Embed Size (px)
Citation preview

Volume 12 Number 12 December 2010 pp. 993–1002 993
www.neoplasia.com
Identification of a PreneoplasticGene Expression Profile inTubal Epithelium of BRCA1Mutation Carriers1,2,3
Joshua Z. Press*, Kaitlyn Wurz*,†,Barbara M. Norquist*, Ming K. Lee†,Christopher Pennil†, Rochelle Garcia‡,Piri Welcsh†, Barbara A. Goff*and Elizabeth M. Swisher*,†
*Division of Gynecologic Oncology, Department ofObstetrics and Gynecology, University of WashingtonSchool of Medicine, Seattle, WA, USA; †Division ofMedical Genetics, Department of Medicine, Universityof Washington School of Medicine, Seattle, WA, USA;‡Department of Pathology, University of WashingtonSchool of Medicine, Seattle, WA, USA
AbstractMicroinvasive carcinomas and high-grade intraepithelial neoplasms are commonly discovered within the fallopiantube of BRCA1 mutation carriers at the time of risk-reducing salpingo-oophorectomy, suggesting that manyBRCA1-mutated ovarian carcinomas originate in tubal epithelium. We hypothesized that changes in gene expressionprofiles within the histologically normal fallopian tube epithelium of BRCA1 mutation carriers would overlap with theexpression profiles in BRCA1-mutated ovarian carcinomas and represent a BRCA1 preneoplastic signature. Lasercapture microdissection of frozen sections was used to isolate neoplastic cells or histologically normal fallopian tubeepithelium, and expression profiles were generated on Affymetrix U133 Plus 2.0 gene expression arrays. Normal-riskcontrols were 11 women wild type for BRCA1 and BRCA2 (WT-FT). WT-FT were compared with histologically nor-mal fallopian tube epithelium from seven women with deleterious BRCA1 mutations who had foci of at least intra-epithelial neoplasm within their fallopian tube (B1-FTocc). WT-FT samples were also compared with 12 BRCA1ovarian carcinomas (B1-CA). The comparison of WT-FT versus B1-FTocc resulted in 152 differentially expressedprobe sets, and the comparison of WT-FT versus B1-CA resulted in 4079 differentially expressed probe sets. TheBRCA1 preneoplastic signature was composed of the overlap between these two lists, which included 41 concor-dant probe sets. Genes in the BRCA1 preneoplastic signature included several known tumor suppressor genes suchas CDKN1C and EFEMP1 and several thought to be important in invasion and metastasis such as E2F3. Theexpression of a subset of genes was validated with quantitative reverse transcription–polymerase chain reactionand immunohistochemistry.
Neoplasia (2010) 12, 993–1002
Address all correspondence to: Joshua Z. Press, MD, Department of Obstetrics andGynecology, University ofWashingtonMedical Center, Box 356460, Seattle, WA 98195.E-mail: [email protected] study was supported by the Yvonne Betson Trust, DOD OC073389 (to E.M.S.)and 1R01CA131965 (E.M.S.). No authors have conflicts of interest to declare.2This study was presented in abstract form at the 40th Annual Society of GynecologicOncologists meeting in San Antonio, TX, 2009.3This article refers to supplementary materials, which are designated by Tables W1and W2 and Figures W1 to W4 and are available online at www.neoplasia.com.Received 22 July 2010; Revised 6 September 2010; Accepted 9 September 2010
Copyright © 2010 Neoplasia Press, Inc. All rights reserved 1522-8002/10/$25.00DOI 10.1593/neo.101044
IntroductionOvarian carcinoma is the leading cause of death from gynecologicmalignant neoplasms in the developed world. Identification of theearly molecular events leading to ovarian carcinoma has been hinderedby the lack of an identifiable preneoplastic lesion and the limited oc-currence of early-stage neoplasms. Although it has been proposed thatovarian carcinoma originates from the surface epithelium of the ovaryand/or the epithelial lining of ovarian inclusion cysts, there have beenfew reports of intraepithelial neoplasms at these sites [1,2].

994 Gene Expression in BRCA1 Tubal Epithelium Press et al. Neoplasia Vol. 12, No. 12, 2010
Alternatively, there has been increasing evidence that many ovariancarcinomas originate within the fallopian tube [3]. Fallopian tube epi-thelium can exhibit areas of increased proliferation and cytologic atypia,called intraepithelial neoplasia (IEN). Most ovarian carcinomas are ofserous histology and frequently exhibit mutations in the critical cellcycle regulator p53 [4]. Severe IEN in fallopian tubes has been foundin conjunction with mullerian malignant neoplasms, particularly serouscarcinomas of ovarian, uterine, or peritoneal origin [5,6]. Identical p53mutations have been identified in tubal IEN and coexisting sporadicserous carcinoma [7], suggesting that genetic disruption within thefallopian tube may progress to ovarian carcinoma.
Further evidence for a tubal origin is suggested by the high preva-lence of occult fallopian tube carcinomas identified among BRCA1and BRCA2 mutation carriers undergoing risk-reducing salpingo-oophorectomy (RRSO). Although the lifetime risk of ovarian carcinomain the general population is only 1% to 2%, women who inherit muta-tions in the BRCA1 and BRCA2 genes have up to a 50% lifetime riskof ovarian carcinoma [8]. These high-risk women are frequently dis-covered to have occult neoplasms at the time of RRSO, and 57% to100% of these lesions arise in the fallopian tube [9–11]. Fallopian tubeepithelium frequently contains areas that have been termed p53 foci(also referred to as p53 signatures), which overexpress p53 and have in-creased expression of the proliferation marker Ki-67 [12]. These tubalp53 foci are more frequent in tubes from BRCA1 and BRCA2mutationcarriers compared with normal-risk women, and they have also beenshown to exhibit decreased expression of the tumor suppressor proteinp27 [13]. These observations have resulted in the proposal of a newparadigm for ovarian carcinoma, in which the fallopian tube epitheliumacquires a sequence of molecular abnormalities leading to an in situor invasive neoplasm, which exfoliates and spreads to the ovary andperitoneum [3]. Validating the role of the fallopian tube in ovariancarcinoma carcinogenesis will require additional studies, such as com-parative analysis of gene expression between wild-type and high-riskfallopian tubes.
We obtained frozen fallopian tube tissue from seven women withBRCA1 mutations found to have occult invasive carcinomas or severeIEN in the fallopian tube on final pathologic examination. We hy-pothesized that the histologically normal tubal epithelium from thesewomen would possess a gene expression profile that would reflect earlyalterations in gene expression contributing to the development of car-cinoma. By comparing the gene expression profiles between thesehigh-risk fallopian tubes and histologically normal fallopian tubes fromwomen with wild-type BRCA1 and BRCA2, we identified a set ofgenes potentially important in the development of BRCA1-associatedcarcinomas. We hypothesized that genes important in BRCA1 ovar-ian carcinogenesis would have similarly altered expression patternsin BRCA1 carcinomas. Therefore, we used the expression patterns inBRCA1 ovarian carcinomas to further define the genes of interest inBRCA1 tubal epithelium.
Materials and Methods
Study Design and Sample SelectionAll tissues and clinical information were obtained from the Univer-
sity of Washington Gynecologic Oncology Tissue Bank according toan institutional review board–approved protocol. To maximize thelikelihood of identifying biologically important gene differentially ex-pressed between histologically normal BRCA wild-type fallopian tubesand high-risk fallopian tubes from BRCA1 mutation carriers, we spe-
cifically selected BRCA1 mutation carriers possessing occult micro-invasive or high-grade intraepithelial fallopian tube neoplasm to createthe gene profile (B1-FTocc). In addition, to minimize the false dis-covery rate, we also identified genes differentially expressed betweenthe BRCA wild-type fallopian tube epithelium (WT-FT) and invasiveBRCA1 carcinomas (B1-CA).We limited ourBRCA1 preneoplastic pro-file to genes showing concordant up-regulation or down-regulation inboth B1-FTocc and B1-CA. Thirty patients were analyzed to createthe BRCA1 preneoplastic gene signature: 11 histologically normal fallo-pian tube epithelium from women with wild-type BRCA1 and BRCA2(WT-FT), 7 histologically normal fallopian tube epithelium fromwomen with deleterious BRCA1 mutations and documented occultmicroinvasive or high-grade intraepithelial fallopian tube carcinoma(B1-FTocc), and 12 high-grade serous ovarian carcinomas from womenwith deleterious BRCA1 mutations (B1-CA). The characteristics ofthese patients are shown in Table 1.We choseWT-FTsamples to matchthe age and menopausal distribution of the B1-FTocc cases. Somewomen in the WT-FT group had a personal history of breast canceror a family history of breast cancer; however, women were excludedfrom the WT-FT group if they had a family history of ovarian cancer.All WT-FT control women had had full gene sequencing by Myriadgenetics, and those who did not have comprehensive rearrangementtesting performed by Myriad were screened with Multiplex Ligation–dependentProbeAmplification (MRC-HollandBV,Amsterdam,Holland)according to the manufacturer’s instructions in our laboratory usingnormal DNA extracted from lymphocytes. For the B1-FTocc samples,the histologically normal epithelium was obtained from the same fallo-pian tube discovered to contain the occult fallopian tube neoplasm.Three of the seven B1-FTocc women were premenopausal at the timeof oophorectomy.
Laser Capture Microdissection, RNA Amplification, andGene Expression Chips
Tissues samples had been collected at the time of RRSO or ovariancarcinoma cytoreductive surgery and were immediately frozen in theoperating room in liquid nitrogen in Tissue-Tek OCT (Alphen aanden Rijn, the Netherlands). For RRSO specimens, a small piece oftubal fimbriae was collected for the tissue bank. A frozen sectionof that tissue was stained with hematoxylin and eosin to confirm nor-mal histologic diagnosis and rule out neoplasia in the research speci-men. The remaining fallopian tube tissues from these cases were thensubjected to serial sectioning by the pathologist to look for intraepithe-lial carcinoma or invasive carcinoma. All stored samples were subjectedto the identical protocol of laser capture microdissection (LCM), linearRNA amplification, andmicroarray production.Hematoxylin and eosinslides from the frozen tissue OCT blocks were reviewed to selectblocks with adequate distal fimbriated fallopian tube epithelium. BeforeLCM, 7-μm frozen sections were cut, adhered onto glass membraneslides (Arcturus, Mountain View, CA), and immediately stored ondry ice. Before LCM, the slides were dehydrated and stained withhematoxylin with the Histogene LCM Frozen Section Staining Kit(Arcturus). Slides were immediately transferred to the Veritas LaserCapture Microdissection system (Arcturus). Fallopian tube epitheliumfrom the distal fimbriated fallopian tube was selectively captured forthe fallopian tube samples, and ovarian carcinoma cells were selectivelycaptured for neoplastic samples (Figure W1). Total RNA was isolated,and contaminating DNA was removed using the PicoPure RNA Isola-tion Kit (Arcturus) as per the company’s protocol. The MessageAmp IIaRNA amplification Kit (Ambion, Austin, TX) was used to amplify

Neoplasia Vol. 12, No. 12, 2010 Gene Expression in BRCA1 Tubal Epithelium Press et al. 995
the total RNA once. The quality of each amplified RNA sample wasconfirmed using Agilent 2000 Bioanalyzer RNA 6000 Pico LabChipKit (Agilent Technologies, Inc, Santa Clara, CA), and quantity wasmeasured using a NanoDropND-1000 Spectrophotometer (NanoDropTechnologies, Wilmington, DE). All labeling, hybridization, and scan-ning were performed at the University of Washington Centre for ArrayTechnology core facility. Amplified complementary DNA (cDNA) waspurified, enzymatically fragmented, and labeled with biotin. Qualityand quantity of the purified labeled cDNA product were confirmedbefore hybridizing to Affymetrix GeneChip U133A Plus 2.0 Arrays(Affymetrix, Inc, Santa Clara, CA). To minimize batch effect, severalsamples from each study group were included in each batch of array runs.
Development of the Gene Expression ProfileGeneSifter (Seattle, WA) software was used for pairwise gene expres-
sion analysis and clustering analysis (Manhattan, Complete Linkage).For pairwise gene expression analysis, a Welch t test was used when gen-erating P values. To develop a potential BRCA1 preneoplastic gene ex-pression profile, two independent comparisons were made. First, the 11WT-FTwere compared with the seven B1-FTocc samples, and probesets were selected, which showed a 1.8-fold differential expression at P <.01. To minimize the false discovery rate, we also performed a compar-ison between the 11 WT-FT and 12 B1-CA and selected probe sets,which showed a 1.8-fold differential expression at P < .01. Probe setswere only selected for the BRCA1 preneoplastic gene expression profileif they demonstrated concordant up-regulation or down-regulation inboth the B1-FTocc and the B1-CA. The 1.8-fold was the cutoff at which
we had most overlapping genes while still optimizing the ratio of over-lapping genes to nonoverlapping genes.
Real-time Quantitative Reverse Transcription–PolymeraseChain Reaction Analysis
Real-time quantitative reverse transcription–polymerase chain reac-tion (RT-PCR) was used to validate the Affymetrix array results for fourgenes from the BRCA1 preneoplastic signature. For each group (WT-FT,B1-FTocc, and B1-CA), five representative cases were selected and ana-lyzed for expression of the four genes (EFEMP1, p57, CYP3A5, andCSPG5). TaqManGeneExpressionAssays (AppliedBiosystems,Carlsbad,CA) were used forEFEMP1 (Hs01013942_m1), p57 (Hs00908986_g1),CYP3A5 (Hs02511768_s1), and CSPG5 (Hs00962721_m1), andGAPDH was used as the reference gene. All samples were run in trip-licate, and the comparative C t method was used for relative quantita-tion using ABI PRISM Sequence Detection Software (AppliedBiosystems). Target gene C t values were normalized to GAPDH.
Interrogation of the BRCA1 Preneoplastic Gene SignatureUsing Independent Samples
Additional fallopian tube samples that were not used to create thegene expression signature were selected to interrogate the BRCA1 pre-neoplastic gene signature. To test the intrasample reproducibility of thetubal expression profiles, three duplicates of the B1-FTocc sampleswere analyzed (Table W1). For two of these B1-FTocc – DUP cases(B1-FTocc no. 2 – DUP and BT-FTocc no. 6 – DUP), expressionarrays were created using tissue from the fallopian tube contralateral
Table 1. Cases Used to Generate the BRCA1 Preneoplastic Gene Signature.
Case Identifier
Age (years) Menopausal Status BRCA1/2 Status* Other CharacteristicsWT-FT no. 1
46 Pre Negative Personal history of breast cancer WT-FT no. 2 47 Post Negative Personal history of breast cancer WT-FT no. 3 48 Post Negative Personal history of breast cancer WT-FT no. 4 48 Pre Negative No personal history of cancer WT-FT no. 5 49 Post Negative Personal history of breast cancer WT-FT no. 6 50 Pre Negative Personal history of breast cancer WT-FT no. 7 52 Pre Negative Personal history of breast cancer WT-FT no. 8 54 Post Negative Personal history of breast cancer WT-FT no. 9 55 Post Negative Personal history of breast DCIS WT-FT no. 10 61 Post Negative No personal history of cancer WT-FT no. 11 61 Post Negative Personal history of breast cancer B1-FTocc no. 1 39 Pre B1.3109insAA Microinvasion left fallopian tube B1-FTocc no. 2 40 Post B1.M1V (120A>G) Microinvasion left fallopian tube B1-FTocc no. 3 47 Pre B1.2800delAA High-grade intraepithelial B1-FTocc no. 4 49 Pre B1.3795del4 Microinvasion right fallopian tube†B1-FTocc no. 5
53 Post B1.del ex14-20 High-grade intraepithelial B1-FTocc no. 6 62 Post B1.C61G High-grade intraepithelial B1-FTocc no. 7 63 Post B1.2800delAA Microinvasion left fallopian tube B1-CA no. 1 40 Pre B1.2576.delC Stage IIIC, grade 3, serous carcinoma B1-CA no. 2 41 Pre B1.185delAG Stage IIIC, grade 3, serous carcinoma B1-CA no. 3 44 Pre B1.2798del4 Stage IIIC, grade 3, serous carcinoma B1-CA no. 4 49 Pre B1.3795del4 Stage IIIC, grade 3, serous carcinoma† B1-CA no. 5 50 Post B1.5382insC Stage IA, grade 3, undifferentiated B1-CA no. 6 51 Post B1.3171ins5 Stage IIIC, grade 3, serous carcinoma B1-CA no. 7 54 Post B1.2594delC Stage IV, grade 3, serous carcinoma B1-CA no. 8 54 Post B1.del_exon14 Stage IIIC, grade 3, serous carcinoma B1-CA no. 9 55 Post B1.M1V (120A>G) Stage IIC, grade 3, serous carcinoma B1-CA no. 10 57 Post B1.5382insC Stage IIIC, grade 3, mixed serous/endo B1-CA no. 11 57 Post B1.5382insC Stage IIIC, grade 3, serous carcinoma B1-CA no. 12 65 Post B1.5382insC Stage IIIC, grade 3, serous carcinoma*Negative cases were wild-type by full sequencing as well as by comprehensive testing for gene rearrangements. WT-FT indicates histologically normal fallopian tube epithelium from BRCA1 wild-typepatients; B1-FTocc, histologically normal fallopian tube epithelium from patients with deleterious BRCA1 mutations and at least high-grade intraepithelial fallopian tube neoplasm; B1-CA, tumor tissuefrom patients with deleterious BRCA1 mutations.†B1-FTocc no. 4 and B1-CA no. 4 are from the same individual who had both microscopic invasive neoplasm within the fallopian tube and peritoneal metastasis. DCIS indicates ductal carcinoma in situ.Menstrual phase of WT-FT cases: WT-FT no. 1 and WT-FT no. 7 had proliferative endometrium and WT-FT no. 4 and WT-FT no. 6 did not have hysterectomy performed.

Figure 1. Diagram illustrating the protocol used to define theBRCA1 preneoplastic gene signature: Pairwise comparison be-tween the WT-FT group and the B1-FTocc group (fold change ≥1.8, P < .01) identified 152 differentially expressed probe sets.Pairwise comparison between the WT-FT group and the B1-CAgroup (fold change ≥ 1.8, P < .01) identified 4079 differentially ex-pressed probe sets. To minimize the false discovery rate, probesets were only included in the gene signature with concordantdown-regulation or up-regulation in both pairwise comparisons(hatched region).
996 Gene Expression in BRCA1 Tubal Epithelium Press et al. Neoplasia Vol. 12, No. 12, 2010
to the microinvasive or high-grade intraepithelial lesion. For the dupli-cate of B1-FTocc no. 1, LCMwas performed a second time using sepa-rate sections obtained approximately 100 μm further into the frozentissue block. In addition, 12 BRCA1-mutated fallopian tubes frompostmenopausal women, which did not contain occult lesions (B1-FT), were also analyzed (Table W2). The expression profiles weregenerated by comparing to the same set of WT-FT cases. These addi-tional expression profiles were then analyzed by combining them oneat a time with the original 30 samples that had been used to createthe premaligant gene signature. Unsupervised hierarchical clustering(Manhattan, Complete Linkage) using the probe sets from the BRCA1preneoplastic gene signature was performed for each combination todetermine whether the additional cases contained the BRCA1 pre-neoplastic expression profile and would therefore cluster with theB1-FTocc cases. In addition, for 10 of the B1-CA carcinomas withadequate DNA available, DNA was sequenced for p53 exons 4 to 10as previously described [14].
Ki-67 ImmunohistochemistryTo validate the array gene expression data for MKI67 (antigen iden-
tified by monoclonal antibody Ki-67), we performed immunohisto-chemistry on a larger set of fallopian tube samples, which had beenstored as paraffin blocks. Most of these cases had right and left distalfallopian tube tissues available, and an average Ki-67 staining score wasobtained from both tubes. Fallopian tube tissues from 26 BRCA1 wild-type cases were compared with fallopian tube tissues from 52 BRCA1mutation carriers without carcinoma obtained at RRSO. Paraffin sec-tions were deparaffinized and sequentially rehydrated, and endogenousperoxidases were blocked. Heat-mediated antigen retrieval was per-formed in a citrate buffer (Antigen Unmasking Solution; Vector Lab-oratories, Burlingame, CA). Slides were incubated with the Ki-67mousemonoclonal antibodyMIB-1, diluted 1:100 (Dako,Copenhagen,Denmark). Sections were washed with phosphate-buffered saline andincubated with secondary antibody (horseradish peroxidase–antimouse;Vector Laboratories). DABwas used to visualize antibody complexes, andsections were counterstained with hematoxylin. Negative and positivecontrols were assessed for each run. Slides were scored by two indepen-dent observers blinded to case designation. The percentages of positiveepithelial cells were scored (0 = none, 1 = 1%, 2 = 2%-4%, 3 = 5%-15%,4 ≥15%). AMann-Whitney test was used to compare the staining results.
Results
Affymetrix Gene ExpressionThere were 18,600 probe sets expressed on the Affymetrix chips,
which showed quality more than 0.7 in all samples. There were152 probe sets with significant differential expression (>1.8-fold, P <.01) between the WT-FT and B1-FTocc. There were 4079 probe setswith significant differential expression (>1.8-fold, P < .01) between theWT-FT and B1-CA. The 152 probe sets differentially expressed fromthe BI-FTocc were compared with the 4079 differentially expressedprobe sets in the B1-CA (Figure 1). The overlap between the two dif-ferentially expressed probe sets consisted of 29 probe sets downregulatedin both groups, 12 probe sets upregulated in both groups, and 7 probesets showing contradictory expression (up-regulation in one comparisonand downregulated in the other). The 41 probe sets demonstratingconcordant up-regulation or down-regulation in both comparisonscomprised the BRCA1 preneoplastic gene signature and are shown inTable 2 and Figure 2.
To test the significance of the overlap in differentially expressed genes,we created a simulation in which there were 4079 randomly selected ex-pressed clones in one group and 152 in a second group from 18,600 ex-pressed clones and compared overlap. We repeated this simulation10,000 times. A total of 21 overlapping clones were only observed in1 (0.01%) of 10,000 simulations, and 22 ormore overlapping genes werenever observed. These data suggest that the overlap of 41 genes betweenour BRCA1 tubal epithelium and BRCA1 carcinomas is highly signifi-cant and that it did not occur by chance. The concordance of directionof the expression differences in 41 (85%) of 48 overlapping probes alsosuggests that overlap in differentially expressed genes is nonrandom.
Real-time Quantitative RT-PCR AnalysisFigure 3 shows the Affymetrix expression array results imposed be-
side the real-time quantitative RT-PCR results for each of the four se-lected genes (EFEMP1, p57, CYP3A5, and CSPG5). For each gene, thereal-time quantitative RT-PCR shows a similar expression pattern to thecorresponding Affymetrix array.
Clustering AnalysisThe 30 samples used to create the BRCA1 preneoplastic gene sig-
nature were subjected to unsupervised hierarchical clustering analysisusing all 18,600 probe sets expressed with quality greater than 0.7(Figure W2). The B1-CA formed a distinct group, but the clusteringof the B1-FTocc and WT-FT did not generate any distinct patternusing all expressed probe sets. Interestingly, using only the 41 overlappingprobes, the wild-type samples separated into distinct premenopausaland postmenopausal groups, which they did not do when clusteringwas based on the entire expressed probe set. Of 10 carcinomas evaluated,6 contained a somatic p53 mutation determined by sequencing p53exons 4 to 10 (data not shown). Carcinomas 2, 5, 6, 7, 10, and 11had p53 mutations, whereas carcinomas 1, 3, 9, and 12 were wild-type.The p53 mutation status was not associated with how the carcinomasclustered when considering the 41 overlapping probe sets or all of the18,600 expressed probes.

Neoplasia Vol. 12, No. 12, 2010 Gene Expression in BRCA1 Tubal Epithelium Press et al. 997
The duplicated samples from the B1-FTocc group were then added tothe clustering analysis and subjected to unsupervised hierarchical cluster-ing using the BRCA1 preneoplastic gene signature. As shown inFigure W3, each of the duplicated samples clustered closely with theirpaired sample even when obtained from the contralateral FT, demonstrat-ing the reproducibility of the expression profile in independent experi-ments as well as the consistency between paired bilateral fallopian tubes.To further interrogate the BRCA1 preneoplastic gene signature,
expression profiles from 12 additional B1-FT that had not been usedin developing the expression profile were each individually combinedwith the 30 samples used to create the signature and subjected to un-supervised hierarchical clustering using the BRCA1 preneoplastic genesignature. Five of the new samples clustered with the B1-FTocc/B1-CAgroup, whereas seven of the new samples clustered with the WT-FT(Table W2). A representative example of each clustering pattern isshown in Figure W4. This suggested that 5 (42%) of the 12 B1-FThad experienced sufficient molecular disruptions to resemble B1-FToccor B1-CA samples. Although the remaining seven B1-FT test samplesclustered with wild-type fallopian tubes, they always clustered with thegroup from premenopausal women.
Ki-67 ImmunohistochemistryThe Affymetrix array analysis showed a significantly increased expres-
sion ofMKI67 (gene for the antigen identified by monoclonal antibodyKi-67) in the B1-FTocc compared withWT-FT (P = .01; Figure 4A). Toconfirm the generalizability of the preneoplastic expression pattern in alarger set of wild-type and BRCA1 histologically normal FT, we evalu-ated Ki-67 protein expression by immunohistochemistry in a larger set ofparaffin-embedded FT specimens. Significantly higher Ki-67 proteinexpressionwas identified in fallopian tubes fromBRCA1mutation carriersthan from BRCA1wild-type women (P = .0002) who did not have cancer(Figure 4B ). Representative images of low Ki-67 staining in WT-FT(Figure 4C ) and high Ki-67 staining in B1-FT (Figure 4D) are shown.
DiscussionFor many years, it was believed that ovarian carcinoma arises from theovarian surface epithelium or in cortical inclusion cysts in the ovary. Inaccordance with this belief, most studies assessing disruption of geneexpression in ovarian carcinomas have focused on the ovarian surfaceepithelium and carcinomas within the ovarian tissue [15]. However,
Table 2. The 41 Probe Sets Demonstrating Concordant Up-regulation or Down-regulation in Both Comparisons between WT-FT and B1-FTocc or B1-CA.
Affymetrix Probe Set
Gene Name Gene Symbol WT-FT vs B1-FTocc WT-FT vs B1-CAFold
P Fold PDownregulated
230130_at Transcribed locus Unknown 3.7 .0020 3.4 .0054 214078_at Primary neuroblastoma cDNA Unknown 3.6 .0003 7.4 .0001 201843_s_at EGF-containing fibulin-like extracellular matrix protein 1 EFEMP1 3.4 .0015 12.4 .0001 205568_at Aquaporin 9 AQP9 2.7 .0021 3.4 .0020 214235_at Cytochrome P450, family 3, subfamily A CYP3A5 2.7 .0048 5.2 .0023 226228_at Aquaporin 4 AQP4 2.6 .0081 7.7 .0003 213182_x_at Cyclin-dependent kinase inhibitor 1C (p57, Kip2) CDKN1C 2.5 .0008 3.1 .0014 203710_at Inositol 1,4,5-triphosphate receptor, type 1 ITPR1 2.4 .0004 3.7 .0002 214607_at p21 (CDKN1A)-activated kinase 3 PAK3 2.4 .0070 5.8 .0002 231183_s_at Jagged 1 (Alagille syndrome) JAG1 2.3 .0002 1.9 .0011 218656_s_at Lipoma HMGIC fusion partner LHFP 2.3 .0032 2.8 .0083 218717_s_at Leprecan-like 1 LEPREL1 2.3 .0034 2.9 .0034 229480_at MRNA; cDNA DKFZp686I18116 Unknown 2.1 .0018 2.2 .0002 209506_s_at Nuclear receptor subfamily 2, group F, member 1 NR2F1 2.1 .0036 7.5 .0000 231262_at Transcribed locus Unknown 2.1 .0035 3.0 .0088 201497_x_at Myosin, heavy chain 11, smooth muscle MYH11 2.1 .0068 15.5 .0000 236277_at Primary neuroblastoma cDNA Unknown 2.0 .0094 3.5 .0001 201885_s_at Cytochrome b5 reductase 3 CYB5R3 2.0 .0004 1.8 .0066 230233_at Transcribed locus Unknown 2.0 .0047 1.9 .0073 1557866_at Chromosome 9 open reading frame 117 C9orf117 2.0 .0013 6.0 .0001 201162_at Insulin-like growth factor binding protein 7 IGFBP7 2.0 .0088 6.1 .0000 201427_s_at Selenoprotein P, plasma, 1 SEPP1 2.0 .0004 2.3 .0010 213451_x_at Transcribed locus, sim to tenascin XB isoform 1 TNXB 1.9 .0072 5.3 .0002 218087_s_at Sorbin and SH3 domain containing 1 SORBS1 1.9 .0082 2.1 .0038 204235_s_at GULP, engulfment adaptor PTB domain containing 1 GULP1 1.9 .0006 4.8 .0000 218718_at Platelet-derived growth factor C PDGFC 1.9 .0007 1.8 .0059 209575_at Interleukin 10 receptor, beta IL10RB 1.9 .0010 1.8 .0016 209505_at Nuclear receptor subfamily 2, group F, member 1 NR2F1 1.8 .0096 7.0 .0000 37005_at Neuroblastoma, suppression of tumorigenicity 1 NBL1 1.8 .0066 2.5 .0017 Upregulated 225857_s_at Hypothetical LOC388796 LOC388796 2.4 .0000 2.6 .0000 238482_at Kruppel-like factor 7 (ubiquitous) KLF7 2.4 .0020 2.2 .0050 39966_at Chondroitin sulfate proteoglycan 5 CSPG5 2.1 .0030 6.2 .0000 203693_s_at E2F transcription factor 3 E2F3 2.1 .0054 6.4 .0000 1560622_at CDNA FLJ20196 fis, clone COLF0944 Unknown 2.0 .0038 2.2 .0005 201577_at Nonmetastatic cells 1, protein (NM23A) NME1 1.9 .0066 3.0 .0002 65588_at Hypothetical LOC388796 LOC388796 1.9 .0000 2.3 .0001 224474_x_at SMEK homolog 2, suppressor of mek1 SMEK2 1.9 .0087 2.0 .0037 212020_s_at Antigen identified by monoclonal antibody Ki-67 MKI67 1.9 .0056 3.5 .0000 224623_at Transcribed locus, similar THO complex 3 THOC3 1.8 .0003 3.2 .0000 1560258_a_at Homo sapiens, clone IMAGE:5590287, mRNA Unknown 1.8 .0044 3.0 .0000 216262_s_at TGFB-induced factor homeobox 2 TGIF2 1.8 .0094 1.8 .0033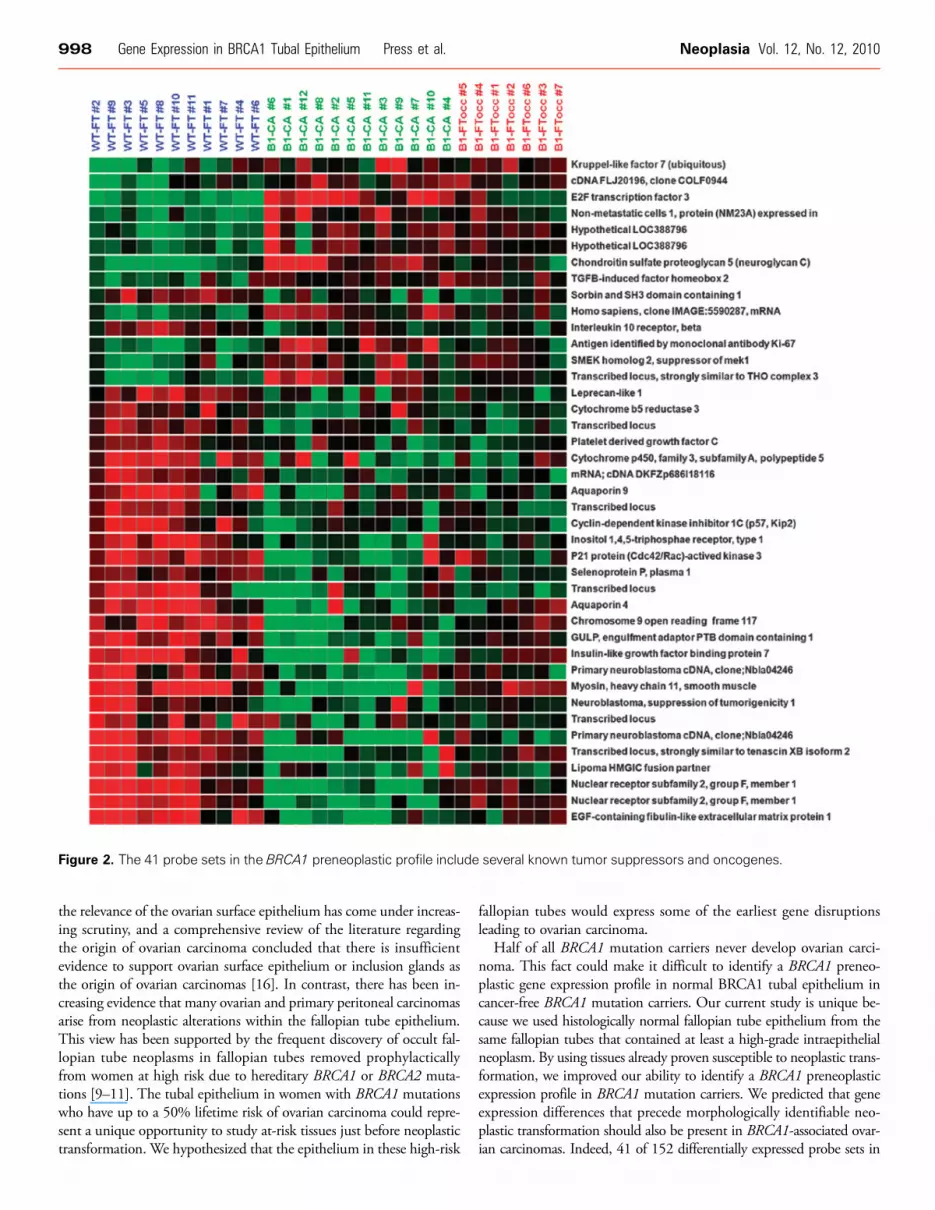
Figure 2. The 41 probe sets in the BRCA1 preneoplastic profile include several known tumor suppressors and oncogenes.
998 Gene Expression in BRCA1 Tubal Epithelium Press et al. Neoplasia Vol. 12, No. 12, 2010
the relevance of the ovarian surface epithelium has come under increas-ing scrutiny, and a comprehensive review of the literature regardingthe origin of ovarian carcinoma concluded that there is insufficientevidence to support ovarian surface epithelium or inclusion glands asthe origin of ovarian carcinomas [16]. In contrast, there has been in-creasing evidence that many ovarian and primary peritoneal carcinomasarise from neoplastic alterations within the fallopian tube epithelium.This view has been supported by the frequent discovery of occult fal-lopian tube neoplasms in fallopian tubes removed prophylacticallyfrom women at high risk due to hereditary BRCA1 or BRCA2 muta-tions [9–11]. The tubal epithelium in women with BRCA1 mutationswho have up to a 50% lifetime risk of ovarian carcinoma could repre-sent a unique opportunity to study at-risk tissues just before neoplastictransformation. We hypothesized that the epithelium in these high-risk
fallopian tubes would express some of the earliest gene disruptionsleading to ovarian carcinoma.
Half of all BRCA1 mutation carriers never develop ovarian carci-noma. This fact could make it difficult to identify a BRCA1 preneo-plastic gene expression profile in normal BRCA1 tubal epithelium incancer-free BRCA1 mutation carriers. Our current study is unique be-cause we used histologically normal fallopian tube epithelium from thesame fallopian tubes that contained at least a high-grade intraepithelialneoplasm. By using tissues already proven susceptible to neoplastic trans-formation, we improved our ability to identify a BRCA1 preneoplasticexpression profile in BRCA1 mutation carriers. We predicted that geneexpression differences that precede morphologically identifiable neo-plastic transformation should also be present in BRCA1-associated ovar-ian carcinomas. Indeed, 41 of 152 differentially expressed probe sets in

Figure 3. Correlation between expression array and real-time quantitative RT-PCR results: Four genes from the gene signature wereselected for validation by RT-PCR with TaqMan assays. Five cases were used from each group (WT-FT, B1-FTocc, and B1-CA). The fourgenes included EFEMP1 (EGF-containing fibulin-like extracellular matrix protein 1), CDKN1C (cyclin-dependent kinase inhibitor 1C orp57), CYP3A5 (cytochrome P450, family 3, subfamily A), and CSPG5 (chondroitin sulfate proteoglycan 5 or neuroglycan C). For eachgene, the array expression data are shown beside the corresponding RT-PCR results.
Neoplasia Vol. 12, No. 12, 2010 Gene Expression in BRCA1 Tubal Epithelium Press et al. 999
the normal tubal epithelium from BRCA1 mutation carriers with tubalneoplasia were also similarly differentially expressed in the BRCA1 carci-nomas when compared with tubal epithelium from normal-risk women.Our computer model confirmed that the identified overlap in expres-
Figure 4. Validation of MIK67 expression data with Ki-67 immunohistothe 11 WT-FT samples compared with the 7 B1-FTocc samples (P = .26 wild-type women compared with fallopian tubes from 52 women wof low Ki-67 expression in a wild-type case (C) and high Ki-67 staining
sion profiles between BRCA1 tubal epithelium and BRCA1 carcinomais highly significant, suggesting that the expression profile that we termedthe BRCA1 preneoplastic signature represents a true biological phenome-non. The 41 overlapping probe sets represent unique genes altered in
chemistry in 26 WT-FT and 52 B1-FT. (A) MIK67 gene expression in01). (B) Ki-67 protein expression (brown) in the fallopian tubes fromith deleterious BRCA1mutations (P= .0002). Representative imagesin a BRCA1-mutated case (D).
1000 Gene Expression in BRCA1 Tubal Epithelium Press et al. Neoplasia Vol. 12, No. 12, 2010
progression from normal fallopian tube epithelium to carcinoma. Fur-thermore, many of these 41 probe sets represent genes that have beenshown to play an important role in cancer biology, such as EFEMP1,CYP3A5, CDKN1C, NR2F1, E2F3, MKI67, NME1, and CSPG5.
One gene in the BRCA1 preneoplastic signature overexpressed inBRCA1 FT is the gene encoding the Ki-67 antigen, expressed in thenuclei of proliferating cells. To generalize our findings to other casesfrom women with known BRCA1 mutations, we performed immuno-histochemistry in a larger series of normal FTs. Consistent with thearray data, our pathologists (who were blinded to case designation)identified significantly higher Ki-67 protein expression in FT epithe-lium of women with BRCA1 mutations compared to women withnegative genetic testing (Figure 4). These data suggest that at least someelements of the BRCA1 preneoplastic signature are generalizable toBRCA1-mutated FTs without neoplasia. These data suggest that beforeneoplastic transformation, there exists a higher rate of proliferation inBRCA1 tubal epithelium, which could increase the opportunity forsomatic clonal genetic changes (such as loss of the wild-type allele)and subsequent neoplastic development.
Examples of downregulated probe sets in the BRCA1 preneoplasticsignature include those representing EFEMP1, CDKN1C, andNR2F1.Decreased expression of each of these genes has been implicated in car-cinogenesis in a variety of neoplasms. EFEMP1 (FLBN3) is a memberof the fibulin family, a family of secreted glycoproteins with repeatedepidermal growth factor domains and a unique C-terminal fibulin-typemodule. Fibulins mediate cell-to-cell and cell-to-matrix communica-tion within the extracellular matrix [17]. Mutations in EFEMP1 causean autosomal-dominant disorder associated with early onset maculardegeneration (Doyne honeycomb retinal dystrophy), which has been as-sociated with excessive angiogenesis [18]. EFEMP1 has antiangiogenicproperties and has been shown to inhibit tumor growth in mice. Theexpression of EFEMP1 is reduced in many human neoplasms, includ-ing ovarian carcinoma [19], and EFEMP1 is inactivated by promotermethylation in 38% of primary lung carcinomas but not in pairednormal lung tissue [20]. The cell cycle regulatory gene CDKN1C(p57/Kip2) is an imprinted maternally expressed gene on chromosome11p15.4. Disruption of CDKN1C expression causes the cancer pre-disposing Beckwith-Wiedemann syndrome [21]. CDKN1C has alsobeen implicated as a tumor suppressor gene in a number of humanmalignant neoplasms including breast, lung, pancreatic, bladder, esopha-geal, and a variety of hematological and myeloid neoplasms [22,23].Prostate explants from a CDKN1C knockout mouse develop IENand prostate adenocarcinoma in nude mice, providing the first mousemodel that is pathologically identical to human prostate carcinoma[24]. CDKN1C dysregulation has not been extensively studied in ovar-ian carcinoma, but the majority (75%) of sporadic ovarian carcinomasdemonstrate reduced CDKN1C protein expression (<10% of tumorcells) using immunohistochemistry [25].NR2F1 encodes for the proteinchicken ovalbumin upstream promoter transcription factor I (COUP-TF1). COUP-TF1 is a nuclear receptor that has been shown to represstranscription, influence the tumor necrosis factor α signaling pathway[26], and modulate the retinoic acid receptor [27]. In breast carcinoma,decreased expression of COUP-TF1 is associated with the up-regulationof aromatase expression [28]. Decreased expression of COUP-TF1 hasalso been observed in ovarian and bladder carcinomas [29,30].
Upregulated probe sets in our BRCA1 preneoplastic signature in-cluded E2F3, NME1, CSPG5, and MKI67. The E2F3 gene is a tran-scription factor that has been implicated in malignant transformationof human lung [31], prostate [32], and bladder carcinomas [33]. Up-
regulation of E2F transcription factors has been shown to influencedisruptions of the cell cycle in high-grade serous ovarian carcinomas[34], and E2F3 has been used as a biomarker for ovarian carcinoma[35]. The E2F3–Aurora-A axis has been implicated in colorectal can-cer [36] and ovarian cancer [37], and recently, E2F3 has been impli-cated in the proliferation of ovarian cancer cells through interactionwith epidermal growth factor receptor [38]. NME1 (NM23) over-expression has been associated with decreased overall survival in pa-tients with serous ovarian carcinoma [39]. CSPG5 (neuroglycan C,neuregulin-6) is a growth factor that transactivates the ErbB2 (HER2/neu) oncogene. CSPG5 is a membrane-anchored chondroitin sulfateproteoglycan that stimulates cell proliferation in a dose-dependent fash-ion, acts as a specific ligand for ErbB3, and is capable of transactivationof ErbB2 (HER2) [40]. ErbB2 (HER2/neu) is a well-recognized onco-gene capable of inducing cellular proliferation and disrupting epithelialcellular polarity. Although CSPG5 has not been well studied in humanmalignant neoplasms, CSPG5 is secreted by neural stem cells, and itpromotes its own proliferation in the fetal brain [41].
The traditional clonal model of carcinogenesis states that clonalexpansion and neoplastic proliferation stem from genetic disruptionswithin an individual cell. However, a more contemporary hypothesiscalled the epigenetic progenitor model proposes that before this clonalevent, there are global epigenetic alterations in nonneoplastic cell linesthat allow the proliferation of cell line–specific stem or progenitor cells.This results in a large population of epigenetically disrupted progenitorcells that could then be affected by an initiating mutation of a keygatekeeper gene in a single cell [42]. An epigenetic progenitor modelcould explain our ability to identify global alterations of gene expres-sion of key tumor progenitor genes in at-risk epithelium in areas thatdo not have histologically identifiable neoplastic proliferation. Furtherepigenetic studies will be necessary to assess this hypothesis in BRCA1tubal epithelium.
We assessed whether the tubal expression profile was consistentbetween various areas of the distal FT by performing unsupervisedhierarchical clustering using independent samples from three of theB1-FTocc cases (two from the contralateral tube). Regardless of whetherthe duplicated samples were created from the ipsilateral or contralateralfallopian tube, all three duplicates clustered immediately adjacent totheir corresponding sample when considering the preneoplastic genesignature (Figure W3). This suggests that the gene disruptions we ob-served in high-risk fallopian tubes represent a global field effect thataffects bilateral fallopian tubes in patients with BRCA1 mutations.
p53-immunopositive foci have been frequently observed in tubalepithelium of both high-risk and normal-risk women [3,13]. We madeno effort to select p53-positive cells to derive the BRCA1 preneoplasticexpression profile. The resulting expression profile did not seem tobe driven by p53 because the expression profiles from the p53 wild-typecarcinomas were not distinct from the p53 mutant carcinomas whenjust considering these genes. The probe sets on the Affymetrix arrayrepresenting p53 showed minimal signal regardless of BRCA1 status.This is not surprising because p53 foci are generally small, occurringin as few as 10 cells and, consequently, would only be present in a smallfraction of the cells that we used for expression array analysis. p53 focilikely represent a clonal event (somatic mutation) in a small subset oftubal epithelial cells. The fact that we can detect differences in ex-pression profiles of BRCA1 tubal epithelium despite not selecting forp53 foci implies that global alterations in gene expression includingMKI67 (Ki-67 protein) occur even in cells that do not have p53 altera-tions or mutation. These data support an alternate model in which
Neoplasia Vol. 12, No. 12, 2010 Gene Expression in BRCA1 Tubal Epithelium Press et al. 1001
global alterations (including increased Ki-67) precede somatic clonalevents such as p53 mutation in p53 foci [13].Three of the seven B1-FTocc samples available from our tissue bank
were collected from premenopausal women. To equalize the menopausalstatus in our three groups, we specifically included cases in the WT-FTand B1-CA groups that were premenopausal at the time of surgery.When unsupervised hierarchical clustering was performed using the pre-neoplastic gene signature, the four premenopausal WT-FT cases formeda distinct group from the seven postmenopausal WT-FT cases. Inter-estingly, when the 12 additional FT-B1 samples (which were all post-menopausal) were subjected to clustering analysis, the 7 samples thatclustered with the WT-FT group always clustered with the premeno-pausal WT-FT. It seems that BRCA1-mutated fallopian tubes maintaina gene expression profile that is more similar to premenopausal tissue,even without the stimulation of the premenopausal hormonal milieu.Our group has recently demonstrated that proliferation in WT-FT asmeasured by Ki-67 protein expression decreases with age, but Ki-67 ex-pression is maintained at a higher level with a less marked decrease withage in women with BRCA1 mutation [13]. Therefore, both protein ex-pression and expression profiling suggest that BRCA1 fallopian tubeepithelium maintains a premenopausal proliferative phenotype. Overall,5 (42%) of the 12 additional B1-FT samples clustered with the B1-FTocc/B1-CA group based on the BRCA1 preneoplastic signature. Thisclosely reflects the percentage of women with BRCA1 mutations whowill go on to develop ovarian carcinoma [8]. Interestingly, the samples thatclustered with the B1-FTocc/B1-CA group had higher Ki-67 staining.There has only been one published study by Tone et al. [43] looking at
differential gene expression profiles from BRCA1-mutated fallopian tubeepithelium and fallopian tube/ovarian carcinomas, which was designeddifferently from our study. These investigators analyzed fallopian tubeepithelium only from premenopausal women, included both BRCA1and BRCA2 mutation carriers, and focused on fallopian tubes withoutassociated carcinoma, as opposed to our strategy of microdissectingepithelium from fallopian tubes containing at least high-grade intra-epithelial neoplasm. Furthermore, their carcinoma group includedsporadic fallopian tube and ovarian carcinomas, whereas we comparedexpression profiles specifically to BRCA1-mutated carcinomas. We feltit was important to separate BRCA1 from BRCA2 fallopian tube epi-thelium given that ovarian carcinomas have distinct different expressionprofiles according to whether they have a BRCA1 or BRCA2 mutation[44]. They observed that BRCA1-mutated fallopian tubes collectedduring the luteal phase of the menstrual cycle were more likely to clusterwith the carcinoma samples. They hypothesized that the hormonalenvironment of the luteal phase causes distinct changes in high-riskfallopian tubes resulting in similar gene expression to carcinoma tissue.Because of the different approaches between this study and our currentstudy, it is difficult to compare the specific genes identified. However,both studies suggest that fallopian tube epithelium from BRCA1 muta-tion carriers is susceptible to disruption in gene expression, which causeshistologically normal fallopian tube tissue to exhibit gene expressionresembling carcinoma.By analyzing gene expression from histologically normal fallopian
tube epithelium isolated from BRCA1-mutated fallopian tubes contain-ing early neoplasms, we have identified a potential BRCA1 preneoplasticgene expression signature for BRCA1 serous carcinoma. This gene sig-nature may include some of the earliest disruptions in gene expressionleading to the development of serous ovarian carcinoma. Further valida-tion will be necessary to determine which of the genes from this signa-ture are critical in this process and to identify the mechanisms of gene
expression alterations. The fact that these genes are disrupted in thefallopian tube tissue before the development of invasive carcinomacould make them useful targets for chemoprevention or early detectionof ovarian carcinoma.
AcknowledgmentsThe authors thank Mary-Claire King for her support and guidancein this project, the staff at the Centre for Array Technology for theirassistance with processing gene expression arrays, Danbin Xu for guid-ance with real-time PCR analysis, Robert Vessella and Colm Morrisseyfor assistance with LCM, Lawrence True for guidance with tissuepreparation, and Peter Nelson and Ilsa Coleman for LCM and expres-sion array protocols.
References[1] Cai KQ, Klein-Szanto A, Karthik D, Edelson M, Daly MB, Ozols RF, Lynch
HT, Godwin AK, and Xu XX (2006). Age-dependent morphological alterationsof human ovaries from populations with and without BRCA mutations. GynecolOncol 103, 719–728.
[2] Schlosshauer PW, Cohen CJ, Penault-Llorca F, Miranda CR, Bignon YJ,Dauplat J, and Deligdisch L (2003). Prophylactic oophorectomy: a morphologicand immunohistochemical study. Cancer 98, 2599–2606.
[3] Crum CP, Drapkin R, Miron A, Ince TA, Muto M, Kindelberger DW, and Lee Y(2007). The distal fallopian tube: a new model for pelvic serous carcinogenesis.Curr Opin Obstet Gynecol 19, 3–9.
[4] Kmet LM, Cook LS, and Magliocco A (2003). A review of p53 expression andmutation in human benign, low malignant potential, and invasive epithelial ovariantumors. Cancer 97, 389–404.
[5] Stern J, Buscema J, Parmley T, Woodruff JD, and Rosenshein NB (1981).Atypical epithelial proliferations in the fallopian tube. Am J Obstet Gynecol 140,309–312.
[6] Yanai-Inbar I and Silverberg SG (2000). Mucosal epithelial proliferation of thefallopian tube: prevalence, clinical associations, and optimal strategy for histo-pathologic assessment. Int J Gynecol Pathol 19, 139–144.
[7] Kindelberger DW, Lee Y, Miron A, Hirsch MS, Feltmate C, Medeiros F,Callahan MJ, Garner EO, Gordon RW, Birch C, et al. (2007). Intraepithelialcarcinoma of the fimbria and pelvic serous carcinoma: evidence for a causal rela-tionship. Am J Surg Pathol 31, 161–169.
[8] KingMC,Marks JH, andMandell JB (2003). Breast and ovarian cancer risk due toinherited mutations in BRCA1 and BRCA2. Science 302, 643–646.
[9] Finch A, Shaw P, Rosen B, Murphy J, Narod SA, and Colgan TJ (2006). Clinicaland pathologic findings of prophylactic salpingo-oophorectomies in 159 BRCA1and BRCA2 carriers. Gynecol Oncol 100, 58–64.
[10] Lamb JD, Garcia RL, Goff BA, Paley PJ, and Swisher EM (2006). Predictors ofoccult neoplasia in women undergoing risk-reducing salpingo-oophorectomy. Am JObstet Gynecol 194, 1702–1709.
[11] Leeper K, Garcia R, Swisher E, Goff B, Greer B, and Paley P (2002). Pathologicfindings in prophylactic oophorectomy specimens in high-risk women. GynecolOncol 87, 52–56.
[12] Lee Y, Miron A, Drapkin R, Nucci MR, Medeiros F, Saleemuddin A, Garber J,Birch C, Mou H, Gordon RW, et al. (2007). A candidate precursor to serouscarcinoma that originates in the distal fallopian tube. J Pathol 211, 26–35.
[13] Norquist BM, Garcia RL, Allison KH, Jokinen CH, Kernochan LE, Pizzi CC,Barrow BJ, Goff BA, and Swisher EM (in press). The molecular pathogenesis ofhereditary ovarian carcinoma: alterations in the tubal epithelium of women withBRCA1 and BRCA2 mutations. Cancer.
[14] Galic V, Willner J, Wollan M, Garg R, Garcia R, Goff BA, Gray HJ, andSwisher EM (2007). Common polymorphisms in TP53 and MDM2 and the re-lationship to TP53 mutations and clinical outcomes in women with ovarian andperitoneal carcinomas. Genes Chromosomes Cancer 46, 239–247.
[15] Fehrmann RS, Li XY, van der Zee AG, de Jong S, Te Meerman GJ, de Vries EG,and Crijns AP (2007). Profiling studies in ovarian cancer: a review. Oncologist 12,960–966.
[16] Bell DA (2005). Origins and molecular pathology of ovarian cancer. Mod Pathol18(suppl 2), S19–S32.
[17] Gallagher WM, Currid CA, and Whelan LC (2005). Fibulins and cancer: friendor foe? Trends Mol Med 11, 336–340.

1002 Gene Expression in BRCA1 Tubal Epithelium Press et al. Neoplasia Vol. 12, No. 12, 2010
[18] Stone EM, Lotery AJ,Munier FL, Héon E, Piguet B, Guymer RH, Vandenburgh K,Cousin P, Nishimura D, Swiderski RE, et al. (1999). A single EFEMP1 mutationassociated with both Malattia Leventinese and Doyne honeycomb retinal dystrophy.Nat Genet 22, 199–202.
[19] Albig AR, Neil JR, and Schiemann WP (2006). Fibulins 3 and 5 antagonizetumor angiogenesis in vivo. Cancer Res 66, 2621–2629.
[20] Yue W, Dacic S, Sun Q, Landreneau R, Guo M, Zhou W, Siegfried JM, Yu J,and Zhang L (2007). Frequent inactivation of RAMP2, EFEMP1 and Dutt1 inlung cancer by promoter hypermethylation. Clin Cancer Res 13, 4336–4344.
[21] Hatada I, Ohashi H, Fukushima Y, Kaneko Y, Inoue M, Komoto Y, Okada A,Ohishi S, Nabetani A, Morisaki H, et al. (1996). An imprinted gene p57KIP2 ismutated in Beckwith-Wiedemann syndrome. Nat Genet 14, 171–173.
[22] Larson PS, Schlechter BL, King CL, Yang Q, Glass CN, Mack C, Pistey R,de Las Morenas A, and Rosenberg CL (2008). CDKN1C/p57 kip2 is a candidatetumor suppressor gene in human breast cancer. BMC Cancer 8, 68.
[23] Kikuchi T, Toyota M, Itoh F, Suzuki H, Obata T, Yamamoto H, Kakiuchi H,Kusano M, Issa JP, Tokino T, et al. (2002). Inactivation of p57KIP2 by regionalpromoter hypermethylation and histone deacetylation in human tumors.Oncogene21, 2741–2749.
[24] Jin RJ, Lho Y, Wang Y, Ao M, Revelo MP, Hayward SW, Wills ML, Logan SK,Zhang P, and Matusik RJ (2008). Down-regulation of p57Kip2 induces prostatecancer in the mouse. Cancer Res 68, 3601–3608.
[25] Khouja MH, BaekelandtM, Nesland JM, and Holm R (2007). The clinical impor-tance of Ki-67, p16, p14, and p57 expression in patients with advanced ovariancarcinoma. Int J Gynecol Pathol 26, 418–425.
[26] Zhang LJ, Liu X, Gafken PR, Kioussi C, and Leid M (2008). A chicken ovalbuminupstream transcription factor 1 (COUP-TF1) complex represses expression of thegene encoding tumor necrosis factor α–induced protein 8 (TNFAIP8). J Biol Chem284, 6156–6168.
[27] Lin B, Chen GQ, Xiao D, Kolluri SK, Cao X, Su H, and Zhang XK (2000).Orphan receptor COUP-TF is required for induction of retinoic acid receptorbeta, growth inhibition, and apoptosis by retinoic acid in cancer cells. Mol CellBiol 20, 957–970.
[28] Chen S, Jingjing Y, Ikuko K, Yoshiyuki K, and Zhou D (2005). Positive andnegative transcriptional regulation of aromatase expression in human breast cancertissue. J Steroid Biochem Mole Biol 95, 17–23.
[29] HamWS, Lee JH, Yu HS, and Choi YD (2008). Expression of chicken ovalbuminupstream promoter-transcription factor 1 (COUP-TF1) in bladder transitionalcell carcinoma. Urology 72, 921–926.
[30] Damiao RDS, Oshima CTF, Stavale JN, and Goncalves WJ (2007). Analysis ofthe expression of estrogen receptor, progesterone receptor and chicken ovalbuminupstream promoter-transcription factor 1 in ovarian epithelial cancers and normalovaries. Oncol Rep 18, 25–32.
[31] Cooper CS, Nicholson AG, Foster C, Dodson A, Edwards S, Fletcher A, Roe T,Clark J, Joshi A, Norman A, et al. (2006). Nuclear overexpression of the E2F3transcription factor in human lung cancer. Lung Cancer 54, 155–162.
[32] Foster CS, Falconer A, Dodson AR, Norman AR, Dennis N, Fletcher A,Southgate C, Dowe A, Dearnaley D, Jhavar S, et al. (2004). Transcription factorE2F3 overexpressed in prostate cancer independently predicts clinical outcome.Oncogene 23, 5871–5879.
[33] Feber A, Clark J, Goodwin G, Dodson AR, Smith PH, Fletcher A, Edwards S,Flohr P, Falconer A, Roe T, et al. (2004). Amplification and overexpression ofE2F3 in human bladder cancer. Oncogene 23, 1627–1630.
[34] Meyer TD, Bijsmans IT, Van de Vijver KK, Bekaert S, Oosting J, Van CriekingeW,van Engeland M, and Sieben NL (2009). E2Fs mediate a fundamental cell-cyclederegulation in high-grade serous ovarian carcinomas. J Pathol 217, 14–20.
[35] Lu KH, Patterson AP, Wang L, Marquez RT, Atkinson EN, Baggerly KA,Ramoth LR, Rosen DG, Liu J, Hellstrom I, et al. (2004). Selection of potentialmarkers for epithelial ovarian cancer with gene expression arrays and recursivedescent partition analysis. Clin Cancer Res 10, 3291–3300.
[36] Baba Y, Nosho K, Shima K, Irahara N, Kure S, Toyoda S, Kirkner GJ, Goel A,Fuchs CS, and Ogino A (2009). Aurora-A expression is independently associatedwith chromosomal instability in colorectal cancer. Neoplasia 11, 418–425.
[37] He L, Yang H, Ma Y, Pledger WJ, Cress WD, and Cheng JQ (2008). Identifica-tion of Aurora-A as a direct target of E2F3 during G2/M cell cycle progression.J Biol Chem 283, 31012–31020.
[38] Reimer D, Hubalek M, Riedle S, Skvortsov S, Erdel M, Conci N, Fiegl H, Muller-Holzner E, Marth C, Illmensee K, et al. (2010). E2F3a is critically involved inepidermal growth factor receptor–directed proliferation in ovarian cancer. CancerRes 70, 4613–4623.
[39] Youn BS, Kim DS, Kim JW, Kim YT, Kang S, and Cho NH (2008). NM23 as aprognostic biomarker in ovarian serous carcinoma. Mod Pathol 21, 885–892.
[40] Kinugasa Y, Ishiguro H, Tokita Y, Oohira A, Ohmoto H, and Higashiyama S(2004). Neuroglycan C, a novel member of the neuregulin family. Biochem BiophysRes Commun 321, 1045–1049.
[41] Ida M, Shuo T, Hirano K, Tokita Y, Nakanishi K, Matsui F, Aono S, Fujita H,Fujiwara Y, Kaji T, et al. (2006). Identification and functions of chondroitinsulfate in the milieu of neural stem cells. J Biol Chem 281, 5982–5991.
[42] Feinberg AP, Ohlsson R, and Henikoff S (2006). The epigenetic progenitororigin of human cancer. Nat Rev Genet 7, 21–33.
[43] Tone AA, BegleyH, SharmaM,Murphy J, Rosen B, BrownTJ, and Shaw PA (2008).Gene expression profiles of luteal phase fallopian tube epithelium from BRCA muta-tion carriers resemble high-grade serous carcinomas. Clin Cancer Res 14, 4067–4078.
[44] Jazaeri AA, Yee CJ, Sotiriou C, Brantley KR, Boyd J, and Liu ET (2002). Geneexpression profiles of BRCA1-linked, BRCA2-linked, and sporadic ovarian can-cers. J Natl Cancer Inst 94, 990–1000.

Figure W1. Illustration of LCM. (A) Fallopian tube tissue: (1) fixed slide immediately before performing LCM, (2) slide after LCM andremoval of tissue, (3) fallopian tube epithelial tissue adherent to collection cap, and (4) collection cap coated with fallopian tube epithelialtissue at completion. (B) Tumor tissue: same steps (1-4) are shown.
Table W1. Duplicated Samples Used to Interrogate the Gene Expression Signature.
Unique Identifier
Corresponding Case Tissue Block Used for LCM BRCA1 Status Menopausal StatusB1-FTocc no. 1 – DUP
B1-FTocc no. 1 Ipsilateral FT B1.3109insAA Pre B1-FTocc no. 2 – DUP B1-FTocc no. 2 Contralateral FT (120A>G) Post B1-FTocc no. 6 – DUP B1-FTocc no. 6 Contralateral FT B1.C61G PostFor each of these patients, an independent section of fallopian tube was subjected to RNA isolation, amplification, and array creation.

Table W2. Twelve Additional Fallopian Tube Samples Used to Interrogate the BRCA1 PreneoplasticGene Signature.
Case Identifier
Figure W2.18,600 probB1-CA forme
Age (years)
Unsupervise sets expd a distin
Menopausal Status
ed hierarchicalressed with adect group from t
BRCA1 Status
clustering of caquate quality ohe fallopian tub
Clustering Group
B1-FT no. 1
39 Post B1.IVS5-11 T>G WT-FT B1-FT no. 2 43 Post B1.C61G WT-FT B1-FT no. 3 45 Post B1.5677insA B1-FTocc B1-FT no. 4 46 Post B1.13+1 G to A WT-FT B1-FT no. 5 48 Post B1.975delAG WT-FT B1-FT no. 6 49 Post B1.3124delA B1-FTocc B1-FT no. 7 50 Post B1.3878insT WT-FT B1-FT no. 8 51 Post B1.Q1200X B1-FTocc B1-FT no. 9 52 Post B1.120A>G(M1V) B1-FTocc B1-FT no. 10 53 Post B1.5385insC WT-FT B1-FT no. 11 59 Post B1.del exon 17 B1-FTocc B1-FT no. 12 62 Post B1.R1699W WT-FTEach fallopian tube was collected at the time of prophylactic salpingo-oophorectomy from a patientwith a known deleterious BRCA1 mutations. None of these samples were used in the derivation ofthe BRCA1 preneoplastic gene signature.
ses using alln the arrays.e samples.

Figure W3. Using the same cases analyzed to create the gene signa-ture, duplicate sections were made, and the protocol was repeatedto assess validity. For case no. 1, the ipsilateral FT was used, andfor case nos. 2 and 6, the contralateral FT was used. Frozen tissuewas subjected independently to sectioning, LCM, andRNA amplifica-tion. These duplicated samples were then subjected to unsupervisedhierarchical clustering using the original 41 probe set gene signature.Clustering of the three duplicated samples (B1-FTocc DUP) showsthat duplicates cluster near regardless ofwhether they are taken fromthe ipsilateral or contralateral fallopian tube.

Figure W4. Representative examples of clustering with the independent B1-FT test samples using the 41 probe set gene signature.(A) B1-FT no. 8 clustered with the B1-FTocc/B1-CA group, whereas (B) B1-FT no. 7 clustered with the WT-FT group.


