Embed Size (px)
Citation preview
Sara Raquel Martins Neves
Master on Biomedical Engineering
Project coordinator:
PhD Célia Maria Freitas Gomes
Identification of Cancer Stem-Like Cells
in Osteosarcoma:
Implications in Radioresistance
Identificação de Células Estaminais Tumorais em Osteosarcoma
e suas implicações na resistência à Radioterapia
University of Coimbra
2010
This work was developed in the following places:
Institute of Biophysics and Biomathematics, Institute of Biomedical Research in Light and Image, Faculty of Medicine, University of Coimbra, Coimbra
Radiotherapy Service - University Hospital of Coimbra, Coimbra
Histocompatibility Centre of Coimbra - University Hospital of Coimbra, Coimbra
Dissertation presented to the Faculty of Sciences
and Technology of the University of Coimbra to
obtain a Master degree in Biomedical Engineering
Parts of this work are published in the following abstracts:
S. R. M. Neves, A. O. G. Lopes, A. do Carmo, A. J. Abrunhosa, P. C. P. S. Simões, A. A.
Paiva, M. Botelho, C. M. F. Gomes “Osteosarcoma contains a subpopulation of Cancer
Stem-like Cells that are highly resistant to radiotherapy” – Acceptance for poster
presentation at the 16th International Charles Heidelberger Symposium on Cancer
Research (September 26-28, 2010 in Coimbra, Portugal).
A. O. G. Lopes, S. R. M. Neves, A. do Carmo, A. A. Paiva, M. Botelho, C. M. F. Gomes
“Identification of Cancer Stem Cells in Osteosarcoma and their implications in response
to Chemotherapy” Acceptance for poster presentation at the 16th International Charles
Heidelberger Symposium on Cancer Research (September 26-28, 2010 in Coimbra,
Portugal).
Celia M. Gomes, Sara R. Neves, Aurio O. Lopes, Antero J. Abrunhosa, Paulo C.Simões,
Artur A. Paiva, Maria F. Botelho “Role of Cancer Stem Cells in [18F]FDG Uptake and
Therapy Response in Osteosarcoma” – Acceptance for oral presentation at the 2010
World Molecular Imaging Congress (September 8-11, 2010 in Kyoto, Japan).
S. R. M. Neves, A. O. G. Lopes, A. J. Abrunhosa, P. C. P. S. Simões, A. A. Paiva, M. Botelho,
C. M. F. Gomes, “Cancer stem cell populations in osteosarcoma: implications for
[18F]FDG uptake and response to therapy” – Acceptance for oral presentation at the
Annual Congress of the European Association of Nuclear Medicine (October 9-13, 2010
in Vienna, Austria).
C. M. F. Gomes, S. R. M. Neves, A. O. G. Lopes, A. do Carmo, A. J. Abrunhosa, M. Botelho,
“Assessing metabolic activity of cancer stem cells during differentiation with [18F]FDG” –
Acceptance for poster presentation at the Annual Congress of the European Association
of Nuclear Medicine (October 9-13, 2010 in Vienna, Austria).

À minha avó Olinda, que Deus tem
Aos meus Pais
Ao meu Namorado

vii
Acknowledgments
First of all, I would like to express my gratitude to Dra. Célia Gomes, my mentor,
my Professora, more than the mastermind of this project, for all the knowledge
transmitted and for the entire confidence.
To Professor Miguel Morgado for all the interest and efforts directed to aspiring
Biomedical Engineers. Very special thanks for all the assistance.
To Radiotherapy Service of the University Hospital of Coimbra, in the person of
Eng. Paulo César Simões, for irradiation experiments.
To Centre of Histocompatibility of Centre of the University Hospital of Coimbra, in
the person of Dr. Artur Paiva, for flow cytometry experiments for characterisation of our
human osteosarcoma cells.
To Dr. Antero Abrunhosa, from Institute of Nuclear Sciences Applied to Health of
the University of Coimbra, for [18F]FDG supply and for useful discussions.
To Dra. Anália do Carmo, from Center for Neurosciences and Cell Biology of the
University of Coimbra, for cell cycle experiments and for helpful discussions and
attention.
To Eng. Francisco Caramelo, for all the pertinent and helpful suggestions.
To Professor Bárbara Oliveiros, from Institute of Biophysics and Biomathematics,
for statistical analysis helpful contribution.
To the staff of the Institute of Biophysics and Biomathematics for the all the
facilities conceived.
To my friends, few but good friends, for all the support, patience, suggestions and
aid. To people of Santos Rocha Residence for the complicity and courage.
À minha família, principalmente aos meus pais, por serem um ‘porto’ seguro, por
sermos fortes e unidos. Por tudo, principalmente pelos valores e pelos sábios conselhos
da minha Mãe.
Ao meu namorado, Nuno, por me ter apoiado incessantemente durante este ano,
pela paciência nos momentos de maior luta e pelo incondicional incentivo que me deu.
A Deus, Essência Vital da minha Vida!

ix
Index
Acknowledgments .............................................................................................................. vii
List of Figures ...................................................................................................................... xi
List of Tables ...................................................................................................................... xii
List of Abbreviations ......................................................................................................... xiii
Abstract .............................................................................................................................. xv
Resumo ............................................................................................................................ xvii
1 Introduction ................................................................................................................ 1
1.1 Objectives............................................................................................................ 1
2 Theoretical background .............................................................................................. 3
2.1 The Cancer Stem Cells theory ............................................................................. 3
2.1.1 Fundamental properties of CSCs ................................................................. 4
2.2 Therapeutic implications of the CSC hypothesis ................................................. 5
2.3 Interaction of IR with cellular systems ................................................................ 7
2.4 Cellular responses to IR ....................................................................................... 9
2.4.1 Cell cycle arrest ......................................................................................... 10
2.4.2 DNA repair systems ................................................................................... 12
2.4.3 Apoptosis .................................................................................................. 13
2.4.4 Other cellular responses to IR ................................................................... 13
2.5 Osteosarcoma ................................................................................................... 14
2.5.1 Clinical features of human osteosarcoma ................................................ 15
2.5.2 Therapeutic management of osteosarcoma ............................................. 16
3 Materials and Methods ............................................................................................. 17
3.1 Cell culture ........................................................................................................ 17
3.1.1 Cell viability ............................................................................................... 17
3.2 Sphere formation assay .................................................................................... 17
3.3 Characterization of MNNG/HOS, MNNG/Sar and CSC cells.............................. 18
3.3.1 Expression of mesenchymal stem cell markers ........................................ 18
3.3.2 Differentiation capacity of CSCs into osteoblasts ..................................... 19
3.3.3 Tumorigenic ability of CSCs ....................................................................... 19
3.3.4 Cellular metabolic activity - [18F]FDG uptake ............................................ 20
3.4 Cellular response to IR ...................................................................................... 21
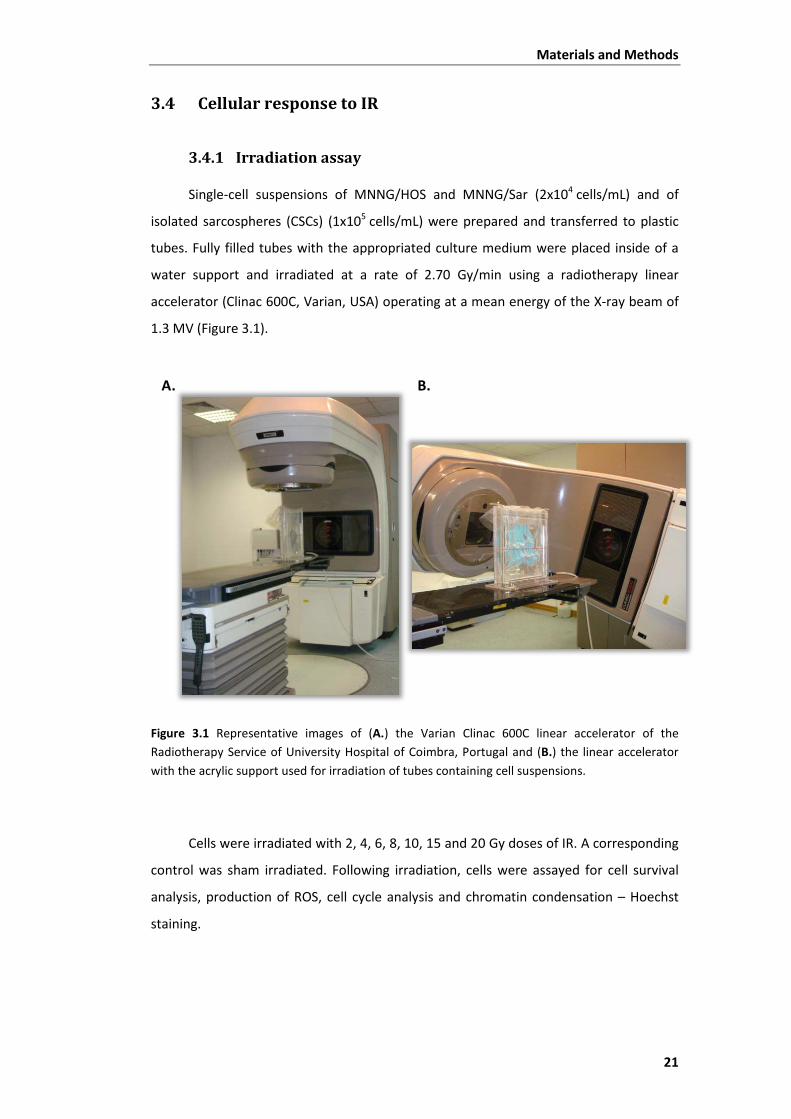
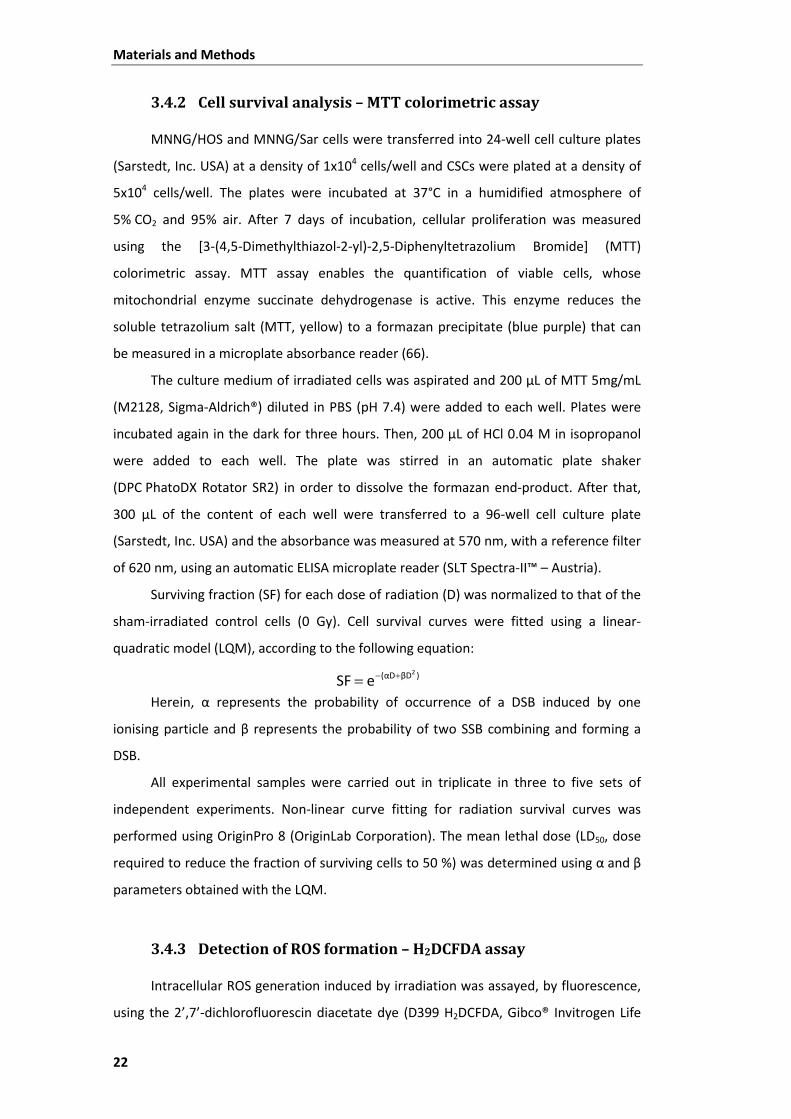
3.4.1 Irradiation assay ........................................................................................ 21
x
3.4.2 Cell survival analysis – MTT colorimetric assay ......................................... 22
3.4.3 Detection of ROS formation – H2DCFDA assay .......................................... 22
3.4.4 Cell cycle analysis ...................................................................................... 23
3.4.5 Chromatin staining with Hoechst 33342 ................................................... 23
3.5 Statistical analysis.............................................................................................. 24
4 Results ....................................................................................................................... 25
4.1 Identification of a Cancer Stem-like Cell (CSC) population in an osteosarcoma MNNG/HOS cell line ...................................................................................................... 25
4.2 Characterisation of adherent and CSC cells ...................................................... 27
4.2.1 Analysis of expression of MSC markers ..................................................... 27
4.2.2 Differentiation capacity into osteoblasts .................................................. 27
4.2.3 CSCs have tumorigenic potential .............................................................. 28
4.2.4 Metabolic activity of CSCs during differentiation ..................................... 29
4.3 Sensibility to IR .................................................................................................. 31
4.3.1 CSCs have higher resistance to IR than adherent cells ............................. 31
4.3.2 Measurement of IR-Induced ROS .............................................................. 33
4.3.3 Cell cycle progression and induction of apoptosis following irradiation .. 33
5 Discussion .................................................................................................................. 39
6 Conclusions ............................................................................................................... 45
7 Future Directions ....................................................................................................... 47
8 References ................................................................................................................. 49
xi
List of Figures
Figure 2.1 The Cancer stem cell model for tumour development and maintenance. ....... 4
Figure 2.2 Schematic diagram of the two processes of interaction between IR and DNA. 8
Figure 2.3 Simplified DNA damage response signalling pathway. ...................................... 9
Figure 2.4 The cell cycle phases and restriction points of checkpoint system. ................ 10
Figure 3.1 Representative images of the Varian Clinac 600C linear accelerator of the
Radiotherapy Service of University Hospital of Coimbra, Portugal. ................................. 21
Figure 4.1 Osteosarcoma cells form sarcospheres in serum-free medium and grow in an
anchorage-independent manner. ..................................................................................... 25
Figure 4.2 Representative dotplots for expression of CD13, CD90 and CD73 surface
markers in CSCs, MNNG/HOS and MNNG/Sar cells. ......................................................... 27
Figure 4.3 Alizarin Red S staining of CSCs after 21 days in Osteogenesis Differentiation
Medium. ............................................................................................................................ 28
Figure 4.4 CSCs injected in athymic mice formed tumour masses, after 3 weeks. .......... 28
Figure 4.5 Uptake of [18F]FDG in CSCs, MNNG/Sar and MNNG/HOS cells at 15, 30 and 60
minutes and uptake of [18F]FDG during differentiation of CSCs. ...................................... 29
Figure 4.6 Dose-response curves of CSCs, MNNG/Sar and MNNG/HOS cells to IR.......... 31
Figure 4.7 ROS production in CSCs, MNNG/Sar and MNNG/HOS cells following exposure
to increasing doses of radiation (2-20 Gy) as measured by H2DCF-DA staining. .............. 33
Figure 4.8 Flow cytometric analysis of cell cycle profiles of MNNG/HOS and CSC cells
after 24 and 48 hours of irradiation with 0, 2, 4, 6, 8 and 10 Gy. ..................................... 34
Figure 4.9 Cell cycle phase distributions measured with flow cytometry for MNNG/HOS
cells and for CSCs after 24 and 48 hours of irradiation with 0, 2, 4, 6, 8 and 10 Gy......... 35
Figure 4.10 Confocal microscopy representative images of MNNG/HOS cells stained with
Hoechst 33342, after irradiation, showing apoptotic cells. .............................................. 36
Figure 4.11 Confocal microscopy representative images of CSCs stained with Hoechst
33342, after irradiation. .................................................................................................... 37
xii
List of Tables
Table 4.1 [18F]FDG uptake in CSCs, MNNG/Sar and MNNG/HOS cells. ............................ 30
Table 4.2 Uptake of [18F]FDG during differentiation of CSCs. ........................................... 30
Table 4.3 Cell survival parameters for CSCs, MNNG/Sar and MNNG/HOS cells, after
irradiation. ......................................................................................................................... 32
xiii
List of Abbreviations
[18F]FDG [18F]fluoro-2-deoxyglucose
AML Acute Myeloid Leukaemia
ATM Ataxia telangiectasia mutated
Bcl-2 B-cell lymphoma 2
BER Base excision repair
Chk1/2 Checkpoint kinases 1 and 2
CSC Cancer Stem Cell
DMEM/F12 Dulbecco’s Modified Eagle Medium / Nutrient Mixture F-12 Ham
DNA Deoxyribonucleic acid
DNA Desoxyribonucleic Acid
DSB Double-strand break
FBS Fetal Bovine Serum
H2DCFDA 2’,7’-dichlorofluorescein diacetate
HRR Homologous recombinational repair
IR Ionising radiation
LD50 Mean lethal dose
LQM Linear-quadratic model
MDR Multidrug resistance
MSC Mesenchymal stem cell
MTT [3-(4,5-Dimethylthiazol-2-yl)-2,5-Diphenyltetrazolium Bromide]
NHEJ Non-homologous End-joining
OH• Hydroxyl free radical
OS Osteosarcoma
PBS Phosphate-Buffered Saline Solution
PET Positron Emission Tomography
PI Propidium iodide

xiv
RNA Ribonucleic acid
RNase Ribonuclease
ROS Reactive oxygen species
RPM Rotations per minute
RPMI Roswell Park Memorial Institute (Medium)
SF Surviving fraction
SSB Single-strand breaks
xv
Abstract
Background: The cancer stem cell theory proposes a hierarchical model for tumour
organisation and states that there is a small subpopulation of stem-like cells, which are
responsible for sustaining tumour growth and differentiation. These cells have a self-
renewal capacity and it has been proposed that they are more resistant to conventional
therapies. We aimed to identify the presence of putative cancer stem-like cells (CSCs) in
a human osteosarcoma cell line (MNNG/HOS) and to evaluate their responsiveness to
ionising radiation.
Methods: CSCs were isolated from the MNNG/HOS osteosarcoma monolayer culture
using the sphere formation assay. The isolated cells were characterised in terms of
expression of mesenchymal stem cell markers, multilineage differentiation and
metabolic activity. Cells were irradiated in a linear accelerator with X-rays at different
doses (2-20Gy). The response of MNNG/HOS and CSCs to ionising radiation was
evaluated using the MTT colorimetric assay after 7 days. The production of reactive
oxygen species was measured using the fluorescent dye H2DCFDA. Cell-cycle responses
were studied at 24 and 48 hours post-irradiation using propidium iodide staining.
Apoptosis was analysed with the fluorescent dye Hoechst 33342.
Results: A subset of cells with stem-like properties was identified in the MNNG/HOS cell
line. The isolated cells formed sphere-clusters, were positive for mesenchymal stem cell
markers, differentiated into osteoblasts and developed tumours in
immunocompromised mice. The uptake of [18F]FDG at 60 minutes in CSCs was of
2.44 ± 1.33 %, significantly lower than that in the MNNG/HOS cells (%/106=11.57 ± 3.55,
p<0.05). The mean lethal dose (LD50) obtained for CSCs was of 7.96 ± 3.00 Gy,
significantly higher than that for MNNG/HOS cells (LD50=3.36 ± 0.55 Gy, p<0.05). The
production of reactive oxygen species was higher in MNNG/HOS cells. It was observed a
dose dependent cell-cycle arrest in G2/M phase at 24h, in the MNNG/HOS cells, which
was partially reversed at 48 hours. The cell-cycle progression in CSCs remained almost
unaltered. Apoptotic CSCs were visible only for higher doses of radiation.
Conclusions: We have identified a subset of tumour cells with stem-like properties in
osteosarcoma that are relatively resistant to radiation. The distinct resistance to therapy
seems to be related with the quiescent status of CSCS, as demonstrated by the lower
accumulation of [18F]FDG in these cells. The absence of alterations in cell-cycle

xvi
progression of CSCs suggests that these cells may have higher capacity to repair the
irradiation-induced DNA lesions and constitutive activated DNA damage checkpoint
response. These results suggest that radiotherapy may not address the CSCs
subpopulation allowing them to survive and regenerate the tumour.
Keywords: cancer stem cells, osteosarcoma, [18F]FDG uptake, radioresistance, cell cycle
xvii
Resumo
Introdução: A teoria das células estaminais cancerosas propõe um modelo hierárquico
para a organização tumoral e postula que existe uma pequena subpopulação de células,
com características de células estaminais, responsáveis pela sustentação do crescimento
e diferenciação tumoral. Estas células possuem uma capacidade de auto-renovação e
tem sido proposto que são mais resistentes às terapias convencionais. Com este
trabalho, pretendemos identificar a presença de células cancerosas com características
de células estaminais (CSCs, do inglês Cancer Stem Cells), numa linha celular de
osteosarcoma humano (MNNG/HOS) e avaliar a sua sensibilidade à radiação ionizante.
Métodos: As CSCs foram isoladas a partir da cultura em monocamada de células
MNNG/HOS de osteosarcoma usando o método de formação de esferas. As células
isoladas foram caracterizadas em termos da expressão de marcadores de células
estaminais mesenquimais, da diferenciação em múltiplas linhagens e de actividade
metabólica. As células foram irradiadas em um acelerador linear com raios-X a
diferentes doses (2-20Gy). A resposta das células MNNG/HOS e das CSCs à radiação
ionizante foi avaliada usando o ensaio colorimétrico de MTT após 7 dias. A produção de
espécies reactivas de oxigénio foi medida usando a sonda fluorescente H2DCFDA. As
respostas em termos de ciclo celular foram estudadas às 24 e 48 horas seguintes à
irradiação usando marcação com iodeto de propídeo. A apoptose foi analisada com a
sonda fluorescente Hoechst 33342.
Resultados: Uma subpopulação de células com características de células estaminais foi
identificada na linha celular MNNG/HOS. As células isoladas formaram esferas, foram
positivas para marcadores de células estaminais mesenquimais, diferenciaram em
osteoblastos e desenvolveram tumores em ratinhos imunodeprimidos. A captação de
[18F]FDG aos 60 minutos nas CSCs foi de 2.44 ± 1.33 %, significativamente menor do que
nas células MNNG/HOS (%/106 = 11.57 ± 3.55, p<0.05). A dose letal média (LD50) obtida
para as CSCs foi de 7.96 ± 3.00 Gy, significativamente maior do que nas células
MNNG/HOS (LD50 = 3.36 ± 0.55 Gy, p<0.05). A produção de espécies reactivas de
oxigénio foi maior nas células MNNG/HOS. Foi observada uma paragem do ciclo celular
dependente da dose de radiação na fase G2/M, às 24 horas, nas células MNNG/HOS, que
foi parcialmente revertida às 48 horas. A progressão no ciclo celular das CSCs
xviii
permaneceu praticamente inalterada. A morte celular por apoptose foi visível nas CSCs
apenas para doses elevadas de radiação.
Conclusões: Identificámos a presença de uma subpopulação de células tumorais com
características de células estaminais no osteossarcoma, que são relativamente
resistentes à radiação. A resistência à terapia parece estar relacionada com o estado
quiescente das CSCs, como demonstrado pela menor acumulação de [18F]FDG nestas
células. A ausência de alterações na progressão do ciclo celular nas CSCs sugere que
estas células podem ter maior capacidade de reparar os danos do DNA induzidos pela
irradiação e uma resposta à lesão do DNA mediada por checkpoints constitutivamente
activada. Estes resultados sugerem que a radioterapia pode não atingir a subpopulação
de células com características de estaminais permitindo-lhes sobreviver e regenerar o
tumor.
Palavras-chave: células estaminais tumorais, osteossarcoma, captação de [18F]FDG radiorresistência, ciclo celular
Introduction
1
1 Introduction
Osteosarcoma (OS), that has been considered to be a disease of differentiation of
osteoblasts, is a type of bone tumour highly incident in children and adolescents. The
gold standard treatment of OS includes neoadjuvant chemotherapy, surgery and
adjuvant chemotherapy. The radiotherapy is the primary local treatment only for OS
lesions in inaccessible sites or in last case for those poor responders and cases of relapse
and adverse outcome, after the application of the standard therapy regimen. The actual
regimen had improved the disease-free survival rates at 50 - 80 %, since its initiation in
the seventies. Nevertheless, 25-50% of non-metastatic patients, which in an initial stage
respond favourably to chemotherapy, subsequently develop systemic disease mostly
related with a poor response to therapy. However, no survival improvement has been
achieved with intensified chemotherapy regimens.
Recent studies suggest that many tumours contain a small subset of cells with
stem-like properties that are responsible for tumour initiation and progression and
resistance to conventional treatments. The presence of these cells has been reported in
many types of tumours, including solid tumours like OS. The therapeutic refractoriness
of these cells seem to be related to intrinsic properties such as the quiescent state, the
expression of multidrug resistance transporters and enhanced mechanisms of DNA
repair.
In the present study, we intend to address whether cancer stem cells are
implicated in tumorigenesis of OS and to determine their role in response to
radiotherapy.
1.1 Objectives
The main objectives of this work are:
1. Isolation of CSCs in an human OS cell line (MNNG/HOS) using the sphere
formation assay;
2. Characterisation of CSCs in terms of expression of cell surface markers,
multilineage differentiation, tumorigenic ability and metabolic activity;
3. Evaluation of the sensitivity of CSCs previously isolated to ionising radiation.

Theoretical background
3
2 Theoretical background
2.1 The Cancer Stem Cells theory
Solid tumours often exhibit a cellular population that displays diverse proliferative
and differentiative properties. This functional heterogeneity is subject of research in the
oncological field; regarding this, the CSC theory is a model that accounts for both
heterogeneity and differences in tumour regenerating capacity of cellular populations in
neoplasms (1).
The CSC hypothesis proposes a hierarchical organisation of cells within the
tumour, in which a subset of stem-like cells are responsible for sustaining tumour
growth and differentiation. These cells termed as cancer stem cells, lying at the apex of
the hierarchy, have the ability to self-renew and differentiate, generating the diverse
cells comprising the bulk tumour.
The first evidence of the presence of CSCs in tumours came from studies in acute
myeloid leukaemia (AML). In the nineties, Bonnet and Lapidot have shown that CSCs had
the ability to regenerate human AML cell populations when transplanted into
immunocompromised mice. The CSCs population was found to be a rare subset of cells
comprising only 0.01-1 % of the total population (2, 3).
Over recent years, CSCs have been prospectively isolated from diverse solid
tumours, albeit its frequency is highly variable [reviewed in (4)]. The existence of CSCs in
solid tumours has been demonstrated in xenotransplantation studies. These studies
have also demonstrated the self-renewal ability of CSCs on serial passaging. For
example, the inoculation of CSCs derived from breast, brain and colon cancer in
immunocompromised mice resulted in the formation of tumour masses (5).
Specific cell surface markers required to isolate CSCs in solid tumours have not yet
been identified. In most studies, combinations of specific markers for normal stem cells
of the same organ of origin have been used in a successful way (6). CD133 and CD44
surface markers have been used to isolate CSCs in different solid tumours. In fact,
different types of brain (7), colon, pancreas, prostate and lung carcinomas have been
identified as being CD133-positive [reviewed in (5)]. Breast cancer was the first solid
tumour from which putative CSCs were prospectively purified and the CSCs population
has shown to be CD44-positive (8). CSCs have already been identified in bone sarcomas.
Cell cultures, from biopsy samples of primary osteosarcoma and chondrosarcoma
Theoretical background
4
tumours, were analysed and revealed the presence of a subset of cells that displayed a
positive staining for the mesenchymal stem cell (MSC) markers Stro-1, CD105 and CD44
(9). In another study, CSCs were detected and characterised based on a CD133-positive
profile and side-population phenotype in established osteosarcoma cell lines (10).
Nevertheless, none of the markers used are exclusively expressed by CSCs.
2.1.1 Fundamental properties of CSCs
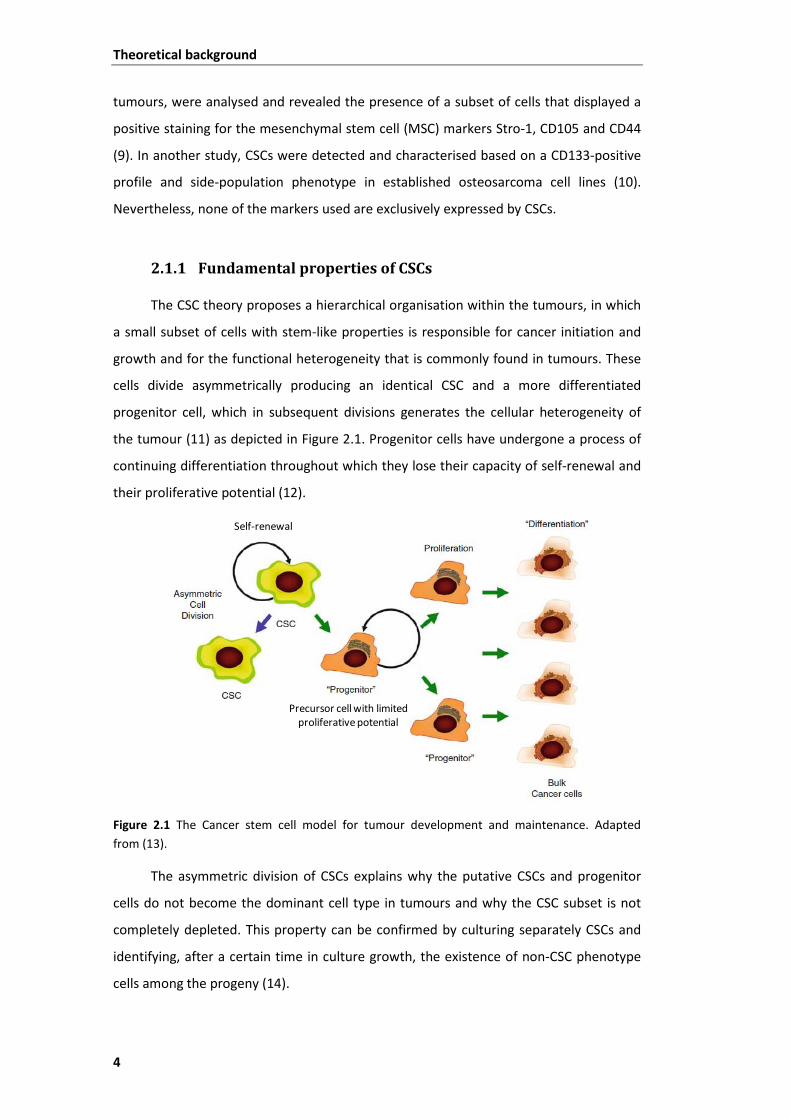
The CSC theory proposes a hierarchical organisation within the tumours, in which
a small subset of cells with stem-like properties is responsible for cancer initiation and
growth and for the functional heterogeneity that is commonly found in tumours. These
cells divide asymmetrically producing an identical CSC and a more differentiated
progenitor cell, which in subsequent divisions generates the cellular heterogeneity of
the tumour (11) as depicted in Figure 2.1. Progenitor cells have undergone a process of
continuing differentiation throughout which they lose their capacity of self-renewal and
their proliferative potential (12).
Figure 2.1 The Cancer stem cell model for tumour development and maintenance. Adapted from (13).
The asymmetric division of CSCs explains why the putative CSCs and progenitor
cells do not become the dominant cell type in tumours and why the CSC subset is not
completely depleted. This property can be confirmed by culturing separately CSCs and
identifying, after a certain time in culture growth, the existence of non-CSC phenotype
cells among the progeny (14).
Self-renewal
Precursor cell with limited proliferative potential
Theoretical background
5
The self-renewal and tumorigenic properties of CSCs have been demonstrated in
vivo, through transplantation of prospectively isolated CSCs in animal models.
The inoculation of isolated CSCs in immunocompromised mice generates tumours
recapitulating the histologic and molecular heterogeneity of the original tumour (15).
The self-renewal property of CSCs contributes extensively to the phenotypic
heterogeneity found in solid tumours. Regarding this heterogenic population, only a
small proportion of cells have tumorigenic capacity when cultured in vitro; for example,
only 0.02-0.1% of cells of lung, ovarian and neuroblastoma cancers were able to form
colonies in soft agar. Accordingly, only 1-4% of leukemic cells transplanted in vivo could
form spleen colonies [reviewed in (16)].
2.2 Therapeutic implications of the CSC hypothesis
From a clinical standpoint of view, the existence of CSCs in tumours has significant
therapeutic implications, since these cells need to be targeted and eliminated to be
achieved complete tumour eradication.
CSCs appear to be relatively resistant to common therapies as compared with
their more differentiated tumorigenic counterparts, and are thought to be responsible
for tumor regeneration after therapy. Several studies have implicated CSCs in resistance
to chemotherapy and radiotherapy (17, 18).
The mechanisms by which CSCs resist to radio or chemotherapy-induced cell
killing are not completely understood. However some properties they share with normal
stem cells such as quiescent status, the expression of ATP-binding cassette (ABC) drug
transporters (e.g. MDR1 and BCRP), altered cell cycle kinetics and higher capacity for
DNA repair, appears to be related with their resistant phenotype (19).
In addition to their ability to self-renew and differentiate, CSCs can also enter in a
quiescent status dividing rarely. It is known that rapidly dividing cells are more sensitive
to cytotoxic therapies; thus, the slow cell cycle kinetics of CSCs can explain why these
cells are spared from therapy (20). Some studies have already implicated the dormant
status of CSCs in both chronic and acute myeloid leukaemia (21-23) in therapy
resistance.
Another important property of CSCs is the overexpression of transmembrane
proteins of the so-called ATP-binding cassette (ABC) superfamily: P-glycoprotein (PGP)
and breast cancer resistance protein (BCRP) (24). These proteins behave as drug-efflux
pumps preventing the intracellular accumulation of cytotoxic agents and represent,
Theoretical background
6
along with the multidrug resistance associated protein-1, the three principal multidrug
resistant proteins that have been identified in resistant tumour cells. This drug efflux
property conferred by the expression of ABC transporters has been used in the isolation
and analysis of a wide variety of human tumour cells, based on the exclusion of the
fluorescent dye Hoechst 33342, by flow cytometry (25).
CSCs have been shown to have altered regulation of cell cycle progression (26).
The differential sensitivity of cells in the different phases of cell cycle can account for
that resistance. Actively proliferating mitotic cells are the most sensitive to DNA
damaging agents like IR, that can induce cell cycle arrest at G1, S and G2 phases (27). As
normal stem cells, CSCs enter frequently in the G0 phase (quiescent) of cell cycle
becoming more resistant. Human leukemic stem cells in xenotransplanted mice,
resistant to chemotherapy, were found to be in the G0 phase of cell cycle (23). This
resting state of CSCs is possibly related to the resistance that CSCs present to the
therapies directed to proliferating cells (28).
Radiation-induced DNA damage accounts for pronounced alterations in the cell
cycle. The activation of the DNA damage checkpoint response enables cellular response
to toxic stress, induced by chemotherapy or radiation, as well as the control of cell cycle
progression. Bao and colleagues have found that CD133-positive stem cells represented
the cellular subpopulation that confers radioresistance to human glioma xenografts and
primary glioblastoma samples (18). Those cells were found to activate extensively
several kinases, such as ataxia telangiectasia mutated (ATM) kinase and the checkpoint
kinases 1 and 2 (Chk1/2), one hour after exposure to IR. Moreover, the radioresistance
profile could be reversed with specific Chk1 and Chk2 inhibitors. These results were also
observed in other tumours (29, 30).
Treatment modalities such as chemo- and radiotherapy act by inducing cellular
death in tumours. There is increasing evidence that CSCs display resistance to apoptotic
stimuli when compared to the bulk tumour cells. CD133-positive glioma stem cells have
already been found to highly express B-cell lymphoma (Bcl-2) and Bcl-XL anti-apoptotic
proteins (31).
Phillips et al. found that the DSBs induced by ionising radiation in the DNA of
human and murine breast CSCs were significantly less compared to non-tumorigenic
cells (32). In an independent study performed in breast cancer it was observed that CSCs
removed more rapidly and more efficiently the foci of phosphorylated histone H2AX by
ATM (28). Constitutive activation of this checkpoint response as a resistant mechanism
in CSCs requires, however, further evidence (33). The transcription factor NF-κB, that
Theoretical background
7
increases the expression of survival factors and thereby inhibiting apoptosis, was also
correlated to resistance of CSCs to apoptotic cell death. Guzman and colleagues, in
successive studies, have found that NF-κB signalling is constitutively activated in human
AML CSCs and that this phenotype could be reversed, resulting in extensive induction of
apoptosis, preferentially in leukemic stem cells (34, 35).
Exposure of cells to IR elicits the chronic production of reactive oxygen species
(ROS), mainly by water radiolysis, which induces the formation of a cascade of reactive
molecules that can target DNA strands. These highly reactive species have already been
found at low constitutive levels in CSCs, on a clinically relevant breast CSC-containing
subpopulation. Moreover, when exposed to IR, radiation-induced ROS levels remained
significantly lower than those levels in tumour bulk cells. In fact, those primary breast
cancer cultures have shown an increased expression of ROS scavengers than the more
differentiated progeny (36). However, the relationship between ROS production and the
ability of CSCs to evade death signals induced by therapy remains to be elucidated.
It is likely that CSCs can use a combination of several mechanisms that make them
relatively resistant to therapy compared to their progeny. Therefore, the identification
of the prevalent resistant mechanism operating in a particular case will allow a more
rational design of better anticancer strategies.
2.3 Interaction of IR with cellular systems
The cellular system is constituted by about 70 % water and the DNA molecule
specifically is highly hydrated. Energy deposition by IR in plasmatic membrane and DNA
molecules is a fact of main concern. These cellular components are relevant targets
regarding cellular integrity and reproductive assurance of viable progeny.
Radiation interactions with matter, which produce biological damage, can be seen
from two points of view: physical processes and cellular alterations. Radiation must first
interact with atoms, alter molecular bonds and then change the chemical structure of
molecules.
Electromagnetic radiation like X-rays of short wavelength and at megavolt
energies (range of 1 – 10 MV) interact randomly with matter and primarily through
three processes: pair production, Compton scattering and photoelectric effect. Briefly, in
the pair production process, an incident X-ray photon is completely absorbed, its energy
is converted to mass and a positron-electron pair is released. The Compton scattering
Theoretical background
8
consists in the process by which a photon is scattered from a nearly unbound atomic
electron. The photoelectric effect occurs whenever an incident photon is absorbed by an
atom and one of the atomic electrons is released (photoelectron) (37).
The majority of cell damage derived from IR results from the formation of free
radicals, due to inelastic collisions between charged particles and water molecules,
resulting in water ionisation and excitation, in a chemical process named water
radiolysis (38).
Regardless of the physicochemical process, an X-ray photon interacting with a
water molecule leads to the formation of free radicals such as hydroxyl radical (•OH),
that are very reactive and chemically unstable molecules. The resulting radicals can
interact with the DNA strands, transferring to them the excess of energy, accounting for
the ‘indirect effects’ of IR in DNA damage. DNA itself can absorb directly the energy of
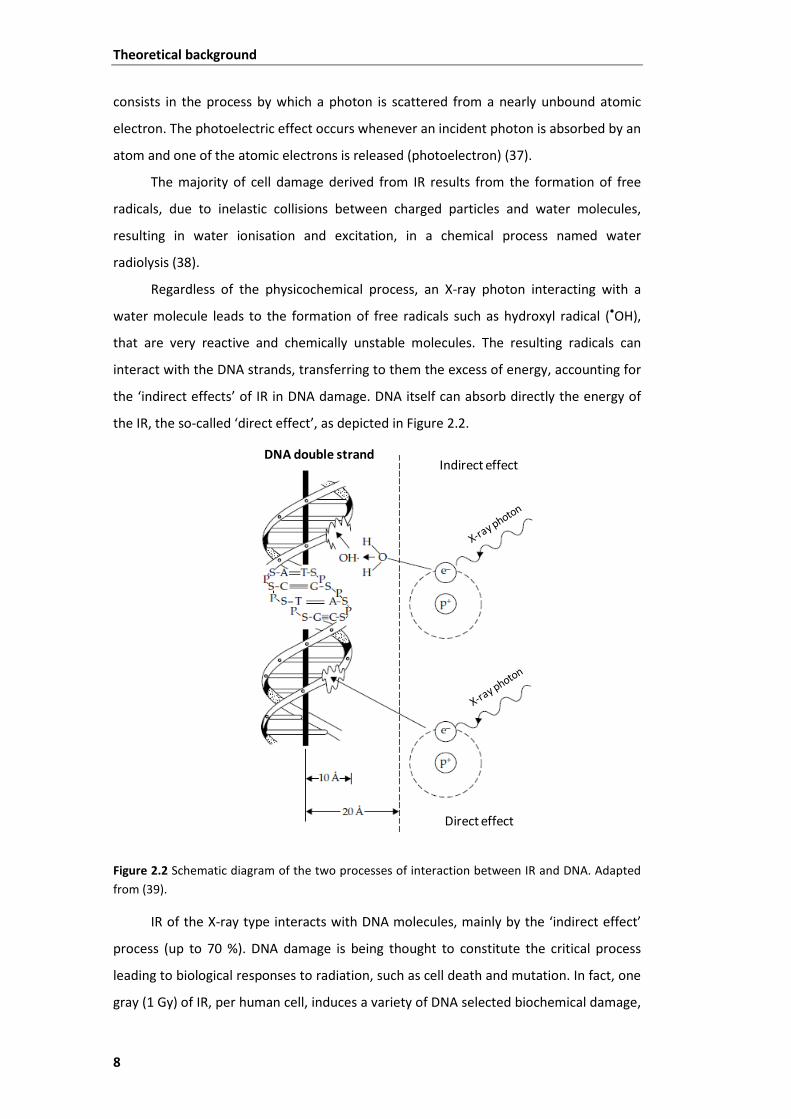
the IR, the so-called ‘direct effect’, as depicted in Figure 2.2.
Figure 2.2 Schematic diagram of the two processes of interaction between IR and DNA. Adapted from (39).
IR of the X-ray type interacts with DNA molecules, mainly by the ‘indirect effect’
process (up to 70 %). DNA damage is being thought to constitute the critical process
leading to biological responses to radiation, such as cell death and mutation. In fact, one
gray (1 Gy) of IR, per human cell, induces a variety of DNA selected biochemical damage,
Indirect effect
Direct effect
DNA double strand
Theoretical background
9
including 40 double-strand breaks (DSB), 500-1000 single-strand breaks (SSB) among
several base and sugar damages, as well as DNA-DNA and DNA-protein cross links (39).
2.4 Cellular responses to IR
The IR, commonly used in radiotherapy, elicits several types of damage in the DNA
structure that include both single-strand and double-strand DNA breaks, base damage
and DNA-protein cross links, being the DSB the most critical lesion.
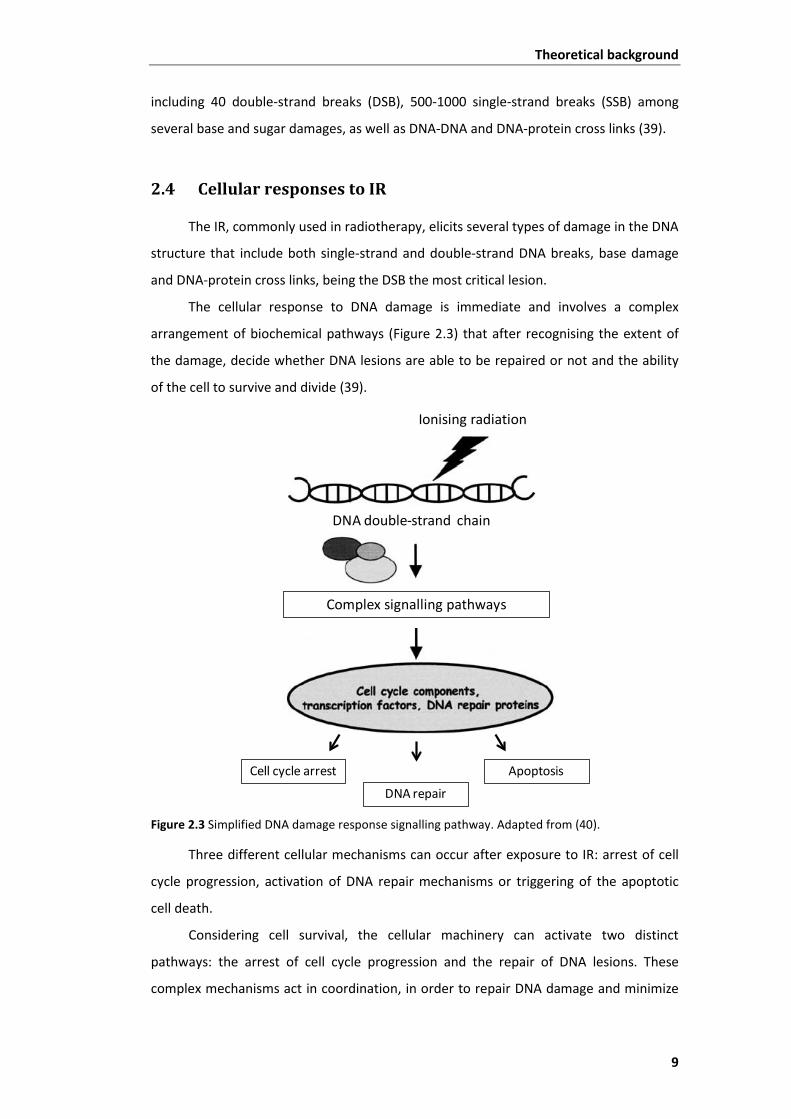
The cellular response to DNA damage is immediate and involves a complex
arrangement of biochemical pathways (Figure 2.3) that after recognising the extent of
the damage, decide whether DNA lesions are able to be repaired or not and the ability
of the cell to survive and divide (39).
Figure 2.3 Simplified DNA damage response signalling pathway. Adapted from (40).
Three different cellular mechanisms can occur after exposure to IR: arrest of cell
cycle progression, activation of DNA repair mechanisms or triggering of the apoptotic
cell death.
Considering cell survival, the cellular machinery can activate two distinct
pathways: the arrest of cell cycle progression and the repair of DNA lesions. These
complex mechanisms act in coordination, in order to repair DNA damage and minimize
Complex signalling pathways
Ionising radiation
DNA double-strand chain
Cell cycle arrest Apoptosis
DNA repair
Theoretical background
10
the occurrence of mutations that compromise the reproductive ability of cells and the
viability of progeny (41).
2.4.1 Cell cycle arrest
Cellular proliferation in eukaryotic cells is accurately regulated by signalling
pathways. Tissues constantly grow and regenerate, by repeated cycles of cell
duplication, of cell division, as well as of cell death. This essential mechanism of cell
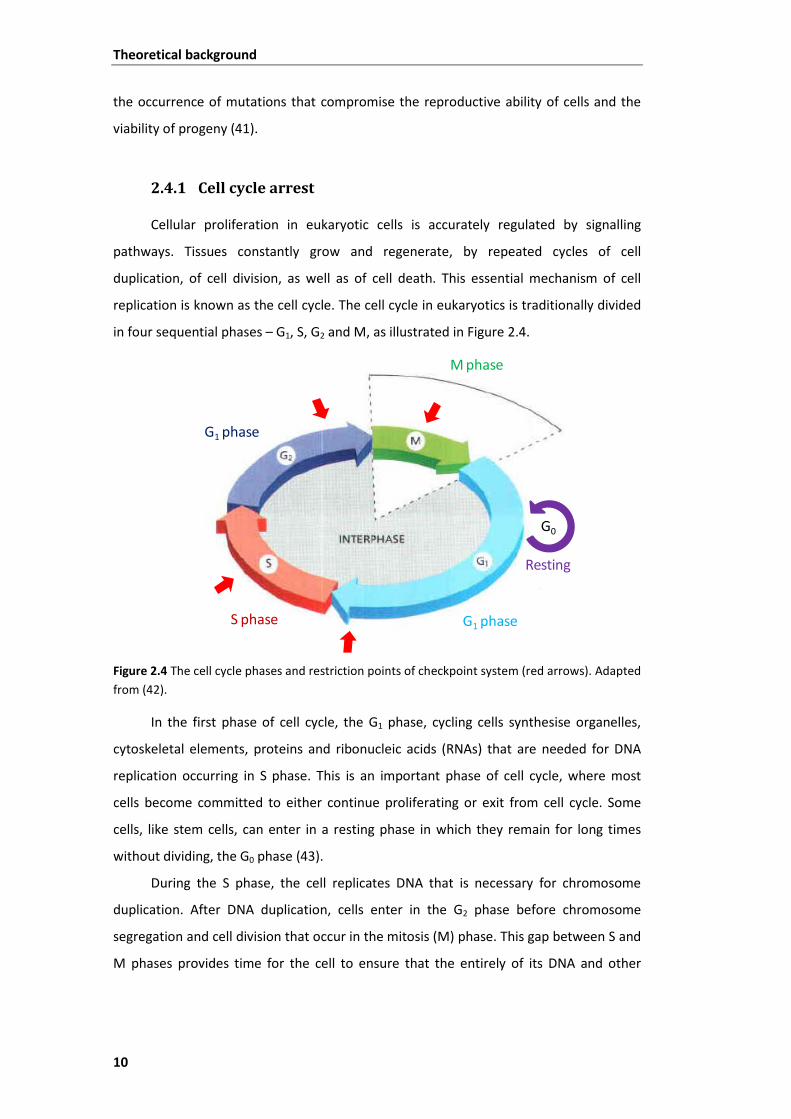
replication is known as the cell cycle. The cell cycle in eukaryotics is traditionally divided
in four sequential phases – G1, S, G2 and M, as illustrated in Figure 2.4.
Figure 2.4 The cell cycle phases and restriction points of checkpoint system (red arrows). Adapted from (42).
In the first phase of cell cycle, the G1 phase, cycling cells synthesise organelles,
cytoskeletal elements, proteins and ribonucleic acids (RNAs) that are needed for DNA
replication occurring in S phase. This is an important phase of cell cycle, where most
cells become committed to either continue proliferating or exit from cell cycle. Some
cells, like stem cells, can enter in a resting phase in which they remain for long times
without dividing, the G0 phase (43).
During the S phase, the cell replicates DNA that is necessary for chromosome
duplication. After DNA duplication, cells enter in the G2 phase before chromosome
segregation and cell division that occur in the mitosis (M) phase. This gap between S and
M phases provides time for the cell to ensure that the entirely of its DNA and other
G1 phase
G0
Resting
G1 phase
S phase
M phase
Theoretical background
11
intracellular components have been properly duplicated, before the cell commits to
mitosis. This gap also provides time for additional growth of the cell.
G1, S and G2 phases are collectively called interphase. In M phase, the cell
proceeds to two major events: nuclear division (mitosis) and cytoplasmatic division
(cytokinesis). In the mitotic phase there is equal distribution of chromosomes and
deposition of new plasmatic membranes into two new daughter cells.
Cell cycle control system assures that DNA is correctly duplicated and segregated
along the different phases of cell cycle. This system is composed by biochemical
switches that recognise DNA content and regulate the progression to subsequent phases
of cell cycle. For example, segregation of chromosomes does not occur until DNA is
correctly duplicated. Environmental conditions like nutrient or oxygen supply and
cytoplasmatic and organelle growth are also monitored by this system (42).
Cell exposure to relevant doses of IR usually delays the normal progression
through the cell cycle, a process known as cell cycle arrest. The progression to the
diverse phases of the cycle is hold up by components of the DNA damage checkpoint
system. This mechanism can arrest the cell cycle progression at the G1 phase, slow down
the S phase or arrest the cell cycle at G2/M phase (41).
The temporary arrest at a specific stage of the cell cycle allows the cell to correct
possible defects. The G1 checkpoint system prevents the replication of damaged DNA
before the cells enter in S phase. At this early time-point of cell cycle, two key
biochemical components operate delaying S phase entry. DNA DSBs, the most cytotoxic
DNA lesions, induced by IR cause an abrupt increase in p53 tumour suppressor levels,
which functions as a transcription factor. The high p53 levels are stabilized by rapidly
activation of the ATM protein kinase, resulting in an arrest of cell cycle in G1 phase.
Upon this procedure, whenever G1 arrest fails, entrance and progression to S phase can
result in the synthesis of radioresistant DNA (39).
The final gatekeeper G2 checkpoint prevents the segregation of aberrant
chromosomes during mitosis. This late checkpoint is activated by a mechanism in which
the ATM protein kinase is activated by DSBs. Subsequently, the activated ATM
phosphorylates the Chk1/2, which in turn inhibits the activity of the cyclin-dependent
kinase 2 that normally drives cell into mitosis, resulting in a block of cell cycle
progression at the G2/M phase (44).
Theoretical background
12
2.4.2 DNA repair systems
DSBs are considered to be the most important type of DNA lesion taking place
after IR insult. When a DSB occurs in a vital section of DNA it can be sufficient to induce
a chromosome abnormality and consequently to sterilize the cell (45).
Base alterations by oxidation, sugar damages like apurinic/apyrimidinic sites and
SSBs are fixed by mechanisms of repair such as base excision repair (BER). This repair
pathway contributes efficiently to maintain genome integrity, by performing a process in
which the damaged bases, as well as SSBs, are detected and removed by glycosylases.
Then those missing bases are replaced and carried out by DNA polymerases and finally
DNA ligases complete the process joining two ends of the DNA strand (45).
DSBs can be repaired by two distinct types of pathways: homologous
recombinational repair (HRR) and non-homologous end-joining (NHEJ). In mammalian
cells, NHEJ has been considered the principal pathway to repair DSBs (41). Both
mechanisms affect the radiosensitivity of a cell. However, there are some differences
between HRR and NHEJ regarding cell cycle dependency. The error free process in HRR,
relying on the use of DNA with the same sequence as a basis for repair, is highly cell
cycle-dependent. HRR commonly occurs in late S/G2 phases, a time-point in which there
is availability of sister chromatid templates. NHEJ recruits less molecular machinery than
HRR and is thought to occur mainly in G0 and G1/early S phases. This is a more rapid
process, although low-fidelity repair pathway, and often results in the formation of small
DNA deletions or insertions. Despite these errors, NHEJ is a good repair pathway as it
maximizes the chances of the cell to survive. The main steps of this signalling process
involve DNA DSBs sensing, removal of the site lesions by nucleases, repair by DNA
polymerases and restore of the DNA chain by DNA ligases (39, 45).
The arrest of the cell cycle progression is thought to allow DNA repair systems
sufficient time to fix DNA lesions, and thus preventing them to be converted into
heritable mutations throughout cell divisions. Targeting DNA repair mechanisms in
tumours with deficiencies in cell cycle checkpoints may enhance cell killing and tumour
response to radiotherapeutic approaches (46).
CSCs are thought to activate more effectively the radiation-induced DNA damage
checkpoint compared to their more differentiated progeny. In fact, more differentiated
cells present higher levels of apoptotic cell death and in less extent the mechanisms of
DNA repair, when submitted to IR (47).
Theoretical background
13
2.4.3 Apoptosis
Apoptosis is recognised as an important tumour response to radiotherapy. This
form of cell death is highly regulated and it is a process that relies on a sequential
activation of several different enzymes, known as caspases (protease cascade) (48).
Cell death by this genetically programmed pathway results in rapid and normally
complete destruction and removal of the cell, often as a consequence of an high amount
of damage (45). p53 tumour suppressor, present in cell cycle arrest and DNA repair
signalling pathways, is also represented in the apoptosis pathway. p53 triggers apoptosis
for eliminating damaged cells, through the induction of pro-apoptotic proteins
activation, such as Bax, but the mechanisms by which it promotes apoptosis are still
controversial (48).
Apoptosis is usually divided in two types of signalling pathways – the intrinsic or
mitochondrial pathway and the extrinsic pathway. The intrinsic signalling way of
apoptosis is the most important process of cell death following irradiation damage (45).
This mechanism depends on the Bcl-2 family of protein regulators, which include both
pro- and anti-apoptotic members. Pro-apoptotic complexes act as promoters of the
release of cytocrome-c from mitochondria what triggers the caspase proteins cascade
effectors of apoptosis. Increased levels of Bcl-2 anti-apoptotic protein cause resistance
to radiation therapy. Caspase enzymes sequentially activated lead, ultimately, to marked
morphological changes in the dying cells. The cell nucleus is the organelle most affected
by apoptotic death involving chromatin condensation, nuclear fragmentation and DNA
laddering. Meanwhile, it occurs cell membrane blebbing and formation of apoptotic
bodies through cytoplasmatic fragmentation (49).
2.4.4 Other cellular responses to IR
IR can also elicit other types of cellular responses to DNA damage, such as
necrosis, autophagy and senescence.
2.4.4.1 Necrosis
DNA-damaging agents such as IR can induce necrosis in human tumours. Extreme
changes in pH induced by oxidative stress, energy loss or ionic disequilibrium can
activate the necrotic process and consequently an uncontrolled cellular swelling, release
of lysosomal enzymes and membrane disruption. Depending on the tumour type, the
Theoretical background
14
frequency of necrosis following irradiation varies and it remains to be demonstrated
how the cells control this type of death (45).
2.4.4.2 Autophagy
Autophagy is the major pathway involved in the catabolism of macromolecules
and organelles. This mechanism is active at basal levels but stressing events like
radiation damage can activate this pathway at higher extents. In fact, it has already been
demonstrated that breast, colon and prostate carcinoma cells exhibit a response to IR
that involves activation of autophagy (50). Moreover, glioma CSCs have shown to be
more resistant to IR than their more differentiated counterparts, by entering in an
autophagic process (51). However, the role of autophagy in the cellular responses to IR
remains controversial, as it can contribute both to cell death as well as to cell
survival (52).
2.4.4.3 Senescence
Radiation-induced DNA damage can elicit a permanent cell cycle arrest, which
consists in the lost of cellular ability to divide over time. This blocking on cell cycle
progression is called senescence and is correlated with a permanently ceased capacity of
proliferation instead of metabolic death; indeed, cells losing their capacity to divide are
unable to contribute to tumour growth or recovery after stressing agents such as DNA
lesion induced by IR (45). Targeting the signalling pathways involved in senescence
would be a valuable tool since CSCs are resistant to this type of growth-arrest program
that limits the lifespan of the cells (53).
2.5 Osteosarcoma
Osteosarcoma (OS) is the most common primary malignant bone tumour affecting
children and adolescents. In fact, OS comprises about 20 % of all primary bone sarcomas
and 3-4 % of all childhood malignancies (54). Epidemiological studies in the United
States of America, in 2006, reported that approximately new 400 cases per year of OS
appear among children below 20 years. The age peak of incidence occurs in the second
decade of life, and affects more males than females with a ratio of 1.6:1 (55).
The causes accounting for OS development are not completely understood.
However, genetic predisposition and radiation exposure have been implicated in its
Theoretical background
15
development. Cytogenetic aberrations like gain, loss or rearrangement of chromosomes
and gene mutations are considered possible causes for OS appearance. Mutations in the
retinoblastoma gene RB1 and in the p53 tumour suppressor gene, are the most frequent
genetic changes occurring during the growth spurt in adolescence (56). It has been
suggested an association between rapid bone growth and the development of OS.
Indeed, rapid proliferating cells are more susceptible to oncogenic and mitotic errors
that possible lead to cancer transformation (56). However, regarding the amplitude of
genetic and epigenetic factors, which can underlie OS development, a consensus for the
origin of OS is far from being achieved and OS tumours continue to be considered of
sporadic pattern (57).
2.5.1 Clinical features of human osteosarcoma
OS is considered a differentiation disease, derived from multipotent MSCs. Recent
findings suggest a potential link between a defective osteogenic differentiation of MSCs
and the development of OS (57).
The diagnostic of OS can be made by imaging studies such as X-rays, computed
tomography, magnetic resonance imaging scans and radionuclide bone scans, for
location of tumour masses and by a biopsy for histologic characterisation of the lesion.
According to the World Health Organization, OS can be histologically classified in
osteoblastic (the most common, 70 %), chondroblastic (10 %) and fibroblastic (10 %).
Other OS types include anaplastic, telangiectatic, giant cell rich and small cell OS (58,
59).
Regarding biochemical parameters, elevated levels of alkaline phosphatase and
lactate dehydrogenase confer a poor prognosis for OS patients (54).
OS lesions tend to form in zones of rapid bone growth or turnover like the long
bones of adolescents. The distal femur, proximal tibia and proximal humerus are the
most common locations (57). OS tumours of high grade have a high propensity to
develop metastasis. The lung is the most common metastatic site followed by bone.
Pulmonary metastases at diagnosis are associated with poor prognosis in
OS patients (54).
Theoretical background
16
2.5.2 Therapeutic management of osteosarcoma
Currently, OS treatment is a multimodal approach constituted by neoadjuvant
chemotherapy, followed by local surgical resection and then postoperative or adjuvant
chemotherapy. With this therapeutic regiment, a long-term disease-free survival
percentage (60-70 %) has been achieved in patients with localised lesions (54). The
chemotherapy regimens recommended by the European and American Osteosarcoma
Study Group (EURAMOS-1) protocol include doxorubicin, cisplatin and methotrexate. In
fact, these three drugs combined with ifosfamide consist on the chemotherapy regimen
most applied in OS patients (60).
Factors such as large tumour volume, metastatic lesions and axial location
account for a negative prognostic for OS patients. Moreover, high alkaline phosphastase
levels and tumours responding poorly to neoadjuvant chemotherapy present a higher
risk of recurrence (61).
The probability of disease-free survival, to date, is essentially determined by the
histological response of tumours to neoadjuvant chemotherapy, which is the most
important prognostic factor. The Huvos grading system classifies the percentage of
necrotic tissue following chemotherapy. Patients with a level of tumour necrosis < 90 %
or Huvos grade I/II are considered inferior or poor responders (62).
Radiotherapy, despite being the less used form of therapy for OS disease,
presents itself as a valid and valuable tool in certain conditions. Radiotherapy can be
employed in OS patients as preoperative (neoadjuvant) and as postoperative (adjuvant).
Depending on tumour type and location, the efficiency of chemotherapy and the
acceptance of surgery, the radiotherapeutic approach is sometimes the unique
acceptable type of therapy (63).
For patients with unsatisfactory margins for surgical resection, as for example in
cases when OS localizes in the pelvis, axial skeleton, base of skull or the head and neck,
radiotherapy is also a valid alternative therapeutic approach. These locations of OS are
reported to be associated with higher extents of recurrence (64). In fact, improper
resection margins for surgery account almost 5-fold to local failure than those patients
with adequate margins, whereas poor histological response account for about 3-fold
more probability of recurrence than those cases with a good response [reviewed
in (61)].
Materials and Methods
17
3 Materials and Methods
3.1 Cell culture
The human osteosarcoma cell line MNNG/HOS was obtained from the American
Type Culture Collection (ATCC, Rockville, MD). Cells grown in monolayer and were
cultured in RPMI-1640 medium (R4130, Sigma-Aldrich®) containing 10% (v/v) of heat-
inactivated fetal bovine serum (FBS, Gibco® Invitrogen Life Technologies),
antibiotic/antimycotic 1% (contains penicillin, streptomycin and amphotericin B, Sigma-
Aldrich®), at 37°C in a humidified atmosphere with 5% CO2 and 95 % air. These cells have
not been previously exposed to irradiation or chemotherapeutic agents for inducing
resistance. Cells were subcultivated at a ratio of 1:5 twice a week in the conditions
described above.
3.1.1 Cell viability
Cell viability was determined before all the experiments using the trypan blue
exclusion method. Equal volumes of cell suspension and trypan blue 0.4 % were mixed,
transferred into a Neubauer chamber hemocytometer and counted in an inverted
microscope (Nikon, Eclipse TS 100). Viable cells with intact cellular membranes actively
extrude the dye and therefore emerge brilliant under the microscope whereas dead or
injured cells appear blue. Cell viability was calculated as a percentage of viable cells
relative to the total number of cells. Only cells with viability > 90% were used in all
experiments.
3.2 Sphere formation assay
CSCs were isolated from the MNNG/HOS cell line using the sphere-formation
assay in ultra-low attachment surfaces. MNNG/HOS cells with 80% confluence were
detached with trypsin-EDTA (Gibco® Invitrogen Life Technologies) and plated at a
density of 6x10⁴ cells/well in 6-well cell culture plates (Sarstedt, Inc. USA) coated with
0.8 mg/cm2 poly-HEMA solution, containing 2mL of N2 medium with 1 % methylcellulose
(M0387, Sigma-Aldrich®). N2 medium consists of Dulbecco’s Modified Eagle
Medium/Nutrient Mixture F-12 Ham (DMEM/F12, D2906 Sigma-Aldrich®) supplemented
with sodium bicarbonate 1.2 g/L (S6297, Sigma-Aldrich®), progesterone 20 nM (P7556,
Materials and Methods
18
Sigma-Aldrich®), putrescine 100 mM (P5780, Sigma-Aldrich®),
insulin-transferrin-selenium-A supplement 1 % (Gibco® Invitrogen Life Technologies) and
antibiotic/antimycotic 1 % (Sigma-Aldrich®). The medium was mixed with equal volume
of sterilized 2 % methylcellulose solution to avoid single-cell aggregation. Human
epidermal growth factor 10 ng/mL (EGF E9644, Sigma-Aldrich®) and human basic
fibroblast growth factor 10 ng/mL (bFGF, PeproTech, EC London) were added twice a
week. Cells were kept at 37°C in a humidified atmosphere of 5% CO2 and 95 % air.
After 7-10 days, the spheres were removed from the suspension culture, allowed
to attach to adherent surfaces and cultured in FBS-containing RPMI medium as
described for MNNG/HOS cells. After reaching 60-80% confluence, cells were re-seeded
as single-cell in serum-free and non-adherent conditions for secondary sphere forming
assays. This procedure was repeated three times. A third generation sphere culture was
allowed to grow in monolayer under the same culture conditions as the MNNG/HOS
cells until 20-30 passages. This cell culture derived from third generation spheres was
referred to as MNNG/Sar cells. Spheres obtained with this method were named
sarcospheres or CSCs.
3.3 Characterization of MNNG/HOS, MNNG/Sar and CSC cells
3.3.1 Expression of mesenchymal stem cell markers
Cells were analysed for the expression of surface markers associated with MSC by
flow cytometry. According to the International Society for Cellular Therapy (65), MSCs
should be positive for CD73, CD90 and CD105 surface markers and negative for CD11b,
CD19, CD34, CD45 and HLA-DR. Cells derived from monolayer cultures and 7-day old
sarcospheres were dissociated with trypsin-EDTA and accutase (Gibco® Invitrogen Life
Technologies), respectively.
Two hundred microliters of a single-cell suspension (2x10⁶ cells/mL) in PBS were
incubated with fluorescent-labelled monoclonal antibodies in the dark for 10 minutes.
After two washing steps with 250 μL of PBS, to remove monoclonal excess, the labelled
cells were analyzed by flow cytometry using a BD FACS Canto™ II Flow Cytometer
(Becton Dickinson, S.A., USA) and analysed using the CellQuest software
(BD Biosciences).
The antibodies used were phycoerythrin (PE)-conjugated CD73 (BD Pharmingen™)
and CD105 (Immunostep), allophycocyanin (APC)-conjugated CD90 (BD Pharmingen™),
Materials and Methods
19
Pacific blue (PB)-conjugated CD11b (BD Pharmingen™), PE-Cy7-conjugated CD19
(eBioscience), peridinin-cholophyll-protein complex (PerCP)-Cy5.5-conjugated CD34 (BD
Pharmingen™), Pacific orange (PO)-conjugated CD45 (Gibco® Invitrogen Life
Technologies) and fluorescein isothiocyanate (FITC)-conjugated HLA-DR (eBioscience).
3.3.2 Differentiation capacity of CSCs into osteoblasts
For this assay we used the guidelines and products of the STEMPRO® Osteogenesis
Differentiation Kit of Gibco® Invitrogen Life Techonologies.
The isolated CSCs were expanded in DMEM low glucose supplemented with 10 %
MSC-qualified serum, L-glutamine 200 mM (59202C Sigma-Aldrich®) and
antibiotic/antimycotic 1%.until they reach 80 % confluence. Thereafter cells were rinsed
with PBS, detached with accutase and pelleted at 1200 RPM for five minutes. Afterward,
cells were counted, ressuspended in MSC growth medium, in 12-well plates, at a density
of 2 x 10⁴ cells/well and incubated at 37°C in a humidified atmosphere of 5% CO2 and
95 % air.
After 24 hours the media was replaced by Complete Osteogenesis Differentiation
Medium and the cells were kept in the incubator for 21 days and reefed every 3 to
4 days. Complete Osteogenesis Differentiation Medium consisted of STEMPRO®
Osteocyte Differentiation Basal Medium supplemented with STEMPRO® Osteogenesis
Supplement and antibiotic/antimycotic 10 %.
Analysis of differentiation of CSCs into osteoblasts was performed at 21 days
under differentiating conditions. The medium was removed and the wells were rinsed
with PBS. Cells were then fixed with ice-cold ethanol 75% for 60 minutes. After fixation,
cells were rinsed twice with distilled water and stained with 2 % Alizarin Red S solution
(pH 4.2) for 30 minutes at room temperature. Wells were then rinsed three times with
distilled water and visualised under light microscope for image capture, using the Motic
Images Advanced 3.2 software.
3.3.3 Tumorigenic ability of CSCs
The tumorigenic ability of CSCs was evaluated through their ability to generate
tumours after inoculation in athymic mice. The animal maintenance and studies were
performed in compliance with the Institutional Guidelines related to the Conduct of
Animal Experiments. Six-week old male athymic Balb/c nu/nu mice, purchased from
Materials and Methods
20
Charles River Laboratories, were injected subcutaneously (s.c.) with 2.5 x 10⁵ and
1 x 10⁶ cells, in the right flank. CSCs with viability > 80 % were injected as a single-cell
suspension in 200 μL of PBS. Tumour growth was monitored weekly for up to 3 weeks.
The animals were sacrificed by cervical dislocation after tumours reached 200 mm3.
3.3.4 Cellular metabolic activity - [18F]FDG uptake
The cellular metabolic activity of both adherent osteosarcoma cells (MNNG/HOS
and MNNG/Sar) and of formed sarcospheres was assessed using
[18F]fluoro-2-deoxyglucose ([18F]FDG), which is a PET radiopharmaceutical analogue of
glucose approved by Food and Drug Administration (United States of America) for
routine clinical PET imaging studies.
Single-cell suspensions (2x10⁶ cells/mL) in culture medium were prepared and
kept in the incubator at 37°C during one hour for recovery. Cell suspensions were
incubated with [18F]FDG (0.75 MBq/mL) under room air at 37°C in an heating plate
(Thermoblock, FALC). At 15, 30 and 60 minutes, samples of 200 μL were transferred to
microcentrifuge tubes containing 500 μL of ice-cold PBS and centrifuged at 1x10⁴ RPM
for one minute in a Costar Mini Centrifuge (USA). The supernatants were collected into
glass tubes and the cell pellets were washed with PBS. Cell pellets and supernatants
were assayed for radioactivity in a Radioisotope Calibrator Well Counter
(CRC-15W Capintec, USA) within the 18F sensitivity energy window (400-600 keV).
Results are reported as the percentage of cell radioactivity associated with the
total radioactivity added and normalized per million of cells. All experimental samples
were carried out in triplicate in four sets of independent experiments.
Materials and Methods
21
3.4 Cellular response to IR
3.4.1 Irradiation assay
Single-cell suspensions of MNNG/HOS and MNNG/Sar (2x10⁴ cells/mL) and of
isolated sarcospheres (CSCs) (1x10⁵ cells/mL) were prepared and transferred to plastic
tubes. Fully filled tubes with the appropriated culture medium were placed inside of a
water support and irradiated at a rate of 2.70 Gy/min using a radiotherapy linear
accelerator (Clinac 600C, Varian, USA) operating at a mean energy of the X-ray beam of
1.3 MV (Figure 3.1).
Figure 3.1 Representative images of (A.) the Varian Clinac 600C linear accelerator of the Radiotherapy Service of University Hospital of Coimbra, Portugal and (B.) the linear accelerator with the acrylic support used for irradiation of tubes containing cell suspensions.
Cells were irradiated with 2, 4, 6, 8, 10, 15 and 20 Gy doses of IR. A corresponding
control was sham irradiated. Following irradiation, cells were assayed for cell survival
analysis, production of ROS, cell cycle analysis and chromatin condensation – Hoechst
staining.
A. B.
Materials and Methods
22
3.4.2 Cell survival analysis – MTT colorimetric assay
MNNG/HOS and MNNG/Sar cells were transferred into 24-well cell culture plates
(Sarstedt, Inc. USA) at a density of 1x10⁴ cells/well and CSCs were plated at a density of
5x10⁴ cells/well. The plates were incubated at 37°C in a humidified atmosphere of
5% CO2 and 95% air. After 7 days of incubation, cellular proliferation was measured
using the [3-(4,5-Dimethylthiazol-2-yl)-2,5-Diphenyltetrazolium Bromide] (MTT)
colorimetric assay. MTT assay enables the quantification of viable cells, whose
mitochondrial enzyme succinate dehydrogenase is active. This enzyme reduces the
soluble tetrazolium salt (MTT, yellow) to a formazan precipitate (blue purple) that can
be measured in a microplate absorbance reader (66).
The culture medium of irradiated cells was aspirated and 200 μL of MTT 5mg/mL
(M2128, Sigma-Aldrich®) diluted in PBS (pH 7.4) were added to each well. Plates were
incubated again in the dark for three hours. Then, 200 μL of HCl 0.04 M in isopropanol
were added to each well. The plate was stirred in an automatic plate shaker
(DPC PhatoDX Rotator SR2) in order to dissolve the formazan end-product. After that,
300 μL of the content of each well were transferred to a 96-well cell culture plate
(Sarstedt, Inc. USA) and the absorbance was measured at 570 nm, with a reference filter
of 620 nm, using an automatic ELISA microplate reader (SLT Spectra-II™ – Austria).
Surviving fraction (SF) for each dose of radiation (D) was normalized to that of the
sham-irradiated control cells (0 Gy). Cell survival curves were fitted using a linear-
quadratic model (LQM), according to the following equation:
Herein, α represents the probability of occurrence of a DSB induced by one
ionising particle and β represents the probability of two SSB combining and forming a
DSB.
All experimental samples were carried out in triplicate in three to five sets of
independent experiments. Non-linear curve fitting for radiation survival curves was
performed using OriginPro 8 (OriginLab Corporation). The mean lethal dose (LD50, dose
required to reduce the fraction of surviving cells to 50 %) was determined using α and β
parameters obtained with the LQM.
3.4.3 Detection of ROS formation – H2DCFDA assay
Intracellular ROS generation induced by irradiation was assayed, by fluorescence,
using the 2’,7’-dichlorofluorescin diacetate dye (D399 H2DCFDA, Gibco® Invitrogen Life
)βDDα( 2
eSF +−=
Materials and Methods
23
Technologies). The acetylated form of 2’7’-dichlorofluorescin (H2DCFDA) is non-
fluorescent. After oxidation by free radicals like peroxyl, alkoxyl, nitrogen dioxide (NO2•),
carbonate radical (CO3•−), hydroxyl radical (OH•) and peroxynitrite (67), the acetate
groups are removed by intracellular esterases and the probe becomes fluorescent. The
fluorescence levels can be measured with a microplate reader with appropriate filters.
Cell suspensions of MNNG/HOS, MNNG/Sar and CSCs (2.5 x 10⁵ cells/mL) were
incubated with 10 μM H2DCFDA in PBS for 30 minutes. After loading, cells were
centrifuged at 1200 RPM during 5 minutes, ressuspended in suitable medium and
incubated at 37°C for one hour for recovery. Before irradiation, cells were ressuspended
in PBS and irradiated as indicated above (See section 3.4.1). A control sample was sham-
irradiated. After irradiation, a total of 5 x 10⁴ cells/well were transferred to 96-well black
plates and DCF fluorescence intensity read in an automatic microplate reader (Synergy™
HT Multi-Mode Microplate Reader, Biotek Instruments) in fluorescence mode, with an
excitation wavelength of 498 nm and an emission wavelength of 530 nm. Fluorescence
intensity was normalised to the values of non-irradiated cells. Experimental samples
were carried out in triplicate in three sets of independent experiments.
3.4.4 Cell cycle analysis
Cell cycle analysis was performed at 24 and 48 hours following irradiation.
Disaggregated cell suspensions of MNNG/HOS and CSCs with at least 1x10⁵ cells were
fixed in 75% ice-cold ethanol overnight at 4°C and then incubated with 10 μg/mL
propidium iodide (P4864 PI, Sigma-Aldrich®) in the presence of 500 μg/mL RNase A
solution (Ribonuclease A from bovine pancreas R4642, Sigma-Aldrich®) in PBS, in the
dark for 75 minutes at room temperature. PI fluorescence was read in a Becton
Dickinson FACS Flow Cytometer. At least 1x10⁴ events were acquired per experiment.
The percentages of cells in the G1, S, and G2/M phases were measured using the
WinMDI 2.9 software.
3.4.5 Chromatin staining with Hoechst 33342
Apoptosis was observed by chromatin staining with Hoechst 33342. Control and
irradiated cells were prepared and collected for chromatin condensation analysis at 48
hours after irradiation. Cell suspensions of MNNG/HOS and CSCs were fixed with 500 μL
of a methanol-acetone solution (1:1) during 15 minutes and then cell nuclei were
Materials and Methods
24
stained with 50 μL of Hoechst 33342 (2 μL/mL, Gibco® Invitrogen Life Technologies) for
3 minutes. After three washing steps, cells were ressuspended in 50 μL of PBS. A drop
was putted in a glass microscope slide sealed with mounting medium with a coverslip
(Vectashield mounting medium for fluorescence, Vector Laboratories, Inc. Burlingame,
CA). The slides were observed with a Zeiss LSM 510 Meta Confocal Microscope.
Apoptotic cells were distinguished by the presence of nuclear chromatin
condensation and of spotted blue bodies.
3.5 Statistical analysis
Data are reported as mean ± standard deviation (S.D.) with n indicating the
number of experiments. We used the non-parametric Kruskal-Wallis test for multiple
comparisons between multiple cell types throughout different conditions or under the
same condition. We used the Mann-Whitney non-parametric test for comparisons
between two cell types under the same condition. The non-parametric Friedman test
was used for comparisons between different conditions within the same cell type.
The p-value < 0.05 was considered statistically significant. All statistical analysis
was performed by using the Statistical Package for the Social Sciences (SPSS) software
(version 17; SPSS, Inc., Chicago, IL).
Results
25
4 Results
4.1 Identification of a Cancer Stem-like Cell (CSC) population in an osteosarcoma MNNG/HOS cell line
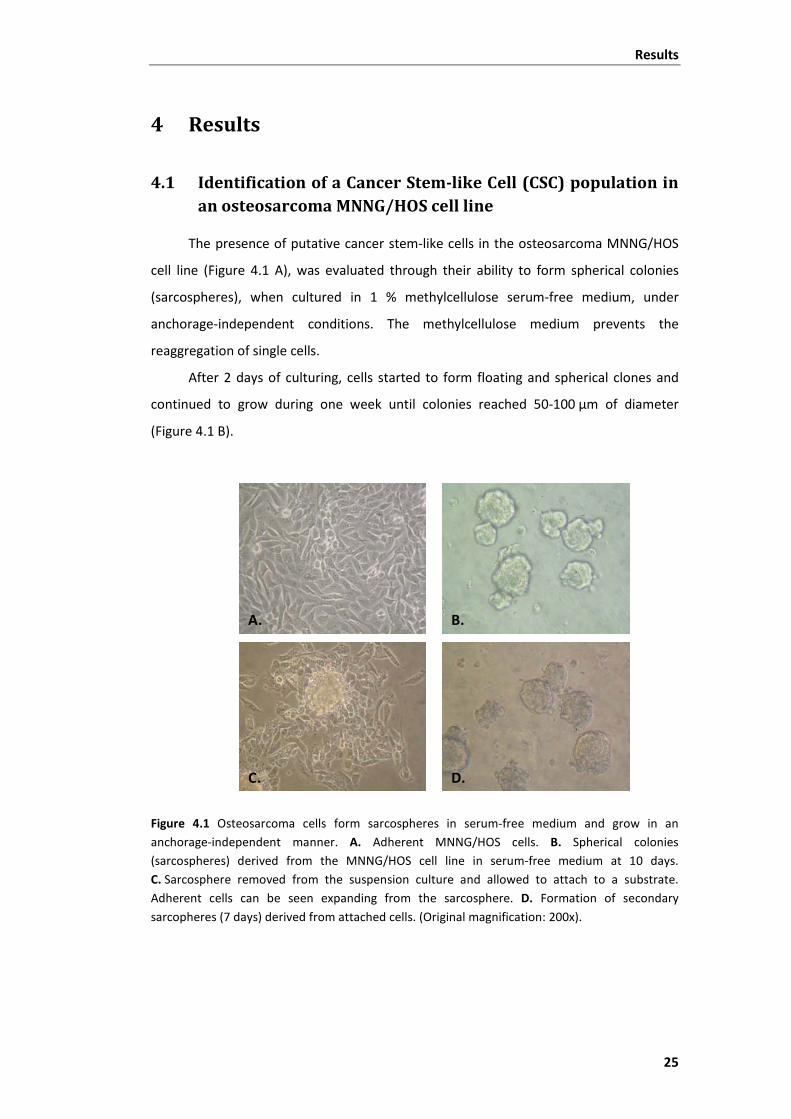
The presence of putative cancer stem-like cells in the osteosarcoma MNNG/HOS
cell line (Figure 4.1 A), was evaluated through their ability to form spherical colonies
(sarcospheres), when cultured in 1 % methylcellulose serum-free medium, under
anchorage-independent conditions. The methylcellulose medium prevents the
reaggregation of single cells.
After 2 days of culturing, cells started to form floating and spherical clones and
continued to grow during one week until colonies reached 50-100 μm of diameter
(Figure 4.1 B).
Figure 4.1 Osteosarcoma cells form sarcospheres in serum-free medium and grow in an anchorage-independent manner. A. Adherent MNNG/HOS cells. B. Spherical colonies (sarcospheres) derived from the MNNG/HOS cell line in serum-free medium at 10 days. C. Sarcosphere removed from the suspension culture and allowed to attach to a substrate. Adherent cells can be seen expanding from the sarcosphere. D. Formation of secondary sarcopheres (7 days) derived from attached cells. (Original magnification: 200x).
A. B.
C. D.
Results
26
Following transfer to standard adherent flasks in RPMI medium containing
10% FBS, within few hours, cells started to migrate from the sarcosphere, and to adhere
to the bottom of the flask assuming a morphological phenotype similar to the original
cell line (Figure 4.1 C).
When reseeded in serum-free medium, the propagated cells formed spherical
colonies with the same efficiency as the previous assay (Figure 4.1 D). This was further
observed in a third round of sphere-forming assay, which confirms their self-renewal
capability.
A third generation of sarcospheres was cultured in monolayer under the same
conditions as the MNNG/HOS cell line, in order to evaluate their capacity to generate
differentiated progeny. After 3 weeks of culture, cells acquired a spindle-shaped
morphology similar to that of the original monolayer culture (MNNG/HOS). This
sarcosphere-derived culture was referred to as MNNG/Sar cells and was used in
subsequent studies.
These results show that human osteosarcoma cell line MNNG/HOS has the ability
to generate spherical colonies, which grow suspended in serum-starvation medium and
that they contain a population of self-renewing cells.
Results
27
4.2 Characterisation of adherent and CSC cells
4.2.1 Analysis of expression of MSC markers
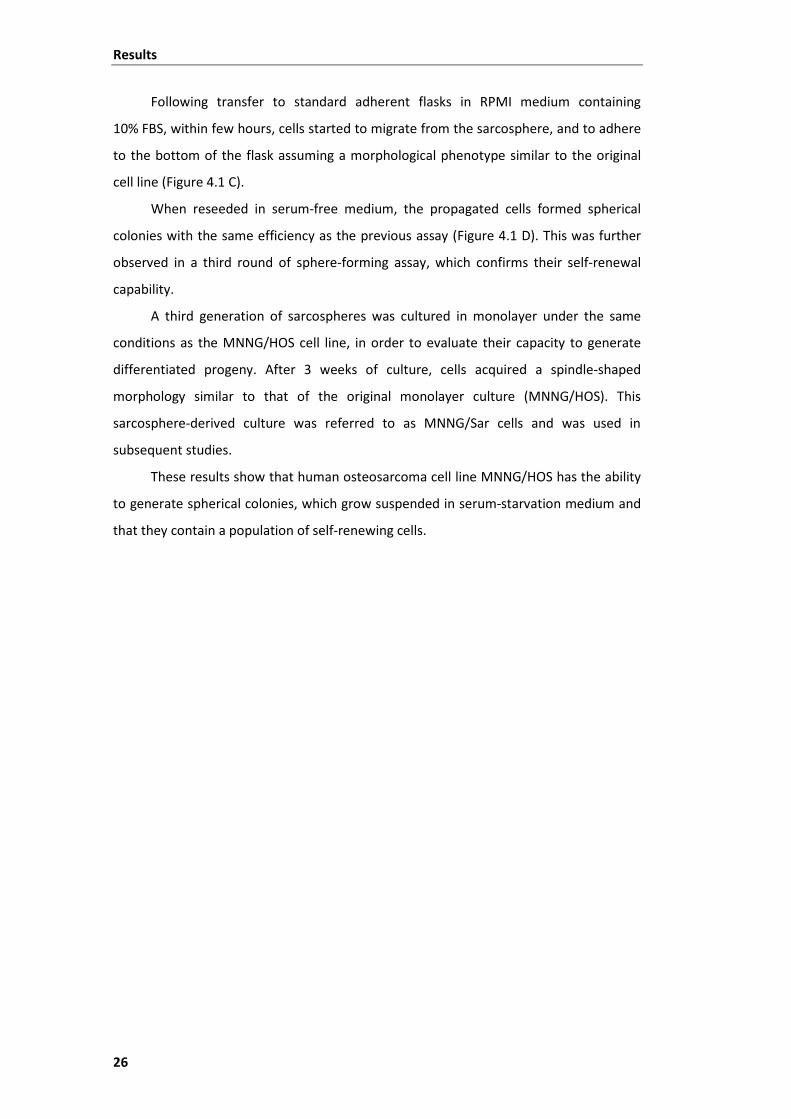
MNNG/HOS, MNNG/Sar and dissociated CSCs were screened for the expression of
specific surface markers of human MSCs, according to criteria of the International
Society for Cellular Therapy (65).
Flow cytometry analysis revealed that CSC were clearly positive for CD90, CD73
and CD13 (Figure 4.2) and weakly positive for CD105. Similar results were obtained with
MNNG/HOS and MNNG/Sar cells.
Figure 4.2 Representative dotplots for expression of CD13, CD90 and CD73 surface markers in CSCs (A.), MNNG/HOS (B.) and MNNG/Sar (C.) cells.
Moreover, the three types of cells lacked the expression of CD34 and CD11b
hematopoietic markers, as well as of CD45 (leukocyte common antigen), CD19 (marker
of B cells) and HLA-DR [expressed on the surface of human antigen presenting cells
(APC)], which exclude the presence of hematopoietic progenitors cells and endothelial
cells that are likely to be found in an MSC culture.
4.2.2 Differentiation capacity into osteoblasts
In order to determine whether CSCs were multipotent, we performed an assay to
induce differentiation in osteoblasts, which is one of the lineages that MSCs can
A. CSCs B. MNNG/HOS
C. MNNG/Sar
Results
28
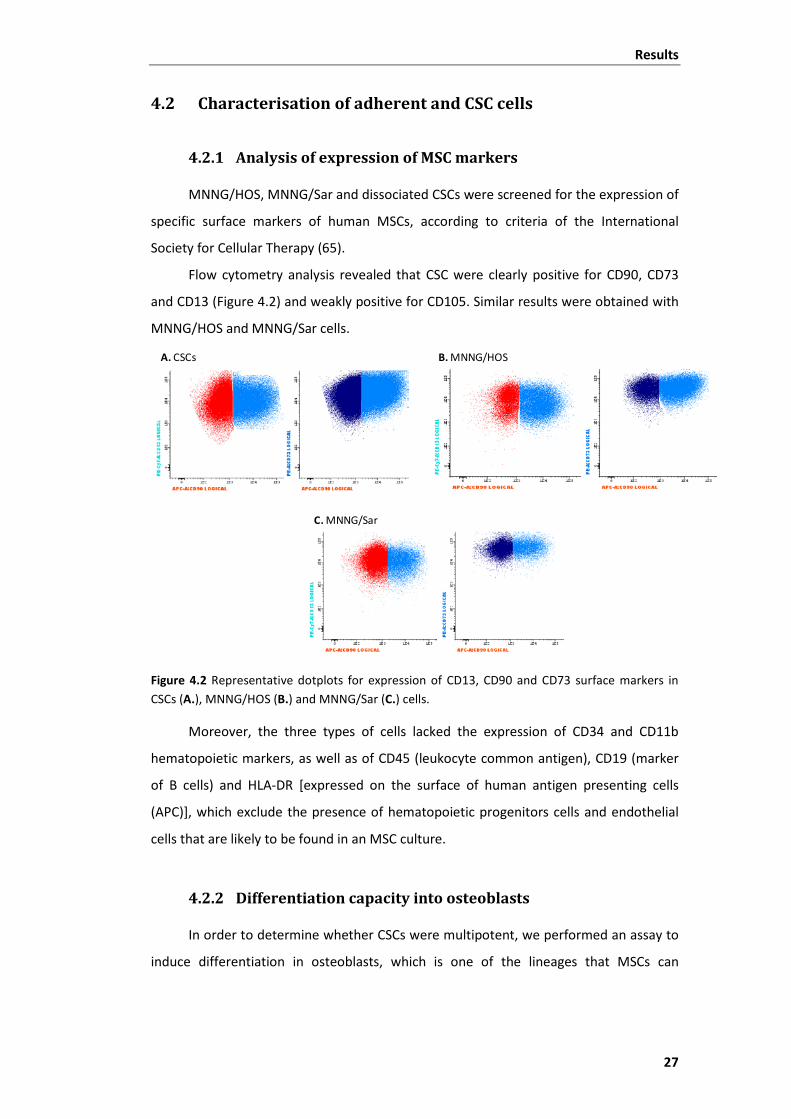
differentiate. After 21 days of incubation in Osteogenesis Differentiation Medium, cells
were stained with the Alizarin Red S dye for visualisation of calcium deposits.
Figure 4.3 Alizarin Red S staining of CSCs after 21 days in Osteogenesis Differentiation Medium. Discrete foci of mineralization are seen in orange. Original magnification: 200x.
The staining with Alizarin Red S showed the deposition of a mineralized matrix as
depicted in Figure 4.3, which demonstrate the osteogenic differentiation potential
of CSCs.
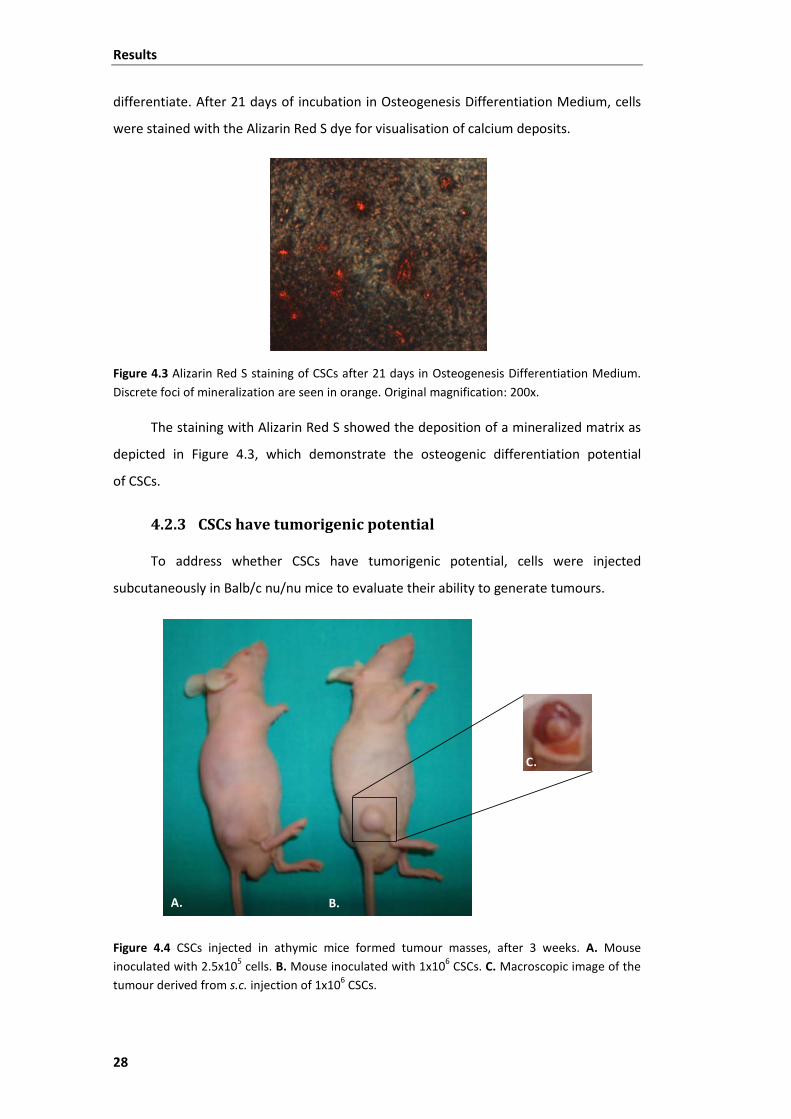
4.2.3 CSCs have tumorigenic potential
To address whether CSCs have tumorigenic potential, cells were injected
subcutaneously in Balb/c nu/nu mice to evaluate their ability to generate tumours.
Figure 4.4 CSCs injected in athymic mice formed tumour masses, after 3 weeks. A. Mouse inoculated with 2.5x10⁵ cells. B. Mouse inoculated with 1x10⁶ CSCs. C. Macroscopic image of the tumour derived from s.c. injection of 1x10⁶ CSCs.
A. B.
C.
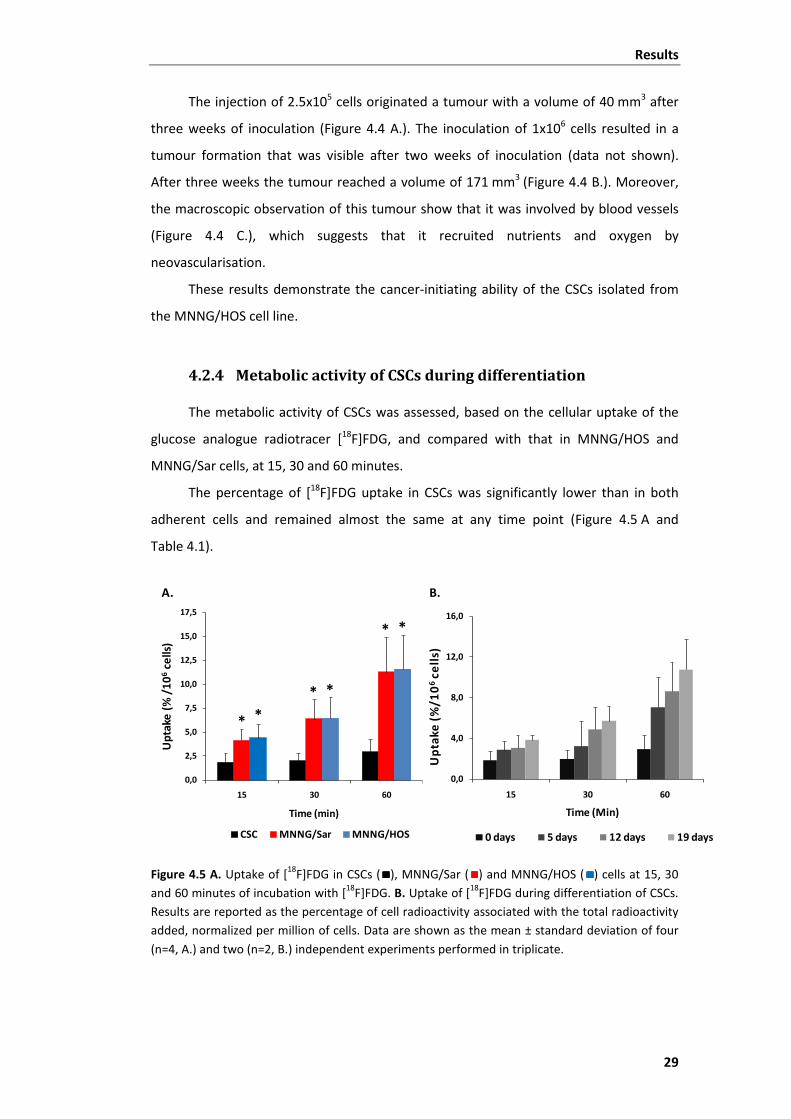
Results
29
The injection of 2.5x10⁵ cells originated a tumour with a volume of 40 mm3 after
three weeks of inoculation (Figure 4.4 A.). The inoculation of 1x10⁶ cells resulted in a
tumour formation that was visible after two weeks of inoculation (data not shown).
After three weeks the tumour reached a volume of 171 mm3 (Figure 4.4 B.). Moreover,
the macroscopic observation of this tumour show that it was involved by blood vessels
(Figure 4.4 C.), which suggests that it recruited nutrients and oxygen by
neovascularisation.
These results demonstrate the cancer-initiating ability of the CSCs isolated from
the MNNG/HOS cell line.
4.2.4 Metabolic activity of CSCs during differentiation
The metabolic activity of CSCs was assessed, based on the cellular uptake of the
glucose analogue radiotracer [18F]FDG, and compared with that in MNNG/HOS and
MNNG/Sar cells, at 15, 30 and 60 minutes.
The percentage of [18F]FDG uptake in CSCs was significantly lower than in both
adherent cells and remained almost the same at any time point (Figure 4.5 A and
Table 4.1).
Figure 4.5 A. Uptake of [18F]FDG in CSCs ( ), MNNG/Sar ( ) and MNNG/HOS ( ) cells at 15, 30 and 60 minutes of incubation with [18F]FDG. B. Uptake of [18F]FDG during differentiation of CSCs. Results are reported as the percentage of cell radioactivity associated with the total radioactivity added, normalized per million of cells. Data are shown as the mean ± standard deviation of four (n=4, A.) and two (n=2, B.) independent experiments performed in triplicate.
0,0
2,5
5,0
7,5
10,0
12,5
15,0
17,5
15 30 60
Upt
ake
(% /
106
cells
)
Time (min)
CSC MNNG/Sar MNNG/HOS
0,0
4,0
8,0
12,0
16,0
15 30 60
Upt
ake
(%/1
06ce
lls)
Time (Min)
0 days 5 days 12 days 19 days
A. B.
*
* *
**
*
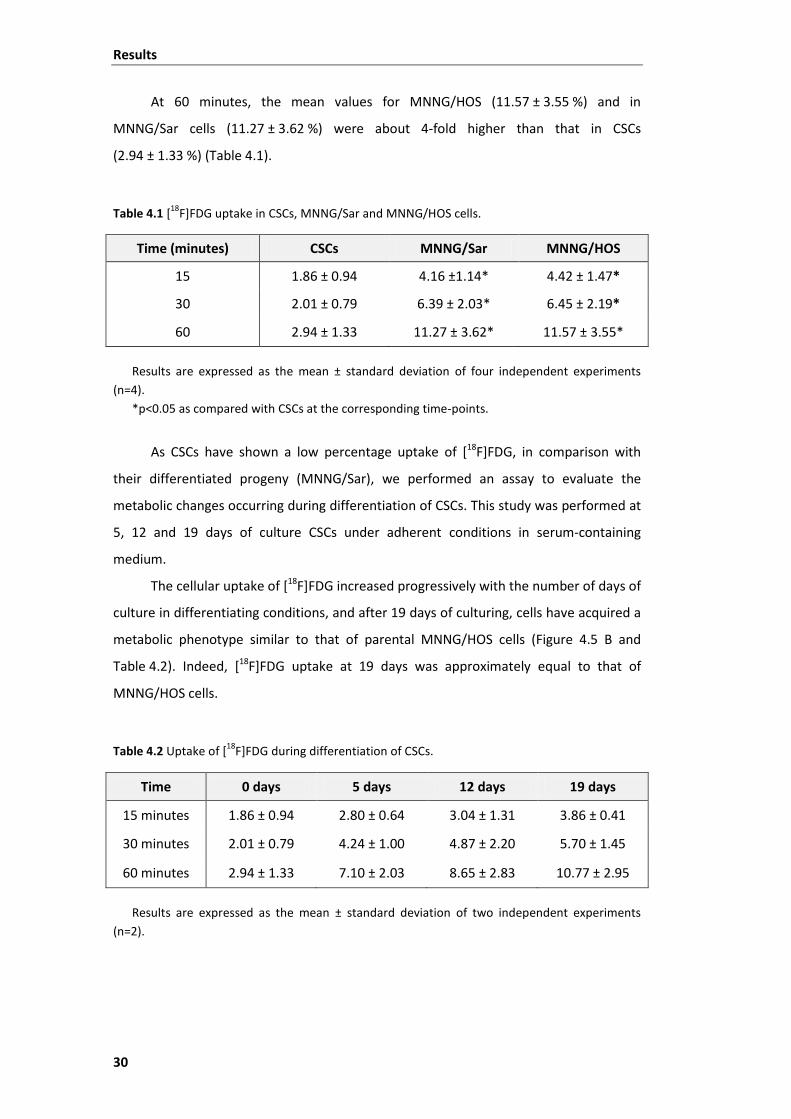
Results
30
At 60 minutes, the mean values for MNNG/HOS (11.57 ± 3.55 %) and in
MNNG/Sar cells (11.27 ± 3.62 %) were about 4-fold higher than that in CSCs
(2.94 ± 1.33 %) (Table 4.1).
Table 4.1 [18F]FDG uptake in CSCs, MNNG/Sar and MNNG/HOS cells.
Time (minutes) CSCs MNNG/Sar MNNG/HOS
15 1.86 ± 0.94 4.16 ±1.14* 4.42 ± 1.47*
30 2.01 ± 0.79 6.39 ± 2.03* 6.45 ± 2.19*
60 2.94 ± 1.33 11.27 ± 3.62* 11.57 ± 3.55*
Results are expressed as the mean ± standard deviation of four independent experiments (n=4).
*p<0.05 as compared with CSCs at the corresponding time-points.
As CSCs have shown a low percentage uptake of [18F]FDG, in comparison with
their differentiated progeny (MNNG/Sar), we performed an assay to evaluate the
metabolic changes occurring during differentiation of CSCs. This study was performed at
5, 12 and 19 days of culture CSCs under adherent conditions in serum-containing
medium.
The cellular uptake of [18F]FDG increased progressively with the number of days of
culture in differentiating conditions, and after 19 days of culturing, cells have acquired a
metabolic phenotype similar to that of parental MNNG/HOS cells (Figure 4.5 B and
Table 4.2). Indeed, [18F]FDG uptake at 19 days was approximately equal to that of
MNNG/HOS cells.
Table 4.2 Uptake of [18F]FDG during differentiation of CSCs.
Time 0 days 5 days 12 days 19 days
15 minutes 1.86 ± 0.94 2.80 ± 0.64 3.04 ± 1.31 3.86 ± 0.41
30 minutes 2.01 ± 0.79 4.24 ± 1.00 4.87 ± 2.20 5.70 ± 1.45
60 minutes 2.94 ± 1.33 7.10 ± 2.03 8.65 ± 2.83 10.77 ± 2.95
Results are expressed as the mean ± standard deviation of two independent experiments (n=2).
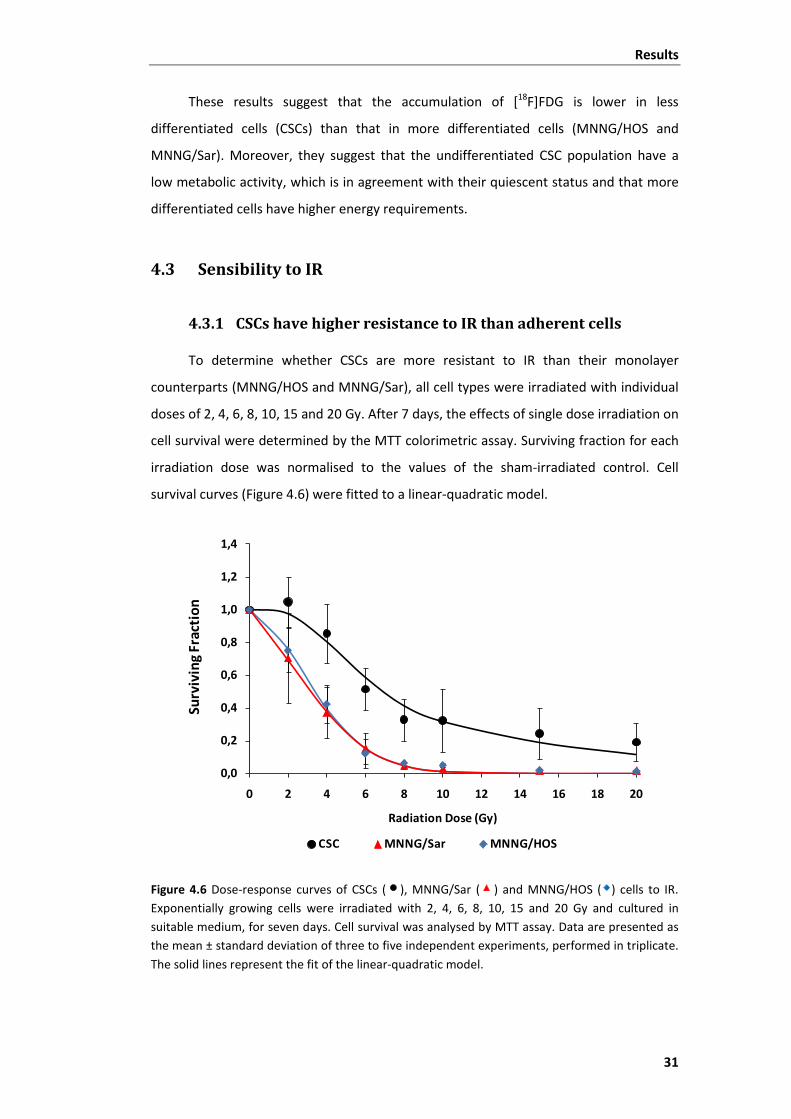
Results
31
These results suggest that the accumulation of [18F]FDG is lower in less
differentiated cells (CSCs) than that in more differentiated cells (MNNG/HOS and
MNNG/Sar). Moreover, they suggest that the undifferentiated CSC population have a
low metabolic activity, which is in agreement with their quiescent status and that more
differentiated cells have higher energy requirements.
4.3 Sensibility to IR
4.3.1 CSCs have higher resistance to IR than adherent cells
To determine whether CSCs are more resistant to IR than their monolayer
counterparts (MNNG/HOS and MNNG/Sar), all cell types were irradiated with individual
doses of 2, 4, 6, 8, 10, 15 and 20 Gy. After 7 days, the effects of single dose irradiation on
cell survival were determined by the MTT colorimetric assay. Surviving fraction for each
irradiation dose was normalised to the values of the sham-irradiated control. Cell
survival curves (Figure 4.6) were fitted to a linear-quadratic model.
Figure 4.6 Dose-response curves of CSCs ( ), MNNG/Sar ( ) and MNNG/HOS ( ) cells to IR. Exponentially growing cells were irradiated with 2, 4, 6, 8, 10, 15 and 20 Gy and cultured in suitable medium, for seven days. Cell survival was analysed by MTT assay. Data are presented as the mean ± standard deviation of three to five independent experiments, performed in triplicate. The solid lines represent the fit of the linear-quadratic model.
0,0
0,2
0,4
0,6
0,8
1,0
1,2
1,4
0 2 4 6 8 10 12 14 16 18 20
Surv
ivin
g Fr
acti
on
Radiation Dose (Gy)
CSC MNNG/Sar MNNG/HOS
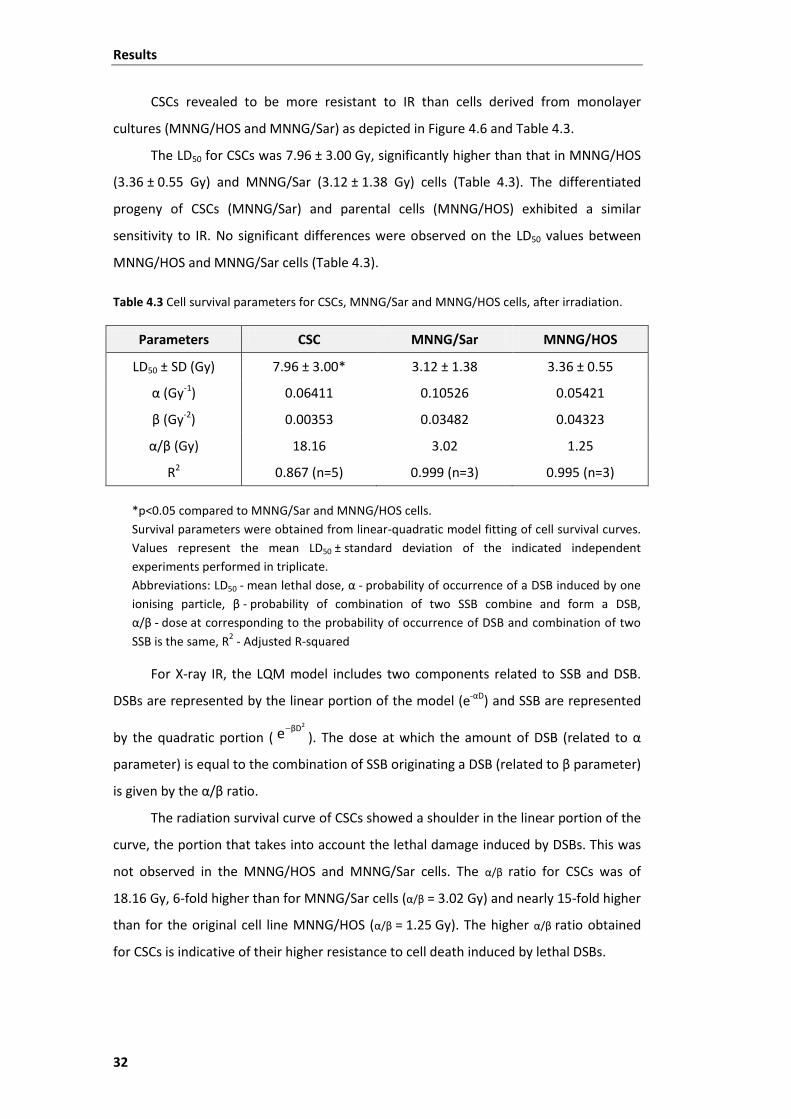
Results
32
CSCs revealed to be more resistant to IR than cells derived from monolayer
cultures (MNNG/HOS and MNNG/Sar) as depicted in Figure 4.6 and Table 4.3.
The LD50 for CSCs was 7.96 ± 3.00 Gy, significantly higher than that in MNNG/HOS
(3.36 ± 0.55 Gy) and MNNG/Sar (3.12 ± 1.38 Gy) cells (Table 4.3). The differentiated
progeny of CSCs (MNNG/Sar) and parental cells (MNNG/HOS) exhibited a similar
sensitivity to IR. No significant differences were observed on the LD50 values between
MNNG/HOS and MNNG/Sar cells (Table 4.3).
Table 4.3 Cell survival parameters for CSCs, MNNG/Sar and MNNG/HOS cells, after irradiation.
Parameters CSC MNNG/Sar MNNG/HOS
LD50 ± SD (Gy) 7.96 ± 3.00* 3.12 ± 1.38 3.36 ± 0.55
α (Gy-1) 0.06411 0.10526 0.05421
β (Gy-2) 0.00353 0.03482 0.04323
α/β (Gy) 18.16 3.02 1.25
R2 0.867 (n=5) 0.999 (n=3) 0.995 (n=3)
*p<0.05 compared to MNNG/Sar and MNNG/HOS cells. Survival parameters were obtained from linear-quadratic model fitting of cell survival curves. Values represent the mean LD50 ± standard deviation of the indicated independent experiments performed in triplicate. Abbreviations: LD50 - mean lethal dose, α - probability of occurrence of a DSB induced by one ionising particle, β - probability of combination of two SSB combine and form a DSB, α/β - dose at corresponding to the probability of occurrence of DSB and combination of two SSB is the same, R2 - Adjusted R-squared
For X-ray IR, the LQM model includes two components related to SSB and DSB.
DSBs are represented by the linear portion of the model (e-αD) and SSB are represented
by the quadratic portion ( ). The dose at which the amount of DSB (related to α
parameter) is equal to the combination of SSB originating a DSB (related to β parameter)
is given by the α/β ratio.
The radiation survival curve of CSCs showed a shoulder in the linear portion of the
curve, the portion that takes into account the lethal damage induced by DSBs. This was
not observed in the MNNG/HOS and MNNG/Sar cells. The α/β ratio for CSCs was of
18.16 Gy, 6-fold higher than for MNNG/Sar cells (α/β = 3.02 Gy) and nearly 15-fold higher
than for the original cell line MNNG/HOS (α/β = 1.25 Gy). The higher α/β ratio obtained
for CSCs is indicative of their higher resistance to cell death induced by lethal DSBs.
2βDe−
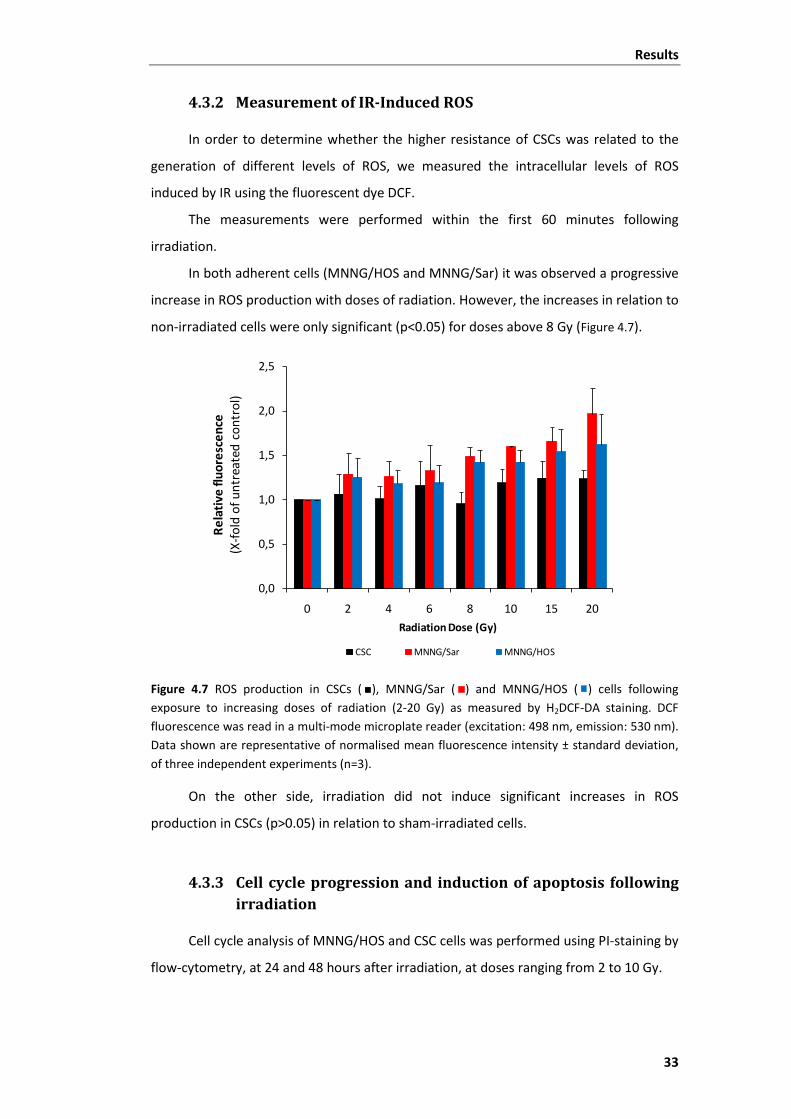
Results
33
4.3.2 Measurement of IR-Induced ROS
In order to determine whether the higher resistance of CSCs was related to the
generation of different levels of ROS, we measured the intracellular levels of ROS
induced by IR using the fluorescent dye DCF.
The measurements were performed within the first 60 minutes following
irradiation.
In both adherent cells (MNNG/HOS and MNNG/Sar) it was observed a progressive
increase in ROS production with doses of radiation. However, the increases in relation to
non-irradiated cells were only significant (p<0.05) for doses above 8 Gy (Figure 4.7).
Figure 4.7 ROS production in CSCs ( ), MNNG/Sar ( ) and MNNG/HOS ( ) cells following exposure to increasing doses of radiation (2-20 Gy) as measured by H2DCF-DA staining. DCF fluorescence was read in a multi-mode microplate reader (excitation: 498 nm, emission: 530 nm). Data shown are representative of normalised mean fluorescence intensity ± standard deviation, of three independent experiments (n=3).
On the other side, irradiation did not induce significant increases in ROS
production in CSCs (p>0.05) in relation to sham-irradiated cells.
4.3.3 Cell cycle progression and induction of apoptosis following irradiation
Cell cycle analysis of MNNG/HOS and CSC cells was performed using PI-staining by
flow-cytometry, at 24 and 48 hours after irradiation, at doses ranging from 2 to 10 Gy.
0,0
0,5
1,0
1,5
2,0
2,5
0 2 4 6 8 10 15 20
Rel
ativ
e flu
ores
cenc
e(X
-fol
d of
unt
reat
ed c
ontr
ol)
Radiation Dose (Gy)
CSC MNNG/Sar MNNG/HOS
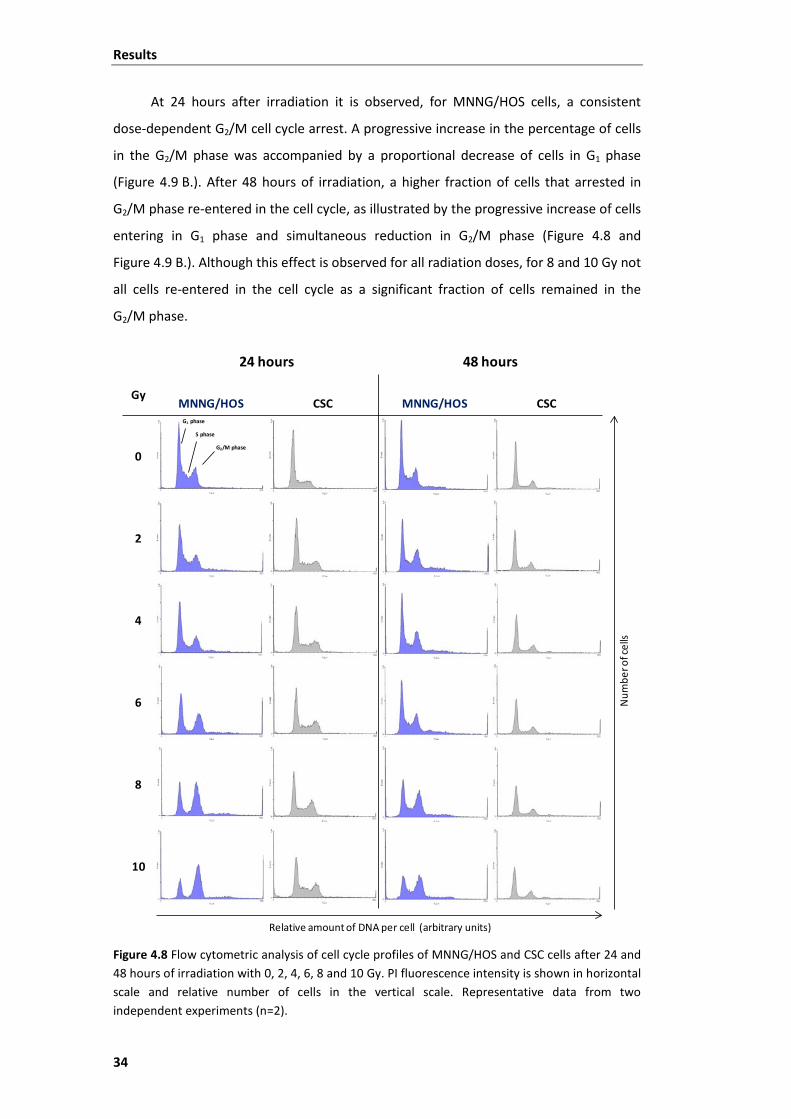
Results
34
At 24 hours after irradiation it is observed, for MNNG/HOS cells, a consistent
dose-dependent G2/M cell cycle arrest. A progressive increase in the percentage of cells
in the G2/M phase was accompanied by a proportional decrease of cells in G1 phase
(Figure 4.9 B.). After 48 hours of irradiation, a higher fraction of cells that arrested in
G2/M phase re-entered in the cell cycle, as illustrated by the progressive increase of cells
entering in G1 phase and simultaneous reduction in G2/M phase (Figure 4.8 and
Figure 4.9 B.). Although this effect is observed for all radiation doses, for 8 and 10 Gy not
all cells re-entered in the cell cycle as a significant fraction of cells remained in the
G2/M phase.
Figure 4.8 Flow cytometric analysis of cell cycle profiles of MNNG/HOS and CSC cells after 24 and 48 hours of irradiation with 0, 2, 4, 6, 8 and 10 Gy. PI fluorescence intensity is shown in horizontal scale and relative number of cells in the vertical scale. Representative data from two independent experiments (n=2).
24 hours 48 hours
GyMNNG/HOS CSC MNNG/HOS CSC
0
2
4
6
8
10
Relative amount of DNA per cell (arbitrary units)
Num
bero
fcel
ls
G1 phase
S phase
G2/M phase
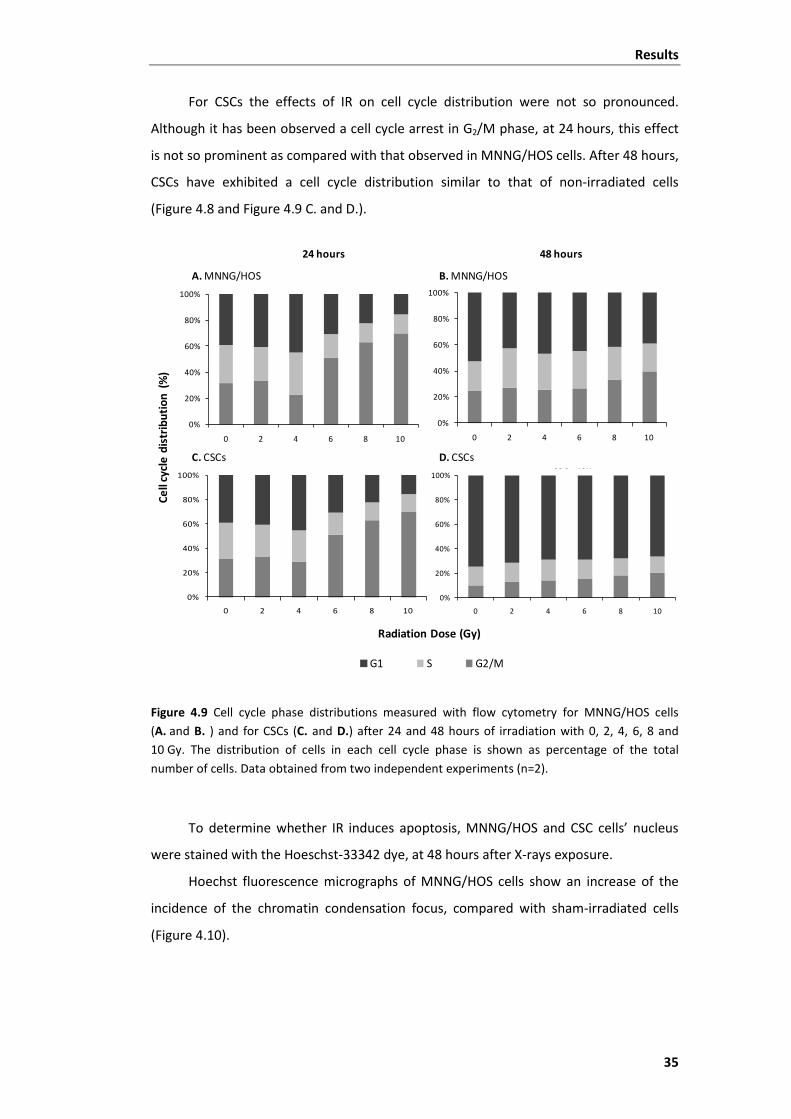
Results
35
For CSCs the effects of IR on cell cycle distribution were not so pronounced.
Although it has been observed a cell cycle arrest in G2/M phase, at 24 hours, this effect
is not so prominent as compared with that observed in MNNG/HOS cells. After 48 hours,
CSCs have exhibited a cell cycle distribution similar to that of non-irradiated cells
(Figure 4.8 and Figure 4.9 C. and D.).
Figure 4.9 Cell cycle phase distributions measured with flow cytometry for MNNG/HOS cells (A. and B. ) and for CSCs (C. and D.) after 24 and 48 hours of irradiation with 0, 2, 4, 6, 8 and 10 Gy. The distribution of cells in each cell cycle phase is shown as percentage of the total number of cells. Data obtained from two independent experiments (n=2).
To determine whether IR induces apoptosis, MNNG/HOS and CSC cells’ nucleus
were stained with the Hoeschst-33342 dye, at 48 hours after X-rays exposure.
Hoechst fluorescence micrographs of MNNG/HOS cells show an increase of the
incidence of the chromatin condensation focus, compared with sham-irradiated cells
(Figure 4.10).
0%
20%
40%
60%
80%
100%
0 2 4 6 8 10
0%
20%
40%
60%
80%
100%
0 2 4 6 8 10
0%
20%
40%
60%
80%
100%
0 2 4 6 8 10
48 hours24 hours
G1 S G2/M
C. CSCs D. CSCs
A. MNNG/HOS B. MNNG/HOS
Radiation Dose (Gy)
0%
20%
40%
60%
80%
100%
0 2 4 6 8 10
CSC 48h
Cell
cycl
edi
stri
buti
on(%
)
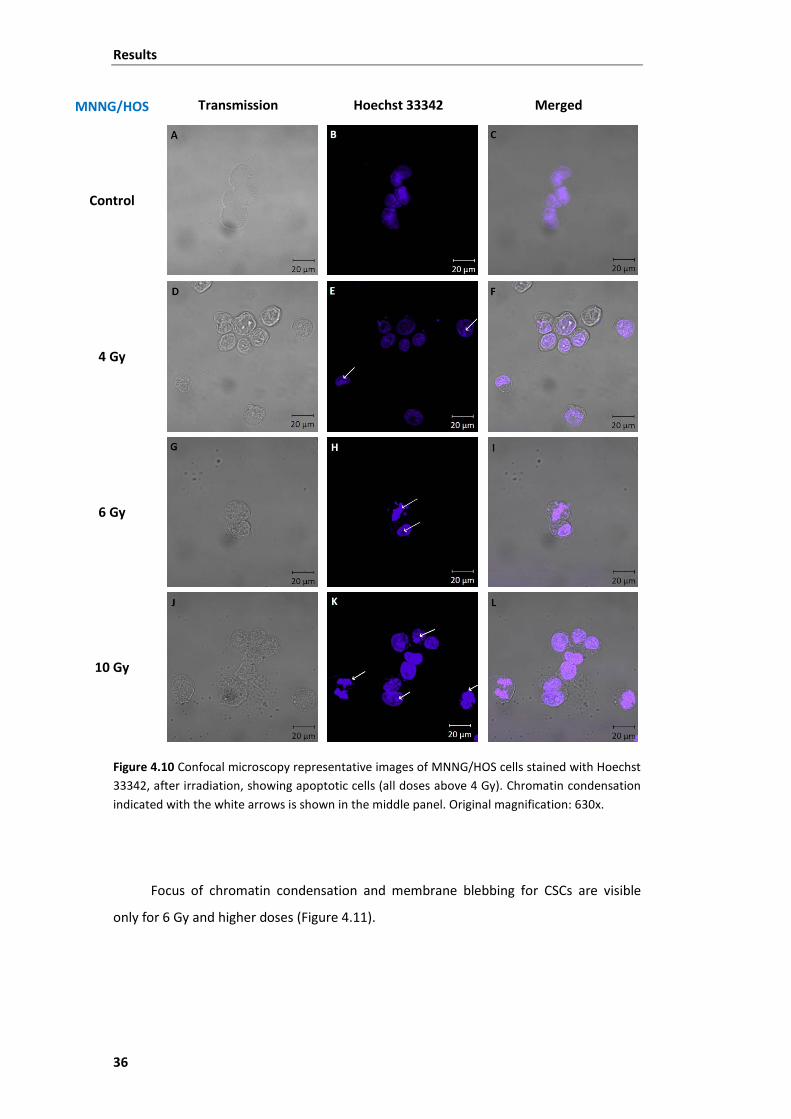
Results
36
MNNG/HOS Transmission Hoechst 33342 Merged
Control
4 Gy
6 Gy
10 Gy
Figure 4.10 Confocal microscopy representative images of MNNG/HOS cells stained with Hoechst 33342, after irradiation, showing apoptotic cells (all doses above 4 Gy). Chromatin condensation indicated with the white arrows is shown in the middle panel. Original magnification: 630x.
Focus of chromatin condensation and membrane blebbing for CSCs are visible
only for 6 Gy and higher doses (Figure 4.11).
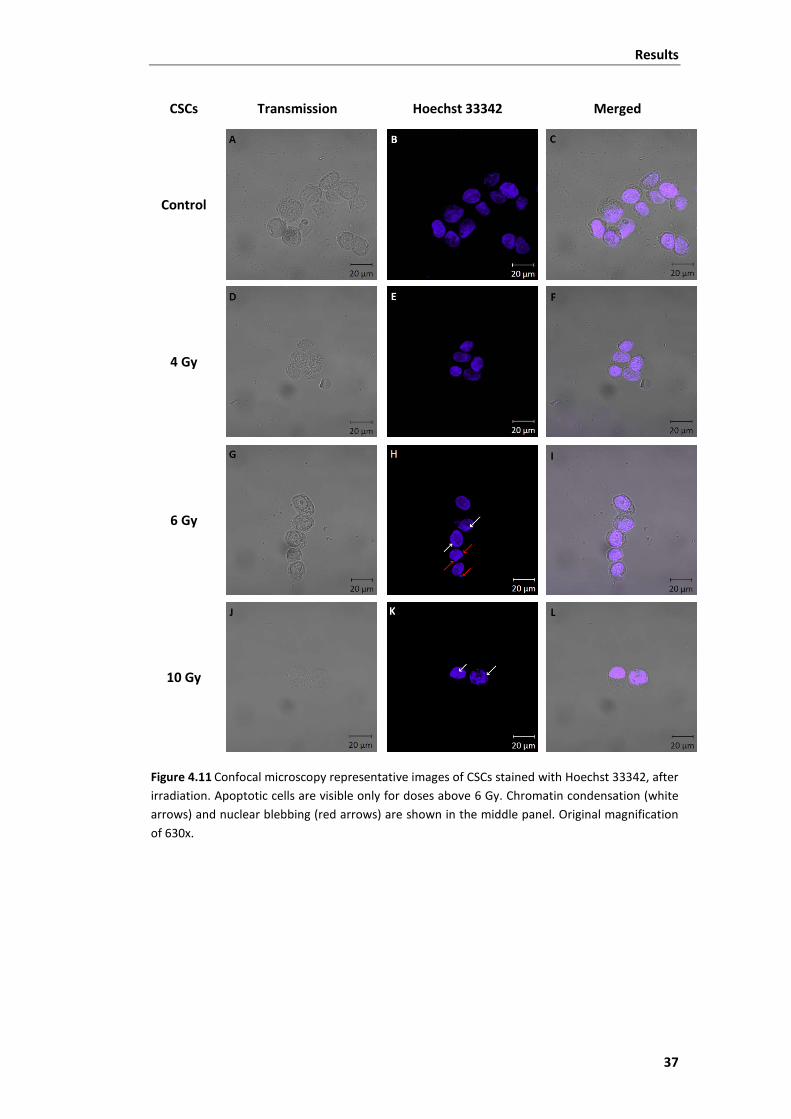
Results
37
CSCs Transmission Hoechst 33342 Merged
Control
4 Gy
6 Gy
10 Gy
Figure 4.11 Confocal microscopy representative images of CSCs stained with Hoechst 33342, after irradiation. Apoptotic cells are visible only for doses above 6 Gy. Chromatin condensation (white arrows) and nuclear blebbing (red arrows) are shown in the middle panel. Original magnification of 630x.

Discussion
39
5 Discussion
This study was designed to isolate and characterise a subpopulation of cancer
cells with stem-like properties in the human osteosarcoma MNNG/HOS cell line and to
evaluate their response to IR.
Using a previously established technique (9) with minor modifications we isolated
and propagated a subpopulation of CSCs within the osteosarcoma cell line.
We used a combination of MSC surface markers for characterisation of the cells
by flow cytometry. Further characteristics of CSCs were assessed testing their capacity
to differentiate in osteoblasts. Additionally, cellular metabolic activity of cells was
examined, based on the uptake of the glucose analogue [18F]FDG as well as changes on
the metabolic profile of CSCs occurring during differentiation in growth medium.
For the evaluation of the cells sensitivity to IR, we performed an irradiation assay
using an X-ray linear accelerator at doses ranging from 2 Gy to 20 Gy. Cellular responses
to radiation were investigated using the MTT cell proliferation assay for cell survival
analysis and by the H2DCFDA staining to measure ROS levels. Moreover, cell cycle
studies were performed by propidium iodide staining and chromatin condensation was
stained with Hoechst 33342 for analysis of apoptotic cell death.
Serum deprivation and anchorage-independent conditions have already
demonstrated to select cells with stem-like properties in the bulk tumour mass, as more
differentiated cells cannot survive under such conditions, entering a state of senescence
(permanent lose of the ability to divide) or dying because of the harsh growth conditions
and nutricional deprivation (68). Therefore, we attempted to apply these conditions to
the MNNG/HOS osteosarcoma cell line. These adherent cells have shown to contain a
small subpopulation of cells with stem-like properties which had the ability to grow in
suspension and to form spheres derived from one single cell that we called cancer stem-
like cells (CSCs). The sphere forming capacity of MNNG/HOS cells was observed
following several passages from non-adherent to adherent conditions, which
demonstrate their self-renew ability. These results are in agreement with those of Gibbs
and colleagues which reported that osteosarcoma and chondrosarcoma primary
cultures had a subset of cells “capable of forming suspended spherical, clonal
colonies” (9).
Discussion
40
Afterwards, we sought to test whether those clonal cells could recapitulate the
morphological appearance of the original adherent cells, in order to evaluate their
capacity of differentiation. Third generation sarcospheres have shown a high plating
efficiency, in standard growth medium supplemented with serum, when removed from
suspension culture and plated in adherent flasks. Cells expanded from the spherical
clones and adhered to the substrate, acquiring a morphological phenotype and
behaviour similar to that of the original adherent cells. Moreover, they reached
confluence at a similar rate as parental cells (MNNG/HOS). These observations
demonstrate the ability of the isolated CSCs to generate differentiated progeny. This
adherent culture derived from the third generation of spheres was maintained in culture
and was referred to MNNG/Sar cells, for comparative studies with the original adherent
cells MNNG/HOS.
The capacity to form spherical clones, self-renew and differentiate, are required
features to identify stem-like cells in a tumour (11). These observations suggest a
situation in which progressively growing and dividing cells, derived from CSCs, undergo
throughout a transition state. Possibly such state is related with asymmetric cell division
of CSCs, originating an identical CSC and a more differentiated progenitor cell. This cell
in subsequent divisions gives rise to cells at diverse status of differentiation (69).
Bearing in mind the fact that osteosarcoma is a tumour derived from multipotent
MSC (70), and due to the lack of a defined set of phenotypic surface markers for CSCs
(6), we attempted to characterize our osteosarcoma stem-like cells using markers of
MSCs. Both adherent and CSC cells have proven to resemble the surface marker profile
of MSC, as measured by flow cytometry. These cells were found to express MSC surface
markers such as CD73, CD90, CD105 and CD13 and lacked the expression of
hematopoietic surface antigens, which is in agreement with the criteria proposed by the
International Society for Cellular Therapy (65). Moreover, the isolated CSCs have also
demonstrated the capacity to differentiate along at least into the osteoblastic lineage,
when cultured in specific osteogenic medium.
CSCs inoculated in athymic mice have formed tumour masses that could be
macroscopically detected after three weeks of subcutaneous injection. These results
demonstrate that CSCs have tumorigenic ability. These observation together with the
stem-like properties described above demonstrate that osteosarcoma MNNG/HOS cell
line contain a subset of cancer cells that have typical properties of stem cells and are
highly tumorigenic, which is in agreement with the CSCs model.
Discussion
41
The metabolic status of CSCs was assessed based on the uptake of [18F]FDG and
compared with that in both adherent MNNG/HOS and MNNG/Sar cells. [18F]FDG is a
fluorinated glucose analogue commonly used in the clinical practice for detecting and
staging malignant tumors in PET imaging studies (71). This radiotracer accumulates
preferentially in cells with high metabolic activity and higher energy requirements as
tumor cells. The biological basis for the increased accumulation of [18F]FDG in tumor
cells in relation to non-malignant tissues is the upregulation of membrane glucose
transporters such as GLUT-1 and GLUT-3 and an increase in rate-limiting enzymes of the
glycolytic pathway including hexokinase (72, 73).
Our results have demonstrated that CSCs are in a quite different metabolic state
compared with both adherent MNNG/HOS and MNNG/Sar cells. In fact, the percentage
of [18F]FGD uptake at 60 minutes in CSCs was about 4-fold lower than that in adherent
cells. This is indicative that CSCs have a slower metabolic rate and lower energy
requirements compared with more differentiated cells. These findings could be related
with the ability of CSCs to enter in a quiescent state without losing their proliferative
potential. This has been referred as an intrinsic defense mechanism of cancer stem cells
they use against chemotherapeutic drugs targeting rapidly dividing cells.
When transferred to standard culture conditions, cells derived from CSCs reached
a metabolic profile similar to that of the original parental cell line (MNNG/HOS) after 19
days. During this period it was observed a progressive increase in [18F]FDG uptake, which
makes an evidence for metabolic dynamic changes occurring during differentiation of
CSCs and that undifferentiated cells as stem like-cells are likely to have low energy
requirements probably due to their quiescence. This can have significant clinical
implications when using PET/FDG imaging studies for monitoring tumor response to
therapy, since survival CSC do not accumulate [18F]FDG and can be maintained for a
defined period before they return to a proliferative state and initiate tumor regrowth.
The results from radiosensitivity assays clearly demonstrated that cells derived
from sarcospheres were more radioresistant than parental MNNG/HOS cells.
The mean lethal doses for CSCs (7.96 ± 3.00 Gy) was about 3-fold higher than that
in parental MNNG/HOS cells (3.12 ± 1.38 Gy) and differentiated progeny MNNG/Sar cells
(3.36 ± 0.55 Gy). Moreover, the α/β ratio for CSCs was equally higher compared to that
of adherent cells, being of 15-fold and 6-fold higher than that of MNNG/HOS and
MNNG/Sar cells, respectively. The shoulder that was observed in the survival curves of
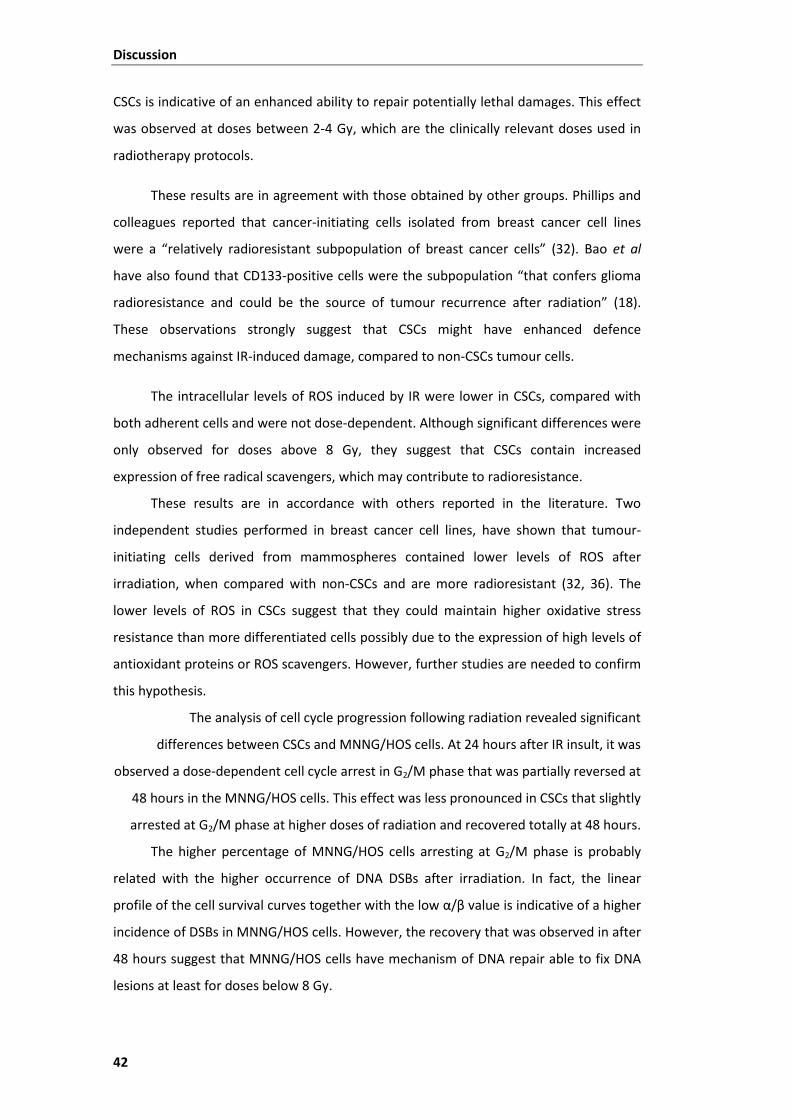
Discussion
42
CSCs is indicative of an enhanced ability to repair potentially lethal damages. This effect
was observed at doses between 2-4 Gy, which are the clinically relevant doses used in
radiotherapy protocols.
These results are in agreement with those obtained by other groups. Phillips and
colleagues reported that cancer-initiating cells isolated from breast cancer cell lines
were a “relatively radioresistant subpopulation of breast cancer cells” (32). Bao et al
have also found that CD133-positive cells were the subpopulation “that confers glioma
radioresistance and could be the source of tumour recurrence after radiation” (18).
These observations strongly suggest that CSCs might have enhanced defence
mechanisms against IR-induced damage, compared to non-CSCs tumour cells.
The intracellular levels of ROS induced by IR were lower in CSCs, compared with
both adherent cells and were not dose-dependent. Although significant differences were
only observed for doses above 8 Gy, they suggest that CSCs contain increased
expression of free radical scavengers, which may contribute to radioresistance.
These results are in accordance with others reported in the literature. Two
independent studies performed in breast cancer cell lines, have shown that tumour-
initiating cells derived from mammospheres contained lower levels of ROS after
irradiation, when compared with non-CSCs and are more radioresistant (32, 36). The
lower levels of ROS in CSCs suggest that they could maintain higher oxidative stress
resistance than more differentiated cells possibly due to the expression of high levels of
antioxidant proteins or ROS scavengers. However, further studies are needed to confirm
this hypothesis.
The analysis of cell cycle progression following radiation revealed significant
differences between CSCs and MNNG/HOS cells. At 24 hours after IR insult, it was
observed a dose-dependent cell cycle arrest in G2/M phase that was partially reversed at
48 hours in the MNNG/HOS cells. This effect was less pronounced in CSCs that slightly
arrested at G2/M phase at higher doses of radiation and recovered totally at 48 hours.
The higher percentage of MNNG/HOS cells arresting at G2/M phase is probably
related with the higher occurrence of DNA DSBs after irradiation. In fact, the linear
profile of the cell survival curves together with the low α/β value is indicative of a higher
incidence of DSBs in MNNG/HOS cells. However, the recovery that was observed in after
48 hours suggest that MNNG/HOS cells have mechanism of DNA repair able to fix DNA
lesions at least for doses below 8 Gy.
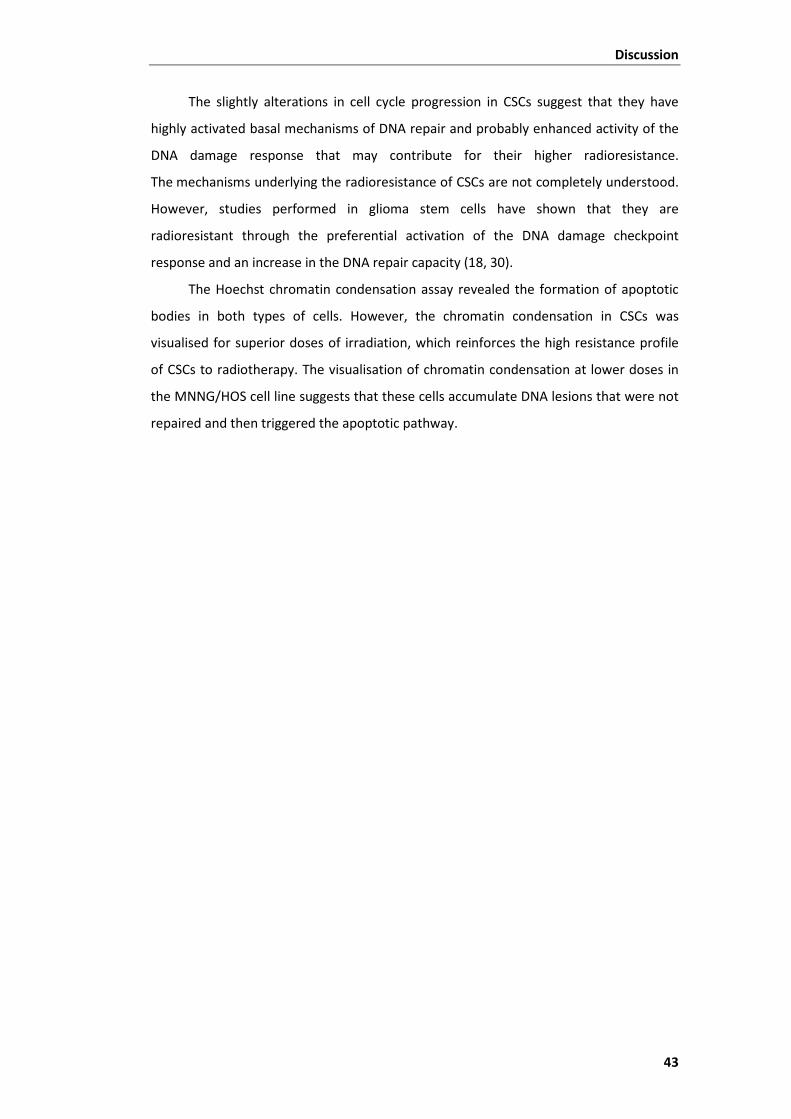
Discussion
43
The slightly alterations in cell cycle progression in CSCs suggest that they have
highly activated basal mechanisms of DNA repair and probably enhanced activity of the
DNA damage response that may contribute for their higher radioresistance.
The mechanisms underlying the radioresistance of CSCs are not completely understood.
However, studies performed in glioma stem cells have shown that they are
radioresistant through the preferential activation of the DNA damage checkpoint
response and an increase in the DNA repair capacity (18, 30).
The Hoechst chromatin condensation assay revealed the formation of apoptotic
bodies in both types of cells. However, the chromatin condensation in CSCs was
visualised for superior doses of irradiation, which reinforces the high resistance profile
of CSCs to radiotherapy. The visualisation of chromatin condensation at lower doses in
the MNNG/HOS cell line suggests that these cells accumulate DNA lesions that were not
repaired and then triggered the apoptotic pathway.

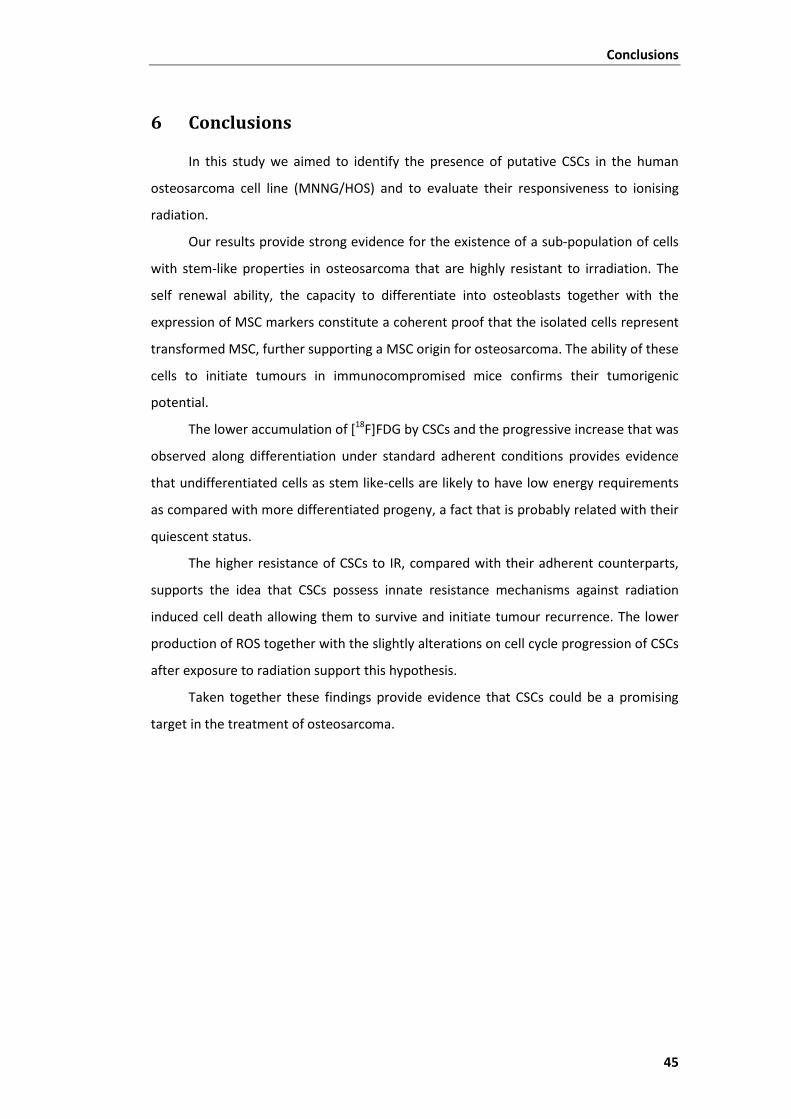
Conclusions
45
6 Conclusions
In this study we aimed to identify the presence of putative CSCs in the human
osteosarcoma cell line (MNNG/HOS) and to evaluate their responsiveness to ionising
radiation.
Our results provide strong evidence for the existence of a sub-population of cells
with stem-like properties in osteosarcoma that are highly resistant to irradiation. The
self renewal ability, the capacity to differentiate into osteoblasts together with the
expression of MSC markers constitute a coherent proof that the isolated cells represent
transformed MSC, further supporting a MSC origin for osteosarcoma. The ability of these
cells to initiate tumours in immunocompromised mice confirms their tumorigenic
potential.
The lower accumulation of [18F]FDG by CSCs and the progressive increase that was
observed along differentiation under standard adherent conditions provides evidence
that undifferentiated cells as stem like-cells are likely to have low energy requirements
as compared with more differentiated progeny, a fact that is probably related with their
quiescent status.
The higher resistance of CSCs to IR, compared with their adherent counterparts,
supports the idea that CSCs possess innate resistance mechanisms against radiation
induced cell death allowing them to survive and initiate tumour recurrence. The lower
production of ROS together with the slightly alterations on cell cycle progression of CSCs
after exposure to radiation support this hypothesis.
Taken together these findings provide evidence that CSCs could be a promising
target in the treatment of osteosarcoma.

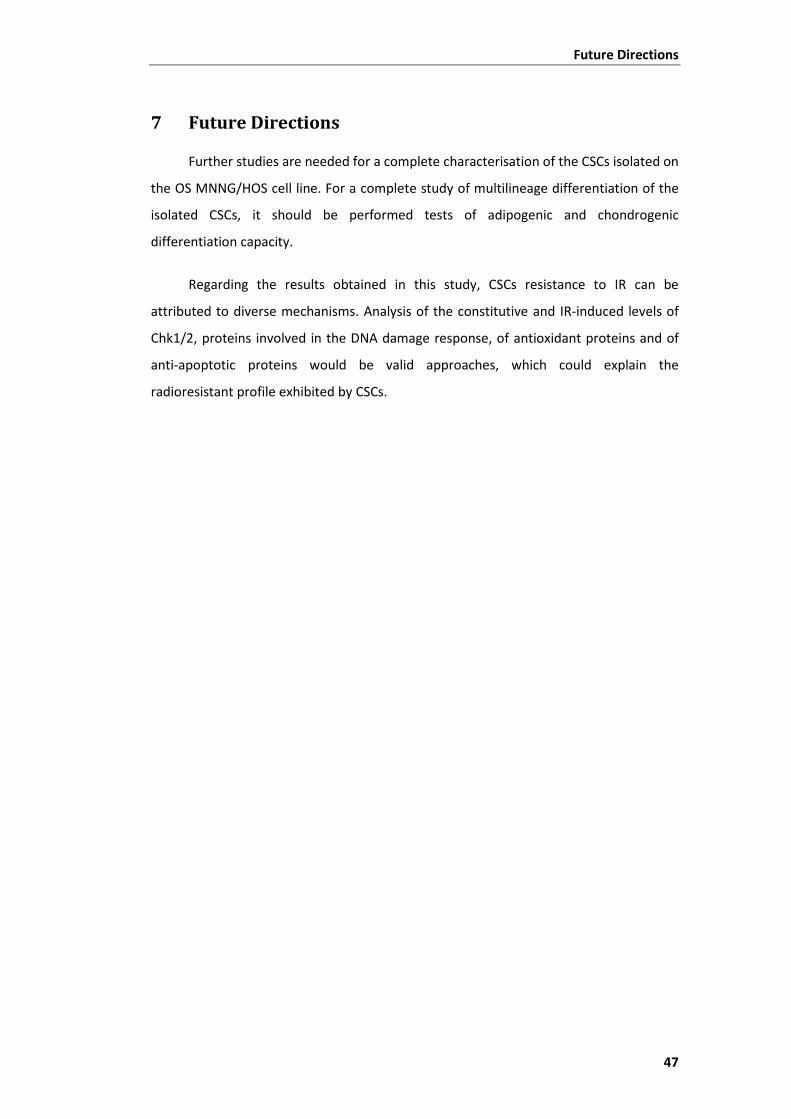
Future Directions
47
7 Future Directions
Further studies are needed for a complete characterisation of the CSCs isolated on
the OS MNNG/HOS cell line. For a complete study of multilineage differentiation of the
isolated CSCs, it should be performed tests of adipogenic and chondrogenic
differentiation capacity.
Regarding the results obtained in this study, CSCs resistance to IR can be
attributed to diverse mechanisms. Analysis of the constitutive and IR-induced levels of
Chk1/2, proteins involved in the DNA damage response, of antioxidant proteins and of
anti-apoptotic proteins would be valid approaches, which could explain the
radioresistant profile exhibited by CSCs.

References
49
8 References
(1) Ward RJ, Dirks PB. Cancer stem cells: at the headwaters of tumor development. Annu Rev Pathol 2007;2:175-89.
(2) Lapidot T, Sirard C, Vormoor J, Murdoch B, Hoang T, Caceres-Cortes J, et al. A cell initiating human acute myeloid leukaemia after transplantation into SCID mice. Nature 1994;367:645-8.
(3) Bonnet D, Dick JE. Human acute myeloid leukemia is organized as a hierarchy that originates from a primitive hematopoietic cell. Nat Med 1997;3:730-7.
(4) O'Brien CA, Kreso A, Dick JE. Cancer stem cells in solid tumors: an overview. Semin Radiat Oncol 2009;19:71-7.
(5) Visvader JE, Lindeman GJ. Cancer stem cells in solid tumours: accumulating evidence and unresolved questions. Nat Rev Cancer 2008;8:755-68.
(6) Woodward WA, Sulman EP. Cancer stem cells: markers or biomarkers? Cancer Metastasis Rev 2008;27:459-70.
(7) Singh SK, Clarke ID, Terasaki M, Bonn VE, Hawkins C, Squire J, et al. Identification of a Cancer Stem Cell in Human Brain Tumors. Cancer Research 2003;63:5821-8.
(8) Al-Hajj M, Wicha MS, Benito-Hernandez A, Morrison SJ, Clarke MF. Prospective identification of tumorigenic breast cancer cells. Proceedings of the National Academy of Sciences of the United States of America 2003;100:3983-8.
(9) Gibbs CP, Kukekov VG, Reith JD, Tchigrinova O, Suslov ON, Scott EW, et al. Stem-like cells in bone sarcomas: implications for tumorigenesis. Neoplasia 2005;7:967-76.
(10) Tirino V, Desiderio V, d'Aquino R, De FF, Pirozzi G, Graziano A, et al. Detection and characterization of CD133+ cancer stem cells in human solid tumours. PLoS One 2008;3:e3469.
(11) Clarke MF, Dick JE, Dirks PB, Eaves CJ, Jamieson CH, Jones DL, et al. Cancer stem cells--perspectives on current status and future directions: AACR Workshop on cancer stem cells. Cancer Res 2006;66:9339-44.
(12) Al-Hajj M, Clarke MF. Self-renewal and solid tumor stem cells. Oncogene 2004;23:7274-82.
(13) Rebecca G.Bagley, Beverly A.Teicher. Cancer Drug Discovery and Development: Stem Cells and Cancer. 2009.
(14) Fabian A, Barok M, Vereb G, Szollosi J. Die hard: are cancer stem cells the Bruce Willises of tumor biology? Cytometry A 2009;75:67-74.
References
50
(15) Singh SK, Hawkins C, Clarke ID, Squire JA, Bayani J, Hide T, et al. Identification of human brain tumour initiating cells. Nature 2004;432:396-401.
(16) Reya T, Morrison SJ, Clarke MF, Weissman IL. Stem cells, cancer, and cancer stem cells. Nature 2001;414:105-11.
(17) Baumann M, Krause M, Thames H, Trott K, Zips D. Cancer stem cells and radiotherapy. Int J Radiat Biol 2009;85:391-402.
(18) Bao S, Wu Q, McLendon RE, Hao Y, Shi Q, Hjelmeland AB, et al. Glioma stem cells promote radioresistance by preferential activation of the DNA damage response. Nature 2006;444:756-60.
(19) Diehn M, Cho RW, Clarke MF. Therapeutic implications of the cancer stem cell hypothesis. Semin Radiat Oncol 2009;19:78-86.
(20) Quintana E, Shackleton M, Sabel MS, Fullen DR, Johnson TM, Morrison SJ. Efficient tumour formation by single human melanoma cells. Nature 2008;456:593-8.
(21) Holyoake T, Jiang X, Eaves C, Eaves A. Isolation of a Highly Quiescent Subpopulation of Primitive Leukemic Cells in Chronic Myeloid Leukemia. Blood 1999;94:2056-64.
(22) Guan Y, Gerhard B, Hogge DE. Detection, isolation, and stimulation of quiescent primitive leukemic progenitor cells from patients with acute myeloid leukemia (AML). Blood 2003;101:3142-9.
(23) Ishikawa F, Yoshida S, Saito Y, Hijikata A, Kitamura H, Tanaka S, et al. Chemotherapy-resistant human AML stem cells home to and engraft within the bone-marrow endosteal region. Nat Biotech 2007;25:1315-21.
(24) Dean M, Fojo T, Bates S. Tumour stem cells and drug resistance. Nat Rev Cancer 2005;5:275-84.
(25) Hirschmann-Jax C, Foster AE, Wulf GG, Nuchtern JG, Jax TW, Gobel U, et al. A distinct "side population" of cells with high drug efflux capacity in human tumor cells. Proceedings of the National Academy of Sciences of the United States of America 2004;101:14228-33.
(26) Chappell J, Dalton S. Altered cell cycle regulation helps stem-like carcinoma cells resist apoptosis. BMC Biology 2010;8:63.
(27) Pawlik TM, Keyomarsi K. Role of cell cycle in mediating sensitivity to radiotherapy. Int J Radiat Oncol Biol Phys 2004;59:928-42.
(28) Pajonk F, Vlashi E, McBride WH. Radiation resistance of cancer stem cells: the 4 R's of radiobiology revisited. Stem Cells 2010;28:639-48.
(29) Chiou SH, Kao CL, Chen YW, Chien CS, Hung SC, Lo JF, et al. Identification of CD133-Positive Radioresistant Cells in Atypical Teratoid/ Rhabdoid Tumor. PLoS ONE 2008;3:e2090.
References
51
(30) Ropolo M, Daga A, Griffero F, Foresta M, Casartelli G, Zunino A, et al. Comparative Analysis of DNA Repair in Stem and Nonstem Glioma Cell Cultures. Molecular Cancer Research 2009;7:383-92.
(31) Liu G, Yuan X, Zeng Z, Tunici P, Ng H, Abdulkadir I, et al. Analysis of gene expression and chemoresistance of CD133+ cancer stem cells in glioblastoma. Molecular Cancer 2006;5:67.
(32) Phillips TM, McBride WH, Pajonk F. The response of CD24(-/low)/CD44+ breast cancer-initiating cells to radiation. J Natl Cancer Inst 2006;98:1777-85.
(33) Guido Frosina. The Bright and the Dark Sides of DNA Repair in Stem Cells. Journal of Biomedicine and Biotechnology 2010;vol. 2010.
(34) Guzman ML, Neering SJ, Upchurch D, Grimes B, Howard DS, Rizzieri DA, et al. Nuclear factor-{kappa}B is constitutively activated in primitive human acute myelogenous leukemia cells. Blood 2001;98:2301-7.
(35) Guzman ML, Swiderski CF, Howard DS, Grimes BA, Rossi RM, Szilvassy SJ, et al. Preferential induction of apoptosis for primary human leukemic stem cells. Proceedings of the National Academy of Sciences of the United States of America 2002;99:16220-5.
(36) Diehn M, Cho RW, Lobo NA, Kalisky T, Dorie MJ, Kulp AN, et al. Association of reactive oxygen species levels and radioresistance in cancer stem cells. Nature 2009;458:780-3.
(37) Krane KS. Introductory Nuclear Physics. Oregon State Univ.; 1987.
(38) Stabin MG. Radiation Protection and Dosimetry: An Introduction to Health Physics. Springer New York; 2007.
(39) Knowles M, Shelby P. Introduction to the Cellular and Molecular Biology of Cancer. Fourth ed. Oxford University Press; 2005.
(40) Abraham RT. Cell cycle checkpoint signaling through the ATM and ATR kinases. Genes & Development 2001;15:2177-96.
(41) Li L, Story M, Legerski RJ. Cellular responses to ionizing radiation damage. Int J Radiat Oncol Biol Phys 2001;49:1157-62.
(42) Bruce Alberts, Alexander Johnson, Julian Lewis, Martin Raff, Keith Roberts, Peter Walter. Molecular biology of the cell. 5th ed. Garland science, Taylor & Francis Group, LLC; 2008.
(43) Harvey F.Lodish, Arnold Berk, Paul Matsudaira, Chris A.Kaiser, Monty Krieger, Matthew P.Scott, et al. Molecular Cell Biology. W.H.Freeman & Co Ltd; 2004.
(44) Peng CY, Graves PR, Thoma RS, Wu Z, Shaw AS, Piwnica-Worms H. Mitotic and G2 Checkpoint Control: Regulation of 14-3-3?Protein Binding by Phosphorylation of Cdc25C on Serine-216. Science 1997;277:1501-5.
References
52
(45) Albert Van der Kogel, Michael Jioner. Basic Clinical Radiobiology. Fourth ed. Oxford University Press; 2009.
(46) Jorgensen TJ. Enhancing radiosensitivity: targeting the DNA repair pathways. Cancer Biol Ther 2009;8:665-70.
(47) Rich JN. Cancer stem cells in radiation resistance. Cancer Res 2007;67:8980-4.
(48) Richard A.Lockshin, Zahra Zakeri. When cells die II : a comprehensive evaluation of apoptosis and programmed cell death. John Wiley & Sons, Inc.; 2004.
(49) Ghobrial IM, Witzig TE, Adjei AA. Targeting apoptosis pathways in cancer therapy. CA Cancer J Clin 2005;55:178-94.
(50) Paglin S, Hollister T, Delohery T, Hackett N, McMahill M, Sphicas E, et al. A Novel Response of Cancer Cells to Radiation Involves Autophagy and Formation of Acidic Vesicles. Cancer Research 2001;61:439-44.
(51) Lomonaco S, Finniss S, Xiang C, others. The induction of autophagy by gamma-radiation contributes to the radioresistance of glioma stem cells. Int. J. Cancer; 2009.
(52) Codogno P, Meijer AJ. Autophagy and signaling: their role in cell survival and cell death. Cell Death Differ 0 AD;12:1509-18.
(53) Jordan CT, Guzman ML, Noble M. Cancer stem cells. N Engl J Med 2006;355:1253-61.
(54) Ta HT, Dass CR, Choong PF, Dunstan DE. Osteosarcoma treatment: state of the art. Cancer Metastasis Rev 2009;28:247-63.
(55) http://seer.cancer.gov/publications/childhood/bone.pdf. 2008. 8-7-2010.
(56) Jaffe N, Bruland OS, Bielack S. Pediatric and Adolescent Osteosarcoma. First ed. Springer US; 2010.
(57) Tang N, Song WX, Luo J, Haydon RC, He TC. Osteosarcoma development and stem cell differentiation. Clin Orthop Relat Res 2008;466:2114-30.
(58) Chan KW, Raney JrRB. Pediatric Oncology. Vol. 4. 2005. Springer US.
(59) Alessandra L, Costantino E, Massimiliano DP, Mario M, Gaetano B. Primary bone osteosarcoma in the pediatric age: State of the art. Cancer treatment reviews 32[6], 423-436. 1-10-2006.
(60) Ferrari S, Palmerini E. Adjuvant and neoadjuvant combination chemotherapy for osteogenic sarcoma. Current Opinion in Oncology 2007;19.
(61) Carrle D, Bielack S. Current strategies of chemotherapy in osteosarcoma. International Orthopaedics 2006;30:445-51.
References
53
(62) Mintz MB, Sowers R, Brown KM, Hilmer SC, Mazza B, Huvos AG, et al. An Expression Signature Classifies Chemotherapy-Resistant Pediatric Osteosarcoma. Cancer Research 2005;65:1748-54.
(63) Delaney TF, Trofimov AV, Engelsman M, Suit HD. Advanced-technology radiation therapy in the management of bone and soft tissue sarcomas. Cancer Control 2005;12:27-35.
(64) Thomas FD, Lily P, Saveli IG, Eugen BH, Norbert JL, John E.Munzenrider, et al. Radiotherapy for local control of osteosarcoma. International journal of radiation oncology, biology, physics 61[2], 492-498. 1-2-2005.
(65) Dominici M, Le BK, Mueller I, Slaper-Cortenbach I, Marini F, Krause D, et al. Minimal criteria for defining multipotent mesenchymal stromal cells. The International Society for Cellular Therapy position statement. Cytotherapy 2006;8:315-7.
(66) Banasiak D, Barnetson AR, Odell RA, Mameghan H, Russell PJ. Comparison between the clonogenic, MTT, and SRB assays for determining radiosensitivity in a panel of human bladder cancer cell lines and a ureteral cell line. Radiat Oncol Investig 1999;7:77-85.
(67) Armstrong D. Advanced Protocols in Oxidative Stress II. First ed. Humana Press; 2010.
(68) Reynolds BA, Rietze RL. Neural stem cells and neurospheres - re-evaluating the relationship. Nat Meth 2005;2:333-6.
(69) Vermeulen L, Sprick MR, Kemper K, Stassi G, Medema JP. Cancer stem cells - old concepts, new insights. Cell Death Differ 2008;15:947-58.
(70) Mohseny A, Szuhai K, Romeo S, et al. Osteosarcoma originates from mesenchymal stem cells in consequence of aneuploidization and genomic loss of Cdkn2. The Journal of Pathology 2010;219:294-305.
(71) Vallabhajosula S. (18)F-labeled positron emission tomographic radiopharmaceuticals in oncology: an overview of radiochemistry and mechanisms of tumor localization. Semin Nucl Med 2007;37:400-19.
(72) Macheda ML, Rogers S, Best JD. Molecular and cellular regulation of glucose transporter (GLUT) proteins in cancer. Journal of Celullar Physiology 2004;202:654-62.
(73) Higashi K, Clavo AC, Wahl RL. Does FDG Uptake Measure Proliferative Activity of Human Cancer Cells? In Vitro Comparison with DNA Flow Cytometry and Tritiated Thymidine Uptake. J Nucl Med 1993;34:414-9.


