Embed Size (px)
Citation preview
ARTICLE IN PRESS
Real-Time Imaging 10 (2004) 251–262
1077-2014/$ - se
doi:10.1016/j.rt
�CorrespondE-mail addr
www.elsevier.com/locate/rti
Identification of tuberculosis bacteria based on shape and color
Manuel G. Foreroa, Filip Sroubekb, Gabriel Cristobala,�
aInstituto de Optica (CSIC), Serrano 121 28006, Madrid, SpainbInstitute of Information Theory and Automation, Academy of Sciences of the Czech Republic, Prague, Czech Republic
Available online 8 August 2004
Abstract
Tuberculosis and other mycobacteriosis are serious illnesses which control is based on early diagnosis. A technique commonly
used consists of analyzing sputum images for detecting bacilli. However, the analysis of sputum is time consuming and requires
highly trained personnel to avoid high errors. Image-processing techniques provide a good tool for improving the manual screening
of samples. In this paper, a new autofocus algorithm and a new bacilli detection technique is presented with the aim to attain a high
specificity rate and reduce the time consumed to analyze such sputum samples. This technique is based on the combined use of some
invariant shape features together with a simple thresholding operation on the chromatic channels. Some feature descriptors have
been extracted from bacilli shape using an edited dataset of samples. A k-means clustering technique was applied for classification
purposes and the sensitivity vs specificity results were evaluated using a standard ROC analysis procedure.
r 2004 Elsevier Ltd. All rights reserved.
Keywords: Tuberculosis; Fluorescence microscopy; Clustering; Feature extraction; k-means; Color; Autofocus
1. Introduction
Mycobacterium tuberculosis bacilli (TB) are the originof the pulmonary tuberculosis disease, although theseorganisms can infect other organs or tissues such asbrain, kidneys, bone and skin. Tuberculosis is the maincause of death produced by an infectious illness.According to the World Health Organization a thirdpart of the worldwide population (1722 million people)are carriers of these bacteria, originating 10 million casesof active tuberculosis worldwide and approximately 3million of deaths annually [1]. Some studies conductedin Spain shown that cigarette smoking is a risk forpulmonary TB in young people [2]. An epidemiologystudy of the tuberculosis in the USA presents aMarkovian model nature showing an increase in theensuing decade and a decline again [3]. Some of thereasons for the increasing incidence of this disease aredue to the HIV infection (in fact tuberculosis is one of
e front matter r 2004 Elsevier Ltd. All rights reserved.
i.2004.05.007
ing author.
ess: [email protected] (G. Cristobal).
the main causes of death in HIV-infected people) andmultidrug resistance.Identification of tubercle bacilli are routinely done in
sputum smears using a fluorescence microscope dyedwith fluoroscope auramine. The non-invasive character-istics of the sputum procedure is important becauserepeated examinations are needed for an early detectionof the disease [4]. These techniques lack of sensitivityand consequently clinicians must wait culture results asmuch as 2 months because these bacilli takes 5–20 h toduplicate themselves. Manual screening for the bacillusidentification involves a labor-intensive task with a highfalse negative rate [5]. Automatic screening will entailseveral advantages, like a substantial reduction in thelabor workload of clinicians, improving the sensitivity ofthe test and a better accuracy in diagnosis by increasingthe number of images that can be analyzed by thecomputer. However, bacteria segmentation of particularspecies entails a complex process. Bacilli shape is not aenough cue to be used as a discriminant feature, becauseother bacteria species and particles share the samemorphology. Therefore besides bacilli shape it is also
ARTICLE IN PRESSM.G. Forero et al. / Real-Time Imaging 10 (2004) 251–262252
necessary to consider bacilli color to improve thediscrimination accuracy.Several works have been addressed the segmentation
of bacteria particles. Veropoulos et al. [5,6] used anidentification method based on shape descriptors andneural network classifiers. Wilkinson [7] proposed arapid multiresolution segmentation technique based oncomputing thresholds for different areas in a mono-chromatic image. Other authors use color informationas the key discriminant factor for bacteria segmentationand identification [8,9]. A survey of various measure-ment features for extracting shape and size of micro-organisms containing a few morphotypes from digitalimages can be found in [10].As a follow-up of previous works [11–13], in this
paper a new technique for bacilli segmentation andidentification is described. As it was mentioned above,the segmentation method is based on the use of thecolor information and the identification techniquerequires several feature descriptors that have beencalibrated using the heuristic knowledge about themost frequent bacilli shapes found in the acquiredimages.
2. Material and methods
Staining procedures were performed with bothrespiratory and non-respiratory clinical specimens ex-cept for urine and blood ones. These specimens werestained with the fluorochrome auramine O and imageswere captured using a fluorescence microscope atmedium magnification ð�250Þ. Veropoulos [5] hasreported an identification method based on observingimages firstly at low magnification ð�100Þ and highmagnification ð�400Þ and the image capture was madeat �630. Note that all the procedures described in thispaper were accomplished only using the above-men-tioned medium magnification ð�250Þ.Fluorochromes are dyes that make non-fluorescent
organisms fluoresce. Because acid-fast artifacts may bepresent in a smear, it is necessary to review the cellmorphology carefully. The confirmation of positivefluorochrome smears was made with the growth of M.
tuberculosis bacilli from the culture of specimens inliquid and solid media. Sample slides were analyzed witha Leica Leitz photomicroscope illuminated with afluorescence illumination system. For image acquisitiona Spot Insight digital camera from Diagnostic Instru-ments, Inc. was used. The exposure time used was 0.9 s/image. A set of 397 negative images from 31 subjects and75 positive images from 4 patients were acquired. Todevelop the identification process, 110 bacilli extractedfrom 15 positive images were analyzed and the other 60positive images were employed to validate the proposedtechnique. From 8 to 100RGB color images of 1600�
1200 pixels were acquired from each microscopic field.Bacilli only occupied a very small fraction of the totalimage area. Considering the 110 bacilli extracted, themean area ratio of a single bacillus to the full image sizerepresents only a 6:7� 10�5 factor. In addition, thebackground can be very complex due to a lot of debristhat are contained at the sputum sample what indicatesthat automated identification of such organisms will bea challenging task.
2.1. Autofocus algorithms for tuberculosis images
The automation of fluorescence-stained mycobacteriafirst require a reliable, accurate and fast autofocusmeasure. Many autofocus algorithms have been pro-posed in the literature. Santos et al. [14] evaluated andcompared an extensive number of autofocusing methodsin cytogenetic studies. For such kind of images theyconcluded that functions based on correlation measuresprovides the best performance. For fluorescence-stainedmycobacteria, we performed a preliminary study on astack of 25 images. The images 1–25 where acquiredfrom one sputum sample but each one with a differentfocal length. The sample was in focus at image 16 andthe sharpness decreases towards images 1 and 25. Onlythe green channel was considered in the calculation offocus measures since it is more discriminant for this typeof images. Four standard and one novel focus measurewere tested in this study. The most simple focus measureis the gray level variance given by
Mvar ¼X
i;j
ðgði; jÞ � �gÞ2; ð1Þ
where g is the image gray level function and �g denotesthe mean gray value of g. The second one is the energyof image Laplacian
ML ¼X
i;j
ðgði � 1; jÞ þ gði þ 1; jÞ þ gði; j � 1Þ
þ gði; j þ 1Þ � 4gði; jÞÞ2; (2)
which is, according to Subbarao [15], more robust tonoise than image variance or gradient energy. The thirdone is a wavelet-based measure ðMwbÞ, proposed in [16],which calculates energy in low- and high-pass bands.The fourth focus measure is based on an autocorrelationfunction [17] defined as
Mcor ¼X
i;j
gði; jÞgði þ 1; jÞ �X
i;j
gði; jÞgði þ 2; jÞ: ð3Þ
None of the above measures produced meaningfulresults for our data when applied to the whole images;see Fig. 3a. The important contribution of tiny bacteriato the focus measure is negligible compared to thecontribution of the noisy background. When only asmall rectangular neighborhood ð256� 256Þ containinga bacterium was considered, Mwb and Mcor were able to
ARTICLE IN PRESSM.G. Forero et al. / Real-Time Imaging 10 (2004) 251–262 253
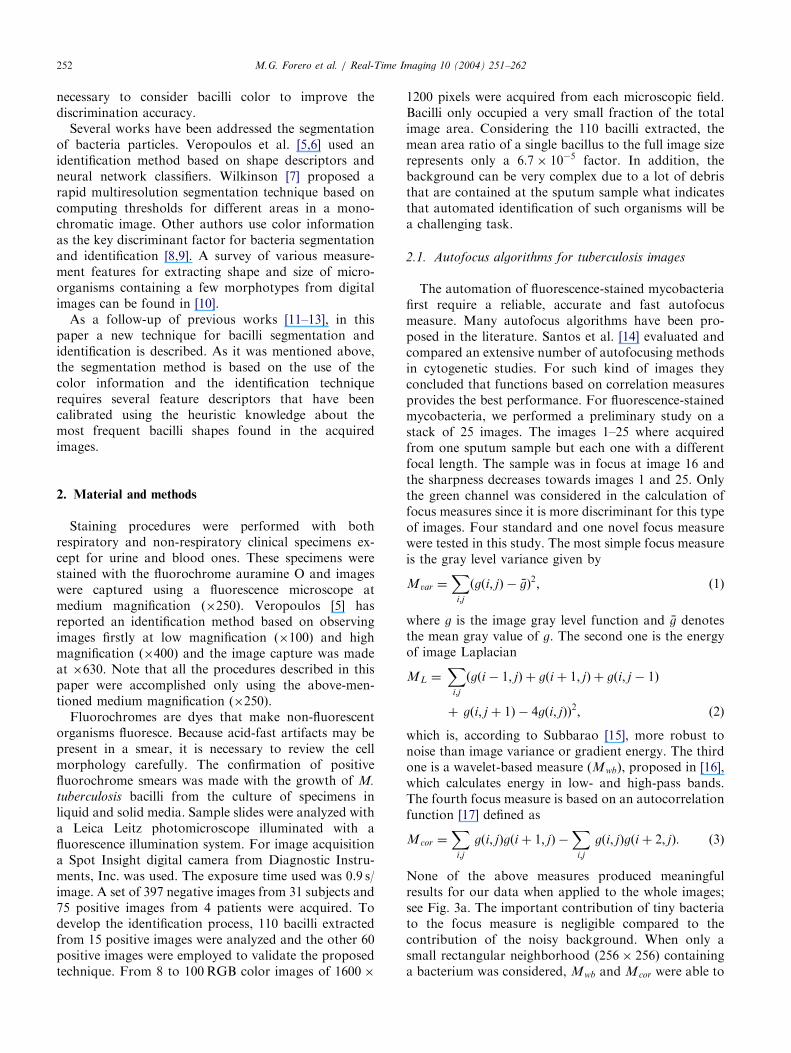
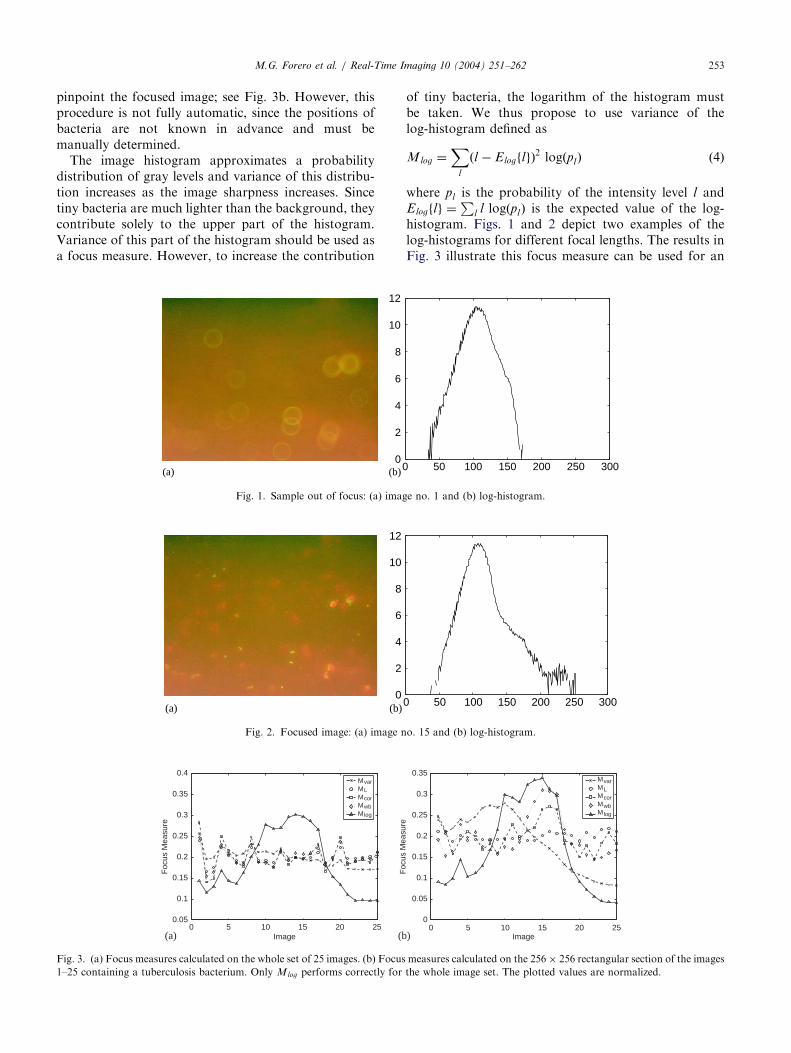
pinpoint the focused image; see Fig. 3b. However, thisprocedure is not fully automatic, since the positions ofbacteria are not known in advance and must bemanually determined.The image histogram approximates a probability
distribution of gray levels and variance of this distribu-tion increases as the image sharpness increases. Sincetiny bacteria are much lighter than the background, theycontribute solely to the upper part of the histogram.Variance of this part of the histogram should be used asa focus measure. However, to increase the contribution
00
2
4
6
8
10
12
(b)(a)
Fig. 1. Sample out of focus: (a) imag
0
2
4
6
8
10
12
(b)(a)
Fig. 2. Focused image: (a) image n
0 5 10 15 20 250.05
0.1
0.15
0.2
0.25
0.3
0.35
0.4
Image
Foc
us M
easu
re
MvarMLMcorMwbMlog
(a) (b
Fig. 3. (a) Focus measures calculated on the whole set of 25 images. (b) Focus
1–25 containing a tuberculosis bacterium. Only Mlog performs correctly for
of tiny bacteria, the logarithm of the histogram mustbe taken. We thus propose to use variance of thelog-histogram defined as
Mlog ¼X
l
ðl � ElogflgÞ2 logðplÞ ð4Þ
where pl is the probability of the intensity level l andElogflg ¼
Pl l logðplÞ is the expected value of the log-
histogram. Figs. 1 and 2 depict two examples of thelog-histograms for different focal lengths. The results inFig. 3 illustrate this focus measure can be used for an
50 100 150 200 250 300
e no. 1 and (b) log-histogram.
0 50 100 150 200 250 300
o. 15 and (b) log-histogram.
0 5 10 15 20 250
0.05
0.1
0.15
0.2
0.25
0.3
0.35
Image
Foc
us M
easu
re
MvarMLMcorMwbMlog
)
measures calculated on the 256� 256 rectangular section of the images
the whole image set. The plotted values are normalized.
ARTICLE IN PRESSM.G. Forero et al. / Real-Time Imaging 10 (2004) 251–262254
automatic evaluation of focus, since it reaches a globalmaximum for images in focus.
2.2. Automatic identification method
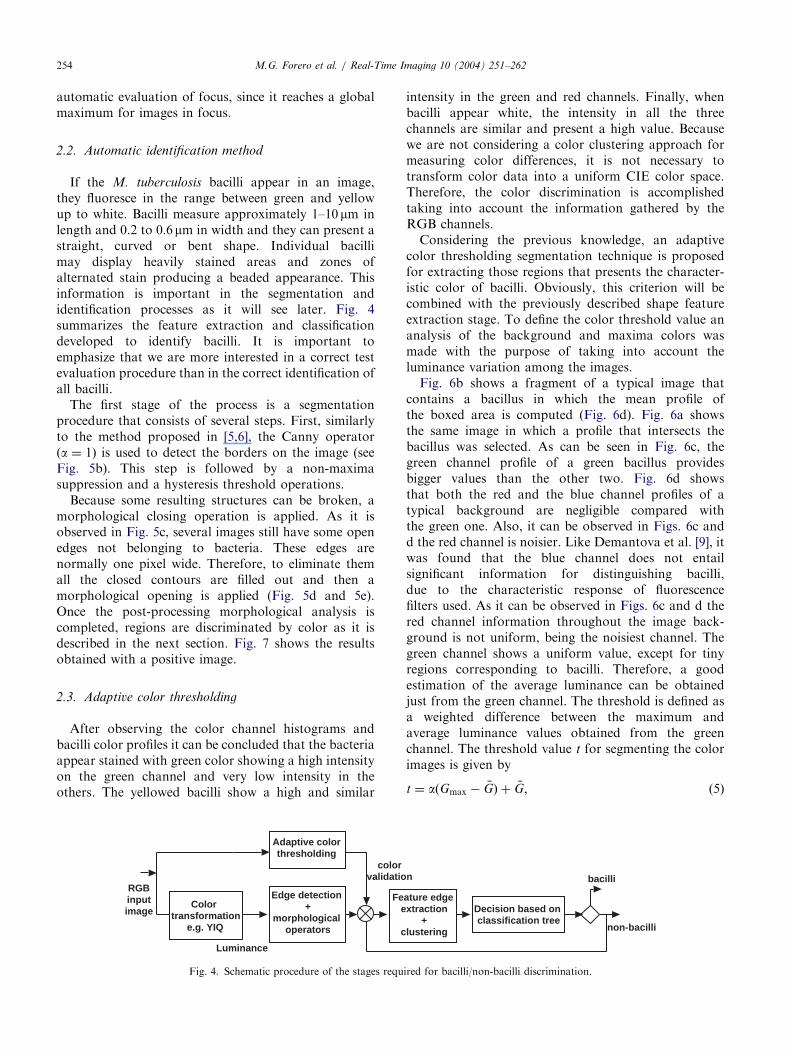
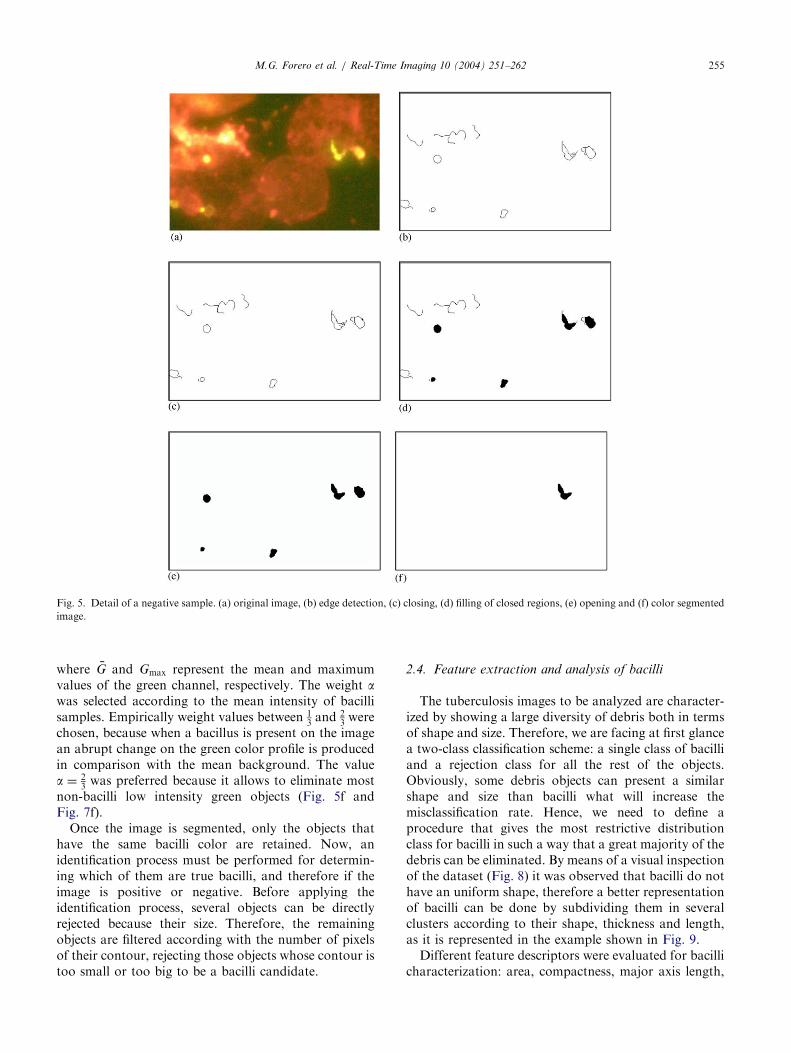
If the M. tuberculosis bacilli appear in an image,they fluoresce in the range between green and yellowup to white. Bacilli measure approximately 1–10mm inlength and 0.2 to 0:6mm in width and they can present astraight, curved or bent shape. Individual bacillimay display heavily stained areas and zones ofalternated stain producing a beaded appearance. Thisinformation is important in the segmentation andidentification processes as it will see later. Fig. 4summarizes the feature extraction and classificationdeveloped to identify bacilli. It is important toemphasize that we are more interested in a correct testevaluation procedure than in the correct identification ofall bacilli.The first stage of the process is a segmentation
procedure that consists of several steps. First, similarlyto the method proposed in [5,6], the Canny operatorða ¼ 1Þ is used to detect the borders on the image (seeFig. 5b). This step is followed by a non-maximasuppression and a hysteresis threshold operations.Because some resulting structures can be broken, a
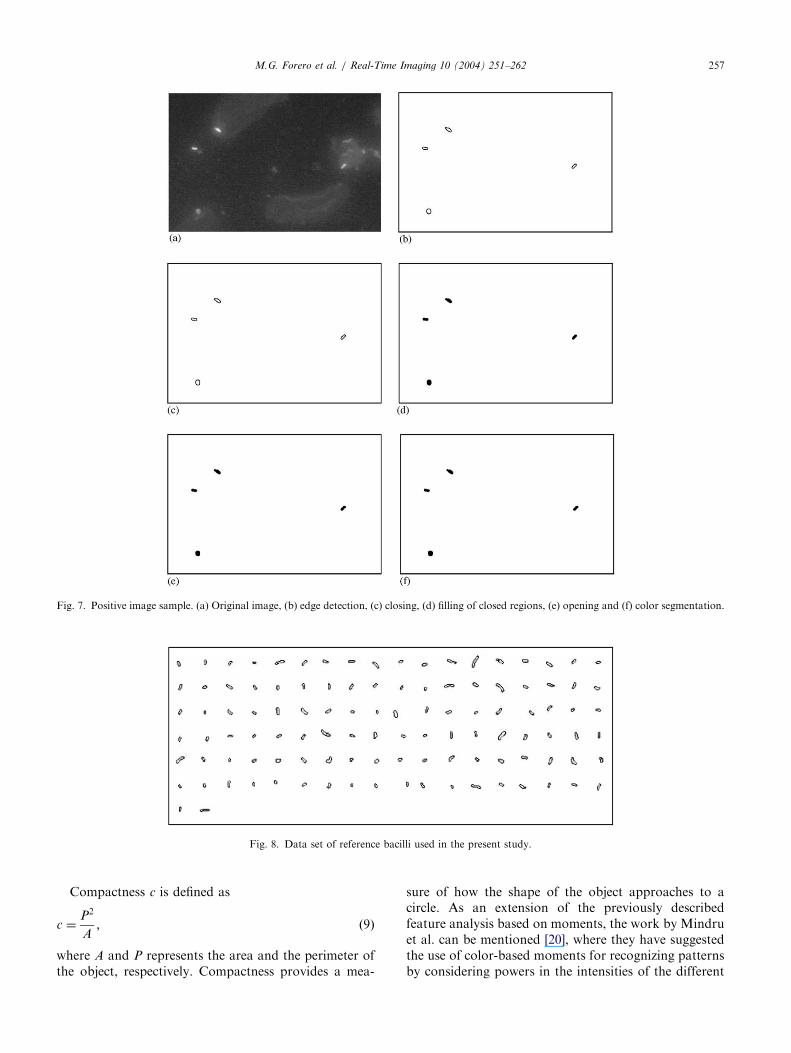
morphological closing operation is applied. As it isobserved in Fig. 5c, several images still have some openedges not belonging to bacteria. These edges arenormally one pixel wide. Therefore, to eliminate themall the closed contours are filled out and then amorphological opening is applied (Fig. 5d and 5e).Once the post-processing morphological analysis iscompleted, regions are discriminated by color as it isdescribed in the next section. Fig. 7 shows the resultsobtained with a positive image.
2.3. Adaptive color thresholding
After observing the color channel histograms andbacilli color profiles it can be concluded that the bacteriaappear stained with green color showing a high intensityon the green channel and very low intensity in theothers. The yellowed bacilli show a high and similar
Color transformation
e.g. YIQ
Adaptive colorthresholding
Edge detection +
morphological operators
Fee
c
colorvalidatio
RGBinputimage
Luminance
Fig. 4. Schematic procedure of the stages requ
intensity in the green and red channels. Finally, whenbacilli appear white, the intensity in all the threechannels are similar and present a high value. Becausewe are not considering a color clustering approach formeasuring color differences, it is not necessary totransform color data into a uniform CIE color space.Therefore, the color discrimination is accomplishedtaking into account the information gathered by theRGB channels.Considering the previous knowledge, an adaptive
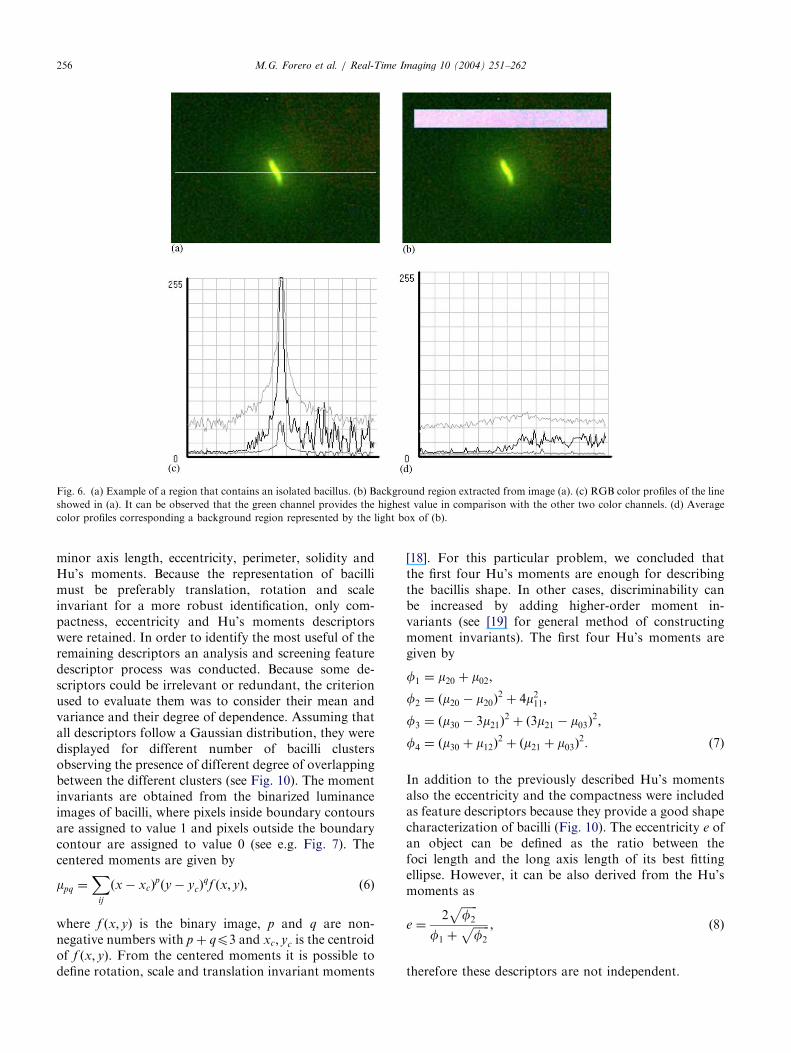
color thresholding segmentation technique is proposedfor extracting those regions that presents the character-istic color of bacilli. Obviously, this criterion will becombined with the previously described shape featureextraction stage. To define the color threshold value ananalysis of the background and maxima colors wasmade with the purpose of taking into account theluminance variation among the images.Fig. 6b shows a fragment of a typical image that
contains a bacillus in which the mean profile ofthe boxed area is computed (Fig. 6d). Fig. 6a showsthe same image in which a profile that intersects thebacillus was selected. As can be seen in Fig. 6c, thegreen channel profile of a green bacillus providesbigger values than the other two. Fig. 6d showsthat both the red and the blue channel profiles of atypical background are negligible compared withthe green one. Also, it can be observed in Figs. 6c andd the red channel is noisier. Like Demantova et al. [9], itwas found that the blue channel does not entailsignificant information for distinguishing bacilli,due to the characteristic response of fluorescencefilters used. As it can be observed in Figs. 6c and d thered channel information throughout the image back-ground is not uniform, being the noisiest channel. Thegreen channel shows a uniform value, except for tinyregions corresponding to bacilli. Therefore, a goodestimation of the average luminance can be obtainedjust from the green channel. The threshold is defined asa weighted difference between the maximum andaverage luminance values obtained from the greenchannel. The threshold value t for segmenting the colorimages is given by
t ¼ aðGmax � �GÞ þ �G; ð5Þ
ature edge xtraction
+lustering
Decision based on classification tree
n
non-bacilli
bacilli
ired for bacilli/non-bacilli discrimination.
ARTICLE IN PRESS
Fig. 5. Detail of a negative sample. (a) original image, (b) edge detection, (c) closing, (d) filling of closed regions, (e) opening and (f) color segmented
image.
M.G. Forero et al. / Real-Time Imaging 10 (2004) 251–262 255
where �G and Gmax represent the mean and maximumvalues of the green channel, respectively. The weight awas selected according to the mean intensity of bacillisamples. Empirically weight values between 1
3and 2
3were
chosen, because when a bacillus is present on the imagean abrupt change on the green color profile is producedin comparison with the mean background. The valuea ¼ 2
3was preferred because it allows to eliminate most
non-bacilli low intensity green objects (Fig. 5f andFig. 7f).Once the image is segmented, only the objects that
have the same bacilli color are retained. Now, anidentification process must be performed for determin-ing which of them are true bacilli, and therefore if theimage is positive or negative. Before applying theidentification process, several objects can be directlyrejected because their size. Therefore, the remainingobjects are filtered according with the number of pixelsof their contour, rejecting those objects whose contour istoo small or too big to be a bacilli candidate.
2.4. Feature extraction and analysis of bacilli
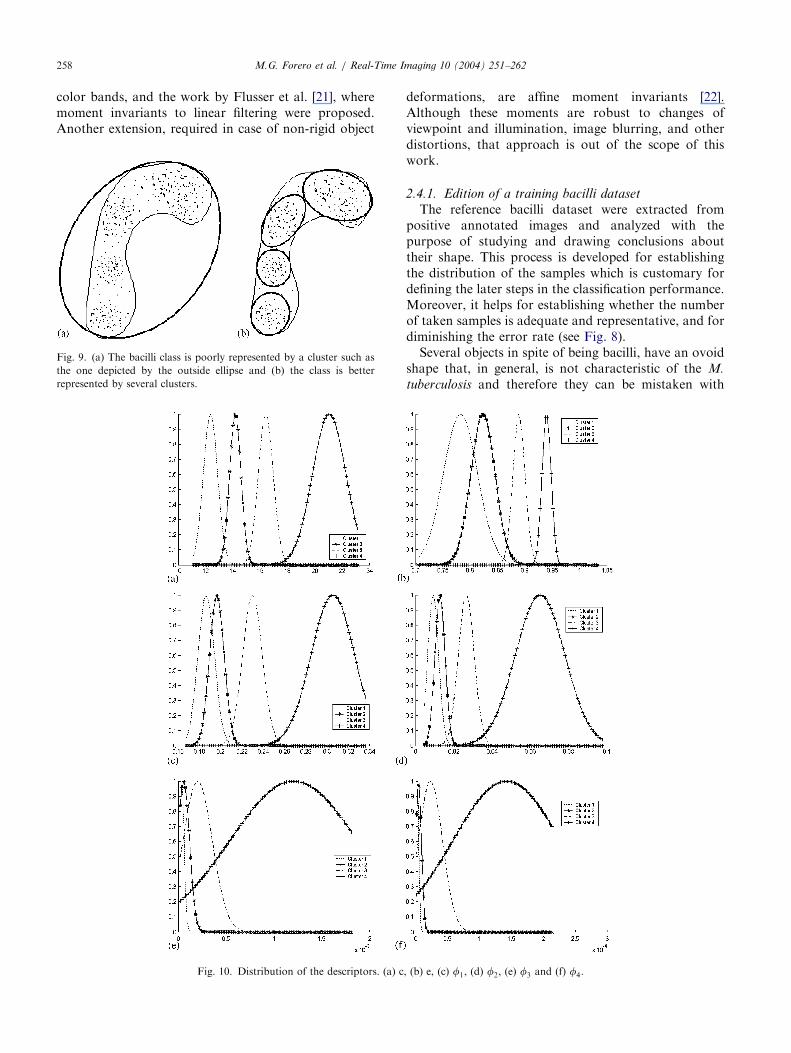
The tuberculosis images to be analyzed are character-ized by showing a large diversity of debris both in termsof shape and size. Therefore, we are facing at first glancea two-class classification scheme: a single class of bacilliand a rejection class for all the rest of the objects.Obviously, some debris objects can present a similarshape and size than bacilli what will increase themisclassification rate. Hence, we need to define aprocedure that gives the most restrictive distributionclass for bacilli in such a way that a great majority of thedebris can be eliminated. By means of a visual inspectionof the dataset (Fig. 8) it was observed that bacilli do nothave an uniform shape, therefore a better representationof bacilli can be done by subdividing them in severalclusters according to their shape, thickness and length,as it is represented in the example shown in Fig. 9.Different feature descriptors were evaluated for bacilli
characterization: area, compactness, major axis length,
ARTICLE IN PRESS
Fig. 6. (a) Example of a region that contains an isolated bacillus. (b) Background region extracted from image (a). (c) RGB color profiles of the line
showed in (a). It can be observed that the green channel provides the highest value in comparison with the other two color channels. (d) Average
color profiles corresponding a background region represented by the light box of (b).
M.G. Forero et al. / Real-Time Imaging 10 (2004) 251–262256
minor axis length, eccentricity, perimeter, solidity andHu’s moments. Because the representation of bacillimust be preferably translation, rotation and scaleinvariant for a more robust identification, only com-pactness, eccentricity and Hu’s moments descriptorswere retained. In order to identify the most useful of theremaining descriptors an analysis and screening featuredescriptor process was conducted. Because some de-scriptors could be irrelevant or redundant, the criterionused to evaluate them was to consider their mean andvariance and their degree of dependence. Assuming thatall descriptors follow a Gaussian distribution, they weredisplayed for different number of bacilli clustersobserving the presence of different degree of overlappingbetween the different clusters (see Fig. 10). The momentinvariants are obtained from the binarized luminanceimages of bacilli, where pixels inside boundary contoursare assigned to value 1 and pixels outside the boundarycontour are assigned to value 0 (see e.g. Fig. 7). Thecentered moments are given by
mpq ¼X
ij
ðx � xcÞpðy � ycÞ
qf ðx; yÞ; ð6Þ
where f ðx; yÞ is the binary image, p and q are non-negative numbers with p þ qp3 and xc; yc is the centroidof f ðx; yÞ. From the centered moments it is possible todefine rotation, scale and translation invariant moments
[18]. For this particular problem, we concluded thatthe first four Hu’s moments are enough for describingthe bacillis shape. In other cases, discriminability canbe increased by adding higher-order moment in-variants (see [19] for general method of constructingmoment invariants). The first four Hu’s moments aregiven by
f1 ¼ m20 þ m02;
f2 ¼ ðm20 � m20Þ2þ 4m211;
f3 ¼ ðm30 � 3m21Þ2þ ð3m21 � m03Þ
2;
f4 ¼ ðm30 þ m12Þ2þ ðm21 þ m03Þ
2: (7)
In addition to the previously described Hu’s momentsalso the eccentricity and the compactness were includedas feature descriptors because they provide a good shapecharacterization of bacilli (Fig. 10). The eccentricity e ofan object can be defined as the ratio between thefoci length and the long axis length of its best fittingellipse. However, it can be also derived from the Hu’smoments as
e ¼2
ffiffiffiffiffiffif2
p
f1 þffiffiffiffiffiffif2
p ; ð8Þ
therefore these descriptors are not independent.
ARTICLE IN PRESS
Fig. 7. Positive image sample. (a) Original image, (b) edge detection, (c) closing, (d) filling of closed regions, (e) opening and (f) color segmentation.
Fig. 8. Data set of reference bacilli used in the present study.
M.G. Forero et al. / Real-Time Imaging 10 (2004) 251–262 257
Compactness c is defined as
c ¼P2
A; ð9Þ
where A and P represents the area and the perimeter ofthe object, respectively. Compactness provides a mea-
sure of how the shape of the object approaches to acircle. As an extension of the previously describedfeature analysis based on moments, the work by Mindruet al. can be mentioned [20], where they have suggestedthe use of color-based moments for recognizing patternsby considering powers in the intensities of the different
ARTICLE IN PRESSM.G. Forero et al. / Real-Time Imaging 10 (2004) 251–262258
color bands, and the work by Flusser et al. [21], wheremoment invariants to linear filtering were proposed.Another extension, required in case of non-rigid object
Fig. 10. Distribution of the descriptors. (a) c
Fig. 9. (a) The bacilli class is poorly represented by a cluster such as
the one depicted by the outside ellipse and (b) the class is better
represented by several clusters.
deformations, are affine moment invariants [22].Although these moments are robust to changes ofviewpoint and illumination, image blurring, and otherdistortions, that approach is out of the scope of thiswork.
2.4.1. Edition of a training bacilli dataset
The reference bacilli dataset were extracted frompositive annotated images and analyzed with thepurpose of studying and drawing conclusions abouttheir shape. This process is developed for establishingthe distribution of the samples which is customary fordefining the later steps in the classification performance.Moreover, it helps for establishing whether the numberof taken samples is adequate and representative, and fordiminishing the error rate (see Fig. 8).Several objects in spite of being bacilli, have an ovoid
shape that, in general, is not characteristic of the M.
tuberculosis and therefore they can be mistaken with
, (b) e, (c) f1, (d) f2, (e) f3 and (f) f4.
ARTICLE IN PRESS
Fig. 12. Resulting silhouette plot for 4 bacilli clusters. SC ¼ 0:702.
Fig. 11. Samples of rejected bacilli due to their shape.
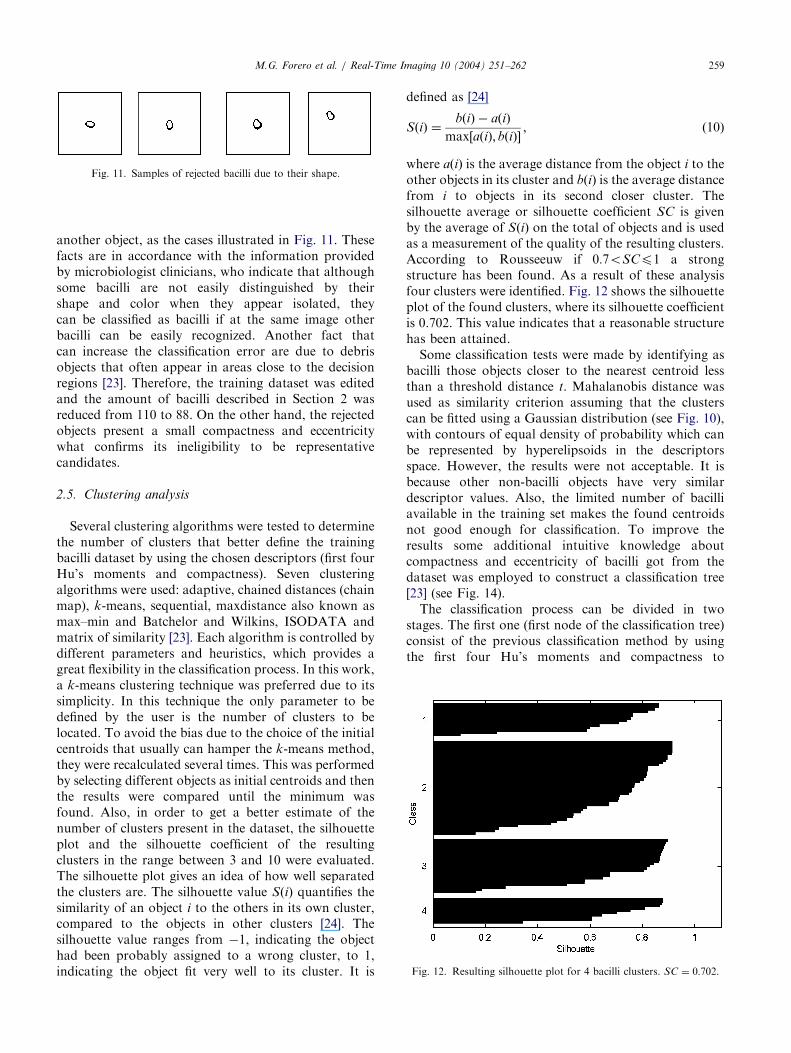
M.G. Forero et al. / Real-Time Imaging 10 (2004) 251–262 259
another object, as the cases illustrated in Fig. 11. Thesefacts are in accordance with the information providedby microbiologist clinicians, who indicate that althoughsome bacilli are not easily distinguished by theirshape and color when they appear isolated, theycan be classified as bacilli if at the same image otherbacilli can be easily recognized. Another fact thatcan increase the classification error are due to debrisobjects that often appear in areas close to the decisionregions [23]. Therefore, the training dataset was editedand the amount of bacilli described in Section 2 wasreduced from 110 to 88. On the other hand, the rejectedobjects present a small compactness and eccentricitywhat confirms its ineligibility to be representativecandidates.
2.5. Clustering analysis
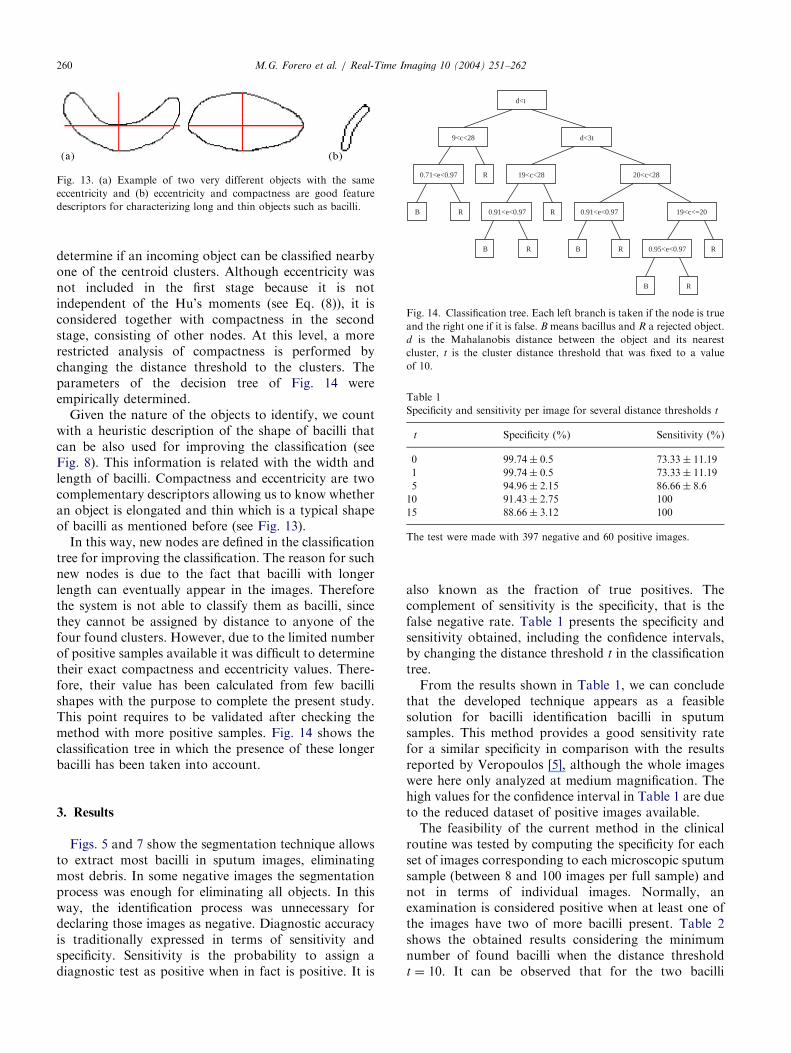
Several clustering algorithms were tested to determinethe number of clusters that better define the trainingbacilli dataset by using the chosen descriptors (first fourHu’s moments and compactness). Seven clusteringalgorithms were used: adaptive, chained distances (chainmap), k-means, sequential, maxdistance also known asmax–min and Batchelor and Wilkins, ISODATA andmatrix of similarity [23]. Each algorithm is controlled bydifferent parameters and heuristics, which provides agreat flexibility in the classification process. In this work,a k-means clustering technique was preferred due to itssimplicity. In this technique the only parameter to bedefined by the user is the number of clusters to belocated. To avoid the bias due to the choice of the initialcentroids that usually can hamper the k-means method,they were recalculated several times. This was performedby selecting different objects as initial centroids and thenthe results were compared until the minimum wasfound. Also, in order to get a better estimate of thenumber of clusters present in the dataset, the silhouetteplot and the silhouette coefficient of the resultingclusters in the range between 3 and 10 were evaluated.The silhouette plot gives an idea of how well separatedthe clusters are. The silhouette value SðiÞ quantifies thesimilarity of an object i to the others in its own cluster,compared to the objects in other clusters [24]. Thesilhouette value ranges from �1, indicating the objecthad been probably assigned to a wrong cluster, to 1,indicating the object fit very well to its cluster. It is
defined as [24]
SðiÞ ¼bðiÞ � aðiÞ
max½aðiÞ; bðiÞ; ð10Þ
where aðiÞ is the average distance from the object i to theother objects in its cluster and bðiÞ is the average distancefrom i to objects in its second closer cluster. Thesilhouette average or silhouette coefficient SC is givenby the average of SðiÞ on the total of objects and is usedas a measurement of the quality of the resulting clusters.According to Rousseeuw if 0:7oSCp1 a strongstructure has been found. As a result of these analysisfour clusters were identified. Fig. 12 shows the silhouetteplot of the found clusters, where its silhouette coefficientis 0.702. This value indicates that a reasonable structurehas been attained.Some classification tests were made by identifying as
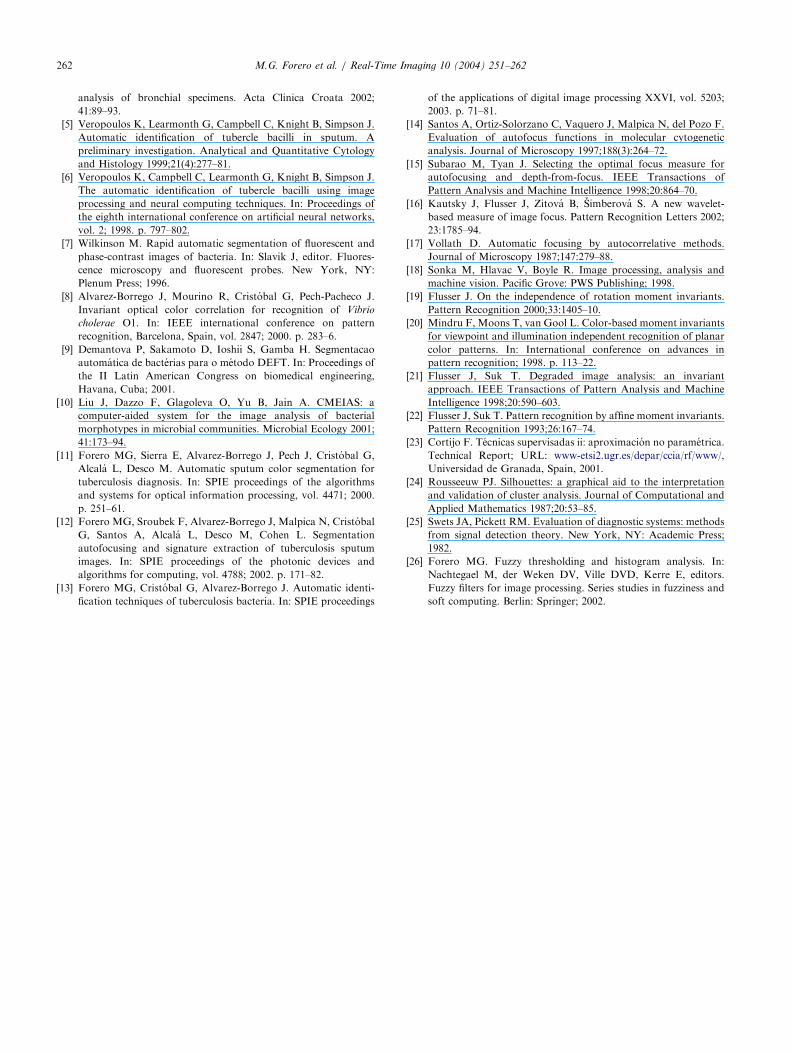
bacilli those objects closer to the nearest centroid lessthan a threshold distance t. Mahalanobis distance wasused as similarity criterion assuming that the clusterscan be fitted using a Gaussian distribution (see Fig. 10),with contours of equal density of probability which canbe represented by hyperelipsoids in the descriptorsspace. However, the results were not acceptable. It isbecause other non-bacilli objects have very similardescriptor values. Also, the limited number of bacilliavailable in the training set makes the found centroidsnot good enough for classification. To improve theresults some additional intuitive knowledge aboutcompactness and eccentricity of bacilli got from thedataset was employed to construct a classification tree[23] (see Fig. 14).The classification process can be divided in two
stages. The first one (first node of the classification tree)consist of the previous classification method by usingthe first four Hu’s moments and compactness to
ARTICLE IN PRESS
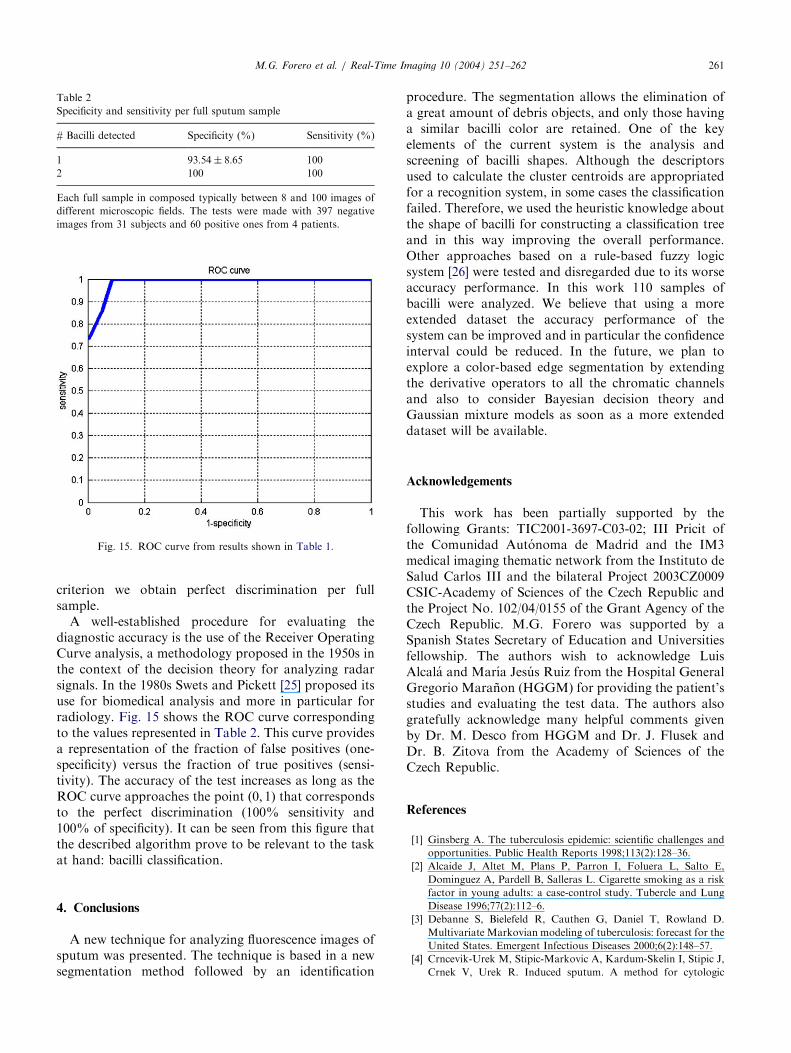
Fig. 13. (a) Example of two very different objects with the same
eccentricity and (b) eccentricity and compactness are good feature
descriptors for characterizing long and thin objects such as bacilli.
0.71<e<0.97
RB
R
9<c<28
19<c<28
0.91<e<0.97 0.91<e<0.97
B R B R
R
d<t
0.95<e<0.97
20<c<28
d<3t
19<c<=20
R
RB
Fig. 14. Classification tree. Each left branch is taken if the node is true
and the right one if it is false. B means bacillus and R a rejected object.
d is the Mahalanobis distance between the object and its nearest
cluster, t is the cluster distance threshold that was fixed to a value
of 10.
Table 1
Specificity and sensitivity per image for several distance thresholds t
t Specificity (%) Sensitivity (%)
0 99:74� 0:5 73:33� 11:191 99:74� 0:5 73:33� 11:195 94:96� 2:15 86:66� 8:610 91:43� 2:75 100
15 88:66� 3:12 100
The test were made with 397 negative and 60 positive images.
M.G. Forero et al. / Real-Time Imaging 10 (2004) 251–262260
determine if an incoming object can be classified nearbyone of the centroid clusters. Although eccentricity wasnot included in the first stage because it is notindependent of the Hu’s moments (see Eq. (8)), it isconsidered together with compactness in the secondstage, consisting of other nodes. At this level, a morerestricted analysis of compactness is performed bychanging the distance threshold to the clusters. Theparameters of the decision tree of Fig. 14 wereempirically determined.Given the nature of the objects to identify, we count
with a heuristic description of the shape of bacilli thatcan be also used for improving the classification (seeFig. 8). This information is related with the width andlength of bacilli. Compactness and eccentricity are twocomplementary descriptors allowing us to know whetheran object is elongated and thin which is a typical shapeof bacilli as mentioned before (see Fig. 13).In this way, new nodes are defined in the classification
tree for improving the classification. The reason for suchnew nodes is due to the fact that bacilli with longerlength can eventually appear in the images. Thereforethe system is not able to classify them as bacilli, sincethey cannot be assigned by distance to anyone of thefour found clusters. However, due to the limited numberof positive samples available it was difficult to determinetheir exact compactness and eccentricity values. There-fore, their value has been calculated from few bacillishapes with the purpose to complete the present study.This point requires to be validated after checking themethod with more positive samples. Fig. 14 shows theclassification tree in which the presence of these longerbacilli has been taken into account.
3. Results
Figs. 5 and 7 show the segmentation technique allowsto extract most bacilli in sputum images, eliminatingmost debris. In some negative images the segmentationprocess was enough for eliminating all objects. In thisway, the identification process was unnecessary fordeclaring those images as negative. Diagnostic accuracyis traditionally expressed in terms of sensitivity andspecificity. Sensitivity is the probability to assign adiagnostic test as positive when in fact is positive. It is
also known as the fraction of true positives. Thecomplement of sensitivity is the specificity, that is thefalse negative rate. Table 1 presents the specificity andsensitivity obtained, including the confidence intervals,by changing the distance threshold t in the classificationtree.From the results shown in Table 1, we can conclude
that the developed technique appears as a feasiblesolution for bacilli identification bacilli in sputumsamples. This method provides a good sensitivity ratefor a similar specificity in comparison with the resultsreported by Veropoulos [5], although the whole imageswere here only analyzed at medium magnification. Thehigh values for the confidence interval in Table 1 are dueto the reduced dataset of positive images available.The feasibility of the current method in the clinical
routine was tested by computing the specificity for eachset of images corresponding to each microscopic sputumsample (between 8 and 100 images per full sample) andnot in terms of individual images. Normally, anexamination is considered positive when at least one ofthe images have two of more bacilli present. Table 2shows the obtained results considering the minimumnumber of found bacilli when the distance thresholdt ¼ 10. It can be observed that for the two bacilli
ARTICLE IN PRESS
Table 2
Specificity and sensitivity per full sputum sample
# Bacilli detected Specificity (%) Sensitivity (%)
1 93:54� 8:65 100
2 100 100
Each full sample in composed typically between 8 and 100 images of
different microscopic fields. The tests were made with 397 negative
images from 31 subjects and 60 positive ones from 4 patients.
Fig. 15. ROC curve from results shown in Table 1.
M.G. Forero et al. / Real-Time Imaging 10 (2004) 251–262 261
criterion we obtain perfect discrimination per fullsample.A well-established procedure for evaluating the
diagnostic accuracy is the use of the Receiver OperatingCurve analysis, a methodology proposed in the 1950s inthe context of the decision theory for analyzing radarsignals. In the 1980s Swets and Pickett [25] proposed itsuse for biomedical analysis and more in particular forradiology. Fig. 15 shows the ROC curve correspondingto the values represented in Table 2. This curve providesa representation of the fraction of false positives (one-specificity) versus the fraction of true positives (sensi-tivity). The accuracy of the test increases as long as theROC curve approaches the point ð0; 1Þ that correspondsto the perfect discrimination (100% sensitivity and100% of specificity). It can be seen from this figure thatthe described algorithm prove to be relevant to the taskat hand: bacilli classification.
4. Conclusions
A new technique for analyzing fluorescence images ofsputum was presented. The technique is based in a newsegmentation method followed by an identification
procedure. The segmentation allows the elimination ofa great amount of debris objects, and only those havinga similar bacilli color are retained. One of the keyelements of the current system is the analysis andscreening of bacilli shapes. Although the descriptorsused to calculate the cluster centroids are appropriatedfor a recognition system, in some cases the classificationfailed. Therefore, we used the heuristic knowledge aboutthe shape of bacilli for constructing a classification treeand in this way improving the overall performance.Other approaches based on a rule-based fuzzy logicsystem [26] were tested and disregarded due to its worseaccuracy performance. In this work 110 samples ofbacilli were analyzed. We believe that using a moreextended dataset the accuracy performance of thesystem can be improved and in particular the confidenceinterval could be reduced. In the future, we plan toexplore a color-based edge segmentation by extendingthe derivative operators to all the chromatic channelsand also to consider Bayesian decision theory andGaussian mixture models as soon as a more extendeddataset will be available.
Acknowledgements
This work has been partially supported by thefollowing Grants: TIC2001-3697-C03-02; III Pricit ofthe Comunidad Autonoma de Madrid and the IM3medical imaging thematic network from the Instituto deSalud Carlos III and the bilateral Project 2003CZ0009CSIC-Academy of Sciences of the Czech Republic andthe Project No. 102/04/0155 of the Grant Agency of theCzech Republic. M.G. Forero was supported by aSpanish States Secretary of Education and Universitiesfellowship. The authors wish to acknowledge LuisAlcala and Marıa Jesus Ruiz from the Hospital GeneralGregorio Maranon (HGGM) for providing the patient’sstudies and evaluating the test data. The authors alsogratefully acknowledge many helpful comments givenby Dr. M. Desco from HGGM and Dr. J. Flusek andDr. B. Zitova from the Academy of Sciences of theCzech Republic.
References
[1] Ginsberg A. The tuberculosis epidemic: scientific challenges and
opportunities. Public Health Reports 1998;113(2):128–36.
[2] Alcaide J, Altet M, Plans P, Parron I, Foluera L, Salto E,
Dominguez A, Pardell B, Salleras L. Cigarette smoking as a risk
factor in young adults: a case-control study. Tubercle and Lung
Disease 1996;77(2):112–6.
[3] Debanne S, Bielefeld R, Cauthen G, Daniel T, Rowland D.
Multivariate Markovian modeling of tuberculosis: forecast for the
United States. Emergent Infectious Diseases 2000;6(2):148–57.
[4] Crncevik-Urek M, Stipic-Markovic A, Kardum-Skelin I, Stipic J,
Crnek V, Urek R. Induced sputum. A method for cytologic
ARTICLE IN PRESSM.G. Forero et al. / Real-Time Imaging 10 (2004) 251–262262
analysis of bronchial specimens. Acta Clinica Croata 2002;
41:89–93.
[5] Veropoulos K, Learmonth G, Campbell C, Knight B, Simpson J.
Automatic identification of tubercle bacilli in sputum. A
preliminary investigation. Analytical and Quantitative Cytology
and Histology 1999;21(4):277–81.
[6] Veropoulos K, Campbell C, Learmonth G, Knight B, Simpson J.
The automatic identification of tubercle bacilli using image
processing and neural computing techniques. In: Proceedings of
the eighth international conference on artificial neural networks,
vol. 2; 1998. p. 797–802.
[7] Wilkinson M. Rapid automatic segmentation of fluorescent and
phase-contrast images of bacteria. In: Slavik J, editor. Fluores-
cence microscopy and fluorescent probes. New York, NY:
Plenum Press; 1996.
[8] Alvarez-Borrego J, Mourino R, Cristobal G, Pech-Pacheco J.
Invariant optical color correlation for recognition of Vibrio
cholerae O1. In: IEEE international conference on pattern
recognition, Barcelona, Spain, vol. 2847; 2000. p. 283–6.
[9] Demantova P, Sakamoto D, Ioshii S, Gamba H. Segmentacao
automatica de bacterias para o metodo DEFT. In: Proceedings of
the II Latin American Congress on biomedical engineering,
Havana, Cuba; 2001.
[10] Liu J, Dazzo F, Glagoleva O, Yu B, Jain A. CMEIAS: a
computer-aided system for the image analysis of bacterial
morphotypes in microbial communities. Microbial Ecology 2001;
41:173–94.
[11] Forero MG, Sierra E, Alvarez-Borrego J, Pech J, Cristobal G,
Alcala L, Desco M. Automatic sputum color segmentation for
tuberculosis diagnosis. In: SPIE proceedings of the algorithms
and systems for optical information processing, vol. 4471; 2000.
p. 251–61.
[12] Forero MG, Sroubek F, Alvarez-Borrego J, Malpica N, Cristobal
G, Santos A, Alcala L, Desco M, Cohen L. Segmentation
autofocusing and signature extraction of tuberculosis sputum
images. In: SPIE proceedings of the photonic devices and
algorithms for computing, vol. 4788; 2002. p. 171–82.
[13] Forero MG, Cristobal G, Alvarez-Borrego J. Automatic identi-
fication techniques of tuberculosis bacteria. In: SPIE proceedings
of the applications of digital image processing XXVI, vol. 5203;
2003. p. 71–81.
[14] Santos A, Ortiz-Solorzano C, Vaquero J, Malpica N, del Pozo F.
Evaluation of autofocus functions in molecular cytogenetic
analysis. Journal of Microscopy 1997;188(3):264–72.
[15] Subarao M, Tyan J. Selecting the optimal focus measure for
autofocusing and depth-from-focus. IEEE Transactions of
Pattern Analysis and Machine Intelligence 1998;20:864–70.
[16] Kautsky J, Flusser J, Zitova B, Simberova S. A new wavelet-
based measure of image focus. Pattern Recognition Letters 2002;
23:1785–94.
[17] Vollath D. Automatic focusing by autocorrelative methods.
Journal of Microscopy 1987;147:279–88.
[18] Sonka M, Hlavac V, Boyle R. Image processing, analysis and
machine vision. Pacific Grove: PWS Publishing; 1998.
[19] Flusser J. On the independence of rotation moment invariants.
Pattern Recognition 2000;33:1405–10.
[20] Mindru F, Moons T, van Gool L. Color-based moment invariants
for viewpoint and illumination independent recognition of planar
color patterns. In: International conference on advances in
pattern recognition; 1998. p. 113–22.
[21] Flusser J, Suk T. Degraded image analysis: an invariant
approach. IEEE Transactions of Pattern Analysis and Machine
Intelligence 1998;20:590–603.
[22] Flusser J, Suk T. Pattern recognition by affine moment invariants.
Pattern Recognition 1993;26:167–74.
[23] Cortijo F. Tecnicas supervisadas ii: aproximacion no parametrica.
Technical Report; URL: www-etsi2.ugr.es/depar/ccia/rf/www/,
Universidad de Granada, Spain, 2001.
[24] Rousseeuw PJ. Silhouettes: a graphical aid to the interpretation
and validation of cluster analysis. Journal of Computational and
Applied Mathematics 1987;20:53–85.
[25] Swets JA, Pickett RM. Evaluation of diagnostic systems: methods
from signal detection theory. New York, NY: Academic Press;
1982.
[26] Forero MG. Fuzzy thresholding and histogram analysis. In:
Nachtegael M, der Weken DV, Ville DVD, Kerre E, editors.
Fuzzy filters for image processing. Series studies in fuzziness and
soft computing. Berlin: Springer; 2002.


![[crosti.ru] color](https://img.pdfslide.net/doc/110x75/635b0815f6a5e096120147a8/crostiru-color.jpg)


