Embed Size (px)
Citation preview
ORNL/TM-2014/540
Identifying Environmental Opportunities outside the Hydropower Project Boundary: An Updated Methodology of the Basin Scale
Opportunity Assessment
Ryan A. McManamay
Matthew J. Troia
Christopher R. DeRolph
Mark S. Bevelhimer
Michael P. Schramm
Kyle B. Larson
Jerry D. Tagestad
Gary E. Johnson
Henriette I. Jager
January 2015
Approved for public release; distribution is unlimited.
This report was prepared as an account of work sponsored by an agency of the United States Government. Neither the United States Government nor any agency thereof, nor any of their employees, makes any warranty, express or implied, or assumes any legal liability or responsibility for the accuracy, completeness, or usefulness of any information, apparatus, product, or process disclosed, or represents that its use would not infringe privately owned rights. Reference herein to any specific commercial product, process, or service by trade name, trademark, manufacturer, or otherwise, does not necessarily constitute or imply its endorsement, recommendation, or favoring by the United States Government or any agency thereof. The views and opinions of authors expressed herein do not necessarily state or reflect those of the United States Government or any agency thereof.
DOCUMENT AVAILABILITY
Reports produced after January 1, 1996, are generally available free via US Department of Energy (DOE) SciTech Connect.
Website http://www.osti.gov/scitech/
Reports produced before January 1, 1996, may be purchased by members of the public from the following source:
National Technical Information Service
5285 Port Royal Road
Springfield, VA 22161
Telephone 703-605-6000 (1-800-553-6847)
TDD 703-487-4639
Fax 703-605-6900
E-mail [email protected]
Website http://www.ntis.gov/help/ordermethods.aspx
Reports are available to DOE employees, DOE contractors, Energy Technology Data Exchange representatives, and International Nuclear Information System representatives from the following source:
Office of Scientific and Technical Information
PO Box 62
Oak Ridge, TN 37831
Telephone 865-576-8401
Fax 865-576-5728
E-mail [email protected]
Website http://www.osti.gov/contact.html
ORNL/TM-2014/540
Identifying Environmental Opportunities outside the Hydropower Project Boundary: An
Updated Methodology of the Basin Scale Opportunity Assessment
Ryan A McManamay, Mathew J Troia, Christopher R DeRolph, Mark S Bevelhimer, Michael P.
Schramm, Kyle B Larson1, Jerry D Tagestad1, Gary E Johnson
1, Henriette I. Jager
Environmental Sciences Division
Date Published: January 2015
Prepared by
OAK RIDGE NATIONAL LABORATORY
Oak Ridge, Tennessee 37831-6283
managed by
UT-BATTELLE, LLC
for the
US DEPARTMENT OF ENERGY
under contract DE-AC05-00OR22725
1 Pacific Northwest National Laboratory
iii
Summary The Basin Scale Opportunity Assessment (BSOA) initiative, led by the Department of Energy’s (DOE)
Water Power Program, was designed to establish an integrative approach to assess the potential for
combined increases in hydropower energy and improvements in the environment at a basin scale.
Methods were developed to isolate mutual benefits to hydropower energy production and environmental
protection. To date, the majority of environmental mitigation at hydropower facilities has occurred within
the vicinity or project area of hydropower facilities (i.e., direct environmental opportunities). This report
summarizes a methodology to identify environmental opportunities independent of a hydropower
development and operations (i.e., indirect opportunities), i.e. those that occur outside the project area or
not in close proximity to hydropower facilities that may complement increases in energy production.
Indirect opportunities include acquisition of conservation land, wetland mitigation, riparian
improvements, stream habitat restoration, and removal of non-powered dams. Using geospatial datasets
summarizing landscape and stream conditions and the occurrence of high-profile aquatic and terrestrial
species of concern, we created a framework to identify indirect opportunities and applied the
methodology to the Roanoke Basin (North Carolina and Virginia, USA) as a case study. A scoring system
was developed to prioritize indirect opportunities based on landscape/stream condition and the presence
of species of concern. In addition, literature reviews and geospatial procedures were used to identify the
social emphasis (overall prevalence and spatial variation in prevalence) of various direct and indirect
environmental opportunities. The inclusion of indirect opportunities may provide greater potential for
environmental mitigation and improvements related to a specific project or hydropower development
because indirect environmental opportunities are pervasive and do not rely on direct geographic affiliation
with a hydropower facility. The full potential of mutual benefits to hydropower energy production and
environmental protection may be underestimated if based solely on potential opportunities near a facility.
The methodology presented also has further reaching implications, such as providing environmental
stakeholders with mechanisms to prioritize restoration actions within a basin, irrespective of hydropower.
iv
Acknowledgments
We thank Hoyt Battey and Thomas Heibel (DOE); Simon Geerlofs (PNNL); members of the BSOA
national steering committee, including Linda Church-Ciocci (National Hydropower Association), Julie
Keil (Portland General Electric), Jeff Leahy (National Hydropower Association), Kerry McCalman
(BOR), Lisa Morales and Kamau Sadiki (U.S. Army Corps of Engineers), Jeff Opperman (The Nature
Conservancy [TNC]), Mike Pulskamp (BOR), Richard Roos-Collins (Water and Power Law Group), and
John Seebach (Low Impact Hydropower Institute). Special appreciation goes to Jason Bulluck and
Joseph Weber for providing wetland layers from the Virginia Wetlands Catalogue and methods for
identifying and prioritizing wetlands for mitigation.
v
Acronyms and Abbreviations 303d 303d Impaired Waterbodies Listing
BISON Biological Information Serving Our Nation
BSOA basin-scale opportunity assessment
CDRI Clearinghouse for Dam Removal Information
cfs cubic (foot) feet per second
DOE Department of Energy
EO elemental occurrence
EPA U.S. Environmental Protection Agency
FERC Federal Energy Regulatory Commission
FPA Federal Power Act
GAP Gap Analysis Program
GIS geographic information system
HUC hydrologic unit code
HUC8 8-digit hydrologic unit code
HUC12 12-digit hydrologic unit code
NFHAP National Fish Habitat Action Plan
NHA Natural Heritage Area
NHD National Hydrography Data set
NHAAP National Hydropower Asset Assessment Program
NLCD National Land Cover Dataset
NOAA National Oceanic and Atmospheric Association
NPD non-powered dam
NRI National Rivers Inventory
NSD New Stream-reach Development
NWI National Wetlands Inventory
ORNL Oak Ridge National Laboratory
PNNL Pacific Northwest National Laboratory
RIBITS Regulatory In lieu fee and Bank Information Tracking System
TNC The Nature Conservancy
USACE U.S. Army Corps of Engineers
USGS U.S. Geological Survey
VDCR Virginia Department of Conservation and Recreation
VWC Virginia Wetlands Catalog
WSR Wild and Scenic River
vi
Contents
Summary ...................................................................................................................................................... iii
Acknowledgments ........................................................................................................................................ iv
Acronyms and Abbreviations ....................................................................................................................... v
1.0 Introduction ............................................................................................................................................. 1
1.1 Background ......................................................................................................................................... 1
1.2 Indirect Environmental Opportunities ................................................................................................ 3
1.3 Objectives ........................................................................................................................................... 4
2.0 Methods.................................................................................................................................................. 5
2.1. Indirect Environmental Opportunity Categories ................................................................................ 6
2.1.1 Wetland Mitigation ...................................................................................................................... 6
2.1.2 Riparian Improvement ............................................................................................................... 12
2.1.3 Instream Habitat Restoration ..................................................................................................... 14
2.1.4 Upland Land Acquisition ........................................................................................................... 14
2.1.5 Riparian Land Acquisition ......................................................................................................... 15
2.1.6 Dam Removal ........................................................................................................................... 16
2.1.7 Benefit Scoring .......................................................................................................................... 17
2.2 Social Emphasis ................................................................................................................................ 20
2.2.1 Literature Review ....................................................................................................................... 20
2.2.2 Overall relevance weighting ...................................................................................................... 21
2.2.3 Geographic weighting ................................................................................................................ 24
2.3 Identifying indirect win-win opportunities ....................................................................................... 27
3.0 Conclusions ........................................................................................................................................... 27
4.0. References ............................................................................................................................................ 28
vii
Figures
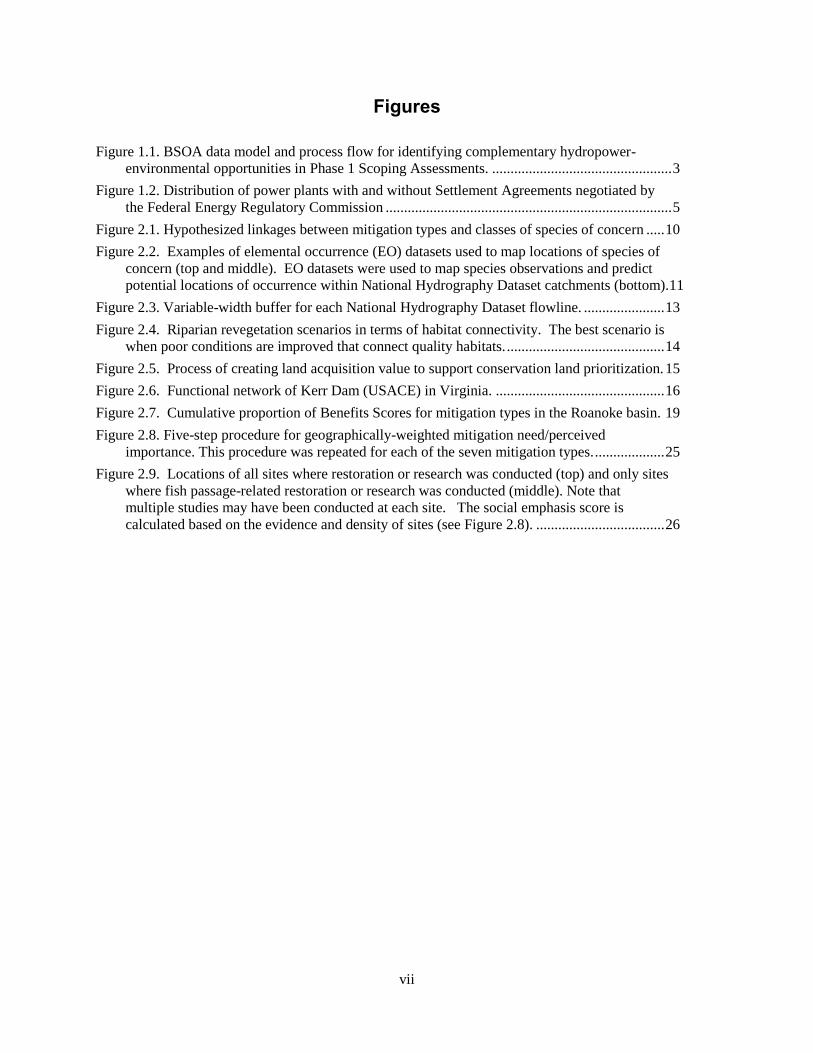
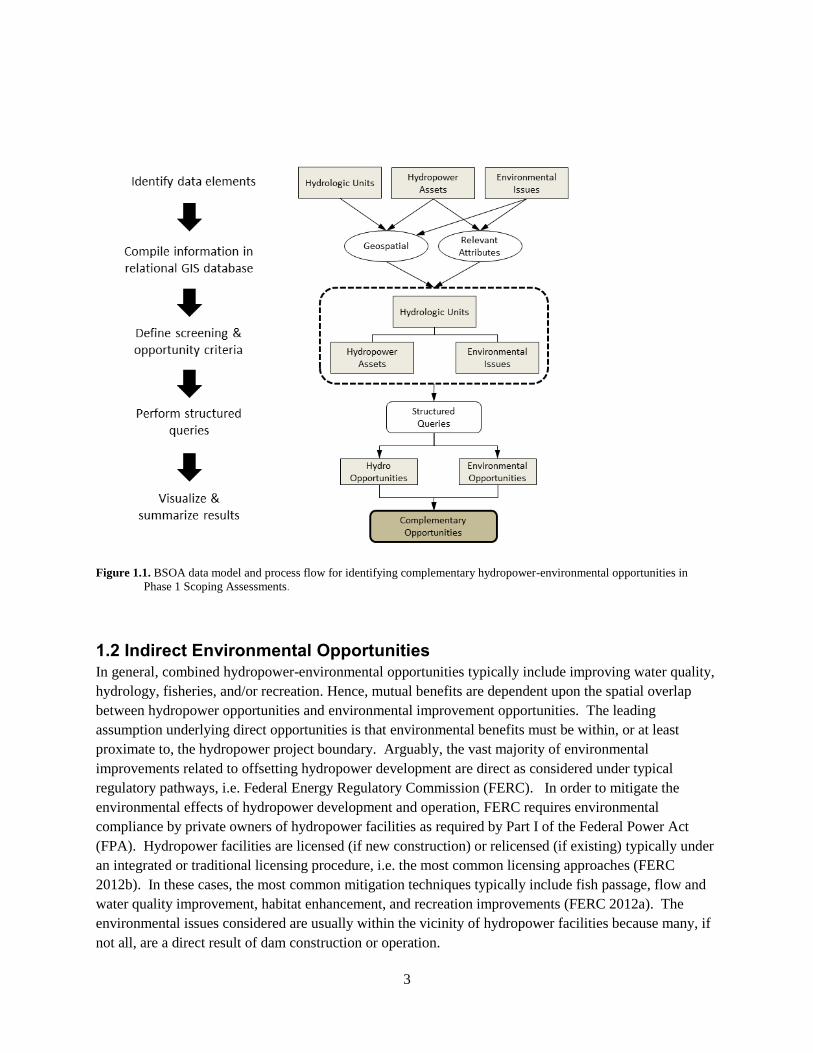
Figure 1.1. BSOA data model and process flow for identifying complementary hydropower-
environmental opportunities in Phase 1 Scoping Assessments. ................................................. 3
Figure 1.2. Distribution of power plants with and without Settlement Agreements negotiated by
the Federal Energy Regulatory Commission .............................................................................. 5
Figure 2.1. Hypothesized linkages between mitigation types and classes of species of concern ..... 10
Figure 2.2. Examples of elemental occurrence (EO) datasets used to map locations of species of
concern (top and middle). EO datasets were used to map species observations and predict
potential locations of occurrence within National Hydrography Dataset catchments (bottom).11
Figure 2.3. Variable-width buffer for each National Hydrography Dataset flowline. ...................... 13
Figure 2.4. Riparian revegetation scenarios in terms of habitat connectivity. The best scenario is
when poor conditions are improved that connect quality habitats. ........................................... 14
Figure 2.5. Process of creating land acquisition value to support conservation land prioritization. 15
Figure 2.6. Functional network of Kerr Dam (USACE) in Virginia. .............................................. 16
Figure 2.7. Cumulative proportion of Benefits Scores for mitigation types in the Roanoke basin. 19
Figure 2.8. Five-step procedure for geographically-weighted mitigation need/perceived
importance. This procedure was repeated for each of the seven mitigation types. ................... 25
Figure 2.9. Locations of all sites where restoration or research was conducted (top) and only sites
where fish passage-related restoration or research was conducted (middle). Note that
multiple studies may have been conducted at each site. The social emphasis score is
calculated based on the evidence and density of sites (see Figure 2.8). ................................... 26
viii
Tables Table 2.1. Types of off-site mitigation, their descriptions, and factors important to determining
their benefit. ................................................................................................................................ 8
Table 2.2. Datasets and sources used to create different indirect mitigation types. ............................ 9
Table 2.3. Equations for Site Scores and Biodiversity Scores that make up Benefit Scores for
different mitigation types. See “Benefit Scoring” section in text. ........................................... 18
Table 2.4 Seven types of on- and off-site mitigation opportunity and descriptions of specific types
of restoration and research projects falling under each type. .................................................... 22
Table 2.5. Keywords used in literature searches for seven mitigation types. ................................... 23
Table 2.6. Weighting system used to characterize overall relevance of each literature document. .. 24
1
1.0 Introduction The Basin Scale Opportunity Assessment (BSOA) initiative, led by the Department of Energy’s (DOE)
Water Power Program, was designed to establish an integrative approach to assess the potential for
combined increases in hydropower energy and improvements in the environment at a basin scale.
Through a collaborative effort between Pacific Northwest National Laboratory (PNNL) and Oak Ridge
National Laboratory (ORNL), a 10-step methodology was developed to isolate mutual benefits to
hydropower energy production and environmental protection. A methodology report (Johnson et al.
2013) was produced as a widely applicable and transferable process for replication in basins across the
United States. Of the 10 steps in the methodology report, three are of great importance here and include:
1) identifying hydropower opportunities, 2) identifying opportunities for environmental improvement
(e.g. mitigation), and 3) evaluating scenarios in which hydropower and environmental opportunities can
mutually benefit. According to Johnson et al. (2013), opportunities are defined as possible actions for
hydropower development or environmental improvement. Opportunities to increase conventional
hydropower included increasing the capacity at existing dams, powering non-powered dams, or
constructing new dams. Environmental opportunities are defined as situations where an existing
environmental issue can be improved, either directly or indirectly, as a result of or in conjunction with a
hydropower action , such as Federal Energy Regulatory Commission (FERC) relicensing procedures
(Johnson et al. 2013). Environmental opportunities independent of a hydropower action (i.e., indirect
opportunities), such as land acquisition and wetland rehabilitation, are possible, but were not considered
by Johnson et al. (2013) because the focus was primarily concerned with combined hydropower-
environmental opportunities, i.e., opportunities for hydropower development that have associated
environmental improvements. The report herein updates the existing BSOA methodology as to identify
indirect environmental opportunities that complement hydropower opportunities.
1.1 Background The preliminary BSOA Phase 1 scoping assessment approach, completed in Sept 2013, identified
complementary hydropower-environmental opportunities and consisted of five general tasks: 1)
contacting key stakeholders, 2) compiling relevant information, 3) identifying hydropower opportunities,
4) identifying environmental issues, and 5) identifying potential complementary hydropower-
environmental opportunities (Johnson et al. 2013). Information from the National Hydropower Asset
Assessment Program (NHAAP) database was used to identify potential hydropower development
opportunities in the basins related to powering Non-powered dams, New Stream Reach Development
(NSD), and information for existing hydropower dams (ORNL 2014). Information about key
environmental issues that could potentially be improved by hydropower development was identified from
publicly-available resources, such as watershed planning documents, environmental impact statements,
water-quality certifications, regulatory filings for hydropower projects, and nationally-available
environmental data (e.g., EPA 303d listings). The information was placed in geographic context within a
Geographic Information System (GIS) database to allow for spatially-driven analyses of hydropower-
environmental interactions (Figure 1). The structure of the database was based on a data model that
involved core data elements (e.g., spatial representations of hydropower opportunities and environmental
opportunities), relationships between data elements, and rules by which interactions between hydropower
and environmental issues are explored. Spatial footprints of hydropower opportunities included dams,

2
reservoirs, and tailwaters, which were included in the model. A central feature of the model was
hydrologic catchment polygons (specifically National Hydrography Dataset (NHD) 1:100,000 scale
catchments), which served as the common spatial unit for exploring spatial overlap between hydropower
and environmental opportunities. To identify complementary hydropower-environmental opportunities,
interactions between hydropower opportunities and environmental issues were explored using a
consistent, sequential process. A key aspect of the process was development of two sets of criteria for
structuring queries of the GIS database that would reveal complementary hydropower-environmental
opportunities. The first criteria set applied environmental attributes that may preclude hydropower
opportunities (e.g., protected lands, federally listed species, wild and scenic rivers), and the second
described potential environmental benefits that may be associated with hydropower. Criteria were kept
fairly coarse because of the broad scale of analysis and the intention of providing an initial assessment of
potential opportunities. The outcome of the approach was a map and list of complementary hydropower-
environmental opportunities for a given basin.
As defined previously, environmental opportunities are defined as situations where an existing
environmental issue can be improved, either directly or indirectly, as a result of or in conjunction with a
hydropower action (Johnson et al. 2013). Hydropower-environmental opportunities can be classified as
direct or indirect depending on whether they improve existing environmental issues that are directly or
indirectly related to hydropower development, respectively. In general, combined hydropower-
environmental opportunities are typically direct and include improving water quality, hydrology,
fisheries, and/or recreation. During the preliminary Phase 1 assessment, only direct hydropower-
environmental opportunities were considered (Johnson et al. 2013). In contrast, indirect environmental
improvements include wetland mitigation, riparian enhancement, habitat restoration, land acquisition,
dam removal, and recreational/cultural enhancement. As an example of a direct opportunity, adding a
turbine to a non-powered dam (i.e., a hydropower action) provides an opportunity to improve low
dissolved oxygen conditions that may exist downstream. Hence, the physical addition of a turbine may
include either engineered aeration structures incorporated into the turbine generator itself, spillage gates,
or as infusers at the base of the powerhouse. In general terms, direct environmental opportunities rely on
a hydropower action to be realized. In terms of the data model (Figure 1.1), these complementary actions
are identified by the intersection of tailwaters and impaired waterbodies with low dissolved oxygen within
the same hydrologic catchment (e.g., NHD 1:100,000 catchment). In contrast, wetland restoration
(indirect opportunity) can occur miles from a dam and regardless of changes in dam operations or
structure.
3
Figure 1.1. BSOA data model and process flow for identifying complementary hydropower-environmental opportunities in
Phase 1 Scoping Assessments.
1.2 Indirect Environmental Opportunities In general, combined hydropower-environmental opportunities typically include improving water quality,
hydrology, fisheries, and/or recreation. Hence, mutual benefits are dependent upon the spatial overlap
between hydropower opportunities and environmental improvement opportunities. The leading
assumption underlying direct opportunities is that environmental benefits must be within, or at least
proximate to, the hydropower project boundary. Arguably, the vast majority of environmental
improvements related to offsetting hydropower development are direct as considered under typical
regulatory pathways, i.e. Federal Energy Regulatory Commission (FERC). In order to mitigate the
environmental effects of hydropower development and operation, FERC requires environmental
compliance by private owners of hydropower facilities as required by Part I of the Federal Power Act
(FPA). Hydropower facilities are licensed (if new construction) or relicensed (if existing) typically under
an integrated or traditional licensing procedure, i.e. the most common licensing approaches (FERC
2012b). In these cases, the most common mitigation techniques typically include fish passage, flow and
water quality improvement, habitat enhancement, and recreation improvements (FERC 2012a). The
environmental issues considered are usually within the vicinity of hydropower facilities because many, if
not all, are a direct result of dam construction or operation.
4
As much, if not more, of the potential for environmental mitigation and improvements within a basin
may, in fact, be indirectly related to a specific project or hydropower development, in general. These
types of environmental improvements include wetland mitigation, riparian enhancement, habitat
restoration, land acquisition, dam removal, and recreational/cultural enhancement. While these potential
improvement areas may be located proximate to facilities, many are likely to be many miles away. Hence,
the full potential of “win/win” scenarios may be underestimated if based solely on spatial overlap and
thus requires prioritizing conservation and sociocultural needs at the scale of the entire basin.
Fortunately, grounds for pursuing environmental opportunities potentially outside the boundaries of a
particular project are supported by existing policies, known as Settlement Agreements, also under Part 1
of the FPA (FERC 2006). However, Settlement Agreements are not common in the US having only
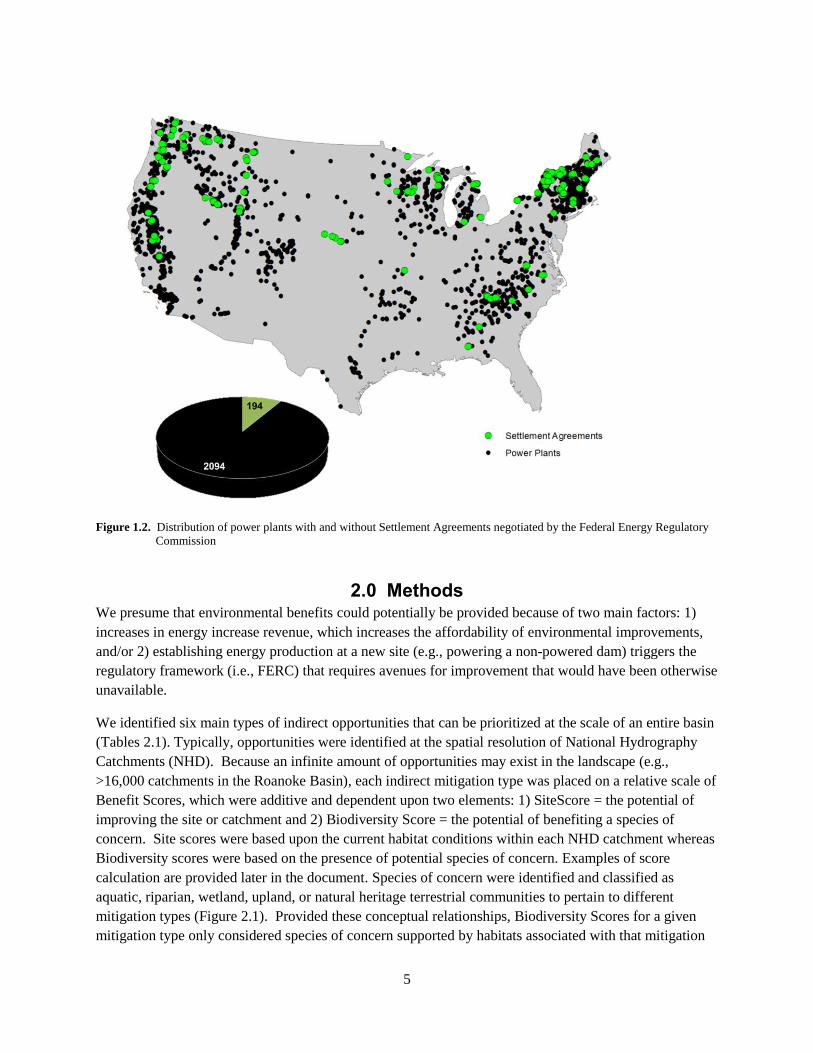
occurred at less than 10% of power plants and are mostly used at larger facilities (Figure 1.2).
Furthermore, FERC requires the following five basic principles for different mitigation measures to be
acceptable within settlement agreements: 1) the mitigation must be based on substantial evidence of an
environmental need in the record, 2) the mitigation must be enforceable and within the FERC’s
jurisdiction, 3) a relationship must exist between the measure and the project’s environmental effects, 4)
required measures should be as specific as possible, and 5) actions should occur as close as possible to the
project (FERC 2006). The strict criteria of these requirements will likely limit the type and scope of any
indirect environmental opportunities, especially if not directly related to hydropower development or
operations. Nonetheless, we include an assessment of indirect opportunities as to inform stakeholders of
potential mechanisms of environmental improvements, provide a prioritization of needs in the basin, and
evaluate current policies.
1.3 Objectives The purpose of this report is to provide a methodology for identifying “indirect” environmental
opportunities to support mutually beneficial situations of increasing hydropower energy while improving
existing environmental conditions within a basin. We developed a framework to rank and prioritize
indirect environmental opportunities in order to select the best options for mutually beneficial energy-
environmental enhancement. In addition, we questioned how the social emphasis, or social importance,
of different mitigation types might influence the relative importance of benefits, especially the social
importance of benefits. Hence, we present a literature review approach to quantify the relative social
benefits of different mitigation types across basins.
5
Figure 1.2. Distribution of power plants with and without Settlement Agreements negotiated by the Federal Energy Regulatory
Commission
2.0 Methods We presume that environmental benefits could potentially be provided because of two main factors: 1)
increases in energy increase revenue, which increases the affordability of environmental improvements,
and/or 2) establishing energy production at a new site (e.g., powering a non-powered dam) triggers the
regulatory framework (i.e., FERC) that requires avenues for improvement that would have been otherwise
unavailable.
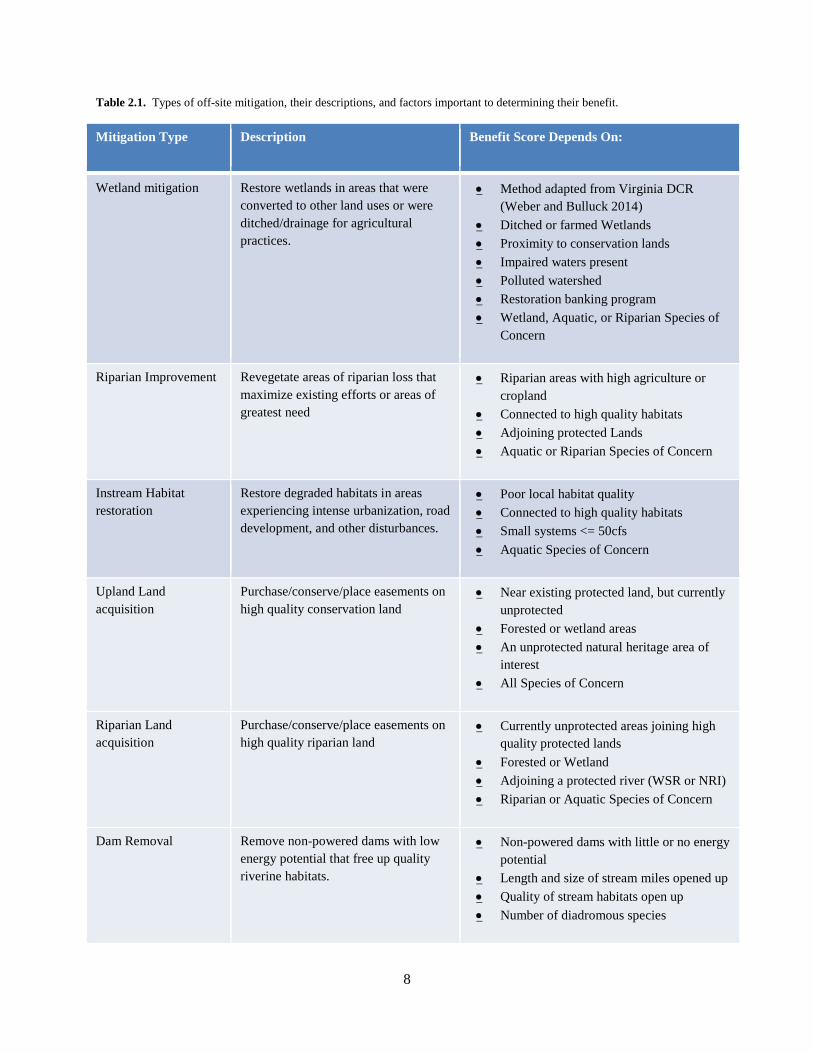
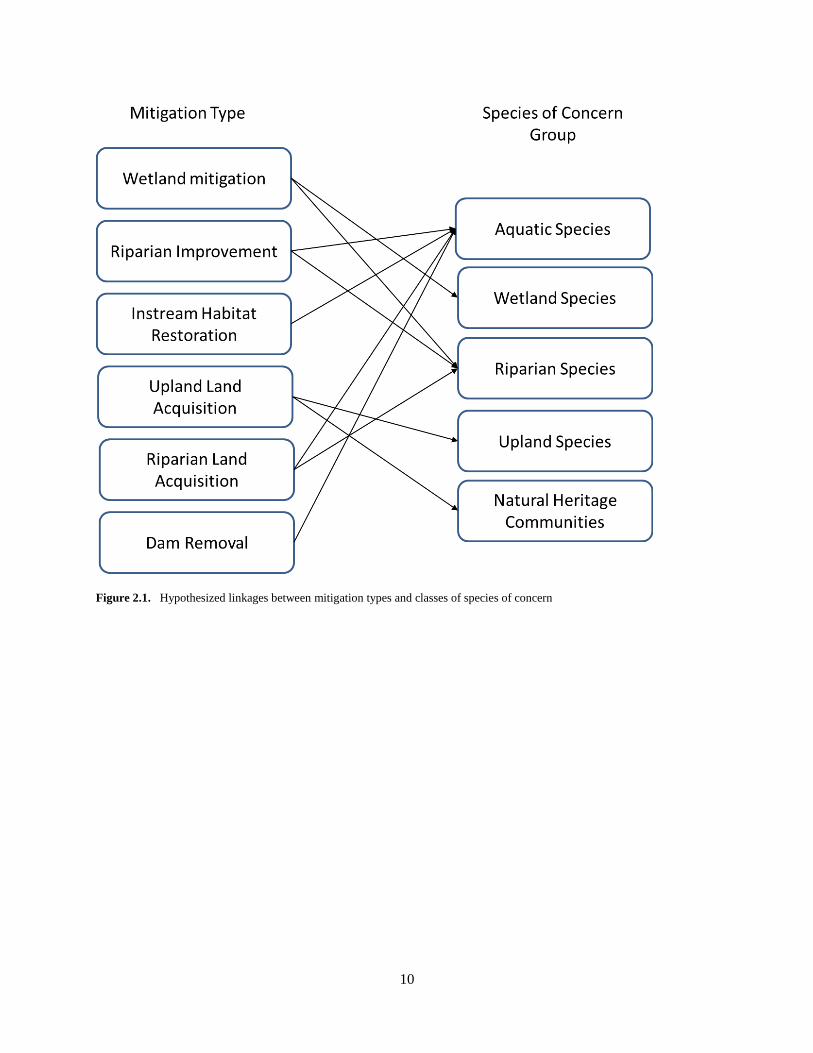
We identified six main types of indirect opportunities that can be prioritized at the scale of an entire basin
(Tables 2.1). Typically, opportunities were identified at the spatial resolution of National Hydrography
Catchments (NHD). Because an infinite amount of opportunities may exist in the landscape (e.g.,
>16,000 catchments in the Roanoke Basin), each indirect mitigation type was placed on a relative scale of
Benefit Scores, which were additive and dependent upon two elements: 1) SiteScore = the potential of
improving the site or catchment and 2) Biodiversity Score = the potential of benefiting a species of
concern. Site scores were based upon the current habitat conditions within each NHD catchment whereas
Biodiversity scores were based on the presence of potential species of concern. Examples of score
calculation are provided later in the document. Species of concern were identified and classified as
aquatic, riparian, wetland, upland, or natural heritage terrestrial communities to pertain to different
mitigation types (Figure 2.1). Provided these conceptual relationships, Biodiversity Scores for a given
mitigation type only considered species of concern supported by habitats associated with that mitigation
6
(Figure 2.1). For example, riparian improvement was more beneficial if a riparian or aquatic species of
concern was potentially present, as opposed to just considering any species of concern.
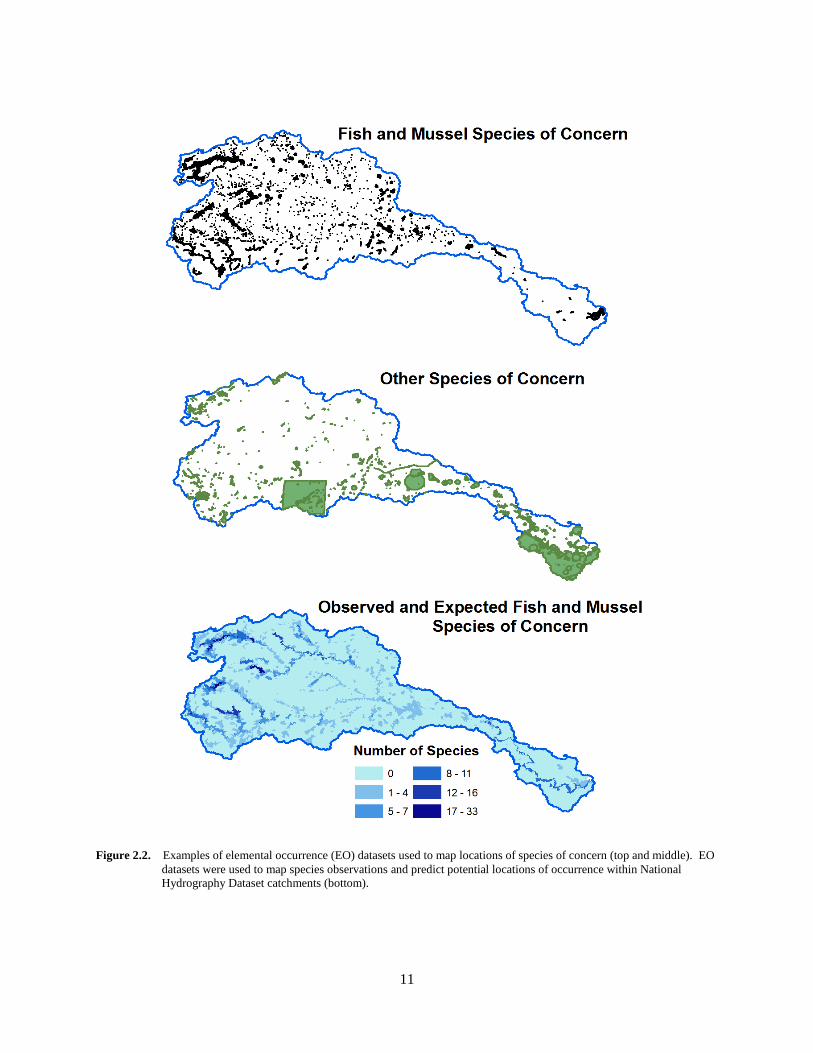
Several datasets were essential to developing Benefit Scores and included: 1) Elemental occurrences
(EO) of species of concern from state-specific Natural Heritage programs or online data repositories
(Figure 2.2), 2) National Land Cover Dataset (NLCD), 3) National Fish Habitat Action Plan (NFHAP), 4)
GAP analysis protected lands layer, 5) National Wetlands Inventory (NWI), and 6) several other
associated datasets (Table 2.2).
Out of these datasets, the EO dataset took the most preparation to transform into a product that informed
our analysis. Species of concern for each basin were isolated from state-specific listings and included any
species under the following criteria: 1) federal protection (of any kind) under the Endangered Species Act,
2) state listed as protected, and/or 3) recognized as rare and of conservation priority. Given the focus on
hydropower development, we also included any diadromous fish species as species of concern.
Occurrences of all species found in the basin were obtained from multiple datasets, including national-
level surveys, online data repositories, and obtaining state-specific Natural Heritage Program data (Table
2.2).
Occurrences were overlaid with NHD catchments to produce contiguous maps of species richness within
different taxonomic groups and/or habitat groups (Figure 2.2). While occurrences were comprehensive,
they were not adequate for determining species presence or absence in unsampled locations. Thus, for
fish and mussel species, we developed simplified species distribution models that predicted species
presence and absence in unsampled NHD catchments (Figure 2.2, bottom panel). Potential presence for a
given mussel or fish species in an NHD catchment was based on the combination of 1) the documented
presence of the species within the surrounding 12-digit hydrologic unit (HUC12) catchment, and 2)
whether flow at the bottom of the NHD catchment exceeded the 25th percentile discharge thresholds of all
catchments in which the species had been documented. For species besides fish and invertebrates, we
obtained raster maps of modeled species’ distributions based on habitat affinities, land cover, and
landscape disturbance from the National Gap Analysis Program (USGS 2014).
2.1 Indirect Environmental Opportunity Categories
2.1.1 Wetland Mitigation Areas that are currently disturbed wetlands or were historically wetlands and converted to other land uses,
such as agriculture, are well-suited for wetland restoration and creation because of the complex nature of
hydric soils and underlying geomorphic conditions. Because the hydrologic conditions of these locations
are difficult to artificially replicate, only existing wetlands or converted wetlands were considered in the
analysis. The Virginia Wetlands Catalog (VWC) provided a methodology to prioritize wetlands for
restoration/mitigation (Weber and Bulluck 2014). The VWC is a joint project between Virginia
Department of Conservation and Recreation (VDCR), Division of Natural Heritage Program, and Virginia
Department of Transportation. Wetlands prioritized for restoration in the VWC were graciously provided
by VDCR for the Virginia portion of the Roanoke Basin (by Joseph Weber and Jason Bulluck).
However, for the remainder of the Roanoke Basin (NC portion) and the Connecticut Basin, we used an
approach similar to Weber and Bulluck (2014). Polygons of wetlands were obtained for both basins
through the National Wetland Inventory (NWI) mapper (Table 2.2). Natural (as opposed to man-made)
wetlands were only considered and ranked if they were ditched or farmed (as opposed to

7
impounded/leveed), were proximate to conservation lands, occurred in subwatersheds that were highly
polluted or contained 303d listed waterbodies, supported species of concern, and were near Regulatory In
lieu fee and Bank Information Tracking System (RIBITS) sites (Appendix 1). Datasets for each of the
elements used to rank wetlands are provided in Table 3. We determined whether wetlands were artificial
and the type of disturbance using the Wetland Classification provided within the NWI. Using the scoring
rubric in Appendix 1, we ranked all wetlands across each basin and then summarized average wetland
scores within each NHD catchment.
8
Table 2.1. Types of off-site mitigation, their descriptions, and factors important to determining their benefit.
Mitigation Type Description Benefit Score Depends On:
Wetland mitigation Restore wetlands in areas that were
converted to other land uses or were
ditched/drainage for agricultural
practices.
Method adapted from Virginia DCR
(Weber and Bulluck 2014)
Ditched or farmed Wetlands
Proximity to conservation lands
Impaired waters present
Polluted watershed
Restoration banking program
Wetland, Aquatic, or Riparian Species of
Concern
Riparian Improvement Revegetate areas of riparian loss that
maximize existing efforts or areas of
greatest need
Riparian areas with high agriculture or
cropland
Connected to high quality habitats
Adjoining protected Lands
Aquatic or Riparian Species of Concern
Instream Habitat
restoration
Restore degraded habitats in areas
experiencing intense urbanization, road
development, and other disturbances.
Poor local habitat quality
Connected to high quality habitats
Small systems <= 50cfs
Aquatic Species of Concern
Upland Land
acquisition
Purchase/conserve/place easements on
high quality conservation land
Near existing protected land, but currently
unprotected
Forested or wetland areas
An unprotected natural heritage area of
interest
All Species of Concern
Riparian Land
acquisition
Purchase/conserve/place easements on
high quality riparian land
Currently unprotected areas joining high
quality protected lands
Forested or Wetland
Adjoining a protected river (WSR or NRI)
Riparian or Aquatic Species of Concern
Dam Removal Remove non-powered dams with low
energy potential that free up quality
riverine habitats.
Non-powered dams with little or no energy
potential
Length and size of stream miles opened up
Quality of stream habitats open up
Number of diadromous species
9
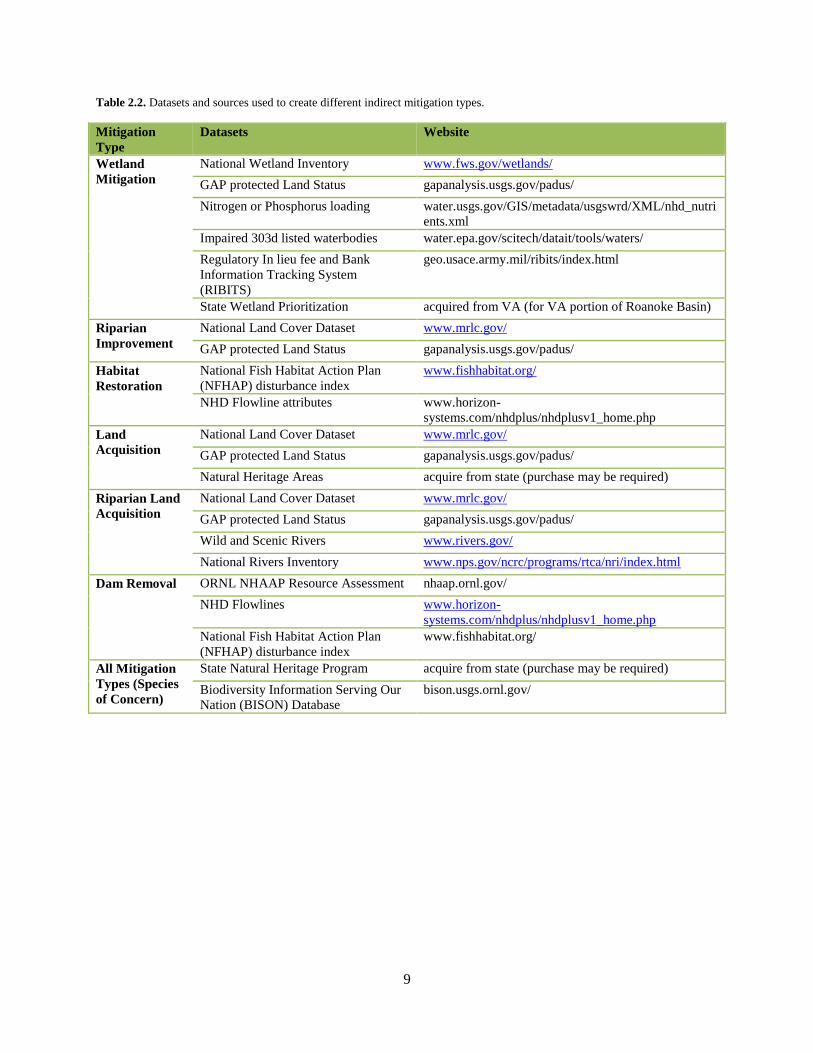
Table 2.2. Datasets and sources used to create different indirect mitigation types.
Mitigation
Type
Datasets Website
Wetland
Mitigation
National Wetland Inventory www.fws.gov/wetlands/
GAP protected Land Status gapanalysis.usgs.gov/padus/
Nitrogen or Phosphorus loading water.usgs.gov/GIS/metadata/usgswrd/XML/nhd_nutri
ents.xml
Impaired 303d listed waterbodies water.epa.gov/scitech/datait/tools/waters/
Regulatory In lieu fee and Bank
Information Tracking System
(RIBITS)
geo.usace.army.mil/ribits/index.html
State Wetland Prioritization acquired from VA (for VA portion of Roanoke Basin)
Riparian
Improvement
National Land Cover Dataset www.mrlc.gov/
GAP protected Land Status gapanalysis.usgs.gov/padus/
Habitat
Restoration
National Fish Habitat Action Plan
(NFHAP) disturbance index
www.fishhabitat.org/
NHD Flowline attributes www.horizon-
systems.com/nhdplus/nhdplusv1_home.php
Land
Acquisition
National Land Cover Dataset www.mrlc.gov/
GAP protected Land Status gapanalysis.usgs.gov/padus/
Natural Heritage Areas acquire from state (purchase may be required)
Riparian Land
Acquisition
National Land Cover Dataset www.mrlc.gov/
GAP protected Land Status gapanalysis.usgs.gov/padus/
Wild and Scenic Rivers www.rivers.gov/
National Rivers Inventory www.nps.gov/ncrc/programs/rtca/nri/index.html
Dam Removal ORNL NHAAP Resource Assessment nhaap.ornl.gov/
NHD Flowlines www.horizon-
systems.com/nhdplus/nhdplusv1_home.php
National Fish Habitat Action Plan
(NFHAP) disturbance index
www.fishhabitat.org/
All Mitigation
Types (Species
of Concern)
State Natural Heritage Program acquire from state (purchase may be required)
Biodiversity Information Serving Our
Nation (BISON) Database
bison.usgs.ornl.gov/
10
Figure 2.1. 3Hypothesized linkages between mitigation types and classes of species of concern
11
Figure 2.2. 4Examples of elemental occurrence (EO) datasets used to map locations of species of concern (top and middle). EO
datasets were used to map species observations and predict potential locations of occurrence within National
Hydrography Dataset catchments (bottom).
12
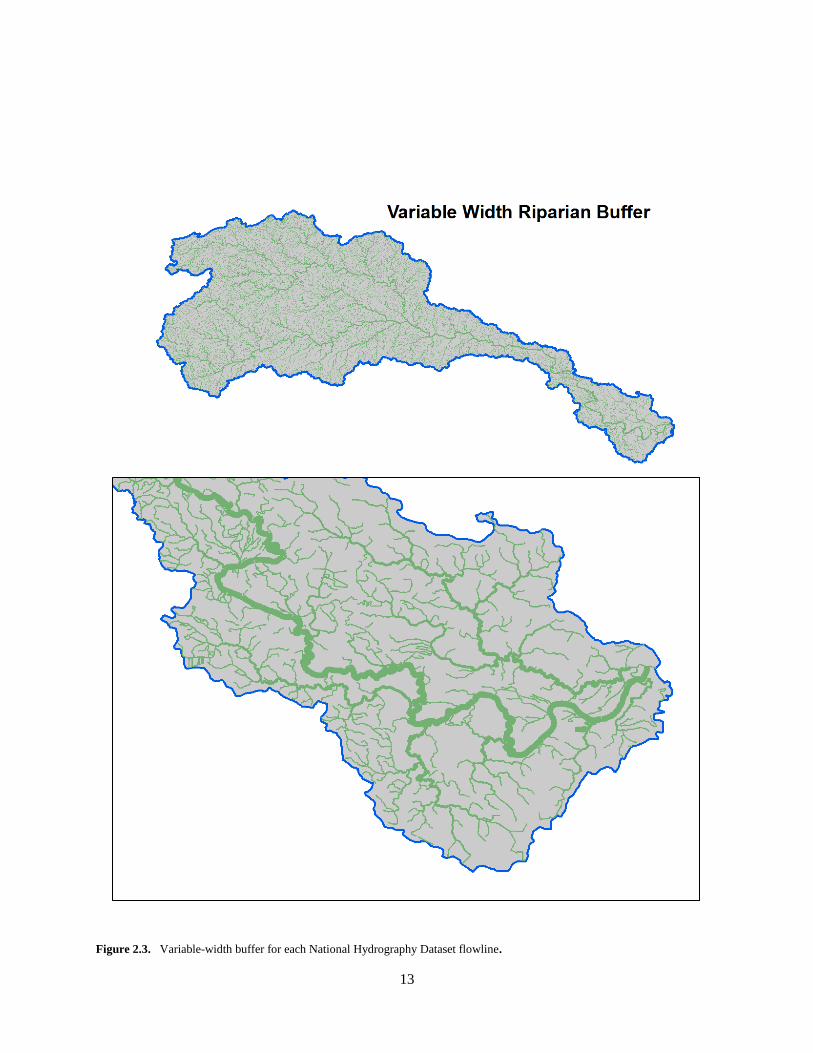
2.1.2 Riparian Improvement Riparian areas, and associated aquatic habitats, experiencing losses in streamside vegetation cover in
agricultural areas would benefit from re-vegetation or vegetation enhancement. Revegetation in
urbanizing areas was not considered for 2 main reasons: 1) the inability of isolating areas that could
realistically support revegetation, and 2) incentive programs such as, Landowner Incentive Program or
Conservation Reserve Enhancement Program are only applicable to farm owners, i.e. agricultural lands.
Because the width of riparian areas, and associated floodplains, will increase with river size, a variable-
width buffer was produced for NHD flowlines based on annual flow (Figure 2.3). The minimum and
maximum buffer sizes were set to 100 and 500m, respectively. Annual flow for each NHD flowline was
rescaled from 0 to 1 by dividing by the maximum flow value for the entire basin. The ratio was then
multiplied by 500 (max buffer) to calculate buffer widths for each flowline, with the smallest buffer being
set at 100m. Using the National Land Cover dataset (NLCD), the percentage of areas falling within
different land use categories was summarized within each buffer segment.
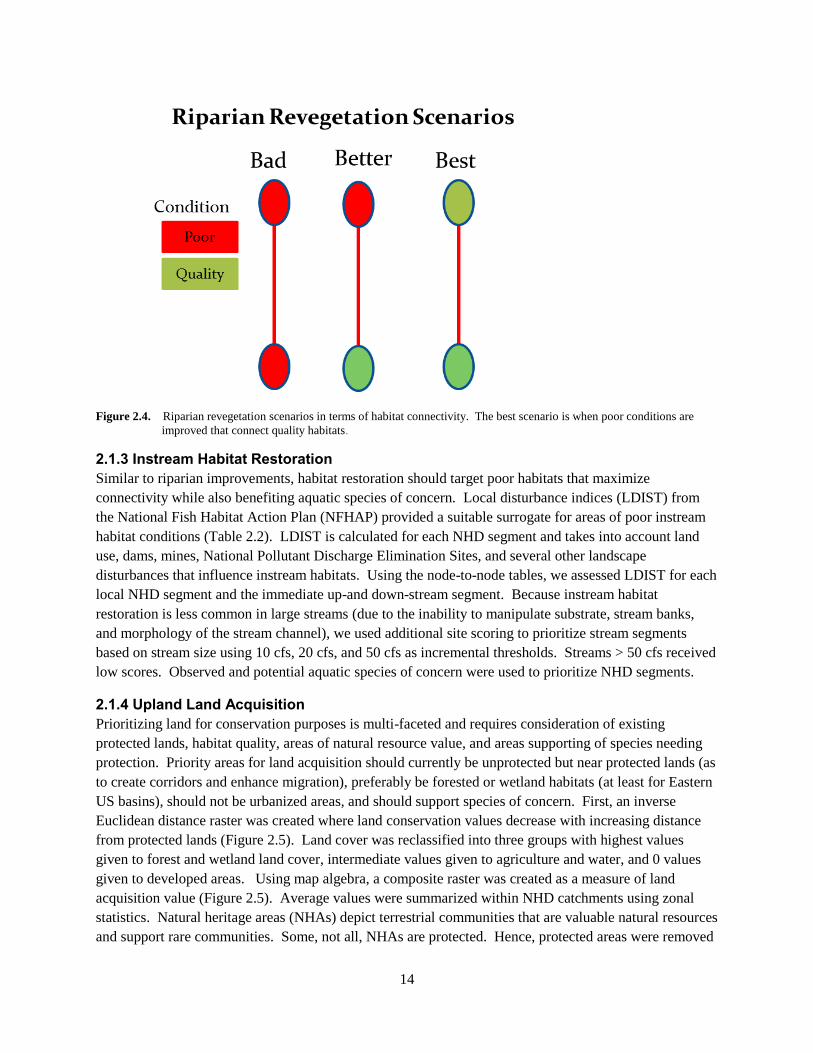
Segments with high amounts of pasture or crop production land uses were assumed to be more
suitable to revegetation. However, riparian improvement should also be dependent upon whether the
stream reach connects high quality habitats as opposed to just the immediate condition within the stream
reach of interest. We prioritized stream reaches with poor riparian conditions that, if restored, would
connect areas of quality habitats to create corridors that enhance migration and connectivity (Figure 2.4).
Likewise, we assumed areas adjoining protected lands provide similar benefits. The NHD dataset
provides the up-and-downstream connectivity of stream segments through unique identifiers for each
stream reach through node-to-node linkage tables. Hence, we summarized the land cover within each
stream reach, but also land cover in the immediate up-and-down reaches. Lastly, we summarized the
number of observed and potential riparian and aquatic species of concern within each stream segment.
13
Figure 2.3. 5Variable-width buffer for each National Hydrography Dataset flowline.
14
Figure 2.4. 6Riparian revegetation scenarios in terms of habitat connectivity. The best scenario is when poor conditions are
improved that connect quality habitats.
2.1.3 Instream Habitat Restoration Similar to riparian improvements, habitat restoration should target poor habitats that maximize
connectivity while also benefiting aquatic species of concern. Local disturbance indices (LDIST) from
the National Fish Habitat Action Plan (NFHAP) provided a suitable surrogate for areas of poor instream
habitat conditions (Table 2.2). LDIST is calculated for each NHD segment and takes into account land
use, dams, mines, National Pollutant Discharge Elimination Sites, and several other landscape
disturbances that influence instream habitats. Using the node-to-node tables, we assessed LDIST for each
local NHD segment and the immediate up-and down-stream segment. Because instream habitat
restoration is less common in large streams (due to the inability to manipulate substrate, stream banks,
and morphology of the stream channel), we used additional site scoring to prioritize stream segments
based on stream size using 10 cfs, 20 cfs, and 50 cfs as incremental thresholds. Streams > 50 cfs received
low scores. Observed and potential aquatic species of concern were used to prioritize NHD segments.
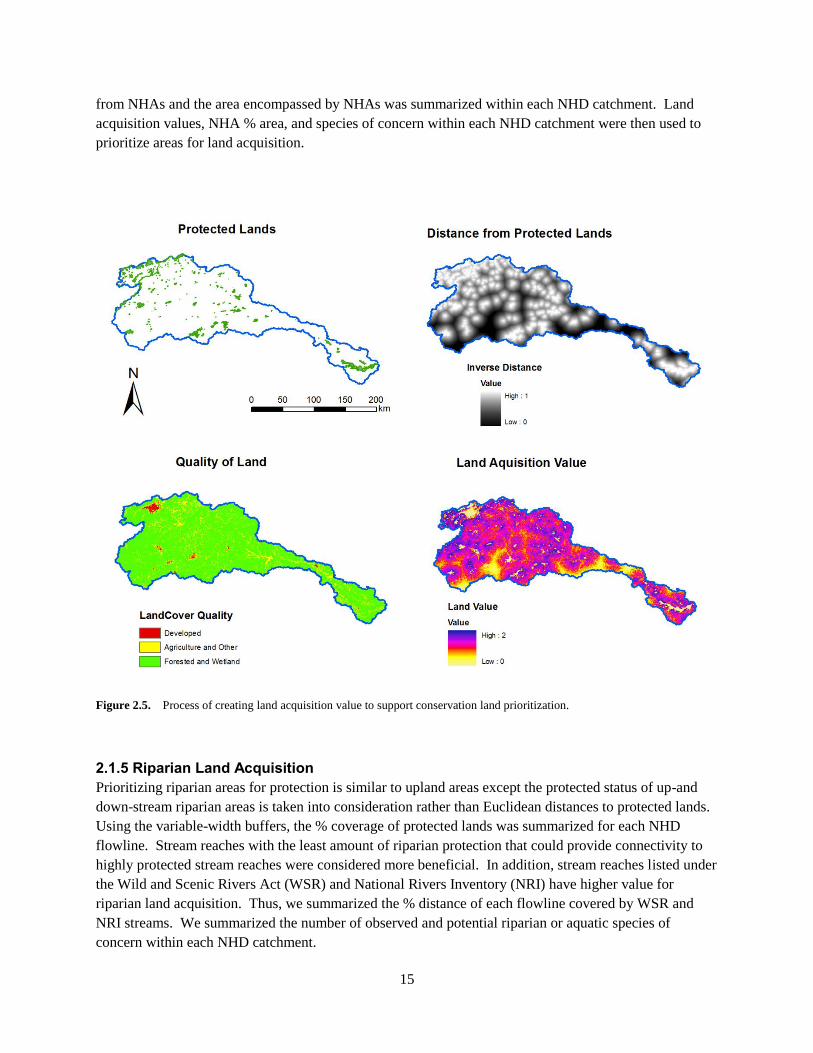
2.1.4 Upland Land Acquisition Prioritizing land for conservation purposes is multi-faceted and requires consideration of existing
protected lands, habitat quality, areas of natural resource value, and areas supporting of species needing
protection. Priority areas for land acquisition should currently be unprotected but near protected lands (as
to create corridors and enhance migration), preferably be forested or wetland habitats (at least for Eastern
US basins), should not be urbanized areas, and should support species of concern. First, an inverse
Euclidean distance raster was created where land conservation values decrease with increasing distance
from protected lands (Figure 2.5). Land cover was reclassified into three groups with highest values
given to forest and wetland land cover, intermediate values given to agriculture and water, and 0 values
given to developed areas. Using map algebra, a composite raster was created as a measure of land
acquisition value (Figure 2.5). Average values were summarized within NHD catchments using zonal
statistics. Natural heritage areas (NHAs) depict terrestrial communities that are valuable natural resources
and support rare communities. Some, not all, NHAs are protected. Hence, protected areas were removed
15
from NHAs and the area encompassed by NHAs was summarized within each NHD catchment. Land
acquisition values, NHA % area, and species of concern within each NHD catchment were then used to
prioritize areas for land acquisition.
Figure 2.5. 7Process of creating land acquisition value to support conservation land prioritization.
2.1.5 Riparian Land Acquisition Prioritizing riparian areas for protection is similar to upland areas except the protected status of up-and
down-stream riparian areas is taken into consideration rather than Euclidean distances to protected lands.
Using the variable-width buffers, the % coverage of protected lands was summarized for each NHD
flowline. Stream reaches with the least amount of riparian protection that could provide connectivity to
highly protected stream reaches were considered more beneficial. In addition, stream reaches listed under
the Wild and Scenic Rivers Act (WSR) and National Rivers Inventory (NRI) have higher value for
riparian land acquisition. Thus, we summarized the % distance of each flowline covered by WSR and
NRI streams. We summarized the number of observed and potential riparian or aquatic species of
concern within each NHD catchment.
16
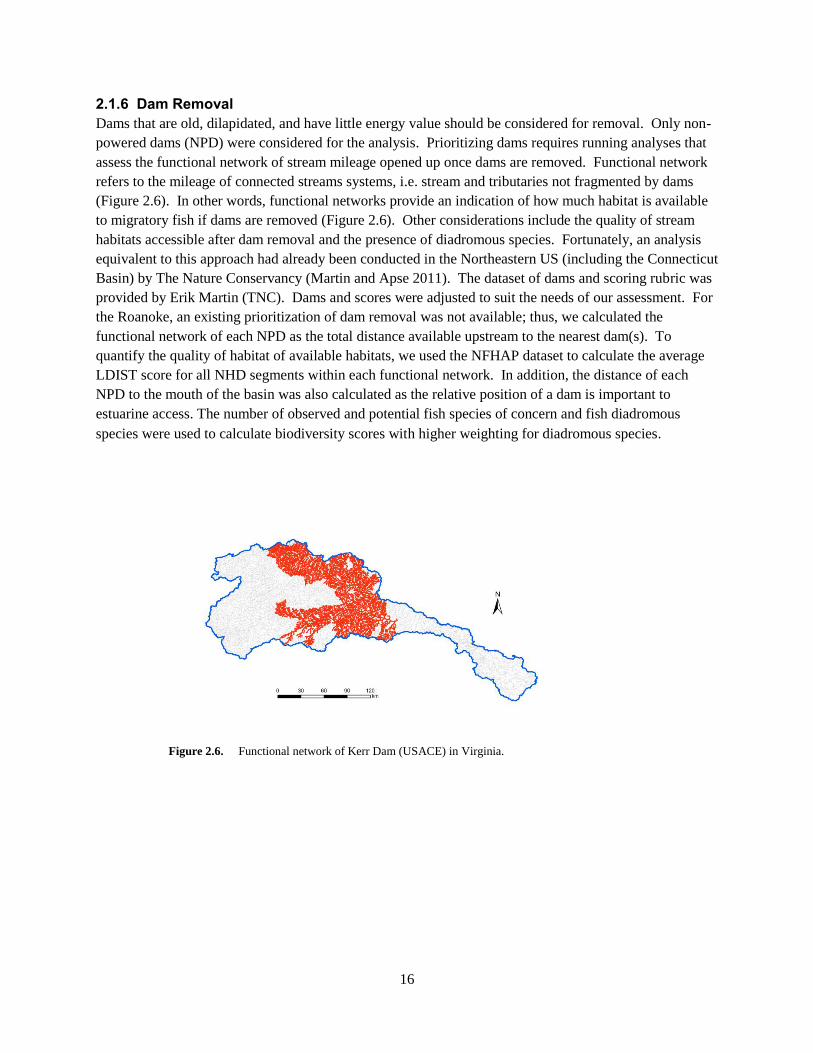
2.1.6 Dam Removal Dams that are old, dilapidated, and have little energy value should be considered for removal. Only non-
powered dams (NPD) were considered for the analysis. Prioritizing dams requires running analyses that
assess the functional network of stream mileage opened up once dams are removed. Functional network
refers to the mileage of connected streams systems, i.e. stream and tributaries not fragmented by dams
(Figure 2.6). In other words, functional networks provide an indication of how much habitat is available
to migratory fish if dams are removed (Figure 2.6). Other considerations include the quality of stream
habitats accessible after dam removal and the presence of diadromous species. Fortunately, an analysis
equivalent to this approach had already been conducted in the Northeastern US (including the Connecticut
Basin) by The Nature Conservancy (Martin and Apse 2011). The dataset of dams and scoring rubric was
provided by Erik Martin (TNC). Dams and scores were adjusted to suit the needs of our assessment. For
the Roanoke, an existing prioritization of dam removal was not available; thus, we calculated the
functional network of each NPD as the total distance available upstream to the nearest dam(s). To
quantify the quality of habitat of available habitats, we used the NFHAP dataset to calculate the average
LDIST score for all NHD segments within each functional network. In addition, the distance of each
NPD to the mouth of the basin was also calculated as the relative position of a dam is important to
estuarine access. The number of observed and potential fish species of concern and fish diadromous
species were used to calculate biodiversity scores with higher weighting for diadromous species.
Figure 2.6. 8 Functional network of Kerr Dam (USACE) in Virginia.
17
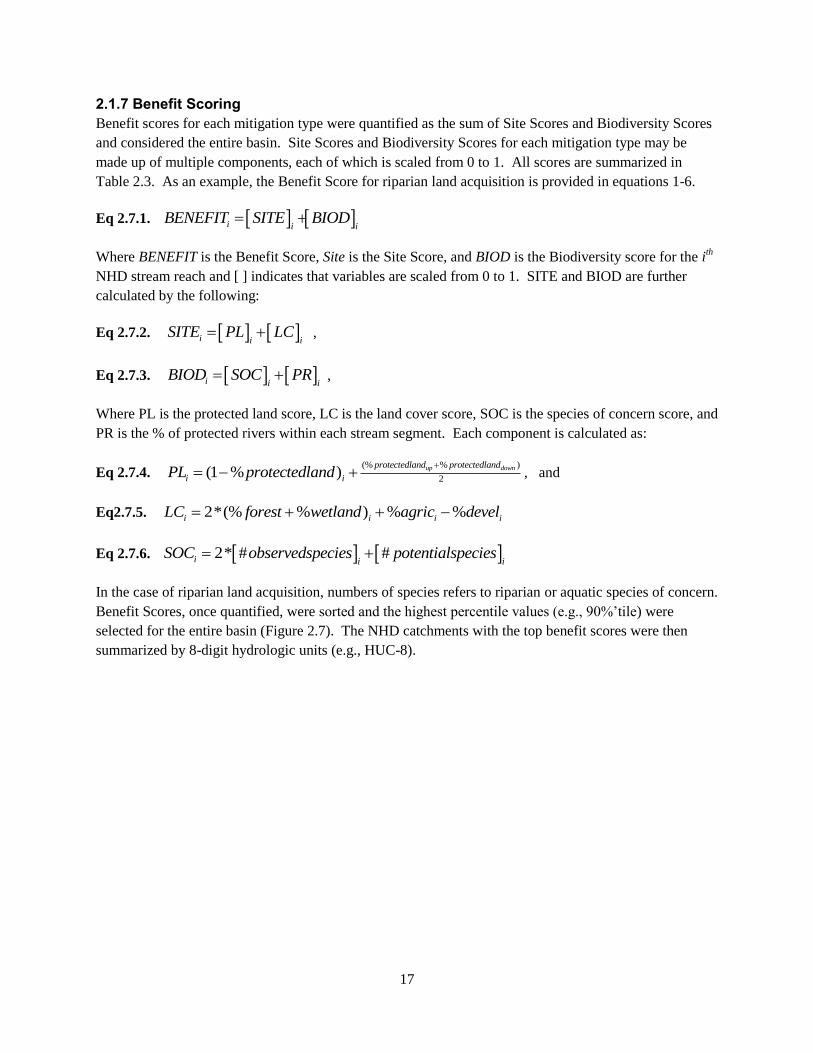
2.1.7 Benefit Scoring Benefit scores for each mitigation type were quantified as the sum of Site Scores and Biodiversity Scores
and considered the entire basin. Site Scores and Biodiversity Scores for each mitigation type may be
made up of multiple components, each of which is scaled from 0 to 1. All scores are summarized in
Table 2.3. As an example, the Benefit Score for riparian land acquisition is provided in equations 1-6.
Eq 2.7.1. i i iBENEFIT SITE BIOD
Where BENEFIT is the Benefit Score, Site is the Site Score, and BIOD is the Biodiversity score for the ith
NHD stream reach and [ ] indicates that variables are scaled from 0 to 1. SITE and BIOD are further
calculated by the following:
Eq 2.7.2. i i iSITE PL LC ,
Eq 2.7.3. i i iBIOD SOC PR ,
Where PL is the protected land score, LC is the land cover score, SOC is the species of concern score, and
PR is the % of protected rivers within each stream segment. Each component is calculated as:
Eq 2.7.4. (% % )
2(1 % ) up downprotectedland protectedland
i iPL protectedland
, and
Eq2.7.5. 2*(% % ) % %i i i iLC forest wetland agric devel
Eq 2.7.6. 2* # #i i iSOC observedspecies potentialspecies
In the case of riparian land acquisition, numbers of species refers to riparian or aquatic species of concern.
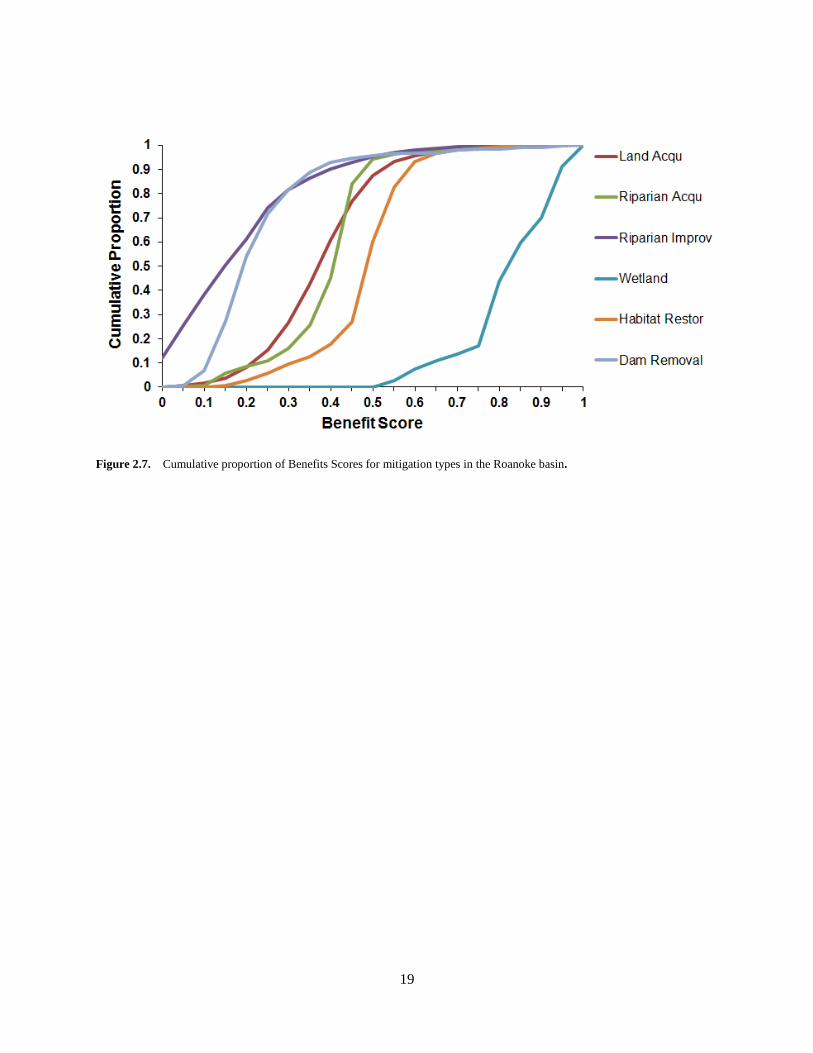
Benefit Scores, once quantified, were sorted and the highest percentile values (e.g., 90%’tile) were
selected for the entire basin (Figure 2.7). The NHD catchments with the top benefit scores were then
summarized by 8-digit hydrologic units (e.g., HUC-8).
18
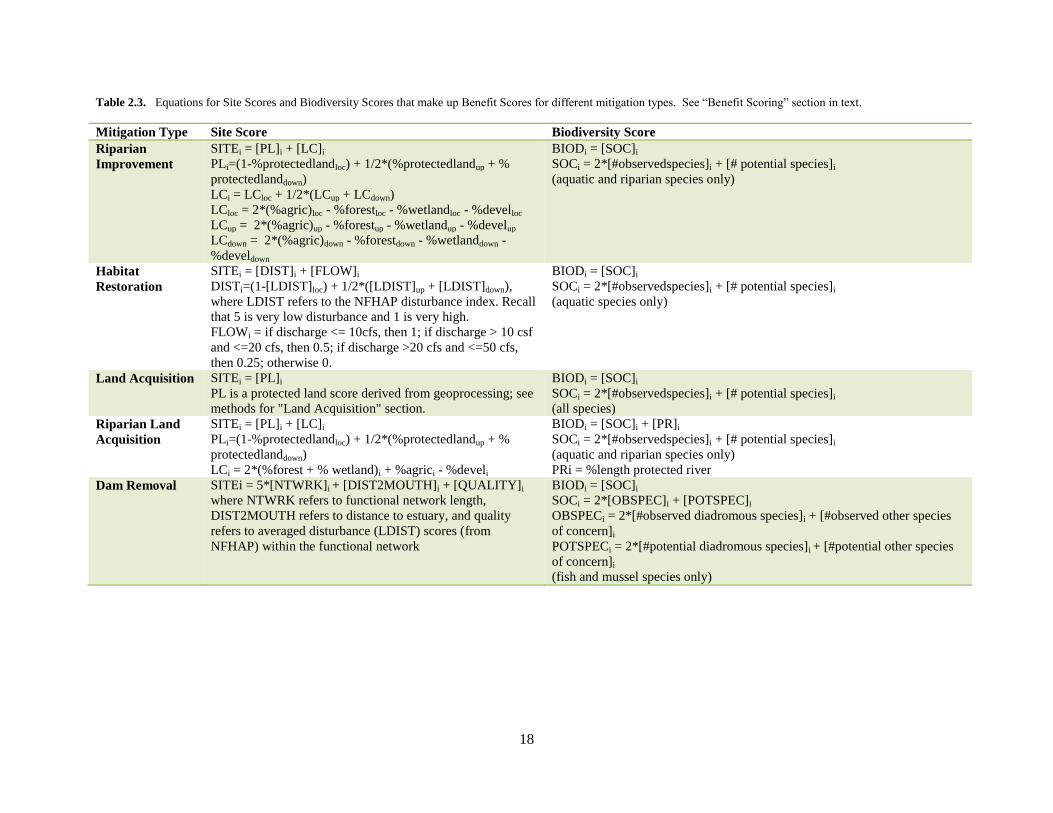
Table 2.3. 3Equations for Site Scores and Biodiversity Scores that make up Benefit Scores for different mitigation types. See “Benefit Scoring” section in text.
Mitigation Type Site Score Biodiversity Score
Riparian
Improvement
SITEi = [PL]i + [LC]i
PLi=(1-%protectedlandloc) + 1/2*(%protectedlandup + %
protectedlanddown)
LCi = LCloc + 1/2*(LCup + LCdown)
LCloc = 2*(%agric)loc - %forestloc - %wetlandloc - %develloc
LCup = 2*(%agric)up - %forestup - %wetlandup - %develup
LCdown = 2*(%agric)down - %forestdown - %wetlanddown -
%develdown
BIODi = [SOC]i
SOCi = 2*[#observedspecies]i + [# potential species]i
(aquatic and riparian species only)
Habitat
Restoration
SITEi = [DIST]i + [FLOW]i
DISTi=(1-[LDIST]loc) + 1/2*([LDIST]up + [LDIST]down),
where LDIST refers to the NFHAP disturbance index. Recall
that 5 is very low disturbance and 1 is very high.
FLOWi = if discharge <= 10cfs, then 1; if discharge > 10 csf
and <=20 cfs, then 0.5; if discharge >20 cfs and <=50 cfs,
then 0.25; otherwise 0.
BIODi = [SOC]i
SOCi = 2*[#observedspecies]i + [# potential species]i
(aquatic species only)
Land Acquisition SITEi = [PL]i
PL is a protected land score derived from geoprocessing; see
methods for "Land Acquisition" section.
BIODi = [SOC]i
SOCi = 2*[#observedspecies]i + [# potential species]i
(all species)
Riparian Land
Acquisition
SITEi = [PL]i + [LC]i
PLi=(1-%protectedlandloc) + 1/2*(%protectedlandup + %
protectedlanddown)
LCi = 2*(%forest + % wetland)i + %agrici - %develi
BIODi = [SOC]i + [PR]i
SOCi = 2*[#observedspecies]i + [# potential species]i
(aquatic and riparian species only)
PRi = %length protected river
Dam Removal SITEi = 5*[NTWRK]i + [DIST2MOUTH]i + [QUALITY]i
where NTWRK refers to functional network length,
DIST2MOUTH refers to distance to estuary, and quality
refers to averaged disturbance (LDIST) scores (from
NFHAP) within the functional network
BIODi = [SOC]i
SOCi = 2*[OBSPEC]i + [POTSPEC]i
OBSPECi = 2*[#observed diadromous species]i + [#observed other species
of concern]i
POTSPECi = 2*[#potential diadromous species]i + [#potential other species
of concern]i
(fish and mussel species only)
19
Figure 2.7. 9Cumulative proportion of Benefits Scores for mitigation types in the Roanoke basin.
20
2.2 Social Emphasis While Benefit Scores represent an ecological valuation of potential areas for mitigation, they do not take
into account social importance or social values. The likelihood of successfully executing an
environmental improvement project depends on social acceptance, such as whether communities will
accept a given mitigation as compensation for on-site/direct environmental degradation associated with
increases in hydropower generation. Social acceptance of mitigation measures depends on many factors,
such as the type of mitigation measure, the extent of disturbance that induces a need for compensation,
the distance between the area of disturbance and the site of mitigation, and the geographical location of
mitigation within a region (e.g., coast versus upland). Determining social acceptance and willingness to
accept a measure as compensation is difficult to quantify and would require, in the least, resource-
intensive surveys of stakeholder values.
In contrast to measuring social acceptance, social emphasis can be used as a surrogate of the relative
social value of different mitigation types. Thus, to reemphasize, we do not propose that we can
understand what constitutes acceptable “compensation”; however, we can estimate whether one
mitigation type has greater social value than another. Estimating social values are important when
comparing potential competing benefits, prioritizing different mitigation types, or calculating potential
cumulative benefits.
We can objectively determine social values by assuming that the frequency of documented mitigation
types or documented environmental issues is an indication of social values within a region. We used an
eco-evidence-based literature review approach to document the frequency of mitigation types and
prevalence of studies assessing environmental issues. Eco-evidence approaches, originally developed by
epidemiologists in the 1960s, rely on extensive literature review to demonstrate support for hypothesized
cause-effect relationships in environmental investigations (Norris et al. 2012). Systematic reviews of
literature and associated weighting schemes, based on the strength of each piece of evidence, are used to
estimate support for a given cause-effect relationship (Norris et al. 2012). In our case, support is assessed
as prevalence of a given action within a geographic area as opposed to hypothetical relationships. The
approach we present examines two concepts related to social emphasis. First, we evaluate the overall
prevalence of mitigation type and environmental issues within basins using a modified eco-evidence
approach based on documentation (literature or web material). Secondly, by extracting geospatial
locations from documents, we evaluate spatial variation in social emphasis by mapping the prevalence of
mitigation actions or environmental issues in the landscape.
2.2.1 Literature Review The objective of the literature review was to compile and categorize literature for the purpose of
characterizing the relative need/perceived importance of seven types of on- and off-site opportunities for
environmental mitigation in the Roanoke basin (Table 2.4). We used a three-tiered approach to compile
information that ranged in scientific rigor from peer-reviewed scientific literature to gray literature from
government sources to non-peer-reviewed documents and reliable webpages (e.g., .org or .gov). First, we
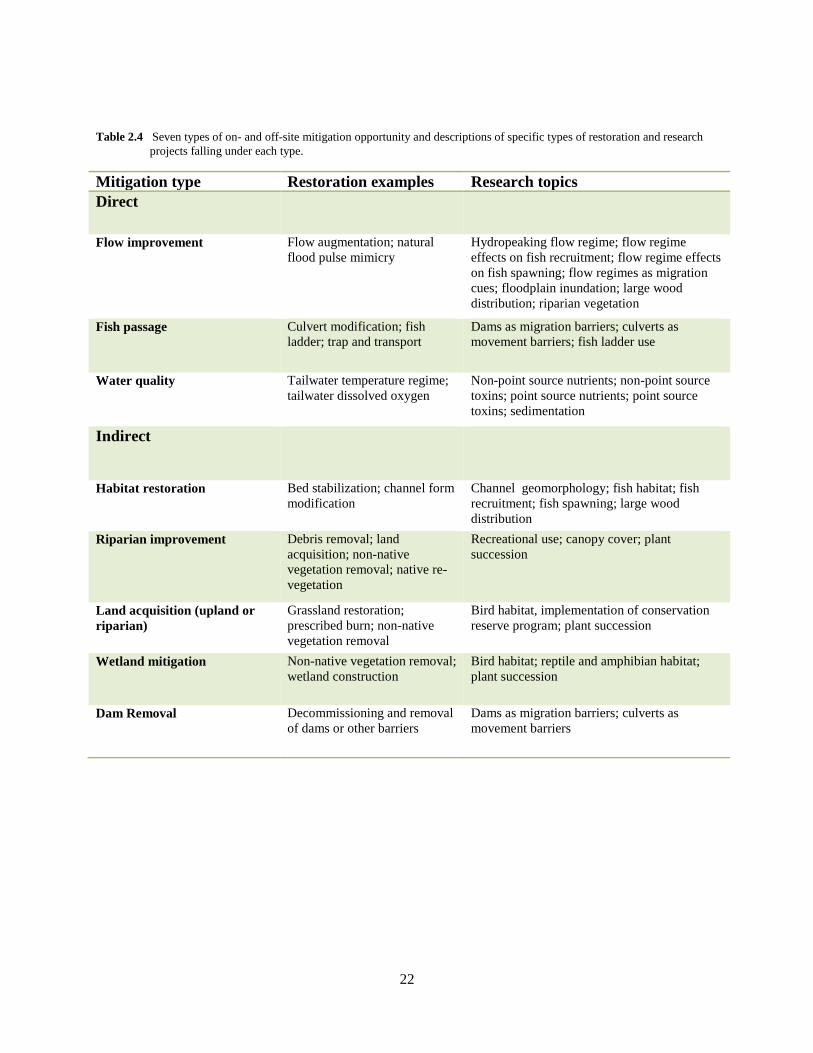
searched ISI Web of Science for peer-reviewed literature using keywords associated with each basin and
each type of environmental opportunity (https://apps.webofknowledge.com). For each mitigation type, we
began with the most relevant keywords and carried out searches with additional keywords until no new
literature documents were identified (Table 2.5). Second, we searched two online databases for gray
literature. The Clearinghouse for Dam Removal Information (CDRI) is a database documenting dam
21
removal projects (http://library.ucr.edu/wrca/collections/cdri/). We searched the CDRI database using the
following geographic keywords: “Roanoke River”, “Virginia”, and “North Carolina”. The National
Oceanic and Atmospheric Administration (NOAA) maintains a database of georeferenced restoration
projects (https://restoration.atlas.noaa.gov). We used the restoration atlas tool provided by NOAA to
identify all completed and ongoing restoration projects within each basin. Third, we systematically
searched webpages of stakeholders for documentation of environmental mitigation projects. A
comprehensive list of stakeholders with known interest in environmental mitigation within each basin was
identified in previous steps of the BSOA project (Johnson et al. 2013).
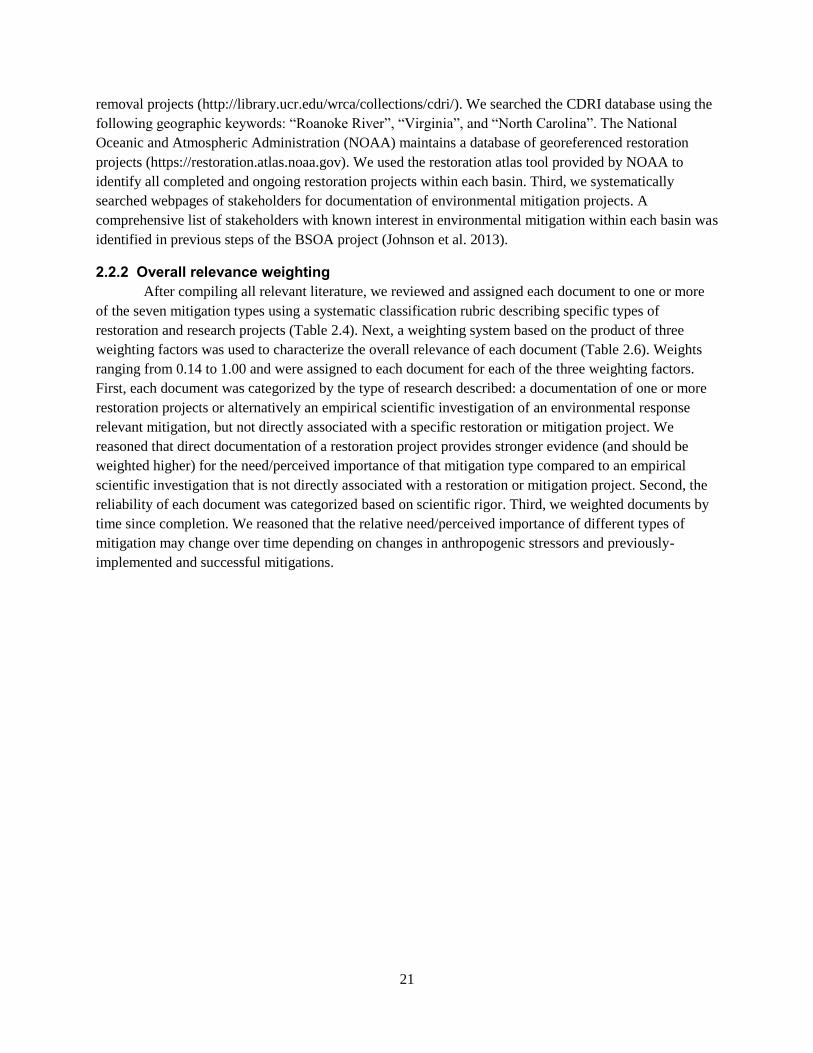
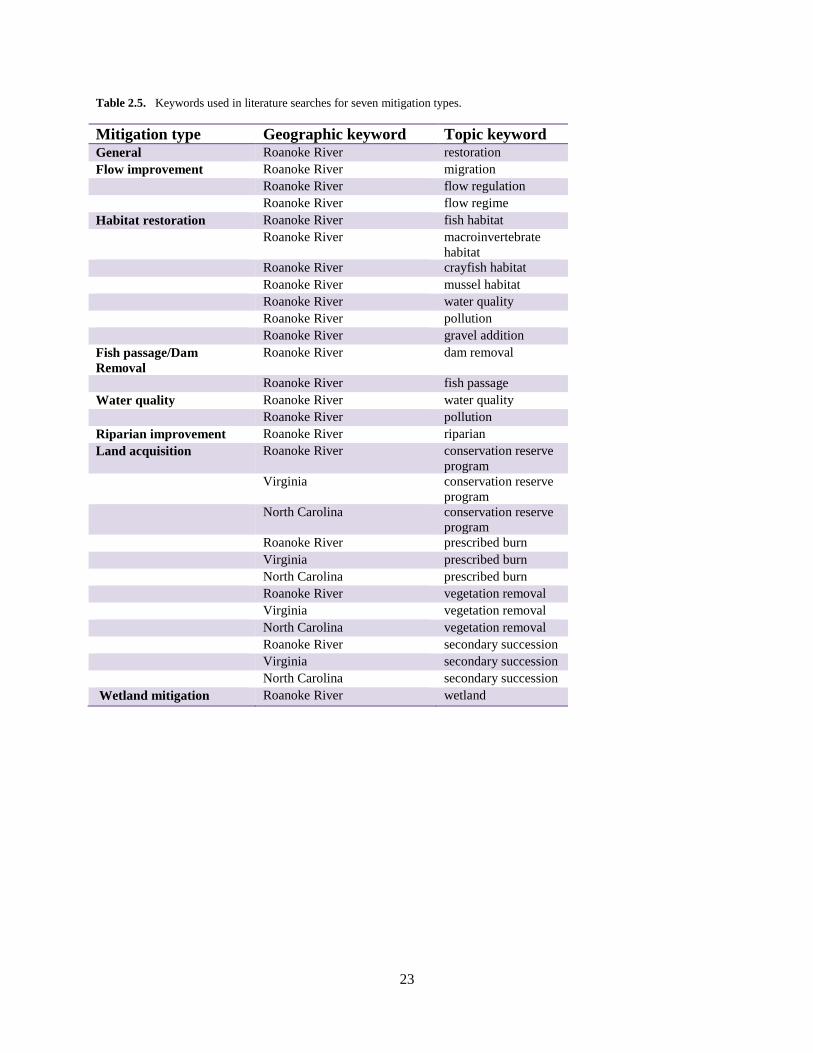
2.2.2 Overall relevance weighting After compiling all relevant literature, we reviewed and assigned each document to one or more
of the seven mitigation types using a systematic classification rubric describing specific types of
restoration and research projects (Table 2.4). Next, a weighting system based on the product of three
weighting factors was used to characterize the overall relevance of each document (Table 2.6). Weights
ranging from 0.14 to 1.00 and were assigned to each document for each of the three weighting factors.
First, each document was categorized by the type of research described: a documentation of one or more
restoration projects or alternatively an empirical scientific investigation of an environmental response
relevant mitigation, but not directly associated with a specific restoration or mitigation project. We
reasoned that direct documentation of a restoration project provides stronger evidence (and should be
weighted higher) for the need/perceived importance of that mitigation type compared to an empirical
scientific investigation that is not directly associated with a restoration or mitigation project. Second, the
reliability of each document was categorized based on scientific rigor. Third, we weighted documents by
time since completion. We reasoned that the relative need/perceived importance of different types of
mitigation may change over time depending on changes in anthropogenic stressors and previously-
implemented and successful mitigations.
22
Table 2.4 4Seven types of on- and off-site mitigation opportunity and descriptions of specific types of restoration and research
projects falling under each type.
Mitigation type Restoration examples Research topics
Direct
Flow improvement Flow augmentation; natural
flood pulse mimicry
Hydropeaking flow regime; flow regime
effects on fish recruitment; flow regime effects
on fish spawning; flow regimes as migration
cues; floodplain inundation; large wood
distribution; riparian vegetation
Fish passage Culvert modification; fish
ladder; trap and transport
Dams as migration barriers; culverts as
movement barriers; fish ladder use
Water quality Tailwater temperature regime;
tailwater dissolved oxygen
Non-point source nutrients; non-point source
toxins; point source nutrients; point source
toxins; sedimentation
Indirect
Habitat restoration Bed stabilization; channel form
modification
Channel geomorphology; fish habitat; fish
recruitment; fish spawning; large wood
distribution
Riparian improvement Debris removal; land
acquisition; non-native
vegetation removal; native re-
vegetation
Recreational use; canopy cover; plant
succession
Land acquisition (upland or
riparian)
Grassland restoration;
prescribed burn; non-native
vegetation removal
Bird habitat, implementation of conservation
reserve program; plant succession
Wetland mitigation Non-native vegetation removal;
wetland construction
Bird habitat; reptile and amphibian habitat;
plant succession
Dam Removal Decommissioning and removal
of dams or other barriers
Dams as migration barriers; culverts as
movement barriers
23
Table 2.5. 5Keywords used in literature searches for seven mitigation types.
Mitigation type Geographic keyword Topic keyword General Roanoke River restoration
Flow improvement Roanoke River migration
Roanoke River flow regulation
Roanoke River flow regime
Habitat restoration Roanoke River fish habitat
Roanoke River macroinvertebrate
habitat
Roanoke River crayfish habitat
Roanoke River mussel habitat
Roanoke River water quality
Roanoke River pollution
Roanoke River gravel addition
Fish passage/Dam
Removal
Roanoke River dam removal
Roanoke River fish passage
Water quality Roanoke River water quality
Roanoke River pollution
Riparian improvement Roanoke River riparian
Land acquisition Roanoke River conservation reserve
program
Virginia conservation reserve
program
North Carolina conservation reserve
program
Roanoke River prescribed burn
Virginia prescribed burn
North Carolina prescribed burn
Roanoke River vegetation removal
Virginia vegetation removal
North Carolina vegetation removal
Roanoke River secondary succession
Virginia secondary succession
North Carolina secondary succession
Wetland mitigation Roanoke River wetland
24
Table 2.6. Weighting system used to characterize overall relevance of each literature document.
Weighting factor Weighting classification Score Research type Restoration 1.00
Empirical research 0.50
Scientific rigor Peer-reviewed journal
article
1.00
Peer-reviewed book
chapter
0.66
Conference proceeding 0.66
Gov. report / gray
literature
0.66
Stakeholder webpage 0.33
Year completed 2005 – ongoing 1.00
1995 – 2004 0.86
1985 – 1994 0.71
1975 – 1984 0.57
1965 – 1974 0.43
1955 – 1964 0.29
1950 – 1954 0.14
(min – max) 0.023 – 1.00
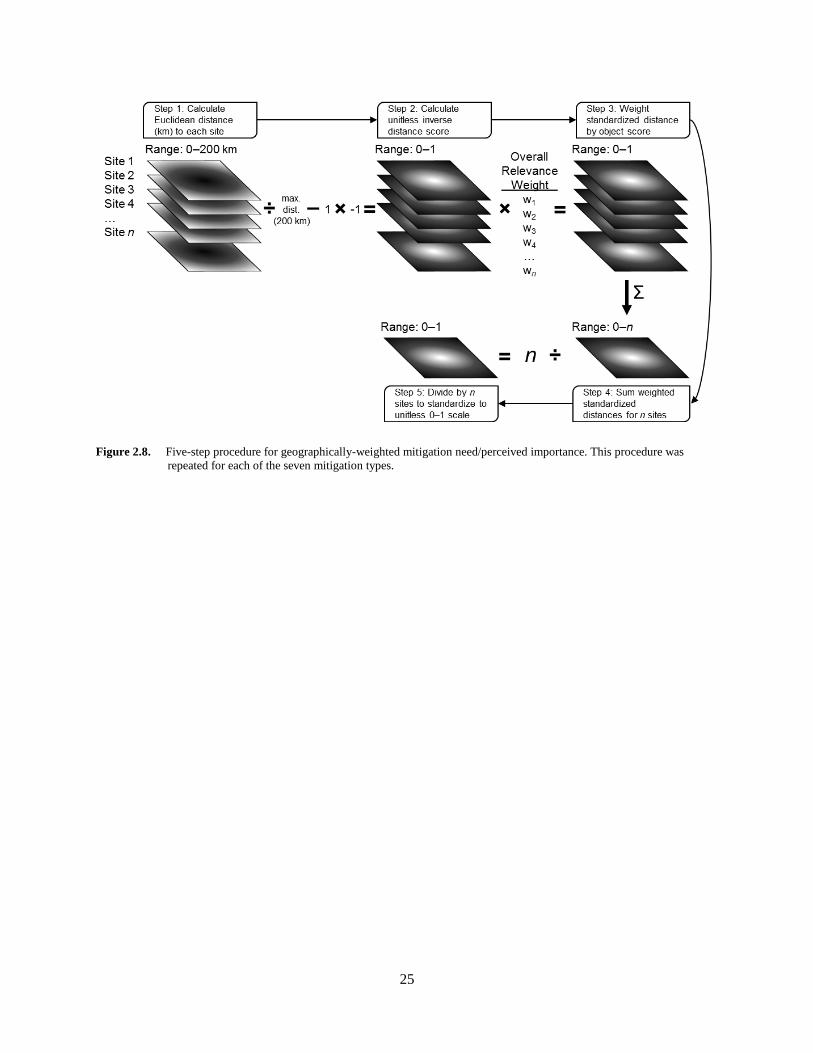
2.2.3 Geographic weighting In addition to the ‘overall relevance’ weighting scheme, we also weighted restoration projects or
restoration-related research based on their location within each basin. This geographic weighting
approach is important for identifying spatial variation in the relative need/perceived importance of each
mitigation type. For example, fish passage for anadromous species and coastal wetland improvement are
more important in the lower basin compared to the upper basin. Locations of projects were identified for
each document using geographic coordinates if provided. If coordinates were not provided, site
descriptions and/or site maps were used to identify locations. In cases where two or more sites were
restored or researched, locations were identified for all sites. For each of the seven mitigation types, a
raster dataset was created that contained spatially-continuous (~30 m raster cell resolution) geographic
weights. These rasters were developed in ArcMap using a five-step procedure (Figure 2.8). First, the
geographic coordinates of each site was displayed in ArcMap (Figure 2.8, 2.9-top) and a separate raster
dataset was created showing Euclidean distances from that site to each raster cell. This was repeated for
each site. Second, raster cell values were standardized from 0 to 1 and converted distance indices to
proximity indices (i.e., higher values for cells nearer to the site). Third, raster cells were multiplied by the
documents overall relevance weight. Fourth, all raster datasets were summed to create a single raster
dataset containing cell values representing both the overall relevance of the projects as well as their
geographic locations. Fifth, the cell values were divided by the number of sites to standardize cell values
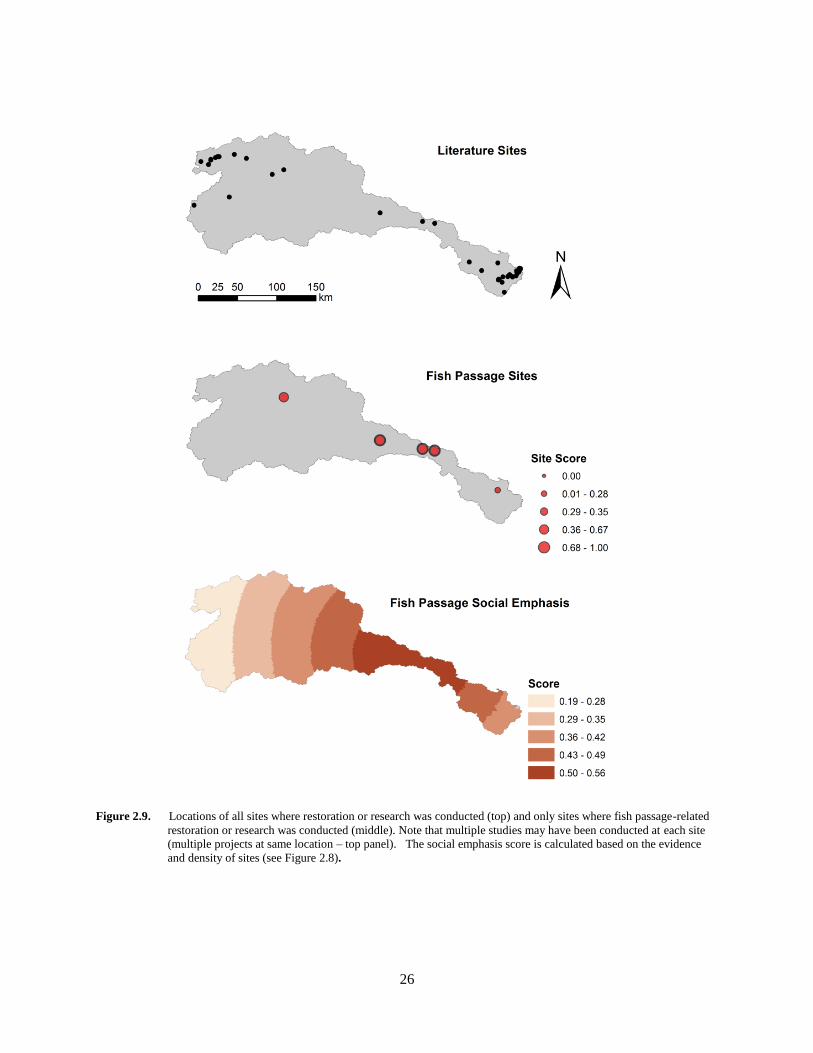
from 0 to 1. An example of the geographic weighting process is provided in Figure 2.9.
25
Figure 2.8. 10Five-step procedure for geographically-weighted mitigation need/perceived importance. This procedure was
repeated for each of the seven mitigation types.
26
Figure 2.9. 11Locations of all sites where restoration or research was conducted (top) and only sites where fish passage-related
restoration or research was conducted (middle). Note that multiple studies may have been conducted at each site
(multiple projects at same location – top panel). The social emphasis score is calculated based on the evidence
and density of sites (see Figure 2.8).
27
2.3 Identifying indirect win-win opportunities Within the preliminary Phase 1 assessment, a data model was used to identify direct hydropower-
environmental opportunities based on spatial overlap, i.e. intersection with the same national hydrography
dataset catchment (Figure 1.1). However, the data model can also be used to identify indirect
hydropower-environmental opportunities with the condition that hydrologic units are larger than the entire
project. According to the Department of Defense, an 8-digit or 6-digit hydrologic unit code is the
appropriate size of a mitigation bank service area to offset impacts of any harmful impact or development
(DOD-EPA 2008). A larger area ensures that indirect environmental opportunities are selected that
maximize ecological and social benefits. Also, indirect hydropower-environmental opportunities can be
selected similarly to direct opportunities using a similar structured query to that found in Johnson et al.
(2013).
Because indirect opportunities are measured by Benefit Scores and Social emphasis scores, the
top 90th percentile scores within each indirect opportunity type can be selected as environmental
opportunities. In addition Benefit Scores and Social Emphasis scores can be combined to create
cumulative benefits. The geospatial data model can be used to summarize hydropower opportunities and
environmental opportunities within HUC-8 watersheds based on various scoring metrics. In this case,
hydropower opportunities can be prioritized along with the best indirect environmental opportunities
based on the occurrence within the same watershed.
3.0 Conclusions Herein, we provided a methodology to augment the existing Basin Scale Opportunity Assessment Phase 1
scoping assessment. The inclusion of indirect opportunities expands the scope of the existing BSOA
process by considering potential environmental improvements well outside the project boundary but
within the immediate basin, thus supporting the ultimate mission of the BSOA. The methodology
presented also has further reaching implications, such as 1) providing environmental stakeholders with
mechanisms to prioritize restoration actions within a basin, irrespective of hydropower, and 2) an
evaluation of current policy limitations (i.e., current limitations in FERC negotiations). The strict criteria
of FERC requirements within licensing or settlement agreements may limit the type and scope of any
indirect environmental opportunities, especially if not directly related to hydropower development or
operations. Obviously, greater potential for environmental mitigation and improvements may be
indirectly related to a specific project or hydropower development because indirect environmental
opportunities are pervasive and do not rely on direct geographic affiliation with hydropower actions. The
full potential of “win/win” scenarios may be underestimated if based solely on spatial overlap and thus
requires prioritizing conservation and sociocultural needs at the scale of the entire basin.
28
4.0. References
DOD-EPA (Department of Defense – Army Corps of Engineers, Environmental Protection Agency).
2008. Compensatory mitigation for losses of aquatic resources. Federal Register 73 (No. 70). 33 CFR
Parts 325 and 332; 40 CFR Part 230. 10 April, 2008. Washington, D.C.
FERC (Federal Energy Regulatory Commission). 2006. Policy statement on hydropower licensing
settlments. Settlements in Hydropower Licensing Proceedings under Part I of the Federal Power Act.
Docket No. PL06-5-000. Issued 21 September, 2006. Washington, D.C.
FERC (Federal Energy Regulatory Commission). 2012a. A guide to understanding and applying the
integrated licensing process study criteria. Federal Energy Regulatory Commission Office of Energy
Projects. March 2012. Accessed online 13 Jan 2015 at: http://www.ferc.gov/industries/hydropower/gen-
info/guidelines/guide-study-criteria.pdf.
FERC (Federal Energy Regulatory Commission). 2012b. Integrated Licensing Process (ILP). Accessed
online 13 Jan 2015 at: http://www.ferc.gov/industries/hydropower/gen-info/licensing/ilp.asp
Johnson, GE, MS Bevelhimer, KB Larson, JD Tagestad, JW Saulsbury, RA McManamay, CA
Duberstein, CR DeRolph, SL Hetrick, BT Smith, and SH Geerlofs. 2013. The Integrated Basin-Scale
Opportunity Assessment Initiative: Phase 1 Methodology and Preliminary Scoping Assessments for the
Connecticut River and Roanoke River Basins. Annual Report.
Martin, E.H., and C.A. Apse. 2011. Northeast Aquatic Connectivity: An assessment of dams on
Northeastern rivers. The Nature Conservancy, Eastern Freshwater Program. 102pp. Accessed online 13
January 2015 at: http://rcngrants.org/sites/default/files/final_reports/NEAquaticConnectivity_Report.pdf
Norris, R. H. J. A. Webb, S. J. Nichols, M. J. Stewardson, and E. T. Harrison. 2014. Analyzing cause and
effect in environmental assessments: using weighted evidence from the literature. Freshwater Science 31:
5–21.
Weber, J. T., and J. F. Bulluck. 2014. Virginia Wetlands Catalog: An Inventory of Wetlands and Potential
Wetlands with Prioritization Summaries for Conservation and Restoration Purposes by Parcel,
Subwatershed, and Wetland Boundaries. Natural Heritage Technical Report 14-4. Virginia Department of
Conservation and Recreation, Division of Natural Heritage. October 2014. Richmond, Virginia 49 pp.
29
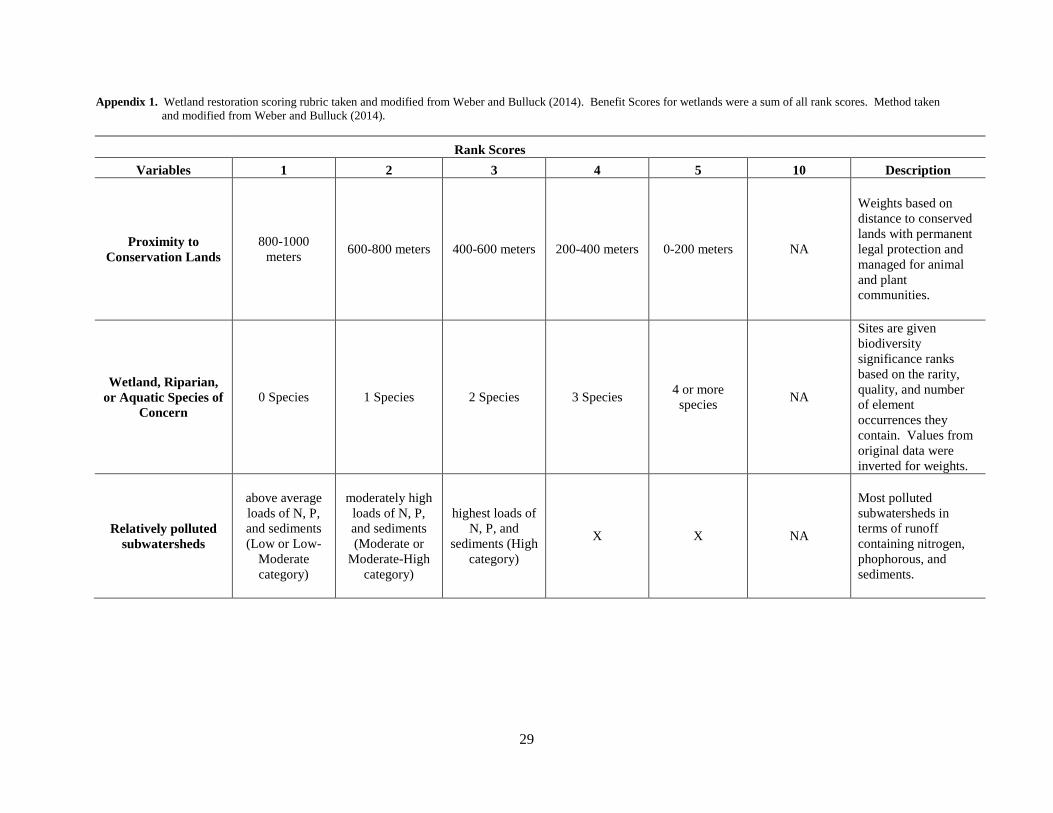
Appendix 1. Wetland restoration scoring rubric taken and modified from Weber and Bulluck (2014). Benefit Scores for wetlands were a sum of all rank scores. Method taken
and modified from Weber and Bulluck (2014).
Rank Scores
Variables 1 2 3 4 5 10 Description
Proximity to
Conservation Lands
800-1000
meters 600-800 meters 400-600 meters 200-400 meters 0-200 meters NA
Weights based on
distance to conserved
lands with permanent
legal protection and
managed for animal
and plant
communities.
Wetland, Riparian,
or Aquatic Species of
Concern
0 Species 1 Species 2 Species 3 Species 4 or more
species NA
Sites are given
biodiversity
significance ranks
based on the rarity,
quality, and number
of element
occurrences they
contain. Values from
original data were
inverted for weights.
Relatively polluted
subwatersheds
above average
loads of N, P,
and sediments
(Low or Low-
Moderate
category)
moderately high
loads of N, P,
and sediments
(Moderate or
Moderate-High
category)
highest loads of
N, P, and
sediments (High
category)
X X NA
Most polluted
subwatersheds in
terms of runoff
containing nitrogen,
phophorous, and
sediments.
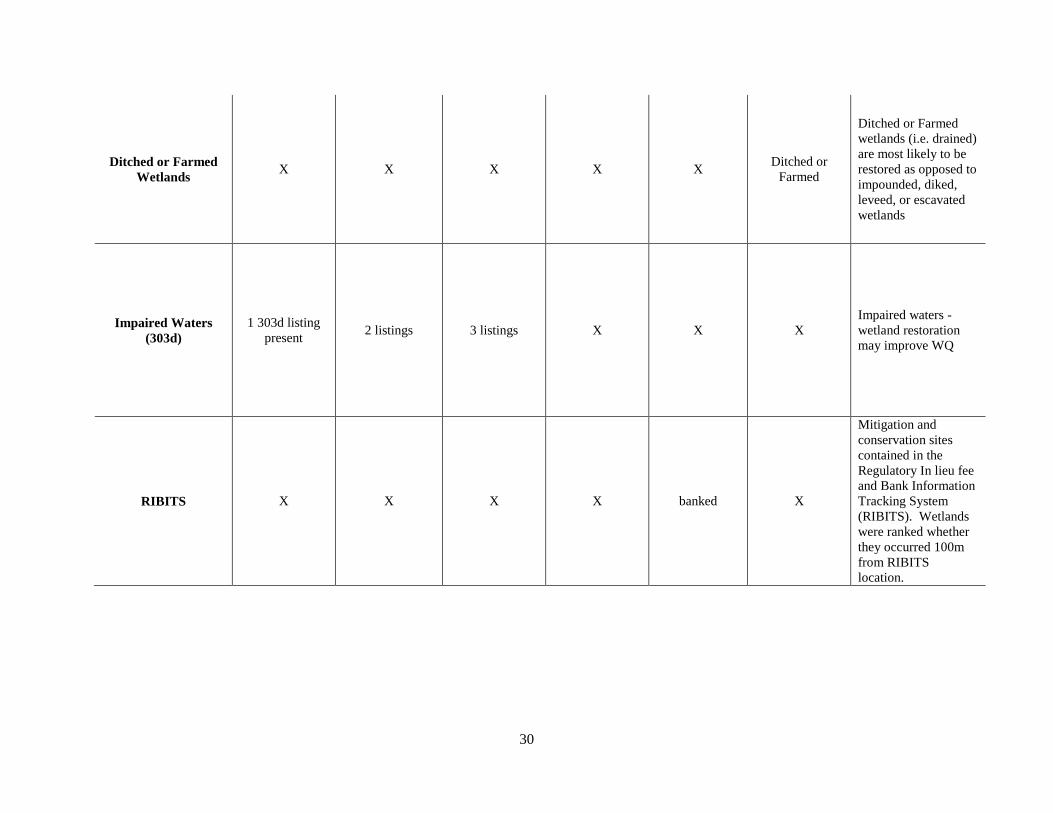
30
Ditched or Farmed
Wetlands X X X X X
Ditched or
Farmed
Ditched or Farmed
wetlands (i.e. drained)
are most likely to be
restored as opposed to
impounded, diked,
leveed, or escavated
wetlands
Impaired Waters
(303d)
1 303d listing
present 2 listings 3 listings X X X
Impaired waters -
wetland restoration
may improve WQ
RIBITS X X X X banked X
Mitigation and
conservation sites
contained in the
Regulatory In lieu fee
and Bank Information
Tracking System
(RIBITS). Wetlands
were ranked whether
they occurred 100m
from RIBITS
location.

31