Embed Size (px)
Citation preview

Journal of Environmental Economics and Management 45 (2003) 231–245
Identifying the warm glow effect in contingent valuation
Paulo A.L.D. Nunesa,b,c,* and Erik Schokkaertd
aDepartment of Spatial Economics, Vrije Universiteit, De Boelelaan 1105, 1081 HV Amsterdam, NetherlandsbCentre of Excellence for Sustainable Development, Universita Ca Foscari, Palazzo Querini Stampalia, Venice, Italy
cFondazione Eni Enrico Mattei, Campo Santa Maria Formosa, Campo S. Maria Formosa, Castello 5252, Venice, ItalydCenter for Economic Studies, Katholieke Universiteit Leuven, 69 Naamsestraat, 3000 Leuven, Belgium
Received 18 January 2001; revised 28 November 2001
Abstract
This paper reports the results from a contingent valuation study designed to investigate the influence of warmglow in willingness to pay (WTP) responses. Interindividual differences in warm glow motivation are measuredthrough a factor analysis, performed on a list of attitudinal items. The reported (WTP) measures fail to pass thescope test. Both socioeconomic variables and motivational factor scores are significant in the explanation of theindividual WTP measures. We compute ‘‘cold’’ WTP measures by taking out the effect of the warm glowmotivation. These ‘‘cold’’ measures satisfy both the scope test and Hausman’s adding-up property.r 2003 Elsevier Science (USA). All rights reserved.
JEL classification: C12; C13; C14; Q26
Keywords: Contingent valuation; Recreation; Wildlife; Willingness to pay; Warm glow
1. Introduction
One of the main points in the ongoing debate about the use of contingent valuation (CV)studies is the so-called embedding phenomenon. The embedding problem may be presentwhenever reported willingness to pay (WTP) responses fail to meet the scope test, i.e., when theWTP for two environmental goods taken together, is about the same as the WTP for one of theindividual goods, considered separately.1 It has been suggested that this valuation pattern reflects
*Corresponding author.
E-mail address: [email protected] (P.A.L.D. Nunes).1This result is a possible indication of incoherency, but not a sufficient proof. It might also occur if the two goods are perfect
substitutes and the marginal utility of additional units is zero once either of the goods is supplied, a case which cannot be
qualified as an embedding problem. Moreover, the empirical evidence is mixed. Carson [4] reviews over 30 studies using split-
sample tests, which all clearly reject the hypothesis that respondents are insensitive to the scope of the good being valued.
0095-0696/03/$ - see front matter r 2003 Elsevier Science (USA). All rights reserved.
doi:10.1016/S0095-0696(02)00051-7

that CV respondents derive moral satisfaction or a warm glow from the act of giving per se [11].Prominent critics of CV [10] hold that the embedding problem shows that CV answers do notreflect real economic preferences and should therefore not be used in cost-benefit analysis.This may be true if the embedding problem followed from incoherent responses. However,if it is indeed possible to explain it by the existence of a warm glow component, this negativeposition is debatable. After all, at least since Arrow [3] the modern theory of social choice hasemphasized that it is immaterial whether individual’s preferences reflect selfish interest or moraljudgment: ‘‘The individual may order all social states by whatever standards he deems relevant’’.Following this tradition, the warm glow may be seen as a perfectly legitimate component orsource of WTP.In this paper we present some further empirical evidence on the significance of the warm glow
effect. Our data refer to a CV survey designed to measure the economic benefits from preventingcommercial tourism development in the Alentejo Natural Park in Portugal. To investigate thewarm glow effect we included in the questionnaire a list of attitudinal items. Factor analytictechniques are used to reduce the individual items to three underlying factors that can be relatedto the use value, the existence value and the warm glow of giving. We then test whetherinterindividual variation in the factor scores for these different motivations can explain differencesin the WTP answers. We also investigate the relationship between the warm glow and theembedding phenomenon.The organization of the paper is as follows. In Section 2 we present a simple testing strategy for
the scope and the adding-up test and we propose a methodology to correct the WTP answers forthe warm glow component, i.e., to compute what we call a ‘‘cold’’ WTP measure. In Section 3 wedescribe the survey and introduce the attitudinal items and the factor analysis. In Section 4 weperform a traditional CV analysis. It turns out that the resulting WTPs do not pass the scope test.In Section 5 we refine the estimation procedure by specifying the sources of interindividualvariation in the WTP answers. The psychological motivation factors are statistically significantand this holds also for the warm glow effect. After taking out this warm glow effect, the resulting‘‘cold’’ WTP measures are lower and satisfy both the scope and the adding-up test. Section 6concludes.
2. A simple strategy to operationalize the warm glow effect
In order to focus our discussion, we consider the case of a Natural Park, consisting of awilderness area with restricted visitor’s access and a recreation area where visitors may enjoyrecreational activities in a natural environment. Three different protection programs areconsidered. In the first one, the wilderness area is protected while the recreation area is furtherdeveloped for commercial tourism. In the second one, the wilderness area is given up but therecreation area is kept intact, i.e., remains reserved for activities that are non-destructive for thenatural environment. The last one protects both the wilderness area and the recreational area. Wecall these protection programs WA, RA and (WA+RA), respectively.Since the first two programs are embedded in the last one, it is interesting to test whether the
reported values of WTP satisfy the scope test. Using the notation WTPrj to refer to the reported
P.A.L.D. Nunes, E. Schokkaert / Journal of Environmental Economics and Management 45 (2003) 231–245232

WTP for protection program j; we can formulate the two null-hypotheses:
EðWTPrWAÞ ¼ EðWTPrðWAþRAÞÞ and EðWTPrRAÞ ¼ EðWTPrðWAþRAÞÞ:
Non-rejection of these hypotheses suggests that there is a problem of incoherence of the reportedWTP values, unless one accepts the assumption that WA and RA are perfect substitutes. Criticslike Diamond et al. [5] go further and argue that ‘‘if the answers reflect economic preferences’’,they should satisfy an adding-up hypothesis, formulated as follows: EðWTPrWAÞ þ EðWTPrRAÞ ¼EðWTPrðWAþRAÞÞ: This position reflects a narrow interpretation of the concept of ‘‘economic
preferences’’. Moreover, the existence of complementarity and substitution relationships betweenWA and RA can easily lead to a rejection of the adding-up test even for a fully coherentrespondent with narrow economic preferences.As a matter of fact least since Kahneman and Knetsch [11], the idea that respondents express
only ‘‘narrow economic preferences’’ in their WTP answers has been questioned. Inspired by thework of Andreoni [1,2] and others on impure altruism, they put forward the idea that respondentspurchase moral satisfaction through their CV answers. In this approach individual consumerscontribute to the provision of a public good for two reasons. First, because they want more of thepublic good and, secondly, because they derive some private benefit from contributing to itsprovision. The latter effect may be related to social pressure, to feelings of guilt and sympathy, orsimply to the desire for a ‘‘warm glow’’. It implies that the individual’s contribution to the publicgood enters into her utility function twice: firstly, as a contribution to public good provision;secondly, as a private good. It is then plausible to argue that the reported WTP also consists ofdifferent components: one relating to the warm glow, the second to the value of the public good
itself. We call these components WTPwg and WTPcold; respectively. It is easy to show that theadding-up condition can be rejected for the reported measures, while holding perfectly at the levelof the ‘‘cold’’ measure. As a simple example, consider the additive case
WTPrj ¼ WTPcoldj þ WTPwgj j ¼WA;RA; ðWAþRAÞ
with the warm glow effect subject to rapidly declining marginal utility, such that for each
respondent WTPwgRA ¼ WTP
wgWA ¼ WTP
wgWAþRA: Even if the adding-up condition holds for the
‘‘cold’’ measures, it will be rejected for the reported WTP measures.If this description of reality makes sense, it is obvious that much progress could be made if we
were able to distinguish empirically the different components in WTP. One possible approach tothis problem (already proposed in another context by Schokkaert and Van Ootegem [18]) is toexploit the interindividual variation in the WTP and in the importance attached to the warmglow-effect.2 This interindividual variation will be related to differences in socioeconomiccharacteristics such as income, education, gender, etc. Different individuals will also differ in theirsensitivity to the warm glow effect and in the importance they attach to use and existence values.We can therefore write WTPij ¼ fjðai;miÞ; where ai refers to a vector of socioeconomic
characteristics and mi ¼ ðwgi; ui; exiÞ refers to the psychological characteristics of respondent i:
2Schkade and Payne [16,17] analyze the verbal protocols of a CV-study and find that some respondents vocalize a
parallel with charitable contributions when answering the WTP survey. Moreover, the variables from the verbal
protocol show a significant relationship with the WTP-answers.
P.A.L.D. Nunes, E. Schokkaert / Journal of Environmental Economics and Management 45 (2003) 231–245 233

the satisfaction generated by the act of giving (warm glow motivation), the importance attached tothe use or recreational value (use motivation), the utility with respect to the protection of natureindependently of recreational use (existence motivation), respectively. We will return in the nextsection to the operationalization of the vector m:In our empirical work we will work with the following semilogarithmic form:3
lnWTPrij ¼ bj þX
k
dkjaki þ dwg;jwgi þ du;jui þ dex;jexi þ eij ð1Þ
where e is a normally distributed error term and the dj’s are the coefficients to be estimated. These
coefficients relate to the amount of warm glow obtained from contributions for project j and tothe use and existence value of that same project, respectively. They are therefore specific to theproject considered and assumed equal for all individuals. The estimate of dwg;j in Eq. (1) will allow
us to test directly whether the warm glow effect plays a role in the reported WTP measures and,more specifically, whether individual respondents with different values for the warm glowcomponent (i.e., different values for wgi) indeed report different values for their WTP.We can go one step further and assess what would be the WTP of the respondents if they were
immune for the warm glow effect. Define by wgcold the minimal value of wg; i.e., the value of thewarm glow motivation for an individual who does not get any warm feeling from giving. We canthen compute for each respondent a ‘‘cold’’ WTP, i.e., the value of their WTP if they had this(minimal) warm glow motivation:
lnWTPcoldij ¼ bj þX
k
dkjaki þ dwg;jwgcold þ du;jui þ dex;jexi þ eij: ð2Þ
If the rejection of the scope test and the adding up test for the reported values of WTP can be fullyexplained by the presence of the warm glow effect, then the ‘‘cold’’ measures should satisfy thescope test. In our empirical work we will formally test this hypothesis.
3. The data: willingness to pay and consumer motivations
In Section 3.1 we will first describe the general features of the survey design. In Section 3.2 wego deeper into the calculation of the indices for the psychological motivations.
3.1. Survey design and data collection
Our empirical data are taken from a large-scale contingent valuation study with arepresentative sample of the Portuguese population. The good being valued is the protectionfrom commercial tourism development of the Recreation Areas and Wilderness Areas in theAlentejo Natural Park, covering about 180 miles along the southwest coastline of Portugal. Tostructure the WTP question we used the double bounded dichotomous choice elicitation questionformat described by Hanemann et al. [8].We used a split-sample design with different versions of the questionnaire. First, as described in
the previous section, there were three different versions, focusing on the Recreation Areas
3We will return to the reasons for the choice of this functional form in Section 4.
P.A.L.D. Nunes, E. Schokkaert / Journal of Environmental Economics and Management 45 (2003) 231–245234

protection program (RA), the Wilderness Areas protection program (WA), and the jointWilderness and Recreation Areas protection program (WA+RA), respectively. The surveyformulation of each policy protection program combined the use of narrative and visual material,including maps, photos of animals and computer generated photos of landscapes (before and aftertourist development), in order to help describing the scenarios. The narrative material was basedon multidisciplinary work, involving the participation of biologists with solid experience in thefield, and making use of all available scientific information.4 In the second place, we varied thepayment vehicle to test for free riding incentives. For part of the sample (in each of the threevariants WA, RA and (WA+RA)), the questions referred to a voluntary contribution in the formof a one-time lump-sum payment to a trust fund, for another part of the sample reference wasmade to a tax. In both cases it was explained that the money collected would only be used tofinancing the protection efforts of the Natural Park’s management agency. Statistical analysis [16]shows that the hypothesis of an equal distribution of the WTPs for the two payment vehiclescannot be rejected for the WA and WA+RA versions, but that there is some indication of freeriding in the RA-scenario. We will therefore include the payment vehicle as an explanatoryvariable in the multivariate analysis of Section 5. We use the pooled data for the univariateanalysis in Section 4.The results were obtained by a nationwide survey conducted in mid September 1997 by the
Survey Department of the Portuguese Catholic University. The survey was conducted in personby trained interviewers. A two-stage area probability sample was set up—see Thompson [19]. Inthe first stage, 37 parishes across Portugal were selected. In the second stage, a set of housing unitswas drawn. The interviewer teams paid visits to 3597 households but 21% of them could not bereached because the residents were not at home. From the households that were successfullycontacted, we received a total of 1678 completed interviews, corresponding to a participationresponse of approximately 60%. A comparison of the data of our survey with demographicstatistics available from the last Census data for Portugal (1991) indicates that the differentdemographic clusters of the Portuguese population are well covered in our sample.
3.2. Consumer motivations
A crucial aspect of our survey is the attempt to measure consumer motivations towards theprotection of nature in general, and towards the act of giving in particular. Therefore, weintroduced into the questionnaire a list of 26 attitudinal questions5 to be answered by therespondents on a five-point Likert-scale, with values ranging from 1 (for ‘‘I disagree completely’’)to 5 (for ‘‘I agree completely’’). These items were formulated so as to capture the warm glow, useand existence motivations. Through the use of an attitudinal scale we deliberately have opted for asubjectivemeasure of these motivations. An alternative would have been to use information on theactual behavior of the respondents, e.g., whether they use the resource or not or whether they
4The survey description of the WA and RA, and the respective protection benefits, were extensively probed during
two focus group sessions and pilot surveys, so that we can be reasonably sure that respondents did not see the different
programs as identical (or as perfect substitutes). More detailed information on the questionnaire and the sample design
can be found in [15].5See the appendix for an English translation of the attitudinal items selected by the factorial analysis design. The full
list used in the original Portuguese questionnaire can be found in [14].
P.A.L.D. Nunes, E. Schokkaert / Journal of Environmental Economics and Management 45 (2003) 231–245 235

spend a large proportion of their income on charitable giving. However, such behavior is alsoinfluenced by factors like the accessibility of Natural Parks or the number of times one is asked tocontribute for charity—not to mention the income position of the respondent. We felt that for thepurpose of explaining WTP answers, a direct measure of psychological motivations is preferableto behavioral indicators.In order to get internally coherent measures of these motivations we used factor analysis as a
variable reduction method—see Harman [9]. This technique is used, first to identify on the basis ofthe answers on the attitudinal questions a set of latent underlying motivations (the same for allindividuals) and second, to estimate for each respondent his or her individual motivational profile,i.e., his or her position on these latent motivations.In the first step the underlying latent motivations are identified on the basis of the correlations
between the responses on the specific attitudinal items. The model assumes that these correlationscan be explained by a linear relationship between the individual attitudinal items and a set ofunderlying latent factors. Highly correlated attitudinal items are assumed to be indicative of thesame underlying factors. The so-called factor loadings then give the product-moment correlationbetween the responses on the attitudinal items and these underlying latent factors. The latter arescaled to have mean zero and unit variance. To get a clear picture we choose an orthogonal factorrepresentation, implying that the basic consumer motivations do not overlap,6 and we opted forthe varimax rotation procedure, which maximizes the variance of the squared loadings of thedifferent items on the factors. The factor loadings after varimax rotation are shown in Table 1.Printed results are multiplied by 100 and rounded to the nearest integer. The asterisks denotevalues above 0.45.Interpretation of the factors resulting from a factor analysis is always a little subjective. Yet the
overall pattern seems clear. The items loading on factor 1 relate to the direct consumption of thenatural park for recreational use.7 Therefore, this latent variable is interpreted as the consumer‘‘use/recreation’’ motivation. Factor 2 is associated with items that capture different ‘‘privategood’’ motivations to contribute, such as the sensitivity to social pressure and campaigning effortsor the feeling of satisfaction generated by the act of giving.8 Although this ‘‘private good’’component is broader than exclusively the ‘‘warm glow’’ of giving, we designate it as the ‘‘warmglow’’ motivation. Factor 3 is associated with items related to the conservation of nature,independent of its human use and we interpret it as the consumer ‘‘non-use/existence’’motivation.9
6This way we avoid potential multicollinearity problems when estimating Eq. (1).7The two largest ones are M14: ‘‘Preservation of the Alentejo coast line is important because this is a privileged place
where all of us may enjoy going to the beach in a relaxed environment and being in contact with nature’’ and M2: ‘‘ðyÞbecause this is a place which all of us can visit and where we can see very beautiful natural landscapes’’.8The two main items are M12: ‘‘There are some funding campaigns to which my family and I feel very close and
therefore we do not hesitate to contribute a donation’’ and M23: ‘‘My family and I like to contribute to good causes
such as the protection of the environment and whenever we can afford it, we do not decline our help to such fund
raising campaigns’’.9The largest loading is for item M10: ‘‘Despite the fact that my family and I may never see an Iberian lynx in its
natural habitat, we are very happy to know that we have the guarantee that the lynx is kept safe from extinction in
Portugal’’. Items M22 and M6 convey the same idea for the eagle and the otter.
P.A.L.D. Nunes, E. Schokkaert / Journal of Environmental Economics and Management 45 (2003) 231–245236

After having defined the content of the factors, the next step is to determine the position of theindividuals on these factors, i.e., the vectors mi ¼ ðwgi; ui; exiÞ: These are given by thestandardized factor scores, again with mean zero and unit variance. The factor score of individuali on factor k basically is a weighted mean of the answers of respondent i on the attitudinal itemsmaking up factor k. A higher value for ui (i.e., a larger factor score for Factor 1) indicates that therespondent attaches more importance to recreation and other use values. Higher values for wgi
(Factor 2) and exi (Factor 3) reveal that the respondent is more sensitive to the warm glow ofgiving and is more concerned with the protection of nature and no-extinction of wildlife,respectively. Let us emphasize again that these factor scores are meant to reflect psychologicaldispositions, containing additional information that is not captured by other socio-economic variables.10 This finding will be tested (and confirmed) in the multivariate analysis ofSection 5.
4. Testing for the scope effect in a univariate setting
As a first approach we will calculate the mean WTP for the different protection scenarios in asimple univariate setting, i.e., neglecting the information on demographic, socioeconomic andpsychological characteristics of our respondents. With the double bounded dichotomous choiceelicitation question format the individual consumer WTP responses are not given directly, i.e.,
Table 1
Factor loadings after varimax rotation
Attitudinal items Factor 1 (use) Factor 2 (warm glow) Factor 3 (existence)
M14 70n 21 18
M2 67n 19 15
M4 63n 16 14
M11 63n 16 27
M13 61n 19 25
M9 58n 17 26
M26 58n 17 20
M5 56n 4 19
M1 47n 13 19
M12 18 60n 13
M23 25 58n 10
M20 14 57n 3
M8 8 56n 6
M15 6 47n 4
M10 36 8 71n
M22 35 15 66n
M6 29 9 62n
Note: the exact wording of the items is given in the appendix.
10A regression analysis on which we do not report here—see [14]—indicates that factor scores are linked to
socioeconomic indicators and to behavioral patterns of use and charitable giving, but the correlations are rather low.
P.A.L.D. Nunes, E. Schokkaert / Journal of Environmental Economics and Management 45 (2003) 231–245 237

WTPrij is not observed. To estimate the mean WTP we therefore have to make an explicit
distributional assumption. It turns out that the fit is very similar for a lognormal, a Weibull and aloglogistic distribution function are similar (see [16]). We prefer the lognormal distribution forinterpretational reasons. Moreover, its WTP estimates proved to be in accordance with non-parametric estimation results and the semilogarithmic specification of (1) is a natural way to copewith possible heteroskedasticity problems.To estimate the location parameter b0 and the variance parameter s of the lognormal
distribution, we follow the maximum likelihood procedure proposed by Hanemann et al. [8]. Theresulting estimates for the WA, RA and (WA+RA) protection programs are given in Table 2.The standard errors indicate that these estimates are rather precise. On the basis of these resultswe computed the mean and median WTP for the different programs and the corresponding 90percent confidence intervals. They are also shown in Table 2 and Fig. 1. The means for the WA,RA and (WA+RA) protection programs are 9800, 7600 and 9300 escudos, respectively.11 Theestimated medians are significantly smaller. This reflects the asymmetric shape of the lognormalprobability distribution. Our results are in line with those found in other valuation studies.We follow the procedure of Diamond et al. [6] for testing the scope effect. Estimation of a
pooled model for WA and (WA+RA) and computing the likelihood ratio test for the restrictionof identical location and variance parameters yields a value for the test statistic of 2.66. The sameexercise for RA and (WA+RA) gives a value of 2.92. Both values are well below the criticalvalue.12 The empirical evidence does not reject the hypothesis that the WTP for WA isapproximately the same as the WTP for (WA+RA), and the WTP for RA is approximately thesame as the WTP for (WA+RA).13 In other words, the test results suggest:
Table 2
Estimation results for the univariate case (Portuguese Escudos)
WA protection program RA protection program (WA+RA) protection program
Estimate Standard error Estimate Standard error Estimate Standard error
Location 7.918 0.092 7.710 0.094 7.751 0.077
Scale 1.598 0.096 1.577 0.100 1.662 0.084
Log-likelihood �515:25 �488:62 �807:72
Mean 9800 7600 9300
[6700–14 600]n [5200–11 700]n [6600–13 300]n
Median 2700 2200 2300
[2400–3200]n [1900–2600]n [2100—2600]n
n90% Confidence interval.
11Which corresponds to 48, 36 and 45 euro, respectively. The yearly average disposable income per capita in 1997 in
Portugal was about 9814 euro.12The likelihood ratio statistic follows asymptotically a chi-square distribution with the number of degrees of
freedom equal to the number of restrictions imposed. The critical value is 5.02.13We could also have tested the hypothesis that the average WTP for WA is equal to the average WTP for RA (and
both are equal to the average WTP for WA+RA). Rejection of this joint hypothesis would not inform us about the
scope effect on its own, however. We therefore preferred to test the scope effect for WA and RA separately.
P.A.L.D. Nunes, E. Schokkaert / Journal of Environmental Economics and Management 45 (2003) 231–245238

Finding 1. The reported WTP-measures fail the scope test.We noted already that this result can reflect a high degree of substitutability between WA and
RA. However, it is possible (and, in our opinion, more likely) that the warm glow components ofthe WTP are insensitive to the scope of the commodity being valued. We will directly test thissecond hypothesis by exploiting our information on the apparent motivations of the respondents.
5. Computing the ‘‘cold’’ willingness to pay in a multivariate setting
We will first introduce some interindividual variation in the estimation of the reported WTPmeasures. In a second step we compute the ‘‘cold’’ WTP (by cooling-off the warm glow) andrepeat the scope test for these corrected measures.
5.1. Explaining the interindividual variation in the WTP
To estimate the full model with all explanatory variables included, we maximize again thelikelihood function, but now with a complete multivariate specification as described in (1). InTable 3 we show the results for a specification in which the explanatory variables are theindividual motivational factor scores,14 as computed in Section 3.2, and various series of dummyvariables to represent the age of the respondent, his/her occupation/job, his/her educational level.The reference individual is between 60 and 70 years old, has completed a medium level ofsecondary studies and is now retired. We also include the number of individuals living in the
9800
2700 2300
9300
2300
7600
0
2000
4000
6000
8000
10000
12000
14000
16000
DC-mea
n
DC-med
ian
DC-mea
n
DC-med
ian
DC-mea
n
DC-med
ian
WA RA WA+RA)
Fig. 1. Point estimates of mean and median WTP and 90% confidence limits.
14An important technical remark is in order here. The factor scores used as explanatory variables are estimated
quantities, rather than deterministic exogenous variables. Ideally, we should have adapted our maximum likelihood
procedure to cope with this problem. This is not trivial, however, and we acknowledge that corners are being cut.
Nevertheless, recent methodological research on the analysis and joint estimation of categorical data models together
with latent trait models does not show substantial qualitative effects on the estimates (e.g. [6,7]).
P.A.L.D. Nunes, E. Schokkaert / Journal of Environmental Economics and Management 45 (2003) 231–245 239

Table 3
Explaining interindividual variation in the WTP
Protection programs
WA RA (WA+RA)
Parameters Est. Sd. Er. P-val. Est. Sd. Er. P-val. Est. Sd. Er. P-val.
Factor scores
Use 0.091 0.12 0.47 0.291n 0.13 0.02 0.165 0.11 0.13
Warm glow 0.536n 0.14 0.00 0.448n 0.12 0.00 0.238n 0.11 0.04
Existence 0.438n 0.12 0.00 0.254n 0.14 0.08 0.233n 0.11 0.03
Area
Rural 0.390 0.33 0.23 �1.04n 0.37 0.00 0.019 0.29 0.94
Urban 0.148 0.23 0.53 0.336 0.21 0.12 0.094 0.18 0.60
Age
20s 0.710 0.48 0.14 1.403n 0.50 0.00 0.774n 0.40 0.05
30s 0.956n 0.49 0.05 1.447n 0.46 0.00 0.655n 0.36 0.07
40s 0.279 0.48 0.56 0.885n 0.44 0.04 0.431 0.35 0.22
50s 0.242 0.41 0.56 0.954n 0.41 0.02 0.225 0.33 0.44
70s �0.388 0.47 0.41 0.034 0.45 0.93 �0.598 0.42 0.15
Occupation
Executives 0.891 0.68 0.19 �0.964 0.63 0.12 �0.565 0.53 0.29
Scientists 0.330 0.58 0.57 �0.341 0.59 0.56 �1.51n 0.54 0.00
Technicians �0.006 0.50 0.98 �0.736 0.48 0.12 �0.121 0.42 0.77
Administrative 0.729 0.50 0.14 �0.751 0.46 0.10 �0.269 0.42 0.52
Sales services �0.899n 0.51 0.08 �0.496 0.46 0.28 �1.04n 0.43 0.01
Farmers, fishers 0.242 0.72 0.73 �1.09 0.77 0.37 �2.68n 1.28 0.03
Craftsmen 0.295 0.47 0.54 �0.615 0.46 0.18 �0.170 0.39 0.66
Assembly work �1.045n 0.61 0.08 0.081 0.59 0.89 0.047 0.60 0.93
Unskilled work 0.020 0.66 0.98 �0.723 0.61 0.24 �1.39n 0.58 0.01
Housekeepers �0.295 0.45 0.51 �0.790n 0.45 0.07 �0.314 0.36 0.39
Work students �1.683n 0.87 0.05 �0.305 0.77 0.69 �0.986 0.77 0.20
Education
Primary (freq.) 0.057 0.62 0.92 0.201 0.60 0.73 �0.521 0.59 0.38
Primary 1.045n 0.52 0.04 0.318 0.47 0.50 �0.751 0.52 0.15
Secondary: low 1.262n 0.51 0.01 0.171 0.45 0.14 �0.770 0.49 0.11
Secondary: high 0.963n 0.53 0.07 �0.087 0.44 0.84 �0.258 0.50 0.61
University 1.000n 0.45 0.02 �0.000 0.54 0.99 0.871n 0.51 0.09
Payment vehicle �0.094 0.20 0.64 �0.370n 0.19 0.05 �0.311 0.20 0.12
Net income 0.157n 0.09 0.09 0.291n 0.10 0.00 0.017 0.08 0.82
Household dimension �0.124 0.11 0.25 �0.082 0.09 0.38 0.099 0.08 0.22
Protesters �1.79n 0.31 0.00 �2.02n 0.32 0.00 �1.38n 0.27 0.00
Intercept ðbÞ 6.589 6.899 8.243
Scale ðsÞ 1.292 1.195 1.576
Log-likelihood �305.06 �279.10 �573.12nSignificant at 10%. Reference group: respondent in her 60s, with a medium level of secondary studies, now retired.
P.A.L.D. Nunes, E. Schokkaert / Journal of Environmental Economics and Management 45 (2003) 231–245240

household and net household income. Finally we include indicators for the protest bidders and forthe payment vehicle as described in the survey instrument (taking the value 1 for a voluntarycontribution).15 The estimated coefficient on the latter variable confirms that there is some mildindication of free rider behavior. However, the estimated coefficient is only significant in the RA-scenario. Since we have controlled for this effect in Table 3 we feel confident about the othercoefficient estimates.Individual characteristics have a strong effect on the mean WTP for the protection programs.
Let us illustrate this by the results for the wilderness area where WTP estimates in our samplerange from about 200 escudos (for a low income worker of more than 50 years old withoutuniversity degree and with a low value for the existence motivation) to about 31,000 escudos (for ayoung high income respondent with a university degree and with a large value for the existencemotivation).16
Most of the results reported in Table 3 speak for themselves. The table shows that respondentswho live in an urban (rural) area are willing to pay more (less) for the RA protection programthan the average respondent. This can be seen as a signal of the scarcity of green spaces and open-air recreational possibilities in cities such as Lisbon and Porto. The table also shows that theeducational level of the respondents has a significantly positive effect on the mean WTP for theWA protection program. Younger respondents in general have a higher WTP for the protectionprograms: this is especially true for the programs with a recreational component. The pattern forthe occupational groups is mixed. Finally, whereas the estimated coefficient for householddimension is hardly significant, the respondent’s net income has a strong positive effect on themean WTP.Let us now focus on the effects of the motivational factor scores. The overall pattern is
remarkably sensible. The evaluation of the RA-program depends on the importance attached bythe respondents to the ‘‘use’’ value. The existence-nonuse component matters in all threeprograms, but most strongly in the WA scenario. Most remarkably, the estimated coefficientsregarding the ‘‘warm glow’’ motivational factor are statistically significant (P-value lower than0.05) in all protection programs. We therefore conclude:Finding 2. Our empirical evidence confirms the presence of a significant warm glow effect in the
WTP responses. Respondents who are more sensitive to warm glow (or less resistant to socialpressure) ceteris paribus reveal a higher WTP.At first sight the estimates in Table 3 suggest that the warm glow effect is different for the
different protection programs, i.e., that it is somewhat weaker in the (WA+RA) scenario.However, formal testing does not corroborate that impression. The likelihood ratio test statisticfor the restriction of equal warm glow effects in the three equations is 0.048, well below the 5%critical level of the chi-square distribution with two degrees of freedom. This result suggests thatthe marginal effect of differences in the warm glow motivation on the WTP is the same for thedifferent projects, at least to the extent that warm glow component is captured by our index.
15All individuals with no/no answers were asked about their reasons for this answer. Those who answered that they
did not want to pay because ‘‘they do not believe in the described tax scheme/national fund campaign’’ , ‘‘do not agree
with this type of question’’, ‘‘believe that this questionnaire is not the best way to approach the topic’’ and ‘‘do not
accept any increase in taxes/any participation in a funding campaign’’ were considered to be protest voters—see [15] for
more details.16Which corresponds to 1 and 155 euro, respectively.
P.A.L.D. Nunes, E. Schokkaert / Journal of Environmental Economics and Management 45 (2003) 231–245 241
5.2. Computing the ‘‘cold’’ willingness to pay
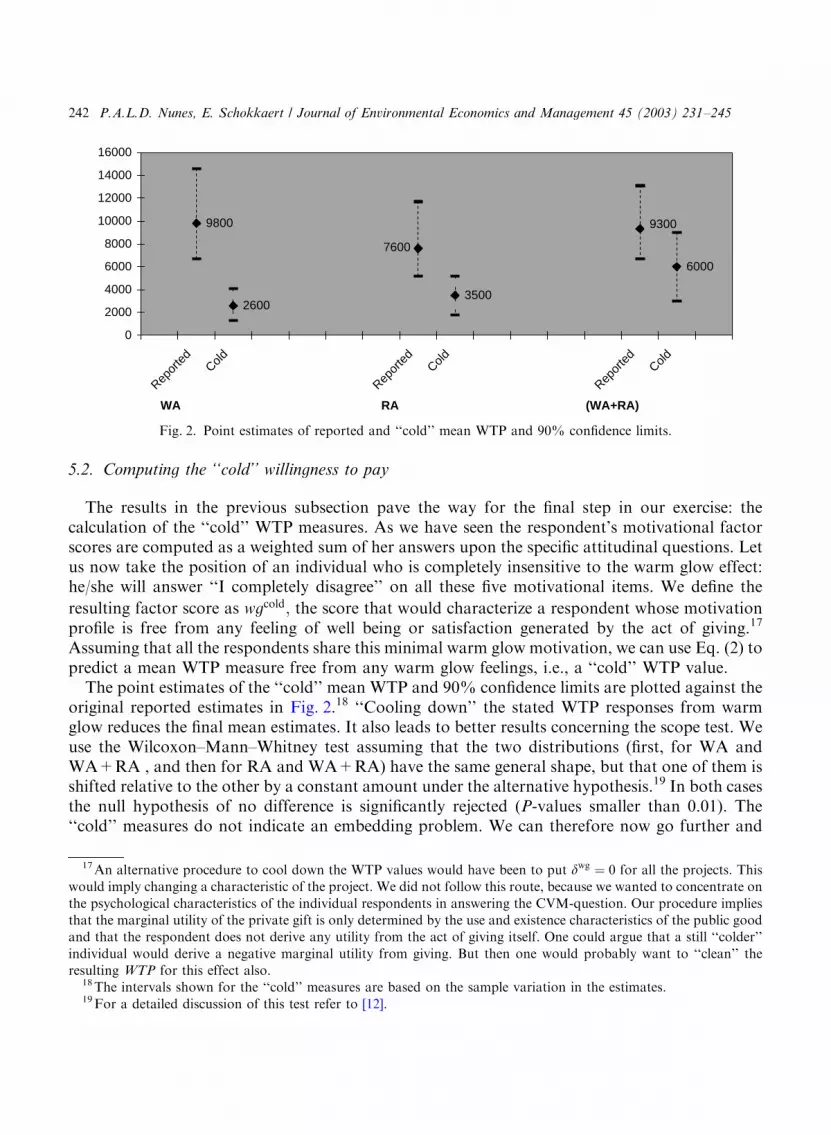
The results in the previous subsection pave the way for the final step in our exercise: thecalculation of the ‘‘cold’’ WTP measures. As we have seen the respondent’s motivational factorscores are computed as a weighted sum of her answers upon the specific attitudinal questions. Letus now take the position of an individual who is completely insensitive to the warm glow effect:he/she will answer ‘‘I completely disagree’’ on all these five motivational items. We define the
resulting factor score as wgcold; the score that would characterize a respondent whose motivationprofile is free from any feeling of well being or satisfaction generated by the act of giving.17
Assuming that all the respondents share this minimal warm glow motivation, we can use Eq. (2) topredict a mean WTP measure free from any warm glow feelings, i.e., a ‘‘cold’’ WTP value.The point estimates of the ‘‘cold’’ mean WTP and 90% confidence limits are plotted against the
original reported estimates in Fig. 2.18 ‘‘Cooling down’’ the stated WTP responses from warmglow reduces the final mean estimates. It also leads to better results concerning the scope test. Weuse the Wilcoxon–Mann–Whitney test assuming that the two distributions (first, for WA andWA+RA , and then for RA and WA+RA) have the same general shape, but that one of them isshifted relative to the other by a constant amount under the alternative hypothesis.19 In both casesthe null hypothesis of no difference is significantly rejected (P-values smaller than 0.01). The‘‘cold’’ measures do not indicate an embedding problem. We can therefore now go further and
9800
26003500
9300
6000
7600
0
2000
4000
6000
8000
10000
12000
14000
16000
Repor
ted
Cold
Repor
ted
Cold
Repor
ted
Cold
WA RA (WA+RA)
Fig. 2. Point estimates of reported and ‘‘cold’’ mean WTP and 90% confidence limits.
17An alternative procedure to cool down the WTP values would have been to put dwg ¼ 0 for all the projects. This
would imply changing a characteristic of the project. We did not follow this route, because we wanted to concentrate on
the psychological characteristics of the individual respondents in answering the CVM-question. Our procedure implies
that the marginal utility of the private gift is only determined by the use and existence characteristics of the public good
and that the respondent does not derive any utility from the act of giving itself. One could argue that a still ‘‘colder’’
individual would derive a negative marginal utility from giving. But then one would probably want to ‘‘clean’’ the
resulting WTP for this effect also.18The intervals shown for the ‘‘cold’’ measures are based on the sample variation in the estimates.19For a detailed discussion of this test refer to [12].
P.A.L.D. Nunes, E. Schokkaert / Journal of Environmental Economics and Management 45 (2003) 231–245242

also test the (stronger) adding-up hypothesis. According to the Wilcoxon–Mann–Whitney test theP-value is 0.72, well above the 5% cutoff. We therefore cannot reject the hypothesis that the mean‘‘cold’’ WTP value attached to WA+RA is equal to the sum of the mean ‘‘cold’’ WTP valuesattached to WA and RA individually.20 Therefore we can summarize our results asFinding 3. The ‘‘cold’’ WTP-measures, i.e., after correcting for the warm glow effect, satisfy
both the scope test and the adding-up test.
6. Conclusion
Let us first take an ambitious position with respect to our results. In an optimistic mood, wecould claim that the use of motivational information has enabled us to show that the embeddingproblem in CV applications is linked to the warm glow effect. Moreover, our procedure foroperationalizing and estimating a ‘‘cold’’ WTP, i.e., a WTP measure for the case in which allrespondents would be free from a general feeling of well-being or satisfaction generated by the actof giving, has worked reasonably well. The ‘‘cold’’ WTP estimates are lower than the originalestimates and formal testing has shown that they do not violate the adding-up property.If one takes the view that the original WTP estimates do not reflect ‘‘economic preferences’’
because they contain an altruistic motive and should therefore not be used for cost-benefitexercises [13], this procedure of ‘‘cooling down’’ the altruistic motive might offer a way-out.Further refinement of our method could even lead to a better distinction between the differentcomponents of ‘‘altruism’’. One could as well argue, however, that ‘‘warm glow’’ is a legitimatecomponent of WTP and should therefore not be disregarded. Since our results suggest that theproblems with the embedding effect do not necessarily point to inconsistent response behavior butcan be explained by the existence of a stable and measurable warm glow component in individualpreferences, they also give support to the direct use of the uncorrected original WTP measures.Caution is needed, however, and we would argue in favor of a less ambitious interpretation of
our results. Since this paper is one of the first attempts to introduce attitudinal information intothe analysis of CV answers, our results for the scope and the adding-up effect with the ‘‘cold’’measures must rather be seen as provisional. It is not obvious that similar results would be foundwith other samples, with other questionnaires and for other environmental commodities.However, even in this more cautious interpretation, it still seems fair to claim that themethodology we propose to measure and incorporate motivational information has workedreasonably well and is promising. Moreover, the evidence that the warm glow effect has animportant influence on the WTP answers seems to be rather robust. The use of direct attitudinalinformation may play a crucial role to get a better understanding of the real content of CVanswers.
20The Wilcoxon–Mann–Whitney test is the most powerful non-parametric test for detecting differences in the
location, i.e., the central tendency of two distributions. It does not work so well for detecting differences in the
dispersion of the distributions. We therefore also calculated the Wald–Wolfowitz runs test. This test confirms the results
of the Wilcoxon–Mann–Whitney test for the scope test, in that the null hypothesis of no difference is significantly
rejected. At the same time, the Wald–Wolfowitz runs test also rejects the adding-up hypothesis at the 5% level.
However, since we are primarily interested in assessing whether one distribution has a larger mean than the other and
much less in differences in the dispersion, we draw our conclusions on the basis of the Wilcoxon–Mann–Whitney test.
P.A.L.D. Nunes, E. Schokkaert / Journal of Environmental Economics and Management 45 (2003) 231–245 243

Acknowledgments
The authors thank two anonymous referees and Associate Editor for their comments andsuggestions on an earlier version of this paper. The authors also thank John Loomis and StefProost for invaluable help in setting up the study and for many interesting comments. PauloNunes acknowledges the Portuguese Ministry of Science (contract BD/2622/93-RO) and theEuropean Commission (contract ENV4-CT96-5050) for financial support.
Appendix
M1. My family and I would have great pleasure in knowing that the SIC, RTP and TVI togetherhave agreed in introducing in their TV schedule more documentary films about wildlife andits natural habitats.
M2. My family and I think that the preservation of the Alentejo coast line is important becausethis is a place which all of us can visit and where we can see very beautiful naturallandscapes.
M4. My family and I think that the preservation of the Parks is important because these areprivileged places where everybody may enjoy a walk or a picnic in a relaxed environment.
M5. My family and I take great satisfaction in knowing that it is today guaranteed that ourchildren, and future generations, will continue to have the possibility of observing wildlifein its natural habitat.
M6. Despite the fact that my family and I may never see an otter in its natural habitat, we wouldbe very worried if the total population of otters in Portugal became extinct.
M8. Our family admires the individuals who, on voluntary basis, participate in collectingdonations for national programs for social aid and solidarity.
M9. My family and I take great pleasure in knowing that we are still able to visit villages inAlentejo that keep their true identity and their typical houses, facades and streets.
M10. Despite the fact that my family and I may never see an Iberian lynx in its natural habitat,we are very happy to know that we have the guarantee that the lynx is kept safe fromextinction in Portugal.
M11. My family and I think that the preservation of the natural areas is important since they areprivileged sites for recreational activities like sightseeing or biking in a naturalenvironment.
M12. There are some funding campaigns to which my family and I feel very close and thereforewe do not hesitate to contribute a donation.
M13. Despite the fact that my family and I may never visit a Natural Park, we are very happy tosee these natural areas protected so that other Portuguese citizens may also have thepossibility to observe wildlife in its natural habitat.
M14. My family and I think that the preservation of the Alentejo coast line is important becausethis is a privileged place where all of us may enjoy going to the beach in a relaxedenvironment and being in contact with nature.
M15. It is difficult for me to decline my help to other individuals who, either in the streets or atmy door, beg for charity.
P.A.L.D. Nunes, E. Schokkaert / Journal of Environmental Economics and Management 45 (2003) 231–245244

M20. I am happy with myself whenever I give a financial contribution to national fund raisingcampaigns.
M22. Despite the fact that my family and I may never observe an eagle in nature, we take greatpleasure in knowing that the eagles are kept safe from extinction.
M23. My family and I like to contribute to good causes such as the protection of theenvironment, and whenever we can afford it, we do not decline our help to such fundraising campaigns.
M26. My family and I think that the preservation of the Alentejo coast line is important becausein this way we are protecting a typical lifestyle of the local inhabitants, which belongs toour national identity.
References
[1] J. Andreoni, Giving with impure altruism: applications to charity and Ricardian equivalence, J. Political Economy
97 (6) (1989) 1447–1458.
[2] J. Andreoni, Impure altruism and donations to public goods: a theory of warm-glow giving, Econom. J. 100 (1990)
464–477.
[3] K. Arrow, Social Choice and Individual Values, Wiley, New York, 1951.
[4] R. Carson, Contingent valuation surveys and tests of insensitivity to scope, in: R. Kopp, et al., (Eds.), Determining
the Value of Non-marketed Goods, Kluwer Academic Publishers, The Netherlands, 1997 (Chapter 6).
[5] P. Diamond, J. Hausman, G. Leonard, M. Denning, Does contingent valuation measure preferences?
Experimental evidence, in: J. Hausman (Ed.), Contingent Valuation: A Critical Assessment, North-Holland,
New York, 1993, pp. 41–85.
[6] J.A. Hagenaars, Loglinear Models with Latent Variables, Sage University Paper Series on Quantitative
Applications in the Social Sciences, 07-094, Sage, Newbury Park, CA, 1993.
[7] J.A. Hagenaars, Categorical causal modeling: directed loglinear models with latent variables, WORC Paper no.
9704.002/7, Methoden en Technieken van Onderzoek Department, Tilburg University, The Netherlands, 1997.
[8] W. Hanemann, J. Loomis, B. Kanninen, Statistical efficiency of double-bounded dichotomous choice contingent
valuation, Amer. J. Agric. Econom. 73 (4) (1991) 1255–1263.
[9] H. Harman, Modern Factor Analysis, Chicago University Press, Chicago, 1976.
[10] J. Hausman (Ed.), Contingent Valuation: A Critical Assessment, North-Holland, New York, 1993.
[11] D. Kahneman, J. Knetsch, Valuing public goods: the purchase of moral satisfaction, J. Environ. Econom.
Manage. 22 (1992) 57–70.
[12] E. Lehmann, Nonparametrics: Statistical Methods based on Ranks, Holden-Day, San Francisco, 1975.
[13] P. Milgrom, Is sympathy an economic value? Philosophy, economics and the contingent valuation method, in: J.
Hausman (Ed.), Contingent Valuation: A Critical Assessment, North-Holland, New York, 1993, pp. 417–435.
[14] P.A.L.D. Nunes, Using factor analysis to identify consumer preferences for the protection of a natural area:
evidence from a valuation survey in Portugal, European J. Oper. Res. 140 (2002) 499–516.
[15] P.A.L.D. Nunes, The Contingent Valuation of Natural Parks: Assessing the Warm Glow Propensity Factor, in:
New Horizons in Environmental Economics Series, Edward Elgar Publishing, Camberley, UK, 2002.
[16] D. Schkade, J. Payne, Where do the numbers come from? How people respond to contingent valuation questions,
in: J. Hausman (Ed.), Contingent Valuation: A Critical Assessment, North-Holland, New York, 1993, pp. 271–
293.
[17] D. Schkade, J. Payne, How people respond to contingent valuation questions: a verbal protocol analysis of
willingness to pay for an environmental regulation, J. Environ. Econom. Manage. 26 (1994) 88–109.
[18] E. Schokkaert, L. Van Ootegem, Preference variation and private donations, in: L.-A. Gerard-Varet, S.-C. Kolm,
J. Mercier-Ythier (Eds.), The Economics of Reciprocity, Giving and Altruism, Macmillan, London, 2000,
pp. 78–95.
[19] S. Thompson, Sampling, Wiley, New York, 1992.
P.A.L.D. Nunes, E. Schokkaert / Journal of Environmental Economics and Management 45 (2003) 231–245 245


