Embed Size (px)
Citation preview
/IjSDO400003
I FF1 CTOF DFFERENTRADIATIONS ON SOME111912"SICO-CHEMICAL PROPERTIE S OF GUNI
ARABIC (Acacia seneg-al (L.) Wil d.)
ByRihab Mirghllnv er Elamin
B.Sc. Scienc ad Education) 1994Faculty of Education, Univ-,-rsity of Khartouir
A thei,is submitted to the University of Khartoum in partial fulfillment forthu requirement of the Degree of Master of Science (Agriculture)
Supervisor:Assoc. Prof Karamalla Ahmed Karainalla
Department of Food Sciencz and TechnologyUniversily of KI-ItzowurnFaculty of Agriculture
111h. 2 I

DEDICATION
To my father and mother
with love
ACKNOWLEDGEMENTS
Praise to God for his care and help. I would like to express my
sincere thanks and gratitude to my supervisor, Dr. Karamalla A. K.
for his suggestions, guidance and encouragement to present this study.
I am greatly indebted to Dr. Ahmed Ali Mahdi, for his generous
help. Sincere thanks are due to Dr. El fatih Ahmed Hassan, Dr. Samia
Eltayeb and Ustaz Sami Ata, for their suggestions and help. Thanks
are also due to Mr. Mustafa Mohammed Elhassan, the Head of Physics
Section in Radiation and Isotopes Centre.
I deeply appreciate the friendliness and support by my
colleague Esmail Musa. Appreciations are also extended to Mr. Khalid
Fadul, Mr. Mohammed Hamid, Mr. Awad Abdallah and Mr. Hassan
Elnour- for their continuous encouragement during this work and also
my thanks are due to all my friends.
Thanks are due to Ustaz Hamid A. Hamid, for his skillful help
offered in printing this work.
Finally, I am especially grateful to my sisters Nazik and Nahid,
for their unlimited continuous encouragement and care to make the
completion of this work possible.
ABSTRACT
Seven di 11erent 1ccicictsenegcil gurn samples amely Al, A2, A3, A4,
All, A, i A7 ere collected From different trees in te sarne forest
gro-,viiig in dainazein season 1994/1995. Some physicochernical and
i'mriciMnal properties Nvere ivestigated i.e. oisture content, itrogen
co!�I(-!It Secific I-OtafiOll, molecular weight emulsifying stability ad water
lioldin�, capacitv. Also te efect of radiation frorn different sources amma
i-Itraviolet (UV) and infra-red (IR) adiations with various doses i.e.
I 50� 325 and 500 gay 2 4 ad 6 hurs and 80, 10 ad 140'C,
resocctivel on some physicochernical and functional properties ad
M11POnent Sgars or gLI111 sainples i solid form and solution of different
conecutrations ivere studied.
Statistical analysis sowed significant differences (P<0.05) between
all ol" hse sven samples i tir physicochernical and functional
pr�)pt.,rhes except in p-I value. Also pl. values we not affected by
("i (loses fy. J ad IR rdiations sed in tis study.
ReSUItS allowe tat te oisture content, ash, nitrogen content ad
stability verenotaffectedbyy( 60 (Co) irradiation where solid
,air! 11LIeOLI Sution Of gum samples showed significant differences
(11<0.05 i specific otation, relative viscosity, intrinsic viscosity and
molecular weight wen exposed to various doses of 7 rays.
Actici(i enegal gUrn Sution (10%) was fractionated before and
after irradiation with 150 ad 500 gray of Yrays and produced six gum
Fractions, analytical Study evealed significant differences (P<0.05) among
t1leir physical an cemical properties compared with the wole gum.
Statistical analysis sowed isignificant differences (P<0.05)
betx\-cen te whole ad iradiated solid gm by UV radiation on ash,
nitrogen content and eulsifying stability. Bt there was a little decrease as
radiation time increase on te oisture content. The relative viscosity was
redLICCCI froin 05582 whole gum) to 04669 (solid gum) when exposed to
UV aiation for 6 lirs Wile reducing -ugars were reduced from 07753%
to 0602% iadiating solution gum) solid gurn irradiated by UV radiation
exlilbiied sliarp reduction of molecular weight with increasing irradiation
tim i comparison to iadiated solution. Reducing sugars and solubility
were ecrease(] from 1.88% and 97.19% of whole gum to 016% and 84.1%
01' L.ILIIII irradiated by IR radiation heating) at 140'C, respectively while
IIIMStLII'C Content reduced from 10.7% to 0.40N. Water holding capacity and
relative viscosity were increased from 40.7% and 04083 of unirradiated
gILIIIII to 53.4% and 06864 of gurn irradiated at 140'C, respectively.
N/l',.IXiII1LI111 value far relative viscosity 07766 of unirradiated gum and its
iii
11111111M.1111 V�IlLle Solution gUI11 (20%) irradiated at I O'C 11or 60
lirs. whi le at 80'C Im- te sme time the 111illiML1111 Value is 0.55 19.
I Analytical Study of degraded gurn at 80 ad 100'C gave igher
values i ash ad educing Sgars wiiiethepHvalue,inoisiurespecific
rot,-,1,on id nitrogen content gave lower values thanthoseofthewhole
gLI111.
Maximum absorbance of UV spectrurn of the whole gurn was
reported a te wave length 280 nni. Genei-allyUVabsorbancewasnot
affiected by and UV adiations while it increased with increase of
M III) C171, LI re.
,I'llin layer cromatography evealed ht some carbohydrate
components, i.e. arabinose, galactose ad rharnnose of A. enegal gurn,
were liberated ad were not affected by te various doses of garni-na,
ultrivlolet and infra-red adiations sed in tis study.
iv
IIj I i '631
A7, A(,, A5, A4,A3, A,, Al
I I o p I I f ;u� Bull .�� L'i kit,�, JL.-JI
LS . �Ljl
cla--.� �� 3L� .l WI LI" L51-- 'I-5 L5zqA jjj-D
_;)L,, b4tL �l
(tjV) �4�ii Lsi_� o ry o o .:jLc. ULM,
jI j� L�.Lsj-� (I R)
L).,-i j�l (P-<0.05) �jy�.- L�-q-� 3j.,_9 k4,=LyI L�]L:� ,l
%nJ
-9 Ls -JI-9 uj-��Jl Ls
(P<0.05) ki L-.� UL, tULL,
jjj-D L3 L6. La..� &4
Lt�l L.�4 _51 0 L:Jt- _�J A- LX.111 AXJ L-jUjJI ---j L:�
L3 -9 J--� j
j& (P<0.05)
(1)<0.05) �j_o-,L4 LUm,.Al
6-0
LS3 LJL--6,1
-,C10A1
% \/Yor
%
�U-5..�'Ji Lsi IAM" UL-"L
% I Y, i % A A �j
Civil La-Z k..JV &,,,U % A
% % Y
_,%ori L5-4 f Ar % f 'y 1.�Ij �*�l k�.
'y y 3b A4 U-61 -L�l Lr6
_,I tIJI % Y -.54s-f,31 33 �� I J-4-,..l . Y YVI +1 Z4 t'.�J
L�-ji U-i� .OA o o i ;A j u�p a L...
0 OA
J i �J-�Ljl LT-!- gja,*Jl L>� I '-a� I L,:w L:.jLj I ��4j LS
6----JJ +14 L-A r3a-j Al LS
j j" I 1 ji kR-11 I L-illmj >.Oi 41 Ulr- 1 L�L�
kZ'jl L 1. -- I k.L-- nill A
W:y
' I ) JUS�Jl :UJS..Il ;k�jl kL� U1
L46.. kitL-k..Il L:jL-- '14
vii
CONTENTS
A cknow ledgem ents .......................... ..................................................... iA bstract ......................................................................................................... iiA rabic abstract .......................................................................... # ................... vContents ..................................................................................................... viiiList of tables .............................................................................................. xiiiList of figures ...... .................................................................................... x i vList of plates ................................ ............................................................ xvi
Chapter O ne: Introduction and Literature Review ...................................... I1 I Introduction ........................................................................................ II.2 Review of gum arabic ....................................................................... 2
1.2.1 Gum exudation ........................................................................... 21.2.2 D istribution of Acacia Senegal ................................................... 31.2.3 Acacia Senegal gum ................................................................... 4
1.2.3.1 Classification ......................................................... I ............. 41. 2.3.2 Acacia Senegal tree ............................................................. 4
1.2.4 Grades and processing ................................................................ 51.2.5 M ain uses .................................................................................... 5
1.2.5.1 Food industry ...................................................................... 51.2.5.2 Pharm aceutical industry ...................................................... 61.2.5.3 M edicine .............................................................................. 61.2.5.4 Cosm etics industry .............................................................. 6
1.2.6 Physicochemical properties of A. enegal gum ......................... 7
.1.2.6.1 M oisture ...................-.... .................................................... 71.2.6.2 A sh ...................................................................................... 71.2.6.3 N itrogen content .................................................................. 71.2.6.4 A cidity and pH m easurem ent .............................................. 81.2.6.5 Solubility ............................................................................. 81.2.6.6. Specific rotation ................................................................. 81.2.6.7 Equivalent weight and uronic acid anhydride ..................... 91.2.6.8 V iscosity .............................................................................. 9
1.2.6.8.1 Intrinsic viscosity ....................................................... 101.2.6.9 M olecular w eight .............................................................. 101.2.6. 1 0 Reducing sugars .............................................................. 10
1.2.7 Functional properties ................................................................ I 1.2.7.1 Em ulsifying stability ......................................................... I 1.2.7.2 W ater holding capacity (W .H .C) ...................................... 12
1.2.8 Structural features of A. enegal gum ...................................... 12
viii
1.2.8.1 M ethylation ....................................................................... 131.2.8.2 Smith degradation method ................................................ 131.2.8.3 Hydrolysis methods of analysis ........................................ 15
1.2.8.3.1 Acid hydrolysis .......................................................... 151.2.8.3.2 Autohydrolysis ........................................................... 151.2.8.3.3 Partial acid hydrolysis ................................................ 171.2.8.3.4 Alkaline hydrolysis .................................................... 17
1.2.8.4 Chromatographic techniques ............................................ 191.2.8.4.1 Thin layer chromatography (TLC) ............................. 19
1.2.8.5 Ultra violet (UV) ............................................................... 20
1.2.8.6 Fractionation ..................................................................... 201.2.9 Sources of radiation .................................................................. 21
1.2.9.1 Interaction of radiation with matter .................................. 231.2.9.2 Absorbed doses ................................................................. 231.2.9.3 Radiation units .................................................................. 24
1.2.9.3.1 Electron volt ............................................................... 241.2.9.3.2 Rad ............................................................................. 241.2.9.3.3 Gray ............................................................................ 25
1.2.9.4 Effect of radiation on solid matter .................................... -2 51.2.9.5 Radiolysis of water and aqueous solution ......................... 25
1.2.9.5.1 Oxidation-reductions'reactions in aqueous solutions 271.2.9.6 Effect of radiation on hydrogen bonds .............................. 271.2.9.7 Effect of radiation on polysaccharide ............................... 281.2.9.8 Gamma radiation 60CO (,Y) ........................................... ..... 28
1.2.9.8.1 The nature and sources of gamma radiation ............... 281.2.9.8.2 Cobalt-60 .................................................................... 301.2.9.8.3 Interaction of gamma radiation with matters ............. 30
1.2.9.8.3.1 Photoelectric effect ............................................. 3 1.2.9.8.3.2 Compton effect .................................................... 3 1.2.9.8.3.3 Electron positron pair production ....................... 32
1.2.9.8.4 Absorption of gamma rays ......................................... 321.2.9.8.5 Effect of gamma radiation on viscosity
measurement ............................................................. 321.2.9.8.6 Effect of gamma radiation on carbohydrate
composition ............................................................... 331.2.9.9 Ultraviolet (UV) and infra red (IR) radiations .................. 33
1.2.9.9.1 Ultraviolet radiation ................................................... 331.2.9.9. 1. M edical application of ultraviolet radiation ....... 341.2-9.9.1.2 Effect of UV radiation on electrons .................... 34
1.2.9.9.1.3 Effect of UV radiation on gum arabic ................ 341.2.9.9.2 Infra-red radiation (jR) .............................................. 34
1.2.9.9.2.1 Effect of IR on molecules ................................... 36
ix
1.2.9.9.2.2 Effect of heating (IR) on gum arabic .................. 371.2. 1 0 O bjectives ............................................................................... 37
Chapter Tw o: M aterials and M ethods ....................................................... 382.1 M aterials .......................................................................................... 38
2. 1.1 Purification and preparation of sam ples .................................. 382.2 M .-thods .......................................................................................... 38
2.2.1 Physicochernical analysis ....................................... * ................ 392.2.1.1 M oisture content .............................................................. 392.2.1.2 Total ash content ............................................................... 402.2.1.3 N itrogen and protein content ............................................ 402.2.1.4 Specific rotation ................................................................ 412.2.1.5 pH value ............................................................................ 412.2.1.6 V iscosity m easurem ent ..................................................... 422.2. 1.7 Intrinsic viscosity (,q) ........................................................ 432.2.1.8 M olecular w eight .............................................................. 432.2.1.9 Apparent equivalent w eight ............................................. 432.2. 1 IO U ronic acid .... i ................................................................. 442.2.1.11 Solubility ........................................................................ 442.2.1.12 Tannin content ................................................................. 452.2.1.13 Reducing sugars .............................................................. 452.2.1.14 U ltra violet absorption spectra ........................................ 46
2.2.2 Functional properties analysis .................................................. 462.2.2.1 Em ulsifying stability ......................................................... 462.2.2.2 W ater holding capacity (W .H .C.) ..................................... 46
2.2.3 Structural analysis .................................................................... 482.2.3.1 A cid hydrolysis ................................................................. 482.2.3.2 A utohydrolysis .................................................................. 482.2.3.3. Partial acid hydrolysis ...................................................... 492.2.3.4 Chrom atographic m ethod .................................................. 49
2.2.3.4.1 Thin layer chromatography (qualitative analysis) ..... 492.2.3.5 Fractionation ..................................................................... 50
.d..3 Statistical analysis ........................................................................... 51
Chapter Three: Results and D iscussion ..................................................... 523.1 A nalytical studies of Acacia Senegal gum ...................................... 52
3. 1.1 M oisture .................................................................................... 523.1.2 A sh content ............................................................................... 523.1.3 N itrogen and protein contents .................................................. 523,1.4 pH value ................................................. ................................. 553.1.5 Specific rotation ....................................................................... 553.1.6 Solubility .................................................................................. 553.1.7 Reducing sugars ....................................................................... 56
x
3.1.8 Relative viscosity ..................................................................... 563.1.9 Intrinsic viscosity and m olecular weight ................................. 563. 1 I Apparent equivalent weight and uronic acid ......................... 573.1.11 Tannin ..................................................................................... 573.1.12 Emulsifying stability .............................................................. 573.1.13 W ater holding capacity (W .H.C.) .......................................... 58
3.2 Effect of gamma irradiation (60CO) on some physicochemicaland functional properties of Acacia Senegal gum ......... ' ................. 58
3.2.1 Moisture, ash, nitrogen, solubility and water holding capacity 583.2.2 pH value ................................................................................... 603.2 '3 Specific rotation ....................................................................... 643.2.4 Relative viscosity ..................................................................... 64
3.3 Effect of UV Irradiation on some physicochemical andfunctional properties of solid Acacia Senegal gum ............... ........ 66
3.3.1 M oisture content ....................................................................... 693.3.2 Ash, nitrogen content and pH value ......................................... 693.3.3 Specific rotation ....................................................................... 693.3.4 Solubility .................................................................................. 693.3.5 Relative viscosity .................................................................... 703.3.6 W ater holding capacity (W .H.C.) ........................................... 70
3.4 Effect of UV irradiation on aqueous A. enegal gum solution ....... 713.4.1 pH value ................................................................................... 7 3.4.2 Specific rotation ....................................................................... 713.4.3 Apparent equivalent weight and uronic acid anhydride .......... 713.4.4 Relative viscosity ..................................................................... 733.4.5 Reducing sugars ....................................................................... 733.4.6 Emulsifying stability ................................................................ 73
3.5 Effect of LJV irradiation on some physicochemical propertiesof solid and solution Acacia Senegal gum ...................................... 74
3.6 Effect of IR radiation on some physicochemical and functionalproperties of solid Acacia Senegal gum .......................................... 7
3.06. 1 Specific rotation ....................................................................... 773.6.2 Solubility .................... ............................................................. 793.6.3 Reducing sugars ....................................................................... 793.6.4 Emulsifying stability ................................................................ 79
3.7 Effect of IR radiation on some physicochemical properties ofaqueous Acacia Senegal gum solutions ........................................... 84
3.7.1 pH value ................................................................................... 843.7.2 Reducing sugars ....................................................................... 86
3.8 Analytical data at for degraded Acacia enegal gum hydrolysisat two different temperatures .......................................................... 89
3.8.1 M oisture content ....................................................................... 89
xi
3.8.2 A sh content ............................................................................... 893.8.3 pH value ................................................................................... 923.8.4 Specific rotation ....................................................................... 923.8.5 Reducing sugars ....................................................................... 933.8.6 N itrogen content ....................................................................... 933.8.7 Relative viscosity, intrinsic viscosity and molecular weight ... 953.8.8 Reduced viscosity .... ................................................... ....... 95
3.9 Fractionation .................................................................................. 1003.9.1 M oisture content ..................................................................... 100-).9.2 N itrogen content ..................................................................... 1023.9.3 pH valu e ................................................................................. 1023.9.4 Specific rotation ..................................................................... 103
3. 1 0 Structural studies ......................................................................... 104
3. 1 0 I LTV absorption ...................................................................... 1043.10.2 Effect of radiation (Y, UV and IR) on the carbohydrate of
Acacia Senegal gum ............................................................ 1083.11 Conclusion and recom m endations .............................................. 113
References ............................................................................................... 117
xii
LIST OF TABLES
Table Page
I M edical applications of ultraviolet radiation ...................................... 35
2. Analytical data for seven samples of A. enegal gum ......................... 53
3. Effect of gamma irradiation 60CO) on some physicochernical. and
functional properties of solid a. enegal gum ..................................... 59
4. Effect of gamma irradiation (60CO) on some physicochernical and
functional properties of aqueous A. enegal gum solution ................. 62
5. Effect of gamma irradiation 60CO) on some physicochemicalproperties of solid and solution states A. enegal gum ....................... 63
6. T-ffect of UV radiation on some physicochemical and functionalproperties of solid A. enegal gum ...................................................... 68
7. Effect of UV radiation on some physicochemical and functionalproperties of aqueous A. enegal gum ................................................. 72
8. Effect of heating (IR) on some physicochei-nical. and functionalproperties of solid A. enegal gum ...................................................... 78
9. Effect of heating (IR) on reducing sugars of aqueous A. enegal
gum solution 20% conc.' (the result taken every IO hrs for 60 hrs) . 85
I 0. Analytical data for degraded A. enegal gum hydrolysate at two6ifferent temperatures (80 and IOO'C) ................................................ 9 I
I 1. Analytical data of six different fraction A. enegal gum before andafter irradiating by y rays ................................................................... 101
Xiii
LIST OF FIGURES
Figure Page
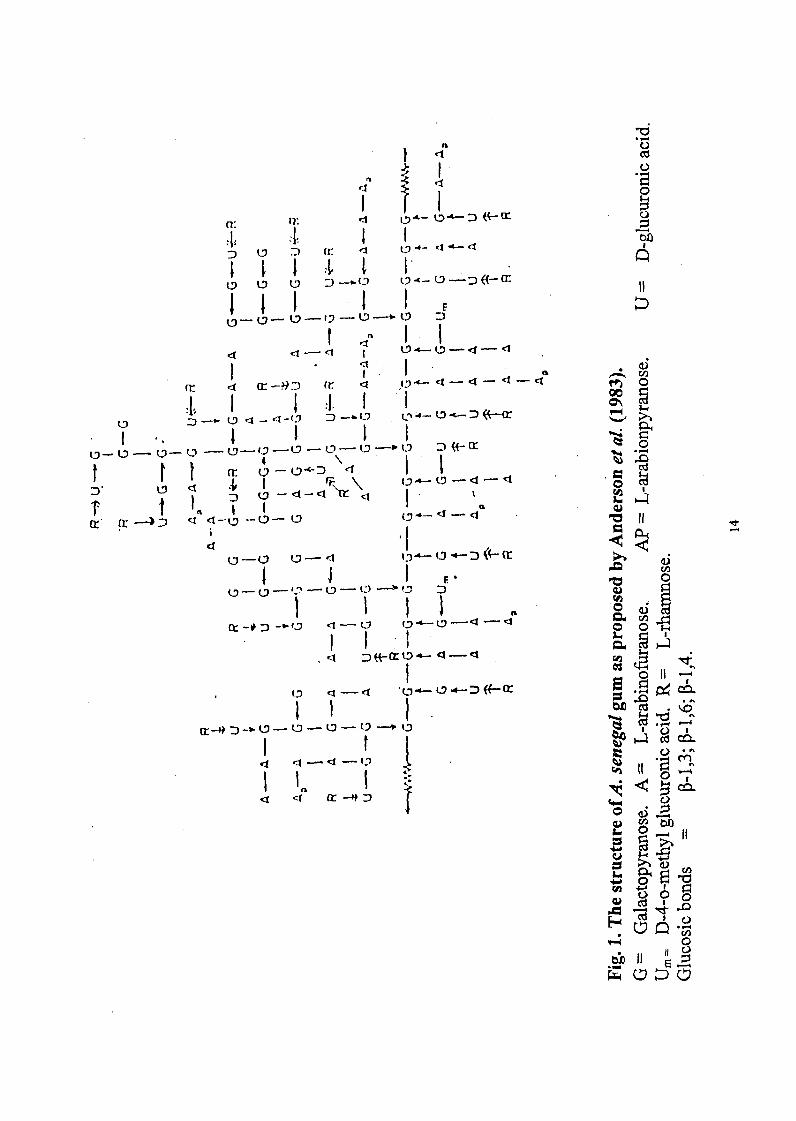
1. The structure of Acacia enegal gum as proposed by Andersonet a l (I 9 83) ......................................................................................... 14
2. The branched galactan core of Acacia enegal gum, S true andA nderson (1983) .................................................................................. 6
3 Glycoprotein model of Acacia enegal, Qi et al. (I 99 1) .................... 8
4. The Wattle-Blossom model for Acacia enegal gum as proposedby Fincher et al. 1983) ....................................................................... 22
5. Electromagnetic radiation spectrum .................................................... 29
6. Standard curve for reducing sugars concentration (as arabinose %at 420 nm ............................................................................................ 47
7. Effect of different doses of gamma irradiation on the water holdingcapacity of solid A. enegal gum ......................................................... 6
8. Effect of different doses of gamma irradiation on intrinsic viscosityfor A. enegal gum (solid and solution) .............................................. 65
9. Effect of different doses of gamma irradiation on molecular weightfor A. enegal gum (solid and solution) .............................................. 67
I 0. Effect of UV radiation on the intrinsic viscosity ('n) of A. enegalgum. Comparing solution state with solid state .................................. 75
I 1. Effect of LJV radiation on molecular weight of A. enegalgum. Comparing solution state with solid state .................................. 76
12. Effect of temperature on the moisture content of solid A. enegalg u m ....................................................................................................... 8 1
13. Effect of temperature on the relative viscosity of solid A. enegalg um ...................................................................................................... 82
14. Effect of temperature on the water holding capacity (W.H.C. ofsolid A . enegal gum ............................................................................ 83
15. Effect of temperature on specific rotation of aqueous A. enegalgum solutions (20% ) ........................................................................... 87
16. Effect of temperature (80 and 0'Q on the relative viscosity ofaqueous A. enegal gum solutions 20%) ........................................... 88
xiv
17. Effect of temperature on moisture content of degraded A. enegalg u m ....................................................................................................... 90
18. Effect of temperature on nitrogen content of degraded,4. enegalg u m ...................................................................................................... 94
19. Effect of temperature on the relative viscosity (n,) of degradedA . enegal gum ..................................................................................... 96
20. Effect of temperature on the intrinsic viscosity (ij) of degradedA . senegal gum .................................................................................... 97
2 1. Effect of temperature on molecular weight Mw.) of degraded-1. enegal gum .................................................................................... 98
22. Effect of concentration on the reduced viscosity TIrd) of degradedA . enegal gum ..................................................................................... 99
23. UV absorption spectra showing the effect of gamma irradiationwith different does on aqueous A. enegal gum solution (conc. 1%) 105
24. UV absorption spectra showing the effect of UV radiation onaqueous a. enegal gum solutions (conc 1%) .................................. 106
25. UV absorption spectra showing the effect of heating (at differenttemperatures for hours) on UV absorbance of solid A. enegalg u m .................................................................................................... 107
"-'6. UV absorption showing the effect of heating (at differenttemperatures with increase in time on aqueous A. enegal gumsolutions (conc. 20% ) ........................................................................ 109
27. UV absorption spectra of degraded A. enegal gum ......................... 110
xv
LIST OF PLATES
Plate Page
1. TLC chromatogram of sugars liberated from A. enegal gum onautohydrolysis for 60 hrs. after gamma radiation with differentd o ses ................................................................................................... II I
2, TLC chromatogram of sugars liberated from A. enegal gum(acid hydrolysis. H2SO40.5 N, 8 hrs.) after heating at differenttem p eratures ......................................................................................... I
3. TLC chromatogram of sugars liberated from A. enegal gum onautolysis for 60 hrs. at different temperature ...................................... jj�
4. TLC chromatogram of sugars liberated from a. enegal gum (acidhydrolysis. H2SO4 I N, 8 hrs.) after irradiated by IR,,y and UVradiation s .............................................................................................. 14d
CHAPTER ONE
INTRODUCTION AND LITERATURE REVIEW
1.1 Introduction
Although there are more than 500 species of Acacias known
botanically, distributed through out the tropical and subtropical areas of the
world, most commercial gum arabic is derived from Acacia enegal locally
known as hashab gum in the Sudan and as Kordofan gum in the world.
Gum arabic has been known for many thousands of years and there are no
artificial substitutes that match it for quality or cost of the production
(Gabb, 1997).
Acacia enegal gum is a natural gummy exudate obtained by
tapping the branches of Acacia enegal tree (Gabb, 1997). In the Sudan the
trees are tapped during the dry season approximately from October to May
or June of the following year. Gum exudation is favoured by the dry hot
weather while cold weather may completely stop the process.
Chemically gum acacia consists mainly of high-molecular weight
polysaccharides made up of rharnnose, arabinose, and galactose, glucuronic
and 4-o-methoylglucuronic acid, calcium, magnesium, potassium, and
sodium (Gabb, 1997). Gum arabic forms viscous solutions up to 60% either
by dissolving in. water or absorbing their own volume of water (G.A.C.,
1(93). Therefore, it ca b egarded as 95 Suble fiberaccording to
SOHIC recently vailable test inethods.
1.2 Review of Gum Arabic
1.2.1 Gum EAndation
There have been nany tories concerning te formation of gum
el'e.�,_!&IICS bUt to ate o oe as popose a universally accepted
CXt)II11,3tiOIl 01. ' gLI111111OSiS Whistler and Bemiller, 1973). Most authorities
(B unt, 926) believes tat te formation of gum exudates is a pathological
COII(litiOll I-eSUlting frorn a microbial (,fungal or bacterial) infection of te
in.iUred re. Although te teory of ifection has not beenmaterially
proved, it is still held by some workers (Edi-nonds, 1965). The view is also
shared by Mantell 1947) Sggesting tat exudates come from natural
IC.1clors tat tend to lessen te vitality of te tees, such as poor soil, lack of
InOiStUre ad ot weather wich improve gurn yields. Malcolm 1936)
considered te production of gurn to be a normal metabolic process
produce i esponse to physiological disturbances induced by drought He
W-LICS that A. enegal is continuously subjected to drought, it still survives
and multiplies. Smith and Montogernry 1959) maintain tat tile trees
PI-OdUCC gUrn to seal tile Wnds and prevent loss of water'. They suggest
that tile gLI111 produced by acacia and esquite are chernically and
StRICtUrally related to the PlIeUMOCOCCUS polysaccharides which
CIIC,1pSUIat a protect te oganism. Local procedures tink that a certain
2
inscc lcally ki-iown as "garraha" a predisposed agent ofguni CXUdation.
Piowe\,cr, ecently Karanialla et al. 1998) indicated tat gum exudation is
not eated to tis insect. Difflerences of opinions, also exist on weather
gLI111 eMldates are formed at te site of te wund or generated internally
and the tansported to site of the eXVdIation (Anderson and Dea, 1968).
1.2.2 Distribution of Acacia enegal
A. senegal is widespread in topical Afi-ica fi-orn Senegal i tile Nvest
to Fthiopia ad Sornalia in te northeast, Swaiziland and Natal, and it
exients to India (Ross, 1975).
The most important gm yielding country is te Republic of tile
SLIC1,111, ollowed by Senegal. auritania, and Mali, Nigeria, Tanzania,
fVlorocco, Ethiopia, ad te Republic of Sornalia produce sizeable
(.11,111tioes of inferior gm Whistler ad Bemiller, 1973).
Commercial roduction Of gUrn arabic occurs principally in te gurn
belt tat lics o te southern periphery of te sahara desert, mainly between
north latitudes I I' ad 14' N (Gabb, 1997).
GLIIII poduction in te Sudan is a taditional skill that as evolved
over nearly generations, always ail iportant part of life in te Sudanese
gt.im belt, bt today as even more economic and social prominence (Gabb,
1997).
3
Gum productimi is evolving fi-om tapping i te wild to a scientific
MIM-l'orestrv operation providim4 hhher and more eliable yields as vel as
I)CttCl- (IL1,11ity 01'prOdUCtiOl (Gabb, 997).
N/la'or arket for gL1111 arabic ae te Uited States, United
Kingdom, Italy, Germany, Japan, Fance, Belgium, and the Netherlands.
T11CSC CLIntries take about 90% of the Sdanese exports, or about 76 of
thC Wrld'S SUppl (Whistler ad Berniller, 1973).
1.2.3 Acticitt enegal Gum
1.2.3.1 Classificatioij
Fainily: LCgUnlinacae
GC11LIS: Acticia
SUbge[WS: ACUleiferUrn (Vassal)
Series: VUlgares (Bentharn)
Species: selh-,gal
1.2.3.2 Acacia senegal Tree
Acucici senegcil is small tree 212 in. igh, bark yellow to lght
brow o ray, Young branchlets, leaves 16 cin. long, flowers wite or
CrCW11, Fruit flat sti-aigiltoblongiiieiiibraiieousdisliiscentpods3-24xl-33
cm., pale bi-o\viitosti'awcoloui-edflowersNov.toFeb.,fruitJan.toApriI
(Flainin, 990).
4
1.2.4 Grades nd Processing
The Guni Aabic Co., Ltd. provides different gades of gum derived
fi-oni Acacio sencWtil. However, tile "HANDPECK, SELECTED" grade
(bigger tars, lighter MOM) eain te qalities of coice for food,
beverage and pharmaceutical applications. GM-i arabic ay be further
processed by kippling, powdering ad spray-drying (G.A.C., 1993).
1.2.5 Main Uses
Gurn arabic i sed extensively in many kinds of industries e.g. te
I'Ood iustries, pharmaceutical, edicine, cosmetics, in local medicinal
and other industries.
1.2.5.1 Food ndustry
the major use of A. eegal gurn is ill. the food industry as a food
ad Iditive because it is nontoxic, oderless, colourless, tasteless and
completely water soluble and does not affect the flavor, colour of the food
to wich is added.
In confectionery gUrn arabic is used to retard crystallization of sugar
and to act as an emulsifier and as stabilizer in fi-ozen dairy products, such
as ice crearns, ices and sherbets, because of it is water absorbing properties
(11�'.aramalla, 1999).
For its viscosity and adhesive property in bakery products.
I lowever i citrus and imitation flavors as an emulsifier, as the flavor
11X,ttiVC, eulsifier and potective colloid in flavour emulsions. It acts as
5
Fonw s!Libilizer and colliding agent i beer ad other beverages and as filrn-
I'01-111ing on H S1`aCeS ill chocolate ad snaks. Its o\v level of
niad)(flization, high fiber cntent is useful i diabetic ad dietetic poducts
(Wilistler nd l3cmiller, 973).
1.2.5.2 Pharmaceutical Industry
GUM 11-abiC i Used i te plinirmacel-Itical idustries as stabilizer For
e111L11SiO11S inder ad coating for tablets, eollient ad delnulcent or
COUgh drops ad Srups Thevenet, 1990).
1.2.5.3 Medicine
Gum arabic is also used medically as a dernulcent. to sooth
irritation, specially of te 11LICOUS embranes ad has been shown to lower
the colesterol levels in the blood of laboratory animals (Gabb, 1997) Te
addition of a 7 gUrn. arabic solution reduce te dissipation rate of te
SOdil.111 cloride Slutio (Wliistler and Berniller, 1973).
In plastic Srgery a 0% gm arabic adhesive has been used
Successfully in grarting destroyed peripheral nerves (Whistler and Berniller,
1973).
1.2.5.4 Cosincties Industry
Ill te cosmetics idustry gum arabic is used as a adhesive and
constricting for facial rnasks, face powder, to give smooth feel to lotions
und protective creams Thevenet, 1990).
6
1.2.6 Physicochenfleal Properties of A. senegal Guni
1.2.6.1 Moisture
The hardness ofthe gm ould be determined by oisture content.
'File IlloiStUre Cntent of good uality gum does not exceed 15% and I %
I')r graiwiar ad spray dried aterial respectively WAO, 1999).
1.2.6.2 Ash
Anderson a Dea(1968)atidSicidig(1996)repoi-tedtliattlietype
of' te soil aected te ash content significantly and the presence of
inorganic elements existing in salt or sould be indicated by ash content.
Recently FAO 1999) reported that te ash content of A. enegal gum is not
nior ta 4.
1.2.6.3 Nitrogen Content
Studies of the role of nitrogen and nitrogenous in the structure,
physicocheinical and functional properties of gurn arabic, done by
(Anderson et al., 1985; Common et al., 1986 and Eric et al., 199 1) showed
that tere was a strong correlation between te proportion of protein in tile
gL]Ill and its eulsifying stability. Moreover, tese proteins are responsible
for te cross-linking of te arabinose-galactan patterns (Anderson and Dea,
I 990).
Akiyarna et l 1984) established tat the amino acid composition
01' gUrn arabic is rich in hydroxyproline and serine while alanine content is
low Aderson et al. 1985 sowed tat te variation in te protien content
7
'WkIS MMIlly due to different localities. Awad Ekarieni 1994) eported tat
tile average itrogen content at different commercial grades is around
0. 2 8'�'o.
1.2.6.4 Acidity and pil Measurement
The ain content of commercial guni arabic is arabian (acid
SUbStMICC ad when is decornposed it gives arabinose (Mantell, 1965 so
that gUni arabic is called arabic acid Terefore te gum Sutio i Sightly
acidic pl-I 45).
1.2.6.5 Solubility
Gum arabic can yield Slutions up to 60% concentration and it is
trul Suble in cold water. Other gums are either insoluble in cold water or
forn-, colonia Sspensions, not true solutions (G.A.C., 1993).
1.2.6.6 Specific Rotation
The specific rotation is considered as te ost important criterion
Of pI-ity and ientify Of gUm arabic, because the direction and magnitude
of te otation are caracteristics of te specific gurn and it is used to
dilTerentiate between A. eegal gUrn and other botanically related Acacia
gums. Both autohydrolysis and ultraviolet irradiations, have no effect on
optical rotation while mild acidic hydrolysis has a significant effect on
optical rotation (Barron et al., 199 1 ).
FA0 ( 990) considered tat te speci fic rotation of A. enegal gurn
to be aging between 26' to 34' Rcently Kararnalla et al. 1998)
8
showed that the mean value of specific rotation of the commercial A.
Senegal gum is 30'.
1.2.6.7 Equivalent Weight and Uronic Acid Anhydride
Titratable acidity, which is the mls. of 002 N sodium hydroxide
that neutralize 10 mls. of 3 gum arabic solution, represents the acid
equivalent weight of the gum, from which the uronic acid content could be
determined (Karamalla, 1965; Anderson et al., 1983; Vandevelde and
Fenvo, 1985 and Jurasek et al., 1993). Anderson et al. (I 99 1) reported that
A. eegal gum from Sudan has 1050 equivalent weight and 17% uronic
acid. Recently, Jurasek et al. (I 993) calculated an equivalent weight of A.
senegal to be 1020 and the uronic acid anhydride as 17%. Moreover,
Karamalla et al. (I 998) reported 1436 for equivalent weight of A. enegal
gum.
1.2.6.8 Viscosity
Studies of flow of gum solutions plays an important role in
identification and characterization of their molecular structure. Koufman
and Falcetta (I 977) showed that viscosity can be presented in many terms
such as relative viscosity, specific viscosity, reduced viscosity, and intrinsic
viscosity which is used to determine the molecular weight of A. enegal
gum (Anderson and Dea, 1969).
9
'rile viscosity Of gUrn arabic Sution is inversely proportional to
teiriperatLWC, varies with te p (Osborne and Lee, 1951).
1.2.6.8.1 Intrinsic Viscosity
Intrinsic viscosity is considered as te ost important aalytical
parameter tat i sed to calculate te molecular weight of A.'senegal gurn
beside it eesents te most crucial physicochernical finger print to
diStillgUiSll /1. senegal gLI111 frorn te acacia gurns as well as natural or
SY11thetiC gms Anderson and Dea, 1969).
Vandevelde and Fenyo 1985) found tat the intrinsic viscosity for
some A. senegal gUrn oiginated fi-orn Sudan was in the range of 14-15.5
In1h,
Anderson et al. (I 987) showed a significant decrease (5 ml -3/g) in
intrinsic Viscosity Of gum arabic due to aUtohydrolysis and ultraviolet
radiation.
1.2.6.9 Molecular Weight
Acacia gUnis are of very high-molecular weight, with average value
or 600,000. Te great values are due to eterogeneity as well as te
variation in te techniques used to separate, purify and determine te
11101eCAllar weight. 'rile most common ethods ave been used to determine
the molecular weight may be te intrinsic viscosity easurements
(Anderson et al., 1983 ad Phillips and Williams, 1989).
M
pplacation of Mark-Houw,nk equation indicated that the viscosity
5average weight of Acacia enegal gum was 64 IO (Alain and
McMullen, 1985).
1.2.6.10 Reducing Sugars
Reducing sugars of A. enegal gum is usuall; calculated as
arabinose. The presence of reducing sugar gives evidence to the reducing
power (free reducing groups) of this type of gum (Somogyi, 1945).
the range value of reducing sugar reported by Anderson and
Karamalla (I 966) for A. enegal gum was 0 16-0.44%.
1.2.7 Functional Properties
1.2.7.1 Emulsifying Stability
Emulsifiers are classified as a group of surface active agents that
can (abilize a dispersion of two liquids such a- water and oil which are
essential for emulsion formation and stabilization to occur (Kinsella, 1979).
Gum arabic produces highly stable emulsions making it very useful
in the preparation of oil in water food flavour emulsions, particularly for
citrus oils (G.A.C., 1993).
Emulsion stability is also very dependent on gum concentration
'%viffi eulsion breakdown and creaming especially rapid at concentrations
<20 g/litre (Underwood and Cheetham, 1994).
1.2.7.2 Water Holding Capacity (W.H.C)
The W.H.C is the ability of the material to hold water against
gravity (Hansen, 1978).
1.2.8 Structural Features of A. enegal Gum
Gums are polysaccharides that contain methoxyle, acetyle and
carbonyl groups, uronic acids and inorganic elements.
Gum arabic from A. enegal (L.) Willd is a-. heteropolymeric
proteinaeous polysactharide;, that consist of high molecular weight
molecules with their calcium, potassium and magnesium salts. The natural
principle sugar residues present in the molecule are D-galactose 41-53%),
L-arabinose 25-27%), L-rhamnose (10-14%), Dglucuronic acid (12.5-
18%) (Anderson et al., 1983).
The structure of the gum arabic contains numerous glycosidic
linkages as the major bonds with different ring forms, many side chains
and peptide linkages would be present in the gum molecule.
Gum arabic complex structure is still not completely known but
many structural studies indicated that tha main structure of the gum arabic
is composed mainly of 1-3-0-D-galactan units, with glucosidic bonds, and
the branches are attached to 1-6-p-D-galactopyronose branches. Location
of the 1---*6) linkages is ncertain, but some of the a-L-rhamnose residues
in the gum arabic are joint 14) to P-D-glucopyranosyl uronic acid
residues, and the arabinose partly as a-L-arabinofuranose end groups, and
12
IN-.�111 11<ed thl-OLIgh t I and 3 positions. Fig.(I)shows tile proposed
.Stl'L[CtLll'C 101- gUni arabic by Aderson et al. ( 1 983).
A kind of'other gUJIIS 1oni acacia secies ave te same general D-
galactan corc with variatio i te degree of banching, the ature ad
attachment of' te peripheral L-arabinose and L-rharnnose units Anderson
et al., I 987).
Studies of te gUrn structures of the polysaccharides are generally
determined by tle following methods:
(i) Methylation.
(ii Smith egradation
(iii) Hydrolysis methods
(1vi Chromatographic techniques including electrophoretic techniques.
1.2.8.1 Methylation
Methylation of A. eegal gUrn was done by Street and Anderson
1983) using rnethanlysis rnethod and ten sown a series of methyl sugars
and 2,4-dimethyl galactose predominates (as the main residues). A ratio of
galactose end-grOUp and a deficiency of uronic acid have resulted from
incomplete separation of 2,3,4,6-tetrai-nethyle galactose and 2,3,4-trii-nethyl
arabinose was also pointed out.
1.2.8.2 Smith Degradation Method
'riiis rnethod provided te pesence of uniforill blocks of 13 linked
galactose units, eac cain contains 13 galactopyronose units (Churrns and
3
Ca
cr 00L'3
cr(J O
cr Cd\ (.)- (9 - <1 -
% LACL
-rf 4)ir fr
lF
(P4o
(D Ir .5 AZEr
CL
D 4-4
cd
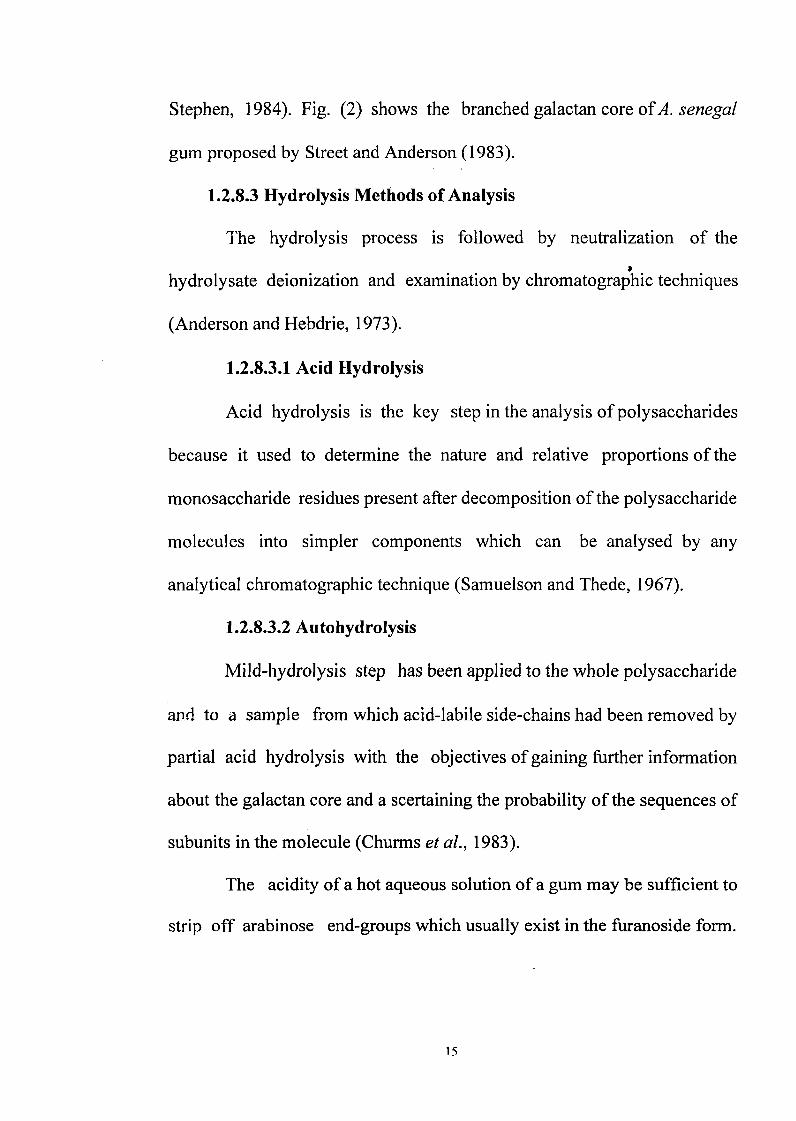
Stephen, 1984). Fig. 2 shows the branched galactan core of A. enegal
gum proposed by Street and Anderson (I 983).
1.2.8.3 Hydrolysis Methods of Analysis
The hydrolysis process is followed by neutralization of the
hydrolysate deionization. and examination by chromatographic techniques
(Anderson and Hebdrie, 1973).
1.2.8.3.1 Acid Hydrolysis
Acid hydrolysis is the key step in the analysis of polysaccharides
because it used to determine the nature and relative proportions of the
monosaccharide residues present after decomposition of the polysaccharide
molecules into simpler components which can be analysed by any
analytical chromatographic technique (Samuelson and Thede, 967).
1.2.8.3.2 Autohydrolysis
Mild-hydrolysis step has been applied to the whole polysaccharide
and to a sample from which acid-labile side-chains had been removed by
partial acid hydrolysis with the objectives of gaining further information
about the galactan core and a scertaining the probability of the sequences of
subunits in the molecule (Churms et al., 1983).
The acidity of a hot aqueous solution of a gum may be sufficient to
strip off arabinose end-groups which usually exist in the furanoside form.
1 5
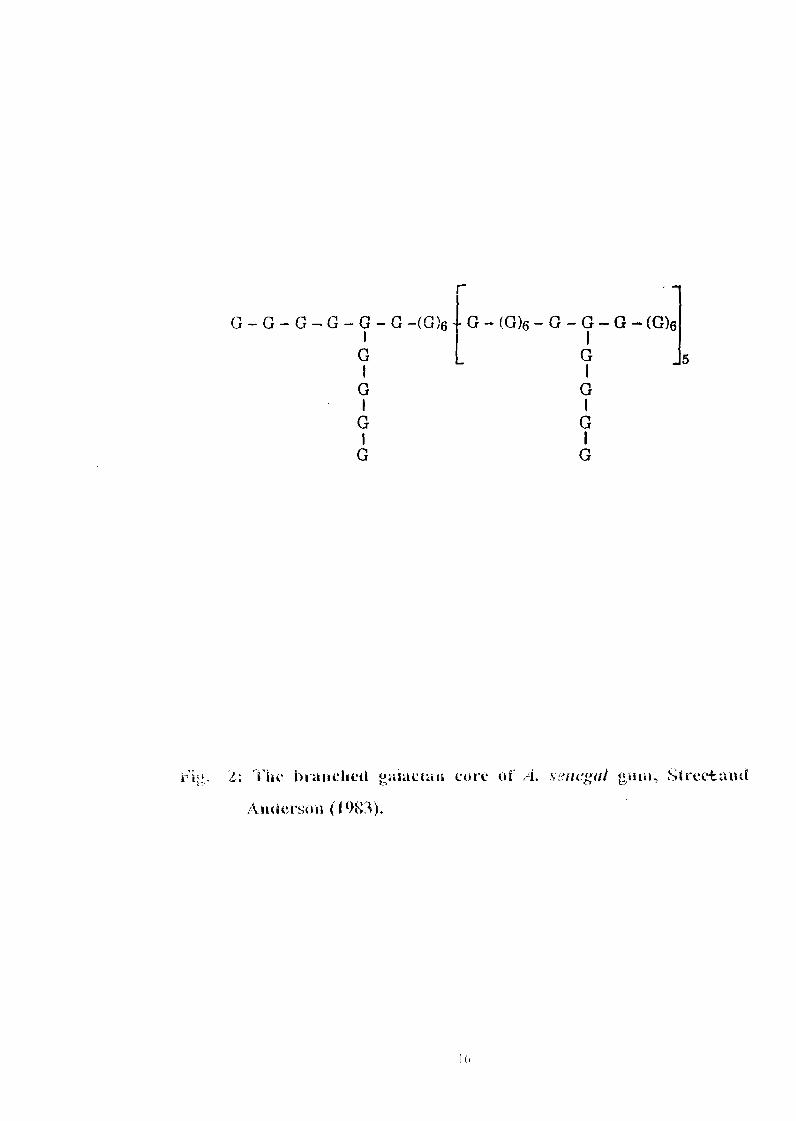
G - - G - G - G- a-(G)6 G - G) - G - G-a- (G)r,
L G -5
G G
G
2- Tii brallelled oaiaclall Core of A si"ile-al oulik, "'Irectund
ildersoll
I 0
This nrocess known as autohydrolysis, produces a degraded polysaccharide
having a simpler structure than the original gum (Karamalla, 1965).
Autohydrolysis has also shown an insignificant effect in sugar
composition of gum arabic (Anderson and McDougall, 1987a).
1.2.8.3.3 Partial Acid Hydrolysis
In a polysaccharide a series of successive sugar units and the
characterization of disaccharide and oligosaccharides which are formed
during the breakdown of the polysaccharide moleculP can be determined
by partial acid hydrolysis which is a most useful technique. These sugars
can be separated from one another by chromatography on charcoal or celite
(Whistler and Miller, 1958); cellulose (Hough et al., 1949); resins column
(Jones et al., 1960).
Partial acid hydrolysis also gives information about the mode of
linkage of each sugar unit and the ratio of none reducing end-groups.
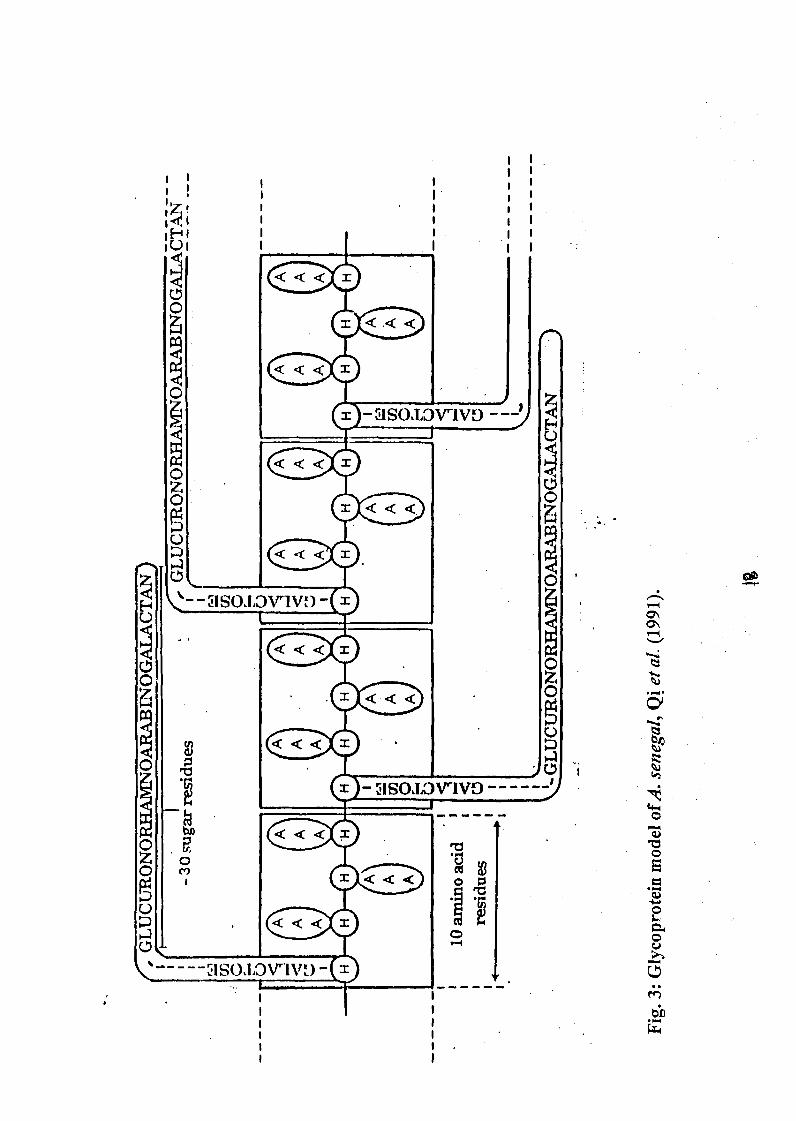
1.2.8.3.4 Alkaline Hydrolysis
It is clear from alkaline hydrolysis, that most of the carbohydrate
are attached to the polypeptide backbone base as a small residues 30
residueG' of hydroxyproline. Polysaccharide substituents are linked through
O-galactosyl hydroxyproline glycopeptide linkage (Lamport et al., 1991)
hence the molecule is described by Qi et al. (I 99 1) as "a twisted hairy
rope" Fig. 3).
17
)-SSOLDWIVD
t3
< <
t:l
4-4
bl)
1.2.8.4 Chromatographic Techniques
Chromatographic separation may poceed tough te action of a
single liquid fce in a process analogous to absorption chromatography in
COIL111111S, or two immisible solvents may be eployed on paper
chromatography.
1.2.8.4.1 Thin Layer Chromatography (TLC)
TU' aff'Ords a siniple, rapid ad sensitive ethod for tle alitative
'111d (IL1,111titative aalysis of low nioleUllar weight sugars and their
derivatives. ''lic separation base upo o adsorption, partition, or a
combinatloil o'both effects, Or pon exclusion, depending on tile particular
type 01' UppOrt, its peparation ad its se with different solvent (FAO,
1978).
Carbohydrates, being strongly hydrophilic, require polar solvent
systems. T%-se solvents have relatively low migration rates requiring from
0.5 to 3 IIOLII-S or one ascent of te plate.
A limited esolution of te simple sugars is attained on silica gel
(G i which these Cmpounds igrate rapidly on it, with relatively non-
polar solvents ad resolution of ,P-anomers and pyranose and furanose
Sugars ae observed (Lewis and Smith, 1957). To calculate R values
chroniatograms of authentic specimens or reference standard ust be
prepared bt ore accurate quantitative easurements must be rnade by
desitonietry or careful eoval of te spots fi-orn the plate, followed by
9
or careful removal of the spots from the plate, followed by elution with a
suitable solvent and spectrophotornetric measurement (FAO, 1978).
A survey of the literature suggested that TLC is now a routine
procedure for examining the purity of synthetic carbohydrate compounds
(FAO, 1978).
1.2.8.5 Ultra Violet (UV)
I UV is not only used to show the presence of individual functional
groups, but also to show the relationships between functional groups
chiefly conjugation, and the presence of aromatic ring. In addition UV can
reveal the number and location of the conjugated systems (Morrison and
Boyd, 973).
1.2.8.6 Fractionation
There are many fractionation techniques used for the examination
of polysaccharides. These include fractional precipitation, complex
formation, preferential solubility, various chromatographic methods and
electrophoresis.
Fractional precipitation is the simplest method. It involves the
addition of a precipitant to unaqeuous solution of the gum and the
subsequent isolation of fractions having different solubilities. Co-
precipitation may occur, and may necessitate several reprecipitations of the
component (Anderson and Dea, 1969"
'O
Some polysaccharides form complexes with certain reagents.
Therefore, this characterization is considered another technique for
fractionating polysaccharide mixtures (Erskine and Jones, 1956).
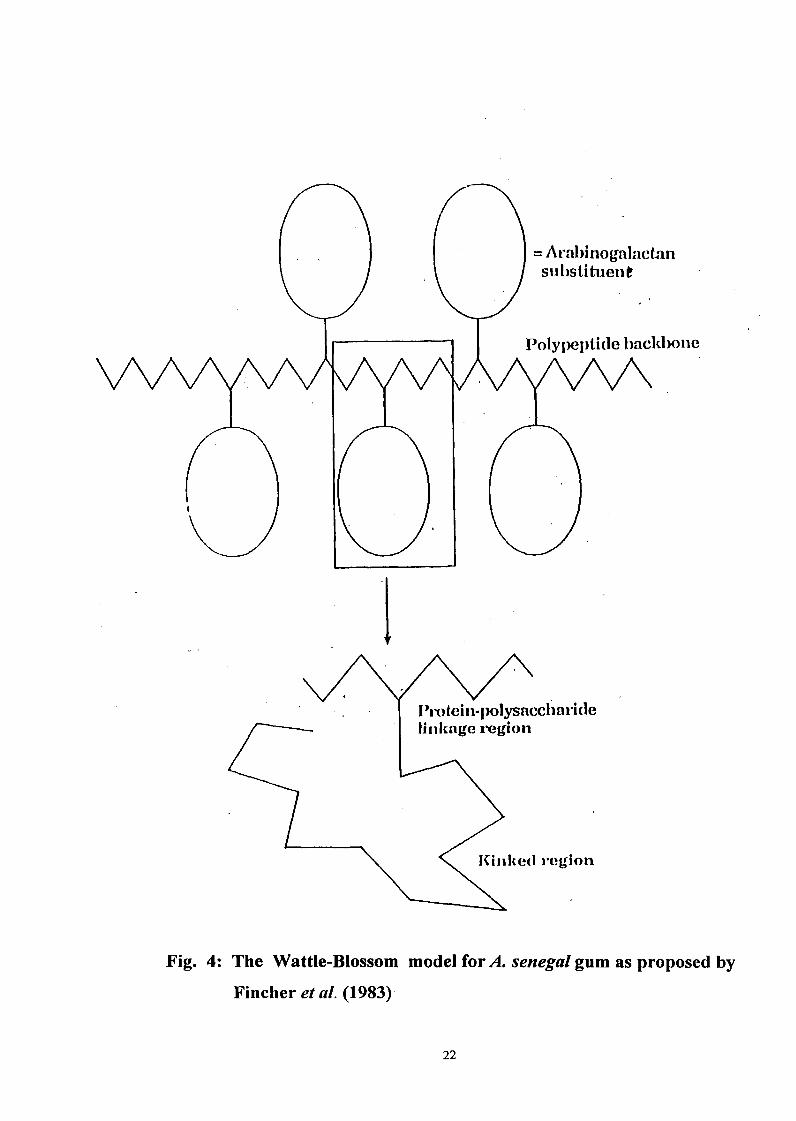
Wattle-blossom model of A. enegal proposed by Fincher et al.
(1983) indicate5tha a few large polysaccharide substituenIs are arranged
along the polypeptide backbone of serodial macromolecule (Fig. 4. The
analysis of three fractions showed that the component of these fractions
have a similar ratio to charbohydrate blocks linked to a main polypeptide
chain (a P-1,34inked galactan core) whilst differing in their molecular
weight and protein contents. The arabino galactan protein fractions were
degraded by pronase to yield a component similar in molecular mass to the
bulk of the gum providing a further support for the wattle-blossom model
(Randallet al., 1989).
Gel permention chromatography showed that A. senegdl gum
consists of essentially three molecular mass fractions classified as an
arabino-galactan (AG), arabino-galactan protein complex (AGP) and a
glycoprotein (GP) (Anderson and McDougall, 1987a).
1.2.9 Sources of Radiation
Throughout history man has been exposed to radiation from the
environment. This natural background radiation comes from four main
sources, cosmic radiation, radiation from terrestrial sources, radioactivity in
the body internal sources) and radon (UNEP, 1991).
2
ArabinogalacUinSubstifilent
Polypeptide backbone
Proicill-polysacchalidefinicage region
inked rgion
Fig. 4 The Wattle-Blossom model for A. enegal gum as proposed by
Fincher et al. 1983)
22
lit addition to the atural sources of adiation, many atificial
SOLH-CCS ave been introduced during ,his century Tese atificial sources
now I-CSL11t i a significant contribution to te total radiation to exposure of
tile POI)LIlation.
1.2.9.1 Interaction of adiation with Matter
When radiatio ipinges o a target material, it brings pysical,
cheniical and biological eects by tansferring its eergy to tile aterial
thu t akes canges in te pysical and chernical characterization of
that material. The complex sequence of events leading to these changes can
be divided i to tree steps Norman and Henry, 1960):
(i) Th tansfer of eergy fi-orn radiation sources to the target material;
(it) 'I lie tansformation of the energized region into particular excited
and active atornic and molecular species which produce the
changes characteristics of the material; and
(iii) The reaction of tese species among thernselves and with their
environment wich lead to these canges.
1.2.9.2 Absorbed Doses
Dose is a general term denoting the quantity of radiation or energy
absul-bed. If nqualified, it refers to absorbed dose (William's et al., 985).
And it is te amount from any type of radiation that required to make a
significant efrect in food, Sch as sterilization in different forms of food
and its a easonable easure of te cemical and pysical effects crated by
23
a giiven radiation exposure in an absorbing material (Genn, 1988). This
dose as a relationship with calculations that are relevant to the radiating
source e.g. engineering aspects, power of the source and the. power of
entitling radiation. Therefore, the following points should be taken into
account (Sharbash, 1996):
6) Kind of radiating source and its power;
ii) Systern of emitting radiation ftom engineering point; and
i:) -he density of the nutrifiv- inaterial that is needed to be radiated.
The unit of absorbed dose is the Joule per kilogram (jkg-'), given
the Social name of gray (Gy) in the SiN systcm previously te rad, was
special unit for absorbed dose (Williams et al., 1985).
I GY= I Jkg-1 I 00 rad
-1.2.9.3 Radiation Units
1.2.9.3.1 Electron Volt
I,- is the traditional unit for the measurement of radiation energy and
del'. Tried as the kinetic energy gained by an electron by its acceleration
throtiah a potential difference of one volt (Genn, 988).
1.2.9.3.2 Rad
It is te historical unit ofabsorbed dose. An allowable abbreviation
for rad ',.s rd, but this is seldom used (Donnell and Sangster, 1969).
SI thifts SI (system international d'unites.
24
I rad Io Joules
I Ox2.389 calories per gram
1.2.9.3.3 Gray
The gray (symbol Gy) is the special Si unit for joule per kilogram
(Willianis et al., 1985) and it's the unit of measuring the abs�rbed dose of
radiation then it replaces the rad (Sharbash, 1996).
1 gray I 00 rad
1.2.9.4 Effect of Radiation on Solid Matter
After the energies (photons) travelling through the solid matter for a
time, they gradually lose their energy by producing radiation damage and
an election or hole may become trapped at a localized site where electronic
field configuration of the crystal permits and the properties of the solid
matter may then be changed (Sharbash, 1996).
1.2.9.5 Radiolysis of Water and Aqueous Solution
T.he radiolysis of water produces only two substances, hydrogen
and hydrogen peroxide according to the following equation:
21420(liquid) radiation H2 (gas) H202(liquid)00.
The amount of each of the products may depend on the temperature,
trace impurities, pH and on the kind of radiation.
25
Many features of the radiolysis of water and aqueous solutions can
be explained on the assumption that the primary active species produced by
radiation consists of hydrogen atoms and hydroxide radicals.
H20 H' +'OH
The precise details of the mechanism of the formation of these
species are still in dispute. These radicals are formed in close association
with one Another in the spurs of the radiation track. In each spur there are
of the order of five or six such radical pair and of the recombination
reactions, one restores the original molecule and two others.form. hydrogen
and hydrogen peroxide.
H'+ 'OH O- H20
H' H 10 H2
1 OH +'OH 0- H202
As the unrecombinded radicals diffuse away they can react with
hydrogen and hydrogen peroxide molecules which were formed at different
sites according to the reactions.
H- +H202 H20 + 'OH
OH H2 H20 +'H
26
A lUmber of' radicals formed with a given arnount of radiation
energy are related to te radiation dose. I addition to the radicals 'FI and
.Of I te are a number of other active secies that appear to be formed by
SeCO11dary reactions i irradiated water. These SUggested species iclude
I lo2 I and perlial)s solvated elections which Nvere analogous to
Solva!Cd J)rotoils Norinan and Henry, 1960).
1.2.9.5.1 Oxidation-reduction Reactions in Aqueous Solutions
The classic definition of oxidation and reduction is te loss and gain
of' elections, respectively. It is apparent tat te radicals produced in water
can function as oxidizing ad reducing agents. A hydrogen atom can be a
1'edLICing agent or electron donor. A hydroxyl radical can be an electron
acceptor or oxidizing agent (Norman and Henry, 1960).
I-" 120 Do 130 + e
.01-1 + PI 01-1-
1.2.9.6 Effect of Radiation on ydrogen Bonds
Hydrogen bonds wich link peptide chain with protein molecule are
decomposed by the idirect influence of radiation because of te reaction
of' 1ree gi-OLIPS, specially hydroxyl goups that are produced after
degradation of' water by irradiation, with ydrogen atorns which are
27
I-CICISCd Il-0111 l1YdI-OgCI hIClS t IN-OCILICe ater 1110leCUles (Sharbash,
1 990).
1.2.9.7 [ffect of adiatio o Polysaccharide
The extent of egradatio o polysaccliaride depends uo te
radiatinL! dose sed and tle condition surrounding te adiation e.g.
temperature ad oxygen, also depends uo te nature of polymer.
lZadiation firstly causes degradation in peripheral cains and
secondly i randorn area at different sites in the main chain. With
increasing of adiation dose different products are produced (Sharbash,
1996).
1.2.9.8 Gamma radiation 60CO (7):
1.2.9.8.1 Te Nature ad Sources of Gamma Radiation
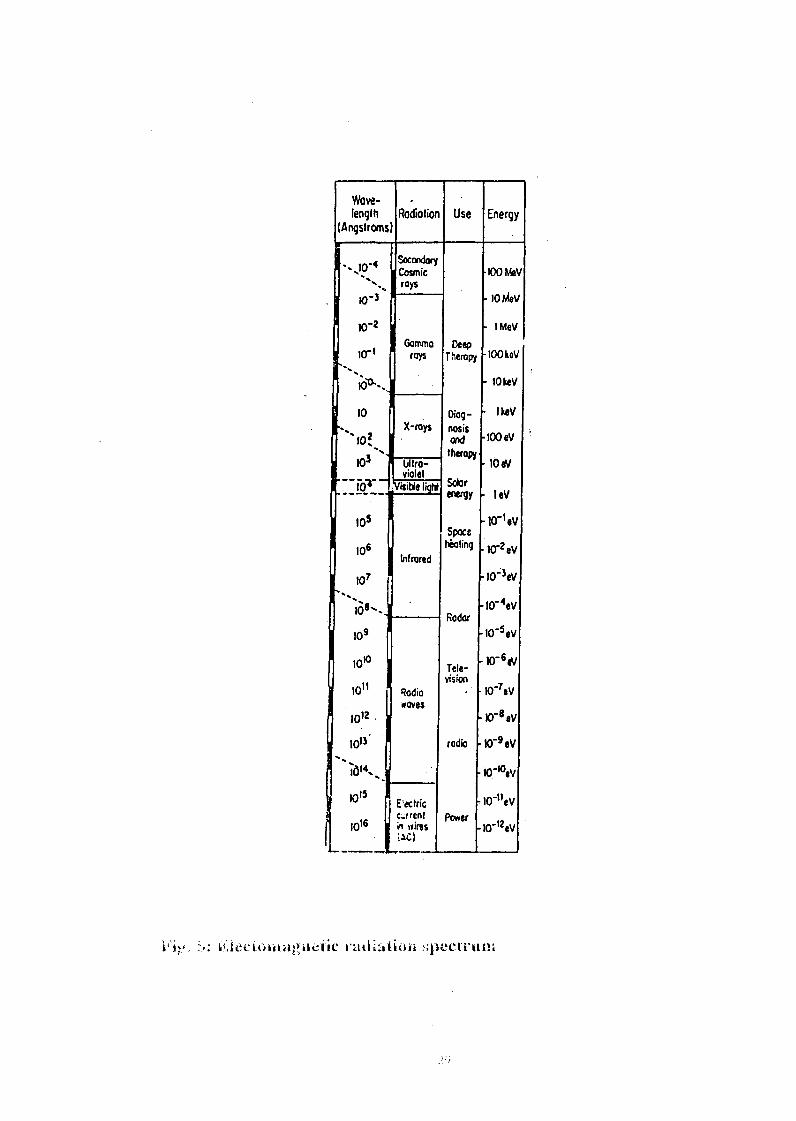
Electromagnetic radiation spectrurn as shown in Fig. (5) represents
tile relationship between y rays and the other electromagnetic radiation
(photons and ratio, ... etc.). These electromagnetic radiations are different
in the It-eqUCncy a te wave length Wile tere is no difference between
a X ays i tile wave length but tey are different in te original
radiation oint. y ays are defined as te electro magnetic rays produced
1'rom te JMICIeLls during te decay of a radioneuclide while X rays are
clectronitignette adiation generally prodUCCCLI frorn the transformation
iIlClLIdCd te cyclic elections atom. Mostly y rays ernission after a and
gI-',l,fdLIlaIcs emission irectly fi-orn te nucleus (Wang et al., 1965).
28
Wave-length Radiation Use Energy
(Angstrorns)
0-4 Socm&ryCosmic 100 IMV
rayslo-] lo Mev
10-2 1 ev
Gamma Deeprays Therapy 100koV
10 kev
10 Diag- I keVX-rQYS nosis
2 10 eV10,
103 Itierapy lb eVviolet Solar
104 energy I eV
105 lo-' eVSpace
106 Infrared fibating 10-2 eV
107 10-�!IeV
10-4eV168-. Radar
109 10- eV
1010 Tele- lo- eVvision
1011 -7Radio 10 eVwaves
iol2 JO-8 V
1013, radio W9eV
1614,, 107100v
1015 Eectric IO-NVCaren Power1016 . . -12evA wires 10
1.2.9.8.2 Cobalt-60
Symbols 60CO27 it is a solid grey substance with 883 g/cm 3 density
5that melts at 149'C. Naturally found a 9Co and consists of 27 protons and
32 neutrons. When 59Co is exposed to slow moving neutrons it absorbs
neutron and converts to 611CO which is radioactive isotope of cAalt, having
physical half life of 52 years (Williams et al., 1985).
Two kinds of gamma rays are emitted from 60co:
(i) Gamma rays of 1 1732 mega electron volt Mev.).
(ii) Gamma rays of 13305 mega electron volt Mev).
16spreferred that 60CO which is used in the field of food radiation to
be coated by two capsules in each coat in order to:
(i) Prevent leakage of radiating substances to the surrounding
environment.
(ii) Prevent the radiating element from environmental conditions such
as exposure to radiation and dissolution of oxides that are
produced in water basin tank (Sharbash, 1996).
1.2.9.8.3 Interaction of Gamma Radiation with Matter
Gamma rays are energies target materials primary by numbers of
process but there are three important mechanisms which are dependent on
the atomic number of the target material and the energy of the gamma
photon (Wang et al., 1965).
30
1.2.9.8.3.1 Photoelectric Effect
In tis pocess a single Data poton (liv) is completely absorbed
hy '11 1m of., the target with the transfer all te energies to the electron.
TNS pCCSS I-eSLIltS in tile emission o'a Free electron with a definite kinetic
energy F given by:
I E Y EB E
Where: E is te aquired garnma rays.
I . is te binding eergy of te eectron.BE
The energetic Free electro tansfers its kinetic energy at atorns by
collision and finally combines wit oe of the eutral atorns resulting i a
llegltiVe in Or IICLltl-,-Ilized positive ion Norman a(] Henry, 1960).
1.2.9.8.3.2 Compton Effect
This process can be considered as a collision process betwee a
photon oenergy (liv ad a obital electron of binding energy (Be) wich
is eected with a kinetic energy (Ee). A poton of energy (hv) is scattered
(Iskel', 1986 and UNEP, 1991 .
I-IV Ee + hv- Be
The result of such a collision is the transfer of partial energy and
1110111CIAL1111 to te electron at te expense of the energy and momentu of
tile photon which does ot vanish, but is degraded to a photon of lower
3
Cliel-gy which lay intei-act again t I)I-OCILICC Further compton electrons or
1diotoelecti-mis (Wang el l., 1965.).
1.2.9.8.3.3 Electron Positron Pair Production
hi tis process a gamma poton which is te electromagnetic field
(C a igh energy iteraction with te strong electric field of the ucleus to
I'01-111 SilllUltatleOLIsly ad a position pair formatio Tis process is possible
only at photon energies >1.02 Mev., twice tile rest mass of the electron, and
increases with tile square of' te atomic umber of te absorber Norman
,nice I leni-v, 1960).
1.2.9.8.4 Absorption of Gamma Rays
i ligh eergy electromagnetic adiations lose a certain fraction of
their energy i passing trough each nit thickness of materials and thus
they nver ave a definite range. At any depth of penetration. Tere is still
sonie aiation present. Te absorption depends on the energy of the y-
photon, of' esity of aterial ad on the atornic numbers of its
components. After passing trough 10 cin of water I Mev. y-radiation loses
abOLIt 50% o'its initial intensity (Sharbash, 1996
1.2.9.8.5 Effect of Ganinia Radiation on Viscosity Measurement
The viscosity of tile acidic polysaccharides, gum karaya and gum
tragacanth, following garnma irradiation at low doses <1000 Gy.) was
Unchanged or slightly higher wen compared to the unirradiated (control
32
samples). Above I 00 Gy ispersion viscosity decreased wit icreasing
close (Karen, 1993).
1.2.9.8.6 Effect of Ganinia Radiation on Carbohydrate
Composition
l3okliary et al. (I 983) found tat tere was very little deqease in tile
content of' carbohydrates with dose of iadiation. With 4770 k. rads of
irradiation tile carbohydrate content decreased b 24.2 rng/grarn of gum
and tey eported tat iradiation ad no significant effect on the
carbohydrate content orA. senegal gum.
1.2.9.9 Ultraviolet (UV) ad nfra Red R) Radiations
Ordinary white light ay be broken Lip into a spectrum by passing it
till-OLIgh a tiangular prism. In the spectI11111, we observe the colors ranging
from ed at one end to violet at the other. But there are colors that we can
not see (beyond) te violet ae the ultraviolet rays that cause sunburn
(bellow) te red are the infrared rays Morrisn ad Boyd, 1973).
1.2.9.9.1 Ultraviolet Radiation
The ost common sources of ultraviolet radiation exposure to man
i Snlight and there are about % of eergy of terrestrial solar radiation in
tile UV Law and Haggith, 1982).
The ultraviolet region lies beyond the violet end of te visible
spectrum between 190-380 nrn ad for visible ultraviolet between 380-
800 Jim (.James ad Stanley, 1988).
3 3
1.2.9.9.1.1 Medical Application of Ultraviolet Radiation
Ultraviolet adiation as a variety o'applications i edicine wich
are SLIffloiarized i Table (I (Law and Haggith, 1982).
1.2.9.9.1.2 Effect of UV Radiation o Electrons
'['here are any kinds of electrons such as a cy electron a 7r electron
and i n electron (a nonbinding electron tat is one of an unshared pair),
which have bee canged fom one orbital to another orbital of higher
energy A Y electron is eld tightly, and a good deal of energy is required to
excite it. Eergy corresponding to UV light of sort wave length, in a
region (f,Ir) UV Outside te ange of te usual spectrometer is chiefly
excitations of te comparatively loosely eld n and 7r electrons that appear
i te ear UV spectrum and of these only chumps to the lower more stable
excited states Marrison and Boyd, 1973 .
1.2.9.9.1.3 Effect of UV Radiation on Gum Arabic
UV radiation reduces the viscosity of gurn arabic mucilage
irradiated for 2 hours in open dishes (Zucca, 1954).
1.2.9.9.2 Infra-red adiation (IR)
The IR rays are of particular iterest to us because tey are
important in te study of heat.
3.1
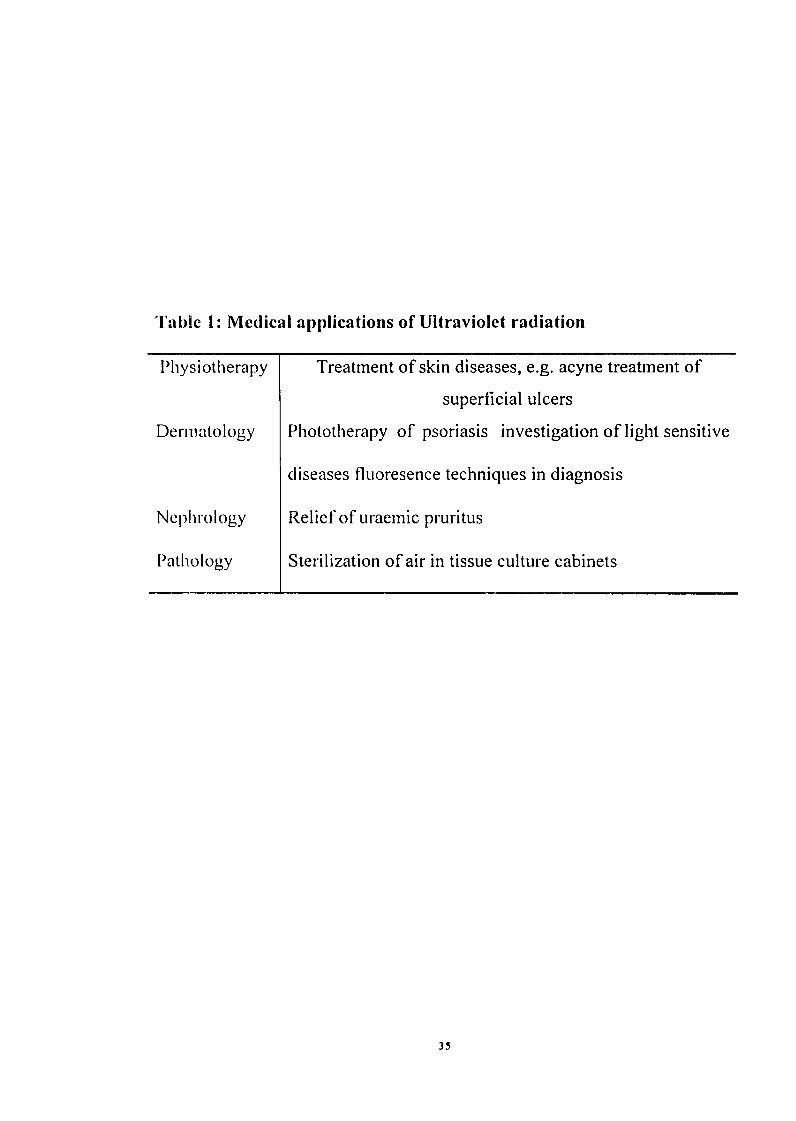
Table 1: Medical applications of Ultraviolet radiation
Physiotherapy Treatment of skin diseases, e.g. acyne treatment of
superficial ulcers
Dermatology Phototherapy of psoriasis investigation of light sensitive
diseases FILloresence techniques i diagnosis
Nephrology Relief Of Uraernic rUritus
Pathology Sterilization of air in tissue culture cabinets
35
it, kict every (reject eniits IR radiation, even at odinary roorn
teIIII)CI-�ILL11-e. The aiation is slight and it is also ow energy ad low
fi-CCI LIency bUt it is einitted Morrisn ad Boyd, 1973).
'I'lle IR egion of' te electromagnetic spectrurn is generally
considered to lie i te wave length age frorn 800 to 1060 nrn and is
SUbdivided ito tree subregions as follows James and Stanley, 1988):
(i)Tlie near IR region (near to te visible) extends from 0.8 to 2 Mrn;
(ii) Tlie middle IR regio (rom 2 to 1 5 Mrn); and
(i i i) Tlie Far I R egion From 1 5 to I 00 Mni).
TIIC Fundamental egion between 2 and 15 Mrn is te egion tat
provides te greatest information for te elucidation of molecular weight
strLICtLIre ad ost IR spectrophotorneters are imited to measurements in
this egion (UNEP, 1991 .
1.2.9.9.2.1 Effect of IR on Molecules
Absorption of IR radiations causes canges in vibrational energy of
dIC gI-OLIIId StItC NIIC 11101CCLIl te te tansition fi-orn vibrational level
to level I gives ise to Fundamental absorption of te molecule (UNEP,
I 99 I .
Just as UV absorption spectra are strictly caused by canges in
electric, vibrationni uIld rotational onergy, so IR absorption spectra are due
to canges i vibrational eergy accompanied by changes in rotational
energy (UNEP, 1991).
36
1.2.9.9.2.2 Effect of Heating (I R) on Gum Arabic
Gabel 1930) ieported tat te viscosity of guin arabic solution call
be Mcreased by rying te gUln Ver sulfuric acid or by heating the dry
gLI111. Moot-Jani a Narwani 1948) coined Gabel's results by an
increase of imbibed water in gurn micelles.
1.2.1 0 Objectives
The aims of tis Study are to:
1. Determine physicochemical properties of irradiated gurn show what
extent does aiation effect te physicochernical and functional
properties Of gum arabic and whether there changes add to the
structure Of gUrn arabic which make gurn arabic more useful
especially in te food industry; and
I Examine if tere are ay degradation changes in gurn structure and
Lo determine wich parameters of gurn arabic are affected by
degradation.
37
CHAPTERIANTO
MATERIALS AND iNILTHODS
2.1 Materials
Seven samples of Acacia metal guin (Al, A2, A3,44, A5, A ad
A7 ad a composite sample N sed in tis study were supplied by te
Gandil Agricultural Co. Ltd. wich were collected rom A. senegal (L.)
trees season 1994/1995 from Edainazein area (first picking).
2.1.1 Purification and Preparation of Samples
Samples sed for tis study were prified frorn impurities sc as
bark ad sand. Te samples were ground sing an unelectric mill. Part of
the samples were left at solid state ad te others were dissolved in distilled
water to give different concentrations and ten filtered trough glass wool.
2.2 Methods
1. Some physicocheinical and fctional properties for te seven
samples were determined to evaluate existing quality control
parameters and;
2. Te composite sample solid and solution of different concentrations
were sbjected to radiation sources as follows:
(i) By (T) rays from cobalt 60 with different doses: 150, 325 ad
500 Gy. sing the cobalt 60 machine for prposes treatment, serial No. 90
with exposure rate: 7780 Rh-1 in 2) and Surce equal 20 mm. dameter.
38
By (UV) light rom a low-pressure niercur-y lamp 320-400
nin 1or diffierent drations 2 4 and 6 hours.
The containers containing samples were placed at a fixed distance
6.5 cin froin te lairip.
(iii) Heating: a oven (Hereaus oven i which amples were
placed i open glass petri-dishes. Te solid samples were sjected to
different temperatures: 80, 105 and 140'C for ors. concentrated
solutions 20% were heated at 80 and I O'C for 60 hrs. For te treatment of
samples ade by (Y ad (UV) radiation solid ad solution samples were
placed i sequence in polyethylene sack, ad geornetrically symmetric
plastic containers which permit to complete transference of te radiation to
the target aterial without loss by refraction or absorption.
The effects of above treatments (1, i ad iii) pon physicochernical,
functional properties ad structural components were studied through te
following parameters:
2.2.1 Physicochemical Analysis
2.2. 1.1 Moisture Content
According to FAO paper No. 49 1990) two grams of te sample
were Treated i Heraeues oven at 105'C to constant weight for five hours
then te moisture content was calculated as percentage as follows.
Moisture content WI W- 00
WIWhere:
39
(-)1 g nal vVeight of' Sample g).
W2 Weight of sample after dying. (g).
2.2.1.2 Total Ash Content
I'lie ash percentage was deten-nined according to FAO paper No. 44
(I 990). 'I'wo grains of sample were weighed o dry basis ad ignited in
I leraeus electronic muffle furanance at 550'C for hours, tile ash content
was then calculated as percentage as follows:
Ash (%) �K WI I 0
W2-WIWhere:
WI = Weight of te empty crucible.
W = Weight of te crucible + te sample.
W = Weight of cnicible + ash.
2.2.1.3 Nitrogen and Protein Content
Nitrogen content was detennined ising a seini-micro, kjeldahl
inelliod according to AOAC 1984). Hence te protein percentage was
determined according to Aderson 1986) by multiplying nitrogen
percentage by te fctor 66.
N% VxNx l4x 100S
Where:
v = Volume of HCI 0.02).
1 = Atomic mass of itrogen.
40
N Normality of HCI (niol. dIII-3).
S Weight of sample.
Protein = N% x 66 66 which is the nitrogen factor for guin
hashab as proposed by Anderson (I 986).
2.2.1.4 Specific Rotation
The specific rotation was determined for 1.0% solution on dry
weight basis sing te Sodium Lamp Perkin-Elmer 243 Polarimeter with
a cell path length of I dcin at room temperature (25'C) afler filtration of
the guni solution through filter paper No. 42. Te specific rotation was
calculated according to (Moffit and Young, 1956) sg te following
equatioll:
a Zx 100D x L
Where:
Ct Specific rotation.
z Observed optical rotation.
C Concentration of te solution.
L Length of te polarinieter cell i din.
D Sodium Lamp 589 nin.
2.2.1.5 pH Value
pH was determined i 1 aeous solution at room temperature
using a pH iiieter KARL KOLB D.6072.
41
2.2.1.6 Viscosity Nleasui-ement
Viscosity was measured tislim, Utube viscometer (type BS/IP/U,
serial No.2948) with te flow time for 1% aqueous solution of sample at
room temperature (25'C). Te relative viscosity i,) was then calculated
using te following equation:
]Jr T - T_T,
Where:
T Flow time of sample solution expressed in seconds.
TO Flow time of solvent DW)* expressed in seconds.
The reduced Vosity 0,d) was deten-nined for different
concentrations of gum solution 5, 10, 15 and 20% ad was then calculated
froin te following euation:
rd /C
Where:
Ijrj Reduced viscosity.
'91 Relative viscosity.
C Concentration of sample solution.
DW = isfillcd water.
42
2.2.1.7 Intrinsic Viscosity ('9)
The intrinsic viscosity was obtained by extrapolation of reduced
viscosity against concentrations back to zero concentration. The
interception on y- axis gives (ij).
2.2.1.8 Molecular Weight
1-he molecular weight was calculated using Mark-Houwink
equation (Mark, 1938; Houwink, 1940).
KMWa
Where:
Mw Molecular weight.
('9) Intrinsic viscosity.
K and a Mark-Houwink constant.
Based on (Anderson and Rahman, 1967b), the values of K and a
were determined for A. enegal gum as follows:
K 1.3xl 0-2
a 0.54.
2.2.1.9 Apparent Equivalent Weight
According to the method reported in the Encyclopaedia of
Chemical Technology 1966) with some modifications. The aqueous gum
solution 3 was treated with Amberlite Resin 120) (H+) 2 grams per 10
mls solution) then shaken for an hour and titrated against 002 N sodium
43
hydroxide solution using phenolphthalein as indicator. The equivalent
weight was calculated as follows:
Eq. Wt. 50,000 x 03M
Where:
Eq. Wt. Equivalent weight.
M No. of mIs of 002 N sodium hydroxide
neutralizing 10 mls of 3% sam. le solution.
0.3 No. of grams of gum per 10 ml of the 3%
solution.
2.2.1.10 Uronic Acid
Uronic acid percentage was deten-nined by multiplying the
molecular weight of the uronic acid 194) by 100 and dividing by the
apparent equivalent weight of the samples as follows:
Uronic acid % 194 x 100Eq. Wt.
2.2.1.11 Solubility
Solubility was obtained by dissolving I gram of sample in 100 ml
distilled water., stirred to dissolve and the solution filtered through a filter
paper No. 41 which weighed before filtration (wi). The filter paper and
contents were then dried at IOPC for 30 minutes, cooled and weighed (W2)-
44
'I'lle solubility was calculated as percent according to the following
equation:
S% (W - W? WI) 00W
Where:
S Solubility.
W Weight of sample.
WI Weight of empty filter paper.
W2 Weight of filter paper insoluble sample.
2.2.1.12 Tannin Content
0 I m of ferric cloride were added to IO m of I% aeous gurn
solution. Preseiice of blackish colouration or precipitate indicates te
presence of tannin (FAO, 1999).
2.2.1.13 Reducing Sugars
Reduchig sugars were determined according to Robyt and Wite
(1987) sing alkaline Ferricyanide ethod. Te procedure uses a single
reagent composed of 034 grn of potassium ferricyanide 5 g-n of potassium
cyanide ad 20 gm of soditun carbonate dissolved in I hire of distilled
water. 1. m of gum solution was added to 40 m of reagent, ten heated
M a boilitig water bath for 10 minutes and cooled. Te absorbance was
measured at 420 nin.
45
A standard curve (Fig. 6 was prepared from different arabinose
concentrations plotted against absorbOnce in order to calculate the reducing
sugar5concentration as arabinose.
2.2.1.14 Ultra Violet Absorption Spectra
Maximum absorption spectra of I% gum solution were determined
using a PERKIN- ELMERLA-(MBDA2UVNis) SPECTROMETER.
2.2.2 Functional Properties Analysis
Functional analysis of A. enegal gum in the present study were
carried out as follows:
2.2.2.1 Emulsifying Stability
Gum hashab solution 20% concentration) was mixed with oil in a
ratio of 80:20 w/w, respectively. They were mixed using a blender for
one minute at 1800 RPM. The mixture was then diluted in a ratio of 1: 1 000
and it was read at �, max. 520,nm. The second reading was taken after one
hour. The readings represented emulsifying index. Emulsifying stability
(E.S.) was calculated as follows:
(E.S.) First readingReading after I hour
2.2.2.2 Water Holding Capacity (W.H.C.)
One gram of A. enegal gum was accurately weighed in a petri dish,
then it was placed in a desiccrator half-filled with distilled water and
incubated for certain lengths of time: 24, 48, 96, 120 and 144 hours. The
46
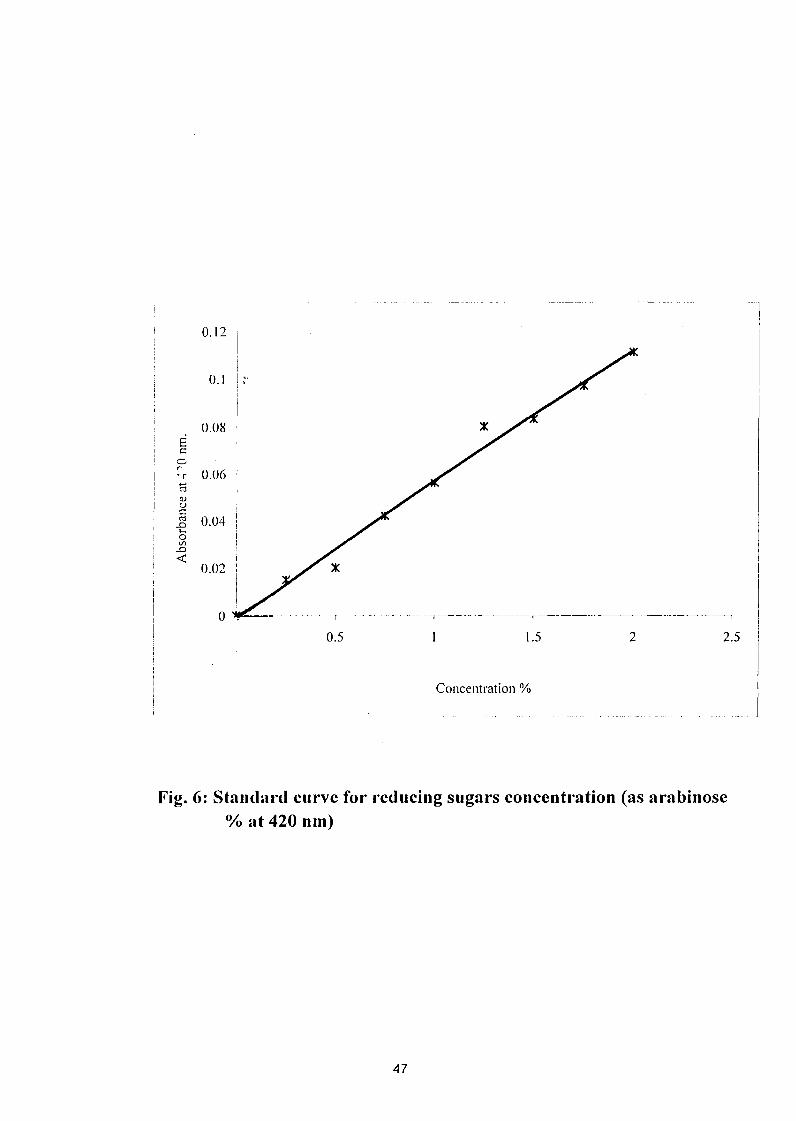
0.12
0.1
OME
r 0.06
0.040V)
<0.02 X
0
0.5 1 1.5 2 2.5
Concentration
Fig. 6 Standard curve for reducing sugars concentration (as arabinose'Yo at 420 nm)
47
and 144 ours. The petri dsh with sample were ten weighed g/g. ad
finally expressed as percentage as follows:
WHC % = Wei OY it of water x I 0Weight of sarnple
W IC = Water olding capacity.
Must ave te constant weight of sainple.
2.2.3 Structural Analysis
2.2.3.1 Acid Hydrolysis
Acid ydrolysis was carried ot according to Aderso ad Munro
(I 970) ethod I i of guni sample (composite sarnple) dissolved in I 0
iuls sulphuric acid with different concentrations (0.5 and I N). The
solutions were ten eated o a boiling water bath for eiglit ours, cooled
and neutralised by adding bariurn ydroxide, ten barium carbonate)
filtere ad stiffed with Ainberlite IR-120 (H+) resin to remove the cations.
The delonized hydrolysates were iltered froin te resin and concentration
in vaccuo at (4'C) then exarnined by Thin Layer Cromatography (TLC).
2.2.3.2 Autohydrolysis
Autohydrolysis was carried ot as described by Bose and Gupta
(1964). 20 gm of A. senegal gurn (composite sample) inlOO ml distilled
water was deionized sing Arnberlite IR-120 (H+) resin, ten filtered. Te
filtrate was eated in a boiling water bath for 60 ours under reflux. Te
I' rotation was detennined for te course of ydrolysis at
48
IO hours. After 60 hours the solution was cooled, and then dialysed in
distilled water for 72 hours where most of the liberated sugars were
recovered and concentrated as a brownish syrup. The degraded gum was
precipitated from the solution with ethanol 4 vol.) acidified with a few
drops of concentrated hydrochloric acid, centrifuged and washed several
times with ethanol. About 9339 grams of degraded gum yielded after
drying.
2.2.3.3 Partial Acid Hydrolysis
0 I gm of degraded gum was added to 25 ml sulphuric acid (0.5 N
and I N). The solution was then heated under reflo.K in a boiling water bath
for, eight hours, cooled and then the solution was partly neutralized by
Ba(OH.) and the neutralization was completed by adding BaCO3filteredS
and the degraded gum was recovered from the centrifugate by precipitation
with ethanol 4 vol.) and the centrifugate was concentrated and examined
by Thin Layer Chromatography.
2.2.3.4 Chromatographic Method
2.2.3.4.1 Thin Layer Chromatography (Qualitative Analysis)
According to Jeffrey et al. (I 969) thin layer chromatography plates
were prepared as follows: 30 grams of silica gel G (Mark) were mixed with
60 ml of 002 M boric acid and shaken manually for 60-90 seconds then
49
then spread oi a well ean and di-v glass plate 2Ox2O Cll) Ing Desaga
applicator to 025 nim thic-ncss.
The plate was left to stand at roorn temperature for about
minutes ad then activated in an oven for one hour at 100'C ten cooled
and stored i a desiccator until sed.
Sample and athentic markers were spotted by a nicropipette at 2
cin From te bottom of te plate. Spots were dried on air. Te plate was
then allowed to develop by ascending chromatography in a clean glass tank
containing 120 nil of (BAW 41:5 (tipper layer), respectively to a height of
about 15 cm i 15-2 hours at rom temperature. Tat was done based on
Jaci ad Meslilein 1965). Te plate was then taken ot of te tank and
dried. Te sugars were visualized by spraying te chrornatograin with a
mixture of 4 gin diplienylarnine 4 ini aniline, 20 r (80%) orthophospboric
acid ad 200 ml, acetone (DPA) Baily ad Bourne (I 960). Te plate was air
dried ad heated at 100'C for 10 mintiets to produce te characteristic
colours. Using te Rf value and colour of te sample spots were compared
with tose of te reference inarkers. Te different sugars i tile sample
solution were identified.
2.2.3.5 Fractionation
Fractionation was carried out according to Tager 1972) and Cowie
(1973).10% gurn solution was placed into three-necked litre round flask
i(
C01111COCLI with a mechanical stirrer. The LItiOil was stirred vigorously
and constantly with addition f acctone 100 nil) until precipitatioll
resulted, and was left over-night for complete precipitation. This precipitate
was separated rom te other please and left to dry. Te sarne operation was
carried ror the remaining solution, until all fractions were obtained and then
examined.
2.3 Statistical Analysis
Data were aalyzed using te completely randomized design to
determine the level of significance and comparative aalysis between
control and irradiated samples (solid and solution) were detennined by
factorial design according to procedure by Goniez and Gornez (I 984).
51
CHAVITWHIREL
RLSULTS AND DISCUSSION
3.1 Analytical Studies of Acacia sell Guin
'rable 2 tives te physicochemical and functional roperties for
seven samples of Acacia enegal guin nainely Al, A2, A3, A4, A5, A ad A7-
3.1.1 Moisture
The results sow tat te oisture content of samples of A. enegal
studied was i the range 10.7-11.13% with a rnean value 0 f 10.87% W11i ch
is in close agreement wit te ean of 10.7% of A. senegal gum obtained
by Karat-nalla el al. 1998). Tis range is slightly different from te rnge
8.1-14.7% reported by Siddig (I 996) for A. senegal gm.
3.1.2 Ash Content
Ash content was found to range from 301 to 371% wit te mean
value of 331% wich is in agreement wit te value of 36% for freeze
dried samples of A. enegal gm obtained by Anderson et al. 1987) and
the range is not similar wit tat for A. senegal gurn 2.75-5.25%) reported
by Karanialla el al. 1998).
3.1.3 Nitrogen and Protein Contents
Nitrogen content was found to be i te range of 0377-0.410%
wit a ean value of 0389% wich is very close to the mean of 038%
52
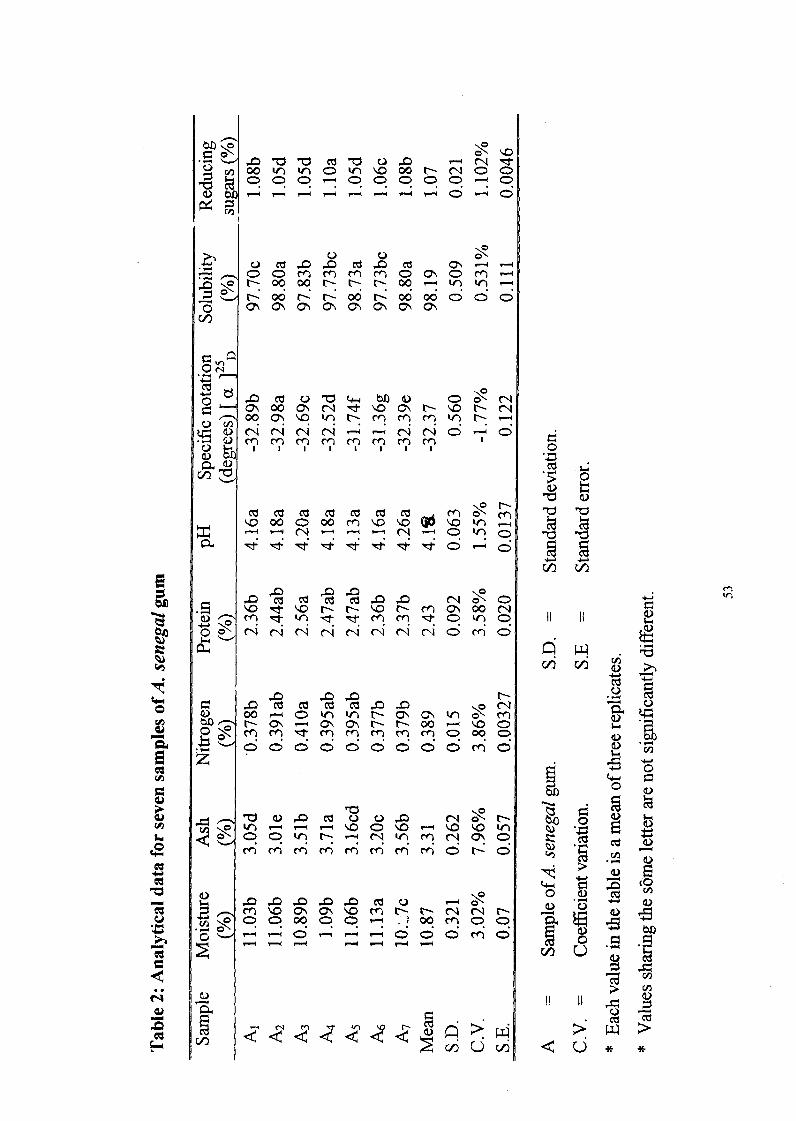
W VI W) C) kn �o W t-- C'�l C)CD c) q CD CD 6 CD. . . . . . . . . .r--q r-4 r-.4 r-4 r--4 r" r-4 r--4 (:=> P--4
C.) Cd .0 2 w 10 m (ONc> C> m M M M C;� C's CD Mt- 00 00 C- t- r- 00 - tn tr)C--' 0 r.- r-- 00 r- 00 00 C) C C>
0 C% A O'A CN C� C'S C� CN
W)0
C�+�0 �o co Q bj 0w CS r14 If 'IO CN E-- INO r-- C14CN "o W) t-- M M M kn C,- r-
0
7:1 0
m CZ m m m m co -al -0"C w C> w \D "C "o kr)--4 tn
4-j 4-4Cn Le)
01�M kn --vt C> W-� C)
C-4 r,� C14 rq c) M. c)
o
CZ M �o 10kn W) - ol� C,-, W)
r- ON (ON C� t-- 00 - "o C)m m Ictow C;z
0
CO Q 0 In 0
C> (-4 ON C>42 gm >
o 0,o c, c, o m r- t-- rq F-4 r- 2C> C) 00 C) O 00 cf) c)
C's
C% V)
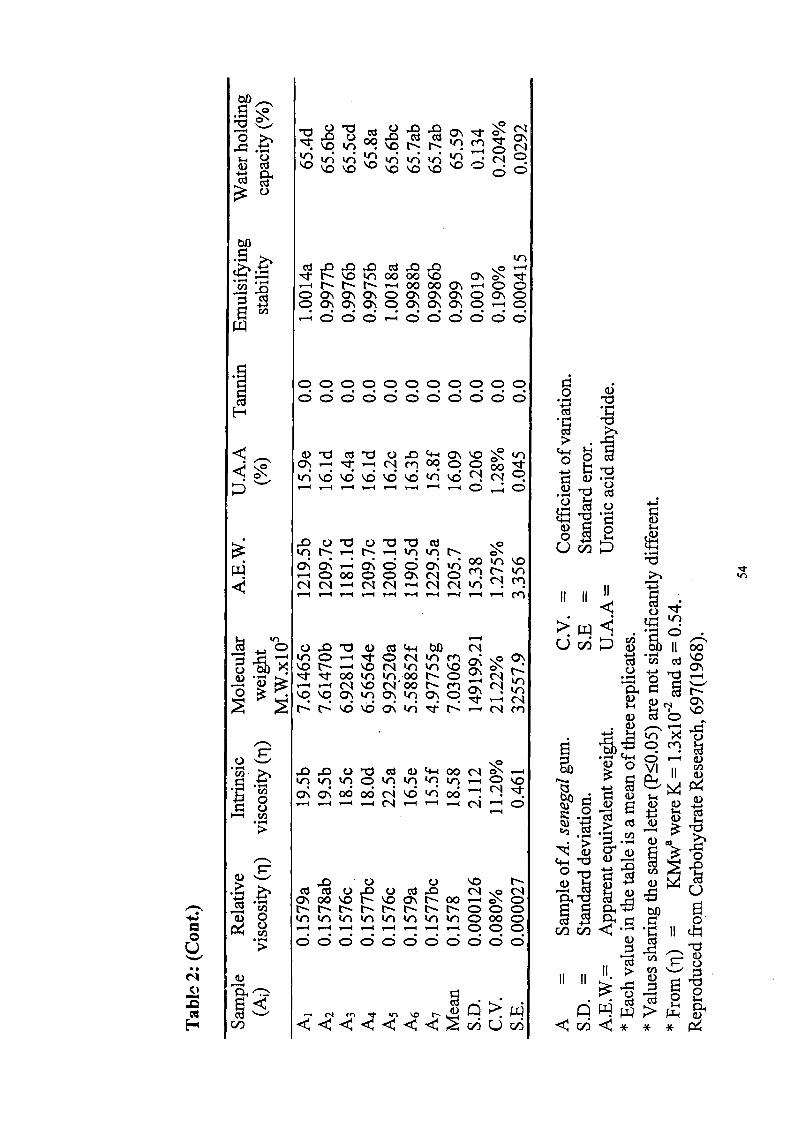
0 u 00 co kn.C� "1 Z tA Z r.- cl$-4 W) 1r; i r V; k ,i kriC13 �o
4b cd la -0 �Q Cd �a �at-- "lo kr) 00 00 'IO 0 N
-4 r� tl- I-- - 00 00 CN - O C)C) (71, (01� CN C) a-, (71, C\ C) C� C>C> O� ON ON C) ON ON ON CD - C)
C; C; C; 14 C; C; C; C; C; C;
C) CD CD 0 CD 0 CD CD C) C) C)0C; C; 6 C; C; C; C; C; C; C; -4
0 -0 cd -0 U �o 4--i 0� 1,0 N� W) C) 0n 00 c) p 00 't
kr) "D "o -,0 tri cq-- 4 -4 -4 C) C) a)
cri
50
0 $-410 u 10 u 10 lack fd U cn �D
. . . . WI "Ca) C� C) C', W) mC) W C> Co as N C> cq m
C-4 C-4 - cq cq - cq C-4 tri - ---4 -4 V--4 "-4 "-4 -- 4 -- 4 -- 4 r--4 M
C_)
> c)W,+J u la 0 Cd 4-4
tn C) tt C) C,4 kn m Cdr- \o C,4 kn W) �o t-
000 W) kn, 00 t- C�i
(D C,4 �o C, 0 t- m C9C� kn0 'IO I'D ON W) C., kn C% 0 (U.
�6 �6 o� wi 4 t- cl�d) -,
tn Xq4-i C>
'a 10 u 10 Cd a) C" 00 C14 S 'D 0 VIkn kn tn tn -- 4
I t t3C� c� 06 06 C-i "6 06 -I ti W t-4
0 -- 4 cq --4 --4 Q C:-, 0 00 - *J,
Cd
> > C'3>
4-4 o0 v wu (D tq 0 4)(ON 00 \oC13 -OCS u M �o N C14 u
\,O (7\ t- 00 C>-- 4 Ln t- r- t-- t-- t- t- t-- [-- C) C> -.54) o W) W) tn WI VI kn tn tn C) 00 C) 5 0
u -- 4 -- 4 -I -- 4 r--l --I "-4 -4 C> C�l C� U)
C� C) C� (D C) C� C> C> C> C; C;>
>el d)O El 0
cr ;3
>
wpoitcd rccently by Kai-amalla el a. 1998) For A. eegul um. Proleill
content ranges rom 236 to 2.56%O with a mean value of 243%. Tis range
is higher tan tat reported by Hassan 2000) for A. enegal guin (0.726-
1.254%).
3.1.4 141 Value
Table 2 shows tat pl-I value ranged rom 413 to 426 with a
mean of 418 which is in close agreement with te ean of 42 obtained by
Karamalla el al. 1998) for A. enegal guni while tis range is lower tan
4.38-4.89 forA. senegal gin calculated by Siddig (I 996).
3.1.5 Specific Rotation
From Table 2) te specific rotation is found to be i te range of
-32.980 to 31.36' wth a nean of 32.37'. Tese results idicated tat
spec ic rotation values or tese samples were levorotatory ad withi te
range 29.0' to 33.0 ivestigated by Aderson and Mc Dougall 1985)
and higher than the mean 31.30 reported by Karamalla el al. 1998) for A.
seneg-algUnl.
3.1.6 Solubility
Table 2) shows tat te solubility ranges rom 97.7 to 98.8% with
an average 98.19% thus isoluble percentage is higher than the range 0.2-
1.6% for A. enegal gurn determined by Anderson and Dea 1971).
5 5
Insoluble fragments may be due to te presence of residues of bark and
othe-t- impurities.
3.1.7 Reducing Sugars
From Table 2) reducing sugars are found to in te rapge of 1.05-
1.10% with a mean of 107%. Tis range is higher tan tose 016-0.44%
and 044-0.50 reported by Kararnalla et al. 1998) for A. enegal gum andEltayeb 999) for Anogeissus leiocarpus gum from Elfula, respectivel
I Y-
3.1.8 Relative Viscosity
From Table 2) te relative viscosity ranges from 0.15 76to 01579
with a mean value of 01578. This range is lower tan the range of 11-2.7
for A. enegal gum reported by Awad El Karium 1994), tis variation may
be de to te variation in temperature.
3.1.9 Intrinsic Viscosity and Molecular Weight
From Table 2) te intrinsic viscosity ranges from 15.5 to 22.5 m1/g
wit a mean value of 18.58 m1/g hence te molecular weight ranges from
9.9252OxlO5 to 4.97755A 05 with a mean value of 7.03063xlO5 which is
lower than the mean 9x 1 05 for A. enegal gum obtained by Karai-nalla et al.
(1998) but higher than 5.6xl 05 for A. seyal gum reported by Churl-ns et al.
(1983). Te range of intrinsic viscosity is similar to tat reported by
Jurasek et al. 1993) for A. enegal gum 13.4-23.0 m/g) and the mean of
3. 1 IO Apparent Lquivalent Wigh ad U ronic Acid
From 'Fable 2) te apparent euivalent weight ad uronic acid are
found in te range 1181.1-1229.5 ad 15.8-16.4%, respectively. The range
of euivalent weight is higher tan 1040.0-1119.0 while he range of uronic
acid is lower tan 17.3-18.6% for A. enegal gurn investigated by Osman el
til. 1993). The ean values of euivalent weight 1205.7 ad uronic acid
anhydride (I 609%) are wthi te means II 00. ad 16.0%, respectively
of athenticated A. enegal gum reported by Aderson el al. 1983).
3.1.11 Iannin
From Table 2 results for all A. enegal samples indicated there
was ot ny tannin in te samples ivestigated. Tese results are in
agreement with te characteristics of A. enegal gn written in FAO
(1999) No. 52.
3.1.12 Emulsifying Stability
From Table 2 te eulsifying stability ranges from 09975 to
1.008% with a mean of 0999% which is a little bit less tan the value
1.026% for A. enegal obtained by Eltayeb (I 999).
57
3.1.13 Water Holding Capacity (W.H.C.)
From Table 2 the water holding capacity is in the range 65.4-
65.8% with a mean of 65.59%. This range is similar with the range of 65.6-
63.77% for A. enegal gum estimated by Eltayeb (I 999).
Statistical analysis shows that there are significant differences
(RO-05) between these seven samples in their physicochemical and
functional:'properties except in pH value.Thisisexplainedbythehighly
polymeric nature of A. enegal gum. Thus the significant variation in these
values between samples, reflects the differences of polymer, which leads to
variation in the whole gum.
3.2 Effect of Gamma Irradiation (60CO) on some Physicochernical and
Functional Properties of Acacia enegal Gum
Table 3 includes the effect of y radiation with different doses, i.e.
150, 325 and 500 gray on some physicochemical and functional properties
of solid A. enegal gum (composite sample).
3.2.1 Moisture, Ash, Nitrogen, solubility and Water Holding
C apacity
The statistical analysis (ANOVA) shows that there are insignificant
differences (P<0.05) between control and irradiated samples in moisture,
ash, nitrogen content and solubility (Table 3.
58
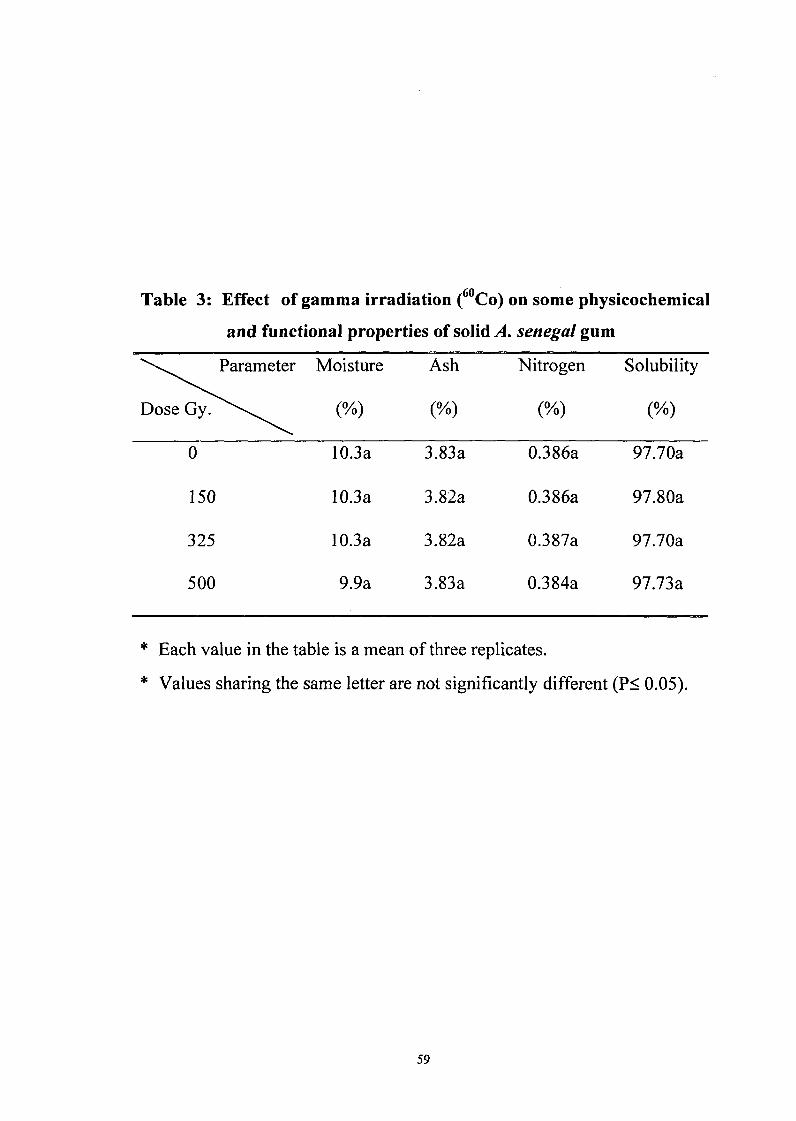
Table 3 Effect of gamma irradiation ( 60CO) on some physicochemical
and functional properties of solid A. enegal gum
arameter Moisture Ash Nitrogen Solubility
Dose Gy. N (%) (%) N
0 10.3a 3.83a 0.386a 97.70a
150 10.3a 3.82a 0.386a 97.80a
325 10.3a 3.82a 0.387a 97.70a
500 9.9a 3.83a 0.384a 97.73a
* Each value in the table is a mean of three replicates.
* Values sharing the same letter are not significantly different (P< 0.05).
59
I; -Ig 7 shows hat \vater holding capacity slightly decreased with
increasing of radiation dose.
Table 4) shows te effect of garnma radiation (60CO) on aqueous A.
senegal gurn solutions.
Statistical analysis (ANOVA) shows tat gainma radiation does ot
affect the apparent eivalent weight, uronic acid anhydride and
emulsifying stability of aqueous guin solutions. Tere are sigificant
differences (P<0.05) in reducing sugars which decrease after doses 15 ad
500 gray owever increased at 325 gray. Tese results may be due to
association between peripheral cains to produce reducing center,
therefore, rducing stigars decreases.
Table (5) shows te effect of dfferent doses of rays on two
different states (solid ad solution) of A. smegal gurn.
3.2.2 111 Value
Statistical aalysis reveals tat tere was o significant difference
(P<0.05 i pl I values between solid ad dissolved samples, irrespective of
increasing te doses and also between different doses regardless of te guin
state. Similarly, here is no difference when we take te two states with
three different doses.
60
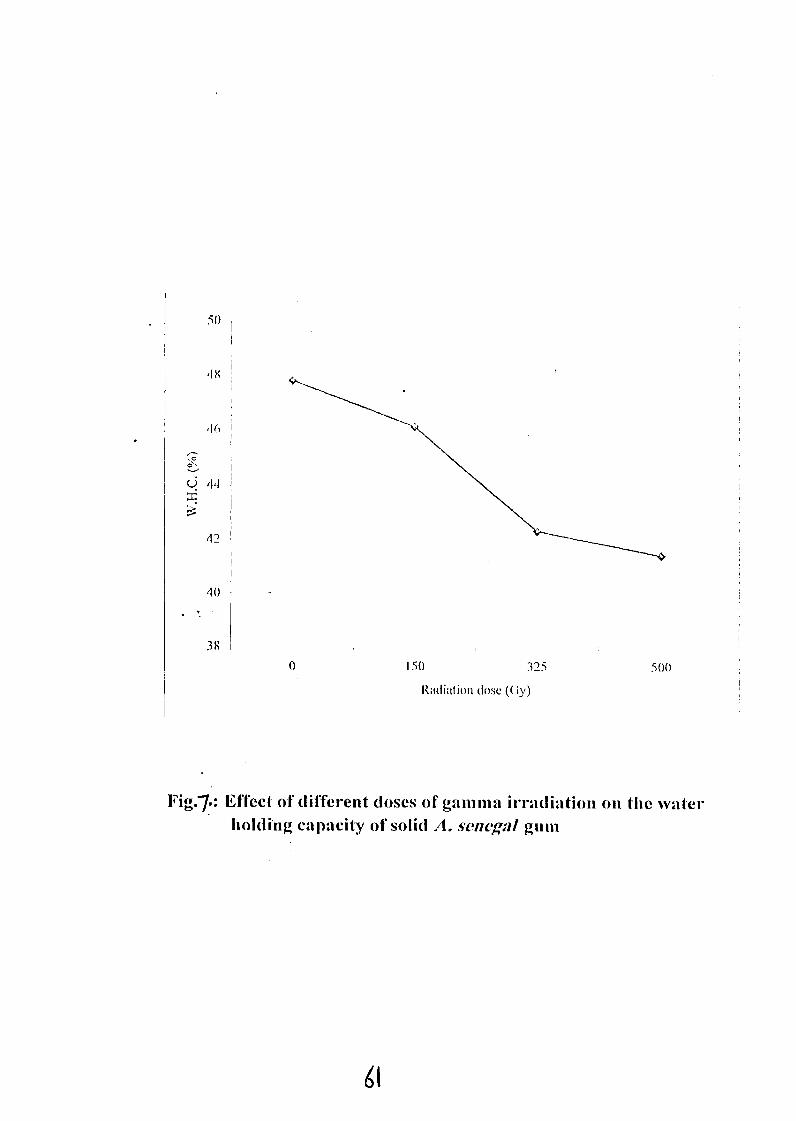
50
'19
'10
42
'10
3
0 1 5( 325 500
Radiation (lose ((iy)
Fig.-7, Effect of ifferent (loses of atunia irradiation on te waterholding capacity of solid A. variegal gum
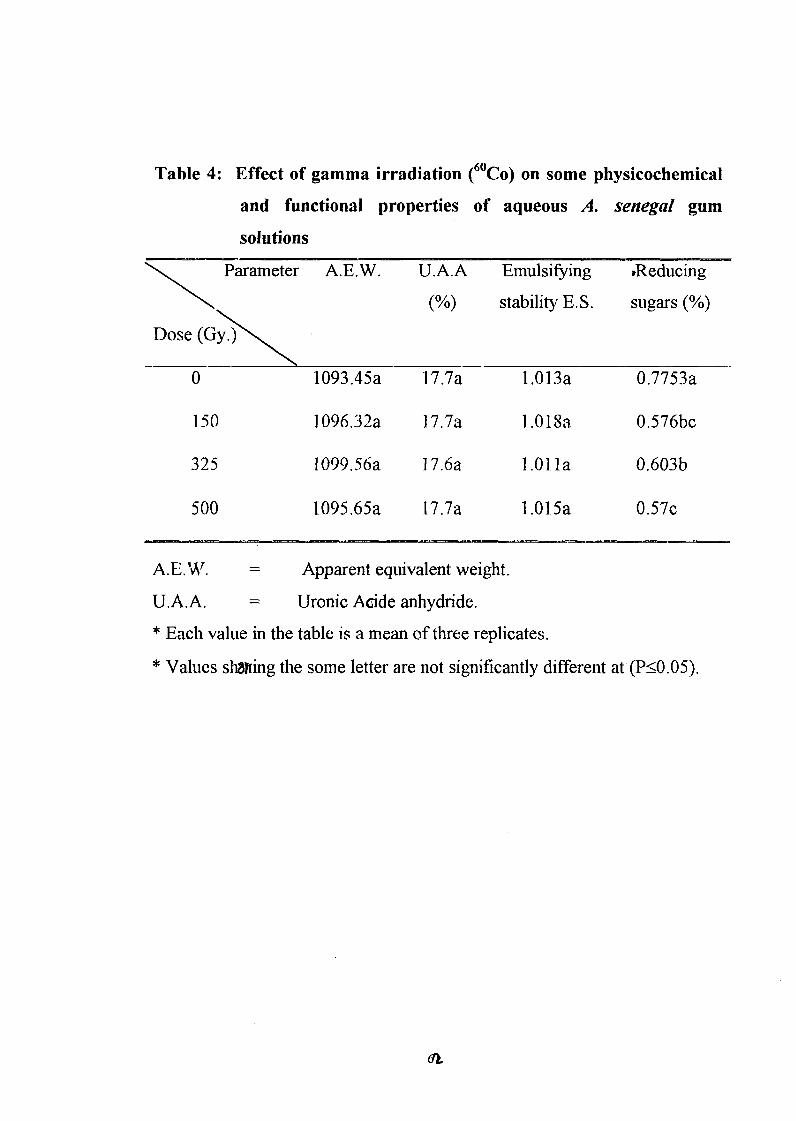
Table 4 Effect of gamma irradiation (60CO) on some physicochemical
and functional properties of aqueous A. enegal gum
solutions
Parameter A.E.W. U.A.A Emulsifying -Reducing
(%) stability E. S. sugars (%)
Dose (Gy.
0 1093.45a 17.7a 1.013a 0.7753a
150 1096.32a 17.7a 1. I "i 0.576bc
325 1099.56a 17.6a 1.01 la 0.603b
500 1095.65a 17.7a 1.015a 0.57c
A.E.",Al. Apparent equivalent weight.
U.A.A. Uronic Acide anhydride.
* Each value in the table is a mean of tree replicates.
* Values shming the sorne letter are not significantly different at (P<0.05).
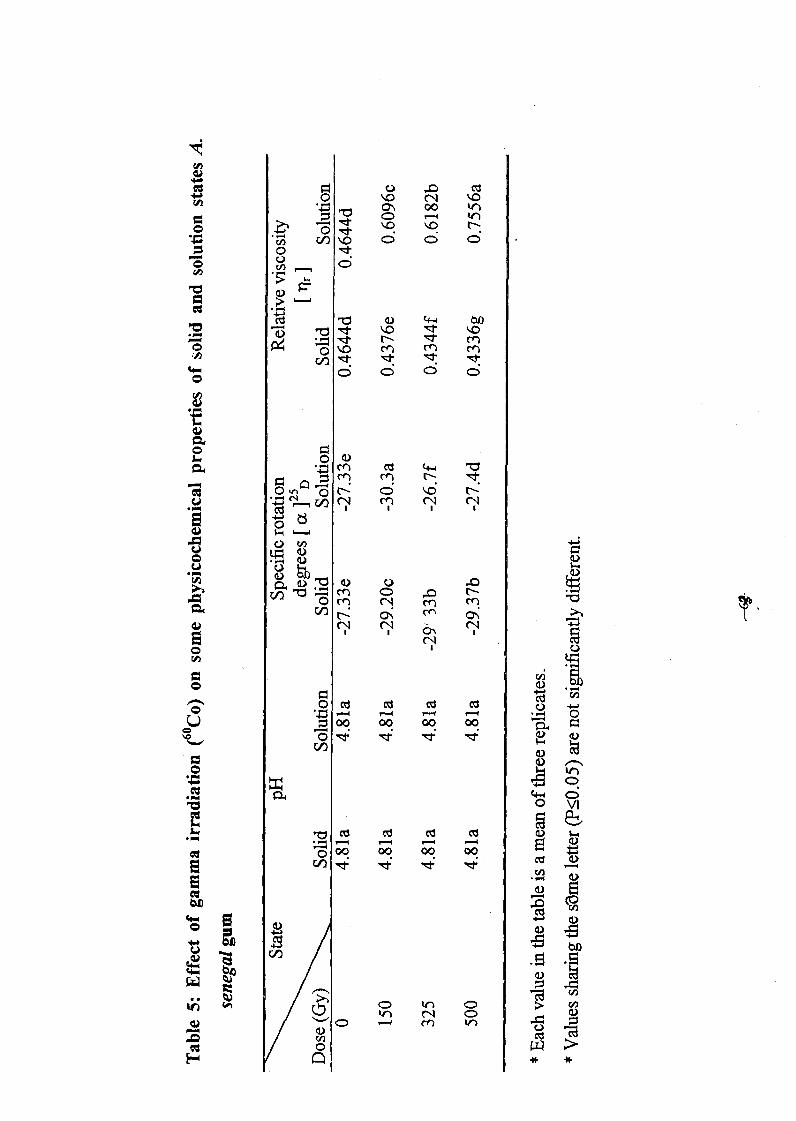
0 �oON 00 knC) kn
04W V)
4-4 to
'RTO
O1:t 'Tt
4-4 C) C) C� C;
m Cld 4.4 Irzir: = m m C-- 'Zil
o --- C 6 116 t--:.,-t 4 0 C\l clq
L5 Q)u
m C) �o tl-
m cq m cf�
r--� C� 0�
cq
cq
0 co co W cisr.-4 r-4 r.-q r-4 -4
00 00 00 00 -- 4P4
Cid..W C)VI
CO C13 W cor-4 r-4 T--40 00 00 00 00
15)
4"0 O
ED to
w4
W) CD CDC>
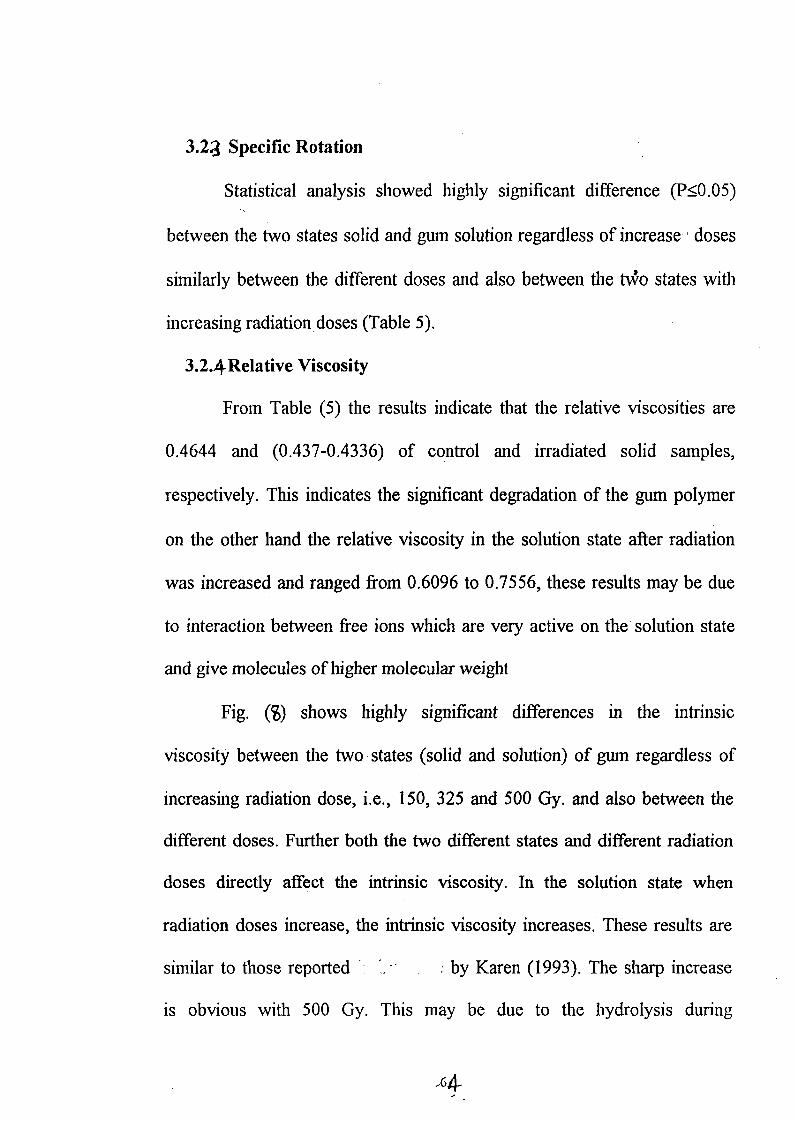
3.2,3 Specific Rotation
Statistical analysis showed ighly significant difference (P<0.05)
between the two states solid and gum solution regardless of increase, doses
similarly between the different doses and also between the ao states with
increasing radiation doses (Table 5).
3.2.4-Relative Viscosity
From Table (5) the results indicate that te relative viscosities are
0.4644 and 0437-0.4336) of control and irradiated solid samples,
respectively. This indicates the significant degradation of te gum polymer
on the other hand te relative viscosity in the solution state after radiation
was increased and ranged from 06096 to 07556, these results may be due
to interaction between free ions which are very active on the solution state
and give molecules of higher molecular weight
Fig. (S) shows highly significant differences in the intrinsic
viscosity between the two states (solid and solution) of gum regardless of
increasing radiation dose, i.e., 150, 325 and 500 Gy. and also between the
different doses. Further both te two different states and different radiation
doses directly affect te intrinsic viscosity. In the solution state when
radiation doses increase) the intrinsic viscosity increases. These results are
similar to tose reported by Karen 1993). The sharp increase
is obvious with 500 Gy. This may be due to the hydrolysis during
64-
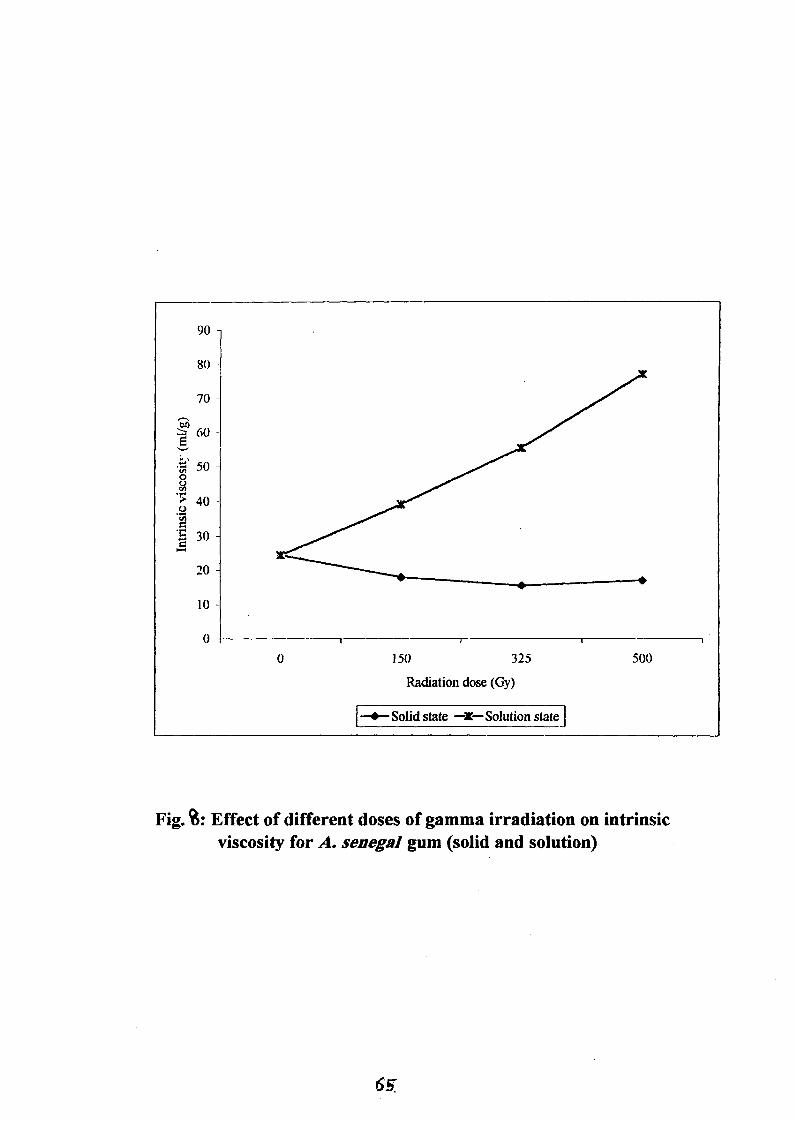
90
80
70
60
50
40
30
20
10
0
0 150 325 500
Radiation dose Gy)
--*-Solid state -X-
Fig. %: Effect of different doses of gamma irradiation on intrinsicviscosity for A. enegal gum (solid and solution)
65,
irradiation at all doses resulting in an increase in the ainount of soluble
polymer and hence increases viscosity at low doses. But on the solid state
intrinsic viscosity decreases with increasing of radiation doses because
there is degradation on the molecules. However, after 500 Cy. te intrinsic
viscosity 16.95 ml/g wich is higher than that calculated after 325 Gy. This
may be due to reassociation between units which were degraded after
irradiated with 325 Gy.
Fig. () shows that in. te solution state the molecular weight
increases as radiation dose increases and sharply increased with 500 Gy.
This is due to interaction between free ions wich are very active. But in
the solid state te results indicate significant degradation of guin arabic by
ganu-na radiation doses. However, after 500 Gy. showed molecular weight
5.84200x,05 which is higher than that obtained after 325 Gy. This may be
due to reassociation of degraded units. This result is in agreement with that
reported by Anderson et al. 1987 wo indicated that there were chemical
degradation of gum arabic by acids and alkaline reagents.
3.3 Effect of UV Irradiation on some Physicochemical and Functional
Properties of Solid Acacia enegal Gum
Table 6) shows some physicochemical and ftuictional properties of
solid A. enegal gum before and after iradiating by UV radiation (X = 320-
400 nm) for 2 4 and 6 ours.
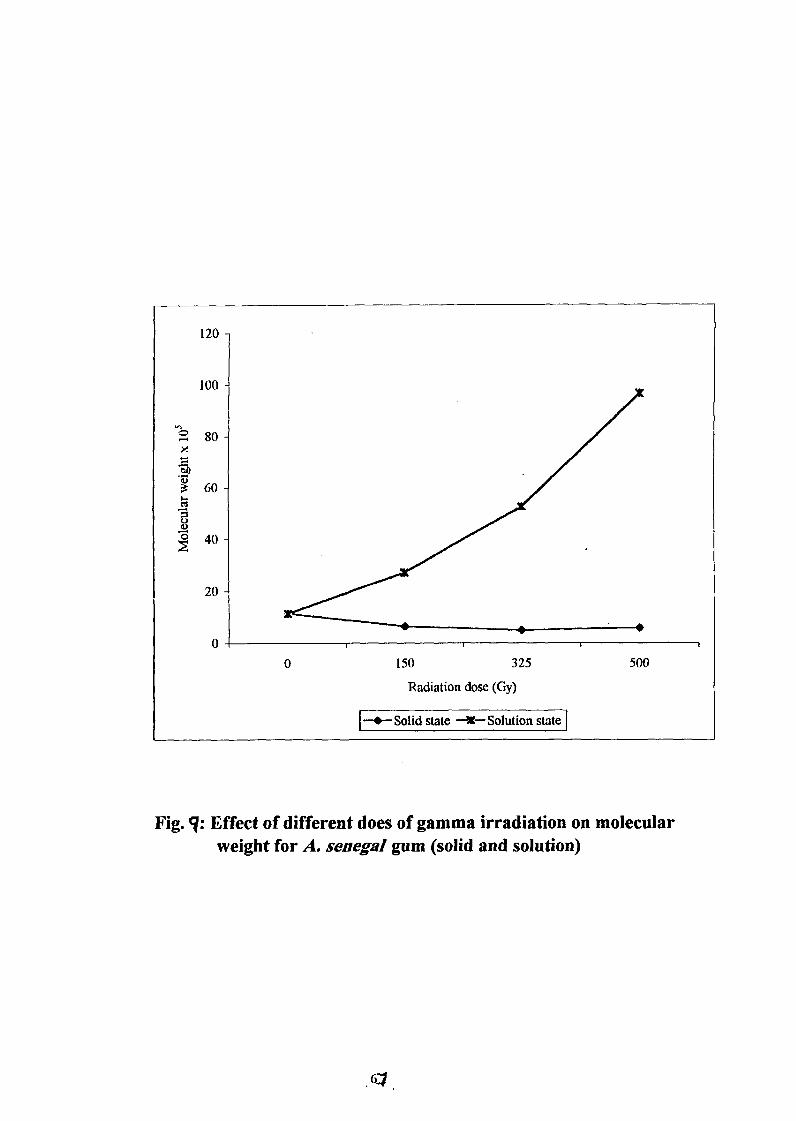
120
100
80
60C1
0 40
20
0
0 150 325 500
Radiation dose (Gy)
-- *--Solid state -- z- Solution state
Fig. q: Effect of different does of gamma irradiation on molecularweight for A. sevegal gum (solid and solution)
6-
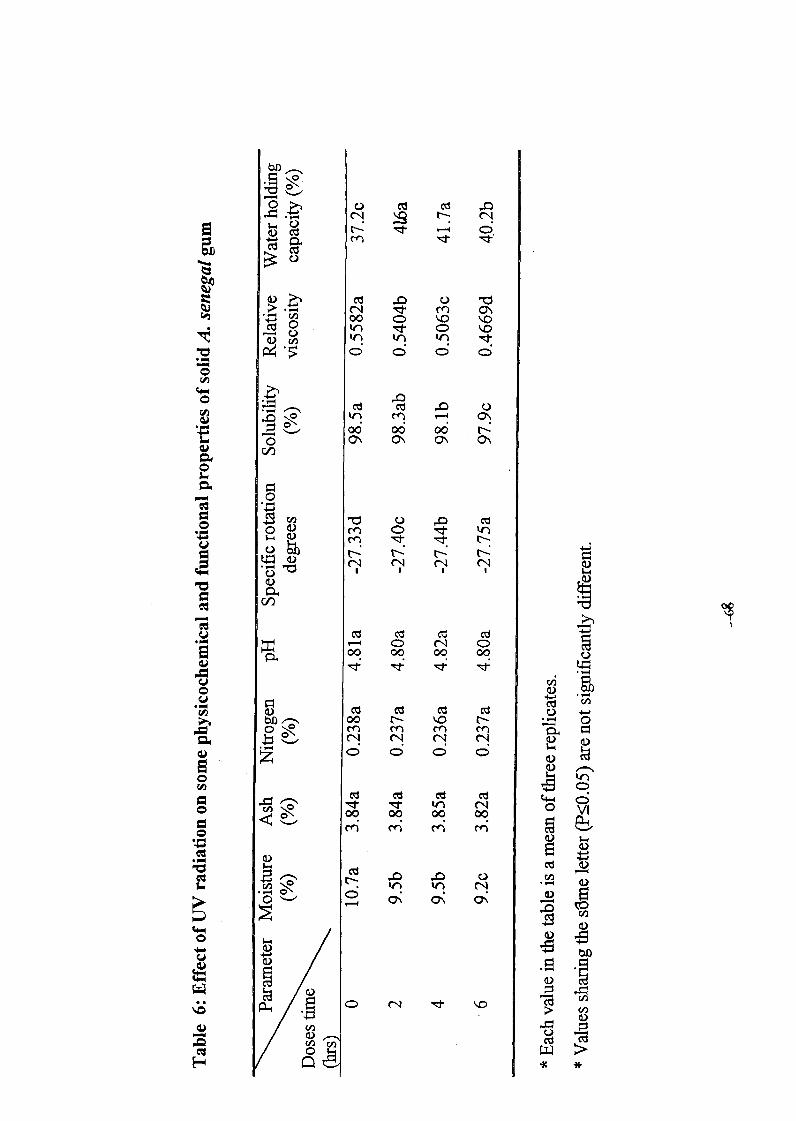
bb
C-) co Cd �mt--
C.)(u Nt ":t,
ts
4WC13 �a 0 it
> C14 11:41 CNr-0) 00 C� 1�0
kn lRd- C) 1-0k4r) tn Itt
4-i
CO -MO 'o
06 06 06 r-�C% C\ CIN C%
Nt
M
04
uo)
C%
C) C-4 C)00 00 00 00
Cd
w CZ co Cd C13bb 00 r-- 1�0 v-0 m 04
C14 C14 C14 Cli 0C; C> CD
C ke)
Cd Cd ce C13MT ItT VI CN 0 C;00 00 00 00 VI
cl ElCO 4)
co 1 4tl- W) cq
(74 C� C� KO
O
C) CN
CIS 0E" 3
3.3.1 Moisture Content
The results point ot tat moisture content is decreasing as radiation
time exposure is icreasing ad tis result may be attributed to tile fact tat
UV as tanslated to heat. Therefore, more oisture is released (Table 6.
3.3.2 Ash, Nitrogen Content and 111 Value
From able 6) te results idicated tat ash, itrogen content ad
pH value of solid gum arabic were ot affected by UV radiation.
3.3.3 Specific Rotation
Table 6) shows tat specific rotation of samples before and after
UV irradiation is found to be leavorotaroty ad tere is very little increase
i te specific rotation as te radiation time was increased. Tis may be due
to te variation in te properties of te sugars which may be liberated bt
Barron el al. 1991) pointed ot tat UV radiation has o effect o specific
rotation.
3.3.4 Solubility
From Table 6) tere is very little decrease in te solubility as te
radiation time icreased ad tis difference in te solubility between treated
and untreated samples may be related to te presence of small pieces of
wood ad other impurities in tese samples which are not soluble or may
be dUe to increase of temperature.
69
3.3.5 Relative Viscosity
The results i this study shows tat te relative viscosity was
0.5582 or untreated gui ad decreased to 05404,0.5063 ad 04669 after
irradiating "r 24 and6 lirs, respectively ('rable 6 and tis may be due to
the fragn,entation oi te guin structure thus te solution flow easily. These
results were found to be similar to tose reported in literature which stated
that UV radiation reduces te viscosity of gss arabic (mucilage) wben
irradiated for 2 lirs. (Zucca, 1 954)
3.3.6 Water olding Capacity (W.H.C.)
Where radiation nine exposure increases te water olding capacity
increases Table 6). Tis result is perhaps de to te fragmentation ill tile
guin polymer molecules to sinall fragments, which have hh activity to
bind with water inoleCLIles. However, after 6 lirs W.H.C. was foulld to be
40.2% which is lower than tat calculated after 4 lirs. tis variation may be
due to te :association between sall fragments to produce olecule which
leave a poor activity to bind water molecules.
Statistical aalysis showed tat there are ot significant differences
(P<0.05) between irradiated ad unirradiated control solid A. seiegal gurn)
by UV radiatio i ash, itrogen content ad pH value. But tere are
significant differences (P<0.05) betwee tem in moisture content, specific
rotation, solubility, relative viscosity ad water holding capacity.
70
3.4 I," ffect of LI I rradiation o Aqueous A. senegal um Solution
Table 7) shows some physicochemical ad functional properties of
aqueous A senegal gurn solution before ad after by UV
radiation (X = 320-400 i1m) for 2 4 ad 6 irs..
3.4.1 41 Value
From 'Fable 7 te Untreated control) and treated samples
indicated te acidity of gurn arabic which is due to te presence of acidic
sugars gluctironic acid). Table 7) also shows tat pH value for solutions
of guin was ot affected by UV radiation even after 6 lirs..
3.4.2 Specific Rotation
'Fable 7) shows tat samples before and after irradiating recorded
levorotatory optical activity and te specific rotation slowly decreased as
(lie radiation time exposure icreased Bt after 4 lirs it has a value 25.26'
which is higher tan tat recorded after 2 firs. (-23.04').
3.4.3 Apparent Equivalent Weight and Uronic Acid Anhydride
[JV rdiation had significant effect o the apparent eivalent
weight as well as uronic cid ahydride content of gin arabic.
This result may refer to te photodegradation i random are as at
different sites i te main Chain (Table 7.
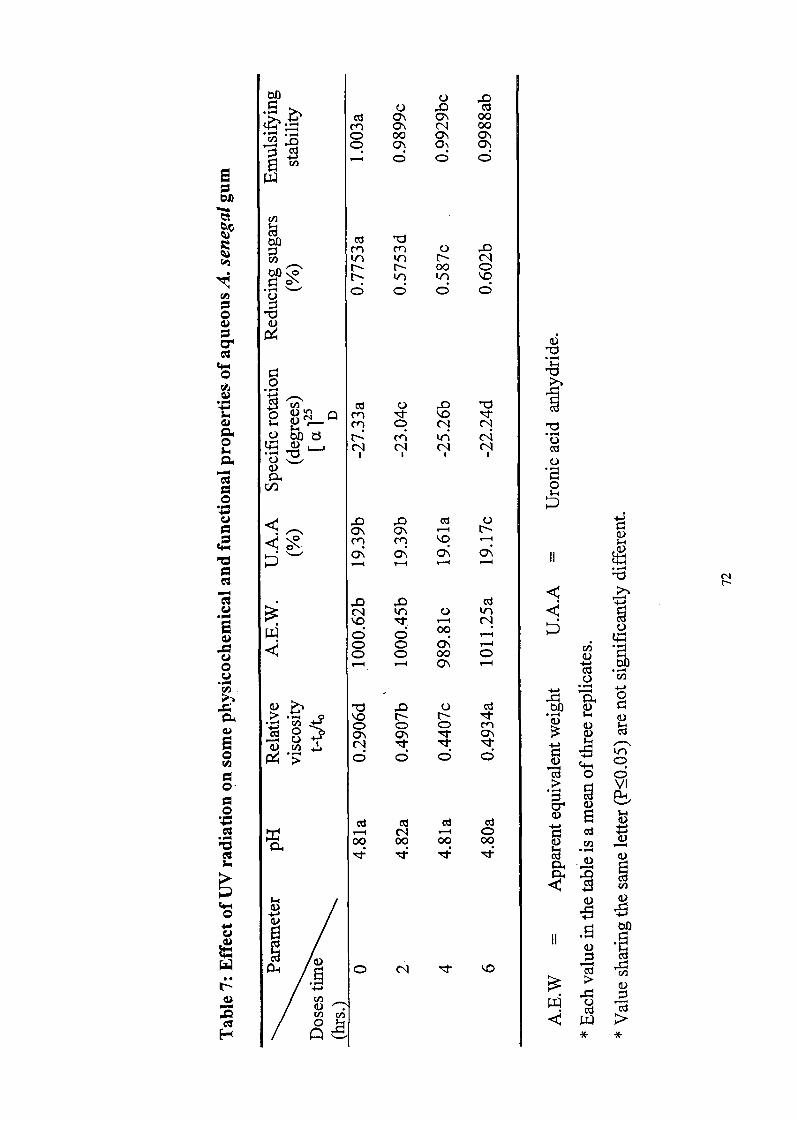
03 (DIN cl� 00CN 00
C) 00C) 01,%'C13 C;
OD
to� kf) kr) C1400 C)
kf) kf) �o
4-40 0
0
C4 Cd utnC11
(la C-i UCIA
7:1
03 uol�
PC
7:1 CT
Cd.ON (14 k4r)
�DC; C; O�C) ONC) 00 C)
all
4-j0
7:$ �c bi) (1)
C> C) CD m0 ON ON :T OIAU 'Irt 'tCliC) C; C;
(4-1
0 C>
VI
Cd Cd Cd Cis-4 C14 r--4 CD Cd00 00 00 00Piz P4
1-4
Q
4-4
3.4.4 Relative Viscosity
From Table 7) te relative viscosity of gum arabic increased from
0.290 to 04907 and 04934 after irradiated for 2 and 6 hrs., respectively
and was reduced to 04407 after 4 lirs. Increase In relative viscosity may be
due to te production of more free hydroxyl groups, after irradiation, which
fornied a etwork, of ydrogen bonds, tat extend throughout te liquid,
thus aking te liquid difficult to flow. Therefore, it makes high
viscosities, and reduction on te relative viscosity after 4 lirs may be
attributed to tile fragmentation o te gurn polymer molecule to sall
fragments which were ade to flow easily.
3.4.5 Reducing Sugars
From Table 7 te reducing sgars decreased as te radiation
exposure finic increased. Tis inay be attributed to association between te
fragments and formation of ew bonds. owever, afler 6 lirs., reducing
sugars were 0602% which are higher than tat detennined after 4 lirs.
(0.587%). rhere may be issociatio o te polymer molecule, thus, sugars
increased.
3.4.6 Emulsifying Stability
The ability of A. eegal gurn to stabilize oil emulsion was
measured for ntreated control) and treated samples. From Table 7) tle
resuits indicated tat samples retained teir ability to forill stable emulsions
73
of small droplet size even after irradiating for 6 hrs. But there is a little
change in this ability between tese samples, wich may be due to
heterogeneous nature of the gum structure. -
Statistical analysis proveJthat tere are insignificant differences
(P<0.05) between unirradiated and irradiated aqueous guin solutions on the
pH, apparent equivalent weight, uronic acid anhydride and emulsifying
stability while there are significant differences (P<0.05) between thern in
the �educing sugars, relative viscosity and specific radiation.
3.5 Effect of UV Irradiation on some Physicochemical Properties of
Solid and Solution Acaciavenegal Gum
Fig. (lo) shows highly significant differences on intrinsic viscosity
between two states (solid and solution) of gum arabic regardless of
radiation time. On the solid state the reduction of intrinsic viscosity is
sharper than that in the solution state. Tis variation may be due to the
reaction between free radicals which produced a number of water
molecules tat made lower viscosity. Therefore, a little reduction in
viscosity on the solution state resulted. This result is in agreement with that
reported by Aderson et al. 1987.1) "that intrinsic viscosity of gum arabic
Ml-3g-1decreased by when exposed to UV radiation.
.From Fig. (10) the molecular weight of solid A. enegal gurn
generally is reduced and shows a reduction after 6 lirs fiorn 11.40193xl 05
,74-
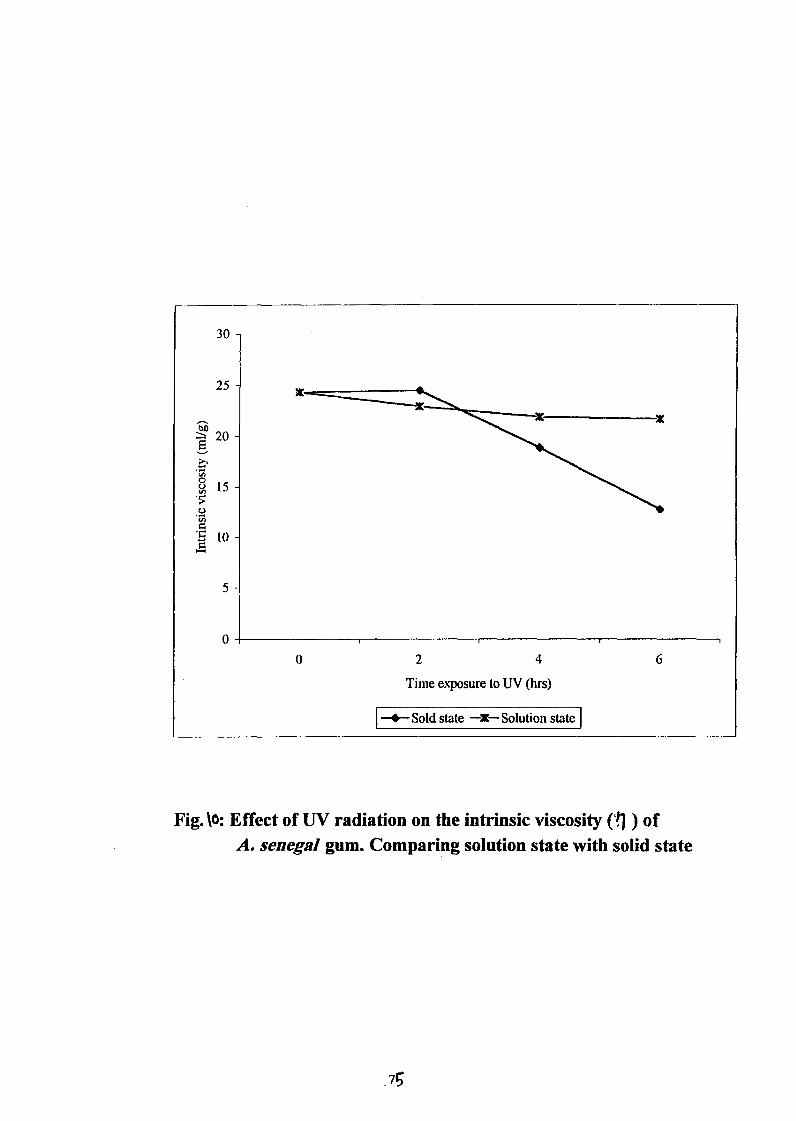
30
25
20
0Q 15
10ti
5
0
0 2 4 6
Time exposure to UV (hrs)
0 Sold state -x- Solution state
Fig. ko: Effect of UV radiation on the intrinsic viscosity ofA. enegal gum. Comparing solution state with solid state
.75
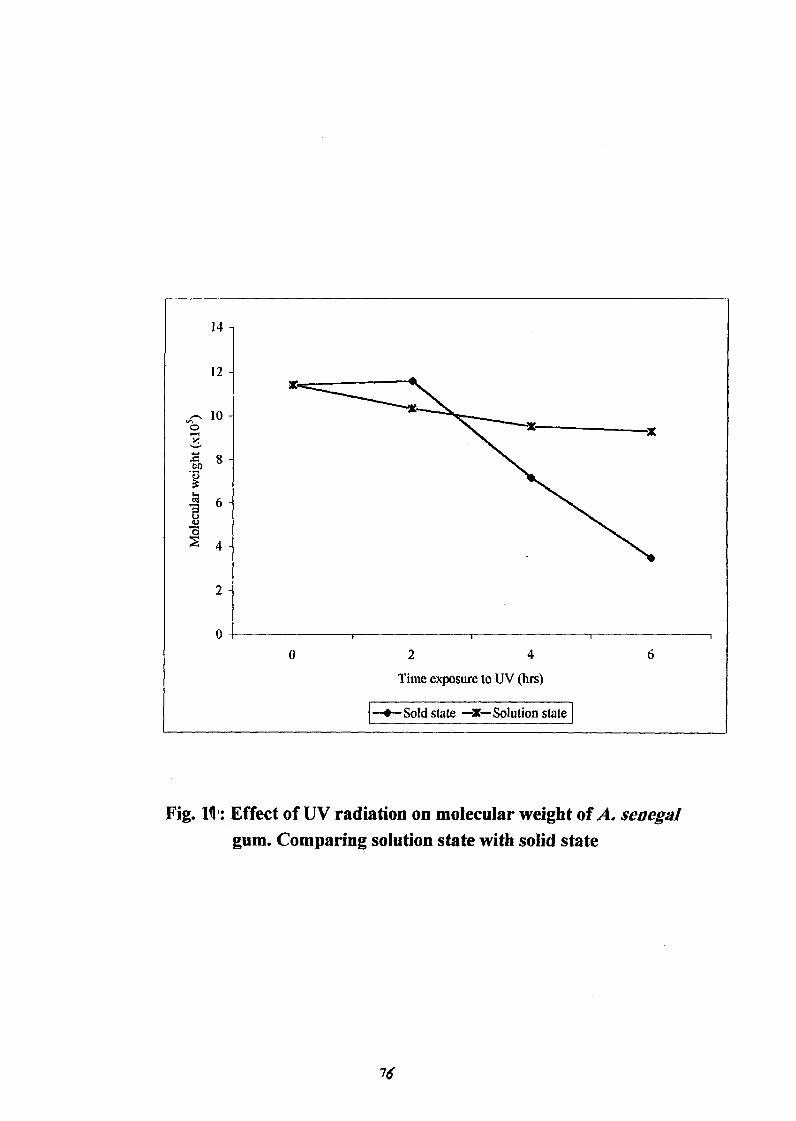
14 -
12 -
10
-Zi -
6
4
2
0
0 2 4
Time exposure to UV irs)
Sold state -Z- Solution state
Fig. A: Effect of UV radiation on molecular weight of A. seaegfilgum. Comparing solution state with solid state
71f
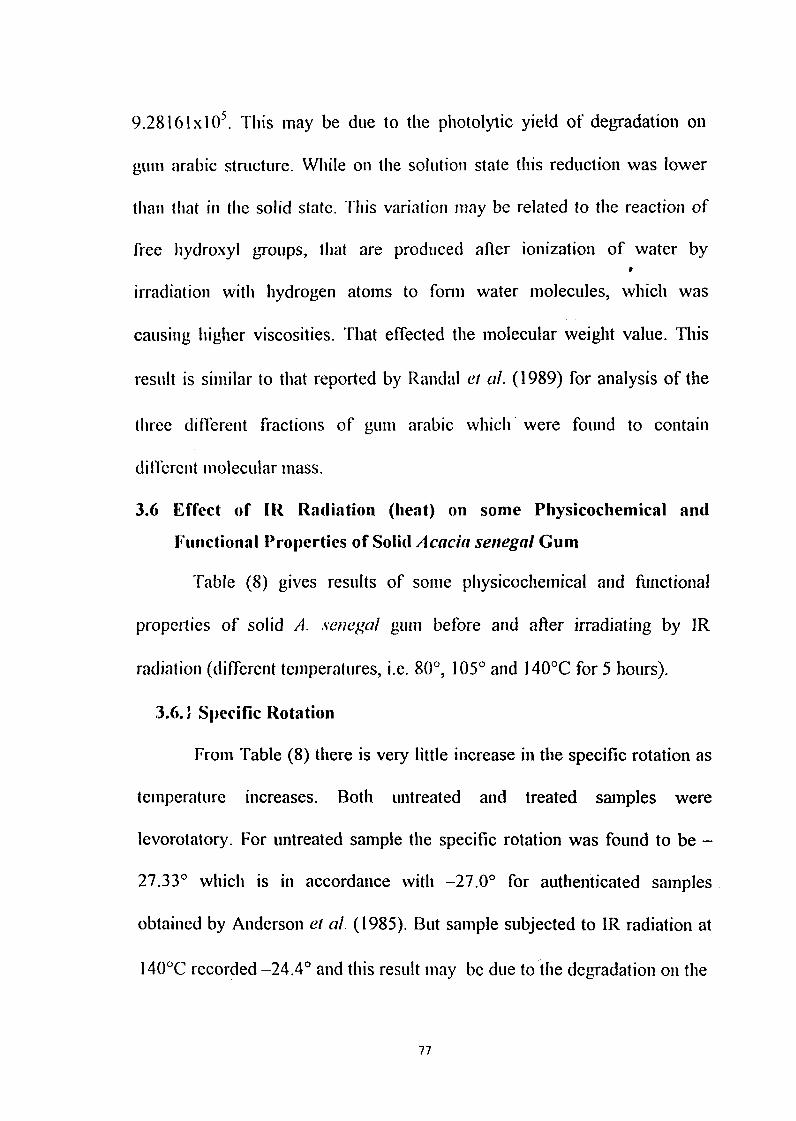
9.2816lxIO5 Tis may be de to te photolytic, yield of degradation on
guin arabic structure. While o te solution state tis reduction was lower
than tat i te solid state. This variation may be related to tile reaction of
free hydroxyl roups, tat are produced after ionization of water by
irradiation with ydrogen atoms to form water molecules, which was
causing higher viscosities. Tat effected te molecular weight value. Tis
result is similar to tat reported by Randal el al. 1989) for analysis of tile
three dfferent fractions of guin arabic which were found to contain
different olecular mass.
3.6 Effect of IR Radiation heat) on some Physicochemical and
Functional Properties of Solid Acacia metal Gum
'rable (8) gives results of some physicochemical ad ftuictional
properties of solid A snegal guin before ad afler iradiating by IR
radiation different temperatures, i.e. 80', 105 ad 140'C for hours).
3.6. Secific Rotation
From rable (8) tere is very little increase i te specific rotation as
temperature increases. Both untreated and treated samples were
levorotatory. For ntreated sample te specific rotation was found to be -
27.33' which is in accordance with 27.0' for authenticated samples
obtained by Anderson el al. 1985) Bt sample sbjected to IR radiatio at
140'C recorded 24.4' and tis result ay be de to te degradatio o tile
77
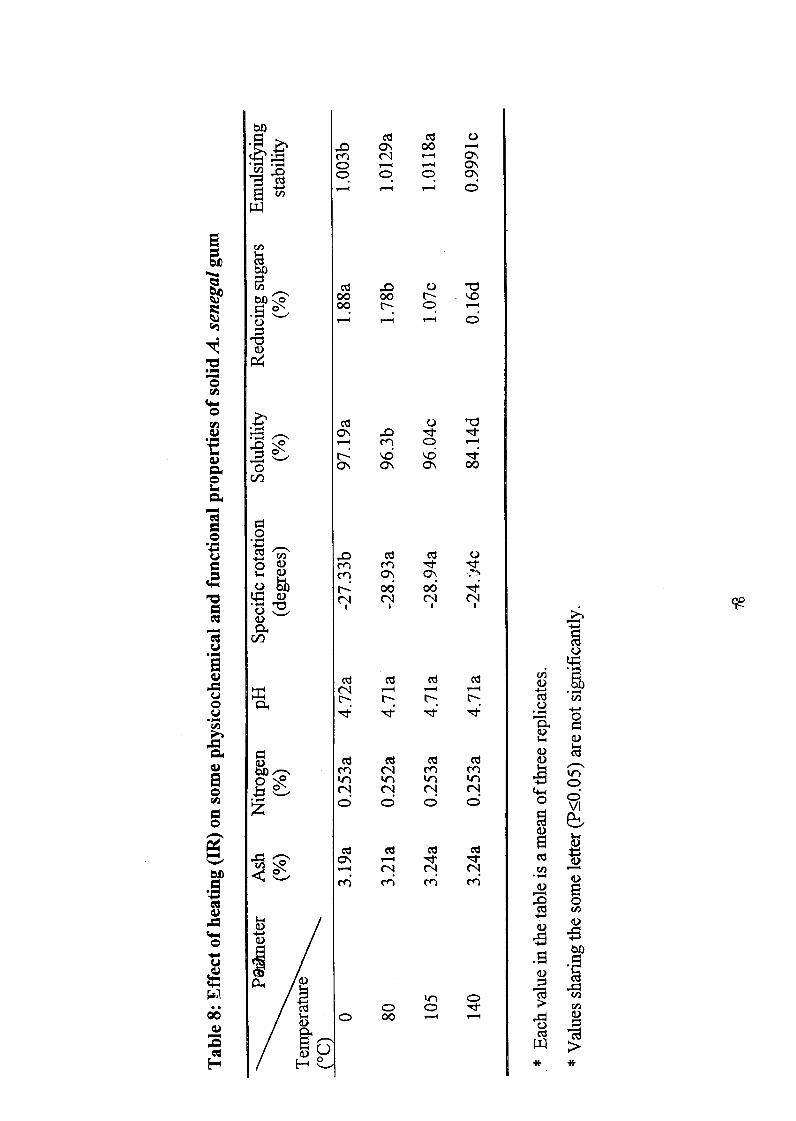
C13 0 C.)�o CIN 00 r-4m CIA r--4 oll�C> r--q C,,
C> C)
bb
rA co �o00 00 t-- I'Delf toC: .5 00
t6) C;co�
P4
W) C13C% I!t
'E '4B C� r-4116 1400
C)
7;
C13 m uC) m I:t I:t
C,% C,% .7NQ 06 06 4
...4
C-)O
rAco m Cfi Cd
r--4 1-4 r--4
64
4) ctCO cri cqj m
bo,-, m C4 Clf) c1r) C>4. 60 VI
CIS Cd co CO C's tl
C4 N cq
0
to
rnm CD C) l-
CZW >
gLIIII pymer chain (autoliydrolysis). Moreover, it may indicate the sugars
released i te peripheral cain.
3.6.2 Solubility
Usually gum arabic dissolves completely i ot or cold water as
shown in 'Fable (8) solubility decreasedasthetei-nperatureiiicreasedand
Was fLind to be 97.19% of untreated gum and decreased to 84.14% after
treatn,ent'with IR radiation at 140'C for hrs.. This reduction may be
caused by formation of a gel-like layer o te outside of particles as a result
of rapid ydration, which prevents penetration of moisture to inside gurn
1`1101CCUIC.
3.6.3 Reducing Sugars
Consideration of te data in Table (8) reducing sugars of gum
arabic was inversely proportional to the increase of temperature. Terefore,
it was found to be 1.88% for control gum which is higher tan 0.16%-
0.44% forA.seiiegalgLliiireporte(:IbyKaramallaetal.(1998)andreduced
to 0 16% after it-radiating at 140'C for hrs. Tis result may be due to te
association between water molecules which drives off the hydroxyl groups
resuitc-d. i eleases of sugar, in the peripheral cain.
3.6.4 Emulsifying Stability
'Fable (8) indicates tat emulsifying stability of control gum
recorded 1003 wich is close to 1026 for A. senegal gum reported by
79
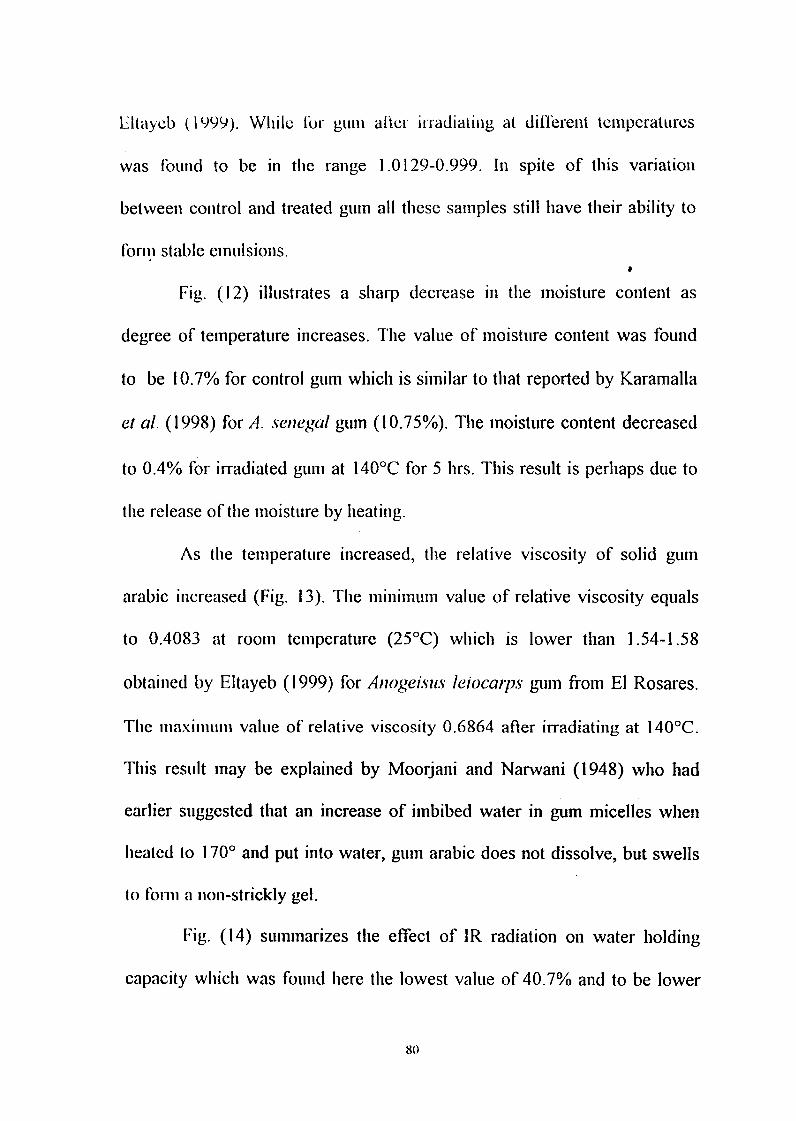
Eltayeb 1999). While I'Or guni aer irradiating at different temperatures
was Cound to be in tile age 10129-0.999. In spite of ts variation
between control and treated gurn all tese samples still have their ability to
rorni stable einuisions.
Fig. 12) illustrates a sharp decrease in te oisture content as
degree of temperature increases. Te value of oisture content was found
to be 10.7% for control gurn which is similar to tat reported by Karamalla
et al. (I 998) for A. senegal gurn (I 075%). Te moisture content decreased
to 04% or irradiated gurn at 140'C for lirs. Tis result is perhaps de to
tile release of te oisture by Treating.
As te temperature increased, tile relative viscosity of solid gurn
arabic increased (Fig. 13). Te inimum value of relative viscosity equals
to 04083 at rooin temperature (25'C) which is lower than 154-1.58
obtained by Eltayeb 1999) for Anog-eisus 10ocarps gurn from El Rosares.
The aximum value of relative viscosity 06864 after rradiating at 140'C.
This result ay be explained by Moorjani and Narwani 1948) who had
earlier sggested tat an increase of imbibed water in gurn micelles when
Treated to 170' and pt ito water, gurn arabic does not dissolve, but swells
to forn a non-strickly gel.
Fig. 14 smmarizes te effect of IR radiation oil water olding
capacity which was found liere te lowest value of 40.7% ad to be lower
8(
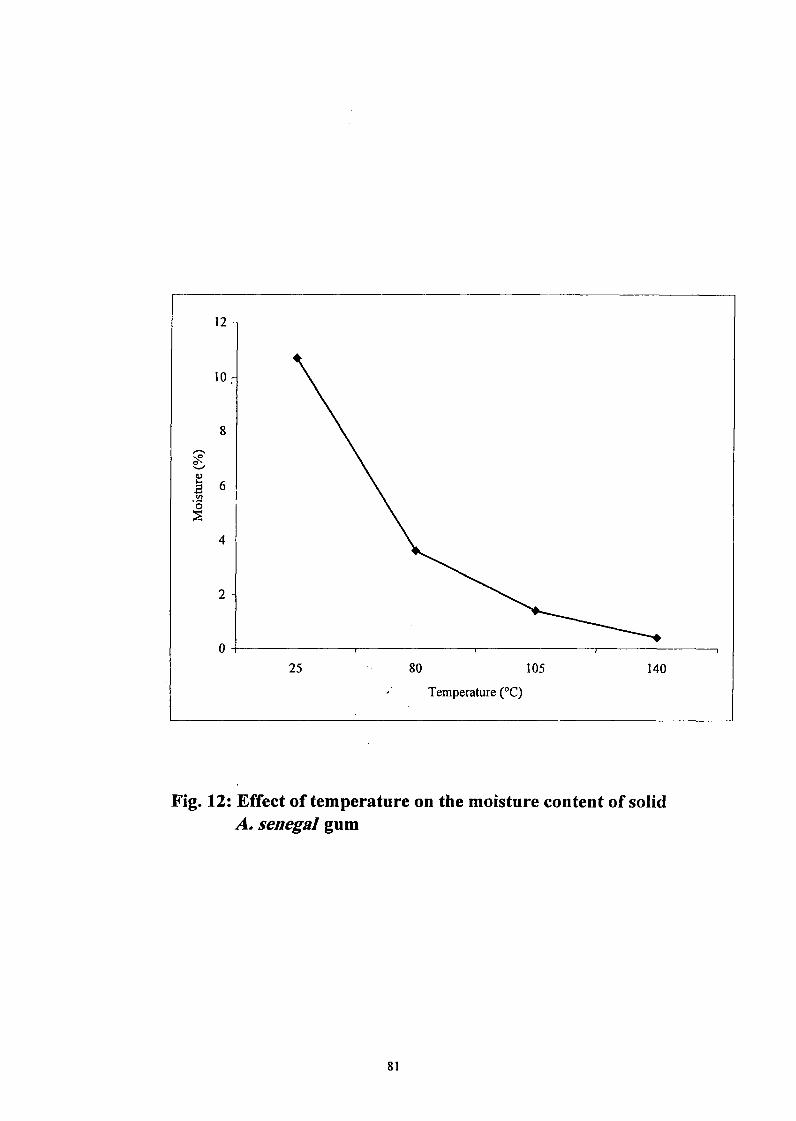
12 -
10
-1-1�S0
6 -.14 i0
4 -
2 -
0 - I I I 1
25 80 105 140
Temperature C)
Fig. 12: Effect of temperature on the moisture content of solidA. enegal gum
81
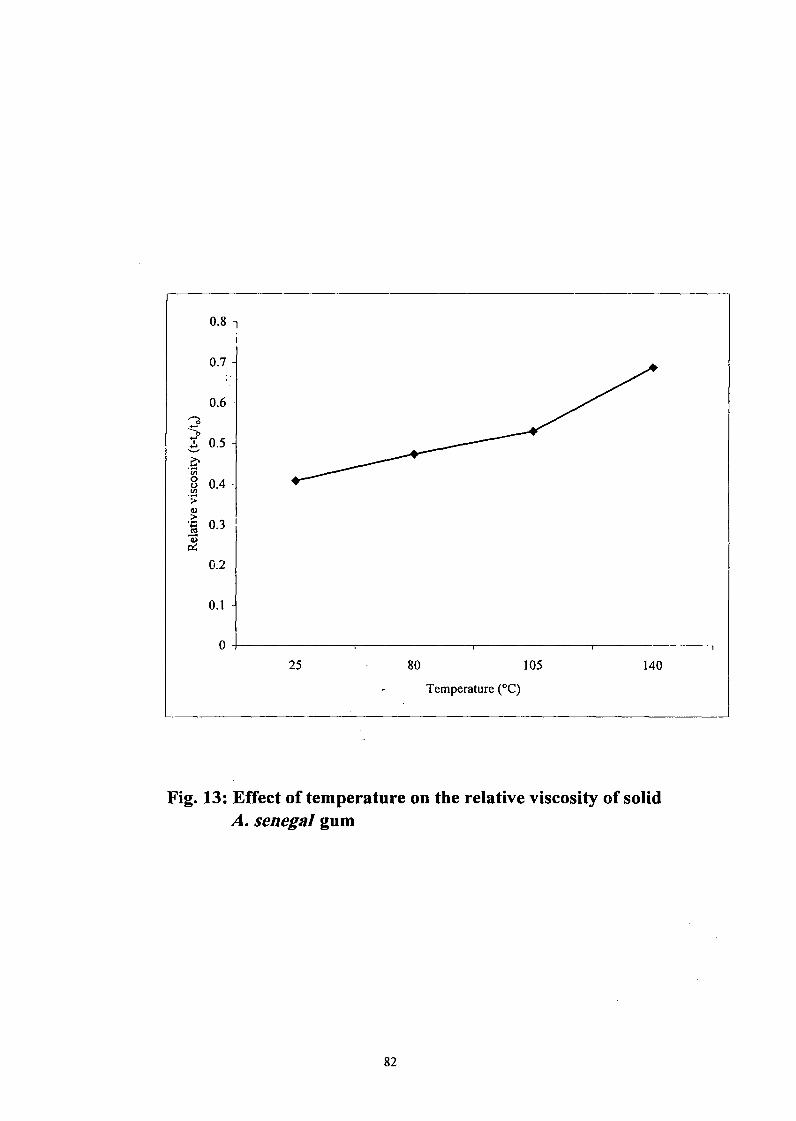
0.8
0.7
0.6
4 0.5
S 0.4En
0.3
0.2
0.1
0
25 80 105 140
Temperature C)
Fig. 13: Effect of temperature on the relative viscosity of solidA. Senegal gum
82
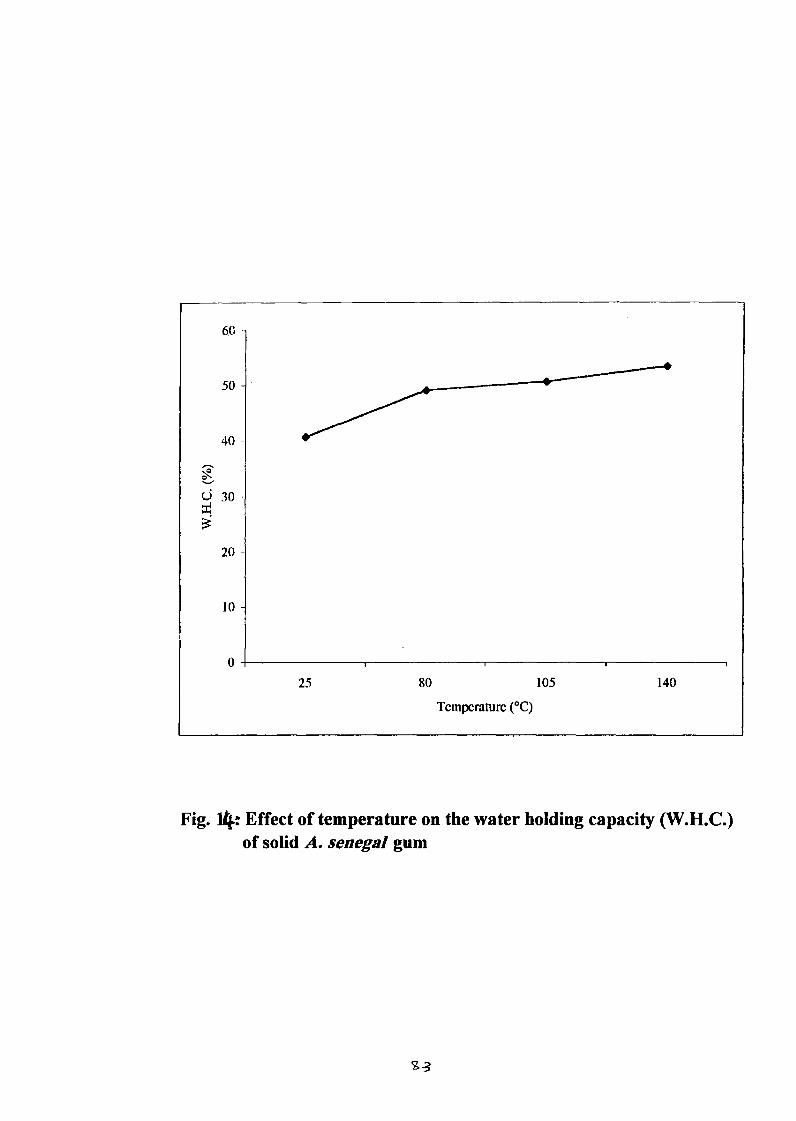
60
5 -
40 -
Zq
d 30 -�4ii
20 -
10
I
0 - I I
25 80 105 140
Tcmperature (C)
Fig. 14: Effect of temperature on the water holding capacity (W.H.C.)of solid A. enegal gum
-3
Fig. 1 sumi-narizes the effect of IR radiation on water holding
capacity which was found here te lowest value of 40.7% and to be lower
than 65.6% reported by Eltayeb 1999) for A. enegal gum. The highest
value of water olding capacity is 53.4% for a sample which is subjected to
IR radiation at 140'C. This direct relationship between water holding
capacity and temperature may be due to te increase in the molecular
weight of gut-n arabic Terefore, it has a higher activity to absorb water
molecules.
Statistical analysis found tat there are insignificant differences
(P<0.05) between unirradiated and iadiated A. enegal gw-n in ash
content, nitrogen content and pH value, but tere are significant differences
between tem in the specific rotation, solubility, emulsifying stability and
reducing sugars.
3.7 Effect of IR Radiation on some Physicochemical Properties of
Aqueous Acacia enegal Gum Solutions
3.7.1 pH Value
There are insignificant differences (P:50.05) in the pH value of gum
arabic solutions 20%) between two different temperatures, i.e. 80 and
100'C with increase in time. Table 9 indicates that pH value is in the
range 459-4.593 ., calculated at interval time (10 hrs) wch is very close
to 44 8 for commercial A. enegal gum obtained by Karamalla et al. (I 99 8).
84
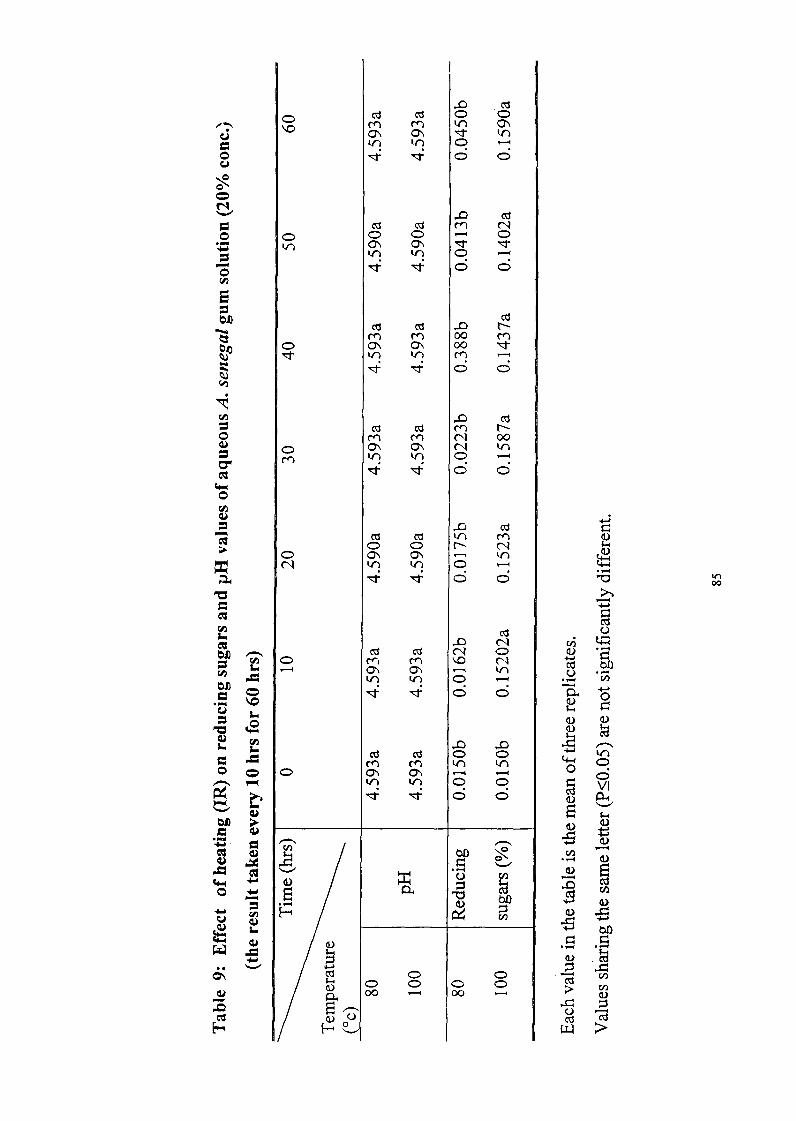
-0 CdC) w C's C) C)
rf) rr) Cl%C\ 0�
COc: cl Cd0 C) C) C> C)
(01) CIN
lr� kq C�I- C>
cdCd Cd -0 t-
ti rr) m oo mC> (01-1 C\ 00 ":t
rr)C;
w Cd rr)m 00COIN CA knkf) C)
4-(0
GnCD 4�
cl Cd co m 0)C) C:) CA
C:) CN CIN knkr) kn O
00
cd
Cd clq C) a)4�LA C) Cd bb
ON CIN kn 0tn tn C)
4�C) C)
I..w C> C>
m Ln V)C� (71, -- 4 0
tn C) VI
VI
4.4
W2cia)
;3 XiON C) cd
00 00_C:
0(-) Cd Cd
1-1 w >
3.7.2 Reducing Sugairs
Theie is a direct relationship between educing sugars ad
temperature wth icreasing i te (Table 9 Tile reducing sugars of
control guni solution 20%) obtained 0015% which is lower tan 016%
for A. enegal gUin reported by Karanialla el al. 1998). NMlile te lowest
value oh-c(Iticin sgars is 0.0 1 62% or the sample afler ydrolysis at 8O'C
for IO lirs.. Te hig lest value was 0 159% for a sample after ydrolysis at
I O'C for 60 lirs. and tis increase i reducing sugars after 60 lirs. indicates
the degradatio i te peripheral chain. Tis explains sugars are present in
the internal structure of te gum arabic are ot easily released.
Fig. 15) shows tat tere are o obvious trends for relationship
between specific rotation of A. eegal gurn solution 20% ad
temperature with increase in time. Specific rotation was found to be 25.5'
for control sample which is similar to tat reported by Churnis el al. 1983)
for A. enegal gL1111 (-26.0'). Te specific rotation for irradiated samples at
80'C ad 100'C, for 60 lirs., i.e. 10 irs iterval, decreased fi-orn 24.4 to
-7.2' ad 17.1' to -5.1', respectively. Tese results give a seful
indication to te degradation oi te guin arabic structure which is very
strong at I O'C ad for ore time.
Fig. 16) illustrates tat te relative viscosity of aueous gurn arabic
solution 20%) is inversely proportional to the temperature with an icrease
86
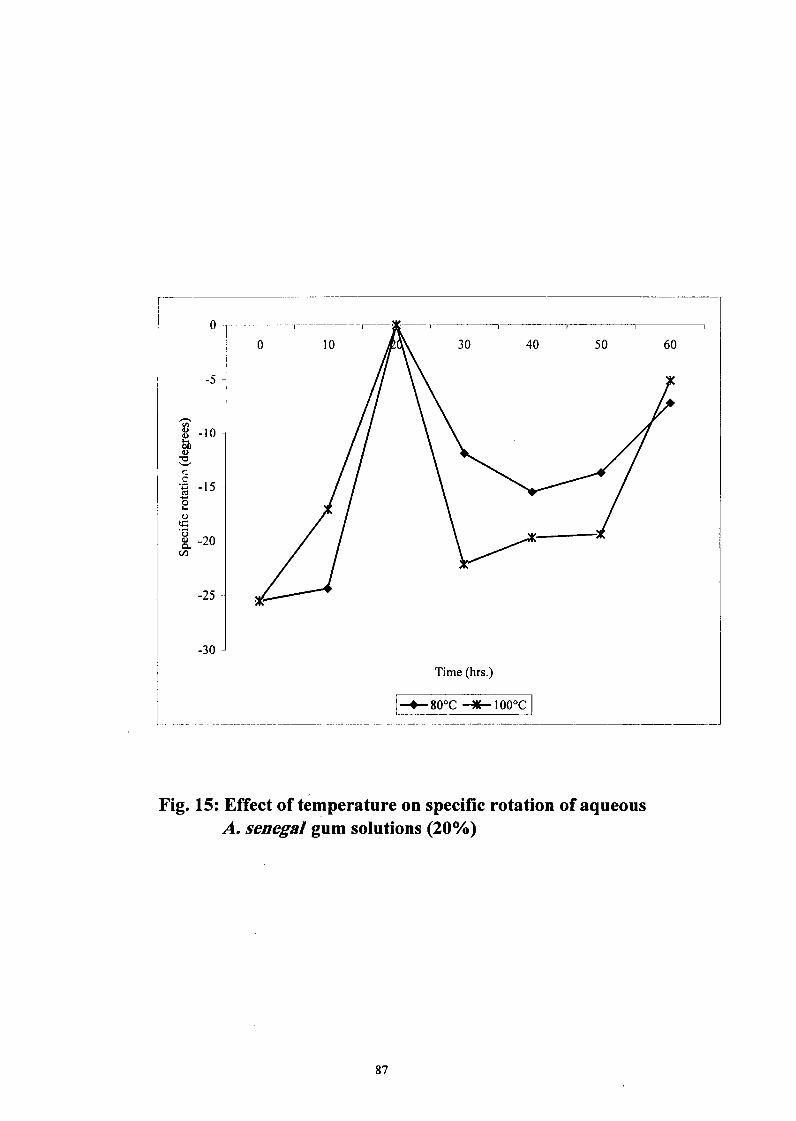
0
0 10 30 40 50 60
-5
-10
71,
150U
-20Cn
-25
-30
Time (hrs.)
1-4- 80-C 4- I 0-C�
Fig. 15: Effect of temperature on specific rotation of aqueousA. enegal gum solutions 20%)
87
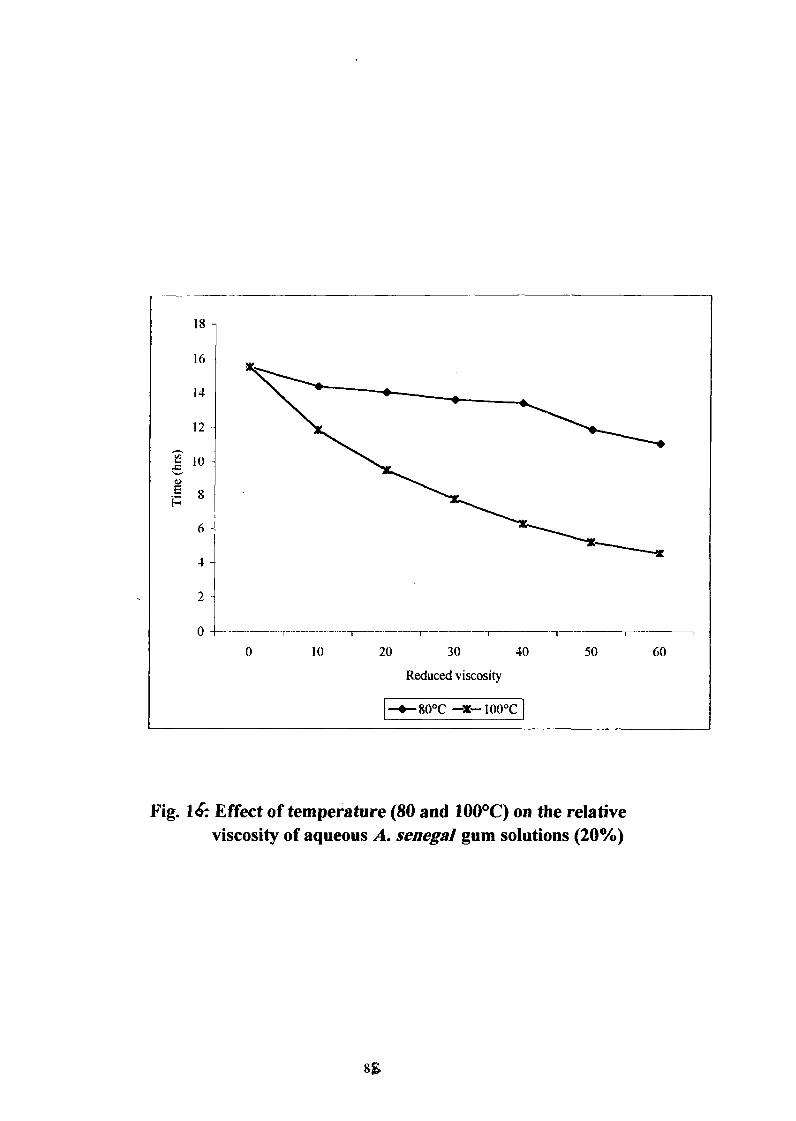
18
16
14
10
8
6
4
2
0
0 10 20 30 40 50 60
Reduced viscosity
800C -z- I OOOC
Fig. 14: Effect of temperature (80 and 1000C) on the relativeviscosity of aqueous A. enegal gum solutions 20%)
8 g
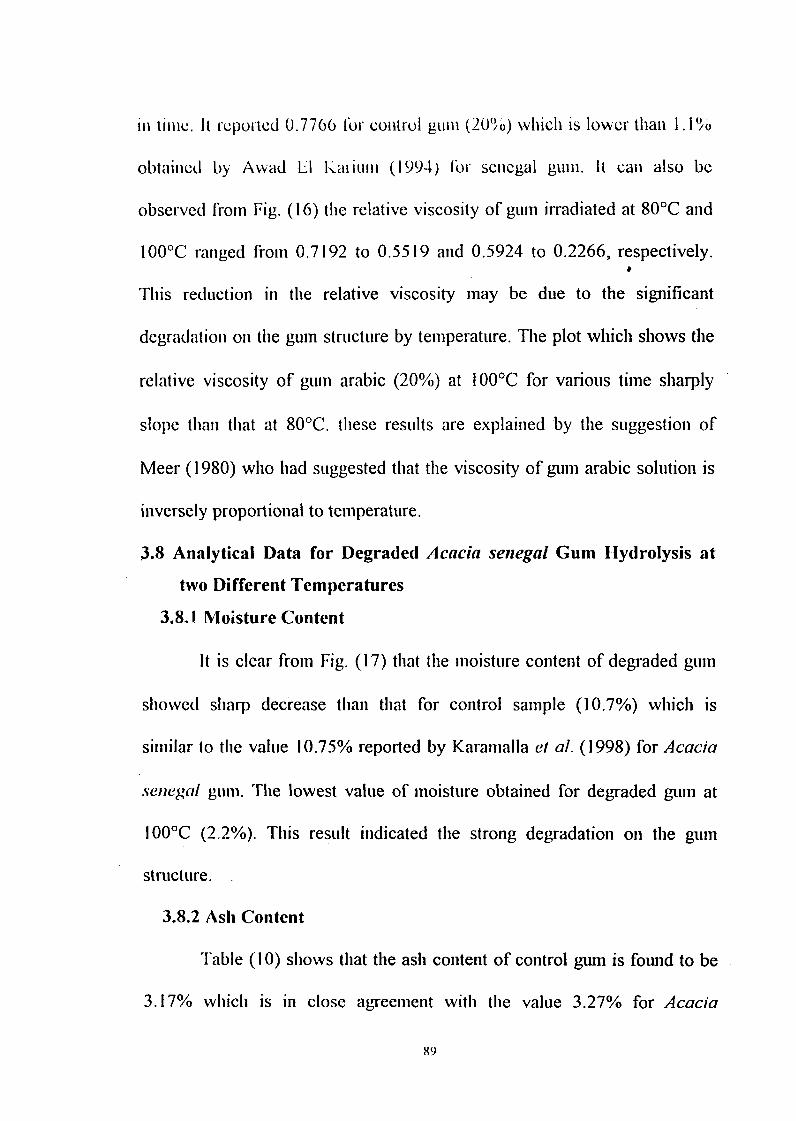
In Ifflic. It repoi-ted 07766 01' C011ti-01 gA1111 201/10') which is ower than I 0
obtained by Awad Li 11%'�ariuni 1994) I'oi- senegal guni. It call also be
observed froin Fig. 16) ie relative viscosity of gurn irradiated at 8O'C ad
IOO'C ranged Froin 07192 to 05519 ad 05924 to 02266, respectively.
This redLiCtiOn in te relative viscosity may be de to te significant
degradation oil te gurn structure by temperature. Te plot which shows tile
i-clative viscosity of guin arabic 20%) at IOO'C for various tirne sarply
slope than hat at 80'C. tese results are explained by te suggestio of
Meer 1980) who had sggested tat te viscosity of gurn arable solutio is
inversely proportional to temperature.
3.8 Analytical Data for Degraded Acacia enegal Gum Hydrolysis at
two Different Temperatures
3.8.1 Moisture Content
It is clear froin Fig. 17) tat tile rnoisture content of degraded gurn
showed sharp decrease than tat for control sarnple 10.7%) which is
similar to te value 10.75% reported by Karanialla el al. 1998) for Acacia
senegal guni. riie lowest value of moisture obtained for degraded gui at
1OO'C 22%). Tis result idicated te strong degradation o te giirn
structure. .
3.8.2 Ash Content
Table (IO) shows that te ash content of control gm is fowid to be
3.17% which is in close agreement with te value 327% for Acacia
89
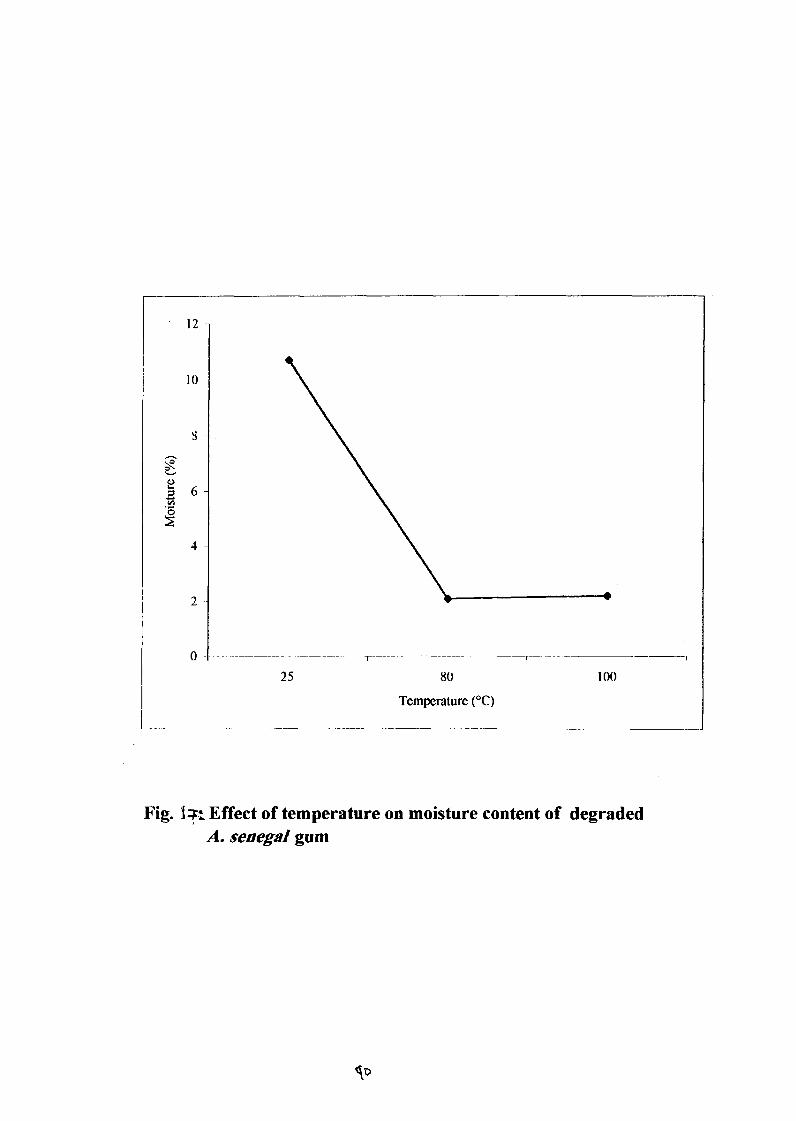
12
10
S
6
4
2
0
25 80 100
Tcinperaturc (C)
Fig. lq:, Effect of temperature on moisture content of degradedA. sevegql gum
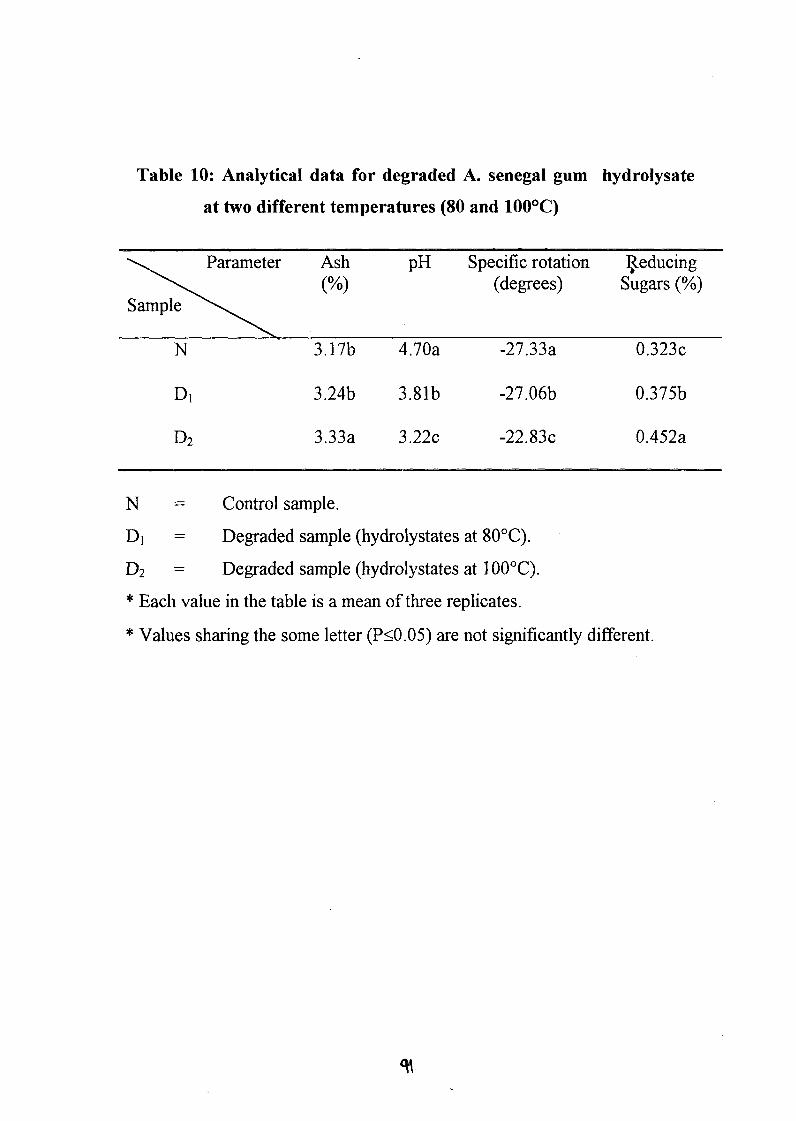
Table 10: Analytical data for degraded A. senegal gum hydrolysate
at two different temperatures (80 and 1001Q
Parameter Ash pH Specific rotation ReducingN (degrees) S�gars (%)
N 3.17b 4.70a -27.33a 0.323c
DI 3.24b 3.81 b -27.06b 0.375b
D2 3.33a 3.22c -22.83c 0.452a
N Control sample.
DI Degraded sample (hydrolystates at 80'C).
D2 Degraded sample (hydrolystates at 100'C).
* Each value in the table is a mean of three replicates.
* Values sharing the some letter (P<0.05) are not significantly different.
.senegal guin ieported by Anderson and Dea 1968). The degi-aded sample
Hydrolysis at 80'C ad 100'C for 60 lirs. resulted n 324% ad of
ash content, respectively. Tis variation i te result may be explained by
the presence of greater amount of iorganic salts on te degraded gurn.
3.8.3 141 Value
Table 10) concludes tat te pH value is inversely proportional to
the egradatio o te gurn strueture p value of control sample recorded
4.7 which is similar to value 46 reported by Kararnalla el al. (I 998) for A.
senegal gum. pH values, for degraded guni ydrolysis at 80'C ad 100'C
for 60 lirs. obtained 381 ad 322, respectively. This reduction in te pH
value ay be related to te release of some uronic acids ahydride which
are in te peripheral chain of gum polymer.
3.8.4 Specific Rotation
As shown rom Table (10) control ad degraded gum are
leavorotatory. Te specific rotation of control sample was found to be -
27.33' which is i close agreement with that reported by Aderson el al.
(1985) For athenticated A. enegal gum (-27.0'). Te degraded samples
Hydrolysis at 80'C and I O'C for 60 lirs. are obtained 27.06 ad 22.83',
respectively. Tis decrease i te specific rotation may idicate the more
degradation (release of sugars) which icreases at high temperature, occurs
on guni structure.
92
3.8.5 Reducing Sugars
'I able (10 sows direct relationship between reducing sugars ad
degraded gum te reducing sgars gave 0323% for control gurn wic is
slightly lower ta te value 044% reported by Karainalla el al. 1998) for
A. senegal guin. Te degraded guin ydrolysis at 80'C and 100'C for 60
lirs. producl-d 0375 ad 0452% respectively wich is te ighest value.
This result may iicate tat ighly significant degradation occurs at
100'C, higher temperature, tat detected for more sgars wich are present
in (lie internal structure of te gurn arabic.
Statistical aalysis was done ad it is observed that tere are highly
significant differences (P<0.05 i te ash content, pH value, specific
rotation and reducing sgars between control ad degraded gurn ydrolysis
at two different temperatures (8 ad I 0'Q.
3.8.6 Nitrogen Content
Fig. (18 sows tat te itrogen ontent of control gurn was 025%
which is smilar to 027% reported by Jurasek el al. 1993) for A. enegal
gurri. 1litrogen content for degraded gum ydrolysis at 80'C and 100'C for
60 lirs. resulted i 0224% ad 0189%, respectively. Tis reduction in te
nitrogen content occurs because some of glycopeptide linkages were
broken by degradation o te guin structure. Te decornposition of tese
linkages mcrcase3 as temperature crease.
93
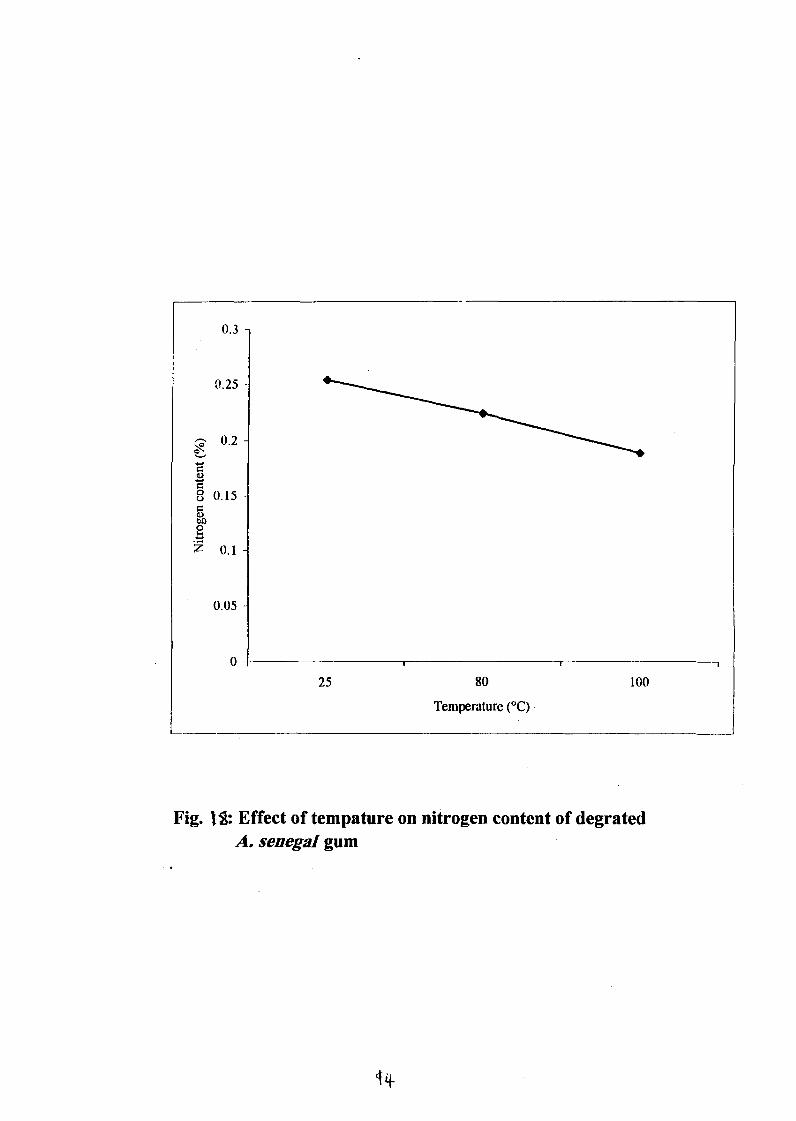
0.3
0.25
0.2
0.15
Oto2
O. I
0.05
0
25 80 100
Temperature C)
Fig. 19: Effect of tempature on nitrogen content of degratedA. senegal gum
3.8.7 Relative Viscosity, Intrinsic Viscosity and Molecular Weight
From Fig. 19) and Fig. 20) there are obvious trends reduction
observed on the relative viscosity and intrinsic viscosity from 04920 and
3.45 for control sample to 02171 25 and 00756 13 for degraded sample
hydrolysis at 80'C and I O'C, respectively. These results give a useful
indication of the degradation on the gum structure which has a direct
relationship with the temperature. This reduction on the relative and
intrinsic viscosity is reflected in the reduction on the molecular weight
from 3.0807xl 04 for control gum to 1.6967xl 04 and 0.5054xl 04 for
degraded gum hydrolysis at 80' and I O'C, respectively (Fig. 2 ), this is
explained by the suggestion of Anderson and Dea 1969), who had
suggested that viscosity is a factor involving the size and shapeofthe
macromolecule.
3.8.8 Reduced Viscosity
Fig. 22) illustrates the plots of reduced viscosity of control gum
against concentration percentage which is the higher area of the diagram
than that for the degraded gum. This leads to the conclusion that highly
significant degradation occurs on the gum polymer molecule (control gum
has higher molecular weight than degraded gum) which is in agreement
with that reported by Dickinson et al. (I 988) for A. enegal gum.
95
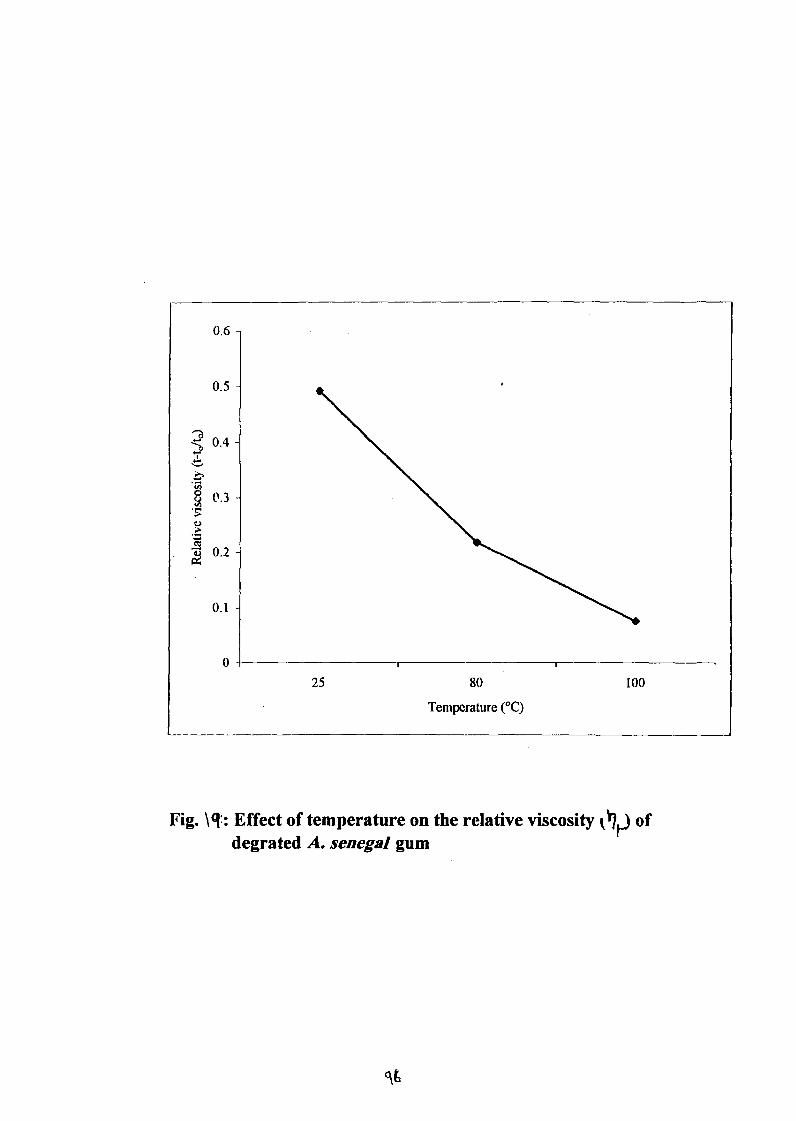
0.6
0.5
0.4
0 0.32'5
'8 0.2P4
0.1
0
25 80 100
Temperature T)
Fig. \%: Effect of temperature on the relative viscosity k� ofdegrated A. enegal gum
�C
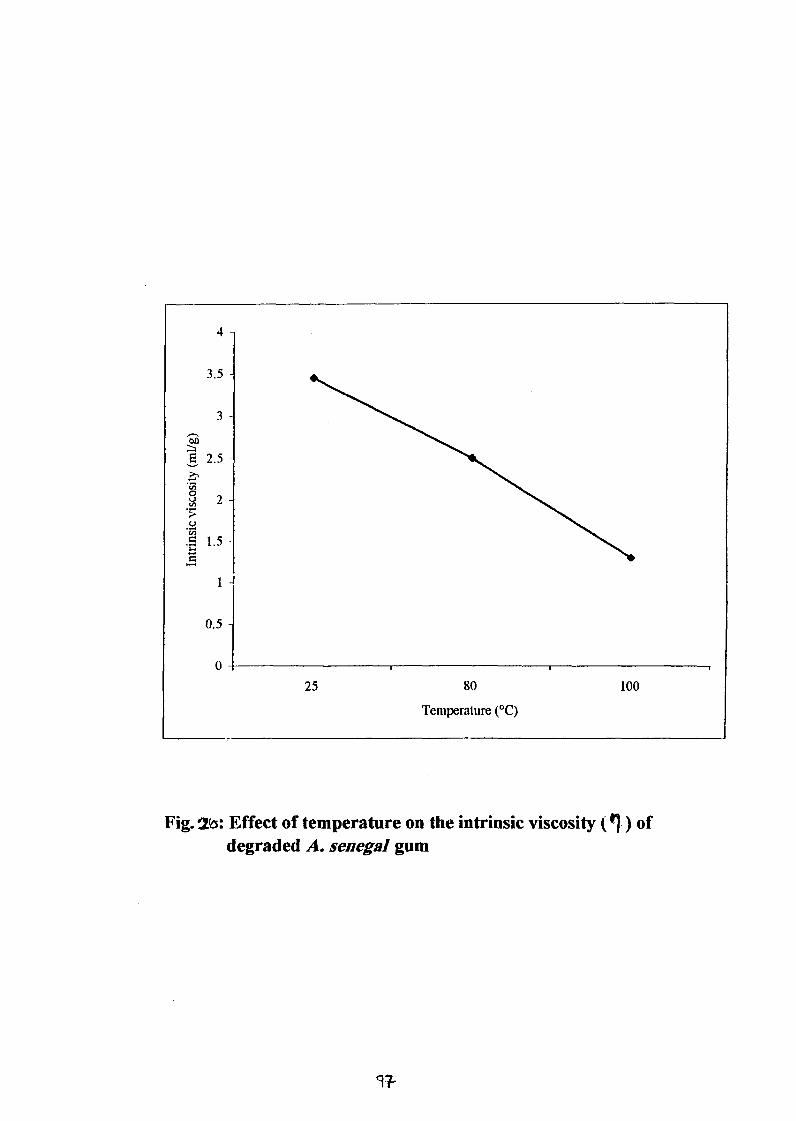
4
3.5
3
2.5
2
Cn1.5
1
0.5
0
25 80 100
Temperature C)
Fig. To: Effect of temperature on the intrinsic viscosity ofdegraded A. enegal gum
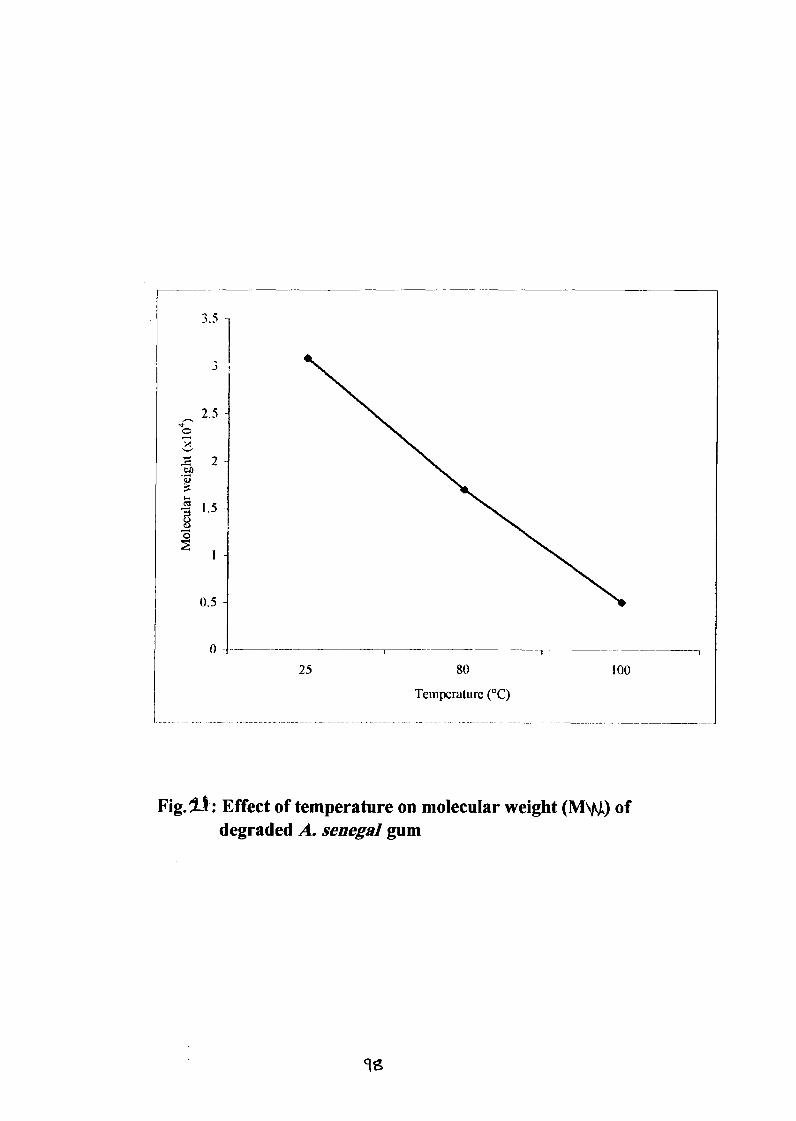
3.5
3
2.5
2
1.5
0.5
0
25 80 100
Temperature T)
Fig. IJ: Effect of temperature on molecular weight M\A ofdegraded A. senegal gum
99
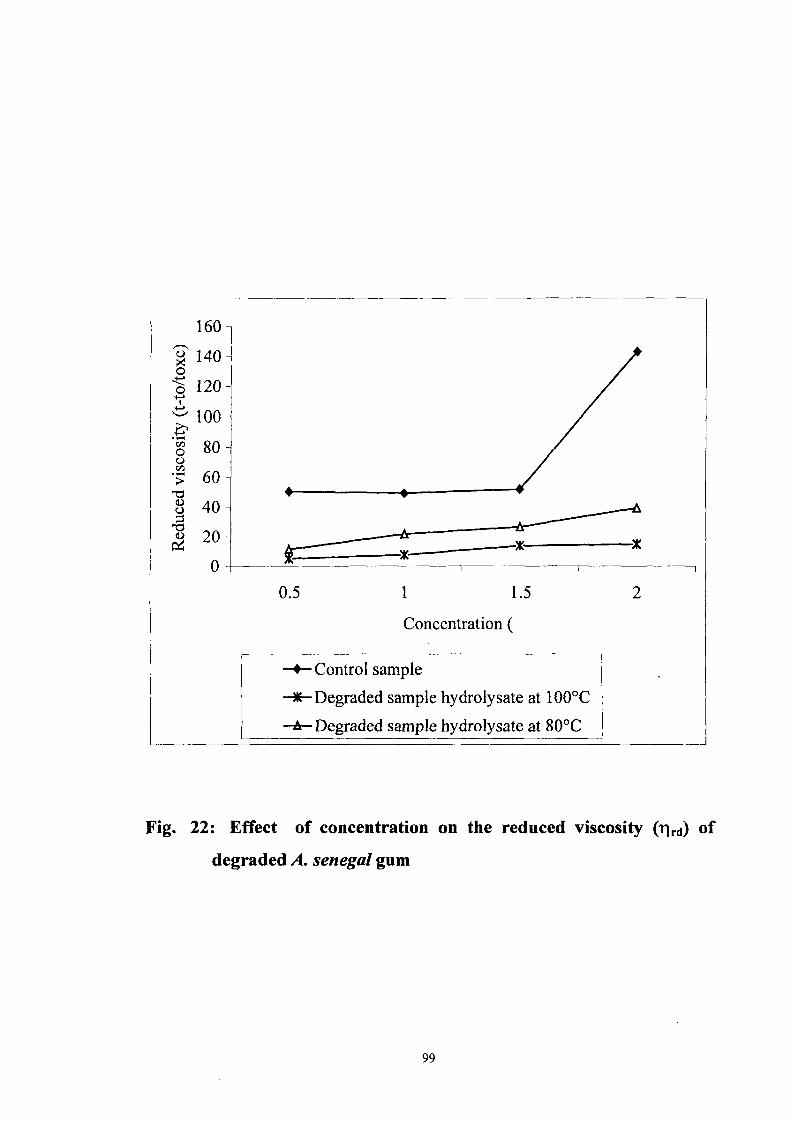
160
140
120 -
100
80
60 -
40 -
20 -
0
0.5 1 1.5 2
Concentration
-4- Control sample
)K Degraded sample hydrolysate at 100'C
Degraded sample hydrolysate at 80'C
Fig. 22: Effect of concentration on the reduced viscosity d Of
degraded A. enegal gum
99
3.9 Fractionation
III thIS StUdy II-action 0' hILICOLIS A SellegUl g1li Sutions (10%),
before arid after irradiating by gaini-na rays, wth 150 and 500 gray using
acetone as a solvent. Therefore, six dfferent fractions precipitated and
some physicocheinical properties were studied. Te results compared
between whole guin ad its fractions before ad after irradiating.
3.9.1 Moisture Content
From Table (I 1) it is concluded hat tere are o obvious trends
observed vvith radiation dose and te firaction for A. eegal gurn. Te
highest value for fraction (11) when treated wh 500 Gy. produced 22.96%
and te lowest value obtained 113% for faction FR) of sample irradiated
with 150 Gy. Tese ranges are different with the range 10.7-11.13% for
whole guni and also higher than tat rported by Nour (996) for ten
different fractions of A. senegal guin 3.7-15.7%) obtained by precipitation
using acetone as a solvent.
Statistical aalysis sowed tat tere was highly significant
differences (P<0.05) between all of' tese fractions i oisture content
except between fraction (111 ad (IV) as well as fractions (1) and (II) for
unirradiatied gurn and fractions (V) and (VI) for sample irradiated wine 500
Gy.
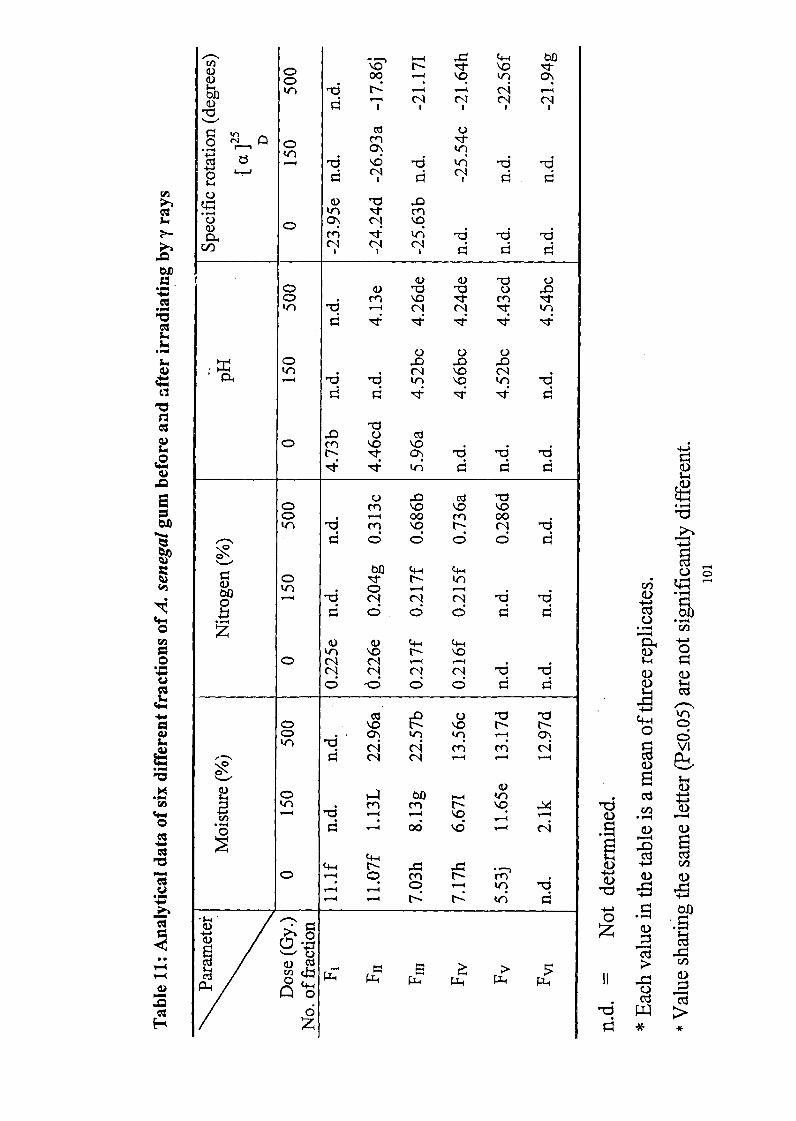
C) 00 �o V)
0 Ntk4(
0 C�
kr)ON CIA �o
C) 4 tri �6CIA CIA
letu
C) mkf)
tr) kf)
r_i ci 4 Fi
C.) CcC)
C) Cf)C) 00 00 7:1
CY) %D tl- cqti a
C) t-- kr)C)C14 N N0
+bC/)z
kn
C-4 C14 clq _Tj -6 Q)
C)
-6-* cd knC> 1�0 r- rl- C)
kr) (n C\ C)C-i cli C-i VI
44" .1
C'3t- %O(U
0 06 �,6
cd
C) m t-C% C>
Q cri
cli 4-40 4-4 V-4P-4 �3
o I
cl >1-4 z
3.9.2 Nitrogen Content
Considering the data in Table (I 1) it can be concluded that nitrogen
content of all five different fractions, for unirradiated and irradiated gum, in
the range 0204-0.736%. This range is different from that of whole gum as
shown from Table 2 in the range 03 77-0.41 % but is similar with the
range 0 1-0.86% reported for three fractions obtained by size exclusion
chromatography of A. enegal gum sample reported by Vandevelde and
Fenyo 1985).
Statistical analysis showed that there are highly significant
differences (P<0.05) in nitrogen content in all of these fractions for A.
Senegal gm before and after irradiating with gamma rays, i.e. 150 and 500
Gy. (Table I . However, F (111) and F (IV) for both unirradiated and
irradiated gum with %5C',, Gy. resulted in insignificant differences (P<0.05)
between them and also there are insignificant differences between F (1) and
F (11) for unirradiated sample.
3.9.3 pH Value
pH value of six fractions for A. enegal gum, before and after
irradiating with gamma rays, indicated the acidity of these fractions from
the range 413-4.73%. This range is higher than that for whole gum
obtained 413-4.26% (Table 2 and similar to the range 465-4.74%
reported by Nour (I 996) for five different fractions of A. enegal gum
102
obtained by acctonc pi-ccipitatioll I 0�%,Cvcr F (111) I'Oi- Unirradiated gLIM
recorded p-I value of 596% which is very high. This ay be attributed to
the presence of more uronic acid anhydride in flat fractions
3.9.4 Specific Rotation
'Fable (I 1) presents te six dfferent fractions for unirradlated and
irradiated guin are leavorotatory ad te specific rotation ranges from -
17.86' to 26.93'. Tis value is inuch lower tan tat for whole grn frorn
-32.980 to 31.360. Tese results ay be de to te degradation on te
guin structure after fractionating. Te specific rotation for unirradiated ad
irradiated gurn with 500 Gy. decreased from F (1) to F (VI) while for
irradiated guin with 150 Gy icreased from F (11) to F (IV). This result
may be rated to te reassociation between gw-n polymer molecule with
the dose 150 Gy I tis study te inean value of six dfferent fractions is -
25.4' which is i close agreement with te value 25.0' of tile third raction
of'A. senegal guin reported by Vandevelde ad Fenyo (I 985 ad is similar
win tat gven by Nour ( 996) for A. enegal gum.
Statistical aalysis sowed tat tere are highly significant
differences (P<0.05) betwee te six fractions before and afler irradiating
by gainina rays with 15 ad 500 Gy i te specific rotation.
M
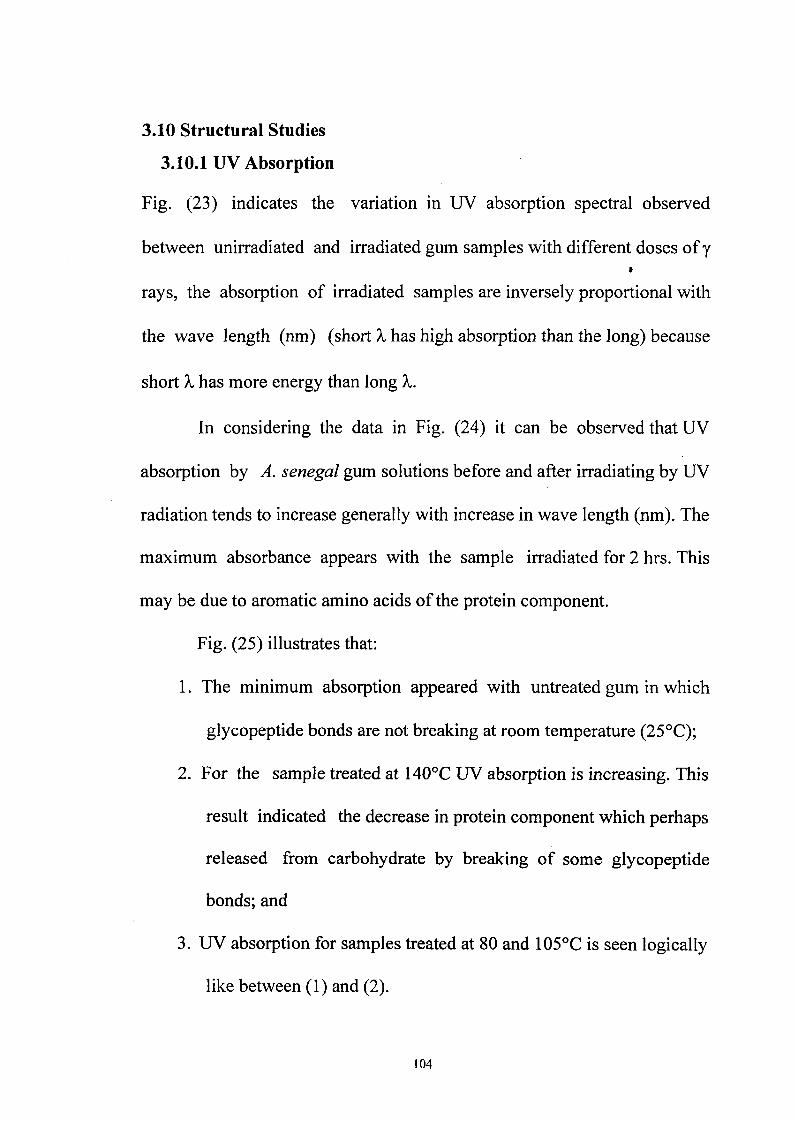
3.10 Structural Studies
3.10.1 UV Absorption
Fig. 23) indicates the variation in UV absorption spectral observed
between unirradiated and irradiated gum samples with different doses of y
rays, the absorption of irradiated samples are inversely proportional with
the wave length (nm) (short has high absorption than the long) because
short has more energy than long X.
In considering the data in Fig. 24) it can be observed that UV
absorption by A. enegal gum solutions before and after irradiating by UV
radiation tends to increase generally with increase in wave length (nm). The
maximum absorbance appears with the sample irradiated for 2 hrs. This
may be due to aromatic amino acids of the protein component.
Fig. 25) illustrates that:
1. The minimum absorption appeared with untreated gum in which
glycopeptide bonds are not breaking at room temperature (25'C);
2. For the sample treated at 140'C UV absorption is increasing. This
result indicated the decrease in protein component which perhaps
released from carbohydrate by breaking of some glycopeptide
bonds;and
3. UV absorption for samples treated at 80 and 105'C is seen logically
like between (1) and 2).
104
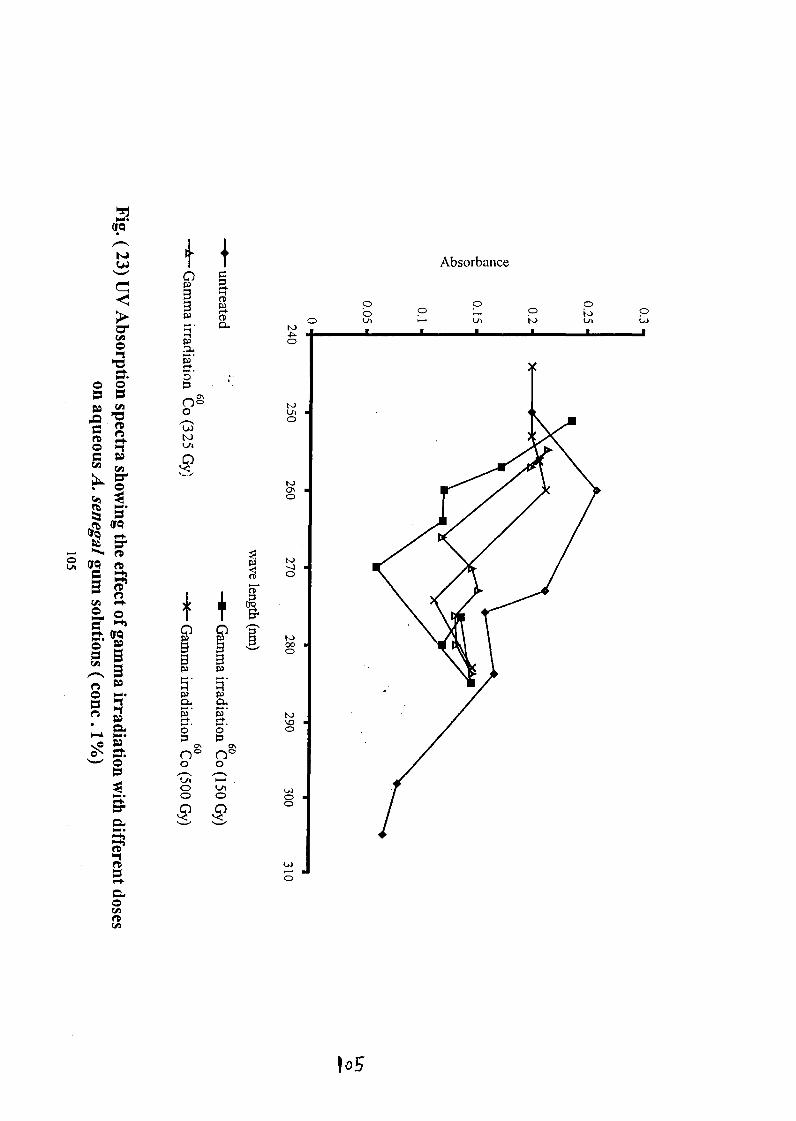
(IQ
w Absorbance
(D CD
Ca.
no
0 LA
CD W
r151CD
ft.
VA IrDC)
CD
tA F4-
TQ 00CD
C)CT-,no
0VA
CDC:> C> C)
CD
CDrA
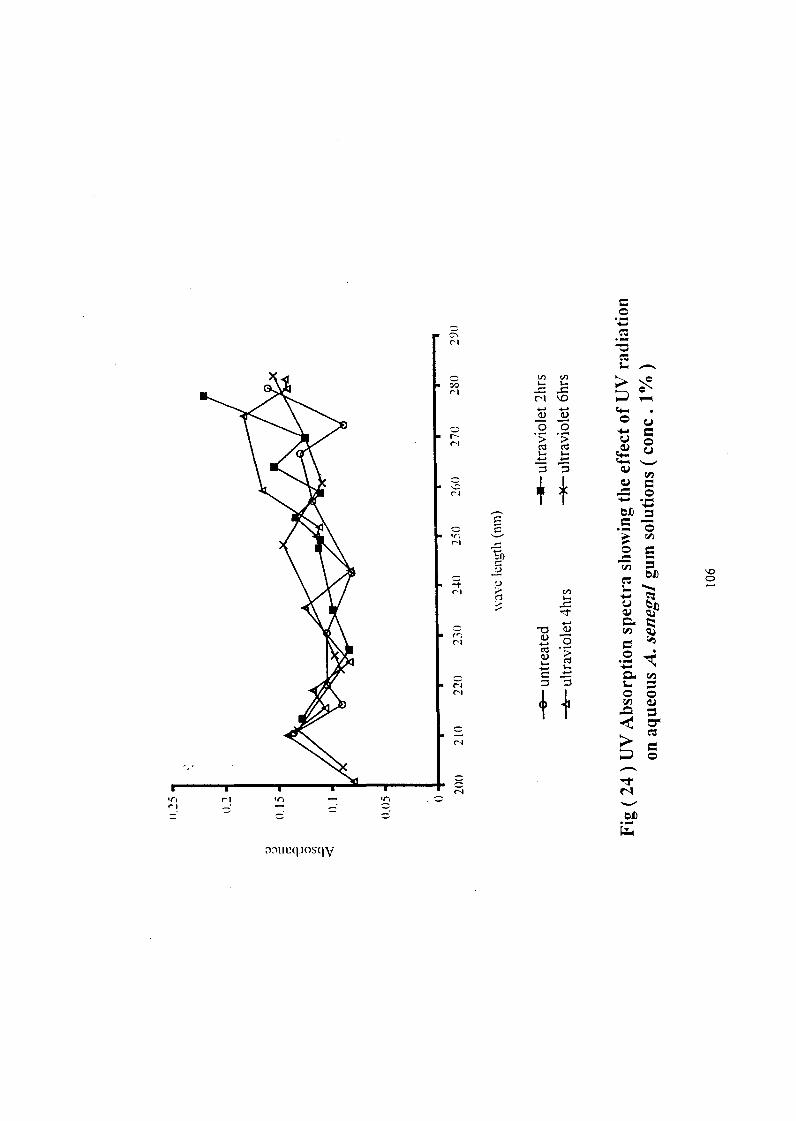
Le) tn" L-
CA -= _cl I'D
.2 .2> >Cd Cld
to,)
CA
CA ell
Cd
C'4
rl
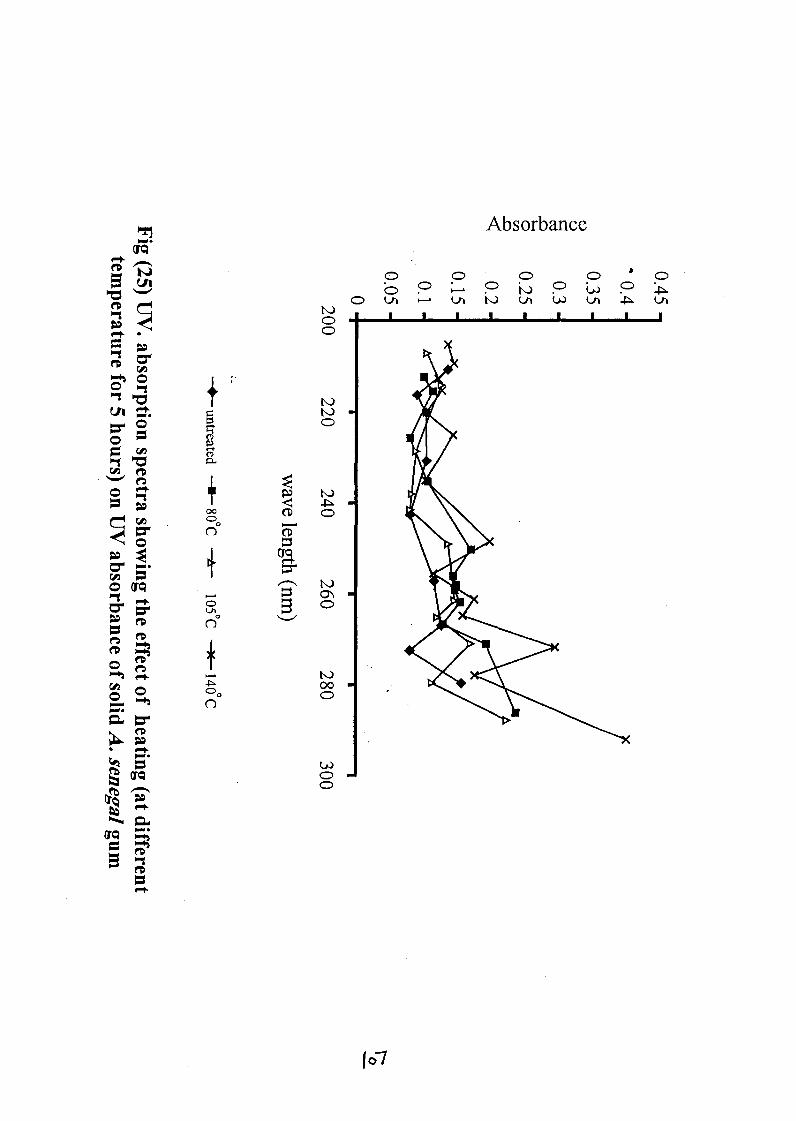
orl AbsorbanceQrQ,P-t-CD CD CD CD CD
CA
ow
CD
CD
00 CD CDC)o 0--
TQ
00CD,
C)
r-t,GrQ C)
C)
6-7
It is clear fro F. 26) hat increase ofteniperature ad time cause
an increase in absorbance ad this ay be de to breaking of some
glycopeptide bonds in te guin structure. Therefore, increase i UV
absorption by released protein is observed.
Fig. 27) shows tat the degraded gurn at 100'C contains lower
protein tan gurn degraded at 80'C shown i Table 10). Therefore,
absorption by UV is amost te sarne because of te presence of aromatic
acid i te bound and unbound protein. But both degraded guin are higher
absorption tan tat of whole control) gurn. this may be attributed to
release of protein by breaking of some glycopeptide bonds.
3.10.2 Effect of Radiation (Y, UV ad IR) on the Carbohydrate of
A cacia enegal Gum
Malysis of unirradiated and irradiated gurn by gaini-na rays with
150, 325 and 500 Gy. sing TLC shows tat sugars are released and te
component of sugars were not affected by te various doses of Y radiation
using i tis study (Plate 1). Tese results are i agreement with tat
reported by Bokhary el al. 1983). 1
Plate 2) illustrates that component of sugars (arabinose, galactose
and rhamnose) for A. senegal guin before and after irradiating by IR at 80,
108
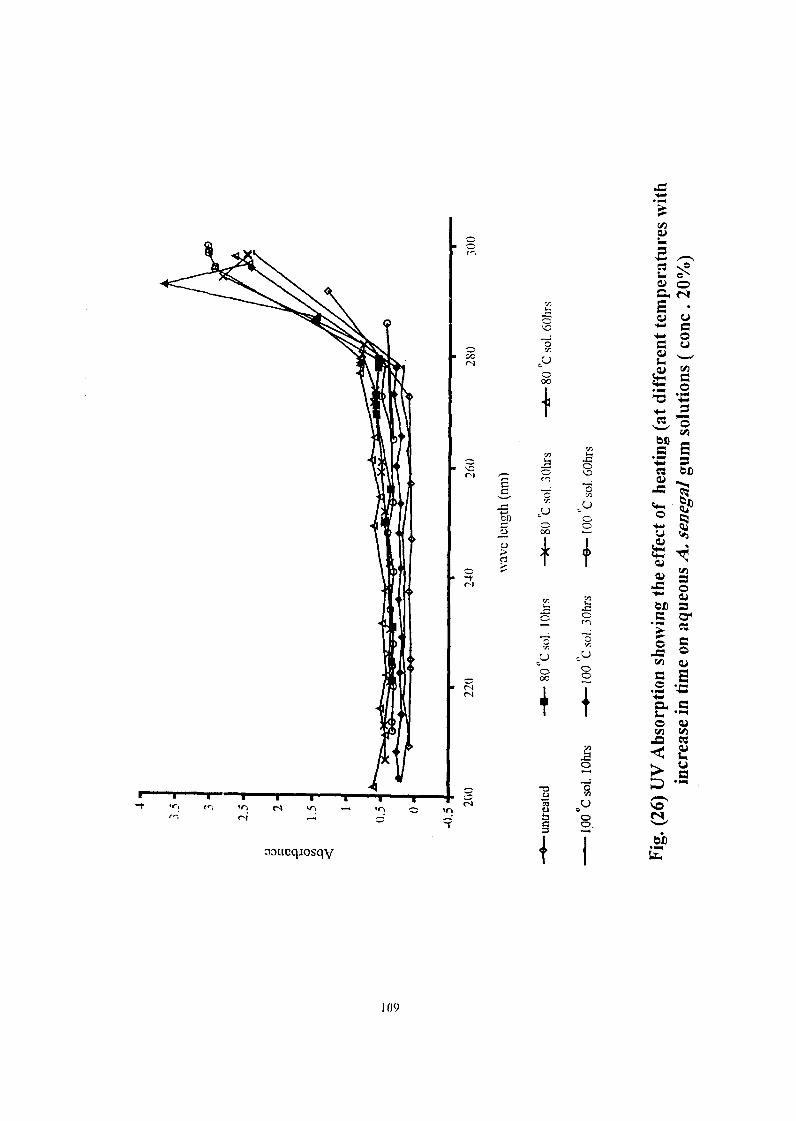
iZ,\0
0
CA
00
li 00
ou00
0CA
CD eq
i-jLtt:qjosqV
1(9
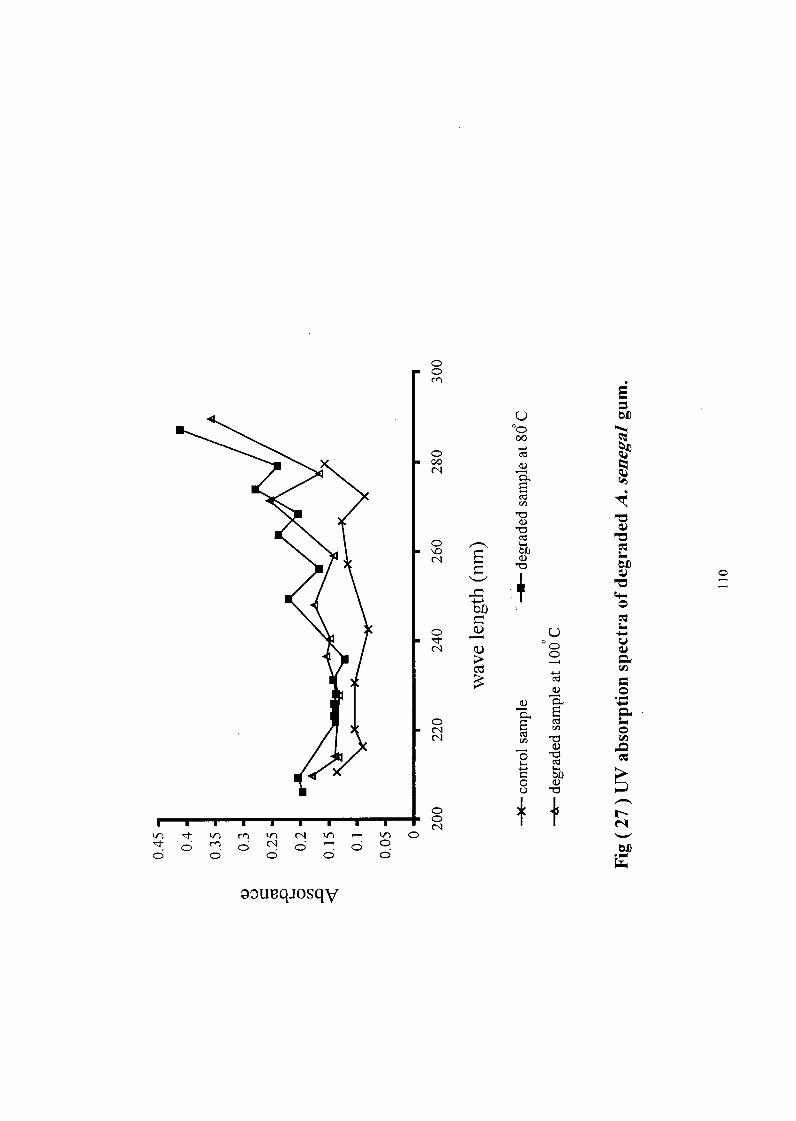
C)C)
00
C) Qj00
C>
4-4
CD
COCA
co
0
C)"C'
kr) m Ln kr) C)M CD " 6
C> C)
oouuqiosqV
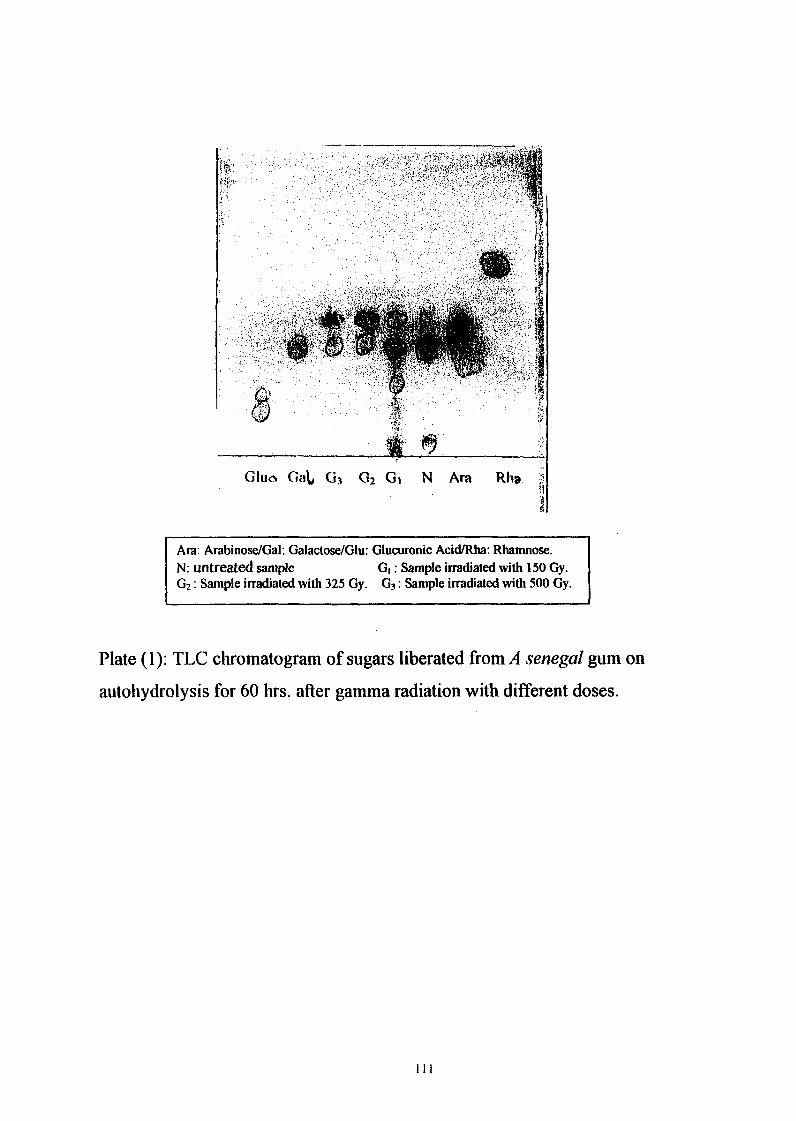
I4Ida,
Gluo GaL G., G 2 G, N Am Rha.
A
Ara: Arabinosc/Gal: Galactose/Glu: Glucuronic Acid/Rha: Rhanmose.N: untreated ample GI: Sample iffadiated with 150 Gy.G2: Sample iffadiated with 325 Gy. G3: Sample iffacliated with 500 Gy.
Plate (1): TLC chromatogram of sugars liberated from A enegal gum on
autohydrolysis for 60 hrs. after gamma radiation with different doses.
III
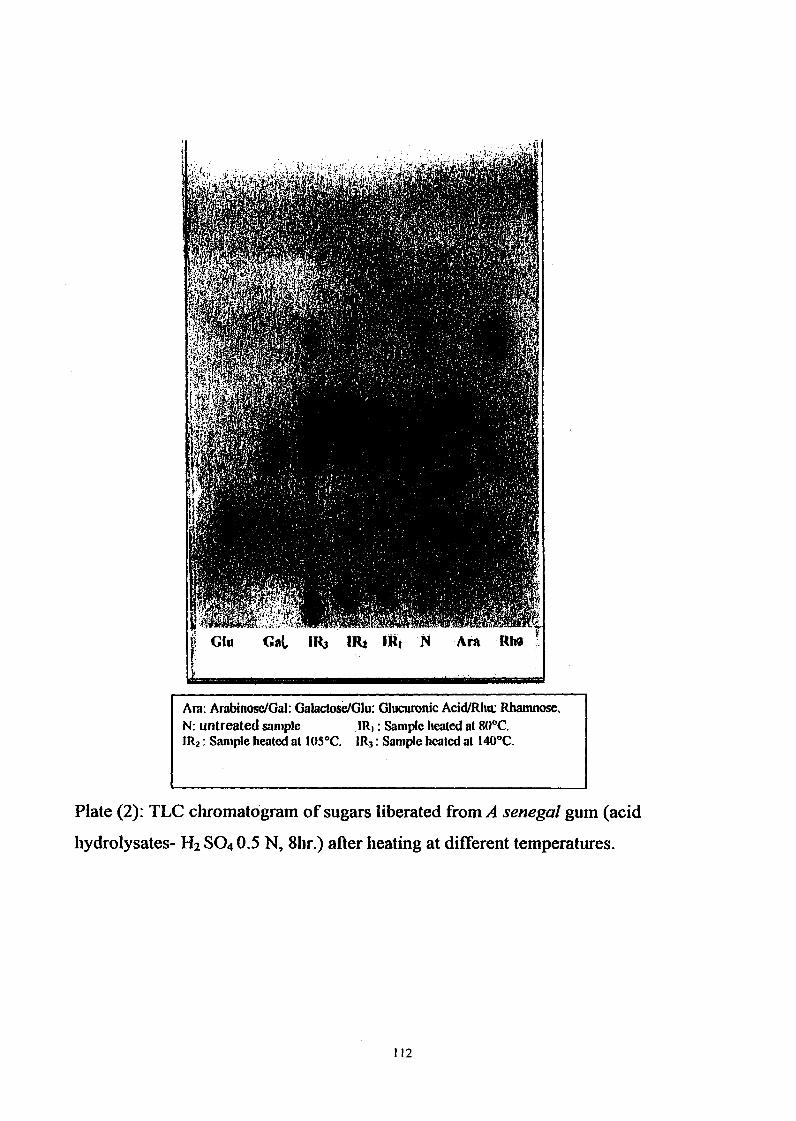
Glu GIIL IR3 IR2 JR, N Am Rho
Ara: Arabinose/Gal: Galactose/Glu: Glucuronic AcidtRhn; Rhaamose.N: untreated Sample .IR, Sample heated at 80'C.1112: Sample heated at 105"C. 113 Sample heated a[ 140'C.
Plate 2): TLC chromatogram of sugars liberated from A enegal gum (acid
hydrolysates- F12SO40.5 N, 8hr.) after heating at different temperatures.
112
105 aiid 140"C we released. These results are i agfeernent with literature
and there are L'tnknown traces of oligosacchanides appeared.
It is clear from Plate 3) TLC chrornatogram shows tat HI releases
three kinds of sugars (arabinose, galactose and rharnnose by
authhydrolysis at 100'C which were more than tat released for gurn
Hydrolysis at 80'C.
Plate 4 shows tat carbohydrates (arabinose, galactose and
rhaninose) from A. senegal gurn before nd after irradiating by Y, UV ad
IR radiations with different doses were released and different uknown
traces of ofigosaccharldes were also observed.
3.11 Conclusion ad Recommendations
1. .1. eegal gurn rradiating with garnina, ( 60CO), Ultraviolet ad
infrared radiations even tip to doses of 500 Gy., 6 lirs ad 140'C,
respectively, he physicochemical ad ffinctional properties
changes ocurred in tis polysaccharlde are very small, and have
110 ignificant influericc o its structure.
2. Zesults proved tat no negative effect of gamma 60 Co), ultra-violet
and infrared irradiations on te ability of A. enegal gurn to form
stable emulsions.
I
3. TC SLIgars component of' SellegUl gL1111 were ot afilected. by
garnnia 60 CO) ad Ultraviolet. However, infrared releases simple
sugars and some ofigosaccharides.
The above ffiree results are very iportant sce y 60(Co), UV ad
IR radiations are significant i food ad parmaceutical idustries
(sterilization and cooking).
4. Sorne work sould be done in gurn to detect any cange due to
microorganism before ad after irradiation.
5. It is recornmended tat guin arabic sould be subjected to uch
higher doses of te three radiations to study teir effects o te
physicochernical ad ftinctional properties of gurn arabic.
114
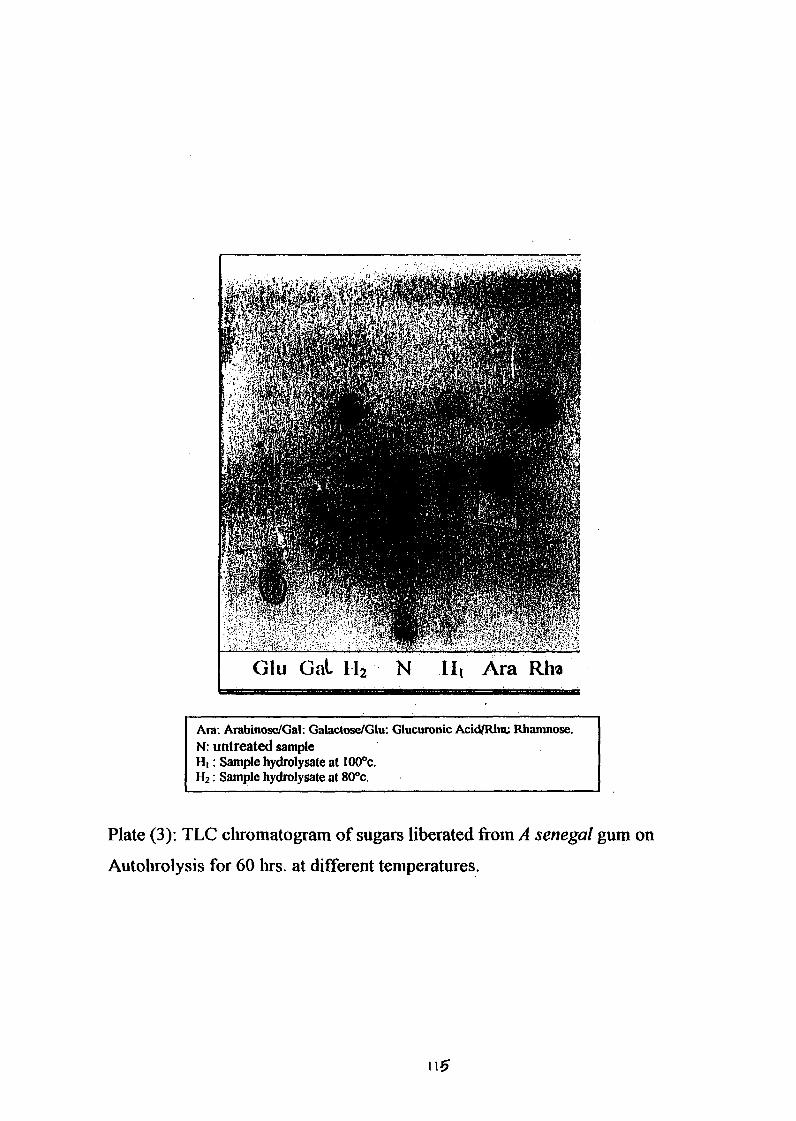
�to
OW -JP -1 Tillld-OMKI V wk.1 04
Glu GaL [1� N 11, Ara R hi
Am: ArabinosclGal: Galactose/Glu: Glucuronic AcidtWitu Rhaminosc.N: untreated sampleHI Sample hydrolysate at 100'c.H2 Sample hydrolysate at 80'c.
Plate 3): TLC chromatogram of sugars liberated from A enegal gum on
Autolirolysis for 60 hrs. at different temperatures.
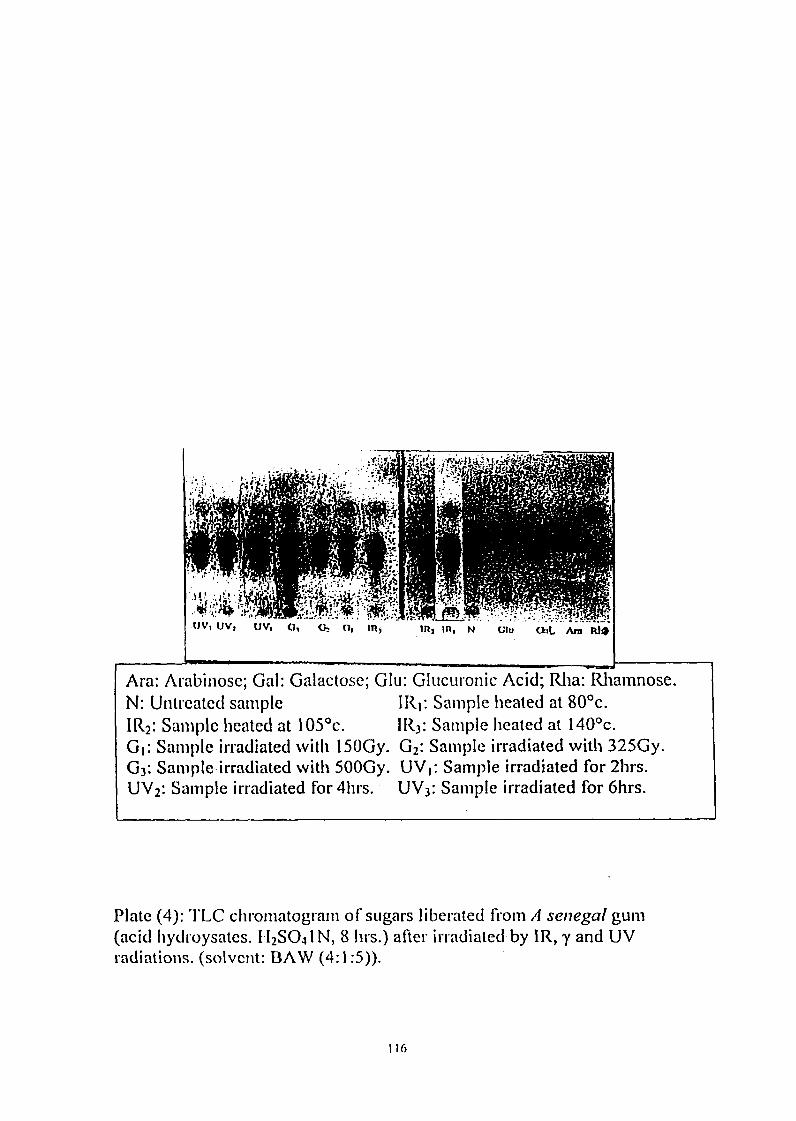
'4 ch"
JA!
UV, UV, UI G, C� alt. Am o
L
Ara: Arabinose; Gal: Galactose; GILI: GILICuronic Acid; Wm: iTarnnose.N: Untreated sample IRI: Sample eated at 00c.
IR2: Sample eated at 105'c. Ilt3: Sample eated at 140'c.GI: Sample irradiated with 15OGy. G2: Sample it-radiated with 325Gy.G3: Sample irradiated with 50OGy. UV,: Sample irradiated for 211rs.UV2: Sample irradiated for 41irs. UV3: Sample irradiated for 6hrs.
Plate (4):TLC chromatograni Of SLIgars liberated fi-orn A senegal gurn(acid hydroysates. 12SO41 N, 8 lirs.) after iradiated by IR, Y and UVradiations. (olvent: BAW 4:1:5)).
116
REFERENCES
Akiyania, Y.; Eda, S. and Kota, K. 1984). Gum arabic is a kind ofarabinogalactan protein. AgHc. Biol. Chem. 48(l): 235-247.
Alain, M. and Mc Mullen, J.N. 1985). Molecular weight of Acacia,International Symposium of Phararnaceutics, 23: 265-275.
Anderson, D.M.W. 1986). Food Addit. Conta. 3 225.
Anderson, D.M.W. ad Dea, I.C.M. 1968). Studies on uronic acidmaterials. Sorne unusual forms of te gum from A. senegal(Wild). Carbohydr. Res., 6 104-1 .
Anderson, D.M.W ad Dea, LCN. (I 969). Carbohydr. Res. 10: 16 .
Anderson, D.M.W. and Dea, L.C.M. 1971). Recent advances in thechernistry of Acacia gums. Carbohydr. Res. Cosmetic Chemistsof Great Britain. 10: 161-164.
Arwerson, 1). M.W. and Dea, L.C.M. 1990). Food Ingredients ExhibitionBritain Serninar. Proceedings. Carbohydr. Res.
Anderson, D.M.W. and Mc Dougall, F.J. 1985). Phytochemistry, 24:1237-1240.
Anderson, D.M.W. and Mc Dougal, F.J. (1987a). Degradative studies ofgum arabic Accicia senegal (L.) Willd) with special reference tothe fate of te amino acids present. Food Additives andContaminants, 43):-257-266.
Anderson, D.M.W. and Flebdrie, M.A. (I 973). Carbohydr. Res., 26: 05-115.
Anderson, D.M.W. and Kararnalla, K.A. 1966). J. Chern. Soc., Lcl 762-764.
Anderson, D.M.W. and Munro, C.A. 1970). Carbohydr. Res., 12 922.
Anderson, D.M.W. and Rahman, S. (1967b). The viscosity-molecularweight relationship frorn Acacia gum. Carbohydr. Res., 4 298-304.
117
Anderson, D.M.W.; Bridgernan, IM.M.E.; Farguhar, J.G ad McNab,C.G.A. (I 983). Int. Tree Cops J., Edinburgh Univ. 2 245-254.
Anderson, D.M.W.; Howlett, J.F. and Mc Nab, C.G.A. 1985). Food Addit.Contain. 2 159-164.
Andcrson, D.M.W.; owlett, J.F. and McNab, C.G.A. 1987).Phytochemistry, 26: 309-3 1 1.
Anderson, D.M.W.; Millar, J.R.A. and Weiping, W. 1991). Gurn arabic(Acacia senegal) from Nigeria comparison with other sourcesand potential agroforestry development. Biochern. Syst. Ecol19(6): 447-452.
AOAC Association of Official Agricultural Chemists 1984). Officialmethods of aalysis, 14"' ed. Washington, D.C.
Awad Elkarim, M.M.E. 1994) Aalytical Studies on some Crude andProcessed GIm Arabic Samples with Regard to Quality Aspects.M.Sc. thesis, FaCLIlty of Agriculture, U. of K., Sudan.
Baily, Z.W ad Bourne, E.J. 1960). J. Cliromatggr. 4.
Barron, L.D.; Gargaro, A.R. and Wen, Z.O. 1991). Carbohydr. Res., 39:210.
Blunt H. 1926). GLIm Arabic with Special References to its Productionin the Sdan, Oxford Univ. Press, London.
Bokhary, H.A.; Flassib, A.M. ad Suleiman, A.A.A. 1983). Garnmait-radiation effects on carbohydrate composition. J. FoodProtection. College of Science, King Saudi University, SaudiArabia, 46(7): 585-588.
Bose, S. and Gpta, K.C. 1964). Indian J. Chem., 2 52.
Churnis, S.C.; Mefrrifield, E.H. and Stephen, A.M. 1983). Some newaspects of the molecular structure of Acacia enegal gurn.Carbohydr. Res., Elsevier Science Publishers B.V., Arnsterdarn,J2I: 267-279.
ClIL11-111S, S.C. and Stephen, A.M. 1984). Carbohydrate Res., 45: 291-298.
Coninion, D.W.; ChUrms, S.C. and Stephen, A.M. 1986). Carbohydr. Res.,151: 136-146.
118
Cowie, .M.G. (I 973). Polyme cemistry ad pysics of modern material.
Dickiiismi, E.; Murray, B.S.; Stainsby, G. and Anderson, P.M.W. 1988).Food Hydrocolloids 26): 477-490.
Doniiell, J.H.O. and Sangster, D.F. 1969). Principles of RadiationCliernistry.
Fklmoiids, M. (I 965). Te Market for GUrn Arabic. I.P.I. Rel�ort No. G.] 6.
El Amin, H.M. 1990). Trees and Srubs of te Sudan. Ithaca Pree exeter.England.
Eltayeb, S. 1999). Analytical Studies on the Gum Exudate fromAnogeissits leiocaipus. Ph.D. thesis, Faculty of Agriculture, U. ofK., Sdan.
Encyclopaedia of Chemical Technology 1966). Executive and EditorAnthony Stander, Inter. Science Publishers John Wiley and Sons.Inc. London.
Eric, D.; Galaz, V.13. and Anderson, D.M.W. 1991). Emulsifyingbehaviour Of gUin arabic. The effect of the gurn molecular weighton enlUlsion droplet. Size distribution. Carbohydrate Polymers,14: 385-392.
Ersl-�ine, A.J ad Jones, J.K.N. 1956). Canad. Chem., 34: 821.
1-AO ( 978). 1ood ancl Nith-ition, Rorne, No. .
I,- AO ( 990). r botl tain Nutrition, Rorne, No. 44.
FAO ( 1 990). r bocl and Nith-ition, Rorne, No. 49.
FAO (I 999). Food and Nutrition. Rome, No. 52.
Fincher, G.B.; Stone, B.A. ad Clarke, A.E. 1983). Arabiongalactanproteins, structure, biosynthesis and function. Ann. Rev. PlantPhysiol., 34: 47-70.
Gabb, S. 1997) Gm Production in Sudan: A Brief Introduction. TheSudan Foundation, London.
Gabel, L.F. 1930). In Wistler, R.L. and Berniller, J.N. 1973). IndustrialGUMS. Polysaccliarides and their Derivatives. Acadernic Press,Inc. 2" edition, New York, San Francisco, London. P. 219.
119
GAC GLIni Aabic Conipany 1993). Gum Arabic A ProdLICI of Nature.
'I'lic Guin Arabic Company Ltd. Kiartouin.
Genn, F.K. 1988). Radiation Detectio ad Measurement, University ofMichigan An. Arobor, Michigan.
Goniez, A.K. ad Gornez, A.A. (1984). Statistical Procedures forAgricultural Research. John Wiley and Sons.
Hansen, J. R. (I 978). Agric. Food, Client J., 26: 301-304.
Hassan, E.A. 2000). Ph.D tesis, U. of K., Sudan.
Hough, L.; Jones, J.K.N. and Wadman, W.H. (I 49). J. Chem. Socl. 251 .
HOL[Wink, R. 1940). Relation between the polymerization degreedetermined by osinotic ad viscornetric ethods. J. Prakt.Chem., 157: 15-18.
Iskef, Ff. ( 1 986) Nclear Pysics. Aleppo Uiversity Publication.
Jacin H ad Mislilein, A.R. 1965). Separation of carbohydrates on BorateInipregnated Silica Gel. G. Plates. J. Chroinatogr., 18: 170-173.
Jarnes, D.1, and Stanley, R.C. 1988). Spectrochernical Analysis. NewJersey, U.K.
Jeffrey, C.D.; Arditi, J. and Est, R. 1969). Determination of di-tri-andtetra-saccharides in mixture with teir component moities byTLC. J. Cliromatog[. 4: 475-480.
Jones, J.K.N.; Wall, R.A ad Pitte, A.0. (I 960). Canada J. Chern., 38: 285.
Jurasek, P.; Kosik, M. and Pillips, G.O. 1993). Chernornetric study of teAcacia gum arabic) and related natural gurns. Foodf lydrocolloids, 70): 73-85.
Karainalla, K.A. 1965). Analytical ad Structural Studies in tePolysaccharide Group. Ph.D. thesis, Edinburgh University, UK.
Karanialla, K.A. 1999). GUM Arabic: Production, Chemistry andApplication, Manager Research ad Development Departrnent.Gandil Agricultural Company Ltd., Sudan.
120
Kai-aiiialla, K.A.; Siddig, N.E ad Osman, M.E. 1998). Analytical data forAcacia metal var. enegal gurn samples collected between1993 and 1995 from Sudan. Food Hydrocolloids, 12: 373-378.
Kai-eii, K. 1993). The effect of g amma irradiation on guar gum, locust,bean gum, gm tragacanth and gum karaya. Queen's University,U.K. Northern Ireland, Belfast, Food Hydrocolloids 66): 559-569.
KaLlfinan, H.S. ad Falcetta, J.J. 1977). Introduction to Polymer Scienceand TechnologyTextbook. P. 425.
Kinsella, J.E. 1979) Fnctional poperties of soy proteins. J. Arner. OilChem. Soc., 56: 242-246.
Law, J. and I-laggith, J.W. 1982). Practical Aspects of Non-ionizingRadiation Protection. The Hospital Physicts' Association,London.
Laiiipci-t, D.T.A., Q.W. and Fong, C. 1991). Gum Arabic glycoproteins isa twisted hairy rope. Plant Physiol., 96: 848-855.
Lewis, B.A. and Smith, F. 1957). J. Arn. Chem. Soc., 79: 929.
Malcolm, D W. 1936). Report on Gum nd Gum Arabic. GovernmentPrinter, Republic of Somalia.
Mantell, C.L. (I 947). The Water Soluble Gums. Reinhold Publishing Corp.New York.
Mantell, C.L. 1965). The Water Soluble Gums. Hofher Publishing Corp.;New York and London.
Mark, 1-1. 1938). Die chemikalis wegbereiterin fortschnitter vortrageleipzig: Holdertemp. Sky. 19 PP. M. 130. Der Feste KorperI luzil, Leipzip. 1. 103.
Meei-, W. (I 980) I andbook of Water Soluble Gurns and Resins, Ed.Davidson, R.L., Mc Graw-Hill, New York.
Mo 11-i t, W. and Young, J.T. (I 956). Proc. Natl. Acad. Sci. (USA), 42, 596.
Mooriaiii, M.N. and Narwani, C.S. 1948). In Whistler, R.L. and Bemiller,I.N. 1973). ndustrial Gums. Polysaccharides and their
2
Derivatives. Academic Press Inc. 2`1 edition. New York, Sat'Francisco, London. P. 219,
Morrison, R.T ad Boyd, R.N. (I 973) Oganic Chernistry; Foreword byRichard, 'F. Arnold. Boston, Allyn and Bacon.
Norman, W.P. and Henry, M.R. (I 960). Radiation Technology in Food,Agriculture and Biology, Te AVL Publishing Company, Inc.Hall London, England.
NOUr, N.M. 1996). M.Sc. thesis, U. of K., Sudan.
Osborne, G. E. and Lee, C.O. (I 95 1). In Whistler, R.L. and Bemiller, J.N.(1973). Industrial GUMS. Polysaccharidesand-their Derivatives.Acadernic Press, Ic. 2 nd edition, New York, San Francisco,London.P.219.
Osman, M.E.; Williams, P.A.; Menzies, A.R. and Pilipo, G. 1993..1Characterization of commercial samples of gum arabic. J. Agric.Food Chem., 41: 71-77.
liffli,)s, G.O. and Williams, P.A. 1988). Structural and ChemicalProperties of Gum Arabic. Teir Practical Impact. Gurn ArabicSymposium. Solingen-West Germany.
Qi, W.; Fong, C. and Lambert, D.T.A. (I 99 1). Plant Physiol.. 96: 849-955.
Randall, R.C.; Pillips, G.O. and Williams, P.A. 1989). Fractionation andcharacterization 0 f gUrn frorn Acacia sel7egal. FoodHydrocolloids 3 65.
Robyt, J.F. and Wite, B.J. f987). Biochemical Techniques Teory andPractices. Brooks/Cole Pblishing Company.
Ross, J. 1-1. ( 915). The Acacia enegal complex. Bothalia 11 4 453-462.
SaIllUelson, 0. and Thede, L.C. 1967). J. Chrornatoger., 30: 556-562.
Sharbash, M.T.M. 1996). Radiation Technology in Food and Agriculture,Arabic Authority for Atomic Energy and Arabic Organization forAgriculture Development (Arabic Reference).
Siddig, N.E. 1996). Nitrogen and Specific Rotation as Qualifying Indicesfor GUrn Arabic Derived from Acacia enegal (L.) Wild. M.Sc.thesis, FaCUlty of Agriculture, U. of K.
122
Sinitli ' ad Montogeinry, R 1959). ''lie Ciemistry of I'laill Gums adMucilages. Reinliold, New York.
Soniogyi, M. (I 945). J. Bol. Cliern., 160: 69.
Street, C.A. ad Aderson, D.M.W. 1983). Refinement of structurespreviously proposed for guni arabic ad other Acacia exudates.Talanta, 30: 887-893.
Tager, A.A. (I 972) Pysical Cemistry of Polymers, Moscow.
Tlievenet, F. 1990). Acacia gurns, atural emulsifiers and stabilizers,Iranex Colloide naturels. Netiffly-Sur-Scine (France), SeminarProceedings, Food Ingredients Exhibition Britain.
Underwood, D.R ad Clieetliaiii, P.S.J. 1994). Te isolation of activeemulsifier components by te fractionation of Gum Talha. J. Sci.Food Agric.,.66: 217-224.
UNEIII 1991). Radiation Doses, Effect, Risks.
Vandevelde, M.C ad Fnyo, J.C. 1995). Macroinolecular distributio ofActicia Senegal guin by size-exclusion chromatography.Carbohydrate Polymers Egland. 5: 251-273.
Wang, D.H., Willis, D.L. ad Loveland, W.D. 1965). RadiotracersMetliodology in Biological, Environmental and PysicalSciences. Printice Hall, I. Eglewood, Cliffs, New Jersey
(Arabic Reference).
Whistler, R.L. and Miller, J.N. 1958). Advan. in Carbohydr. Client, 13:289.
Whistler, R.L. and Bemiller, J.N. 1973). Industrial gums."Polysacclian'desand their Derivatives. Academic Press. Inc. 2`1 edition. NewYork. San Francisco. London. PP. 194-254.
Williams, B.D.P.; Heron, J.C.L.; Pollette, J.L. and Cartwright, P.H. 1985).A Glossary of Pysics, Radiation Protection and Dosinietry inMedical Diagnostic Imaging, New Zealand.
Zucca, C. 1954) I Whistler, R.L ad Berniller, J.N. 1973) IdustrialGuins. Polysaccliarides and teir Denvatives. Academic Press,Inc. 2nd edition, New York, San Francisco, London. P. 227.
'23