Embed Size (px)
Citation preview

the generation of free radicals concurrent with the NADH photolysis mustbe considered. Despite these complications, NADH ED-FRAP is the onlymethod available to dynamically monitor the turnover of NAD(P)H inintact systems. It has been demonstrated that this approach can work atseveral different spatial scales, from subcellular measures to suspensionsof enzymes and cellular organelles. It will improve the understandingof NADH utilization in intact cellular systems in terms of both cellulartopology and cellular metabolic regulation.
Acknowledgments
The authors thank Drs. Emily Rothstein and Paul Jobsis for many useful discussions and
help in some experiments that contributed to this work. We also thank William
Riemenschneider for help in figure preparation.
286 imaging of receptors, small molecules, and protein interactions [16]
[16] Imaging Myocardium Enzymatic Pathwayswith Carbon-11 Radiotracers
By Carmen S. Dence, Pilar Herrero, Sally W. Schwarz,Robert H. Mach, Robert J. Gropler, and Michael J. Welch
Introduction
Under normal conditions, the heart utilizes a variety of metabolic path-ways, such as the oxidation of carbohydrates, fatty acids, lactate, and pyru-vate, to meet the high-energy demands of contraction and maintenance ofcellular function. The metabolic flux through each pathway is determinedby the availability of substrates for each metabolic pathway in plasma, aswell as hormonal status and myocardial oxygen supply. For example,the high blood levels of fatty acids during fasting result in the oxidationof fatty acids as the principal form of energy production and account forapproximately 70% of the cardiac energy requirements. Consumption ofa high carbohydrate meal results in an elevation of plasma glucose levels,an increase in insulin production, and an activation of glycolysis. Exerciseresults in the release of lactate by skeletal muscle, which is taken up rapidlyby the heart, converted to acetyl-CoA, and oxidized through the tricarbox-ylic acid cycle (TCA) cycle. The extraordinary ability of the heart to utilizea number of different metabolic pathways and to change its metabolic pref-erence rapidly is necessary for the maintenance of proper mechanical func-tion under a variety of physiological conditions. Therefore, a derangement
Copyright 2004, Elsevier Inc.All rights reserved.
METHODS IN ENZYMOLOGY, VOL. 385 0076-6879/04 $35.00

[16] imaging myocardium enzymatic pathways 287
in the balance of myocardial metabolism is expected to play a key role in anumber of pathological conditions leading to abnormal cardiac function.
Much of the work that resulted in the characterization of the differentenzymes involved in intermediary metabolism was carried out in vitro.Although this seminal research provided the foundation for the fields ofbiochemistry and enzymology, the techniques used in the mapping of inter-mediary metabolism are inadequate for studying the change in metabolicprocesses that underlie myocardial dysfunction in human disease. Whilethe elucidation of the different metabolic pathways was complete by themiddle of the 20th century, the study of the change in myocardial metabo-lism as a consequence of disease was not possible until the advent of non-invasive imaging techniques such as positron emission tomography (PET)and single photon emission computed tomography (SPECT) in the 1970s.
Positron emission tomography is an imaging technique developedfor the in vivo study of metabolic functions in both healthy and diseasedstages. The goal of the technique was best expressed in 1975 by Dr. MichelTer-Pogossian,1 one of the pioneers of this modality at Washington Uni-versity: ‘‘Our ultimate goal is to measure in vivo regionally and as noninva-sively as possible metabolic processes. Perhaps a term for this approachcould be either in vivo biochemistry or functional [imaging]. The reasonfor seeking this goal, of course, is the application of this approach to medi-cine using the premise that any form of pathology either results from oris accompanied by an alteration of some metabolic pathway. Our approachto achieve the above goal consists in labeling with cyclotron-producedradionuclides, more specifically, oxygen-15, carbon-11, nitrogen-13 andfluorine-18, certain metabolic substrates, the fate of which is studiedin vivo subsequent to their administration, by some radiation detector orimaging device, with the hope, after suitable unraveling of the metabolicmodel used, of measuring in vivo a particular pathway.’’
Since the early 1980s and more extensively in the mid 1990s, investiga-tors at the Washington University School of Medicine have used PET tostudy the change in metabolic substrate utilization that occurs under a va-riety of experimental conditions, including normal aging, obesity, dilatedcardiomyopathy, type 1 diabetes mellitus, and hypertension-induced leftventricular hypertrophy. This is accomplished by measuring the dynamics(i.e., uptake and washout kinetics) of radiolabeled substrates for each met-abolic pathway. These studies, which utilize the radiotracers 1-[11C]d-glucose, 1-[11C]acetate, and 1-[11C]palmitate, are collectively termed the
1 M. Ter-Pogossian, ‘‘The Developing Role of Short-Lived Radionuclides in Nuclear
Medicine,’’ p. 9. U.S. Department of Health, Education and Welfare, 1977.

288 imaging of receptors, small molecules, and protein interactions [16]
GAP studies. This Chapter provides details of the radiosynthesis, dosime-try, quality control, data acquisition, and kinetic modeling that are neededto conduct this experimental paradigm successfully. These issues are dis-cussed to help the reader new to the field gain a broad understanding ofthe problems faced by the PET researchers that work with short-lived iso-topes and to learn some of the approaches used to solve these problems.This Chapter does not include a discussion of the basic principles of PET.The reader interested in a general survey on the synthesis of 11C-labeledcompounds and of radiopharmaceuticals used for studying the heart isreferred to Antoni et al.2 and Hwang and Bergmann,3 respectively.
Overview of the Production of Carbon-11
The physical characteristics of the radionuclides used in PET are listedin Table I, along with the most common nuclear reaction to produce themin a clinical setting. Their decay mode by positron emission allows their de-tection outside the body after annihilation with an electron in the body.The result is the production of two photons (0.511 MeV each) at almost180
�to each other. These two photons are detected by the imaging device,
which then creates images of the tissue under study. A simplified version ofthese events is presented in Fig. 1.
Because GAP studies require the administration of multiple radiola-beled substrates, it is necessary to use the shorter-lived positron-emitting
2 G. Antoni, T. Kihlberg, and B. Langstrom, in ‘‘Handbook of Radiopharmaceuticals:
Radiochemistry and Applications’’ (M. J. Welch and C. S. Redvanly, eds.), p. 141. Wiley,
West Sussex, England, 2003.3 D.-H. Hwang and S. R. Bergmann, in ‘‘Handbook of Radiopharmaceuticals: Radiochemis-
try and Applications’’ (M. J. Welch and C. S. Redvanly, eds.), p. 529. Wiley, West Sussex,
England, 2003.
TABLE I
Physical Characteristics of Commonly Produced Short-Lived Isotopes
Nuclide Half-life
Nuclear
reaction
Max
energy
(MeV)
Range
in H2O
(mm)
Specific
activity
(Ci/mmol)
Decay
mode
Carbon-11 20.4 m 14N(p,�)11C 0.96 4.1 9.22� 106 �þ (99%)
Nitrogen-13 10.0 m 16O(p,�)13N 1.19 5.42 18.9� 106 �þ (100%)
Oxygen-15 2.03 m 14N(d,n)15O 1.70 8.0 91.7� 106 �þ (100%)
Fluorine-18 109.7 m 18O(p,n)18F 0.64 2.4 1.71� 106 �þ (97%)

[16] imaging myocardium enzymatic pathways 289
radionuclides in order to assure that sufficient radioactive decay hasoccurred between imaging studies. Furthermore, because it is our goal tomeasure the metabolic flux through each enzymatic pathway, positron-emitting versions of the metabolic substrates are best suited for this pur-pose. The radionuclide chosen for these studies is carbon-11, and efficientsyntheses for the preparation of 1-[11C]d-glucose, 1-[11C]acetate, and1-[11C]palmitate have been developed in our laboratory.
Carbon-11 is produced by the 14N(p,�)11C reaction using a gas targetsystem of 0.5% oxygen in nitrogen with typical bombardments of 20–40 minat 40 �A beam power. The product obtained from the target is [11C]CO2,which is then trapped under vacuum in a specially designed stainless steelcoil cooled to �196
�with liquid nitrogen.
Fig. 1. Positron annihilation and coincidence detection of 0.511-MeV � rays.

Fig. 2. Synthesis of the radiotracers used in the GAP studies.
290 imaging of receptors, small molecules, and protein interactions [16]
The transformations undergone by [11C]CO2 to produce these cardiactracers are depicted in Fig. 2. The primary conversions shown inside thesmall rectangles are fast (on average, 2–5 min are needed for the conver-sions) and can take place on solid support systems by catalysts, as in thecase of [11C]CH4 and [11C]NH4CN, or in the gas phase, as in the case of[11C]CH3I. It is important to remove from the [11C]CO2 gas all traces ofnonradioactive oxides of nitrogen (NOx) produced as contaminants duringbombardment of the target gas. These oxides, present in about 50–150 ppmafter 30 min of bombardment, may contribute to catalytic poisoning of thesurface of the Pt wire inside the furnace used to produce glucose. Theseoxides may also lead to a lowering of radiochemical yields when using or-ganometallic reactions,4 such as the Grignard reaction used in the synthesisof 1-[11C]palmitate and 1-[11C]acetate. Removal of the oxides of nitrogenhas a significant advantage in the reaction of carbon-11 with Grignardreagents, as it allows the use of a smaller amount of starting material andresults in a significant improvement in specific activity. Removal of the
4 M. S. Kharasch and O. Reinmuth, ‘‘Grignard Reactions of Non-metallic Substances,’’
p. 1243. Prentice Hall, New York, 1954.
[16] imaging myocardium enzymatic pathways 291
oxides of nitrogen is accomplished easily by placing a commercially avail-able NOx scrubber inline before passing the radioactive gases through tothe next conversion stage. The Kitagawa gas detector solid-phase system(Matheson Gas Products tube #175SH) has been used routinely for thispurpose in all of the synthesis modules described here.5
Specific Activity (SA)
Specific activity is a very important parameter when working withradiopharmaceuticals. SA, defined as the amount of activity per unit mass,is expressed as the number of nuclear disintegrations per minute permole of compound. For carbon-11, the theoretical SA of 9.2 � 106 Ci/mmolof the carrier-free radionuclide (Table I) is never achieved in practice, anddilutions to approximately 104 Ci/mmol are common due to the presenceof traces of carbon in the gas lines, delivery systems, reagents, etc.High SA radiotracers are very important when dealing with receptor-basedcompounds, gene expression experiments, and other specific uptakestudies where saturation with the carrier compounds may invalidate theresults.
The issue of low SA for carbon-11 compounds has been documentedextensively in the literature, and a number of solutions have been offeredto try to improve it. Among them are the use of ultrahigh purity gases, acareful consideration of the target and window foil material used, and anadherence to rigid protocols for cleaning such targets and related glass-ware. The use of the highest quality material available is necessary for allancillary equipment needed for isotope production, such as gas regulators,connectors, compressors, water lines, and vacuum pump oil, as all arepotential sources of traces of carbon that will reduce the specific activity ofthe radiopharmaceutical. In addition, minimizing the amount of reagentsused in each reaction and exploring gas-phase and solid-phase reactionshave all been examined by chemists with some success. Because of the phys-iological presence of glucose, acetate, and palmitate in the human body, avery high SA for the GAP radiopharmaceuticals is of lesser concern.
Synthesis Modules
We have built semiautomated remote chemistry systems for the pro-duction of 1-[11C]d-glucose and 1-[11C]palmitate. These systemsare shielded by placement within hot cells in the cyclotron area. They are
5 C. S. Dence, T. J. McCarthy, and M. J. Welch, ‘‘Proceedings 6th Workshop on Targetry and
Target Chemistry,’’ p. 216. Vancouver, Canada, 1995.
292 imaging of receptors, small molecules, and protein interactions [16]
relatively inexpensive and easy to construct and allow the chemist to makequick adjustments when needed during the synthesis. In contrast to themore sophisticated robotic manipulators that are also used, these remotegantries can be adapted to new, exploratory syntheses with a minimum in-vestment of time. All the alternatives to synthesize these carbon-11 tracers(remote gantries, robotic hands, and commercially available synthesizers)share the important characteristics of reliability and very low exposure tothe operator (<2 mR per synthesis). The in-house built systems are alsothe least expensive of the three systems.
1-[11C]d-Glucose
Ever since the early 1990s, the authors have been involved in the synthe-sis of 1-[11C]d-glucose.6 The result has been an improved procedure forthe production of the desired compound in sufficient quantities for twosimultaneous human studies and an additional animal study if needed.7
This improved synthesis involves the use of a preformed sugar–borate com-plex of the starting substrate, d-arabinose, to effect the condensation with[11C]NH4CN. The stereochemistry of this sugar–borate complex favorsthe formation of glucose over mannose (ratio 1.8 � 0.6:1). The overallchemistry illustrated in Scheme 1 is performed using a semiautomatedremote system illustrated in Fig. 3.
The reaction vessel A is a two-necked 10-ml conical flask (14/20 joints)filled with 0.5 ml of 0.01 N NaOH, and the pH probe is set in place in oneof the side arms. Vessel B, a 10-ml conical vial that is modified to admit aside Teflon line, contains a freshly prepared Raney-nickel slurry (about0.3 g) in 30% formic acid (2.0 ml). The purification column C (Bio-Radcolumn 26 cm long � 10 mm i.d.) contains 8.5–9.0 g of anion-exchangeresin Bio-Rex 5, 100–200 mesh (OH form), and 3.5 g of cation-exchange resin AG50W-X8 100–200 mesh (H form). The purification col-umn C is connected to the 50-ml vessel of a rotary evaporator by means ofa three-way valve and a Teflon line. The rotary evaporator vessel is pro-vided with 10–11 ml of acetonitrile to remove excess water azeotropicallyfrom the final mixture prior to HPLC purification.
At the end of bombardment (EOB), the [11C]CO2 is first converted to[11C]CH4 in a furnace heated with a nickel-chromium resistance wiremaintained at 385
�. This furnace is provided with a borosilicate glass tube
(26 cm length � 9 mm i.d.) filled in the center of the tube with small pieces
6 C. S. Dence, W. J. Powers, and M. J. Welch, Appl. Radiat. Isot. 44, 971 (1993).7 C. S. Dence, W. J. Powers, R. J. Gropler, and M. J. Welch, J. Labeled Compd. Radiopharm.
40, 777 (1997).

Fig. 3. Schematic of the gantry system used in the synthesis of 1-[11C]d-glucose.
Scheme 1. Radiosynthesis of 1-[11C]d-glucose.
[16] imaging myocardium enzymatic pathways 293
of glass wool coated with 0.5 g of nickel powder on Kieselguhr (Ventron).The nickel catalyst is held in place by putting at each end of the same an-other small piece of glass wool and stainless steel wool. A second furnace toconvert the [11C]CH4 to [11C]NH4CN has a quartz glass column 36 cm

294 imaging of receptors, small molecules, and protein interactions [16]
length � 9 mm i.d., which holds 1.2 g of 0.25-mm-diameter platinum wire(Aldrich 26,717-1) wound inside the quartz tube and is kept at 870–880
�.
All the connections between the two furnaces and the radiator trap forthe radioactive gases are done with 1/8 o.d. Teflon tubing. Theconnections within valves and glassware in the gantry are made with 1/16Teflon tubing. Two small radioactive detectors located strategically nearthe [11C]CO2 trap and vessel A help follow the flow of radioactivity duringthe synthesis.
The [11C]CO2 gas is first trapped under vacuum in a radiator trap keptat �196
�with liquid N2. At the end of collection, the radiator trap is
brought to atmospheric pressure, and the [11C]CO2 is displaced from thetrap with a reducing gas mixture of 8% H2 in nitrogen. The gas is firstpassed through the Kitagawa purification tube to remove nonradioactiveoxides of nitrogen, as described earlier. The radioactive gas then goesthrough the first furnace (nickel furnace) and is converted to [11C]CH4 bythe stream of the reducing gas at 20–30 ml/min. Any unconverted [11C]CO2
is removed from the gas stream by a stainless steel soda-lime tube (6–8 g)placed in between the two furnaces.
Anhydrous ammonia (2 ml/min) is then added to the 11CH4/H2/N2
stream, and the mixture is passed through the second furnace (platinumfurnace), where it is converted to [11C]NH4CN. The no-carrier-added[11C]NH4CN is introduced into the gantry through valve V1 and is collect-ed in vessel A after about 5 min from EOB. After a peak reading on theradioactive detector, the ammonia flow is stopped and the pH is adjustedto approximately 9 with about 0.18 ml of 3 M glacial acetic acid. The sub-strate d-arabinose (10–14 mg) in 0.45 ml of 0.033 M borate buffer (pH 8.1)is added to reaction flask A and the mixture is allowed to react for 5 min atroom temperature.
At the end of this incubation time, the clear reaction mixture is trans-ferred by air pressure into flask B, where the intermediate aldonitrilesare reduced with the Raney-nickel slurry. The mixture is heated under re-flux for 5 min at 110
�, is cooled for approximately 1 min, and is transferred
by air pressure to resin purification column C. After the first 2–3 ml of elu-ate are discarded, column C is flushed dry with air to eliminate as much aspossible the excess solvents used: sodium hydroxide, formic acid, aceticacid, etc. Finally, the radioactive sugars are eluted from column C by theaddition of about 9 ml of water. The eluate is reduced azeotropically inthe rotary evaporator under vacuum/heat to less than 0.1 ml volume, dilut-ed with deionized (DI) water to 0.8–0.9 ml, and injected onto the prepara-tive high-performance liquid chromatography (HPLC). 1-[11C]d-Glucose ispurified on a 7.8 � 300-mm Bio-Rad HPX-87P column heated to 85
�and is
then eluted with water at 1.0 ml/min. The aqueous fraction containing the

[16] imaging myocardium enzymatic pathways 295
1-[11C]d-glucose is collected after about 8 min in a sterile 6-ml syringe.This fraction is purified further of any remaining inorganic or metal ionsby filtering through an ion-exchange chromatography Chelex cartridge(Alltech 30250). The eluate is made isotonic by the addition of 3 M NaCl,diluted to 5–7 ml with DI water, and filtered through a 0.22-�m, 25-mmvented filter to produce a sterile and pyrogen-free solution ready for injec-tion. Current yields are from 40 to 60 mCi of final product, ready forinjection, following a synthesis time of about 50 min from EOB.
[1-11C]Palmitate
Synthesis of [1-11C]palmitate is accomplished according to themethod outlined in Fig. 2 and with the remote system detailed in Fig. 4.8,9
The system uses a single reaction vessel 13.5 cm long � 3.5 cm wide (B),equipped with two side arms. The lower section is in the shape of a 10-mm o.d. test tube marked at the 1-cc volume. The vessel is agitated usinga standard laboratory mixer (C). A 1-mm i.d. Teflon tube (L1) is insertedthrough one side arm to add reagents from outside the hood. Another1-mm i.d. Teflon tube (L2) is inserted through the second side arm to thebottom of the vessel (B). The other end of L2 enters a Teflon block (D)(4 � 5.5 cm, bored as indicated in Fig. 2). Block D is the common pathfor connecting the reaction vessel (B) to the waste receptacle (F) and thefiltration gantry (E).
At the end of bombardment, the [11C]CO2 produced is collected byevacuating the target gas into the cooled (�196
�) radiator trap (A). The
Grignard reagent, 0.1 M 1-pentadecylmagnesium bromide in diethyl ether(3 ml), is added to the reaction vessel (B). The Dewar (I) is lowered, theradiator trap (A) is warmed, and the [11C]CO2/N2 is bubbled throughthe Grignard reagent for 1–3 min. The reaction is quenched by the additionof 3 ml of 1.0 N HCl, and 3 ml of diethyl ether is added to extract the[11C]palmitate. The vessel (B) is shaken in the vortex mixer (C) and thelayers are allowed to separate. The lower aqueous layer is drawn off byclosing valve V2 (vent), opening valve V7 briefly to slightly pressurizethe vessel (B), and then opening valve V6. The aqueous layer is pushedthrough the Teflon line (L2) and Teflon block (D) and into the waste recep-tacle (F). The remaining ether layer is washed twice with 5 ml of 0.9%
8 M. J. Welch, S. L. Wittmer, C. S. Dence, and T. J. Tewson, in ‘‘Short-Lived Radionuclides
in Chemistry and Biology’’ (J. W. Root and K. A. Krohn, eds.), ACS Advances in
Chemistry Series 197. p. 407. Washington, DC, 1981.9 M. J. Welch, C. S. Dence, D. R. Marshall, and M. R. Kilbourn, J. Labeled Compd.
Radiopharm. 30, 1087 (1983).

Fig. 4. Schematic of the gantry system used in the synthesis of 1-[11C]palmitate.
296 imaging of receptors, small molecules, and protein interactions [16]
sodium chloride (USP saline), and each time the lower aqueous layer is dis-carded into the waste receptacle (F). The ether solution is then diluted with1 ml of 95% ethyl alcohol and the diethyl either is evaporated using a 100-ml/min flow of nitrogen through the solution, accomplished by openingvalves V5, V7, and V2. Evaporation is continued until less than 1 ml ofliquid (ethanol layer) is left, the nitrogen flow is reduced to 10 ml/min,and valve V5 is closed.
The ethyl alcohol solution is then diluted with 8.2 ml of a 3.5% solutionof human serum albumin in USP saline (kept at �50
�during the synthesis)
and left to stand undisturbed for 3 min to complex the fatty acid with thealbumin. For the final filtration, the albumin fatty acid solution is pulledfrom the vessel (B) into the 12-ml syringe and is pushed through the 0.45-and 0.22-�m, 25-mm filters and into the collection vial (J). Current yieldsat the end of a 25- to 30-min bombardment are from 150 to 350 mCi of finalproduct ready for injection in a synthesis time of 15–20 min from EOB.
1-[11C] Acetate
We use a robotic system, as well as a commercially available synthesizer,for the production of 1-[11C]acetate. The Hudson workstation (ThermoElectron Corp., Ontario, Canada) is illustrated in Fig. 5. All platforms have

Fig. 5. Hudson robotic system for the compounding of an 1-[11C]acetate injection.
[16] imaging myocardium enzymatic pathways 297
been custom built and include a dedicated reagent rack constructed of Plex-iglas, a capping station, a nitrogen purge device, and three 3-way valves andfour 2-way valves to direct the [11C]CO2 target gas and nitrogen gas flow tothe trapping/reaction vessel. The capping station holds a 5-ml Reactivial(Wheaton Scientific, Millville, IL) used for trapping the [11C]CO2. A 3.5-in. � 19-gauge needle connects the inlet line for incoming target gasesand nitrogen, and a 1.5-in. � 18-gauge needle connects the outlet line forventing and trapping any unreacted [11C]CO2. After the [11C]CO2 targetgas addition, the system removes the cap from the Reactivial with thetop-loading capping station from Hudson. The heating station is con-structed from a heating block obtained from Fisher Scientific (St. Louis,MO), and an aluminum block into which a hole is drilled to accommodatethe 5-ml Reactivial. A temperature controller (Model D1311 from OmegaEngineering, Stanford, CT) controls the temperature of the heating block.All liquid transfers are done with disposable 1000-�l pipette tips using a pi-pette tip holder attached to the gripping hand of the Hudson robot thatconnects to a Hamilton syringe station to control pipetting and dispensing.

298 imaging of receptors, small molecules, and protein interactions [16]
After cyclotron irradiation, [11C]CO2 is collected in an evacuated coldtrap cooled with liquid nitrogen. The trap is removed from the liquid nitro-gen, warmed, and purged using a stream of nitrogen gas (10 ml/min). Thestream of nitrogen gas containing the [11C]CO2 is bubbled through 50 �l of3 M methylmagnesium bromide diluted with 3 ml diethyl ether in a 5-mlReactivial. USP sterile water for injection (0.25 ml) is added, and the reac-tion vial is placed onto a 50
�heating block to evaporate the ether using a
stream of nitrogen gas. The intermediate organometallic complex is hydro-lyzed by the addition of 2 ml of 0.4 N hydrochloric acid, followed by theaddition of 2 ml of USP sterile water for injection. Purification of the acidicmixture by solid phase is accomplished by the robot, which pours the solu-tion onto the PrepSep funnel, which contains 600–700 mg of C18 resin ac-tivated previously with 5 ml of ethanol and rinsed with 10 ml of sterilewater and 2–3 g of AG 11A8 ion retardation resin. The final product is fil-tered through a 0.22-�m, 25-mm, sterile, apyrogenic filter. Batches of220 mCi on average at the end of 20-min syntheses are obtained routinelyafter a 20-min bombardment.
1-[11C]Acetate is also produced routinely in our laboratory with acommercially available chemistry synthesizer, the CTI acetate module(Knoxville, TN) (Fig. 6). After irradiation, the target gases are passedthrough a needle valve into the reagent vessel; the flow of the target gasis limited to less than 100 ml/min. The stream of nitrogen gas containingthe [11C]CO2 is bubbled through 50 �l of 3 M methylmagnesium bromidediluted with 1 ml diethyl ether in a 10-mm o.d. � 75-mm-long test tubesealed with a red flange stopper top. Sterile water for injection, USP(0.25 ml) is added, and the reaction vial is heated to 145
�. The ether is
evaporated using a stream of helium gas. The intermediate is hydrolyzedby the addition of 0.5 ml of 10% phosphoric acid. The acidic mixtureis then purified by heating at 145
�for 420 s to distill 1-[11C]acetate into
USP saline (10 ml). The final product is passed through a 0.22-�m, 25-mm, sterile, apyrogenic filter. Average yields of 200 mCi of 1-[11C]acetateare obtained routinely in a synthesis time of 20 min from EOB.
Overview of the Quality Assurance of C-11 Radiopharmaceuticals
Radiopharmaceuticals administered for PET procedures and whichcontain radionuclides of very short half-lives, such as carbon-11 (20.4 min),must be analyzed, must meet quality assurance specifications, and mustbe fully documented prior to administration to humans.10,11 This requiresvarious types of quality control (QC) determinations, such as radionuclidicidentity, radionuclidic purity, radiochemical and chemical purity, sterility,
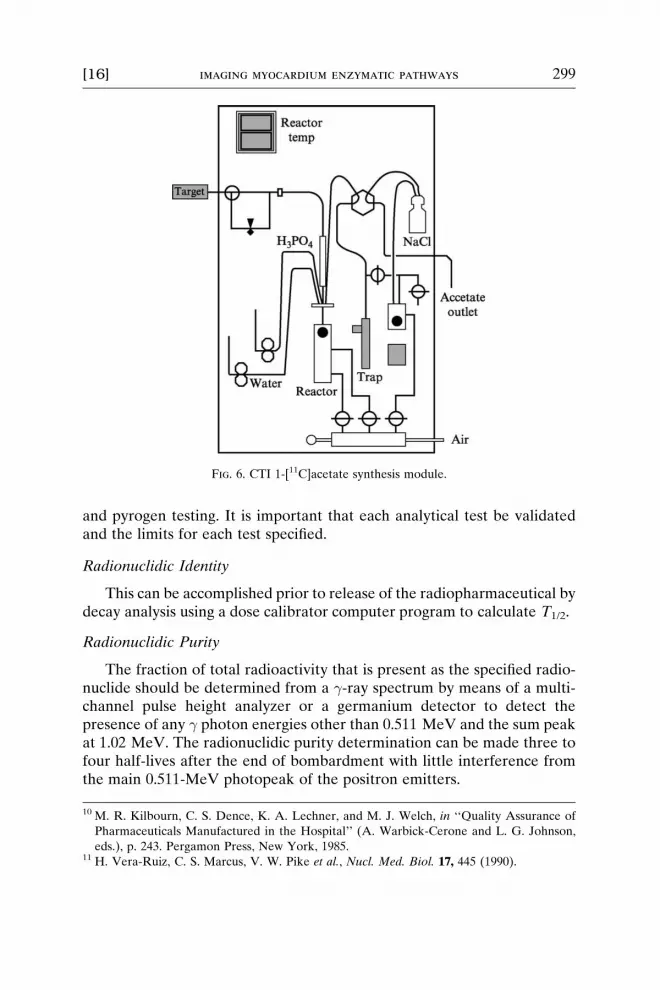
Fig. 6. CTI 1-[11C]acetate synthesis module.
[16] imaging myocardium enzymatic pathways 299
and pyrogen testing. It is important that each analytical test be validatedand the limits for each test specified.
Radionuclidic Identity
This can be accomplished prior to release of the radiopharmaceutical bydecay analysis using a dose calibrator computer program to calculate T1/2.
Radionuclidic Purity
The fraction of total radioactivity that is present as the specified radio-nuclide should be determined from a �-ray spectrum by means of a multi-channel pulse height analyzer or a germanium detector to detect thepresence of any � photon energies other than 0.511 MeV and the sum peakat 1.02 MeV. The radionuclidic purity determination can be made three tofour half-lives after the end of bombardment with little interference fromthe main 0.511-MeV photopeak of the positron emitters.
10 M. R. Kilbourn, C. S. Dence, K. A. Lechner, and M. J. Welch, in ‘‘Quality Assurance of
Pharmaceuticals Manufactured in the Hospital’’ (A. Warbick-Cerone and L. G. Johnson,
eds.), p. 243. Pergamon Press, New York, 1985.11 H. Vera-Ruiz, C. S. Marcus, V. W. Pike et al., Nucl. Med. Biol. 17, 445 (1990).

300 imaging of receptors, small molecules, and protein interactions [16]
Radiochemical Purity
The quality control method for determining radiochemical purity (thefraction of the radiopharmaceutical that is present in the desired chemicalform, with the label in the specified molecular position) is usually basedon a chromatographic method with simultaneous mass and radioactivitydetection. Various types of chromatographic methods such as thin-layerchromatography (TLC) or HPLC can be used. HPLC allows the in-linemeasurement of chemical and radiochemical purity. These chromatograph-ic methods are performed using standards for the comparison of Rf valuesand retention times or for generating standard calibration curves.12
Radioactivity Balance
For the development of new radiopharmaceuticals requiring analysis byHPLC, it is generally necessary to perform a radioactivity balance measure-ment to ensure that the total radioactivity injected onto a HPLC column isrecovered at the end of the specified HPLC run time. This determinationcan be made by injection of an aliquot of the radiopharmaceutical(10–50 �l) onto the HPLC and collecting all the postinjection effluentsolvent in a volumetric flask. The flask is then taken to the standard volumeand mixed well. For example, for an HPLC run at 1.5 ml/min that lasts10 min, a 25-ml volumetric flask is used to collect the eluate. After 10 minthe flask is removed from the eluting line and a sufficient volume of water(or a solvent compatible with the HPLC solvent used) is added to bring thetotal volume to 25 ml. This constitutes ‘‘sample counts.’’ The ‘‘standardcounts’’ sample is obtained by aliquoting the original volume injected onthe HPLC column (10–50 �l from the same original analyte) into another25-ml volumetric, and adding sufficient solvent to bring the total volume to25 ml. An aliquot from each volumetric flask is transferred into a test tube,and the samples are counted in a sodium iodide � counter. Due to the shorthalf-life of C-11, it is necessary to decay correct both samples to time zeroand compute the percentage eluted as follows: (‘‘counts in sample’’/‘‘counts in standard’’) � 100. Acceptable values should be 85% or higher.With high specific activity radiopharmaceuticals, some radioactivity lossesare unavoidable on the HPLC tubing, column, precolumn, filters, etc. Val-ues below 85% are usually indicative of radioactivity being retained on thechromatographic column or precolumns that need to be addressed in orderto avoid inaccurate radiochemical purity determinations.
12 M. R. Kilbourn, M. J. Welch, C. S. Dence, and K. A. Lechner, in ‘‘Analytical and
Chromatographic Techniques in Radiopharmaceutical Chemistry’’ (D. M. Wieland, M. C.
Tobes, and T. J. Mangner, eds.), p. 251. Springer-Verlag, New York, 1986.

[16] imaging myocardium enzymatic pathways 301
Chemical Purity
Analyses are required to verify the absence of any chemical impuritiesor solvent residues in the final preparation. Analyses also require an injec-tion of a known standard each time a QC is performed. In this way theaccuracy of the HPLC, or of any other system that is used, is determinedeach time. Chemical impurities separated by HPLC are generally easyto detect if they are ultraviolet (UV) absorbing. Compounds with lowUV absorption characteristics can be detected by pulsed amperometricdetectors (PADs) or by HPLC mass spectrometry. The chemical purityrequirement serves to verify the chemical identity of the product andby-products, including stereoisomeric purity, if needed (e.g., 1-[11C]d-glu-cose versus 1-[11C]d-mannose). Ion chromatographic techniques are ap-plied routinely to the detection of residual inorganic species in order tovalidate the absence of nickel, borate, and lead ions. Lead ions may poten-tially arise from the lead counterion of the Aminex resin of the HPLCcolumn used in the preparative purification of the 1-[11C]d-glucosepreparation.6
The quantification of organic solvent residues such as ethanol, acetoni-trile, and ether used in the preparation of the carbon-11 compounds isperformed by gas chromatography. Separation is carried out on a Varian3800 gas chromatograph using a capillary column DB-Wax, 30-m �0.53-mm i.d., 1-�m film thickness (J&W Scientific). The injector and FIDdetector temperatures are held at 225
�and 275
�, respectively. Helium is
used as a carrier at a flow rate of 7 ml/min. The column temperature is heldat 40
�for 2 min and is raised to 110
�in 7 min. Analyses are performed on
a 1.0-�l aliquot of the final injectable solution after sterile filtration.
Sterility, Apyrogenicity, Isotonicity, and Acidity
Tests should be performed to ensure sterility, apyrogenicity, isotonicity,and suitable acidity (pH) before administration to humans. Sterility shouldbe determined postrelease on each batch of parenteral radiopharmaceuti-cal intended for human use. The injectable drug product must be sterilizedby filtration through a 0.22-�m filter as a final step in the radiosyntheticprocedure. USP methods for sterility require inoculation of the radio-pharmaceutical into both tryptic soy broth and fluid thioglycolate mediawithin 24-h postend of synthesis (EOS). Because an entire lot of a PETradiopharmaceutical may be administered to one or several subjects, de-pending on the radioactivity remaining in the container at the time ofadministration, administration of the entire quantity of the lot to a singlepatient should be anticipated for each lot prepared. Verification of apyro-genicity should be made using the USP bacterial endotoxin test (BET)
302 imaging of receptors, small molecules, and protein interactions [16]
on each batch of every nongaseous radiopharmaceutical prepared forintravenous human administration. The USP limit for endotoxins is 175 en-dotoxin units (EU) per volume (V), which is the maximum volume ad-ministered in the total dose. If the T1/2 � 20 min, a 20-min endotoxin‘‘limit test’’ must be performed prerelease (USP 46). A standard 60-mintest must also be performed on each batch. The pH and isotonicity can beadjusted to physiologic values prior to the final filtration by the addition ofsterile buffers or by a 0.9% sodium chloride solution.
Dosimetry Calculations
All radiopharmaceuticals that are injected into humans require that ab-sorbed dose calculations be performed. These dose calculations are neededto predict the risk involved in the use of any ionizing radiation.13 Medicalinternal radiation dose (MIRD) calculations require knowledge of certainparameters. These include the amount of cumulative activity in each of theorgans of the body and the type of radiation administered.
Cumulative activity represents the time course of the radioactivity inthe body that requires information on the rate of radiopharmaceutical up-take and removal (biological half-life), as well as the physical decay of theradionuclide injected (physical half-life).
Biological clearance data (percentage injected dose/organ over time)are often obtained by the performance of biodistribution studies, usuallyin rodents, over a time interval. If radiopharmaceuticals labeled withC-11 are used, a 2- to 3-h time interval is acceptable. Clearance can alsobe determined by the use of dynamic PET imaging. Mathematical models,such as the dynamic bladder model,14 can also be used to calculate theclearance. Biological clearance data are used to calculate the cumulativeactivity in each organ. The formula for the absorbed dose is D ¼ AS, whereA is cumulative activity and S is absorbed dose per unit cumulative activity.The absorbed doses per unit cumulative activity can be calculated for thespecific isotope used (S ¼ �ø/m), where
�ø ¼ 2.13 � ni Ei, ni is the number of particles or photons per nucleartransformation, Ei is the mean energy of the radiation, and m is the mass ofthe organ. These S values can also be obtained from a dosimetry computersoftware program MIRDOSE3.15,16
13 M. G. Stabin, M. Tagesson, S. R. Thomas, M. Ljungberd, and S. E. Strand, Appl. Radiat.
Isot. 50, 73 (1999).14 S. R. Thomas, M. G. Stabin, C. T. Chen, and R. C. Samaratunga, J. Nucl. Med. 40, 102S
(1999).15 M. G. Stabin, J. Nucl. Med. 37, 538 (1996).16 R. N. Howell, B. W. Wessels, and R. Loevinger, J. Nucl. Med. 40, 3S (1999).

[16] imaging myocardium enzymatic pathways 303
Conduct of GAP Studies
Measurement of Regional Perfusion and Metabolism
Data Acquisition. Figure 7 is a representation of the imaging protocolfor the GAP studies. A transmission scan is initially conducted prior toadministration of the radiotracer. The transmission scan consists of a dataacquisition session in which a positron-emitting point source is rotated 360
�
around the subject to be scanned. The function of the transmission scanis to provide an accurate measurement of photon attenuation for the atten-uation correction of the ensuing emission scans (i.e., a scan acquired afterthe administration of the radiotracer). For the measurement of myocardialblood flow, up to 0.40 mCi/kg of 15O water (prepared using the method ofWelch and Kilbourn17) is administered as a bolus intravenously with theimmediate initiation of dynamic data collection for 5 min. After allowancefor decay of the 15O water, up to 0.30 mCi/kg of 1-[11C]acetate is injectedintravenously, and a 30-min dynamic data collection is performed to mea-sure myocardial oxygen consumption. After allowance for decay of the1-[11C]acetate, up to 0.30 mCi/kg of 1-[11C]d-glucose is injected intrave-nously, and a 60-min dynamic data collection is performed to measuremyocardial glucose metabolism. Finally, after allowance for decay of the1-[11C]d-glucose, up to 0.30 mCi/kg of 1-[11C]palmitate is injected intrave-nously, and a 30-min dynamic data collection is performed to measuremyocardial fatty acid metabolism.
During the 1-[11C]acetate, 1-[11C]palmitate, and 1-[11C]d-glucose scans,8–10 venous samples are obtained to measure 11CO2 production (in thecase of 1-[11C]d-glucose, 1-[11C]lactate is measured as well) in order to cor-rect the arterial input function during kinetic modeling (see kinetic model-ing section). Between each metabolic scan (i.e., between 1-[11C]acetate and1-[11C]d-glucose), subjects are removed from the tomograph to increasetheir comfort during the study. Upon their return to the tomograph, anoth-er transmission scan is performed (a total of three transmission scans perstudy). Table II lists the total amount of radioactivity administered to thetest subject in a typical GAP study, which is approximately 1475 mrem.This represents about 30% of the annual exposure limit for a radiationworker (e.g., personnel involved in the synthesis of PET radiotracers).
Data Reconstruction and Generation of Time–Activity Curves. Afterdata reconstruction is performed, myocardial images are reformattedfrom the transaxial orientation to the true short-axis views on whichmeasurements of perfusion and metabolism will be performed. Myocardial
17 M. J. Welch and M. R. Kilbourn, J. Labeled Compd. Radiopharm. 22, 1193 (1985).

Fig. 7. Flowchart outlining the steps in conducting a GAP study.
304 imaging of receptors, small molecules, and protein interactions [16]
[15O]water, 1-[11C]acetate, 1-[11C]d-glucose, and 1-[11C]palmitate imagesare generated and then reoriented to standard short- and long-axis views.To generate myocardial time–activity curves, regions of interest on ante-rior, lateral, septal, apical, and inferior myocardial walls (3–5 cm3) areplaced on three to four midventricular short and long axis slices ofcomposite [15O]water, 1-[11C]acetate, 1-[11C]d-glucose, and 1-[11C]palmi-tate images. To generate blood time–activity curves for each tracer, a smallregion of interest (1 cm3) is placed within the left atrial cavity on a midven-tricular slice in the horizontal long-axis orientation of each composite im-age. Within these regions of interest, myocardial and blood time–activitycurves are generated for each of the sets of tracer data. Subsequently,blood and myocardial time–activity curves are used in conjunction with

TABLE II
Effective Dose Equivolent (EDE) for All the Radiopharmaceuticals
Administered in a GAP studya
[15O]Waterb [11C]Acetatec [11C]Palmitatec [11C]d-Glucosec Total
92 mremd 273 mremd 320 mremd 790 mremd 1475 mrem
a A measure of the biological damage caused by ‘‘ionizing’’ radiation, e.g., � rays, X rays,
and � particles, is expressed by the dose equivalent, the unit of which is the rem. A
special variation of the dose equivalent is the EDE, a computed uniform whole body dose
that applies to nonuniform irradiation of differing organs and tissues in the body. The
allowable EDE for a radiation worker in the United States is 5000 mrem. The EDE for
administration of the radiopharmaceuticals listed here would be 30% of the allowable
annual exposure for a radiation worker.b Administered dose: 28 mCi (0.4 mCi/Kg; 70 Kg man).c Administered dose: 21 mCi (0.3 mCi/Kg; 70 Kg man).d EDE from unpublished dosimetry estimates.
[16] imaging myocardium enzymatic pathways 305
well-established kinetic models to measure myocardial blood flow, oxygenconsumption, glucose utilization, fatty acid utilization, and oxidation.
Metabolite Analysis
In order to validate the kinetic models used to study the enzymaticpathways of the heart with the carbon-11 tracers, it is necessary to accountfor the impact of blood acidic metabolites on the arterial input function.18
This routinely includes the analysis of C-11 acidic metabolites presentin blood, namely carbonate and lactate, following the injection of C-11radiotracers.19
Determination of [11C]CO2. The determination is based on the loss of[11C]CO2 under acidic conditions. A 5-ml blood sample is withdrawn intoa gray-top Vacutainer (L10330-00; Becton-Dickinson, NJ) after a specifiedpostinjection time. Blood is spun for 5–6 min at 3500 rpm to separate theplasma. For each sample to be analyzed, a set of two test tubes areprepared, each containing 1.0 ml of 0.9 M sodium bicarbonate and 3 mlof isopropanol. To one of the test tubes, 1 ml of 0.1 N NaOH is added(labeled ‘‘basic’’). To each test tube, 0.5 ml of plasma is added and thetubes are vortexed briefly and gently. The other test tube is then treatedwith 1 ml of 6 N HCl (labeled ‘‘acidic’’). All the ‘‘acidic’’ test tubes are
18 P. Herrero, T. L. Sharp, C. Dence, B. M. Haraden, and R. J. Gropler, J. Nucl. Med. 43, 1530
(2002).19 C. S. Dence, P. Herrero, T. L. Sharp, and M. J. Welch, ‘‘12th International Symposium on
Radiopharmacology,’’ Interlaken Switzerland, Abstract Book, 2001.

306 imaging of receptors, small molecules, and protein interactions [16]
placed in a custom-made manifold and purged with a stream of nitrogen for10 min at room temperature to eliminate [11C]CO2. At the end of bubbling,all the tubes are counted for radioactivity (from last-to-first collected), de-cay corrected to time zero, and the percentage of [11C]CO2 is calculated(counts ‘‘acidic’’/counts ‘‘basic’’ � 100).
Total Acidic Metabolites. Following injections of 1-[11C]d-glucose,blood samples are analyzed for total acidic metabolites (TAM) ([11C]car-bonate and [11C]lactate) and residual 1-[11C]d-glucose. Analysis is basedon the trapping of these acidic species on an anion-exchange column whileeluting the neutral species. The authors use 1.2–1.3 g of AG1-X8, in theformate form, 100–200 mesh (Bio-Rad) placed in a 6-ml disposable syringewith a glass wool plug in the bottom. The resin is rinsed with 4–6 ml of wa-ter. These columns can be prepared 24 h ahead and kept moist at roomtemperature. The blood samples are collected on special Vacutainer tubes(as described earlier) containing sodium fluoride and potassium oxalate tostop further glucose metabolism. About 1.0 ml of plasma is pipetted intothe resin column, and deionized water (in 2 þ 3-ml fractions) is used toelute the nonmetabolized 1-[11C]d-glucose. This eluate (5 ml total) iscollected in one test tube. The acidic metabolites, [11C]carbonate and[11C]lactate are retained on the resin. Both eluate and resin are countedfor radioactivity, and after decay correction the percentage of acidicmetabolites is calculated (counts in resin/counts in eluate � 100). The per-centage of [11C]lactate is calculated by subtracting the percentage of CO2
(determined as described earlier) from the percentage of TAM, and thepercentage of residual glucose as 100 – %TAM.
Kinetic Modeling
After the blood time–activity curve has been corrected for its metabo-lites, the blood (input function) and tissue–time activity curves generatedfrom PET cardiac images are used in conjunction with kinetic models tomeasure myocardial blood flow and metabolism. In the kinetic modelingof PET data derived from GAP studies, the method that is typically usedis the compartmental model method. A compartmental model is generallyrepresented by a series of compartments linked together by arrows repre-senting transfer between the compartments. A compartment is defined asthe space in which the radiotracer is distributed uniformly.20 The numberof compartments that are needed to quantify the fate of the radiotracer
20 S.-C. Huang and M. E. Phelps, in ‘‘Positron Emission Tomography and Autoradiography:
Principles and Applications for the Brain and Heart’’ (M. Phelps and J. Mazziotta, eds.),
p. 287. Raven Press, New York, 1986.

Fig. 8. Four-compartment model used for 1-[11C]d-glucose. K1 (ml/g/min), k2, and k3
(min�1). Net 1-[11C]d-glucose uptake (K, ml/g/min) ¼ (K1 * k3)/(k2 þ k3).
[16] imaging myocardium enzymatic pathways 307
in vivo is directly proportional to the number of steps in the metabolic pro-cess being investigated (Fig. 8). The arrows in Fig. 8 represent possiblepathways the radiotracer can follow in a particular metabolic pathway.The symbol k above each arrow is a rate constant and denotes the fractionof the total radiotracer that would leave the compartment per unit time[turnover rate (min�1)].
The key assumptions of compartmental modeling are that the traceris distributed homogeneously in each compartment and that the rate of trac-er transfer from compartment 1 to compartment 2 is directly proportional tothe tracer concentration in compartment 1. These assumptions make itpossible to describe the system under study by n first-order, linear differen-tial equations, where n is the number of compartments and each differentialequation represents the rate of change of tracer concentration over time ina given compartment, defined as the rate of tracer in minus the rate of trac-er out of the compartment. The solution to the system of differential equa-tions gives the concentration of tracer in each compartment over time. Thesum of the concentrations from all compartments (a function of the bloodactivity and the turnover rates of the tracer) represents the myocardial activ-ity over the scanning period (theoretical myocardial time–activity curve).Using nonlinear least-square approaches, turnover rates (ks values) are esti-mated by minimizing the differences between the PET derived myocardialtime-activity curve and the analytical curve derived from the model. A briefdescription of the compartmental models used in the kinetic analysis of aGAP study is outlined next.
Myocardial Blood Flow (MBF). [15O]Water is a freely diffusible radio-tracer whose myocardial kinetics appears to be related solely to blood flow.

308 imaging of receptors, small molecules, and protein interactions [16]
That is, the uptake of [15O]water is not altered by changes in myocardialmetabolism.21–23 The kinetics of freely diffusible tracers such as [15O]watercan be described by a simple one compartment model. The approachfor quantifying MBF is based on the model developed by Kety24–26 forradiolabeled inert freely diffusible gases. The rate of change of myocardialtracer activity over time can be defined by a simple differential equation:
dCTðtÞ=dðtÞ ¼ ðMBFÞ CaðtÞ � ðMBFÞ CTðtÞ=� (1)
The solution to the differential equation is shown as
CTðtÞ ¼ MBF CaðtÞ � expðMBF t=�Þ (2)
where CT(t) is tissue tracer concentration (counts/g), Ca(t) is arterial tracerconcentration (input function) (counts/ml), MBF is myocardial bloodflow per unit of tissue volume (ml/g/min), � is the tissue/blood partitioncoefficient (0.92 ml/g), and * is the convolution process.
Using least-square techniques, estimates of MBF can be obtained byfitting Eq. (2) to the myocardial tissue activity CT(t). However, becauseof the limited resolution of PET tomographs (8–12 mm FWHM) in relationto the thickness of the myocardium (approximately 10 mm in humans) andeffects of cardiac motion, the true tissue concentration cannot be measureddirectly with PET. If the object under study is less than twice the resolutionof the tomograph, the true activity in the region of interest is underesti-mated (partial volume effect) and activity from adjacent regions is detectedinto the region of interest (spillover effect). The relationship between thetrue and the observed PET activity can be defined as
CT PETðtÞ ¼ FMM � CTðtÞ þ FBM � CaðtÞ (3)
Ca PETðtÞ ¼ FBB � CaðtÞ þ FMB � CTðtÞ (4)
where CT PET(t) is observed tissue activity (counts/g), CT(t) is true tissueactivity (counts/g), Ca PET(t) is observed blood pool activity (counts/g),Ca(t) is true blood pool activity (counts/g), FMM is the tissue recoverycoefficient (accounts for partial-volume effects in the myocardium), FBM
is fraction of blood activity into tissue (accounts for spillover of bloodcounts into myocardium), FBB is the blood recovery coefficient (accounts
21 S. R. Bergmann, P. Herrero, J. Markham, C. J. Weinheimer, and M. N. Walsh, J. Am. Coll.
Cardiol. 14, 639 (1989).22 P. Herrero, J. Markham, and S. R. Bergmann, J. Comp. Assist. Tomogr. 13, 862 (1989).23 P. Herrero, J. J. Hartman, M. J. Senneff, and S. R. Bergmann, J. Nucl. Med. 35, 558 (1994).24 S. S. Kety, Pharmacol. Rev. 3, 1 (1951).25 S. S. Kety, Methods Med. Res. 8, 223 (1960).26 S. S. Kety, Methods Med. Res. 8, 228 (1960).

[16] imaging myocardium enzymatic pathways 309
for partial-volume effects in the blood), and FMB is the fraction of tissueactivity into blood (accounts for spillover of myocardium counts intoblood).
If these correction factors are known a priori, the true blood and myo-cardial activity can be calculated from Eqs. (3) and (4). These correctionfactors can be calculated analytically if the resolution of the tomographand the dimensions of the blood chambers and myocardial tissue areknown and there is no motion present.27 However, when cardiac and respi-ratory motion are present and/or the measurements of cardiac chambersand tissue are not accurate, then measurement of the true blood andtissue–activity curves will be inaccurate and will result in erroneous MBFestimates. This problem is circumvented by incorporating within the bloodflow model [Eq. (2)] this relationship between the true tissue activity andthe PET-derived tissue activity given by
CT PETðtÞ ¼ FMM � ½MBF CaðtÞ � expð�ðMBFÞt=�Þ þ FBM � CaðtÞ (5)
where MBF is estimated along with FMM and FBM by fitting Eq. (5) to PET-derived tissue activity [CT PET(t)]. This model assumes that Ca(t) can bemeasured directly with PET [i.e., FBB ¼ 1.0 and FMB ¼ 0.0 in Eq. (4)]. Thisassumption has been validated in experimental human studies.27
Kinetic Modeling of 11C-Labeled Metabolic Radiotracers
For all 11C-labeled metabolic radiotracers, a correction for myocardialpartial volume and spillover effects was done by estimating the corre-sponding model turnover rates along with FBM after fixing FMM to valuesobtained from the [15O]water analysis.
Myocardial Glucose Utilization. Myocardial glucose utilization (MGU)is obtained using a four-compartment model for 1-[11C]d-glucose (Fig. 8).28
This model assumes that vascular 1-[11C]d-glucose enters the interstitialand cytosolic component of the myocardium (compartment 1) at a rate ofK1 (ml/g/min). Once the tracer enters compartment 1, it either diffusesback into the vascular space at a rate of k2 (min�1) or it is phosphorylatedand metabolized to [11C]pyruvate (compartment 2) at a rate of k3 (min�1).Phosphorylated 1-[11C]d-glucose can either form [11C]glycogen at a rate ofk4 (min�1) or be metabolized through anaerobic and oxidative pathways(compartment 4) at a rate of k5 (min�1). Radiotracer entering the metabol-ic pool is assumed to be unidirectional, and washout of [11C]CO2 and
27 P. Herrero, J. Markham, D. W. Myears, C. J. Weinheimer, and S. R. Bergmann, Math.
Comp. Model. 11, 807 (1988).28 P. Herrero, C. J. Weinheimer, C. S. Dence, W. F. Oellerich, and R. J. Gropler, J. Nucl.
Cardiol. 9, 5 (2002).

310 imaging of receptors, small molecules, and protein interactions [16]
[11C]lactate to the vasculature is assumed to be proportional to bloodflow. This is an important assumption, as it enables one to ‘‘lump’’ all theradiolabeled intermediates in the glycolytic pathway (Fig. 9) into onecompartment.
Differential equations defining the model are as follows:
dq1ðtÞ=dt ¼ K1CaðtÞ � ðk2 þ k3Þq2ðtÞ (6)
dq2ðtÞ=dt ¼ k3q1ðtÞ � ðk4 þ k5Þq2ðtÞ (7)
dq3ðtÞ=dt ¼ k4q1ðtÞ (8)
dq4ðtÞ=dt ¼ k5q2ðtÞ � ðMBFÞq4ðtÞ (9)
The solution of this set of differential equations results in the concentrationof tracer in each compartment (q1–q4). The total radiotracer concentra-tion in the myocardium as a function of time is then defined as the sumof the radiotracer concentrations in each compartment:
qtðtÞ ¼ q1ðtÞ þ q2ðtÞ þ q3ðtÞ þ q4ðtÞ ¼ f ðCaðtÞ;K1; k2--k5;MBF;VÞ (10)
where Ca(t) is arterial 1-[11C]d-glucose concentration (i.e., the input func-tion for 1-[11C]d-glucose) K1 and k2–k5 are turnover constants describingthe transfer of radiotracer between compartments, q n is the concentrationof radiotracer in compartment n (counts/ml), and V is the fractional vascu-lar volume and is assumed to be 10% of total volume (0.1 ml/g); f repre-sents a function of the parameters in parentheses. The model transferrate constants (K1, k2–k5) and the spillover fraction are estimated usingwell-established least-square approaches by fitting the model Eq. (10) toPET myocardial time–activity curves. If one assumes steady-state condi-tions (i.e., differential equations are set to zero), then these estimated turn-over rates (K1, k2–k5) are used to calculate the net 1-[11C]d-glucose uptake(GLUuptake) and MGU as
GLUuptakeðml=g=minÞ ¼ ðK1k3Þ=ðk2 þ k3Þ and (11)
MGUðnmol=g=minÞ ¼ ðGlb; nmol=mlÞðGLUuptake; ml=g=minÞ (12)
The myocardial glucose extraction fraction (EFGLU) is calculated as
EFGLU ¼ GLUuptake=MBF (13)
Hence, myocardial glucose utilization can be calculated as the product ofthree key measurements—the plasma glucose level, myocardial blood flow,and the myocardial glucose extraction fraction:
MGUðnmol=g=minÞ ¼ ðGlbÞðMBFÞðEFGLUÞ (14)

Fig. 9. Fate of the 11C radiolabel in 1-[11C]d-glucose in the glycolytic pathway. Enzymes: 1, hexokinase; 2, glucose
phosphate isomerase; 3, 6-phosphofructokinase; 4, fructose diphosphate aldolase; 5, triosephosphate isomerase; 6,
glyceraldehydephosphate dehydrogenase; 7, phosphoglycerate kinase; 8, phosphoglyceromutase; 9, enolase; 10, pyruvate
kinase; 11, lactate dehydrogenase. From Nelson and Cox.28a
[16]
im
ag
in
gm
yo
ca
rd
iu
me
nz
ym
atic
pa
th
wa
ys
31
1
312 imaging of receptors, small molecules, and protein interactions [16]
where Glb is the plasma glucose level in nmol/ml measured from venousblood samples obtained during the PET study and EFGLU is the myocardialglucose extraction fraction estimated from 1-[11C]d-glucose kinetics.
Myocardial Oxidative Metabolism. After correction of the PET-derivedblood 11C activity for the 11CO2 contribution, the blood and myocardial time–activity curves are used in conjunction with a simple one compartment modelto estimate two turnover rates: K1(ml/g/min) representing the net rate of1-[11C]acetate uptake into the myocardium, and k2 (min�1) representing therate at which 1-[11C]acetate is converted to 11CO2. The latter has been shownto be directly proportional to myocardial oxygen consumption (MVO2).29,30
MVO2 (�mol/g/min) is then calculated from an experimentally derivedlinear relationship between k2 and MVO2 in humans.31
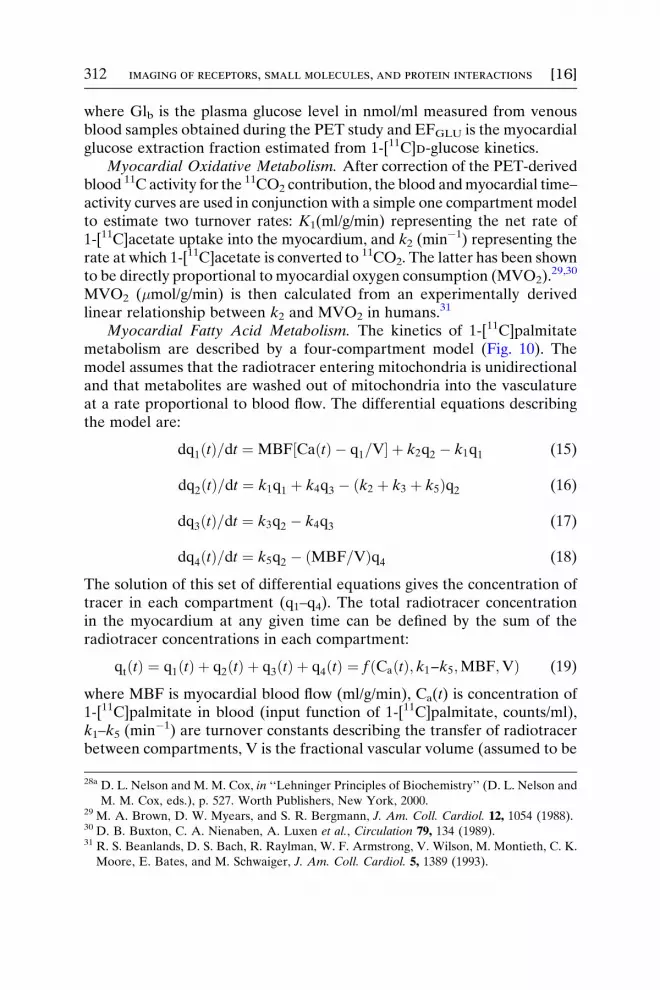
Myocardial Fatty Acid Metabolism. The kinetics of 1-[11C]palmitatemetabolism are described by a four-compartment model (Fig. 10). Themodel assumes that the radiotracer entering mitochondria is unidirectionaland that metabolites are washed out of mitochondria into the vasculatureat a rate proportional to blood flow. The differential equations describingthe model are:
dq1ðtÞ=dt ¼ MBF½CaðtÞ � q1=V þ k2q2 � k1q1 (15)
dq2ðtÞ=dt ¼ k1q1 þ k4q3 � ðk2 þ k3 þ k5Þq2 (16)
dq3ðtÞ=dt ¼ k3q2 � k4q3 (17)
dq4ðtÞ=dt ¼ k5q2 � ðMBF=VÞq4 (18)
The solution of this set of differential equations gives the concentration oftracer in each compartment (q1–q4). The total radiotracer concentrationin the myocardium at any given time can be defined by the sum of theradiotracer concentrations in each compartment:
qtðtÞ ¼ q1ðtÞ þ q2ðtÞ þ q3ðtÞ þ q4ðtÞ ¼ f ðCaðtÞ; k1--k5;MBF;VÞ (19)
where MBF is myocardial blood flow (ml/g/min), Ca(t) is concentration of1-[11C]palmitate in blood (input function of 1-[11C]palmitate, counts/ml),k1–k5 (min�1) are turnover constants describing the transfer of radiotracerbetween compartments, V is the fractional vascular volume (assumed to be
28a D. L. Nelson and M. M. Cox, in ‘‘Lehninger Principles of Biochemistry’’ (D. L. Nelson and
M. M. Cox, eds.), p. 527. Worth Publishers, New York, 2000.29 M. A. Brown, D. W. Myears, and S. R. Bergmann, J. Am. Coll. Cardiol. 12, 1054 (1988).30 D. B. Buxton, C. A. Nienaben, A. Luxen et al., Circulation 79, 134 (1989).31 R. S. Beanlands, D. S. Bach, R. Raylman, W. F. Armstrong, V. Wilson, M. Montieth, C. K.
Moore, E. Bates, and M. Schwaiger, J. Am. Coll. Cardiol. 5, 1389 (1993).

Fig. 10. The four-compartment model used in the kinetic analysis of 1-[11C]palmitate.
[16] imaging myocardium enzymatic pathways 313
10% of total volume) (0.1 ml/g), q n is the concentration of radiotracer incompartment n (counts/ml), and qt is the total concentration of radiotracerin the myocardium (counts/ml).
Because blood contains radiolabeled metabolites in addition to 1-[11C]palmitate, the PET-derived 11C blood activity must be correctedfor the presence of 11CO2 as described earlier in order to derive the trueinput function. Myocardial blood flow is fixed to values obtained with[15O]water, and the fractional vascular volume is fixed at 0.1 ml/g. Similarlyto the analysis of 1-[11C]d-glucose, after a correction of the blood 11C activ-ity for 11CO2, the turnover rates (k1–k5) and FBM are estimated by fittingEq. (19) to the PET myocardial time–activity curves after fixing FMM tovalues obtained from [15O]water analyses.
If one assumes steady-state conditions (i.e., each differential equationis set equal to zero), then key quantities such as fatty acid utilization,oxidation, and esterification (all in nmol/g/min) can be calculated fromthe estimated turnover rates. The model assumes that once the tracer isin the interstitial/cytosolic compartment, it can follow only three pathways:back diffusion into the vasculature (k2), storage into neutral lipids andamino acids (esterification) (k3), and � oxidation (k5) (see Fig. 10). Becausethe proportion of arterial palmitate (a long chain fatty acid) to the totalfree fatty acid concentration in blood remains constant during a widerange of free fatty acid levels, and different chains of fatty acids have com-parable myocardial extraction fractions,32 fatty acid utilization, oxidation,and esterification can be calculated from the kinetics of 1-[11C]palmitate as
MFAU ðnmol=g=minÞ ¼ ðFFAbÞðMBFÞðEF11C-palÞ (20)
where FFAb is free fatty acid in blood (nmol/ml), MBF is myocardial blood

314 imaging of receptors, small molecules, and protein interactions [16]
flow (ml/g/min), EF11C-pal is the myocardial extraction fraction of palmitateestimated from the kinetics of 1[11C]palmitate, and
MFAU ðnmol=g=minÞ ¼ MFAO þ MFAE (21)
where MFAO is myocardial fatty acid oxidation, MFAE is myocardial fattyacid that is retained by the myocardium and includes esterified fatty acids,as well as intermediary metabolites, and
MFAO ðnmol=g=minÞ ¼ k5q2 (22)
MFAE ðnmol=g=minÞ ¼ k3q2 ðk4 is negligible during the study periodÞ (23)
q2 ¼ fk1½MBF FFAb g=f½ðk2 þ k5Þðk1 þ MBF=VÞ � ðk1k2Þ g (24)
where q2 is the concentration of unlabeled palmitate in compartment2 (nmol/g), FFAb is the fatty acid concentration in blood (nmol/ml), andV is the fractional vascular volume in myocardium [assumed to be 10%of total volume (ml/g)].
Finally, the fraction of extracted palmitate undergoing oxidation (Fox)or esterification (Fes) can be calculated as
Fox ¼ MFAO=MFAU (25)
Fes ¼ MFAE=FMAU (26)
Conclusion
GAP studies currently represent the most thorough application ofPET in the measurement of substrate utilization and oxidative metabo-lism in the heart. The successful completion of this research protocol re-quires the detailed coordination of radiochemists, cyclotron operators,cardiologists, nurses, and technicians with mathematical modelers and dataanalysis personnel in order to contend with the short half-lives of the radio-nuclides used in the imaging studies. Analysis of PET data requires sophis-ticated metabolite correction, image coregistration, partial volume andspillover correction techniques in order to quantitate myocardial metabo-lism accurately. Nonetheless, data analyses of a typical GAP study requireminimum manual data entry and, on average, are completed within 2 hfrom the time the myocardial PET images are reconstructed, making thesetypes of complex studies feasible to implement in a clinical PET environ-ment. To date, this imaging paradigm has been used to measure thechanges in metabolic flux in a variety clinical research protocols, includingnormal aging,33,34 obesity,35 dilated cardiomyopathy,36 type 1 diabetes
32 S. R. Bergmann, C. J. Weinheimer, J. Markham, and P. Herrero, J. Nucl. Med. 37, 1723
(1996).

[17] molecular imaging of enzyme function in lungs 315
mellitus, and hypertension-induced left ventricular hypertrophy.37 Futurestudies will be directed toward the application of this paradigm in orderto delineate the mechanisms responsible for the metabolic changes ob-served in these conditions and to assess the efficacy of novel therapies de-signed to reverse these metabolic abnormalities.
Acknowledgments
We thank Jeff Willits for his assistance with the illustrations and Dr. Joseph B. Dence for
his suggestions and reading of the manuscript. This work was conducted under NIH Grants
HL13851 and RO1 AG15466.
[17] Molecular Imaging of Enzyme Function in Lungs
By Delphine L. Chen, Jean-Christophe Richard, andDaniel P. Schuster
Introduction
A wide variety of pulmonary transport and metabolic processes are ame-nable for study by positron emission tomography (PET).1 Most PET studiesof the lungs so far have focused on measuring transport functions such aspulmonary blood flow and ventilation, as the matching of these two on a re-gional level is the main determinant of effective gas exchange. In addition,because pulmonary edema is a common and important clinical problem
33 A. M. Kates, P. Herrero, C. S. Dence, P. Soto, M. Srinivasan, D. G. Delano, A. Ehsani, and
R. J. Gropler, J. Am. Coll. Cardiol. 41, 293 (2003).34 P. F. Soto, P. Herrero, A. M. Kates, C. S. Dence, A. A. Ehsani, V. Davila-Roman, K. B.
Schechtman, and R. J. Gropler, Am. J. of Physiol. Heart Circ. Physiol. 285, H2158 (2003).35 L. R. Peterson, P. Herrero, K. B. Schechtman, S. B. Racette, A. D. Waggoner,
Z. Kisreivaware, C. S. Dence, S. Klein, J. Marsala, T. Meyer, and R. J. Gropler,
Circulation 2004 (in press).36 V. G. Davila-Roman, G. Vedula, P. Herrero, L. de las Fuentes, J. G. Rogers, D. P. Kelly,
and R. J. Gropler, J. Am. Coll. Cardiol. 40, 271 (2003).37 L. De las Fuentes, P. Herrero, L. R. Peterson, D. P. Kelly, R. J. Gropler, and V. G. Davila-
Roman, Hypertension 41, 83 (2003).
1 D. Schuster, in ‘‘Positron Emission Tomography: Principles and Practice’’ (D. Bailey, D. V.
Townsend, P. Valk, and M. Maisey, eds.), p. 465. Springer-Verlag, London, 2003.
Copyright 2004, Elsevier Inc.All rights reserved.
METHODS IN ENZYMOLOGY, VOL. 385 0076-6879/04 $35.00


