Embed Size (px)
Citation preview
Imaging Single Retrovirus Entry through AlternativeReceptor Isoforms and Intermediates of Virus-EndosomeFusionNaveen K. Jha1¤a, Olga Latinovic1, Erik Martin1, Gennadiy Novitskiy1, Mariana Marin1¤b, Kosuke
Miyauchi1¤c, John Naughton2, John A. T. Young2, Gregory B. Melikyan1¤b*
1 Institute of Human Virology and Department of Microbiology and Immunology, University of Maryland School of Medicine, Baltimore, Maryland, United States of
America, 2 Nomis Center for Immunobiology and Microbial Pathogenesis, The Salk Institute for Biological Studies, La Jolla, California, United States of America
Abstract
A large group of viruses rely on low pH to activate their fusion proteins that merge the viral envelope with anendosomal membrane, releasing the viral nucleocapsid. A critical barrier to understanding these events has been the lackof approaches to study virus-cell membrane fusion within acidic endosomes, the natural sites of virus nucleocapsidcapsid entry into the cytosol. Here we have investigated these events using the highly tractable subgroup A aviansarcoma and leukosis virus envelope glycoprotein (EnvA)-TVA receptor system. Through labeling EnvA pseudotypedviruses with a pH-sensitive fluorescent marker, we imaged their entry into mildly acidic compartments. We found thatcells expressing the transmembrane receptor (TVA950) internalized the virus much faster than those expressing the GPI-anchored receptor isoform (TVA800). Surprisingly, TVA800 did not accelerate virus uptake compared to cells lacking thereceptor. Subsequent steps of virus entry were visualized by incorporating a small viral content marker that was releasedinto the cytosol as a result of fusion. EnvA-dependent fusion with TVA800-expressing cells occurred shortly afterendocytosis and delivery into acidic endosomes, whereas fusion of viruses internalized through TVA950 was delayed. Inthe latter case, a relatively stable hemifusion-like intermediate preceded the fusion pore opening. The apparent size andstability of nascent fusion pores depended on the TVA isoforms and their expression levels, with TVA950 supportingmore robust pores and a higher efficiency of infection compared to TVA800. These results demonstrate that surfacereceptor density and the intracellular trafficking pathway used are important determinants of efficient EnvA-mediatedmembrane fusion, and suggest that early fusion intermediates play a critical role in establishing low pH-dependent virusentry from within acidic endosomes.
Citation: Jha NK, Latinovic O, Martin E, Novitskiy G, Marin M, et al. (2011) Imaging Single Retrovirus Entry through Alternative Receptor Isoforms andIntermediates of Virus-Endosome Fusion. PLoS Pathog 7(1): e1001260. doi:10.1371/journal.ppat.1001260
Editor: Michael Farzan, Harvard Medical School, United States of America
Received August 12, 2010; Accepted December 15, 2010; Published January 20, 2011
Copyright: � 2011 Jha et al. This is an open-access article distributed under the terms of the Creative Commons Attribution License, which permits unrestricteduse, distribution, and reproduction in any medium, provided the original author and source are credited.
Funding: This work has been supported by the NIH AI053668 grant to GBM, and by the Nomis Foundation and the James B. Pendleton Charitable Trust (JATY).The funders had no role in study design, data collection and analysis, decision to publish, or preparation of the manuscript.
Competing Interests: The authors have declared that no competing interests exist.
* E-mail: [email protected]
¤a Current address: Johns Hopkins University School of Medicine, Baltimore, Maryland, United States of America.¤b Current address: Division of Pediatric Infectious Diseases, Emory University Children’s Center, Atlanta, Georgia, United States of America.¤c Current address: AIDS Research Center, National Institute of Infectious Diseases, Tokyo, Japan.
Introduction
Viral fusion proteins mediate the release of nucleocapsid into
the cytoplasm by merging the viral and cellular membranes. When
activated by cellular receptors and/or by acidic pH, these proteins
undergo extensive refolding and mediate membrane fusion
(reviewed in [1,2,3]). Viruses that rely on low pH to activate their
fusion proteins are normally confined to entry through endocytic
pathways, whereas those that mediate fusion at neutral pH,
following the interactions with cellular receptors, can fuse directly
to the plasma membrane or to endocytic compartments
[4,5,6,7,8,9,10]. Mechanistic studies of virus-endosome fusion
have been hampered by inaccessibility of these cellular compart-
ments and the lack of techniques to monitor the virus-endosome
fusion in live cells. The mechanisms of low pH-induced fusion
have therefore been extensively investigated using a cell-cell fusion
model (see for example [11,12,13]).
Envelope glycoproteins of viruses entering cells through pH-
dependent endocytic pathways are capable of mediating cell-cell
fusion when expressed in the plasma membrane and exposed to
acidic pH. However, recent studies revealed that productive virus
entry occurs through interplay between the envelope glycoproteins
and cellular factors, many of which are endosome-resident
[14,15,16,17,18,19]. The efficacy and the functional outcomes of
membrane fusion in the context of cell-cell and virus-cell models
can differ [8,20,21,22]. For instance, endosome-resident factors,
such as proteolytic enzymes [21] or lipids [20], can be essential for
initiation and/or completion of the fusion process. Thus, fusion
should be investigated at the physiological virus entry site(s).
Advances in live cell imaging allow the visualization of single
virus entry and fusion in real time [8,23,24,25]. Viral fusion has
usually been visualized by incorporating relatively high amounts of
fluorescent markers into their membranes, which resulted in
fluorescence self-quenching [20,23,24,26]. Dilution of these dyes
PLoS Pathogens | www.plospathogens.org 1 January 2011 | Volume 7 | Issue 1 | e1001260
upon virus-endosome fusion is associated with considerable
increase in their fluorescence intensity, which can be readily
detected. This approach detects fusion based on the lipid mixing
activity, but not the actual release of the viral core/content, which
is a prerequisite for infection. An alternative approach involves co-
labeling the viral core and the viral membrane with different
fluorescent proteins. If nearly all viral particles contain both
markers, fusion can be detected based on the appearance of single-
labeled puncta positive for the core marker [27,28]. This approach
allowed enumeration of the fusion events in cells pre-incubated
with viruses, but not in real-time imaging experiments, perhaps
due to the slow separation of the viral core and envelope. On the
other hand, co-labeling the inner leaflet of viral membrane with
fluorescence proteins and the membrane itself with either a
lipophilic dye [8] or with tagged fusion protein [4] permitted
monitoring the dynamics of viral fusion in live cells.
We have previously developed a single virus imaging-based
assay for sensitive detection of early stages of fusion, from lipid
mixing to formation and dilation of fusion pores [8,29,30]. In
addition to a membrane dye, viruses were labeled with a content
marker that remained trapped within virions following the
proteolytic cleavage/maturation event [8,30]. This labeling
strategy provided new insights into the cellular entry site of
HIV-1 [8] and helped identify key intermediates of Avian
Sarcoma and Leukosis Virus (ASLV) fusion [29]. ASLV fusion
proceeds in two spatially and temporally distinct steps: priming by
a cognate receptor at neutral pH on the cell surface and low pH-
mediated fusion with endosomes [29,31,32,33,34]. Like other
acid-triggered viruses with relatively high pH threshold for fusion,
such as vesicular stomatitis virus and Semliki Forest Virus [35,36],
ASLV likely fuses with early endosomes [32,37]. However, unlike
many low pH-dependent viruses, the ability of ASLV to undergo
low pH-mediated fusion strictly depends on the prior priming by
cognate receptors [33]. This two-step fusion mechanism makes the
ASLV amenable for mechanistic studies of fusion with intracellular
compartments.
Another important feature of ASLV that facilitates mechanistic
studies of low pH-dependent viral entry mechanisms is that
different pathways are used by subtype A ASLV depending upon
usage of two natural isoforms of its TVA receptor [38,39,40]. The
two TVA isoforms are generated from alternatively spliced
mRNA: the transmembrane (TVA950) and the GPI-anchored
(TVA800) receptor. Both TVA isoforms support virus infection
[38,39], but their roles in virus trafficking and fusion are not fully
understood. ASLV appears to enter cells engineered to express
either TVA800 or TVA950 through distinct endocytic pathways
[33,41]. This notion is supported by the following observations: (1)
TVA800, but not TVA950, partitions into lipid rafts; (2) viruses
entering cells via TVA800 are much more stable in NH4Cl-treated
cells than those entering via TVA950, an effect that is
compromised by lipid raft disruption; (3) cells expressing the
transmembrane receptor internalize the virus more quickly but
sort it into fusion-supporting acidic compartments more slowly
than cells expressing TVA800.
We have previously immobilized ASLV Env-pseudotyped
particles on a coverslip, overlaid permissive cells on top, and forced
the virus fusion with the plasma membrane by lowering the external
pH [29]. Although somewhat artificial, this configuration facilitated
the visualization of single virus fusion at the cell surface. Here, we
visualized ASLV Env-mediated fusion at its natural entry site. Co-
labeling of the viral membrane and interior with fluorescent
markers permitted real-time detection of lipid and content transfer
into an endosomal membrane and into the cytosol, respectively.
TVA800 less efficiently supported ASLV fusion and infection than
the transmembrane TVA950 receptor. The rate of virus endocy-
tosis, and therefore the rate of fusion, was slower and the diameter of
fusion pores formed in endosomes was smaller in cells expressing the
GPI-anchored receptor. We found that the level of virus infectivity
in cells expressing alternative receptor isoforms correlated with its
ability to form robust fusion pores. Importantly, virus fusion with
endosomes progressed through a relatively long-lived hemifusion
intermediate, and pores formed by this virus often remained small
for several minutes. The slow progression through these steps could
be rate-limiting, as evidenced by the delayed viral content release
following its entry into acidic endosomes of TVA950-expressing
cells. Our results thus reveal important functional implications of
ASLV entry through alternative receptors and suggest that early
fusion intermediates play a critical role in establishing productive
infection.
Results
Production and characterization of pH-sensingfluorescent ASLV pseudoviruses
To monitor EnvA-dependent endocytosis and entry into mildly
acidic compartments, we labeled EnvA-pseudotyped HIV-1
virions with the pH-sensitive derivative of GFP, ecliptic pHluorin
(EcpH) [42], anchored to the viral membrane via the transmem-
brane domain of ICAM-1 (Figure 1A). This construct (hereafter
designated EcpH-TM) permitted sensitive detection of the pH
drop below neutrality, as the fluorescence of EcpH is strongly
diminished at mildly acidic pH [42] (Figure 1B). The EcpH signal
from individual cell-associated viruses was lost against the
background fluorescence at pH#6.2 (data not shown). Hence,
disappearance of the EcpH fluorescence in cells marks the virus
entry into compartments with luminal pH around 6.2 or lower,
which likely correspond to early endosomes [43]. In addition to
the EcpH-TM marker, the viral core was co-labeled by appending
mCherry to the C-terminus of HIV-1 Gag (referred to as Gag-
mCherry).
The mCherry construct was chosen because of the relative pH-
independence of its fluorescence [44], which enables continuous
Author Summary
Enveloped viruses are taken up into host cells after theybind to a specific receptor on the cell surface. Theseviruses are often delivered to specific compartmentsknown as endosomes which have an acid environmentthat can trigger the virus and endosome membranes tofuse, allowing virus entry into the cell interior. In spite ofextensive studies, key steps of this process are poorlyunderstood. To examine the mechanism of virus-endo-some fusion, we took advantage of a model retrovirus(ASLV). We imaged the entry of ‘‘labeled’’ ASLV into cellsusing fluorescence microscopy and found importantdifferences between ASLV entry, depending upon whetherthe virus was attached to a transmembrane receptor or toa lipid-anchored receptor. A transmembrane receptorsupported faster virus uptake followed by the formationof larger and more stable fusion pores, which wassomewhat delayed relative to ASLV entry into acidicendosomes. This could be due, in part, to a relatively long-lived hemifusion intermediate that preceded the formationof a fusion pore in cells expressing a transmembrane, butnot a lipid-anchored receptor. These findings shed light onfunctional consequences of virus entry via distinctendocytic routes and on critical fusion intermediatesleading to infection.
Retrovirus-Endosome Fusion Intermediates
PLoS Pathogens | www.plospathogens.org 2 January 2011 | Volume 7 | Issue 1 | e1001260
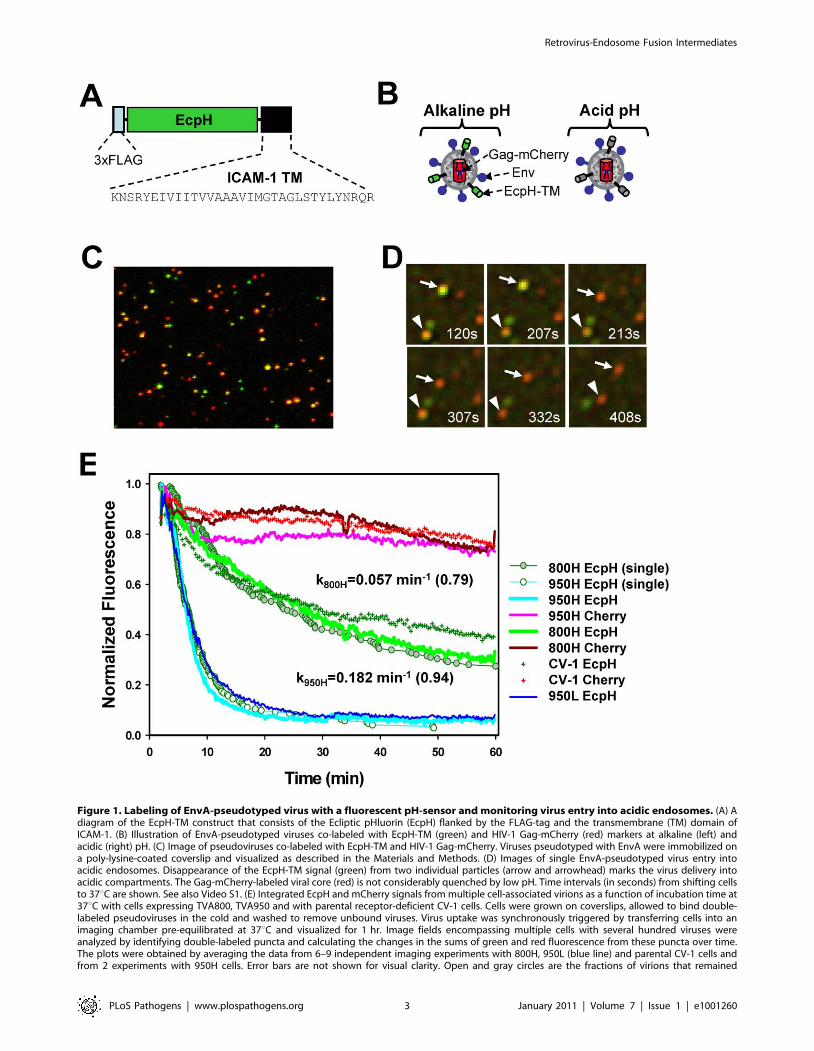
Figure 1. Labeling of EnvA-pseudotyped virus with a fluorescent pH-sensor and monitoring virus entry into acidic endosomes. (A) Adiagram of the EcpH-TM construct that consists of the Ecliptic pHluorin (EcpH) flanked by the FLAG-tag and the transmembrane (TM) domain ofICAM-1. (B) Illustration of EnvA-pseudotyped viruses co-labeled with EcpH-TM (green) and HIV-1 Gag-mCherry (red) markers at alkaline (left) andacidic (right) pH. (C) Image of pseudoviruses co-labeled with EcpH-TM and HIV-1 Gag-mCherry. Viruses pseudotyped with EnvA were immobilized ona poly-lysine-coated coverslip and visualized as described in the Materials and Methods. (D) Images of single EnvA-pseudotyped virus entry intoacidic endosomes. Disappearance of the EcpH-TM signal (green) from two individual particles (arrow and arrowhead) marks the virus delivery intoacidic compartments. The Gag-mCherry-labeled viral core (red) is not considerably quenched by low pH. Time intervals (in seconds) from shifting cellsto 37uC are shown. See also Video S1. (E) Integrated EcpH and mCherry signals from multiple cell-associated virions as a function of incubation time at37uC with cells expressing TVA800, TVA950 and with parental receptor-deficient CV-1 cells. Cells were grown on coverslips, allowed to bind double-labeled pseudoviruses in the cold and washed to remove unbound viruses. Virus uptake was synchronously triggered by transferring cells into animaging chamber pre-equilibrated at 37uC and visualized for 1 hr. Image fields encompassing multiple cells with several hundred viruses wereanalyzed by identifying double-labeled puncta and calculating the changes in the sums of green and red fluorescence from these puncta over time.The plots were obtained by averaging the data from 6–9 independent imaging experiments with 800H, 950L (blue line) and parental CV-1 cells andfrom 2 experiments with 950H cells. Error bars are not shown for visual clarity. Open and gray circles are the fractions of virions that remained
Retrovirus-Endosome Fusion Intermediates
PLoS Pathogens | www.plospathogens.org 3 January 2011 | Volume 7 | Issue 1 | e1001260
tracking of virions entering acidic compartments. In addition,
Gag-mCherry was poorly cleaved by protease upon viral
maturation (Figure S1G), and, in its unprocessed oligomeric form,
was not released from virions permeabilized with saponin (data not
shown). Although a relatively small fraction of EnvA-pseudotyped
virions underwent fusion in permissive cells (see below), the lack of
Gag-mCherry cleavage further diminished the loss of red puncta
and ensured a more steady reference signal for monitoring the
EcpH quenching. Co-expression of Gag-mCherry and EnvA with
the HIV-1 packaging vector encoding for wild-type Gag produced
pseudoviruses capable of fusion (Figure S1F) and single-round
infection (data not shown). Typically, ,50% of Gag-labeled
pseudoviruses were positive for the ICAM-1-based membrane
marker (Figure 1C).
To determine whether EnvA is incorporated into double-
labeled particles, we adhered viruses on a coverslip and stained
with an EnvA-specific monoclonal antibody (Figure S1B). More
than 80% of Gag-labeled particles appeared positive for Env,
while only ,30% appeared to contain all three markers. This
seemingly low colocalization of Gag, Env and the membrane
marker was due to a limited sensitivity of fluorescence microscopy,
which did not detect a small number of ICAM-anchored
fluorescent proteins on individual virions. In fact, virtually all
functional virions contained EcpH-TM, since more than 96% of
infectivity could be precipitated from supernatant, using anti-
FLAG antibodies (Figure S1E). EcpH-TM did not appear to
compete with Env incorporation (Figure S1C, D) or interfere with
its function, as evidenced by similar infectious titers (usually, 106–
107 IU/ml, Figure S1E) and the fusion activities (Figure S1F) of
Gag-mCherry-labeled and double-labeled virions. Together, these
results indicate that EcpH-TM did not exert detectable adverse
effect on the functionality of the EnvA-pseudotyped viruses.
EnvA pseudotyped virus is more quickly internalizedwhen associated with TVA950
In order to elucidate the EnvA-dependent entry routes and
evaluate the functional consequences of utilization of alternative
receptors, we generated CV-1 cell lines stably expressing relatively
high levels of TVA800 or TVA950 (designated 800H and 950H
cells, respectively). CV-1 cells were chosen for their flat
morphology which greatly simplified time-resolved virus imaging
(see Materials and Methods). Since, the GPI-anchored isoform is
always more abundantly expressed on the surfaces of CV-1 cells
than the transmembrane receptor (Figure S2), it was not possible
to obtain cell lines with matched surface levels of both receptors.
However, as we will demonstrate below, the higher level of
TVA800 expression does not affect the key findings of this paper.
To examine the rate of virus uptake by cells expressing alternative
receptors, we imaged entry of EcpH-TM/Gag-mCherry labeled
viruses into mildly acidic endosomes based on a sudden drop of the
EcpH fluorescence. As expected, the mCherry fluorescence
provided a relatively stable reference signal for particles tracking
(Figure 1D, E and Video S1).
Virus uptake and delivery into acidic compartments as a
function of time was evaluated by analyzing the decay of the total
EcpH signal from several hundred double-labeled particles in the
image field. The virus uptake by 950H cells was clearly much
faster than by 800H cells (Figure 1E, P,0.001). Within 15 min at
37uC, nearly 90% of virions entered acidic compartments of 950H
cells, whereas only ,30% of the EcpH signal was quenched in
cells expressing the GPI-anchored receptor. The latter cells did not
complete virus endocytosis even after 60 min of incubation.
Surprisingly, parental CV-1 cells lacking receptors internalized the
virus nearly as quickly as 800H cells (Figure 1E, green crosses and
green line, respectively). Thus, in spite of the more abundant
expression of TVA800 compared to TVA950 (Figure S2), the
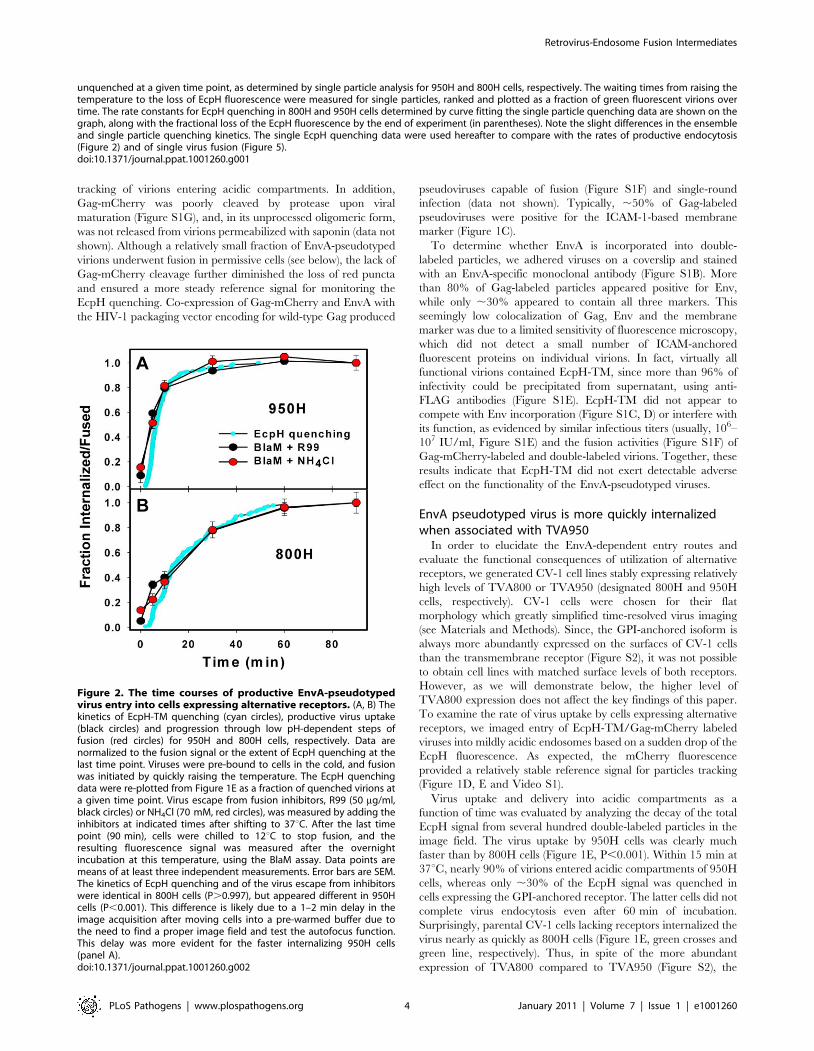
Figure 2. The time courses of productive EnvA-pseudotypedvirus entry into cells expressing alternative receptors. (A, B) Thekinetics of EcpH-TM quenching (cyan circles), productive virus uptake(black circles) and progression through low pH-dependent steps offusion (red circles) for 950H and 800H cells, respectively. Data arenormalized to the fusion signal or the extent of EcpH quenching at thelast time point. Viruses were pre-bound to cells in the cold, and fusionwas initiated by quickly raising the temperature. The EcpH quenchingdata were re-plotted from Figure 1E as a fraction of quenched virions ata given time point. Virus escape from fusion inhibitors, R99 (50 mg/ml,black circles) or NH4Cl (70 mM, red circles), was measured by adding theinhibitors at indicated times after shifting to 37uC. After the last timepoint (90 min), cells were chilled to 12uC to stop fusion, and theresulting fluorescence signal was measured after the overnightincubation at this temperature, using the BlaM assay. Data points aremeans of at least three independent measurements. Error bars are SEM.The kinetics of EcpH quenching and of the virus escape from inhibitorswere identical in 800H cells (P.0.997), but appeared different in 950Hcells (P,0.001). This difference is likely due to a 1–2 min delay in theimage acquisition after moving cells into a pre-warmed buffer due tothe need to find a proper image field and test the autofocus function.This delay was more evident for the faster internalizing 950H cells(panel A).doi:10.1371/journal.ppat.1001260.g002
unquenched at a given time point, as determined by single particle analysis for 950H and 800H cells, respectively. The waiting times from raising thetemperature to the loss of EcpH fluorescence were measured for single particles, ranked and plotted as a fraction of green fluorescent virions overtime. The rate constants for EcpH quenching in 800H and 950H cells determined by curve fitting the single particle quenching data are shown on thegraph, along with the fractional loss of the EcpH fluorescence by the end of experiment (in parentheses). Note the slight differences in the ensembleand single particle quenching kinetics. The single EcpH quenching data were used hereafter to compare with the rates of productive endocytosis(Figure 2) and of single virus fusion (Figure 5).doi:10.1371/journal.ppat.1001260.g001
Retrovirus-Endosome Fusion Intermediates
PLoS Pathogens | www.plospathogens.org 4 January 2011 | Volume 7 | Issue 1 | e1001260
lipid-anchored receptor did not accelerate EnvA pseudotyped
virus endocytosis beyond the rate of receptor-independent uptake.
The modest decrease in the mCherry fluorescence over time
(Figure 1E) was not due to the sample photobleaching (data not
shown), but was likely caused by the limited quenching in acidic
endosomes.
The EcpH quenching kinetics followed a single exponential
time course and were only marginally affected by the expression
level of either receptor (Figure 1E, blue vs. cyan line, and data not
shown). Thus, the nature of the TVA anchorage to a cell
membrane was solely responsible for the marked difference in the
rate of virus endocytosis. The rate of EnvA-mediated entry into
acidic endosomes was also verified by examining individual viral
particles. The time intervals between placing the cells into a pre-
warmed buffer and individual EcpH quenching events (e.g.,
Figure 1D) were measured and plotted as cumulative distributions
(Figure 1E, circles). Single virus entry into acidic compartments
followed the same time course as the ensemble EcpH quenching of
multiple viruses in the image field. To conclude, the transmem-
brane-anchored TVA allowed for fast virus uptake and delivery
into acidic compartments, while the GPI-anchored receptor did
not accelerate virus entry into acidic endosomes compared to that
in receptor-deficient, parental CV-1 cells.
Productive EnvA-dependent virus entry is faster viaTVA950
The EcpH quenching assay reports the EnvA-mediated virus
delivery into acidic compartments, but does not directly measure
the step of virus engulfment by an endosome. Also, EcpH
quenching measures the bulk uptake, irrespective of whether or
not it leads to EnvA-driven fusion with an endosome. To assess the
rates of productive virus internalization and activation at low pH,
we employed a virus-cell fusion assay, which measures the transfer
of the virus-incorporated b-lactamase (BlaM) into the cytosol [45].
First, the kinetics of productive endocytosis was determined from
the time course of the virus escape from the inhibitory peptide,
R99. This peptide derived from the C-terminal heptad repeat
region of the EnvA ectodomain is thought to block fusion by
binding to a stable intermediate conformation of Env and
preventing its folding into a final 6-helix bundle structure
[46,47]. Since the virus is incapable of fusing with the plasma
membrane at neutral pH [29,33], protection from R99 must occur
due to its entry into endosomal compartments where it is no longer
accessible to the peptide. By contrast, surface-accessible viruses
that engaged receptors and thus have R99 binding sites on Env
exposed would bind the peptide and lose the ability to fuse with
endosome following internalization.
We pre-bound the viruses to cells in the cold and initiated their
uptake and fusion by quickly raising the temperature. A fully-
inhibitory concentration of R99 was added at indicated incubation
times to block fusion of viruses remaining on the cell surface.
Similar to the EcpH quenching kinetics (Figure 1E), viruses
entering via TVA950 were protected from R99 faster than those
utilizing the GPI-anchored receptor (Figure 2A, B). Next, EnvA
activation in acidic compartments was examined through raising
endosomal pH (adding NH4Cl) at varied times of virus-cell
incubation. The extent of fusion following the addition of NH4Cl
is a measure of progression beyond the low pH-dependent step(s)
of virus entry. Irrespective of the receptor isoform, the virus
acquired resistance to NH4Cl shortly after virus uptake, as
evidenced by the identical kinetics of virus escape from R99 and
NH4Cl (Figure 2). In other words, the time required for the
internalized viruses to enter acidic endosomes and to undergo low
pH-dependent conformational changes leading to fusion was too
short to be resolved by this functional assay.
For a given cell line, the fraction of EnvA pseudotyped viruses
that lost their EcpH fluorescence was close to the fraction of virus
protected from fusion inhibitors (Figure 2). Thus, EcpH quenching
provides a reasonable estimate for the productive uptake and
activation of these pseudoviruses. The above results imply that,
once engulfed by an endosome, the virus quickly enters acidic
compartments and undergoes low pH-dependent fusion activation
in both 950H and 800H cells. However, both bulk and productive
virus endocytosis is markedly faster in cells expressing the
transmembrane receptor compared to the GPI-anchored isoform.
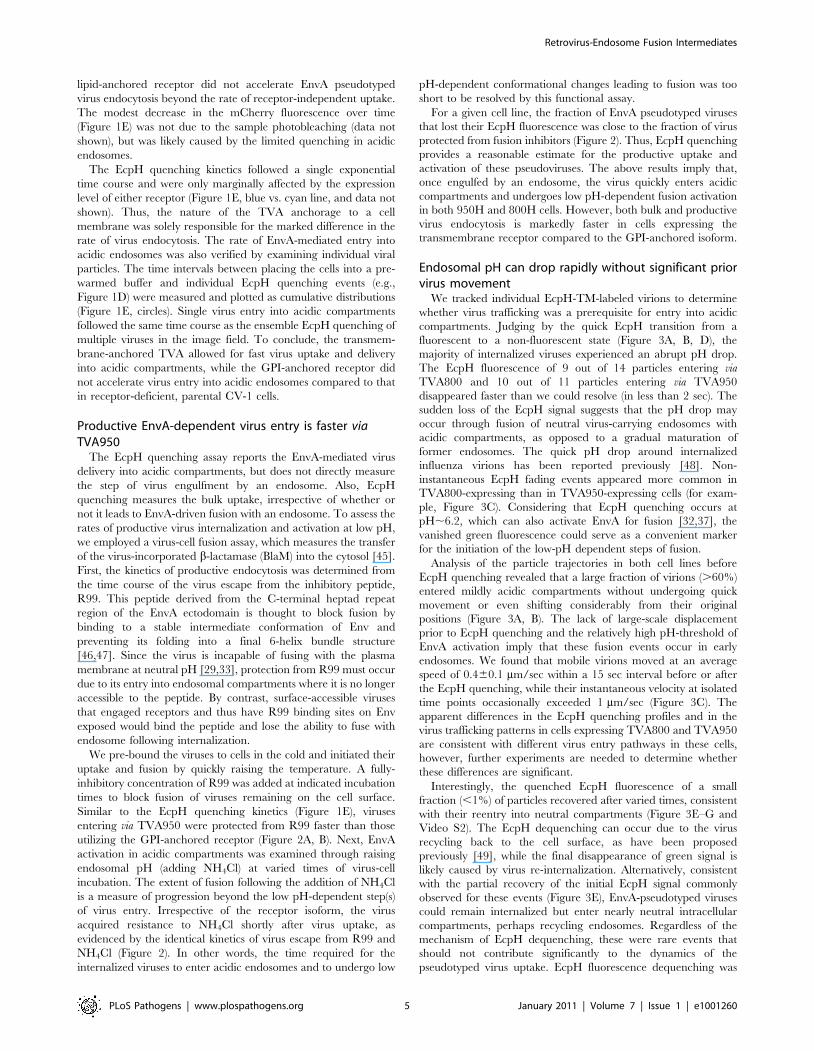
Endosomal pH can drop rapidly without significant priorvirus movement
We tracked individual EcpH-TM-labeled virions to determine
whether virus trafficking was a prerequisite for entry into acidic
compartments. Judging by the quick EcpH transition from a
fluorescent to a non-fluorescent state (Figure 3A, B, D), the
majority of internalized viruses experienced an abrupt pH drop.
The EcpH fluorescence of 9 out of 14 particles entering via
TVA800 and 10 out of 11 particles entering via TVA950
disappeared faster than we could resolve (in less than 2 sec). The
sudden loss of the EcpH signal suggests that the pH drop may
occur through fusion of neutral virus-carrying endosomes with
acidic compartments, as opposed to a gradual maturation of
former endosomes. The quick pH drop around internalized
influenza virions has been reported previously [48]. Non-
instantaneous EcpH fading events appeared more common in
TVA800-expressing than in TVA950-expressing cells (for exam-
ple, Figure 3C). Considering that EcpH quenching occurs at
pH,6.2, which can also activate EnvA for fusion [32,37], the
vanished green fluorescence could serve as a convenient marker
for the initiation of the low-pH dependent steps of fusion.
Analysis of the particle trajectories in both cell lines before
EcpH quenching revealed that a large fraction of virions (.60%)
entered mildly acidic compartments without undergoing quick
movement or even shifting considerably from their original
positions (Figure 3A, B). The lack of large-scale displacement
prior to EcpH quenching and the relatively high pH-threshold of
EnvA activation imply that these fusion events occur in early
endosomes. We found that mobile virions moved at an average
speed of 0.460.1 mm/sec within a 15 sec interval before or after
the EcpH quenching, while their instantaneous velocity at isolated
time points occasionally exceeded 1 mm/sec (Figure 3C). The
apparent differences in the EcpH quenching profiles and in the
virus trafficking patterns in cells expressing TVA800 and TVA950
are consistent with different virus entry pathways in these cells,
however, further experiments are needed to determine whether
these differences are significant.
Interestingly, the quenched EcpH fluorescence of a small
fraction (,1%) of particles recovered after varied times, consistent
with their reentry into neutral compartments (Figure 3E–G and
Video S2). The EcpH dequenching can occur due to the virus
recycling back to the cell surface, as have been proposed
previously [49], while the final disappearance of green signal is
likely caused by virus re-internalization. Alternatively, consistent
with the partial recovery of the initial EcpH signal commonly
observed for these events (Figure 3E), EnvA-pseudotyped viruses
could remain internalized but enter nearly neutral intracellular
compartments, perhaps recycling endosomes. Regardless of the
mechanism of EcpH dequenching, these were rare events that
should not contribute significantly to the dynamics of the
pseudotyped virus uptake. EcpH fluorescence dequenching was
Retrovirus-Endosome Fusion Intermediates
PLoS Pathogens | www.plospathogens.org 5 January 2011 | Volume 7 | Issue 1 | e1001260
Retrovirus-Endosome Fusion Intermediates
PLoS Pathogens | www.plospathogens.org 6 January 2011 | Volume 7 | Issue 1 | e1001260
transient, as the green signal vanished once again, while the
mCherry fluorescence remained steady. Our data demonstrate the
utility of EcpH labeling for studies of viral uptake and recycling in
cells.
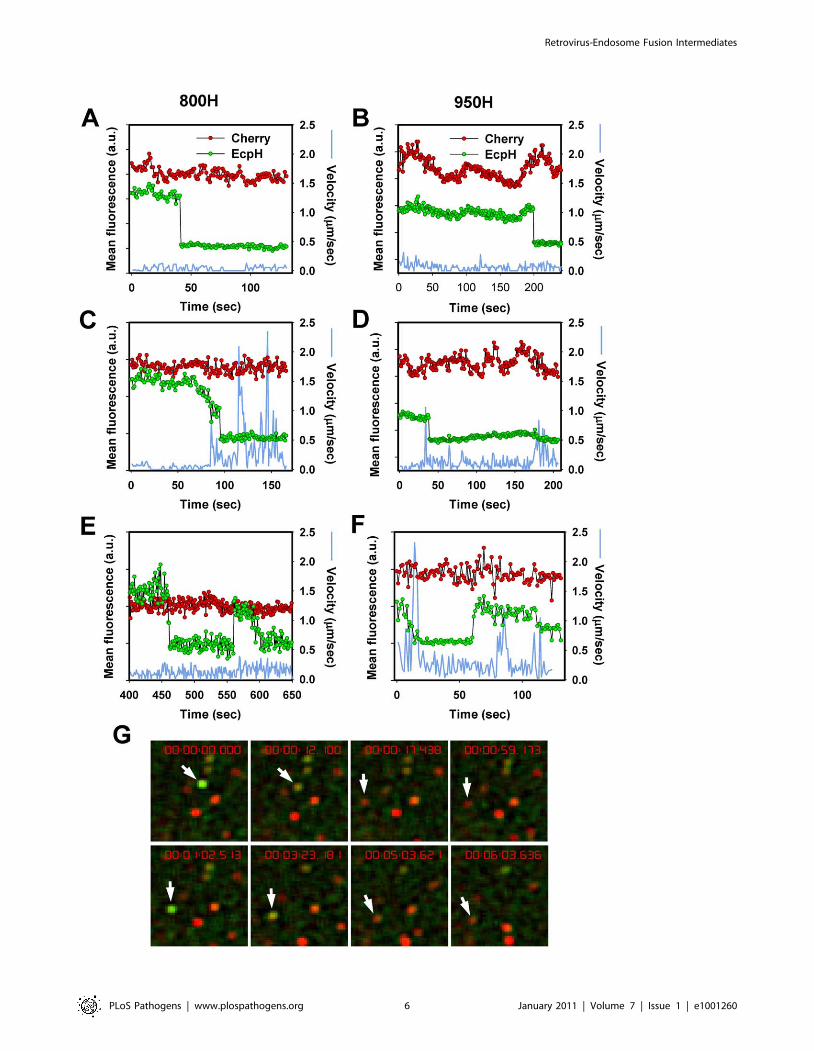
Detection of single EnvA-pseudotyped virus fusion withendosomes
To measure single virus particle fusion with endosomes, we
employed the virus labeling strategy used previously to visualize
individual HIV-1 entry events [8] and EnvA-mediated fusion with
the plasma membrane at low pH [29]. Pseudoviruses bearing
ASLV Env and the Murine Leukemia Virus (MLV) core labeled
with Gag-eGFP were produced and their membranes were co-
labeled with DiD (a lipophilic dye emitting in far red). The MLV
Gag-eGFP was chosen because, unlike the HIV-1 Gag-mCherry
used for virus uptake experiments above, this precursor is cleaved
by the viral protease, yielding the nucleocapsid-eGFP fragment
(NC-eGFP) [30]. This fluorescent fragment becomes loosely
trapped within the viral particle and is readily released from
virions upon permeabilization with saponin (see below and [30]).
The NC-eGFP release thus marks the formation of a relatively
small fusion pore between viruses and endosomes, as evidenced by
disappearance of the green signal due to its dilution in the cytosol
(Figure 4A and Video S3) [8]. In contrast, DiD redistribution into
an endosomal membrane results in a limited dilution of this dye
and thus does not change its punctuate appearance [8].
As expected, the viral eGFP signal remained stationary when
imaging experiments were carried out in the presence of NH4Cl
(Figure 4B) or BafA1 (data not shown), which are known to block
ASLV fusion through neutralizing the endosomal pH [31,33].
However, virions were still observed to lose eGFP in the presence
of fully inhibitory concentrations of R99 peptide (Figure 4B, open
bars). Since even lower R99 concentrations fully blocked virus-cell
fusion measured by the BlaM assay (Figure S1F), it is unlikely that
the loss of green fluorescence was due to incomplete inhibition of
fusion by this peptide. We reasoned that these false fusion events
were likely caused by the low pH-induced quenching of NC-eGFP
in virions that failed to fuse with early endosomes and eventually
entered more acidic compartments. Even though the eGFP
fluorescence is less pH-dependent than that of EcpH (pKa 6.0
vs. 7.0, respectively [42,44]), the signal from virions with
compromised membrane integrity should be markedly reduced
at pH 5.0 typical for late endosomes (e.g., [43]).
To distinguish between false positive and true fusion events, we
compared the rates of eGFP decay in the presence and in the
absence of R99. This analysis revealed that the apparent loss of
fluorescence occurred much more slowly in the presence of the
inhibitory peptide (Figure 4C). Moreover, the eGFP decay under
these fusion-blocking conditions was often incomplete (data not
shown). This finding supported the notion that slow fluorescence
decay was caused by low pH-dependent eGFP quenching in
viruses with compromised membrane integrity. By categorizing
the eGFP vanishing events into ‘‘fast’’ and ‘‘slow’’, lasting longer
than 5 min (Figure 4C), we found that, normally, the overwhelm-
ing majority of these events were fast (Figure 4B, cyan bars). This
phenotype was reversed in the presence of R99: nearly all detected
fluorescence decay events were slow. Consistent with the virus
trafficking to late endosomes in the presence of R99, the ‘‘slow’’
eGFP decay events tended to occur after a longer incubation time
at 37uC compared to ‘‘fast’’ events (data not shown). We therefore
limited the imaging experiments to 35–40 min in order to further
reduce the occurrence of false-positive fusion events. Thus, by
disregarding the slow eGFP decay events and events occurring late
after the initiation of pseudotyped virus uptake, one could be
reasonably confident that eGFP disappearance marks EnvA-
driven virus-endosome fusion. Based on our data, the estimated
likelihood of misinterpreting an eGFP quenching event as true
fusion was less than 8%.
We asked if the relatively high incidence rate of eGFP
quenching in the presence of a fusion inhibitor resulted from
EnvA-mediated destabilization of the viral membrane, following
its activation by receptors and exposure to low pH. Increases in
viral membrane permeability in the course of fusion have been
previously observed in [29]. To address this possibility, viruses
were immobilized on a coverslip and either pre-treated with
soluble TVA ectodomain (sTVA) or left untreated. Final
conformational changes in viral Env were triggered by a brief
exposure to a membrane-impermeant acidic MES buffer. Since
the eGFP fluorescence of sTVA-treated pseudoviruses was not
significantly reduced by an acidic buffer (Figure S3), we concluded
that the integrity of viral membrane was not compromised by the
above treatment. Note, however, that these results do not rule out
the possibility that virus permeabilization requires prolonged
activation of Env with receptor and/or the presence of a target
membrane.
EnvA-mediated fusion is more rapid and efficient inTVA950-expressing cells
We tracked single viruses and analyzed the extent and the rate
of their fusion in cells expressing alternative receptors, using the
above ‘‘time of eGFP decay’’ criterion to discern true fusion from
the eGFP quenching by low pH. Similar to the EcpH quenching
dynamics (Figure 3), single viruses exhibited diverse movement
patterns prior to fusion, ranging from little or no displacement to
fast and often directional movement (Figure 5A, B). These
movement patterns were observed irrespective of the receptor
isotype, but particles trafficked by TVA800 appeared to undergo
more sustained fast movement prior to fusion than those
internalized via TVA950 (data not shown). A more detailed
analysis of pseudovirus trafficking via alternative receptors is
beyond the scope of the current paper which is instead focused on
the endosomal fusion events mediated by these receptors.
The efficiency of virus fusion was determined by normalizing
the number of individual fusion events in each experiment to the
number of cell-bound double-labeled virions at the onset of image
acquisition. This analysis showed that 1662% (n = 9 independent
experiments) of viruses fused with 950H cells, 461% (n = 7) with
800H cells and 662% (n = 4) with cells expressing a lower level of
Figure 3. EcpH quenching patterns for individual EnvA-pseudotyped virus particles. Changes in fluorescence intensities of single virionsentering 800H (A, C, E) and 950H (B, D, F) cells are shown. Single particles were tracked, using the relatively stable mCherry signal (red), and the meanfluorescence intensities of both EcpH (green) and mCherry were plotted. The instantaneous velocities of particles are shown by blue lines. (E, F)Examples of possible pseudovirus recycling events manifested by the consecutive quenching and dequenching of the EcpH fluorescence. Thetransient recovery of green signal likely occurs due to recycling to the cell surface or as a result of re-entry of into pH-neutral compartments. (G)Images of the transient EcpH dequenching event shown in panel F. To aid clarity, only the time interval encompassing the reversible dequenchingevent is represented in F and G, and an arbitrary chosen time point preceding the first EcpH decay was set to zero. See also the corresponding VideoS2.doi:10.1371/journal.ppat.1001260.g003
Retrovirus-Endosome Fusion Intermediates
PLoS Pathogens | www.plospathogens.org 7 January 2011 | Volume 7 | Issue 1 | e1001260
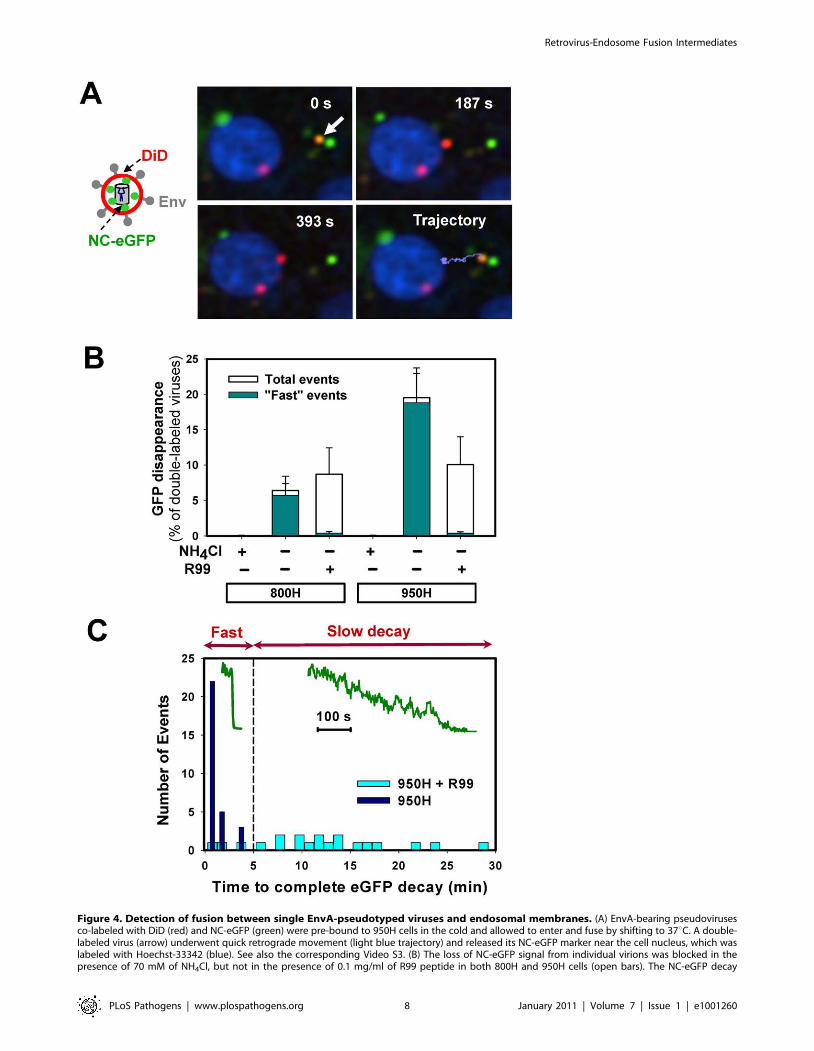
Figure 4. Detection of fusion between single EnvA-pseudotyped viruses and endosomal membranes. (A) EnvA-bearing pseudovirusesco-labeled with DiD (red) and NC-eGFP (green) were pre-bound to 950H cells in the cold and allowed to enter and fuse by shifting to 37uC. A double-labeled virus (arrow) underwent quick retrograde movement (light blue trajectory) and released its NC-eGFP marker near the cell nucleus, which waslabeled with Hoechst-33342 (blue). See also the corresponding Video S3. (B) The loss of NC-eGFP signal from individual virions was blocked in thepresence of 70 mM of NH4Cl, but not in the presence of 0.1 mg/ml of R99 peptide in both 800H and 950H cells (open bars). The NC-eGFP decay
Retrovirus-Endosome Fusion Intermediates
PLoS Pathogens | www.plospathogens.org 8 January 2011 | Volume 7 | Issue 1 | e1001260
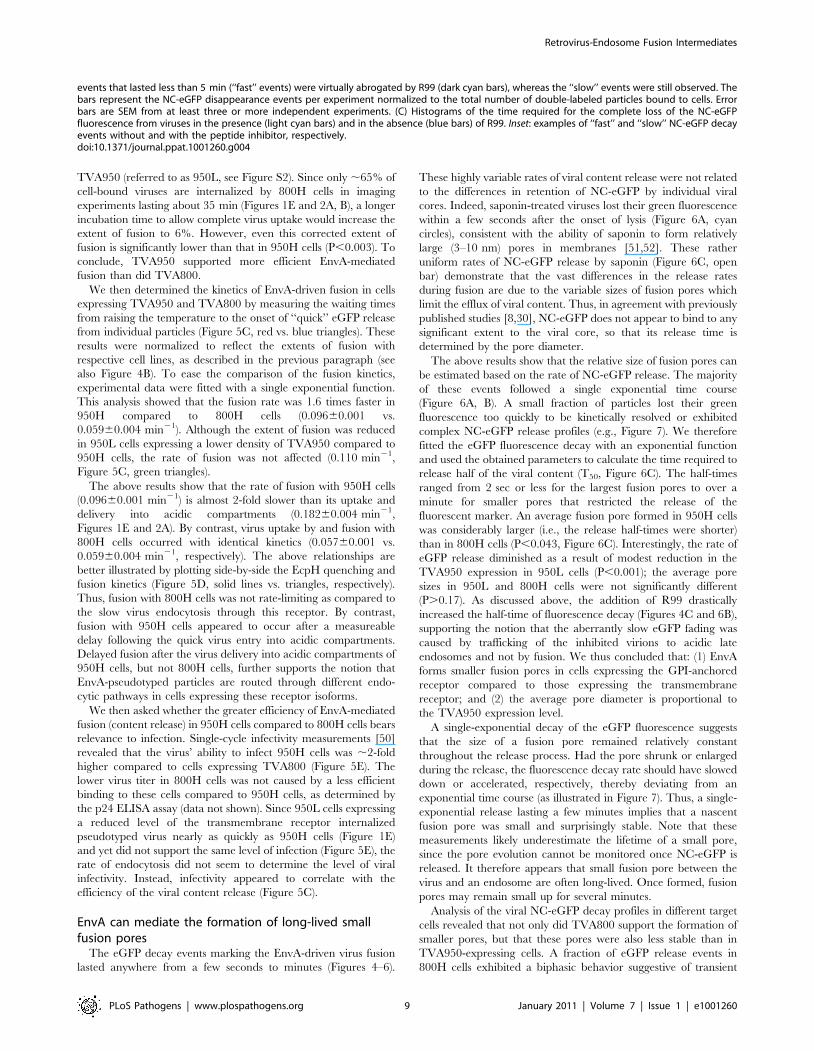
TVA950 (referred to as 950L, see Figure S2). Since only ,65% of
cell-bound viruses are internalized by 800H cells in imaging
experiments lasting about 35 min (Figures 1E and 2A, B), a longer
incubation time to allow complete virus uptake would increase the
extent of fusion to 6%. However, even this corrected extent of
fusion is significantly lower than that in 950H cells (P,0.003). To
conclude, TVA950 supported more efficient EnvA-mediated
fusion than did TVA800.
We then determined the kinetics of EnvA-driven fusion in cells
expressing TVA950 and TVA800 by measuring the waiting times
from raising the temperature to the onset of ‘‘quick’’ eGFP release
from individual particles (Figure 5C, red vs. blue triangles). These
results were normalized to reflect the extents of fusion with
respective cell lines, as described in the previous paragraph (see
also Figure 4B). To ease the comparison of the fusion kinetics,
experimental data were fitted with a single exponential function.
This analysis showed that the fusion rate was 1.6 times faster in
950H compared to 800H cells (0.09660.001 vs.
0.05960.004 min21). Although the extent of fusion was reduced
in 950L cells expressing a lower density of TVA950 compared to
950H cells, the rate of fusion was not affected (0.110 min21,
Figure 5C, green triangles).
The above results show that the rate of fusion with 950H cells
(0.09660.001 min21) is almost 2-fold slower than its uptake and
delivery into acidic compartments (0.18260.004 min21,
Figures 1E and 2A). By contrast, virus uptake by and fusion with
800H cells occurred with identical kinetics (0.05760.001 vs.
0.05960.004 min21, respectively). The above relationships are
better illustrated by plotting side-by-side the EcpH quenching and
fusion kinetics (Figure 5D, solid lines vs. triangles, respectively).
Thus, fusion with 800H cells was not rate-limiting as compared to
the slow virus endocytosis through this receptor. By contrast,
fusion with 950H cells appeared to occur after a measureable
delay following the quick virus entry into acidic compartments.
Delayed fusion after the virus delivery into acidic compartments of
950H cells, but not 800H cells, further supports the notion that
EnvA-pseudotyped particles are routed through different endo-
cytic pathways in cells expressing these receptor isoforms.
We then asked whether the greater efficiency of EnvA-mediated
fusion (content release) in 950H cells compared to 800H cells bears
relevance to infection. Single-cycle infectivity measurements [50]
revealed that the virus’ ability to infect 950H cells was ,2-fold
higher compared to cells expressing TVA800 (Figure 5E). The
lower virus titer in 800H cells was not caused by a less efficient
binding to these cells compared to 950H cells, as determined by
the p24 ELISA assay (data not shown). Since 950L cells expressing
a reduced level of the transmembrane receptor internalized
pseudotyped virus nearly as quickly as 950H cells (Figure 1E)
and yet did not support the same level of infection (Figure 5E), the
rate of endocytosis did not seem to determine the level of viral
infectivity. Instead, infectivity appeared to correlate with the
efficiency of the viral content release (Figure 5C).
EnvA can mediate the formation of long-lived smallfusion pores
The eGFP decay events marking the EnvA-driven virus fusion
lasted anywhere from a few seconds to minutes (Figures 4–6).
These highly variable rates of viral content release were not related
to the differences in retention of NC-eGFP by individual viral
cores. Indeed, saponin-treated viruses lost their green fluorescence
within a few seconds after the onset of lysis (Figure 6A, cyan
circles), consistent with the ability of saponin to form relatively
large (3–10 nm) pores in membranes [51,52]. These rather
uniform rates of NC-eGFP release by saponin (Figure 6C, open
bar) demonstrate that the vast differences in the release rates
during fusion are due to the variable sizes of fusion pores which
limit the efflux of viral content. Thus, in agreement with previously
published studies [8,30], NC-eGFP does not appear to bind to any
significant extent to the viral core, so that its release time is
determined by the pore diameter.
The above results show that the relative size of fusion pores can
be estimated based on the rate of NC-eGFP release. The majority
of these events followed a single exponential time course
(Figure 6A, B). A small fraction of particles lost their green
fluorescence too quickly to be kinetically resolved or exhibited
complex NC-eGFP release profiles (e.g., Figure 7). We therefore
fitted the eGFP fluorescence decay with an exponential function
and used the obtained parameters to calculate the time required to
release half of the viral content (T50, Figure 6C). The half-times
ranged from 2 sec or less for the largest fusion pores to over a
minute for smaller pores that restricted the release of the
fluorescent marker. An average fusion pore formed in 950H cells
was considerably larger (i.e., the release half-times were shorter)
than in 800H cells (P,0.043, Figure 6C). Interestingly, the rate of
eGFP release diminished as a result of modest reduction in the
TVA950 expression in 950L cells (P,0.001); the average pore
sizes in 950L and 800H cells were not significantly different
(P.0.17). As discussed above, the addition of R99 drastically
increased the half-time of fluorescence decay (Figures 4C and 6B),
supporting the notion that the aberrantly slow eGFP fading was
caused by trafficking of the inhibited virions to acidic late
endosomes and not by fusion. We thus concluded that: (1) EnvA
forms smaller fusion pores in cells expressing the GPI-anchored
receptor compared to those expressing the transmembrane
receptor; and (2) the average pore diameter is proportional to
the TVA950 expression level.
A single-exponential decay of the eGFP fluorescence suggests
that the size of a fusion pore remained relatively constant
throughout the release process. Had the pore shrunk or enlarged
during the release, the fluorescence decay rate should have slowed
down or accelerated, respectively, thereby deviating from an
exponential time course (as illustrated in Figure 7). Thus, a single-
exponential release lasting a few minutes implies that a nascent
fusion pore was small and surprisingly stable. Note that these
measurements likely underestimate the lifetime of a small pore,
since the pore evolution cannot be monitored once NC-eGFP is
released. It therefore appears that small fusion pore between the
virus and an endosome are often long-lived. Once formed, fusion
pores may remain small up for several minutes.
Analysis of the viral NC-eGFP decay profiles in different target
cells revealed that not only did TVA800 support the formation of
smaller pores, but that these pores were also less stable than in
TVA950-expressing cells. A fraction of eGFP release events in
800H cells exhibited a biphasic behavior suggestive of transient
events that lasted less than 5 min (‘‘fast’’ events) were virtually abrogated by R99 (dark cyan bars), whereas the ‘‘slow’’ events were still observed. Thebars represent the NC-eGFP disappearance events per experiment normalized to the total number of double-labeled particles bound to cells. Errorbars are SEM from at least three or more independent experiments. (C) Histograms of the time required for the complete loss of the NC-eGFPfluorescence from viruses in the presence (light cyan bars) and in the absence (blue bars) of R99. Inset: examples of ‘‘fast’’ and ‘‘slow’’ NC-eGFP decayevents without and with the peptide inhibitor, respectively.doi:10.1371/journal.ppat.1001260.g004
Retrovirus-Endosome Fusion Intermediates
PLoS Pathogens | www.plospathogens.org 9 January 2011 | Volume 7 | Issue 1 | e1001260
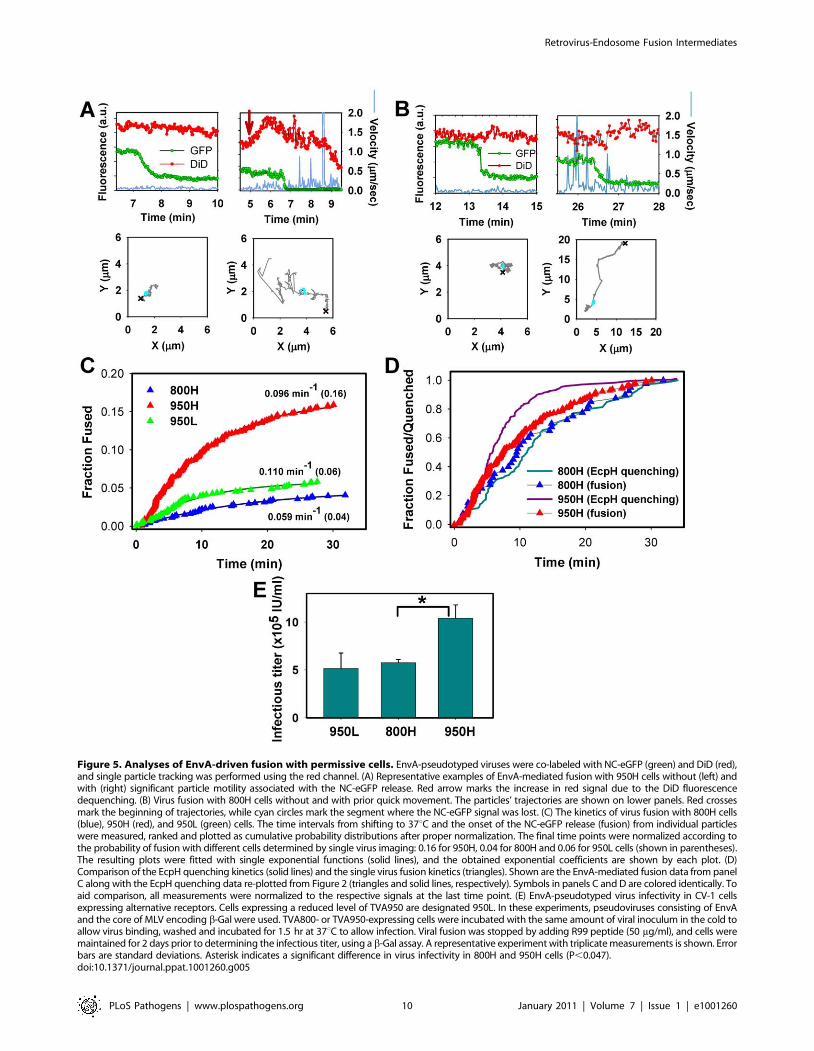
Figure 5. Analyses of EnvA-driven fusion with permissive cells. EnvA-pseudotyped viruses were co-labeled with NC-eGFP (green) and DiD (red),and single particle tracking was performed using the red channel. (A) Representative examples of EnvA-mediated fusion with 950H cells without (left) andwith (right) significant particle motility associated with the NC-eGFP release. Red arrow marks the increase in red signal due to the DiD fluorescencedequenching. (B) Virus fusion with 800H cells without and with prior quick movement. The particles’ trajectories are shown on lower panels. Red crossesmark the beginning of trajectories, while cyan circles mark the segment where the NC-eGFP signal was lost. (C) The kinetics of virus fusion with 800H cells(blue), 950H (red), and 950L (green) cells. The time intervals from shifting to 37uC and the onset of the NC-eGFP release (fusion) from individual particleswere measured, ranked and plotted as cumulative probability distributions after proper normalization. The final time points were normalized according tothe probability of fusion with different cells determined by single virus imaging: 0.16 for 950H, 0.04 for 800H and 0.06 for 950L cells (shown in parentheses).The resulting plots were fitted with single exponential functions (solid lines), and the obtained exponential coefficients are shown by each plot. (D)Comparison of the EcpH quenching kinetics (solid lines) and the single virus fusion kinetics (triangles). Shown are the EnvA-mediated fusion data from panelC along with the EcpH quenching data re-plotted from Figure 2 (triangles and solid lines, respectively). Symbols in panels C and D are colored identically. Toaid comparison, all measurements were normalized to the respective signals at the last time point. (E) EnvA-pseudotyped virus infectivity in CV-1 cellsexpressing alternative receptors. Cells expressing a reduced level of TVA950 are designated 950L. In these experiments, pseudoviruses consisting of EnvAand the core of MLV encoding b-Gal were used. TVA800- or TVA950-expressing cells were incubated with the same amount of viral inoculum in the cold toallow virus binding, washed and incubated for 1.5 hr at 37uC to allow infection. Viral fusion was stopped by adding R99 peptide (50 mg/ml), and cells weremaintained for 2 days prior to determining the infectious titer, using a b-Gal assay. A representative experiment with triplicate measurements is shown. Errorbars are standard deviations. Asterisk indicates a significant difference in virus infectivity in 800H and 950H cells (P,0.047).doi:10.1371/journal.ppat.1001260.g005
Retrovirus-Endosome Fusion Intermediates
PLoS Pathogens | www.plospathogens.org 10 January 2011 | Volume 7 | Issue 1 | e1001260
Figure 6. Analysis of the rate of NC-eGFP release from single viruses fusing with endosomes. (A) The NC-eGFP release fromrepresentative EnvA-pseudotyped virus particles upon treatment with 0.1 mg/ml saponin (cyan circles) and as a result of fusion with a 950H cell(green circles). Exponential fits (solid black lines) of the decaying green fluorescence and the obtained decay rates are shown. (B) Similar to panel A,
Retrovirus-Endosome Fusion Intermediates
PLoS Pathogens | www.plospathogens.org 11 January 2011 | Volume 7 | Issue 1 | e1001260
closing and reopening of a pore (Figure 7A, B). This phenomenon
is referred to as pore flicker [53]. The cessation of NC-eGFP
release after the first drop in fluorescence corresponds to closure or
shrinkage of pores to sizes that do not permit the passage of this
marker, while resumed release marks the pore reopening. Of
course the NC-eGFP efflux from virions does not differentiate
between the formation of a single and multiple fusion pores. It is
therefore possible that the resumed fluorescence decay is not due
to re-opening of the same pore, but rather due to the formation of
a new one. We consider the possibility of multiple pore formation
for a single retroviral particle less likely because these viruses
incorporated relatively few fusion proteins and fuse with low
probability [29].
Transient fusion events were also observed in cells expressing a
lower density of TVA950 (Figure 7C), albeit less frequently than in
800H cells. To better illustrate the dynamic nature of fusion pores
formed by ASLV Env, we calculated their relative permeability
(Figure 7, blue lines) based on the eGFP decay profile, as described
in [54]. EnvA-driven fusion pores formed in 800H and, less
frequently, in 950L cells clearly opened and closed transiently
prior to releasing the entire viral content. Collectively, the above
results imply that TVA800 not only failed to quickly deliver the
virus into acidic endosomes, but also did not support efficient
fusion. These findings are especially striking considering that
TVA800 was over-expressed relative to TVA950.
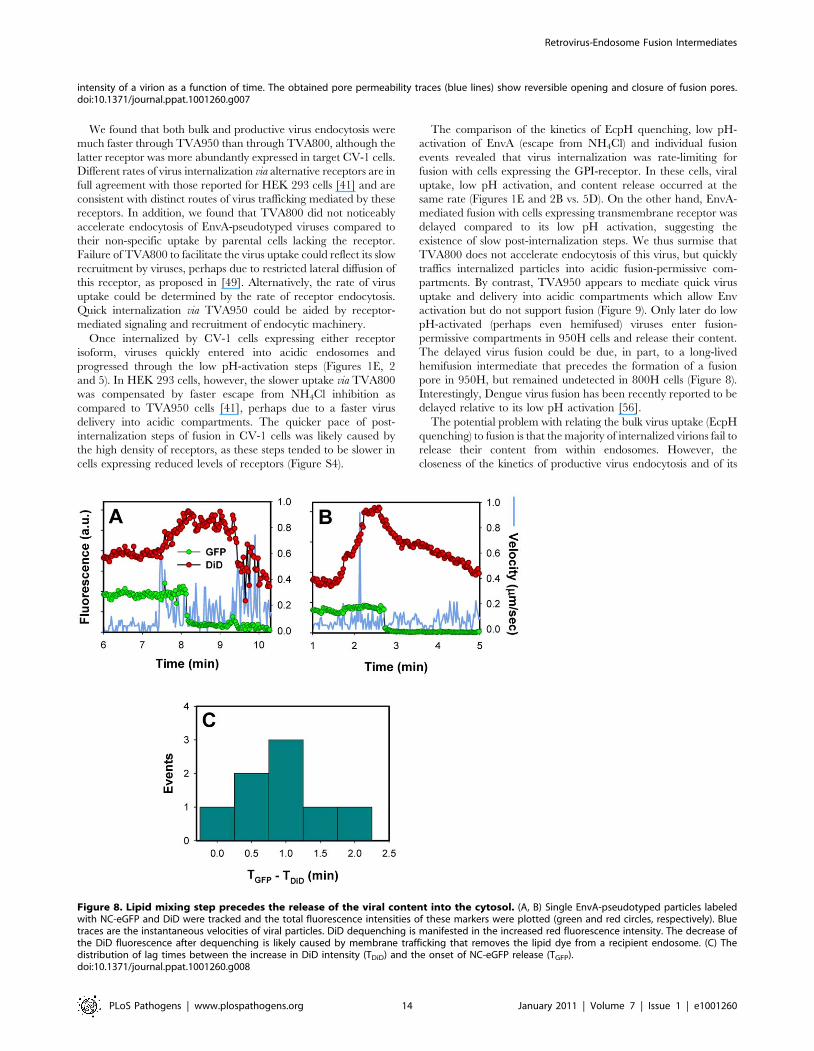
EnvA-driven fusion is delayed relative to lipid mixingVirus-endosome fusion has been visualized by incorporating
relatively high, self-quenching concentrations of a lipophilic dye
into viruses by direct injection into viral suspension and following
individual dequenching events [20,23,24,26]. The virus labeling
strategy employed in this work was based on labeling the virus
producing cells (see Materials and Methods) with little or no
control over the amount of DiD incorporated into the viral
membrane. Nevertheless, we did detect a marked increase of the
DiD signal for a fraction of pseudoviruses that incorporated a
greater amount of this dye (Figure. 5A, red arrow, and Figure 8A,
B).
DiD dequenching allowed, for the first time, the distinction
between lipid and content mixing steps of virus fusion with
endosomes. DiD transfer into an endosomal membrane showed
that fusion had reached at least a hemifusion stage, which is
operationally defined as lipid mixing without content transfer [55]
(see Figure 9 below). It is possible, however, that this lipid transfer
occurs through a nascent fusion pore that is too small to allow the
passage of NC-eGFP; subsequent dilation of such small pore
would lead to detectable content release. Analysis of DiD
dequenching showed that these events always preceded the eGFP
fluorescence decay and that the average lag time between lipid and
content transfer was around 1 min (Figure 8C). This result
demonstrates the existence of a long-lived fusion intermediate
upstream of formation of detectable pores. If DiD redistribution
that precedes the NC-eGFP release occurs in the absence of pore
formation, our finding would support the existence of relatively
stable hemifusion intermediate en route to fusion.
Interestingly, for the same batch of labeled virus, DiD
dequenching was almost exclusively observed in cells expressing
a high level of TVA950, but not in 800H or 950L cells. It is
possible that the lack of DiD dequenching in 800H cells was
simply due to slow lipid transfer between the virus and a recipient
endosome. In this case, the increase in the overall DiD
fluorescence could be prevented/masked by its concomitant
removal from a recipient endosome through membrane traffick-
ing. The pronounced decrease in the DiD signal that follows its
dequenching (Figure 8) supports the notion that a recipient
endosome loses a large fraction of this marker within a few
minutes. It thus appears that the architecture of pre-fusion sites
formed by EnvA in cells expressing alternative receptors could be
different with respect to their permissiveness for redistribution of a
lipophilic marker.
In summary, by monitoring the transfer of membrane and
content markers during single EnvA-pseudotyped virus-endosome
fusion, we were able to identify a long-lived hemifusion-like
intermediate in 950H cells. Small and surprisingly stable fusion
pores could represent another intermediate of ASLV fusion,
however, we cannot rule out the possibility that these pores never
fully dilate and thus do not lead to productive infection. The
surprising longevity of these small pores in spite of high levels of
receptor expression suggests that these steps could be rate-limiting
for ASLV entry, in agreement with the slower rate of fusion
compared to virus activation in acidic endosomes of 950H cells
(Figure 5). The rather steep dependence of the average size and
stability of fusion pores on the surface density of TVA950 indicates
that, in natural target cells expressing lower levels of both
receptors, progression through fusion intermediates could be even
slower.
Discussion
In this study we used a model retroviral Env-receptor system to
dissect the intermediate steps of virus entry and fusion with
endosomes. The requirement for EnvA priming by cognate
receptors on the cell surface followed by low pH-dependent fusion
with endosomes facilitates the identification of critical intermedi-
ates of ASLV entry. Furthermore, the ability of the subgroup A
virus to utilize two natural receptor isoforms differing only in their
membrane anchors permitted the comparison of distinct entry
pathways. As discussed below, the results of this paper have broad
implications for the mechanisms of virus entry through endocy-
tosis. Our findings reveal that receptor density and endosomal
trafficking pathways could play critical roles in the virus’ ability to
form functional fusion pores and, therefore, to establish productive
infection.
First, the time course of receptor-mediated endocytosis was
determined by adding the inhibitory peptide R99 which targets
the late step of fusion. Second, delivery of internalized pseudo-
viruses into mildly acidic compartments was monitored, using
particles tagged with the pH-sensitive GFP variant, EcpH. Third,
the progression of fusion beyond the low pH-dependent steps was
measured based on the virus escape from inhibition by NH4Cl.
Fourth, single virus fusion events were visualized in real time based
upon the release of a fluorescent marker trapped within the viral
membrane. Fifth, the relative size and the stability of fusion pores
were evaluated based upon the rate of viral content redistribution.
Sixth, a long-lived hemifusion-like intermediate of single EnvA-
pseudotyped virus fusion with endosomes was identified from the
temporal differences in transfer of viral lipid and content markers.
but for the virus fusion with 800H cells in the absence (blue circles) or in the presence (open circles) of 0.1 mg/ml R99 peptide. (C) Half-times (T50) ofthe NC-eGFP release in 950H (red bars), 950L (gray bars) and 800H (blue bars) cells. The T50 values were determined from the exponential decaycoefficients, as shown in panels A and B. The distribution of T50 for saponin-formed lytic pores in single virions is shown by an open bar.doi:10.1371/journal.ppat.1001260.g006
Retrovirus-Endosome Fusion Intermediates
PLoS Pathogens | www.plospathogens.org 12 January 2011 | Volume 7 | Issue 1 | e1001260
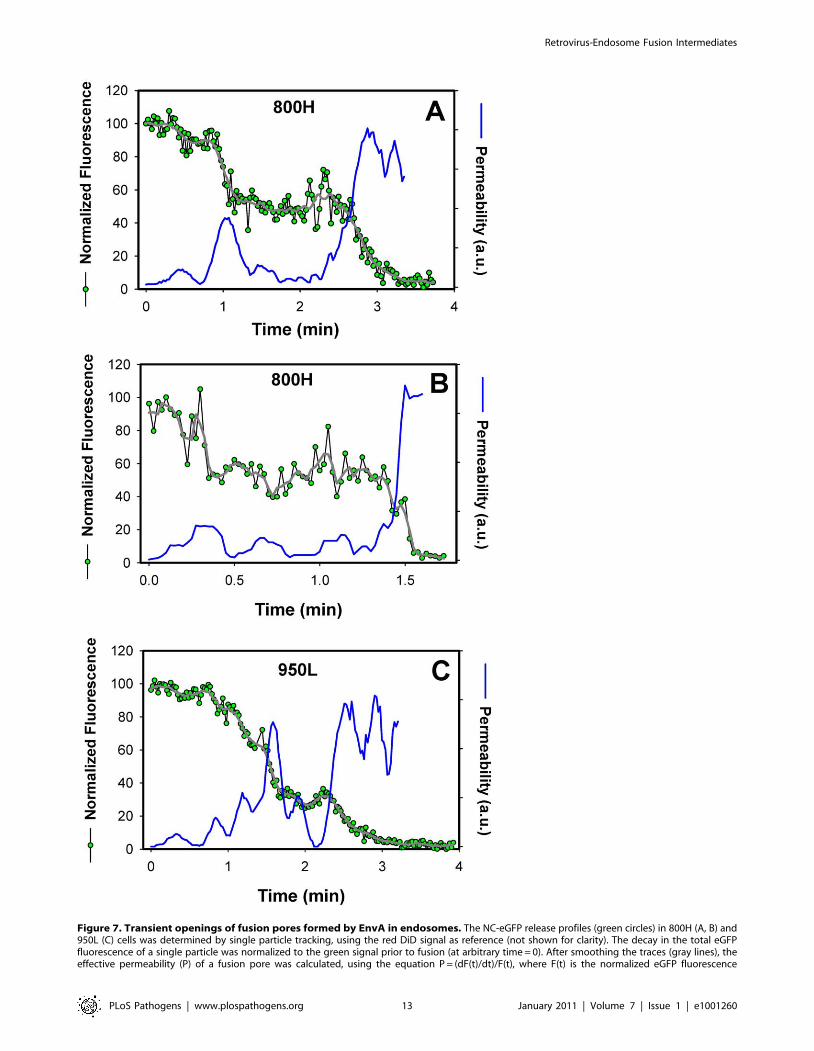
Figure 7. Transient openings of fusion pores formed by EnvA in endosomes. The NC-eGFP release profiles (green circles) in 800H (A, B) and950L (C) cells was determined by single particle tracking, using the red DiD signal as reference (not shown for clarity). The decay in the total eGFPfluorescence of a single particle was normalized to the green signal prior to fusion (at arbitrary time = 0). After smoothing the traces (gray lines), theeffective permeability (P) of a fusion pore was calculated, using the equation P = (dF(t)/dt)/F(t), where F(t) is the normalized eGFP fluorescence
Retrovirus-Endosome Fusion Intermediates
PLoS Pathogens | www.plospathogens.org 13 January 2011 | Volume 7 | Issue 1 | e1001260
We found that both bulk and productive virus endocytosis were
much faster through TVA950 than through TVA800, although the
latter receptor was more abundantly expressed in target CV-1 cells.
Different rates of virus internalization via alternative receptors are in
full agreement with those reported for HEK 293 cells [41] and are
consistent with distinct routes of virus trafficking mediated by these
receptors. In addition, we found that TVA800 did not noticeably
accelerate endocytosis of EnvA-pseudotyped viruses compared to
their non-specific uptake by parental cells lacking the receptor.
Failure of TVA800 to facilitate the virus uptake could reflect its slow
recruitment by viruses, perhaps due to restricted lateral diffusion of
this receptor, as proposed in [49]. Alternatively, the rate of virus
uptake could be determined by the rate of receptor endocytosis.
Quick internalization via TVA950 could be aided by receptor-
mediated signaling and recruitment of endocytic machinery.
Once internalized by CV-1 cells expressing either receptor
isoform, viruses quickly entered into acidic endosomes and
progressed through the low pH-activation steps (Figures 1E, 2
and 5). In HEK 293 cells, however, the slower uptake via TVA800
was compensated by faster escape from NH4Cl inhibition as
compared to TVA950 cells [41], perhaps due to a faster virus
delivery into acidic compartments. The quicker pace of post-
internalization steps of fusion in CV-1 cells was likely caused by
the high density of receptors, as these steps tended to be slower in
cells expressing reduced levels of receptors (Figure S4).
The comparison of the kinetics of EcpH quenching, low pH-
activation of EnvA (escape from NH4Cl) and individual fusion
events revealed that virus internalization was rate-limiting for
fusion with cells expressing the GPI-receptor. In these cells, viral
uptake, low pH activation, and content release occurred at the
same rate (Figures 1E and 2B vs. 5D). On the other hand, EnvA-
mediated fusion with cells expressing transmembrane receptor was
delayed compared to its low pH activation, suggesting the
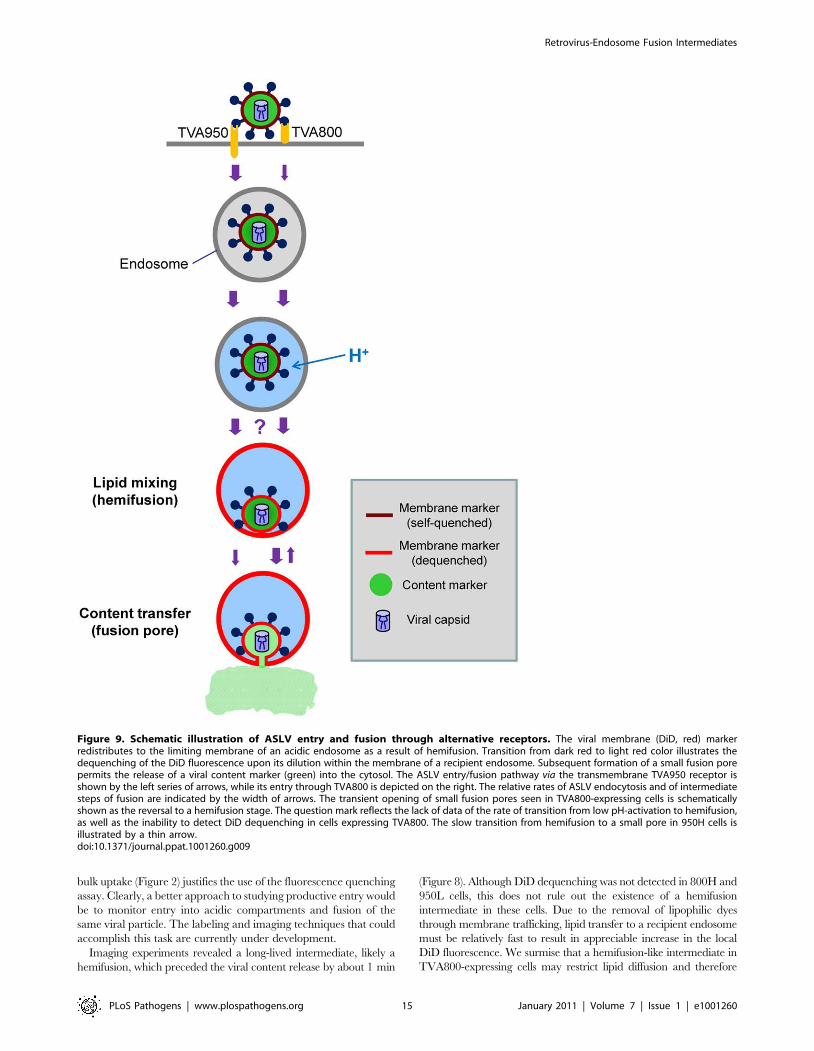
existence of slow post-internalization steps. We thus surmise that
TVA800 does not accelerate endocytosis of this virus, but quickly
traffics internalized particles into acidic fusion-permissive com-
partments. By contrast, TVA950 appears to mediate quick virus
uptake and delivery into acidic compartments which allow Env
activation but do not support fusion (Figure 9). Only later do low
pH-activated (perhaps even hemifused) viruses enter fusion-
permissive compartments in 950H cells and release their content.
The delayed virus fusion could be due, in part, to a long-lived
hemifusion intermediate that precedes the formation of a fusion
pore in 950H, but remained undetected in 800H cells (Figure 8).
Interestingly, Dengue virus fusion has been recently reported to be
delayed relative to its low pH activation [56].
The potential problem with relating the bulk virus uptake (EcpH
quenching) to fusion is that the majority of internalized virions fail to
release their content from within endosomes. However, the
closeness of the kinetics of productive virus endocytosis and of its
Figure 8. Lipid mixing step precedes the release of the viral content into the cytosol. (A, B) Single EnvA-pseudotyped particles labeledwith NC-eGFP and DiD were tracked and the total fluorescence intensities of these markers were plotted (green and red circles, respectively). Bluetraces are the instantaneous velocities of viral particles. DiD dequenching is manifested in the increased red fluorescence intensity. The decrease ofthe DiD fluorescence after dequenching is likely caused by membrane trafficking that removes the lipid dye from a recipient endosome. (C) Thedistribution of lag times between the increase in DiD intensity (TDiD) and the onset of NC-eGFP release (TGFP).doi:10.1371/journal.ppat.1001260.g008
intensity of a virion as a function of time. The obtained pore permeability traces (blue lines) show reversible opening and closure of fusion pores.doi:10.1371/journal.ppat.1001260.g007
Retrovirus-Endosome Fusion Intermediates
PLoS Pathogens | www.plospathogens.org 14 January 2011 | Volume 7 | Issue 1 | e1001260
bulk uptake (Figure 2) justifies the use of the fluorescence quenching
assay. Clearly, a better approach to studying productive entry would
be to monitor entry into acidic compartments and fusion of the
same viral particle. The labeling and imaging techniques that could
accomplish this task are currently under development.
Imaging experiments revealed a long-lived intermediate, likely a
hemifusion, which preceded the viral content release by about 1 min
(Figure 8). Although DiD dequenching was not detected in 800H and
950L cells, this does not rule out the existence of a hemifusion
intermediate in these cells. Due to the removal of lipophilic dyes
through membrane trafficking, lipid transfer to a recipient endosome
must be relatively fast to result in appreciable increase in the local
DiD fluorescence. We surmise that a hemifusion-like intermediate in
TVA800-expressing cells may restrict lipid diffusion and therefore
Figure 9. Schematic illustration of ASLV entry and fusion through alternative receptors. The viral membrane (DiD, red) markerredistributes to the limiting membrane of an acidic endosome as a result of hemifusion. Transition from dark red to light red color illustrates thedequenching of the DiD fluorescence upon its dilution within the membrane of a recipient endosome. Subsequent formation of a small fusion porepermits the release of a viral content marker (green) into the cytosol. The ASLV entry/fusion pathway via the transmembrane TVA950 receptor isshown by the left series of arrows, while its entry through TVA800 is depicted on the right. The relative rates of ASLV endocytosis and of intermediatesteps of fusion are indicated by the width of arrows. The transient opening of small fusion pores seen in TVA800-expressing cells is schematicallyshown as the reversal to a hemifusion stage. The question mark reflects the lack of data of the rate of transition from low pH-activation to hemifusion,as well as the inability to detect DiD dequenching in cells expressing TVA800. The slow transition from hemifusion to a small pore in 950H cells isillustrated by a thin arrow.doi:10.1371/journal.ppat.1001260.g009
Retrovirus-Endosome Fusion Intermediates
PLoS Pathogens | www.plospathogens.org 15 January 2011 | Volume 7 | Issue 1 | e1001260
remain undetected. Indeed, it has been shown that hemifusion
intermediates and even nascent fusion pores formed by viral proteins
can restrict lipid diffusion [12,57].
The second entry step that could represent a long-lived
intermediate of EnvA-mediated fusion was the formation of a small
pore. At this point, we cannot rule out the alternative possibility that
long-lived small pores are simply off-path structures that do not lead
to productive infection. However, by analogy with the fusion pores
formed at the cell surface [29], it is plausible that at least a fraction of
small pores formed in endosomes fully enlarges. To restrict efflux of
the loosely trapped NC-eGFP marker, the pore diameter should be
comparable to the size of this marker. The NC fragment is
approximately 3-fold smaller than eGFP molecule, which has the
dimensions of 4 by 3 nm [58]. Therefore, the NC should not
considerably increase the overall size the NC-eGFP marker,
suggesting that small fusion pores formed by EnvA should be a
few nanometers in diameter. This size is consistent with the
diameter of a saponin pore (3–10 nm [51,52]) which does not
considerably restrict the release of viral content (Figure 6).
Perhaps the most surprising finding of this work was the marked
difference in early fusion pores formed by EnvA in cells expressing
alternative receptors. Both the apparent diameter and stability of
early fusion pores were greater in 950H compared to 800H cells
(Figures 6 and 7). These differences could indicate the role for the
TVA950 transmembrane domain in forming and/or stabilizing a
fusion pore. However, TVA appears to dissociate from the EnvA
at neutral pH when EnvA interacts with target membrane [59,60]
and is therefore unlikely to be a part of an endosomal fusion
complex. An alternative explanation for the differences in fusion
pores in cells expressing TVA isoforms is that these structures are
formed in distinct endosomal compartments or in distinct lipid
microdomains of the same endosomal compartment. It is
conceivable that different compositions and/or dynamics of
endosomal compartments harboring the virus in 800H and
950H cells can determine the properties of these pores. Yet
another explanation for the unstable fusion pores formed through
TVA800 is the less optimal priming of ASLV Env by this receptor.
It has been shown that suboptimal conditions for fusion (e.g., pH,
temperature, density of active fusion proteins) preclude the
formation of pores capable of enlarging and releasing the
nucleocapsid [12,57,61,62]. This notion is further supported by
the reduced pore diameter (Figure 6) and stability (Figure 7) in
cells finding expressing a lower level of TVA950.
The delayed virus uptake and lower efficiency of fusion and
infection in 800H compared to 950H cells imply that ASLV is
more likely to enter natural target cells expressing both isoforms via
the transmembrane receptor. Moreover, the usage of the GPI-
anchored receptor in these target cells should be further
minimized, since these cells express lower levels of this isoform
compared to TVA950 [39]. The higher infectivity of EnvA-
pseudoviruses in cells expressing the transmembrane receptor
compared to the GPI-anchored isoform could be traced back to
the formation of more robust fusion pores and of an upstream
hemifusion-like intermediate that did not noticeably restrict lipid
redistribution. Our data thus imply that the size and the stability of
endosomal pre-fusion and early fusion sites depend on the TVA
receptor isoform and that these early structures determine the
outcome of ASLV entry.
Materials and Methods
Cell lines, viruses and reagentsCV-1 cells and HEK 293T/17 cells were obtained from ATCC
(Manassas, VA) and grown in Dulbecco’s modified Eagle high
glucose medium (DMEM, Invitrogen Carlsbad, CA) supplement-
ed with either Cosmic bovine serum or fetal bovine serum,
respectively, purchased from the Hyclone Laboratories (Logan,
UT). CV-1 cells were transduced with VSV-G pseudotyped
retroviral vectors pCMMP-TVA950 or pCMMP-TVA 800 as
described previously [41]. Cells expressing either high or low levels
of either TVA receptor were sorted by flow cytometry using a
FACS Vantage SE DiVa (BD Biosciences; Salk CCMI Core
Facility) after binding to a subgroup A ASLV SU-IgG fusion
protein and a FITC-conjugated secondary antibody (swine anti-
rabbit FITC) [63]. Stable expression levels of the receptors were
verified several times by flow cytometric analysis over the course of
these studies.
The fluorescent MLV core (Gag-eGFP and Gag-Pol) was
pseudotyped with the ASLV EnvA glycoprotein lacking the
cytoplasmic domain (designated EnvADCT) and co-labeled with a
membrane marker DiD, as described previously [29] with minor
modifications. Briefly, HEK 293T cells on a 6 cm dish were
transfected with 3 mg Gag-eGFP, 10 mg Gag-Pol, 20 mg MLV
LTR-LacZ and 20 mg ASLV EnvADCT expressing vectors, using
the Ca-phosphate protocol. Transfected cells were labeled with
5 mM DiD (freshly dispersed in pre-warmed serum-free Opti-
MEM) on the following day. Cells were kept in a CO2 incubator
for 4 hr, washed and incubated for additional 24 hr in a full
growth medium. Virus-containing extracellular medium was
collected 48 hr post-transfection, briefly centrifuged to remove
cell debris, and passed through 0.45 mm filters. Virus preparations
were aliquoted and stored at 280uC. The infectious titer of
EnvADCT-pseudotyped viruses was determined using the b-Gal
assay, as described before [8].
For the virus uptake measurements, HIV-1 Gag fused at the C-
terminus to the mCherry sequence (see below) was pseudotyped
with EnvADCT and labeled with the pH-sensitive EcpH-TM
construct. These pseudoviruses were produced by transfecting a
10 cm dish of HEK 293T/17 cells with plasmids encoding HIV-1
R8DEnv (3.3 mg, from C. Aiken, Vanderbilt University), 1 mg
pcRev, HIV-1 Gag-mCherry (1 mg), EcpH-ICAM-1 (3.3 mg), and
EnvADCT (3 mg), using PolyFect Transfection Reagent (Qiagen,
Valencia, CA).
Sodium pyruvate was from Sigma (St. Louis, MO), penicillin-
streptomycin from Gemeni Bio-Products (West Sacramento, CA),
L-Glutamine from Lonza (Walkersville, MD), phosphate-buffered
saline (PBS) and geneticin were from Mediatech Inc. (Manassas,
VA). The far red lipophilic dye DiD, Hoechst-33342 nuclear stain
and MitoTracker Deep Red were purchased from Invitrogen
(Carlsbad, CA). The EnvA-derived R99 peptide (.95% purity by
HPLC) was synthesized by Macromolecular Resources (Fort
Collins, CO).
Construction of HIV Gag- and ICAM-1-based fluorescentmarkers
To construct the HIV Gag-mCherry expression plasmid, the
codon optimized HIV-1 Gag fragment [64] was amplified by PCR
using the following primers: TAAGCTTGCC ACCATGGGCG
CCCGCGCCAG CGTGCTGAGC and TGGATCCCTG GC-
TGCTGGGG TCGTTGCCGA ACAGGCT. HindIII-BamHI
fragments of the PCR products were cloned into pcDNA3.1zeo (+)
vector (Invitrogen,Carlsbad, CA). The mCherry coding sequence
was amplified by PCR using the pRSET-BmCherry vector (from
R. Tsien, University of California, San Francisco) as a template
and primers AGGATCCAAG GGCGAGGAGG ATAACATGG
and ACTCGAGTTA CTTGTACAGC TCGTCCATGC CG-
CCGGTGGA GTGGC. BamHI-XhoI fragments of the PCR
products were cloned into the pcDNA3.1 zeo (+)-HIV gag
Retrovirus-Endosome Fusion Intermediates
PLoS Pathogens | www.plospathogens.org 16 January 2011 | Volume 7 | Issue 1 | e1001260
plasmid. To construct the EcpH-TM expression plasmid, the
fragments of ecliptic pHluorin (EcpH) [42] were amplified by PCR
using the following primers: TAAGCTTCTC GAGAGTAAAG
GAGAAGAACT TTTCACTGG and TGAATTCTTG TATA-
GTTCAT CCATGCCATGTG. HindIII-EcoRI fragments of the
PCR products were cloned into p3xFLAG CMV9 vector (Sigma,
St. Louis, MO). The transmembrane fragment of ICAM-1 was
amplified by PCR using the pCDM8 ICAM-1 vector (Addgene
Inc., Cambridge, MA) as a template and the following primers:
AGAATTCACG GTATGAGATT GTCATCATC and T-
GGATCCTCA CCGCTGGCGG TTATAGAGGTA. EcoRI-
BamHI fragments of the PCR products cloned into p3xFLAG
CMV9-EcpH vector.
Virus-cell fusionEnvA-mediated virus-cell fusion was measured using the b-
lactamase (BlaM) assay, as described previously [8,65]. Briefly,
pseudoviruses were prepared by transfecting HEK 293T/17 cells
with 2.4 mg pR8DEnv, 1 mg BlaM-Vpr expressing pMM310
vector [66], 1 mg pcRev, and 3 mg of ASLV EnvADCT-expressing
plasmid, using the PolyFect transfection reagent. Viruses were
bound to target CV-1 cells by centrifugation at 20956g, 4uC for
30 min. After washing off unbound viruses, cells were incubated at
37uC for 90 min in the presence or absence of 50 mg/ml R99
peptide. Cells were then loaded with fluorescent CCF2-AM
substrate (Invitrogen) and incubated overnight at 12uC. Intracel-
lular a-lactamase activity (ratio of blue to green fluorescence) was
measured using the Synergy HT fluorescence microplate reader
(Bio-Tek, Germany).
Imaging single virus uptake and fusionVirus uptake and delivery into mildly acidic compartments was
assessed using particles co-labeled with HIV-1 Gag-mCherry and
EcpH-TM as the viral core and membrane markers, respectively.
EnvA-driven fusion was measured using pseudoviruses co-labeled
with MLV Gag-eGFP and DiD. Cells were grown to confluency
on No. 0 glass coverslips using phenol red-free growth medium.
Cells were washed with Hanks’ Balanced Salt Solution (HBSS)
supplemented with 1 mM sodium pyruvate and 2% serum.
Viruses were diluted in this buffer and spinoculated onto cells at
21006g (4uC) for 20–30 minutes. Free viruses were removed by
washing, and cells were placed on ice and used for imaging
experiments within 3 hr. Pieces of a coverslip with cells were
transferred into a glass-bottom imaging chamber pre-warmed to
37uC thereby initiating the virus uptake and fusion. Image
acquisition started immediately after finding a suitable image
field, which usually took about 30 sec after transferring cells into
the chamber. Image acquisition started after a longer delay (up to
2 min) after transferring the cells in experiments where virus
endocytosis was monitored by EcpH quenching.
Imaging was performed using the Personal DeltaVision imaging
system (Applied Precision LLC., Issaquah, WA) equipped with an
environmental enclosure that maintained the desired temperature
and humidity around the sample. An UPlanFluo 406/1.3 NA oil
objective (Olympus) was used to visualize labeled viruses. At every
time point, two consecutive images were acquired by alternating
the standard FITC and TRITC or CY5 excitation/emission
filters. Green and orange/red signals were separated by a quad
(DAPI/FITC/TRITC/Cy5) dichroic beam-splitter and sequen-
tially acquired using an EM-CCD camera (Photometrics). Unless
stated otherwise, virus fusion was monitored by acquiring green
and red fluorescence signals at 0.66 Hz (1.5 sec per image) during
35 min. Bulk virus uptake was imaged using a reduced acquisition
rate (unless stated otherwise, one frame per 10 sec) for up to 1 hr.
The image contrast-based autofocus feature was employed to
compensate for a focal drift, which was most noticeable during the
first 5–10 min of imaging. In order to provide a reference signal
for the autofocus, cell nuclei were labeled with 1 mM Hoechst-
33342 and imaged with DAPI filters. When monitoring uptake of
Gag-mCherry/EcpH-TM labeled pseudoviruses, cells were pre-
stained with MitoTracker Deep Red, and autofocus was
implemented using the Cy5 filter.
Image analysesAll images were deconvoluted using the DeltaVision Softworx
package prior to analysis with the Volocity software (Improvision,
Waltham, MA). To quantify the global quenching of EcpH signal
from multiple viruses entering acidic endosomes, objects (viruses)
positive for both Gag-mCherry and EcpH-TM markers were
identified in consecutive images and the sum of EcpH signals from
all double-labeled objects within the specified size range was
calculated. The changes in the mCherry signal were determined
by identifying objects positive for this marker, using the
parameters applied for double-labeled virions, and the sum of
red fluorescence was calculated for every image frame.
The efficacy of EnvA-mediated fusion was evaluated by
normalizing the number of virions that released their eGFP
content to the total number of double-labeled particles in the
image field. The kinetics of single virus entry into acidic
compartments (EcpH-TM quenching) and of endosomal fusion
(NC-eGFP release) was initially determined based on the visual
observation of the onset of EcpH or eGFP fluorescence decay. The
time interval from placing the cells into a pre-warmed imaging
chamber and the onset of acquisition was subtracted from
subsequent quenching or fusion time points. To obtain more
quantitative information regarding the fluorescence intensities of
the core and membrane markers and to assess the particles’
velocities and trajectories, individual viral particles were tracked,
as described previously [8]. Due to the poor signal-to-noise ratio
and particle crowding at the perinuclear space, only about 30% of
double-labeled viruses could be reliably tracked by our software.
The rate of the eGFP fluorescence decay associated with virus
fusion was determined by fitting the data with a single exponential
function (Sigma Plot, SSI). This analysis yielded the exponential
time constant, which was used to calculate the time required to
lose half of the eGFP signal (T50). In order to minimize the
contribution from deterioration of the eGFP signal due to its
quenching in acidic compartments, we did not consider the eGFP
decay events lasting longer than 5 min. These slow events were
predominantly observed in the presence of ASLV fusion inhibitor,
R99.
Supporting Information
Figure S1 Labeling and characterization of ASLV EnvA-
pseudotyped viruses. (A) Illustration of the mCherry-TM construct
consisting of the mCherry sequence flanked by the triple FLAG-tag
and the transmembrane domain of ICAM-1. (B) Immunofluores-
cence staining of viral particles co-labeled with Gag-eGFP (green)
and mCherry-TM (red). Note the inversion of colors of the core and
membrane markers compared to Figure 1. This combination of
markers was selected in order to ensure the pH-independence of
fluorescence of the viral membrane marker. Viruses were immobi-
lized on a poly-lysine-coated chambered coverslip (Lab-TekTM,
Rochester, NY) and incubated with anti-Env MC8C5-4 mAb or
with isotype control antibodies in a blocking buffer for 1 hr at 4uC.
Viruses were then stained with goat anti-mouse IgG conjugated with
Cy5TM (colored blue), washed and fixed with 4% paraformaldehyde.
Retrovirus-Endosome Fusion Intermediates
PLoS Pathogens | www.plospathogens.org 17 January 2011 | Volume 7 | Issue 1 | e1001260
(C, D) Analyses of the viral marker colocalization of particles labeled
as in panel B and of correlation between the mCherry-TM and Env
signals. (E) Immunoprecipitation of double-labeled EnvA-pseudo-
typed viruses using anti-FLAG M2 and isotype control antibodies.
Virions were concentrated by ultracentrifugation and incubated for
2 hr at 4uC with M2-agarose (Sigma) resuspended in HBSS. Viruses
remaining in the supernatant after immunoprecipitation were
titrated on HEK 293 cells expressing TVA950. (F) Inhibition of
EnvA-mediated virus-cell fusion measured by the b-lactamase assay
(see Materials and Methods) and plotted as blue/green fluorescence
ratio. Fusion of unlabeled viruses and viruses labeled with mCherry-
TM was assessed in TVA950-expressing CV-1 cells in the presence
or in absence of 50 mg/ml R99 peptide. Data shown are means and
SEM from a representative experiment performed in triplicate. G.
Western blot analysis of pseudoviruses bearing the subtype A ASLV
Env and co-labeled with HIV-1 Gag-mCherry and EcpH-ICAM-1
constructs (designated EnvA-HIV-Gag-mCherry). The bands were
probed with either with the 13G4 anti-p24 monoclonal antibody
(obtained from the Institute of Human Virology Core Facility) or
with a rabbit polyclonal antibody to mCherry (from Clontech).
Infectious pNL4-3 HIV-1 preparation was used as control. The Pr55
band on the left panel comes from the wild-type Gag (from the
pR8DEnv vector) co-expressed with the Gag-mCherry (for details,
see Materials and Methods).
Found at: doi:10.1371/journal.ppat.1001260.s001 (3.32 MB TIF)
Figure S2 TVA800 and TVA950 expression in CV-1 cells. CV-
1 cells were transduced with VSV-G pseudotyped retroviral
vectors pCMMP-TVA950 or pCMMP-TVA800. Cells expressing
either receptor isoform were sorted into high (H) and low (L)
fluorescence intensity subpopulations, using a subgroup A ASLV-
SU-IgG fusion protein and a FITC-conjugated secondary
antibody. The 800L population (not shown) was rather heteroge-
neous and, therefore, was not used in our experiments.
MFI = mean fluorescence intensity.
Found at: doi:10.1371/journal.ppat.1001260.s002 (2.19 MB TIF)
Figure S3 The lack of increases of membrane permeability of
EnvA-pseudotyped viruses upon pretreatment with soluble TVA
(sTVA) and low pH. Subtype A Env-pseudotyped viruses were co-
labeled with MLV Gag-eGFP and DiD, adhered to a poly-lysine-
coated coverslip at 4uC and incubated with 0.5 mg/ml of soluble
TVA ectodomain (sTVA) in PBS for 15 min at 37uC or left
untreated. Viruses were then exposed to a pH 4.8 MES buffer,
and the resulting changes in the eGFP fluorescence of individual
particles were monitored using Zeiss LSM 510 Meta confocal
microscope. In control experiments, untreated viruses were
exposed to a membrane-permeant pH 4.8 acetate buffer. The
apparent transient increase in the eGFP fluorescence around
20 sec after addition of MES was due to the focus drift, which was
corrected after a few frames.
Found at: doi:10.1371/journal.ppat.1001260.s003 (0.63 MB TIF)
Figure S4 The kinetics of productive virus uptake and low pH
activation in CV-1 cells expressing lower levels of TVA950 (A,
950L) and TVA800 (B, 800L). The rates of receptor-mediated
endocytosis (black circles) and EnvA activation in acidic
endosomes (red circles) was measured by adding the R99
inhibitory peptide (50 mg/ml) or NH4Cl (70 mM), respectively.
Virus escape from these inhibitors was assessed by the beta-
lactamase-based virus-cell fusion assay (for details, see the legend
to Figure 2 and Materials and Methods). The time-course of
EcpH-TM quenching (green lines) re-plotted from the Figure 1E is
shown as a reference. Data points are means of at least three
independent measurements. Error bars are SEM.
Found at: doi:10.1371/journal.ppat.1001260.s004 (1.18 MB TIF)
Video S1 Imaging of EnvA-pseudotyped virus entry into mildly
acidic endosomes. Viruses co-labeled with EcpH-TM (green) and
Gag-mCherry (red) were adhered to CV-1 cells expressing
TVA950 in the cold, and the temperature was raised to 37uC at
time = 0 (elapsed time is shown in the upper right corner). Virus
entry into acidic compartment is marked by disappearance of the
green signal. A particle in the lower right corner experiences a pH
drop without moving considerably from its initial position. Over
time, virions move to the perinuclear space that can be identified
by somewhat higher autofluorescence compared to the cell
periphery. For details, see the legend to Figure 1.
Found at: doi:10.1371/journal.ppat.1001260.s005 (2.83 MB
MOV)
Video S2 Virus recycling and re-internalization. Double-labeled
virion (arrowhead) shifts toward the lower left corner of the image
and loses its EcpH signal, indicating the virus entry into an acidic
compartment. The subsequent recovery of green fluorescence is
consistent with virus recycling. The recovery is transient, as the
EcpH signal slowly fades again. The time elapsed from shifting
CV-1 cells expressing TVA950 and viruses to 37uC is shown on
top. For details, see the legend to Figure 3.
Found at: doi:10.1371/journal.ppat.1001260.s006 (4.53 MB
MOV)
Video S3 EnvA-driven virus fusion with an endosome. A virion
co-labeled with the membrane marker, DiD (red), and with the
diffusible content marker, NC-eGFP (green), travels toward the
cell nucleus (stained with Hoechst-33342, blue). The release of the
viral content into the cytosol, which is marked by disappearance of
the green signal, corresponds to the formation of a fusion pore
between the viral and endosomal membranes. The time elapsed
after raising the temperature to initiate endocytosis and fusion is
shown in the upper right corner. For details, see the legend to
Figure 4.
Found at: doi:10.1371/journal.ppat.1001260.s007 (1.49 MB
MOV)
Acknowledgments
The authors wish to thank Dr. Richard Barnard for making the original
CV-1 cell lines expressing TVA receptors, which were lost due to
equipment malfunction.
Author Contributions
Conceived and designed the experiments: GBM. Performed the experi-
ments: NKJ OL EM GN MM KM JN. Analyzed the data: NKJ OL EM
GN MM KM JN GBM. Contributed reagents/materials/analysis tools:
JATY. Wrote the paper: MM JATY GBM.
References
1. Harrison SC (2008) Viral membrane fusion. Nat Struct Mol Biol 15: 690–698.
2. Melikyan GB (2008) Common principles and intermediates of viral protein-mediated fusion: the HIV-1 paradigm. Retrovirology 5: 111.
3. White JM, Delos SE, Brecher M, Schornberg K (2008) Structures and
mechanisms of viral membrane fusion proteins: multiple variations on a
common theme. Crit Rev Biochem Mol Biol 43: 189–219.
4. Koch P, Lampe M, Godinez WJ, Muller B, Rohr K, et al. (2009) Visualizing
fusion of pseudotyped HIV-1 particles in real time by live cell microscopy.
Retrovirology 6: 84.
5. Stein BS, Gowda SD, Lifson JD, Penhallow RC, Bensch KG, et al. (1987) pH-
independent HIV entry into CD4-positive T cells via virus envelope fusion to the
plasma membrane. Cell 49: 659–668.
Retrovirus-Endosome Fusion Intermediates
PLoS Pathogens | www.plospathogens.org 18 January 2011 | Volume 7 | Issue 1 | e1001260
6. Maddon PJ, McDougal JS, Clapham PR, Dalgleish AG, Jamal S, et al. (1988)
HIV infection does not require endocytosis of its receptor, CD4. Cell 54:
865–874.
7. McClure MO, Marsh M, Weiss RA (1988) Human immunodeficiency virus
infection of CD4-bearing cells occurs by a pH-independent mechanism. Embo J
7: 513–518.
8. Miyauchi K, Kim Y, Latinovic O, Morozov V, Melikyan GB (2009) HIV enters
cells via endocytosis and dynamin-dependent fusion with endosomes. Cell 137:
433–444.
9. Beer C, Andersen DS, Rojek A, Pedersen L (2005) Caveola-dependent endocytic
entry of amphotropic murine leukemia virus. J Virol 79: 10776–10787.
10. Katen LJ, Januszeski MM, Anderson WF, Hasenkrug KJ, Evans LH (2001)
Infectious entry by amphotropic as well as ecotropic murine leukemia viruses
occurs through an endocytic pathway. J Virol 75: 5018–5026.
11. Blumenthal R, Bali-Puri A, Walter A, Covell D, Eidelman O (1987) pH-
dependent fusion of vesicular stomatitis virus with Vero cells. Measurement by
dequenching of octadecyl rhodamine fluorescence. J Biol Chem 262:
13614–13619.
12. Chernomordik LV, Frolov VA, Leikina E, Bronk P, Zimmerberg J (1998) The
pathway of membrane fusion catalyzed by influenza hemagglutinin: restriction
of lipids, hemifusion, and lipidic fusion pore formation. J Cell Biol 140:
1369–1382.
13. Melikyan GB, White JM, Cohen FS (1995) GPI-anchored influenza hemagglu-
tinin induces hemifusion to both red blood cell and planar bilayer membranes.
J Cell Biol 131: 679–691.
14. Kolokoltsov AA, Deniger D, Fleming EH, Roberts NJ, Jr., Karpilow JM, et al.
(2007) Small interfering RNA profiling reveals key role of clathrin-mediated
endocytosis and early endosome formation for infection by respiratory syncytial
virus. J Virol 81: 7786–7800.
15. Krishnan MN, Ng A, Sukumaran B, Gilfoy FD, Uchil PD, et al. (2008) RNA
interference screen for human genes associated with West Nile virus infection.
Nature 455: 242–245.
16. Brass AL, Dykxhoorn DM, Benita Y, Yan N, Engelman A, et al. (2008)
Identification of host proteins required for HIV infection through a functional
genomic screen. Science 319: 921–926.
17. Zhou H, Xu M, Huang Q, Gates AT, Zhang XD, et al. (2008) Genome-scale
RNAi screen for host factors required for HIV replication. Cell Host Microbe 4:
495–504.
18. Konig R, Zhou Y, Elleder D, Diamond TL, Bonamy GM, et al. (2008) Global
analysis of host-pathogen interactions that regulate early-stage HIV-1 replica-
tion. Cell 135: 49–60.
19. Karlas A, Machuy N, Shin Y, Pleissner KP, Artarini A, et al. (2010) Genome-
wide RNAi screen identifies human host factors crucial for influenza virus
replication. Nature 463: 818–822.
20. Le Blanc I, Luyet PP, Pons V, Ferguson C, Emans N, et al. (2005) Endosome-to-
cytosol transport of viral nucleocapsids. Nat Cell Biol 7: 653–664.
21. Chandran K, Sullivan NJ, Felbor U, Whelan SP, Cunningham JM (2005)
Endosomal proteolysis of the Ebola virus glycoprotein is necessary for infection.
Science 308: 1643–1645.
22. Ou W, Xiong Y, Silver J (2004) Quantification of virus-envelope-mediated cell
fusion using a tetracycline transcriptional transactivator: fusion does not
correlate with syncytium formation. Virology 324: 263–272.
23. Lakadamyali M, Rust MJ, Babcock HP, Zhuang X (2003) Visualizing infection
of individual influenza viruses. Proc Natl Acad Sci U S A 100: 9280–9285.
24. van der Schaar HM, Rust MJ, Chen C, van der Ende-Metselaar H, Wilschut J,
et al. (2008) Dissecting the cell entry pathway of dengue virus by single-particle
tracking in living cells. PLoS Pathog 4: e1000244.
25. Vonderheit A, Helenius A (2005) Rab7 associates with early endosomes to
mediate sorting and transport of Semliki forest virus to late endosomes. PLoS
Biol 3: e233.
26. Joo KI, Wang P (2008) Visualization of targeted transduction by engineered
lentiviral vectors. Gene Ther 15: 1384–1396.
27. Campbell EM, Perez O, Melar M, Hope TJ (2007) Labeling HIV-1 virions with
two fluorescent proteins allows identification of virions that have productively
entered the target cell. Virology 360: 286–293.
28. Lampe M, Briggs JA, Endress T, Glass B, Riegelsberger S, et al. (2006) Double-
labelled HIV-1 particles for study of virus-cell interaction. Virology 360: 92–104.
29. Melikyan GB, Barnard RJ, Abrahamyan LG, Mothes W, Young JA (2005)
Imaging individual retroviral fusion events: from hemifusion to pore formation
and growth. Proc Natl Acad Sci U S A 102: 8728–8733.
30. Markosyan RM, Cohen FS, Melikyan GB (2005) Time-resolved imaging of
HIV-1 Env-mediated lipid and content mixing between a single virion and cell
membrane. Mol Biol Cell 16: 5502–5513.
31. Barnard RJ, Narayan S, Dornadula G, Miller MD, Young JA (2004) Low pH is
required for avian sarcoma and leukosis virus Env-dependent viral penetration
into the cytosol and not for viral uncoating. J Virol 78: 10433–10441.
32. Melikyan GB, Barnard RJ, Markosyan RM, Young JA, Cohen FS (2004) Low
pH Is Required for Avian Sarcoma and Leukosis Virus Env-Induced
Hemifusion and Fusion Pore Formation but Not for Pore Growth. J Virol 78:
3753–3762.
33. Mothes W, Boerger AL, Narayan S, Cunningham JM, Young JA (2000)
Retroviral entry mediated by receptor priming and low pH triggering of an
envelope glycoprotein. Cell 103: 679–689.
34. Smith JG, Mothes W, Blacklow SC, Cunningham JM (2004) The mature avianleukosis virus subgroup A envelope glycoprotein is metastable, and refolding
induced by the synergistic effects of receptor binding and low pH is coupled to
infection. J Virol 78: 1403–1410.
35. Kielian MC, Marsh M, Helenius A (1986) Kinetics of endosome acidification
detected by mutant and wild-type Semliki Forest virus. EMBO J 5: 3103–3109.
36. White J, Matlin K, Helenius A (1981) Cell fusion by Semliki Forest, influenza,
and vesicular stomatitis viruses. J Cell Biol 89: 674–679.
37. Delos SE, La B, Gilmartin A, White JM (2010) Studies of the ‘‘chain reversalregions’’ of the avian sarcoma/leukosis virus (ASLV) and ebolavirus fusion
proteins: analogous residues are important, and a His residue unique to EnvAaffects the pH dependence of ASLV entry. J Virol 84: 5687–5694.
38. Bates P, Young JA, Varmus HE (1993) A receptor for subgroup A Rous sarcoma
virus is related to the low density lipoprotein receptor. Cell 74: 1043–1051.
39. Elleder D, Melder DC, Trejbalova K, Svoboda J, Federspiel MJ (2004) Two
different molecular defects in the Tva receptor gene explain the resistance of twotvar lines of chickens to infection by subgroup A avian sarcoma and leukosis
viruses. J Virol 78: 13489–13500.
40. Young JA, Bates P, Varmus HE (1993) Isolation of a chicken gene that conferssusceptibility to infection by subgroup A avian leukosis and sarcoma viruses.
J Virol 67: 1811–1816.
41. Narayan S, Barnard RJ, Young JA (2003) Two retroviral entry pathwaysdistinguished by lipid raft association of the viral receptor and differences in viral
infectivity. J Virol 77: 1977–1983.
42. Miesenbock G, De Angelis DA, Rothman JE (1998) Visualizing secretion and
synaptic transmission with pH-sensitive green fluorescent proteins. Nature 394:
192–195.
43. Maxfield FR, McGraw TE (2004) Endocytic recycling. Nat Rev Mol Cell Biol 5:
121–132.
44. Shaner NC, Steinbach PA, Tsien RY (2005) A guide to choosing fluorescent
proteins. Nat Methods 2: 905–909.
45. Cavrois M, De Noronha C, Greene WC (2002) A sensitive and specific enzyme-based assay detecting HIV-1 virion fusion in primary T lymphocytes. Nat
Biotechnol 20: 1151–1154.
46. Markosyan RM, Bates P, Cohen FS, Melikyan GB (2004) A study of low pH-induced refolding of Env of avian sarcoma and leukosis virus into a six-helix
bundle. Biophys J 87: 3291–3298.
47. Netter RC, Amberg SM, Balliet JW, Biscone MJ, Vermeulen A, et al. (2004)
Heptad repeat 2-based peptides inhibit avian sarcoma and leukosis virus
subgroup a infection and identify a fusion intermediate. J Virol 78:13430–13439.
48. Lakadamyali M, Rust MJ, Zhuang X (2006) Ligands for clathrin-mediatedendocytosis are differentially sorted into distinct populations of early endosomes.
Cell 124: 997–1009.
49. Lim KI, Narayan S, Young JA, Yin J (2004) Effects of lipid rafts on dynamics ofretroviral entry and trafficking: Quantitative analysis. Biotechnol Bioeng 86:
650–660.
50. Kimpton J, Emerman M (1992) Detection of replication-competent and
pseudotyped human immunodeficiency virus with a sensitive cell line on the
basis of activation of an integrated beta-galactosidase gene. J Virol 66:2232–2239.
51. Francis G, Kerem Z, Makkar HP, Becker K (2002) The biological action ofsaponins in animal systems: a review. Br J Nutr 88: 587–605.
52. Inamitsu T, Ohtsuki I (1984) Characterization of ATP-dependent Ca2+ uptake
by canine brain microsomes with saponin. Eur J Biochem 145: 115–121.
53. Breckenridge LJ, Almers W (1987) Final steps in exocytosis observed in a cell
with giant secretory granules. Proc Natl Acad Sci U S A 84: 1945–1949.
54. Markosyan RM, Cohen FS, Melikyan GB (2003) HIV-1 envelope proteinscomplete their folding into six-helix bundles immediately after fusion pore
formation. Mol Biol Cell 14: 926–938.
55. Melikyan GB, Brener SA, Ok DC, Cohen FS (1997) Inner but not outer
membrane leaflets control the transition from glycosylphosphatidylinositol-
anchored influenza hemagglutinin-induced hemifusion to full fusion. J Cell Biol136: 995–1005.
56. Zaitseva E, Yang S-T, Melikov K, Pourmal S, Chernomordik LV (2010) DengueVirus Ensures Its Fusion in Late Endosomes Using Compartment-Specific
Lipids. PLoS Pathog 6(10): e1001131.
57. Melikyan GB, Markosyan RM, Roth MG, Cohen FS (2000) A point mutation inthe transmembrane domain of the hemagglutinin of influenza virus stabilizes a
hemifusion intermediate that can transit to fusion. Mol Biol Cell 11: 3765–3775.
58. Yang F, Moss LG, Phillips GN, Jr. (1996) The molecular structure of green
fluorescent protein. Nat Biotechnol 14: 1246–1251.
59. Damico RL, Crane J, Bates P (1998) Receptor-triggered membrane associationof a model retroviral glycoprotein. Proc Natl Acad Sci U S A 95: 2580–2585.
60. Hernandez LD, Peters RJ, Delos SE, Young JA, Agard DA, et al. (1997)Activation of a retroviral membrane fusion protein: soluble receptor- induced
liposome binding of the ALSV envelope glycoprotein. J Cell Biol 139:
1455–1464.
61. Borrego-Diaz E, Peeples ME, Markosyan RM, Melikyan GB, Cohen FS (2003)
Completion of trimeric hairpin formation of influenza virus hemagglutininpromotes fusion pore opening and enlargement. Virology 316: 234–244.
62. Markosyan RM, Cohen FS, Melikyan GB (2000) The lipid-anchored
ectodomain of influenza virus hemagglutinin (GPI-HA) is capable of inducingnonenlarging fusion pores. Mol Biol Cell 11: 1143–1152.
Retrovirus-Endosome Fusion Intermediates
PLoS Pathogens | www.plospathogens.org 19 January 2011 | Volume 7 | Issue 1 | e1001260
63. Zingler K, Young JA (1996) Residue Trp-48 of Tva is critical for viral entry but
not for high- affinity binding to the SU glycoprotein of subgroup A avian leukosisand sarcoma viruses. J Virol 70: 7510–7516.
64. zur Megede J, Chen MC, Doe B, Schaefer M, Greer CE, et al. (2000) Increased
expression and immunogenicity of sequence-modified human immunodeficiencyvirus type 1 gag gene. J Virol 74: 2628–2635.
65. Miyauchi K, Kozlov MM, Melikyan GB (2009) Early steps of HIV-1 fusion
define the sensitivity to inhibitory peptides that block 6-helix bundle formation.PLoS Pathog 5(9): e1000585.
66. Tobiume M, Lineberger JE, Lundquist CA, Miller MD, Aiken C (2003) Nef
does not affect the efficiency of human immunodeficiency virus type 1 fusionwith target cells. J Virol 77: 10645–10650.
Retrovirus-Endosome Fusion Intermediates
PLoS Pathogens | www.plospathogens.org 20 January 2011 | Volume 7 | Issue 1 | e1001260


