Embed Size (px)
Citation preview

AmericanJournal ofPathology, Vol. 134, No. 4, April 1989Copyright © American Association ofPathologists
Immunocytochemical Study of TransformingGrowth Factor Expression in Benign andMalignant Gliomas
V. Samuels, J. M. Barrett, S. Bockman,C. G. Pantazis, and M. B. Allen, Jr.From the Departments ofNeurosurgery, Anatomy, andPathology Medical College ofGeorgia, Augusta, Georgia,and CoreSCAN, Santa Rosa, California
Immunocytochemical studies usingpolyclonal an-tibodies to epidermal growth factor (EGF) andtransforming growthfactor (TGF) alpha and betawereperformed on 20 cases ofhuman gliomas. EGFimmunoreactive material was detected in both be-nign and malignant glial tumors. In addition, EGFimmunoreactive material was detected in normalbrain. TGF-beta was detected in both benign andmalignant tumors, but was not detected in normalbrain. In contrast, TGF-alpha was highly conservedin its expression, occurring predominantly in ma-lignant compared with benign or normal brain tis-sue (P < 0.0001). In malignant gliomas, glioblas-tomas contained 76% TGF-alpha reactivity (im-munoreactive product), and anaplastic typescontained 85% reactivity. Benign gliomas con-tained only 13% TGF-alpha reactivity. These find-ings support the role of TGF-alpha as an oncopro-tein marker in brain neoplasms. (Am J Pathol1989, 134:895-902)
Transforming growth factors (TGF) are low molecularweight polypeptides that reversibly induce anchorage-in-dependent growth of nontransformed anchorage-depen-dent cells. At least two types of transforming growth fac-tors have been described-alpha and beta. TGF alpha isa M, 6000 single-chain polypeptide that shares 30 to 35%homology with human and rat epidermal growth factor(EGF).1 Both EGF and TGF-alpha can compete for thesame membrane receptors.2 In contrast to EGF, TGF-al-pha secretion is seen primarily in the transformation ofcells to a malignant phenotype. The release of TGF-alphaby transformed cells is thought to be the result of onco-gene activation rather than a consequence of a cellularchange during the process of transformation.3 The link
between oncogenes and growth factors has been estab-lished for many polypeptide growth factors.4 The autono-mous production of growth factors has led to the auto-crine mechanism for neoplastic conversion.
To obtain a more thorough understanding of the ubiq-uitous patterns of polypeptide growth factor production,we performed an immunocytochemical analysis in 20cases of benign and malignant human glial tumors. Glialtumors were chosen as a model of study because of theirprecise morphologic correlation relating to malignant phe-notypes.5
Materials and Methods
Twenty human glioma biopsies obtained from archivalcases within the Department of Pathology at the MedicalCollege of Georgia from 1981 to 1984 were examined andclassified by a neuropathologist. Of the 20 specimens, 8were grade (benign), 5 were grade 11 (anaplastic), and7 were grade IlIl (glioblastoma multiforme). This gradingsystem corresponds to that system recommended by theWorld Health Organization.6 Anti-TGF-alpha, beta, andEGF polyclonal antibodies were obtained from BiotopeCompany (Bellevue, WA). These antibodies were gener-ated from synthetically produced polypeptides. The sen-sitivity of these polyclonal antibodies was determined byWestern blot analysis. The detection limit of these re-agents is between 5 and 10 ng of antigen. EGF does notreact with this antisera when examined similarly.7 Forthese studies, we used an indirect peroxidase-anti-peroxi-dase method described previously.89 Briefly, sections aredeparafinized in 100% xylene, and then rehydrated bygraded series of ethanols (100 to 50%). The slides con-taining 5-it thick sections are then placed in a 0.05 M TRIS,1.5% saline, pH 7.6 buffer before the start of the proce-dure. The sections are then blocked by the addition of 5%powdered milk dissolved in TRIS-saline for 30 minutes.This is followed by the addition of 0.3% H202 for 30 min-
Accepted for publication January 6, 1989.Address reprint requests to Dr. Cooley Pantazis, Department of Pa-
thology, Medical College of Georgia, Augusta, GA 30917.
895

896 Samuels et alAJPApril 1989, Vol. 134, No. 4
utes to block endogenous peroxidase. After severalrinses in TRIS-saline, the slides are reacted with the anti-body (1 :10 dilution in TRIS-saline). Control sections werereacted with goat serum. The antibodies are visualizedby sandwiching with either anti-goat or anti-rabbit linkingagents. The labeling agent, peroxidase to anti-peroxidaseimmunoenzyme complex, is then added. The complex isthen visualized by the addition of a chromogenic sub-strate (amino-ethyl carbazole, AEC). All sections werethen counterstained with hematoxylin and mounted withPermount and then analysed.
Color Image Analysis System
Sections of tumor were examined in three high-powerfields, consisting of approximately 100 cells/high powerfield. Cytoplasmic immunoreactive product was quanti-tated using a Delta Scan Color Image Analyzer (DeltaTechnologies, Inc., Augusta, GA). This system includes acolor video camera mounted on a Zeiss Axiophot micro-scope. In turn, the video camera is cabled to the input ofan AT&T True Vision Image Capture Board, installed onan IBM-PC with a hard disk and Microsoft mouse. Theoutput of the ICB is directed to a Sony RGB color monitor.To maintain constant light intensity conditions, the re-corded image was performed in one sitting. Only the fo-cus was changed from specimen to specimen to insurethat all samples were recorded on the exact magnificationand illumination intensity. Each digitized image was thenimmediately saved to hard disk for additional analysis.Verification of the accuracy of the reaction product wasalways confirmed by pixel mapping of the localized reac-tion product.
Color Image Analysis Software
Several investigative methods have been used to quanti-tate immunologic staining in tissue sections.9 10 To obtainobjective quantitation, image processing techniques thatuse monochrome optical density for measuring intensityhave been used.11'12 This approach can analyze both real-time and stored images. Pixel measurements are gener-ated within an object by high resolution digital sampling.We have developed a video-based microscope system,driven by color algorithms structured in C language. Thissoftware system can accurately quantitate by pixel map-ping digitized images received from the videomicroscopehardware. This system can analyze both real-time andstored images. Pixel measurements are generated withinan object by high resolution digital sampling.
The software used for this analysis was developed byone author (SB) and is called "CoreSCAN." CoreSCAN isa color video analysis program. The program compareseach scanned pixel to a previously collected list of colorvalues. If the color value of the pixel matches the valuewithin the list, the program increments a net pixel count.The net pixel count may be output as a numerical valuein operator-specified units. Each matching pixel also is in-cluded in a map which may be displayed as an imageoverlay. The operator creates a list of color values forcomparison in a controlled collection process. The color-banding feature of CoreSCAN may be used to augmentthe collection and comparison of color values. Colorbanding reduces the potential number of unique colorscontained in an image, from the theoretical maximum of32,768 to either 4096, 512, 64, or 8 colors. This effectivelycoerces similar color values to identical color values,thereby reducing the size of the list of color values usedin comparison and decreasing the comparison time.
Statistical Analysis
An analysis of the F ratios of variance was used to deter-mine the acceptable selection of the sample size. De-scriptive statistics were calculated to determine the meanvariance of standard deviation and standard error of themeans. Statistical differences between the means weredetermined by a multiple analysis of variance (MANOVA,followed by Tukey multiple range tests, using StatGraph-ics [SBSC and Company]). Means deemed significantwere greater than P < 0.05.
Results
Demonstration of quantitated immunoreactive product bycolor video analysis is illustrated in Figures 1 to 4. Figure 1is a digitized image of an anaplastic (grade 11) astrocytomastained with goat anti-TGF-alpha, demonstrating moder-ate localization of immunoreactive product. Once the spe-cific colors of interest are placed within the color net, Cor-eSCAN will digitize the image and color-pixel map the areaof reaction product (Figure 2). Figure 3 shows the digi-tized image of a malignant (grade ll) astrocytoma stainedwith goat anti-TGF-alpha, with extensive amounts of im-munoreactive product. Computer analysis of the same im-age of Figure 3 reveals the TGF reaction product that hasbeen localized and quantitated and indicates the speci-ficity of the color video analysis system (Figure 4).
The results of quantitative color video analysis of EGF,TGF-alpha and beta, are illustrated in Figures 5 to 8. EGFstaining patterns were examined in both normal and neo-

TGF Expression in Gliomas 897AJPApril 1989, Vol. 134, No. 4
Figure 1. Digitized image ofanti-TGFalpha staining ofan anaplastic astrocytoma (counterstained with hematoxylin, X400).
Figure 2. Colorpixel mapping ofimmunocytochemical reactionproduct ofthe same image in Figure 1.

898 Samuels et alAJPApril 1989, Vol. 134, No. 4
Figure 3. Digitized image ofanti-TGF-alpha staining ofa malignant astrocytoma, grade III (X400).
Figure 4. Computer analysis with resultantpixel mapping ofthe same image as in Figure 3.

TGF Expression in Gliomas 899AJPApril 1989, Vol. 134, No. 4
Figure 5. Distribution EGF staining pat-terns of both benign and malignant glio-mas. Results are given as the mean ± stan-dard error of the mean (SEM) of three ob-servationsper group.
Figure 6. Relative levels ofEGF immunore-active product in all grades of astrocyto-mas. Statistical differences between groupswere determined by AANOVA and Tukeymultiple range tests.
EGF1 nAI %-VVVV
8000
Enusa)
-4-Ji
E 60000
c)
a 4000cn
ua)
2000
0
Benign 3] Anaplastic a Glioblastoma *
lfini EGF
I
x
"J
COCu
CL)
-4
P:
Benign Anaplastic Glioblastoma
Mean E S.E.U
. . . pi rAMEW
900 Samuels et alAJPApril 1989, Vol. 134, No. 4
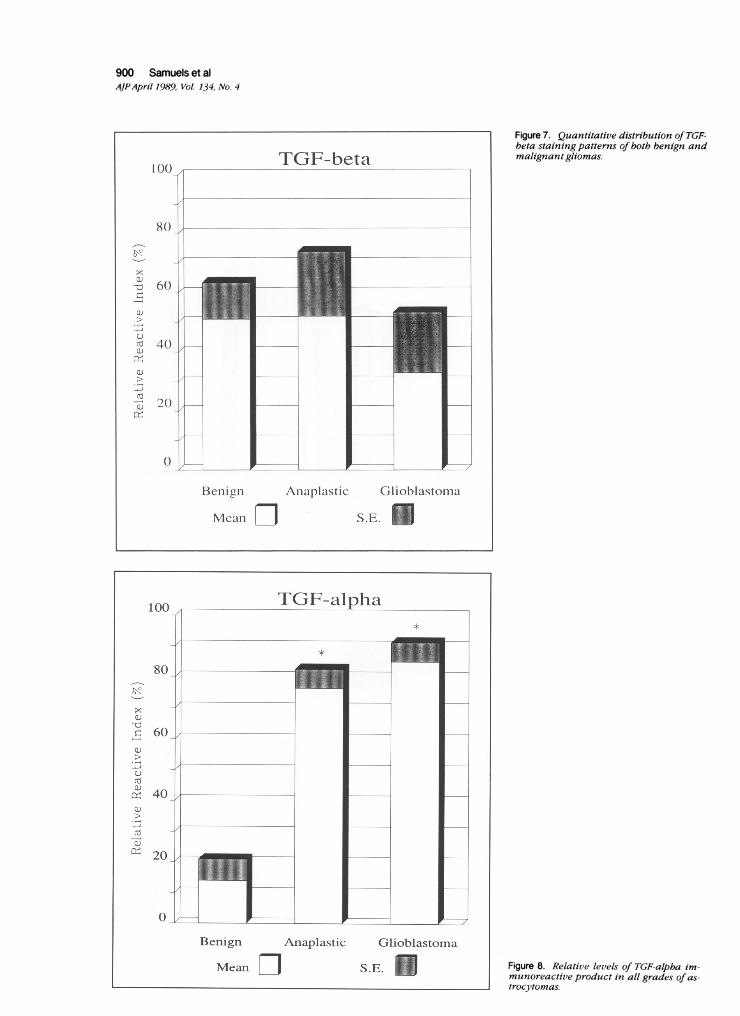
Figure 7. Quantitative distribution ofTGF-beta staining patterns of both benign andmalignant gliomas.
Figure 8. Relative levels of TGF-alpba im-munoreactive product in all grades of as-trocytomas.
000- I

TGF Expression in Gliomas 901AJPApril 1989, Vol. 134, No. 4
plastic brain tissue first. EGF immunoreactive siteswere found in the cerebrum and cerebellum of normalhuman brain tissue. White matter tended to containgreater amounts of reactive material. Control sectionsreacted with goat serum or TRIS buffer alone did notstain. Figure 5 depicts the area (in square micrometers)of EGF-reactive material detected in 20 cases of benignand malignant gliomas. These cases are grouped ac-cording to grades of malignancy. Each bar is a meanvalue of a triplicate measurement by color video analy-sis. Immunocytochemical reactive material for EGF wasdetected in all human gliomas. However, the benign tu-mors produced far more EGF reaction product than ma-lignant tumors (mean area of reactivity for benign tu-mors equaled 17,652 sq ,u per area of scanned fieldvs. 8493 sq us per area of scanned field for malignanttumors). These benign to malignant categories pro-duced a trend of decreasing EGF reactivity. Whenthese values were normalized by comparing them withthe most. reactive tumor within the group, these differ-ences were not statistically significant (Figure 6). Be-nign tumors had 75.6% relative reactivity, whereas ma-lignant tumors had 35.4% and 42.6%, respectively.We next investigated the cellular localization of TGF-
alpha and TGF-beta on the same glial tumors. TGF-betaimmunoreactive material was detected in all grades of gli-oma without any demonstrable correlation to the degreeof malignancy (Figure 7). These findings confirmed thefindings of previous studies by other investigators,13 andalso extend the localization to benign tumors as well. Inaddition, TGF-beta tended to stain mesenchymal struc-tures such as fibroblasts and vascular cells within thebrain tumors.
In contrast, immunocytochemical localization of TGF-alpha to the same groups of tumors revealed a tumor-specific distribution. Immunoreactive material was alwayslocalized in cells of malignant gliomas. Benign gliomaswere consistently negative. The mean area of reactivitywas quantified by triplicate analysis using color videoanalysis. The mean values were 1651 sq ,u per scannedarea for malignant gliomas (anaplastic and glioblastoma),and 1 1.1 sq A per scanned area for benign gliomas. Theindividual absolute values were again normalized by com-paring to the most immunoreactive section. These TGF-alpha immunocytochemical values were then examinedstatistically (Figure 8), and were shown to be significantlydifferent (P < 0.0001). TGF-alpha immunoreactive prod-uct easily segregated benign gliomas from both malig-nant gliomas. Both malignant gliomas (anaplastic andglioblastoma) demonstrated a relative reactivity index of76 and 85%, whereas benign gliomas showed only 13%reactivity.
Discussion
These findings support the role of a functional classifica-tion of tumors based on the quantitated patterns of poly-peptide growth factor localization. Furthermore, they lendsupport to the oncogene concept of neoplastic transfor-mation and progression to a more malignant phenotypetype that occurs via gene amplification and translocationof growth factor signals.1314 The separation of benignfrom malignant gliomas using TGF-alpha production is fur-ther supported by current known biology and physiologyof this polypeptide.15 Recently, Lieberman and cowork-ers15 have shown that the majority of malignant glioma celllines express high levels of a 4.6 kb TGF-alpha-specificmRNA. TGF-alpha mRNA was not present in normal orbenign tumors. Other investigators have implicated TGF-alpha an angiogenic growth factor.1718 Massive prolifera-tion of endothelial cells is characteristic of glial malignan-cies.6 Hence, the presence of TGF-alpha and otherknown growth factors for malignant glial cells may influ-ence tumor progression.
TGF-beta has been identified in malignant gliomas byseveral investigators. In our study, TGF-beta was presentin malignant tumors and benign tumors, but not in normalbrain. Our findings are in agreement with those of Clarkand Bressler,' who found TGF-beta activity in a variety ofgrades of gliomas.
The use of in situ immunocytochemical methods al-lows precise localization of immunoreactive products inquestion. The results reported herein supports the useof TGFs localization as a chemical means of separatingbenign from malignant glial tumors.
References
1. Spom MB, Todaro GJ: Autocrine secretion and the malgnanttransformation of cells. N Engl J Med 1980, 303:878-880
2. Bishop JM: Cellular oncogenes and retroviruses. Annu RevBiochem 1983, 52:301-354
3. Bishop JM: Viral oncogenes. Cell 1985, 42:23-384. Weinberg RA, Cecchini MA, Hare DL, Stem DF: Construction
of anovel oncogene based on synthetfc sequences encodingepqermal growth factor. Science 1987, 235:321-324
5. Zulch KJ, Wechsler W: Pathology and classification of glio-mas. Prog Neurol Surg 1968, 2:1-84
6. Rubistein LJ: Atlas of Tumor Pathology, Second Series, Fas-cicle 6, Tumors of the Central Nervous System. Washington,DC, Armed Forces Institute of Pathology, 1972, pp 1-97
7. BioTope, Inc. Bellevue, Washington. bro. 8606158. Sternberger LA: Immunochemistry. 2nd ed. New York, John
Wiley & Sons, 1979, pp 1-354

902 Samuels et alAJPApril 1989, Vol. 134, No. 4
9. Patau K, Swift H: The DNA content of nuclei during mitosisin a root tip of onion. Chromoasoma 1953, 6:149-152
10. Koss LG: Measuring DNA in human cancer; JAMA 1986,255:3158-3163
11. Bocking A, Adler CP, Common HH, Hilgarth M, Granzen B,Auffermann, W: Algorithm for DNA cytophotometry. AnalytQuant Cytol 1984,6:1-8
12. Bacus JW, Grace LJ: Optical microscope system for stan-dardized measurements and analyses. Applied Optics1987,26:3280-3293
13. Sporn MB, Roberts AB: Autocrine growth factors and can-cer. Nature 1985,313:745-747
14. Massague J: Epidermal growth factor-like transforminggrowth factor. J Biol Chem 1983, 258:13614-13620
15. Libermann TA, Friesel R, Jaye M, Lyall RM, Westermark B,Drohan W, Schmidt A, Maciag T, Schlessinger J: An angio-genic growth factor is expressed in human gliomas. EMBOJ 1987, 6:1627-1632
16. Derynck RJ: Transforming growth factor a: Structure and bi-ological activities. Cell Biochem 1986,321:293-304
17. Schrieber AB, Winkler ME, Derynck R: Transforming growthfactor a: A more potent angiogenic mediator than epidermalgrowth factor. Science 1986, 232:1250-1253
18. Twardzik DR, Sherman SA, Ranchalis JE, Todaro GJ: Trans-forming growth factors in the urine of normal, pregnant, andtumor-bearing humans. JNCI 1982, 69:793-798
19. Marquart H, Hunkapiller MW, Hood LE, Twardzik DR, De-larco JE, Todaro GJ: Transforming growth factors producedby retrovirus-transformed rodent fibroblasts and human mel-anoma cells: Amino acid sequence homology with epider-mal growth factor. Proc Natl Acad Sci USA 1983, 80:4684-4688
20. Clark WC, Bressler J: Transforming growth factor activity intumors of the central nervous system. J Neurosurg 1988,68:920-924


