Embed Size (px)
Citation preview

Title: Changes to Tier 2 Settlement Rules IA No: HO0052 Lead department or agency: Home Office
Other departments or agencies: HM Treasury; Department for Business, Innovation and Skills; Department for Work and Pensions; Better Regulation Executive; Department of Health; Department for Education; Department for Communities and Local Government; Cabinet Office; Foreign and Commonwealth Office; Devolved Administrations
Impact Assessment (IA) Date: 15/3/2012
Stage: Final
Source of intervention: Domestic
Type of measure: Secondary legislation
Contact for enquiries: Migration Policy, Home Office
Summary: Intervention and Options RPC Opinion: AMBER
Cost of Preferred (or more likely) Option
Total Net Present Value
Business Net Present Value
Net cost to business per year (EANCB on 2009 prices)
In scope of One-In, One-Out?
Measure qualifies as
-£288m -£0.6m £0.06m Yes IN
What is the problem under consideration? Why is government intervention necessary?
The Government believes that Britain can benefit from migration but not uncontrolled migration. The Government has indicated that through a more rigorous and controlled approach there will be fewer non-EU migrants than in the past and a significant reduction in net migration. The goal is a smarter, more selective, more responsive system that commands public confidence and serves the UK’s economic interests. To help achieve the Government’s migration aims, the settlement rules for skilled and highly skilled workers have been reviewed.
What are the policy objectives and the intended effects?
To be more selective about those workers that are allowed to settle in the UK in order to break the link between coming to work and staying permanently. To reserve settlement for those who make the biggest economic contribution. To reduce the adverse social impacts of migration and improve public confidence in the immigration system. To reduce reliance on migrant labour, while ensuring that employers are able to recruit the migrants they need to fill skills shortages and drive growth, and that Britain remains open for business. To reduce the numbers settling and thus contribute to reducing net migration.
What policy options have been considered, including any alternatives to regulation? Please justify preferred option (further details in Evidence Base)
Option 1: do nothing. Option 2 (preferred option): T2 settlement pay threshold of £35k or going rate for job, whichever is higher. Non-regulatory options include measures to up-skill the resident labour force but alone these will not achieve the objectives outlined above. A more selective settlement policy requires policy intervention. A range of options has been considered (see Section D2); this IA presents the final policy set against the ‘do nothing’ option. Independent advice was sought from the Migration Advisory Committee (MAC) and from a public consultation and the final policy reflects the advice and feedback. The Migration Advisory Committee report “Analysis of the Points Based System: Settlement rights of migrants in Tier 1 and Tier 2” provides further information on options considered by the Committee.
Will the policy be reviewed? It will be reviewed. If applicable, set review date: 04/2017
Does implementation go beyond minimum EU requirements? N/A
Are any of these organisations in scope? If Micros not exempted set out reason in Evidence Base.
MicroYes
< 20 Yes
SmallYes
MediumYes
LargeYes
What is the CO2 equivalent change in greenhouse gas emissions? (Million tonnes CO2 equivalent)
Traded: N/A
Non-traded: N/A
I have read the Impact Assessment and I am satisfied that (a) it represents a fair and reasonable view of the expected costs, benefits and impact of the policy, and (b) that the benefits justify the costs.
Signed by the responsible Minister: Date: 14 March 2012
1

Summary: Analysis & Evidence Policy Option 1 Description: Do Nothing
FULL ECONOMIC ASSESSMENT
Net Benefit (Present Value (PV)) (£m) Price Base Year 2011
PV Base Year 2011
Time Period Years 10 Low: 0 High: 0 Best Estimate: 0
COSTS (£m) Total Transition (Constant Price) Years
Average Annual (excl. Transition) (Constant Price)
Total Cost (Present Value)
Low 0 0 0
High 0 0 0
Best Estimate 0
1
0 0
Description and scale of key monetised costs by ‘main affected groups’
No additional monetised costs
Other key non-monetised costs by ‘main affected groups’
No additional non-monetised costs. There is the potential for some short-run displacement of resident workers by migrants in the UK; and for continued costs and risks associated with the public service and social impacts of migrants.
BENEFITS (£m) Total Transition (Constant Price) Years
Average Annual (excl. Transition) (Constant Price)
Total Benefit (Present Value)
Low 0 0 0
High 0 0 0
Best Estimate 0
1
0 0
Description and scale of key monetised benefits by ‘main affected groups’
No additional monetised benefits
Other key non-monetised benefits by ‘main affected groups’
No additional non-monetised benefits
Key assumptions/sensitivities/risks Discount rate (%) 3.5
It is assumed Tier 1 and 2 settlement volumes will fall from around 60,000 in 2010 to around 10,000 to 39,000 per annum from 2016 onwards in the absence of any other changes, due to the impact of policies introduced in April 2011 to limit the volumes of migrants entering the UK under these routes. It is also assumed that there is no labour market displacement of resident workers by migrants. Risks include: migrants continue to settle in the UK without sufficiently high skills; risks of continued negative social impacts associated with migration;
BUSINESS ASSESSMENT (Option 1)
Direct impact on business (Equivalent Annual) £m: In scope of OIOO? Measure qualifies as
Costs: 0 Benefits: 0 Net: 0 No NA
2

Summary: Analysis & Evidence Policy Option 2 Description: T2 settlement pay threshold of £35k, exemptions for Shortage and PhD occupations, threshold frozen until April 2018. FULL ECONOMIC ASSESSMENT
Net Benefit (Present Value (PV)) (£m) Price Base Year 2011
PV Base Year 2011
Time Period Years 10 Low: -142 High: -433 Best Estimate: -288
COSTS (£m) Total Transition (Constant Price) Years
Average Annual (excl. Transition) (Constant Price)
Total Cost (Present Value)
Low 0.3 25 187
High 0.9 78 596
Best Estimate 0.6
6
51 392
Description and scale of key monetised costs by ‘main affected groups’
Reduction in economic output - estimated at £181m to £575m over 10 years (present value), these costs could be lower depending on whether there is labour market displacement of resident workers by migrant workers; reduction in UKBA ILR fee income - £6m to £20m over 10 years (present value); training and familiarisation costs for employers, private and third sector immigration advisers and public sector workers - £0.3million to £0.9million in 2016.
Other key non-monetised costs by ‘main affected groups’
Reduction in GDP per capita; reduction in any positive dynamic impacts of migrants on economic growth; potential costs to employers of recruiting, training and/or upskilling resident workers to replace lost migrants if there is labour market displacement, and hence replacement of migrant workers with resident workers. This is likely to vary across sectors affected.
BENEFITS (£m) Total Transition (Constant Price) Years
Average Annual (excl. Transition) (Constant Price)
Total Benefit (Present Value)
Low 0 6 45
High 0 21 163
Best Estimate 0
0
14 104
Description and scale of key monetised benefits by ‘main affected groups’
Reduction in public service and social impacts of migration, including: reduction in health care costs (£8m to £29m over 10 years (present value)); reduction in education costs for migrant child dependants £11m to £54m over 10 years (present value)); reduction in crime costs (£1 to £5m over 10 years (present value));reduction in UK Border Agency settlement case processing costs (£2m to £7m over 10 years (present value)).
Other key non-monetised benefits by ‘main affected groups’
Reduction in wider negative public service and social impacts of migration, including: reduction in contribution to higher population growth; reduction in negative impacts of migration on housing, congestion and wider public service provision; potential increase in social cohesion in the UK; increase in public confidence in the immigration system; potential benefit to resident workers if there is reduced likelihood of labour market displacement of resident workers by migrants.
Key assumptions/sensitivities/risks Discount rate (%) 3.5
Baseline Tier 1 and 2 entry volumes will remain stable in the absence of policy changes; between 29% and 40% of migrants entering the UK will remain at settlement; migrant wages on entry are a good indicator of their wages at settlement; introducing a salary requirement of £35k at settlement, but exempting SOL and PhD occupations and holding the pay threshold until 2018, will reduce the numbers qualifying by around 16% per annum; no labour market displacement by migrants. Key risks include: potential recycling of migrants that do not qualify if the Tier 2 General entry limit is not reached; negative impacts on some sectors such as nursing and teaching.
BUSINESS ASSESSMENT (Option 2)
Direct impact on business (Equivalent Annual) £m: In scope of OIOO? Measure qualifies as
Costs: 0.06 Benefits: 0 Net: -0.06 Yes IN
3
Changes to Tier 2 Settlement rules: Evidence Base A. Strategic Overview A.1 Background The Points Based System (PBS) was introduced between February 2008 and March 2009 in phases and replaced over 80 predecessor routes, wrapping them up into five tiers. Work-related migration is catered for through Tiers 1, 2 and 5 of the PBS. Summary of the Points Based System:
Tier 1: Investors, Entrepreneurs and Exceptional Talent Migrants
Tier 2: Skilled workers with a job offer Tier 3: Low skilled workers (currently suspended) Tier 4: Students Tier 5: Temporary Workers and Youth Mobility - primarily for non-
economic reasons.
The Tier 2 (General) Resident Labour Market Test (RLMT) route enables employers to bring an employee from overseas to fill a vacancy in the UK if it has not proved possible to employ a worker from the resident labour market. The job needs to be skilled to National Qualifications Framework level 4 or above (NQF4+). Jobs paid £150,000 or more are exempt from the requirement to test the resident labour market. The Tier 2 (General) shortage occupation (SOL) route enables migrants to come to the UK to work in certain occupations and job titles on the UK Border Agency shortage occupation list. Occupations need to be skilled to NQF4+ and be experiencing a shortage of labour that can sensibly be filled from outside the EEA. The lists are reviewed periodically.
The RLMT and Shortage Occupation routes are subject to an annual entry limit. The limit in 2011/12 was 20,700 migrants.
The Tier 2 ministers of religion (MOR) route is for ministers of religion undertaking preaching and pastoral work, missionaries or members of religious orders taking up employment or a post or role within their faith community in the UK.
The Tier 2 sportsperson route is for elite sportspersons and coaches whose employment will make a significant contribution to the development of their sport at the highest level.
The Tier 1 exceptional talent route is for migrants who are internationally recognised as world leaders or potential world leaders in science or the arts. A designated competent body must endorse entry through this route. This route went live on 9 August 2011 and is subject to an annual limit of 1,000 places. To qualify for settlement, Tier 1 and Tier 2 migrants will currently need to show they:
have spent a continuous period of five years lawfully in the UK; can demonstrate knowledge of the English language and life in the UK; are free of unspent criminal convictions; continue to meet at least the minimum income threshold which applied when they last
extended their permission to stay in the UK; continue to be required for employment (Tier 2) or remain economically active (Tier 1);
and,
4

must not fall under the general grounds for refusal.
More specifically, once an application for settlement is made, an explicit obligation is placed on the sponsor who last issued the Certificate of Sponsorship allowing the applicant grant of leave to remain in the UK. The grant may have been related to applicants on either the Resident Labour Market Test (RLMT) route or the Shortage Occupation route. The Sponsor must certify in writing that (i) he or she still requires the applicant for the employment in question, and (ii) that the applicant is paid at or above the appropriate rate for the job as set out in the relevant UK Border Agency code of practice for sponsored skilled workers.
There are no requirements additional to those set out above for persons in the UK under the sportsperson or ministers of religion routes applying for settlement.
To qualify for settlement through the Tier 1 exceptional talent route, the applicant must be economically active in his or her expert field, and be in employment, or self-employment, or both.
For the routes discussed in this section, adult dependants are eligible to apply for settlement at the same time as the principal migrant, as long as they have lived with him or her in the UK for a minimum of two years. Children are usually eligible to apply for settlement at the same time as their parents. The Government consultation document – Employment related settlement, Tier 5 and overseas domestic workers1 proposed changes to Tier 1 and Tier 2 settlement rights. Following that consultation, the Government has decided to leave Tier 1 settlement arrangements unchanged. This impact assessment considers changes to settlement rights for the Tier 2 migrant groups set out above. A.2 Groups Affected The key groups affected by the policy are:
Migrants in Tier 2 routes and their dependants; UK-based employers who recruit non-EU migrants (sponsors) under Tier 2; Private and Third sector immigration lawyers and advisers; Government departments and agencies, including the UK Border Agency which is
responsible for administering the immigration system, and other Government departments which have an interest in work-related migration;
A.3 Consultation Within Government The Government departments consulted and involved in the formulation of the policy include: HM Treasury; Department for Business, Innovation and Skills; Department for Work and Pensions; Better Regulation Executive; Department of Health; Department for Education; Department for Communities and Local Government; Cabinet Office; Foreign and Commonwealth Office; Ministry of Justice; Department for International Development; Department of Transport; Department for Environment, Food and Rural Affairs; Department of Energy and Climate Change; and the devolved administrations. Public Consultation
1 See: http://www.ukba.homeoffice.gov.uk/sitecontent/documents/policyandlaw/consultations/employment-related-settlement/
5

A public consultation was conducted by the UK Border Agency (UKBA) from 9 June to 9 September 2011. A summary of consultation responses is at Annex 2. In addition, the independent Migration Advisory Committee (MAC) issued a call for evidence to inform its report on Tier 1 and Tier 2 settlement. Consultation responses and the MAC’s advice have been used to inform the final set of policy proposals and impact assumptions – see section D.2 to look at options previously considered and how they were influenced by the consultation responses. B. Rationale The rationale for changes to the Tier 2 settlement criteria is to help deliver an improved, more selective, immigration system that reduces net migration, commands public confidence and serves the UK’s economic interests. The Government has also pledged to break the link between temporary migration and settlement2. In 1997, there were 59,000 grants of settlement in total and less than 10,000 employment-related grants. In 2011, settlement grants (including dependants) totalled 163,000, of which 70,000 were from employment routes. Employment-related settlement grants increased from 17% of total settlement grants in 1997 to 43% in 2011. The vast majority of employment-related settlement (over 61,000 in 2011) is from Tier 1 and Tier 2 or the precursor routes. C. Objectives The Governments’ objectives are to:
break the link between coming to the UK to work and staying permanently, by being more selective about those who stay, reserving settlement for those who make the biggest economic contribution;
reduce any adverse social impacts of immigration and improve public confidence in the immigration system through the introduction of better controls;
reduce reliance on migrant labour, while ensuring that employers are able to recruit the
migrants they need to fill skills shortages and drive growth, and that Britain remains open for business;
contribute to the Government’s aim of lowering net migration by ensuring that only the
brightest and the best are able to settle in the UK. D. Options The policies analysed in this impact assessment relate to changes to Tier 2 settlement considered in the consultation document – Employment related settlement, Tier 5 and overseas domestic workers.3 For ease, this impact assessment presents the final Tier 2 settlement proposals as one option described below, set against the do nothing option. Other options considered, including non-regulatory options, are discussed in section D2. 2 Immigration Limit Oral Statement: http://www.ukba.homeoffice.gov.uk/sitecontent/documents/news/oral-statement-imm-limit.pdf
3 See: http://www.ukba.homeoffice.gov.uk/sitecontent/documents/policyandlaw/consultations/employment-related-settlement/
6

D.1 Options Assessed Option 1 - Do nothing.
Option 1 is the “do nothing” option, the option which involves no change in policy and where settlement volumes are assumed to continue to follow the trends governed by the previous policy framework and driven by economic and social developments.
Although Tier 1 and 2-related settlement volumes are predicted to fall as a result of a range of factors including the effects of the annual limit on Tier 2 General entry and other recent measures to tighten entry criteria for work routes, the “do nothing” option would not meet the Government’s objectives, set out above. In particular, it would not provide a clear break between coming to work and staying permanently, nor would it enable the Government to ensure that only the brightest and the best migrants are permitted to settle in the UK. Without additional measures to restrict settlement and cap temporary leave, outflows of migrants are unlikely to increase. Option 2 - Changes to tighten settlement criteria for Tier 2 migrants
Allow Tier 2 General migrants to settle if they earn over £35,000 per annum or the going
rate for the job as specified in the Tier 2 codes of practice, whichever is higher for all Tier 2 General settlement except those in shortage occupations and specified PhD level jobs;
Apply the same pay threshold to Tier 2 Sportsperson route; Hold the pay threshold at £35,000 until April 2018 and up-rate it annually in line with
wage inflation thereafter. Leave the Tier 2 Ministers of Religion route unchanged; Cap all Tier 2 General, Minister of Religion and Sportsperson temporary leave at 6
years. Those who do not settle after this time will be expected to leave the UK. Leave will be issued for three years on entry and up to a further three years’ leave to remain in the UK.
D.2 Options Previously Considered
Regulatory options
A number of options were considered during the consultation. Each option is set out briefly below, and the rationale for discounting it is described. In general, either feedback from the consultation and/or advice from the MAC has suggested that these options are either not suitable, not economically efficient or otherwise undesirable.
Settlement criteria: The MAC was commissioned to provide advice on what criteria could be used to identify the most economically important Tier 2 migrants for settlement. The MAC considered a range of criteria including age and qualifications but concluded a simple pay threshold would be the most suitable policy. Pay is considered a good indicator of skill and adopting it as the primary criterion is consistent with economic theory and employers’ requests for simplicity and certainty.
Settlement pay threshold options: The MAC advised that a minimum pay
threshold of between £31k and £49k, specified at the time of entry and up-rated over time to account for price or pay inflation would be economically defensible. Thresholds across this range were considered by the Government (see Annex 5) including setting the pay threshold at a level equal to the 50th or 75th percentile of earnings for the migrant’s occupation (based on ASHE data). However, setting individual thresholds for occupations or sectors would add a substantial degree of
7

Options for exempting specific groups: the MAC recommended that exceptions
from the pay threshold for specific groups should be limited in their scope and the economic or other reasons for them explicitly articulated by Government. In view of the lower salaries relative to skill level in research occupations, and in view of the potential contribution of the higher education sector to long term growth, the Government has decided to exempt certain PhD level occupations from the settlement pay threshold, provided they continue to earn the salary level specified on entry4. Similarly, the Government intends to exempt shortage occupations from the threshold. This will ensure shortages in the domestic labour market are met, and recognises the role of the Shortage Occupation List in provision of key public services at a time of heavily constrained public finances. With regard to Ministers of Religion, the MAC noted this is not an economic route and therefore they made no recommendation in relation to it. In recognition of its distinct, non-economic status, the Government has decided to leave the settlement rules for Ministers of Religion unchanged.
A numerical limit on grants of settlement: this option was considered but
rejected: a key message emerging from the consultation was that employers required a degree of certainty that would not be provided by a numerical limit. A simple pay threshold is considered to deliver sufficient control over the volume and type of migrant settling to meet the Government’s policy objectives.
Restricting settlement of Tier 1 exceptional talent migrants: the consultation sought
views on whether settlement should be restricted for Tier 1 exceptional talent migrants; and whether Tier 1 temporary leave should be capped at five years. The volume of exceptional talent migrants is expected to be low and these migrants are likely to contribute significantly to UK economy and society. Given the limited and highly selective nature of this route, such restrictions were considered unnecessary, although the MAC recommended the exceptional talent route be kept under review.
The consultation also discussed changing the point at which work migrants apply for settlement, proposing that those wishing to settle should apply for a permanent migration visa after three years in the UK, subject to strict criteria and possibly a numerical limit. The possibility of employer sponsorship at the three-year point was discussed; and it was also proposed to introduce a language requirement for dependants of those intending to stay permanently. Those successful at the three-year- point would move into a permanent migration route and be able to apply for settlement in year five, while the rest could stay for up to five years, and then be required to leave the UK. Although this approach was designed to give employers some degree of certainty (from year 3) over which migrants were likely to be permitted to remain permanently, a key message from business during the consultation was that clarity at the point of entry is an important part of attracting the brightest and best migrants. They felt that taking a pre-settlement decision at the three-year point added complexity and uncertainty. This option was therefore not taken forward for final policy development. Employers will continue to be obliged to confirm that the migrant is required for employment; the Government will consider whether changes to the UK Border Agency fees structure are necessary in the context of future fees rounds. Proposals for increasing the level of English language
4 See table A.3.3 in Annex 3 for a list of PHD-level occupations that will be exempt from the proposals
8

competency required at settlement, including for dependants of Tier 2 migrants, were included in the Family Migration Consultation and will be taken forward separately. Non-regulatory options Non-regulatory options could include measures encouraging migrants not to settle in the UK or encouraging employers to recruit and up-skill resident workers. The Government believes that non-regulatory options would prove both unsuitable and insufficient to meet the Government’s objectives. The Government’s objectives include a more selective settlement policy that breaks the link between temporary migration and staying permanently. Non-regulatory measures would not deliver the required level of control; they are unlikely to improve public confidence in the immigration system; and they would be liable to deter those migrants the UK needs, and who will make a significant economic contribution, while having less influence on less economically valuable migrants. E. Appraisal Time Period of Appraisal The impacts are estimated over ten years in line with guidance from the Better Regulation Executive (BRE) and the Regulatory Policy Committee (RPC). The impacts of the proposals, particularly those on limiting settlement, are unlikely to have an immediate impact. An economic migrant is only eligible for settlement after they have been in the UK on a qualifying route for a period of five years. The proposals contained in the accompanying consultation document refer to Tier 2 migrants entering the UK under the Immigration Rules in force from April 2011. Thus they would only be eligible for settlement after April 2016. Likewise, the proposal that Tier 2 temporary leave should be limited to a period of six years for those entering from April 2011 will only have an impact from April 2017. E.1 Volume Impact Internal modelling has been used to estimate the impacts of the policies on the volume of migrants settling in the UK. Given the uncertainty in projecting migration volumes forward, we present high and low scenarios for baseline settlement volumes based upon estimates provided by the MAC. Annex 3 has a full list of assumptions used in the modelling; Annex 4 presents more detailed statistics on the settlement route. Option 1 The baseline scenario below sets out estimated Tier 1 and 2 entry and settlement volumes under the option 1 ‘Do nothing’ option, against which we compare estimated post-policy volumes in 2011 and beyond with what we estimate they would otherwise have been, in the absence of any policy changes. The baseline includes the estimated impacts of the limits on Tier 1 and Tier 2 migration that have already been announced. This allows us to identify only the direct impacts from the change in settlement policy. Tier 1 and 2 Entry volumes In determining our baseline estimates, we use assumptions set out by the MAC and based on the analysis in Migrant Journey Analysis. The MAC use ranges to reflect the uncertainty in: firstly, the volume of Tier 1 and Tier 2 General visa grants per annum; secondly, the proportion of Post-Study Work Route (PSWR) migrants who will apply for and qualify for Tier 2 when the PSWR route is closed; thirdly, the dependant ratio for Tier 1 and Tier 2 migrants; and fourthly, the propensity to settle in the UK of the migrants that are in Tiers 1 and 2.
9

The settlement policy changes relate to Tier 2 migrants and their dependants. Since April 2011, visa grants in the Tier 2 General route have been subject to a limit of 20,700 per annum (excluding dependants). However, in the period from April 2011 to December 2011, Tier 2 General visa grants were running at around 40% of the limit. It is therefore assumed that volumes will range from around 8,400 (the current level) to 20,700 (the limit in 2011/12 onwards). In 2011, there were 342 Tier 2 Ministers Of Religion (MOR) and 232 Tier 2 Sportspersons visas issued to main applicants. It is assumed that the combined volumes will remain between 300 and 900 (50% lower and higher than current volumes) from 2011 onwards. In addition, it is assumed that between 11,000 and 19,000 main applicants who enter the UK through a route not leading to settlement will switch in-country into Tier 2 (General) each year after the post-study work route closes. According to the most recent published figures, there were 33,973 in-country grants to post-study work route main applicants in 2010 (Immigration Statistics 2011). In Home Office research: User’s Views of the PBS: Tier 1 Applicant’s Survey, it was estimated that approximately half of post-study work route migrants were employed in the top three 1-digit SOC 2000 groups. In the Impact Assessment for Reform to the Student Immigration System,5 it was assumed that only half the migrants would meet the criteria to qualify for Tier 2 (General). Consequently, it is estimated that around 17,000 (50 per cent) main applicants in the PSWR would instead have switched from Tier 4 (and its precursor route) from study to employment in Tier 2 (General) if the PSWR had been closed. Because Tier 4 migrants switching into the post-study work route do not initially need a job offer, while those that switch into Tier 2 (General) do, this estimate probably represents an over-estimate of future switching from Tier 4 to Tier 2, so it forms our upper bound. To reflect the uncertainty around these calculations, a lower bound estimate of 50 per cent of this figure has been assumed. To these figures are added the number of Tier 4 and (its precursor route) main applicants recently switching directly into Tier 2 (General). In the year to 2011 Q2, the latest readily available data,, 11,495 main applicants were granted in-country leave under the Tier 2 (General) route (Migration Statistics 2011). Of these, around 20 per cent switched from Tier 4 and its precursor route. Therefore, we estimate that 2,300 main applicants per year switch directly from Tier 4 (and its precursor route) into Tier 2 (General). For Tier 1, we assume those entering the Exceptional Talent route will be between zero and 1,000 per year (the annual limit).6 In 2011, prior to the establishment of Tier 1 as a route for only exceptional talent, there were 331 Tier 1 Investor main applicant visa grants, and 420 Tier 1 Entrepreneur main applicant visa grants. For those entering under the Investor and Entrepreneur routes, we assume volumes will be between 50% higher and lower than current volumes, so total visa grants will vary between 400 and 1100 per annum. The MAC assume that the dependant ratio will lie between 0.71 (the dependant ratio for Tier 2 main applicants on entry) and 1.27 (the dependant ratio for employment-related migrants at settlement). These ratios are based on published Migration Statistics for 2010 and UK Border Agency Management Information respectively. The same assumptions for dependants have been used in this assessment. Duration of Stay of Tier 1 and 2 migrants The Home Office research the Migrant Journey Analysis report suggests that of the cohort of “work” migrants granted a visa in 2004 in routes leading to settlement, 29% had reached settlement five years later, and a further 11% were still in the same route, that is working in the
5 See: Impact Assessment on Reforms to the Student Immigration System, Home Office 2011.
6 The Tier 1 Exceptional Talent Route went live in July 2011.During the period July – December 2011, only 7 applications have been granted..
10

UK with a path to settlement.7 It is therefore assumed that between 29% and 40% of Tier 1 and Tier 2 migrants across all routes will remain and settle in the UK after 5 years. It is assumed that this propensity to stay in the UK is the same for all groups of Tier 1 and 2 migrants affected in the absence of any other information. It is possible that propensity to settle may vary for future cohorts or for different routes – for example, the new Tier 1 Exceptional Talent route and changes to the Tier 1 Investor and Entrepreneur routes in April 2011 may encourage increased settlement for such groups. Recent evidence from analysis of a cohort of Tier 2 migrants in 2009 (based on a sample of 456 main applicants for whom occupation details could be obtained from UKBA Management Information) on their propensity to settle suggest that those most likely to settle were those at the lower end of the skills and income distribution – for example chefs, nurses and care workers.8 If this evidence holds for future cohorts that are likely to be more skilled, it would be likely that settlement rates would be lower as a result. Tier 1 and 2 Settlement baseline volumes Under the above assumptions, we estimate that the number of Tier 1 and Tier 2 settlement grants would be around 60,000 from 2011 to 2016, and then would have fallen to between 10,000 and 39,000 per annum from 2016. Our low and high Tier 1 and 2 settlement baseline scenarios are presented in the table below from 2016 onwards. Table 1: Tier 1 and 2 settlement grants – Baseline (rounded)
Route 2016/17 20117/18 2018/19 2019/20 2020/21
T1 Settlement – low 0 0 0 0 0
T2 Settlement – low 10,000 10,000 10,000 10,000 10,000
T1 Settlement – high 2,000 2,000 2,000 2,000 2,000
T2 Settlement – high 37,000 37,000 37,000 37,000 37,000
Total T1/T2 Settlement – low 10,000 10,000 10,000 10,000 10,000
Total T1/T2 Settlement – high 39,000 39,000 39,000 39,000 39,000Note – Tier 1 includes Tier 1 Investors, Tier 1 Entrepreneurs and Tier 1 Exceptional Talent; Tier 2 includes Tier 2 General, Tier 2 (bridge from PSWR), Tier 2 Ministers of Religion and Tier 2 Elite Sportspersons. Numbers may not sum due to rounding. Dependants are included. It is from this baseline that the settlement policy proposals set out above are measured. Option 2 The key proposals and expected volume impact are set out below. Categorise all visas as either ‘temporary’ or ‘permanent’; the aim of this proposal is to introduce effective labelling of migration products to ensure migrants understand the entitlement their product gives them on entry. It is not expected to change migration or settlement volumes. Allow Tier 2 General and Tier 2 Elite Sportsperson migrants, who meet the pay threshold or exemption criteria, to qualify for settlement after five years. Cap temporary leave for all Tier 2 migrants (including Ministers of Religion) at six years. This will apply to Tier 2 migrants entering the UK from April 2011 onwards. Tier 2 migrants who do not meet the settlement criteria will be expected to leave the UK after a maximum of six years. This will reduce net migration, through increasing emigration. However, the policy will not have an effect until April 2017.
7 http://www.homeoffice.gov.uk/publications/science-research-statistics/research-statistics/immigration-asylum-research/horr43/
8 Forthcoming research: Home Office (2011): Analysis of Tier 2 Migrants: Previous Salaries and Occupations of those eligible to settle
11

Evidence Evidence for setting threshold The MAC recommended setting the Tier 2 settlement salary threshold within a £31k to £49k range. This range is based on the median, mean and 75th percentile earnings of UK workers skilled to NQF4+, which is the current minimum skill level of migrants using Tier 2 General. The gross pay distributions are generated using Labour Force Survey (LFS) data and Annual Survey of Hours and Earnings (ASHE) data, and by taking two different approaches: qualifications-based which reflects the pay distributions of individuals holding NQF4+ qualifications and occupation-based which reflects the pay distribution of those employed in NQF4+ occupations (ASHE does not record qualifications held). The ranges are set out in the table below: Table 2: Pay distribution of those skilled to National Qualifications Framework level 4 and above Source LFS LFS ASHE
Approach Qualifications-
based Occupation-
based
Measure (£ per year)
Median 31,000 35,000 36,000
75th percentile 43,000 45,000 49,000
Mean 36,000 39,000 46,000 Source: Migration Advisory Committee (2011) The Government, following consideration of consultation responses, intends to use a threshold towards the lower end of the range recommended by the MAC (£35k p.a. gross). In addition, the Government intend using median earnings rather than mean earnings to ensure those who qualify are in the top half of the UK earnings distribution for the skill level of their occupation. The occupation-based approach is considered most apt since it relates to the earnings of those in skilled jobs and is therefore most consistent with Tier 2 General entry criteria that focus on the job, rather than qualifications held. To provide certainty for migrants and employers, the Government intends to hold the pay threshold at £35k until April 2018 and up-rate it in line with wage inflation thereafter. The level of the threshold for 2018-19 will be announced during 2013. Specified PhD level jobs will be exempt, allowing these migrants to settle if they continue to be paid what they were on entry. This provides symmetry with Tier 2 entry rules, based on these migrants’ potential to promote economic growth at low pay relative to skill level. Jobs on the Shortage Occupation List will also be exempt. Again, this provides symmetry with Tier 2 entry rules and recognises the role such migrants have in filling shortages in the domestic labour market, including some key public sector roles. Based on consultation responses from employers, the Government will provide a degree of flexibility by allowing all Tier 2 migrants the possibility of temporary leave up to a maximum of six years. This will help to mitigate any negative impacts on employers when the policy is implemented. Migrants will be eligible for leave to enter the UK lasting for a period of three years and further leave to remain in the UK, again for a three year period. The MAC recommended the Government apply the same settlement threshold to Tier 2 Elite Sportspeople as to the Tier 2 General Route.
12

Evidence for estimating impact To estimate the impact of a salary threshold of £35k, management information on the earnings of Tier 2 General migrants on entry to the UK was used.9 The earnings distribution is shown below: Chart 1: Earnings distribution of Tier 2 General migrants post-April 2011
0
10
20
30
40
50
60
70
20 22 24 26 28 30 32 34 36 38 40 42 44 46 48 50Pay threshold (£000s per year)
Pro
port
ion
excl
uded
(%
)
20 per cent excluded at a pay threshold of £31,000
59 per cent excluded at a pay threshold of £49,000
Source: Analysis by the Migration Advisory Committee 2011 based on UK Border Agency Management Information Analysis by the MAC suggests that at a threshold of £31k, around 20% of Tier 2 General migrants would no longer qualify for settlement, and at a threshold of £49k, around 59% of Tier 2 General migrants would no longer qualify for settlement. Impact of Proposals The proposal is to have a gross salary threshold of £35k p.a. for Tier 2 General and Sportsperson migrants, but that migrants in shortage and PHD-level occupations will be exempt. The pay threshold will be held at £35k until April 2018. It is estimated that around 35% of current Tier 2 migrants would not qualify for settlement at a salary threshold of £35k. However, by exempting Ministers of Religion, shortage occupations and PHD-level occupations, and holding the threshold at £35k until April 2018, it is estimated that overall only around 16% of Tier 2 migrants would no longer qualify. Applying this impact assumption against the baseline volumes, it is therefore estimated that the combined policy package will reduce total Tier 1 and Tier 2 settlement in 2016-17 to a range of 8,000 to 33,000 compared to around 60,000 in the 12 months to June 2011 and a ‘do nothing’ estimate of 10,000 to 39,000. These figures include dependants. 9 The data used are for earnings including allowances for Certificates of Sponsorship (CoS) used since April 2011.
The data are filtered to account for the fact that some CoS used after April 2011 will have been granted before that date, and so will have been subject to the previous Tier 2 General policy. For the RLMT route, the data are filtered by excluding occupations not skilled to NQF4+. For the shortage occupation route, the data are filtered to exclude occupations not on the shortage occupation list as of 6 April 2011, and to exclude chefs earnings under £28,260. For both the RLMT and shortage occupation routes, all earnings of less than £20,000 are excluded. A maximum of ten occupations according to the number of observations excluded by the pay threshold are listed under each threshold, restricted only to those for which at least 10 observations are excluded.
13

Table 3: Tier 1 and 2 settlement grants – Option 2
Route 2016/17 20117/18 2018/19 2019/20 2020/21
T1 Settlement – low 0 0 0 0 0
T2 Settlement – low 8,000 8,000 8,000 8,000 8,000
T1 Settlement – high 2,000 2,000 2,000 2,000 2,000
T2 Settlement – high 31,000 31,000 31,000 31,000 31,000
Total T1/T2 Settlement – low 8,000 8,000 8,000 8,000 8,000
Total T1/T2 Settlement – high 33,000 33,000 33,000 33,000 33,000Source – Analysis of UKBA Management Information Note – Tier 1 includes Tier 1 Investors, Tier 1 Entrepreneurs and Tier 1 Exceptional Talent; Tier 2 includes Tier 2 General, Tier 2 (bridge from PSWR), Tier 2 Ministers of Religion and Tier 2 Elite Sportspersons. Numbers may not sum due to rounding. These figures include dependants. Impact across Tier 1 and 2 sub-routes: At £35k ( until 2018) and with shortage and PHD-level occupations exempt, we expect the following proportions of existing migrants to qualify for settlement across Tier 1 and the Tier 2 sub-routes: Table 4: Estimated percent of sub-route that will qualify for settlement – Option 2 Sub-Route % of route that will
qualify for settlement
Tier 2 RLMT 82%Tier 2 SOL 100%Tier 2 Ministers of Religion 100%Tier 2 Elite Sportspersons 55%Tier 2 Total 84%Tier 1 Exceptional Talent 100%Tier 1 Investors and Entrepreneurs 100%
Source: Analysis of UKBA Management Information We can see that the largest impacts will be on the Elite Sportsperson route, where only 55% of those entering are likely to qualify under the new settlement rules. Impacts across sectors: At the proposed salary threshold of £35k p.a., with the exemptions described above, we estimate 48% of migrant nurses, 37% of primary school teachers, 35% of IT/software professionals and 9% of secondary teachers would be excluded. Scientists, researchers and higher education teachers would have been affected by the £35k salary threshold, but by exempting specified PhD-level occupations, there should be no impact on these groups. Further detail is included in the impact on sectors section below. E.2 Net migration Impacts Option 2 We estimate that these restrictions on settlement will lead to some reductions in net migration of between 0 and 4,000 per year at a salary threshold of £35k p.a. from 2017 onwards. These are calculated using historic scaling factors between visa grants and IPS inflows, around 0.65 for main applicants and 0.54 for dependants. However, we assume that migrants leaving will be replaced by new migrants until the Tier 2 General entry limit is reached. Thus there is no net migration impact until the Tier 2 limit is reached. We might also expect up-skilling of the UK labour force to enable some employers to recruit domestically, thus delivering a net migration benefit even if the limit is undersubscribed but these effects are impossible to estimate with any
14

reliability. E.3 Appraisal (Costs and Benefits) In the following sections, the expected impacts of options 1 and 2 are set out. The estimated volume impacts of the policy framework are translated into monetary values for inclusion in the cost-benefit analysis under two broad headings – direct costs and benefits, and indirect, or “wider”, costs and benefits.
The direct costs and benefits are those that are clearly related to the activities of those coming through the routes under consideration, and the operations of institutions and the UKBA in processing their applications. The direct costs include training and familiarisation costs for the UKBA and sponsors, and reductions in UKBA settlement income. The direct benefits are dominated by a reduction in UKBA processing costs as settlement volumes fall. The impacts on businesses through changes in levels of employment are a direct impact. However, it is believed that working migrants are marginal hires. Thus their wage is equal to their marginal productivity, and the cost in terms of lost output is equal to the benefit of the saved wage. Overall, the direct impact on business is expected to be zero. This is explained further on page 21. The wider costs and benefits are those more closely associated with economic output and labour market activity. The wider costs include the impact on UK GDP and GDP per capita. The wider benefits of a reduction in settlement volumes relate to reduced pressure on public services and improvements in social cohesion.
The following sections describe in more detail how costs and benefits have been calculated, and summarises the results. In general the method is straightforward: total costs and benefits are the product of a change in volume and an estimated unit cost or benefit, adjusted for the impact being considered and discounted at a rate of 3.5%, in line with HM Treasury Green Book guidance. Ranges are used to reflect the uncertainty in potential impacts. Option 1 – do nothing Costs The ‘Do nothing’ option represents the baseline against which we analyse option 2. There will be a number of risks associated with option 1.
The link between temporary migration and settlement will continue; There will be no change in the adverse social consequences of migration such as
burdens on the tax payer; No improved public confidence in the migration system; and Net migration will not be reduced.
Benefits The ‘Do nothing’ option represents the baseline against which we analyse option 2. Migrants in Tier 1 and 2 will continue to be able to settle in the UK with their dependants if they meet the same conditions they met on entry to the UK. Option 2 – Tighten Tier 2 settlement criteria The impacts of option 2 are set out below. Ranges have been used to show the low and high end impacts. These are based on the low and high volume assumptions, and also on low and
15

high impact assumptions. In the absence of other information, the central estimates are assumed to be the mid-point of the low and high, and these are set out in the summary table. Direct Impacts The direct impacts of the proposals are estimated by looking at the volumes affected by the policies across the groups identified, and then estimating the total direct costs and benefits of the proposals. The assumptions used to construct the cost and benefit estimates are set out below and a summary table can be found in Annex 3. Costs Set up costs
Familiarisation, training and guidance costs for UKBA: Staff processing applications from Tier 2 migrants will be required to be familiar with settlement policy for Tier 2 migrants. It is estimated that staff will require between three and five hours familiarisation. Assuming around 100 to 120 staff will require familiarisation training, at a wage of £12.60 per hour (the ASHE 2011 median hourly wage for Government administrative staff including on-costs of 21%), this is estimated to cost between £4k and £6k in 2016 (present value). Changes to guidance and rules are assumed to take four members of staff around eight weeks to draft, check and amend. Assuming a wage of £12.60 as per above, this is estimated to cost around £15k in 2016 (present value). Familiarisation, training and guidance costs for legal advisers in the private/third sector: There will be familiarisation costs for the private sector and third sector. Immigration lawyers and advisers will need to be familiar with the policy changes. Assuming there are around 2,000 private sector lawyers and advisers, at a wage of £22.66 (the ASHE 2011 median hourly wage for business professional staff including on-costs of 21%), this is estimated to cost between £40k and £110k in 2016 (present value). Assuming there are around 2,000 third sector lawyers and advisers, at a wage of £11.76 (the ASHE 2011 median hourly wage for administrative staff including on-costs of 21%), this is estimated to cost between £20k and £60k in 2016 (present value). Familiarisation, training and guidance costs for sponsors in the private and third sector: There will be familiarisation costs for private sector and third sector sponsors. In July 2011, there were around 22,000 UKBA-registered Tier 2 sponsors. Assuming one member of administrative staff per sponsor will require familiarisation, at a wage of £11.76 (the ASHE 2011 median hourly wage for administrative staff including on-costs of 21%), this is estimated to cost between £220k and £670k in 2016 (present value). Judicial Review costs The change in policy may encourage those affected to challenge UKBA through a judicial review. Although the risk of judicial review is unquantifiable, for the purpose of this impact assessment, it is assumed that UKBA will be challenged through between one and five judicial reviews in the first year of implementation. The unit cost of a Judicial Review is estimated to be around £3,450 to UKBA in 2016. The costs are therefore estimated to range between £3k and £14k in 2016 (present value). Ongoing Costs
16

Fall in UKBA fee income for settlement applications Increasing the requirements for settlement is expected to reduce the volume of applications and hence reduce UKBA fee income. Applications for settlement in 2011/12 are priced at £972 for main applicants and £486 for dependants. It is assumed these fees will grow in line with inflation of 2% over the long-run (the target inflation rate). Assuming settlement application volumes fall in line with the change in grants set out in table 3 above, UKBA fee income is estimated to fall by between £6 million and £20 million over 10 years (present value). Benefits Fall in UKBA case work costs for settlement applications Increasing the requirements for settlement is expected to reduce the volume of applications and hence reduce UKBA case work costs. Applications for settlement in 2011/12 cost £243 for main applicants and £243 for dependants. It is assumed these costs will grow in line with inflation of 2% over the long-run. Assuming the volumes fall in line with table 3 above, UKBA case work costs are estimated to fall by between £2 million and £7 million over 10 years (present value). Wider Indirect Impacts - Monetised There will be a number of wider economic and social costs associated with option 2. The key effects are discussed below. The indirect costs and benefits of the policy changes are difficult to quantify, but an attempt has been made to do so where appropriate. Where this has not been possible the impact is discussed in the text. Impact on GDP The potential reduction in labour supply resulting from the decrease in volume of migrants, all else being equal, will reduce output compared to the counterfactual. However, by selecting those who earn over £35k, the policy will reduce migrants at the lower end of the earnings distribution. The MAC estimate output loss effects of fewer migrants by looking at the employment rate and earnings of the migrants and their working dependants that will be excluded by the policy.10 Evidence from the Labour Force Survey (LFS) suggests the employment rate for non-EU born that came to the UK for “work” and have been in the UK for at least five years was 85% in 2010 (LFS Q1 2011 to Q4 2011). As set out above UKBA management information on the earnings of migrants on entry to the UK in Tier 2 was used to understand what proportion of migrants would not qualify for settlement under the new salary threshold. This data can be used to estimate the average wage for those that will not qualify. Under the proposed £35k threshold (exempting PHD-level and shortage occupations and holding the threshold at £35k until April 2018), the average salary of those that will not qualify is estimated at £27,300. The net reduction in volumes of main applicant grants is estimated between 1,000 in the low scenario and 2,500 in the high scenario. Under these assumptions, the estimated output loss from fewer main applicants is between £17 million and £49 million per annum from 2016 onwards. As the cumulative volume of main applicants reduced will grow over time, the total impacts over 10 years are estimated between £157 million and £454 million (present value). To understand the output effects of fewer dependants, similar evidence is required on the proportion of working age, the proportion in employment, and their average earnings. Management information on the age of dependants at settlement suggests around 47% are of 10
See: Migration Advisory Committee (2011)
17

working age (see table A.4.2 in Annex 4). Evidence from the LFS (Q1 2011 to Q4 2011) suggests the employment rate for non-EU born that came to the UK to “accompany or join” was 56% and their average earnings were around £18,250 per annum. The net reduction in volumes of dependant grants is estimated between 650 in the low scenario and 3,300 in the high scenario. Under these assumptions, the estimated output loss from fewer dependants is between £2 million and £13 million per annum from 2016 onwards. As the cumulative volume of dependants reduced will grow over time, the total impacts over 10 years are estimated between £24 million and £122 million (present value). Impact on GDP per capita The impacts on GDP per capita will depend on the total impact on output set against the total impact on the population. The estimated impacts on GDP per capita in the low and high scenarios in the first year are set out in the table below: Table 6: Estimated impact of option 2 on GDP per capita GDP per capita Impact Assumptions Low scenario High Scenario A. GDP – baseline 2016 (£m) 1,500,072 1,500,072 B. Population – baseline (m) 62.3 62.3 C. GDP per capita – baseline (£) = (A) / (B) 24,093 24,093 D. Output loss - post-policy (£m) 181 575 E. Population reduction - post policy (m) 0.002 0.006 F. GDP - post-policy (£m) = (A) - (D) 1,499,891 1,499,496 G. Population - post-policy (m) = (B) - (E) 62.260 62.256 H. GDP per capita - post-policy (£) = (F) / (G) 24,091 24,086 I. Change in GDP per capita -£2.31 -£6.97
Note – the GDP 2016 baseline uses 2011 GDP estimate from ONS and assumes it will grow in line with GDP growth assumptions as set out by the Office for Budget Responsibility in March 2011. Overall, there is not expected to be a significant impact on GDP per capita over the short-run. Over the longer-run, however, dynamic effects will have more of an impact on both GDP and GDP per capita. As skilled migrant workers are expected to have a positive dynamic impact on growth over the long-run, we would expect reductions in skilled Tier 2 migrants to have a negative dynamic impact on per capita growth. However, as the policy affects those workers towards the lower end of the earnings distribution, the dynamic impacts are likely to be relatively modest. In addition, there may be adjustment across the economy, for example if employers are incentivised to up-skill resident workers and improve average productivity in the UK. The largest part of the costs from this proposal are derived from the negative impacts on GDP, however it is not possible to estimate these potential positives which might counterbalance the negative effects and so the NPV calculation cannot take these into account. Furthermore, as set out by the MAC11, there is no absolute presumption GDP or GDP per capita will reduce as restrictions (on rights to remain) will not necessarily reduce the number of Tier 1 and Tier 2 migrants in the UK at any one time. An increase in the churn of migrant inflows (assuming there continues to be capacity with the Tier 2 entry limit) would mean limited impact of the proposals on both GDP and GDP per capita. Impact on Public Services
11
Analysis of the points based system – Settlement rights of migrants in Tier 1 and Tier 2, Migration Advisory Committee, November 2011
18

The impacts on public services of option 2 are estimated using the following methodology: the cumulative reduction in main applicant and dependant volumes is broken down by
age band; a unit cost of public service provision is applied for each age band, adjusting for likely
take-up rates (for example, participation rates in education); the volumes and unit costs are multiplied to estimate total public service impacts.
The key assumption is that Tier 2 migrants and their dependants will use public services at the same rate as UK residents controlling for their age. Unit costs of public service provision have been provided for health and education services and unit costs of crime have been used to estimate the potential impact of fewer migrants on the criminal justice system. Table 7 sets out the estimated savings in public service provision over 10 years (present value) for health, education and the criminal justice system. Further detail on the assumptions and methodology are set out in Annex 6. Table 7 – Estimated 10 year savings from reduced public service provision – Option 2 Public Service Low Central High
Education £11 £32 £54
Health £8 £18 £29
Crime £1 £3 £5 There are a number of uncertainties around these estimates: firstly, participation rates in education and the average costs of schooling may change over time; secondly, the unit costs of health services across age bands may change over time; and thirdly, migrants may not take-up health and education services or have the same propensity to commit crime as the UK average. There are also other public service impacts which we have been unable to quantify - these are discussed in table 11. In addition, there is likely to be an impact on the public service workforce. This is discussed in more detail in the wider non-monetised impacts section below. Impact on Welfare benefits The impacts on welfare payments of a reduction in migrants associated with option 2 are estimated using the following methodology:
the cumulative reduction in main applicant volumes is broken down by age band – only main applicant volumes are used as these are a proxy for the household benefit unit (it is the benefit unit that drives benefit claims);
a unit cost of welfare payment is applied for each age band across welfare benefit types, adjusting for likely take-up rates of those benefits;
the volumes and unit costs are multiplied to estimate total changes in welfare payments
The key assumption is that Tier 2 migrants will take-up benefits at the same rate as UK residents (or EU8 migrants) controlling for their age. Unit costs of welfare benefit payments have been provided for Income-based Jobseekers Allowance, Employment Support Allowance, Housing Benefit, Council Tax Benefit, Attendance Allowance, Carer’s Allowance, Disability Living Allowance, Child Tax Credit, Working Tax Credit and Child Benefits. Local Authority Housing and Homelessness, Social Fund Payment, Residential Care Support and State Pension Credit have not been considered in this modelling so the total savings may be underestimated.
19

Table 8 sets out the estimated savings in welfare payments to migrants over 10 years (present value) in the low and high scenarios. Further detail on the assumptions and age bands are set out in Annexes 3 and 4. Table 8: Estimated 10 year savings from reduced welfare payments – Option 2 Welfare Savings Low Central High
Welfare Savings £24 £46 £68 There are a number of uncertainties around these estimates: firstly, benefit take-up rates may vary between migrants and UK residents; secondly, the take-up of benefits will change over time depending on the state of the economy and employment; and thirdly, reforms to benefits may affect future levels and availability of benefits to UK residents and migrants. Wider Impacts – Non-monetised Regional Impacts This impact assessment assumes that Tier 2 migrants are distributed throughout the UK and there are no disproportionate impacts on a specific region. The MAC considered the case for adjusting the settlement pay threshold to reflect pay differences between the regions but concluded that higher pay in some regions could reflect a higher economic contribution. They were unconvinced there is an economic case for regionally differentiated pay criteria.
Impact on Sectors and Employers Impact on Sectors The impact of option 2 on the top ten occupations in Tier 2 general (in volume terms) is set out in the table below: Table 9: Impact of option 2 on top ten Tier 2 Occupations (April to September 2011) Top Ten Occupations Tier 2 General (4-digit SOC code job title)
Option 2 – % of Tier 2 migrants that will not qualify
for settlement across occupation groups
Finance/Investment Analyst 4%
Medical practitioners 5%
IT, software professionals 35%
Consultants 8%
Scientific researchers 0%
Nurses 48%
Directors 0%
Researchers 0%
Teachers HE 0%
Managers, marketing 20%
Source – Analysis of UKBA Management Information We can see that the most significant impact will be on migrant nurses, where many earn less than £35,000 and will not be able to qualify for settlement in the UK from 2016 onwards. Those
20

in shortage occupation jobs will not be affected. There is also expected to be a significant impact on migrant IT and software professionals. There are also expected to be moderate negative impacts on marketing managers and medical practitioners from outside the European Union. There should be no impact on scientific researchers, researchers or teachers in higher education as these are PHD-level occupations that will be exempt from the settlement salary threshold. There is not expected to be a significant impact on any of the labour forces in the affected sectors as the volumes prevented from settling are low relative to the size of the sectoral labour forces. For example, for nurses, the most affected occupational group, assuming of those that enter Tier 2 initially, only 29% to 40% will reach settlement, the likely reduction due to the settlement salary threshold is likely to lie in the hundreds or low thousands, when there are an estimated 698,000 nurses working in the UK (based on ASHE 2011).12 Similarly, for IT software professionals, the likely reduction is likely to be in the hundreds, when there are an estimated 309,000 IT software professionals working in the UK (based on ASHE 2011). Impact on employers If a migrant worker is no longer eligible to work then, under our assumption that migrant workers do not displace non-migrant workers, the economy suffers a loss in output equal at least to the migrant wage. The loss will be greater if, as well as the wage, the economy (and the employer) also lose the additional value added by the worker, over and above the wage. This is sometimes referred to as “producer surplus”; the additional output that the worker provides for the employer over and above the output represented by the wage cost. In our analysis we have treated the loss as limited to the wage, with no loss of producer surplus. This assumption is justified in each of the following cases:
(i) the migrant labour is employed at the margin, where the wage of the worker in a competitive labour market is driven to equal the output produced, with no element of producer surplus; or
(ii) the migrant labour has low value-added, meaning that the producer surplus, although not zero, is nevertheless very low.
We contend that the migrant workers affected by this policy change are indeed marginal, or have low value-added. They are marginal in the sense that their numbers are very low (in the case of nurses, some hundreds out of around 698,000 nurses in the UK) and they will not be included in the shortage occupation list. They are likely to be low value-added because, in general, they lie towards the lower-end of the earnings distribution. As discussed on page 10, it is worth noting that only an estimated 29% to 40% of Tier 2 workers reach settlement so the volumes affected will be relatively low and can be described as marginal. In addition, recent analysis by the UK Border Agency13 suggests those that settle have lower salaries or work in lower skilled occupational groups, suggesting they are less likely to have high-value added. The overall impact on employers is therefore expected to be relatively low. Impact on Social Cohesion Option 2 reduces the volume of migrants and their dependants and may have a positive effect on social cohesion. We are unable to quantify the size of these effects.
12
See p.74 MAC 2011: Skilled Shortage, Sensible: Full Review of the recommended shortage occupation lists for the UK and Scotland 13
Analysis of Tier 2 general migrants previous salary and occupation of those eligible to apply for settlement. www.homeoffice.gov.uk/publications/science-research-statistics/research-statistics/immigration-asylum-research/occ100/?view=Standard&pubID=1010018
21
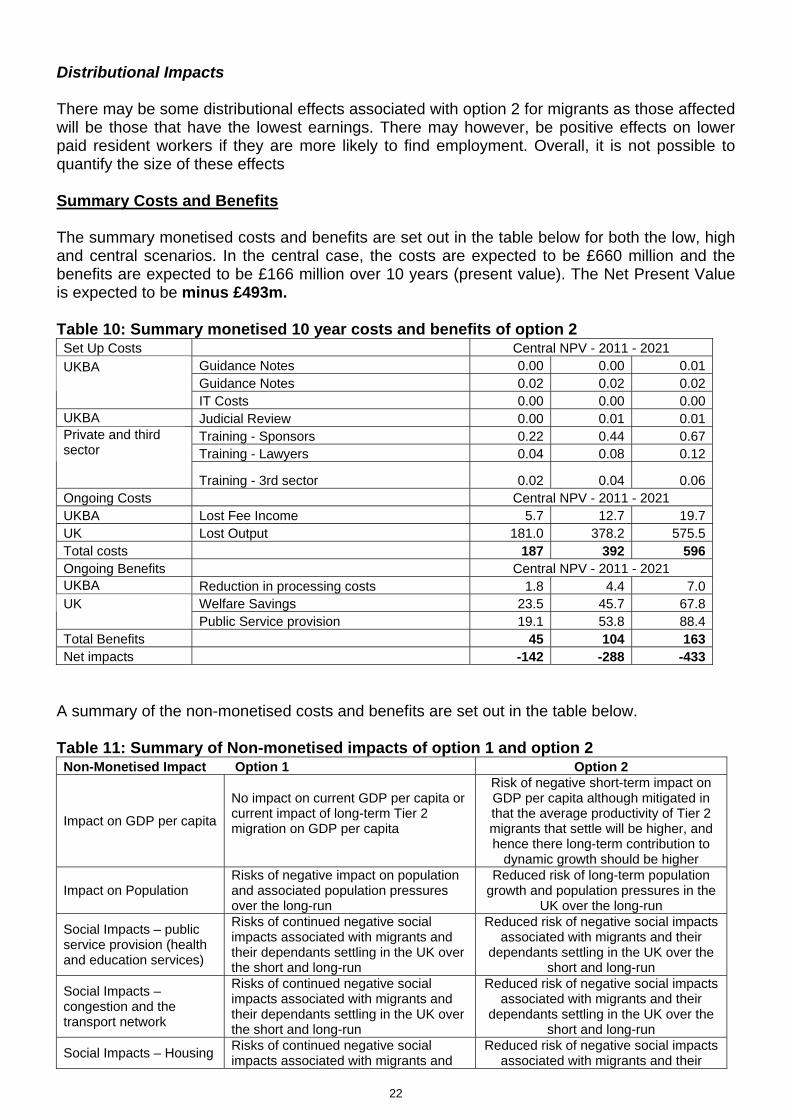
Distributional Impacts There may be some distributional effects associated with option 2 for migrants as those affected will be those that have the lowest earnings. There may however, be positive effects on lower paid resident workers if they are more likely to find employment. Overall, it is not possible to quantify the size of these effects Summary Costs and Benefits The summary monetised costs and benefits are set out in the table below for both the low, high and central scenarios. In the central case, the costs are expected to be £660 million and the benefits are expected to be £166 million over 10 years (present value). The Net Present Value is expected to be minus £493m. Table 10: Summary monetised 10 year costs and benefits of option 2 Set Up Costs Central NPV - 2011 - 2021
Guidance Notes 0.00 0.00 0.01Guidance Notes 0.02 0.02 0.02
UKBA IT Costs 0.00 0.00 0.00UKBA Judicial Review 0.00 0.01 0.01
Training - Sponsors 0.22 0.44 0.67Training - Lawyers 0.04 0.08 0.12
Private and third sector Training - 3rd sector 0.02 0.04 0.06Ongoing Costs Central NPV - 2011 - 2021 UKBA Lost Fee Income 5.7 12.7 19.7UK Lost Output 181.0 378.2 575.5Total costs 187 392 596Ongoing Benefits Central NPV - 2011 - 2021 UKBA Reduction in processing costs 1.8 4.4 7.0
Welfare Savings 23.5 45.7 67.8UK Public Service provision 19.1 53.8 88.4Total Benefits 45 104 163Net impacts -142 -288 -433
A summary of the non-monetised costs and benefits are set out in the table below. Table 11: Summary of Non-monetised impacts of option 1 and option 2 Non-Monetised Impact Option 1 Option 2
Impact on GDP per capita
No impact on current GDP per capita or current impact of long-term Tier 2 migration on GDP per capita
Risk of negative short-term impact on GDP per capita although mitigated in that the average productivity of Tier 2 migrants that settle will be higher, and hence there long-term contribution to
dynamic growth should be higher
Impact on Population Risks of negative impact on population and associated population pressures over the long-run
Reduced risk of long-term population growth and population pressures in the
UK over the long-run
Social Impacts – public service provision (health and education services)
Risks of continued negative social impacts associated with migrants and their dependants settling in the UK over the short and long-run
Reduced risk of negative social impacts associated with migrants and their
dependants settling in the UK over the short and long-run
Social Impacts – congestion and the transport network
Risks of continued negative social impacts associated with migrants and their dependants settling in the UK over the short and long-run
Reduced risk of negative social impacts associated with migrants and their
dependants settling in the UK over the short and long-run
Social Impacts – Housing Risks of continued negative social impacts associated with migrants and
Reduced risk of negative social impacts associated with migrants and their
22

their dependants settling in the UK over the short and long-run
dependants settling in the UK over the short and long-run
Social Impacts – Crime
Risks of continued negative social impacts associated with migrants and their dependants settling in the UK over the short and long-run
Reduced risk of negative social impacts associated with migrants and their
dependants settling in the UK over the short and long-run
Social Cohesion
Risks of continued negative social impacts associated with migrants and their dependants settling in the UK over the short and long-run
Reduced risk of negative social impacts associated with migrants and their
dependants settling in the UK over the short and long-run
Impact on employers No impact on employers’ recruitment and re-training costs
If there is labour market displacement of resident workers by migrant labour, or additional migrant worker churn as a result of settlement restrictions, there may be the potential for employers to
face additional training and recruitment costs
Discussion of Monetised and Non-Monetised Impacts Overall, whilst there are high monetised costs associated with option 2 there are a number of non-monetised benefits that should be taken into consideration. The negative net present value is largely driven by the costs of reduced output as a result of reducing the volume of Tier 2 migrants and dependants settling in the UK. These estimates assume there is no displacement of resident workers by non-EU skilled workers, based on the available academic evidence,14 and hence that if the migrants leave the UK there will be no replacement by resident workers. The MAC has reviewed the labour market impacts of non-EEA migration and published its report in January 201215. The Government is considering the implications of the MAC report and how best to reflect them in future impact assessments. F. Risks Policy risks The aim of the policies set out under option 2 is to break the link between coming to work and settling permanently, reserving settlement for those who make the most economic contribution. It is also intended to make a modest contribution to the Government’s target of reducing net migration. The estimates set out in the sections above assume that the volume of non EU workers settling in the UK will fall and contribute to reducing net migration (through higher emigration). There is a risk that some of these workers may be replaced with EU workers, causing net migration to fall by less than anticipated. While the Tier 2 entry limit remains undersubscribed, there is also a risk of ‘churn’ with some emigrating workers being replaced by new immigrants. However, if non-EU workers are replaced by UK workers, then the original estimated effects may be exceeded. As mentioned above, the MAC published its report into the labour market impacts of non-EEA migration and the issue of displacement in January 2012. The Government is currently considering its implications. In addition, there is a risk that the policy may deter skilled migrants from coming to the UK initially if they may not be able to settle in the long-run. This is not expected to be a significant risk associated with the proposals, as the decision to migrate to the UK through a skilled route is likely to depend on a number of variables, and the ability to settle later on may not be as 14
See discussion in section 7.4 of MAC 2010: Limits on Migration: http://www.ukba.homeoffice.gov.uk/sitecontent/documents/aboutus/workingwithus/mac/mac-limits-t1-t2/report.pdf?view=Binary 15
See MAC 2012 Analysis of the impacts of migration. http://www.ukba.homeoffice.gov.uk/sitecontent/documents/aboutus/workingwithus/mac/27-analysis-migration/01-analysis-report/analysis-of-the-impacts?view=Binary
23

important relative to the more immediate drivers at the arrival stage – such as employment, earning, language learning and career prospects of migrants. Modelling risks The estimation of the impact of the policy changes is based on a number of assumptions and is therefore subject to error. As set out above, the modelling assumes that the changes to settlement policy will not deter Tier 2 migrants from entering the UK. Volumes of Tier 2 migrants expected to reach settlement stage are based on volumes reaching these stages in the Migrant Journey Analysis,16 based on migrants on work routes to settlement who entered the UK in 2004. This IA assumes that current and future Tier 2 migrants will have the same propensity to reach settlement. Sensitivity Analysis A number of key assumptions are tested in the sensitivity analysis to assess what impact they have on the costs and benefits. Firstly the propensity of migrants to reach the settlement stage is examined. A range of between 29% and 40% reaching settlement has been used based on the Migrant Journey Analysis report. In the sensitivity analysis, a high assumption of 50% and a low assumption of 20% are tested. Secondly, the impact of the salary threshold is examined. The proportion of Tier 2 migrants that qualify at a threshold of £35k will depend on their initial salary at entry and the growth rate of that salary over the 5 years before settlement. It is possible that Tier 2 migrant wages will grow at a higher rate than average UK wage inflation, and hence more would be likely to qualify at settlement. Similarly, it is possible that employers respond by increasing the wages they pay to Tier 2 migrants that want to settle in the UK. It is also possible however, that Tier 2 migrant’s wages grow at a lower rate than the UK average inflation rate. The central case assumes 16% of Tier 2 migrants will not qualify at settlement. In the sensitivity analysis, a potential reduction of 8% and 24% are tested. The results of the sensitivity analysis are presented in table 12 below. Table 12: Sensitivity Analysis – high and low costs and benefits under option 2 Option 2 Assumption Tested 10 year NPV 10 year NPV 10 year NPV Low High Central
50% settlement rate -£245m -£541m -£393m High assumptions 24% impact of salary threshold -£201m -£603m -£402m
20% settlement rate -£98m -£217m -£158m Low assumptions 8% impact of salary threshold -£69m -£208m -£139m
One In One Out – Impact of regulation on businesses and third sector The training and familiarisation costs of option 2 are expected to be around £0.6m in 2016 (present value). These costs will be borne by Tier 2 sponsors and legal advisers in the private and third sector. There may be additional costs for employers if the reduction in skilled migrants requires them to up-skill resident labour in their place. Given the assumption of zero labour
16
See Achato et al (2010)
24

25
market displacement, there is not expected to be any replacement or need for up-skilling, Overall option 2 is expected to cost business £0.5m (present value) in staff time costs in 2016. G. Enforcement UKBA will enforce current and revised Tier 1 and 2 settlement policies. There is not expected to be an increase in enforcement activity or costs as a result of these policy proposals. H. Summary and Recommendations The table below outlines the summary costs and benefits of the proposed changes.
Table H.1 Costs and Benefits
Option Costs Benefits
2 £392m (10 year present value) £104m (10 year present value)
Source: UKBA Analysis
The preferred option is option 2 – reform to Tier 2 Settlement rules. Although this option has a negative net present value, this option meets the Government’s objectives, and there are a number of non-monetised benefits that suggest this option will be significantly better than maintaining the do nothing scenario. I. Implementation
The Government plans to introduce these changes to migrants applying to entering Tier 2 from April 2011 onwards, who will be eligible to apply for settlement from April 2016. The policy will not affect migrants at settlement until April 2016, so many of the operational and implementation impacts will not begin until then. J. Monitoring and Evaluation The effectiveness of the new regime will be monitored by the Home Office. This will include: Monitoring the volume and characteristics of Tier 1 and 2 migrants and their dependants
that apply for and qualify for settlement from 2016 onwards; Monitoring IPS net migration to see if there are any changes in non-EU outflows post-
policy-implementation. K. Feedback
Feedback and findings from monitoring will be incorporated into the post-implementation review of the policy to inform future policy decisions on employment-related settlement. L. Specific Impact Tests See annex 1 for details.

Annex 1. Specific Impact Tests Statutory Equality Duties Equality Impact Assessment A separate Policy Equality Statement has been completed and is available at www.homeoffice.gov.uk/publications/.
Economic Impacts Competition Assessment The settlement salary criteria will apply to all migrants at settlement and will therefore affect all firms employing migrant workers equally. The proposals should not have an adverse impact on competition. Small Firms Impact Test The settlement salary criteria will apply to all migrants at settlement and will therefore affect all firms employing migrant workers of any size equally. Management information from the UK Border Agency suggests the breakdown of sponsors is as follows: Organisation Size – Tier 2 Sponsor Total % Large organisation (251 + employees) 3,879 18%Medium organisation (51 - 250 employees) 4,507 20%Small organisation (10 - 50 employees) 7,588 34%Micro organisation (0 - 9 employees) 6,049 27%Total 22,023 100%Source: UKBA Management Information. These figures were extracted on the 03/11/2011 and are subject to change. Note - organisation size is self-declared by the sponsor and as such, may not be 100% accurate It is possible that micro and small sponsors may be adversely affected by the proposals depending on the volume of Tier 2 migrants that they employ and the salaries they are being paid. It is not possible to exempt micro or small businesses as the policy objectives would not be met. The micro-business moratorium policy applies to all new domestic regulation within the scope of the ‘One In One Out’ rules that affect micro-businesses and which is intended to come into force before 31 March 2014. The Tier 2 settlement changes will not apply to applications before April 2016 and are therefore outside the scope of the moratorium.
Environmental Impacts Greenhouse Gas Assessment No impact identified Wider Environmental Issues No impact identified Social Impacts Health and Well-being There is expected to be a reduction in health provision costs to the UK government as a result of option 2. These are estimated between £27 million and £87 million over ten years (present value). Human Rights No impact identified. Justice No significant impact identified. There may be a small increase in Judicial Reviews and costs in the first year of implementation, but these are not expected to be significant. There may be a change in appeals and appeal costs over the long-run but the direction of effects is uncertain – there may be an increase in appeals if more migrants apply for settlement and are refused due to the salary threshold; or there may be a decrease in appeals if fewer migrants apply for settlement and fewer are refused. Rural Proofing
26

27
No impact identified
Sustainability Sustainable Development No impact identified

Annex 2 – Summary of Consultation Responses A total of 12,499 responses were received to the Government’s consultation ‘Employment-related settlement, Tier 5 and overseas domestic workers’. A summary of the responses to the employment-related settlement questions are presented below. Further information is available in the document at http://www.homeoffice.gov.uk/publications/immigration/employment-related-settlement/. Sixty-five per cent of all respondents agreed with the proposal that creating temporary and permanent visas would help everyone better understand the immigration system. In particular non-British respondents were more likely to favour this proposal (72%), compared with British respondents (62%) and those responding on behalf of their organisation, from hereon called ‘organisations’ (58%). Tier 1 Seventy-six per cent of all respondents agreed that exceptional talent migrants should have an automatic route to settlement after five years. The non-British respondents were more likely to favour this proposal (83%) compared with the British respondents and ‘organisations’ (74% and 69% respectively). Forty-seven per cent disagreed with the proposal that temporary leave for Tier 1 migrants should be capped at a maximum of five years (those who wish to stay longer will be obliged to apply for settlement). In particular the British respondents were more likely to disagree with the proposals (52%), compared with the non-British respondents (49%). Tier 2 Sixty-four per cent of all respondents disagreed with the proposal that temporary leave for Tier 2 migrants should be capped at a maximum of five years. ‘Organisations’ were more likely to disagree (71%), compared with the non-British respondents (70%) and the British respondents (65%). Of the 28 per cent of respondents who agreed that temporary leave for Tier 2 migrants should be capped at a maximum of five years, 66 per cent agreed that a Tier 2 migrant should be allowed to reapply for another Tier 2 visa after they have left the UK. Non-British respondents were the most likely to support this proposal (74%), compared with the ‘organisations’ (65%), and the British respondents (57%). Fifty per cent thought there should be a grace period before resubmitting another application (but 44% said there shouldn’t). Seventy-three per cent of all respondents disagreed with the proposal that Tier 2 General become a wholly temporary route with no avenue to settlement. The non-British respondents and the ‘organisations’ were most likely to disagree (79% and 78% respectively), compared with the British respondents (73%). Of the 20 per cent of respondents who agreed with the proposal, 52 per cent thought people earning over £150,000 should be exempt and 33 per cent thought sports people should be exempt. There were again differences in how British, non-British respondents and the ‘organisations’ answered these questions, with non-British respondents being more supportive in every case. Sixty-five per cent of all respondents disagreed that there should there be an annual limit on the number of Tier 2 migrants progressing to settlement. However 27 per cent agreed. Of these, 62 per cent thought 40 per cent or below should be allowed to progress to settlement (including 37% who felt that this proportion should be only 10%). The British respondents were more likely than the non-British respondents to suggest a smaller proportion (under 40%) of Tier 2 migrants should be allowed to progress to settlement (71% and 54% respectively). Forty-nine percent of the British respondents thought only 10 per cent of Tier 2 migrants should be allowed to progress to settlement. Ninety-four per cent of all respondents thought objective criteria should be used to determine which migrants can apply for settlement. (Non-British respondents and ‘organisations’ were slightly more likely to say objective criteria (95% for both) compared with the British respondents (93%)). Of these, 73 per cent thought academic qualifications should be taken into account, followed by professional/vocational qualifications (63%) then by salary, or a combination of salary and age (59%), working in a shortage occupation was chosen by 41 per cent of respondents.
28

29
Fifty-four per cent of all respondents supported option 1 - a decision on whether Tier 2 migrants should be permitted to enter a route that leads to settlement should be taken after three years for all cases. Thirsty-two per cent supported option 2 - a decision should be made on entry in selected cases. Fifty-one per cent of all respondents disagreed with the proposal that employers be required to sponsor a migrant who wanted to stay permanently. In particular non-British respondents disagreed with this proposal (56%) compared with 52 per cent of the British respondents. However, only 45 per cent of the ‘organisations’ disagreed with the proposal, whilst 50 per cent supported it. Overall 41 per cent agreed with the proposal and of these 42 per cent thought sponsorship should be required at the three year point. Fifty-one per cent of all respondents disagreed with the proposal that the employer should be expected to pay to sponsor their Tier 2 General employee’s transfer to a permanent visa. Non-British, British respondents and the ‘organisations’ responded similarly (52%, 52% and 53% respectively). Thirty-eight per cent agreed with the proposal. Eighty-one per cent of all respondents agreed with the proposal that Tier 2 migrants should be able to switch employer. Non-British respondents were more likely to agree (88%) with the proposals compared with the British respondents (79%) and the ‘organisations’ (75%). Fifty-six per cent of all respondents agreed that dependants of Tier 2 migrants, who switch from a temporary to permanent route, take an English language test. Of these 61 per cent thought an intermediate level would be appropriate and that we should test speaking (96%), listening (87%), reading (77%) and writing (64%). The non-British responders were more likely to say that a basic language requirement would be appropriate, 40 per cent compared with 35 per cent of British respondents and 37 per cent of ‘organisations’.

Annex 3 – Assumptions
This section lists the main assumptions used in the cost benefit modelling.
Table A.3.1: Key assumptions for cost and benefit estimates Set Up costs - Private Sector Stock of Tier 2 Sponsors 22,023 UKBA Management Information - July 2011 Baseline: Hours of familiarisation required for Tier 2 sponsors
3
Option 2 - Assumes one member of staff per sponsor
Average wage of sponsor admin staff
9.72
ASHE 2011 - hourly median wage for all administrative staff - http://www.statistics.gov.uk/downloads/theme_labour/ASHE-2010/tab2-5a.xls
Stock of Legal Advisers - Private Sector
2,000
OISC Publication
Stock of Legal Advisers - Third Sector
2,000
OISC Publication
Wage - Private sector lawyers
18.73
ASHE 2011 - hourly median wage for all senior management staff - http://www.statistics.gov.uk/downloads/theme_labour/ASHE-2010/tab2-5a.xls
Wage Third Sector lawyers
9.72
ASHE 2011 - hourly median wage for all administrative staff - http://www.statistics.gov.uk/downloads/theme_labour/ASHE-2010/tab2-5a.xls
Hours of familiarisation required for lawyers and immigration advisers
3
Option 2 - Assumes one member of staff per sponsor
On Costs
21%
Labour Cost Survey 2004 http://www.statistics.gov.uk/downloads/theme_labour/LabourCostSurvey/LABOUR_COST_SURVEY_04.pdf
Set Up costs - UKBA Staff Volumes - UK ILR caseworkers
110-120
UKBA assumption. Note - figures are adjusted to take account of spending review and projected decreases in staff volumes
Proportion of staff likely to need training
100%
UKBA Assumption. All settlement case workers will require familiarisation training
Hours of training and familiarisation required
3-5
UKBA Assumption
Hourly Wage of Public Admin staff
£13
ASHE 2011 Government and related organisations administrative staff Median hourly wage (including on-cost of 21%)
Guidance notes - weeks to produce
32
Expected to take four FTE staff eight weeks to construct guidance, update forms, and provide communications on changes
Judicial Review - volumes 1-5 UKBA Assumption Cost to UKBA of a Judicial Review
£3,372
UKBA Management Information (2010/11)
Wider Impacts – GDP impacts and up-skilling costs Tier 2 Average Wage of those that do not qualify
£27,300
This is the average wage of those that do not qualify below the salary threshold (including on-costs)
Tier 2 Employment Rate (after 5 years)
85%
LFS Q1 2011 - Q4 2011. Employment rate for those who came to the UK to work and have been here long enough to settle (5 years)
Tier 2 Dependant Average Wage (after 5 years)
£18,252
Median wage of someone coming to the UK as a dependant, has been in the UK long enough to qualify for settlement (5 years)
Tier 2 Dependant Employment Rate (5 years)
56%
LFS Q1 2011 - Q4 2011. Employment rate for those who came to the UK as a dependant and have been here long enough to settle (5 years)
30

31
Table A.3.2: Volume Modelling Assumptions
Volume Modelling assumptions
Value
Source
Tier 2 General entry volumes
8,420 to 20,700
UKBA Internal assumptions based on Immigration Statistics and UKBA Management Information
Tier 2 General in country switching volumes
10,792 to 19,286
UKBA Internal assumptions based on Immigration Statistics and UKBA Management Information
Tier 2 Minister of Religion and Elite Sportspersons entry volumes
300 to 900
UKBA Internal assumptions based on Immigration Statistics and UKBA Management Information
Tier 1 Exceptional Talent entry volumes
0 to 1,000
UKBA Internal assumptions based on Immigration Statistics and UKBA Management Information
Tier 1 Investors and Entrepreneur entry volumes
400 to 1100
UKBA Internal assumptions based on Immigration Statistics and UKBA Management Information
Proportion of economic migrants that settle in 5 years
29% to 40%
Migrant Journey Analysis (Achato et al. 2010)
Table A.3.3: List of PHD-level occupation groups exempt from the proposals
SOC Code Occupation Group 1137 Research and Development Managers 2111 Chemists 2112 Biological Scientists and Research Chemists 2113 Physicists, Geologists and Meteorologists 2311 Higher Education teaching Professionals 2321 Scientific Researchers 2322 Social Science Researchers 2329 Researchers not elsewhere classified
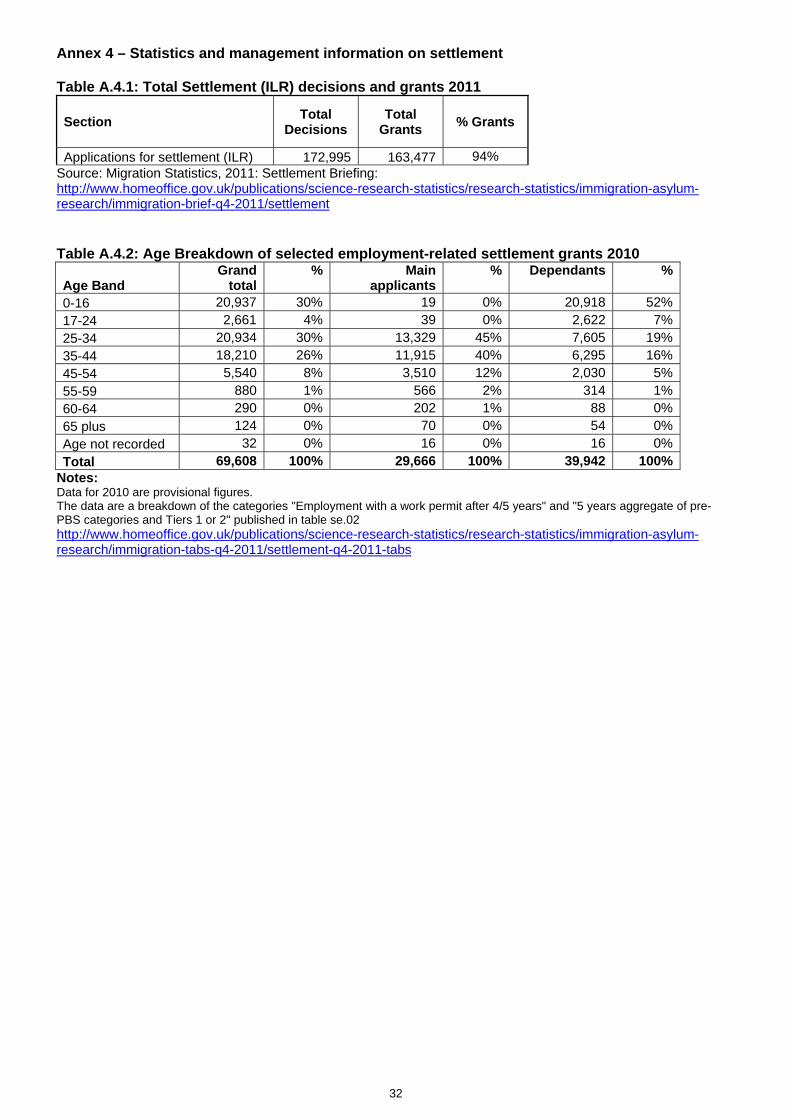
Annex 4 – Statistics and management information on settlement Table A.4.1: Total Settlement (ILR) decisions and grants 2011
Section Total
Decisions Total
Grants % Grants
Applications for settlement (ILR) 172,995 163,477 94% Source: Migration Statistics, 2011: Settlement Briefing: http://www.homeoffice.gov.uk/publications/science-research-statistics/research-statistics/immigration-asylum-research/immigration-brief-q4-2011/settlement Table A.4.2: Age Breakdown of selected employment-related settlement grants 2010
Age Band Grand
total %
Main
applicants% Dependants
%
0-16 20,937 30% 19 0% 20,918 52%17-24 2,661 4% 39 0% 2,622 7%25-34 20,934 30% 13,329 45% 7,605 19%35-44 18,210 26% 11,915 40% 6,295 16%45-54 5,540 8% 3,510 12% 2,030 5%55-59 880 1% 566 2% 314 1%60-64 290 0% 202 1% 88 0%65 plus 124 0% 70 0% 54 0%Age not recorded 32 0% 16 0% 16 0%
Total 69,608 100% 29,666 100% 39,942 100%Notes: Data for 2010 are provisional figures. The data are a breakdown of the categories "Employment with a work permit after 4/5 years" and "5 years aggregate of pre-PBS categories and Tiers 1 or 2" published in table se.02 http://www.homeoffice.gov.uk/publications/science-research-statistics/research-statistics/immigration-asylum-research/immigration-tabs-q4-2011/settlement-q4-2011-tabs
32

Annex 5 – Additional Pay Threshold Options Considered As discussed in section D2, a variety of pay thresholds were considered within the Migration Advisory Committee’s recommended range of £31k to £49k. In addition, the Government considered but rejected the option of setting the pay threshold according to occupation. For illustrative purposes, the following tables show the estimated impact of the following pay thresholds:
- Option 3: £35k with exemptions for Ministers of Religion and PhD level jobs. - Option 4: £31k (median salary of those holding NQF4+ qualifications) or appropriate rate for the
job, whichever is higher. Minimum of MAC recommended range. - Option 5: £49k (75th percentile of the salary distribution for those in NQF4+ occupations) or
appropriate rate for the job, whichever is higher. Maximum of MAC recommended range. - Option 6: Median salary of the relevant occupation. - Option 7: 75th percentile of the pay distribution for the relevant occupation.
Impact on Volumes: The table below sets out the estimated reduction in Tier 1 and 2 settlement volumes associated with five other options that have been considered: Table A.5.1: Impact of Pay Threshold Options on Tier 1 and 2 settlement volumes Estimated Tier 2 settlement grant reductions
Option 3(£35k/PHD)
Option 4(£31k)
Option 5(£49k)
Option 6 (Median)
Option 7 (75th
percentile)
Estimated reductions – low 2,000 2,000 6,000 4,000 6,000
Estimated reductions – high 9,000 8,000 22,000 14,000 21,000
Impacts across occupations: The table below sets out the estimated reduction in migrants across the top ten occupational groups (based on 4-digit SOC) associated with the other options that are being considered: Table A.5.2: Impacts of Pay Threshold Options by Top Ten Tier 2 Occupation Groups
Estimated percent reduction in Tier 2 settlement grants
Option 3(£35k/PHD)
Option 4(£31k)
Option 5(£49k)
Option 6 (Median)
Option 7 (75th
percentile)
Finance/Investment Analyst 4% 2% 39% 4% 38%
Medical practitioners 15% 10% 58% 92% 98%
IT, software professionals 35% 8% 77% 38% 73%
Consultants 8% 1% 47% 14% 49%
Scientific researchers 0% 51% 87% 68% 80%
Nurses 98% 87% 99% 79% 95%
Directors 0% 0% 1% 5% 14%
Researchers 0% 55% 89% 42% 73%
Teachers HE 0% 9% 62% 33% 62%
Managers, marketing 20% 6% 33% 30% 44%
33

Annex 6: Methodology to estimate the public service and welfare impacts The presence of migrants in the UK places additional pressure on the provision of public services in the UK. We have attempted to quantify the impacts of a reduction in migrants as a result of the proposals to increase the settlement salary threshold on healthcare, education and the criminal justice system. The estimated savings are shown below. Table A6.1 – Estimated savings from reduced public service provision
Public Service Low Central High
Education £11 £32 £54
Health £8 £18 £29
Crime £1 £3 £5 Health In general, lower levels of migrants settling in the UK might be expected to reduce the total demand for healthcare, although the extent will depend on the characteristics of migrants settling, and those prevented from settling. Individuals can have very differing healthcare needs – the old and the very young for example have, on average, high costs, while working age adults have much lower costs. In 2010 of those settling in the UK under employment routes, 70% were working age adults. A further 30% were children and less than 1% were aged over 65. Of dependants, 52% were children, 47% were working age adults and less than 1% were aged over 65. See table A4.2 in annex 4 for a full breakdown. To estimate the effect of the policies contained in option 2 on health care costs we inflate Hospital and Community Health Services (HCHS) per capita expenditure by age (1999-00, England)1 by the increase in overall HCHS expenditure in England, and we assume that these per capita costs stay constant over the reference period. The figures we derive are as follows: Table A6.2 – Annual HCHS per capita expenditure, 2010-11
Age Per capita HCHS cost per annum
Under 5 £1,913
5 to 15 £446
16 to 44 £790
45 to 64 £1,107
65 to 74 £2,287
75 to 84 £4,057
Over 84 £6,360
We have assumed that all migrants that settle will settle permanently in the UK and thus would incur healthcare costs in each future year. The table below gives the estimated volume of migrants affected in each year of the IA under the low and high scenario assumptions. Table A6.3 – Estimated cumulative volumes not requiring healthcare under option 2 Year 1 2 3 4 5 6 7 8 9 10 Cumulative volumes - low 0 0 0 0 0 0 2,000 3,000 5,000 6,000Cumulative volumes - high 0 0 0 0 0 0 6,000 12,000 18,000 23,000
We have used the volumes figures outlined above combined with the HCHS costs above to calculate the reduction in healthcare costs resulting from a decrease in migrants. Where the age bands do not compute with the healthcare ranges we have assumed that ages are equally distributed within the bands. We estimate that reducing the volume of migrants settling in the UK will save £8m to £29m (present value) in healthcare costs over the period assessed in the impact assessment.
1 See: http://www.ohe.org/page/knowledge/schools/appendix/nhs_cost.cfm
34

Education The policy proposals are expected to affect state and independent schools through a reduction in the number of migrants and their dependants who will settle and require education in the UK. Forthcoming research by the National Institute of Economic Research (NIESR) suggests that Tier 1 and Tier 2 migrants are more likely to have pre-school children than the population as a whole and therefore, will make fewer initial demands on education services. These demands will increase as the children reach school age in the 5 year period of their stay. However, reductions in settlement numbers of Tier 1 and Tier 2 migrants are likely to have a relatively small aggregate effect on the demand for teachers over the reference period, as these economic migrants represent only a small subset of the total migrant population. However, there may be a larger effect at the local level. We have estimated that reducing the volumes settling through Tier 1 and 2 work routes could lower education spending by £11m to £54m (present value) over ten years. This assumes that 52% of dependants are aged between 0 and 16 and a further 1% are aged between 16 and 18. We have taken ageing into account and constructed an estimate of children moving through the schooling system. On advice from the Department for Education (DfE), we have assumed a participation rate of 82% for 0 to 15 year olds, and 67% for 16 to 18 year olds. The cost per year per pupil is expected to be £5,310; this is based on DfE’s published revenue funding per school pupil 2010/11 plan for pupils aged 3 to 19.2 This amount does not include capital spending and is the best available estimate of the variable costs associated with education. We have assumed that the unit funding will stay constant during the reference period. However the spending review announced that unit funding will need to fall and therefore the cost savings are overestimated in this respect, but it is uncertain by how much. We have assumed that children of those settling would mainly attend state schools, but that 7% would attend independent schools, in line with the average for the UK population.3 However, the forthcoming NIESR research suggests that the children of Tier 1 and Tier 2 migrants may be more likely to attend independent schools. Costs at independent schools may differ, and revenue may be lost at independent schools. The participation age will rise to 17 in 2013 and to 18 in 2015; the figures in this IA do not consider the impact of this change and will therefore underestimate the benefits in this respect. The IA has also assumed the current participation rate for those aged between 16 and 18 will remain constant, but this may be subject to change over time. Schools and colleges may also respond to falling numbers of non-EEA students by recruiting more UK or EU domiciled students. This would lower the estimated cost savings. Criminal Justice System Reducing the volume of people settling in the UK could lead to reductions in expenditure on the criminal justice system. We have used data from the Offending Crime and Justice Survey 20064 and the Offending Crime and Justice Survey 20035, to estimate the likelihood that an individual of a certain age would commit a crime by crime type. Neither the police nor the criminal justice sector routinely record activity by nationality or migrant status. Thus we have assumed that the propensity of non-EU migrants settling in the UK through employment routes to commit crime is the same as that of British nationals of the same age group. We used 2006 criminal justice costs by crime type6 inflated to 2011 prices and the propensity to commit crime to obtain the estimates shown below for the annual criminal justice cost per person dependent on age. 2 (http://www.education.gov.uk/rsgateway/DB/TIM/m002012/NSRStatsJuneGDP140809.xls ) 3 See: http://www.education.gov.uk/rsgateway/DB/SFR/s001012/index.shtml 4 http://rds.homeoffice.gov.uk/rds/pdfs08/hosb0908.pdf 5 http://rds.homeoffice.gov.uk/rds/pdfs05/hors275.pdf 6 http://rds.homeoffice.gov.uk/rds/pdfs05/rdsolr3005.pdf
35
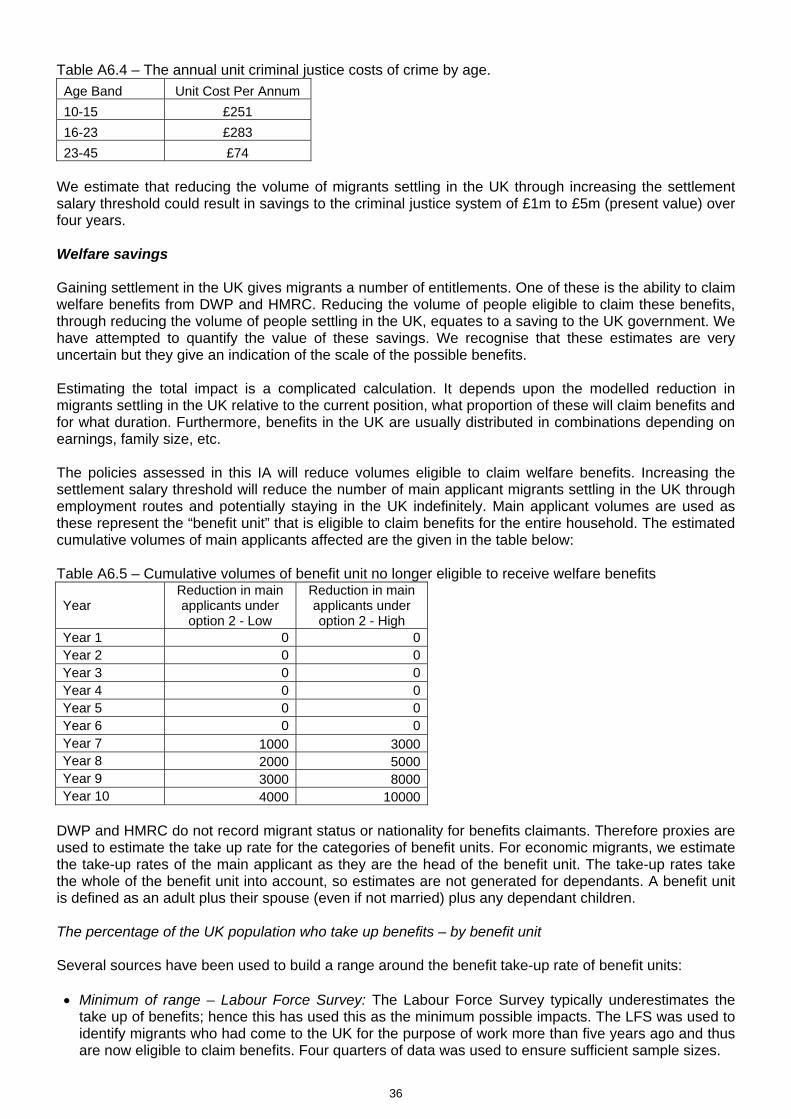
Table A6.4 – The annual unit criminal justice costs of crime by age.
Age Band Unit Cost Per Annum
10-15 £251
16-23 £283
23-45 £74 We estimate that reducing the volume of migrants settling in the UK through increasing the settlement salary threshold could result in savings to the criminal justice system of £1m to £5m (present value) over four years. Welfare savings Gaining settlement in the UK gives migrants a number of entitlements. One of these is the ability to claim welfare benefits from DWP and HMRC. Reducing the volume of people eligible to claim these benefits, through reducing the volume of people settling in the UK, equates to a saving to the UK government. We have attempted to quantify the value of these savings. We recognise that these estimates are very uncertain but they give an indication of the scale of the possible benefits. Estimating the total impact is a complicated calculation. It depends upon the modelled reduction in migrants settling in the UK relative to the current position, what proportion of these will claim benefits and for what duration. Furthermore, benefits in the UK are usually distributed in combinations depending on earnings, family size, etc. The policies assessed in this IA will reduce volumes eligible to claim welfare benefits. Increasing the settlement salary threshold will reduce the number of main applicant migrants settling in the UK through employment routes and potentially staying in the UK indefinitely. Main applicant volumes are used as these represent the “benefit unit” that is eligible to claim benefits for the entire household. The estimated cumulative volumes of main applicants affected are the given in the table below: Table A6.5 – Cumulative volumes of benefit unit no longer eligible to receive welfare benefits
Year
Reduction in main applicants under option 2 - Low
Reduction in main applicants under option 2 - High
Year 1 0 0Year 2 0 0Year 3 0 0Year 4 0 0Year 5 0 0Year 6 0 0Year 7 1000 3000Year 8 2000 5000Year 9 3000 8000Year 10 4000 10000
DWP and HMRC do not record migrant status or nationality for benefits claimants. Therefore proxies are used to estimate the take up rate for the categories of benefit units. For economic migrants, we estimate the take-up rates of the main applicant as they are the head of the benefit unit. The take-up rates take the whole of the benefit unit into account, so estimates are not generated for dependants. A benefit unit is defined as an adult plus their spouse (even if not married) plus any dependant children. The percentage of the UK population who take up benefits – by benefit unit Several sources have been used to build a range around the benefit take-up rate of benefit units: Minimum of range – Labour Force Survey: The Labour Force Survey typically underestimates the
take up of benefits; hence this has used this as the minimum possible impacts. The LFS was used to identify migrants who had come to the UK for the purpose of work more than five years ago and thus are now eligible to claim benefits. Four quarters of data was used to ensure sufficient sample sizes.
36

Maximum of range - The percentage of migrants who claimed out-of-work benefits within 6 months of
registering for a National Insurance Number (NINo): This data is collected by DWP7, but is limited in that not all migrants who claim benefits register for NINos and of those who do, many are likely to claim benefits after 6 months. This is used to proxy take up rates for out of work benefits such as Job Seekers Allowance (JSA).
Maximum of range – The proportion of benefit units who claim other benefits adjusted for the age of
migrants settling through Tier 2: DWP8 collect and publish data based on the proportion of benefit units claiming each type of benefit by age and type of unit. We have used data on the age of each benefit unit adjusted for the age of migrants prevented from settling in the UK to estimate the impact of Tier 2 migrants not being able to settle.
Benefit Amounts Assumptions around the likely amounts of support provided were either taken from publicly available figures or provided by other Government departments (DWP, HMRC, CLG and DH). We have used average figures despite some benefits being determined by individual circumstances. This implies that Tier 2 migrants settling have the same characteristics as the rest of the population. The estimated figures only take into account the amount spent on income based job seekers allowance, income support, employment support allowance (ESA), tax credits, housing benefit, council tax benefit, child benefits (child benefit and child tax credit), disability living allowance, carers allowance and attendance allowance. This estimate does not include various other benefits such as social housing and homelessness assistance, access to Higher Education at the home rate and any wider social impacts. The table below sets out the benefit amounts and the estimated take-up which have been applied to the volumes of those no longer eligible. Table A6.6 – benefit amounts and estimated take up by benefit unit. Benefit Amounts Take-up rate
Benefit Type
Amount per week
Annual amount Min Max Note on Assumptions
Jobseeker's Allowance
£64.17 (May 11)9
£3,210 1.2% 4.6%
Income support £84.88 (May11)
£4,279 2.4% 4.6%
Employment Support Allowance
£78.11 (May 11)
£3,845 0.2% 4.6%
Minimum: Based on LFS 2010 Q1 - Q4. Surveys migrants who have come to the UK to work more than five years ago - to proxy for ability to claim benefits. Maximum: Based on proportion of NINo registrations to adult overseas nationals entering the UK and claiming out of work benefits
Housing benefit £86.98 (Nov 11)10
£4,533 5.7% 11.0%
Attendance Allowance
£63.08 (May 11)
£3,180 0.1% 0.0%
Carer’s allowance £55.55 (May 11)
£2,797 0.3% 1.2%
Disability living allowance
£74.08 (May 11)
£3,736 2.5% 5.0%
Council tax benefit £15.70 (Nov 11)
£820 5.8% 12.5%
Child tax credit £3,151.00 18.6% 21.4% Working tax credit £1,228.00 6.0% 8.3%
Social fund payment
Child benefit £1,500 17.4% 32.5%
Minimum: Based on LFS 2010 Q1 - Q4. Surveys migrants who have come to the UK to work more than five years ago - to proxy for ability to claim benefits. These migrants are likely to be head of household, thus head of benefit unit, thus figures are comparable with maximum. Maximum: Based on proportion of benefit units in the UK who claim housing benefits, adjusted for age of benefit units and age of ODW migrants.
7 See: http://www.dwp.gov.uk/asd/asd1/tabtools/nino_alloc_summ_tables_may09.xls
8 See: http://www.dwp.gov.uk/asd/asd1/tabtools/nino_alloc_summ_tables_may09.xls
9 http://83.244.183.180/100pc/tabtool.html
10 http://research.dwp.gov.uk/asd/index.php?page=hbctb
37

38
The table below sets out the expected savings from reducing the volume of people who are eligible to claim welfare benefits. Please note: there is a high degree of uncertainty around these estimates. Table A5.7 – Estimated reductions in welfare expenditure Estimated Savings Low Central High Option 2 £24 £46 £68
Note - the minimum figure assumes that the average support duration for the various types is 6 months, the maximum assumes 1 year.
The estimates presented in this impact assessment do not take account of the universal credit proposals as the impact on entitlements to migrants is not yet clear. Universal Credit is expected to be open to new claims in October 2013, with individuals being migrated over from the existing income-related benefits over the subsequent four years. A majority of households will be entitled to higher entitlements under Universal Credit, with 85% of gains going to those in the bottom two quintiles of the income distribution. Whilst some households will have lower entitlements under Universal Credit, it is important to recognise that transitional protection will ensure there are no cash losers at the point of change. Overall, it is estimated that benefit expenditure will be around £2.6bn higher once Universal Credit is fully implemented. This estimate includes an increase of £2bn due to changes in entitlement rules and totals around £2.6bn after accounting for increased take-up. Offsetting this, it is estimated that there will be savings of around £2bn due to reduced fraud, error and overpayments together with changes to the earnings disregards that currently exist in tax credits.