Embed Size (px)
Citation preview

Author's personal copy
Ecological Engineering 44 (2012) 44– 52
Contents lists available at SciVerse ScienceDirect
Ecological Engineering
j o ur nal homep age : www.elsev ier .com/ locate /eco leng
Impact of aeration conditions on the removal of low concentrations of nitrogenin a tertiary partially aerated biological filter
Antonio Albuquerquea,∗, Jacek Makiniab, Krishna Pagillac
a Civil Engineering and Architectural Department, University of Beira Interior, Calc ada Fonte do Lameiro, 6200-001 Covilhã, Portugalb Faculty of Civil and Environmental Engineering, Gdansk University of Technology, Gabriela Narutowicza 11/12, 80-233 Gdansk, Polandc Civil, Architectural and Environmental Engineering Department, Illinois Institute of Technology, 3201 South Dearborn Street, Room 228 Alumni Memorial Hall, Chicago, IL 60616-3793, USA
a r t i c l e i n f o
Article history:Received 25 September 2011Received in revised form 21 February 2012Accepted 26 March 2012
Keywords:Biological aerated filterDenitrificationNitrogen removalNitrificationPartial aerationResidual removal
a b s t r a c t
A submerged biological aerated filter (BAF) partially aerated was used to study the removal of low concen-trations of ammonia nitrogen (0.3 g N/m3 to 30.5 g N/m3) typically found in nutrient enriched river andlake waters, and treated effluents. Four series of experiments were performed with a synthetic wastewa-ter at ammonia loading rates between 6 g N/m3 d and 903 g N/m3 d and C/N ratios from 2 to 20. The resultsshowed that ammonia removal rates reached higher values (172 g N/m3 d to 564 g N/m3 d) for C/N = 2 andlower values (13.6 g N/m3 d to 34.6 g N/m3 d) for C/N = 20. Between 50% and 70% of the ammonia wasremoved in the upper section of the BAF, where the dissolved oxygen (DO) concentration was over 2.1 gO2/m3 and the biofilm depth ranged from 0.4 to 0.6 mm. At the bottom section of the reactor, simulta-neous removal of ammonia and nitrate was observed at the DO concentrations in the range 0.4 g O2/m3
to 0.8 g O2/m3. There was no removal of ammonia nitrogen for loads below 15 g N/m3.d. The results indi-cate that the removal of nitrogen in partially aerated BAF may not only be explained by the conventionalmechanisms of nitrification/denitrification.
© 2012 Elsevier B.V. All rights reserved.
1. Introduction
The discharge of nitrogen compounds to soil and waters mayadversely affect water resources in several ways including contri-bution to eutrophication, depletion of oxygen, toxicity to aquaticenvironment and public health concerns. Nitrogen polluted sur-face waters including those from lakes and rivers often need to bepretreated prior to use in drinking water systems. Hence, removalof nitrogen (both reduced form such as ammonia and oxidizedform such as nitrate) from treated waters and surface waters forreuse has become an important need to protect public health andreduce ecological risk. In order to satisfy stringent regulations con-cerning nitrogen removal from wastewater in the European Union(Urban Wastewater Directive 91/271/EEC, 10 to 15 g N/m3) andUSA (total N = 3 g N/m3 in some regions), conventional secondarywastewater treatment systems need to be retrofitted or the treat-ment scheme should be expanded with polishing treatment. Theresearch described here addresses nitrogen removal from surface
∗ Corresponding author. Tel.: +351 275 242058; fax: +351 275 329969.E-mail addresses: [email protected], [email protected] (A. Albuquerque),
[email protected] (J. Makinia), [email protected] (K. Pagilla).
waters and wastewater effluents using low maintenance and effec-tive biological aerated filters.
Application of submerged biological filtration to remove resid-ual loads (nutrients, trace elements and pathogens) as a tertiaryand/or polishing step can be a promising alternative to retrofitting(Tchobanoglous et al., 2003; Jeong et al., 2006; Schulz andMenningmann, 2008; Farabegoli et al., 2009; Jenssen et al.,2010). Submerged biological aerated filters (BAF), also known assubmerged aerobic biofilters (Schulz and Menningmann, 2008)present several advantages over other fixed-film reactors (e.g.rotating biological contactors (RBC) or trickling filters) includinga high concentration of active biomass, good control of excessbiomass, high sludge retention time (SRT) that enables degrada-tion of complex compounds, better protection against toxic peaksby the biofilm, good efficiency of pollutant (carbon, nitrogen, phos-phorous and pathogen) removal combined with a high filteringcapacity in a single-unit process, easy maintenance and operation,no need for sludge recycling and a final clarifier (Mendoza-Espinosaand Stephenson, 1999; Grady et al., 1999; Tchobanoglous et al.,2003; Hidaka and Tsuno, 2004; Schulz and Menningmann, 2008).The capital cost of adding BAF as tertiary/polishing treatment islower in comparison with construction of a new advanced treat-ment system and its construction does not interfere with theoperation of existing reactors.
0925-8574/$ – see front matter © 2012 Elsevier B.V. All rights reserved.http://dx.doi.org/10.1016/j.ecoleng.2012.03.006

Author's personal copy
A. Albuquerque et al. / Ecological Engineering 44 (2012) 44– 52 45
The main disadvantages are the risk of clogging and energy costsassociated with aeration and washing systems. Clogging may beminimized if solids could be properly removed upstream or byusing media with void ratio over 0.4 (Grady et al., 1999; Farabegoliet al., 2009). The energy costs may be reduced by optimizing wash-ing cycles and using low air flow rate or intermittent aeration.This last procedure may also be useful to change the biochemi-cal environment in the filter from anaerobic to aerobic in order topromote simultaneously or alternately nitrification/denitrificationmechanisms.
The media used in BAF must have suitable specific surfacearea (500 m2/m3 to 2000 m2/m3) to allow a good biofilm devel-opment, and a particle diameter ranging from 1 to 4 mm to allowa void ratio adequate for a good hydraulic flow rate (Mendoza-Espinosa and Stephenson, 1999; Albuquerque, 2003; Schulz andMenningmann, 2008). Mendoza-Espinosa and Stephenson (1999)point out removal efficiencies for organics and nitrogen over 80% incompletely aerated BAF running with hydraulic loading rates (HLR)from 1 m/h to 10 m/h. A natural porous volcanic rock (puzzolane)presents suitable properties for application in bioreactors and hasbeen already tested in sequencing batch biofilter (Buitrón et al.,2004) for the removal of azo dye. Villaverde et al. (2000) have alsotested this material in completely aerated BAF, but for the removalof high ammonia concentrations (100 g N/m3). Operation air flowrates in BAF may range from 18 L/H to 200 L/h (He et al., 2007; Haet al., 2010).
In a previous paper (Albuquerque et al., 2009a) the perfor-mance of a non-aerated lab-scale biofilter (filled with 2–4 mm ofpuzzolane particles) on the removal of organic matter (acetate),ammonia, nitrite and nitrate was analysed. In this study, the samereactor was converted to a partially aerated BAF and long-termoperating data were analysed in terms of the removal of low ammo-nia nitrogen concentrations. Therefore, the aim of this study was toevaluate the effect of aeration on the performance of a puzzolane-based BAF reactor to remove low concentrations of ammonianitrogen (0.3 g N/m3 to 30.5 g N/m3), which may constitute a usefulmitigation measure for pollution control and integrated water-shed management. Most of the previous works with BAF have useda total aerated filter to remove higher concentrations of ammo-nia (Mendoza-Espinosa and Stephenson, 1999; Villaverde et al.,2000; Stephenson et al., 2003; Garzon-Zuniga et al., 2005; Lei et al.,2009; Ha et al., 2010), normally from 25 g N/m3 to approximately650 g N/m3 (i.e., the reactors were used mainly as a secondary treat-ment step). BAFs reactor studied in this paper could be used forrestoration of ponds, lakes, and rivers polluted by cultural eutroph-ication as well as pollution prevention by treating wastewatereffluents, which contain low nitrogen levels.
2. Methodology
2.1. Experimental set-up
A BAF reactor with 7.0 cm × 40.5 cm (internal diame-ter × packing height) with a downward flow configurationwas set-up for this study (Fig. 1). A homogeneous puzzolanematerial with an effective diameter of 4 mm, specific surface areaof 1740 m2/m3 and void ratio of 0.52 was used. The media bed wassubmerged 3 cm below the water level. Five sampling ports (P1–P5,5 mm in diameter) were provided along the height of the reactorto collect water samples for analytical measurements. Anotherfive ports in the same locations were connected to piezometers toevaluate variations in the hydrostatic pressure between the ports.
The reactor was also equipped with an external aeration device(TetraTec AP150 pump, Italy) with a flow rate control system and
a maximum capacity of 150 L/h, connected close to the P2 sam-pling point (at approximately 8 cm from the media top). The airwas injected into the reactor through a 4 mm tube with a fine bub-ble micro-diffuser. The aeration device introduced air upward inorder to keep dissolved oxygen (DO) concentrations over 2 g O2/m3
in the section MT-P2 (i.e., the reactor was partially aerated). Thisis one of the novelties of this work, since most of the previousworks with BAF (Villaverde et al., 2000; Stephenson et al., 2003; Leiet al., 2009; Ha et al., 2010) used completely aerated filters with theaeration device located at the bottom of the reactors. A backwash-ing system was included in order to remove the excess of sludgeproduced during the BAF operation. The backwashing water flowrate was controlled by a rotameter (GARDENA T120, Italy), whilstthe backwashing air flow rate was controlled by a pressure pump(VACUUBRAND ME 4R, Germany).
2.2. Feeding solutions
The feeding solution used for the experiments included a min-eral medium (buffer, magnesium sulphate, calcium chloride andiron chloride solutions) and sources of organic carbon (sodiumacetate) and ammonia (ammonia chloride), as previously describedin Albuquerque et al. (2009a). The concentrated sodium acetatesolution (113.4 g C2H3O2Na·3H2O per L) had a chemical oxy-gen demand (COD) concentration of 50 kg COD/m3 and a totalorganic carbon (TOC) concentration of 20 kg C/m3. The concen-trated ammonia chloride solution (76.41 g NH4Cl per L) had aNH4–N concentration of 20 kg N/m3.
During the normal operating conditions (excluding the exper-imental assays), the BAF reactor was fed with the syntheticwastewater with concentrations of COD of 100 g COD/m3 (equiv-alent to 40 g C/m3) and ammonia nitrogen (NH4–N) of 10 g N/m3
(i.e., C/N ratio of 4) as also used in Albuquerque et al. (2009a).The synthetic wastewater was prepared with tap water by dilut-ing the concentrated solutions in the following proportions: 2 mL/Lof the buffer solution, 0.2 mL/L of the magnesium sulphate solu-tion, 0.2 mL/L of the calcium chloride solution, 0.2 mL/L of the ironchloride solution, 0.2 mL/L of the oligoelements solution, 2 mL/L ofsodium acetate solution, and 0.5 mL/L of ammonia chloride solu-tion. For the experiments presented in the Table 1 the feedingsolution composition was changed in order to obtain the influentC/N ratios of 2, 4, 10 and 20. Therefore, the appropriate concentra-tions of COD (or TOC) and NH4–N were obtained by diluting theconcentrated solutions of sodium acetate and ammonia chloride,according to the volumes presented in Albuquerque (2003). Thefeeding solution was kept in a storage tank (ISCO FTD 220, Italy)at a constant temperature of approximately 4 ◦C and pumped tothe BAF reactor through a peristaltic pump (ISMATEC MCP CA4,Switzerland).
2.3. Operation of the experimental BAF
The operation of the BAF reactor involved two phases: investi-gating the backwashing cycle and achieving steady-state conditionswith aeration (Phase I, 16 days), and performing experimentalassays (Phase II, 102 days) for different ammonia nitrogen load-ing rates (NLR) and C/N ratios. The reactor was previously operatedwithout aeration during 152 days. Before the experiments, the reac-tor was inoculated with biomass from an activated sludge systemtreating municipal wastewater. The colonization took approxi-mately 15 days in a closed circuit (1 L/h) and discontinuous feeding.Approximately 38.9 mL and 9.7 mL of acetate and ammonia solu-tions, respectively, and a proportional volume of the mineralsolutions were added to the reactor every 24 h in order to ensurethe concentrations of 100 g COD/m3 and 10 g NH4–N/m3 (C/N = 4)

Author's personal copy
46 A. Albuquerque et al. / Ecological Engineering 44 (2012) 44– 52
Fig. 1. Schematic representation of the experimental BAF.
as described in Albuquerque et al. (2009a). In Phase II, four seriesof 24-h experiments with C/N ratios of 2, 4, 10 and 20 (20 assays)were performed as described in Table 1.
In Phase I, the backwashing cycle was defined under normaloperating conditions (i.e., 100 g COD/m3 and 10 g NH4–N/m3),by operating the BAF until the steady-state conditions werebroken. The backwashing period was selected in order to notallow the deterioration of the steady-state conditions. The headlosses were determined daily in five reactor sections. Duringsteady-state conditions, the measurements of DO, pH, temper-ature, TOC, COD and NH4–N were performed every 2 days inthe influent, P2 and effluent. Backwashing was performed byinjecting simultaneously upward air at the flow rate of 5 L/m2 s(≈68 L/h, ≈0.4 m3 air/m3 media min) and water at the flow rate of1 L/m2.sec (≈14 L/h, ≈0.3 m3 water/m3 media min), during 10 min.These conditions were set based on the recommendations ofMendoza-Espinosa and Stephenson (1999), i.e. air flow rates andwater flow rates in the range of 0.4–0.5 m3 air/m3 media min andfrom 0.33 to 0.35 m3 air/m3 media min, respectively, and are inthe range of flow rates observed in the studies of Yang et al.(2010) and Liu et al. (2010), 5.3 L/m2 s to 15 L/m2 s (backwashingair flow rate) and 0.18 L/m2 s to 5 L/m2 s (backwashing water flowrate).
In the second phase, the reactor was operated continuously dur-ing 102 days to perform four series of experiments (altogether20 assays) by modifying the organic loading and C/N ratio incomparison with the steady-state conditions (Fig. 2). Between theexperiments, for approximately 4 days (the period required toattain steady-state conditions, as shown in Albuquerque, 2003),the reactor feed was the same as that at steady state conditions(i.e., 100 g COD/m3 and 10 g NH4–N/m3). On the 5th day, the oper-ating conditions were modified for each individual experimentas presented in Table 1. In each assay, measurements of DO, pH,temperature, TOC, COD, NH4–N, nitrite nitrogen (NO2–N), nitratenitrogen (NO3–N), total suspended solids (TSS), volatile suspendedsolids (VSS) and alkalinity were performed at 12 h, 16 h and 20 hafter changing the operating conditions (influent, the five sam-pling ports and effluent). In days 28, 48, 74 and 108, four grainsof the media were collected in each of the five sampling ports inorder to evaluate the biofilm thickness variations across the bed.TOC was occasionally determined to control the C/N ratio, whereasCOD analyses were used to follow the removal of acetate.
The aeration rate was kept at 20 L/h. The continuous or inter-mittent air flow rates between 3.5 L/h and 18 L/h are consideredto be sufficient for the simultaneous removal of organic carbonand nitrogen according to Schulz and Menningmann (2008), Chang
Table 1Influent characteristics for the experimental assays in Phase II.
Days Assay pH Temperature (◦C) COD (g COD/m3) TOC (g C/m3) Feed DO(g O2/m3)
NH4–N (g N/m3) Alkalinity(g CaCO3/m3)
C/N (g C/g N)
18–42 A6.2.1. 7.2 19.3 151.1 62.6 7.6 3.1 109.5 20.2A6.2.3. 7.2 19.5 100.8 41.9 7.4 2.1 102.6 20.0A6.2.4. 7.2 19.6 50.1 20.8 7.7 1.1 90.8 18.9A6.2.6. 6.8 19.8 10.8 4.2 7.3 0.2 58.1 21.0
44–62 A7.2.1. 7.2 19.4 152.4 62.5 7.8 6.3 119.5 9.9A7.2.3. 7.2 18.9 102.3 41.5 7.2 4.3 107.9 9.7A7.2.4. 7.2 18.9 49.7 20.6 7.9 2.1 88.9 9.8A7.2.6. 6.9 19.5 3.8 4.3 7.4 0.5 58.4 8.6
64–102 A8.2.1. 7.2 19.5 155.3 62.5 7.4 15.8 126.7 4.0A8.2.2. 7.2 19.6 131.5 52.2 7.9 12.6 117.9 4.1A8.2.3. 7.2 20.4 101.8 41.8 7.3 10.2 115.8 4.1A8.2.4. 7.2 18.8 52.3 20.6 7.7 5.1 95.4 4.0A8.2.5. 7.1 19.2 25.8 10.2 7.0 2.5 70.2 4.1A8.2.6. 7.1 18.9 11.2 4.4 7.3 1.1 55.4 4.0A8.2.7. 6.9 19.5 5.2 2.1 7.2 0.5 39.6 4.2A8.2.8. 6.8 19.7 3.1 1.0 7.5 0.3 22.5 3.3
104–118 A9.2.1. 7.2 19.2 150.8 62.4 7.6 30.5 123.8 2.0A9.2.3. 7.3 19.5 102.6 41.6 7.7 20.4 123.8 2.0A9.2.4. 7.2 19.5 52.3 20.8 7.8 10.2 85.4 2.0A9.2.6. 7.1 19.1 9.8 4.2 7.6 2.1 52.2 2.0

Author's personal copy
A. Albuquerque et al. / Ecological Engineering 44 (2012) 44– 52 47
Fig. 2. Schematic representation of the operating conditions during Phase II.
et al. (2008) and Ha et al. (2010). For both phases, the reactor wasoperated at the flow rate of 1 L/h (HLR of approximately 0.26 m/h).Recent studies showed good performance for ammonia removal atHLR up to 3 m/h and air flow rate from 18 L/h to 200 L/h (Schulzand Menningmann, 2008; Lei et al., 2009; Ha et al., 2010; He et al.,
2007) in BAF completely aerated fed with higher ammonia concen-trations (>100 g NH4–N/m3). The hydraulic retention time (HRT)was approximately 50 min, which is in the range (20 min to 2 h)reported by Mendoza-Espinosa and Stephenson (1999) and Ha et al.(2010) for downflow BAF reactors. The hydrostatic pressure wasrecorded daily from each piezometer. The temperature in the BAFreactor was kept constant at approximately 20 ◦C during the exper-imental phases.
2.4. Analytical methods
The DO, pH and temperature were measured with a D201flow through vessel using probes SenTix 41 and CellOx 325 con-nected to the Multi 340i meter (WTW, Germany). Concentrations oforganic carbon were measured as both COD, by closed reflux diges-tion and titrimetric method (APHA-AWWA-WEF, 1999), and TOCusing the TOC-5000 analyzer (Shimadzu, Japan). Concentrationsof NH4–N and NO2–N were measured through spectrophotome-try according to the Standard Methods (APHA-AWWA-WEF, 1999),whereas NO3–N concentrations were measured using LCK 339cuvette test (0.23–13.5 g NO3–N/m3) and the Cadas 50 spectropho-tometer (HACH-LANGE, Germany). TSS and VSS concentrationswere determined by the gravimetric method using 0.45 �m poresize filters (APHA-AWWA-WEF, 1999). Alkalinity measurements
Fig. 3. Temporal variations of NH4–N concentrations at the influent, P2, P4 and effluent (a) and offloads of NH4–N removed during Phase I (b).

Author's personal copy
48 A. Albuquerque et al. / Ecological Engineering 44 (2012) 44– 52
Table 2Ammonia loading rates and ammonia removal rates in the experiments of Phase II.
Assays C/N NLRa (g N/m3 d) rNH4N (g N/m3 d)
MT-P2 P2–P4 P4-MB MT-MBa
A6.2.1. 20 91.8 94.4 26.4 14.4 34.6A6.2.3. 62.2 69.0 30.4 0.0 27.8A6.2.4. 32.6 52.5 9.6 0.0 13.6A6.2.6. 5.9 0 0 0 0A7.2.1. 10 186.6 212.9 35.2 12.3 60.4A7.2.3. 127.3 205.4 24.0 4.8 51.5A7.2.4. 62.2 76.5 36.0 0.0 33.2A7.2.6. 14.8 0 0 0 0A8.2.1. 4 467.9 860.5 103.9 66.5 237.2A8.2.2. 373.1 586.1 43.2 50.0 153.4A8.2.3. 302.0 577.2 72.8 20.6 149.8A8.2.4. 151.0 226.4 28.8 27.4 67.2A8.2.5. 74.0 45.0 12.8 19.2 21.9A8.2.6. 32.6 0 0 0 0A8.2.7. 14.8 0 0 0 0A8.2.8. 8.9 0 0 0 0A9.2.1. 2 903.2 2149.7 310.2 56.2 563.8A9.2.3. 604.1 1133.3 544.5 63.7 453.1A9.2.4. 302.0 632.6 80.0 40.4 172.0A9.2.6. 62.2 0 0 0 0
a Calculated based on the total effective media volume (MT-MB): 0.00081 m3.
were performed by titration (APHA-AWWA-WEF, 1999). Thebiofilm thickness was evaluated using an electronic microscope(Hitachi S 2700, Japan) after dehydratation of the sample (substra-tum/biofilm) with acetone.
3. Results and discussion
3.1. Phase I – steady state conditions
The concentrations of ammonia observed in both phases arepresented in Fig. 3(a). There was no detection of significant concen-trations of nitrite (0.1–0.2 g NO2–N/m3) in all the sampling pointsfor Phases I and II. Steady-state conditions were evaluated throughthe NH4–N load removal (Fig. 3(b)) that was attained in sectionsMT-P2, P2–P4 and P4–MB after approximately 8 days of the con-tinuous operation. The BAF performance was analysed for sectionsMT-P2 (aerated section, aerobic), P2–P4 (section with residual oxy-gen, anoxic) and P4-MB (non-aerated section, anaerobic).
The average COD concentrations were 100.7 ± 0.6 g/m3,60.6 ± 7.1 g/m3, 38.4 ± 2.2 g/m3 and 28.8 ± 1.3 g/m3, respectively,in the influent, P2, P4 and effluent (considering 9 samples anda 95% confidence interval), which corresponds to average CODremoval efficiencies (RE) of 40%, 35% and 25%, respectively, forsections MT-P2, P2–P4 and P4-MB and an overall RE of 71%.The average NH4–N concentrations at the same points were10.6 ± 0.2 g/m3, 6.7 ± 0.7 g/m3, 5.8 ± 0.7 g/m3 and 5.4 ± 0.6 g/m3,which corresponds to average RE of NH4–N of 37%, 15% and 6%,respectively, for sections MT-P2, P2–P4 and P4-MB and an overallRE of 50%.
Comparing with results obtained in a previously study(Albuquerque et al., 2009a), in the same reactor, but without aer-ation, the introduction of aeration in the upper part of the reactor(first 8 cm) led to an increase in the overall RE of COD, from 18%to 71%, and ammonia, from 28% to 50%. Approximately 56% of CODand 74% of ammonia were removed in the aerated section MT-P2,which contrasts with the 90% efficiency observed for both com-pounds under non-aerated conditions for the same section. Theintroduction of aeration did not influence the time necessary toattain steady-state conditions since it was observed the same 8 daysafter the start-up and 8 h after washing. However, the backwashingcycle was reduced to 5 h of operation. It took 5 h to reach an overall
head loss of 5 cm compared to 10 h when the reactor was not aer-ated. This difference can be explained by the turbulence caused insection MT-P2 due to the introduction of air, as well as due to theproduction of large amount of biomass that led to a quick cloggingof the bed.
The DO concentrations were stable with average val-ues of 7.6 ± 0.1 g O2/m3, 3.3 ± 0.3 g O2/m3, 0.5 ± 0.1 g O2/m3 and0.3 ± 0.03 g O2/m3, respectively, in the influent, P2, P4 and the efflu-ent. The concentrations of TSS and VSS in P2 and P4 were 60 ± 5 gTSS/m3 and 45 ± 5 g TSS/m3 and 38 ± 3 g VSS/m3 and 18 ± 2 gVSS/m3, respectively, which corresponds to a VSS/TSS ratio of 0.63and 0.40, respectively, in these two points (i.e., more biomass wasproduced in the section MT-P2).
After 5 days of operation at steady-state conditions, the headlosses in the section MT-P2 increased quickly (from 5 cm to 9.5 cmfor day 5 and day 6, respectively) due to clogging of the bed. As aconsequence, the removal of COD and ammonia decreased quicklyand the steady-state conditions became deteriorated. Therefore,backwashing was scheduled every 5 days during continuous opera-tion, which corresponded to a maximum head loss of 5 cm allowedfor the BAF reactor. 8 h after the backwashing, the steady-state con-ditions were observed again, and COD and ammonia removal werefully recovered after another 2 h.
3.2. Phase II – long term operation
In Phase II, the ammonia and COD concentrations changedwith varying influent conditions. It was found, however, that thesteady-state conditions returned in approximately 12 h after eachassay. Regardless of the applied C/N ratio, there was no signifi-cant removal of NH4–N in the assays with lowest influent CODconcentrations (from 3.1 g COD/m3 to 11.2 g COD/m3) and lowestinfluent NH4–N concentrations (from 0.3 g N/m3 to 2.1 g N/m3), i.e.the assays A6.2.6., A7.2.6., A8.2.6., A8.2.7., A8.2.8. and A9.2.6.). i.e.,there is no removal of ammonia for NLR below 15 g N/m3 d. Xiaet al. (2008) observed that the population of nitrifiers was in inverseproportion to C/N ratio in carrier biofilm reactors.
The pH slightly increased throughout the reactor depth reach-ing higher effluent values in the experiments with higher ammoniaremoval: 7.2 (influent) to 7.7 (effluent) in assays 8.2.1. and 8.2.2.;(C/N = 4) 7.1 (influent) to 7.8 (effluent) in assays 9.2.1., 9.2.3. and

Author's personal copy
A. Albuquerque et al. / Ecological Engineering 44 (2012) 44– 52 49
Fig. 4. Typical DO (blue line) and pH (black line) profiles in the experiments of Phase II. (For interpretation of the references to color in this figure legend, the reader isreferred to the web version of the article.)
9.2.4. (C/N = 2). The values of alkalinity also increased in thoseassays. This finding is in contradiction with ammonia removalvia nitrification. The reactor was aerobic in most of its depth(Fig. 4), which favoured ammonia oxidation to nitrite and nitrate(and resulted in alkalinity consumption). However, the removalof acetate (determined as COD) under aerobic conditions was alsohigher for C/N ratios of 2 and 4 and, as reported by Grady et al.(1999), the respective pathway produced alkalinity. Therefore,the production of alkalinity due to acetate oxidation was greaterthan its consumption by nitrification. The average DO concentra-tions ranged from 3.1 g O2/m3 to 4.1 g O2/m3 (P1), 2.1 g O2/m3 to3.8 g O2/m3 (P2), 0.5 g O2/m3 to 1.1 g O2/m3 (P3), 0.4 g O2/m3 to0.8 g O2/m3 (P4) and 0.2 g O2/m3 to 0.8 g O2/m3 (P5), confirming theaerobic conditions in section MT-P2.
Removal rates are normally based on effective reactor volume(Mendoza-Espinosa and Stephenson, 1999; Grady et al., 1999;Stephenson et al., 2003; Chang et al., 2008; Ha et al., 2010). Theremoval of ammonia started to be significant for NLR above 32.6 g
N–NH4/m3.d (assay A6.2.4., C/N = 20). The higher removal ratesof ammonia (rNH4N) were observed in the experiments with alow C/N ratio (2) and for the higher NLR, as can be observed inTable 2. These results may be explained by the higher develop-ment of nitrifiers for low C/N ratio as observed by Xia et al. (2008).The observed RE in the assays varied in the following ranges:37.7–44.8% (C/N = 20), 32.4–53.3% (C/N = 10), 29.6–50.7% (C/N = 4)and 57–75% (C/N = 2). The overall removal rates of ammonia (13.6 gN–NH4/m3 d to 563.8 g N–NH4/m3 d) are in agreement with the val-ues (up to 1300 g N–NH4/m3 d) suggested by Mendoza-Espinosaand Stephenson (1999) for downflow BAF with HRT between 0.4 hand 1.3 h. A wide range of efficiencies (10–90%) have been reportedfor lab-scale RBCs treating ammonium rich wastewater at low C/Nratios (Helmer et al., 1999; Pynaert et al., 2002). The RE for CODremoval ranged between 26% (C/N = 20) and 79% (C/N = 2).
Regardless the C/N ratio, most of ammonia removal wasobserved in section MT-P2: 54–74% (C/N = 20), 53–79% (C/N = 10),41–76% (C/N = 4) and 49–75% (C/N = 2). For all the assays, between
Fig. 5. Vertical profiles of DO and NH4–N concentrations and biofilm thickness for assays A8.2.3. and A9.2.3.
Author's personal copy
50 A. Albuquerque et al. / Ecological Engineering 44 (2012) 44– 52
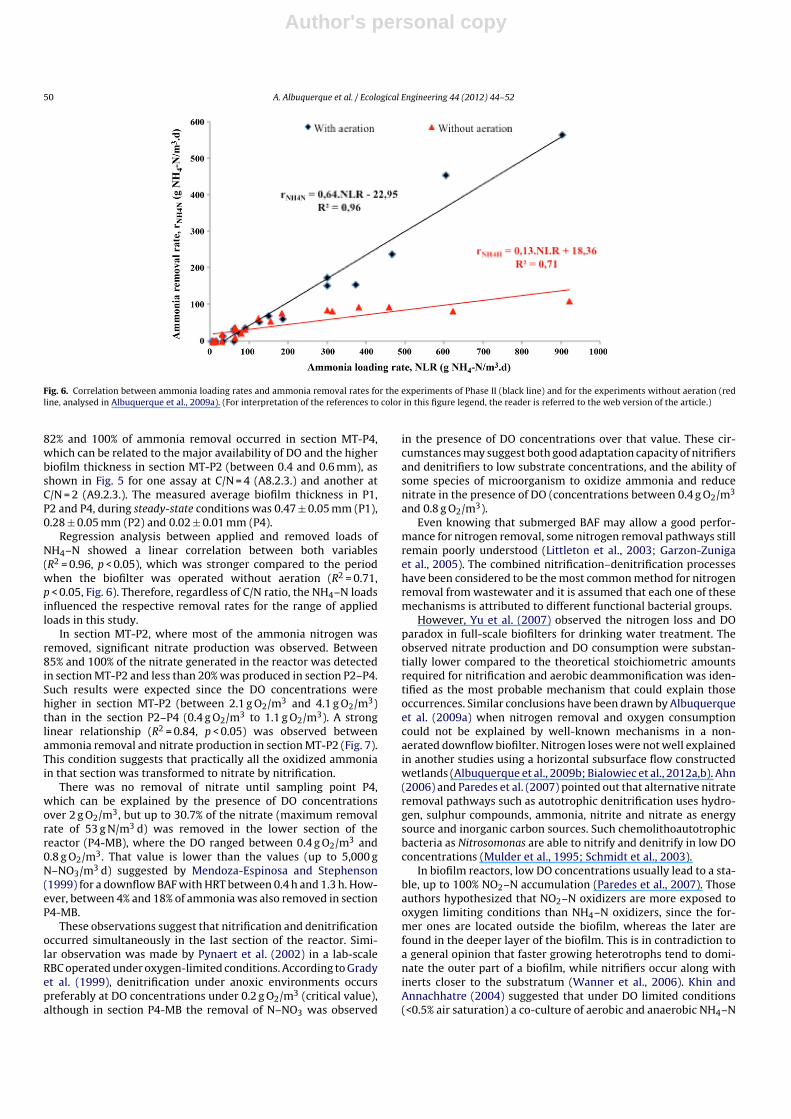
Fig. 6. Correlation between ammonia loading rates and ammonia removal rates for the experiments of Phase II (black line) and for the experiments without aeration (redline, analysed in Albuquerque et al., 2009a). (For interpretation of the references to color in this figure legend, the reader is referred to the web version of the article.)
82% and 100% of ammonia removal occurred in section MT-P4,which can be related to the major availability of DO and the higherbiofilm thickness in section MT-P2 (between 0.4 and 0.6 mm), asshown in Fig. 5 for one assay at C/N = 4 (A8.2.3.) and another atC/N = 2 (A9.2.3.). The measured average biofilm thickness in P1,P2 and P4, during steady-state conditions was 0.47 ± 0.05 mm (P1),0.28 ± 0.05 mm (P2) and 0.02 ± 0.01 mm (P4).
Regression analysis between applied and removed loads ofNH4–N showed a linear correlation between both variables(R2 = 0.96, p < 0.05), which was stronger compared to the periodwhen the biofilter was operated without aeration (R2 = 0.71,p < 0.05, Fig. 6). Therefore, regardless of C/N ratio, the NH4–N loadsinfluenced the respective removal rates for the range of appliedloads in this study.
In section MT-P2, where most of the ammonia nitrogen wasremoved, significant nitrate production was observed. Between85% and 100% of the nitrate generated in the reactor was detectedin section MT-P2 and less than 20% was produced in section P2–P4.Such results were expected since the DO concentrations werehigher in section MT-P2 (between 2.1 g O2/m3 and 4.1 g O2/m3)than in the section P2–P4 (0.4 g O2/m3 to 1.1 g O2/m3). A stronglinear relationship (R2 = 0.84, p < 0.05) was observed betweenammonia removal and nitrate production in section MT-P2 (Fig. 7).This condition suggests that practically all the oxidized ammoniain that section was transformed to nitrate by nitrification.
There was no removal of nitrate until sampling point P4,which can be explained by the presence of DO concentrationsover 2 g O2/m3, but up to 30.7% of the nitrate (maximum removalrate of 53 g N/m3 d) was removed in the lower section of thereactor (P4-MB), where the DO ranged between 0.4 g O2/m3 and0.8 g O2/m3. That value is lower than the values (up to 5,000 gN–NO3/m3 d) suggested by Mendoza-Espinosa and Stephenson(1999) for a downflow BAF with HRT between 0.4 h and 1.3 h. How-ever, between 4% and 18% of ammonia was also removed in sectionP4-MB.
These observations suggest that nitrification and denitrificationoccurred simultaneously in the last section of the reactor. Simi-lar observation was made by Pynaert et al. (2002) in a lab-scaleRBC operated under oxygen-limited conditions. According to Gradyet al. (1999), denitrification under anoxic environments occurspreferably at DO concentrations under 0.2 g O2/m3 (critical value),although in section P4-MB the removal of N–NO3 was observed
in the presence of DO concentrations over that value. These cir-cumstances may suggest both good adaptation capacity of nitrifiersand denitrifiers to low substrate concentrations, and the ability ofsome species of microorganism to oxidize ammonia and reducenitrate in the presence of DO (concentrations between 0.4 g O2/m3
and 0.8 g O2/m3).Even knowing that submerged BAF may allow a good perfor-
mance for nitrogen removal, some nitrogen removal pathways stillremain poorly understood (Littleton et al., 2003; Garzon-Zunigaet al., 2005). The combined nitrification–denitrification processeshave been considered to be the most common method for nitrogenremoval from wastewater and it is assumed that each one of thesemechanisms is attributed to different functional bacterial groups.
However, Yu et al. (2007) observed the nitrogen loss and DOparadox in full-scale biofilters for drinking water treatment. Theobserved nitrate production and DO consumption were substan-tially lower compared to the theoretical stoichiometric amountsrequired for nitrification and aerobic deammonification was iden-tified as the most probable mechanism that could explain thoseoccurrences. Similar conclusions have been drawn by Albuquerqueet al. (2009a) when nitrogen removal and oxygen consumptioncould not be explained by well-known mechanisms in a non-aerated downflow biofilter. Nitrogen loses were not well explainedin another studies using a horizontal subsurface flow constructedwetlands (Albuquerque et al., 2009b; Bialowiec et al., 2012a,b). Ahn(2006) and Paredes et al. (2007) pointed out that alternative nitrateremoval pathways such as autotrophic denitrification uses hydro-gen, sulphur compounds, ammonia, nitrite and nitrate as energysource and inorganic carbon sources. Such chemolithoautotrophicbacteria as Nitrosomonas are able to nitrify and denitrify in low DOconcentrations (Mulder et al., 1995; Schmidt et al., 2003).
In biofilm reactors, low DO concentrations usually lead to a sta-ble, up to 100% NO2–N accumulation (Paredes et al., 2007). Thoseauthors hypothesized that NO2–N oxidizers are more exposed tooxygen limiting conditions than NH4–N oxidizers, since the for-mer ones are located outside the biofilm, whereas the later arefound in the deeper layer of the biofilm. This is in contradiction toa general opinion that faster growing heterotrophs tend to domi-nate the outer part of a biofilm, while nitrifiers occur along withinerts closer to the substratum (Wanner et al., 2006). Khin andAnnachhatre (2004) suggested that under DO limited conditions(<0.5% air saturation) a co-culture of aerobic and anaerobic NH4–N

Author's personal copy
A. Albuquerque et al. / Ecological Engineering 44 (2012) 44– 52 51
Fig. 7. Correlation between ammonia removal and nitrate production observed in section MT-P2 (black line) and section P2-P4 (red line). (For interpretation of the referencesto color in this figure legend, the reader is referred to the web version of the article.)
oxidizing bacteria (ANAMMOX) can be established, and this systemis responsible for the process termed CANON, OLAND or aero-bic deammonification. The interaction of aerobic and anaerobicNH4–N oxidizing bacteria under DO limited conditions results inalmost complete conversion of NH4–N to N2 gas, whereas onlysmall amounts of NO3–N are produced.
Therefore, different operation procedures of BAF may be sched-uled in order to meet different criteria for the final effluent. The useof aeration in part of the reactor may allow for a superior reductionof organic compounds and ammonia nitrogen, with no guaran-tee of high reduction of nitrate. This procedure may, however,be useful whenever the concentration of nitrate does not becomedetrimental to effluent reuse purposes or does not produce signifi-cant environmental impacts on receiving environments. The use ofintermittent aeration may, therefore, be an interesting option. Dur-ing the aeration phase, high carbon and ammonia nitrogen removalrates may be achieved. The nitrate produced by nitrification may beeliminated during the non aeration phase as a result of establishingfavourable anoxic areas.
4. Conclusions
Within the applied ranges of loading rates of ammo-nia (6 g N/m3.d to 903 g N/m3 d) and organic compounds (48 gCOD/m3 d to 2,391 g COD/m3 d), the results showed that the par-tially aerated BAF used in this study allowed carbon removal,nitrification and denitrification simultaneously, at significantremoval rates. However, ammonia removal was not observed forNLR below 15 g N–NH4/m3.d. The long-term operation of the BAFreactor was characterized by stable and relative high removal effi-ciencies in terms of both COD (<80%) and NH4–N (<75%). Between50% and 70% of ammonia removal occurred in the upper sec-tion of the BAF (MT-P2), where larger biofilm development wasobserved and DO concentrations remained over 2.1 g O2/m3. Theapplied NLR significantly influenced the removal rates of ammoniafor NLR above 32.6 g N–NH4/m3 d. At the reactor bottom (P4-MB),simultaneous nitrification and denitrification was observed at DOconcentrations between 0.4 g O2/m3 and 0.8 g O2/m3. The use ofsubmerged BAF partially aerated for the removal of low concentra-tions of carbon and nitrogen forms appears to be an advantageouspolishing solution, which can be used to produce effluents for reusepurposes or to reduce nitrogen loads to be discharged into streams.
References
Ahn, Y., 2006. Sustainable nitrogen elimination biotechnologies: a review. Process.Biochem. 41, 1709–1721.
A. Albuquerque, 2003. Contribution to the study of residual carbon removal in down-flow biological packed beds, Ph.D. Thesis, University of Beira Interior, Covilha,Portugal, pp. 469 (in Portuguese).
Albuquerque, A., Makinia, J., Pagilla, K., 2009a. Investigation of nitrogen removalpathways in a biological packed bed reactor using elementary mass balances.In: Proceedings of the WEF 2nd Specialty Conference on Nutrient Removal 2009:Sustainable Treatment Solutions (CD-ROM), Washington, USA, June 28–July 1,WEF, Alexandria, USA, pp. 117–135.
Albuquerque, A., Oliveira, J., Semitela, S., Amaral, L., 2009b. Influence of bed mediacharacteristics on ammonia and nitrate removal in shallow horizontal subsur-face flow constructed wetlands. Biores. Technol. 100, 6269–6277.
APHA-AWWA-WEF, 1999. Standard Methods for the Examination of Water andWastewater, 20th edition. American Public Health Association, Washington, DC,USA, pp. 1325.
Bialowiec, A., Davies, L., Albuquerque, A., Randerson, P., 2012b. The influence ofplants on nitrogen removal from landfill leachate in discontinuous batch shallowconstructed wetland with recirculating subsurface horizontal flow. Ecol. Eng. 40,44–52.
Bialowiec, A., Davies, L., Albuquerque, A., Randerson, P., 2012a. Nitrogen removalfrom landfill leachate in constructed wetlands with reed and willow: redoxpotential in the root zone. J. Environ. Manag. 97, 22–27.
Buitrón, G., Quezada, M., Moreno, G., 2004. Aerobic degradation of the azodye acid red in a sequencing batch biofilter. Biores. Technol. 92 (2),143–149.
Chang, Y., Henkel, J., Meda, A., Wagner, M., Cornel, P., 2008. Comparison of tech-niques in greywater treatment. In: Proceedings of the IWA Conference onSanitation Options in the Asia-Pacific (CD-Rom), Hanoi, Vietnam, November18–20, IWA, London, UK.
Farabegoli, G., Chiavola, A., Rolle, E., 2009. The biological aerated filter (BAF) as alter-native treatment for domestic sewage. Optimization of plant performance. J.Hazard. Mater. 171 (1–3), 1126–1132.
Garzon-Zuniga, M., Lessard, P., Aubry, G., Buelna, G., 2005. Nitrogen eliminationmechanisms in an organic media aerated biofilter treating pig manure. Environ.Technol. 26, 361–371.
Grady Jr., C., Daigger, G., Lim, H., 1999. Biological wastewater treatment. In: Revisedand Expanded, 2nd edition. Marcel Dekker, New York, USA, pp. 1076.
Ha, J., Ong, S., Surampalli, R., 2010. Impact of media type and various operatingparameters on nitrification in polishing biological aerated filters. Environ. Eng.Res. 15 (2), 79–84.
He, S., Xue, G., Kong, H., 2007. The performance of BAF using natural zeolite as fil-ter media under conditions of low temperature and ammonium shock load. J.Hazard. Mater. 143, 291–295.
Helmer, C., Kunst, S., Juretschko, S., Schmid, M.C., Schleifer, K.H., Wagner, M.,1999. Nitrogen loss in a nitrifying biofilm system. Water Sci. Technol. 39 (7),13–21.
Hidaka, T., Tsuno, H., 2004. Development of a biological filtration model applied foradvanced treatment of sewage. Water Res. 38, 335–346.
Jenssen, P., Krogstad, T., Paruch, A., Mæhlum, T., Adam, K., Arias, C., Heistad, A.,Jonsson, L., Hellström, D., Brix, H., Yli-Halla, M., Vråle, L., Valv, M., 2010. Filter bedsystems treating domestic wastewater in the Nordic countries – performanceand reuse of filter media. Ecol. Eng. 36 (12), 1651–1659.

Author's personal copy
52 A. Albuquerque et al. / Ecological Engineering 44 (2012) 44– 52
Jeong, J., Hidaka, T., Tsuno, H., Oda, T., 2006. Development of biological filter astertiary treatment for effective nitrogen removal: biological filter for tertiarytreatment. Water Res. 40, 1127–1136.
Khin, T., Annachhatre, A., 2004. Novel microbial nitrogen removal processes. Biotech.Adv. 22, 519–532.
Lei, G., Qi, B., Wang, Z., Wang, J., 2009. Treatment of municipal sewage by biologicalaerated filter (BAF) using burned clay pellet as media. Int. J. Environ. Pollut. 37(2–3), 186–204.
Littleton, H., Daigger, G., Strom, P., Cowan, R., 2003. Simultaneous biological nutrientremoval: evaluation of autotrophic denitrification, heterotrophic nitrification,and biological phosphorus removal in full-scale systems. Water Environ. Res.75, 138–150.
Liu, Y., Yang, T., Yuan, D., Wu, X., 2010. Study of municipal wastewater treat-ment with oyster shell as biological aerated filter medium. Desalination 254,149–153.
Mendoza-Espinosa, L., Stephenson, T., 1999. A review of biological aerated filters forwastewater treatment. Environ. Eng. Sci. 16, 201–216.
Mulder, A., van de Graaf, A., Robertson, L., Kuenen, J., 1995. Anaerobic ammoniumoxidation discovered in a denitrifying fluidized bed reactor. FEM Microb. Ecol.16 (3), 177–184.
Paredes, D., Kuschk, P., Mbwette, T., Stange, F., Müller, R., Köser, H., 2007. New aspectsof microbial nitrogen transformations in the context of wastewater treatment– a review. Eng. Life Sci. 7 (1), 13–25.
Pynaert, K., Sprengers, R., Laenen, J., Verstraete, W., 2002. Oxygen-limited nitrifi-cation and denitrification in a lab-scale rotating biological contactor. Environ.Technol. 23, 353–362.
Schmidt, I., Sliekers, O., Schmid, M., Bock, E., Fuerst, J., Kuenen, J., Jetten, M., Strous, M.,2003. New concepts of microbial treatment processes for the nitrogen removalin wastewater. FEMS Microb. Rev. 27, 481–492.
Schulz, J., Menningmann, G., 2008. Submerged fixed-bed reactors. In: Rehm, H., Reed,G. (Eds.), Biotechnology: Environmental Processes I, vol. 11a. , 2nd edition. WileyVCH, Weinheim, Germany.
Stephenson, T., Pollard, S., Cartmell, E., 2003. Feasibility of biological aerated filters(BAF) for leachate treatment. In: Proc. 9th International Waste Management andLandfill Symposium (CD-Rom), S. Margherita di Pula, Cagliari, Italy, Oct. 6–10,CISA, Italy, pp. 10.
Tchobanoglous, G., Burton, F.L., Stensel, H.D., 2003. Wastewater Engineering. Treat-ment and Reuse, 4th Edition. McGraw-Hill, New York, USA.
Villaverde, S., Fdz-Polanco, F., Garcia, 2000. Nitrifying biofilm acclimation to freeammonia in submerged biofilters: startup influence. Water Res. 34 (2), 602–610.
Wanner, O., Eberl, H., Morgenroth, E., Noguera, D., Picioreanu, C., Rittmann, B., vanLoosdrecht, M., 2006. Mathematical Modeling of Biofilms, Scientific and Tech-nical Report No. 18. IWA Publishing, London, UK.
Yang, J., Liu, W., Li, B., Yuan, H., Tong, M., Gao, J., 2010. Application of a novelbackwashing process in upflow biological aerated filter. J. Environ. Sci. 22 (3),362–366.
Yu, X., Qi, Z., Zhang, X., Yu, P., Liu, B., Zhang, L., Fu, L., 2007. Nitrogen loss and oxygenparadox in full-scale biofiltration for drinking water treatment. Water Res. 41,1455–1464.
Xia, S., Li, J., Wang, R., 2008. Nitrogen removal performance and microbial com-munity structure dynamics response to carbon nitrogen ratio in a compactsuspended carrier biofilm reactor. Ecol. Eng. 32 (3), 256–262.


