Embed Size (px)
Citation preview
Research Project
“INFLUENCES OF ONLINE SERVICES ON CUSTOMER SATISFACTON
IN BANKING SECTOR IN PAKISTAN”
Assigned by:
Ahsan Akbar
Submitted By:
Rizwan Ali Khan (08-176)
Jawad Ashraf (08-189)
Sana Khalid (08-209)
BBA (Hon’s) 8th Semester (Morning)
University OF Education Lahore (Okara Campus)
Influences of online services on customer satisfaction in banking
sector in Okara, Punjab, Pakistan
Abstract
Online services are essential sector of banking industry. Online services are gaining the
attention of conventional bank’s customers rapidly. It has brought the revolutionary changes in
the Okara banking industry in terms of customer satisfaction. Online banking has got popularity
in the developed as well as developing countries because it saves people time, reduces costs and
people have access to all banking services on one click. More often, the new innovated system
allows the customers to access their accounts at home using a mobile device or electronic
devices. This research paper focuses on growth and awareness of online banking services among
Residents of the Okara, Pakistan. Online banking is today’s needed as it provides easy way to
approach an account. Most of the commercial banks in the Okara switched to the convenience
ways in accessing the accounts of the customers and giving them the freedom for the easy
access. “The volume of e-banking transactions in Pakistan reached 125.9 million while the value
of these transactions aggregated to Rs.12 trillion showing an increase of 15.5 percent and 19.0
percent respectively as compared to the first half of year 2011”. Online distribution channels
provide alternatives for quick delivery of banking services to a wider scope of customers. But
despite all the opportunities and benefits created by the online banking, there are still many
challenges that are present in the financial sector.
Key Words: Online Banking, Customer satisfaction, Service quality, Access, E-SERVQUAL,
Reliability, Efficiency.
Introduction
Service sectors in Pakistan are rapidly increasing their performances due to many
pressure forces. The most common and major pressure force is Technology, which has
revolutionized all fields for business by eliminating all their barriers. Continuous creation
of new products and services opportunities in the markets are increasing rapidly which
has developed greatly customer oriented businesses. To be more competitive service
providers are increasing their offers for customers. They are using IT based services to
minimize costs & to create additional services for their customers. Some other common
examples of pressure forces or IT based services are ATM; web based banking services,
online transfer of payments, automatic ticketing machines by airlines. These systems are
expected to enhance the service quality, financial performance, efficiency, effectiveness
& customer satisfaction. Furey (1991) pointed out that IT can improve service quality by
improving convenience, providing extra services & collecting feedback for management
use. Fitzsimmons (1997) pointed out some competitive rules for IT in services like
creation of entry barriers, increasing productivity & increase of revenue generation from
new services Award (2000) explained that internet users do four activities which are
Shopping, Banking, Investing, and Online e-payments. All these factors require banking
relationship. The rapid growth of internet is changed the way of businesses to interact
with its customers. SERVQUAL developed by Zeithaml (1988) is one of the most widely
used instruments to interpret customer satisfaction.
In many service industries IT based service systems are very important for institutions to
attain a competitive edge (Bonfield 1996). As technology is very important so we need to
better understand How IT based services can we evaluate, how can we enhance the
customer satisfaction & how it affect their perceptions, because consumers are end users
so their perceptions matters a lot.
Now companies are introducing superior services which are the result of rapid growth in
communication technologies. Internet banking is another complete subject that adds some
additional values to the existing portfolio by giving personal attentions with service
personal through technology ( Jun and Cai , 2001 ) . Based on these developments it will
be prominent for researchers to make evaluations of IT based services by customers. (
Parasuraman and Grewal, 2000 ) pointed out that internet based on home banking have
possibilities to bring revolutions in the way in which banks maintain their relationships.
The focus of many researches was almost to study the close relationships between service
quality & their customer’s satisfactions and the primary purpose of this study is to
explore the same relationship in the Pakistan’s banking sector. Internet banking is a
worldwide and very vast field so the dimensions of conventional service qualities may
not directly be applied to e- banking. So different dimensions have been used to measure
e-service quality. The most commonly used is “the extent to which website facilitates
productive shopping, purchasing, and delivery of goods & services” (Siu and Mou, 2003;
Zeithmal et al, 2000; Yang and Fang 2004; Bitner et al 1990; Parasuraman et al 1985; Liu
and Arnett 2000). Also online service quality rated as second most important activity,
involving empathy, quick response, and follow up and to make assurance (awad 2000).
A large number of studies have been conducted important dimensions of service quality
but a gap is still remaining even literatures are also investigated (Jun and Cai 2001).
However further researches and studies are desired to understand these dimensions of
online service quality and these studies should conducted for different modes of e-
transactions (Zeithmal et al 2002). Some studies are available for examining the same in
Pakistani Banking Sector.
Literature Review
Oliver (1980), Churchill and Surprenant (1982) conducted a research on customer satisfaction
and they defined it as “to make decision before making a choice regarding purchase decision of
any commodity”. They consider satisfaction as “An attitude or decision made by consumer by
comparing their purchase expectations in advance to what people actually think about
performance”.Parasuraman et al. (1985, 1988), Pitt et al. (1995), Zeithmal et al. (1985) studied
different research papers and articles, to understand the different factors or determinants in
conventional services that affect greatly the online service quality. Cadotte et al. (1987) gave the
historical definition of expectation as “How a product or service fulfills the needs, wants and
demands of the customers in their true sense”. Hoffman and Bateson (1997) clearly suggested
and identified that “Ambiguity increases due to these two terminologies that are, first is Service
quality and second is customer satisfaction. Experts were sure that “Service quality was a long-
term analysis of attitude and Customer satisfaction was a short –term analysis of attitude”.
After that Johnston (1997) strongly argued that it is very important to know the factors which
identify the service quality. Ho and Wu (1999) pointed out five factors of customer satisfaction
in online dealings. They include Logistic Support, Product personality, and Technical
characteristics, Features of information and Presentation of home page.
Mckinney et al. (2002) defined consumer’s expectations as “Trust or belief in a product
or service prior to use it”. Also provide the basis for customer satisfaction model & worked on
disconfirmation. They defined disconfirmation as “customer decision making based on
comparing the current and perceived true value delivered”. They also defined online services as
“The capability of the website to obtain and convey information”. Liu and Khalifa (2003) clearly
mention that online means of dealings are so much easy, cost effective & efficient, and highly
customized than other means of dealings (such as conventional means). Zeithmal et al. (2002)
according to this literature and research there are six factors or determinant of service quality
which is based on previous studies. A SERVQUAL MODEL is used in this research.
According to Jun and cai (2001), Saha and Zhao (2005) Efficiency: It can be defined as
quickness and Customer’s ability to reach their most wanted and desired websites, products &
information with convenience, little or no efforts. Reliability: It can be defined as uniformity and
consistency in real & actual performance. It means that firm should do exactly what it said. E.g.
maintaining proper records, billing accuracy and delivery of services within acceptable and
promised time. Fulfillment: It can be defined as having sufficient products and services in stock
& making available these products and services to the customers within agreed time.
Zeithmal et al. (2002) Responsiveness: It is employee’s agreeableness for the provision
of services. E.g. quickly answer and response as customer calls for an action or service.
According to Wang and Huarng (2002) Assurance: A set of courtesy, respect and
employee’s knowledge with their abilities to build, maintain and enhance confidence.
According to Yang and Fang (2004), Saha and Zhao (2005) Privacy: It can be defined as
assurance and giving guarantee to customers for security of their records, shopping activities and
keeping account information secret.
As Parasuraman et al. (1985) gave the concept of ten determinents Access,
Responsiveness, Reliability, Competence, Credibility, Courtesy, Security, Communication,
Understanding the Customers, Tangibles. After the study they review these ten determinants in
to five main dimensions. Tangibles; these are related to physical facilities, personnel, equipment
and communication. Reliability; this includes the ability to complete the service quality.
Responsiveness; this includes the agreeableness of the service provider to give services to
customers. Assurance; which refers the information and behavior of employees and their
willingness to convey believe and confidence. Empathy; which includes the individual attention
to customer. We studied the litrature of Parasuraman and we really appriciate his efforts because
he identified many important dimensions than any other auther.
According to Peter and Olson, (1990) it indicates that relationship between service quality
and satisfaction. Satisfaction and dissatisfaction create the result in form of pre purchase and post
purchase. Johnston (1995-1997) there is some predominant determinants which create
satisfaction and dissatisfaction.
Satisfaction; creates care, responsiveness. Attention and friendliness
Dissatisfaction; creates reliability, integrity and functionality.
Some actions that create or increase the information and customers, these are important to get
customer willingness and other actions as increasing the reliability of equipment will decrease
the dissatisfaction. McQuity et al. (2000) disconfirmation can be divided in two parts.....
Negative Disconfirmation: when product performance < expected performance.
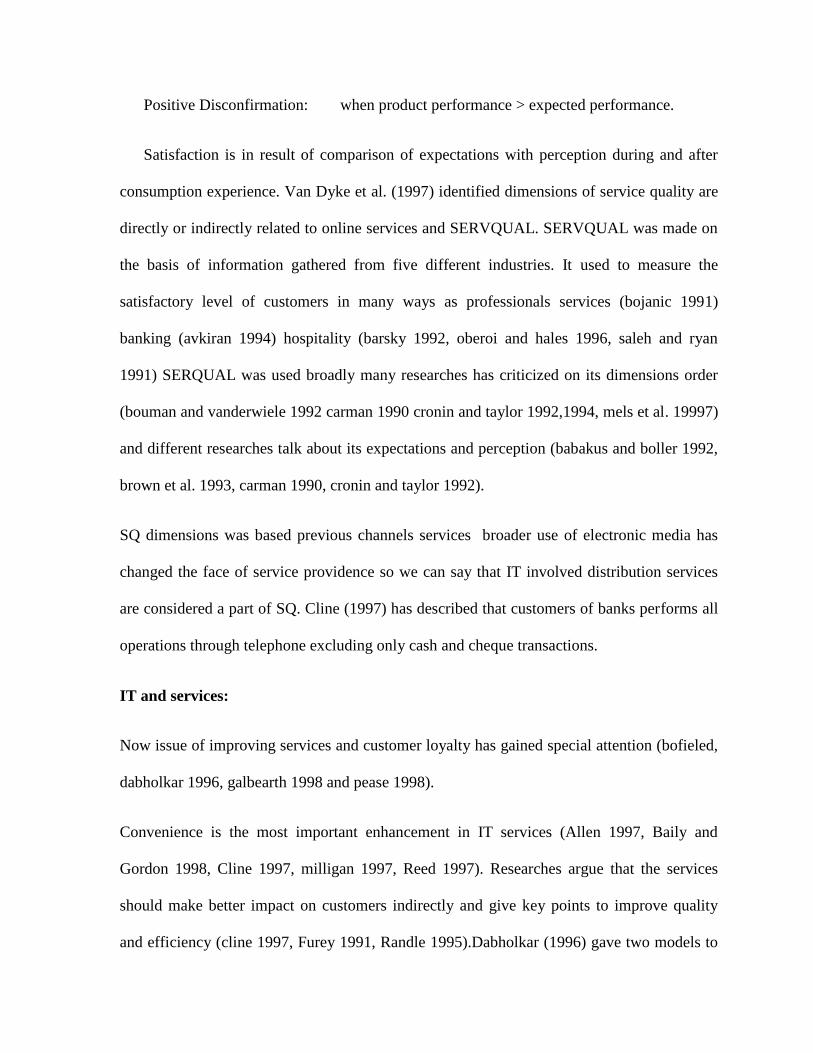
Positive Disconfirmation: when product performance > expected performance.
Satisfaction is in result of comparison of expectations with perception during and after
consumption experience. Van Dyke et al. (1997) identified dimensions of service quality are
directly or indirectly related to online services and SERVQUAL. SERVQUAL was made on
the basis of information gathered from five different industries. It used to measure the
satisfactory level of customers in many ways as professionals services (bojanic 1991)
banking (avkiran 1994) hospitality (barsky 1992, oberoi and hales 1996, saleh and ryan
1991) SERQUAL was used broadly many researches has criticized on its dimensions order
(bouman and vanderwiele 1992 carman 1990 cronin and taylor 1992,1994, mels et al. 19997)
and different researches talk about its expectations and perception (babakus and boller 1992,
brown et al. 1993, carman 1990, cronin and taylor 1992).
SQ dimensions was based previous channels services broader use of electronic media has
changed the face of service providence so we can say that IT involved distribution services
are considered a part of SQ. Cline (1997) has described that customers of banks performs all
operations through telephone excluding only cash and cheque transactions.
IT and services:
Now issue of improving services and customer loyalty has gained special attention (bofieled,
dabholkar 1996, galbearth 1998 and pease 1998).
Convenience is the most important enhancement in IT services (Allen 1997, Baily and
Gordon 1998, Cline 1997, milligan 1997, Reed 1997). Researches argue that the services
should make better impact on customers indirectly and give key points to improve quality
and efficiency (cline 1997, Furey 1991, Randle 1995).Dabholkar (1996) gave two models to
know the IT/Self services according to customers view. Barkley and Gupta (1994) had given
a model to evaluate the performance with 9 dimensions.
Overall study of history has resulted that more research on online services quality is
necessary.
Proposed Model
The research team used E-SERVQUAL model which is the conceptual model based on the
theoretical background and the literature review.
METHODOLOGY:
Research Question:
An influence of online services on customer satisfaction in Okara is the research question of our
survey and throughout the research we will determine the satisfaction level of the customers in
our city Okara.
Population and Sample:
The residents of Okara city, villages and its surrounding areas are the population which we used
in our research. We used the convenient sampling to conduct the information about our research
article to identify the satisfaction level of customers about online services in Okara. We
distributed 100 questionnaires among different people of the different institutions Like, Govt.
high school new campus Okara, Wateen office, The Bank of Punjab, District high court okara,
Govt College for Women Okara and The University of Education okara. Despite of their work
load they gave us healthy responses against our questionnaire.
Instruments:
As we are familiar with the most of data collection instruments including Surveys,
Questionnaire, Direct observation, Meetings and Interviews etc. We used the questionnaire
method as an instrument to collect the data. It is a descriptive method. Our questionnaire has two
parts. First one is demographic section, in which we used three dimensions; gender, age,
education. Second one question section in which we used six dimensions; reliability,
responsiveness, assurance, satisfaction, security and tangibles. These six dimensions have twenty
eight items.
Item is also known as question. Each and every question explains and elaborates our dimensions.
We use the likert scale for this research which contains five options for each question. 1 show the
Highly Dissatisfaction, 2 shows the Dissatisfaction, 3 shows that customer is Neutral, 4 shows
the Satisfaction and 5 show the Highly Satisfaction level of the online customers in our city.
Procedure:
The main procedure used by our research team is self-administered questionnaires to collect the
data. We briefed the respondents about required data and objectives of the study. Each
respondent is given only single questionnaire. Data collection from the large number of
respondents was pretty difficult for us due to Lack of resources, very short time for research and
budget constraints But it was a very interesting experience for us.
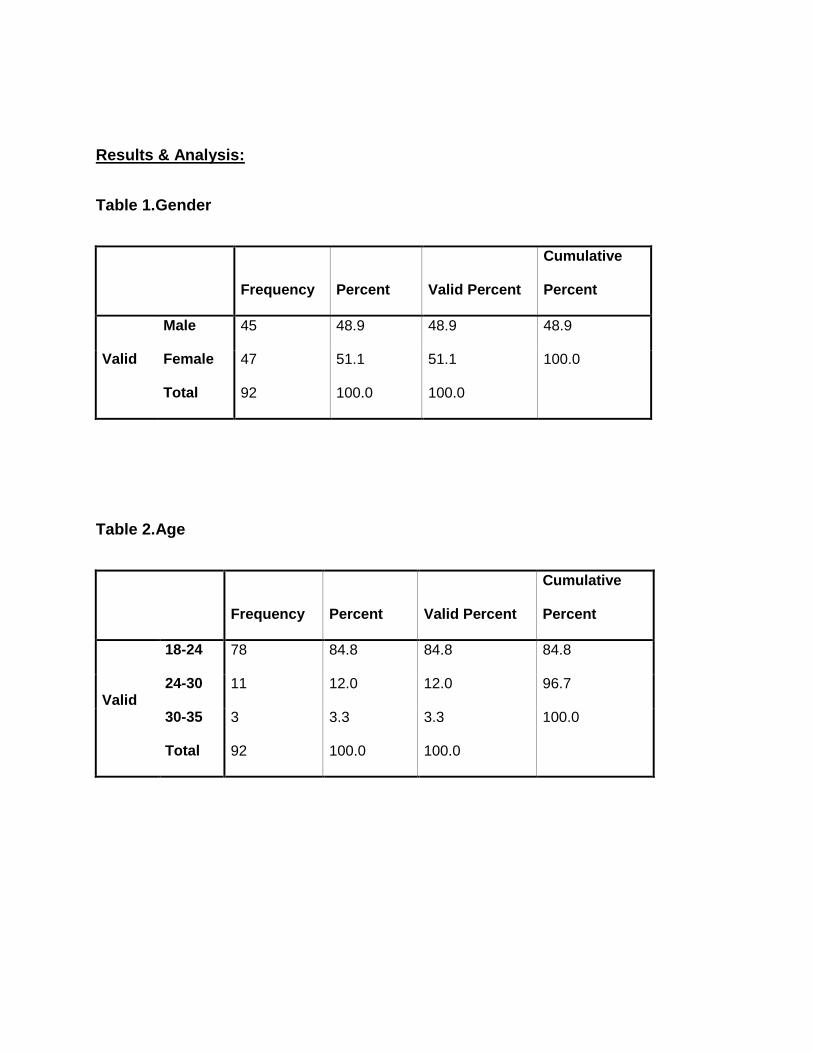
Results & Analysis:
Table 1.Gender
Frequency Percent Valid Percent
Cumulative
Percent
Valid
Male 45 48.9 48.9 48.9
Female 47 51.1 51.1 100.0
Total 92 100.0 100.0
Table 2.Age
Frequency Percent Valid Percent
Cumulative
Percent
Valid
18-24 78 84.8 84.8 84.8
24-30 11 12.0 12.0 96.7
30-35 3 3.3 3.3 100.0
Total 92 100.0 100.0
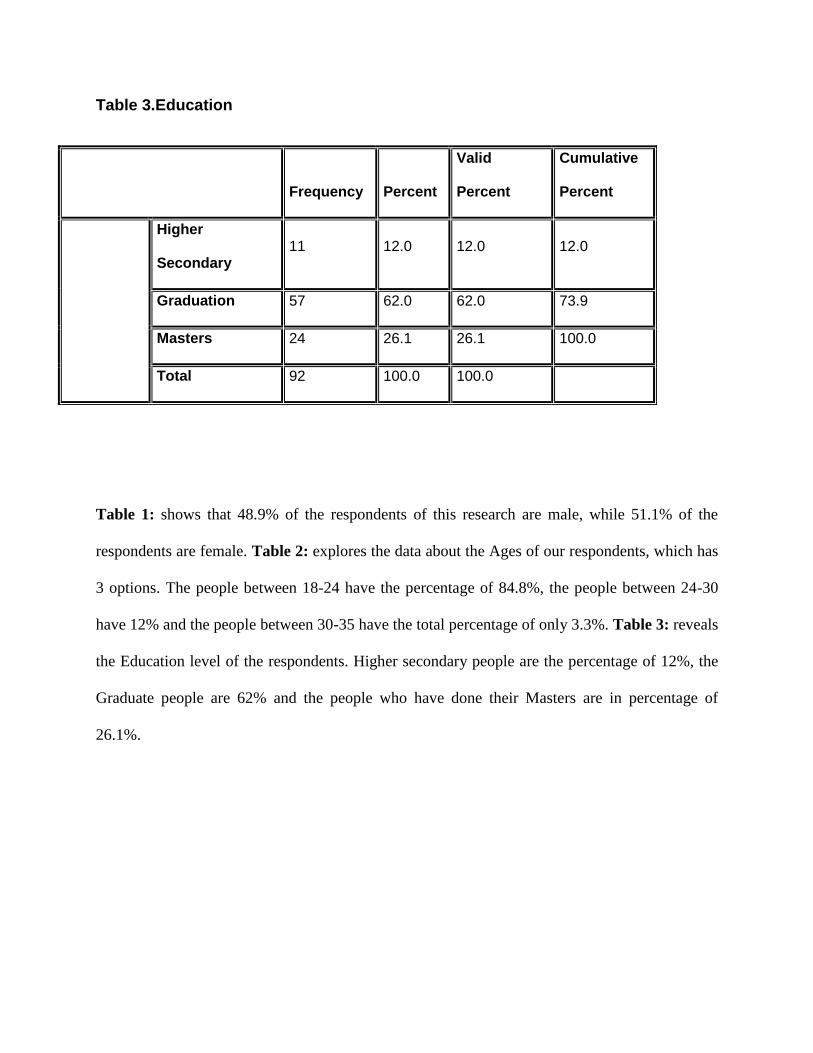
Table 3.Education
Frequency Percent
Valid
Percent
Cumulative
Percent
Higher
Secondary 11 12.0 12.0 12.0
Graduation 57 62.0 62.0 73.9
Masters 24 26.1 26.1 100.0
Total 92 100.0 100.0
Table 1: shows that 48.9% of the respondents of this research are male, while 51.1% of the
respondents are female. Table 2: explores the data about the Ages of our respondents, which has
3 options. The people between 18-24 have the percentage of 84.8%, the people between 24-30
have 12% and the people between 30-35 have the total percentage of only 3.3%. Table 3: reveals
the Education level of the respondents. Higher secondary people are the percentage of 12%, the
Graduate people are 62% and the people who have done their Masters are in percentage of
26.1%.
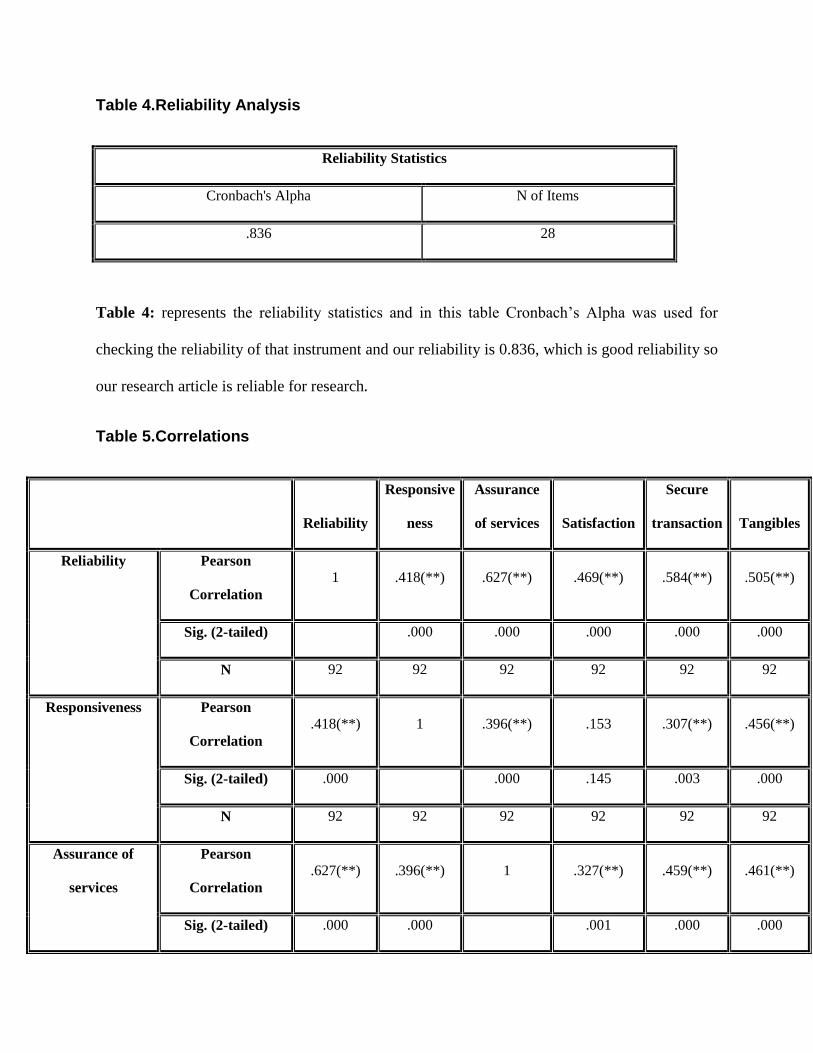
Table 4.Reliability Analysis
Reliability Statistics
Cronbach's Alpha N of Items
.836 28
Table 4: represents the reliability statistics and in this table Cronbach’s Alpha was used for
checking the reliability of that instrument and our reliability is 0.836, which is good reliability so
our research article is reliable for research.
Table 5.Correlations
Reliability
Responsive
ness
Assurance
of services Satisfaction
Secure
transaction Tangibles
Reliability Pearson
Correlation
1 .418(**) .627(**) .469(**) .584(**) .505(**)
Sig. (2-tailed) .000 .000 .000 .000 .000
N 92 92 92 92 92 92
Responsiveness Pearson
Correlation
.418(**) 1 .396(**) .153 .307(**) .456(**)
Sig. (2-tailed) .000 .000 .145 .003 .000
N 92 92 92 92 92 92
Assurance of
services
Pearson
Correlation
.627(**) .396(**) 1 .327(**) .459(**) .461(**)
Sig. (2-tailed) .000 .000 .001 .000 .000
N 92 92 92 92 92 92
Satisfaction Pearson
Correlation
.469(**) .153 .327(**) 1 .300(**) .550(**)
Sig. (2-tailed) .000 .145 .001 .004 .000
N 92 92 92 92 92 92
Secure
transactions
Pearson
Correlation
.584(**) .307(**) .459(**) .300(**) 1 .383(**)
Sig. (2-tailed) .000 .003 .000 .004 .000
N 92 92 92 92 92 92
Tangibles Pearson
Correlation
.505(**) .456(**) .461(**) .550(**) .383(**) 1
Sig. (2-tailed) .000 .000 .000 .000 .000
N 92 92 92 92 92 92
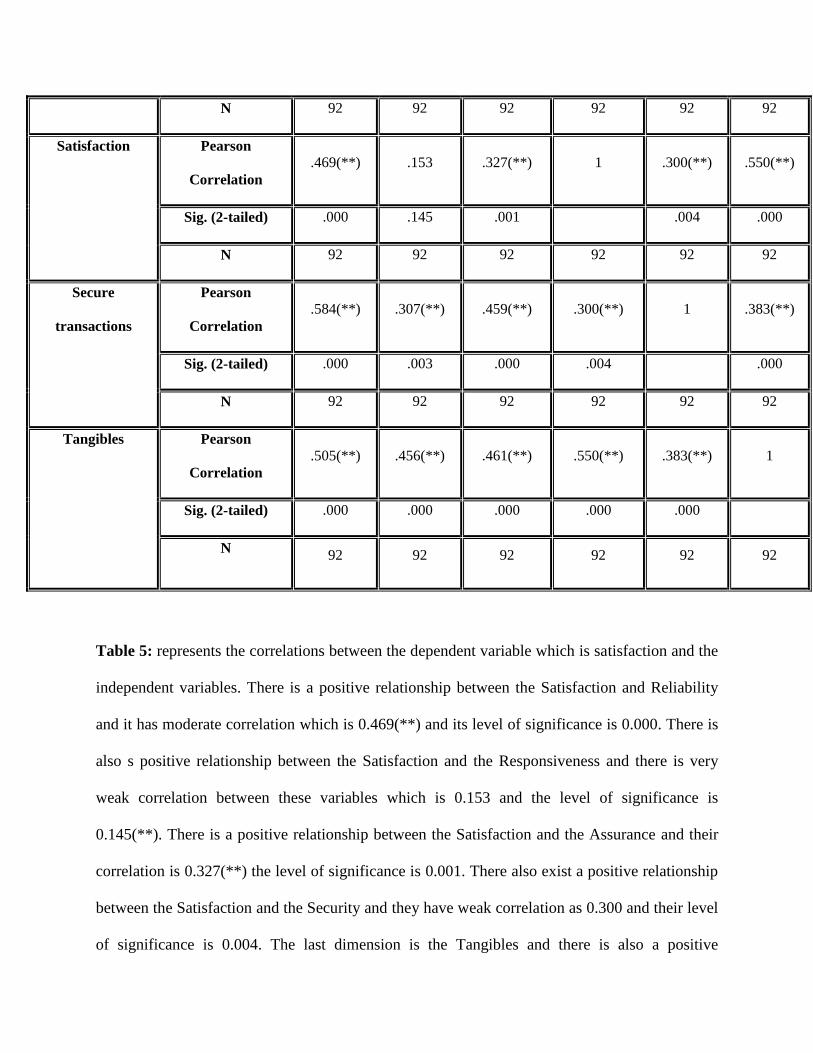
Table 5: represents the correlations between the dependent variable which is satisfaction and the
independent variables. There is a positive relationship between the Satisfaction and Reliability
and it has moderate correlation which is 0.469(**) and its level of significance is 0.000. There is
also s positive relationship between the Satisfaction and the Responsiveness and there is very
weak correlation between these variables which is 0.153 and the level of significance is
0.145(**). There is a positive relationship between the Satisfaction and the Assurance and their
correlation is 0.327(**) the level of significance is 0.001. There also exist a positive relationship
between the Satisfaction and the Security and they have weak correlation as 0.300 and their level
of significance is 0.004. The last dimension is the Tangibles and there is also a positive
relationship between these both variables and the value of correlation is 0.550(**) which is
moderate their level of significance is0.000.
Conclusion:
We started this article to identify the Influence of online services on customer satisfaction. Many
researches have been conducted on this topic in different areas and different countries and we
were aimed to conduct this research in our city Okara and of course with the help of Allah we are
concluding this article. Conclusion is that online service quality help to enhance the satisfaction
level of the customer directly or indirectly. As we see in conventional businesses and banking
that they are utilizing new technology, increased efficiency and the innovative ideas So online
services are also using modern technology equipment to satisfy the customers.
The entire Hypothesis accepted and proposed conceptual model which is E-SERVQUAL also
right at its best level. The dimensions of the service quality such as reliability, responsiveness,
assurance, satisfaction, security and tangibles lead to higher satisfaction of the customer in online
services.
Limitations:
Data collection from the large number of respondents was pretty difficult for us due to following
reasons (1) Lack of resources, (2) very short time for research, (3) budget constraints and (4) our
own Study load. Due to following some reasons we face some difficulties but overall it was a
very interesting experience for us because it was a totally new knowledge for us and out of
routine study.
REFERANCES
1. Allen, D.S.(1997), “Where’s the productivity growth”? Federal Reserve Bank of St
Louis.
2. Avkiran, N.K.(1994), “Developing an instrument to measure customer service quality in
branch banking”. International journal of bank marketing.
3. Babakus, E. and Boller, G.W.(1994), “An empirical assessment of the SERVQUAL
scale”. Journal of business research.
4. Baily, M. and Gordon, R.J.(1988), “The productivity slowdown, measurement issues, and
the explosion of computer power”. Brooding papers on economic activity.
5. Barsky, J.D (1992), “Customers satisfaction in the hotel industry meaning and measures.”
Hospitality research journal.
6. Berkley, B and Gupta A (1994), “Improving service quality with information
technology”. International journal of information management.
7. Cadotte ER, Woodruff RB, Jenkins RL (1987). Expectations and norms in models of
consumer satisfaction. J. Mark. Res., 24(3): 305–314
8. Churchill GA, Surprenant C (1982). An investigation into the determinants of customer
satisfaction. J. Mark. Res., 19(4): 491-504.
9. Cline, K (1997), “Call centers; the heart of direct banking”. banking strategies
10. Hoffman D, Bateson J, (1997). Essentials of Service Marketing, The Dryden Press, New
York, NY, pp. 22-46.
11. Johnston, R . (1995),“The de te rminant s of service quali ty: satisfiers and
d i s s a t i s f i e s ”, International Journal of Service Industry Management,
Vol.6No.5,pp.5371.
12. Johnston,R. (1997),“Identifying the critical determinants of service quality in retail
banking: importance and effect”, The International Journal of Bank Marketing,
Vol.15No.4, pp.111-6.
13. Johnston R (1997). Identifying the critical determinants of service quality in retail
banking: importance and effect. Int. J. Bank Mark., 15 (4): 111-16
14. Johnson,D.,Bardhi, F. and Dunn,D.(2008),“Understanding how technology paradoxes
affect customer satisfaction with self-service technology the role of performance
ambiguity and trust in technology”, Psychology & Marketing, Vol.25No.5,pp.416-43.
15. Jun M, Cai S (2001). The key determinants of internet banking service quality: a content
analysis. Int. J. Bank. Mark., 19(7): 276-291
16. Liu V, Khalifa M (2003). The determinants of satisfaction at different adoption stages of
internet based services. J. Assoc. Info. Syst., 4(1): 206-232
17. McKinney V, Yoon K, Zahedi FM (2002). The measurement of web-customer
satisfaction: An expectation and disconfirmation approach. Inform. Syst. Res., 13(3):
296-315.
18. Mc Quitty, S., Finn, A and Wiley,J.B.(2000),“ Systematically varying consumer satisfaction
and its implications for product choice”, Academy of Marketing Science Review,Vol.2000
No.10,pp.1-16.
19. Oliver RL (1980). A cognitive model of the antecedents and consequences of satisfaction
decisions. J. Mark. Res., 17 (4): 460–469
20. Parasuraman, ET. Al (1988), “SERVQUAL a multi item scale for measuring consumer
perception of service quality”. journal of retailing
21. Parasuraman,A.,Zeithaml,V.A.andBerry,L.L.(1985),“Aconceptualmodelofservicequality
and its implications for future research”, Journal of Marking, Vol.49No.4,pp.41-50.
22. Parasuraman A, Zeithml VA, Bery LL (1988). SERVQUAL: a multiple – item scale for
measuring consumer perceptions of service quality. J. Retail., 64: 2-40.
23. Saleh, F and Ryan, C. (1991), “Analyzing service quality in the hospitality in the industry
using the SERVQUAL model”. The service industries journal.
24. T.R Furey (1991), “How information power can improve service quality”. planning
review.
25. VanDyke,T.P.,Kappelman,L.A.andPrybutok,V.R.(1997),“Measuringinformationsystems
service quality: concerns on the use of the SERVQUAL questionnaire”, MIS Quarterly,
Vol.21No.2,pp.195-208.
26. Wang M, Huarng SA (2002). An empirical study of internet store customer post shopping
satisfaction. Spec. Iss. Inform. Syst. 3: 632-638
27. Yang Z, Fang X (2004). Online service quality dimensions and their relationships with
satisfaction. Int. J. Serv. Ind. Manage., 15(3): 302-326
28. Zeithaml VA, Parasuraman A, Malhotra A (2002). Service quality delivery through
websites: a critical review of extant knowledge. J. Acad. Mark. Sci., 30(4): 362-375