Embed Size (px)
Citation preview

ORIGINAL PAPER
Impact of recharge from a check dam on groundwaterquality and assessment of suitability for drinkingand irrigation purposes
S. Parimala renganayaki & L. Elango
Received: 27 February 2013 /Accepted: 28 May 2013# Saudi Society for Geosciences 2013
Abstract Assessment of surface water and groundwaterquality is necessary as it controls their usability fordrinking and irrigation purposes. This study was carriedout to assess the suitability of groundwater for thesepurposes and to understand the impact of water storedin a check dam on groundwater quality near Chennai,Tamil Nadu, India. Water samples were collected from acheck dam across Arani River and 13 nearby wellsduring October 2010, January 2011, and April 2011.These samples were analyzed for pH, electrical conduc-tivity (EC), and calcium, magnesium, sodium, potassium,carbonate, bicarbonate, chloride, and sulfate concentra-tions. The World Health Organization and the Bureauof Indian Standards guidelines were used to assess thesuitability of groundwater for the purpose of drinking.Suitability of water for irrigation was determined basedon the EC, sodium adsorption ratio, US SalinityLaboratory diagram, percentage sodium, Wilcox’s dia-gram, Kelly’s index, and Doneen’s permeability index.About 38 % of the groundwater samples were suitablefor drinking and 70 % were suitable for irrigational use.Water stored in the check dam and groundwater in thewells closer to the structure were suitable for both drink-ing and irrigation purposes. The study confirms that thecheck dam in this area improves the groundwater qualityin its surroundings.
Keywords Managed aquifer recharge . Check dam .Majorions . WHO . BIS . Arani river . Chennai
Introduction
It is essential to ensure proper quality of water used fordrinking and irrigation purposes. Use of inferior quality ofwater for drinking will adversely affect human health. Indeveloping countries like India, most of the population useuntreated groundwater for various purposes, as they do nothave access to good quality water. The suitability of water fordrinking depends on various constituents such as suspendedparticles and dissolved inorganic, organic, radiological, andbiological constituents. The Bureau of Indian Standards (BIS2003) and the World Health Organization (WHO 2006) haveprescribed maximum permissible limits for various dissolvedions in water used for human intake. Researchers around theworld have studied the quality of water based on these stan-dards (Subramani et al. 2005; Kumaresan and Riyazuddin2006; Khodapanah et al. 2009; Das et al. 2010; Brindha andElango 2011; Obiefuna and Sheriff 2011; Alexakis 2011;Brindha and Elango 2012; Brindha et al. 2012; Bhalla et al.2012; Vaishnav and Dewangan 2012; Kalpana and Elango2013; Srinivasamoorthy et al. 2013; Brindha and Elango2013). Similarly, water used for irrigation should be of suit-able quality to ensure maximum yield from the crops. Thequality of irrigation water depends on the concentration ofdissolved ions within the recommended permissible limits.The use of inferior quality of water for irrigation will affectboth the plant as well as soil. In general, the problems associ-ated with the use of poor quality water include reduction ininfiltration rate and toxicity due to certain ions and excessivenutrients (Ayers and Westcot 1994). High concentrations ofdissolved ions in irrigation water will also affect the growth ofplants (Ramakrishnan 1998). Evaluation of water quality forirrigation purposes can be carried out using guidelines givenby the Food and Agricultural Organization (Kacmaz andNakoman 2010) and the BIS (1987). Further, it can also beassessed based on electrical conductivity (EC), sodium ad-sorption ratio (SAR), US Salinity Laboratory (USSL) diagram
S. Parimala renganayaki : L. Elango (*)Department of Geology, Anna University, Chennai 600 025,Tamil Nadu, Indiae-mail: [email protected]
S. Parimala renganayakie-mail: [email protected]
Arab J GeosciDOI 10.1007/s12517-013-0989-z

(USSL Staff 1954), percentage sodium (%Na), Wilcox’s dia-gram, Kelly’s index (KI), and Doneen’s permeability index(PI). This will help in adopting proper management strategiesfor getting better yield from the crops. Many researchers havestudied the quality of groundwater used for irrigation and theassociated problems (Eaton 1950; Mahida 1981; Sundarayet al. 2009; Al-Taani 2011; Vasanthavigar et al. 2012;Ramesh and Elango 2012; Jagadeshan and Elango 2012).
India is a country where agriculture is the primary source ofincome for the people and about 85 % of the population de-pends on groundwater for irrigation and domestic needs. Part ofthe water supply for large cities like Chennai in India, which isthe fourth largest metropolitan city, is also met by groundwater.The Chennai Metropolitan Water Supply and Sewerage Boardis pumping groundwater from the region located north ofChennai nearer to the present study site to supplement the waterneeds of the city. Further, groundwater is also used for domesticand irrigation purposes in this area. The overextraction ofgroundwater in this area has resulted in the decrease in ground-water level. In order to increase the groundwater level, a seriesof check dams are constructed across the two rivers flowingnorth of Chennai to harness flood water during the monsoonperiods. Parimala renganayaki and Elango (2013a, b) reviewedthe work related to managed aquifer recharge (MAR) by checkdams and assessed the impact of the check dam in augmentinggroundwater resources. However, the impact of check dam ongroundwater quality of this area has not been studied earlier.Hence, the present study was carried out around a check dam inArani River located at a distance of about 57 km northwest of
Chennai (Fig. 1). The objective of this study is to assess thesuitability of groundwater for domestic and irrigation purposesand to determine the effect of storage of water in the check damon groundwater quality.
Study area
The study area forms a part of Arani River basin (Fig. 1). TheArani River is a nonperennial river flowing toward the east.This river drains into the Bay of Bengal which is at a distance of35 km from this area. Considering a runoff coefficient of 0.15(Irrigated Agriculture Modernization and Water-BodiesRestoration andManagement Project 2006), average north eastmonsoonal rainfall of 600mm and 893 Km2 catchment area forthis check dam, the river discharge at this site is about 80million m3/year. A check dam of 260 m length and 3.5 mheight was constructed across this river in the year 2010. Thestorage capacity of this check dam is 0.8 million m3. Theatmospheric temperature of this area ranges from 38 to 42 °Cduring May–June and from 18 to 36 °C during December–January. The average annual rainfall is around 1,200 mm ofwhich 35 % falls during the southwest monsoon (June–September) and 60 % falls during the northeast monsoon(October–December) (Elango et al. 1996). Rainfall is the majorsource of groundwater recharge in this area. Intensive agricul-tural activity takes place throughout the year, which mainlydepends on groundwater. Submersible pumps are used to tapgroundwater for this purpose. Themajor crops cultivated in this
Fig. 1 Location of the study area in Arani River basin and sampling wells
Arab J Geosci

area are paddy, watermelon, spinach, and cucumber. Flowerslike jasmine and rose are also grown. The Tamil Nadu WaterSupply and Drainage Board tap groundwater to supply water tothe houses in nearby villages. Apart from this, the residents alsouse centrifugal pumps to tap groundwater for domestic pur-poses. Geologically, this area comprises of alluvial deposits ofabout 50 m thickness of recent age, which are underlain by lowpermeable rocks of pre-Quaternary age (Elango et al. 1996).The alluvium consists of sand and clay, with the fine-grainedbeds becoming dominant upwards.
Methods
A well inventory survey was carried out during July 2010,during which all the wells in this area were inspected to assessthe types of wells, pumping pattern, and hydrogeology. Thegroundwater level and EC of water were measured in all thesewells. Based on this, 13 representative wells surrounding thecheck dam at various distances were chosen for periodicalmonitoring. Subsequently, groundwater samples were collectedafter filtering it by 0.45 μm filter paper from these 13 wells inclean polyethylene bottles of 500 ml capacity during October2010, January 2011, and April 2011. These periods were cho-sen as the construction of the check dam was completed inAugust 2010 and, after the onset of the northeast monsoon,water started filling up from September 2010. Sampling wasdone once in 3months fromOctober 2011.Water samples fromthe check dam were also collected at the time of groundwatersampling. The pH and EC of the samples were measured in thefield immediately after sampling using a portable multiparam-eter system (YSI 556) which was calibrated with appropriatestandards. Carbonate and bicarbonate concentrations were es-timated by titration with 0.01 N H2SO4 as per APHA (1998).Calcium, magnesium, sodium, potassium, chloride, and sulfateconcentrations were analyzed using a Metrohm 861 advanced
compact ion chromatograph. Blanks and standards were ana-lyzed in between to check the accuracy of the analytical pro-cedures. Total dissolved solids (TDS) was calculated based onthe measured EC values using the relationship: TDS(mg/L)=EC (μS/cm)×0.64 (Lloyd and Heathcote 1985).Total hardness (TH) was calculated by TH (mg/L)=2.497 Ca(mg/L)+4.115 Mg (mg/L) (Faure 1998). The accuracy of theanalysis was determined by calculating the ion balance error,which was generally within ±10 %. AquaChem software wasused for preparing the Piper (1944) trilinear diagram.
Results and discussion
Hydrogeochemistry and suitability for domestic use
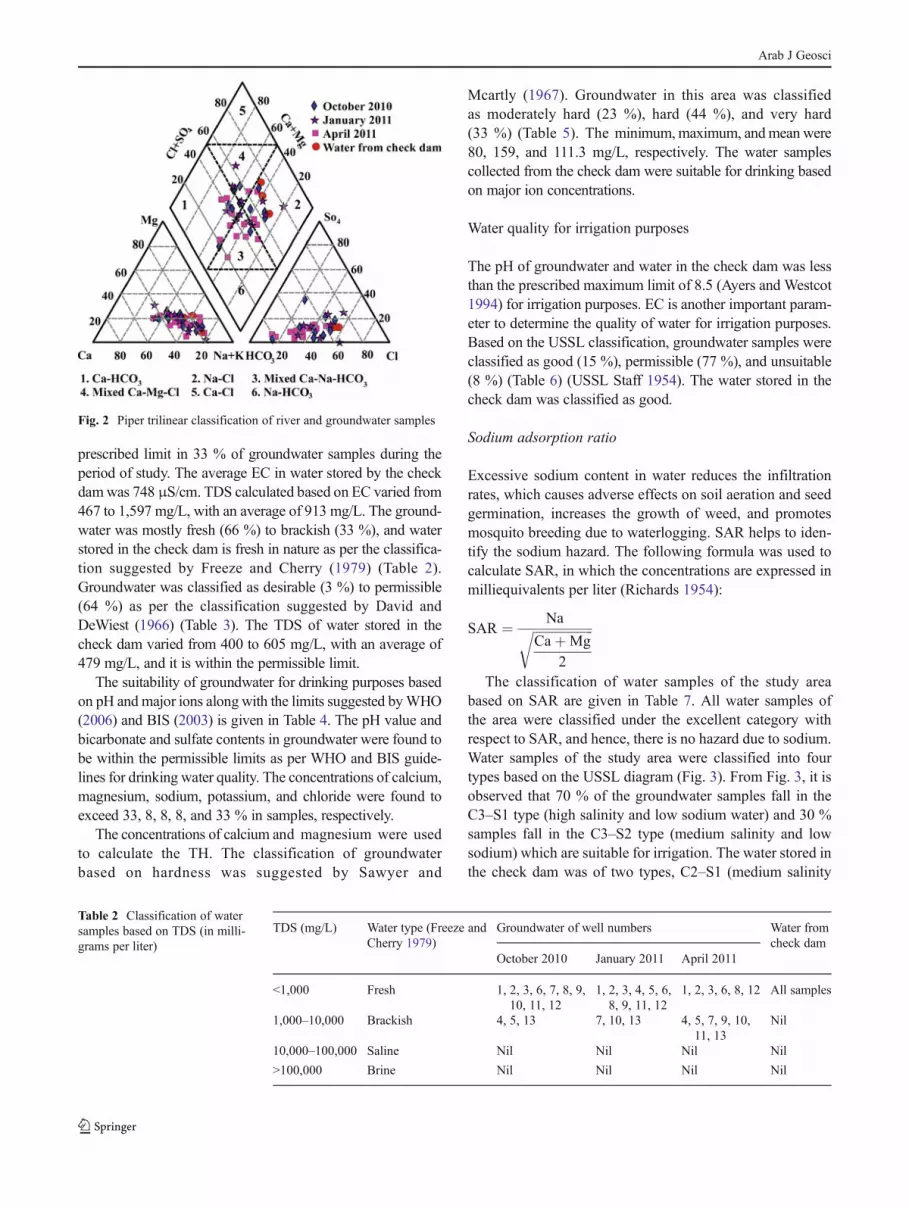
Mean values of various parameters measured in groundwaterand water from the check dam are given in Table 1. Theabundance of major cation concentration in groundwater isof the order Na>Ca>Mg>K, while that of anions is of theorder HCO3>Cl>SO4>CO3. Figure 2 indicates that Ca–Na–HCO3, Na–Cl, Ca–HCO3, and Ca–Mg–Cl were the domi-nant groundwater types in this area. The water from thecheck dam was of Na–Cl type.
The pH of groundwater is around neutral with an average of7.05, and for the water stored in the check dam, it was 7.1.High concentration of ions in drinking water may cause unde-sirable effects such as change in taste (pH), gastrointestinalirritation (TDS), scale formation in pipes (calcium and magne-sium), salty taste (chloride), etc. The EC, a measure of TDS, isone of the important parameters, as prolonged use of drinkingwater with high EC may cause gastrointestinal irritation forhumans (Singh et al. 2008). The EC of the groundwatersamples of the study area varied from 730 to 2,496 μS/cm,with an average of 1,426 μS/cm. The prescribed limit of EC is1,500 μS/cm, but the measured EC was above the maximum
Table 1 Mean values of mea-sured parameters in watersamples
Parameter Unit Groundwater Water from check dam
October 2010 January 2011 April 2011 Mean of October 2010,January 2011, and April 2011Mean Mean Mean
pH No unit 6.8 7.2 7.2 7.1
EC μS/cm 1276.7 1391.2 1610.9 748.0
Calcium mg/L 78.2 89.2 43.7 25.3
Magnesium mg/L 32.4 38.0 16.8 11.6
Sodium mg/L 183.7 175.6 99.0 66.3
Potassium mg/L 6.7 35.7 16.2 3.2
Carbonate mg/L 1.4 9.5 3.7 46.0
Bicarbonate mg/L 288.1 365.5 415.6 83.6
Chloride mg/L 186.8 237.6 199.7 105.5
Sulfate mg/L 97.3 110.6 70.9 38.1
Arab J Geosci
prescribed limit in 33 % of groundwater samples during theperiod of study. The average EC in water stored by the checkdamwas 748 μS/cm. TDS calculated based on EC varied from467 to 1,597 mg/L, with an average of 913 mg/L. The ground-water was mostly fresh (66 %) to brackish (33 %), and waterstored in the check dam is fresh in nature as per the classifica-tion suggested by Freeze and Cherry (1979) (Table 2).Groundwater was classified as desirable (3 %) to permissible(64 %) as per the classification suggested by David andDeWiest (1966) (Table 3). The TDS of water stored in thecheck dam varied from 400 to 605 mg/L, with an average of479 mg/L, and it is within the permissible limit.
The suitability of groundwater for drinking purposes basedon pH and major ions alongwith the limits suggested byWHO(2006) and BIS (2003) is given in Table 4. The pH value andbicarbonate and sulfate contents in groundwater were found tobe within the permissible limits as per WHO and BIS guide-lines for drinking water quality. The concentrations of calcium,magnesium, sodium, potassium, and chloride were found toexceed 33, 8, 8, 8, and 33 % in samples, respectively.
The concentrations of calcium and magnesium were usedto calculate the TH. The classification of groundwaterbased on hardness was suggested by Sawyer and
Mcartly (1967). Groundwater in this area was classifiedas moderately hard (23 %), hard (44 %), and very hard(33 %) (Table 5). The minimum,maximum, andmean were80, 159, and 111.3 mg/L, respectively. The water samplescollected from the check dam were suitable for drinking basedon major ion concentrations.
Water quality for irrigation purposes
The pH of groundwater and water in the check dam was lessthan the prescribed maximum limit of 8.5 (Ayers and Westcot1994) for irrigation purposes. EC is another important param-eter to determine the quality of water for irrigation purposes.Based on the USSL classification, groundwater samples wereclassified as good (15 %), permissible (77 %), and unsuitable(8 %) (Table 6) (USSL Staff 1954). The water stored in thecheck dam was classified as good.
Sodium adsorption ratio
Excessive sodium content in water reduces the infiltrationrates, which causes adverse effects on soil aeration and seedgermination, increases the growth of weed, and promotesmosquito breeding due to waterlogging. SAR helps to iden-tify the sodium hazard. The following formula was used tocalculate SAR, in which the concentrations are expressed inmilliequivalents per liter (Richards 1954):
SAR ¼ Naffiffiffiffiffiffiffiffiffiffiffiffiffiffiffiffiffiffiffi
CaþMg
2
r
The classification of water samples of the study areabased on SAR are given in Table 7. All water samples ofthe area were classified under the excellent category withrespect to SAR, and hence, there is no hazard due to sodium.Water samples of the study area were classified into fourtypes based on the USSL diagram (Fig. 3). From Fig. 3, it isobserved that 70 % of the groundwater samples fall in theC3–S1 type (high salinity and low sodium water) and 30 %samples fall in the C3–S2 type (medium salinity and lowsodium) which are suitable for irrigation. The water stored inthe check dam was of two types, C2–S1 (medium salinity
Table 2 Classification of watersamples based on TDS (in milli-grams per liter)
TDS (mg/L) Water type (Freeze andCherry 1979)
Groundwater of well numbers Water fromcheck dam
October 2010 January 2011 April 2011
<1,000 Fresh 1, 2, 3, 6, 7, 8, 9,10, 11, 12
1, 2, 3, 4, 5, 6,8, 9, 11, 12
1, 2, 3, 6, 8, 12 All samples
1,000–10,000 Brackish 4, 5, 13 7, 10, 13 4, 5, 7, 9, 10,11, 13
Nil
10,000–100,000 Saline Nil Nil Nil Nil
>100,000 Brine Nil Nil Nil Nil
Fig. 2 Piper trilinear classification of river and groundwater samples
Arab J Geosci

Table 5 Classification ofgroundwater based on TH TH (mg/L) Type of water (Sawyer
and Mcartly 1967)Groundwater of well numbers Water from check
damOctober 2010 January 2011 April 2011
<75 Soft Nil Nil Nil Nil
75–150 Moderately hard 6, 7 3, 13 1, 2, 6, 8, 12 April
150–300 Hard 1, 2, 3, 8, 11, 12 1, 2, 6, 8, 12 3, 4, 5, 7, 9, 10 Oct, Jan
>300 Very Hard 4, 5, 9, 10, 13 4, 5, 7, 9, 10, 11 11, 13 Nil
Table 4 Comparison of waterquality parameters with the per-missible limits
Parameter WHO(2006)
BIS(2003)
Well numbers in which the limits areexceeded
Water samples from checkdam in which the limit exceed
October 2010 January 2011 April 2011
pH 6.5–8.5 6.5–8.5 Nil Nil Nil Nil
Ca (mg/L) 75 75 4, 5, 9, 6,10, 13
5, 7, 9,10, 11
1, 13 Nil
Mg (mg/L) 50 30 7, 10 5 Nil Nil
Na (mg/L) 200 – 4, 5, 9 Nil Nil Nil
K (mg/L) 55 – Nil 4, 9 9 Nil
HCO3 (mg/L) 1,000 – Nil Nil Nil Nil
Cl (mg/L) 250 250 4, 5, 7, 9, 13 4, 5, 7, 9, 13 7, 5, 13 Nil
SO4 (mg/L) 400 400 Nil Nil Nil Nil
Table 3 Classification ofgroundwater based on TDS (inmilligrams per liter)
TDS (mg/L) Classification (Davidand DeWiest 1966)
Groundwater of well numbers Water fromcheck dam
October 2010 January 2011 April 2011
<500 Desirable for drinking 3 Nil Nil Oct, Jan
500–1,000 Permissible for drinking 1, 2, 6, 7, 8, 9,10, 11, 12
1, 2, 3, 4, 5, 6, 8,9, 11, 12
1, 2, 3, 6, 8, 12 April
1,000–3,000 Useful for drinking andirrigation
4, 5, 13 7, 10, 13 4, 5, 7, 9, 10,11, 13
Nil
>3,000 Unfit for drinking andirrigation
Nil Nil Nil Nil
Table 6 Suitability of ground-water for irrigation based on theUSSL classification
EC (μs/cm) Salinity class andremarks
Groundwater of well numbers Water fromcheck dam
October 2010 January 2011 April 2011
<250 C1, excellent Nil Nil Nil Nil
250–750 C2, good 1, 2, 3, 6, 8, 12 Nil Nil All samples
750–2,250 C3, permissible 4, 5, 7, 9, 10, 11, 13 1, 2, 3, 4, 5, 6, 8,9, 10, 11, 12, 13
1, 2, 3, 4, 5, 6,8, 9, 10, 11, 12
Nil
2,250–5,000 C4, unsuitable Nil 7 7, 13 Nil
Arab J Geosci

and low sodium) and C3–S1 (high salinity and low sodiumwater), and was found suitable for irrigation.
Percentage sodium
It is important to classify the irrigation water based on theexchangeable sodium because excessive sodium affects bothsoil and crops, as explained earlier. In addition to SAR, %Nais also used to determine the effect of sodium. %Na iscalculated using the formula:
%Na ¼ Naþ Kð ÞCaþMgþ Naþ K
� 100
where all concentrations are in milliequivalents per liter. Theclassification of water samples based on %Na is given inTable 8. It indicates that 18 % of the groundwater sampleswere classified as good, 51 % as permissible, and 31 % asdoubtful. Water samples collected from the check dam wereclassified as permissible. Based on Wilcox’s (1955) plot,groundwater samples were classified as excellent (3 %), goodto permissible (64 %), permissible to doubtful (33 %), anddoubtful to unsuitable (10 %) (Fig. 4). Water samples collect-ed from the check dam were classified as excellent to goodand good to permissible.
Kelly’s index
The KI is based on the ratio of concentration of sodium tocalcium and magnesium. The KI was calculated using thefollowing formula (Kelly 1963):
KI ¼ Na
CaþMg
where all the ionic concentrations are expressed in milli-equivalents per liter. Less calcium creates soil dispersion,which reduces the infiltration rate. Excessive calcium causespoor seed emergence and reduced aeration. Water quality prob-lems associated with magnesium are very similar to that ofcalcium. The classification of the quality of irrigation waterbased on KI is given in Table 9. The groundwater is clas-sified as suitable (31 %), marginal (61 %), and unsuitable(8 %) based on KI. Water samples collected from the checkdam were classified as marginally suitable for irrigationpurpose based on KI.
Permeability index
Doneen (1964) had developed a chart based on the PI and thetotal concentrations of all ions. PI is given by:
PI ¼ Naþ ffiffiffiffiffiffiffiffiffiffiffiffiffi
HCO3p
CaþMgþ Na� 100
where the concentrations are expressed in milliequivalentsper liter. The plot between total concentration and PI is
Table 7 Classification of watersamples based on SAR SAR Water class Groundwater of well numbers Samples from check dam
October 2010 January 2011 April 2011
<10 Excellent All wells All wells All wells All samples
10–18 Good Nil Nil Nil Nil
18–26 Doubtful Nil Nil Nil Nil
>26 Unsuitable Nil Nil Nil Nil
Fig. 3 Classification based on the USSL plot
Arab J Geosci

shown in Fig. 5. Most of the groundwater samples, i.e., 47 %fall under class I (good for irrigation purpose), 29 % of thesamples in class II (moderately suitable for irrigation), and24 % of the samples in class III (not suitable for irrigation).Water stored in the check dam was classified as moderatelysuitable (class II) for irrigation purposes.
The concentration of ions in groundwater is high in cer-tain regions as groundwater used for irrigation purposes un-dergoes evaporation leading to an increase in concentrationof ions. This evaporation-enriched irrigated water enters thegroundwater zone as recharge, which is pumped again forirrigation. Thus, the use of groundwater for irrigation and itsevaporation from the irrigated area lead to an increase in theconcentration of ions in the groundwater of this area. Suchobservations were also made by Bouwer (1987), Elangoet al. (2003), and Rajesh et al. (2011).
Effect of check dam on groundwater quality
The EC and concentrations of major ions were used toidentify the region that was benefited by recharge from thecheck dam. The plot between EC (a function of TDS) andchloride (dominant conservative anion) shows (Fig. 6) thatpoints of some wells plot closer to the origin, whereas theothers plot away from it. This indicates that the points closerto the origin are of wells with EC (730 to 1,200 μS/cm) andchloride (100 to 150 mg/L) values closer to that of the waterin the check dam (EC of 625 μS/cm and chloride concentra-tion of 96 mg/L), whereas the points that plot away from theorigin are of the wells with EC (1,300 to 2,500 μS/cm) andchloride (200 to 415 mg/L) values much higher than that ofthe water stored in the check dam. Na, Ca, Cl, and HCO3 are
Fig. 4 Classification based on the Wilcox plot
Table 9 Classification of irrigation water based on Kelly’s ratio
KI Water class Groundwater of well numbers Water from check dam
October 2010 January 2011 April 2011
<1 Suitable 2, 3, 10, 13 7, 9, 11 1, 3, 4, 10, 13 Nil
1–2 Marginal 1, 4, 6, 7, 8, 9, 11, 12 1, 2, 3, 4, 5, 6, 8, 10, 12 2, 6, 7, 8, 9, 11, 12 All samples
>2 Unsuitable 5 13 5 Nil
Table 8 Classification of watersamples based on %Na %Na Water class Groundwater of well numbers Water from check dam
October 2010 January 2011 April 2011
0–20 Excellent Nil Nil Nil Nil
20–40 Good 3, 10 5, 6, 9 4, 10 Nil
40–60 Permissible 1, 2, 4, 6, 8, 12, 13 1, 3, 4, 8, 11 1, 2, 3, 6, 8, 11, 12, 13 All samples
60–80 Doubtful 5, 7, 9, 11 2, 7, 10, 12, 13 5, 7, 9 Nil
>80 Unsuitable Nil Nil Nil Nil
Arab J Geosci

four dominant ions in the groundwater of this area; a plot ofNa/Cl versus Ca/HCO3 was made and shown in Fig. 7.Similar kinds of groupings of wells were also seen in this
diagram, as in the case of Fig. 6. The figure shows that thepoints closer to the origin are of wells with Na/Cl (0.3 to 0.5)and Ca/HCO3 (0.09 to 0.2) ratios closer to that of the waterstored by the check dam (Na/Cl of 0.38 and Ca/HCO3 of0.09), whereas the points that plot much away from theorigin are of the wells with Na/Cl (1 to 1.7) and Ca/HCO3
(0.1 to 0.7) ratios much higher than that of the water stored inthe check dam. The concentration of ions in water stored inthe check dam was less and the recharge of this water hasdecreased the concentration of ions in groundwater closer tothe check dam. In general, the concentration of ions ingroundwater of wells located far away from the check damwas higher than the concentration of the water in the checkdam. Hence, it is identified that the group of points that plotcloser to the origin are the wells that are recharged from thecheck dam (Figs. 6 and 7). The qualities of water of thesegroups of wells were also found to be suitable for bothdrinking and irrigation purpose, as given in Table 10, whichsummarizes the suitability of water for drinking and irriga-tion purposes. As the percentage distribution of ions in bothgroundwater and check dam water are more or less similar,there is no distinction between the water types of wells thatare primarily benefited by check dam and the other wells(Fig. 2). Out of 13 wells that were sampled, groundwater wasfound to be suitable for drinking purposes in only 5 locationsand was found to be suitable for irrigation purposes in 9locations. Water stored by the check dam is suitable for boththese uses during the entire period of study. Figure 8 showsthe area where the groundwater was suitable or unsuitable fordrinking and irrigation purposes. Figure 8 also shows theregion that was benefited to the maximum by the rechargefrom the check dam. Thus, it is clear that the recharge fromthe check dam has resulted in improvement of groundwaterquality in its surroundings, whereas the groundwater fromthe wells located far away from the check dam is eithersuitable or not suitable even for irrigation purposes.
Fig. 6 Plot of EC versus Cl concentration of the water samples (Jan-uary 2011)
Fig. 7 Plot of Ca/HCO3 versus Na/Cl of the water samples (January 2011)
Fig. 5 Classification of water samples based on PI
Arab J Geosci

Conclusion
The quality of groundwater and water stored in the checkdam in Arani River, north of Chennai was assessed fordrinking and irrigation purposes. Groundwater from dif-ferent wells and surface water samples from the checkdam were collected and analyzed during October 2010,January 2011, and April 2011. The order of dominanceof cations and anions were Na>Ca>Mg>K andHCO3>Cl>SO4>CO3, respectively. Piper trilinear dia-gram indicates that Ca–Na–HCO3, Na–Cl, Ca–HCO3,
and Ca–Mg–Cl were the dominant groundwater types in thisarea. Groundwater was found suitable for drinking purposesin five locations, and it was found unsuitable in eight locationsdue to high concentrations of calcium, magnesium, sodium,potassium, and chloride. The groundwater was found to beunsuitable for irrigation purpose in five locations either due toKI, PI, or both. However, the water in the check dam pos-sesses very low TDS and, hence, found suitable for bothdomestic and irrigation purposes. The groundwater was foundsuitable for domestic and irrigation purpose in wells locatedcloser to the check dam. This is due to the recharge of
Fig. 8 Locations showingsuitability of water for drinkingand irrigation purposes
Table 10 Classification of watersamples for drinking and irriga-tion purposes
a Parameters due to which waterclassified as unsuitable are givenwithin parentheses
Well no. Drinking water qualitya Irrigation water qualitya
1 Suitable Suitable
2 Suitable Suitable
3 Suitable Suitable
8 Suitable Suitable
12 Suitable Suitable
4 Unsuitable (EC, TDS, Na, K, Cl, Ca, Mg, TH) Suitable
5 Unsuitable (EC, TDS, Na, Cl, Ca, Mg, TH) Unsuitable (KI)
6 Unsuitable (Ca) Suitable
7 Unsuitable (EC, TDS, Cl, Ca, TH) Suitable
9 Unsuitable (EC, TDS, Na, K, Cl, Ca, TH) Unsuitable (PI)
10 Unsuitable (EC, TDS, Ca, Mg, TH) Unsuitable (PI)
11 Unsuitable (EC, TDS, Ca, TH) Suitable
13 Unsuitable (EC, TDS, Cl, Ca, TH) Unsuitable (KI, PI)
Water stored in the check dam All samples suitable All samples suitable
Arab J Geosci

comparatively fresh water from the check dam. The storage ofwater in the check dam improves the groundwater quality inan area of about 3 km2. Hence, construction of such checkdams at optimal distances along this river will improvegroundwater quantity and quality in this region.
Acknowledgments The authors thank the Department of Science andTechnology, New Delhi, India for funding this research under theWomen Scientist Scheme (grant no. SR/WOS-A/ET-49/2010(G)).
References
Alexakis D (2011) Assessment of water quality in the Messolonghi–Etoliko and Neochorio region (West Greece) using hydrochemicaland statistical analysis methods. EnvironMonit Assess. doi:10.1007/s10661-011-1884
Al-Taani AA (2011) Seasonal variations in water quality of Al-WehdaDam north of Jordan and water suitability for irrigation in summer.Arab J Geosci. doi:10.1007/s12517-011-0428-y
APHA (1998) Standard methods for the examination of water andwastewater, 20th edn. American Public Health Association,Washington, DC
Ayers RS,Westcot DW (1994)Water quality for agriculture. FAO Irrigationand Drainage Paper 29 Rev. 1. Available at http://www.fao.org/docrep/003/t0234e/t0234e00.htm. Accessed 14 Sept 2012
Bhalla G, Swamee PK, Kumar A, Bansal A (2012) Assessment ofgroundwater quality near municipal solid waste landfill by anaggregate index method. Int J Environ Sci 2(2). doi:10.6088/ijes.00202030034
BIS (1987) Bureau of Indian Standard guidelines for the quality ofirrigation water. IS:11624-1986. Reaffirmed 2001. Bureau ofIndian Standards, New Delhi
BIS (2003) Bureau of Indian Standards specification for drinking water.IS:10500:91. Revised 2003. Bureau of Indian Standards, New Delhi
Bouwer H (1987) Effect of irrigated agriculture on groundwater. JIrrigat Drain Eng 113(1):4–15
Brindha K, Elango L (2011) Hydrochemical characteristics of ground-water for domestic and irrigation purposes in Mahuranthakam,Tamil Nadu, India. Earth Sci res J 15(2):101–108
Brindha K, Elango L (2012) Impact of tanning industries on ground-water quality near a metropolitan city in India. Water ResourManag 26(6):1747–1761
Brindha K, Elango L (2013) Occurrence of uranium in groundwater of ashallow granitic aquifer and its suitability for domestic use insouthern India. J Radioanal Nucl Chem 295:357–367
Brindha K, Rajesh R, Murugan R, Elango L (2012) Nitrate pollution ingroundwater in some rural areas of Nalgonda district, AndraPradesh, India. J Environ Sci Eng 54(1):62–70
Das RM, Pradhan AA, Goswami S (2010) Groundwater quality assess-ment of Banki subdivision, Cuttack district, Orissa. J life sci 1:35–42
David SN, DeWiest RJ (1966) Hydrogeology. Wiley, New York, 463 ppDoneen LD (1964) Notes on water quality in agriculture. Published as
Water Science and Engineering Paper 4001, Department of Water,Science and Engineering, University of California, Davis
Eaton FM (1950) Significance of carbonates in irrigation waters. SoilSci 39:123–133
Elango L, Ramachandran S, Sreenivasan M (1996) Time series analysis ofgroundwater quality parameters. In: Muller A (ed) Hydroinformatics‘96’, Vol 2. Balkema, Rotterdam, pp 613–620
Elango L, Kannan R, Kumar SM (2003) Major ion chemistry andidentification of hydrogeochemical processes of groundwater ina part of Kancheepuram district, Tamil Nadu, India. J EnvironGeosci 10(4):157–166
Faure G (1998) Principles and applications of geochemistry, 2nd edn.Prentice Hall, Upper Saddle River, 436 pp
Freeze RA, Cherry JA (1979) Groundwater. Prentice Hall, New Jersey,604 pp
Jagadeshan G, Elango L (2012) Groundwater quality assessment in apart of Vaniyar River basin, Tamil Nadu. Indian J Environ32(90):772–777
Kacmaz H, Nakoman ME (2010) Evaluation of shallow groundwaterquality for irrigation purposes in the Koprubasi uranium area(Manisa, Turkey). BALWOIS 2010—Ohrid, Republic ofMacedonia, 25–29 May. Available at http://balwois.com/balwois/administration/full_paper/ffp-1690.pdf. Accessed 25 January 2013
Kalpana L, Elango L (2013) Assessment of groundwater quality fordrinking and irrigation purpose in Pambar River sub-basin, TamilNadu. Indian J Environ 33(1):1–8
Kelly WP (1963) Use of saline irrigation water. Soil Sci 95(4):355–391
Khodapanah L, Sulaiman WNA, Khodapanah N (2009) Groundwaterquality assessment for different purposes in Eshtehard District,Tehran Iran. Eur J Sci Res 36(4):543–553
Kumaresan M, Riyazuddin P (2006) Major ion chemistry ofenvironmental samples around sub-urban of Chennai city.Curr Sci 91(12)
Lloyd JW, Heathcote JA (1985) Natural inorganic hydrochemistry inrelation to groundwater. Clarendon, Oxford
Mahida UN (1981) Water pollution and disposal of wastewater onland. Tata McGraw-Hill Publishing Company Limited, NewDelhi
Obiefuna GI, Sheriff A (2011) Assessment of shallow ground waterquality of Pindiga Gombe Area, Yola Area, NE, Nigeria forirrigation and domestic purposes. Res J Environ Earth sci3(2):131–141
Parimala renganayaki S, Elango L (2013a) A review on managedaquifer recharge by check dams: A case study near Chennai,India. Int J Res Engg Tech 2(4):416–423
Parimala renganayaki S, Elango L (2013b) Augmentation of ground-water by managed aquifer recharge around a non perennial river, In:Efficient water management: Challenges and opportunities.Available at https://indiawaterweek.water.tallyfox.com/documents/augmentation-groundwater-managed-aquifer-recharge-around-non-perennial-river. Accessed 10 June 2013
Piper AM (1944) A graphical procedure in the geochemical inter-pretation of water analysis. Trans Am geophys Union 25:914–928
Rajesh R, Brindha K, Murugan R, Elango L (2011) Influence ofhydrogeochemical processes on temporal changes in groundwaterquality in a part of Nalgonda district, Andhra Pradesh, India.Environ Earth Sci 65(4):1203–1213
Ramakrishnan S (1998) Ground water. S. Ramakrishnan, Chennai,533 pp
Ramesh K, Elango L (2012) Groundwater quality and its suitability fordomestic and agricultural use in Tondiar river basin, Tamil Nadu.India Environ Monit Assess. doi:10.1007/s10661-011-2231-3
Richards LA (1954) Diagnosis and improvement of saline alkali soils.US Department of Agriculture Handbook 60, Government print-ing office, Washington DC, p 160
Sawyer GN, Mcartly DL (1967) Chemistry of sanitary engineers, 2ndedn. McGraw-Hill, New York, 518 pp
Singh AK, Mondal GC, Kumar S, Singh TB, Tewary BK, Sinha A(2008) Major ion chemistry, weathering processes and water qual-ity assessment in upper catchment of Damodar River basin, India.Environ Geol 54:745–758
Arab J Geosci

Srinivasamoorthy K, Vasanthavigar M, Vijayaraghavan K, SarathidasanR, Gopinath S (2013) Hydrochemistry of groundwater in a coastalregion of Cuddalore district, Tamilnadu, India: implication for qual-ity assessment. Arab J Geosci 6:441–454
Subramani T, Elango L, Damodarasamy SR (2005) Groundwater qual-ity and its suitability for drinking and agricultural use in ChitharRiver Basin, Tamil Nadu, India. Environ Geol 47:1099–1110
Sundaray SK, Nayak BB, Bhatta D (2009) Environmental studies onriver water quality with reference to suitability for agriculturalpurposes: Mahanadi river estuarine system, India—a case study.Environ Monit Assess 55:227–243
United States Salinity Laboratory Staff (USSL) (1954) Diagnosis andimprovement of saline and alkali soils. US Department of
Agriculture Handbook 60, Government printing office, WashingtonDC, p 147
Vaishnav MM, Dewangan S (2012) Impact of Balco industrial wasteson surface and groundwater quality of Korba, India. J Environ ResDev 6(3A):623
Vasanthavigar M, Srinivasamoorthy K, Ganthi GR, Vijayaraghavan K,Sarma VS (2012) Characterisation and quality assessment of ground-water with a special emphasis on irrigation utility: Thirumanimuttarsub-basin, Tamil Nadu, India. Arab J Geosci 5:245–258
WHO (2006) Guideline for drinking-water quality: recommendations,vol. 1. World Health Organization, Geneva, 130 pp
Wilcox LV (1955) Classification and use of irrigation waters. Circular969. USDA, Washington, DC
Arab J Geosci


