Embed Size (px)
Citation preview
Stud. Geophys. Geod., 52 (2008), 237!254 237 © 2008 Inst. Geophys. AS CR, Prague
IMPACT-PRESSURE CONTROLLED ORIENTATION OF SHATTER CONE MAGNETIZATIONS IN SIERRA MADERA, TEXAS, USA
T. ADACHI1,2 AND G. KLETETSCHKA1,2,3
1 Department of Physics, Catholic University of America, 200 Hannan Hall, Washington DC, USA
2 NASA Goddard Space Flight Center, Code 691, Greenbelt, Maryland, USA
3 Institute of Geology, Acad. Sci. Czech Republic, Rozvojová 269, 165 00 Praha 6, Czech Republic
Received: March 2, 2007; Revised: January 2, 2008; Accepted: February 18, 2008
ABSTRACT
A suite of Sierra Madera Impact deformed rocks was studied and magnetic analyses were performed. We characterized the magnetic signatures of two locations, sites A and B that have different physical characteristics of shock fractured structures as well as the magnetic signatures. Shatter cone at site A has a fine-scale (few to ~10 mm) distributed array of complete shatter cones with sharp apex. Natural remanent magnetization (NRM) of site A shatter cone is distributed within the plane that is perpendicular to the apexes of the cones. Shatter cone at site B shows no apparent cone shape or apex, instead, a relatively larger scale and multiple striated joint set (MSJS) and sinusoidal continuous peak. NRM of site B shatter cone is clustered along the apexes. The difference in magnetization direction is a likely indicator of the shock pressure where parallel to apex indicates pressures larger than 10 GPa and perpendicular to apex indicate pressures less than 10 GPa. Intensities of NRM and saturation isothermal remanent magnetization (SIRM) contrast and fluctuate within a shatter cone as well as in between two sites. We observed a random orientation of magnetic vector directions and amplitudes changing over small scales leading to the absence of coherent macro-scale signature.
Ke y wo r d s : shatter cones, demagnetization, remagnetization, impact crater, shock
fractures, magnetism, magnetic efficiency, magnetic signatures, magnetic anomaly, Mars
1. INTRODUCTION
The Sierra Madera Impact crater is located in Pecos county (30°36 N, 102°55 W), Texas, USA (Fig. 1a,b,c). It is a complex impact crater with an intensely folded and faulted central uplift (Wilshire et al., 1971, 1972). It had been initially described by Boon and Albritton Jr. (1936) and Eggleton and Shoemaker (1961). The diameter is 12 km and the target rock is thick marine carbonate sedimentary unit. The age was estimated less than 100 Ma (Late Cretaceous to Early Tertiary) and the shock pressure was estimated as ~40 GPa (central uplift) by Golding et al. (2006). Huson et al. (2006) estimated 8 to 30 GPa using X-ray powder diffraction (XRD) analysis of shatter cones. Sharpness of the
T. Adachi and G. Kletetschka
238 Stud. Geophys. Geod., 52 (2008)
peaks in the XRD pattern indicate crystallinity, and asymmetric broadening in the XRD patterns indicates spatial inhomogeneity due to shock effects (Ashworth and Schneider, 1985).
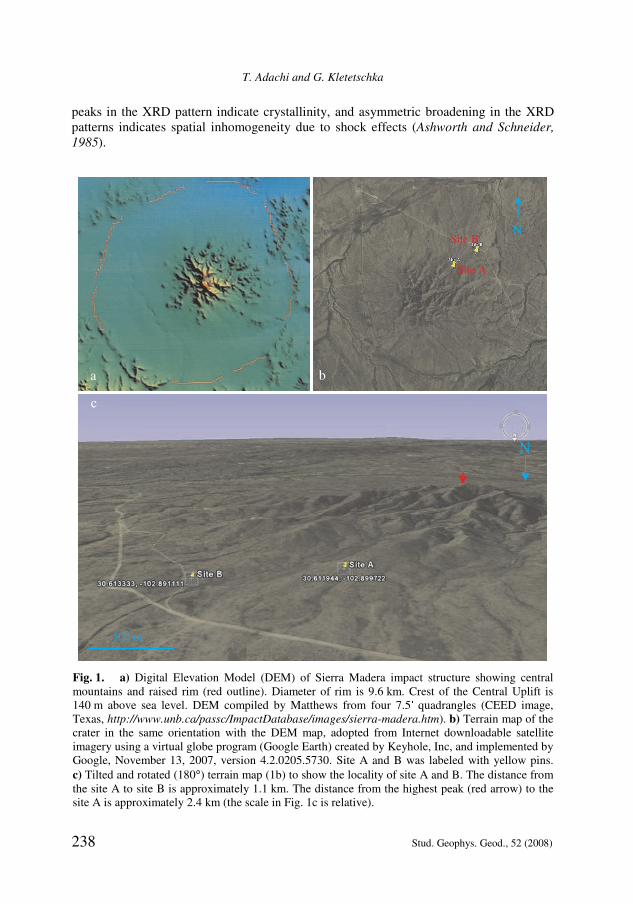
Fig. 1. a) Digital Elevation Model (DEM) of Sierra Madera impact structure showing central mountains and raised rim (red outline). Diameter of rim is 9.6 km. Crest of the Central Uplift is 140 m above sea level. DEM compiled by Matthews from four 7.5 quadrangles (CEED image, Texas, http://www.unb.ca/passc/ImpactDatabase/images/sierra-madera.htm). b) Terrain map of the crater in the same orientation with the DEM map, adopted from Internet downloadable satellite imagery using a virtual globe program (Google Earth) created by Keyhole, Inc, and implemented by Google, November 13, 2007, version 4.2.0205.5730. Site A and B was labeled with yellow pins.
c) Tilted and rotated (180°) terrain map (1b) to show the locality of site A and B. The distance from the site A to site B is approximately 1.1 km. The distance from the highest peak (red arrow) to the site A is approximately 2.4 km (the scale in Fig. 1c is relative).
Impact-Pressure Controlled Orientation of Shatter Cone Magnetizations
Stud. Geophys. Geod., 52 (2008) 239
Shatter cones have been described by many researchers and the studies were summarized in Nicolaysen and Reimold (1999). Since Dietz (1959, 1961, 1968) interpreted that the formation of shatter cones originated from propagating shock waves at impacts, the formation of shatter cones has been used as a diagnostic tool for identifying a bolide impact structure (Nicolaysen and Reimold, 1999). French (1998) described that intense, transient, high-pressure shock waves that were generated at the point of impact and radiated outward through the target rocks, were responsible for shatter cone textures.
The details of how the shatter cones originate are still uncertain, however researchers postulated that hypervelocity impact (by cosmic projectile) generated shock waves with tensile stress normal to the propagating wave direction may produce shatter cones (Sagy et al., 2002). Baratoux and Melosh (2003) and Osinski and Spray (unpublished reults) suggested that heterogeneity in rocks could be an initiation point for shatter cone formation, resulting in tensional stress that fractures rocks and produces conical shapes. Osinski and Spray (unpublished reults) observed abundant shatter cones with complete conical shapes and sharp apexes in Houghton crater in Canada. They accounted for the complex impact features in the crater as due to heterogeneity of the target rocks.
Sagy et al. (2002, 2004) explained the mechanism of shatter cone formation was due to tensile fracturing in the early compression stage of a shock event. A contrasting account has been proposed by Wieland et al. (2006) and Nicolaysen and Reimold (1999), particularly for the Vredefort shatter cones that they were late stage formation and shatter cones occurrence varies depending on the rock types. Another hypothesis based on a numerical modeling by Baratoux and Melosh (2003) suggested that shatter cones were tensional fractures formed at a local heterogeneity of rocks. Well summarized account for the genesis of shatter cone formation has been described in Wieland et al. (2006) that a front wave of an impact acts homogeneously throughout the bed rock (early stage), while the scattering and reflecting waves act locally (later stage) due to heterogeneity of rocks (e.g., porosity, mineralogy).
We note that there is no published work describing magnetic properties of shatter cones. In this paper, we report that shatter cones contain impact related magnetic signature. Our specimens are a suite of shatter cones with: 1) well-pronounced apexes (Fig. 2, smaller scale shatter cone A); and 2) multiple striated joint sets, MSJS (Fig. 3, larger scale shatter cone) from the Sierra Madera Impact Crater in Texas, USA. Magnetic analyses were conducted in the Magnetics Lab at NASA, Goddard Space Flight Center (GSFC), Greenbelt, USA.
We characterized the magnetic signatures of the samples using the selected analytical methods of paleomagnetism, e.g., measurement of natural remanent magnetization (NRM), saturation isothermal remanent magnetization (SIRM), and alternating field (AF) demagnetization of NRM. NRM is the intensity and direction of natural remanent magnetism in rocks. The AF demagnetization removes NRM of low coercivity components and reveals presence of magnetic materials of different coercivities whose spectrum relates to the composition and magnetic properties of the magnetic carriers in rocks. SIRM is a useful parameter in estimating the efficiency of the remanence acquisition. The NRM and SIRM values were used to evaluate the magnetic efficiency (Fig. 3). The efficiency was obtained by taking the ratio of NRM to SIRM, called REM. The REM analytic method had been established initially by Wasilewski (1977), and the method developed further by Kletetschka et al., (2003a, 2004a). Terrestrial rocks whose
T. Adachi and G. Kletetschka
240 Stud. Geophys. Geod., 52 (2008)
NRM contains single components of thermal remanence magnetization (TRM) have the
REM values of between 0.01 ! 0.02 (Kletetschka et al., 2003a,b). Stereonet projection supplements the representation of the average orientation of
magnetization in addition to inclination-declination plot (Figs. 5a and 6a).
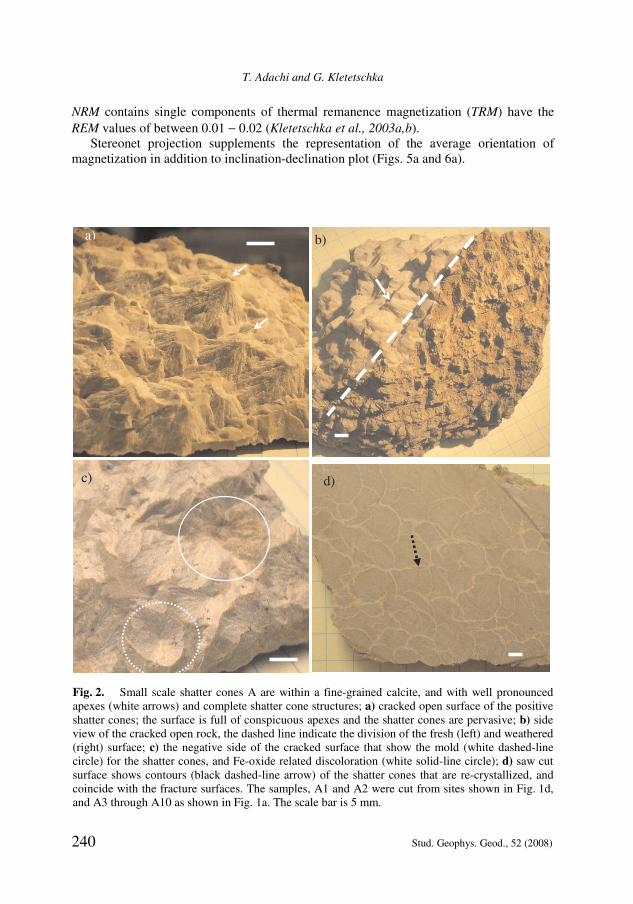
Fig. 2. Small scale shatter cones A are within a fine-grained calcite, and with well pronounced apexes (white arrows) and complete shatter cone structures; a) cracked open surface of the positive shatter cones; the surface is full of conspicuous apexes and the shatter cones are pervasive; b) side view of the cracked open rock, the dashed line indicate the division of the fresh (left) and weathered (right) surface; c) the negative side of the cracked surface that show the mold (white dashed-line circle) for the shatter cones, and Fe-oxide related discoloration (white solid-line circle); d) saw cut surface shows contours (black dashed-line arrow) of the shatter cones that are re-crystallized, and coincide with the fracture surfaces. The samples, A1 and A2 were cut from sites shown in Fig. 1d, and A3 through A10 as shown in Fig. 1a. The scale bar is 5 mm.
Impact-Pressure Controlled Orientation of Shatter Cone Magnetizations
Stud. Geophys. Geod., 52 (2008) 241
Magnetism of shock deformed rock has been studied by Hargraves and Perkins (1969). They coined the term “shock remanent magnetization” (SRM) that includes various types of demagnetization and remagnetization. Dickinson and Wasilewski (2000) pointed out that magnetic remanence can be acquired or removed by shock events in iron particles in extraterrestrial rocks. Kletetschka et al. (2004b) demonstrated a significant reduction of the initial magnetization of various minerals in impact pressures as low as 1 GPa (under magnetic vacuum < 100 nT). The common view of the consequences of shock impact of rocks is demagnetization/resetting of the NRM, and/or acquisition of a secondary (vector) component.
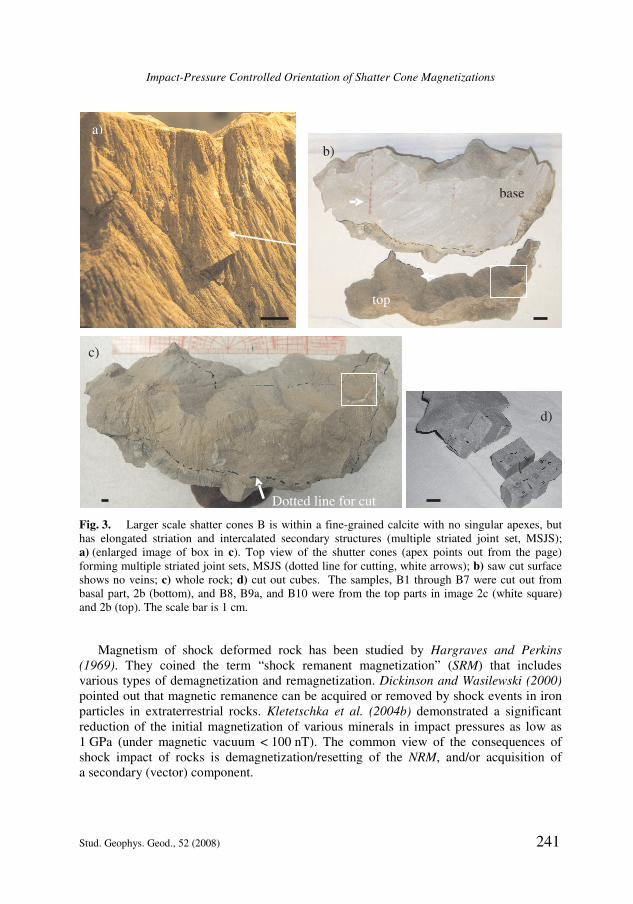
Fig. 3. Larger scale shatter cones B is within a fine-grained calcite with no singular apexes, but has elongated striation and intercalated secondary structures (multiple striated joint set, MSJS); a) (enlarged image of box in c). Top view of the shutter cones (apex points out from the page) forming multiple striated joint sets, MSJS (dotted line for cutting, white arrows); b) saw cut surface shows no veins; c) whole rock; d) cut out cubes. The samples, B1 through B7 were cut out from basal part, 2b (bottom), and B8, B9a, and B10 were from the top parts in image 2c (white square) and 2b (top). The scale bar is 1 cm.
T. Adachi and G. Kletetschka
242 Stud. Geophys. Geod., 52 (2008)
An important magnetic signature has been identified by Carporzen et al. (2005) in the impact deformed rocks containing planar deformation features (PDFs) in the Vredefort structure in South Africa. Vredefort is the largest (~300 km) and oldest (~2.0 Ga) terrestrial impact crater (Hart et al., 1995; Carporzen et al., 2006). They observed a random orientation of magnetic vector directions changing over centimeter length scales leading to the absence of coherent macro-scale signature. This may be significant on Mars where the micro-scale randomization of intensity vectors might appear to be demagnetized parts of the crust.
2. IMPACT MAGNETIZATION AND DEMAGNETIZATION
Hypervelocity impact produces an amount of energy that deforms, fractures, and melts the target rocks. Hargraves and Perkins (1969) used magnetic techniques to study rocks affected by shock induced high strain rate deformation (but no shatter cones were studied). The noted effects of impacts were: changes in NRM directions, remagnetization, and reduction in bulk susceptibility. An important finding was that the impact effect on NRM was detectable. Shock remanent magnetization (SRM) collectively includes various effects that must be identified, such as demagnetization and/or remagnetization which may involve changes in magnetic remanence directions. Impact shock event also involves thermal signatures, which may contribute to TRM or pTRM components. Magnetic Phases can also be altered due to intense structural modification, heating (melting), or fluid alterations. Since impact shock events involve stress, strain, pressure and heat, the total effect on magnetization could be rather significant.
The mechanism of shock induced magnetic effects (SRM) in shatter cones has not been studied at all. Nicolaysen and Reimold (1999) suggested the relatively late formation of shatter cone structures in the Vredefort impact crater during the impact compression. Hart et al. (2000) suggested the high remanent magnetism over the Vredefort impact structures is due to elongated, micron-size single-domain magnetite that formed along PDFs under extreme P-T conditions. In their studies magnetizations of shatter cones were not considered.
3. MATERIALS
Impact deformed rock samples were collected in March, 2006. The locations were
(Fig. 1a,b,c): smaller scale shatter cone site A: 30°36 43 N, 102°53 59 W (slope of the
central uplift); larger scale shatter cone site B: 30°36 48 N, 102°53 28 W (slope of the central uplift). Please refer to the Field Guide to the Sierra Madera Impact Structure (Huson, unpublished results) for site location map. The magnetic analyses of sites A, and B are reported here. These site designation letters also annotate the subsample IDs: Smaller-scale shatter cone SmSC A and Larger-scale shatter cone LgSC B. The names of the sub-samples along with their magnetic remanence measurements, NRM, SIRM, efficiency ratio (NRM/SIRM), and saturation field are listed in Table 1.
SmSC A (fine-grained dolomitic limestone, Fig. 2) has small complete shatter cone
structures that have conical shape with an apex angle of ~70° to 75°, and the height of the cone from the plane that is perpendicular to the apex axis ranges from 5 to 10 mm. Very
Impact-Pressure Controlled Orientation of Shatter Cone Magnetizations
Stud. Geophys. Geod., 52 (2008) 243
fine, radiating striations are observed to begin from the apex and bifurcating near the edge of the cone. Figs. 2a,c show the cracked opened (top and underside) hand specimen. The shatter cone structures appear to be positive on one side, and negative on the other. These shapes mimic a rhombohedral calcite crystal form of scalenohedron (a typical quasi-conical surface of a shatter cone, Nicolaysen and Reimold, 1999). Rusty discoloration (Fig. 2c) was observed along the shatter cone fractures; these were enriched on the fracture surface, probably some type of Fe-oxide and/or sulfides, possibly hematite or iron hydroxide (average Fe content is 0.1 weight %, S. Huson, personal communication). The thin-vein pattern observed in SmSC A (Fig. 2d) are interpreted to be fault fractures outlining the shatter cone surfaces that are contemporaneous with the formation of the cones. Nicolaysen and Reimold (1999) interpreted glassy looking film covering the shatter cone structures to be linked with formation of pseudotachylitic melt.
LgSC B (coarse-grained dolomite, Fig. 3) has no distinct apex but continuous peaks and multiple striated joint sets, MSJS (Nicolaysen and Reimold, 1999). MSJS are planar to curviplanar fractures occurring at a spacing of microns to several millimeters. The MSJS in LgSC B is observed to be sinusoidal (from the top view, Fig. 2) and looks as if it is a miniature “mountain range”. The apparent size of the height of the elongated (curviplanar) shatter cone structures of B ranges from ~2 to 5 cm.
4. METHOD
The magnetic characterization was designed to observe small-scale (centimeters) heterogeneity in magnetism recorded at the impact. The shatter cone samples were prepared to preserve orientations and spatial configurations.
Shatter cone samples were cut out into cubes from 1.2 cm3 (SmSC A) to 1.5 cm3 (LgSC B) using a nonmagnetic diamond saw in the rock shop at NASA GSFC. The sub-samples were cut out in order to preserve the spatial orientation of each other respect to the parent sample, and the orientations of the apex axis. The orientations of the apex axis
were kept to be parallel to the z-axis of the magnetometer with the errors ranging ± 5°. The sub-samples of SmSC A were cut out and labeled as: A1, A2, A3, through A10, and eight out of ten of them were used for analysis. A1 and A2 were basal (below apex, no striations), and A3 through A10 were with apex structures with striations, and re-crystalized surfaces (Table 1). The sub-samples of LgSC B were cut out and labeled as B1, B2, B3 though B10. B1 through B7 are basal (below apex and no striations), and B8, B9a, and B10 has multiple striated joint set (extending apex like a ridgeline, see Fig. 3) (Table 1). Orientations were marked using permanent marker.
Both A and B cubed samples were mounted on one inch glass slides in the orientation that the apex axis was normal to the slide surface. The NRM of glass slides were measured prior to the mounting so that the values were subtracted later to correct and obtain accurate sample NRM measurements.
NRM of the sub-samples were measured with an orientation of the cone axis that is parallel to the instrument holder z-axis of the 2G superconducting magnetometer, and all the x, y, z axis were maintained in all analysis. To obtain the AF (alternating field) demagnetization curve (Figs. 4 and 5), the samples were demagnetized using a single axis demagnetizer at peak fields: 2, 4, 8, 15, 30, 60, 120, 240 mT, and for all three axes.
T. Adachi and G. Kletetschka
244 Stud. Geophys. Geod., 52 (2008)
Subsequently, sub-samples A1, A2, A3, A5, B1, B3, and B7 were saturated with magnetic field of 2 T in the x-direction respective to the magnetometer coordinate system using the
Varian 12 inch magnet. These data were presented at the 10th Castle Meeting; Paleo, Rock
and Environmental Magnetism, September 3!8, 2006. The rest of the sub-samples: A4, A6, A7, A10, B4, B5, B6, B8, B9a, B10 were saturated with the field of 3 T by an Impulse Magnetizer (ASC Scientific Impulse Magnetizer). Then using the SIRM and NRM values, the remanence efficiency of magnetization ratio, REM, was calculated. All the data
were recorded in spreadsheets and AF demagnetization curve (Figs. 5!7) and REM ratios were plotted in charts (Fig. 4) Representative sub-samples were plotted as normalized AF demagnetization curve, and stereonet projection (Fig. 7).
X-ray powder diffraction (XRPD) analysis of magnetic extracts from site A and B was performed at the Vitreous State Laboratory at Catholic University of America, Washington, DC. The results were inconclusive due to contaminants introduced during the powdering of the samples and signals to noise ratio of available magnetic extracts.
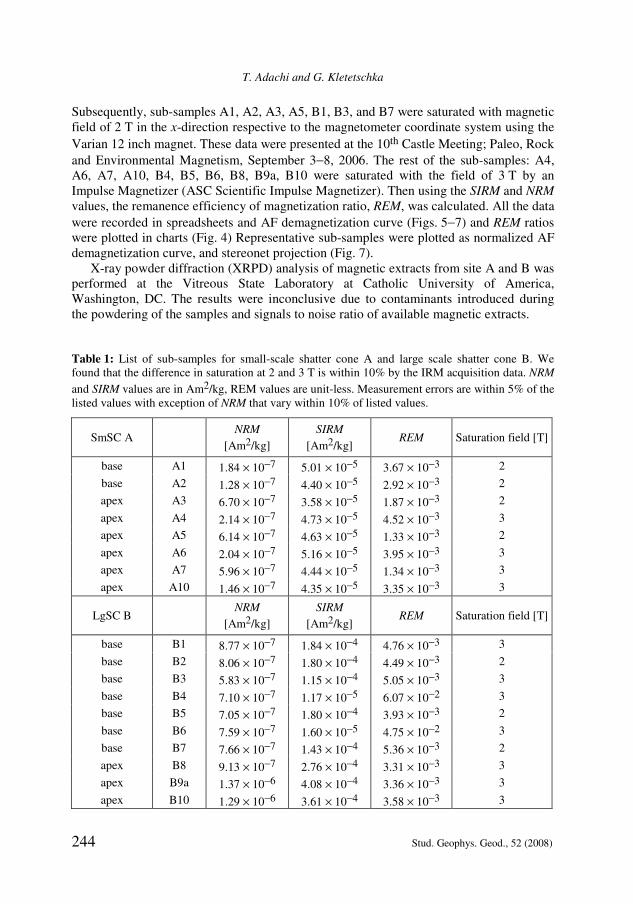
Table 1: List of sub-samples for small-scale shatter cone A and large scale shatter cone B. We found that the difference in saturation at 2 and 3 T is within 10% by the IRM acquisition data. NRM
and SIRM values are in Am2/kg, REM values are unit-less. Measurement errors are within 5% of the listed values with exception of NRM that vary within 10% of listed values.
SmSC A NRM
[Am2/kg]
SIRM
[Am2/kg] REM Saturation field [T]
base A1 1.84 " 10!7 5.01 " 10!5 3.67 " 10!3 2
base A2 1.28 " 10!7 4.40 " 10!5 2.92 " 10!3 2
apex A3 6.70 " 10!7 3.58 " 10!5 1.87 " 10!3 2
apex A4 2.14 " 10!7 4.73 " 10!5 4.52 " 10!3 3
apex A5 6.14 " 10!7 4.63 " 10!5 1.33 " 10!3 2
apex A6 2.04 " 10!7 5.16 " 10!5 3.95 " 10!3 3
apex A7 5.96 " 10!7 4.44 " 10!5 1.34 " 10!3 3
apex A10 1.46 " 10!7 4.35 " 10!5 3.35 " 10!3 3
LgSC B NRM
[Am2/kg]
SIRM
[Am2/kg] REM Saturation field [T]
base B1 8.77 " 10!7 1.84 " 10!4 4.76 " 10!3 3
base B2 8.06 " 10!7 1.80 " 10!4 4.49 " 10!3 2
base B3 5.83 " 10!7 1.15 " 10!4 5.05 " 10!3 3
base B4 7.10 " 10!7 1.17 " 10!5 6.07 " 10!2 3
base B5 7.05 " 10!7 1.80 " 10!4 3.93 " 10!3 2
base B6 7.59 " 10!7 1.60 " 10!5 4.75 " 10!2 3
base B7 7.66 " 10!7 1.43 " 10!4 5.36 " 10!3 2
apex B8 9.13 " 10!7 2.76 " 10!4 3.31 " 10!3 3
apex B9a 1.37 " 10!6 4.08 " 10!4 3.36 " 10!3 3
apex B10 1.29 " 10!6 3.61 " 10!4 3.58 " 10!3 3
Impact-Pressure Controlled Orientation of Shatter Cone Magnetizations
Stud. Geophys. Geod., 52 (2008) 245
5. RESULTS
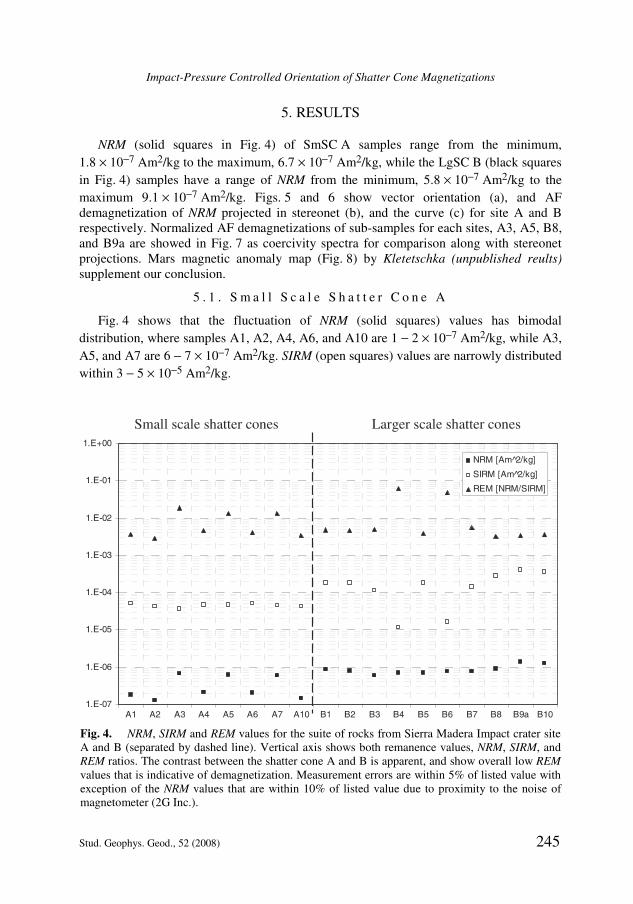
NRM (solid squares in Fig. 4) of SmSC A samples range from the minimum,
1.8 " 10!7 Am2/kg to the maximum, 6.7 " 10!7 Am2/kg, while the LgSC B (black squares
in Fig. 4) samples have a range of NRM from the minimum, 5.8 " 10!7 Am2/kg to the
maximum 9.1 " 10!7 Am2/kg. Figs. 5 and 6 show vector orientation (a), and AF demagnetization of NRM projected in stereonet (b), and the curve (c) for site A and B respectively. Normalized AF demagnetizations of sub-samples for each sites, A3, A5, B8, and B9a are showed in Fig. 7 as coercivity spectra for comparison along with stereonet projections. Mars magnetic anomaly map (Fig. 8) by Kletetschka (unpublished reults) supplement our conclusion.
5 . 1 . S m a l l S c a l e S h a t t e r C o n e A
Fig. 4 shows that the fluctuation of NRM (solid squares) values has bimodal
distribution, where samples A1, A2, A4, A6, and A10 are 1 ! 2 " 10!7 Am2/kg, while A3,
A5, and A7 are 6 ! 7 " 10!7 Am2/kg. SIRM (open squares) values are narrowly distributed
within 3 ! 5 " 10!5 Am2/kg.
Fig. 4. NRM, SIRM and REM values for the suite of rocks from Sierra Madera Impact crater site A and B (separated by dashed line). Vertical axis shows both remanence values, NRM, SIRM, and REM ratios. The contrast between the shatter cone A and B is apparent, and show overall low REM values that is indicative of demagnetization. Measurement errors are within 5% of listed value with exception of the NRM values that are within 10% of listed value due to proximity to the noise of magnetometer (2G Inc.).
T. Adachi and G. Kletetschka
246 Stud. Geophys. Geod., 52 (2008)
5 . 2 . L a r g e S c a l e S h a t t e r C o n e B
Fig. 4 shows a relatively uniform distribution of NRM (5 ! 9 " 10!7 Am2/kg) (solid squares) except B9a and B10 (ridgeline apex) show slightly higher values
(10 ! 20 " 10!7 Am2/kg). Whereas the SIRM (open squares) shows bimodal distribution
where B4 and B6 have order of magnitude lower SIRM (1.17 " 10!5 Am2/kg and
1.60 " 10!5 Am2/kg), respectively, compared with 10 ! 40 " 10!5 Am2/kg for the rest of the B-samples.
The NRM values of B are similar or little higher to the higher NRM values of A (A3, A5, A7). These fluctuations are reflected in the REM values (solid triangles). The overall efficiency (averaged REM values of all the sub-samples) is ~0.005, which is lower than
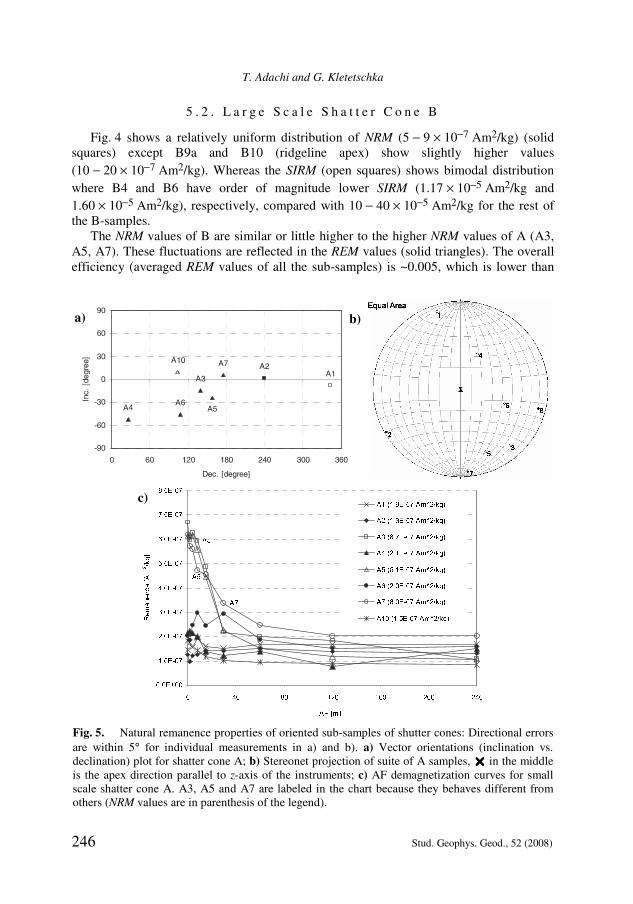
Fig. 5. Natural remanence properties of oriented sub-samples of shutter cones: Directional errors
are within 5° for individual measurements in a) and b). a) Vector orientations (inclination vs. declination) plot for shatter cone A; b) Stereonet projection of suite of A samples, in the middle is the apex direction parallel to z-axis of the instruments; c) AF demagnetization curves for small scale shatter cone A. A3, A5 and A7 are labeled in the chart because they behaves different from others (NRM values are in parenthesis of the legend).
c)
b) a)
Impact-Pressure Controlled Orientation of Shatter Cone Magnetizations
Stud. Geophys. Geod., 52 (2008) 247
suggested terrestrial NRM values of 0.01 (Kletetschka et al., 2003a,b). However, the efficiency of B4 (0.06) and B6 (0.05) is much higher than the rest of the samples or common terrestrial values.
The vector orientations as declination (x-axis) versus inclination (y-axis) were plotted in Fig. 5a for SmSC A, and Fig. 6a for LgSC B to depict the vector behaviors. The fluctuations of NRM of SmSC A shows that most of the vectors, except A4 and A6, are oriented perpendicular to the shatter cone axes that are normal to the base (Fig. 5a). The
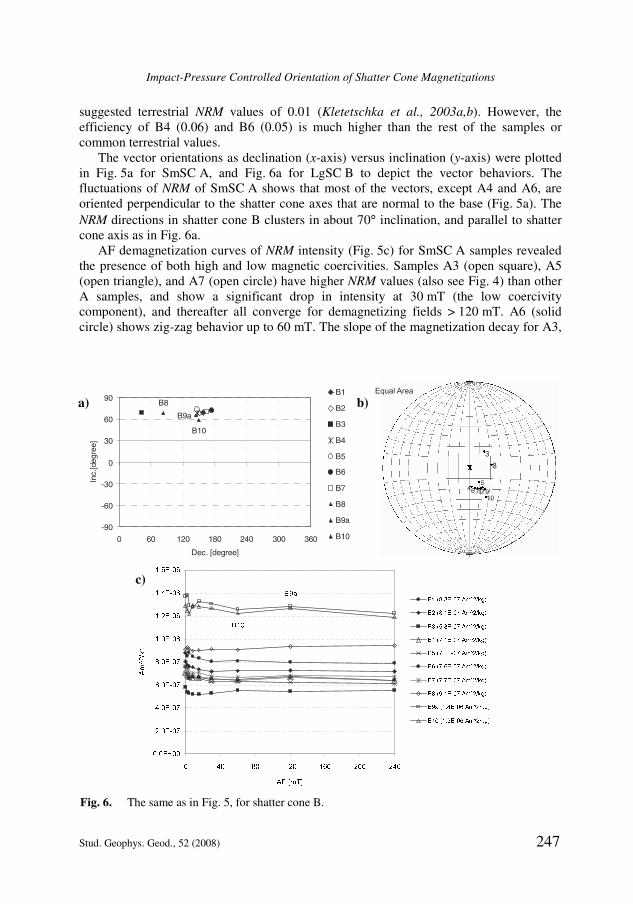
NRM directions in shatter cone B clusters in about 70° inclination, and parallel to shatter cone axis as in Fig. 6a.
AF demagnetization curves of NRM intensity (Fig. 5c) for SmSC A samples revealed the presence of both high and low magnetic coercivities. Samples A3 (open square), A5 (open triangle), and A7 (open circle) have higher NRM values (also see Fig. 4) than other A samples, and show a significant drop in intensity at 30 mT (the low coercivity component), and thereafter all converge for demagnetizing fields > 120 mT. A6 (solid circle) shows zig-zag behavior up to 60 mT. The slope of the magnetization decay for A3,
Fig. 6. The same as in Fig. 5, for shatter cone B.
c)
b) a)
T. Adachi and G. Kletetschka
248 Stud. Geophys. Geod., 52 (2008)
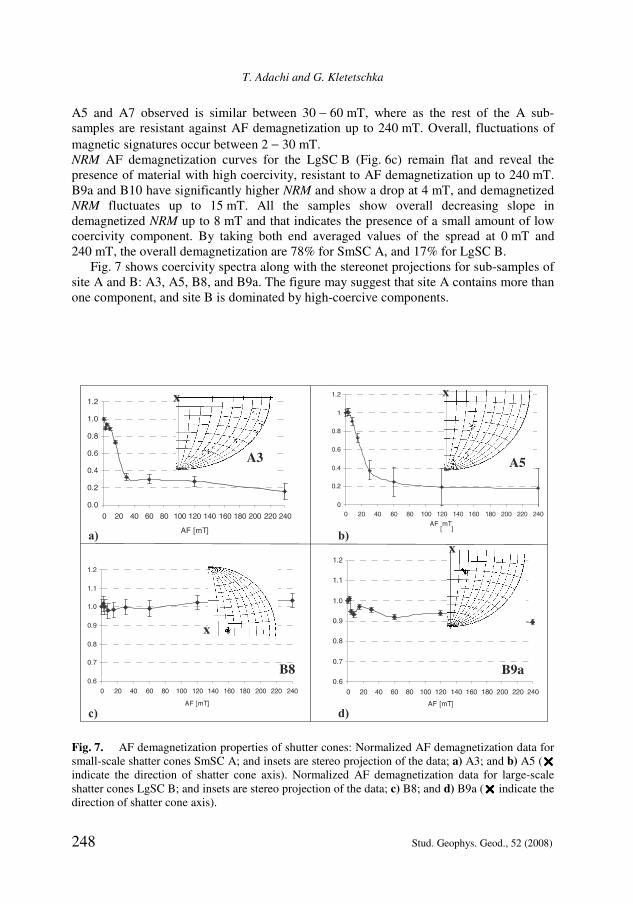
A5 and A7 observed is similar between 30 ! 60 mT, where as the rest of the A sub-samples are resistant against AF demagnetization up to 240 mT. Overall, fluctuations of
magnetic signatures occur between 2 ! 30 mT. NRM AF demagnetization curves for the LgSC B (Fig. 6c) remain flat and reveal the presence of material with high coercivity, resistant to AF demagnetization up to 240 mT. B9a and B10 have significantly higher NRM and show a drop at 4 mT, and demagnetized NRM fluctuates up to 15 mT. All the samples show overall decreasing slope in demagnetized NRM up to 8 mT and that indicates the presence of a small amount of low coercivity component. By taking both end averaged values of the spread at 0 mT and 240 mT, the overall demagnetization are 78% for SmSC A, and 17% for LgSC B.
Fig. 7 shows coercivity spectra along with the stereonet projections for sub-samples of site A and B: A3, A5, B8, and B9a. The figure may suggest that site A contains more than one component, and site B is dominated by high-coercive components.
Fig. 7. AF demagnetization properties of shutter cones: Normalized AF demagnetization data for small-scale shatter cones SmSC A; and insets are stereo projection of the data; a) A3; and b) A5 ( indicate the direction of shatter cone axis). Normalized AF demagnetization data for large-scale shatter cones LgSC B; and insets are stereo projection of the data; c) B8; and d) B9a ( indicate the direction of shatter cone axis).
Impact-Pressure Controlled Orientation of Shatter Cone Magnetizations
Stud. Geophys. Geod., 52 (2008) 249
6. DISCUSSION
Each of our shatter cone samples came from one piece of rock. One would expect similar magnetic efficiencies of each of the sub-samples. However, Fig. 4 shows that efficiencies for both shatter cone A and B have large variations. The variation for shatter cone A sub-samples A3, A5 and A7 is quite outstanding. Detailed removal of their natural magnetization (AF demagnetization curve, Fig. 5c) displays the reason for the efficiency enhancement. The low coercivity grains were more efficiently magnetized than high coercivity grains. Once these three samples, A3, A5 and A7 were demagnetized by 50 mT alternating field, their efficiencies were indistinguishable from the rest of the A samples
(Magnetizations are within a narrow range 1 ! 2 " 10!7 Am2/kg; see Fig. 4). This suggests that during the impact event there were small-scale pockets of electric current. Such pockets may have formed during the fracturing of the shatter cones. This magnetic acquisition may be similar to the remanence acquired near the lightning bolt (Wasilewski and Kletetschka, 1999). Magnetic field generated by these currents could efficiently magnetize the low coercivity grains at ambient temperature.
Such currents may have formed at the same time with formations of small pocket of melt that often cover the surfaces of the shatter cones. Melt on the shatter cone surfaces formed during the expansion regime after the primary shock wave passed (Gibson and Spray, 1998).
Similar anomalous magnetization is observed in the B-sub-samples. The sub-samples B4 and B6 have magnetic efficiency almost order of magnitude larger compared to other B-sub-samples. However, in the case of AF demagnetization, the behaviors are similar and indistinguishable from the rest of the B-sub-samples (Fig. 6c).
The most significant result is that magnetizations of all of our A-samples are distributed perpendicular to the shatter cone axis (Fig. 5a,b), and therefore perpendicular to the shock wave propagation direction. This is consistent with experimental data (Funaki and Syono, unpublished results) where impact pressures of 5 GPa and 10 GPa produced magnetization directions that were perpendicular to the shock propagation. However, our B-site sub-samples have their directions parallel to the apex direction (Fig. 6a,b). This is important in light of experimental shock measurements by Funaki and Syono (unpublished results), where impact pressures of 20 GPa produced magnetization directions parallel to the shock wave propagation. Since the apex direction indicates the shock wave propagation, our data from site B may indicate that the shock pressures were higher than in site A. Based on Funaki and Syono (unpublished results) analogy, these shatter cones may have formed at impact pressure as large as 20 GPa.
The above agrees with what the Hargraves and Perkins (1969) reported in their paper that changes in NRM directions caused possibly by remagnetization. The contrasted magnetic signatures between sites A and B agrees with the views of Osinski and Spary (unpublished reults) and Baratoux and Melosh (2003) that heterogeneity in rocks reflects the shatter cone formation.
We suggest that the magnetization event may not be a one time event, but may be at least two; an initial strong demagnetization that homogeneously randomizes the orientation (therefore the bulk intensity of NRM) by a shock wave, followed by a secondary expansion wave that causes the actual shatter cone formation and magnetizes
T. Adachi and G. Kletetschka
250 Stud. Geophys. Geod., 52 (2008)
the shatter cone material. This observation agrees with Wieland et al. (2006) that a front wave of an impact affect homogeneously throughout the bed rock (early stage) while the drop in the pressure caused localized melting along the fractures and could reset the magnetization vector of shatter cone material.
For site A where we have evidence of such melting, and the data show that the immediate magnetization was perpendicular to the shock direction. Also magnetization was enhanced for low coercivity grains, indicating low ambient temperature magnetic acquisition. Based on Funaki and Syono (unpublished results), the impact pressure of the
shatter cone A may have been around 5 ! 10 GPa while the magnetization acquired perpendicular to the shock wave. Shatter cone B has the same level of coercivities (see AF demagnetization of NRM, Fig. 6c). Therefore the final magnetization may have reset to parallel to the apex across all coercivities. This is consistent with much larger impact pressures for which there is some experimental base (Funaki and Syono, unpublished results).
Importantly, there are significant variations within one sample (Fig. 4), which supports the Carporzen et al. (2005) report. The fluctuating behaviors of NRM values of SmSC A occur within the samples A1 through A10. This is an indication of randomness not only in the directions perpendicular to the cone axis, but also in related magnetic intensities (Fig. 4).
Hargraves and Perkins (1969) had reported about uniaxial stress will affect only the region with directions of magnetization such that the component of normal deviatoric stress parallel to the magnetization is greater than the minimum coercive stress for the regions. This phenomenon is observed in both shatter cone A and B, and such deviatoric stress had to exceed the coercive stress.
7. CONCLUSIONS AND PERSPECTIVES
This is the first attempt to magnetically test carbonate shatter cone structures. Magnetic signatures of Sierra Maderra suites of impact deformed rocks demonstrated the contrasting NRM and SIRM between the sites, and important variations in magnetization orientations. The NRM signatures of small scale shatter cone, SmSC A and larger scale shatter cone LgSC B suggest that shock plays an important role in resulting magnetization direction. Our data revealed distinct magnetic signatures of shatter cones. The variation of the magnetic remanence suggests that shatter cones may have recorded contrasting magnetic signatures in both intensities and directions depending on the impact pressures. The dimensional scale of shatter cones may be also an indicative parameter for randomization of the magnetic intensities. Such variations may influence the overall coherent magnetic intensity observed from a distance. This may have some role to play regarding magnetic anomalies on Mars and Moons. The cause of lunar magnetism was suggested as crustal rock remanent magnetization by Pohl (1981). He suggested that the possible source of overall magnetic field may be a wide spread and stable remanent magnetizations in rocks.
We suggest that the shock effect on magnetic carriers in carbonates in the Sierra Madera impact rocks may be bimodal, 1) The initial shock wave that compress the host rock demagnetizes the original magnetic signature; 2) The immediate decompression
Impact-Pressure Controlled Orientation of Shatter Cone Magnetizations
Stud. Geophys. Geod., 52 (2008) 251
wave, produces the shatter cone fractures, with partially melt infill and remagnetizes the shatter cone material.
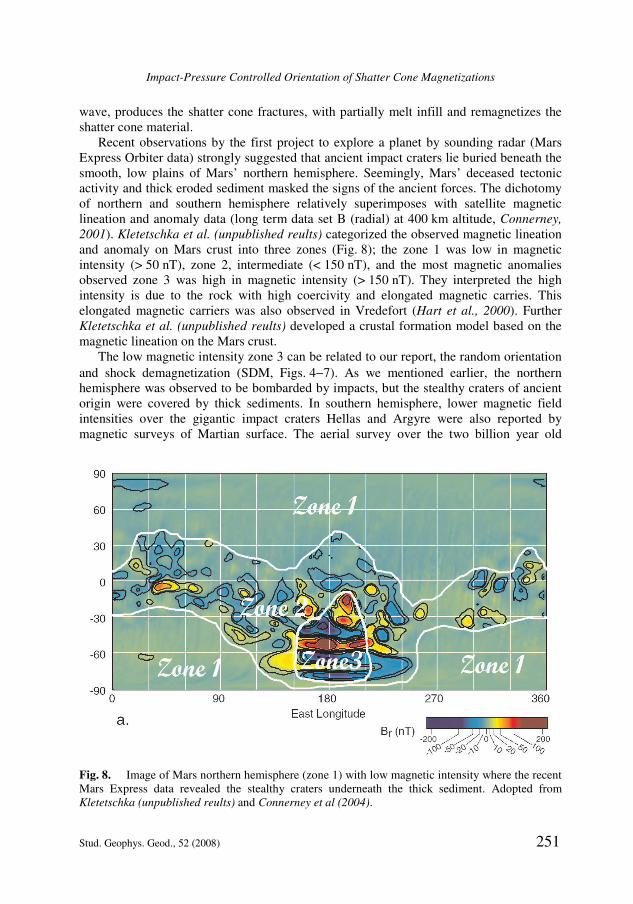
Recent observations by the first project to explore a planet by sounding radar (Mars Express Orbiter data) strongly suggested that ancient impact craters lie buried beneath the smooth, low plains of Mars’ northern hemisphere. Seemingly, Mars’ deceased tectonic activity and thick eroded sediment masked the signs of the ancient forces. The dichotomy of northern and southern hemisphere relatively superimposes with satellite magnetic lineation and anomaly data (long term data set B (radial) at 400 km altitude, Connerney, 2001). Kletetschka et al. (unpublished reults) categorized the observed magnetic lineation and anomaly on Mars crust into three zones (Fig. 8); the zone 1 was low in magnetic intensity (> 50 nT), zone 2, intermediate (< 150 nT), and the most magnetic anomalies observed zone 3 was high in magnetic intensity (> 150 nT). They interpreted the high intensity is due to the rock with high coercivity and elongated magnetic carries. This elongated magnetic carriers was also observed in Vredefort (Hart et al., 2000). Further Kletetschka et al. (unpublished reults) developed a crustal formation model based on the magnetic lineation on the Mars crust.
The low magnetic intensity zone 3 can be related to our report, the random orientation
and shock demagnetization (SDM, Figs. 4!7). As we mentioned earlier, the northern hemisphere was observed to be bombarded by impacts, but the stealthy craters of ancient origin were covered by thick sediments. In southern hemisphere, lower magnetic field intensities over the gigantic impact craters Hellas and Argyre were also reported by magnetic surveys of Martian surface. The aerial survey over the two billion year old
Fig. 8. Image of Mars northern hemisphere (zone 1) with low magnetic intensity where the recent Mars Express data revealed the stealthy craters underneath the thick sediment. Adopted from Kletetschka (unpublished reults) and Connerney et al (2004).
T. Adachi and G. Kletetschka
252 Stud. Geophys. Geod., 52 (2008)
Vredefort crater in South Africa, largest on the Earth, indicated a much lower intensity at the site despite evidence of strongly magnetized SD magnetite in it's shocked granites (Hart et al., 2000), while the overall bulk remanence appeared to be lower (Carporzen et al., 2005). The Carporzen report suggested this low magnetic field over crater is due to randomized magnetization recorded in impact shock deformed and fractured rocks. This randomized magnetization masks the true intensity of magnetic remanence of rocks in craters; it suggests magnetic (lower intensity) anomalies of meteorite craters cannot be used as evidence for the absence of the planet’s internally generated magnetic field at the time of impact. Hart et al. (2000) reported extremely high remanent magnetism in the shocked Archaen granites that derived from elongated, micron-size single domain magnetite particles found along shock-induced planar deformation in quartz. The shock pressure was predicted to be 30 GPa (Stoffler and Langenhorst, 1994; Grieve et al., 1996). Magnetic characterization of impacted terrestrial rocks is important in the light of planetary magnetic anomaly interpretation.
Acknowledgements: We are grateful to the reviewers. Without their thorough reviewing,
comments and suggestions; the paper would not have taken the shape. We thank D. Makeown (XRD Lab) for his kind assistance for X-ray Powered Diffraction analysis, and I. Pegg, the director of the Vitreous State Laboratory (VSL), at Catholic University of America who allowed our access to the XRD Lab, and S. Huson for the personal communication regarding the Fe-content). T. Elbra and T. Kohout are also thanked for their help to collecting the samples at the Sierra Madera Impact site. We thank to P. Wasilewski for use of his magnetic laboratory at NASA Goddard Space Flight Center. Also we would like to thank the Impact Field Study Group (http://web.eps.utk.edu/ifsg.htm) especially, M. Thompson who organized the field trip to Sierra Madera Impact site, and allowed the collection of the samples.
References
Ashworth J.R. and Schneider H., 1985. Deformation and transformation in experimentally shock-loaded quartz. Phys. Chem. Miner., 11, 241!249.
Baratoux D. and Melosh H.J., 2003. The formation of shatter cones by shock wave interference during impacting. Earth Planet. Sci. Lett., 216, 43!54.
Boon J.D. and Albritton C.C. Jr., 1936. Meteorite craters and their possible relationship to “cryptovolcanic structures”. Field and Laboratory, 5, 1!9.
Carporzen L., Gilder S.A. and Hart R.J., 2005. Palaeomagnetism of the Vredefort meteorite crater and implications for craters on Mars. Nature, 435, 198!201.
Carporzen L., Gilder S.A. and Hart R.J., 2006. Origin and implication of two Verwey transitions in the basement rocks of the Vredefort meteorite crater, South Africa. Earth Planet. Sci. Lett., 251, 305!317.
Eggleton R.E. and Shoemaker E.M., 1961. Breccia at Sierra Madera, Texas. U.S. Geological Survey Professional Paper, 424-D, D151!D153.
French B.M., 1998. Traces of Catastrophe, a Handbook of Shock-Metamorphic Effects in Terrestrial Meteorite Impact Structures. Lunar and Planetary Institute, Contribution No. 954.
Impact-Pressure Controlled Orientation of Shatter Cone Magnetizations
Stud. Geophys. Geod., 52 (2008) 253
Gibson H.M. and Spray J.G., 1998. Shock-induced melting and vaporization of shatter cone surfaces: evidence from the Sudbury impact structure. Meteorit. Planet. Sci., 33, 329!336.
Grieve R.A.F., Langenhorst F. and Stoffler D., 1996. Shock metamorphism of quartz in nature and experiment. 2. Significance in geosciences. Meteorit. Planet. Sci., 31, 6!35.
Hargraves R.B. and Perkins W.E., 1969. Investigations of the effect of shock on natrual remanent magnetism. J. Geophys. Res., 74, 2576!2589.
Hart R.J., Hargraves R.B., Andreoli M.A.G., Tredoux M. and Doucoure C.M., 1995. Magnetic anomaly near the center of the Vredfort structure - implications for impact-related magnetic signatures. Geology, 23, 277!280.
Hart R.J., Connell S.H., Cloete M. and Mare L., 2000. ‘Super magnetic’ rocks generated by shock metamorphism from the centre of the Vredefort impact structure, South Africa. S. Afr. J. Geol., 103, 151!155.
Huson S.A., Foit F.F., Watkinson A.J. and Pope M.C., 2006. X-ray diffraction powder patterns and thin section observations from the Sierra Madera Impact Structure. Lunar and Planetary Science, XXXVII, 2377.pdf (http://www.lpi.usra.edu/meetings/lpsc2006/pdf/2377.pdf).
Kletetschka G., Kohout T. and Wasilewski P.J., 2003a. Magnetic remanence in the Murchison meteorite. Meteorit. Planet. Sci., 38, 399!405.
Kletetschka G., Ness N.F., Wasilewski P.J., Connerney J.E.P. and Acuna M.H., 2003b. Possible mineral sources of magentic anomalies on Mars. The Leading Edge, 22, 766!768.
Kletetschka G., Acuna M.H., Kohout T., Wasilewski P.J. and Connerney J.E.P., 2004a. An empirical scaling law for acquisition of thermoremanent magnetization (vol 225, pg 279, 2004). Earth Planet. Sci. Lett., 228, 573!573.
Kletetschka G., Connerney J.E.P., Ness N.F. and Acuna M.H., 2004b. Pressure effects on martian crustal magnetization near large impact basins. Meteorit. Planet. Sci., 39, 1839!1848.
Nicolaysen L.O. and Reimold W.U., 1999. Vredefort shatter cones revisited. J. Geophys. Res.-Solid Earth, 104, 4911!4930.
Pohl J., 1981. Planetary and lunar magnetism: In: ESA The Solar System and Its Exploration, 115!120 (SEE N82-26087 16-88).
Sagy A., Fineberg J. and Reches Z., 2004. Shatter cones: branched, rapid fractures formed by shock impact. J. Geophys. Res.-Solid Earth, 109, B10209.
Sagy A., Reches Z. and Fineberg J., 2002. Dynamic fracture by large extraterrestrial impacts as the origin of shatter cones. Nature, 418, 310!313.
Stoffler D. and Langenhorst F., 1994. Shock metamorphism of quartz in nature and experiment. 1. Basic observation and theory. Meteoritics, 29, 155!181.
Wasilewski P., 1977. Magnetic and microstructural properties of some lodestones. Phys. Earth Planet. Inter., 15, 349!362.
Wasilewski P. and Kletetschka G., 1999. Lodestone - nature’s only permanent magnet, what it is and how it gets charged. Geophys. Res. Lett., 26, 2275!2278.
Wieland F., Reimold W.U. and Gibson R.L., 2006. New observations on shatter cones in the Vredefort impact structure, South Africa, and evaluation of current hypotheses for shatter cone formation. Meteorit. Planet. Sci., 41, 1737!1759.
T. Adachi and G. Kletetschka
254 Stud. Geophys. Geod., 52 (2008)
Wilshire H.G., Howard K.A. and Offield T.W., 1971. Impact breccias in carbonate rocks, Sierra Madera, Texas. Geol. Soc. Am. Bull., 82, 1009!1017.
Wilshire H.G., Offield T.W., Howard K.A. and Cummings D., 1972. Geology of the Sierra Madera cryptoexplosion structure, Pecos County, Texas. USGS Professional Paper, No. 599-H, 1!49.