Embed Size (px)
Citation preview
Copyright Q 1973 by Academic Press, Inc. All rights of reproduction in any form reserued
Experimental Cell Research 78 (1973) 214224
IMPORTANCE OF THE NUCLEOLUS IN THE INITIATION OF DNA
SYNTHESIS IN MAMMALIAN CELLS
Studies with an Ultraviolet Microbeam and Low Concentrations of Actinomycin D
J. M. R. HATFIELD,l P. P. DENDY,e F. MEYSKEN!? and A. B. RICKINSON4
Department of Radiotherapeutics, University of Cambridge, Cambridge, UK
SUMMARY
Two independent techniques have been used to study the effects of nucleolar damage on the entry of cells into the DNA synthetic phase. Experiments have been performed with HEp/Z cells, mouse L cells, freshly cultured embryonic mouse fibroblast cells &d freshly cultured monkey kidney cells. All the results confirm previous reports that when cells have proceeded more than 1-2 h into the G 1 phase the onset of the next DNA synthetic phase is not delayed by nucleolar damage. However, nucleolar damage at about the time of cell division appears to delay entry into S phase for certain cell types.
There is considerable evidence that RNA and protein must be synthesised during the Gl phase before a cell can initiate DNA synthesis [l, 2, 31. Since the nucleolus is involved in the synthesis of ribosomal RNA [4], and consequently in the synthesis of protein, it may play an important part in the movement of a cell into the DNA synthetic phase. The purpose of this work was to investigate to what extent, if at all, nucleo- lar activity controls the initiation of DNA synthesis.
1 Present address: Department of Zoology, University of Edinburgh, West Mains Road, Edinburgh EH9 3JT. Scotland. 2 Piesent address: Department of Radiotherapeutics, University of Cambridge, Hills Road, Cambridge, UK. 3 Present address: Laboratory of Radiobiology, University of California School of Medicine, San Francisco, Calif. 94122, USA. 4 Present address: Department of Pathology, Univer- sity of Bristol, BristocBS8 ITD, UK. -
Exptl Cell Res 78 (1973)
A direct investigation is possible with the ultraviolet (UV) microbeam. Such an instru- ment, designed to produce a focused spot 2 pm in diameter [5] can be used to damage the nucleolus by selective irradiation. If the nucleoli of a cell of known age within the Gl phase are irradiated, the subsequent entry of this cell into DNA synthesis can be studied whilst the other daughter cell from the same division can be used as a control. If another pair of daughter cells is selected, one of them can be irradiated with an equivalent dose of radiation within the nucleoplasm. In such experiments, the micro- beam is being used as a microsurgical instru- ment and any differences between the effects of nucleolar and nucleoplasmic irradiation may be directly associated with the inhibition of some function specific to the nucleolus.
An independent approach to the problem is possible using the antibiotic, actinomycin

The nucleolus and onset of DNA synthesis 215
D (AMD). An interesting finding with this drug has been the identification of a dose of AMD which will inhibit 3H-uridine (3H-UR) uptake into the nucleoli of mammalian cells without appreciable effect on extranucleolar nuclear incorporation [6]. This observation raises the possibility that AMD may be capable of inhibiting nucleolar synthetic activity whilst causing minimal damage to other cellular functions. The finding that comparable doses of AMD in early G 1 phase delayed entry of mouse L cells into the DNA synthetic phase in both asynchronous and synchronous cultures suggested that this highly important transition in the cell cycle is dependent upon a functional nucleolus [7, 81. The present experiments with AMD were designed to test this suggestion by deter- mining whether or not the effect of the drug upon nucleolar synthetic activity could be dissociated from its effect upon the initia- tion of DNA synthesis [9].
Experiments were conducted both with cells of normal origin in primary culture and with cells from established lines of malignant origin, to try and identify possible differences in the mechanism controlling the initiation of DNA synthesis in different cell types.
MATERIALS AND METHODS
Established cell lines Both mouse L cells and HEpI cells, a human tumour of the nasopharynx maintained in culture for a number of years, were grown in Pyrex feeding bottles in culture medium comprising 90% medium 199 (Glaxo Ltd) and 10% foetal bovine serum for L cells and 90 % Eagle medium and 10 % foetal bovine serum buffered to pH 7.2 with bicarbonate for HEpj2 cells.
Primary cell lines Monkey Kidney (MK) cells were supplied as primary cultures by Wellcome Ltd. They were grown in 90 % medium 199, 9 % foetal calf serum and 1 % lactalbumin hydrolysate.
Embryonic mouse fibroblast (EMF) cultures were obtained by standard procedures IlO] and were grown in the same medium as MK cells. Both MK and EMF cells were used for experiments in either the second or third passage.
Asynchronous cultures were prepared by tryp- sinising a monolayer of cells and seeding coverslips 16 mm in diameter with 2-4 x 10“ cells. The cultures were incubated in an atmosnhere of 5 % CO, in air for at least 24 h in the case of EMF cells and MK cells and 36 h in the case of mouse L cells and HEp/2 cells before experimental use.
Synchronous cultures
L Cells, HEpI cells and EMF cells. Synchronous cultures were prepared by selectively harvesting mitotic cells from a nearly confluent monolayer growing on a 10 cm Petri dish [II]. A preliminary washing of the parent culture was followed 12 h later by a second washing to provide cells for ex- uerimental use. In the case of EMF cells the second washing was preceded by a 1 h incubation in Ca2+-free medium.
For microbeam work the cells were allowed to settle on to a quartz coverslip in the bottom of a specially designed tube. This tube was made from Perspex and the cap covering its base could be removed (Tolmach. Personal communication). After l-2 h the mitotic cells had attached themselves to the coverslip and the latter could be removed from th: tube and inverted on to the culture chamber. These chambers were used routinely for microbeam work and were similar in design to those described in previous communications [12, 131. Because the exact time of division was not known for individual cells, and because the cells spread out rather slowly after washing off, they were not irradiated during the Gl phase following harvesting. However, this pro- cedure did provide, 16-20 h later, a large number of mitotic cells which could be followed from the nrecise moment of anaphase at the second division until they had spread out sufficiently for irradiation in the-next Gi phase.
L cells exposed to AMD medium were either treated for 2 h starting 3 h before washing off mitotic cells (m-3 to m - 1 h), or mitotic cells were washed off in AMD medium and allowed to grow for 2 h before being returned to AMD free medium (m to m +2 h). or cells were treated with AMD for 2 h starting’3 h after washing off (m+ 3 to m-1 5 h). EMF cells exposed to AMD medium were either treated for 45 min starting 1.5 h before washing off (m - 1.5 to m - 0.75 h), or were washed off in AMD medium and allowed to grow for 45 min before being returned to AMD free medium (m to m +0.75 h). Fortyfive-minute exposures to AMD were chosen for EMF cells because the Gl and G2 phases in these cells are much shorter than in L cells (see table 1 later).
MK cells are extremely difficult to synchronise. For microbeam irradiation of single cells it was con- sidered more satisfactory to follow by eye a particular pair of daughter cells in an asynchronous culture from the time of division to the time of irradiation.
Exptl Cell Res 78 (1973)

216 J. M. R. Hatfield et al.
Microbeam apparatus. The aouaratus is similar to that first de&bed by Uretz-& Perry [5]. However the reflecting objective has been renlaced by a Zeiss (32 i: ) ‘Ultr~flu&’ objective which allows -the cells to be viewed with phase contrast optics during irradiation [14]. A series of experiments to check the optical properties of the objective and to measure the diameter of the focused UV beam spot can be summarised as follows: (i) Using a 50 ,um diameter primary aperture, the Ultrafluar objective produced a focused UV spot which, when recorded on thin autoradiographic emulsion, had an effective diameter of 2.0 pm. The amount of UV radiation scattered outside the beam was measured using different exposure times on the same emulsion and found to be very small-O.5 pm from the edge of the beam the intensity had fallen to 10 %, and 1 pm from the edge, the intensity was only 1 %. (ii) The focal plane of ‘the objective shifted by 0.9 p&~when the wavelength was changed from 550 to 275 urn. However, the diameter of the beam had increasei by less than 10 % of its minimum value when measure- ments were made in planes 2 pm above and below the focal plane, and, therefore, the focal shift was considered not to be significant.
The two wavelengths chosen for irradiation were 260 nm where nucleic acid bases absorb strongly and 280 nm where certain of the amino acids in proteins show strong absorption.
Microbeam dosimetry
The flux of UV radiation in the microbeam was meas- ured by reflecting the beam with a periscope ar- rangement into a photomultiplier. The geometry was carefully arranged so that the UV light passed to a calibrated photomultiplier along a ray path similar to the one it normally traversed during irradiation experiments. The spectrum of UV radiation delivered by the mercury arc lamp was measured and the spectrum of UV passed by the monochromator when it was set at 260 and 280 nm was then calculated [14].
The flux used for cellular irradiation was estimated to be approx. 4 x lo-* erg+ at 280 nm. Although the photomultiplier method could not provide this gbsolute figure with an accuracy of better than 30 %, it was possible using this arrangement to monitor at the beginning of each experiment and arrange for the total UV exposure to be reproducible within an error of 5 %.
The absorption of UV radiation by the nucleolus, nucleoplasm and cytoplasm of living HEu/2 cells has been measured using a specially -designed micro- spectrophotometer [15]. It was thus possible to calculate the absorbed dose of radiation for each part of the cell when it was irradiated with the microbeam.
checked by redrawing the field of view at hourly intervals. All of the nucleoli in one of the two daughter cells were irradiated at a known time after mitosis. A nearby pair of cells, which had divided at approximately the same time, was chosen and one of the daughters was irradiated at different places in the nucleoplasm-the number of places irradiated being equal to the number of nucleoli irradiated in the first cell. All four cells were then followed until the control cells could be presumed to be in S phase (from table 1).
Drug
A commercial preparation of AMD was used (Merck, Sharp & Dohme Ltd) and an intermediate dilution of 4 pg/ml stored in the dark in medium 199 at - 20°C showed no appreciable deterioration over a period of 1 month, after which time a fresh dilution was made [16].
Pulse labelling and autoradiography
Cells were treated for 15 min with medium con- taining SH-thymidine ($H-TdR) at 5 @/ml, 2 Ci/mM, or aH-uridine (SH-UR) at 20 &i/ml, 3 Ci/mM, rinsed twice in Ringer, fixed in ethanol/acetic acid (3 : 1) for 15 min and then rinsed in 70 % ethanol for 5 min and distilled water for 1 min. In the mitotic labelling experiments the culture was rinsed thor- oughly in Ringer after the 15 min pulse of SH-TdR and the label was flooded by adding 1O-6 M cold thymidine to the medium for 1 h. Cultures were fixed at intervals thereafter. 3H-UR labelled cultures were digested with DNAase (Worthington Biochemical Corp.) at 15 mg/lOO ml in buffered solution for 30 min after fixation.
Labelled coverslips were mounted on slides with “DePeX”. Slides were dipped into diluted 1 :l Ilford K-2 emulsion, exposed for 3 days and developed in ID 19.
In microbeam experiments, counts were made over all the irradiated nuclei, usually about 20 in each culture, and over all their paired controls. The count over each irradiated nucleus was expressed as a percentage of the count over the unirradiated sister nucleus and the results for pairs of cells which had been treated similarly (usually about 20 in all) were averaged. For AMD work, average values for the percentages of cells labelled with 8H-TdR were determined by counting 2 000 cells/point for asyn- chronous cultures and at least 200 telophase pairs for synchronous cultures. Average grain counts in 8H- UR experiments were obtained from counts on 50 cells.
Microspectrophotometry
Irradiation procedure The total DNA content of the nuclei of synchronous HE&2 cells was measured on Feulgen stained nre- ---c, ~~
The time of division was recorded for individual parations using a Barr & Stroud Iniegrating Micro- cells and the position of the two daughter cells was densitometer.
Exptl Cell Res 78 (1973)

Table 1. Cell cycle parameters for four dif- ferent ceil types
Inter- mitotic time
Cell type (h)
EMF 11.4 2.3 1.2 1.6 0.3 MK 17.0 5.2 8.0 3.5 0.3
&p/2 22.5 7.6 9.1 4.8 0.4 19.0 7.5 7.0 4.0 0.5
RESULTS
Cell cycle analysis
The percentage of labelled mitotic cells on preparations of asynchronous cultures fixed at various times after a short pulse of 3H-TdR was measured for EMF cells (fig. l), MK cells and HEpj2 cells. The duration of mitosis (M) was estimated by visual obser- vation under the microscope. From this data the intermitotic time and the length of each of the phases of the cell cycle have been calculated. The data for L cells are taken from Rickinson [8].
For the microbeam experiments and some AMD experiments a more accurate value of G 1 was desirable. This was obtained for L cells and HEpj2 cells by harvesting mitotic cells into medium containing 3H-TdR and fixing at intervals thereafter (e.g. the control curve on fig. 5).
All the relevant information on cell cycle parameters is summarised in table 1.
Effects of microbeam irradiation during early and mid Gl phase
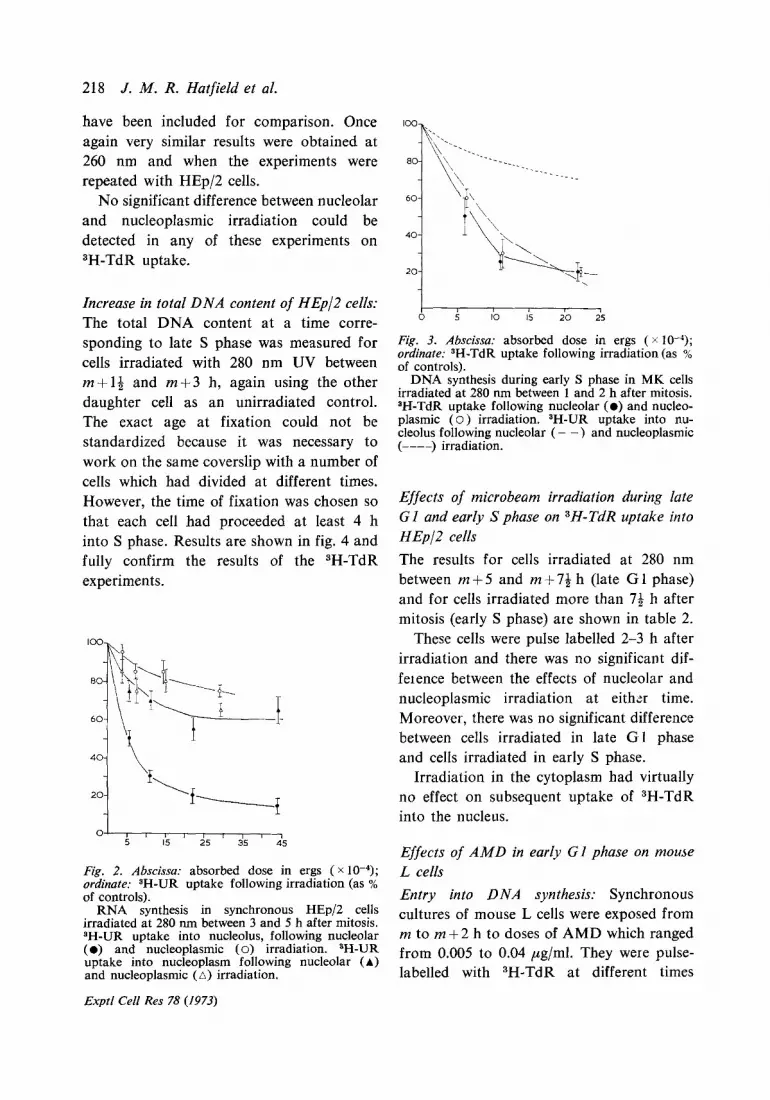
3H-UR uptake into HEpI cells and MK cells: Fig. 2 shows results for HEp/2 cells irradiated at 280 nm between 3 and 54 h after mitosis (m+3 h to m + 5& h), pulse- labelled with 3H-UR between 2 and 3 h after irradiation and fixed immediately. Simi- lar results were obtained when the cells were
The nucleolus and onset of DNA synthesis 217
I 0 4 8 I2 16 20
Fig. 1. Abscissa: time (hours) after exposure to SH-TdR; ordinate: % labelled mitoses.
The percentage of labelled mitoses in a culture of EMF cells at various times after a pulse exposure to *H-TdR is shown on the graph from which the durations of the G2 phase++ mitosis (G2 +&U), the DNA synthetic phase (S) and the intermitotic time (I) can be deduced.
irradiated at 260 nm; when they were ir- radiated with either wavelength between m + 14 and m + 3 h, and when the experi- ments were repeated with MK cells (see the broken lines in fig. 3).
All these experiments indicate that there is a range of absorbed doses in the region of (10-30) x 1O-4 ergs/cell nucleus within which nucleolar 3H-UR incorporation is reduced to a much greater extent by nucleolar irradiation than by nucleoplasmic irradiation. Within the same dose range, however, nucleoplasmic 3H-UR incorporation is af- fected equally and only slightly by irradia- tion at either site.
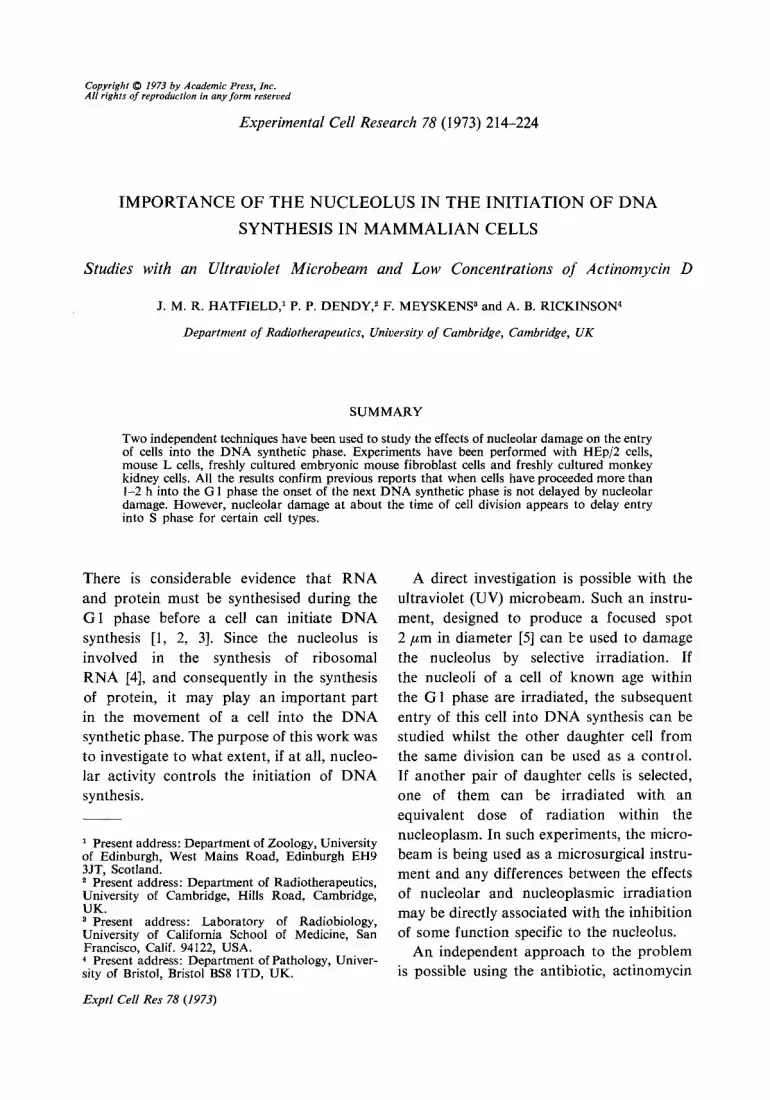
3H-TdR uptake into HEpI cells and MK cells: These cultures were allowed to grow after irradiation until the control cells were judged to have entered S phase on the basis of information in table 1, (e.g. until about m +6 h to m +7 h in the case of MK cells), then pulse-labelled and fixed immediately. The results for MK cells irradiated at 280 nm between m + 1 and m +2 h are shown in fig. 3. The effects of similar treat- ment on nucleolar 3H-UR incorporation
Exptl Cell Res 78 (1973)
218 J. M. R. Hatfield et al.
have been included for comparison. Once again very similar results were obtained at 260 nm and when the experiments were repeated with HEp/2 cells.
No significant difference between nucleolar and nucleoplasmic irradiation could be detected in any of these experiments on 3H-TdR uptake.
Increase in total DNA content of HEpJ2 cells: The total DNA content at a time corre- sponding to late S phase was measured for cells irradiated with 280 nm UV between m + 14 and m +3 h, again using the other daughter cell as an unirradiated control. The exact age at fixation could not be standardized because it was necessary to work on the same coverslip with a number of cells which had divided at different times. However, the time of fixation was chosen so that each cell had proceeded at least 4 h into S phase. Results are shown in fig. 4 and fully confirm the results of the 3H-TdR experiments.
Fig. 2. Abscissa: absorbed dose in ergs (x 10-3; ordinate: SH-UR uptake following irradiation (as % of controls). _
RNA synthesis in synchronous HEp/2 cells irradiated at 280 nm between 3 and 5 h after mitosis. aH-UR uptake into nucleolus, following nucleolar (0) and nucleoulasmic (0) irradiation. %H-UR uptake into nucieoplasm ‘fohowing nucleolar (A) and nucleoplasmic (A) irradiation.
Exptl Cell Res 78 (1973)
I 1 0 5 IO 15 20 25
Fig. 3. Abscissa: absorbed dose in ergs ( x 10-4); ordinate: SH-TdR uptake following irradiation (as % of controls).
DNA synthesis during early S phase in MK cells irradiated at 280 m-n between 1 and 2 h after mitosis. 8H-TdR uptake following nucleolar (0) and nucleo- plasmic ( o ) irradiation. SH-UR uptake into nu- cleolus following nucleolar ( - -) and nucleoplasmic (----) irradiation.
Effects of microbeam irradiation during late Gl and early S phase on 3H-TdR uptake into HEpI cells
The results for cells irradiated at 280 nm between m+5 and m+7& h (late Gl phase) and for cells irradiated more than 7+ h after mitosis (early S phase) are shown in table 2.
These cells were pulse labelled 2-3 h after irradiation and there was no significant dif- feience between the effects of nucleolar and nucleoplasmic irradiation at either time. Moreover, there was no significant difference between cells irradiated in late Gl phase and cells irradiated in early S phase.
Irradiation in the cytoplasm had virtually no effect on subsequent uptake of 3H-TdR into the nucleus.
Effects of AA4D in early Gl phase on moue L cells
Entry into DNA synthesis: Synchronous cultures of mouse L cells were exposed from m to m + 2 h to doses of AMD which ranged from 0.005 to 0.04 ,ug/ml. They were pulse- labelled with 3H-TdR at different times
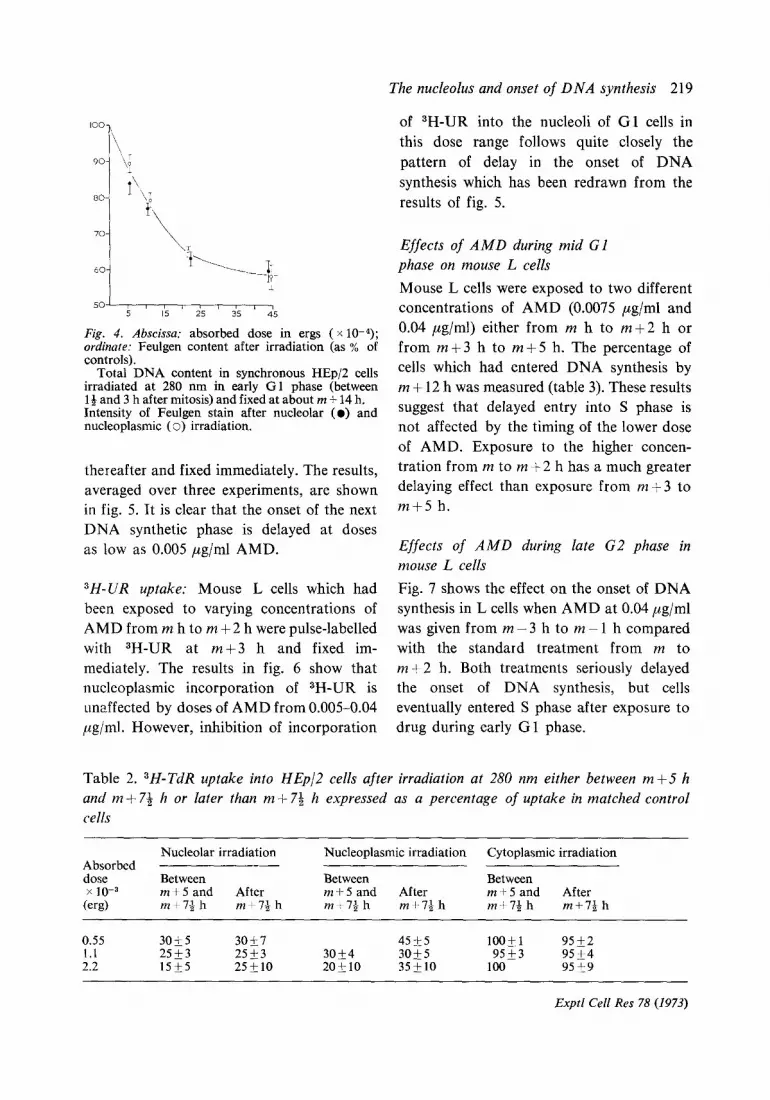
Fig. 4. Abscissa: absorbed dose in ergs ( x 10-4); ordinate: Feulgen content after irradiation (as % of controls).
Total DNA content in synchronous HEp/Z cells irradiated at 280 nm in early Gl phase (between l& and 3 h after mitosis) and fixed at about m + 14 h. Intensity of Feulgen stain after nucleolar (0) and nucleoplasmic ( 0) irradiation.
thereafter and fixed immediately. The results, averaged over three experiments, are shown in fig. 5. It is clear that the onset of the next DNA synthetic phase is delayed at doses as low as 0.005 pug/ml AMD.
3H-UR uptake: Mouse L cells which had been exposed to varying concentrations of AMD from m h to m + 2 h were pulse-labelled with 3H-UR at m +3 h and fixed im- mediately. The results in fig. 6 show that nucleoplasmic incorporation of 3H-UR is unaffected by doses of AMD from 0.005-0.04 pg/ml. However, inhibition of incorporation
The nucleolus and onset of DNA synthesis 219
of 3H-UR into the nucleoli of Gl cells in this dose range follows quite closely the pattern of delay in the onset of DNA synthesis which has been redrawn from the results of fig. 5.
Effects of AMD during mid Gl phase on mouse L cells
Mouse L cells were exposed to two different concentrations of AMD (0.0075 pg/ml and 0.04 ,ug/ml) either from m h to m +2 h or from m +3 h to m +5 h. The percentage of cells which had entered DNA synthesis by m + 12 h was measured (table 3). These results suggest that delayed entry into S phase is not affected by the timing of the lower dose of AMD. Exposure to the higher concen- tration from m to m -t 2 h has a much greater delaying effect than exposure from m +3 to
m+5 h.
Effects of AMD during late G2 phase in mouse L cells
Fig. 7 shows the effect on the onset of DNA synthesis in L cells when AMD at 0.04 pg/ml was given from m - 3 h to m ~ 1 h compared with the standard treatment from m to m +2 h. Both treatments seriously delayed the onset of DNA synthesis, but cells eventually entered S phase after exposure to drug during early Gl phase.
Table 2. 3H-TdR uptake into HEpI cells after irradiation at 280 nm either between mf.5 h and m + 7+ h or later than m+ 7=& h expressed as a percentage of uptake in matched control cells
Nucleolar irradiation Nucleoplasmic irradiation Cytoplasmic irradiation Absorbed dose Between Between Between x IO-3 m+5 and After m+5 and After m+5 and After
(erg) m+l+ h m+l* h m+l$ h m+l~$ h m+l& h m-t11 h
0.55 30*5 30+1 451-5 100&l 95&2 I.1 25+3 25_+3 30_+4 3Ok5 95+3 95_+4 2.2 15+5 25klO 20+10 35&10 100 95+9
Exptl Cell Res 78 (1973)

220 J. M. R. Hatfield et al.
Comparative experiments with synchronous EMF cells
The results of similar experiments with EMF cells are also presented in fig. 7. Again the onset of DNA synthesis was seriously de- layed by both schedules of drug exposure and for early Gl phase cells the block appears to be more effective than for L cells.
Continuous incubation of asynchronous cultures of L cells, EMF cells and HEpI cells in O.Ol,ug/ ml AMD. In preliminary experiments for this section asynchronous cultures of each cell type were exposed to 0.04 rug/ml AMD for 2 h, then pulse labelled with 3H-UdR and fixed immediately.
Results in table 4 show that for all three cell types, this concentration of AMD will cause a highly selective inhibition of nucleolar 3H-UdR incorporation at the end of the 2 h exposure period.
Asynchronous cultures of each cell type were then incubated continuously in the nucleolar-specific AMD concentration of 0.04 pg/ml and the percentage of cells in the DNA synthetic phase at various times was
Fig. 5. Abscissa: time (hours) after washing off mitotic cells; ordinaie: % cells labelled with SH-TdR. x - x , control; l -•,0.0()5; O--O, 0.0075; A-A,
0.01; A-A, 0.04 pg/ml AMD Measurements on the entry of synchronous L
cells into the DNA synthetic phase following dif- ferent doses of AMD from m to m + 2 h.
Exptl Cell Res 78 (1973)
0.0075 0.04 iugbl m/ml
Fig. 6. Abscissa: log,, (AMD cont. in pg/ml); ordinate: (left) % 8H-UR untake relative to con- trols; (right) cells in S phase by 12 h as % of controls.
The figures (0.0075 and 0.04 pg/ml) concern ranges of doses of particular interest.
Effects of exposure of synchronous L cells to dif- ferent doses of AMD from m to m+2 h on in- corporation of SH-UR into nucleolus ( l ) and nucleoplasm (0) at m + 3 h. x , % aH-TdR-labelled cells at m+ 12 h, expressed as % labelled control cells at the same time. Each point has been averaged from the results of 6 expts in the case of low doses of AMD and 2 expts for doses above 0.04 pg/ml.
recorded. The results (fig. 8) showed marked variations in the responses of the different cell types.
DISCUSSION
The discussion can most easily be developed by dividing the G 1 phase into two parts, con- sidering first those cells which had proceeded more than l-2 h beyond mitosis at the time of treatment, and secondly those cells which had not reached this stage when treated.
Results of the microbeam experiments relate to cells in the first group. Fig. 2 confirms the observation of Perry et al. [17] that it is possible to choose a dose of UV radiation which, when delivered to the nucleoli, will severely interfere with nucleolar 3H-UR incorporation but will have very little effect on that process when delivered to, nucleoplasmic regions. On the other hand the same absorbed dose of radiation delivered either to nucleoli or nucleoplasm has only

The nucleolus and onset of DNA synthesis 221
Table 3. Effects of doses of AMD which cause little nucleolar inactivation (0.0075 pg/ml) and substantial nucleolar inactivation (0.04 pglml) on the entry of synchronised L cells into S phase
Results are averaged over 12 expts
% cells labelled with 3H-TdR at m+12 h
Drug from Drug from in to ??+3 to m+2 h m+5 h
Control 81 k4 83 +4 0.0075 pg/ml AMD 35+8 41+4 0.04 pg/ml AMD 10+2 33+_3
a small effect on nucleoplasmic 3H-UR incorporation. It is, therefore, reasonable to conclude that as far as 3H-UR metabolism is concerned the UV microbeam is able to cause appreciable nucleolar inactivation with a fairly high degree of specificity within the dose range (10-30) x 1O-2 ergs/nucleus.
When these doses of radiation were de- livered to either the nucleoli or nucleo- plasm of HEp/2 cells in late Gl phase or early in S phase and the effects on DNA synthesis were measured, results confirmed those of Dendy & Smith [12]. For irradia- tion at about this time in the cell cycle it is not possible to find a dose of UV which will have a. greater effect on 3H-TdR incorpora- tion when delivered to the nucleoli than when delivered to the nucleoplasm.
Irradiations were performed even earlier in the cell cycle to study specifically the onset of S phase; thus HEp/2 cells were irradiated 14-3 h, and MK cells as early as l-2 h after mitosis with wavelengths which would be preferentially absorbed either in nucleic acid bases (260 nm) or in certain amino acids in proteins (280 nm). In none of these situations was it possible to find a selective effect of nucleolar irradiation on
Fig. 7. Abscissa: time after mitosis (in fractions of intermitotic time); ordinate: % SH-TdR-labelled cells.
Effects on entry into the next DNA synthetic phase of exposure to 0.04 ,ug/ml AMD during very late G2 phase compared with exposure during very early Gl phase. Synchronous L cells x , Control; 0, AMD from m to m + 2 h, l , AMD from m - 3 to m - 1 h; synchronous EMF cells + Control; q , AMD from m to m+ij h; n , AMD from m-14 to m-3 h.
3H-TdR incorporation, nor was it possible to find a selective effect on the total DNA content in HEp/2 cells several hours after irradiation at 280 nm between l$ and 3 h after mitosis.
Because cells require some time to spread out on the quartz surface after cell division, it is not possible for them to be irradiated earlier than m + 14 h in the case of HEp/Z cells or m+ 1 h in the case of MK cells. Whether or not one can exclude nucleolar control over the onset of DNA synthesis at very early stages of the cell cycle has therefore been investigated using AMD. Earlier work by Rickinson [8] has shown that there was no significant effect on nucleolar 3H-UR up- take when asynchronous cultures of L cells were exposed to AMD at concentrations of 0.005-0.0075 pug/ml. The results shown in fig. 5 where it was possible to delay appreci- ably the onset of DNA synthesis if these very low drug concentrations were administered from m to m+2 h, appeared to have dis- sociated this effect of the drug from its action upon nucleolar RNA synthesis. However,
Expfl Cell Res 78 (1973)

222 J. M. R. Hatfield et al.
Table 4. Effects of a 2 h incubation with 0.04 ,uglml AMD on the incorporation of 3H-UR into asynchronous cultures of various cell types
Control (grains) Treated (grains)
Nucleo- Nucleo- Cell type Nucleolus plasm Nucleolus plasm
L cells 7.3 14.5 2.2 14.7 EMF cells 5.6 23.7 1.6 25.6
HEp/2 cells 7.6 19.6 1.7 20.1
measurements of nucleolar 3H-UR uptake by synchronous cells shortly after a 2 h drug exposure very early in Gl phase (fig. 6), suggest that these cells are more sensitive than cells in other parts of the cycle. When a strict comparison is made for cells of the same age, the inhibition of nucleolar 3H-UdR labelling in early Gl phase cells and the inhibition of their subsequent entry into DNA synthesis show a similar dependence upon the AMD concentration from m to m +2 h and thus the two effects could be related.
From fig. 6 the effects of a 2 h exposure to 0.0075 pg/ml AMD on nucleolar incorpora- tion of 3H-UR are measurable but small, whereas a 2 h exposure at 0.04 &ml causes substantial nucleolar inactivation. These dlug concentrations were therefore chosen for the experiments summarised in table 3 and show that the percentage of cells in S phase by 12 h is not affected by the timing of drug treatment when using the lower dose which causes little inactivation of nucleolar 3H-UR uptake. Treatment with a dose which strongly inactivates nucleolar uptake however reduces substantially the percentage of cells in S phase by 12 h if given for the first two hours after mitosis. The small delay in the onset of DNA synthesis following a 2 h treatment with 0.0075 pug/ml AMD at either time or
Exptl Cell Res 78 (1973)
3 01
0 051 I LSI 21
Fig. 8. Abscissa: time in AMD (in fractions of inter- mitotic time); ordinate: % SH-TdR-labelled cells.
Effect of continuous incubation in 0.04 pg/ml AMD on the percentage of cells in an asynchronous culture labelled during a brief exposure to 3H-TdR. x, EMF; 0, HEp/2 cells; .-‘., L cells redrawn
from Rickinson [8].
with 0.04 ,ug/ml AMD from m + 3 h to m + 5 h appears to reflect an action of the drug which must be distinguished from the effects when very early Gl phase cells are exposed to the higher drug concentration.
Experiments to compare the effects of ex- posures to AMD at 0.04 kg/ml either in early Gl phase or late in the previous G2 phase are shown in fig. 7. A marked dis- turbance of entry into DNA synthesis was observed in each case for both cell types, the effect of exposure in the late G2 phase being at least as great as that in early Gl phase for EMF cells and even greater in the case of L cells. Interpretation of these results is dif- ficult because a ‘pulse exposure’ in the true sense, is not possible with AMD which binds strongly to DNA and cannot be removed by simple washing procedures [18]. Our own observations upon autoradiographs of mouse L cells labelled for 2 h with 0.04 pug/ml 3H AMD and then returned to normal medium suggest that the level of 3H label falls to 50% after about 5 h. Since the binding of this label to DNA is known to persist during cell division [19], the progeny of cells exposed to the drug in G2 phase probably still contain a considerable amount of AMD during the next interphase. For this

The nucleolus and onset of DNA synthesis 223
reason the similarity in response to the two drug schedules shown in fig. 7 could again relate to a specific action of the drug in early Gl phase. On the other hand it could mean that AMD-sensitive events necessary for undisturbed entry into S phase also occur at the end of the previous G2 phase.
If nucleolar activity plays an important role in the progression of cells through the cell cycle and into the DNA synthetic phase in particular, then continuous incubation of asynchronous cultures in a nucleolar specific concentration of AMD (deduced from table 4) should cause marked changes in the distribu- tion of cells in the various phases of the cell cycle. Moreover if cellular growth is equally dependent upon nucleolar activity in a num- ber of different cell types then the effects of such incubation should be similar in each case.
The effects of continuous incubation of asynchronous cultures in 0.04 pg/ml AMD on the percentage of cells in the DNA synthetic phase are shown in fig. 8 and are strikingly different for the three cell types studied. The curves for EMF cells and L cells show a similar response in the early stages with the first detectable reduction in the percentage of cells in S phase at the end of a time interval which corresponds ap- proximately to the length of the Gl phase. Rickinson has shown for L cells [S] that at this time cells are leaving S phase for G2 at the normal rate but entry into S phase from G 1 has been blocked. The rise some houis later in the L cell curve reflects a substantial recovery of entry into DNA synthesis which does not appear to be shown by EMF cells. In contrast, the percentage of HEp/2 cells in S phase does not seem unduly affected by continuous exposure to this level of AMD for at least one generation time.
This increased disturbance of the cell cycle from HEp/2 cells to L cells to EMF cells,
15- 731818
is similar to observations of Studzinski & Ellem $201 who noted that heteroploid cells showed a greater growth capacity than diploid cells when ribosomal RNA synthesis was preferentially depressed by puromycin amino- nucleoside. In both sets of experiments the ob- served differences may be a consequence of the degree of constraint which nucleolar inhibition places upon different types of cell, particularly in the case of diploid EMF cells whose natural rate of ribosomal RNA turnover may be higher than that of hetero- ploid cells [21].
All the experiments reported here confirm by two independent approaches the earlier suggestion that, when a cell has proceeded more than l-2 h into the Gl phase, any interruption of normal nucleolar function will not prevent DNA synthesis starting on time and proceeding at the normal rate. However it has not been possible to dis- sociate completely the disturbances of nucleo- lar function at about the time of cell division and delays in the onset of the next DNA synthetic phase. The results must therefore lend further support to the suggestion that at least for EMF and L cells subribosomal particles produced in very early interphase and possibly those made in the previous G2 phase and inherited from the parent cell are important for the initiation of DNA syn- thesis. The extent to which their depletion can disturb the cell cycle may be different for the two cell types.
We would hke to thank the Head of the Department, Professor J. S. Mitchell, F.R.S., for supporting this work. The technical assistance.of Miss-D. M. A. Warner is also gratefully acknowledged.
REFERENCES
1. Mueller, G C, Fed proc 28 (1969) 1780. 2. Mittermayer, C, Kaden, P, Trommershaeuser,
U & Sandritter, W, Histochemie 14 (1968) 113. 3. Terasima, T & Yasukawa, M, Exptl cell res 44
(1967) 669.
Exptl Cell Res 78 (1973)

5.
76: 8. 9.
10.
11.
12.
13.
14.
Perry. R P, Exntl cell res 29 (1963) 400.
4. Perry, R P, Progr in nucleic acid res mol biol 6
Fujiiara, ?, J cell physiol 70‘(1967) 291. Rickinson, A B, Cell tissue kinet 3 (1970) 335. Rickinsorr, A B & Dendy, P P, Experientia 25
(1967) 219.
(1969) 1251.
Uretz, R P & Perry, R P, Rev sci instr 28 (1957)
Paul, J, Cell and tissue culture, 4th edn, p. 207. Livingstone, Edinburgh and London (1970). Terasima, T & Tolmach, L J, Exptl cell res 30
861.
(1963) 344. Dendy, P P & Smith, C L, Proc roy sot B 160 (1964) 328. Smith, C L & Dendy, P P, Cell tissue kinet 1 (1968) 225. Hatfield. J M R, PhD thesis, Univ of Cambridge (1970). ’ ’
224 J. M. R. Hatfield et al.
17. Perrv. R P. Hell. A & Errera. M. Biochim
15. Hatfield, J M R, Schultz, L & Ernst, D, Exptl cell res 59 (1970) 484.
16. Rickinson, A B, PhD thesis, Univ of Cambridge (1969~. \ - - - - I .
biophys acta 49 (1961) 47. ’ ’ 18. Elkind. M M. Sakamoto. K & Kamoer. C. Cell
tissue kinet l’(1968) 209: _ , ,
19. Fraccaro, M, Mannini, A, Tiepolo, L & Albertini, A, Exptl cell res 43 (1966) 136.
20. Studzinski, G P & Ellem, K A 0, Cancer res 28 (1968) 1773.
21. Michl, J & Svoboda, J, Exptl cell res 47 (1967) 616.
Received May 9, 1972 Revised version received September 20, 1972
Exptl Cell Res 78 (1973)


