Embed Size (px)
Citation preview
iii
Improving Integrated Pest Management of Stemphylium Leaf Blight of Onion
by Sara Stricker
A Thesis presented to
The University of Guelph
In partial fulfilment of requirements
for the degree of Doctor of Philosophy
in Plant Agriculture
Guelph, Ontario, Canada
© Sara Marie Stricker, September, 2021
ii
ABSTRACT
IMPROVING INTEGRATED PEST MANAGEMENT OF STEMPHYLIUM LEAF BLIGHT OF ONION
Sara Marie Stricker Advisors: University of Guelph, 2021 Dr. Mary Ruth McDonald Dr. Bruce D. Gossen Stemphylium leaf blight (SLB), caused by Stemphylium vesicarium, has become an important
disease of onion in Ontario, Canada and the north-eastern USA in recent years. This is the first
study in Canada to confirm the species of Stemphylium isolates collected in onion fields using
molecular methods and to investigate several elements of the life cycle in North America. The
research confirmed that sexual reproduction and survival of overwintering structures on onion
leaves occurred in the field and identified six weed species that are alternative hosts: redroot
pigweed (Amaranthus retroflexus), marshcress (Rorippa palustris), yellow nutsedge (Cyperus
esculentus), perennial sowthistle (Sonchus arvensis), bull thistle (Cirsium vulgare) and purslane
(Portulaca oleracea). Using the forecasting models TOMcast and BSPcast to trigger foliar
fungicide application reduced applications by one or two sprays. Foliar sprays in combination
with fungicide seed treatments reduced SLB severity by 33–48%, but seed treatments or foliar
sprays alone did not suppress symptoms. The efficacy of foliar fungicides for the management of
SLB has declined over the past 10 years. Isolates of S. vesicarium collected in southern Ontario
from onion, asparagus, and leek in 2012–2019 were assessed for insensitivity to the active
ingredients of commonly used fungicides via mycelial growth and conidial germination assays.
Of the isolates collected in southern Ontario in 2018–2019, 94% were insensitive to
azoxystrobin, 61% to pyrimethanil, and 18% to fluopyram. Difenoconazole did not inhibit
conidial germination and 1% of S. vesicarium isolates were insensitive in the mycelial growth
iii
assay. Weather variables relating to moisture (high daily average relative humidity, low vapour
pressure deficit, and increased leaf wetness) were correlated with an increase in air-borne
S. vesicarium spores. A model was developed to predict the concentration of air-borne spores but
requires validation with more data, especially for years with high SLB severity. Other abiotic
factors such as drought may increase disease severity, but a controlled environment experiment
did not find a relationship between SLB susceptibility and drought. Future research should focus
on new fungicides, alternative products, biocontrol agents, and modifying the integrated pest
management program to better indicate when no fungicides are required.

iv
ACKNOWLEDGEMENTS I would like to thank my advisory committee including Dr. Mary Ruth McDonald, Dr. Bruce Gossen, Dr. Sarah Pethybridge, and Dr. Peter Pauls for all the support, patience, insight, and opportunities you have provided me. I also greatly appreciate the financial support provided by the Ontario Agri-Food Innovation Alliance, The Food from Thought research assistantship, Agriculture and Agri-Food Canada, and the Fresh Vegetable Growers of Ontario. I need to thank all of my lab mates, past and present, who created such a great atmosphere in the lab and especially the support of Sarah Drury who helped me with the final push of writing this thesis. Thanks also to Stephen Reynolds, Jake Carson, Afsaneh Sedaghatkish, Umbrin Ilyas. Christine Dervaric, Drew MacLean, and Selassi Tayviah. Additional thanks to the undergraduate students who volunteered their time to assist with my research: Emily McFaul, Kirstyn Howieson, and Marcelina Kaminska. I am very grateful to Kevin Vander Kooi, Laura Riches, Shawn Janse, Misko Mitrovic, Dennis Van Dyk, Tyler Blauel, Zach Telfer and the summer staff at the Muck Crops Research Station for all of your help with my field trials and your continued patience with my many, many, many questions. I wouldn’t be here without the support of many “doctors” in my past. Thank you especially to Dr. Greg Boland and Dr. Tom Hsiang for inspiring my initial interest in plant pathology. Thank you to the amazing mentors I’ve had in my life including Dr. Stacy Deneka, Dr. Monica Parker, Dr. Linda Jewell, Dr. Annick Bertrand, and Dr. Jen Foster. Thank you to Dr. Manish Raizada, Dr. Art Schaafsma, and Dr. Michelle Edwards for their assistance with my qualifying exam, among other things. Another set of thanks go to Dr. Cheryl Trueman and Dr. Odile Carisse for joining my defence committee as examiners. I appreciate the tremendous support from all of my friends and colleagues, especially the staff in the OAC. A special thank you to Gisele Angel, Tara Israel, Leigh West, and Dr. Istvan Rajcan for the encouragement and for being there when I needed a kind smile or an ear to listen. I am very grateful to my family for their understanding and support during my ongoing quest to collect more diplomas. I would like to say a special thank you to my mom, Susan Stricker, for instilling pride in me and for bragging to anyone who would listen that her daughter is studying to be a “plant doctor”. Finally, I want to say a very big thank you to my best friend and wife, Nureen Savji, for her unwavering support through all of these years. Nevertheless, she persisted.
v
TABLE OF CONTENTS ABSTRACT .............................................................................................................................................. ii ACKNOWLEDGEMENTS ..................................................................................................................... iv TABLE OF CONTENTS .......................................................................................................................... v LIST OF TABLES ................................................................................................................................ viii LIST OF FIGURES ................................................................................................................................... x LIST OF APPENDICES ....................................................................................................................... xiii LIST OF ABBREVIATIONS AND ACRONYMS ................................................................................ xv
Chapter 1 Literature review ..................................................................................................... 1 1.1 Introduction .................................................................................................................................. 1 1.2 Onion production ......................................................................................................................... 1
1.2.1 Onion taxonomy and description ............................................................................................. 1 1.2.2 Onion production and cultivation ............................................................................................ 3 1.2.3 Growing conditions ................................................................................................................. 4 1.2.4 Foliar diseases of onion ........................................................................................................... 5
1.3 Stemphylium leaf blight ............................................................................................................... 6 1.3.1 Symptoms of Stemphylium leaf blight .................................................................................... 6 1.3.2 Origin, distribution, and host range of Stemphylium vesicarium ............................................. 7 1.3.3 Identification .......................................................................................................................... 12 1.3.4 Life cycle ............................................................................................................................... 14 1.3.5 Host-specific toxins ............................................................................................................... 17
1.4 Factors affecting SLB severity ................................................................................................... 18 1.4.1 Temperature ........................................................................................................................... 18 1.4.2 Moisture ................................................................................................................................. 19 1.4.3 Other environmental factors .................................................................................................. 20
1.5 Management of Stemphylium leaf blight ................................................................................... 21 1.5.1 Cultural management methods .............................................................................................. 22 1.5.2 Fungicides .............................................................................................................................. 23 1.5.3 Biocontrol agents ................................................................................................................... 24 1.5.4 Genetic resistance .................................................................................................................. 25 1.5.5 Activated resistance ............................................................................................................... 26 1.5.6 Forecasting models ................................................................................................................ 27
1.6 Fungicide insensitivity ............................................................................................................... 28 1.6.1 Fungicide insensitivity in Stemphylium vesicarium ............................................................... 30
1.7 Hypothesis and Objectives ......................................................................................................... 36
Chapter 2 Epidemiology and life cycle of Stemphylium vesicarium ..................................... 38 2.1 Introduction ................................................................................................................................ 38 2.2 Materials and methods ............................................................................................................... 40
2.2.1 Sample preparation and growth media .................................................................................. 40 2.2.2 Pathogen identification .......................................................................................................... 41 2.2.3 Sexual reproduction and overwintering ................................................................................. 46 2.2.4 Weeds as alternative hosts ..................................................................................................... 48 2.2.5 Stemphylium vesicarium as a seed-borne pathogen ............................................................... 50 2.2.6 Data analysis .......................................................................................................................... 52
2.3 Results ........................................................................................................................................ 53 2.3.1 Pathogen confirmation ........................................................................................................... 53 2.3.2 Over-winter survival .............................................................................................................. 54 2.3.3 Sexual reproduction ............................................................................................................... 56 2.3.4 Weeds as alternative hosts ..................................................................................................... 59
vi
2.3.5 Stemphylium vesicarium as a seed-borne pathogen ............................................................... 62 2.4 Discussion .................................................................................................................................. 66
Chapter 3 Scheduling fungicide applications for management of Stemphylium leaf blight of onion 71
3.1 Introduction ................................................................................................................................ 71 3.2 Materials and methods ............................................................................................................... 74
3.2.1 Plant material ......................................................................................................................... 74 3.2.2 Fungicide spray programs ...................................................................................................... 75 3.2.3 Disease forecasting models .................................................................................................... 77 3.2.4 Disease and yield assessment ................................................................................................ 78 3.2.5 Data analysis .......................................................................................................................... 79
3.3 Results ........................................................................................................................................ 79 3.3.1 2018 Field season .................................................................................................................. 79 3.3.2 2019 Field season .................................................................................................................. 82 3.3.3 Pooled years ........................................................................................................................... 83
3.4 Discussion .................................................................................................................................. 89
Chapter 4 Fungicide Sensitivity of Stemphylium vesicarium isolates ................................... 94 4.1 Introduction ................................................................................................................................ 94 4.2 Materials and methods ............................................................................................................... 99
4.2.1 Isolate collection .................................................................................................................... 99 4.2.2 Determination of discriminatory concentrations ................................................................. 101 4.2.3 Sensitivity assessment – conidial germination .................................................................... 102 4.2.4 Sensitivity assessment – mycelial growth ........................................................................... 102 4.2.5 Impact of SHAM ................................................................................................................. 103 4.2.6 Data analysis ........................................................................................................................ 103
4.3 Results ...................................................................................................................................... 104 4.3.1 Azoxystrobin ........................................................................................................................ 104 4.3.2 Pyrimethanil ......................................................................................................................... 107 4.3.3 Difenoconazole .................................................................................................................... 110 4.3.4 Fluopyram ............................................................................................................................ 111 4.3.5 Insensitivity to more than one active ingredients ................................................................ 114 4.3.6 In vitro mycelial growth fitness cost .................................................................................... 114
4.4 Discussion ................................................................................................................................ 115
Chapter 5 Factors affecting epidemics of Stemphylium leaf blight ..................................... 121 5.1 Introduction .............................................................................................................................. 121 5.2 Materials and methods ............................................................................................................. 123
5.2.1 Sporometrics spore sampling ............................................................................................... 123 5.2.2 Bioaerosol collection and DNA extraction .......................................................................... 123 5.2.3 Primer design ....................................................................................................................... 125 5.2.4 Quantitative PCR assay ....................................................................................................... 126 5.2.5 Dilution series to establish qPCR standard curve ................................................................ 126 5.2.6 Rotorod spore sampling ....................................................................................................... 127 5.2.7 Burkard tape sampler ........................................................................................................... 128 5.2.8 Disease assessment .............................................................................................................. 128 5.2.9 Weather data collection ....................................................................................................... 128 5.2.10 Drought study .................................................................................................................. 130 5.2.11 Data analysis .................................................................................................................... 132
5.3 Results ...................................................................................................................................... 135 5.3.1 Quantification of spore samples using Burkard multi-vial sampler and qPCR ................... 135
vii
5.3.2 Comparison of spore sampling methods .............................................................................. 135 5.3.3 SLB severity and spore concentration ................................................................................. 137 5.3.4 Weather variables and air-borne spore concentrations ........................................................ 139 5.3.5 Weather model observations ................................................................................................ 144 5.3.6 Effect of drought .................................................................................................................. 149
5.4 Discussion ................................................................................................................................ 150
Chapter 6 General discussion ............................................................................................... 163 Literature Cited ..................................................................................................................................... 167 Appendices for Chapter 2 ...................................................................................................................... 193 Appendices for Chapter 3 ...................................................................................................................... 198 Appendices for Chapter 4 ...................................................................................................................... 204 Appendixes for Chapter 5 ..................................................................................................................... 213
viii
LIST OF TABLES
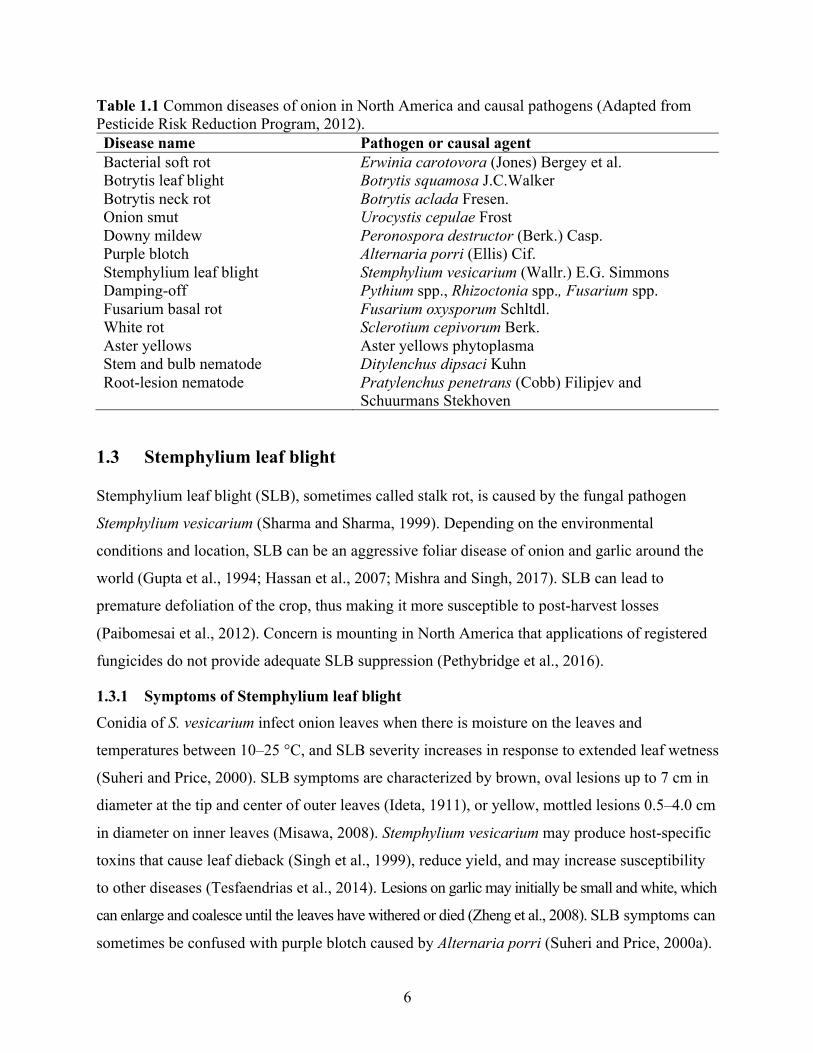
Table 1.1 Common diseases of onion in North America and causal pathogens (Adapted from Pesticide Risk Reduction Program, 2012). .............................................................................. 6
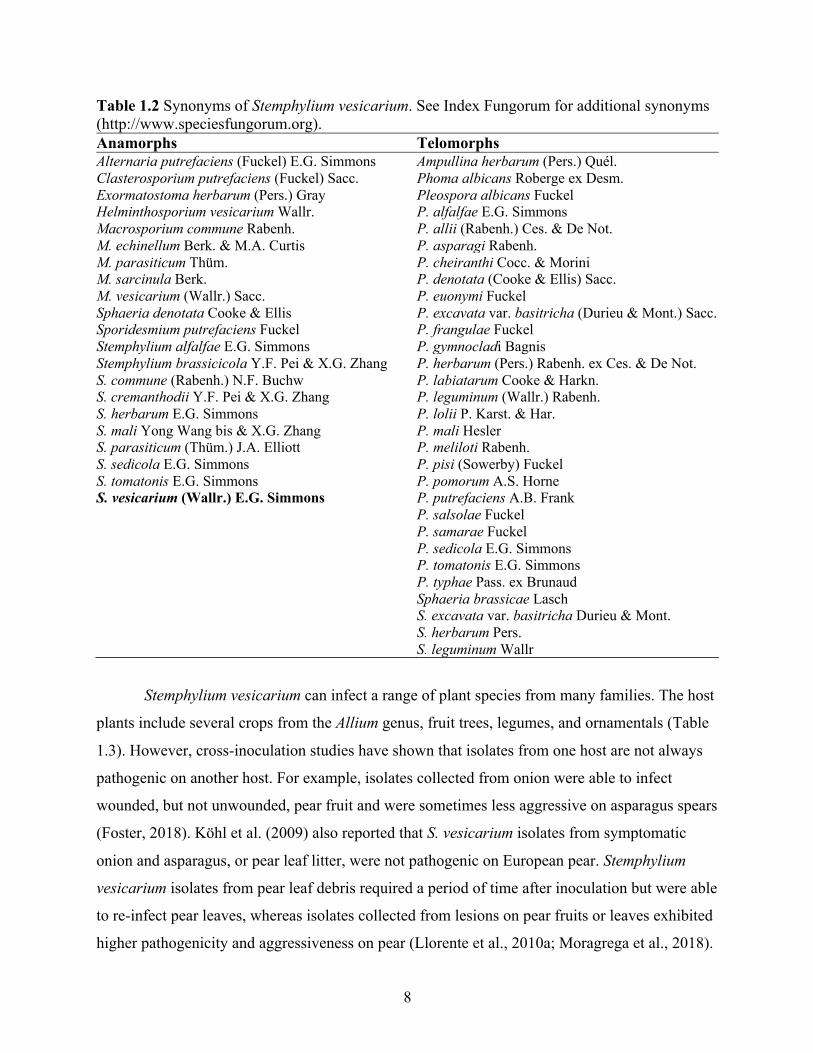
Table 1.2 Synonyms of Stemphylium vesicarium. See Index Fungorum for additional synonyms (http://www.speciesfungorum.org). ......................................................................................... 8
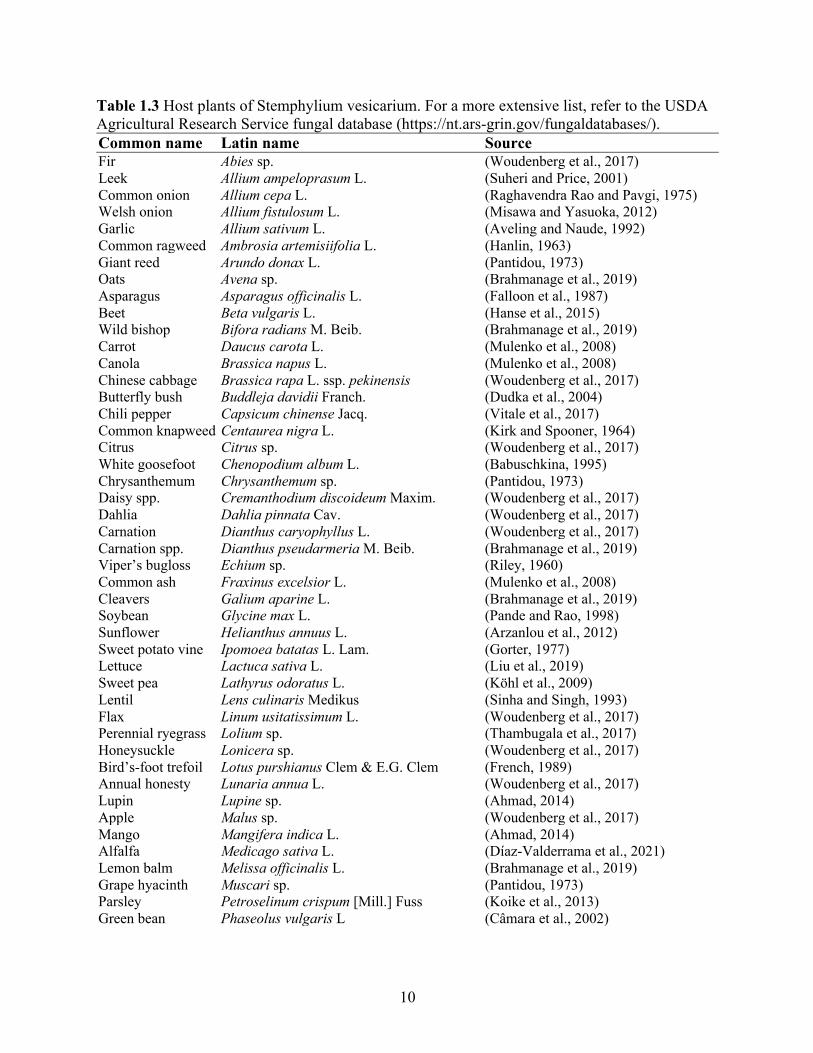
Table 1.3 Host plants of Stemphylium vesicarium. For a more extensive list, refer to the USDA Agricultural Research Service fungal database (https://nt.ars-grin.gov/fungaldatabases/). .. 10
Table 1.4 List of fungicides registered in Canada to manage Stemphylium vesicarium on onion (Health Canada, 2020). .......................................................................................................... 24
Table 2.1 Stemphylium vesicarium isolates, collection years, host plants, and collection sites. ... 42 Table 2.2 Description and sequence of the primers used to confirm the identification of
Stemphylium vesicarium isolates collected in Ontario. ......................................................... 44 Table 2.3 Percentage of weed and onion leaf pieces producing Stemphylium vesicarium colonies
after inoculation and incubation in a controlled environment for 10–20 days. (n = 8). ........ 61 Table 2.4 First reports for Canada or worldwide of common weed species from the Holland
Marsh, Ontario acting as hosts of Stemphylium vesicarium. ................................................. 61 Table 2.5 Observations from onion seeds naturally inoculated in the field, collected in July–
August 2019 (Early) or on 30 August 2019 (End of season). ............................................... 63 Table 2.6 The effect of seed harvested at two time points and subsequent surface sterilization on
recovery of Stemphylium vesicarium colonies from onion seed that was naturally inoculated in the field during production at the Muck Crops Research Station in 2019. ....................... 63
Table 2.7 The effect of seed harvested at two time points on emergence and recovery of Stemphylium vesicarium colonies from the cotyledon and first true leaf of onions grown from seed that was naturally inoculated in the field during production at the Muck Crops Research Station in 2019. ...................................................................................................... 64
Table 3.1 Timing of fungicide application treatments for the fungicide timing field trials on Stemphylium leaf blight of onion at the Muck Crops Research Station, Ontario in 2018 and 2019. Values within brackets indicate the number of foliar fungicide applications each year. ............................................................................................................................................... 76
Table 3.2 Fungicide applications in the fungicide application timing field trials for management of Stemphylium leaf blight of onion at the Holland Marsh, ON. .......................................... 77
Table 3.3 Mean temperature and leaf wetness duration values used in calculating disease severity values (DSV) for the TOMCAST model (Madden et al., 1978). .......................................... 78
Table 3.4 Effect of fungicide applications on Stemphylium leaf blight incidence (%) and severity (disease severity index, DSI, and standardized area under disease progress curve, sAUDPC1) on onion at the Muck Crops Research Station, 2018. ......................................... 80
Table 3.5 Effect of fungicide application on yield and size distribution of onions at the Muck Crops Research, 2018. ........................................................................................................... 81
Table 3.6 Effect of fungicide applications on Stemphylium leaf blight incidence (%) and severity (disease severity index, DSI and standardized area under the disease progress curve, sAUDPC) on onion at the Muck Crops Research Station, 2019. .......................................... 83
Table 3.7 Effect of fungicide application on yield and size distribution of onions at the Muck Crops Research Station, 2019. ............................................................................................... 83
Table 3.8 Correlation (r) between Stemphylium leaf blight severity and yield (total and marketable) for 2 years of field experiments on onion. ......................................................... 84
ix
Table 3.9 Approximate cost of fungicide application programs used to manage SLB in the Holland Marsh, ON in 2018 and 2019. ................................................................................. 88
Table 4.1 Effect of fungicides on Stemphylium leaf blight (disease severity index) of at the Holland Marsh, ON, from 2011–2019 (Stricker et al., 2020). .............................................. 96
Table 4.2. Effect of SHAM at four concentrations of azoxystrobin on mycelial growth of Stemphylium vesicarium relative to unamended media. ...................................................... 105
Table 4.3 Estimates of EC50 values to azoxystrobin calculated for inhibition of conidial germination and mycelial growth of isolates of Stemphylium vesicarium and sensitivity classification to azoxystrobin (S – sensitive, Insen – insensitive) of these isolates. ........... 106
Table 4.4 EC50 values for inhibition of conidial germination and mycelial growth of Stemphylium vesicarium and fungicide sensitivity classification (S – sensitive, Insen – insensitive) based on exposure to selected rates of pyrimethanil on agar medium. ......................................... 108
Table 4.5 EC50 values for inhibition of conidial germination and mycelial growth of Stemphylium vesicarium and fungicide sensitivity classification (S – sensitive, Insen – insensitive) based on exposure to selected rates of difenoconazole-amended agar medium. ........................... 110
Table 4.6 EC50 values for inhibition of conidial germination and mycelial growth of Stemphylium vesicarium and fungicide sensitivity classification (S – sensitive, Insen – insensitive) based on exposure to selected rates of fluopyram on agar medium. ............................................. 112
Table 4.7 Mean mycelial growth rate (mm h1) on non-unamended agar medium of Stemphylium vesicarium isolates characterized as sensitive or insensitive to four fungicide active ingredients. .......................................................................................................................... 115
Table 5.1 Primers and probes used for quantitative PCR on DNA extracted from bioaerosol samples collected using a Burkard volumetric sampler in an onion field at the Holland Marsh, ON. .......................................................................................................................... 126
Table 5.2 Weather variables assessed in modelling air-borne spores of Stemphylium vesicarium trapped in an onion field at the Holland Marsh, ON in 2015, 2016, 2018, 2019, and 2020. ............................................................................................................................................. 130
Table 5.3 Average monthly temperatures and rainfall at the Holland Marsh, Ontario for 2018, 2019, and 2020 relative to the 10-year average. (orange cells higher, blue cells lower). ... 139
Table 5.4 Correlation matrix among weather variables pooled across the growing seasons at the Muck Crops Research Station of 2015, 2016, 2018, 2019, and 2020. ................................ 143
Table 5.5 Model overview, standard error (SE) and summary of stepwise selection. ................ 145
x
LIST OF FIGURES
Figure 1.1 Stemphylium vesicarium A) ascus, B) ascospores, C) conidiophores, and D) conidia (Simmons, 1969). .................................................................................................................. 12
Figure 1.2 Symptoms of Stemphylium leaf blight: A) dieback of the oldest leaves, B) oval-shaped lesions with dark areas of sporulation, leading to tip dieback, and C) chlorotic regions around lesion on scape, leading to collapse and termination of the flower. ............. 16
Figure 1.3 Possible life cycle of Stemphylium vesicarium on onion. ............................................ 17 Figure 2.1 Gel electrophoresis of seven Stemphylium vesicarium isolates, one Plasmodiophora
brassicae isolate and one Colletotrichum fioriniae isolate (in that order) using primers to amplify the: A) internal transcribed spacer; B) glyceraldehyde 3-phosphate dehydrogenase; C) translation elongation factor EF-1 alpha; and D) cytochrome b regions. Ladders on the right indicate regions of 100 bp–10 Kb. ................................................................................ 45
Figure 2.2 Sample preparation and deployment in a study to assess survival of Stemphylium vesicarium on onion leaves: A) fabric bag containing one onion leaf infected with S. vesicarium and a Falcon tube containing a second inoculated leaf, and B) one bag buried in a plastic pot (left) and one bag pinned to the soil surface (right). ..................................... 47
Figure 2.3 Weedy plant species assessed as alternative hosts for Stemphylium vesicarium that are common near the Holland Marsh in southern Ontario: A) marshcress, B) yellow nutsedge, C) redroot pigweed, and D) sow thistle. ................................................................................ 49
Figure 2.4 Conidia from isolates of Stemphylium vesicarium collected from symptomatic onion plants in Ontario. ................................................................................................................... 53
Figure 2.5 Percent of inoculated onion leaf samples overwintered at the Muck Crops Research station in the winter of 2018 on the soil surface or buried in soil, then collected at five sampling dates, that produced Stemphylium vesicarium colonies when cultured on V8 agar. Error bars represent standard error of five replicates. ........................................................... 55
Figure 2.6 Onion leaves infected with Stemphylium vesicarium after 7 months of overwintering treatment A) at the soil surface, or B) buried 10 cm below the surface in a muck soil field. Five pairs of samples are pictured. In each pair, the leaf was either kept dry (Dry) in a sealed plastic container or exposed to the wet environment (Wet) within a polyester fabric bag. ........................................................................................................................................ 56
Figure 2.7 Asci containing ascospores protruding from a crushed pseudothecia of Stemphylium vesicarium collected from an overwintered onion leaf. ........................................................ 57
Figure 2.8 Germinated Stemphylium vesicarium ascospores and associated mycelium on a fresh onion leaf, visualised by peeling off the epidermis and staining the mycelium from germinated spores with lactophenol cotton blue. .................................................................. 58
Figure 2.9 Stemphylium vesicarium pseudothecia produced on five onion leaves collected at five sampling dates from the soil surface or buried underground, which were kept dry in a tube or exposed to environmental moisture in a fabric bag. Stars above line indicate how many of the samples also produced ascospores in surface-wet treatment. .......................................... 59
Figure 2.10 Purslane A) before inoculation and B) after inoculation with Stemphylium vesicarium, showing dark sunken circular or oval lesions (red arrows). .............................. 60
Figure 2.11 Effect of temperature and duration of heat treatment on A) onion seed germination, B) seedling emergence, C) total number of fungal colonies produced from seeds, and D) on the first leaf and cotyledon on V8 agar from onion seed grown in a controlled environment.
xi
* Indicates significant difference from the control treatment, based on Dunnett’s test at P < 0.05. ................................................................................................................................ 65
Figure 3.1 A) Poor emergence in penflufen-treated seed compared to B) the control treatment on onion in a field trial at the Muck Crops Research Station in 2018. ....................................... 81
Figure 3.2 Effect of seed treatments and foliar fungicides on mean Stemphylium leaf blight incidence in field trials at the Holland Marsh, ON data from 2018 and 2019 pooled. Values at the base of each bar indicate the number of foliar fungicide applications. Bars topped with the same letters do not differ based on Tukey Test at P < 0.05, and the capped lines represent standard error. ........................................................................................................ 85
Figure 3.3 Fungicide timing trials exhibiting low disease severity on A) 7 August 2018 and B) 15 August 2019 at the Muck Crops Research Station. ............................................................... 86
Figure 3.4 Stemphylium leaf blight symptoms in the Holland Marsh, ON: A) Chlorotic streaks along the entire edge of oldest leaf with a lesion near the base, B) tip dieback with a lesion in the midst of the chlorotic region, C) leaf dieback and twisting with a brown region of sporulation, D) chlorotic streak on one edge of leaf with sunken spindle-shaped lesions, E) diffuse chlorosis of entire leaf with streaks of brown sporulating areas, F) tip dieback with oval-shaped lesion, and G) tip dieback and darkening (‘dirty tips’) with oval-shaped lesion with concentric rings of sporulation. ..................................................................................... 87
Figure 4.1. Variable germination of conidia of Stemphylium vesicarium isolate GB7_3 on media amended with 100 µg a.i. mL-1 pyrimethanil and stained with lactophenol cotton blue. ... 109
Figure 4.2 Germination of conidia of Stemphylium vesicarium isolate EO9 conidia stained with lactophenol cotton blue A) on media amended with 1000 µg a.i. mL-1 difenoconazole compared to B) the unamended control. .............................................................................. 111
Figure 4.3 Conidia of Stemphylium vesicarium A) insensitive isolate KG07 and B) sensitive isolate MS11 PDA media amended with 100 µg a.i. mL-1 fluopyram. ............................... 113
Figure 5.1 A Spornado bioaerosol collection unit located adjacent to a newly planted onion field at the Muck Crops Research Station in 2020 (photo courtesy of Dennis Van Dyk). .......... 123
Figure 5.2 The Burkard multi-vial cyclone sampler A) in a field of seedling onion, and B) air is funnelled through the slotted opening (red arrow) by a battery-operated vacuum and bioaerosol is deposited into microcentrifuge tubes (yellow arrow). ................................... 124
Figure 5.3 The automatic weather station at the Muck Crops Research Station: A) entire unit, B) rain gauge, C) digital data logger and D) leaf wetness sensors. .......................................... 129
Figure 5.4 Scatterplot of rank analysis of spore estimates from the Burkard using cytB qPCR and Sporometrics Spornado using ITS qPCR sampling methods for samples collected on the same day within an onion field in the Holland Marsh in 2020. .......................................... 136
Figure 5.5 Stemphylium leaf blight (SLB) incidence and severity plotted with cytB qPCR estimates of air-borne spore quantity in 2018–2020. Extreme spore values at the top of the graph are (left to right): 2018) 2967, 2254, 7102, 4492, 25536, 2348, 2620, 6838, 62488, 59287; 2019) 2317; 2020) 4957, 32773, 4455. ................................................................... 138
Figure 5.6 Scatterplots of daily air temperature, rainfall, and estimates of air-borne spore quantity of Stemphylium vesicarium based on cytB qPCR in the Holland Marsh in 2018, 2019, and 2020. Extreme spore values at the top of the graph left to right, are: 2018) 2967, 2254, 7102, 4492, 25536, 2348, 2620, 6838, 62488, 59287; 2019) 2317; 2020) 4957, 32773, 4455. ... 141
Figure 5.7 Spore prediction model versus actual spore concentrations (Burkard tape spore counts) and Stemphylium leaf blight (SLB) in 2015 and 2016 (data from Tayviah 2017). 147
xii
Figure 5.8 Spore prediction model versus actual spore concentrations (adjusted cytB qPCR estimates) and Stemphylium leaf blight (SLB) in 2018, 2019, and 2020. Blue arrow indicates approximate date when lodging began. ................................................................ 148
Figure 5.9 Chlorosis of onion plants subjected to ‘normal’ watering or ‘drought’ conditions, inoculated with Stemphylium vesicarium or mock inoculated at 7-, 10-, 14-, and 18-days post inoculation in a controlled environment. Values topped with the same letter do not differ based on Tukey’s HSD at P < 0.05. Capped lines represent standard error. ............. 150
xiii
LIST OF APPENDICES
Appendix 2.1 Layout of the trial to examine survival of Stemphylium vesicarium on onion leaves overwinter at the Muck Crops Research Station. Paired ‘wet’ and ‘dry’ samples were pinned to the soil surface (S) or buried (B). The study was arranged in five blocks, one for each monthly sampling date. ....................................................................................................... 193
Appendix 2.2 Analysis of variance for alternative weed host assessment of Stemphylium vesicarium. ........................................................................................................................... 194
Appendix 2.3 Analysis of variance for alternative weed host assessment of Stemphylium vesicarium – sorted by surface sterilization. ....................................................................... 195
Appendix 2.4 Analysis of variance for production Stemphylium vesicarium colonies by onion seeds naturally inoculated and collected in the Holland Marsh, ON. .................................. 196
Appendix 2.5 Analysis of variance for germination of onion seeds naturally inoculated with Stemphylium vesicarium, collected in the Holland Marsh, ON. .......................................... 196
Appendix 2.6 Analysis of variance for fungal infestation of onion seeds collected in the Holland Marsh, ON after heat treatments. ........................................................................................ 197
Appendix 2.7 Analysis of variance for germination on Petri dishes of onion seeds collected in the Holland Marsh, ON after heat treatments. ........................................................................... 197
Appendix 2.8 Analysis of variance for emergence of onion seedlings in a controlled environment after heat treatments. ........................................................................................................... 197
Appendix 3.1 Field diagram and randomized complete block design for Stemphylium leaf blight fungicide timing field trials. ................................................................................................ 198
Appendix 3.2 Restricted maximum likelihood covariate parameter estimates for Stemphylium leaf blight (SLB) in fungicide timing trails in 2018 ............................................................ 199
Appendix 3.3 Restricted maximum likelihood covariate parameter estimates for Stemphylium leaf blight (SLB) in fungicide timing trails in 2018 ............................................................ 200
Appendix 3.4 Restricted maximum likelihood covariate parameter estimates for onion yield in 2018. .................................................................................................................................... 201
Appendix 3.5 Restricted maximum likelihood covariate parameter estimates for onion yield in 2019. .................................................................................................................................... 202
Appendix 3.6 Restricted maximum likelihood covariate parameter estimates for end of season in-field DSI assessments for treatments in both 2018 and 2019. ............................................. 203
Appendix 4.1 Fungicide-amended media recipes. ...................................................................... 205 Appendix 4.2 Geographical origin, host plant and year collected of isolates of Stemphylium
vesicarium from Ontario tested for sensitivity to the fungicides azoxystrobin and pyrimethanil. Phenotypes were classified as sensitive (S, inhibition at 5 µg a.i./mL), insensitive (Insen, no inhibition at 5 µg), or highly insensitive (Insen+, no inhibition at 100 µg a.i./mL). .......................................................................................................................... 206
Appendix 4.3 Example of the Probit procedure for EC50 of Stemphylium vesicarium. .............. 210 Appendix 4.4 Mean mycelial growth of Stemphylium vesicarium isolated characterized as
sensitive or insensitive to four fungicide active ingredients. .............................................. 211 Appendix 4.5 Restricted maximum likelihood covariate parameter estimates for fitness (assessed
as mycelial growth rate) for isolates sensitive and insensitive to azoxystrobin, pyrimethanil, difenoconazole, and fluopyram fungicides. ......................................................................... 212
Appendix 5.1 Relationship between QIAxpert spectrofluorometry and qPCR spore estimates. 213
xiv
Appendix 5.2 Normality of qPCR with three primer sets (TEf-A, cytB, and ITS) and QIAxpert data with and without extreme outliers. .............................................................................. 214
Appendix 5.3 Statistical analysis of qPCR analysis among reactions and between primer sets . 215 Appendix 5.4 Effect of run on spore estimates by qPCR for three primers sorted by year. ....... 216 Appendix 5.5 Relationships between three primer sets amplifying different gene regions of
Stemphylium vesicarium using a conidia suspension. ......................................................... 217 Appendix 5.6 Relationship between cytB qPCR, Sporometrics and Rotorod methods for
estimating air-borne Stemphylium vesicarium spores. ........................................................ 218 Appendix 5.7 Results from the REG procedure for stepwise regression between Stemphylium
vesicarium spore values and weather variables. .................................................................. 219 Appendix 5.8 Results from the LOGISTIC procedure for cumulative log regression between
Stemphylium vesicarium spore values and weather variables ............................................. 221 Appendix 5.9 Results from the HPSLIT procedure for regression tree analysis of Stemphylium
vesicarium spore values and weather variables ................................................................... 223 Appendix 5.10 Effect of drought (trt) and inoculation with Stemphylium vesicarium (inoc) for
two repeated experiments (exp) under controlled environmental conditions ...................... 224 Appendix 5.11 Effect of drought on percent chlorosis regression over time. ............................. 226 Appendix 5.12 Simplified spore prediction model overview and analysis of variance .............. 227 Appendix 5.13 qPCR CT values, efficiency, and R2 values for DNA of Stemphylium vesicarium
extracted from bioaerosol samples using three gene regions (TEf-A, cytB, ITS) ................ 228
xv
LIST OF ABBREVIATIONS AND ACRONYMS
a.i – active ingredient AOX – alternative oxidase AP – anilinopyrimidine AUDPC – area under disease progress curve BLAST – Basic Local Alignment Search Tool BSP – brown spot of pear CDSI – cumulative disease severity values cytB – cytochrome b DMI – demethylation inhibitors DSI – disease severity index DSV – disease severity value EC50 – effective fungicide concentration that caused 50% inhibition of growth or germination FRAC – Fungicide Resistance Action Committee gapdh – glyceraldehyde-3-phosphate dehydrogenase GSWC – gravimetric soil water content HCl – hydrochloride HHK – hybrid histidine kinase HK – histidine kinase HST – host specific toxins IPM – integrated pest management ISR – induced systemic resistance
ITS – internal transcribed spacer MAP – mitogen-activated protein MCRS – Muck Crops Research Station PDA – potato dextrose agar ATP – adenosine triphosphate PP – phenylpyrrole fungicides QoI – quinone outside inhibitor qPCR – quantitative polymerase chain reaction SAR – systemic acquired resistance sAUDPC– standardized area under disease progress curve sdh – succinate dehydrogenase complex iron sulfur subunit (sdhA, sdhB, sdhC, sdhD) SDHI- succinate dehydrogenase inhibitor SHAM – salicylhydroxamic acid SLB – Stemphylium leaf blight TEf-A – translation elongation factor 1α UV – ultraviolet VPD – vapour pressure deficit vmaA-vpsA – intergenic spacer between the vacuolar membrane ATPase catalytic subunit A gene and the vacuolar protein sorting-associated protein VSWC – volumetric soil water content
1
Chapter 1 Literature review
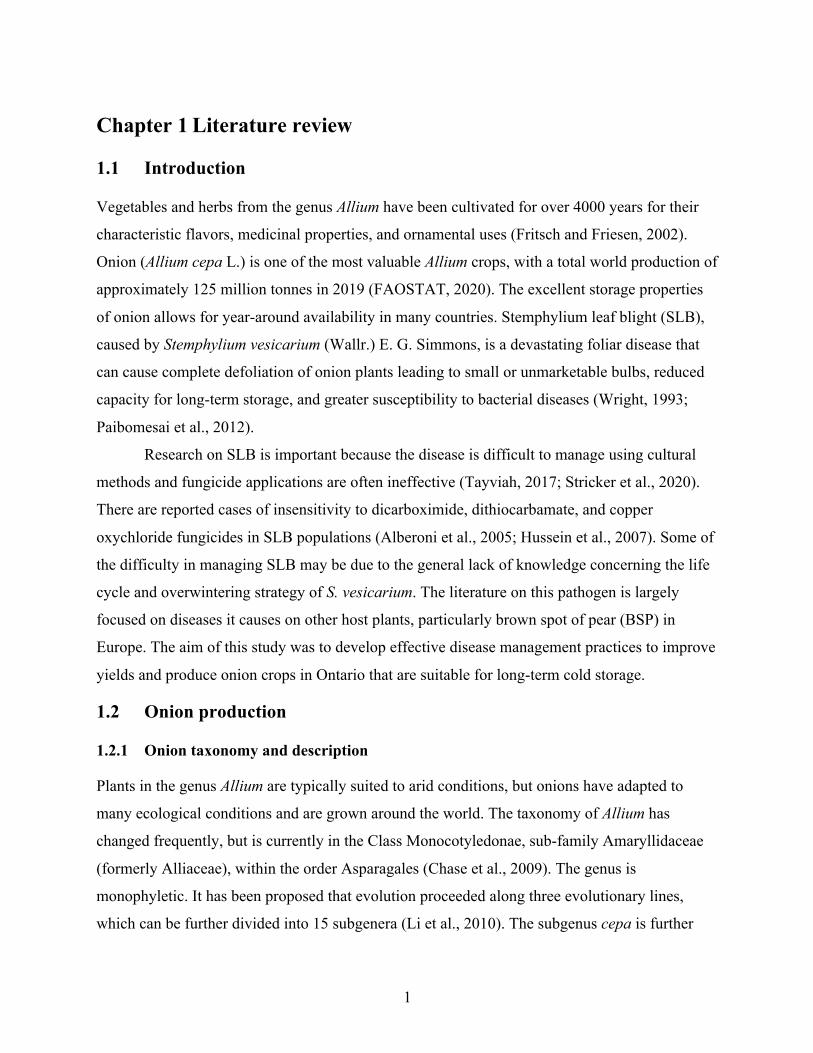
1.1 Introduction
Vegetables and herbs from the genus Allium have been cultivated for over 4000 years for their
characteristic flavors, medicinal properties, and ornamental uses (Fritsch and Friesen, 2002).
Onion (Allium cepa L.) is one of the most valuable Allium crops, with a total world production of
approximately 125 million tonnes in 2019 (FAOSTAT, 2020). The excellent storage properties
of onion allows for year-around availability in many countries. Stemphylium leaf blight (SLB),
caused by Stemphylium vesicarium (Wallr.) E. G. Simmons, is a devastating foliar disease that
can cause complete defoliation of onion plants leading to small or unmarketable bulbs, reduced
capacity for long-term storage, and greater susceptibility to bacterial diseases (Wright, 1993;
Paibomesai et al., 2012).
Research on SLB is important because the disease is difficult to manage using cultural
methods and fungicide applications are often ineffective (Tayviah, 2017; Stricker et al., 2020).
There are reported cases of insensitivity to dicarboximide, dithiocarbamate, and copper
oxychloride fungicides in SLB populations (Alberoni et al., 2005; Hussein et al., 2007). Some of
the difficulty in managing SLB may be due to the general lack of knowledge concerning the life
cycle and overwintering strategy of S. vesicarium. The literature on this pathogen is largely
focused on diseases it causes on other host plants, particularly brown spot of pear (BSP) in
Europe. The aim of this study was to develop effective disease management practices to improve
yields and produce onion crops in Ontario that are suitable for long-term cold storage.
1.2 Onion production
1.2.1 Onion taxonomy and description
Plants in the genus Allium are typically suited to arid conditions, but onions have adapted to
many ecological conditions and are grown around the world. The taxonomy of Allium has
changed frequently, but is currently in the Class Monocotyledonae, sub-family Amaryllidaceae
(formerly Alliaceae), within the order Asparagales (Chase et al., 2009). The genus is
monophyletic. It has been proposed that evolution proceeded along three evolutionary lines,
which can be further divided into 15 subgenera (Li et al., 2010). The subgenus cepa is further
2
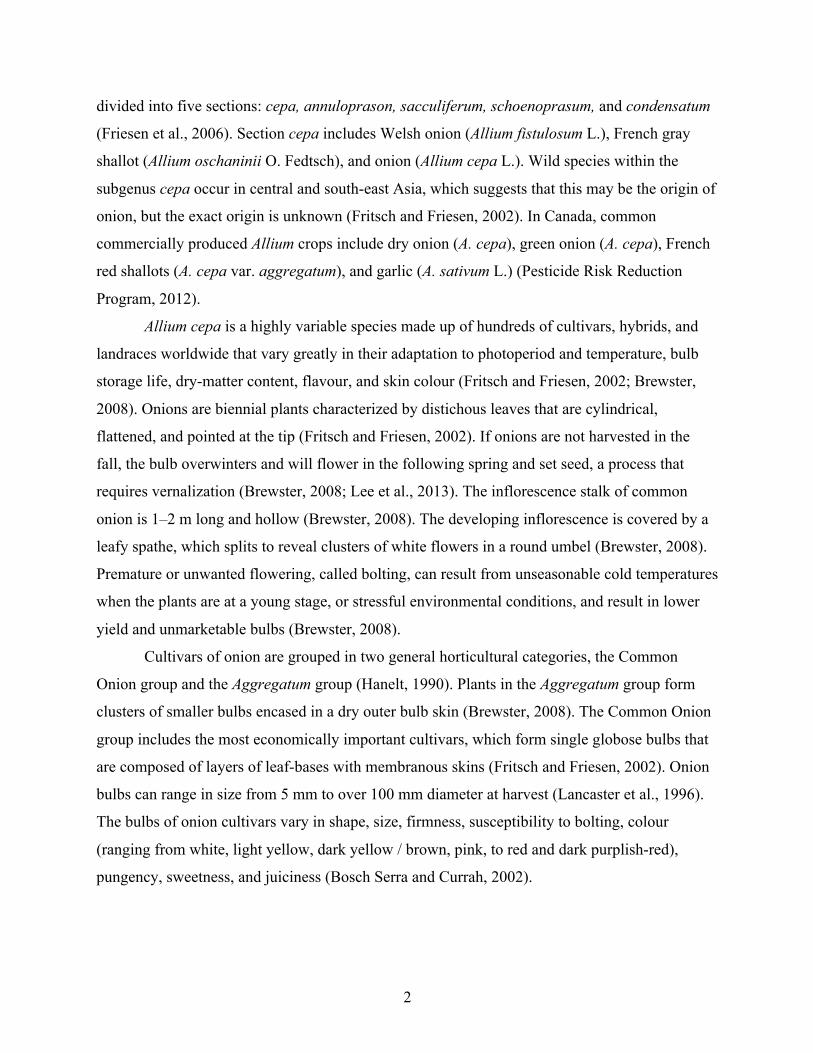
divided into five sections: cepa, annuloprason, sacculiferum, schoenoprasum, and condensatum
(Friesen et al., 2006). Section cepa includes Welsh onion (Allium fistulosum L.), French gray
shallot (Allium oschaninii O. Fedtsch), and onion (Allium cepa L.). Wild species within the
subgenus cepa occur in central and south-east Asia, which suggests that this may be the origin of
onion, but the exact origin is unknown (Fritsch and Friesen, 2002). In Canada, common
commercially produced Allium crops include dry onion (A. cepa), green onion (A. cepa), French
red shallots (A. cepa var. aggregatum), and garlic (A. sativum L.) (Pesticide Risk Reduction
Program, 2012).
Allium cepa is a highly variable species made up of hundreds of cultivars, hybrids, and
landraces worldwide that vary greatly in their adaptation to photoperiod and temperature, bulb
storage life, dry-matter content, flavour, and skin colour (Fritsch and Friesen, 2002; Brewster,
2008). Onions are biennial plants characterized by distichous leaves that are cylindrical,
flattened, and pointed at the tip (Fritsch and Friesen, 2002). If onions are not harvested in the
fall, the bulb overwinters and will flower in the following spring and set seed, a process that
requires vernalization (Brewster, 2008; Lee et al., 2013). The inflorescence stalk of common
onion is 1–2 m long and hollow (Brewster, 2008). The developing inflorescence is covered by a
leafy spathe, which splits to reveal clusters of white flowers in a round umbel (Brewster, 2008).
Premature or unwanted flowering, called bolting, can result from unseasonable cold temperatures
when the plants are at a young stage, or stressful environmental conditions, and result in lower
yield and unmarketable bulbs (Brewster, 2008).
Cultivars of onion are grouped in two general horticultural categories, the Common
Onion group and the Aggregatum group (Hanelt, 1990). Plants in the Aggregatum group form
clusters of smaller bulbs encased in a dry outer bulb skin (Brewster, 2008). The Common Onion
group includes the most economically important cultivars, which form single globose bulbs that
are composed of layers of leaf-bases with membranous skins (Fritsch and Friesen, 2002). Onion
bulbs can range in size from 5 mm to over 100 mm diameter at harvest (Lancaster et al., 1996).
The bulbs of onion cultivars vary in shape, size, firmness, susceptibility to bolting, colour
(ranging from white, light yellow, dark yellow / brown, pink, to red and dark purplish-red),
pungency, sweetness, and juiciness (Bosch Serra and Currah, 2002).
3
1.2.2 Onion production and cultivation
Onion, also known as the common onion, dry onion, or bulb onion, is valued for its aromatic,
flavourful bulbs. In 2019, onion represented 8.8% of the total world vegetable production
quantity and 8.7% of area harvested (FAOSTAT, 2020). China and India are typically the two
greatest producers of onion, totalling over 22 million metric tonnes (T) of dry onion each
(FAOSTAT, 2020). The average yield of onion is 23 T ha-1, and countries with the highest yield
per hectare were Guyana, Korea, and the USA, with 60–77 T ha-1 in 2019 (FAOSTAT, 2020).
In Canada, approximately 5,700 ha of onion are planted, yielding a total production of
250,000 T (Statistics Canada, 2020). The farm gate value of the onion industry in Canada is
$86.4–113.5 million. Most onions and shallots grown in Canada are sold domestically in the
fresh market, and a small proportion is exported (Pesticide Risk Reduction Program, 2012). In
2016–2020, Ontario produced an average of 102,604 T of dry onion, which represents 40% of
national production, with an average yield of 42,900 kg ha-1 (Statistics Canada, 2020). Growers
in Ontario mainly produce yellow globe onion and some red onion (McDonald et al., 2016b).
The current research program focused on yellow onions grown in the Holland Marsh, an area in
Ontario that is characterized by organic muck soil (50–75% organic matter, pH 5.5–6.5), where
the majority of Ontario onion crops are produced.
There are several methods that can be used to establish the onion crop: direct sowing,
transplants, or sets (Brewster, 2008). In most onion-growing regions of Canada, onion seed is
sown using a pneumatic precision seeder at 35–45 seeds per m of row at 2 cm depth (Brewster,
2008; Pesticide Risk Reduction Program, 2012). Transplanting is less cost-effective, but results
in a more uniform crop with desirable spacing compared to direct seeding, and can be used to
lengthen the growing season (Brewster, 2008). Bare-root transplanting involves planting seeds in
nursery beds at high densities, removing the plants at the 3- to 4-leaf stage from the soil,
trimming the roots and shoots, and transplanting the plants to the field (Bosch Serra and Currah,
2002). Plug transplants are established as single- or multiple-seeded cells grown in greenhouses
or under rain shelters and the entire plug, consisting of plant and growth media, is transplanted to
the field (Bosch Serra and Currah, 2002). The third option is to plant using sets; sets are initially
seeded at a high density and harvested when the bulbs are less than 25 mm in diameter, for
planting in the following growing season (Brewster, 2008). Onions planted as sets can grow very
4
quickly, but are prone to bolting and can transmit pests and diseases (Bosch Serra and Currah,
2002; Brewster, 2008).
Onions destined for long-term storage are commonly sprayed with maleic hydrazide, a
growth-regulator that disrupts cell division and inhibits bolting in storage (Isenberg et al., 1974).
This product is applied to green onion leaves when the onions begin to lodge, and it is
translocated to the bulb (Brewster, 2008). Onions should have 5-8 green leaves in order to absorb
maleic hydrazide (Ilić et al., 2011; Arysta LifeScience Canada, 2020).
1.2.3 Growing conditions
The cultivation and distribution of onions are influenced by photoperiod length, light intensity
and quality, and temperature (Khokhar, 2017). The optimal temperature for onion seed
germination is 25 °C, but can occur between 10–35 °C (Maynard and Hochmuth, 2006). The
ideal temperatures for onions are 15–20 °C during early growth and 20–27 °C for bulb
development (Khokhar, 2017). The temperature must exceed 12 °C for optimal bulb
development, and growth rates decrease at temperatures over 32 °C (Brewster, 2008). However,
if the day length is inappropriate for the cultivar, no bulbing will occur even at ideal
temperatures (Khokhar, 2008). Seed companies often classify onion cultivars based on the
minimum day length required to initiate bulb development into ‘short-day’, ‘intermediate-day’,
‘long-day’, and ‘very long-day’ types (Brewster, 2008). Short-day onions require a minimum of
11 h of light, intermediate-day types require greater than 13 h, and long-day types initiate bulbs
only when day length exceeds 16 h (Brewster, 2008). Growers must select the appropriate type
of onion cultivar to grow based on their latitude, altitude, growing season, and consumer market.
Commonly used commercial cultivars grown in the Holland Marsh are ‘long-day’ and mature
92–116 days after seeding (McDonald et al., 2016a).
In the Holland Marsh, it is recommended to seed barley as a nurse crop to decrease wind
erosion in the early spring, followed by the application of a slow-kill selective herbicide 3 to 4
weeks after barley emergence to kill the barley once the onion crop has established to prevent
competition effects (Souza Machado and Ali, 1992).
Onions can be cultivated in many types of soils, so long as they are fertile and well-
drained (Pesticide Risk Reduction Program, 2012). The soil should be homogeneous, free of
debris and stones, not prone to compaction, and have a pH in the range of 5.0–8.4 (Bosch Serra
and Currah, 2002; Pesticide Risk Reduction Program, 2012). Onions are susceptible to drought
5
stress because the roots are relatively shallow, with main roots reaching only about 18 cm deep,
so water that has moved below 76 cm from the soil surface is inaccessible to the crop in mineral
soil (Drinkwater and Janes, 1955). However, mature onions can have root systems in sandy loam
mineral soil reaching as deep as 99 cm if the soil is not compacted (Weaver and Bruner, 1927).
The soil in the Holland Marsh is classified as muck soil, also known as a sapric soil,
which is a type of histosoil that is high in decomposed organic matter. Muck soil typically occurs
in a topographical depression, and is characterized by a dark brown or black surface layer
(Hoffman and Richards, 1955). The Holland Marsh was a marsh that was first drained in 1925,
and is now a hub for vegetable production (Hoffman and Richards, 1955). The soil in this region
was relatively high in nitrogen but low in potassium, phosphorus, copper, boron, and manganese
when it was first drained (Hoffman and Richards, 1955). The soil pH may be slightly acidic to
slightly alkaline, the drainage is poor, and the area is prone to flooding in extremely wet years
(Hoffman and Richards, 1955). The pH near the Muck Crops Research Station in the Holland
Marsh is approximately 6.5 (Al-Daoud et al., 2020). An extensive tile drainage network has been
put into place in the Holland Marsh to improve drainage (Grenon et al., 2021).
1.2.4 Foliar diseases of onion
All plants are susceptible to pathogen attack and unfavourable environmental conditions that
may cause disease-like symptoms. A disease is an abnormality in appearance or function, caused
by the invasion by an infectious agent or pathogen (Agrios, 2005). There are many diseases and
disorders of onions in North America caused by fungi, bacteria, nematodes, viruses, and abiotic
factors (Table 1.1). Commercial onion cultivars differ in their resistance or tolerance to pests,
diseases, and environmental conditions (Brewster, 2008). Environmental conditions such as hail,
rain, and ozone can damage leaves and increase susceptibility to foliar diseases (Pesticide Risk
Reduction Program, 2012). Common foliar diseases of onion in Ontario include Botrytis leaf
blight, downy mildew, and purple blotch (Chaput, 1995). Stemphylium leaf blight (SLB) is a
relatively new disease that was first observed in Ontario in 2008, and is now a major concern for
onion production (Tesfaendrias et al., 2014). SLB causes leaf dieback, which affects the uptake
of maleic hydrazide into onion bulbs and so could affect the post-harvest storage properties of
the crop (McDonald et al., 2016b).
6
Table 1.1 Common diseases of onion in North America and causal pathogens (Adapted from Pesticide Risk Reduction Program, 2012). Disease name Pathogen or causal agent Bacterial soft rot Botrytis leaf blight Botrytis neck rot Onion smut Downy mildew Purple blotch Stemphylium leaf blight Damping-off Fusarium basal rot White rot Aster yellows Stem and bulb nematode Root-lesion nematode
Erwinia carotovora (Jones) Bergey et al. Botrytis squamosa J.C.Walker Botrytis aclada Fresen. Urocystis cepulae Frost Peronospora destructor (Berk.) Casp. Alternaria porri (Ellis) Cif. Stemphylium vesicarium (Wallr.) E.G. Simmons Pythium spp., Rhizoctonia spp., Fusarium spp. Fusarium oxysporum Schltdl. Sclerotium cepivorum Berk. Aster yellows phytoplasma Ditylenchus dipsaci Kuhn Pratylenchus penetrans (Cobb) Filipjev and Schuurmans Stekhoven
1.3 Stemphylium leaf blight
Stemphylium leaf blight (SLB), sometimes called stalk rot, is caused by the fungal pathogen
Stemphylium vesicarium (Sharma and Sharma, 1999). Depending on the environmental
conditions and location, SLB can be an aggressive foliar disease of onion and garlic around the
world (Gupta et al., 1994; Hassan et al., 2007; Mishra and Singh, 2017). SLB can lead to
premature defoliation of the crop, thus making it more susceptible to post-harvest losses
(Paibomesai et al., 2012). Concern is mounting in North America that applications of registered
fungicides do not provide adequate SLB suppression (Pethybridge et al., 2016).
1.3.1 Symptoms of Stemphylium leaf blight
Conidia of S. vesicarium infect onion leaves when there is moisture on the leaves and
temperatures between 10–25 °C, and SLB severity increases in response to extended leaf wetness
(Suheri and Price, 2000). SLB symptoms are characterized by brown, oval lesions up to 7 cm in
diameter at the tip and center of outer leaves (Ideta, 1911), or yellow, mottled lesions 0.5–4.0 cm
in diameter on inner leaves (Misawa, 2008). Stemphylium vesicarium may produce host-specific
toxins that cause leaf dieback (Singh et al., 1999), reduce yield, and may increase susceptibility
to other diseases (Tesfaendrias et al., 2014). Lesions on garlic may initially be small and white, which
can enlarge and coalesce until the leaves have withered or died (Zheng et al., 2008). SLB symptoms can
sometimes be confused with purple blotch caused by Alternaria porri (Suheri and Price, 2000a).
7
A closely related species, Stemphylium solani G.F. Weber, also causes symptoms similar to SLB
on garlic in China (Zheng et al., 2008).
Symptoms on asparagus are elliptical, slightly sunken lesions (0.8–1.6 mm) are formed
on the spears and ferns (Falloon et al., 1984). The spots are initially purple but may become tan
in the centre with a purple edge as the disease progresses. On pear, necrotic brown spots (2.5–10
mm) develop on pear fruit, leaves, and twigs (Moragrega et al., 2018). Diseased asparagus spears
and pear fruits are unmarketable due to cosmetic damage. This pathogen is prevalent on
asparagus in Ontario but has not yet been reported on pear in North America (Foster, 2018).
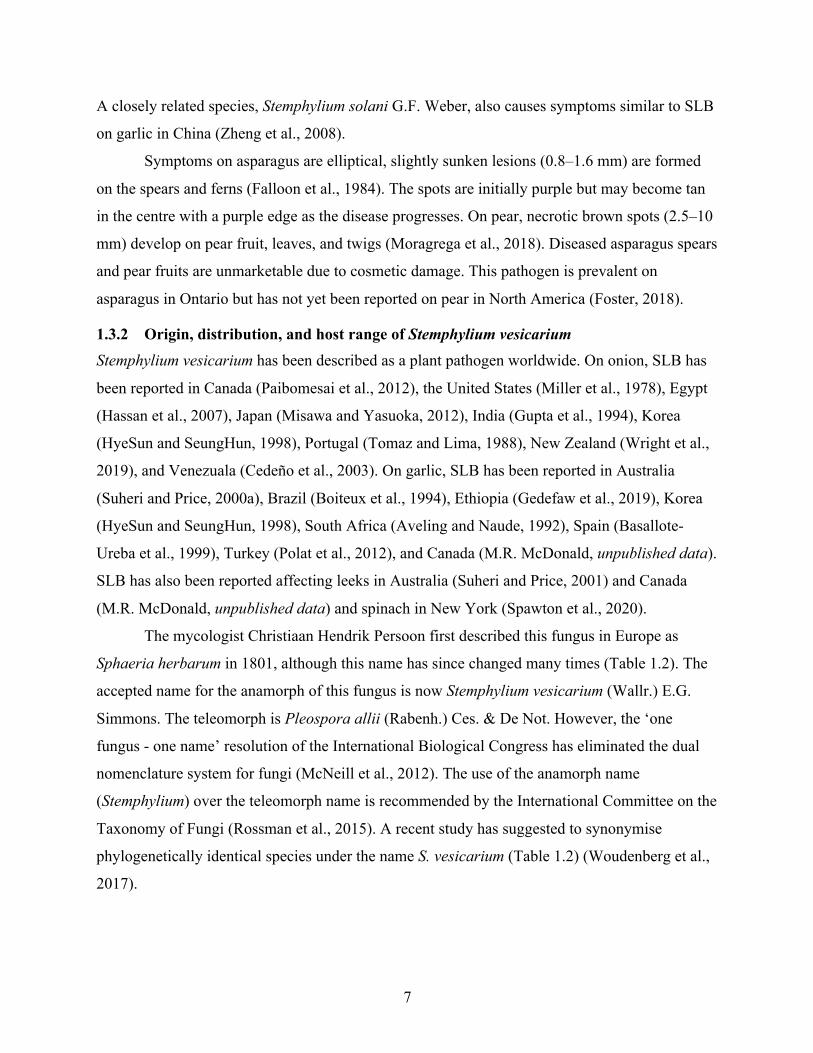
1.3.2 Origin, distribution, and host range of Stemphylium vesicarium Stemphylium vesicarium has been described as a plant pathogen worldwide. On onion, SLB has
been reported in Canada (Paibomesai et al., 2012), the United States (Miller et al., 1978), Egypt
(Hassan et al., 2007), Japan (Misawa and Yasuoka, 2012), India (Gupta et al., 1994), Korea
(HyeSun and SeungHun, 1998), Portugal (Tomaz and Lima, 1988), New Zealand (Wright et al.,
2019), and Venezuala (Cedeño et al., 2003). On garlic, SLB has been reported in Australia
(Suheri and Price, 2000a), Brazil (Boiteux et al., 1994), Ethiopia (Gedefaw et al., 2019), Korea
(HyeSun and SeungHun, 1998), South Africa (Aveling and Naude, 1992), Spain (Basallote-
Ureba et al., 1999), Turkey (Polat et al., 2012), and Canada (M.R. McDonald, unpublished data).
SLB has also been reported affecting leeks in Australia (Suheri and Price, 2001) and Canada
(M.R. McDonald, unpublished data) and spinach in New York (Spawton et al., 2020).
The mycologist Christiaan Hendrik Persoon first described this fungus in Europe as
Sphaeria herbarum in 1801, although this name has since changed many times (Table 1.2). The
accepted name for the anamorph of this fungus is now Stemphylium vesicarium (Wallr.) E.G.
Simmons. The teleomorph is Pleospora allii (Rabenh.) Ces. & De Not. However, the ‘one
fungus - one name’ resolution of the International Biological Congress has eliminated the dual
nomenclature system for fungi (McNeill et al., 2012). The use of the anamorph name
(Stemphylium) over the teleomorph name is recommended by the International Committee on the
Taxonomy of Fungi (Rossman et al., 2015). A recent study has suggested to synonymise
phylogenetically identical species under the name S. vesicarium (Table 1.2) (Woudenberg et al.,
2017).
8
Table 1.2 Synonyms of Stemphylium vesicarium. See Index Fungorum for additional synonyms (http://www.speciesfungorum.org). Anamorphs Telomorphs Alternaria putrefaciens (Fuckel) E.G. Simmons Ampullina herbarum (Pers.) Quél. Clasterosporium putrefaciens (Fuckel) Sacc. Phoma albicans Roberge ex Desm. Exormatostoma herbarum (Pers.) Gray Pleospora albicans Fuckel Helminthosporium vesicarium Wallr. P. alfalfae E.G. Simmons Macrosporium commune Rabenh. P. allii (Rabenh.) Ces. & De Not. M. echinellum Berk. & M.A. Curtis P. asparagi Rabenh. M. parasiticum Thüm. P. cheiranthi Cocc. & Morini M. sarcinula Berk. P. denotata (Cooke & Ellis) Sacc. M. vesicarium (Wallr.) Sacc. P. euonymi Fuckel Sphaeria denotata Cooke & Ellis P. excavata var. basitricha (Durieu & Mont.) Sacc. Sporidesmium putrefaciens Fuckel P. frangulae Fuckel Stemphylium alfalfae E.G. Simmons P. gymnocladi Bagnis Stemphylium brassicicola Y.F. Pei & X.G. Zhang P. herbarum (Pers.) Rabenh. ex Ces. & De Not. S. commune (Rabenh.) N.F. Buchw P. labiatarum Cooke & Harkn. S. cremanthodii Y.F. Pei & X.G. Zhang P. leguminum (Wallr.) Rabenh. S. herbarum E.G. Simmons P. lolii P. Karst. & Har. S. mali Yong Wang bis & X.G. Zhang P. mali Hesler S. parasiticum (Thüm.) J.A. Elliott P. meliloti Rabenh. S. sedicola E.G. Simmons P. pisi (Sowerby) Fuckel S. tomatonis E.G. Simmons P. pomorum A.S. Horne S. vesicarium (Wallr.) E.G. Simmons P. putrefaciens A.B. Frank P. salsolae Fuckel P. samarae Fuckel P. sedicola E.G. Simmons P. tomatonis E.G. Simmons P. typhae Pass. ex Brunaud Sphaeria brassicae Lasch S. excavata var. basitricha Durieu & Mont. S. herbarum Pers. S. leguminum Wallr
Stemphylium vesicarium can infect a range of plant species from many families. The host
plants include several crops from the Allium genus, fruit trees, legumes, and ornamentals (Table
1.3). However, cross-inoculation studies have shown that isolates from one host are not always
pathogenic on another host. For example, isolates collected from onion were able to infect
wounded, but not unwounded, pear fruit and were sometimes less aggressive on asparagus spears
(Foster, 2018). Köhl et al. (2009) also reported that S. vesicarium isolates from symptomatic
onion and asparagus, or pear leaf litter, were not pathogenic on European pear. Stemphylium
vesicarium isolates from pear leaf debris required a period of time after inoculation but were able
to re-infect pear leaves, whereas isolates collected from lesions on pear fruits or leaves exhibited
higher pathogenicity and aggressiveness on pear (Llorente et al., 2010a; Moragrega et al., 2018).
9
Interestingly, S. vesicarium isolates from asparagus were pathogenic on Japanese pear but not on
European pear (Singh et al., 1999). In another study, S. vesicarium isolates from asparagus,
onion, and garlic were pathogenic to all three crops, although this was not always the case
(Basallote-Ureba et al., 1999).
Isolates from parsley were pathogenic to celery, carrot, and pear, but not to leek, onion,
spinach, or tomato (Koike et al., 2013). Stemphylium vesicarium isolated from lupin (Lupinus
angustifolius L) was pathogenic on lupin but not on faba bean, lentil, or alfalfa, whereas isolates
collected from lentil only caused symptoms on lentil and not on faba bean, lupin, or alfalfa
(Vaghefi et al., 2020). In addition, isolates collected from faba bean, chickpea, and alfalfa did not
cause symptoms on any of the crops tested (Vaghefi et al., 2020).
Of 44 S. vesicarium isolates collected as air-borne spores in a pear orchard, only 5 (11%)
were pathogenic on pear (Moragrega et al., 2018). These reports show that variation exists within
the S. vesicarium species, resulting in a range of saprophytic and necrotrophic pathogenic
activities on specific plant tissues. Stemphylium vesicarium isolated from onion also exhibited
high variability in aggressiveness when re-inoculated on onion (Hassan et al., 2020).
Stemphylium spp. often colonize dead or dying plant tissues, and some isolates of S. vesicarium
can be saprophytic (Hudson, 1971; Bansal et al., 1991). In addition, S. vesicarium can develop as
an endophyte in the living tissues of asymptomatic plants (Misawa and Yasuoka, 2012).
10
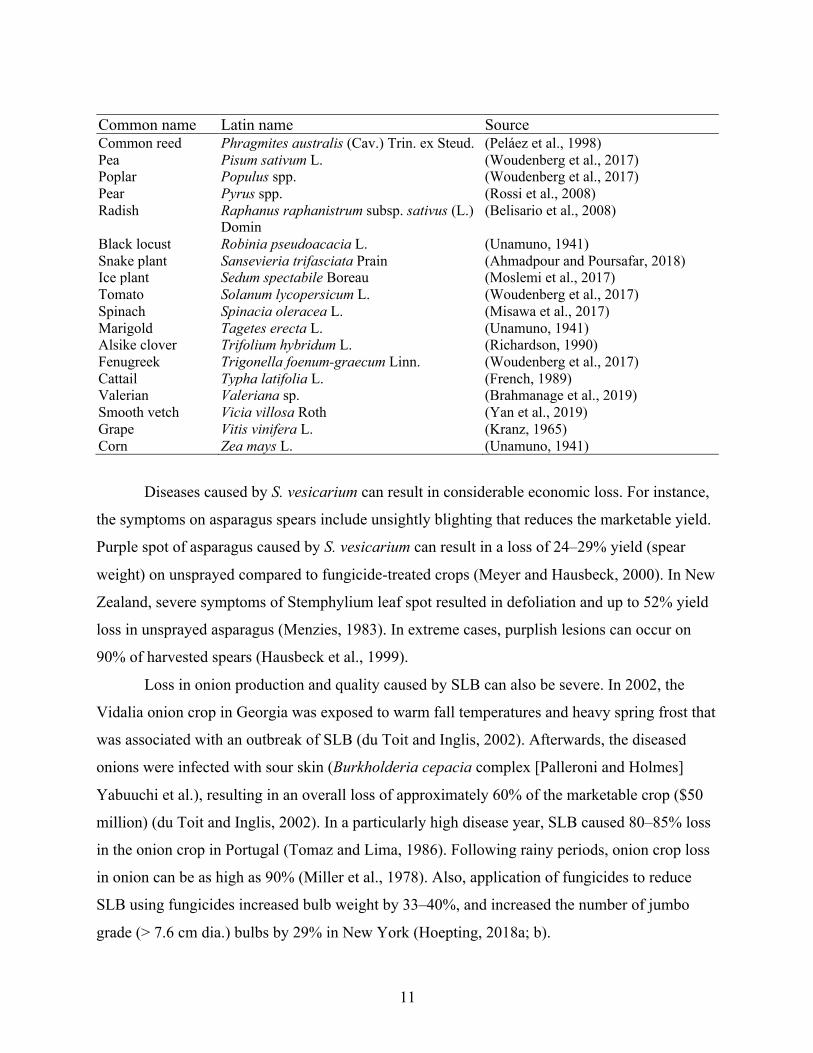
Table 1.3 Host plants of Stemphylium vesicarium. For a more extensive list, refer to the USDA Agricultural Research Service fungal database (https://nt.ars-grin.gov/fungaldatabases/). Common name Latin name Source Fir Abies sp. (Woudenberg et al., 2017) Leek Allium ampeloprasum L. (Suheri and Price, 2001) Common onion Allium cepa L. (Raghavendra Rao and Pavgi, 1975) Welsh onion Allium fistulosum L. (Misawa and Yasuoka, 2012) Garlic Allium sativum L. (Aveling and Naude, 1992) Common ragweed Ambrosia artemisiifolia L. (Hanlin, 1963) Giant reed Arundo donax L. (Pantidou, 1973) Oats Avena sp. (Brahmanage et al., 2019) Asparagus Asparagus officinalis L. (Falloon et al., 1987) Beet Beta vulgaris L. (Hanse et al., 2015) Wild bishop Bifora radians M. Beib. (Brahmanage et al., 2019) Carrot Daucus carota L. (Mulenko et al., 2008) Canola Brassica napus L. (Mulenko et al., 2008) Chinese cabbage Brassica rapa L. ssp. pekinensis (Woudenberg et al., 2017) Butterfly bush Buddleja davidii Franch. (Dudka et al., 2004) Chili pepper Capsicum chinense Jacq. (Vitale et al., 2017) Common knapweed Centaurea nigra L. (Kirk and Spooner, 1964) Citrus Citrus sp. (Woudenberg et al., 2017) White goosefoot Chenopodium album L. (Babuschkina, 1995) Chrysanthemum Chrysanthemum sp. (Pantidou, 1973) Daisy spp. Cremanthodium discoideum Maxim. (Woudenberg et al., 2017) Dahlia Dahlia pinnata Cav. (Woudenberg et al., 2017) Carnation Dianthus caryophyllus L. (Woudenberg et al., 2017) Carnation spp. Dianthus pseudarmeria M. Beib. (Brahmanage et al., 2019) Viper’s bugloss Echium sp. (Riley, 1960) Common ash Fraxinus excelsior L. (Mulenko et al., 2008) Cleavers Galium aparine L. (Brahmanage et al., 2019) Soybean Glycine max L. (Pande and Rao, 1998) Sunflower Helianthus annuus L. (Arzanlou et al., 2012) Sweet potato vine Ipomoea batatas L. Lam. (Gorter, 1977) Lettuce Lactuca sativa L. (Liu et al., 2019) Sweet pea Lathyrus odoratus L. (Köhl et al., 2009) Lentil Lens culinaris Medikus (Sinha and Singh, 1993) Flax Linum usitatissimum L. (Woudenberg et al., 2017) Perennial ryegrass Lolium sp. (Thambugala et al., 2017) Honeysuckle Lonicera sp. (Woudenberg et al., 2017) Bird’s-foot trefoil Lotus purshianus Clem & E.G. Clem (French, 1989) Annual honesty Lunaria annua L. (Woudenberg et al., 2017) Lupin Lupine sp. (Ahmad, 2014) Apple Malus sp. (Woudenberg et al., 2017) Mango Mangifera indica L. (Ahmad, 2014) Alfalfa Medicago sativa L. (Díaz-Valderrama et al., 2021) Lemon balm Melissa officinalis L. (Brahmanage et al., 2019) Grape hyacinth Muscari sp. (Pantidou, 1973) Parsley Petroselinum crispum [Mill.] Fuss (Koike et al., 2013) Green bean Phaseolus vulgaris L (Câmara et al., 2002)
11
Common name Latin name Source Common reed Phragmites australis (Cav.) Trin. ex Steud. (Peláez et al., 1998) Pea Pisum sativum L. (Woudenberg et al., 2017) Poplar Populus spp. (Woudenberg et al., 2017) Pear Pyrus spp. (Rossi et al., 2008) Radish Raphanus raphanistrum subsp. sativus (L.)
Domin (Belisario et al., 2008)
Black locust Robinia pseudoacacia L. (Unamuno, 1941) Snake plant Sansevieria trifasciata Prain (Ahmadpour and Poursafar, 2018) Ice plant Sedum spectabile Boreau (Moslemi et al., 2017) Tomato Solanum lycopersicum L. (Woudenberg et al., 2017) Spinach Spinacia oleracea L. (Misawa et al., 2017) Marigold Tagetes erecta L. (Unamuno, 1941) Alsike clover Trifolium hybridum L. (Richardson, 1990) Fenugreek Trigonella foenum-graecum Linn. (Woudenberg et al., 2017) Cattail Typha latifolia L. (French, 1989) Valerian Valeriana sp. (Brahmanage et al., 2019) Smooth vetch Vicia villosa Roth (Yan et al., 2019) Grape Vitis vinifera L. (Kranz, 1965) Corn Zea mays L. (Unamuno, 1941)
Diseases caused by S. vesicarium can result in considerable economic loss. For instance,
the symptoms on asparagus spears include unsightly blighting that reduces the marketable yield.
Purple spot of asparagus caused by S. vesicarium can result in a loss of 24–29% yield (spear
weight) on unsprayed compared to fungicide-treated crops (Meyer and Hausbeck, 2000). In New
Zealand, severe symptoms of Stemphylium leaf spot resulted in defoliation and up to 52% yield
loss in unsprayed asparagus (Menzies, 1983). In extreme cases, purplish lesions can occur on
90% of harvested spears (Hausbeck et al., 1999).
Loss in onion production and quality caused by SLB can also be severe. In 2002, the
Vidalia onion crop in Georgia was exposed to warm fall temperatures and heavy spring frost that
was associated with an outbreak of SLB (du Toit and Inglis, 2002). Afterwards, the diseased
onions were infected with sour skin (Burkholderia cepacia complex [Palleroni and Holmes]
Yabuuchi et al.), resulting in an overall loss of approximately 60% of the marketable crop ($50
million) (du Toit and Inglis, 2002). In a particularly high disease year, SLB caused 80–85% loss
in the onion crop in Portugal (Tomaz and Lima, 1986). Following rainy periods, onion crop loss
in onion can be as high as 90% (Miller et al., 1978). Also, application of fungicides to reduce
SLB using fungicides increased bulb weight by 33–40%, and increased the number of jumbo
grade (> 7.6 cm dia.) bulbs by 29% in New York (Hoepting, 2018a; b).
12
SLB was first reported in New York in 1985 (Shishkoff and Lorbeer, 1989) and spread
across most onion fields in the state by 1990, where it resulted in severe foliar dieback in some
fields (Lorbeer, 1993). SLB was considered of minor importance in North America until its re-
emergence in the last 10 years as the dominant foliar disease affecting broad-acre onion
production (Hay et al., 2019). The focus of the current research program was on management of
S. vesicarium on onion in Ontario.
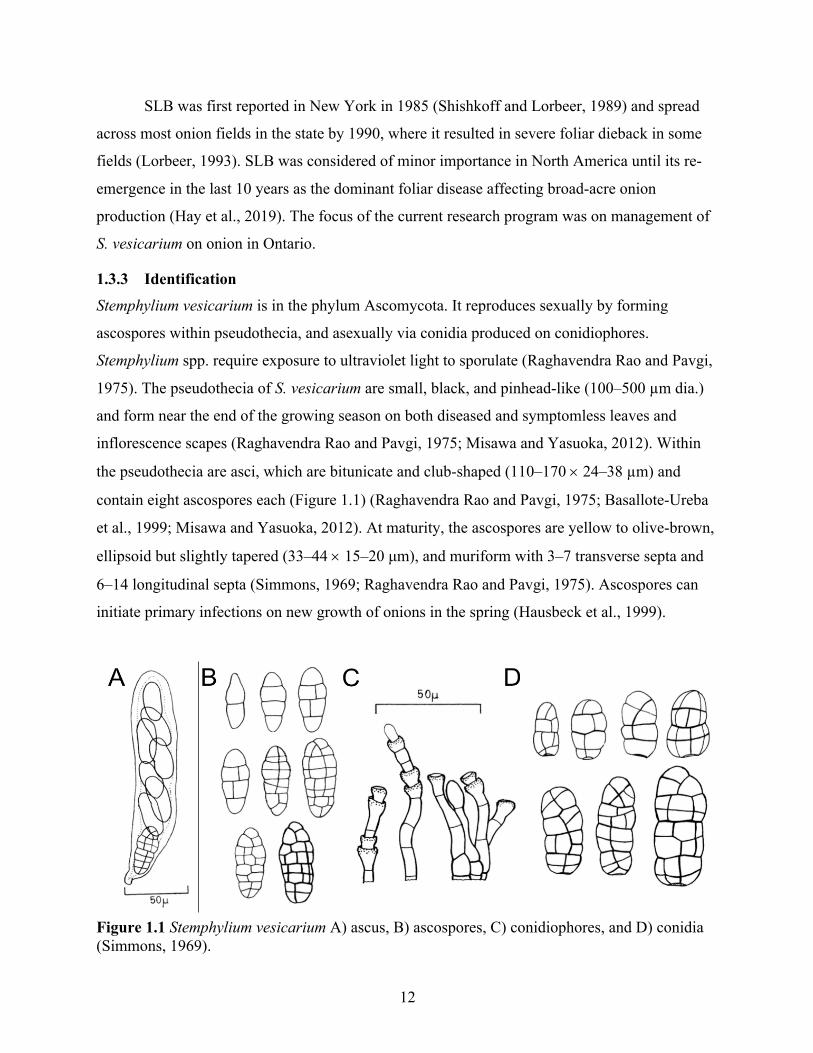
1.3.3 Identification
Stemphylium vesicarium is in the phylum Ascomycota. It reproduces sexually by forming
ascospores within pseudothecia, and asexually via conidia produced on conidiophores.
Stemphylium spp. require exposure to ultraviolet light to sporulate (Raghavendra Rao and Pavgi,
1975). The pseudothecia of S. vesicarium are small, black, and pinhead-like (100–500 µm dia.)
and form near the end of the growing season on both diseased and symptomless leaves and
inflorescence scapes (Raghavendra Rao and Pavgi, 1975; Misawa and Yasuoka, 2012). Within
the pseudothecia are asci, which are bitunicate and club-shaped (110–170 ´ 24–38 µm) and
contain eight ascospores each (Figure 1.1) (Raghavendra Rao and Pavgi, 1975; Basallote-Ureba
et al., 1999; Misawa and Yasuoka, 2012). At maturity, the ascospores are yellow to olive-brown,
ellipsoid but slightly tapered (33–44 ´ 15–20 μm), and muriform with 3–7 transverse septa and
6–14 longitudinal septa (Simmons, 1969; Raghavendra Rao and Pavgi, 1975). Ascospores can
initiate primary infections on new growth of onions in the spring (Hausbeck et al., 1999).
Figure 1.1 Stemphylium vesicarium A) ascus, B) ascospores, C) conidiophores, and D) conidia (Simmons, 1969).
13
Ascospores take time to mature. On garlic debris in Spain, undifferentiated ascocarps
were present within 30 days in the field, but it took 4 months for ascospores to develop in mature
pseudothecia (Basallote-Ureba et al., 1999). In New York, pseudothecia on onion leaves which
that had overwintered in the field did not contain ascospores (Hay et al., 2019; Leach et al.,
2020), but mature pseudothecia containing ascospores were observed on artificially inoculated
and symptomatic onion leaves that had been maintained in cold storage (~4 °C) for 2–3 months.
However, ascospores were not present on onion leaf tissue collected from the field that had been
maintained under the same conditions (Dr. S.J. Pethybridge, Cornell University, personal
communication). Pseudothecia have not previously been documented at the Holland Marsh, but
air-borne ascospores have been collected in the region (Gossen et al., 2021).
In Italy, S. vesicarium produced mature ascospores under field conditions on detached
leaves of pear and several alternative hosts such as grasses and weeds (Kentucky bluegrass [Poa
pratensis L.], red fescue [Festuca rubra L.], sheep fescue [Festuca ovina L.], perennial ryegrass
[Lolium perenne L.], tall crabgrass [Digitaria sanguinalis L. Scoop.], yellow foxtail [Setaria
glauca L. Beauv.], and white clover [Trifolium repens L.]) (Rossi et al., 2005b). Pseudothecia
developed earlier and in greater density on the alternative hosts, but those produced on pear
leaves were larger and ascospore maturation and ejection was highest from pear leaves (Rossi et
al., 2005b). Ascospore release typically occurred between April–June in Ontario onion fields
(Gossen et al., 2021), from February–April for garlic fields in Spain (Prados-Ligero et al., 2003),
and September–January and then again in May for asparagus in New Zealand (Menzies et al.,
1992). In addition, ascospore production on pear leaves in Italy occurred from February–May,
with an extended period of ascospore ejection into mid-June from pseudothecia produced on
sheep fescue and yellow foxtail (Rossi et al. 2005). The production, maturation, and ejection of
S. vesicarium ascospores is influenced by the host and environmental conditions.
Asexual reproduction occurs via oval to ellipsoidal, pale to dark brown conidia (22–42 ´
12–25 μm) with 3–5 transverse septa, 4–14 longitudinal septa, and a dark basal scar (Figure 1.1)
(Simmons, 1969). Conidia are produced on yellow or brown conidiophores that are cylindrical
and enlarged apically at the site of conidia production (Raghavendra Rao and Pavgi, 1975).
Under warm (25 °C) and damp conditions, conidia and ascospores germinate on onion leaves,
forming single or multiple germ-tubes (Simmons, 1969). The germ-tubes terminate in bulbous
appressoria upon stomata or epidermal cells (Falloon et al., 1987; Aveling and Snyman, 1993;
14
Prados-Ligero et al., 2003). Appressoria that formed above epidermal cells successfully
penetrated the host at a rate of 48–72% and those formed above stomata were 89–97% successful
(Aveling and Snyman, 1993). The greatest success was observed after 24 h at 18–25 °C with a
minimum leaf wetness period of 16 h (Aveling and Snyman, 1993).
Vegetable juice agars such as V8 medium are often used to induce sporulation of
Stemphylium spp. and other pathogens (Simmons, 1969; Rissler and Millar, 1977; Chowdhury et
al., 2015). V8 media contains a mixture of macro- and micronutrients including nitrogen, salts,
and metals (especially copper) that supports sexual reproduction (Kent et al., 2008). In the
human fungal pathogen Cryptococcus neoformans (San Felice) Vuill., copper in the V8 media
enhanced mate recognition, cell fusion, filamentation, and up-regulated pheromone gene
expression (Kent et al., 2008). Copper is an essential micronutrient used by enzymes for
production of melanin (Eisenman and Casadevall, 2012). Copper deficiency can cause reduced
pigmentation in cultures of many fungi when grown on potato dextrose agar (Griffith et al.,
2007).
The genome of an isolate of S. vesicarium has recently been sequenced (Gazzetti et al.,
2019) and this resource can now be used as a baseline for molecular confirmation of the species
identity of new isolates. The internal transcribed spacer, glyceraldehyde-3-phosphate
dehydrogenase, and translational elongation factor EF-1 alpha sequences were used to separate
S. vesicarium (designated in the article as syn. P. herbarum) into a clade apart from several
closely related Stemphylium species, but did not differentiate P. herbarum from P. alfalfae,
P. sedicola, and P. tomatonis (Inderbitzin et al., 2009). However, new studies have suggested
that these species be synonymized (Woudenberg et al., 2017). Additionally, S. vesicarium can be
differentiated from S. botryosum based on the cytochrome b sequence (Graf et al., 2016).
1.3.4 Life cycle Stemphylium vesicarium is dormant during the winter, surviving as pseudothecia or mycelia in
diseased or asymptomatic leaves (Simmons, 1969). In spring, ascospores are ejected from
pseudothecia at temperatures > 14 °C, and primary infections from conidia also occur (Misawa
and Yasuoka, 2012). In the Holland Marsh, air-borne ascospores were trapped from April to
July, but declined as the season progressed, which indicated that pseudothecia can overwinter in
the region. However, pseudothecia were not found on onion leaf residue left in the field in the
Holland Marsh in one year (Gossen et al., 2021), possibly because the leaf tissue was highly
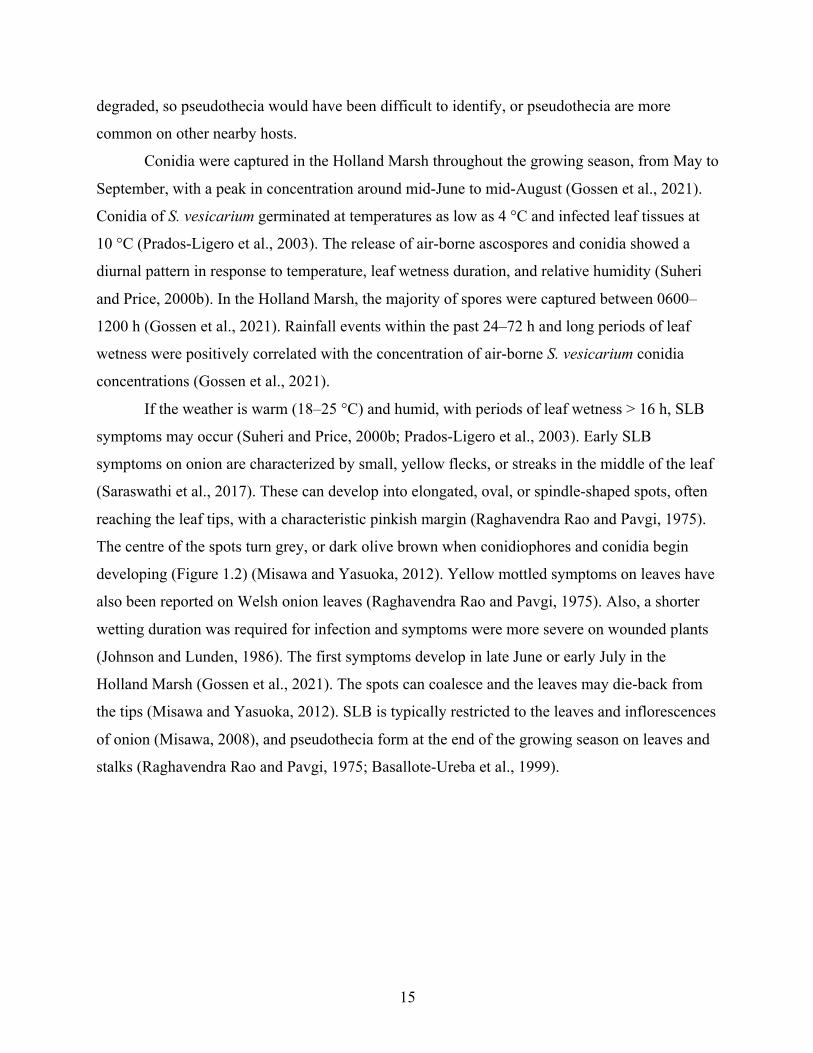
15
degraded, so pseudothecia would have been difficult to identify, or pseudothecia are more
common on other nearby hosts.
Conidia were captured in the Holland Marsh throughout the growing season, from May to
September, with a peak in concentration around mid-June to mid-August (Gossen et al., 2021).
Conidia of S. vesicarium germinated at temperatures as low as 4 °C and infected leaf tissues at
10 °C (Prados-Ligero et al., 2003). The release of air-borne ascospores and conidia showed a
diurnal pattern in response to temperature, leaf wetness duration, and relative humidity (Suheri
and Price, 2000b). In the Holland Marsh, the majority of spores were captured between 0600–
1200 h (Gossen et al., 2021). Rainfall events within the past 24–72 h and long periods of leaf
wetness were positively correlated with the concentration of air-borne S. vesicarium conidia
concentrations (Gossen et al., 2021).
If the weather is warm (18–25 °C) and humid, with periods of leaf wetness > 16 h, SLB
symptoms may occur (Suheri and Price, 2000b; Prados-Ligero et al., 2003). Early SLB
symptoms on onion are characterized by small, yellow flecks, or streaks in the middle of the leaf
(Saraswathi et al., 2017). These can develop into elongated, oval, or spindle-shaped spots, often
reaching the leaf tips, with a characteristic pinkish margin (Raghavendra Rao and Pavgi, 1975).
The centre of the spots turn grey, or dark olive brown when conidiophores and conidia begin
developing (Figure 1.2) (Misawa and Yasuoka, 2012). Yellow mottled symptoms on leaves have
also been reported on Welsh onion leaves (Raghavendra Rao and Pavgi, 1975). Also, a shorter
wetting duration was required for infection and symptoms were more severe on wounded plants
(Johnson and Lunden, 1986). The first symptoms develop in late June or early July in the
Holland Marsh (Gossen et al., 2021). The spots can coalesce and the leaves may die-back from
the tips (Misawa and Yasuoka, 2012). SLB is typically restricted to the leaves and inflorescences
of onion (Misawa, 2008), and pseudothecia form at the end of the growing season on leaves and
stalks (Raghavendra Rao and Pavgi, 1975; Basallote-Ureba et al., 1999).
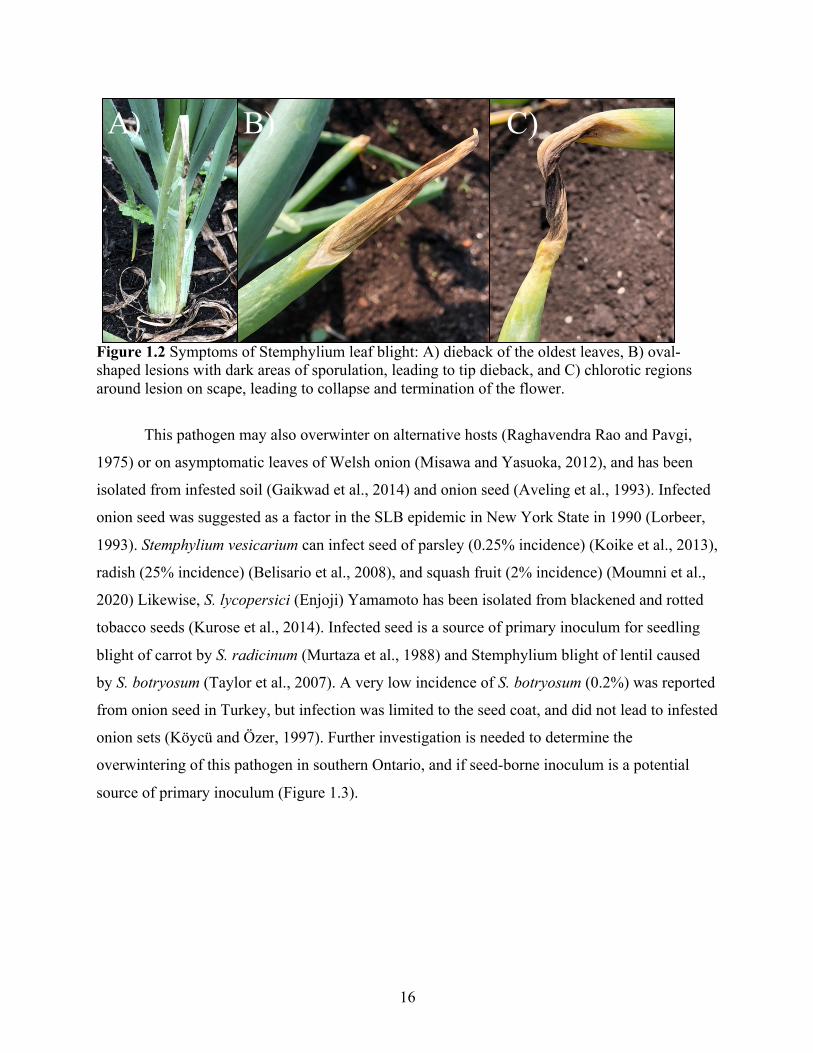
16
Figure 1.2 Symptoms of Stemphylium leaf blight: A) dieback of the oldest leaves, B) oval-shaped lesions with dark areas of sporulation, leading to tip dieback, and C) chlorotic regions around lesion on scape, leading to collapse and termination of the flower.
This pathogen may also overwinter on alternative hosts (Raghavendra Rao and Pavgi,
1975) or on asymptomatic leaves of Welsh onion (Misawa and Yasuoka, 2012), and has been
isolated from infested soil (Gaikwad et al., 2014) and onion seed (Aveling et al., 1993). Infected
onion seed was suggested as a factor in the SLB epidemic in New York State in 1990 (Lorbeer,
1993). Stemphylium vesicarium can infect seed of parsley (0.25% incidence) (Koike et al., 2013),
radish (25% incidence) (Belisario et al., 2008), and squash fruit (2% incidence) (Moumni et al.,
2020) Likewise, S. lycopersici (Enjoji) Yamamoto has been isolated from blackened and rotted
tobacco seeds (Kurose et al., 2014). Infected seed is a source of primary inoculum for seedling
blight of carrot by S. radicinum (Murtaza et al., 1988) and Stemphylium blight of lentil caused
by S. botryosum (Taylor et al., 2007). A very low incidence of S. botryosum (0.2%) was reported
from onion seed in Turkey, but infection was limited to the seed coat, and did not lead to infested
onion sets (Köycü and Özer, 1997). Further investigation is needed to determine the
overwintering of this pathogen in southern Ontario, and if seed-borne inoculum is a potential
source of primary inoculum (Figure 1.3).
A) B) C)
17
Figure 1.3 Possible life cycle of Stemphylium vesicarium on onion.
1.3.5 Host-specific toxins
Host specific toxins (HST) are compounds produced by plant pathogens that induce toxicity and
promote disease only in the susceptible host species. HSTs have been extracted from isolates of
S. vesicarium isolated from pear trees by refining the toxin from culture filtrates, but the
chemical formulae and structures were not defined (Singh et al., 1999). Two compounds, SV-I
and SV-II, induced vein necrosis on susceptible pear cultivars; likely by altering the plasma
membrane, resulting in electrolyte leakage (Singh et al., 2000). These SV-toxins were host
specific, and did not produce necrosis on resistant cultivars or non-host species such as tomatoes
(Singh et al., 1999). Some SLB symptoms on onion and garlic may be due to a toxin released by
the fungus (Basallote-Ureba et al., 1999).
Four other metabolites, stemphylin, stemphyloxin, stemphyperylenol, and stemphol, have
been detected in extracts of S. vesicarium colonies using high-performance liquid
chromatography and thin-layer chromatography (Andersen et al., 1995). Low doses of
Leaves die back from the tip. Onion leaves may die standing up
or lodge. Pseudothecia develop
Conidia infect new onion leaves, alternative hosts, or
onion flowers (multiple cycles)
Overwinters on plant
debris Symptoms: oval, brown or yellow lesions. Conidia
produced
Infection of cotyledon and/or first
leaf
Seed-borne inoculum may play
a role
Ascospores infect onion seedlings or alternative
hosts in the spring
18
stemphylin have been used to treat mouse leukemia cells, but a high concentration (40 μM)
extracted from S. botryosum caused death of treated mice (Assante and Nasini, 1987).
Stemphyperylenol obtained from Alternaria cassia Jurair & A. Khan induced host-specific
necrosis on crabgrass (Digitaria sanguinalis [L.] Scop.) (Hradil et al., 1989) and exhibited
antibacterial activity at a concentration of 3.12 μg mL-1 (Liu et al., 2010). Another compound,
stemphyltoxin II, extracted from Alternaria alternata (Fr.) Keissl was mutagenic for a
Salmonella species (Davis and Stack, 1991). There is one documented report of S. vesicarium
producing patulin, a particularly toxic mycotoxin, in pear fruits (Laidou et al., 2001). Patulin is
carcinogenic and toxic to plants and animals but its role in causing animal and human disease is
unknown (Bullerman, 2003).
Overall, there is a paucity of literature on the animal toxicity of compounds produced by
S. vesicarium, and toxin production in Allium spp. has not yet been confirmed. Detailed toxicity
data are not available for these compounds, but a recent review developed in preparation for the
current study concluded that Stemphylium spp. did not pose a risk to the health of humans or
animals (Stricker et al., 2021a).
1.4 Factors affecting SLB severity For disease to occur, the host plant must be susceptible, there must be a virulent pathogen
present, and environmental conditions must be favourable for infection and symptom
development (Agrios, 2005). Stemphylium vesicarium is a pathogen of crops around the world,
which demonstrates that it has adapted to many ecological niches. For foliar pathogens, infection
success is restricted by the duration of leaf wetness, humidity, and temperature (Magarey et al.,
2005). Plant canopy density, the timing and amount of rainfall, and other environmental factors
act in combination to affect infection success and disease development (Aveling, 1993;
Basallote-Ureba et al., 1999; Mwakutuya, 2006; Misawa and Yasuoka, 2012).
1.4.1 Temperature Plant pathogens have characteristic optimal temperatures for infection and growth that result in
the most rapid disease development, but typically differ from the optimum for the host (Agrios,
2005). However, the optimal temperature can differ by the stage in pathogen’s life cycle, the host
infected, and location. The optimum temperature for mycelium growth of four S. vesicarium
isolates on water agar was 25 °C (Bohlen-Janssen et al., 2018a), but infection by Stemphylium
spp. on asparagus in New Zealand was higher at 14 °C than at 20 °C or 26 °C (Menzies et al.,
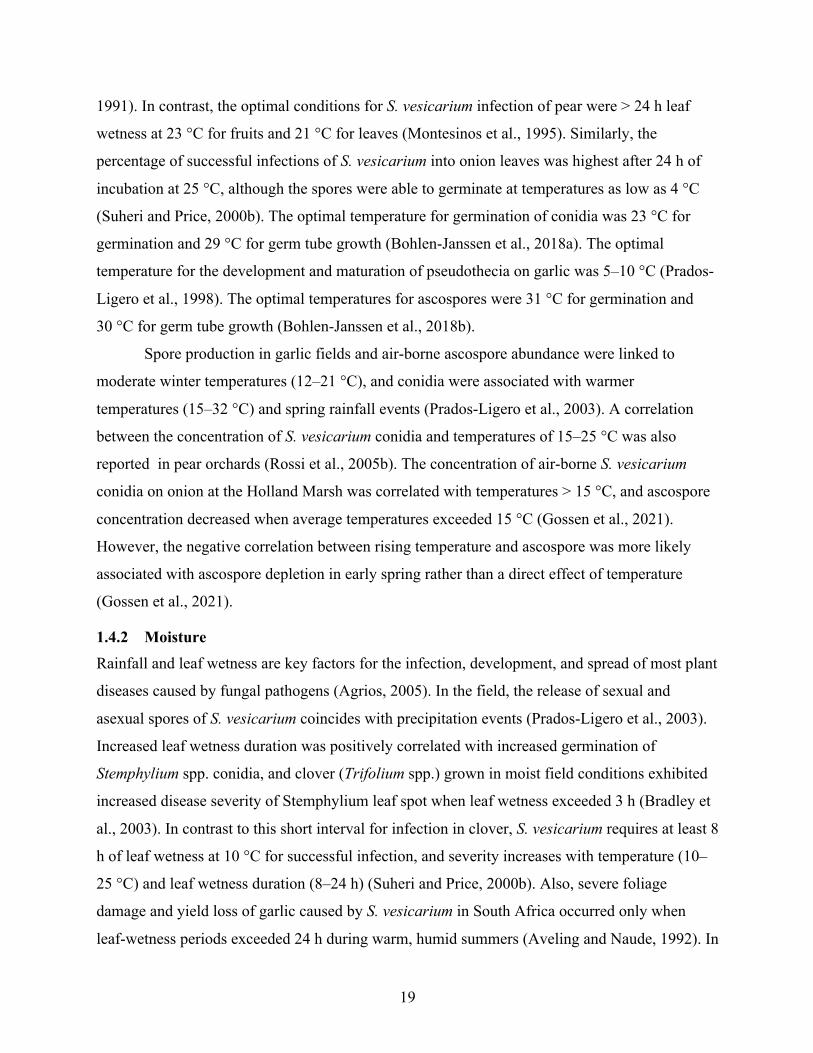
19
1991). In contrast, the optimal conditions for S. vesicarium infection of pear were > 24 h leaf
wetness at 23 °C for fruits and 21 °C for leaves (Montesinos et al., 1995). Similarly, the
percentage of successful infections of S. vesicarium into onion leaves was highest after 24 h of
incubation at 25 °C, although the spores were able to germinate at temperatures as low as 4 °C
(Suheri and Price, 2000b). The optimal temperature for germination of conidia was 23 °C for
germination and 29 °C for germ tube growth (Bohlen-Janssen et al., 2018a). The optimal
temperature for the development and maturation of pseudothecia on garlic was 5–10 °C (Prados-
Ligero et al., 1998). The optimal temperatures for ascospores were 31 °C for germination and
30 °C for germ tube growth (Bohlen-Janssen et al., 2018b).
Spore production in garlic fields and air-borne ascospore abundance were linked to
moderate winter temperatures (12–21 °C), and conidia were associated with warmer
temperatures (15–32 °C) and spring rainfall events (Prados-Ligero et al., 2003). A correlation
between the concentration of S. vesicarium conidia and temperatures of 15–25 °C was also
reported in pear orchards (Rossi et al., 2005b). The concentration of air-borne S. vesicarium
conidia on onion at the Holland Marsh was correlated with temperatures > 15 °C, and ascospore
concentration decreased when average temperatures exceeded 15 °C (Gossen et al., 2021).
However, the negative correlation between rising temperature and ascospore was more likely
associated with ascospore depletion in early spring rather than a direct effect of temperature
(Gossen et al., 2021).
1.4.2 Moisture Rainfall and leaf wetness are key factors for the infection, development, and spread of most plant
diseases caused by fungal pathogens (Agrios, 2005). In the field, the release of sexual and
asexual spores of S. vesicarium coincides with precipitation events (Prados-Ligero et al., 2003).
Increased leaf wetness duration was positively correlated with increased germination of
Stemphylium spp. conidia, and clover (Trifolium spp.) grown in moist field conditions exhibited
increased disease severity of Stemphylium leaf spot when leaf wetness exceeded 3 h (Bradley et
al., 2003). In contrast to this short interval for infection in clover, S. vesicarium requires at least 8
h of leaf wetness at 10 °C for successful infection, and severity increases with temperature (10–
25 °C) and leaf wetness duration (8–24 h) (Suheri and Price, 2000b). Also, severe foliage
damage and yield loss of garlic caused by S. vesicarium in South Africa occurred only when
leaf-wetness periods exceeded 24 h during warm, humid summers (Aveling and Naude, 1992). In
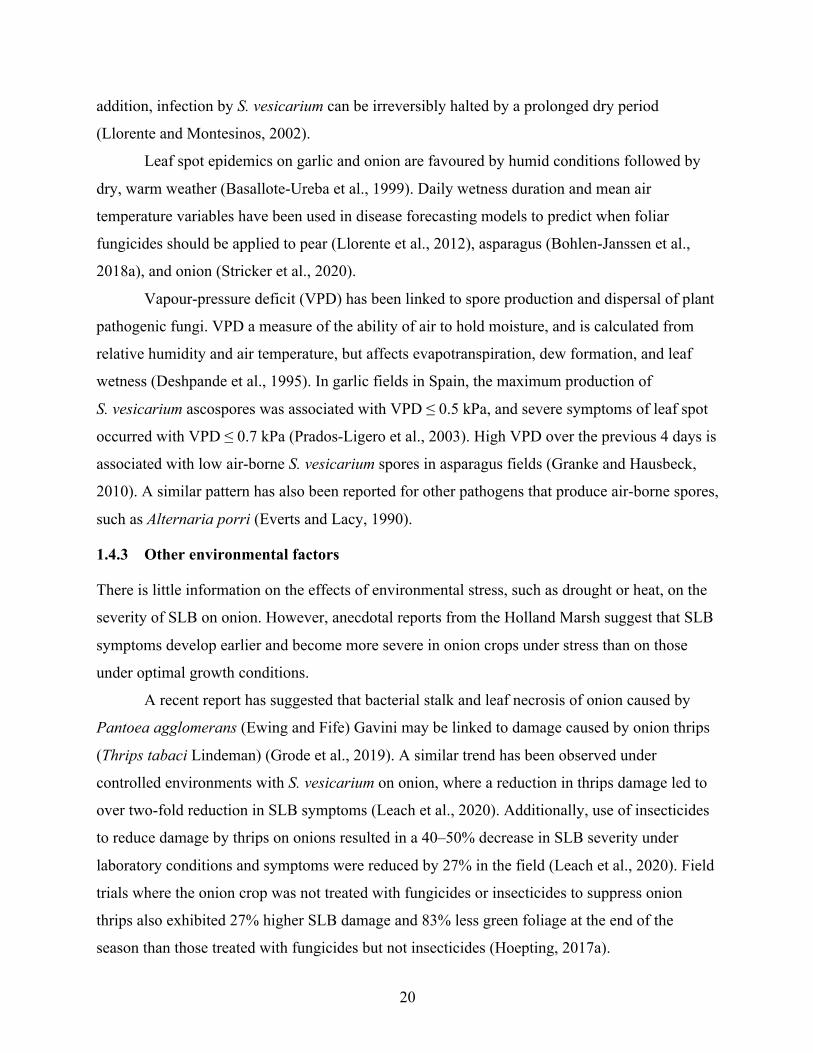
20
addition, infection by S. vesicarium can be irreversibly halted by a prolonged dry period
(Llorente and Montesinos, 2002).
Leaf spot epidemics on garlic and onion are favoured by humid conditions followed by
dry, warm weather (Basallote-Ureba et al., 1999). Daily wetness duration and mean air
temperature variables have been used in disease forecasting models to predict when foliar
fungicides should be applied to pear (Llorente et al., 2012), asparagus (Bohlen-Janssen et al.,
2018a), and onion (Stricker et al., 2020).
Vapour-pressure deficit (VPD) has been linked to spore production and dispersal of plant
pathogenic fungi. VPD a measure of the ability of air to hold moisture, and is calculated from
relative humidity and air temperature, but affects evapotranspiration, dew formation, and leaf
wetness (Deshpande et al., 1995). In garlic fields in Spain, the maximum production of
S. vesicarium ascospores was associated with VPD ≤ 0.5 kPa, and severe symptoms of leaf spot
occurred with VPD ≤ 0.7 kPa (Prados-Ligero et al., 2003). High VPD over the previous 4 days is
associated with low air-borne S. vesicarium spores in asparagus fields (Granke and Hausbeck,
2010). A similar pattern has also been reported for other pathogens that produce air-borne spores,
such as Alternaria porri (Everts and Lacy, 1990).
1.4.3 Other environmental factors
There is little information on the effects of environmental stress, such as drought or heat, on the
severity of SLB on onion. However, anecdotal reports from the Holland Marsh suggest that SLB
symptoms develop earlier and become more severe in onion crops under stress than on those
under optimal growth conditions.
A recent report has suggested that bacterial stalk and leaf necrosis of onion caused by
Pantoea agglomerans (Ewing and Fife) Gavini may be linked to damage caused by onion thrips
(Thrips tabaci Lindeman) (Grode et al., 2019). A similar trend has been observed under
controlled environments with S. vesicarium on onion, where a reduction in thrips damage led to
over two-fold reduction in SLB symptoms (Leach et al., 2020). Additionally, use of insecticides
to reduce damage by thrips on onions resulted in a 40–50% decrease in SLB severity under
laboratory conditions and symptoms were reduced by 27% in the field (Leach et al., 2020). Field
trials where the onion crop was not treated with fungicides or insecticides to suppress onion
thrips also exhibited 27% higher SLB damage and 83% less green foliage at the end of the
season than those treated with fungicides but not insecticides (Hoepting, 2017a).
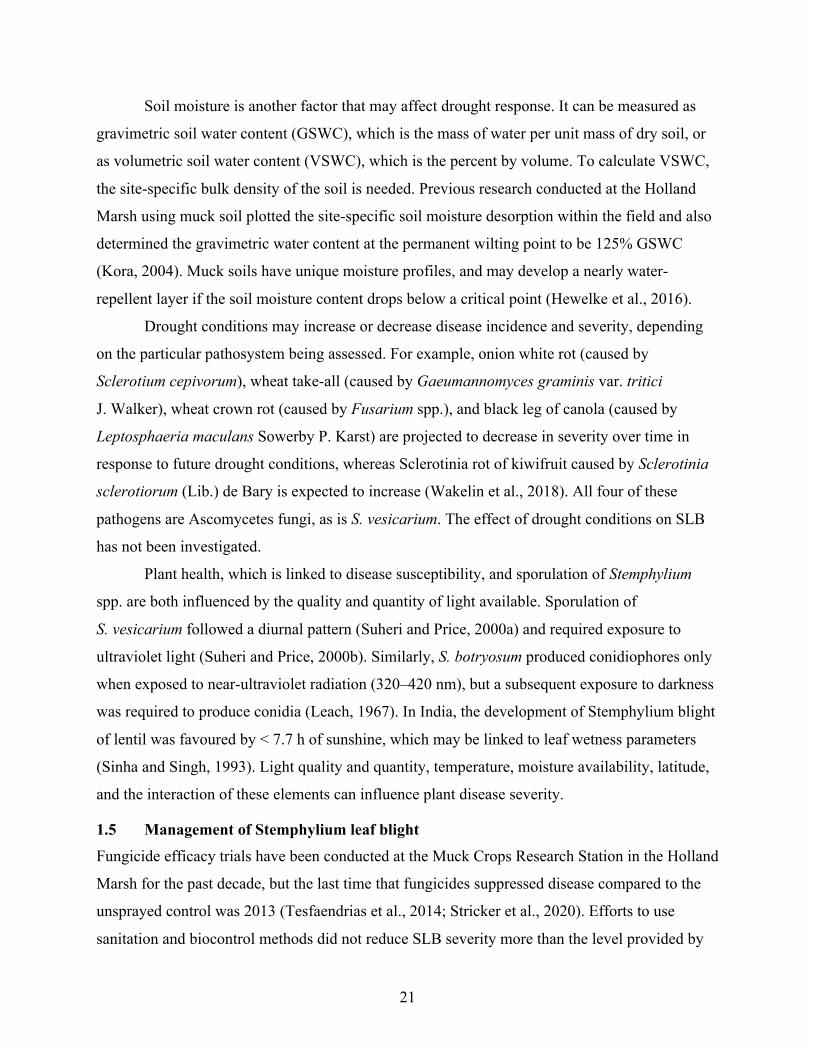
21
Soil moisture is another factor that may affect drought response. It can be measured as
gravimetric soil water content (GSWC), which is the mass of water per unit mass of dry soil, or
as volumetric soil water content (VSWC), which is the percent by volume. To calculate VSWC,
the site-specific bulk density of the soil is needed. Previous research conducted at the Holland
Marsh using muck soil plotted the site-specific soil moisture desorption within the field and also
determined the gravimetric water content at the permanent wilting point to be 125% GSWC
(Kora, 2004). Muck soils have unique moisture profiles, and may develop a nearly water-
repellent layer if the soil moisture content drops below a critical point (Hewelke et al., 2016).
Drought conditions may increase or decrease disease incidence and severity, depending
on the particular pathosystem being assessed. For example, onion white rot (caused by
Sclerotium cepivorum), wheat take-all (caused by Gaeumannomyces graminis var. tritici
J. Walker), wheat crown rot (caused by Fusarium spp.), and black leg of canola (caused by
Leptosphaeria maculans Sowerby P. Karst) are projected to decrease in severity over time in
response to future drought conditions, whereas Sclerotinia rot of kiwifruit caused by Sclerotinia
sclerotiorum (Lib.) de Bary is expected to increase (Wakelin et al., 2018). All four of these
pathogens are Ascomycetes fungi, as is S. vesicarium. The effect of drought conditions on SLB
has not been investigated.
Plant health, which is linked to disease susceptibility, and sporulation of Stemphylium
spp. are both influenced by the quality and quantity of light available. Sporulation of
S. vesicarium followed a diurnal pattern (Suheri and Price, 2000a) and required exposure to
ultraviolet light (Suheri and Price, 2000b). Similarly, S. botryosum produced conidiophores only
when exposed to near-ultraviolet radiation (320–420 nm), but a subsequent exposure to darkness
was required to produce conidia (Leach, 1967). In India, the development of Stemphylium blight
of lentil was favoured by < 7.7 h of sunshine, which may be linked to leaf wetness parameters
(Sinha and Singh, 1993). Light quality and quantity, temperature, moisture availability, latitude,
and the interaction of these elements can influence plant disease severity.
1.5 Management of Stemphylium leaf blight
Fungicide efficacy trials have been conducted at the Muck Crops Research Station in the Holland
Marsh for the past decade, but the last time that fungicides suppressed disease compared to the
unsprayed control was 2013 (Tesfaendrias et al., 2014; Stricker et al., 2020). Efforts to use
sanitation and biocontrol methods did not reduce SLB severity more than the level provided by
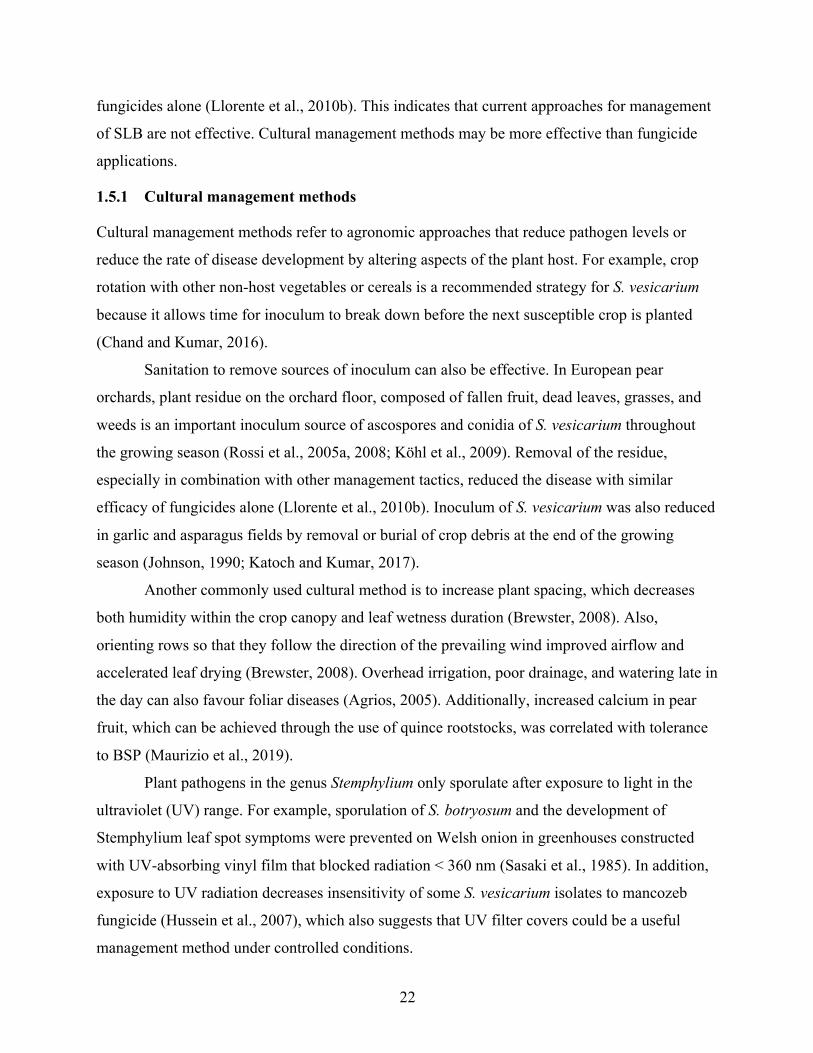
22
fungicides alone (Llorente et al., 2010b). This indicates that current approaches for management
of SLB are not effective. Cultural management methods may be more effective than fungicide
applications.
1.5.1 Cultural management methods
Cultural management methods refer to agronomic approaches that reduce pathogen levels or
reduce the rate of disease development by altering aspects of the plant host. For example, crop
rotation with other non-host vegetables or cereals is a recommended strategy for S. vesicarium
because it allows time for inoculum to break down before the next susceptible crop is planted
(Chand and Kumar, 2016).
Sanitation to remove sources of inoculum can also be effective. In European pear
orchards, plant residue on the orchard floor, composed of fallen fruit, dead leaves, grasses, and
weeds is an important inoculum source of ascospores and conidia of S. vesicarium throughout
the growing season (Rossi et al., 2005a, 2008; Köhl et al., 2009). Removal of the residue,
especially in combination with other management tactics, reduced the disease with similar
efficacy of fungicides alone (Llorente et al., 2010b). Inoculum of S. vesicarium was also reduced
in garlic and asparagus fields by removal or burial of crop debris at the end of the growing
season (Johnson, 1990; Katoch and Kumar, 2017).
Another commonly used cultural method is to increase plant spacing, which decreases
both humidity within the crop canopy and leaf wetness duration (Brewster, 2008). Also,
orienting rows so that they follow the direction of the prevailing wind improved airflow and
accelerated leaf drying (Brewster, 2008). Overhead irrigation, poor drainage, and watering late in
the day can also favour foliar diseases (Agrios, 2005). Additionally, increased calcium in pear
fruit, which can be achieved through the use of quince rootstocks, was correlated with tolerance
to BSP (Maurizio et al., 2019).
Plant pathogens in the genus Stemphylium only sporulate after exposure to light in the
ultraviolet (UV) range. For example, sporulation of S. botryosum and the development of
Stemphylium leaf spot symptoms were prevented on Welsh onion in greenhouses constructed
with UV-absorbing vinyl film that blocked radiation < 360 nm (Sasaki et al., 1985). In addition,
exposure to UV radiation decreases insensitivity of some S. vesicarium isolates to mancozeb
fungicide (Hussein et al., 2007), which also suggests that UV filter covers could be a useful
management method under controlled conditions.
23
Cultural management can provide some reduction in disease. Detailed knowledge of the
pathogen is required for IPM systems to be effective. The IPM system for SLB in southern
Ontario must be improved to sustainability maintain, or intensify, onion production in the region.
1.5.2 Fungicides
Fungicides have been grouped by biochemical mechanism and target site within the target
pathogen (mode of action), and assigned a code number by the Fungicide Resistance Action
Committee (FRAC, 2017). Fungicides in the same FRAC group use the same biochemical
mechanism to disrupt the disease of fungi.
The fungicide groups that are currently registered in Canada to manage SLB are
phthalimides (group M04), chloronitrile fungicides (group M05), demethylation inhibitors (DMI,
group 3), succinate-dehydrogenase inhibitors (SDHI, group 7), anilino-pyrimidine fungicides
(group 9), and strobilurin fungicides (QoI, group 11) but only a few are registered for the
management of SLB (Health Canada, 2020) (Table 1.4). To reduce the risk of the development
of fungicide insensitivity, it is important not to use one mode of action exclusively, but to apply
several modes of action products as a mixture, or rotate between products with different modes
of action (Brent and Hollomon, 2007a). Fungicides containing active ingredients from FRAC
group 7 (fluxapyroxad and fluopyram), and group 3 (difenoconazole) have exhibited the best
SLB reduction in field trials in New York (Dr. F. Hay, Cornell University, personal
communication, 2018). In Italian pear orchards, application of captan (group M04), captan mixed
with tebuconazole (group 3), boscalid (group 7), fludioxonil (group 12), and fluazinam (group
29) have provided sufficient suppression of BSP (Brunelli et al., 2014).
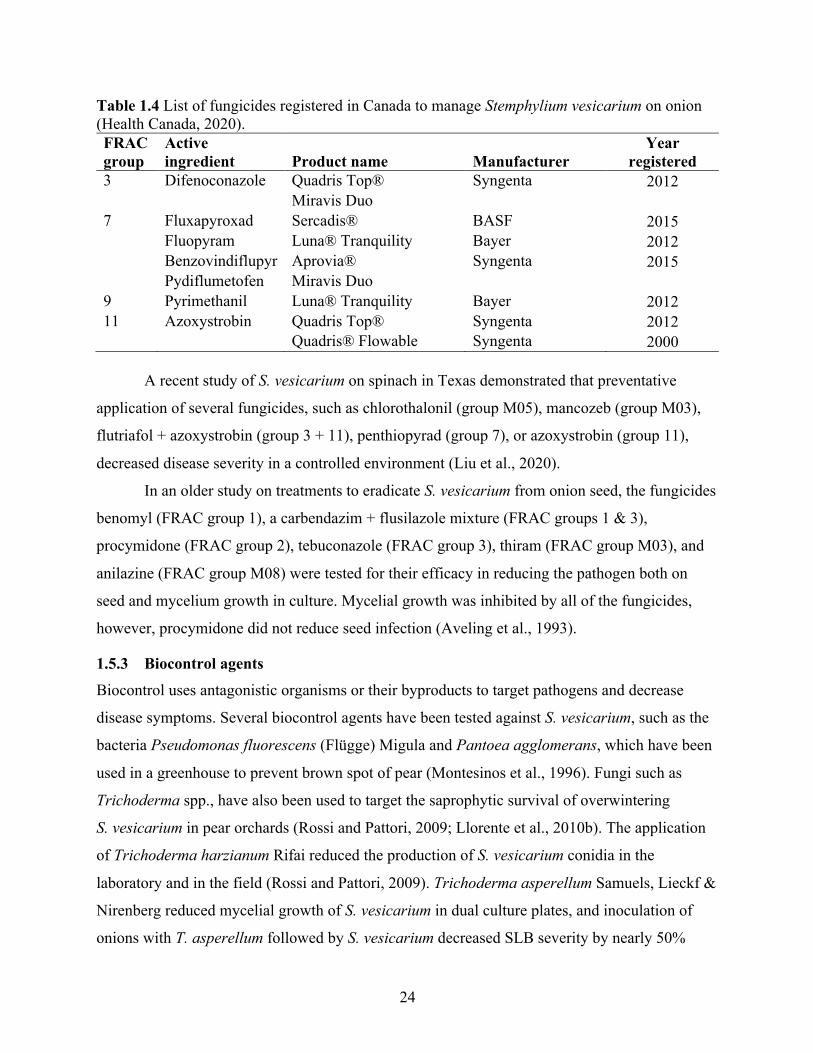
24
Table 1.4 List of fungicides registered in Canada to manage Stemphylium vesicarium on onion (Health Canada, 2020). FRAC group
Active ingredient Product name Manufacturer
Year registered
3 Difenoconazole Quadris Top® Syngenta 2012 Miravis Duo 7 Fluxapyroxad Sercadis® BASF 2015 Fluopyram Luna® Tranquility Bayer 2012 Benzovindiflupyr Aprovia® Syngenta 2015 Pydiflumetofen Miravis Duo 9 Pyrimethanil Luna® Tranquility Bayer 2012 11 Azoxystrobin Quadris Top® Syngenta 2012 Quadris® Flowable Syngenta 2000
A recent study of S. vesicarium on spinach in Texas demonstrated that preventative
application of several fungicides, such as chlorothalonil (group M05), mancozeb (group M03),
flutriafol + azoxystrobin (group 3 + 11), penthiopyrad (group 7), or azoxystrobin (group 11),
decreased disease severity in a controlled environment (Liu et al., 2020).
In an older study on treatments to eradicate S. vesicarium from onion seed, the fungicides
benomyl (FRAC group 1), a carbendazim + flusilazole mixture (FRAC groups 1 & 3),
procymidone (FRAC group 2), tebuconazole (FRAC group 3), thiram (FRAC group M03), and
anilazine (FRAC group M08) were tested for their efficacy in reducing the pathogen both on
seed and mycelium growth in culture. Mycelial growth was inhibited by all of the fungicides,
however, procymidone did not reduce seed infection (Aveling et al., 1993).
1.5.3 Biocontrol agents
Biocontrol uses antagonistic organisms or their byproducts to target pathogens and decrease
disease symptoms. Several biocontrol agents have been tested against S. vesicarium, such as the
bacteria Pseudomonas fluorescens (Flügge) Migula and Pantoea agglomerans, which have been
used in a greenhouse to prevent brown spot of pear (Montesinos et al., 1996). Fungi such as
Trichoderma spp., have also been used to target the saprophytic survival of overwintering
S. vesicarium in pear orchards (Rossi and Pattori, 2009; Llorente et al., 2010b). The application
of Trichoderma harzianum Rifai reduced the production of S. vesicarium conidia in the
laboratory and in the field (Rossi and Pattori, 2009). Trichoderma asperellum Samuels, Lieckf &
Nirenberg reduced mycelial growth of S. vesicarium in dual culture plates, and inoculation of
onions with T. asperellum followed by S. vesicarium decreased SLB severity by nearly 50%
25
under controlled environmental conditions (Zapata-Sarmiento et al., 2020). However,
Trichoderma spp. did not always reduce disease caused by S. vesicarium when applied to pear
trees in the field (Ponti et al., 1993). Endophytic bacteria, such as Bacillus subtilis (Ehrenberg)
Cohn and Bacillus cereus Frankland & Frankland also reduced mycelial growth of S. vesicarium
in dual culture, but have not been tested in planta (Al-Badri et al., 2020).
Biocontrol methods may also include the application of products with antimicrobial
properties. For example, propolis is a resinous material produced by bees that has been used in
alternative medicine for its antibacterial and antifungal properties. In a recent study, propolis
extracts inhibited in vitro growth of S. vesicarium and decreased disease incidence on detached
pears (Loebler et al., 2020). Antimicrobial peptides also reduced mycelial growth of
S. vesicarium and infection on detached pear leaves (Puig et al., 2014). In another study, extracts
from common rue (Ruta graveolens L.) inhibited growth of S. vesicarium by > 60% (Reyes-
Vaquero et al., 2021). However, these extracts have not been tested in the field.
The consistency and efficacy of biocontrol agents alone may not be as high as synthetic
pesticides, because their efficacy is influenced by temperature, pH, moisture, and competition
with other microorganisms in the phyllosphere (Howell, 2003). However, when Trichoderma
spp. were used in combination with leaf litter removal, the disease suppression was comparable
to a fungicide alone (Llorente et al., 2010b). A biocontrol agent containing Trichoderma
atroviridae was tested in one field season in the Holland Marsh, ON, but did not suppress SLB
on onion in Ontario (Stricker et al., 2020). This is an ongoing investigation at the Muck Crops
Research Station. Currently there are no biocontrol agents commercially registered for
management of Stemphylium leaf blight of onion in Canada.
1.5.4 Genetic resistance
Another approach to reducing the impact of S. vesicarium is to develop resistant onion cultivars.
Onion species and cultivars differ in response to S. vesicarium (Behera et al., 2013). Field trials
at the Holland Marsh showed some variation in susceptibility among cultivars, although the
results varied from season to season (Foster et al., 2019). The cultivar Braddock had relatively
low SLB incidence but high numbers of lesions per infected leaf, Milestone had high numbers of
lesions but average leaf dieback symptoms, and Highlander had low lesions per leaf but high leaf
dieback. Overall, no cultivar consistently exhibited strong resistance to SLB (Tayviah, 2017).
Results from other locations are similar (Hoepting, 2020a). An onion cultivar developed in
26
southern India (RO-1) exhibited moderate resistance to SLB (Sharma and Sain, 2003). Another
study in northern India reported three cultivars with moderate resistance (Behera et al., 2013).
The bunching onion cultivar Pusa Soumya and the red onion cultivar Red Creole 2 also exhibited
moderate resistance to SLB in India (Dangi et al., 2019).
Welsh onions (Allium fistulosum) are resistant or moderately-resistant to S. vesicarium
(Pathak et al., 2001; McDonald and Vander Kooi, 2015). A breeding program in Taiwan crossed
A. fistulosum and A. cepa in an effort to develop onion lines resistant to SLB (Pathak et al.,
2001), but no resistant cultivar has been released. An interspecific hybrid of A. cepa and
A. fistulosum was developed that carried recombinant chromosomes with resistance genes
against S. vesicarium and was partially resistant in a field trial (Kudryavtseva et al., 2019). More
research is needed to develop a marketable onion cultivar that is resistant to SLB.
1.5.5 Activated resistance
Plants can respond to biotic and abiotic stresses through the expression of active defence
mechanisms. When appropriately stimulated, plants enter a state of enhanced responsiveness and
capacity for response termed ‘induced resistance’. Disease symptoms can be reduced if these
mechanisms are stimulated before the pathogen is present (Choudhary et al., 2007). There are
two main forms or pathways for induced resistance in plants: systemic acquired resistance (SAR)
and induced systemic resistance (ISR) (Walters and Fountaine, 2009).
A resistance activator product is a substance that, when applied to a plant, activates
resistance responses that decrease damage caused by abiotic stresses or pathogen infection
(Walters and Fountaine, 2009). Resistance activator products may have an acute toxicity to plant
hosts, pathogens, or non-target organisms, but this is often lower than that of synthetic pesticides
(Thakur and Sohal, 2013). Plant activators that have been used for disease management in crops
include acibenzolar-S-methyl, 2, 6- dichloroisonicotinic acid, β-aminobutyric acid, probenazole,
salicylic acid, riboflavin, potassium phosphonate, and methyl jasmonate (Sreeja, 2014).
There is limited literature on activated resistance in onion crops. In one study, foliar
applications of salicylic acid reduced SLB of onion by up to 40% (Abo-Elyousr et al., 2009). The
application of acibenzolar-S-methyl, a structural analog of salicylic acid, also provided some
reduction of Xanthomonas leaf blight of onion caused by the bacteria Xanthomonas axonopodis
pv. allii Kadota (Lang et al., 2007). In a growth chamber study, acibenzolar-S-methyl reduced
27
populations of X. axonopodis pv. allii on onion leaves as effectively as copper hydroxide-
mancozeb pesticide (Gent and Schwartz, 2005).
Civitas (Intelligro, manufactured by Petro-Canada Lubricants, Inc., a Suncor Energy
Business, Mississauga, ON, Canada) is a food-grade mineral oil product that is often mixed with
Harmonizer™ Pigment Dispersion (polychlorinated copper phthalocyanine pigment), which has
been registered for use in the United States and Canada for turfgrass diseases, as well as some
insects (http://www.civitasturf.com). Civitas has an ISR mode of action (Cortes-Barco et al.,
2010), while the mode of action of Harmonizer may involve both ISR and SAR components (T.
Hsiang, University of Guelph, personal communication, 2017). The current research project
included an early drench application of Civitas soon after emergence, to assess if this product can
provide early-season protection from SLB.
1.5.6 Forecasting models
Growers in Ontario have used a calendar-based method weekly or bi-weekly, to time application
of fungicides for SLB management. This method does not depend on weather conditions or
knowledge of the biology of the pathogen, and can result in more applications than necessary
(Llorente et al., 2012). Unnecessary applications are not economical for the grower and can
increase the risk of fungicide insensitivity developing in the pathogen population (Alberoni et al.,
2010b). More recently the IPM program has been providing indications of disease risk and spray
timing based on the research presented in this thesis and previous research summarized in
Stricker et al. (2021).
Forecasting models use environmental factors to predict conditions that are conducive to
disease development and may recommend when growers should apply pesticides. When used
correctly, forecasting models can provide the same or better disease suppression as calendar-
based methods, often with fewer fungicide applications. For instance, FAST, a forecast model
developed for Alternaria solani Sorauer on tomatoes, achieved comparable disease suppression
for brown spot of pear (BSP) as the 7-day calendar spray with 28% fewer applications
(Montesinos and Vilardell, 1992). Another forecasting model, BSPcast, was designed for
S. vesicarium in pear orchards (Montesinos et al., 1995). Validation of the model confirmed that
the BSPcast-guided schedules used 20–50% fewer sprays and provided the same degree of
disease suppression as a weekly application of thiram (Llorente et al., 2010b). The PAMcast
model (Pleospora allii maturation forecast) was designed to include the environmental
28
conditions conducive to the development of the sexual phase of S. vesicarium (Llorente and
Montesinos, 2004). PAMcast has been used to determine the date to begin the BSPcast
forecasting system (Llorente et al., 2006).
The TOMcast model was developed based on the FAST model to manage foliar diseases
of tomato in Ontario (Pitblado, 1992). Disease severity values (DSVs) were calculated based on
leaf wetness duration and the average temperature during the wet period and sprays were
recommended when the sum of daily values reached a set threshold (Montesinos and Vilardell,
1992). Ideally a disease forecasting model should reduce the number of sprays without
compromising onion yield and quality. In a recent study, fungicides applied to onion according
to TOMcast maintained comparable SLB incidence and severity compared to a calendar spray
treatment under high disease pressure (Stricker et al., 2020). In years when the disease pressure
was low, the SLB severity was not different than the unsprayed control. However, there was
suspicion at this time that the S. vesicarium population was largely insensitive to most of the
active ingredients applied, which would explain why there was little or no reduction in SLB
severity or increase in crop yield in that study (Stricker et al., 2020).
TOMcast has also been successfully used for management of purple spot of asparagus
(Meyer and Hausbeck, 2000). On some cultivars of asparagus, TOMcast can even improve the
management of Stemphylium leaf spot without increasing the number of fungicide applications
(Foster and McDonald, 2018). In 2012 and 2013, TOMcast reduced the number of fungicide
applications on asparagus by 1 or 2 sprays, but sometimes recommended more sprays than the
calendar-based method depending on the threshold selected (Foster, 2018). To our knowledge, a
forecasting model specifically for S. vesicarium on onion has not yet been developed.
1.6 Fungicide insensitivity
The application of fungicides in agricultural systems is an essential part of crop management to
maintain healthy crops and to safeguard crop yield and quality. Frequent use of a single
fungicide can result in insensitivity in pathogen populations and a loss of disease suppression
over time (Lucas et al., 2015). Fungicide insensitivity builds up in a fungal population treated
with fungicides, beginning with the survival of rare mutants that are not killed by the fungicide
(Brent and Hollomon, 2007a). If the mutation is not associated with a major fitness cost, the
mutants survive and reproduce, which results in a population containing more insensitive isolates
29
in the next generation (Lucas et al., 2015). Repeated fungicide treatments can result in a rapid
shift in the fungal population, until eventually the whole population consists of completely
insensitive individuals.
The ability to reproduce sexually often increases the population diversity, can limit the
accumulation of deleterious alleles, and increases the potential for adaptation to changes in the
environment (Ene and Bennett, 2014). The ‘Red Queen Hypothesis’ states that host-pathogen
relationships lead to co-adaptation cycles, where sexual outcrossing of the host promotes further
adaptation by the pathogen as both host and pathogen try to stay ahead in an ‘arms race’ (Van
Valen, 1973). This has been confirmed by a study on roundworm (Caenorhabditis elegans
Maupas) and a bacterial parasite (Serratia marcescens Bizio), where populations of the parasite
that were unable to sexually reproduce were driven to extinction and those capable of
outcrossing survived (Morran et al., 2011). Sexual reproduction may increase the risk of a
pathogen population developing insensitivity to fungicides, although not always (Brent and
Hollomon, 2007b). This highlights the importance of confirming whether sexual reproduction of
S. vesicarium is occurring in or near the onion fields in Ontario.
There are two main types of fungicide insensitivity: qualitative and quantitative.
Qualitative insensitivity is typically conferred by a single-point mutation in the fungicide target
gene, which leads to complete insensitivity (Lucas et al., 2015). As a result, individuals in the
population will be either fully sensitive or fully insensitive. Insensitivity to quinone outside
inhibitor (QoI) fungicides due to the G143A mutation in the cytochrome b complex is an
example of qualitative insensitivity (Lucas et al., 2015). Another example would be point
mutations in the Bcmdl1 and Bcpos5 genes, which resulted in anilinopyrimidine insensitivity in
Botrytis cinerea Pers. ex Fr. (Mosbach et al., 2017). Quantitative insensitivity occurs when
mechanisms are available to export or otherwise detoxify the fungicide, resulting in varying
levels of insensitivity (Deising et al., 2008). For example, mutations in various locations within
the ß-tubulin gene have been linked to benzimidazole (FRAC group 1) insensitivity in several
plant pathogens. Moderately insensitive strains of Gibberella zeae (Schwein.) Petch exhibited
single-point mutations, and a highly insensitive isolate had two mutations (Chen et al., 2009).
Rapid increases in the frequency of extreme phenotypes of quantitative insensitivity are the
outcome of strong selection pressure, where individuals that are able to survive have passed on
30
their genes, and repeated exposure to the fungicide has shifted the population towards increasing
insensitivity.
Four key mechanisms by which fungicide insensitivity is acquired are alteration of the
target protein, overexpression of the target, degradation of the fungicide by metabolic enzymes,
and efflux pumps that remove the fungicide from within the cell or away from the fungicide
action site (Lucas et al., 2015). Additionally, fungicides may be converted into nontoxic
compounds through biotransformation and conjugation (Kim et al., 2004). Fungicides with a
single site of action are more at risk for the development of insensitivity (Brent and Hollomon,
2007a). The sensitivity to a fungicide is typically measured by calculating the fungicide
concentration that causes 50% inhibition (EC50) of conidial germination or mycelial growth
compared to the nonamended control treatment (Gupta, 2016).
Countermeasures to prevent the development of fungicide insensitivity include reducing
the dose or number of fungicide applications, and mixing or alternating with fungicides that have
different modes of action (Lucas et al., 2015). However, the use of reduced fungicide doses to
slow fungicide insensitivity development is controversial; some studies report that low doses
increased this phenomenon (Ayer et al., 2020), and others report that it did not impact fungicide
insensitivity development (Pijls and Shaw, 1997). Monitoring for fungicide insensitivity is an
important tool that augments resistance management strategies such as adjusting application
frequency, using cultural management methods, or mixing with non-cross-resistant products to
ensure the continued effectiveness of the product. It is especially important considering the high
cost of research, development, and registration of new pesticides.
The development of fungicide insensitivity has been linked to multiple fungicide
applications in a growing season and three major risk factors: high genetic diversity of the
pathogen, short generation time, and high potential for reproduction and dispersal of propagules
(Brent and Hollomon, 2007a). Pathogens with polycyclic life cycles that produce windborne
propagules will have a higher risk for developing fungicide insensitivity, especially in cropping
systems with large monoculture fields (Gossen et al., 2014).
1.6.1 Fungicide insensitivity in Stemphylium vesicarium
Researchers have reported S. vesicarium populations that are insensitive to fungicides for the
past two decades. Populations on onion are at high risk of insensitivity because onion is grown
31
on a large-scale and routinely receives multiple fungicide applications during a growing season,
and S. vesicarium possesses all three of the risk factors for fungicide insensitivity: short asexual
reproductive generations, production of air-borne spores and potential for sexual reproduction
each year.
Brown spot of pear caused by S. vesicarium has caused economic losses since the early
1980s (Ponti et al., 1982), which is likely why most publications on the fungicide insensitivity in
S. vesicarium are focused on that disease. Several fungicides have previously provided effective
SLB or BSP suppression, but the efficacy varies by product and crop, and has decreased over
time. One fungicide group that is registered for use on onion in Canada is the quinone outside
inhibitor group (QoI; FRAC group 11, also known as strobilurins). QoIs disable the production
of energy (adenosine triphosphate) in fungal pathogens by blocking the transfer of electrons at
the outer quinone site of the cytochrome bc1 complex in the electron transport chain (Bartlett et
al., 2002). This can have a profound effect on conidial germination as well as mycelial growth
(Jin et al., 2009). Insensitivity to group 11 fungicides has been documented in pear orchards in
Italy since 2006 (Collina et al., 2007).
The alternative respiration system, the use of efflux transporters, or mutations that may
change the structure of proteins within the cytochrome complex could all result in QoI-
insensitivity (Fernández-Ortuño et al., 2008). Qualitative insensitivity to this group of fungicides
is commonly conferred by a single nucleotide polymorphism which results in an amino acid
substitution of glycine with alanine at position 143 (G143A) on cytochrome b (Bartlett et al.,
2002). Two other mutations have also been identified: phenylalanine to leucine at position 129
(F129L) and glycine to arginine at position 137 (G137R) (Gisi et al., 2002). QoI fungicides have
been available since 1996, and insensitive fungi were reported 4 years later (Heaney et al., 2000).
A QoI-insensitive isolate of S. vesicarium was first detected in an Italian pear orchard,
and the G143A mutation was confirmed (Collina et al., 2007). This mutation was also detected in
azoxystrobin-insensitive strains of S. vesicarium in New York state (Hay et al., 2019). In
addition, cross-insensitivity between azoxystrobin and pyraclostrobin (another QoI) has been
documented (Hay et al., 2019). QoI insensitivity due to G143A has been documented in several
other plant pathogenic fungi, including Botrytis cinerea, Didymella rabiei (Kovatsch.) Arx,
Magnaporthe grisea (T.T. Hebert) M.E. Barr, and Cercospora beticola Sacc. (Kim et al., 2003;
Banno et al., 2009; Bolton et al., 2013; Owati et al., 2017). The F129L mutation site has been
32
documented in Alternaria solani, a relative of S. vesicarium (Rosenzweig et al., 2008). In
addition, the frequency of the F129L substitutions within the A. solani population was dependent
on management practices (Rosenzweig et al., 2008).
Dicarboximide fungicides (FRAC group 2) interfere with of the osmotic signal
transduction pathway, which consists of histidine kinase (HK) and mitogen-activated protein
(MAP) kinase cascades (Yamaguchi and Fujimura, 2005). Mutations in the HK gene SvHK1
conferred degrees of sensitivity to dicarboximide fungicides in S. vesicarium isolates from pear
orchards in Italy (Alberoni et al., 2010b). Isolates that are sensitive to procymidone and
iprodione but moderately insensitive to vinclozolin exhibited the F267L mutation, while those
highly insensitive to procymidone but moderately insensitive to the other dicarboximide
exhibited the L290S mutation, and isolates highly insensitive to all dicarboximides exhibited
T765R or Q777R mutations in the SvHK1 gene (Alberoni et al., 2010b). This is an example of
quantitative insensitivity. Dicarboximide-insensitive strains of Alternaria brassicicola
(Schwein.) Wiltshire may also have mutations in AbNIK1, a HK gene (Avenot et al., 2005).
Other researchers have reported other HK gene mutations that result in insensitivity to
dicarboximide fungicides in Alternaria alternata, Sclerotinia sclerotiorum, and B. cinerea,
among others (Dry et al., 2004; Fillinger et al., 2012; Duan et al., 2013). In a recent study,
S. vesicarium isolates collected in New York state were sensitive to iprodione (EC50 < 0.5 μg a.i.
mL-1) (Hay et al., 2019). Iprodione is not registered for use on onion in Canada.
Phenylpyrrole fungicides (PP; FRAC group 12) are derived from an antifungal compound
produced by Pseudomonas spp. (Gehmann et al., 1990). The mode of action of this group
appears to differ for each active ingredient. One study has shown that exposure to fenpiclonil
results in the accumulation of the lipophilic cation tetraphenyl-phosphonium bromide, which
modifies the membrane potential of the mitochondria (Jespers et al., 1993). A subsequent study
documented the intracellular accumulation of glycerol and mannitol, which suggested that the
mode of action may be inhibition of the phosphorylation of glucose (Jespers and De Waard,
1995). The proposed mode of action for fludioxonil is that binding to the class III hybrid
histidine kinase (HHK) mimics osmotic stress by activating Os-2/Hog1 MAP kinases (reviewed
in Kilani and Fillinger, 2016). Only a few mutations for insensitivity have been documented and
mapped to the class III HHK genes in Alternaria spp. (Iacomi-Vasilescu et al., 2004) and
B. cinerea (Ren et al., 2016). In New York, S. vesicarium isolates were highly sensitive to
33
fludioxonil (Hay et al., 2019), but fludioxonil-insensitive isolates of S. eturmiunum have been
isolated from garlic in China (Chen et al., 2020).
It has been proposed that anilinopyrimidine fungicides (AP; FRAC group 9) inhibit the
biosynthesis of methionine, and the proposed target is cystathionine β-lyase or cystathionine γ-
synthase (Jeschke et al., 2019). However, this was recently disputed, because pyrimethanil
affects an unknown gene that simultaneously controls methionine, cystine, and cysteine
biosynthesis in S. sclerotiorum (Hou et al., 2018). Another recent study identified nine genes for
nuclear-encoded proteins targeted to the mitochondria that contain insensitivity-conferring
mutations; Bcmdl1E407K and Bcpos5L412F mutations accounted for 76% of AP insensitive isolates
in Botrytis cinerea on grape (Mosbach et al., 2017). Several isolates of S. vesicarium collected in
New York state were insensitive (EC50 > 10 μg a.i. mL-1) to the AP fungicides cyprodinil and
pyrimethanil (11 and 15 insensitive isolates out of 46, respectively) (Hay et al., 2019). It is
unclear if this type of insensitivity is qualitative or quantitative.
Succinate dehydrogenase inhibitor fungicides (SDHI; FRAC group 7) , which target the
succinate dehydrogenase complex in the mitochondrial respiration chain (Keon et al., 1991),
have been in use since the late 1960s. SDHIs inhibit spore germination, germ-tube elongation,
mycelial growth, and sporulation by blocking electron transport in the mitochondrial respiratory
chain through inhibition of succinate dehydrogenase (complex II) (Lunn, 2011). Succinate
dehydrogenase is an enzyme necessary for aerobic respiration and is constructed of four nuclear
encoded protein subunits: sdhA, sdhB, sdhC, and sdhD (Hägerhäll, 1997). SDHI fungicides bind
to the ubiquinone binding site that is formed by the interface of the sdhB, sdhC and sdhD
subunits (Avenot and Michailides, 2010). Mutations that result in SDHI insensitivity have been
documented in all three of these subunit genes (Sun et al., 2016). In addition, each mutation
confers differing degrees of insensitivity to individual active ingredients in the SDHI group
(Scalliet et al., 2012). Isolates may possess one to eight different sdh substitution mutations,
resulting in a range of sensitivity phenotypes (low, moderate, or high insensitivity to the active
ingredient) (Pearce et al., 2019). In a recent study, most of the S. vesicarium isolates collected in
New York were sensitive to the SDHI fungicides fluopyram and fluxapyroxad, but over half
were insensitive to boscalid, with an EC50 > 10 μg a.i. mL-1 (Hay et al., 2019). Insensitivity to
SDHIs is considered to be quantitative insensitivity.
34
Some genetic mutations can increase sensitivity to SDHI fungicides; the greater
sensitivity to fluopyram and boscalid of some isolates of Fusarium tucumaniae O’Donnell &
Aoki was attributed to the mutation G277R in sdhB (Sang et al., 2018). The sdhB-H277Y
mutation in Alternaria alternata and sdhB-H267T in Clarireedia jacksonii Beirn, B.B. Clarke,
C. Salgado & J.A. Crouch both resulted in sensitivity to fluopyram but also conferred decreased
sensitivity to boscalid (Avenot and Michailides, 2010; Popko et al., 2018). Some isolates of
A. alternata with the H277Y/R mutation in sdhB exhibited insensitivity to boscalid but were
sensitive to fluopyram, while isolates with the H134R mutation in sdhC or H133R in sdhD were
insensitive to both active ingredients (Avenot et al., 2014, 2019). Of 118 A. solani isolates with
the D123E mutation in sdhD, 80% exhibited insensitivity to boscalid and 50% exhibited slight
insensitivity to fluopyram (EC50 = 0.2–3 µg a.i. mL-1) (Bauske et al., 2018). Additionally,
isolates of Botrytis cinerea that were insensitive to boscalid were sensitive to fluopyram (EC50 =
0.01–1.96 µg a.i. mL-1), which was associated with the sdhB-N230I mutation (Fernández-Ortuño
et al., 2017). Fluopyram binds in a different manner to the cavity within the sdhB protein than
other SDHI active ingredients, which may explain the few reported cases of cross-insensitivity
with other group 7 fungicides (Fraaije et al., 2012).
Field trials in New York in 2017 demonstrated that fungicides containing fluopyram
reduced SLB severity by 69% compared to the unsprayed control (Hoepting, 2018a).
Additionally, in vitro studies in New York demonstrated a high level (> 90%) of sensitivity to
fluopyram in the S. vesicarium population in New York (Hay et al., 2019). Over half of the
isolates in New York were insensitive to another SDHI fungicide, boscalid (Hay et al., 2019).
However, it is important to note that due to the different binding capacity, the results from
boscalid cannot extrapolated to other fungicides in group 7 such as fluopyram, fluxapyroxad, and
benzovindiflupyr.
Demethylation inhibitor fungicides (DMI; FRAC group 3) destabilise cell membranes by
inhibiting C14 demethylation during sterol formation (Ziogas and Malandrakis, 2015). DMIs
specifically prevent the formation of membrane sterols by targeting sterol 14α-demethylase
cytochrome P450 (Joseph-Horne and Hollomon, 1997). Insensitivity to DMI fungicides is often
quantitative and can be conferred through many different mechanisms, including modification of
the target site CYP51 gene, overexpression of CYP51, reduced accumulation of DMIs in fungal
cells, or the production of paralogues (gene copies within the genome which may be slightly
35
different) of the target gene (Ziogas and Malandrakis, 2015). Other point mutations (Mair et al.,
2016), overexpression of the fungicide target gene (Ma et al., 2006), overexpression of
transmembrane transport proteins (Price et al., 2015), or changes in sterol biosynthesis
(Karaoglanidis et al., 2001) can also result in DMI-insensitivity.
Insensitivity to DMI fungicides has not been previously documented for Stemphylium
vesicarium, but a recent study suggests that increased tolerance to DMIs in populations of
Alternaria alternata in China may have increased. Isolates of A. alternata were collected from
seven regions in China, and growth was inhibited by 0.12–0.2 μg a.i. mL-1 but the amount of
inhibition differed by region (He et al., 2019). Reduced-sensitivity to the DMI fungicide
difenoconazole has been reported for two other fungal pathogens, Stemphylium solani on cotton
(Mehta and Oliveira, 1998) and Venturia inaequalis (Cooke) G. Winter in apple orchards
(Mondino et al., 2015), which are both also in the order Pleosporales. However, of the 46
S. vesicarium isolates collected in New York, 98% were sensitive (EC50 < 0.5 μg a.i. mL-1) to
difenoconazole (Hay et al., 2019).
Insensitivity to multi-site fungicides, such as FRAC groups M03, M04, and M05, is rare.
A mancozeb-insensitive (group M03) strain of A. alternata was reported in South Greece on
tomatoes (Malandrakis et al., 2015), which may be the first and only report of insensitivity to this
fungicide group. The mechanism of insensitivity has not been explained. Symptoms caused by
S. solani on cotton in Brazil were reduced when treated with 2000 g a.i. ha-1 mancozeb (Mehta
and Oliveira, 1998), but this treatment did not differ from the unsprayed control when the
experiment was repeated. Also, recent field studies in New York using mancozeb did not
suppress SLB (Hoepting, 2018a, 2019, 2020b; c). Fungicides containing mancozeb have not
been registered for management of SLB in Canada. Insensitivity to fungicides in the FRAC
group M05, such as chlorothalonil, has not yet been reported (FRAG-UK, 2016).
There has been no assessment of in vitro fungicide sensitivity of S. vesicarium in onion
production systems in Canada. For several years, researchers at the Muck Crops Research
Station in the Holland Marsh, ON, have been testing fungicides for the management of
S. vesicarium on onions. From 2014–2019 field seasons, none of the commercial fungicides
selected from various FRAC groups decreased the severity of SLB compared to the control
(Stricker et al., 2020). To select fungicides that are effective in the field, the S. vesicarium
population of southern Ontario should be screened for sensitivity to active ingredients of

36
commonly used fungicides, so the use of products for which high levels of insensitivity are
present in the population can be avoided, or the use pattern modified.
1.7 Hypothesis and Objectives
The overall objective of this project was to improve the management of Stemphylium leaf blight
of onion in Ontario. The specific objectives of the proposed work were as follows:
Pathogen identification:
1. Confirm the identify of S. vesicarium using molecular methods.
Sources of inoculum:
2. Assess alternative hosts in the Holland Marsh for susceptibility to S. vesicarium.
3. Determine the overwintering survival of S. vesicarium on onion in Ontario.
4. Assess infected seed as a potential source of primary inoculum for onions.
Fungicides:
5. Screen the pathogen population for in vitro insensitivity to common fungicides used on
onion, especially azoxystrobin and fluopyram.
6. Assess existing disease forecasting models for SLB to identify the most effective ones.
Abiotic Factors:
7. Determine if plant stress by drought increases susceptibility to S. vesicarium.
8. Identify weather factors that affect the concentration of air-borne S. vesicarium spores.
The hypotheses of the proposed work are as follows:
1. The pathogen causing leaf blight symptoms in the Holland Marsh is S. vesicarium.
2. Common weed species in the Holland Marsh are hosts of S. vesicarium and act as
reservoirs of inoculum.
3. S. vesicarium produces overwintering structures on onion residue.
4. Infection of onion seed by S. vesicarium can occur in the field during flowering and
resulting seedlings are infected with S. vesicarium.
5. The S. vesicarium population in onion-growing regions of southern Ontario is insensitive
to fungicides in the FRAC groups 11, 7, 3, and 9.
37
6. A forecasting model based on environmental conditions can be used to trigger fungicide
applications to provide comparable suppression levels as a calendar-based spray
schedule, with a lower number of applications.
7. Drought stress increases severity of SLB symptoms on onion.
8. Weather factors related to increased leaf wetness, humidity, and precipitation increase
sporulation of S. vesicarium.
These objectives were chosen to address gaps in the existing research regarding SLB on
onion in Ontario. The pathogen has previously only been identified based on morphology, but
confirmation of the identity using molecular methods is desired because many species of
Stemphylium are morphologically similar. Growers in the region report an increase in SLB
severity over the past decade, which may be associated with plant stress, increased inoculum, or
decreased fungicide efficacy. This research aimed to gain more information about the
epidemiology of SLB and develop improved management strategies for onion growers in
Ontario.
38
Chapter 2 Epidemiology and life cycle of Stemphylium vesicarium The results from the gene sequencing of S. vesicarium have been published (Foster et al., 2019).
2.1 Introduction
Stemphylium vesicarium can infect and cause disease on a range of plant hosts. SLB of onion is
currently managed through integrated pest management (IPM) strategies that include fungicide
application and cultural management methods. Effective IPM requires knowledge of the
pathogen’s identity, life cycle, and alternative hosts. It is also important to correctly identify a
pathogen to assess results from the available literature. Microscopy is often used to identify
fungal spores, but identifying the spores of Stemphylium to species is difficult because of
overlapping morphological characteristics within the genus and even among related species. The
Stemphylium genus is somewhat morphologically similar to genera such as Alternaria and
Ulocladium, which also produce multicellular conidia on proliferating conidiophores with
apically-swollen conidiogenous cells (Simmons, 1967). Furthermore, symptoms caused by
Alternaria porri on onion can be confused with SLB (Denis et al., 2010) by those who are not
trained in disease identification. In the genus Stemphylium, spore size and colony morphology
can be variable (Hassan et al., 2020), so identification based on the internal transcribed spacer
(ITS) and glyceraldehyde-3-phosphate dehydrogenase (gapdh) gene sequences has largely
replaced morphology for species validation. Other gene regions that have been used to
discriminate among Stemphylium spp. include the translation elongation factor 1α (TEf-A),
cytochrome b (cytB), calmodulin, actin assembly-inducing protein, histidine kinase (HK) and the
intergenic spacer between the vacuolar membrane ATPase catalytic subunit A gene and the
vacuolar protein sorting-associated protein (vmaA-vpsA) (Câmara et al., 2002; Samac et al.,
2014; Graf et al., 2016; Woudenberg et al., 2017; Das et al., 2019). The species S. vesicarium,
S. herbarum, S. alfalfae, S. tomatonis, and S. sedicola were combined in a single clade within the
genus because they could not be differentiated even using molecular methods (Inderbitzin et al.,
2009; Wang et al., 2010; Woudenberg et al., 2017).
Once the identity of the pathogen has been established, the next step is to describe the
disease cycle. The timing of fungicide applications can often be improved through an
understanding of the biology of the target pathogen. Also, the efficacy of cultural management
methods often depends on exploiting a vulnerable period in the disease cycle. Determining when
39
management practices should begin in a growing season can be an important component of IPM.
For example, onion growers in Nova Scotia commonly use the first detection of S. vesicarium
spores on onion or barley leaf tissue in the growing season as the action threshold to initiate the
application of foliar fungicides to manage SLB (Dr. P. Hildebrand, Hildebrand Disease
Management, personal communication). In Ontario, growers typically begin spraying when the
onion crop has reached the 3–4 leaf growth stage, or when SLB symptoms have been reported in
the area. A recent study demonstrated that the number of applications per season in Ontario
could be substantially reduced using any one of several disease forecasting programs (Tayviah,
2017; Stricker et al., 2020).
Removal of plant residue, such as fallen fruit, dead leaves, and weeds, is used to manage
brown spot of pear caused by S. vesicarium in pear orchards, since these residues may be a
source of inoculum of S. vesicarium (Rossi et al., 2005a, 2008; Köhl et al., 2009; Llorente et al.,
2010b). Removal of crop residue practice is also recommended in garlic and asparagus fields to
manage diseases caused by S. vesicarium (Johnson, 1990; Katoch and Kumar, 2017). In Ontario,
the current IPM recommendations for onions include rotation with non-host crops, destroying
infected crops, application of registered fungicides, and minimizing damage caused by herbicide
applications and onion thrips (OMAFRA, 2009).
Reduction of primary inoculum is one management tactic that can be incorporated into
IPM strategies, so it is important to know where it originates. In theory, reducing initial inoculum
for polycyclic diseases is not as important as reducing the rate of disease development. The
relationship of initial development and disease development for SLB on onion in Ontario is not
yet known. It is also not known how and where S. vesicarium overwinters in or near onion fields
in Ontario. High levels of air-borne ascospores are present in early spring in or near onion fields
in Ontario (Gossen et al., 2021). This indicated that pseudothecia, which are initiated in the fall
to produce ascospores in spring, are certainly present near onion fields in late winter or early
spring. One possible source of ascospores could be viable pseudothecia in overwintered onion
leaf residue, as has been observed in warmer climates such as Spain, Italy, and India (Basallote-
Ureba et al., 1999; Rossi and Pattori, 2009; Katoch and Kumar, 2017). However, a small study
did not find pseudothecia after winter on onion residue in this region in one year of testing
(Gossen et al., 2021). Another possibility is that the pathogen, which has a wide host range,
overwinters on some other plant hosts in the region.
40
It is also possible that inoculum on the seed at planting contributes to early SLB
development (Neergaard, 1977). The pathogen has been reported at high rates in seed of
commercial onion (Aveling et al., 1993) and radish seed (Belisario et al., 2008), and has also
been isolated from turfgrass seeds (Ban et al., 2021). Many seed companies take active measures
to minimize this possibility, such as treating the seeds with a hot water bath prior to sale (Stokes
Seed, personal communication). Therefore, there are several potential sources of primary
inoculum of S. vesicarium in the Holland Marsh: onion leaf residues left in the field, local plant
species that are alternative hosts, and seed-borne propagules of S. vesicarium.
The objectives of the study were i) to sequence diagnostic gene regions of isolates to
validate the species identification (part of this work has been published, Foster et al., 2019), ii) to
determine if S. vesicarium survives overwinter on onion leaves in the region; iii) to assess if local
weed species are alternative hosts for S. vesicarium, and iv) to determine if seed-borne
S. vesicarium is a potential source of primary inoculum in southern Ontario.
2.2 Materials and methods 2.2.1 Sample preparation and growth media
Isolates of S. vesicarium were obtained from symptomatic onion leaves. The leaves were surface
sterilized as follows: samples were dipped in 70% ethanol for 30 sec, then in 5% commercial
bleach (0.5% sodium hypochlorite v/v) for 1 min, followed by a rinse with sterile water for 2
min. Leaf pieces were cultured on V8-agar media (200 mL V8 juice [Campbell Soup Co.,
Etobicoke, ON], 3 g calcium carbonate [Sigma-Aldrich, Oakville, ON], 20 g agar [Fisher
Scientific, Mississauga, ON], and 800 mL deionized water) in plastic Petri dishes (90 mm dia
×15 mm, Fisher Scientific, Fair Lawn, NJ) sealed with Parafilm (Bemis Company, Inc., WI).
This medium was also used for routine culture of S. vesicarium. When culturing fungi from
onion, leek, or asparagus samples collected from the field, the V8 media was amended with
antibiotics (250 mg L-1 ampicillin [Sigma-Aldrich, Oakville, ON], 150 mg L-1 streptomycin
[Sigma-Aldrich, Oakville, ON]). If conidia were required for identification or inoculation, the
colonies were incubated under UV light (15 watt F15T8/BLB, Westinghouse Lamps, McNulty,
PA) (12 h on / 12 h off) at room temperature for 3–5 days to stimulate production of conidia.
41
2.2.2 Pathogen identification
Morphological characteristics
Isolates were obtained from commercial onion fields in Ontario, at the Holland Marsh
(44.0415°N, 79.6001°W), Grand Bend (43.241226°N, 81.816714°W), and Keswick
(44.223634°N, 79.417749°W), and from asparagus fields from five counties in southern Ontario.
Two historical isolates were purchased from the Canadian Collection of Fungal Cultures (Ottawa
Research and Development Centre, Agriculture and Agri-Food Canada), and three isolates were
contributed by Dr. P.D. Hildebrand from commercial onion fields in Kings County, NS. Five
isolates were cultured from onion seed collected from flowers that had been naturally inoculated
at the Muck Crops Research Station in the Holland Marsh (Table 2.1). Symptomatic tissue was
collected, surface sterilized, and plated onto V8 agar amended with antibiotics. Fungal colonies
that matched the desired phenotype were purified by hyphal-tip culture.
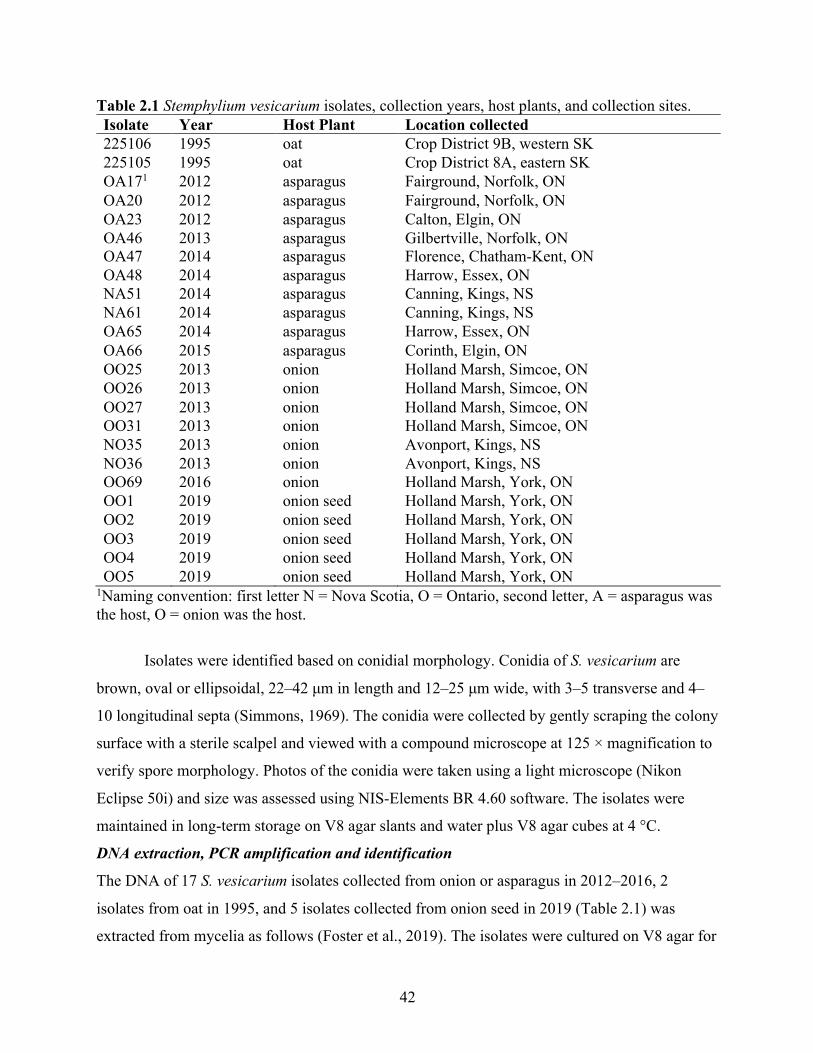
42
Table 2.1 Stemphylium vesicarium isolates, collection years, host plants, and collection sites. Isolate Year Host Plant Location collected 225106 1995 oat Crop District 9B, western SK 225105 1995 oat Crop District 8A, eastern SK OA171 2012 asparagus Fairground, Norfolk, ON OA20 2012 asparagus Fairground, Norfolk, ON OA23 2012 asparagus Calton, Elgin, ON OA46 2013 asparagus Gilbertville, Norfolk, ON OA47 2014 asparagus Florence, Chatham-Kent, ON OA48 2014 asparagus Harrow, Essex, ON NA51 2014 asparagus Canning, Kings, NS NA61 2014 asparagus Canning, Kings, NS OA65 2014 asparagus Harrow, Essex, ON OA66 2015 asparagus Corinth, Elgin, ON OO25 2013 onion Holland Marsh, Simcoe, ON OO26 2013 onion Holland Marsh, Simcoe, ON OO27 2013 onion Holland Marsh, Simcoe, ON OO31 2013 onion Holland Marsh, Simcoe, ON NO35 2013 onion Avonport, Kings, NS NO36 2013 onion Avonport, Kings, NS OO69 2016 onion Holland Marsh, York, ON OO1 2019 onion seed Holland Marsh, York, ON OO2 2019 onion seed Holland Marsh, York, ON OO3 2019 onion seed Holland Marsh, York, ON OO4 2019 onion seed Holland Marsh, York, ON OO5 2019 onion seed Holland Marsh, York, ON
1Naming convention: first letter N = Nova Scotia, O = Ontario, second letter, A = asparagus was the host, O = onion was the host.
Isolates were identified based on conidial morphology. Conidia of S. vesicarium are
brown, oval or ellipsoidal, 22–42 μm in length and 12–25 μm wide, with 3–5 transverse and 4–
10 longitudinal septa (Simmons, 1969). The conidia were collected by gently scraping the colony
surface with a sterile scalpel and viewed with a compound microscope at 125 × magnification to
verify spore morphology. Photos of the conidia were taken using a light microscope (Nikon
Eclipse 50i) and size was assessed using NIS-Elements BR 4.60 software. The isolates were
maintained in long-term storage on V8 agar slants and water plus V8 agar cubes at 4 °C.
DNA extraction, PCR amplification and identification
The DNA of 17 S. vesicarium isolates collected from onion or asparagus in 2012–2016, 2
isolates from oat in 1995, and 5 isolates collected from onion seed in 2019 (Table 2.1) was
extracted from mycelia as follows (Foster et al., 2019). The isolates were cultured on V8 agar for
43
3 days at room temperature (22 °C) and darkness, after which four 5-mm-dia. plugs were taken
from the edge of an actively growing colony and transferred into a flask containing 100 mL
potato dextrose broth media (Difco, Becton Dickinson, and Co., Sparks, MO). The inoculated
flasks were incubated at room temperature on an orbital shaker at 90 rpm, and mycelial mats
were collected 14 days later by filtering through sterile cheesecloth. The mats were transferred to
sterile micro-centrifuge tubes containing one tungsten carbide bead and flash frozen in liquid
nitrogen. DNA was extracted using a DNeasy Plant Kit (Qiagen, Toronto, ON) according to the
manufacturer’s protocol and stored at -80 °C.
Species-specific primers were selected based on previous literature (Table 2.2) to amplify
regions of the ITS, gapdh, TEf-A, cytB, and vmA-vspA genes of S. vesicarium, based on
GenBank accessions. In a previous study, the ITS, gapdh, and TEf-A sequences were used to
separate S. vesicarium (syn. P. herbarum) from other closely related Stemphylium spp.
(Inderbitzin et al., 2009). The cytB sequence (Graf et al., 2016) was included to differentiate
S. vesicarium from S. botryosum, since the two pathogens have similar host ranges and
distributions. VmaA-vpsA has been used for evolutionary studies of Stemphylium species
(Inderbitzin et al., 2009; Graf et al., 2016).
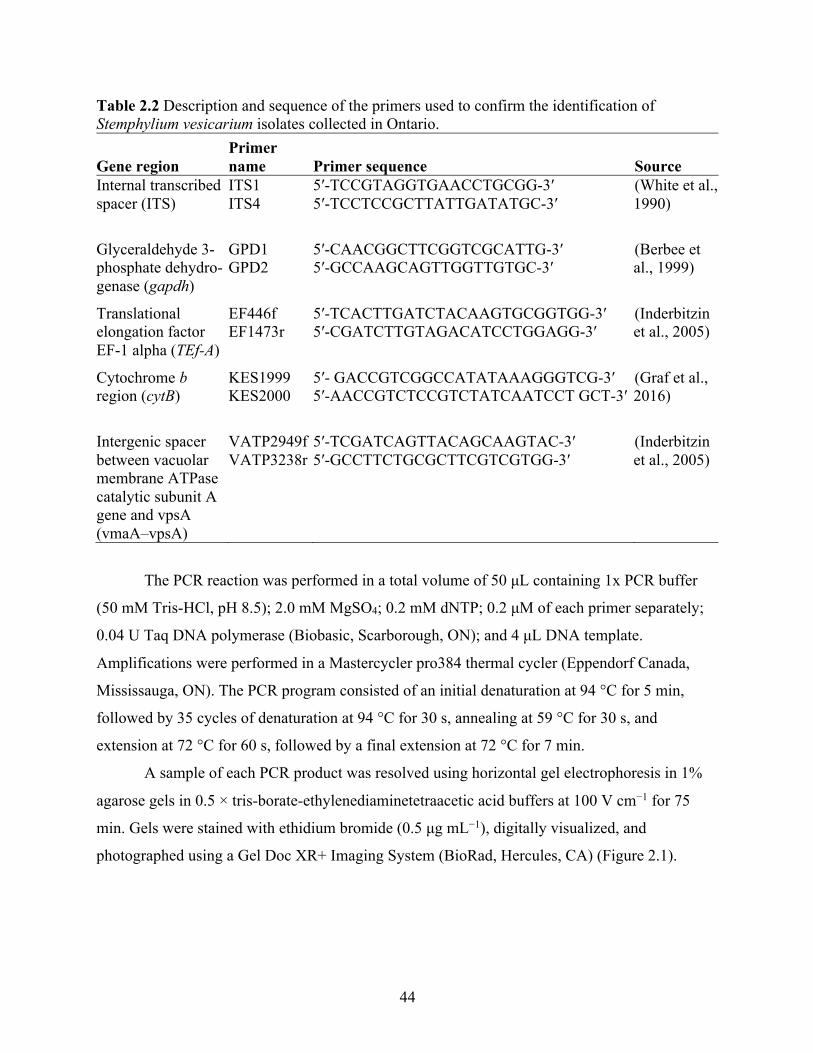
44
Table 2.2 Description and sequence of the primers used to confirm the identification of Stemphylium vesicarium isolates collected in Ontario.
Gene region Primer name Primer sequence Source
Internal transcribed spacer (ITS)
ITS1 ITS4
5′-TCCGTAGGTGAACCTGCGG-3′ 5′-TCCTCCGCTTATTGATATGC-3′
(White et al., 1990)
Glyceraldehyde 3-phosphate dehydro-genase (gapdh)
GPD1 GPD2
5′-CAACGGCTTCGGTCGCATTG-3′ 5′-GCCAAGCAGTTGGTTGTGC-3′
(Berbee et al., 1999)
Translational elongation factor EF-1 alpha (TEf-A)
EF446f EF1473r
5′-TCACTTGATCTACAAGTGCGGTGG-3′ 5′-CGATCTTGTAGACATCCTGGAGG-3′
(Inderbitzin et al., 2005)
Cytochrome b region (cytB)
KES1999 KES2000
5′- GACCGTCGGCCATATAAAGGGTCG-3′ 5′-AACCGTCTCCGTCTATCAATCCT GCT-3′
(Graf et al., 2016)
Intergenic spacer between vacuolar membrane ATPase catalytic subunit A gene and vpsA (vmaA–vpsA)
VATP2949f VATP3238r
5′-TCGATCAGTTACAGCAAGTAC-3′ 5′-GCCTTCTGCGCTTCGTCGTGG-3′
(Inderbitzin et al., 2005)
The PCR reaction was performed in a total volume of 50 μL containing 1x PCR buffer
(50 mM Tris-HCl, pH 8.5); 2.0 mM MgSO4; 0.2 mM dNTP; 0.2 μM of each primer separately;
0.04 U Taq DNA polymerase (Biobasic, Scarborough, ON); and 4 μL DNA template.
Amplifications were performed in a Mastercycler pro384 thermal cycler (Eppendorf Canada,
Mississauga, ON). The PCR program consisted of an initial denaturation at 94 °C for 5 min,
followed by 35 cycles of denaturation at 94 °C for 30 s, annealing at 59 °C for 30 s, and
extension at 72 °C for 60 s, followed by a final extension at 72 °C for 7 min.
A sample of each PCR product was resolved using horizontal gel electrophoresis in 1%
agarose gels in 0.5 × tris-borate-ethylenediaminetetraacetic acid buffers at 100 V cm−1 for 75
min. Gels were stained with ethidium bromide (0.5 μg mL−1), digitally visualized, and
photographed using a Gel Doc XR+ Imaging System (BioRad, Hercules, CA) (Figure 2.1).
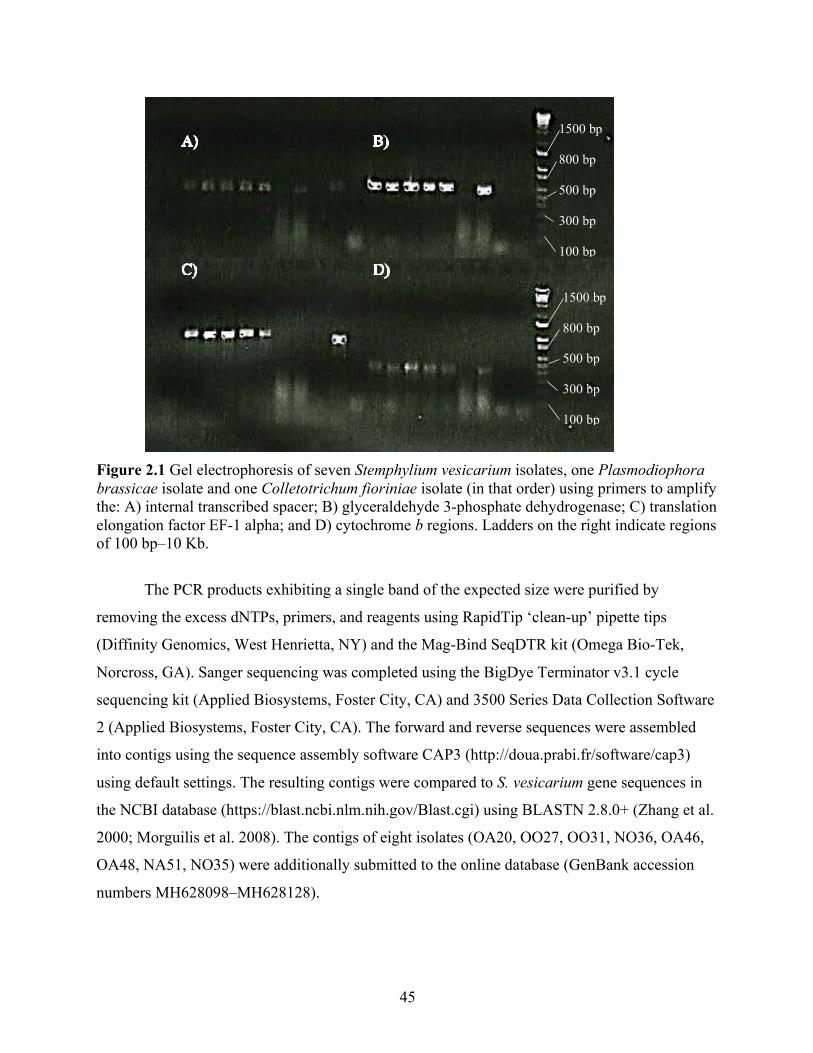
45
Figure 2.1 Gel electrophoresis of seven Stemphylium vesicarium isolates, one Plasmodiophora brassicae isolate and one Colletotrichum fioriniae isolate (in that order) using primers to amplify the: A) internal transcribed spacer; B) glyceraldehyde 3-phosphate dehydrogenase; C) translation elongation factor EF-1 alpha; and D) cytochrome b regions. Ladders on the right indicate regions of 100 bp–10 Kb.
The PCR products exhibiting a single band of the expected size were purified by
removing the excess dNTPs, primers, and reagents using RapidTip ‘clean-up’ pipette tips
(Diffinity Genomics, West Henrietta, NY) and the Mag-Bind SeqDTR kit (Omega Bio-Tek,
Norcross, GA). Sanger sequencing was completed using the BigDye Terminator v3.1 cycle
sequencing kit (Applied Biosystems, Foster City, CA) and 3500 Series Data Collection Software
2 (Applied Biosystems, Foster City, CA). The forward and reverse sequences were assembled
into contigs using the sequence assembly software CAP3 (http://doua.prabi.fr/software/cap3)
using default settings. The resulting contigs were compared to S. vesicarium gene sequences in
the NCBI database (https://blast.ncbi.nlm.nih.gov/Blast.cgi) using BLASTN 2.8.0+ (Zhang et al.
2000; Morguilis et al. 2008). The contigs of eight isolates (OA20, OO27, OO31, NO36, OA46,
OA48, NA51, NO35) were additionally submitted to the online database (GenBank accession
numbers MH628098–MH628128).
1500 bp 800 bp 500 bp 300 bp 100 bp
1500 bp 800 bp 500 bp 300 bp 100 bp
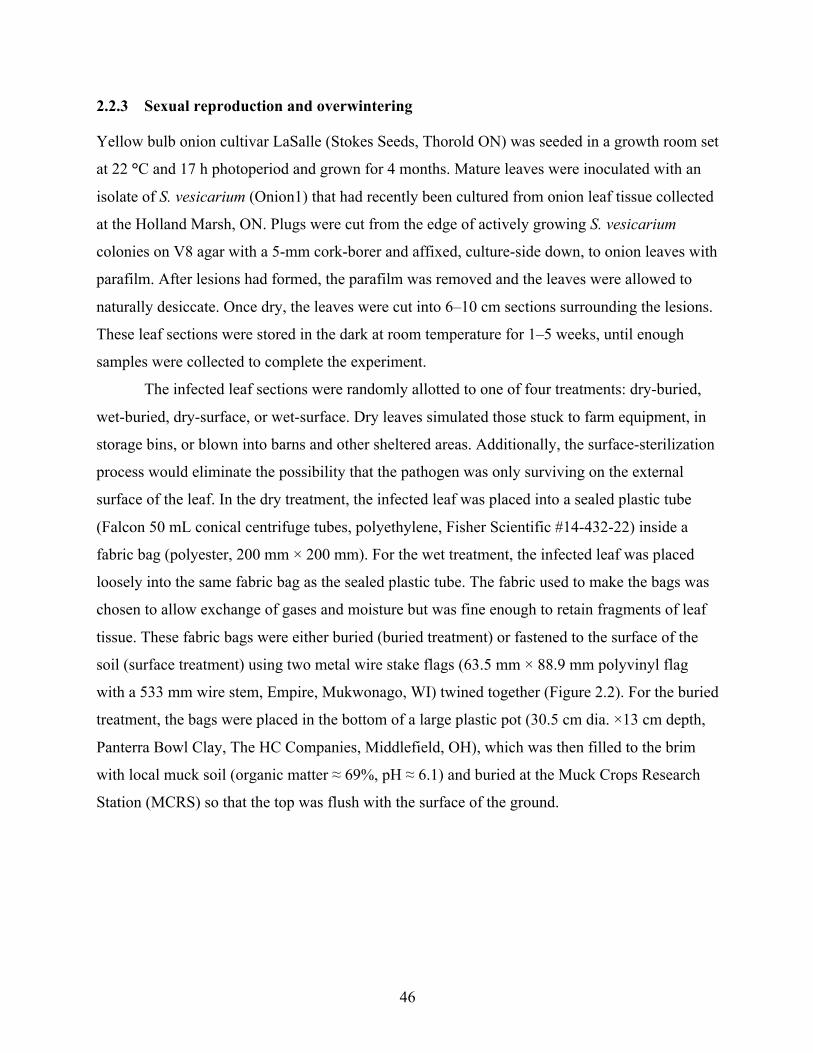
46
2.2.3 Sexual reproduction and overwintering
Yellow bulb onion cultivar LaSalle (Stokes Seeds, Thorold ON) was seeded in a growth room set
at 22 °C and 17 h photoperiod and grown for 4 months. Mature leaves were inoculated with an
isolate of S. vesicarium (Onion1) that had recently been cultured from onion leaf tissue collected
at the Holland Marsh, ON. Plugs were cut from the edge of actively growing S. vesicarium
colonies on V8 agar with a 5-mm cork-borer and affixed, culture-side down, to onion leaves with
parafilm. After lesions had formed, the parafilm was removed and the leaves were allowed to
naturally desiccate. Once dry, the leaves were cut into 6–10 cm sections surrounding the lesions.
These leaf sections were stored in the dark at room temperature for 1–5 weeks, until enough
samples were collected to complete the experiment.
The infected leaf sections were randomly allotted to one of four treatments: dry-buried,
wet-buried, dry-surface, or wet-surface. Dry leaves simulated those stuck to farm equipment, in
storage bins, or blown into barns and other sheltered areas. Additionally, the surface-sterilization
process would eliminate the possibility that the pathogen was only surviving on the external
surface of the leaf. In the dry treatment, the infected leaf was placed into a sealed plastic tube
(Falcon 50 mL conical centrifuge tubes, polyethylene, Fisher Scientific #14-432-22) inside a
fabric bag (polyester, 200 mm × 200 mm). For the wet treatment, the infected leaf was placed
loosely into the same fabric bag as the sealed plastic tube. The fabric used to make the bags was
chosen to allow exchange of gases and moisture but was fine enough to retain fragments of leaf
tissue. These fabric bags were either buried (buried treatment) or fastened to the surface of the
soil (surface treatment) using two metal wire stake flags (63.5 mm × 88.9 mm polyvinyl flag
with a 533 mm wire stem, Empire, Mukwonago, WI) twined together (Figure 2.2). For the buried
treatment, the bags were placed in the bottom of a large plastic pot (30.5 cm dia. ×13 cm depth,
Panterra Bowl Clay, The HC Companies, Middlefield, OH), which was then filled to the brim
with local muck soil (organic matter ≈ 69%, pH ≈ 6.1) and buried at the Muck Crops Research
Station (MCRS) so that the top was flush with the surface of the ground.
47
Figure 2.2 Sample preparation and deployment in a study to assess survival of Stemphylium vesicarium on onion leaves: A) fabric bag containing one onion leaf infected with S. vesicarium and a Falcon tube containing a second inoculated leaf, and B) one bag buried in a plastic pot (left) and one bag pinned to the soil surface (right).
On 8 November 2018 the buried/surface treatments were arranged in the field in a
completely randomized design with five samples dates arranged as blocks, where each sampling
date would be destructively harvested (Appendix 2.1). Each buried or surface treatment consisted
of a fabric bag which contained a ‘wet’ leaf and a ‘dry’ leaf. There were five replicates for each
treatment. The sampling dates were initially planned for December, January, February, March,
and April. However, the January and February samples were frozen solid in the soil, and so
could not be collected. The actual collection dates were 20 December 2018, 15 March 2019, 11
April 2019, 1 May 2019, and 30 May 2019.
After collection, the fabric bags were rinsed with sterilized water and the leaf sections
were carefully removed and viewed under a dissecting microscope to check for the presence of
pseudothecia. If present, several pseudothecia were collected using a sterile scalpel, placed onto
a glass slide with a drop of water, covered with a plastic cover slip, firmly squeezed to crush the
pseudothecia, and viewed under a microscope to check for ascospores. If present, the ascospores
were collected with a 100 μL pipette, transferred to a fresh onion leaf from the growth room, and
incubated at room temperature on a moist paper towel within a Petri dish sealed with Parafilm.
After 24 h, a thin coating of clear nail polish was applied over the inoculation site, allowed to
dry, then carefully removed with forceps. The nail polish peel was transferred to a glass slide,
strained with 1–2 drops of lactophenol cotton blue, and viewed under a microscope to determine
if the ascospores had germinated (Leandro et al., 2002).
A) B)
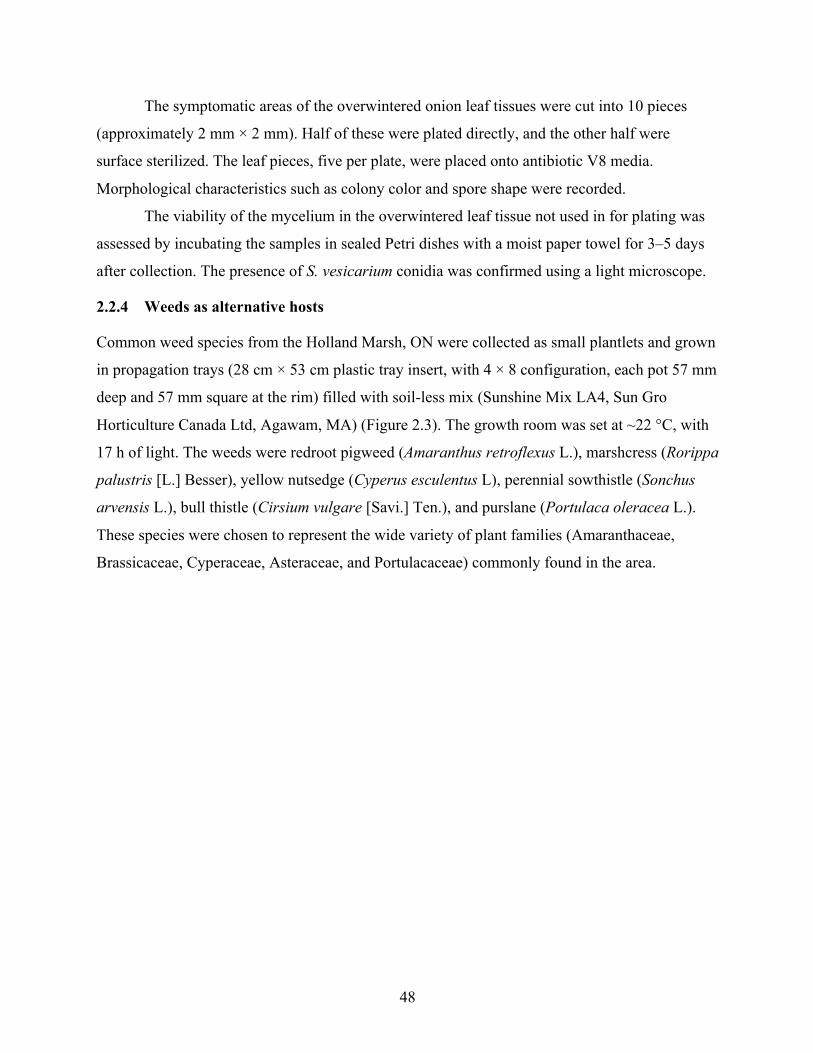
48
The symptomatic areas of the overwintered onion leaf tissues were cut into 10 pieces
(approximately 2 mm × 2 mm). Half of these were plated directly, and the other half were
surface sterilized. The leaf pieces, five per plate, were placed onto antibiotic V8 media.
Morphological characteristics such as colony color and spore shape were recorded.
The viability of the mycelium in the overwintered leaf tissue not used in for plating was
assessed by incubating the samples in sealed Petri dishes with a moist paper towel for 3–5 days
after collection. The presence of S. vesicarium conidia was confirmed using a light microscope.
2.2.4 Weeds as alternative hosts
Common weed species from the Holland Marsh, ON were collected as small plantlets and grown
in propagation trays (28 cm × 53 cm plastic tray insert, with 4 × 8 configuration, each pot 57 mm
deep and 57 mm square at the rim) filled with soil-less mix (Sunshine Mix LA4, Sun Gro
Horticulture Canada Ltd, Agawam, MA) (Figure 2.3). The growth room was set at ~22 °C, with
17 h of light. The weeds were redroot pigweed (Amaranthus retroflexus L.), marshcress (Rorippa
palustris [L.] Besser), yellow nutsedge (Cyperus esculentus L), perennial sowthistle (Sonchus
arvensis L.), bull thistle (Cirsium vulgare [Savi.] Ten.), and purslane (Portulaca oleracea L.).
These species were chosen to represent the wide variety of plant families (Amaranthaceae,
Brassicaceae, Cyperaceae, Asteraceae, and Portulacaceae) commonly found in the area.
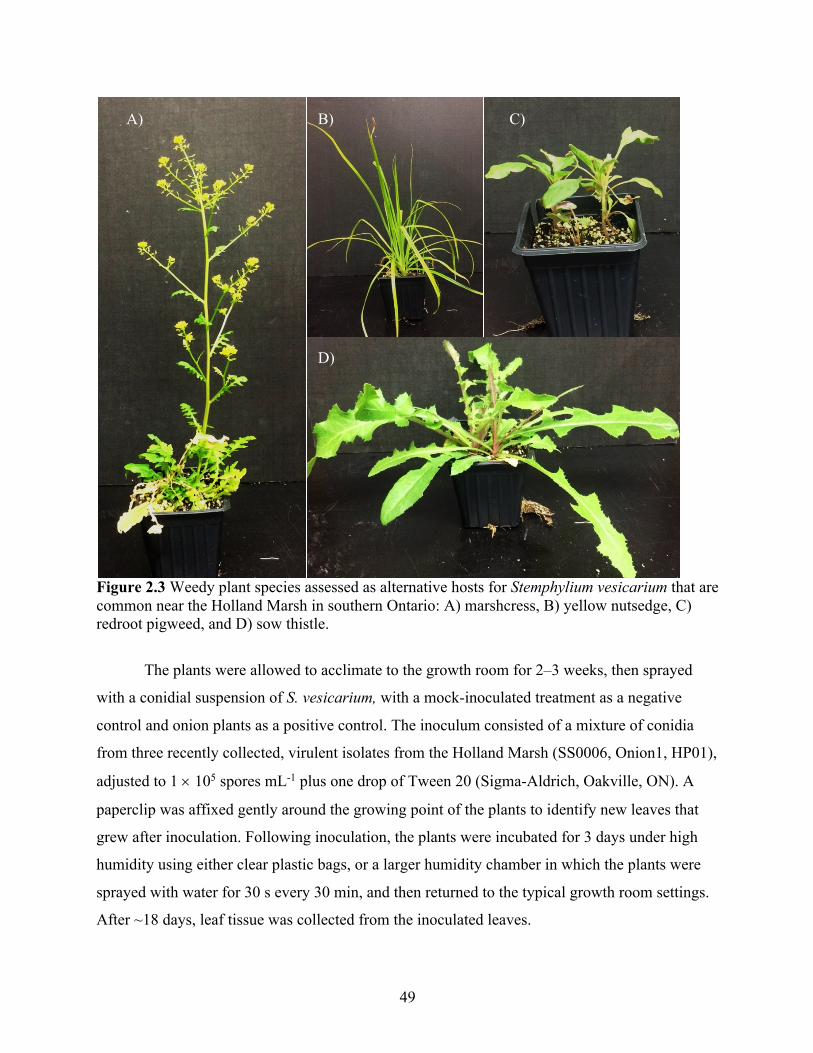
49
Figure 2.3 Weedy plant species assessed as alternative hosts for Stemphylium vesicarium that are common near the Holland Marsh in southern Ontario: A) marshcress, B) yellow nutsedge, C) redroot pigweed, and D) sow thistle.
The plants were allowed to acclimate to the growth room for 2–3 weeks, then sprayed
with a conidial suspension of S. vesicarium, with a mock-inoculated treatment as a negative
control and onion plants as a positive control. The inoculum consisted of a mixture of conidia
from three recently collected, virulent isolates from the Holland Marsh (SS0006, Onion1, HP01),
adjusted to 1 ´ 105 spores mL-1 plus one drop of Tween 20 (Sigma-Aldrich, Oakville, ON). A
paperclip was affixed gently around the growing point of the plants to identify new leaves that
grew after inoculation. Following inoculation, the plants were incubated for 3 days under high
humidity using either clear plastic bags, or a larger humidity chamber in which the plants were
sprayed with water for 30 s every 30 min, and then returned to the typical growth room settings.
After ~18 days, leaf tissue was collected from the inoculated leaves.
A) B) C) D)
50
For each species, four or five small sections (3 mm × 3 mm) of inoculated or mock-
inoculated leaf tissue were surface sterilized and cultured on amended V8 agar as described
above. The resulting colonies were identified based on spore morphology under a light
microscope after 3–9 days of growth. The assessment of each weed species was repeated.
2.2.5 Stemphylium vesicarium as a seed-borne pathogen
Inoculation of seed
A commercial seed lot of cultivar LaSalle (Stokes Seed, ON) was soaked in water and strained to
remove the pelleted seed coat. The seeds were surface sterilized as above, and half were
inoculated with a suspension of S. vesicarium conidia (~3 × 10⁴ spores mL-1 plus a drop of
Tween 20, isolates FE02, FE03, FE04). The seeds were then allowed to dry in an unsealed
plastic Petri dish at room temperature for 3 days. Ten seeds from each treatment were plated onto
V8 media amended with antibiotic and incubated for 3 to 4 days under 12 h UV light / 12 h
darkness. The resulting colonies were identified based on spore morphology. Of the remaining
dried seed, 36 were planted in a 48-cell seeding tray filled with soil-less mix (Sunshine Mix
LA4, Sun Gro Horticulture Canada Ltd, Agawam, MA). The pots were incubated in growth
chambers set at ~24.5 °C, with 17 h of light for approximately 2 months. The mature onion
plants were assessed for SLB symptoms, specifically leaf chlorosis, lesions, and tip dieback.
Inoculation of flowers – Growth room
Year-old onion bulbs of cultivar LaSalle were stored at 4 °C for 4 to 6 months, planted into 3.8-L
pots filled with soil-less mix (Sunshine Mix LA4) and grown in growth chambers set at 24.5 °C,
with 17 h of light (n = 16). Sixteen plants in total were grown until flowers were produced at ~3
months. When the florets began to open, they were manually pollinated by collecting several
anthers from each plant, crushing the anthers to release the pollen, and using a paintbrush to
carefully place pollen onto the stigmas of the florets. The flowers of eight plants were sprayed
with a conidia suspension collected from three isolates of S. vesicarium (~3 × 10⁴ spores mL-1
plus a small drop of Tween 20, isolates FE02, FE04, FE05), with the other eight serving as a
non-inoculated control.
Once the inflorescences set seed at 4–6 weeks after flowering, the seeds were collected
using forceps and air-dried in an unsealed Petri dish at room temperature. Up to 20 seeds (where
available) were collected from each plant and stored at 4 °C until assessed. Ten of these seeds
were plated directly onto amended V8 agar. The remaining seeds were surface sterilized, plated
51
onto the V8 agar and incubated under UV lights at room temperature for 2 weeks, and the
colonies were assessed.
Inoculation of flowers – Field trial
Bulbs of onion cultivar LaSalle were stored over the winter in a cool storage room (dark, ~10 °C)
for approximately 38 weeks. One hundred and twenty bulbs were planted at a site with high
organic soil (organic matter ≈ 71%, pH ≈ 5.7) at the Muck Crops Research Station, King,
Ontario. These plants were allowed to flower and pollinate naturally. Only 39 flowers were
produced because many bulbs rotted after planting. The flowers were not inoculated, so any
infection likely resulted from inoculum released from nearby onion fields. Eight flowers were
collected early (23 July–10 August 2019) because mechanical or insect damage to the flower
scape had terminated the flower. At the end of the growing season (30 August 2018), the
remaining scapes were cut and 31 flowers were collected in individual paper bags. The flowers
were stored at room temperature for 6 weeks to let the seeds air-dry.
As in the growth room study, up to 60 seeds (if available) per flower were plated onto V8
media + antibiotics on 6 November 2019 (surface-sterilized or not sterilized, 10 seeds per plate,
with three replications), and fungal colonies were identified based on spore morphology 7 days
later. Some colonies also produced immature pseudothecia in culture. Mycelium was collected
from five representative colonies and pathogen identity was confirmed via DNA sequencing.
Seed-to-seedling transmission
Naturally-inoculated seed from the field trial was grown in a controlled environment to assess if
S. vesicarium would be transmitted to seedlings. Approximately 35 seeds per flower (if
available) were seeded into propagation trays (28 cm × 53 cm plastic tray insert, with 8 × 12
configuration, each cell 57 mm ×38 mm × 54 mm deep) filled with soil-less mix (Sunshine Mix
LA4) in a growth room set at ~22 °C with 17 h of light. When the seedlings reached the first true
leaf stage, the cotyledon and the first leaf were collected using disinfected forceps and scissors.
A 10-mm section of the tip and the middle of the leaf / cotyledon were cut using a sterile scalpel,
plated onto V8 media amended with antibiotics, and incubated at room temperature with 12 h
UV light / 12 h darkness. The plates were assessed 6 days later for S. vesicarium colonies.
52
Seed Heat Treatment
Onion seeds collected from flowers naturally inoculated with S. vesicarium were divided into
Falcon 50 mL conical centrifuge tubes, with 60 seeds per tube and three replicate tubes per
treatment. Shortly before heat treatment, autoclaved deionized water was added to each tube
(~5 mL) to cover the seeds. The tubes were then immersed in a water bath (40, 50, or 60 °C) for
10, 20, 30, or 40 min. The control was soaked in sterile water at room temperature (~21 °C) for
40 min. The water was removed using a sterilized metal strainer. The seeds were then placed
onto sterile filter paper in a plastic Petri dish with the lid cracked open in a laminar flow hood for
2 h to dry. Seed from each treatment was plated onto amended V8 media with five seeds per
plate on five plates (25 seeds total), with three replicates separated over time, incubated under
UV light 12 h on / off for 5 to 7 days, and assessed for S. vesicarium colonies (as described
previously) and germination.
Twenty-five seeds per treatment per replication were planted in a growth room following
the protocol previously described. When the first leaf emerged, the cotyledon and the first leaf
were collected using sterilized scissors and forceps. Two 10-mm pieces were cut from each leaf,
one from the top and another from the middle of the sample, and these pieces were surface
sterilized and plated as described previously. Seedling emergence and the number of fungal
colonies produced were recorded for all fungal species and for S. vesicarium.
2.2.6 Data analysis
Statistical analyses were conducted using SAS v.9.4 (SAS Institute Inc., Cary, NC). The
numerical values of the proportion of tissues producing pseudothecia were presented without
statistical analysis. The overwintering survival response over time was plotted for location,
sterilization, and moisture factor separately to show effects of each treatment.
The frequency of infection of weed species by S. vesicarium was assessed in two
repetitions of the host range study. There was no repetition × species interaction, so the data were
pooled to make the best possible assessment of the suitability of each species as an alternative
host for S. vesicarium when compared to the onion host. After sorting the data by sterilization
treatment, a Dunnett’s test was used to compare the recovery from the weed species to recovery
from onion. Additionally, a Student’s T-test was used to assess the effect of sterilization on each
plant species.
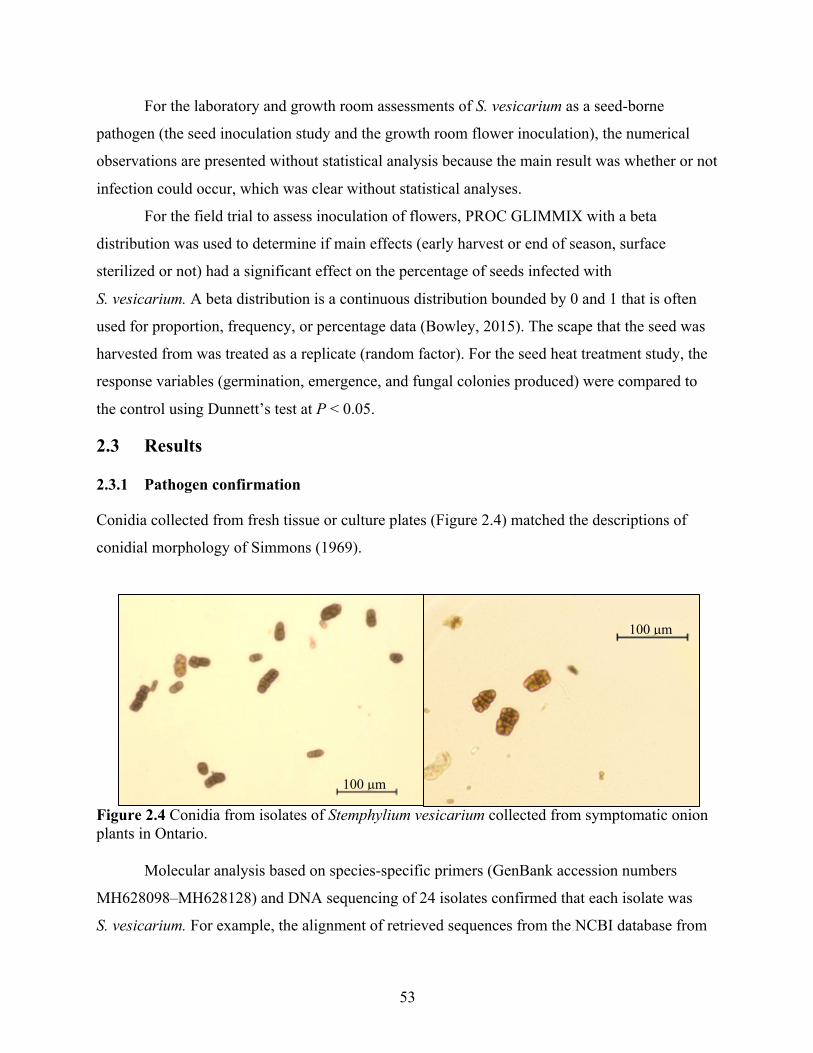
53
For the laboratory and growth room assessments of S. vesicarium as a seed-borne
pathogen (the seed inoculation study and the growth room flower inoculation), the numerical
observations are presented without statistical analysis because the main result was whether or not
infection could occur, which was clear without statistical analyses.
For the field trial to assess inoculation of flowers, PROC GLIMMIX with a beta
distribution was used to determine if main effects (early harvest or end of season, surface
sterilized or not) had a significant effect on the percentage of seeds infected with
S. vesicarium. A beta distribution is a continuous distribution bounded by 0 and 1 that is often
used for proportion, frequency, or percentage data (Bowley, 2015). The scape that the seed was
harvested from was treated as a replicate (random factor). For the seed heat treatment study, the
response variables (germination, emergence, and fungal colonies produced) were compared to
the control using Dunnett’s test at P < 0.05.
2.3 Results
2.3.1 Pathogen confirmation
Conidia collected from fresh tissue or culture plates (Figure 2.4) matched the descriptions of
conidial morphology of Simmons (1969).
Figure 2.4 Conidia from isolates of Stemphylium vesicarium collected from symptomatic onion plants in Ontario.
Molecular analysis based on species-specific primers (GenBank accession numbers
MH628098–MH628128) and DNA sequencing of 24 isolates confirmed that each isolate was
S. vesicarium. For example, the alignment of retrieved sequences from the NCBI database from
100 μm
100 μm
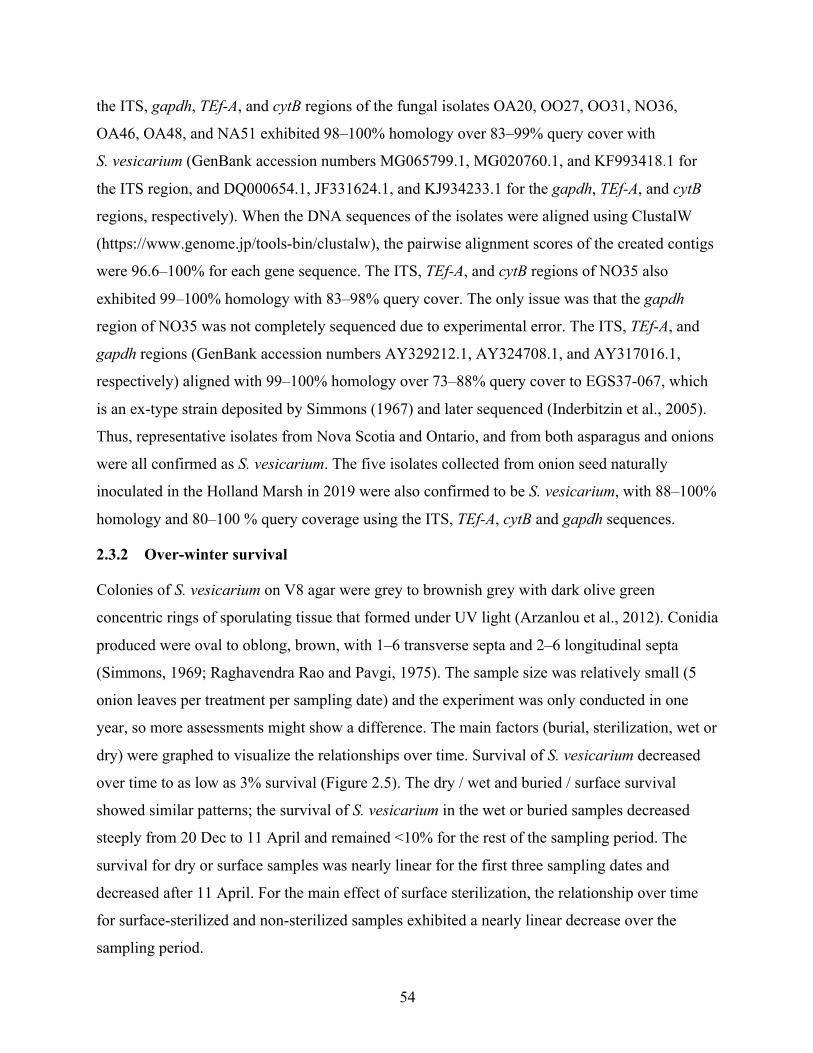
54
the ITS, gapdh, TEf-A, and cytB regions of the fungal isolates OA20, OO27, OO31, NO36,
OA46, OA48, and NA51 exhibited 98–100% homology over 83–99% query cover with
S. vesicarium (GenBank accession numbers MG065799.1, MG020760.1, and KF993418.1 for
the ITS region, and DQ000654.1, JF331624.1, and KJ934233.1 for the gapdh, TEf-A, and cytB
regions, respectively). When the DNA sequences of the isolates were aligned using ClustalW
(https://www.genome.jp/tools-bin/clustalw), the pairwise alignment scores of the created contigs
were 96.6–100% for each gene sequence. The ITS, TEf-A, and cytB regions of NO35 also
exhibited 99–100% homology with 83–98% query cover. The only issue was that the gapdh
region of NO35 was not completely sequenced due to experimental error. The ITS, TEf-A, and
gapdh regions (GenBank accession numbers AY329212.1, AY324708.1, and AY317016.1,
respectively) aligned with 99–100% homology over 73–88% query cover to EGS37-067, which
is an ex-type strain deposited by Simmons (1967) and later sequenced (Inderbitzin et al., 2005).
Thus, representative isolates from Nova Scotia and Ontario, and from both asparagus and onions
were all confirmed as S. vesicarium. The five isolates collected from onion seed naturally
inoculated in the Holland Marsh in 2019 were also confirmed to be S. vesicarium, with 88–100%
homology and 80–100 % query coverage using the ITS, TEf-A, cytB and gapdh sequences.
2.3.2 Over-winter survival
Colonies of S. vesicarium on V8 agar were grey to brownish grey with dark olive green
concentric rings of sporulating tissue that formed under UV light (Arzanlou et al., 2012). Conidia
produced were oval to oblong, brown, with 1–6 transverse septa and 2–6 longitudinal septa
(Simmons, 1969; Raghavendra Rao and Pavgi, 1975). The sample size was relatively small (5
onion leaves per treatment per sampling date) and the experiment was only conducted in one
year, so more assessments might show a difference. The main factors (burial, sterilization, wet or
dry) were graphed to visualize the relationships over time. Survival of S. vesicarium decreased
over time to as low as 3% survival (Figure 2.5). The dry / wet and buried / surface survival
showed similar patterns; the survival of S. vesicarium in the wet or buried samples decreased
steeply from 20 Dec to 11 April and remained <10% for the rest of the sampling period. The
survival for dry or surface samples was nearly linear for the first three sampling dates and
decreased after 11 April. For the main effect of surface sterilization, the relationship over time
for surface-sterilized and non-sterilized samples exhibited a nearly linear decrease over the
sampling period.
55
Figure 2.5 Percent of inoculated onion leaf samples overwintered at the Muck Crops Research station in the winter of 2018 on the soil surface or buried in soil, then collected at five sampling dates, that produced Stemphylium vesicarium colonies when cultured on V8 agar. Error bars represent standard error of five replicates.
Whether the overwintering leaf tissue was buried in soil or affixed to the soil surface did
not have a major effect on pathogen survival; colonies of S. vesicarium were produced from both
sets of samples, and the trend over time was not different between buried and surface samples.
Overall, there was more survival on dry leaves relative to wet leaves.
There was no survival on buried wet leaves recovered on 11 April or later, suggesting
that burying onion debris may reduce overwintering inoculum (Figure 2.5). Similarly, there were
no colonies from the surface wet samples on 11 April and 1May. There was some survival on the
surface wet leaves on 30 May. This may not be a reflection on the survival of the pathogen per
se, and instead of the ability to compete against other saprophytic microbes when cultured on V8
0102030405060708090
20 Dec 15 Mar 11 Apr 1 May 30 May
SV c
olon
ies (
%)
Buried Samples
20 Dec 15 Mar 11 Apr 1 May 30 May
Surface Samples
0102030405060708090
20 Dec 15 Mar 11 Apr 1 May 30 May
SV c
olon
ies (
%)
20 Dec 15 Mar 11 Apr 1 May 30 May
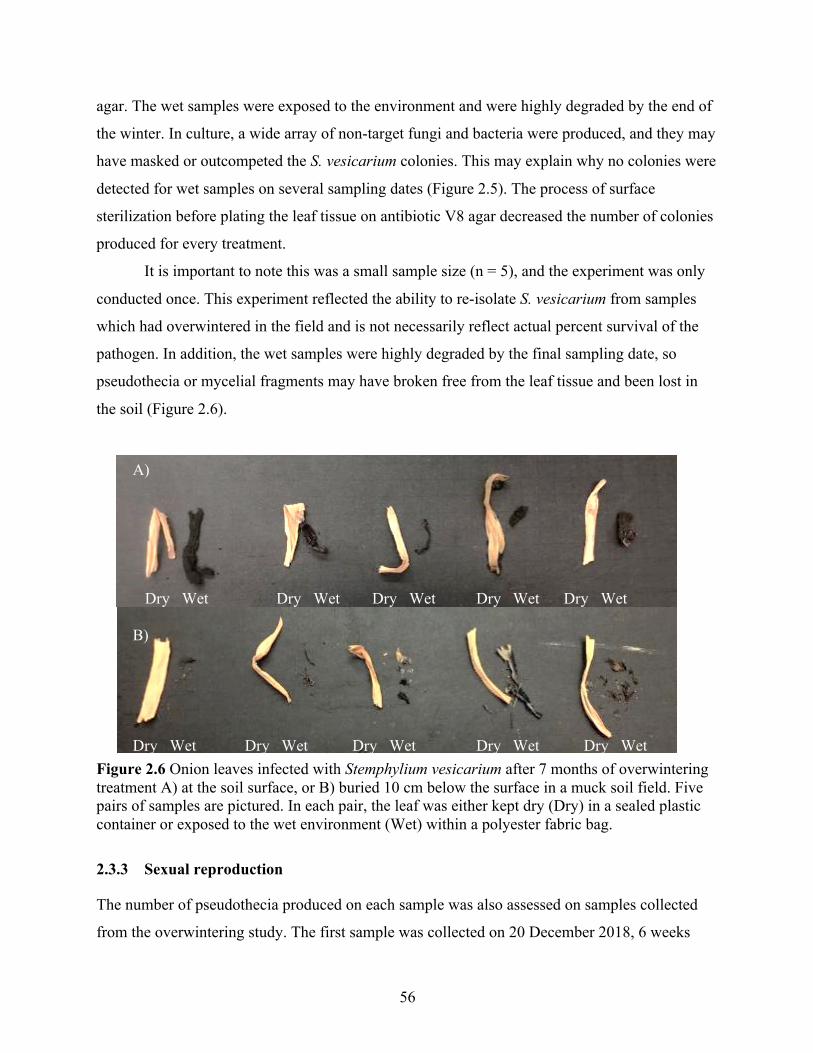
56
agar. The wet samples were exposed to the environment and were highly degraded by the end of
the winter. In culture, a wide array of non-target fungi and bacteria were produced, and they may
have masked or outcompeted the S. vesicarium colonies. This may explain why no colonies were
detected for wet samples on several sampling dates (Figure 2.5). The process of surface
sterilization before plating the leaf tissue on antibiotic V8 agar decreased the number of colonies
produced for every treatment.
It is important to note this was a small sample size (n = 5), and the experiment was only
conducted once. This experiment reflected the ability to re-isolate S. vesicarium from samples
which had overwintered in the field and is not necessarily reflect actual percent survival of the
pathogen. In addition, the wet samples were highly degraded by the final sampling date, so
pseudothecia or mycelial fragments may have broken free from the leaf tissue and been lost in
the soil (Figure 2.6).
Figure 2.6 Onion leaves infected with Stemphylium vesicarium after 7 months of overwintering treatment A) at the soil surface, or B) buried 10 cm below the surface in a muck soil field. Five pairs of samples are pictured. In each pair, the leaf was either kept dry (Dry) in a sealed plastic container or exposed to the wet environment (Wet) within a polyester fabric bag.
2.3.3 Sexual reproduction
The number of pseudothecia produced on each sample was also assessed on samples collected
from the overwintering study. The first sample was collected on 20 December 2018, 6 weeks
A) Dry Wet Dry Wet Dry Wet Dry Wet Dry Wet B) Dry Wet Dry Wet Dry Wet Dry Wet Dry Wet
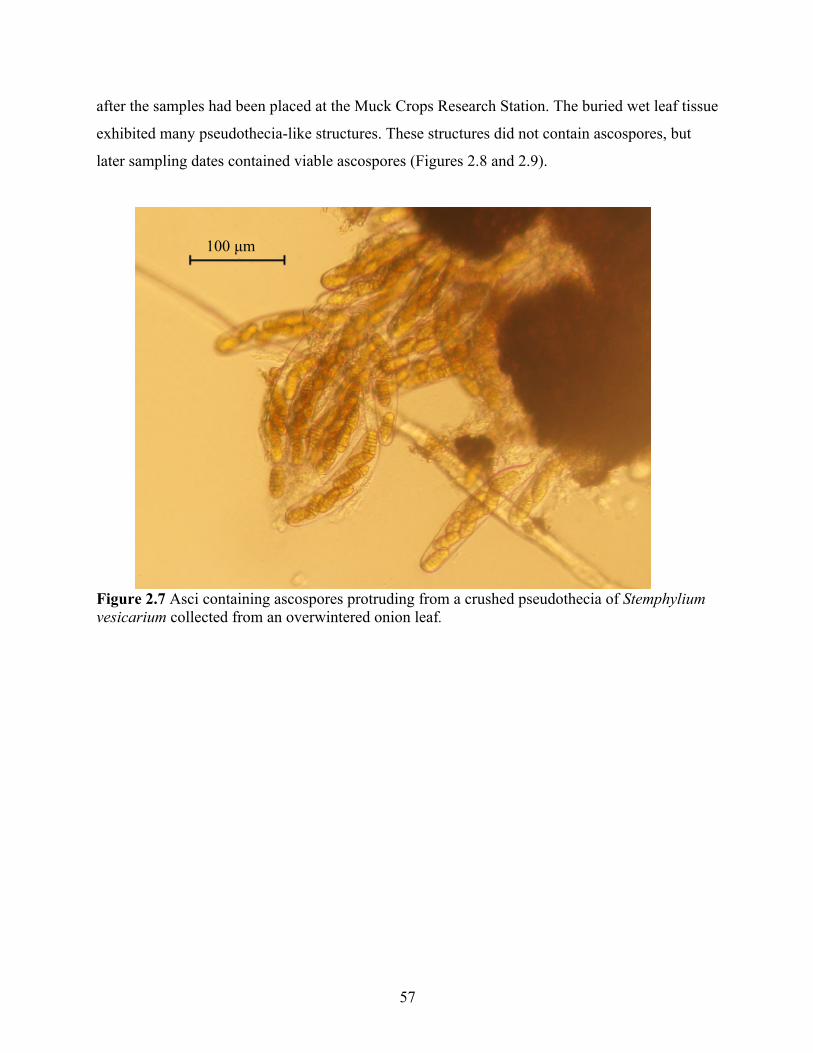
57
after the samples had been placed at the Muck Crops Research Station. The buried wet leaf tissue
exhibited many pseudothecia-like structures. These structures did not contain ascospores, but
later sampling dates contained viable ascospores (Figures 2.8 and 2.9).
Figure 2.7 Asci containing ascospores protruding from a crushed pseudothecia of Stemphylium vesicarium collected from an overwintered onion leaf.
100 μm
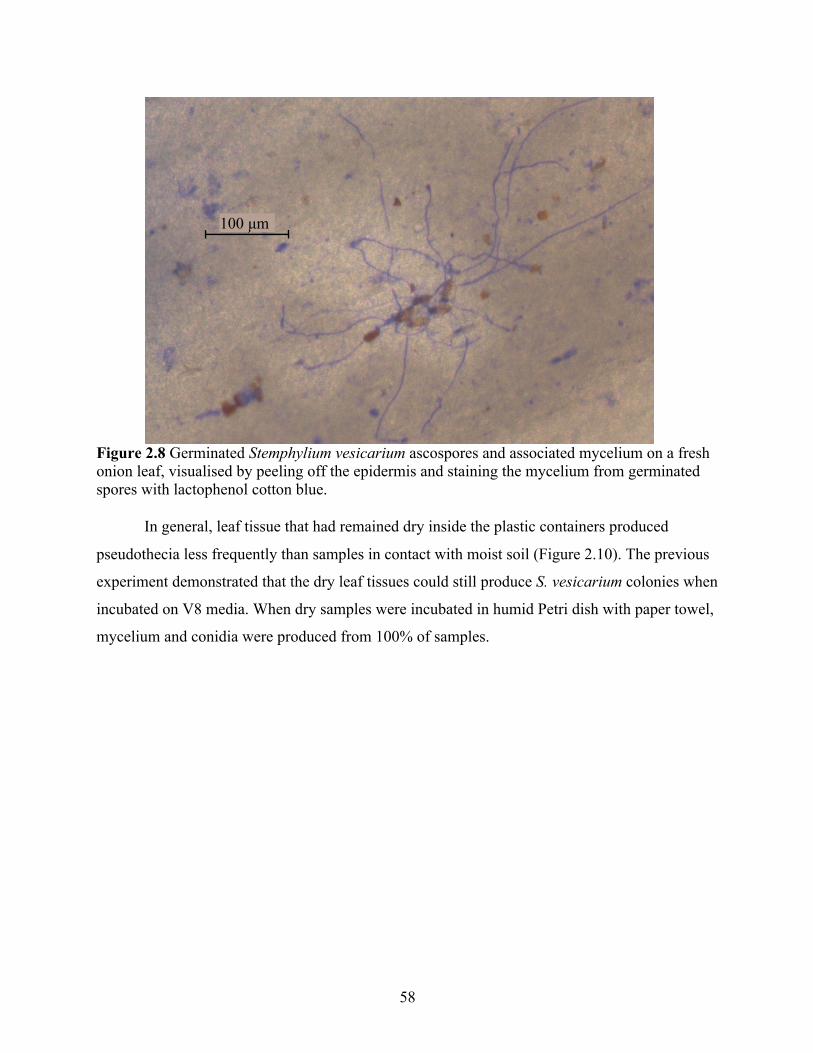
58
Figure 2.8 Germinated Stemphylium vesicarium ascospores and associated mycelium on a fresh onion leaf, visualised by peeling off the epidermis and staining the mycelium from germinated spores with lactophenol cotton blue.
In general, leaf tissue that had remained dry inside the plastic containers produced
pseudothecia less frequently than samples in contact with moist soil (Figure 2.10). The previous
experiment demonstrated that the dry leaf tissues could still produce S. vesicarium colonies when
incubated on V8 media. When dry samples were incubated in humid Petri dish with paper towel,
mycelium and conidia were produced from 100% of samples.
100 μm mm
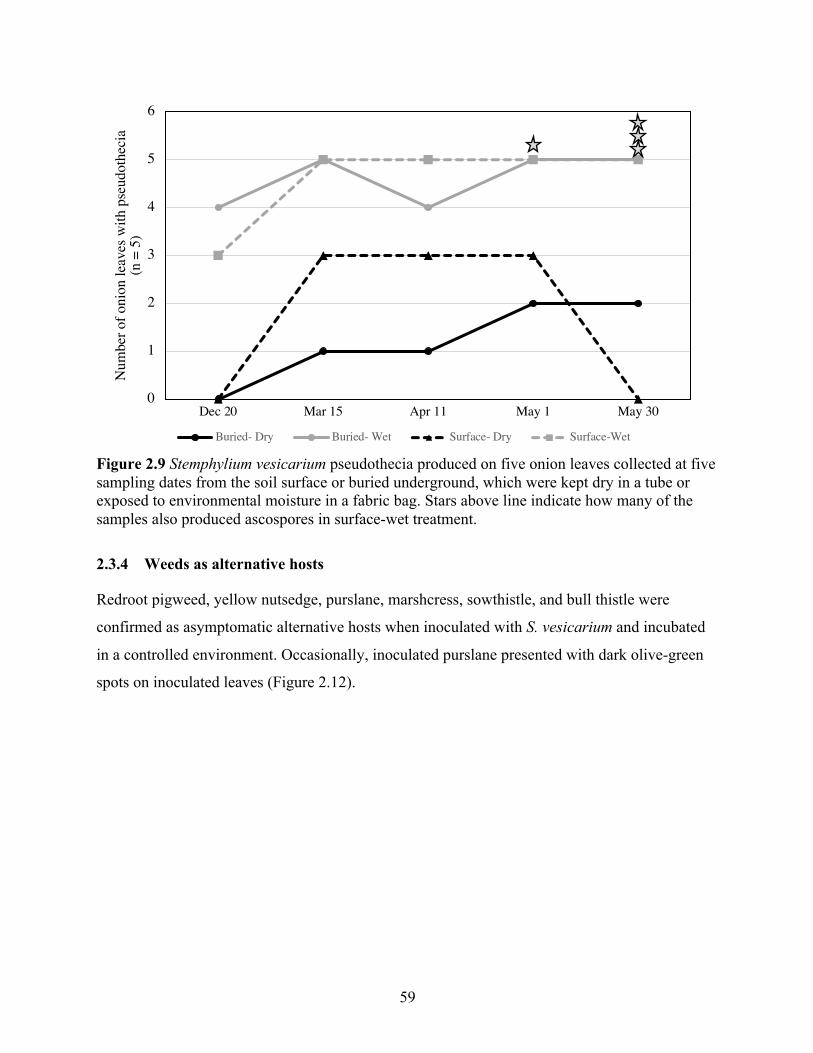
59
Figure 2.9 Stemphylium vesicarium pseudothecia produced on five onion leaves collected at five sampling dates from the soil surface or buried underground, which were kept dry in a tube or exposed to environmental moisture in a fabric bag. Stars above line indicate how many of the samples also produced ascospores in surface-wet treatment.
2.3.4 Weeds as alternative hosts
Redroot pigweed, yellow nutsedge, purslane, marshcress, sowthistle, and bull thistle were
confirmed as asymptomatic alternative hosts when inoculated with S. vesicarium and incubated
in a controlled environment. Occasionally, inoculated purslane presented with dark olive-green
spots on inoculated leaves (Figure 2.12).
0
1
2
3
4
5
6
Dec 20 Mar 15 Apr 11 May 1 May 30
Num
ber o
f oni
on le
aves
with
pse
udot
heci
a (n
= 5
)
Buried- Dry Buried- Wet Surface- Dry Surface-Wet
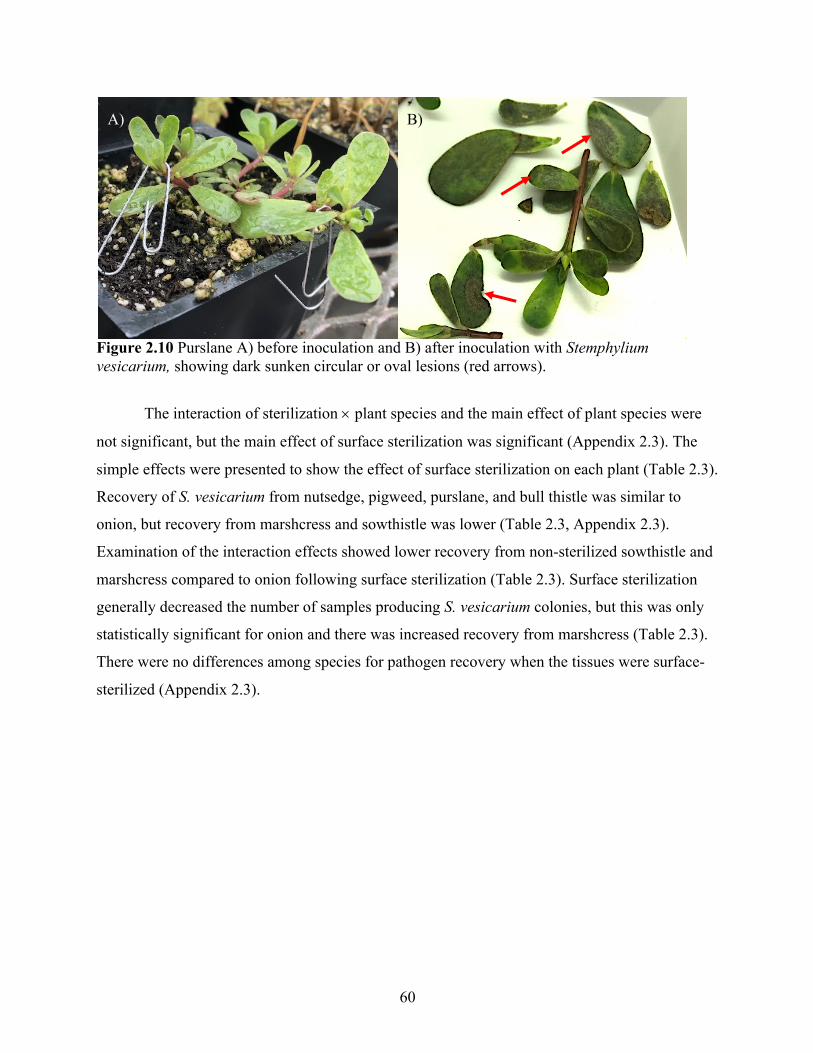
60
Figure 2.10 Purslane A) before inoculation and B) after inoculation with Stemphylium vesicarium, showing dark sunken circular or oval lesions (red arrows).
The interaction of sterilization ´ plant species and the main effect of plant species were
not significant, but the main effect of surface sterilization was significant (Appendix 2.3). The
simple effects were presented to show the effect of surface sterilization on each plant (Table 2.3).
Recovery of S. vesicarium from nutsedge, pigweed, purslane, and bull thistle was similar to
onion, but recovery from marshcress and sowthistle was lower (Table 2.3, Appendix 2.3).
Examination of the interaction effects showed lower recovery from non-sterilized sowthistle and
marshcress compared to onion following surface sterilization (Table 2.3). Surface sterilization
generally decreased the number of samples producing S. vesicarium colonies, but this was only
statistically significant for onion and there was increased recovery from marshcress (Table 2.3).
There were no differences among species for pathogen recovery when the tissues were surface-
sterilized (Appendix 2.3).
A) B)
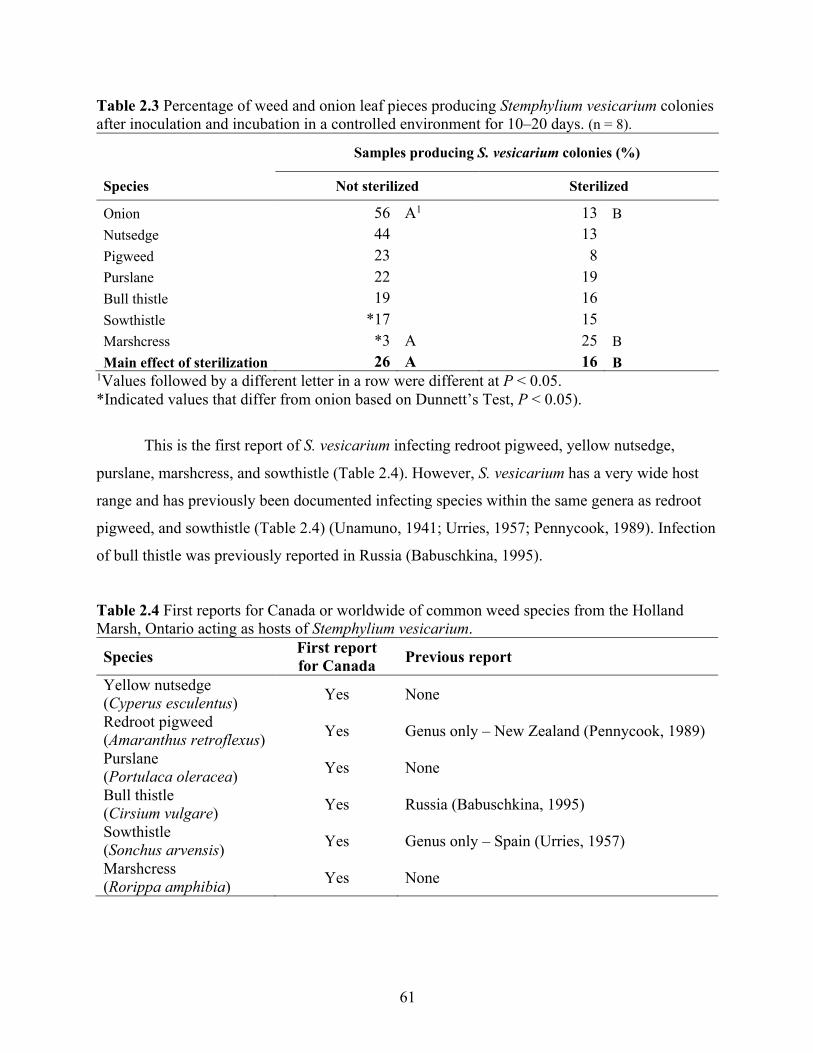
61
Table 2.3 Percentage of weed and onion leaf pieces producing Stemphylium vesicarium colonies after inoculation and incubation in a controlled environment for 10–20 days. (n = 8).
Samples producing S. vesicarium colonies (%)
Species Not sterilized Sterilized
Onion 56 A1 13 B Nutsedge 44 13 Pigweed 23 8 Purslane 22 19 Bull thistle 19 16 Sowthistle *17 15 Marshcress *3 A 25 B Main effect of sterilization 26 A 16 B
1Values followed by a different letter in a row were different at P < 0.05. *Indicated values that differ from onion based on Dunnett’s Test, P < 0.05).
This is the first report of S. vesicarium infecting redroot pigweed, yellow nutsedge,
purslane, marshcress, and sowthistle (Table 2.4). However, S. vesicarium has a very wide host
range and has previously been documented infecting species within the same genera as redroot
pigweed, and sowthistle (Table 2.4) (Unamuno, 1941; Urries, 1957; Pennycook, 1989). Infection
of bull thistle was previously reported in Russia (Babuschkina, 1995).
Table 2.4 First reports for Canada or worldwide of common weed species from the Holland Marsh, Ontario acting as hosts of Stemphylium vesicarium.
Species First report for Canada Previous report
Yellow nutsedge (Cyperus esculentus) Yes None
Redroot pigweed (Amaranthus retroflexus) Yes Genus only – New Zealand (Pennycook, 1989)
Purslane (Portulaca oleracea) Yes None
Bull thistle (Cirsium vulgare) Yes Russia (Babuschkina, 1995)
Sowthistle (Sonchus arvensis) Yes Genus only – Spain (Urries, 1957)
Marshcress (Rorippa amphibia) Yes None
62
2.3.5 Stemphylium vesicarium as a seed-borne pathogen
Inoculation of seed
In the small study of seed inoculated with a spore suspension of S. vesicarium, all of the
inoculated seeds produced S. vesicarium colonies on V8 agar, and 1 of 10 seeds (10%) surface
sterilized seeds produced colonies of S. vesicarium. No colonies grew from the non-inoculated
commercial seed, as expected. When 36 inoculated seeds were planted, only six onion seedlings
(17%) emerged from the surface-sterilized treatment, and 5 from the inoculated treatment. The
low germination rate may be due to damage to the seed embryo during surface-sterilization. At
maturity (10–12 leaf stage), none of the onion leaves exhibited symptoms of SLB. Note that this
preliminary experiment had an extremely small sample size.
Inoculation of flowers – Growth room
Fourteen flowers from onion plants grown in a controlled environment were manually pollinated
and half were inoculated with S. vesicarium. All seed was surface sterilized or rinsed with water
and plated onto V8 media. In the inoculated surface sterilized treatment, 2 of 48 seeds (4.2%)
from six flowers produced S. vesicarium colonies. Both seeds originated from the same flower.
In the inoculated, non-sterilized treatment, 3 of 53 seeds (5.7%) produced S. vesicarium colonies.
These infected seeds originated from two flowers. None of the seeds from the eight non-
inoculated flowers produced S. vesicarium colonies, as expected.
Inoculation of flowers – Field trial
In the field study, eight flowers were harvested early due to mechanical or insect damage and 31
flowers were collected at the end of the season. The main effects (time harvested and surface
sterilization) and their interaction on infestation with S. vesicarium were not significant so the
data were pooled (Appendix 2.4). However, the main effects of time of harvest and sterilization
on seed germination were significant, but infestation with S. vesicarium did not affect
germination (Appendix 2.5). Germination was decreased by surface sterilization from 57% to
19% for early harvested seeds and from 54% to 17% for late harvested seeds. There was a small
but significant difference between germination of early harvested seed (38%) and late harvested
seed (34%). The interactions were generally not significant, except for a significant interaction
between time harvested and infestation with S. vesicarium (Appendix 2.7). Infection of the seeds
by S. vesicarium was 3% of those harvested early and 0.6% of those harvested at the end of the
season (Table 2.5), which was lower than had been previously described in the literature.
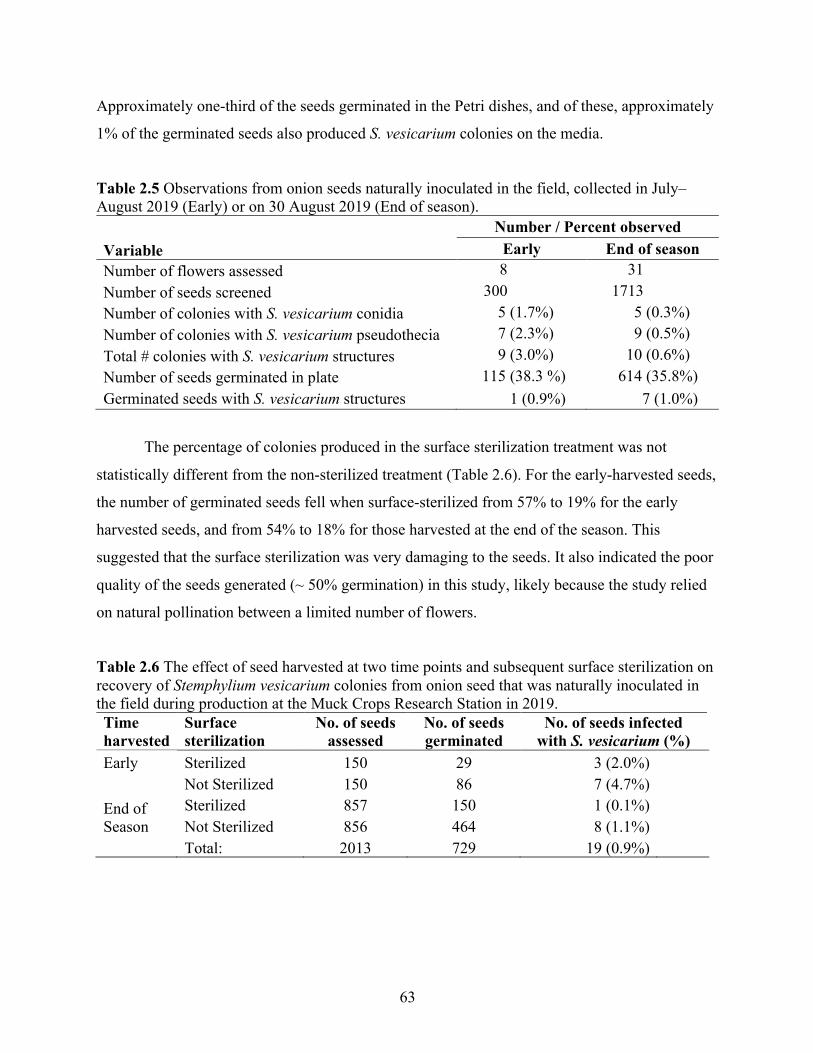
63
Approximately one-third of the seeds germinated in the Petri dishes, and of these, approximately
1% of the germinated seeds also produced S. vesicarium colonies on the media.
Table 2.5 Observations from onion seeds naturally inoculated in the field, collected in July–August 2019 (Early) or on 30 August 2019 (End of season). Number / Percent observed Variable Early End of season Number of flowers assessed 8 31 Number of seeds screened 300 1713 Number of colonies with S. vesicarium conidia 5 (1.7%) 5 (0.3%) Number of colonies with S. vesicarium pseudothecia 7 (2.3%) 9 (0.5%) Total # colonies with S. vesicarium structures 9 (3.0%) 10 (0.6%) Number of seeds germinated in plate 115 (38.3 %) 614 (35.8%) Germinated seeds with S. vesicarium structures 1 (0.9%) 7 (1.0%)
The percentage of colonies produced in the surface sterilization treatment was not
statistically different from the non-sterilized treatment (Table 2.6). For the early-harvested seeds,
the number of germinated seeds fell when surface-sterilized from 57% to 19% for the early
harvested seeds, and from 54% to 18% for those harvested at the end of the season. This
suggested that the surface sterilization was very damaging to the seeds. It also indicated the poor
quality of the seeds generated (~ 50% germination) in this study, likely because the study relied
on natural pollination between a limited number of flowers.
Table 2.6 The effect of seed harvested at two time points and subsequent surface sterilization on recovery of Stemphylium vesicarium colonies from onion seed that was naturally inoculated in the field during production at the Muck Crops Research Station in 2019. Time harvested
Surface sterilization
No. of seeds assessed
No. of seeds germinated
No. of seeds infected with S. vesicarium (%)
Early Sterilized 150 29 3 (2.0%) Not Sterilized 150 86 7 (4.7%) End of Season
Sterilized 857 150 1 (0.1%) Not Sterilized 856 464 8 (1.1%)
Total: 2013 729 19 (0.9%)
64
Seed-to-seedling transmission
There was no seed to seedling transmission of S. vesicarium from the early harvested seed. This
null result may be due to the poor emergence (34%) and the small sample size (110). In seed
harvested at the end of the season, only 1.2% transmitted S. vesicarium to seedlings (Table 2.8).
This was consistent with the level of infection of seed assessed in the previous experiment.
Table 2.7 The effect of seed harvested at two time points on emergence and recovery of Stemphylium vesicarium colonies from the cotyledon and first true leaf of onions grown from seed that was naturally inoculated in the field during production at the Muck Crops Research Station in 2019. Time harvested
Seeds planted
No. of seedlings
Emergence (%)
Seedlings infected with S. vesicarium
Transmission to seedling (%)
Early 110 40 33.5% 0 0% End of season 945 504 53.3% 6 1.2%
Seed Heat Treatment
Naturally inoculated seeds collected from the field were exposed to 40, 50, or 60 °C for 10, 20,
30, or 40 min and assessed for infection. There was no interaction between time and duration of
treatment. The main effect of temperature on seed infestation with fungi was significant, but not
the duration of the heat treatment (Appendix 2.6). The opposite was found for seed germination,
where the interaction of temperature and duration was significant (Appendix 2.7).In contrast, the
interaction of temperature and duration was significant for seed germination (Appendix 2.7) and
emergence of onion seedlings (Appendix 2.8).
Exposure of seed to 60 °C for 40 min reduced survival (17% germination, 0%
emergence) compared to the control (57% germination, 88% emergence). Seed that had been
exposed to heat treatments < 60 °C for 10 min germinated and emerged at similar rates as the
control (Figure 2.12).
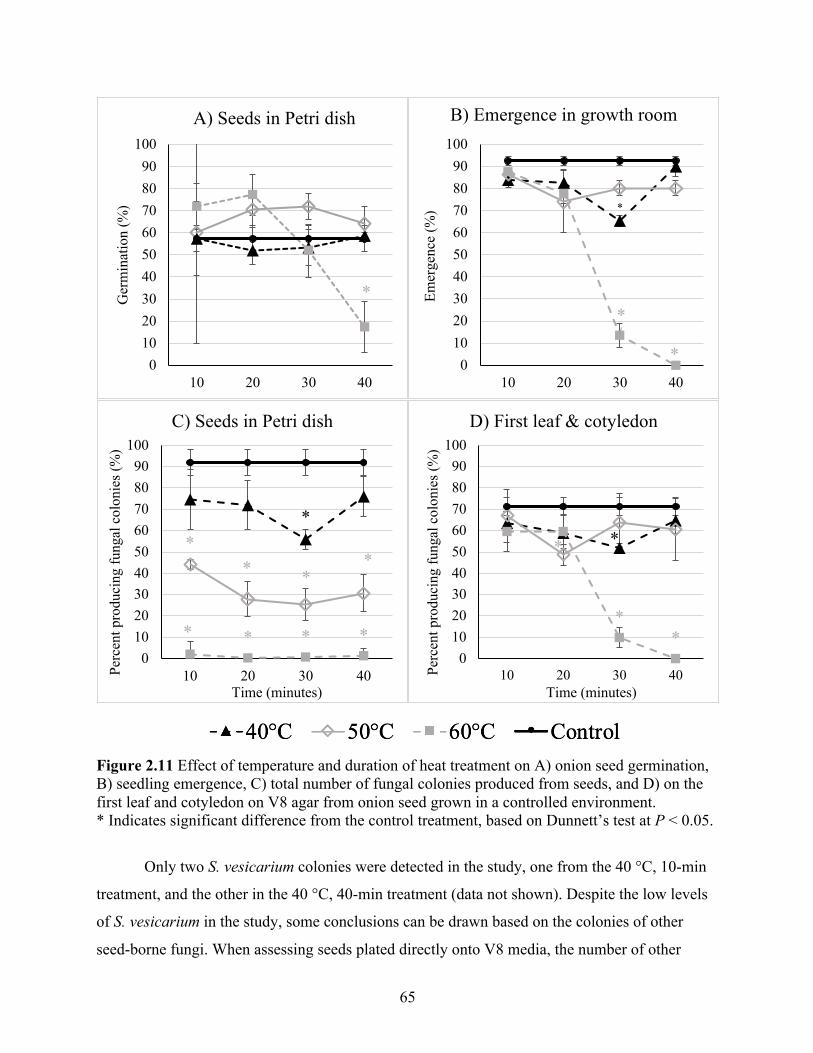
65
Figure 2.11 Effect of temperature and duration of heat treatment on A) onion seed germination, B) seedling emergence, C) total number of fungal colonies produced from seeds, and D) on the first leaf and cotyledon on V8 agar from onion seed grown in a controlled environment. * Indicates significant difference from the control treatment, based on Dunnett’s test at P < 0.05.
Only two S. vesicarium colonies were detected in the study, one from the 40 °C, 10-min
treatment, and the other in the 40 °C, 40-min treatment (data not shown). Despite the low levels
of S. vesicarium in the study, some conclusions can be drawn based on the colonies of other
seed-borne fungi. When assessing seeds plated directly onto V8 media, the number of other
*
0102030405060708090
100
10 20 30 40
Ger
min
atio
n (%
)A) Seeds in Petri dish
*
*
*0102030405060708090
100
10 20 30 40
Emer
genc
e (%
)
B) Emergence in growth room
**
* **
* * * *0
102030405060708090
100
10 20 30 40Perc
ent p
rodu
cing
fung
al c
olon
ies (
%)
Time (minutes)
C) Seeds in Petri dish
**
**
0102030405060708090
100
10 20 30 40Perc
ent p
rodu
cing
fung
al c
olon
ies (
%)
Time (minutes)
D) First leaf & cotyledon
66
fungal colonies decreased as the temperature increased, but the duration of treatment did not
affect the number of fungal colonies at 40 °C or 50 °C (Figure 2.13 C). The colonies produced
from the cotyledon and first leaf showed that 60 °C reduced infection by fungi; the 30- and 40-
min treatments reduced the number of fungal colonies from 71% to 3% and 0%, respectively.
Interestingly, the number of fungal colonies produced by the cotyledon / leaf tissue was
generally much lower (71%) than the direct seed assessment method (92%) (Figure 2.13 D),
likely because the tissue collected from the growth room was surface sterilized after collection
(Figure 2.13). A decrease in transmission from seed to cotyledon and first leaf is not surprising.
2.4 Discussion The identity of the pathogen species causing SLB in the Holland Marsh, Ontario was initially
identified as S. vesicarium based on conidia and ascospore morphology. The current study used
molecular tests and confirmed the identification for the first time in the region, based on
homology with accessions on GenBank (Foster et al. 2019), which has become the standard for
identifications for this morphologically diverse group.
Three important aspects of the lifecycle of S. vesicarium were examined. The current
study demonstrated that the pathogen could overwinter on infected onion leaf debris in Ontario,
identified for the first time that common weed species in Ontario were alternative hosts, and
confirmed that S. vesicarium could be seed-borne. The overwintering is consistent with results
from New York State (Dr. S.J. Pethybridge, Cornell University, personal communication) and
the seed-borne nature of the pathogen confirms an earlier report (Aveling et al., 1993). This
study was the first to identify yellow nutsedge, redroot pigweed, purslane, sowthistle, and
marshcress as alternative hosts of S. vesicarium.
Identifying the source of the primary inoculum could improve the efficacy of IPM
strategies. Stemphylium vesicarium was recovered from overwintering onion leaf tissue at all of
the five sampling dates from December to May. In early May, close to when the first onion
transplants would be planted in the region, pseudothecia on the leaves contained mature, viable
ascospores. It is important to note that the weather conditions over winter may have affected the
timing of pseudothecial development in the overwintering study, especially since this study was
only conducted in one year. Ascospores of S. vesicarium were previously reported in air samples
collected at the Muck Crops Research Station in the Holland Marsh from late April to July
67
(Gossen et al., 2021). However, spore trapping does not assess if the ascospores were produced
on onion or on other hosts.
No pseudothecia were found on overwintered symptomatic onion tissues in a previous
study in the Holland Marsh, ON. In the previous experiment, the leaves were fresh when buried,
so they degraded very quickly (Tayviah, 2017). In addition, it may have been more difficult to
identify the symptomatic areas of the leaves after they had overwintered in the field for several
weeks or months, since entire leaves and bulbs were used in the previous study. The current
study improved upon the previous protocol by using dried leaf tissues, which degraded more
slowly than fresh leaves. Also, dry leaf tissue simulated more closely what would occur naturally
in the field. The samples in the current study were small sections of leaf surrounding a confirmed
lesion, which narrowed the observation area after overwintering, as opposed to using the entire
leaf. Finally, dry samples (contained in a sealed plastic tube) were included to represent onion
leaves that may be stuck to equipment or had been blown into a sheltered area over winter.
The current study also assessed the viability of S. vesicarium after overwintering. The
percentage of samples producing S. vesicarium colonies generally decreased over the winter
period. This is likely due to competition by other microbes in the Petri dish when reviving the
pathogen from field samples, or competition with other microbes in the soil. By comparison to
opportunistic fungi such as Penicillium spp., S. vesicarium grows relatively slow in culture (S.
Stricker, personal observation). The leaves in the buried, wet treatment were extremely degraded
when collected on 1 May and 30 May, which may have also reduced culturing success. The
percent survival may be an underestimation of the actual survival of the pathogen in the soil,
since growth on V8 agar doesn’t mimic field conditions exactly. The buried wet treatment did
not produce viable colonies on 11 April–30 May samples, but pseudothecia were present.
Ascospores were only present on samples which were wet and on the soil surface overwinter.
This likely occurred be because daylight is required for the production of ascospores, or possibly
because of greater degradation of the buried pseudothecia by microbial saprophytes. Further
investigation is needed to confirm that burial of leaf litter decreases survival of S. vesicarium.
There was always some survival of the pathogen in treatments where the sample was dry
or at the soil surface, even at the final sampling period, which occurred when most onion
growers in the area would have onions planted. This confirms that onion leaf residue in the field
(or adjacent fields) could act as a source of primary inoculum for onion transplants or seedlings.
68
An interesting finding was that even the dry samples, which had not produced pseudothecia at
the time of collection, produced immature pseudothecia when incubated in a moist chamber.
This indicated that all of the overwintered leaf samples had the potential to produce ascospores.
We conclude that S. vesicarium is able to survive overwinter in dried crop residue at the
soil surface, but the resulting inoculum from dried tissue would likely be conidia and not
ascospores when the tissue is rehydrated. The production of ascospores required prolonged
moisture and time, with mature ascospores on wet surface samples collected on 1 May and on 30
May. It is possible that the buried wet samples had also produced pseudothecia with ascospores,
but the leaf tissue was very degraded, so buried residue was unlikely to be a strong source of
pseudothecia and ascospores.
Another possible source of primary inoculum was alternative hosts. The recovery of
S. vesicarium from inoculated weeds in a controlled-environment setting ranged from 3–44%.
When the leaf sections were surface sterilized, the recovery rate was reduced substantially for
onion but did not result in a decrease for the weeds. Successful isolation of S. vesicarium from
surface-sterilized leaves indicated that the pathogen had infected these plants and was not just
surviving as conidia or as an epiphyte on the leaf surface. The survival on alternative hosts over
winter was not tested, but the previous study showed that S. vesicarium can survive in dried
residue at the soil surface. The results from this study showed that all of the weed species tested
were asymptomatic hosts of S. vesicarium, with recovery after sterilization similar to onion. This
may be due to the small sample size of the experiment. All of the local weed species tested were
potential sources of inoculum and may also act as a living bridge for the pathogen to survive
when onion plants are not available.
Weedy hosts may also serve a beneficial role, in the case of fungicide resistance
management. The pathogen refuge hypothesis states that non-sprayed host plants offer a genetic
refuge for susceptible alleles and so the emergence of fungicide insensitivity in a pathogen
population will be slowed (Shaw, 2009). Conversely, these alternative hosts may exist as weeds
within the onion field or in neighbouring crop fields that are treated with fungicides, thus further
increasing the number of interactions between pathogen and fungicide, resulting in increased
selection pressure that could shift the population towards fungicide insensitivity. Fungicide
sensitivity is examined in detail in Chapter 4.
69
Over 500 species have been reported as hosts for S. vesicarium, but this is the first report
of infection of redroot pigweed, yellow nutsedge, purslane, marshcress, bull thistle, and
sowthistle in Canada. Therefore, the ditches and fallow areas near onion fields may act as
sources of primary inoculum for SLB. As a result, removal of weeds from surrounding areas
might reduce early-season infection. However, growers already make every effort to manage
weeds within the onion crop and eliminating all weeds or possible alternative hosts near fields
would be costly and potentially detrimental to the local ecosystem. One management
recommendation would be that when onion fields are hand-weeded, that the weeds should be
physically removed from the field because the plucked weeds could act as sources of inoculum
for the pathogen. Fortunately, this is already a common practice as weeds can regrow if pulled
and left on the soil. The wide host range of S. vesicarium also means that ornamental plants and
grass species around dwellings in the Holland Marsh could be a source of inoculum, or plants in
the natural areas around the Marsh. The main source of initial inoculum and the relative
contributions of different plant species is not known.
Several researchers have suggested that S. vesicarium is a seed-borne pathogen, and
S. vesicarium and other Stemphylium spp. have previously been isolated from seed of pea (Pisum
sativum) (Teixeira, 2005), spinach (Spinacia oleracea) (Hernandez-Perez, 2005), squash
(Cucurbita maxima, C. moschata) (Moumni et al., 2020), onion (Aveling et al., 1993), and other
crops (Groves and Skolko, 1944). The current study confirmed that S. vesicarium can be seed-
borne on onion. Onion plants grown from a commercial seed lot inoculated with S. vesicarium
did not develop SLB symptoms, which indicated that surface infestation of seed did not result in
seed-to-seedling transmission. It is possible that the study was too small to capture a small
proportion of seed-to-seedling transmission.
The pathogen was isolated from 4–6% of surface-sterilized seed produced in inoculated
flowers in a growth room study. This indicated that S. vesicarium could develop within the seed,
not just on the surface, likely as the result of infection during seed formation. A field study
confirmed that 19 of 2013 of seeds (0.9%) were infected with S. vesicarium. Seed-to-seedling
transmission occurred in 1.2% of the onion seedlings grown from that seed. This infection rate is
much lower than previously reported rates of 32% for seeds and 28% for onion seedlings
(Aveling et al., 1993). This difference may possibly be due to a lower inoculum load in the
current study than in the original study. Much commercial seed production takes place in regions
70
with low rainfall and low incidence of foliar diseases. Assessment of a larger number of infected
seeds might change the proportion of naturally infected seeds or seed-to-seedling transmission,
but the current study is consistent with earlier studies showing that this can occur.
Seedling infection from infected seed may result from infection of the tip of the
cotyledon when the seed-coat remains attached to the tip of the cotyledon as the seedling
emerges from the soil, as occurs with neck rot of onion caused by Botrytis allii Munn (Maude
and Presly, 1977). There is also the possibility that the fungus grows systemically from the seed
to the cotyledon and other leaves. The mechanisms of seed-to-seedling transmission have not
been investigated for S. vesicarium. The heat treatment studies showed that heat treatments of
50 °C for 10 to 40 min reduced fungal infestation without affecting seed germination or seedling
emergence.
This study investigated the etiology of SLB caused by S. vesicarium on onion, from
primary inoculum to overwintering. It demonstrated that S. vesicarium overwintered in infected
leaf debris to produce ascospores in early spring and confirmed that it can infest onion seed. In
addition, it demonstrated that the local weed species are hosts of S. vesicarium, which is not
surprising considering the vast and diverse number of previously described host species.
These conclusions support a number of existing management recommendations. Burial or
removal of onion debris may reduce the initial inoculum, as has been previously recommended
(WCPD, 2012). Infested seed could be a source of inoculum, but commercial seed is often
treated with heat and /or fungicides, which probably reduce or eliminate the risk of seed as a
source of inoculum. The role of common weeds as alternative hosts supports recommendations
for keeping onion fields weed free to reduce competition. This study also provides support for
the practice of removing weeds from the field when hand weeding.
71
Chapter 3 Scheduling fungicide applications for management of
Stemphylium leaf blight of onion The following results of the fungicide application timing field studies have been published
(Stricker et al., 2020).
3.1 Introduction
Stemphylium leaf blight (SLB) was first reported on onion in the North America in Texas, USA
in 1976 (Miller et al., 1978) and in New York state in 1985 (Shishkoff and Lorbeer, 1989). By
1990, SLB was present in almost all onion fields surveyed across New York state, resulting in
severe foliar dieback in some fields (Lorbeer, 1993). SLB was first reported on onion in Ontario
in 2008 (Paibomesai et al. 2012) and is a growing concern in both Ontario and New York.
SLB can lead to premature defoliation of the onion crop, resulting in loss of yield up to
90% (Lorbeer, 1993). Field trials in New York have reported yield losses of 28–38% (Hoepting,
2018a; c) and up to 74% premature plant mortality when disease pressure was high (Hoepting,
2017b). The pathogen, S. vesicarium also causes purple spot and Stemphylium leaf spot of
asparagus and brown spot of pear (Lacy 1982; Hausbeck et al. 1999; Singh et al. 1999). Infection
of asparagus or pear fruit results in an unmarketable produce due to cosmetic damage (Falloon et
al., 1987; Llorente et al., 2010b).
None of the onion cultivars commercially grown in Ontario are resistant to S. vesicarium
(Foster et al., 2019). Some cultivars exhibited more foliar lesions than others, whereas other
cultivars were more susceptible to leaf dieback (Foster et al., 2019). This observation is
supported by reports from a fungicide trial conducted in New York; some fungicide treatments
resulted in high levels of leaf dieback with few SLB lesions, while others had less leaf dieback
and high SLB lesion counts (Hoepting, 2020a). These results suggested that resistance to
infection was independent of susceptibility to dieback.
Regular application of preventative or curative fungicides is an important tool for
management of diseases caused by fungal pathogens (Llorente et al., 2012), especially where
genetic resistance is not available. Onion growers often use a calendar-based method (e.g.,
weekly or bi-weekly) for scheduling fungicide applications to manage foliar diseases in the
absence of disease forecasting information. Onion growers in the Holland Marsh, Ontario,
typically begin fungicide applications for SLB when the disease is reported in the local area
72
(Tayviah, 2017). This method does not depend on weather conditions or knowledge of the
biology of the pathogen, and can result in more applications than necessary (Llorente et al.,
2012, Tayviah 2017). More recently, fungicides have been applied when disease forecasting
using TOMcast indicated a high risk of disease. This change resulted from trials in the current
study and a previous study (Tayviah, 2017). Applying more fungicide sprays than needed is not
economical, and also increases the risk that fungicide insensitivity will develop in the pathogen
population (Alberoni et al., 2010b). On the other hand, fewer applications than necessary could
result in unacceptable levels of disease and loss of yield. Forecasting models use environmental
factors to identify conditions that are conducive to disease development and recommend when
growers should apply pesticides. A disease forecasting model should trigger fungicide
applications that manage the disease without compromising crop yield or quality.
Effective forecasting models can provide the same level of disease suppression as
calendar-based methods that result in a greater number of fungicide applications. Several
forecasting models have been used for management of S. vesicarium on a range of crops, or of
other foliar diseases of onion. FAST (Forecasting for Alternaria solani on Tomato), a forecast
model developed for A. solani on tomatoes (Solanum lycopersicum L.), achieved comparable
disease reduction for brown spot of pear (BSP) as the 7-day calendar spray, with 28% fewer
applications (Montesinos and Vilardell, 1992). TOMcast (Tomato forecaster), a modification of
FAST, was developed for management of Septoria leaf spot (Septoria lycopersici Speg.) and
anthracnose (Colletotrichum coccodes [Wallr.] S. Hughes) on tomato in Ontario (Pitblado,
1992).
In the TOMcast model, disease severity values (DSVs) are calculated based on leaf
wetness duration and the average temperature during the wet period, and fungicide sprays are
recommended when cumulative DSVs meet or exceed the threshold value (Madden et al., 1978).
When TOMcast with a DSV threshold of 15 was used for management of purple spot of
asparagus, fungicide application was reduced by 60% (Meyer and Hausbeck, 2000). With some
cultivars of asparagus, TOMcast improved the suppression of Stemphylium leaf spot without
increasing the number of fungicide applications (Foster and McDonald, 2018). TOMcast also
reduced fungicide sprays on onion in 2015 and 2016 while providing 35–44% SLB disease
suppression (Stricker et al., 2020).
73
The BOTcast (Botrytis forecaster) model was developed for management of Botrytis leaf
blight of onion caused by Botrytis squamosa. BOTcast uses similar weather parameters as
TOMcast but a different combination of temperature and leaf wetness to estimate disease risk
based on favourable conditions for infection (Sutton et al., 1986). A combination of daily
inoculum value (0–2) and daily infection value (0–2) is used to calculate cumulative disease
severity index (CDSI). Fungicide applications are recommended at one of two thresholds:
medium risk at 21–30 CDSI, and high risk of disease at 31–40 CDSI. In previous trials at the
Muck Crops Research Station (MCRS) in Ontario, BOTcast showed potential to reduce the
number of spray applications for managing SLB on onion (McDonald and Vander Kooi, 2014).
A third model, BSPcast (Brown spot of pear forecaster), was developed specifically for use with
S. vesicarium in pear (Pyrus spp.) orchards in Spain (Montesinos et al., 1995). As with the
previous models, this model integrated the effect of daily leaf wetness duration and the
temperature during the wetness period to calculate a fungicide application recommendation.
BSPcast-guided schedules for application of thiram used 20–50% fewer sprays to provide the
same degree of disease suppression as weekly application on pear (Llorente et al., 2010b). Most
recently, the forecasting model SIMSTEM (Simulation of Stemphylium) was developed for
management of purple spot of asparagus in Germany (Bohlen-Janssen, 2018). SIMSTEM uses
area-specific weather data to predict the beginning of an epidemic, the time of first treatment,
and disease progress. The simulator will be available to growers on a website platform in the
future (www.isip.de).
Fungicide seed treatments can be highly effective in reducing, or even eradicating, seed-
borne fungal pathogens for many vegetable crops (Mancini and Romanazzi, 2014). Systemic
fungicides such as penflufen and azoxystrobin may also protect the first few leaves of an onion
seedling before the plants are big enough to be sprayed with a foliar fungicide. Studies presented
in Chapter 2 demonstrated that S. vesicarium can be seed-borne, as suggested by Aveling et al.
(1993), and ascospores are present in the field even before the crop emerges (Gossen et al. 2021),
so seed treatments may offer early-season protection against SLB.
The objectives of the current project were i) to assess existing disease forecasting models
for the management of SLB, and ii) to investigate seed treatments as alternative or additional
management methods for SLB.
74
This research focused on yellow bulb onion grown in the Holland Marsh, Ontario on
organic muck soil (50–75% organic matter, pH 5.5–7.2), which is where the majority of Ontario
onions are produced. The fungicide timing study presented below has already been published
(Stricker et al., 2020).
3.2 Materials and methods
3.2.1 Plant material
Commonly used cultivars of yellow cooking onion (cv. LaSalle in 2018, cv. Fortress in 2019;
Stokes Seeds, Thorold, ON) were direct seeded in organic soil (organic matter ≈ 69, pH ≈ 6.1) at
the Muck Crops Research Station (King, ON, 44.0406° N, 79.5977° W). Cultivar LaSalle was
selected because it was susceptible to SLB in a previous study (Tayviah, 2017). In 2019, this
cultivar was not available, so another susceptible cultivar, Fortress, was used.
The experimental design was a randomized complete block design with four replicates.
One plot consisted of two adjacent beds, each 6 m × 1.75 m, seeded with four double rows 7.5
cm apart with 35 cm separation between pairs of rows. Beds were separated by 45 cm-wide
wheel row furrows. There were four plots across the field and each set of four beds was
separated by a 1.5 m-wide path (Appendix 3.1).
Onion plots were seeded on 9 May 2018 and 17 May 2019. Planting was delayed in 2019
due to high rainfall and poor drainage in the field. Seed was sown at 35 seeds m-1 using a
Stanhay S870 Precision belt planter (Stanhay, Bourne, UK). The granular fungicide Dithane™
DG (75% mancozeb, 6.6 kg ha-1, Dow Agrosciences, Calgary, AB) was applied in the furrow at
seeding to manage onion smut caused by Urocystis cepulae. Insecticides, herbicides, and
irrigation were applied as required according to OMAFRA production recommendations. The
seed was pelleted, and the pellet contained insecticide (0.18 g clothianidin + 0.6 g imidacloprid
per 1,000 seeds, Sepresto 75 WS, CropScience, NC) for management of onion maggot (Delia
antiqua Meigen). Herbicides were applied for weed management when necessary, and plots were
also weeded by hand.
In 2019, barley was manually sown after onion was seeded. Interplanting with barley is a
common cultural practice to reduce soil erosion by wind when planting carrot or onion crops in
muck soil (Zandstra and Warncke, 1993). Herbicide (125 g ha-1fluazifop-P-butyl and s-isomer;
75
Venture L, Syngenta, Guelph ON) was applied to kill the barley when the barley leaves reached
15 cm and the onions reached the 2–4 leaf stage.
3.2.2 Fungicide spray programs
A tractor-mounted sprayer fitted with spray nozzles (D-3 hollow cone, TeeJet) delivered 500 L
solution ha-1 at 620 kPa. In 2018, the foliar sprays consisted of azoxystrobin plus difenoconazole
(Quadris Top, applied at 200 g ha-1 azoxystrobin, 125 g ha-1 difenoconazole; Syngenta, Guelph,
ON) alternated with fluopyram plus pyrimethanil (Luna Tranquility, applied at 150 g ha-1
fluopyram, 450 g ha-1 pyrimethanil; Bayer Crop Science Inc., Calgary, AB). The foliar fungicide
spray program in 2019 used benzovindiflupyr (Aprovia applied at 75 g a.i. ha-1; Syngenta,
Guelph, ON) alternated with chlorothalonil (Bravo Zn applied at 1.8 kg a.i. ha-1; Syngenta,
Guelph, ON) in an effort to use fungicides that might be more effective to reduce SLB, since no
disease suppression was observed in 2018.
There were seven treatments and an unsprayed check (Table 3.1). The weekly calendar
sprays were applied every 7–10 days where possible. There were also two fungicide seed
treatments in the trials: EverGol Prime (2.5 g penflufen kg-1 seed; Bayer Crop Science, Guelph,
ON) or FarMore F300 (0.075 g mefenoxam kg-1 seed, 0.0275 g fludioxonil kg-1 seed, 0.025 g
azoxystrobin kg-1 seed; Syngenta, Guelph, ON). The seed treatments were applied commercially
(Incotec, Salinas, CA) using industry-standard procedures. In 2019, the seed treatments were also
tested without additional foliar fungicide applications. The action thresholds for these disease
forecasting models were based on previous research (Tayviah, 2017; Bohlen-Janssen, 2018).
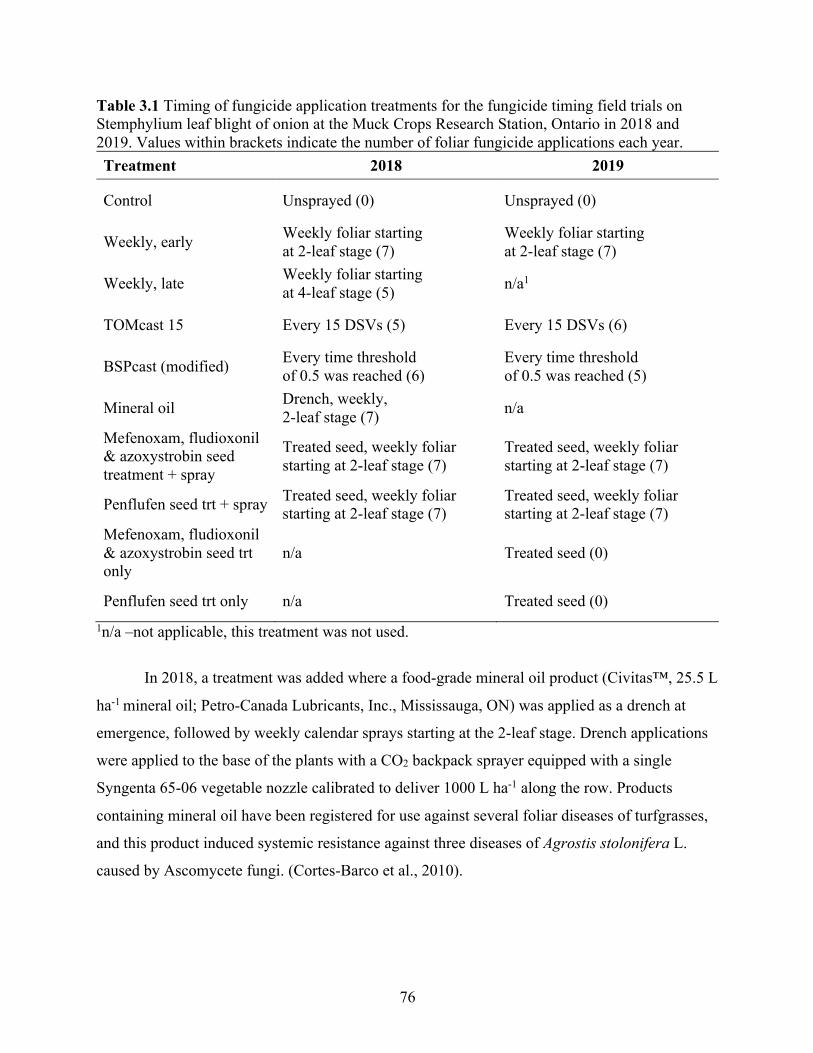
76
Table 3.1 Timing of fungicide application treatments for the fungicide timing field trials on Stemphylium leaf blight of onion at the Muck Crops Research Station, Ontario in 2018 and 2019. Values within brackets indicate the number of foliar fungicide applications each year. Treatment 2018 2019
Control Unsprayed (0) Unsprayed (0)
Weekly, early Weekly foliar starting at 2-leaf stage (7)
Weekly foliar starting at 2-leaf stage (7)
Weekly, late Weekly foliar starting at 4-leaf stage (5) n/a1
TOMcast 15 Every 15 DSVs (5) Every 15 DSVs (6)
BSPcast (modified) Every time threshold of 0.5 was reached (6)
Every time threshold of 0.5 was reached (5)
Mineral oil Drench, weekly, 2-leaf stage (7) n/a
Mefenoxam, fludioxonil & azoxystrobin seed treatment + spray
Treated seed, weekly foliar starting at 2-leaf stage (7)
Treated seed, weekly foliar starting at 2-leaf stage (7)
Penflufen seed trt + spray Treated seed, weekly foliar starting at 2-leaf stage (7)
Treated seed, weekly foliar starting at 2-leaf stage (7)
Mefenoxam, fludioxonil & azoxystrobin seed trt only
n/a Treated seed (0)
Penflufen seed trt only n/a Treated seed (0) 1n/a –not applicable, this treatment was not used.
In 2018, a treatment was added where a food-grade mineral oil product (Civitas™, 25.5 L
ha-1 mineral oil; Petro-Canada Lubricants, Inc., Mississauga, ON) was applied as a drench at
emergence, followed by weekly calendar sprays starting at the 2-leaf stage. Drench applications
were applied to the base of the plants with a CO2 backpack sprayer equipped with a single
Syngenta 65-06 vegetable nozzle calibrated to deliver 1000 L ha-1 along the row. Products
containing mineral oil have been registered for use against several foliar diseases of turfgrasses,
and this product induced systemic resistance against three diseases of Agrostis stolonifera L.
caused by Ascomycete fungi. (Cortes-Barco et al., 2010).
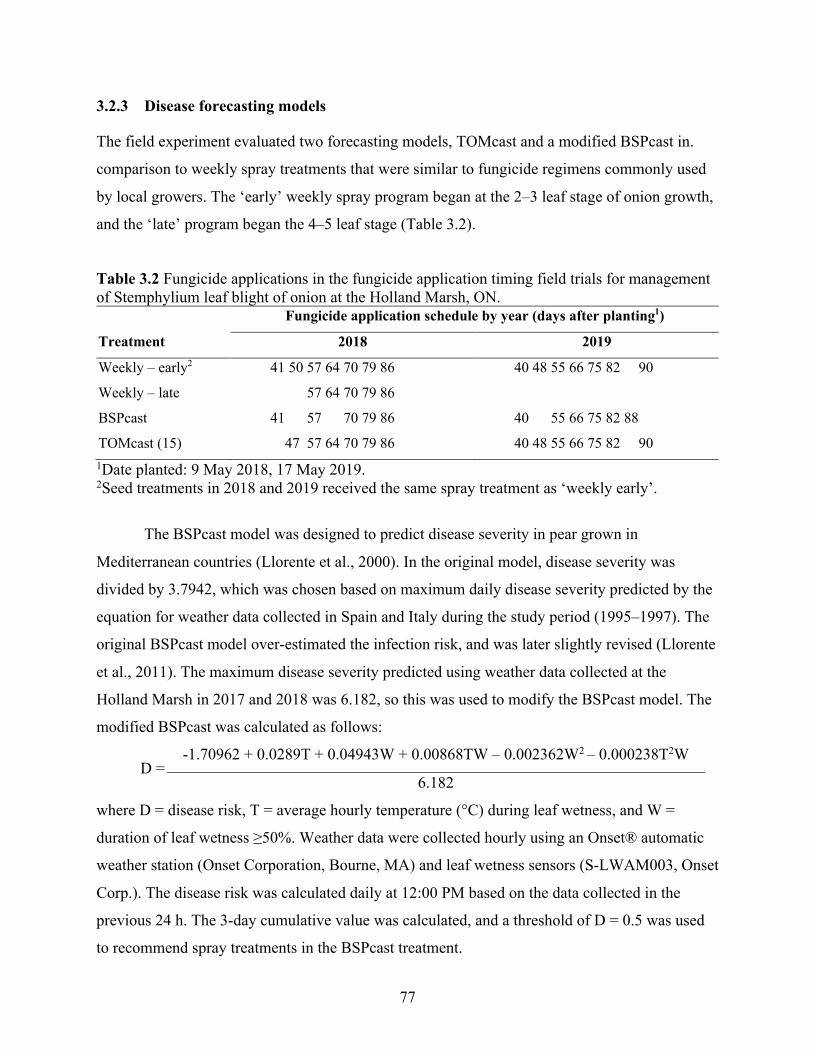
77
3.2.3 Disease forecasting models
The field experiment evaluated two forecasting models, TOMcast and a modified BSPcast in.
comparison to weekly spray treatments that were similar to fungicide regimens commonly used
by local growers. The ‘early’ weekly spray program began at the 2–3 leaf stage of onion growth,
and the ‘late’ program began the 4–5 leaf stage (Table 3.2).
Table 3.2 Fungicide applications in the fungicide application timing field trials for management of Stemphylium leaf blight of onion at the Holland Marsh, ON. Fungicide application schedule by year (days after planting1)
Treatment 2018 2019
Weekly – early2 41 50 57 64 70 79 86 40 48 55 66 75 82 90
Weekly – late 57 64 70 79 86
BSPcast 41 57 70 79 86 40 55 66 75 82 88
TOMcast (15) 47 57 64 70 79 86 40 48 55 66 75 82 90 1Date planted: 9 May 2018, 17 May 2019. 2Seed treatments in 2018 and 2019 received the same spray treatment as ‘weekly early’.
The BSPcast model was designed to predict disease severity in pear grown in
Mediterranean countries (Llorente et al., 2000). In the original model, disease severity was
divided by 3.7942, which was chosen based on maximum daily disease severity predicted by the
equation for weather data collected in Spain and Italy during the study period (1995–1997). The
original BSPcast model over-estimated the infection risk, and was later slightly revised (Llorente
et al., 2011). The maximum disease severity predicted using weather data collected at the
Holland Marsh in 2017 and 2018 was 6.182, so this was used to modify the BSPcast model. The
modified BSPcast was calculated as follows:
D = -1.70962 + 0.0289T + 0.04943W + 0.00868TW – 0.002362W2 – 0.000238T2W
6.182
where D = disease risk, T = average hourly temperature (°C) during leaf wetness, and W =
duration of leaf wetness ≥50%. Weather data were collected hourly using an Onset® automatic
weather station (Onset Corporation, Bourne, MA) and leaf wetness sensors (S-LWAM003, Onset
Corp.). The disease risk was calculated daily at 12:00 PM based on the data collected in the
previous 24 h. The 3-day cumulative value was calculated, and a threshold of D = 0.5 was used
to recommend spray treatments in the BSPcast treatment.
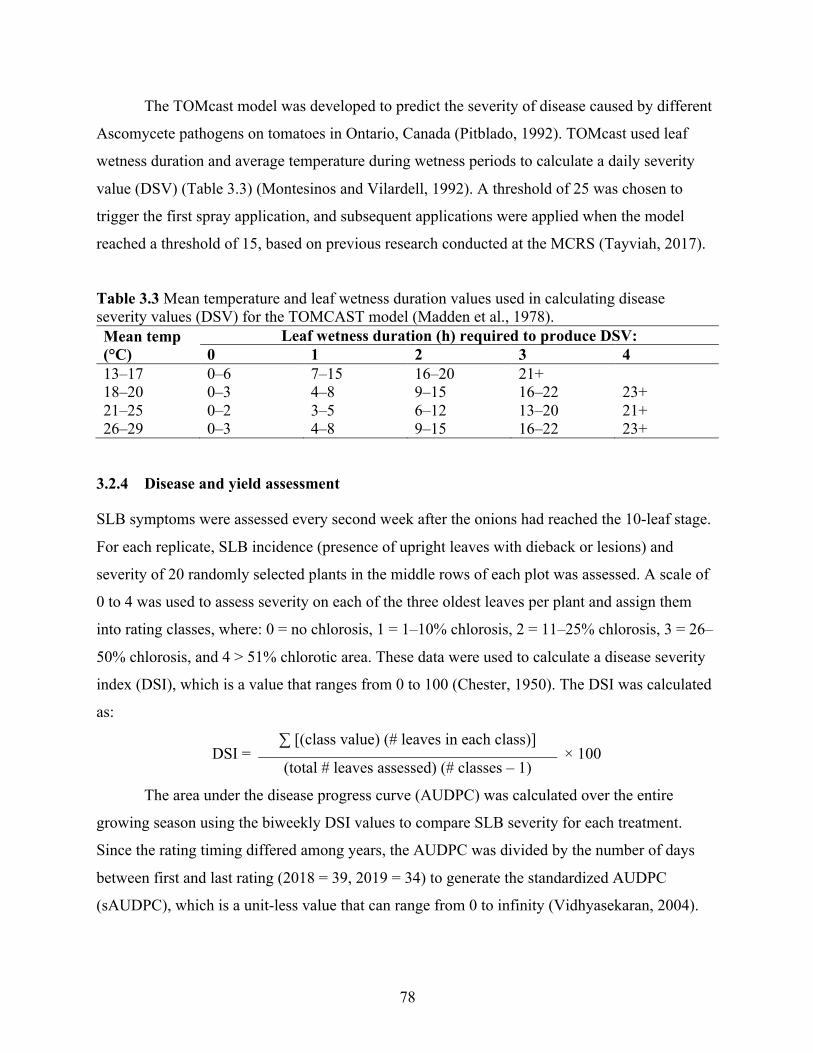
78
The TOMcast model was developed to predict the severity of disease caused by different
Ascomycete pathogens on tomatoes in Ontario, Canada (Pitblado, 1992). TOMcast used leaf
wetness duration and average temperature during wetness periods to calculate a daily severity
value (DSV) (Table 3.3) (Montesinos and Vilardell, 1992). A threshold of 25 was chosen to
trigger the first spray application, and subsequent applications were applied when the model
reached a threshold of 15, based on previous research conducted at the MCRS (Tayviah, 2017).
Table 3.3 Mean temperature and leaf wetness duration values used in calculating disease severity values (DSV) for the TOMCAST model (Madden et al., 1978). Mean temp (°C)
Leaf wetness duration (h) required to produce DSV: 0 1 2 3 4
13–17 0–6 7–15 16–20 21+ 18–20 0–3 4–8 9–15 16–22 23+ 21–25 0–2 3–5 6–12 13–20 21+ 26–29 0–3 4–8 9–15 16–22 23+
3.2.4 Disease and yield assessment
SLB symptoms were assessed every second week after the onions had reached the 10-leaf stage.
For each replicate, SLB incidence (presence of upright leaves with dieback or lesions) and
severity of 20 randomly selected plants in the middle rows of each plot was assessed. A scale of
0 to 4 was used to assess severity on each of the three oldest leaves per plant and assign them
into rating classes, where: 0 = no chlorosis, 1 = 1–10% chlorosis, 2 = 11–25% chlorosis, 3 = 26–
50% chlorosis, and 4 > 51% chlorotic area. These data were used to calculate a disease severity
index (DSI), which is a value that ranges from 0 to 100 (Chester, 1950). The DSI was calculated
as:
DSI = ∑ [(class value) (# leaves in each class)]
× 100 (total # leaves assessed) (# classes – 1)
The area under the disease progress curve (AUDPC) was calculated over the entire
growing season using the biweekly DSI values to compare SLB severity for each treatment.
Since the rating timing differed among years, the AUDPC was divided by the number of days
between first and last rating (2018 = 39, 2019 = 34) to generate the standardized AUDPC
(sAUDPC), which is a unit-less value that can range from 0 to infinity (Vidhyasekaran, 2004).
79
Shortly before lodging, a final destructive disease assessment was conducted. Twenty
onion plants were harvested from the inside rows of each plot, and every leaf was removed. The
leaves were sorted based on the same classes as described previously and DSI was calculated as
described above. In late September to early October, the yield and marketable yield were
assessed by harvesting two 2.3-m-long sections of row from the middle rows of each plot. The
plants were topped using an agriculture-grade onion topping machine, bagged, weighed, and
graded based on diameter to determine marketable yield, which was converted to tonnes ha-1.
The onions were sorted into four classes: cull (< 32 mm dia.), small (32–45 mm), medium (45–
76 mm), and jumbo (> 76 mm). Onions in the medium and jumbo classes were deemed
marketable, and the percent of marketable onions (by weight) was calculated for each treatment.
3.2.5 Data analysis
A mixed model analysis of variance was used to assess the disease and yield data (PROC
GLIMMIX) in SAS University Edition (SAS Institute Inc., Cary, NC). DSI and marketable yield
values, which were expressed as a percent, were divided by 100 for analysis using a beta
distribution. Variance was partitioned into random (block or replicate) and fixed (treatment)
effects. Means were separated using Tukey’s Honest Significant Difference at P ≤ 0.05.
Pearson’s correlation (PROC CORR, P ≤ 0.05) was used to test for a linear relationship between
yield and SLB severity each year. In the pooled analysis across years, the treatments occurring in
only one year were removed prior to analysis.
3.3 Results
3.3.1 2018 Field season
Disease pressure and SLB severity was high in 2018, starting early in the growing season. The
weekly schedules resulted in five (4-leaf stage) to seven (2-leaf stage) foliar applications of
fungicide. Weekly foliar fungicide applications and the mineral oil drench did not reduce blight
incidence or severity compared to the untreated control (Table 3.4). The forecasting models
reduced the number of fungicide applications compared to the weekly schedule starting at the 2-
leaf growth stage, with five applications recommended by TOMcast and six applications by
BSPcast. However, neither of the forecasting models reduced SLB severity compared to the
unsprayed control based on in-field disease incidence and severity. In contrast, fungicide seed
treatments in combination with weekly foliar sprays reduced SLB incidence by 22–30%, DSI by
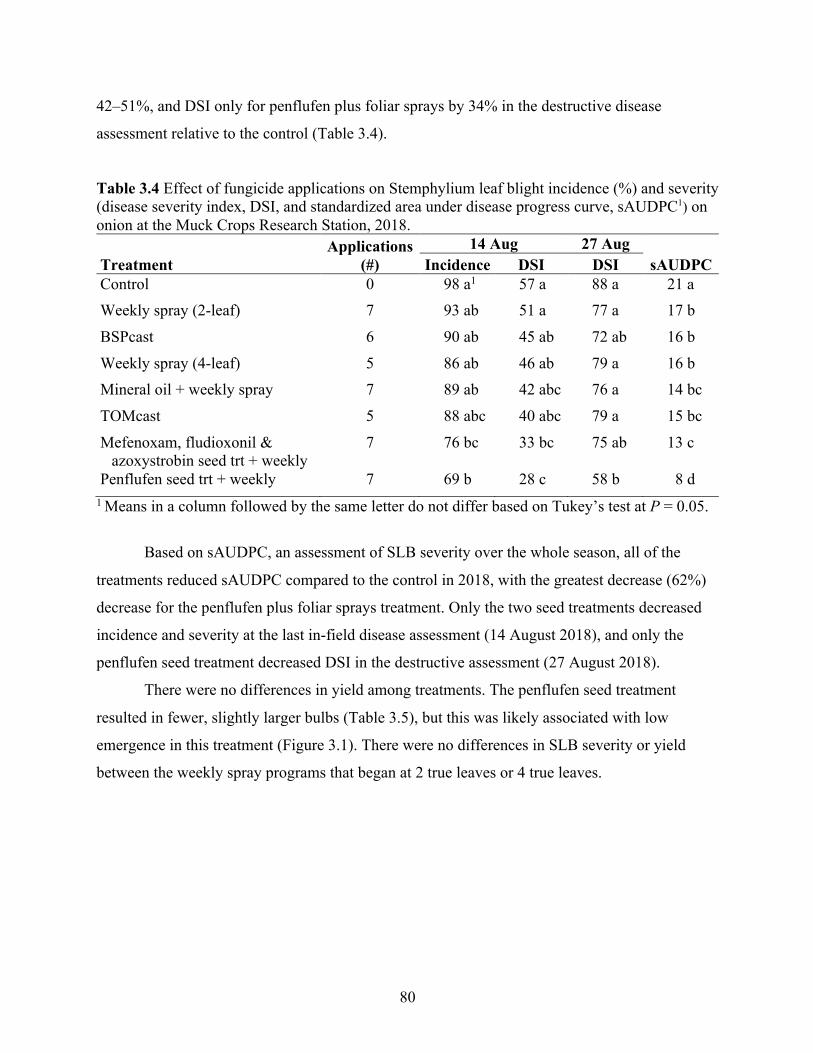
80
42–51%, and DSI only for penflufen plus foliar sprays by 34% in the destructive disease
assessment relative to the control (Table 3.4).
Table 3.4 Effect of fungicide applications on Stemphylium leaf blight incidence (%) and severity (disease severity index, DSI, and standardized area under disease progress curve, sAUDPC1) on onion at the Muck Crops Research Station, 2018.
Treatment Applications
(#) 14 Aug 27 Aug
sAUDPC Incidence DSI DSI Control 0 98 a1 57 a 88 a 21 a Weekly spray (2-leaf) 7 93 ab 51 a 77 a 17 b
BSPcast 6 90 ab 45 ab 72 ab 16 b
Weekly spray (4-leaf) 5 86 ab 46 ab 79 a 16 b Mineral oil + weekly spray 7 89 ab 42 abc 76 a 14 bc
TOMcast 5 88 abc 40 abc 79 a 15 bc
Mefenoxam, fludioxonil & azoxystrobin seed trt + weekly
7 76 bc 33 bc 75 ab 13 c
Penflufen seed trt + weekly 7 69 b 28 c 58 b 8 d 1 Means in a column followed by the same letter do not differ based on Tukey’s test at P = 0.05.
Based on sAUDPC, an assessment of SLB severity over the whole season, all of the
treatments reduced sAUDPC compared to the control in 2018, with the greatest decrease (62%)
decrease for the penflufen plus foliar sprays treatment. Only the two seed treatments decreased
incidence and severity at the last in-field disease assessment (14 August 2018), and only the
penflufen seed treatment decreased DSI in the destructive assessment (27 August 2018).
There were no differences in yield among treatments. The penflufen seed treatment
resulted in fewer, slightly larger bulbs (Table 3.5), but this was likely associated with low
emergence in this treatment (Figure 3.1). There were no differences in SLB severity or yield
between the weekly spray programs that began at 2 true leaves or 4 true leaves.
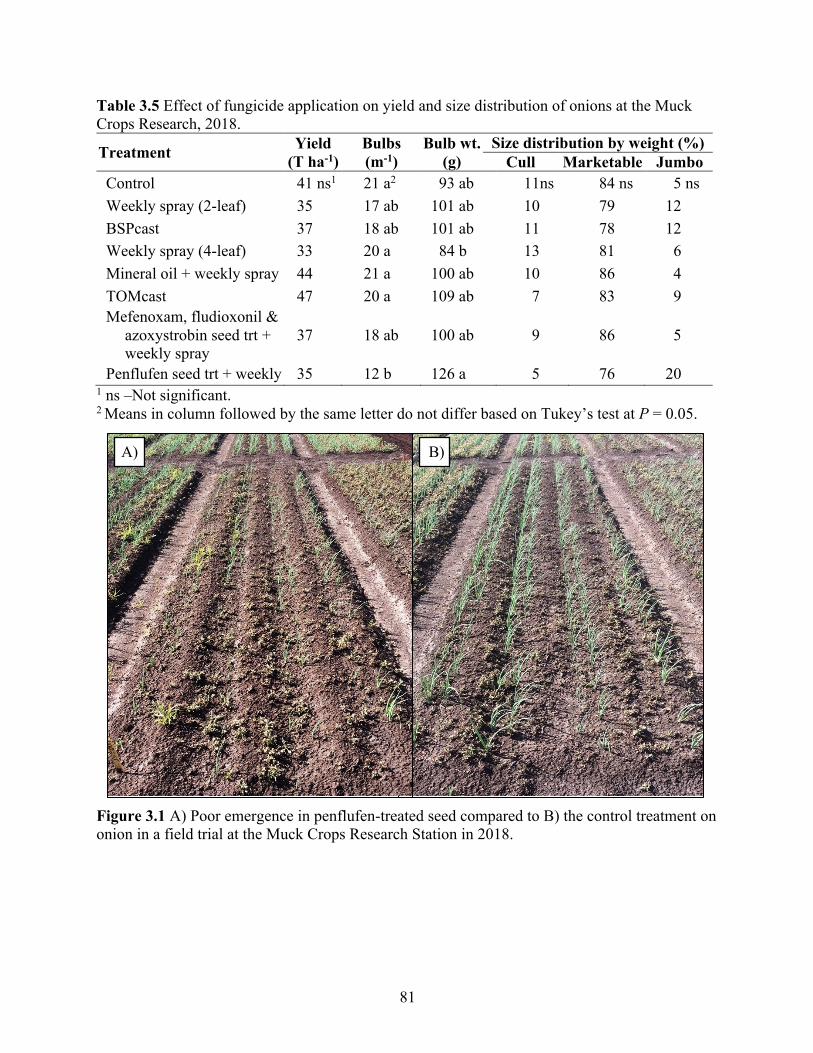
81
Table 3.5 Effect of fungicide application on yield and size distribution of onions at the Muck Crops Research, 2018.
Treatment Yield (T ha-1)
Bulbs (m-1)
Bulb wt. (g)
Size distribution by weight (%) Cull Marketable Jumbo
Control 41 ns1 21 a2 93 ab 11ns 84 ns 5 ns Weekly spray (2-leaf) 35 17 ab 101 ab 10 79 12 BSPcast 37 18 ab 101 ab 11 78 12 Weekly spray (4-leaf) 33 20 a 84 b 13 81 6 Mineral oil + weekly spray 44 21 a 100 ab 10 86 4 TOMcast 47 20 a 109 ab 7 83 9 Mefenoxam, fludioxonil &
azoxystrobin seed trt + weekly spray
37 18 ab 100 ab 9 86 5
Penflufen seed trt + weekly 35 12 b 126 a 5 76 20 1 ns –Not significant. 2 Means in column followed by the same letter do not differ based on Tukey’s test at P = 0.05.
Figure 3.1 A) Poor emergence in penflufen-treated seed compared to B) the control treatment on onion in a field trial at the Muck Crops Research Station in 2018.
A) B)
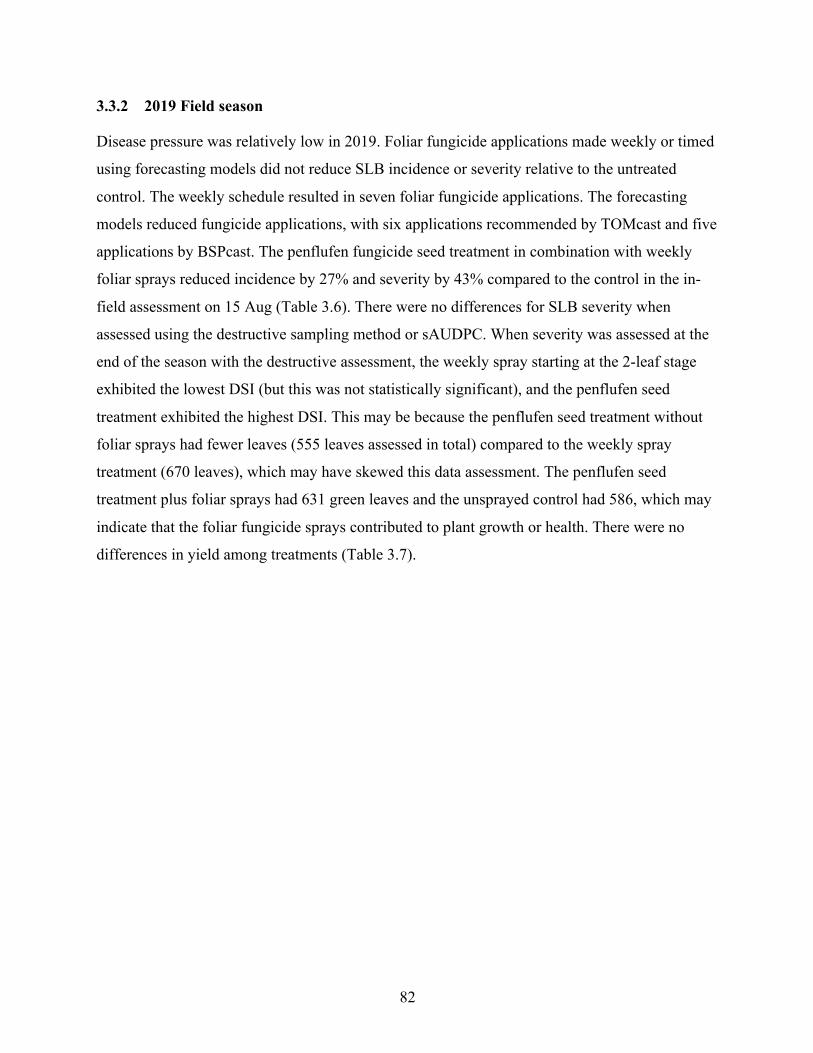
82
3.3.2 2019 Field season
Disease pressure was relatively low in 2019. Foliar fungicide applications made weekly or timed
using forecasting models did not reduce SLB incidence or severity relative to the untreated
control. The weekly schedule resulted in seven foliar fungicide applications. The forecasting
models reduced fungicide applications, with six applications recommended by TOMcast and five
applications by BSPcast. The penflufen fungicide seed treatment in combination with weekly
foliar sprays reduced incidence by 27% and severity by 43% compared to the control in the in-
field assessment on 15 Aug (Table 3.6). There were no differences for SLB severity when
assessed using the destructive sampling method or sAUDPC. When severity was assessed at the
end of the season with the destructive assessment, the weekly spray starting at the 2-leaf stage
exhibited the lowest DSI (but this was not statistically significant), and the penflufen seed
treatment exhibited the highest DSI. This may be because the penflufen seed treatment without
foliar sprays had fewer leaves (555 leaves assessed in total) compared to the weekly spray
treatment (670 leaves), which may have skewed this data assessment. The penflufen seed
treatment plus foliar sprays had 631 green leaves and the unsprayed control had 586, which may
indicate that the foliar fungicide sprays contributed to plant growth or health. There were no
differences in yield among treatments (Table 3.7).
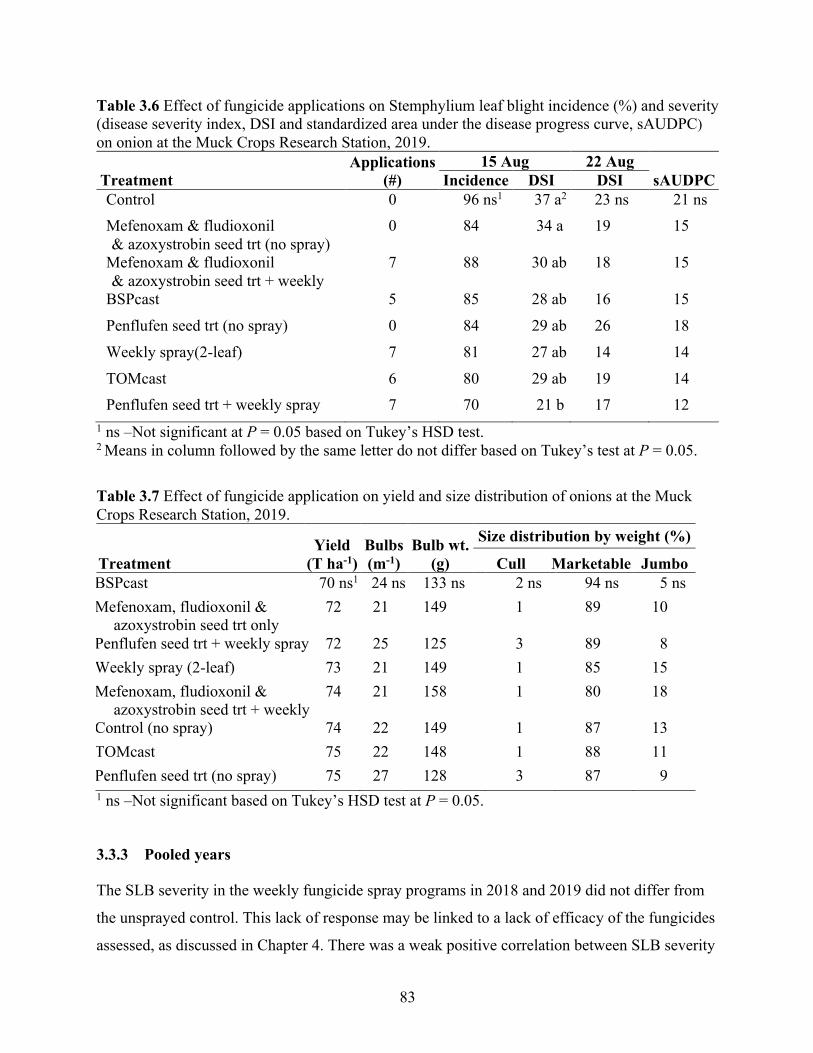
83
Table 3.6 Effect of fungicide applications on Stemphylium leaf blight incidence (%) and severity (disease severity index, DSI and standardized area under the disease progress curve, sAUDPC) on onion at the Muck Crops Research Station, 2019.
Treatment Applications
(#) 15 Aug 22 Aug
sAUDPC Incidence DSI DSI Control 0 96 ns1 37 a2 23 ns 21 ns Mefenoxam & fludioxonil & azoxystrobin seed trt (no spray)
0 84 34 a 19 15
Mefenoxam & fludioxonil & azoxystrobin seed trt + weekly
7 88 30 ab 18 15
BSPcast 5 85 28 ab 16 15
Penflufen seed trt (no spray) 0 84 29 ab 26 18
Weekly spray(2-leaf) 7 81 27 ab 14 14
TOMcast 6 80 29 ab 19 14 Penflufen seed trt + weekly spray 7 70 21 b 17 12
1 ns –Not significant at P = 0.05 based on Tukey’s HSD test. 2 Means in column followed by the same letter do not differ based on Tukey’s test at P = 0.05.
Table 3.7 Effect of fungicide application on yield and size distribution of onions at the Muck Crops Research Station, 2019.
Treatment Yield
(T ha-1) Bulbs (m-1)
Bulb wt. (g)
Size distribution by weight (%)
Cull Marketable Jumbo BSPcast 70 ns1 24 ns 133 ns 2 ns 94 ns 5 ns Mefenoxam, fludioxonil &
azoxystrobin seed trt only 72 21 149 1 89 10
Penflufen seed trt + weekly spray 72 25 125 3 89 8 Weekly spray (2-leaf) 73 21 149 1 85 15 Mefenoxam, fludioxonil &
azoxystrobin seed trt + weekly 74 21 158 1 80 18
Control (no spray) 74 22 149 1 87 13 TOMcast 75 22 148 1 88 11 Penflufen seed trt (no spray) 75 27 128 3 87 9 1 ns –Not significant based on Tukey’s HSD test at P = 0.05.
3.3.3 Pooled years
The SLB severity in the weekly fungicide spray programs in 2018 and 2019 did not differ from
the unsprayed control. This lack of response may be linked to a lack of efficacy of the fungicides
assessed, as discussed in Chapter 4. There was a weak positive correlation between SLB severity
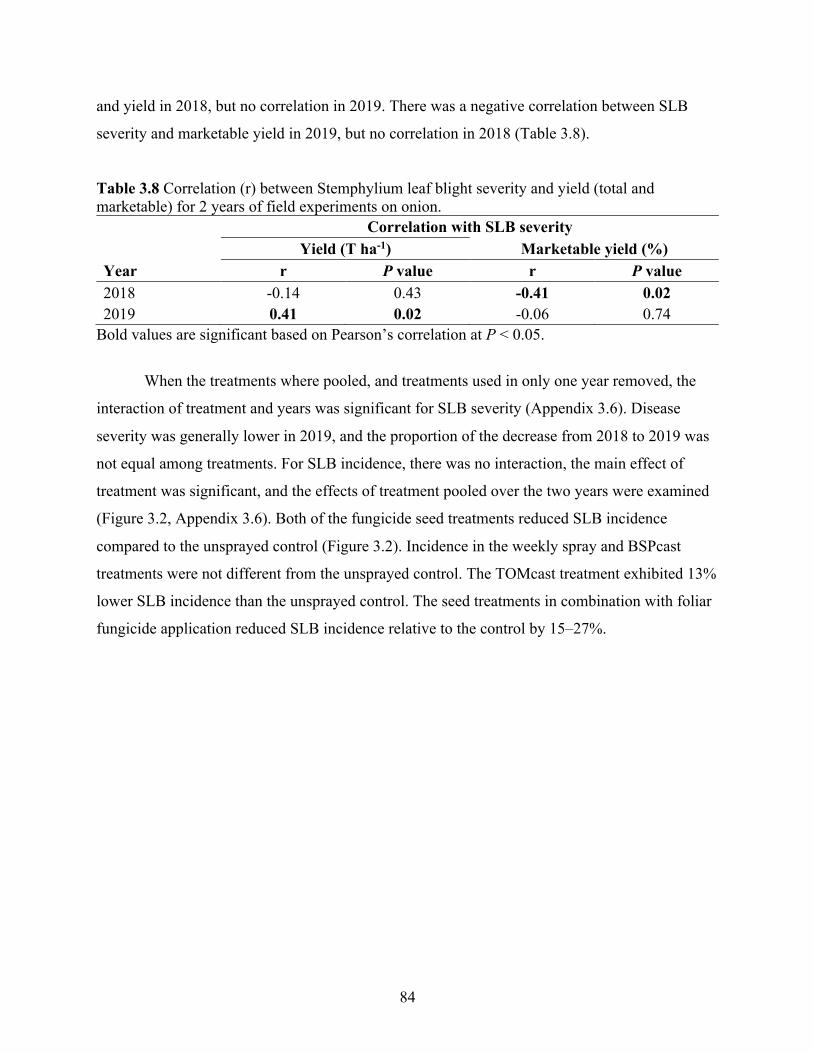
84
and yield in 2018, but no correlation in 2019. There was a negative correlation between SLB
severity and marketable yield in 2019, but no correlation in 2018 (Table 3.8).
Table 3.8 Correlation (r) between Stemphylium leaf blight severity and yield (total and marketable) for 2 years of field experiments on onion. Correlation with SLB severity
Yield (T ha-1) Marketable yield (%) Year r P value r P value 2018 -0.14 0.43 -0.41 0.02 2019 0.41 0.02 -0.06 0.74
Bold values are significant based on Pearson’s correlation at P < 0.05.
When the treatments where pooled, and treatments used in only one year removed, the
interaction of treatment and years was significant for SLB severity (Appendix 3.6). Disease
severity was generally lower in 2019, and the proportion of the decrease from 2018 to 2019 was
not equal among treatments. For SLB incidence, there was no interaction, the main effect of
treatment was significant, and the effects of treatment pooled over the two years were examined
(Figure 3.2, Appendix 3.6). Both of the fungicide seed treatments reduced SLB incidence
compared to the unsprayed control (Figure 3.2). Incidence in the weekly spray and BSPcast
treatments were not different from the unsprayed control. The TOMcast treatment exhibited 13%
lower SLB incidence than the unsprayed control. The seed treatments in combination with foliar
fungicide application reduced SLB incidence relative to the control by 15–27%.
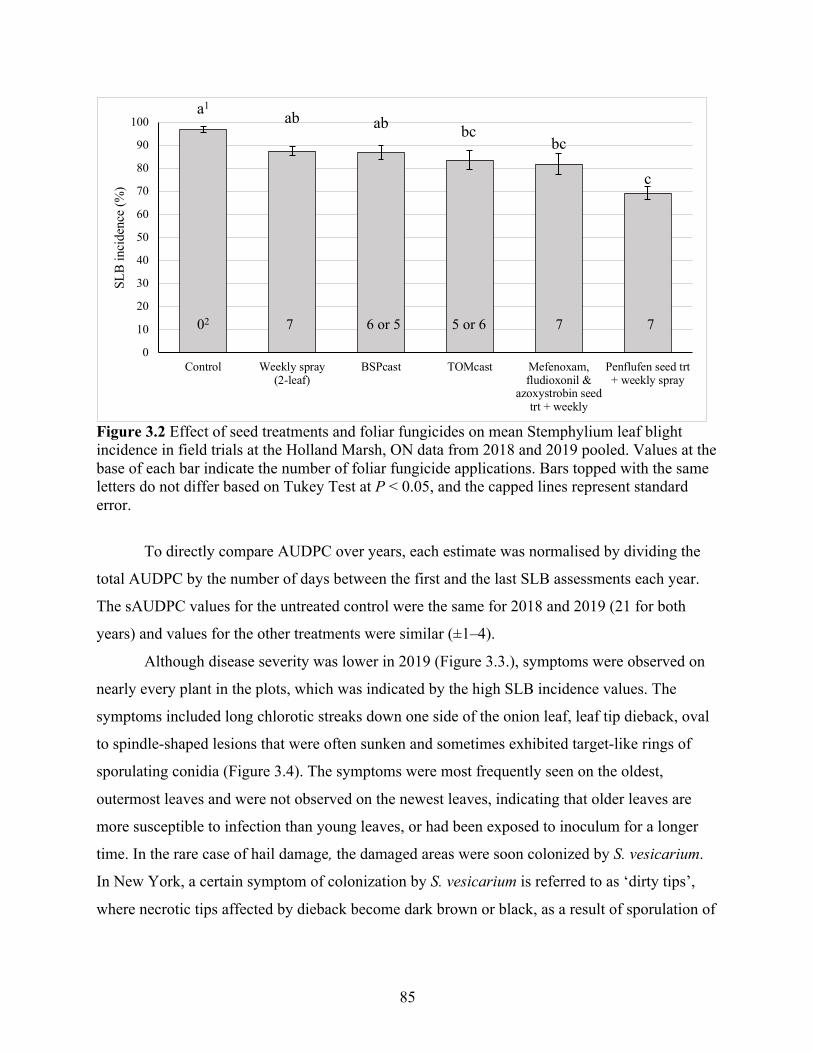
85
Figure 3.2 Effect of seed treatments and foliar fungicides on mean Stemphylium leaf blight incidence in field trials at the Holland Marsh, ON data from 2018 and 2019 pooled. Values at the base of each bar indicate the number of foliar fungicide applications. Bars topped with the same letters do not differ based on Tukey Test at P < 0.05, and the capped lines represent standard error.
To directly compare AUDPC over years, each estimate was normalised by dividing the
total AUDPC by the number of days between the first and the last SLB assessments each year.
The sAUDPC values for the untreated control were the same for 2018 and 2019 (21 for both
years) and values for the other treatments were similar (±1–4).
Although disease severity was lower in 2019 (Figure 3.3.), symptoms were observed on
nearly every plant in the plots, which was indicated by the high SLB incidence values. The
symptoms included long chlorotic streaks down one side of the onion leaf, leaf tip dieback, oval
to spindle-shaped lesions that were often sunken and sometimes exhibited target-like rings of
sporulating conidia (Figure 3.4). The symptoms were most frequently seen on the oldest,
outermost leaves and were not observed on the newest leaves, indicating that older leaves are
more susceptible to infection than young leaves, or had been exposed to inoculum for a longer
time. In the rare case of hail damage, the damaged areas were soon colonized by S. vesicarium.
In New York, a certain symptom of colonization by S. vesicarium is referred to as ‘dirty tips’,
where necrotic tips affected by dieback become dark brown or black, as a result of sporulation of
a1ab ab bc
bc
c
0
10
20
30
40
50
60
70
80
90
100
Control Weekly spray(2-leaf)
BSPcast TOMcast Mefenoxam,fludioxonil &
azoxystrobin seedtrt + weekly
Penflufen seed trt+ weekly spray
SLB
inci
denc
e (%
)
02 7 6 or 5 5 or 6 7 7
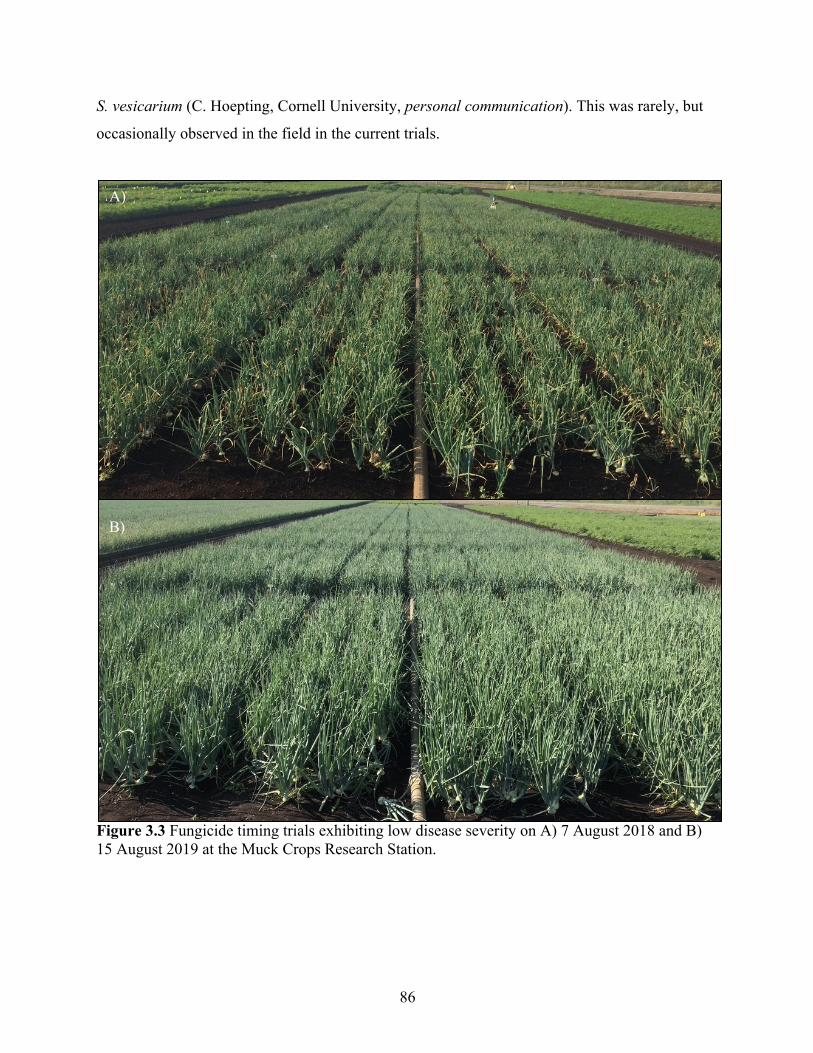
86
S. vesicarium (C. Hoepting, Cornell University, personal communication). This was rarely, but
occasionally observed in the field in the current trials.
Figure 3.3 Fungicide timing trials exhibiting low disease severity on A) 7 August 2018 and B) 15 August 2019 at the Muck Crops Research Station.
A) B)
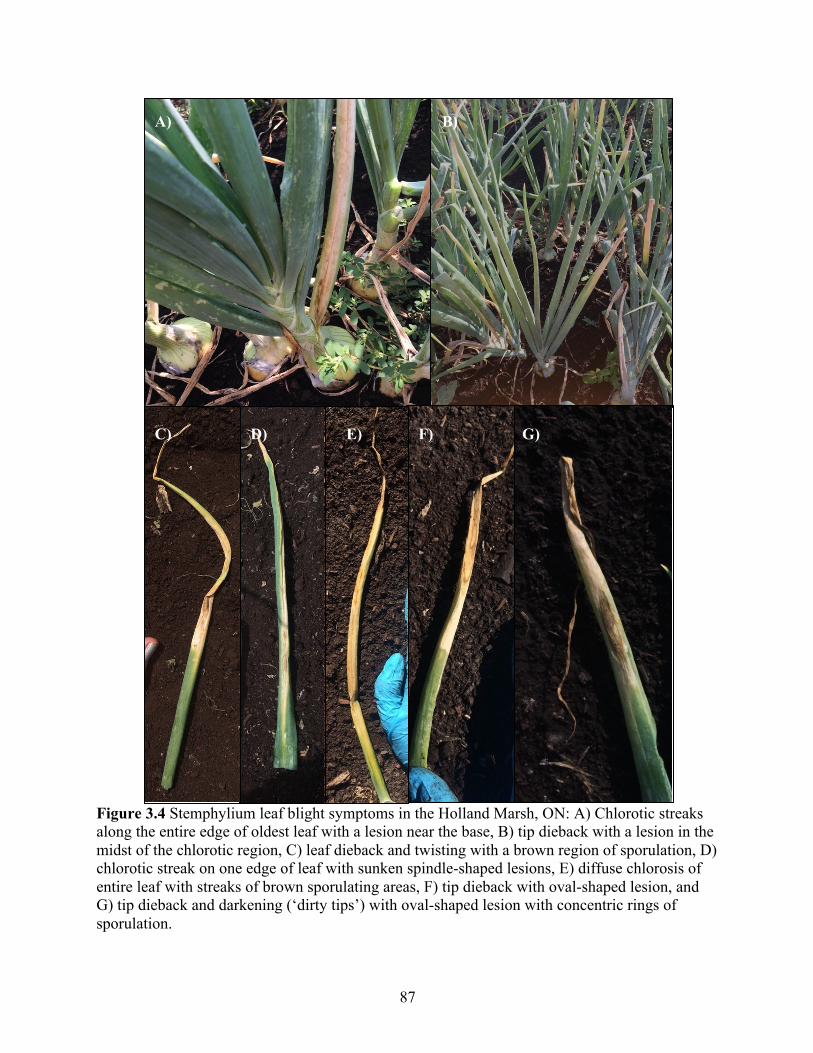
87
Figure 3.4 Stemphylium leaf blight symptoms in the Holland Marsh, ON: A) Chlorotic streaks along the entire edge of oldest leaf with a lesion near the base, B) tip dieback with a lesion in the midst of the chlorotic region, C) leaf dieback and twisting with a brown region of sporulation, D) chlorotic streak on one edge of leaf with sunken spindle-shaped lesions, E) diffuse chlorosis of entire leaf with streaks of brown sporulating areas, F) tip dieback with oval-shaped lesion, and G) tip dieback and darkening (‘dirty tips’) with oval-shaped lesion with concentric rings of sporulation.
A) B) C) D) E) F) G)
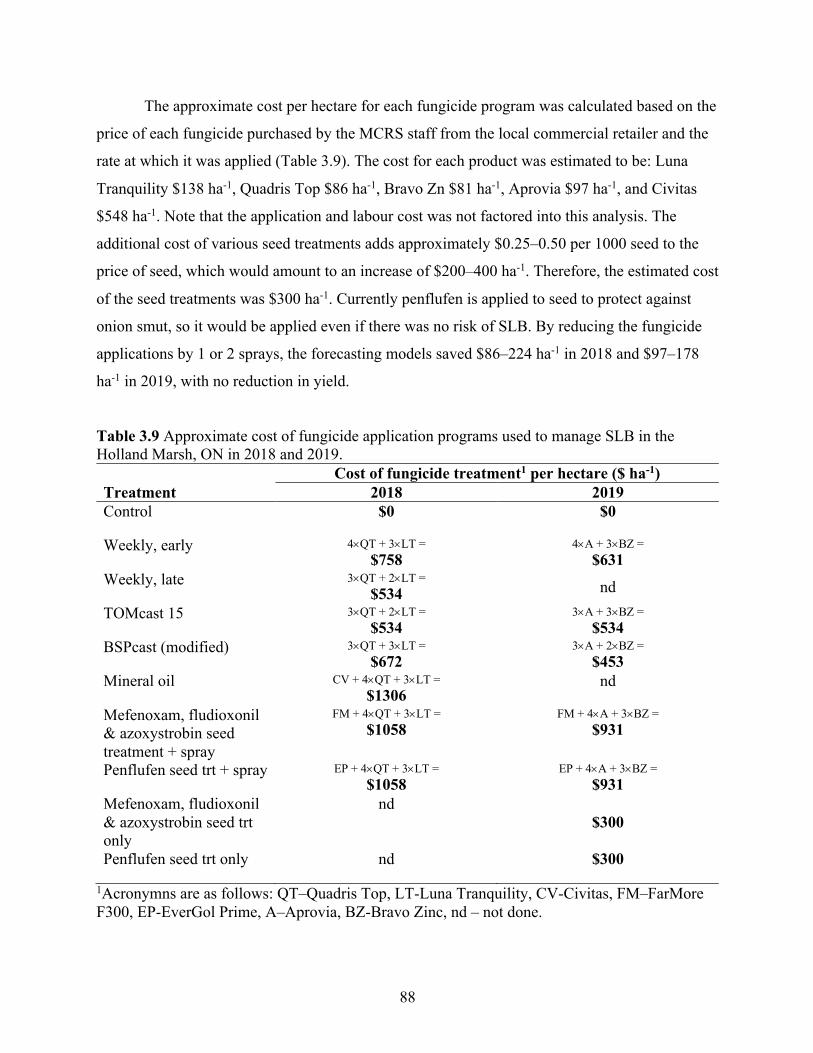
88
The approximate cost per hectare for each fungicide program was calculated based on the
price of each fungicide purchased by the MCRS staff from the local commercial retailer and the
rate at which it was applied (Table 3.9). The cost for each product was estimated to be: Luna
Tranquility $138 ha-1, Quadris Top $86 ha-1, Bravo Zn $81 ha-1, Aprovia $97 ha-1, and Civitas
$548 ha-1. Note that the application and labour cost was not factored into this analysis. The
additional cost of various seed treatments adds approximately $0.25–0.50 per 1000 seed to the
price of seed, which would amount to an increase of $200–400 ha-1. Therefore, the estimated cost
of the seed treatments was $300 ha-1. Currently penflufen is applied to seed to protect against
onion smut, so it would be applied even if there was no risk of SLB. By reducing the fungicide
applications by 1 or 2 sprays, the forecasting models saved $86–224 ha-1 in 2018 and $97–178
ha-1 in 2019, with no reduction in yield.
Table 3.9 Approximate cost of fungicide application programs used to manage SLB in the Holland Marsh, ON in 2018 and 2019. Cost of fungicide treatment1 per hectare ($ ha-1) Treatment 2018 2019 Control $0 $0
Weekly, early 4´QT + 3´LT = $758
4´A + 3´BZ = $631
Weekly, late 3´QT + 2´LT = $534 nd
TOMcast 15 3´QT + 2´LT = $534
3´A + 3´BZ = $534
BSPcast (modified) 3´QT + 3´LT = $672
3´A + 2´BZ = $453
Mineral oil CV + 4´QT + 3´LT = $1306
nd
Mefenoxam, fludioxonil & azoxystrobin seed treatment + spray
FM + 4´QT + 3´LT = $1058
FM + 4´A + 3´BZ = $931
Penflufen seed trt + spray EP + 4´QT + 3´LT = $1058
EP + 4´A + 3´BZ = $931
Mefenoxam, fludioxonil & azoxystrobin seed trt only
nd $300
Penflufen seed trt only nd $300
1Acronymns are as follows: QT–Quadris Top, LT-Luna Tranquility, CV-Civitas, FM–FarMore F300, EP-EverGol Prime, A–Aprovia, BZ-Bravo Zinc, nd – not done.
89
3.4 Discussion
Stemphylium leaf blight can result in severe defoliation of onion, and concern has been
mounting over this disease in Ontario in the past decade. Currently, SLB is managed with
repeated applications of foliar fungicides. In this study, two forecasting models were assessed
over 2 years compared to a weekly (7–10 day interval) spray program. Both forecasting models
reduced the number of fungicide applications while providing equivalent disease suppression.
This resulted in a cost savings of $86–224 ha-1, not including application costs. Repeated
applications of a fungicide also increase the risk of fungicide insensitivity developing in the
pathogen population. Reducing the number of applications by using disease forecasting models
is an important management tactic that could extend the useful life of fungicides in the field, in
addition to being more economical for growers. However, none of the fungicide spray programs
resulted in an increase in yield in comparison to the untreated check and there is the possibility
that no fungicide sprays should have been applied during these years.
The mineral oil drench treatment did not decrease SLB severity compared to the
unsprayed control. Additionally, the application of this product increased the cost of the
fungicide treatment by $548 ha-1, which is much more costly than any other fungicide products
on the market. This treatment was not repeated in 2019 because of the lack of disease
suppression and the cost of the product, which would be a barrier for growers.
Fungicide seed treatments reduced the severity of SLB when combined with foliar
fungicide applications. Treatment with penflufen consistently reduced SLB severity during the
growing season when used in conjunction with weekly foliar sprays. This indicated that infection
may be occurring early in the season, as soon as onion leaf tissue was present. Penflufen is a new
active ingredient in the SDHI group (FRAC group 7) that was registered for use on onion in
Ontario in 2019. The in vitro sensitivity of S. vesicarium to penflufen has not yet been assessed.
There is a possibility that the seed treatment provided early-season protection with this systemic
fungicide, or that the seed treatment led to healthier seedlings that were more resistant to
infection. The other seed treatment, FarMore F300, contained azoxystrobin that has been proven
to be ineffective because of fungicide insensitivity (Stricker et al., 2020). It also included
mefenoxam, a FRAC group 4 fungicide which is not normally applied to onion seed in Ontario
and is not expected to have any activity against an Ascomycete fungus such as S. vesicarium.
90
It is interesting to note that the final destructive assessment did not detect any differences
among the treatments in 2019. The destructive assessment included all of the leaves of each
plant, whereas the earlier severity ratings each season only include the oldest three leaves. As a
result, the final (destructive) assessment may represent a more accurate assessment of the impact
of SLB on the whole plant. Although DSI values were lower in 2019 compared to 2018, the
sAUDPC in 2019 was equal to 2018. The 2019 season was cooler in May, resulting in a lower
disease severity at the first rating date, but high temperatures in July may have contributed to the
rapid increase in severity.
The poor emergence in the seeds treated with penflufen (FRAC group 7) in 2018 was an
anomaly; the same product has been used before and since, but this was the only time this effect
was observed. There is a possibility that, since the seed was older, the germination of the seed
was lower overall and extended exposure of the embryo within the seed to the penflufen seed
treatment may have resulted in toxicity. A decrease in emergence has previously been
documented for wheat seeds treated with benomyl (FRAC group 1) or carboxin (FRAC group 7)
and stored for > 30 days (Khaleeq and Klatt, 1986). Phytotoxicity of fluopyram has also been
reported in soybean seedlings, resulting in a ‘halo effect’ symptom on cotyledons, but the plants
were able to survive and yield was not impacted (Kandel et al., 2018).
SLB severity in 2019 was low to moderate, which was likely associated with below-
average seasonal rainfall. However, the disease forecasting programs still recommended several
fungicide applications. The DSI for the unsprayed control at the end of the season was only 33,
but TOMcast recommended six applications in 2019. In a previous study on disease forecasting
models conducted at the same location, TOMcast recommended five applications in 2016, when
final severity was only 28 DSI (Stricker et al., 2020). This level of severity arguably did not
merit the number of fungicide applications recommended. There clearly is room for
improvement in SLB forecasting, especially when disease risk is low.
The relationship between SLB severity and yield was inconsistent among years, which
may be due to confounding factors such as weather, cultivar used, and differences in seeding
date. Weather likely had the greatest effect. For example, high temperature stress could reduce
yield but not directly affect SLB severity. Overall, only a small proportion of the variation in
yield was explained by variance in SLB severity. The trials conducted at the MCRS may be too
small to capture small changes in yield, even though differences in yield were identified in
91
similar trials in New York State (Hoepting, 2017c, 2018a). Yield was much higher in 2019 than
2018, but this may be due to cultivar differences, since LaSalle was used in 2018 and Fortress in
2019. In disease forecasting trials conducted at the same location in 2015 and 2016, the
relationship between yield and SLB severity was not significant (Stricker et al., 2020). The poor
emergence in the penflufen seed treatment in 2018 may also have confounded the yield data and
the relationship between SLB severity and yield.
Even if defoliation caused by SLB does not affect yield directly, especially if it occurs
later in the growing season, it can reduce the efficacy of sprout inhibitors. The sprout inhibitor,
maleic hydrazide, should be applied to onions that have at least 5–8 green leaves shortly before
lodging (Ilić et al., 2011; Arysta LifeScience Canada, 2020). Onions with moderate to severe
SLB might not have enough green leaves at the end of the season to take up the sprout inhibitor.
If sprout inhibitor is not applied or is not taken up by the crop, the harvested bulbs will have a
shorter storage life and shelf life. This can require the crop to be sold earlier, often at a time of
lower prices, leading to lower returns. However, SLB severity was not high enough in the
unsprayed control to prevent the application of maleic hydrazide in either year of this study.
Previous studies of disease forecasting models were conducted at the MCRS in 2015 and
2016. Versions of TOMcast and BOTcast were used to time the application of Luna Tranquility
(Stricker et al., 2020). In 2015, treatments scheduled based on either of these disease forecasting
models decreased leaf dieback (AUDPC) relative to the unsprayed control. In 2016, however,
there was lower SLB severity overall and no differences among treatments, which may be linked
to fungicide insensitivity. Similar to this study, SLB severity for the two forecasting models was
the same as the weekly spray programs with fewer fungicide applications. Also, there were no
differences in yield among the treatments in 2015 or 2016, but this may be linked to relatively
low SLB severity (15–47 sAUDPC for leaf dieback) (Tayviah, 2017).
Based on the current fungicide timing trials and previous studies at the Holland Marsh
(Stricker et al., 2020; Gossen et al., 2021), one might conclude that applications of foliar
fungicide to suppress SLB on onion were not warranted, since there was little or no reduction in
yield or quality of the treatments compared to the untreated control. However, recent trials
conducted in New York State provided a different picture of SLB, even though the onion
production systems in the two regions are quite similar. In 2016 and 2017, fluopyram plus
pyrimethanil (Luna Tranquility) alone or azoxystrobin plus difenoconazole (Quadris Top) alone
92
reduced SLB severity compared to the untreated control, resulting in an increase in marketable
yield of 20–63% (Hoepting, 2017c, 2018a). Severity of SLB in New York State was moderate in
the untreated control (2.2–3.2 on a scale of 0–6) but premature plant mortality was very high by
mid to late September. Based on these studies, growers were advised to begin weekly spray
programs near the end of July, or around the time 2.5-cm-dia bulbs had formed (Hoepting,
2017c, 2018c). Fungicides containing azoxystrobin or pyraclostrobin (FRAC group 11) were
originally effective against SLB in New York, but had become ineffective by 2015 (Hoepting,
2016). Similarly, the active ingredient boscalid (FRAC group 7) declined in efficacy by 2017
(Hoepting, 2016, 2017c, 2018c). Recent trials have identified reduced performance of fungicides
containing active ingredients in FRAC groups 2, 7, and 9 compared to previous years (Hoepting,
2017c, 2018a, 2019, 2020b; a).
It is difficult to directly compare the studies in New York and Ontario because the timing
of initial infection and the rate of SLB development could have been very different in the two
regions, and severity values may have been influenced by the different methods used for SLB
assessment. However, the start date for recommended fungicide applications in New York is
substantially later than indicated by the current study, where seed treatment to minimize early
season infection was essential for SLB suppression, even though application was initiated at the
2- or 4-leaf stage (often mid-late June). Also, the fungicides identified as highly effective in New
York were no longer effective during the same years as studies conducted at the Holland Marsh
(Stricker et al., 2020).
It has been suggested that a portion of SLB symptoms on onion and garlic may be due to
a host-specific toxin produced by the pathogen (Basallote-Ureba et al., 1999). Previous studies
have shown that secondary metabolites produced by S. vesicarium caused leaf dieback, reduced
yield, and may increase susceptibility to other diseases (Singh et al., 1999). A few lesions of
S. vesicarium on a plant early in the growing season may result in severe defoliation due to the
production of host-specific toxins. Subsequent fungicide sprays would not control the earlier
infections and thus be less effective in reducing the damage.
The current study indicated that foliar sprays in combination with seed treatments may be
the best method to manage SLB. However, field trials conducted in the past 6 years in Ontario,
culminating in the current study, have not identified a fungicide that provides effective SLB
suppression (Stricker et al., 2020). Further research should focus on a) development of a

93
forecasting model that is also effective under low disease pressure, b) assessment of the efficacy
of new fungicides and of biological controls, and c) continued assessment of the sensitivity of
S. vesicarium to recommended fungicides to alert growers to changes in efficacy.
94
Chapter 4 Fungicide Sensitivity of Stemphylium vesicarium isolates The results of the in vitro fungicide sensitivity assessments for azoxystrobin, pyrimethanil, and
difenoconazole have been published (Stricker et al., 2020).
4.1 Introduction
Fungicides are an important tool for integrated pest management (IPM) systems in agriculture.
However, fungicide insensitivity, also known as fungicide resistance, may develop in a pathogen
population in response to selection pressure from frequent fungicide applications (Shaw, 2009).
Several fungicides with different modes of action are registered in Canada for management of
SLB on onion, but growers in the Holland Marsh are frustrated by a perceived lack of efficacy.
In New York State, several of the foliar fungicides registered for management of SLB on onion
no longer provide economic levels of SLB suppression, mostly due to fungicide insensitivity
(Pethybridge et al., 2016).
The Fungicide Resistance Action Committee (FRAC) has classified the active ingredients
in synthetic fungicides based on their mode of action, which is the biochemical mechanism by
which they affect target pathogens. FRAC has also characterized the inherent risk of pathogen
populations developing insensitivity to each mode of action grouping (Brent and Hollomon,
2007b). For example, FRAC group 11, also known as the QoI group or strobilurins, has a high
risk for developing insensitivity (Gisi et al., 2002). Mutations that result in insensitivity to one
active ingredient in the QoI group often confer partial or complete insensitivity to all of the
active ingredients in the group (known as cross-insensitivity) (Gisi et al., 2002). For instance,
sensitivity of Botrytis cinerea (Markoglou et al., 2006) to the strobilurin fungicide pyraclostrobin
resulted in reduced sensitivity to other strobilurins, including azoxystrobin, fluoxastrobin,
trifloxystrobin, and picoxystrobin (Markoglou et al., 2006).
Field trials on fungicide efficacy for the management of SLB on onion have been
conducted by Dr. M.R. McDonald at the Muck Crops Research Station at the Holland Marsh,
ON since 2011, but for the past 6 years (2014–2019) none of the fungicides assessed reduced
SLB severity (Table 4.1, Stricker et al., 2020). In other studies, high concentrations of mancozeb,
azoxystrobin, propiconazole, and propineb inhibited in vitro growth of S. vesicarium (Mishra and
Gupta, 2012) but had little or no impact on the incidence of SLB in the field (Hoepting and
Pethybridge, 2016). Several studies have reported that populations of S. vesicarium are
95
insensitive to specific fungicides (Alberoni et al., 2005, 2010b; Hay et al., 2019). This is not
unexpected; S. vesicarium is at high risk for developing fungicide insensitivity because there can
be multiple generations per season, there is abundant production of air-borne spores through
sexual and asexual reproduction (Gossen et al., 2021), and management of SLB involves
multiple fungicide applications per growing season (Misawa and Yasuoka, 2012). The fungicides
currently registered for management of SLB in Canada are listed in Chapter 1, Table 1.4. The
fungicides are in FRAC groups 3, 7, 9, and 11.
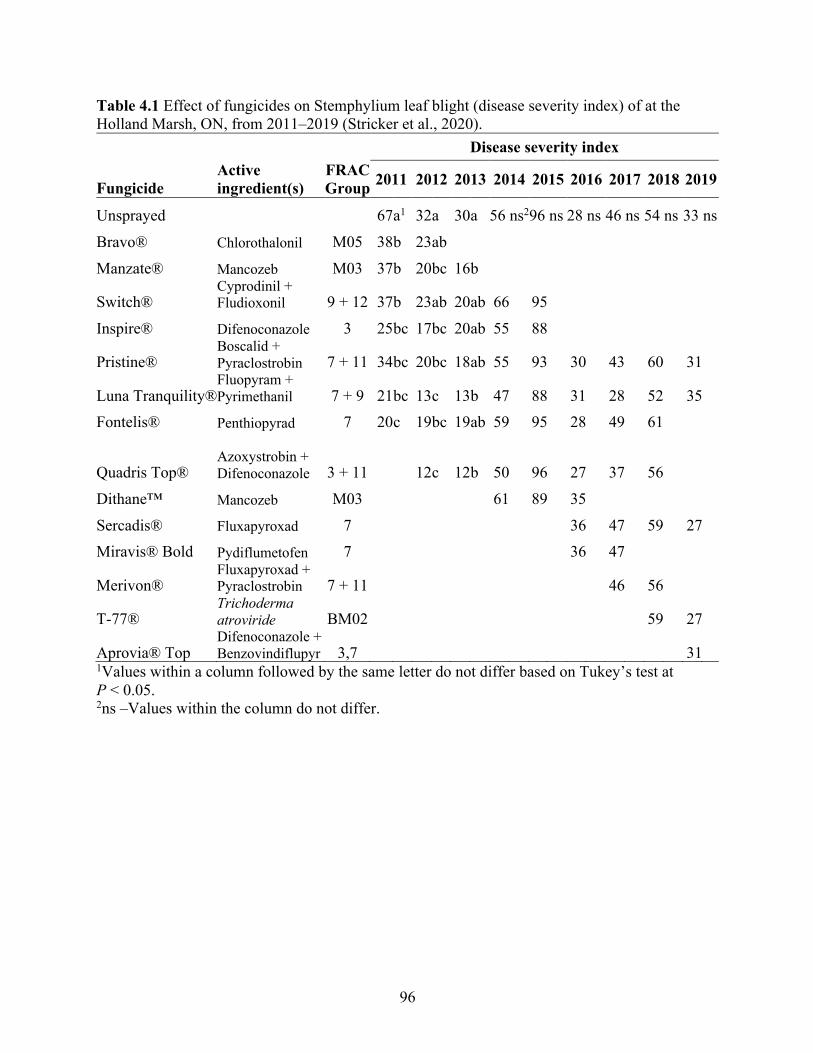
96
Table 4.1 Effect of fungicides on Stemphylium leaf blight (disease severity index) of at the Holland Marsh, ON, from 2011–2019 (Stricker et al., 2020).
Fungicide
FRAC Group
Disease severity index Active ingredient(s) 2011 2012 2013 2014 2015 2016 2017 2018 2019
Unsprayed 67 a1 32 a 30 a 56 ns2 96 ns 28 ns 46 ns 54 ns 33 ns
Bravo® Chlorothalonil M05 38 b 23 ab Manzate® Mancozeb M03 37 b 20 bc 16 b
Switch® Cyprodinil + Fludioxonil 9 + 12 37 b 23 ab 20 ab 66 95
Inspire® Difenoconazole 3 25 bc 17 bc 20 ab 55 88
Pristine® Boscalid + Pyraclostrobin 7 + 11 34 bc 20 bc 18 ab 55 93 30 43 60 31
Luna Tranquility® Fluopyram + Pyrimethanil 7 + 9 21 bc 13 c 13 b 47 88 31 28 52 35
Fontelis® Penthiopyrad 7 20 c 19 bc 19 ab 59 95 28 49 61
Quadris Top®
Azoxystrobin + Difenoconazole 3 + 11 12 c 12 b 50 96 27 37 56
Dithane™ Mancozeb M03 61 89 35 Sercadis® Fluxapyroxad 7 36 47 59 27 Miravis® Bold Pydiflumetofen 7 36 47
Merivon® Fluxapyroxad + Pyraclostrobin 7 + 11 46 56
T-77® Trichoderma atroviride BM02 59 27
Aprovia® Top Difenoconazole + Benzovindiflupyr 3,7 31
1Values within a column followed by the same letter do not differ based on Tukey’s test at P < 0.05. 2ns –Values within the column do not differ.
97
This study focused on the four active ingredients from the FRAC groups present in Luna
Tranquility and Quadris Top. Luna Tranquility (fluopyram + pyrimethanil, groups 9 and 7) and
Quadris Top (azoxystrobin + difenoconazole, groups 11 and 3) have been registered for use on
onion in Canada since 2012 (Health Canada, 2020a). The first QoI-insensitive isolate of
S. vesicarium was detected in 2016 in Italy (Collina et al., 2007). QoI-insensitivity was also
identified recently in New York State, where 67% of 105 isolates from onion fields were
insensitive to 0.5 µg a.i. mL-1 and the G143A mutation was detected in 70% of this sample (Hay
et al., 2019). Difenoconazole (FRAC group 3) is a locally systemic DMI fungicide with efficacy
against a broad range of fungal pathogens (Fonseka and Gudmestad, 2016; Jurick et al., 2017;
Ali et al., 2018). Over 95% of S. vesicarium isolates tested in New York State were sensitive to
difenoconazole, despite the fact that Quadris Top and Inspire Super (cyprodinil &
difenoconazole; Syngenta) have been applied on onion crops in New York for 10 years in mixed
formulations (Hay et al., 2019). Dual insensitivity between difenoconazole and pyrimethanil was
not detected in the 33 isolates tested against both active ingredients (Hay et al., 2019). The
activity of anilinopyrimidine fungicides (AP; FRAC group 9) such as pyrimethanil is mostly
through direct contact, but they have some systemic activity (Rosslenbroich and Stuebler, 2000).
Several isolates of S. vesicarium collected in New York State were insensitive to the AP
fungicides cyprodinil and pyrimethanil (Hay et al., 2019). Succinate-dehydrogenase inhibitor
(SDHI; FRAC group 7) fungicides such as fluopyram exhibit contact and some systemic activity
(Lunn, 2011). In vitro studies in New York demonstrated that > 90% S. vesicarium isolates were
sensitive to fluopyram (Hay et al., 2019).
Mutations conferring fungicide insensitivity may also have pleiotropic effects that can
result in adverse effects and a fitness cost (Anderson, 2005). Fitness parameters are a method for
determining the relative ability of a pathogen to survive, infect, and reproduce (Dekker, 1976).
For example, azoxystrobin-insensitive isolates of Ustilago maydis exhibited decreased in vitro
growth and pathogenicity on corn plants (Ziogas et al., 2002). Similarly, QoI-insensitive
Cercospora beticola isolates exhibited a 30% reduction in mycelial growth, 18–54% reduction in
pathogenicity on sugar beet, and half of the isolates exhibited reduced sporulation (Malandrakis
et al., 2006). Isolates of Stemphylium solani that were insensitive to fludioxonil (FRAC group
12) exhibited decreased in vitro mycelial growth and sporulation, and reduced in planta
aggressiveness on tomato (Wu et al., 2015). Fitness costs associated with mutations conferring
98
insensitivity to QoIs have also been observed in insensitive populations of Plasmopara viticola
(Heaney et al., 2000) and Magnaporthe grisea (Avila-adame and Köller, 2003) but did not affect
fitness parameters in Erysiphe graminis É.J, Narchal (Heaney et al., 2000), Plasmopara viticola
(Corio-Costet et al., 2011), or dicarboximide-insensitive S. vesicarium isolates from pear
(Alberoni et al., 2006, 2010b). In fact, QoI-insensitive isolates of Alternaria alternata were more
aggressive than sensitive isolates on detached pistachio leaves. Fitness costs can also vary with
environmental conditions such as temperature (Brown et al., 2006). The fitness of fungicide-
insensitive isolates of S. vesicarium from onion have not been assessed. Future research may
include screening the genome of S. vesicarium for RNA microsatellites related to pathogenicity
or aggressiveness of isolates.
If use of a fungicide or mode-of-action group is discontinued, selection pressure can shift
an insensitive pathogen population back towards to sensitivity if there is a fitness cost associated
with the mutation conferring fungicide insensitivity (Andersson and Hughes, 2011). For
example, successive sub-culturing of pyraclostrobin-insensitive C. beticola isolates on fungicide-
free medium resulted in a shift towards sensitivity (Malandrakis et al., 2006). However, this is
not always the case. Genes conferring insensitivity to the fungicide may persist in a population if
the fitness costs are low or even fitness-increasing, if these genes are linked to other beneficial
traits, or if subsequent mutations compensate for the fitness cost (Andersson and Hughes, 2011).
Fungicide sensitivity is often assessed using mycelial growth assays or germination of
fungal spores (Russell, 2004). These methods compare the response of isolates on a fungicide-
amended medium relative to non-amended medium. Initial studies generally assess response to a
wide range of fungicide concentrations. However, a discriminatory dose can be used to reduce
the time and effort needed to perform assessments on a large population. The decision to use a
discriminatory dose was based on the anticipation of analyzing a large sample of isolates.
However, the actual number of isolates was lower than expected due to research restrictions
during the COVID-19 pandemic. A discriminatory dose is a specific concentration or dose that
can be used to differentiate between sensitive and insensitive isolates, based on decreased growth
or germination in previous trials (Russell, 2004).
When testing sensitivity to QoI fungicides, salicylhydroxamic acid (SHAM) is commonly
added to media because it inhibits the alternate oxidase (AOX) pathway (Mizutani et al., 1996;
Wood and Hollomon, 2003). It has been used when testing many fungi including S. vesicarium
99
(Hay et al., 2019), S. solani (Wu et al., 2015), and many others (Pereira et al., 1997; Ziogas et al.,
2002; Ma et al., 2003). SHAM alone generally does not affect mycelial growth or conidial
germination (Pereira et al., 1997; Wang et al., 2016), but can reduce mycelial growth of some
fungal pathogens (Avila-Adame and Köller, 2002; Seyran et al., 2010; Kunova et al., 2013;
MacLean et al., 2017). Also, a low dose (20 mg L-1) enhanced the inhibitory effect of
pyraclostrobin on Clarireedia jacksonii (Liang et al., 2015).
AOX inhibitors are generally not used in field trials because they are rapidly broken
down in the environment and may inhibit plant respiration (Wood and Hollomon, 2003). One
hypothesis states that AOX inhibitors are not needed for in planta studies because plant
metabolites, such as flavonoids, also inhibit the alternative oxidase pathway (Tamura et al.,
1999). However, respiration via AOX differs among species and the alternative oxidation
pathway was active during infection of barley with Mycosphaerella oryzae (Catt.) Jacz. (Avila-
Adame and Köller, 2002) and on wheat infected with Mycosphaerella graminicola (Fuckel)
J. Schröt. (Miguez et al., 2004). Since the energy requirements changes during the infection
period and saprophytic in vitro growth, the efficiency of the AOX pathway will depend on many
factors (Wood and Hollomon, 2003). Therefore, whether or not to include SHAM in a fungicide
sensitivity assay should be determined for each fungal pathogen. To date, assessments with and
without SHAM have not been conducted for S. vesicarium.
Screening for insensitivity should provide information that would allow growers to avoid
fungicides that are not effective and may explain the lack of SLB suppression by certain
fungicides in the field. There have been no assessments of fungicide sensitivity of S. vesicarium
in onion production in Canada. The objective of the study was to assess the in vitro sensitivity of
S. vesicarium to the active ingredients of fungicides commonly used in Canada for management
of SLB. The results of the in vitro fungicide sensitivity assessments for azoxystrobin,
pyrimethanil, and difenoconazole conducted as part of this study have already been published
(Stricker et al., 2020).
4.2 Materials and methods
4.2.1 Isolate collection
Symptomatic leaf tissue was collected from onion and leek crops grown in commercial and
research fields in 2018 and 2019 from the Grand Bend, Holland Marsh, and Keswick areas of
100
Ontario. The leaves were incubated for 24–48 h to induce sporulation in a moist chamber. The
moist chamber consisted of a white plastic propagation tray covered with a clear plastic humidity
dome (279 mm × 543 mm, Mondi Products, Vancouver, BC) and lined with moist paper towels.
The resulting colonies were incubated at room temperature for 3–4 days under UV light
(Westinghouse Lamps, McNulty, PA), 12 h on / 12 h off, to stimulate production of conidia. The
resulting conidia were collected by gently scraping the colony surface with a sterile scalpel.
Conidia were transferred to Petri dishes containing 10 mL of V8-agar media amended with
ampicillin and streptomycin (as in Chapter 2). In total, 122 isolates were collected from onion
samples in Ontario: 1 from Keswick, 17 from Exeter, 60 from Grand Bend, and 44 from the
Holland Marsh. An additional 10 isolates were collected from garlic in Exeter and 3 from leek in
the Holland Marsh. All isolates were collected from a single lesion but could reflect a range of
genetics since several conidia were collected from each lesion.
In addition, two isolates of S. vesicarium that had not been exposed to fungicides
(baseline isolates) were purchased from the Canadian Collection of Fungal Cultures, Ottawa,
ON. These were originally isolated from oat in Saskatchewan in 1995. Four isolates were also
revived from a collection created by Dr. J. Foster; the isolates were collected from commercial
asparagus and onion fields in southern Ontario and Nova Scotia between 2012 and 2016 (Foster,
2018).
The type of media used can be a confounding factor in fungicide sensitivity testing. For
example, the EC50 values for Alternaria alternata exhibited a wider range on minimum media
compared to potato dextrose agar (PDA) media. This may have been due to the fact that the
fungus grew slower on MM, so inhibition was more difficult to measure (Vega and Dewdney,
2015). Likewise, S. vesicarium and other Stemphylium spp. have exhibited lower growth rates
when grown on PDA compared to V8 agar (Chowdhury et al., 2015; de Souza et al., 2018); so
inhibition may be more variable on PDA than it would be on V8 agar. Several other studies have
used V8 media to culture the fungal isolates and then transferred the cultures to PDA or water
agar media for fungicide sensitivity screening (Pasche et al., 2005; Dube et al., 2014; Hay et al.,
2019). Some studies have used fungicide-amended V8 media (Geary et al., 2007; Cox et al.,
2009) and others recommend using V8 media for mycelial growth assessments and water agar
media for conidial germination assessments (Secor and Rivera, 2012). Media can impact the
growth and development of fungi, so it is important to follow standardized protocols. In order to
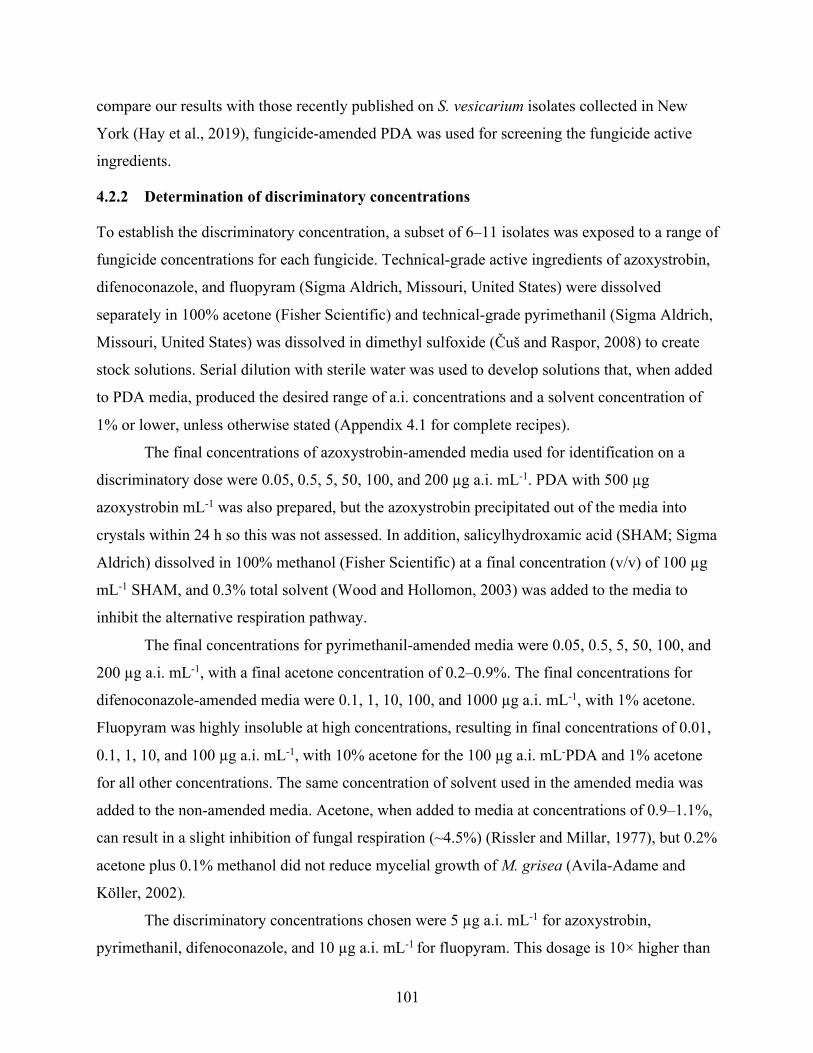
101
compare our results with those recently published on S. vesicarium isolates collected in New
York (Hay et al., 2019), fungicide-amended PDA was used for screening the fungicide active
ingredients.
4.2.2 Determination of discriminatory concentrations
To establish the discriminatory concentration, a subset of 6–11 isolates was exposed to a range of
fungicide concentrations for each fungicide. Technical-grade active ingredients of azoxystrobin,
difenoconazole, and fluopyram (Sigma Aldrich, Missouri, United States) were dissolved
separately in 100% acetone (Fisher Scientific) and technical-grade pyrimethanil (Sigma Aldrich,
Missouri, United States) was dissolved in dimethyl sulfoxide (Čuš and Raspor, 2008) to create
stock solutions. Serial dilution with sterile water was used to develop solutions that, when added
to PDA media, produced the desired range of a.i. concentrations and a solvent concentration of
1% or lower, unless otherwise stated (Appendix 4.1 for complete recipes).
The final concentrations of azoxystrobin-amended media used for identification on a
discriminatory dose were 0.05, 0.5, 5, 50, 100, and 200 µg a.i. mL-1. PDA with 500 µg
azoxystrobin mL-1 was also prepared, but the azoxystrobin precipitated out of the media into
crystals within 24 h so this was not assessed. In addition, salicylhydroxamic acid (SHAM; Sigma
Aldrich) dissolved in 100% methanol (Fisher Scientific) at a final concentration (v/v) of 100 µg
mL-1 SHAM, and 0.3% total solvent (Wood and Hollomon, 2003) was added to the media to
inhibit the alternative respiration pathway.
The final concentrations for pyrimethanil-amended media were 0.05, 0.5, 5, 50, 100, and
200 µg a.i. mL-1, with a final acetone concentration of 0.2–0.9%. The final concentrations for
difenoconazole-amended media were 0.1, 1, 10, 100, and 1000 µg a.i. mL-1, with 1% acetone.
Fluopyram was highly insoluble at high concentrations, resulting in final concentrations of 0.01,
0.1, 1, 10, and 100 µg a.i. mL-1, with 10% acetone for the 100 µg a.i. mL-PDA and 1% acetone
for all other concentrations. The same concentration of solvent used in the amended media was
added to the non-amended media. Acetone, when added to media at concentrations of 0.9–1.1%,
can result in a slight inhibition of fungal respiration (~4.5%) (Rissler and Millar, 1977), but 0.2%
acetone plus 0.1% methanol did not reduce mycelial growth of M. grisea (Avila-Adame and
Köller, 2002).
The discriminatory concentrations chosen were 5 µg a.i. mL-1 for azoxystrobin,
pyrimethanil, difenoconazole, and 10 µg a.i. mL-1 for fluopyram. This dosage is 10× higher than
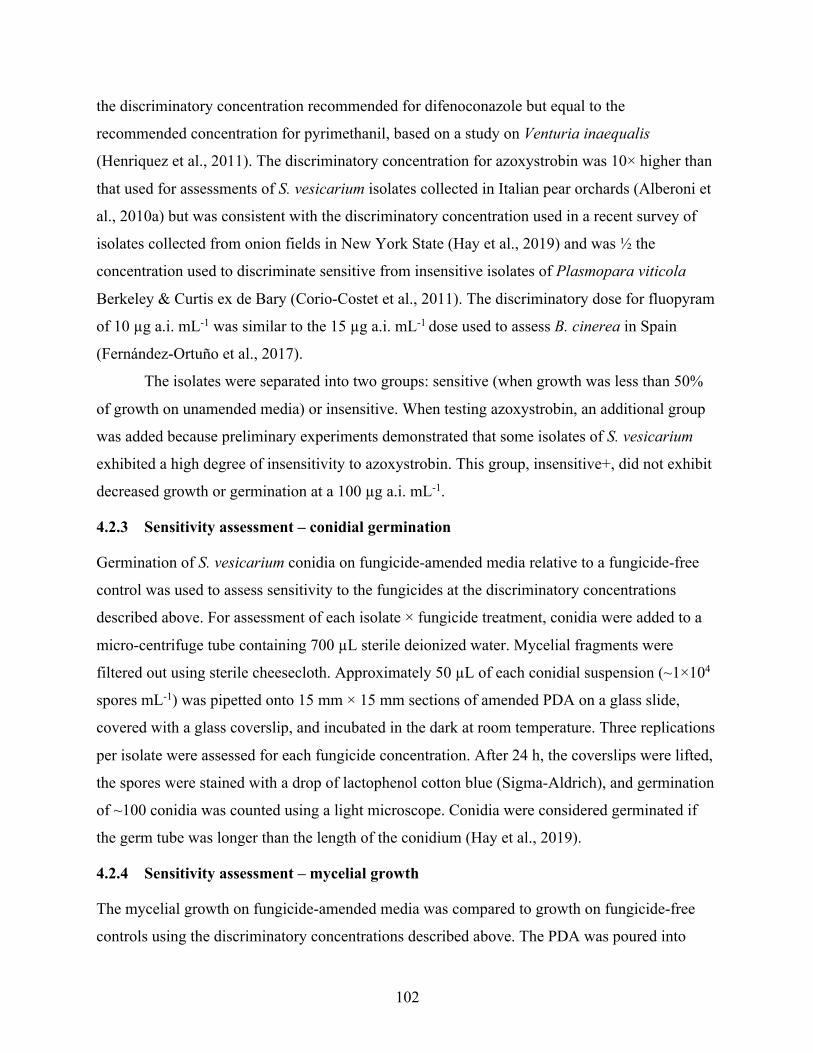
102
the discriminatory concentration recommended for difenoconazole but equal to the
recommended concentration for pyrimethanil, based on a study on Venturia inaequalis
(Henriquez et al., 2011). The discriminatory concentration for azoxystrobin was 10× higher than
that used for assessments of S. vesicarium isolates collected in Italian pear orchards (Alberoni et
al., 2010a) but was consistent with the discriminatory concentration used in a recent survey of
isolates collected from onion fields in New York State (Hay et al., 2019) and was ½ the
concentration used to discriminate sensitive from insensitive isolates of Plasmopara viticola
Berkeley & Curtis ex de Bary (Corio-Costet et al., 2011). The discriminatory dose for fluopyram
of 10 µg a.i. mL-1 was similar to the 15 µg a.i. mL-1 dose used to assess B. cinerea in Spain
(Fernández-Ortuño et al., 2017).
The isolates were separated into two groups: sensitive (when growth was less than 50%
of growth on unamended media) or insensitive. When testing azoxystrobin, an additional group
was added because preliminary experiments demonstrated that some isolates of S. vesicarium
exhibited a high degree of insensitivity to azoxystrobin. This group, insensitive+, did not exhibit
decreased growth or germination at a 100 µg a.i. mL-1.
4.2.3 Sensitivity assessment – conidial germination
Germination of S. vesicarium conidia on fungicide-amended media relative to a fungicide-free
control was used to assess sensitivity to the fungicides at the discriminatory concentrations
described above. For assessment of each isolate × fungicide treatment, conidia were added to a
micro-centrifuge tube containing 700 µL sterile deionized water. Mycelial fragments were
filtered out using sterile cheesecloth. Approximately 50 µL of each conidial suspension (~1×10⁴
spores mL-1) was pipetted onto 15 mm × 15 mm sections of amended PDA on a glass slide,
covered with a glass coverslip, and incubated in the dark at room temperature. Three replications
per isolate were assessed for each fungicide concentration. After 24 h, the coverslips were lifted,
the spores were stained with a drop of lactophenol cotton blue (Sigma-Aldrich), and germination
of ~100 conidia was counted using a light microscope. Conidia were considered germinated if
the germ tube was longer than the length of the conidium (Hay et al., 2019).
4.2.4 Sensitivity assessment – mycelial growth
The mycelial growth on fungicide-amended media was compared to growth on fungicide-free
controls using the discriminatory concentrations described above. The PDA was poured into
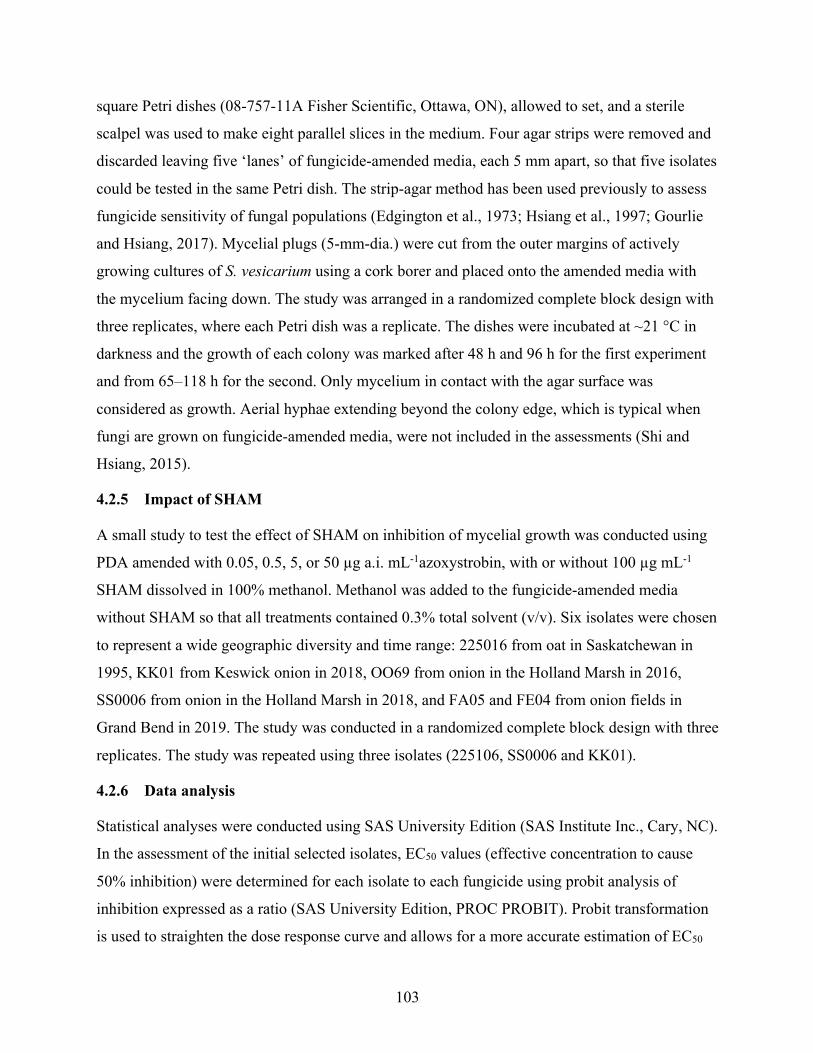
103
square Petri dishes (08-757-11A Fisher Scientific, Ottawa, ON), allowed to set, and a sterile
scalpel was used to make eight parallel slices in the medium. Four agar strips were removed and
discarded leaving five ‘lanes’ of fungicide-amended media, each 5 mm apart, so that five isolates
could be tested in the same Petri dish. The strip-agar method has been used previously to assess
fungicide sensitivity of fungal populations (Edgington et al., 1973; Hsiang et al., 1997; Gourlie
and Hsiang, 2017). Mycelial plugs (5-mm-dia.) were cut from the outer margins of actively
growing cultures of S. vesicarium using a cork borer and placed onto the amended media with
the mycelium facing down. The study was arranged in a randomized complete block design with
three replicates, where each Petri dish was a replicate. The dishes were incubated at ~21 °C in
darkness and the growth of each colony was marked after 48 h and 96 h for the first experiment
and from 65–118 h for the second. Only mycelium in contact with the agar surface was
considered as growth. Aerial hyphae extending beyond the colony edge, which is typical when
fungi are grown on fungicide-amended media, were not included in the assessments (Shi and
Hsiang, 2015).
4.2.5 Impact of SHAM
A small study to test the effect of SHAM on inhibition of mycelial growth was conducted using
PDA amended with 0.05, 0.5, 5, or 50 µg a.i. mL-1azoxystrobin, with or without 100 µg mL-1
SHAM dissolved in 100% methanol. Methanol was added to the fungicide-amended media
without SHAM so that all treatments contained 0.3% total solvent (v/v). Six isolates were chosen
to represent a wide geographic diversity and time range: 225016 from oat in Saskatchewan in
1995, KK01 from Keswick onion in 2018, OO69 from onion in the Holland Marsh in 2016,
SS0006 from onion in the Holland Marsh in 2018, and FA05 and FE04 from onion fields in
Grand Bend in 2019. The study was conducted in a randomized complete block design with three
replicates. The study was repeated using three isolates (225106, SS0006 and KK01).
4.2.6 Data analysis
Statistical analyses were conducted using SAS University Edition (SAS Institute Inc., Cary, NC).
In the assessment of the initial selected isolates, EC50 values (effective concentration to cause
50% inhibition) were determined for each isolate to each fungicide using probit analysis of
inhibition expressed as a ratio (SAS University Edition, PROC PROBIT). Probit transformation
is used to straighten the dose response curve and allows for a more accurate estimation of EC50
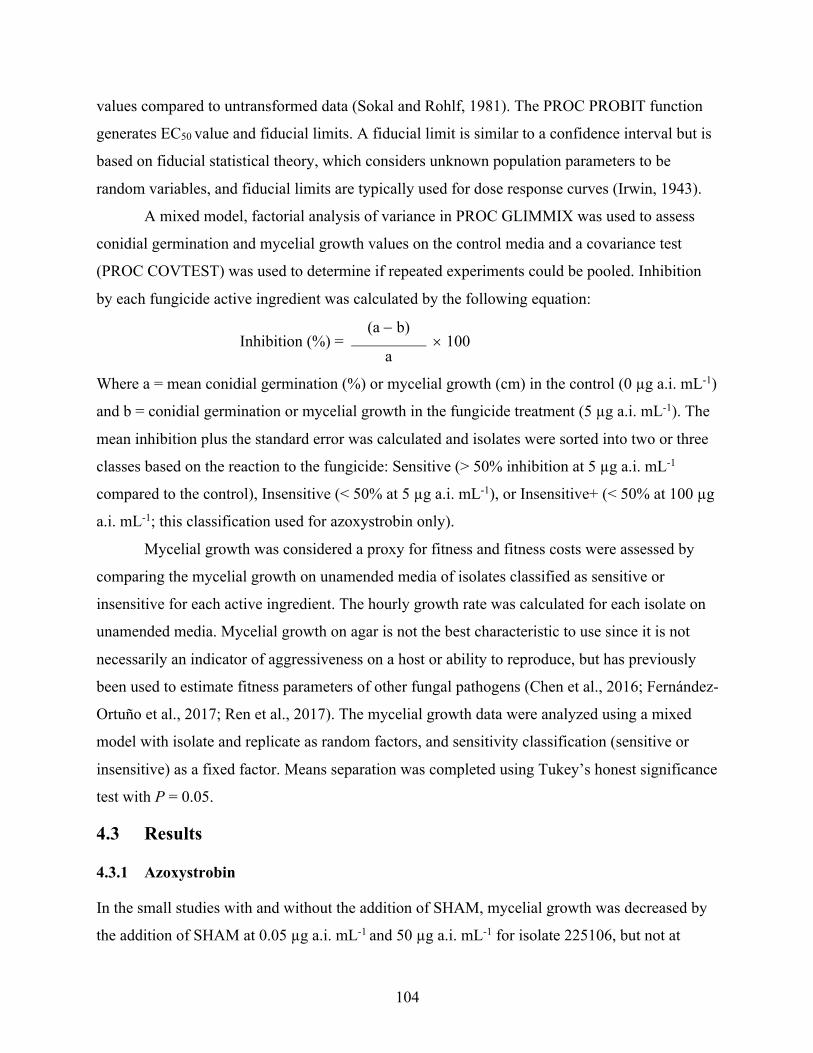
104
values compared to untransformed data (Sokal and Rohlf, 1981). The PROC PROBIT function
generates EC50 value and fiducial limits. A fiducial limit is similar to a confidence interval but is
based on fiducial statistical theory, which considers unknown population parameters to be
random variables, and fiducial limits are typically used for dose response curves (Irwin, 1943).
A mixed model, factorial analysis of variance in PROC GLIMMIX was used to assess
conidial germination and mycelial growth values on the control media and a covariance test
(PROC COVTEST) was used to determine if repeated experiments could be pooled. Inhibition
by each fungicide active ingredient was calculated by the following equation:
Inhibition (%) = (a - b)
´ 100 a
Where a = mean conidial germination (%) or mycelial growth (cm) in the control (0 µg a.i. mL-1)
and b = conidial germination or mycelial growth in the fungicide treatment (5 µg a.i. mL-1). The
mean inhibition plus the standard error was calculated and isolates were sorted into two or three
classes based on the reaction to the fungicide: Sensitive (> 50% inhibition at 5 µg a.i. mL-1
compared to the control), Insensitive (< 50% at 5 µg a.i. mL-1), or Insensitive+ (< 50% at 100 µg
a.i. mL-1; this classification used for azoxystrobin only).
Mycelial growth was considered a proxy for fitness and fitness costs were assessed by
comparing the mycelial growth on unamended media of isolates classified as sensitive or
insensitive for each active ingredient. The hourly growth rate was calculated for each isolate on
unamended media. Mycelial growth on agar is not the best characteristic to use since it is not
necessarily an indicator of aggressiveness on a host or ability to reproduce, but has previously
been used to estimate fitness parameters of other fungal pathogens (Chen et al., 2016; Fernández-
Ortuño et al., 2017; Ren et al., 2017). The mycelial growth data were analyzed using a mixed
model with isolate and replicate as random factors, and sensitivity classification (sensitive or
insensitive) as a fixed factor. Means separation was completed using Tukey’s honest significance
test with P = 0.05.
4.3 Results
4.3.1 Azoxystrobin
In the small studies with and without the addition of SHAM, mycelial growth was decreased by
the addition of SHAM at 0.05 µg a.i. mL-1 and 50 µg a.i. mL-1 for isolate 225106, but not at
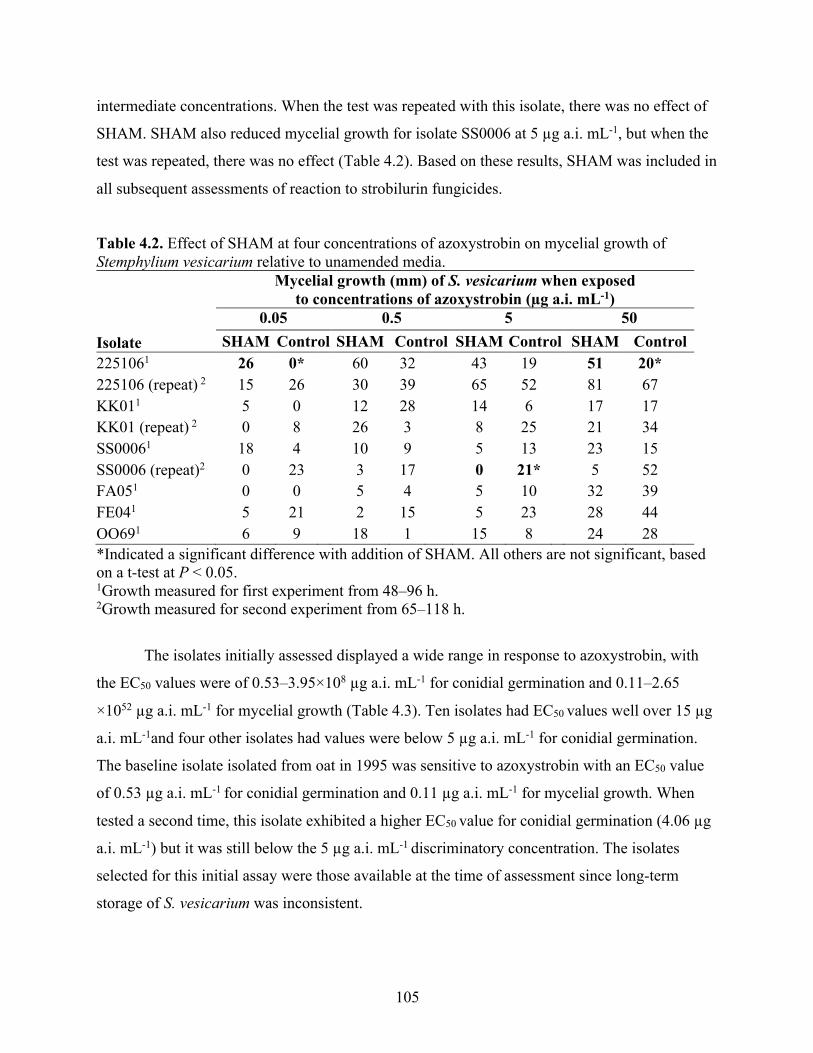
105
intermediate concentrations. When the test was repeated with this isolate, there was no effect of
SHAM. SHAM also reduced mycelial growth for isolate SS0006 at 5 µg a.i. mL-1, but when the
test was repeated, there was no effect (Table 4.2). Based on these results, SHAM was included in
all subsequent assessments of reaction to strobilurin fungicides.
Table 4.2. Effect of SHAM at four concentrations of azoxystrobin on mycelial growth of Stemphylium vesicarium relative to unamended media. Mycelial growth (mm) of S. vesicarium when exposed
to concentrations of azoxystrobin (µg a.i. mL-1) 0.05 0.5 5 50
Isolate SHAM Control SHAM Control SHAM Control SHAM Control 2251061 26 0* 60 32 43 19 51 20*
225106 (repeat) 2 15 26 30 39 65 52 81 67 KK011 5 0 12 28 14 6 17 17 KK01 (repeat) 2 0 8 26 3 8 25 21 34 SS00061 18 4 10 9 5 13 23 15 SS0006 (repeat)2 0 23 3 17 0 21* 5 52 FA051 0 0 5 4 5 10 32 39 FE041 5 21 2 15 5 23 28 44
OO691 6 9 18 1 15 8 24 28 *Indicated a significant difference with addition of SHAM. All others are not significant, based on a t-test at P < 0.05. 1Growth measured for first experiment from 48–96 h. 2Growth measured for second experiment from 65–118 h.
The isolates initially assessed displayed a wide range in response to azoxystrobin, with
the EC50 values were of 0.53–3.95×10⁸ µg a.i. mL-1 for conidial germination and 0.11–2.65
×1052 µg a.i. mL-1 for mycelial growth (Table 4.3). Ten isolates had EC50 values well over 15 µg
a.i. mL-1and four other isolates had values were below 5 µg a.i. mL-1 for conidial germination.
The baseline isolate isolated from oat in 1995 was sensitive to azoxystrobin with an EC50 value
of 0.53 µg a.i. mL-1 for conidial germination and 0.11 µg a.i. mL-1 for mycelial growth. When
tested a second time, this isolate exhibited a higher EC50 value for conidial germination (4.06 µg
a.i. mL-1) but it was still below the 5 µg a.i. mL-1 discriminatory concentration. The isolates
selected for this initial assay were those available at the time of assessment since long-term
storage of S. vesicarium was inconsistent.
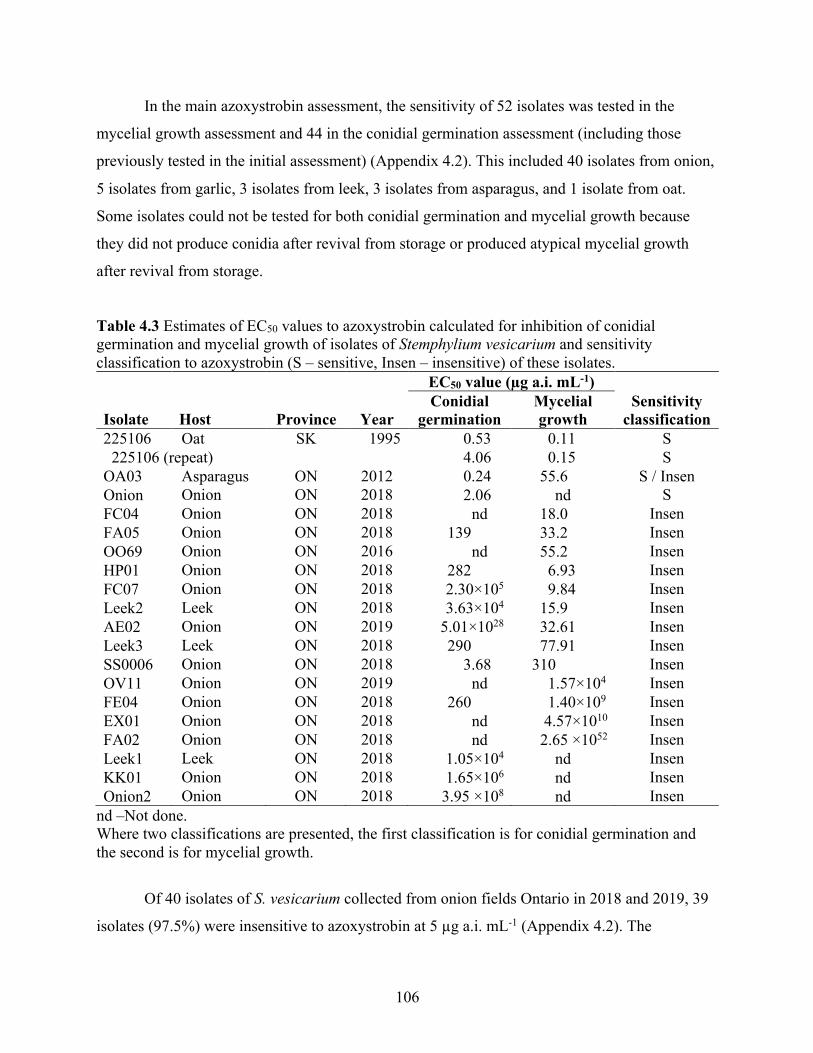
106
In the main azoxystrobin assessment, the sensitivity of 52 isolates was tested in the
mycelial growth assessment and 44 in the conidial germination assessment (including those
previously tested in the initial assessment) (Appendix 4.2). This included 40 isolates from onion,
5 isolates from garlic, 3 isolates from leek, 3 isolates from asparagus, and 1 isolate from oat.
Some isolates could not be tested for both conidial germination and mycelial growth because
they did not produce conidia after revival from storage or produced atypical mycelial growth
after revival from storage.
Table 4.3 Estimates of EC50 values to azoxystrobin calculated for inhibition of conidial germination and mycelial growth of isolates of Stemphylium vesicarium and sensitivity classification to azoxystrobin (S – sensitive, Insen – insensitive) of these isolates.
Isolate
EC50 value (µg a.i. mL-1) Sensitivity
classification Host Province Year Conidial
germination Mycelial growth
225106 Oat SK 1995 0.53 0.11 S 225106 (repeat) 4.06 0.15 S OA03 Asparagus ON 2012 0.24 55.6 S / Insen Onion Onion ON 2018 2.06 nd S FC04 Onion ON 2018 nd 18.0 Insen FA05 Onion ON 2018 139 33.2 Insen OO69 Onion ON 2016 nd 55.2 Insen HP01 Onion ON 2018 282 6.93 Insen FC07 Onion ON 2018 2.30×10⁵ 9.84 Insen Leek2 Leek ON 2018 3.63×10⁴ 15.9 Insen AE02 Onion ON 2019 5.01×1028 32.61 Insen Leek3 Leek ON 2018 290 77.91 Insen SS0006 Onion ON 2018 3.68 310 Insen OV11 Onion ON 2019 nd 1.57×10⁴ Insen FE04 Onion ON 2018 260 1.40×10⁹ Insen EX01 Onion ON 2018 nd 4.57×10¹⁰ Insen FA02 Onion ON 2018 nd 2.65 ×1052 Insen Leek1 Leek ON 2018 1.05×10⁴ nd Insen KK01 Onion ON 2018 1.65×10⁶ nd Insen Onion2 Onion ON 2018 3.95 ×10⁸ nd Insen
nd –Not done. Where two classifications are presented, the first classification is for conidial germination and the second is for mycelial growth.
Of 40 isolates of S. vesicarium collected from onion fields Ontario in 2018 and 2019, 39
isolates (97.5%) were insensitive to azoxystrobin at 5 µg a.i. mL-1 (Appendix 4.2). The
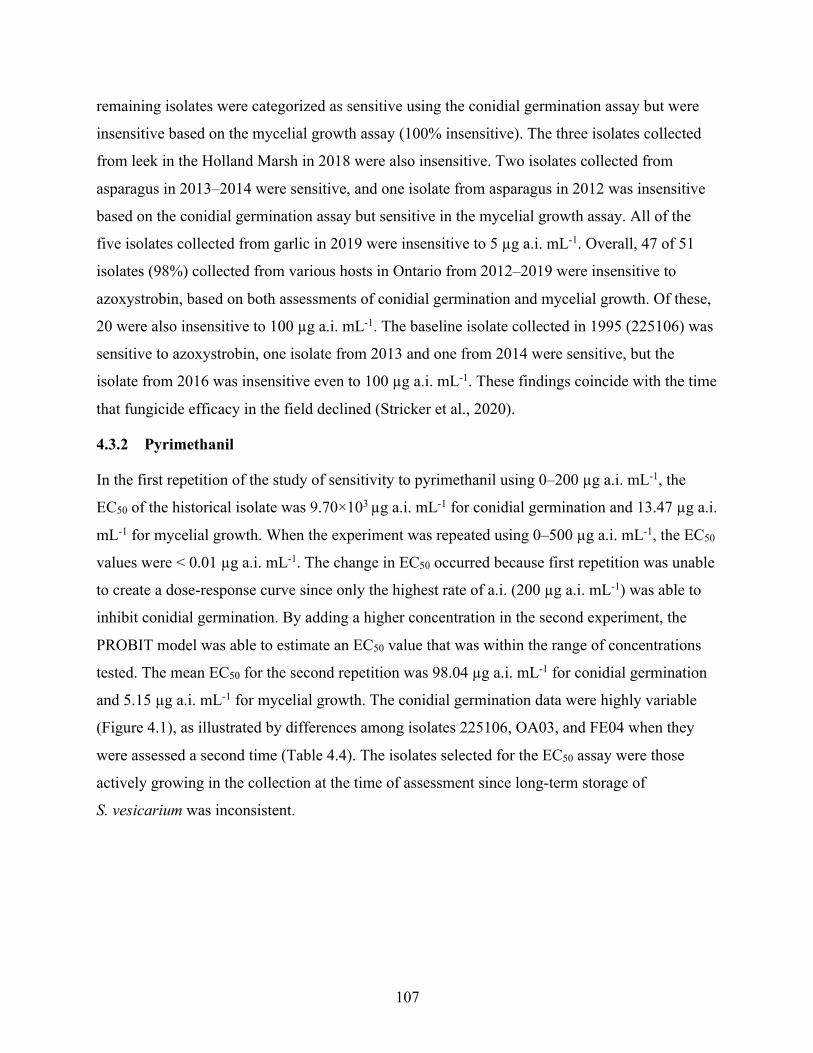
107
remaining isolates were categorized as sensitive using the conidial germination assay but were
insensitive based on the mycelial growth assay (100% insensitive). The three isolates collected
from leek in the Holland Marsh in 2018 were also insensitive. Two isolates collected from
asparagus in 2013–2014 were sensitive, and one isolate from asparagus in 2012 was insensitive
based on the conidial germination assay but sensitive in the mycelial growth assay. All of the
five isolates collected from garlic in 2019 were insensitive to 5 µg a.i. mL-1. Overall, 47 of 51
isolates (98%) collected from various hosts in Ontario from 2012–2019 were insensitive to
azoxystrobin, based on both assessments of conidial germination and mycelial growth. Of these,
20 were also insensitive to 100 µg a.i. mL-1. The baseline isolate collected in 1995 (225106) was
sensitive to azoxystrobin, one isolate from 2013 and one from 2014 were sensitive, but the
isolate from 2016 was insensitive even to 100 µg a.i. mL-1. These findings coincide with the time
that fungicide efficacy in the field declined (Stricker et al., 2020).
4.3.2 Pyrimethanil
In the first repetition of the study of sensitivity to pyrimethanil using 0–200 µg a.i. mL-1, the
EC50 of the historical isolate was 9.70×10³ µg a.i. mL-1 for conidial germination and 13.47 µg a.i.
mL-1 for mycelial growth. When the experiment was repeated using 0–500 µg a.i. mL-1, the EC50
values were < 0.01 µg a.i. mL-1. The change in EC50 occurred because first repetition was unable
to create a dose-response curve since only the highest rate of a.i. (200 µg a.i. mL-1) was able to
inhibit conidial germination. By adding a higher concentration in the second experiment, the
PROBIT model was able to estimate an EC50 value that was within the range of concentrations
tested. The mean EC50 for the second repetition was 98.04 µg a.i. mL-1 for conidial germination
and 5.15 µg a.i. mL-1 for mycelial growth. The conidial germination data were highly variable
(Figure 4.1), as illustrated by differences among isolates 225106, OA03, and FE04 when they
were assessed a second time (Table 4.4). The isolates selected for the EC50 assay were those
actively growing in the collection at the time of assessment since long-term storage of
S. vesicarium was inconsistent.
108
Table 4.4 EC50 values for inhibition of conidial germination and mycelial growth of Stemphylium vesicarium and fungicide sensitivity classification (S – sensitive, Insen – insensitive) based on exposure to selected rates of pyrimethanil on agar medium.
Isolate
EC50 value (µg a.i. mL-1) Sensitivity
classification Host Province Year Conidial
germination Mycelial growth
225106 Oat SK 1995 9.70×10³ 13.5 Insen 225106 (repeat) 98.0 5.2 Insen AE02 Onion ON 2018 nd 0.54 S Onion2 Onion ON 2018 nd 0.97 S FA01 Onion ON 2018 3.40×10¹³ 1.30 Insen / S FC07 Onion ON 2018 31.8 5.20 Insen / S Leek2 Leek ON 2018 133 5.04 Insen Leek1 Leek ON 2018 1.84×10⁷ 10.6 Insen Leek1 (repeat) 497 8.34×10⁵ Insen Leek3 Leek ON 2018 1.46×10⁷ 12.9 Insen FC04 Onion ON 2018 10.6 16.1 Insen OV11 Onion ON 2019 6.80×10⁵ 20.6 Insen OO69 Onion ON 2016 924 37.5 Insen FE04 – Onion ON 2018 1.12×10⁴ 44.0 Insen FE04 (repeat) 1.18 ×10⁶ 444 Insen
HP01 Onion ON 2018 6.37×10¹¹ 177 Insen OA03 Asparagus ON 2012 2.02 309 Insen OA03 (repeat) ON 523 nd Insen SS0006 Onion ON 2018 239 1.22×10³ Insen SS0006 (repeat) 5.76×10³ nd Insen EX01 Onion ON 2018 1.00×10⁴ 1.06×10⁴ Insen KK01 Onion ON 2018 3.67 1.82×10¹⁴ Insen nd –Not done. Where two classifications are presented, the first classification is for conidial germination and the second is for mycelial growth.
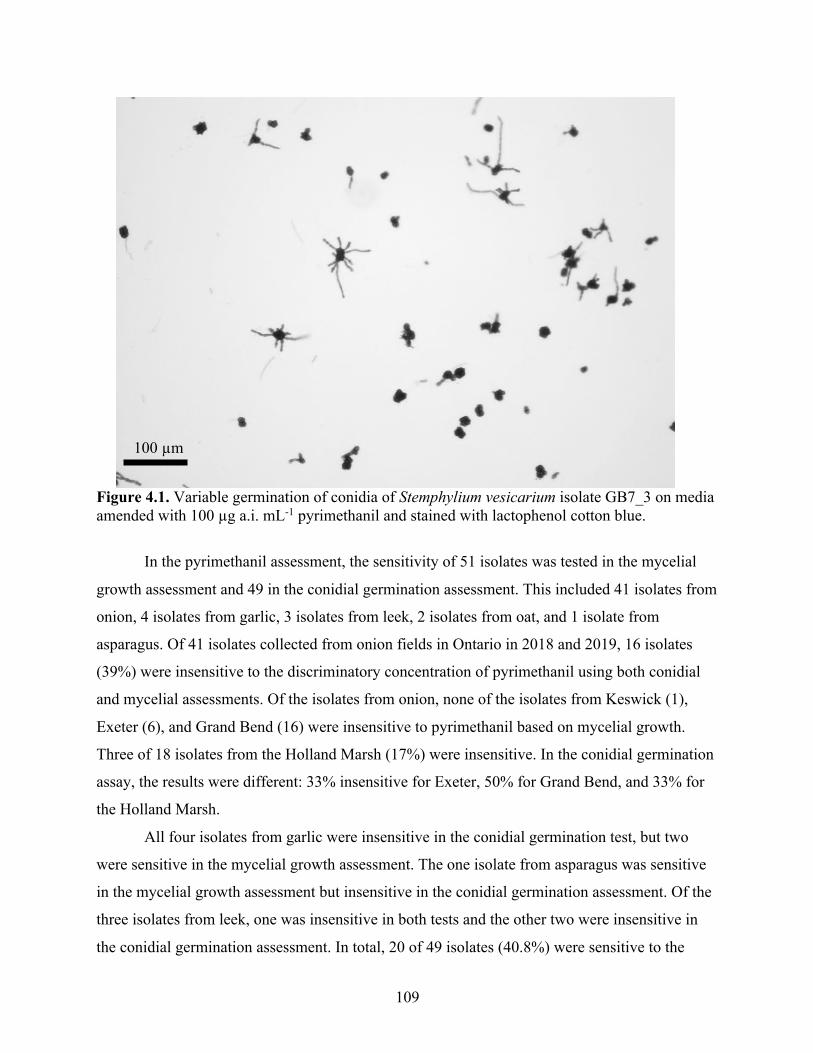
109
Figure 4.1. Variable germination of conidia of Stemphylium vesicarium isolate GB7_3 on media amended with 100 µg a.i. mL-1 pyrimethanil and stained with lactophenol cotton blue.
In the pyrimethanil assessment, the sensitivity of 51 isolates was tested in the mycelial
growth assessment and 49 in the conidial germination assessment. This included 41 isolates from
onion, 4 isolates from garlic, 3 isolates from leek, 2 isolates from oat, and 1 isolate from
asparagus. Of 41 isolates collected from onion fields in Ontario in 2018 and 2019, 16 isolates
(39%) were insensitive to the discriminatory concentration of pyrimethanil using both conidial
and mycelial assessments. Of the isolates from onion, none of the isolates from Keswick (1),
Exeter (6), and Grand Bend (16) were insensitive to pyrimethanil based on mycelial growth.
Three of 18 isolates from the Holland Marsh (17%) were insensitive. In the conidial germination
assay, the results were different: 33% insensitive for Exeter, 50% for Grand Bend, and 33% for
the Holland Marsh.
All four isolates from garlic were insensitive in the conidial germination test, but two
were sensitive in the mycelial growth assessment. The one isolate from asparagus was sensitive
in the mycelial growth assessment but insensitive in the conidial germination assessment. Of the
three isolates from leek, one was insensitive in both tests and the other two were insensitive in
the conidial germination assessment. In total, 20 of 49 isolates (40.8%) were sensitive to the
100 µm
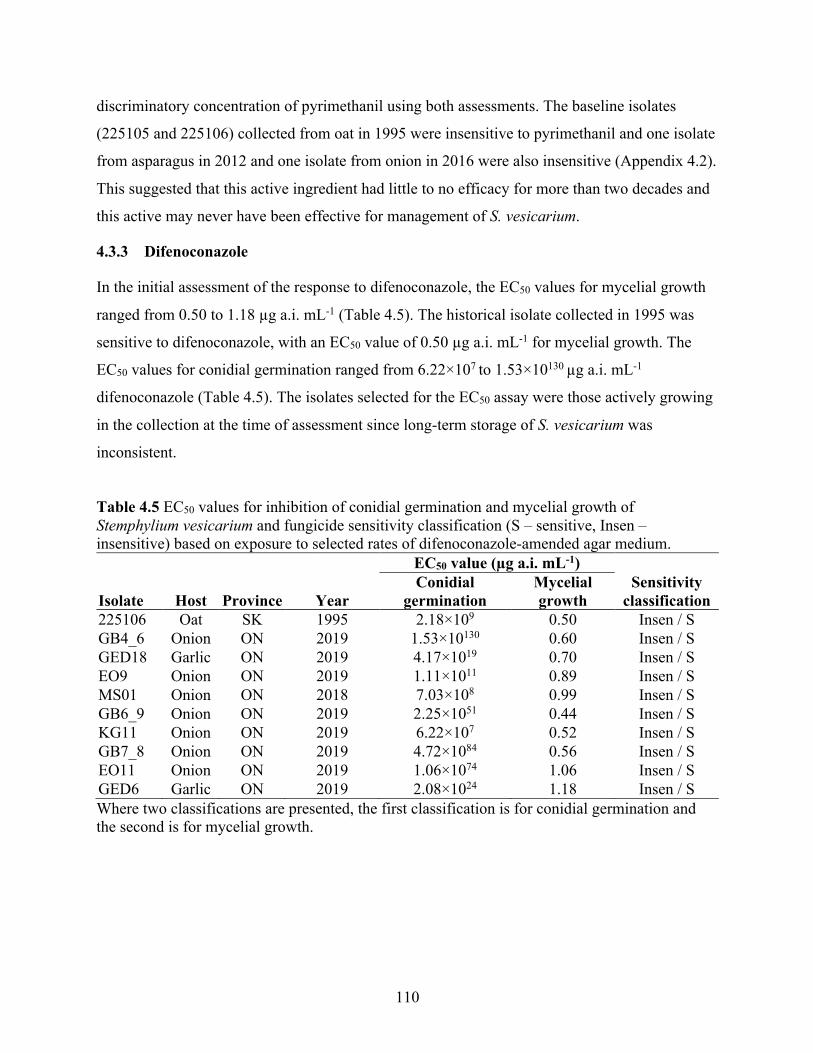
110
discriminatory concentration of pyrimethanil using both assessments. The baseline isolates
(225105 and 225106) collected from oat in 1995 were insensitive to pyrimethanil and one isolate
from asparagus in 2012 and one isolate from onion in 2016 were also insensitive (Appendix 4.2).
This suggested that this active ingredient had little to no efficacy for more than two decades and
this active may never have been effective for management of S. vesicarium.
4.3.3 Difenoconazole
In the initial assessment of the response to difenoconazole, the EC50 values for mycelial growth
ranged from 0.50 to 1.18 µg a.i. mL-1 (Table 4.5). The historical isolate collected in 1995 was
sensitive to difenoconazole, with an EC50 value of 0.50 µg a.i. mL-1 for mycelial growth. The
EC50 values for conidial germination ranged from 6.22×10⁷ to 1.53×10130 µg a.i. mL-1
difenoconazole (Table 4.5). The isolates selected for the EC50 assay were those actively growing
in the collection at the time of assessment since long-term storage of S. vesicarium was
inconsistent.
Table 4.5 EC50 values for inhibition of conidial germination and mycelial growth of Stemphylium vesicarium and fungicide sensitivity classification (S – sensitive, Insen – insensitive) based on exposure to selected rates of difenoconazole-amended agar medium.
Isolate
EC50 value (µg a.i. mL-1) Sensitivity
classification Host Province Year Conidial
germination Mycelial growth
225106 Oat SK 1995 2.18×10⁹ 0.50 Insen / S GB4_6 Onion ON 2019 1.53×10130 0.60 Insen / S GED18 Garlic ON 2019 4.17×10¹⁹ 0.70 Insen / S EO9 Onion ON 2019 1.11×10¹¹ 0.89 Insen / S MS01 Onion ON 2018 7.03×10⁸ 0.99 Insen / S GB6_9 Onion ON 2019 2.25×1051 0.44 Insen / S KG11 Onion ON 2019 6.22×10⁷ 0.52 Insen / S GB7_8 Onion ON 2019 4.72×1084 0.56 Insen / S EO11 Onion ON 2019 1.06×1074 1.06 Insen / S GED6 Garlic ON 2019 2.08×1024 1.18 Insen / S Where two classifications are presented, the first classification is for conidial germination and the second is for mycelial growth.
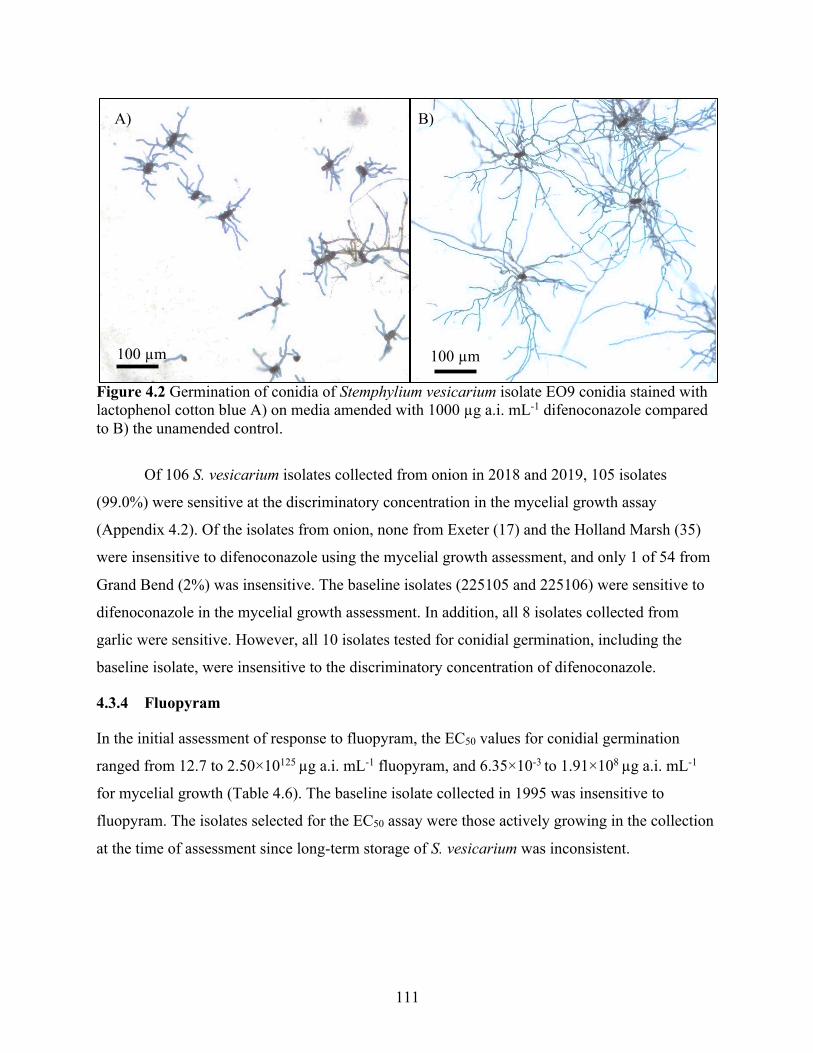
111
Figure 4.2 Germination of conidia of Stemphylium vesicarium isolate EO9 conidia stained with lactophenol cotton blue A) on media amended with 1000 µg a.i. mL-1 difenoconazole compared to B) the unamended control.
Of 106 S. vesicarium isolates collected from onion in 2018 and 2019, 105 isolates
(99.0%) were sensitive at the discriminatory concentration in the mycelial growth assay
(Appendix 4.2). Of the isolates from onion, none from Exeter (17) and the Holland Marsh (35)
were insensitive to difenoconazole using the mycelial growth assessment, and only 1 of 54 from
Grand Bend (2%) was insensitive. The baseline isolates (225105 and 225106) were sensitive to
difenoconazole in the mycelial growth assessment. In addition, all 8 isolates collected from
garlic were sensitive. However, all 10 isolates tested for conidial germination, including the
baseline isolate, were insensitive to the discriminatory concentration of difenoconazole.
4.3.4 Fluopyram
In the initial assessment of response to fluopyram, the EC50 values for conidial germination
ranged from 12.7 to 2.50×10125 µg a.i. mL-1 fluopyram, and 6.35×10⁻³ to 1.91×10⁸ µg a.i. mL-1
for mycelial growth (Table 4.6). The baseline isolate collected in 1995 was insensitive to
fluopyram. The isolates selected for the EC50 assay were those actively growing in the collection
at the time of assessment since long-term storage of S. vesicarium was inconsistent.
A) B)
100 µm 100 µm
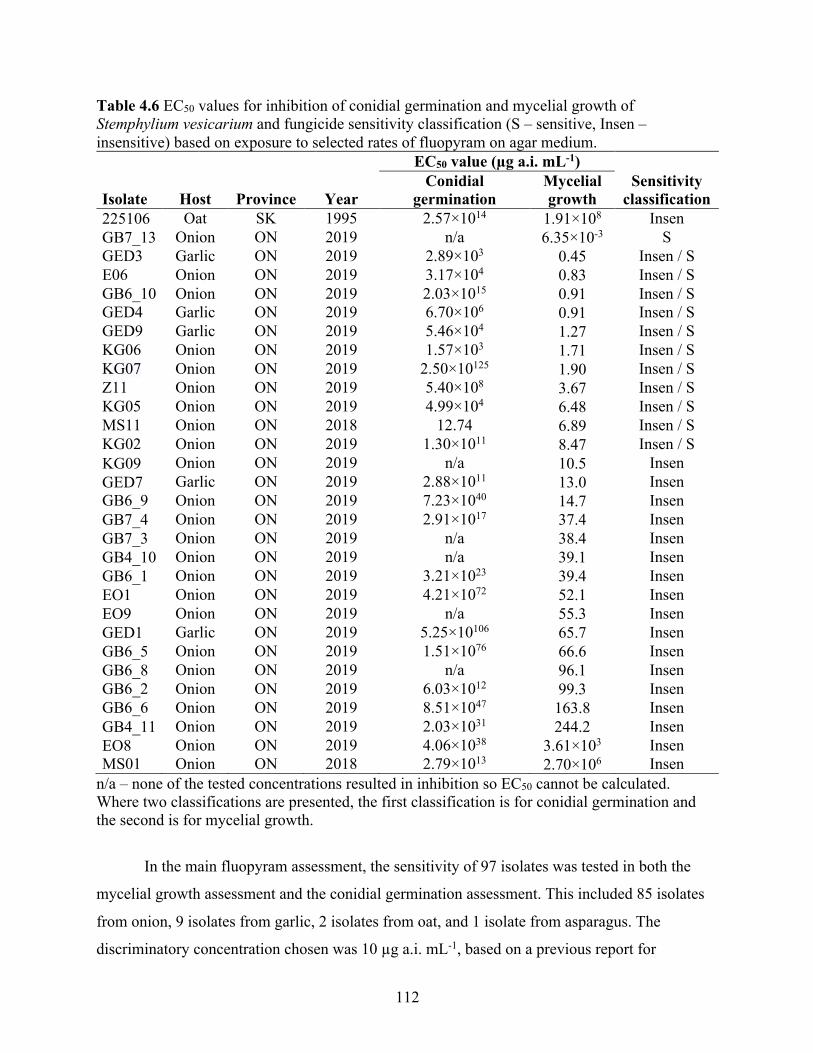
112
Table 4.6 EC50 values for inhibition of conidial germination and mycelial growth of Stemphylium vesicarium and fungicide sensitivity classification (S – sensitive, Insen – insensitive) based on exposure to selected rates of fluopyram on agar medium. EC50 value (µg a.i. mL-1)
Sensitivity classification Isolate Host Province Year
Conidial germination
Mycelial growth
225106 Oat SK 1995 2.57×10¹⁴ 1.91×10⁸ Insen GB7_13 Onion ON 2019 n/a 6.35×10⁻³ S GED3 Garlic ON 2019 2.89×10³ 0.45 Insen / S E06 Onion ON 2019 3.17×10⁴ 0.83 Insen / S GB6_10 Onion ON 2019 2.03×10¹⁵ 0.91 Insen / S GED4 Garlic ON 2019 6.70×10⁶ 0.91 Insen / S GED9 Garlic ON 2019 5.46×10⁴ 1.27 Insen / S KG06 Onion ON 2019 1.57×10³ 1.71 Insen / S KG07 Onion ON 2019 2.50×10125 1.90 Insen / S Z11 Onion ON 2019 5.40×10⁸ 3.67 Insen / S KG05 Onion ON 2019 4.99×10⁴ 6.48 Insen / S MS11 Onion ON 2018 12.74 6.89 Insen / S KG02 Onion ON 2019 1.30×10¹¹ 8.47 Insen / S KG09 Onion ON 2019 n/a 10.5 Insen GED7 Garlic ON 2019 2.88×10¹¹ 13.0 Insen GB6_9 Onion ON 2019 7.23×1040 14.7 Insen GB7_4 Onion ON 2019 2.91×10¹⁷ 37.4 Insen GB7_3 Onion ON 2019 n/a 38.4 Insen GB4_10 Onion ON 2019 n/a 39.1 Insen GB6_1 Onion ON 2019 3.21×10²³ 39.4 Insen EO1 Onion ON 2019 4.21×1072 52.1 Insen EO9 Onion ON 2019 n/a 55.3 Insen GED1 Garlic ON 2019 5.25×10106 65.7 Insen GB6_5 Onion ON 2019 1.51×1076 66.6 Insen GB6_8 Onion ON 2019 n/a 96.1 Insen GB6_2 Onion ON 2019 6.03×10¹² 99.3 Insen GB6_6 Onion ON 2019 8.51×1047 163.8 Insen GB4_11 Onion ON 2019 2.03×1031 244.2 Insen EO8 Onion ON 2019 4.06×1038 3.61×10³ Insen MS01 Onion ON 2018 2.79×10¹³ 2.70×10⁶ Insen
n/a – none of the tested concentrations resulted in inhibition so EC50 cannot be calculated. Where two classifications are presented, the first classification is for conidial germination and the second is for mycelial growth.
In the main fluopyram assessment, the sensitivity of 97 isolates was tested in both the
mycelial growth assessment and the conidial germination assessment. This included 85 isolates
from onion, 9 isolates from garlic, 2 isolates from oat, and 1 isolate from asparagus. The
discriminatory concentration chosen was 10 µg a.i. mL-1, based on a previous report for
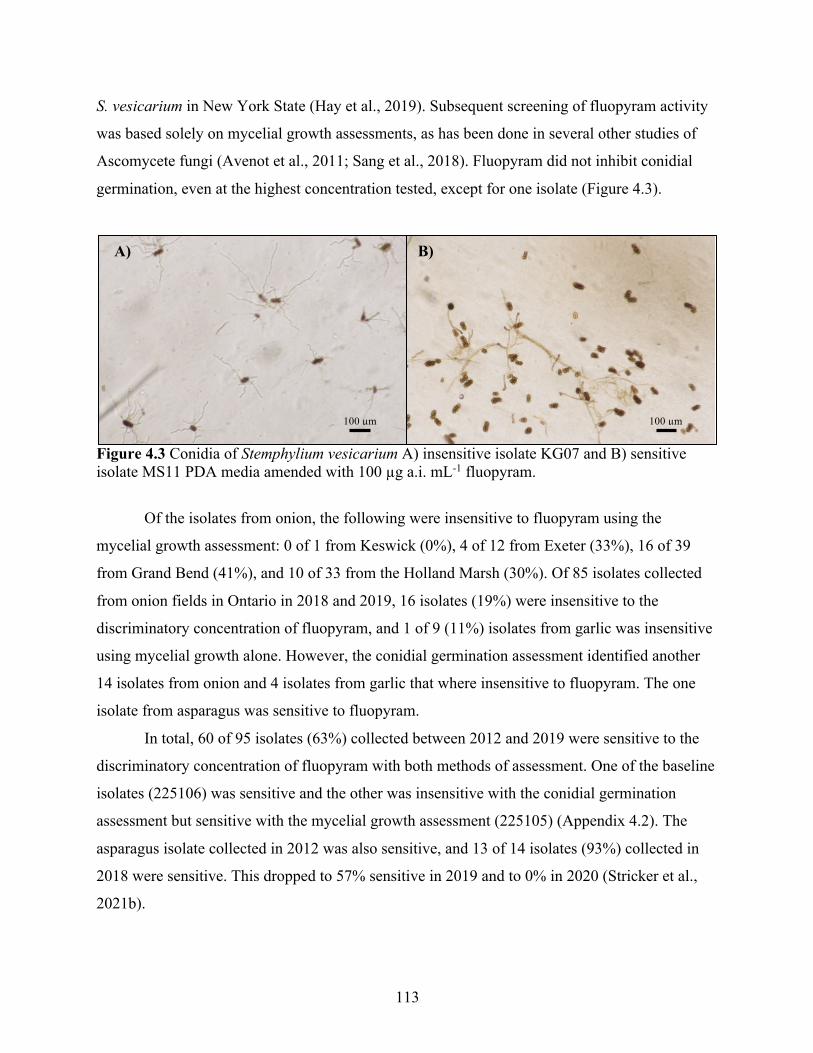
113
S. vesicarium in New York State (Hay et al., 2019). Subsequent screening of fluopyram activity
was based solely on mycelial growth assessments, as has been done in several other studies of
Ascomycete fungi (Avenot et al., 2011; Sang et al., 2018). Fluopyram did not inhibit conidial
germination, even at the highest concentration tested, except for one isolate (Figure 4.3).
Figure 4.3 Conidia of Stemphylium vesicarium A) insensitive isolate KG07 and B) sensitive isolate MS11 PDA media amended with 100 µg a.i. mL-1 fluopyram.
Of the isolates from onion, the following were insensitive to fluopyram using the
mycelial growth assessment: 0 of 1 from Keswick (0%), 4 of 12 from Exeter (33%), 16 of 39
from Grand Bend (41%), and 10 of 33 from the Holland Marsh (30%). Of 85 isolates collected
from onion fields in Ontario in 2018 and 2019, 16 isolates (19%) were insensitive to the
discriminatory concentration of fluopyram, and 1 of 9 (11%) isolates from garlic was insensitive
using mycelial growth alone. However, the conidial germination assessment identified another
14 isolates from onion and 4 isolates from garlic that where insensitive to fluopyram. The one
isolate from asparagus was sensitive to fluopyram.
In total, 60 of 95 isolates (63%) collected between 2012 and 2019 were sensitive to the
discriminatory concentration of fluopyram with both methods of assessment. One of the baseline
isolates (225106) was sensitive and the other was insensitive with the conidial germination
assessment but sensitive with the mycelial growth assessment (225105) (Appendix 4.2). The
asparagus isolate collected in 2012 was also sensitive, and 13 of 14 isolates (93%) collected in
2018 were sensitive. This dropped to 57% sensitive in 2019 and to 0% in 2020 (Stricker et al.,
2021b).
A) B)
100 µm 100 µm
114
4.3.5 Insensitivity to more than one active ingredients
There were 32 isolates of S. vesicarium collected from onion and garlic that were tested against
both azoxystrobin and difenoconazole, which are the active ingredients in Quadris Top
fungicide. All of these isolates were insensitive to azoxystrobin, and none were insensitive to
difenoconazole using the mycelial growth assessment. However, the highest rate of
difenoconazole did not inhibit conidial germination, so 100% of these isolates could be
considered insensitive to both active ingredients.
For the 41 isolates tested against fluopyram and pyrimethanil, which are the two
fungicides in Luna Tranquility, only two isolates were insensitive to both active ingredients, but
only two isolates were sensitive to both active ingredients with both assessment methods. The
remaining 37 isolates (90%) were insensitive to at least one ingredient with either or both the
mycelial growth and conidial germination assessment methods.
Of the 39 isolates tested against both azoxystrobin and pyrimethanil, 100% were
insensitive to at least one of the active ingredients, but 26 isolates (67%) were sensitive to
pyrimethanil with the conidial germination assay. Of the 39 isolates tested against azoxystrobin
and fluopyram, all of the isolates were insensitive to at least one active ingredient and five
isolates were insensitive with both assessment methods. Of the 21 isolates tested against
pyrimethanil and difenoconazole, only one isolate was sensitive to both active ingredients.
4.3.6 In vitro mycelial growth fitness cost
The mycelial growth rates on unamended media of insensitive isolates were compared to those
that had been classified as sensitive to each active ingredient. The classification of sensitivity or
insensitivity was based on the inhibition of growth or germination on fungicide-amended
compared to the non-amended control; assessment of fitness compared growth on non-amended
media only.
Mycelial growth was not affected by insensitivity to azoxystrobin (Table 4.7), based on
50 insensitive isolates but only one sensitive isolate. Isolates insensitive to difenoconazole,
pyrimethanil, and fluopyram grew more slowly than sensitive isolates (Table 4.7). Slower
growth of insensitive isolates could indicate that there was a fitness cost associated with
insensitivity.
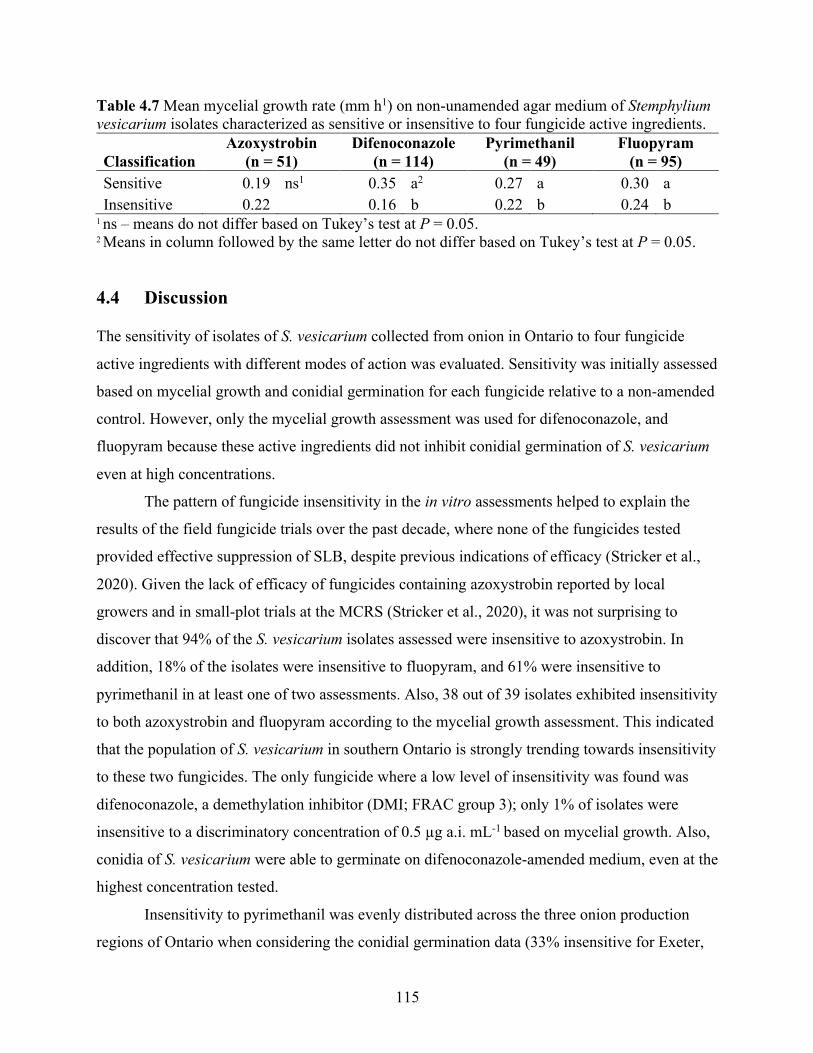
115
Table 4.7 Mean mycelial growth rate (mm h1) on non-unamended agar medium of Stemphylium vesicarium isolates characterized as sensitive or insensitive to four fungicide active ingredients.
Classification Azoxystrobin
(n = 51) Difenoconazole
(n = 114) Pyrimethanil
(n = 49) Fluopyram
(n = 95) Sensitive 0.19 ns1 0.35 a2 0.27 a 0.30 a Insensitive 0.22 0.16 b 0.22 b 0.24 b
1 ns – means do not differ based on Tukey’s test at P = 0.05. 2 Means in column followed by the same letter do not differ based on Tukey’s test at P = 0.05.
4.4 Discussion
The sensitivity of isolates of S. vesicarium collected from onion in Ontario to four fungicide
active ingredients with different modes of action was evaluated. Sensitivity was initially assessed
based on mycelial growth and conidial germination for each fungicide relative to a non-amended
control. However, only the mycelial growth assessment was used for difenoconazole, and
fluopyram because these active ingredients did not inhibit conidial germination of S. vesicarium
even at high concentrations.
The pattern of fungicide insensitivity in the in vitro assessments helped to explain the
results of the field fungicide trials over the past decade, where none of the fungicides tested
provided effective suppression of SLB, despite previous indications of efficacy (Stricker et al.,
2020). Given the lack of efficacy of fungicides containing azoxystrobin reported by local
growers and in small-plot trials at the MCRS (Stricker et al., 2020), it was not surprising to
discover that 94% of the S. vesicarium isolates assessed were insensitive to azoxystrobin. In
addition, 18% of the isolates were insensitive to fluopyram, and 61% were insensitive to
pyrimethanil in at least one of two assessments. Also, 38 out of 39 isolates exhibited insensitivity
to both azoxystrobin and fluopyram according to the mycelial growth assessment. This indicated
that the population of S. vesicarium in southern Ontario is strongly trending towards insensitivity
to these two fungicides. The only fungicide where a low level of insensitivity was found was
difenoconazole, a demethylation inhibitor (DMI; FRAC group 3); only 1% of isolates were
insensitive to a discriminatory concentration of 0.5 µg a.i. mL-1 based on mycelial growth. Also,
conidia of S. vesicarium were able to germinate on difenoconazole-amended medium, even at the
highest concentration tested.
Insensitivity to pyrimethanil was evenly distributed across the three onion production
regions of Ontario when considering the conidial germination data (33% insensitive for Exeter,
116
50% for Grand Bend, 33% for the Holland Marsh). However, in the mycelial growth assay, there
was 100% insensitivity for Exeter, 100% for Grand Bend, and 83% for the Holland Marsh. This
highlights the importance of using both assessment methods to assess fungicide sensitivity.
The small study on the addition of SHAM to azoxystrobin-amended media indicated that
there was little or no direct impact on S. vesicarium, but that SHAM reduced the variability of
QoI-sensitivity reactions. However, this assessment was conducted with a small sample size (6
isolates) and would benefit from additional study using more S. vesicarium isolates from a wider
diversity of sampling locations and plant hosts.
The fungicide timing trials presented in the previous chapter used fluopyram +
pyrimethanil alternated with azoxystrobin + difenoconazole as the foliar fungicide treatments in
2018. However, seven weekly applications using this fungicide program did not reduce SLB
severity. These are the main fungicides used for management of SLB in the Holland Marsh. Both
were recommended based on registration, results of efficacy trials, and results from other
jurisdictions. However, these fungicides and others were not effective in trials from 2013 to 2019
(Stricker et al., 2020).
The commercial fungicide Luna Tranquility contains fluopyram and pyrimethanil.
Pyrimethanil causes some inhibition of spore germination and germ tube growth. However, spore
germination data can be highly variable, as demonstrated in a study on Botrytis cinerea (Fritz et
al., 2003). In the current study, the spore germination on pyrimethanil-amended media was
highly variable even within one experimental unit for a single isolate. The proportion of isolates
that were insensitive to pyrimethanil in the current study was even higher than the 33% of
insensitive S. vesicarium isolates recently reported in New York (Hay et al., 2019). The
pyrimethanil-sensitive isolates in the current study appeared to be quantitatively insensitive;
isolate reaction ranged from highly sensitive (EC50 < 0.1 µg a.i. mL-1) to insensitive (EC50 < 5 µg
a.i. mL-1) to extremely insensitive (EC50 > 100 µg a.i. mL-1). However, since the mode of action
of this active ingredient is unknown, there is limited data to confirm if insensitivity is qualitative
or quantitative. The relatively small sample size assessed in the current study due to research
restrictions province-wide associated with the COVID 19 lockdown in 2020 likely contributed to
this high variability.
Fluopyram, the second ingredient in Luna Tranquility, is a succinate-dehydrogenase
inhibitor (SDHI; FRAC group 7). Field trials in New York in 2017 demonstrated that fungicides
117
containing fluopyram suppressed the SLB score by 69% relative to the unsprayed control
(Hoepting, 2018a). In vitro studies in New York also demonstrated a high level (> 90%) of
sensitivity to fluopyram in the S. vesicarium population (Hay et al., 2019). However, fungicides
containing fluopyram did not suppress SLB in recent field trials in the Holland Marsh (Stricker
et al., 2020) and 40% of isolates tested exhibited insensitivity in at least one of the in vitro
assessments. This difference may be due to lower sensitivity in the local population, lower
disease pressure in Ontario, or due to a difference in disease assessment methods between the
studies.
The S. vesicarium isolate collected from asparagus in 2012 was sensitive to fluopyram.
This suggests that the population may have initially been sensitive, which is supported by the
results of the initial field trials in the region (Stricker et al., 2020). In an experiment using
Alternaria alternata, a mixture of fluopyram plus pyrimethanil was more effective at reducing in
vitro mycelial growth compared to each active ingredient alone, which suggests a possibility of
synergy between the two products (Fairchild et al., 2013). Of the 41 isolates tested against these
two active ingredients, only two isolates were completely sensitive to both active ingredients.
In the current study, the EC50 values for conidial germination were often much higher
(> 100×) than those estimated using mycelial growth. This may be associated with the
assessment method. In another study, Alternaria alternata was also more sensitive to boscalid in
mycelium assays than conidial germination, and conidial germination was not affected by
concentrations > 50 µg a.i. mL-1 (Vega and Dewdney, 2015). Conversely, the fluopyram EC50
values of Fusarium spp. estimated using the mycelial growth inhibition were higher than those
calculated using a conidial germination assay (Wang et al., 2017). Similarly, the EC50 values for
Venturia inaequalis were higher for fluopyram and benzovindiflupyr (another SDHI fungicide)
for mycelial growth (2.02 and 0.043 µg a.i. mL-1, respectively) than for germ tube growth (0.176
and 0.0016 µg a.i. mL-1) (Villani et al., 2016). Differences in reduction of germination of conidia
as compared to inhibition of mycelial growth in different fungicides is common. The mode of
action of fungicides can affect certain life stages differently; DMI fungicides may have little to
no impact on spore germination since the mode of action is preventing sterol production and
fungal spores contain sterol reserves (Mueller et al., 2013).
In another pathosystem, the degree of fungicide-insensitive respiration of Fusarium
oxysporum increased over time, starting at germination and becoming up to 60% insensitive to
118
the active ingredient in the stationary growth phase (Pereira et al., 1997). This suggested that
growth stage can have an important impact on sensitivity to synthetic fungicides. DMI fungicides
such as difenoconazole inhibit cytochrome P450 and thus prevent the conversion of lanosterol to
ergosterol which inhibits cell division and thus mycelial growth (Bossche et al., 1983). In one
study, Aspergillus ochraceus Wilhelm mycelium consisted of 52% ergosterol and 37% lanosterol
during the germination phase, but this shifted to 95% ergosterol in the vegetative growth phase
(Gutarowska and Żakowska, 2009).
Azole fungicides block the production of ergosterol, which may explain why
difenoconazole inhibited mycelial growth but not conidial germination. A complete lack of
conidial germination inhibition by DMI fungicides has been previously reported for other fungal
pathogens (Jaspers, 2001). In fact, conidia of Fusarium spp. germinated after 48 h of incubation
when exposed to 2.5–250 µg mL-1 difenoconazole, but after 72 h of incubation the germ tubes
had collapsed and elongation ceased (Masiello et al., 2019). However, this is not always the case
for this fungicide group; 0.48 µg mL-1 difenoconazole inhibited conidial germination of A. solani
after 24 h of incubation (Issiakhem and Bouznad, 2010) and other DMI fungicides
(myclobutanil, prochloraz, prochloraz + epoxiconazole, and tebuconazole) inhibited conidial
germination of Diplodia mutila Slippers with mean EC50 values ranging between 0.3–3.2 µg mL-
1 (Torres et al., 2013). DMI fungicides inhibit production of sterols and since fungal spores
contain sterol, the inhibition of conidial germination will vary by active ingredient, length of
exposure, and the pathogen in question (Mueller et al., 2013).
The majority of tip-dieback symptoms of SLB may be caused by release of phytotoxins
by S. vesicarium (Singh et al., 1999). Some systemic fungicides reduce the rate of lesion
expansion but fungicides do not reduce or eliminate existing lesions (Ranzi and Forcelini, 2013).
Infections that occurred early in onion growth could continue to produce toxins, even if
additional infection was prevented by fungicide application. Also, systemic products would not
be translocated into dead leaf tissue. The necrotic leaf tissue could then provide a location for
new infections and would have to be protected by fungicides applied to the surface.
In populations where there is a fitness cost associated with fungicide insensitivity, the
population will generally trend back towards sensitivity when the active ingredient is removed
from the production system (Mikaberidze and McDonald, 2015). Therefore, assessment of the
fitness associated with insensitivity can be an important component of a fungicide management
119
package. A number of fitness assessments have been used to assess the pathogenicity, virulence,
and / or aggressiveness of pathogen isolates (Dyakov, 2007; Pariaud et al., 2009; Elliott et al.,
2015). However, assessment of fitness costs was not a primary objective of the current study, so
only a comparison of growth rate on unamended media was assessed. Growth rate on artificial
media can approximate growth rate on the host, but it is not a good indicator of aggressiveness or
fitness. There was a slight reduction in mycelial growth associated with insensitivity to
difenoconazole, pyrimethanil, and fluopyram, but not for azoxystrobin. In fact, azoxystrobin-
insensitive isolates had a slightly higher (numerically but not statistically) growth rate than
sensitive isolates.
Overall, the current study provided evidence of fungicide insensitivity to three of four
fungicides commonly used in Ontario to suppress SLB. The high rates of insensitivity reported in
the current study for the first time in Canada should be very concerning for onion growers in
Ontario. High levels of insensitivity were found to azoxystrobin. The other active ingredient in
Quadris Top, difenoconazole, did not inhibit spore germination even at the highest concentration.
This can explain why these commercial products were no longer effective against S. vesicarium
in the field (Stricker et al., 2020). In vitro testing showed that insensitivity to azoxystrobin was
very high (94%), to fluopyram was high (63%), to pyrimethanil was lower (41%), and to
difenoconazole using the mycelial growth assessment only was very low (1%). Of 30
S. vesicarium isolates collected from the Holland Marsh in 2020, 97% were insensitive to
azoxystrobin and 100% were insensitive to fluopyram (Stricker et al. 2021). This information is
valuable to help growers and integrated pest management practitioners avoid fungicides that will
not provide effective disease suppression in the field. Future research should investigate the in
vitro sensitivity of other active ingredients and screen the S. vesicarium isolates from Ontario for
mutations linked to fungicide insensitivity.
If a mutation causing fungicide insensitivity results in a fitness cost of some kind, there is
hope that the fungal population will trend back towards sensitivity if growers stop using that
product. Other research indicates that once reduced sensitivity to azoxystrobin has been
established in a pathogen population, the phenotype is stable and will persist even if the selection
pressure is removed (Primiano et al., 2017). Fluopyram is a relatively new active ingredient,
developed by Bayer CropScience and released in 2010 (Hopkins, 2009) so information on
insensitivity to this active ingredient is limited. In a study on Botrytis cinerea, some insensitive
120
mutants exhibited lower aggressiveness, spore production, mycelial growth, and sclerotia
viability (Veloukas et al., 2014). However, no fitness cost of mutations conferring insensitivity to
SDHI fungicides was observed in other studies (Scalliet et al., 2012). Pyrimethanil is another
relatively new active ingredient; studies with pyrimethanil-insensitive isolates of B. cinerea have
reported lower mycelial growth rates, spore germination, and competitive ability (Ren et al.,
2017). Similarly, difenoconazole-insensitive isolates of Lasiodiplodia theobromae (Pat.) Griffon
& Maubl., Bull. exhibited reduced virulence and mycelial growth (Li et al., 2020).
It would be interesting to determine if the insensitivity observed in this study is
qualitative (conferred by single gene mutations with large effect) or quantitative (conferred by
multiple mutations with small effects). Insensitivity to azoxystrobin is often qualitative,
conferred by a single mutation such as F129L or G143A in the cytochrome b protein (Kim et al.,
2003). The two mutations have not been documented in the same isolate (Li et al., 2021).
Insensitivity to SDHI fungicides such as fluopyram can result from several mutations in three of
the four sub-units of succinate dehydrogenase (Sun et al., 2016). Some mutations result in
greater insensitivity than others, but multiple mutations within a single isolate of a pathogen are
non-existent or very rare (Rehfus, 2018). Difenoconazole insensitivity typically builds over time
in a multi-step process through many small-effect mutations (Brent and Hollomon, 2007a). The
genetic cause of pyrimethanil-insensitivity has not been determined (Kanetis et al., 2010).
Based on the results of this study, the use of azoxystrobin, fluopyram, or pyrimethanil for
in-field suppression of SLB on onion in Ontario is not recommended. Based on in vitro studies,
difenoconazole may offer some protection from SLB, but field trials did not demonstrate disease
suppression by this active ingredient. The fitness cost assessment in this study suggests that if
growers can avoid use of products containing fluopyram and pyrimethanil, the S. vesicarium
population may regain sensitivity to these fungicides in the future. However, the length of time
this would take is unknown, especially if several similar fungicides are applied on the rotation
crop, carrots. For example, insensitivity to pyrimethanil was stable after 10 generations of B.
cinerea (Ren et al., 2017). Future research is needed to assess fitness costs of fungicide-
insensitive S. vesicarium isolates collected in Ontario, and to perform genetic screening for
known or new mutations conferring insensitivity to fungicides.
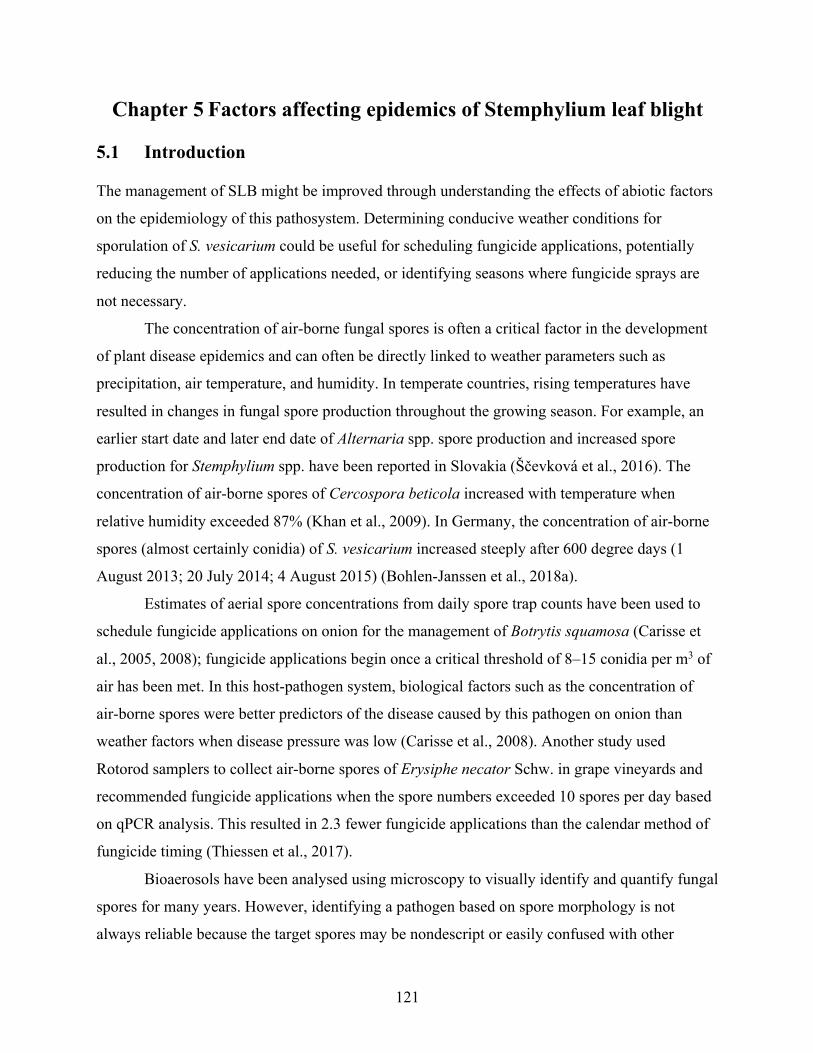
121
Chapter 5 Factors affecting epidemics of Stemphylium leaf blight
5.1 Introduction
The management of SLB might be improved through understanding the effects of abiotic factors
on the epidemiology of this pathosystem. Determining conducive weather conditions for
sporulation of S. vesicarium could be useful for scheduling fungicide applications, potentially
reducing the number of applications needed, or identifying seasons where fungicide sprays are
not necessary.
The concentration of air-borne fungal spores is often a critical factor in the development
of plant disease epidemics and can often be directly linked to weather parameters such as
precipitation, air temperature, and humidity. In temperate countries, rising temperatures have
resulted in changes in fungal spore production throughout the growing season. For example, an
earlier start date and later end date of Alternaria spp. spore production and increased spore
production for Stemphylium spp. have been reported in Slovakia (Ščevková et al., 2016). The
concentration of air-borne spores of Cercospora beticola increased with temperature when
relative humidity exceeded 87% (Khan et al., 2009). In Germany, the concentration of air-borne
spores (almost certainly conidia) of S. vesicarium increased steeply after 600 degree days (1
August 2013; 20 July 2014; 4 August 2015) (Bohlen-Janssen et al., 2018a).
Estimates of aerial spore concentrations from daily spore trap counts have been used to
schedule fungicide applications on onion for the management of Botrytis squamosa (Carisse et
al., 2005, 2008); fungicide applications begin once a critical threshold of 8–15 conidia per m3 of
air has been met. In this host-pathogen system, biological factors such as the concentration of
air-borne spores were better predictors of the disease caused by this pathogen on onion than
weather factors when disease pressure was low (Carisse et al., 2008). Another study used
Rotorod samplers to collect air-borne spores of Erysiphe necator Schw. in grape vineyards and
recommended fungicide applications when the spore numbers exceeded 10 spores per day based
on qPCR analysis. This resulted in 2.3 fewer fungicide applications than the calendar method of
fungicide timing (Thiessen et al., 2017).
Bioaerosols have been analysed using microscopy to visually identify and quantify fungal
spores for many years. However, identifying a pathogen based on spore morphology is not
always reliable because the target spores may be nondescript or easily confused with other
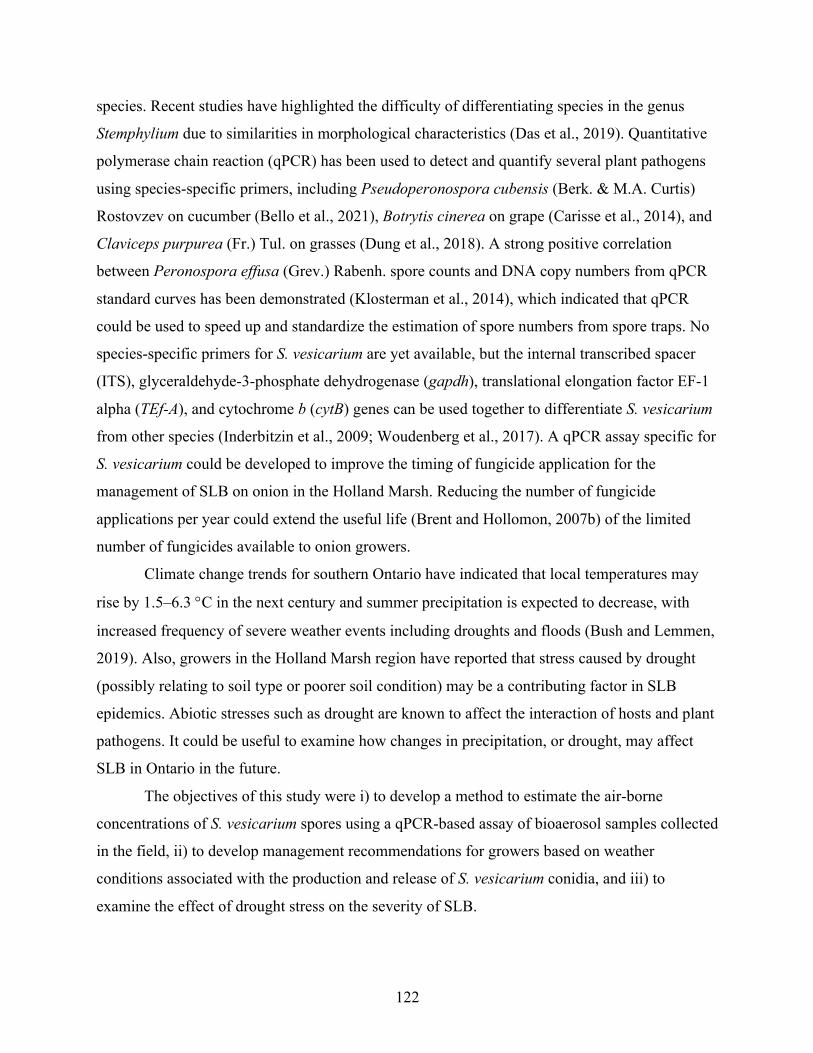
122
species. Recent studies have highlighted the difficulty of differentiating species in the genus
Stemphylium due to similarities in morphological characteristics (Das et al., 2019). Quantitative
polymerase chain reaction (qPCR) has been used to detect and quantify several plant pathogens
using species-specific primers, including Pseudoperonospora cubensis (Berk. & M.A. Curtis)
Rostovzev on cucumber (Bello et al., 2021), Botrytis cinerea on grape (Carisse et al., 2014), and
Claviceps purpurea (Fr.) Tul. on grasses (Dung et al., 2018). A strong positive correlation
between Peronospora effusa (Grev.) Rabenh. spore counts and DNA copy numbers from qPCR
standard curves has been demonstrated (Klosterman et al., 2014), which indicated that qPCR
could be used to speed up and standardize the estimation of spore numbers from spore traps. No
species-specific primers for S. vesicarium are yet available, but the internal transcribed spacer
(ITS), glyceraldehyde-3-phosphate dehydrogenase (gapdh), translational elongation factor EF-1
alpha (TEf-A), and cytochrome b (cytB) genes can be used together to differentiate S. vesicarium
from other species (Inderbitzin et al., 2009; Woudenberg et al., 2017). A qPCR assay specific for
S. vesicarium could be developed to improve the timing of fungicide application for the
management of SLB on onion in the Holland Marsh. Reducing the number of fungicide
applications per year could extend the useful life (Brent and Hollomon, 2007b) of the limited
number of fungicides available to onion growers.
Climate change trends for southern Ontario have indicated that local temperatures may
rise by 1.5–6.3 °C in the next century and summer precipitation is expected to decrease, with
increased frequency of severe weather events including droughts and floods (Bush and Lemmen,
2019). Also, growers in the Holland Marsh region have reported that stress caused by drought
(possibly relating to soil type or poorer soil condition) may be a contributing factor in SLB
epidemics. Abiotic stresses such as drought are known to affect the interaction of hosts and plant
pathogens. It could be useful to examine how changes in precipitation, or drought, may affect
SLB in Ontario in the future.
The objectives of this study were i) to develop a method to estimate the air-borne
concentrations of S. vesicarium spores using a qPCR-based assay of bioaerosol samples collected
in the field, ii) to develop management recommendations for growers based on weather
conditions associated with the production and release of S. vesicarium conidia, and iii) to
examine the effect of drought stress on the severity of SLB.
123
5.2 Materials and methods
5.2.1 Sporometrics spore sampling
A Spornado bioaerosol collection unit provided by Sporometrics Inc. (Toronto, ON) was used
for comparison to the Burkard multi-vial cyclone sampler (Burkard Manufacturing Co. Ltd.,
Rickmansworth, United Kingdom) in 2020. The Spornado is a wind-powered, low-cost spore
trap consisting of a cone-shaped funnel attached to a metal pole (Figure 5.1). Plastic cassettes
containing specialized membranes snap into the cone; fungal spores that are passively carried by
the wind are trapped on the membrane. The intake opening was 1.8 m from the ground. DNA
was extracted from the membranes with the FastDNA Spin kit for Soil (MP Biomedicals, USA)
and subjected to multi-target qPCR by Sporometrics Inc. The Spornado trap operated for
multiple days between changes of the cassette, so the spore estimates are converted to spores per
day by dividing the estimate by the number of days sampled.
Figure 5.1 A Spornado bioaerosol collection unit located adjacent to a newly planted onion field at the Muck Crops Research Station in 2020 (photo courtesy of Dennis Van Dyk).
5.2.2 Bioaerosol collection and DNA extraction
A Burkard Multi-Vial Cyclone Sampler was placed at the Muck Crops Research Station (MCRS)
of the University of Guelph in a 10 m ´ 60 m onion plot in 2018, 2019, and 2020. Each day, the
bioaerosol was collected into a 1.5 mL microcentrifuge tube at an air movement rate of 16.5 L
124
min-1 from 6:00 am to 12:00 pm (Figure 5.2). The time for sampling was chosen based on
previous research, which demonstrated that the majority of spores of S. vesicarium were released
in the morning time period (Gossen et al., 2021). The intake opening of the Burkard sampler was
0.95 m above the soil surface. DNA was directly extracted from the microcentrifuge tubes,
making this air sampler highly compatible with qPCR pathogen detection and quantification
methods (Williams et al., 2001). There were 48 samples collected in 2018, 42 in 2019, and 27 in
2020. The air samples were collected from 8 June–31 August 2018, 31 May–30 August 2019,
and 2 June–27 July 2020. Several samples where multiple days of bioaerosol were collected in
error were removed from the study. Samples were stored at -20 °C prior to DNA extraction.
Figure 5.2 The Burkard multi-vial cyclone sampler A) in a field of seedling onion, and B) air is funnelled through the slotted opening (red arrow) by a battery-operated vacuum and bioaerosol is deposited into microcentrifuge tubes (yellow arrow).
The process to extract DNA from the samples was initiated by dislodging the bioaerosol
from the inner surface of the tube walls and mechanically disrupting the samples as follows: 60
μL of C1 buffer from the DNeasy PowerSoil DNA Isolation Kit (Qiagen, Toronto) was added to
each collection tube and vortexed for 10 min, followed by three freeze–thaw cycles consisting of
2 min in liquid nitrogen followed by 2 min at 65 °C, with the final thaw extended to 30 min. The
contents of one PowerBead tube was transferred into each collection tube, followed by DNA
A) B)
125
extraction according to the manufacturer’s protocol. In the final step, the DNA was eluted into
50 µL of solution C6 from the DNeasy PowerSoil DNA Isolation Kit. DNA samples were kept
frozen at -80 °C. Nucleic acid concentration (ng μL-1) was quantified using the QIAxpert system
(Qiagen), which uses a microfluidic UV/VIS ratio absorption based on a spectrophotometer.
5.2.3 Primer design
Three primer and probe sets were designed for qPCR to target the internal transcribed spacer
(ITS), translational elongation factor EF-1 alpha (TEf-A), and cytochrome b (cytB) genes of
S. vesicarium. The primers and probes were designed using the free, on-line platform Benchling
(benchling.com) based on contigs derived from previous gene sequencing of local S. vesicarium
isolates (Foster et al., 2019). The specificity of the primers and probes was checked using the
Primer BLAST form to ensure that the primers would amplify S. vesicarium. The TaqManTM
probes incorporated a 5’ fluorescent reporter dye (FAM) and a 3’ nonfluorescent quencher
(NFQ-MGB). The quality of the primers and probes was confirmed using OligoAnalyzer
(www.idtdna.com/calc/analyzer) to predict whether the primers would form hairpins and ensure
that the melting temperatures were optimal. The glyceraldehyde-3-phosphate dehydrogenase
(gapdh) region was not selected because > 50% of the results yielded Alternaria species when
searching GenBank accessions using the Basic Local Alignment Search Tool (BLAST) for
primers (www.ncbi.nlm.nih.gov). The primers used by Sporometrics used a CAL Flour® Dye
(CAL-560) that was quenched with Black Hole Quencher® (BHQ). The final primer sequences
used for qPCR are listed in Table 5.1.
126
Table 5.1 Primers and probes used for quantitative PCR on DNA extracted from bioaerosol samples collected using a Burkard volumetric sampler in an onion field at the Holland Marsh, ON. ITS
Forward 5' TCGGTGAGGGCTCCAGCTTGTC 3' Probe 5’ [6-FAM] ACAACGGATCTCTTGGTTCTGGCA [NFQ-MGB] 3’
Reverse 5' ATTGTGCTGCGCTCCGAAACCA 3' TEf-A
Forward 5' TGCACGGTGCTAACAAGCCTCA 3' Probe 5' [6-FAM] CGAGCTCGGTAAGGGTTCCTTCA [NFQ-MGB] 3'
Reverse 5' TCGCGCTCAGCCTTCAACTTGT 3' cytB
Forward 5' GTAAGTTTGTATGTTCTTCCGTATG 3' Probe 5' [6-FAM] ACTGTAGCACCTCATAATGACATTTGCC [NFQ-MGB] 3'
Reverse 5’ CAAGGAATAGCACTCATAAGGTT 3’ Primer used by Sporometrics (ITS region)
Forward 5’ CCACCAGGACCAAACCATAAAC 3’ Probe 5’ [CAL-560] CGAATCTTTGAACGCACATTGCGCCCT [BHQ] 3’
Reverse 5’ GGTGTTGGGCGTCTTTGTCT 3’
5.2.4 Quantitative PCR assay
Quantitative PCR reactions were performed in a StepOnePlusTM Real-Time PCR System
(Applied Biosystems) using TaqMan fluorogenic probe detection at the University of Guelph
Genomics Facility. All reactions were performed in 0.1 mL MicroAmp® Fast 96-Well Reaction
Plates (Applied Biosystems) in a reaction volume of 20 μL containing 4 μL of DNA extract; 10
μL of TaqMan Universal PCR Mastermix (Applied BiosystemsTM, ThermoFisher Scientific), 2
μL of each primer, 0.2 μL of the corresponding probe, and 1.8 μL of PCR-grade sterile water.
The amplification and quantification conditions were an initial denaturation at 95 °C for 2 min,
followed by 40 cycles at 95 °C for 1 sec and annealing for 30 sec at 60 °C. Each qPCR reaction
included the samples, a no-template negative control, and was performed in technical triplicates.
Additionally, each plate contained a positive control of S. vesicarium conidia collected from
known cultures (isolates GB8_1, EX06, EO15, and FA01 mixed together) as raw 10-5 conidia
mL-1 spore suspension (DNA not extracted) to be used as an inter-run calibration control (one
per plate, n = 6).
5.2.5 Dilution series to establish qPCR standard curve
To produce conidia, S. vesicarium colonies (isolates GB8_1, EX06, EO15, and FA01) were
incubated at room temperature with 12 h UV light / 12 h dark. Conidia were harvested by
127
flooding the Petri dish with sterile water, gently scraping the colonies with a sterile scalpel, and
collecting the loosened conidia with a pipette. Mycelial fragments were filtered out using sterile
cheesecloth. The concentration of the spore suspension was adjusted to 1 ´ 105 spores mL-1 using
a haemocytometer. The spore suspension was portioned into 200 μL subsamples to be used for
qPCR and kept frozen at -20 °C until use. The DNA was extracted from these samples using the
same protocol as the bioaerosol samples. After DNA extraction, the DNA was diluted using 10-
fold serial dilutions to create DNA samples which represent 1´104, 1´103, 1´102, and 1´101
spores mL-1 samples. Fresh serial dilutions were made for each qPCR reaction. These samples
were used in each qPCR reaction plate to generate a standard curve. The Applied Biosystems
software calculated the slope of the standard curve samples (which should be between 90–110%)
and the coefficient of correlation (R2) value (values > 0.97 indicate good quality reactions). This
method cannot differentiate between conidia and ascospores, so the qPCR values of the standard
curves were used to determine the number of spores per collection tube. Each tube represented 6
h of sampling time per day. The number of spores per tube was converted to spores m-3 of air
(number of spores per collection tube ´ 1,000 L m-3) / (16.5 L min-1 ´ 60 min h-1 ´ 6 h).
5.2.6 Rotorod spore sampling
Rotating arm impactor spore samplers, trade name Rotorod samplers, have been used for routine
monitoring of Botrytis, Stemphylium, Peronospora, Alternaria, and Fusarium species at the
MCRS for many years. Bioaerosol was collected on a pair of 1.52 mm-wide polystyrene
collector rods rotated at ~2,400 rpm by a simple motor powered by a 12V battery from 06:00 am
to 12:00 pm on each sampling date in 2014, 2015, 2016, and 2020. The manufacturer states that
a single rod sampled air at 22.6 m-3 min-1; two rods were collected, resulting in a sampling
volume of 45.1 m-3 min-1. The leading edge of each rod was coated with a silicone grease
adhesive, which served to trap impacted particles. The Rotorod sampler was placed at canopy
height within an onion field at the MCRS (approx. 1.3 m).
For analysis, each rod was collected and mounted on a customized glass slide with an
appropriately sized groove to hold it in place, and spores were counted under a compound light
microscope by MCRS staff. The spores were identified to genus by a trained research assistant,
producing discrete count data for each genus.
128
5.2.7 Burkard tape sampler
A Burkard 7-day recording volumetric tape sampler (Burkard Manufacturing Co. Ltd.,
Rickmansworth, UK) was used to trap air-borne spores from 20 May–16 September 2015 (120
days), and 21 April–6 September 2016 (139 days) by C.S. Tayviah (2017). The design of this
Burkard tape was very similar to the Burkard multi-vial sampler, except that the opening orifice
of the sampler was lower (only 0.7 m above the soil), the sampling airflow rate was lower (10 L
min-1), and the sampler was operated 24 h day-1, 7 days a week. The spores were captured on a
clear cellophane tape coated with an adhesive mixture (50 mL petroleum jelly, 6 g paraffin, 0.6 g
phenol) mounted on a metal drum. The tape was changed weekly and 0.33-mm-long sections of
tape, representing 2-h intervals, were examined under a light microscope at 250 ´ magnification
to manually identify and count spores. The Burkard tape sampler was placed within an onion
field at the MCRS.
5.2.8 Disease assessment
SLB was evaluated every 7–14 days throughout the growing season in four assessment plots of
the unsprayed control in fungicide timing trials at the MCRS in 2018 and 2019, and in the
fungicide efficacy trial conducted at the MCRS in 2020, using the disease assessment methods
described in Chapter 4. The onion cultivars in these trials were LaSalle (2018), Fortress (2019),
and Traverse (2020). The plot set-up and size were as described in Chapter 4. The disease
incidence and severity (DSI) were plotted as disease progress curves for each year.
In addition, SLB incidence and leaf dieback data from the cultivar LaSalle from previous
research at this site conducted by C.S. Tayviah (2017) was included in this study to make the
analysis more robust and representative of the region. In the studies in 2015 and 2016, the
incidence and severity of SLB was evaluated every 7–14 days from 29 June–14 August 2015 and
11 July–11 August 2016 in an onion cultivar trial.
5.2.9 Weather data collection
Hourly air and soil temperature (°C), relative humidity (%), rainfall (mm), and leaf wetness (%)
were recorded using an Onset® automatic weather station (Onset Corporation, Bourne, MA)
placed at the MCRS near an onion field (Figure 5.3) and maintained by MCRS staff. Air
temperature and relative humidity (RH) were measured with a combined temperature and RH
sensor (Model: S-THB-M00x). Rainfall was measured with a rainfall smart sensor (Model: S-
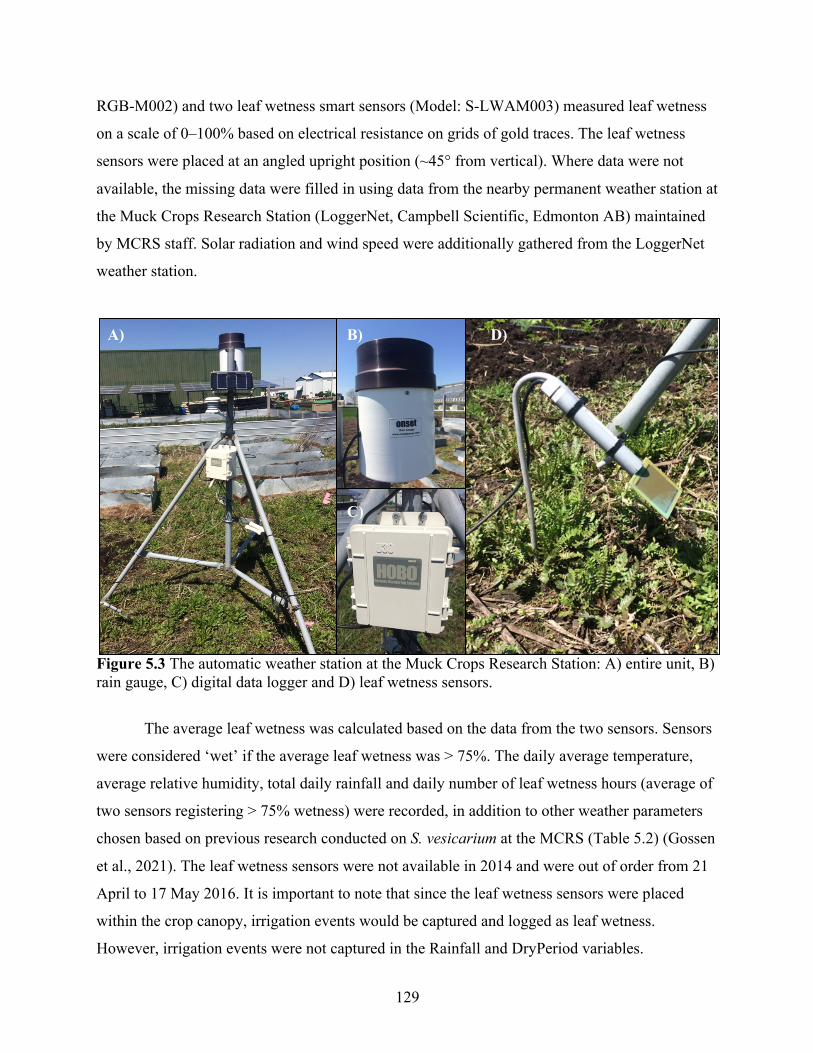
129
RGB-M002) and two leaf wetness smart sensors (Model: S-LWAM003) measured leaf wetness
on a scale of 0–100% based on electrical resistance on grids of gold traces. The leaf wetness
sensors were placed at an angled upright position (~45° from vertical). Where data were not
available, the missing data were filled in using data from the nearby permanent weather station at
the Muck Crops Research Station (LoggerNet, Campbell Scientific, Edmonton AB) maintained
by MCRS staff. Solar radiation and wind speed were additionally gathered from the LoggerNet
weather station.
Figure 5.3 The automatic weather station at the Muck Crops Research Station: A) entire unit, B) rain gauge, C) digital data logger and D) leaf wetness sensors.
The average leaf wetness was calculated based on the data from the two sensors. Sensors
were considered ‘wet’ if the average leaf wetness was > 75%. The daily average temperature,
average relative humidity, total daily rainfall and daily number of leaf wetness hours (average of
two sensors registering > 75% wetness) were recorded, in addition to other weather parameters
chosen based on previous research conducted on S. vesicarium at the MCRS (Table 5.2) (Gossen
et al., 2021). The leaf wetness sensors were not available in 2014 and were out of order from 21
April to 17 May 2016. It is important to note that since the leaf wetness sensors were placed
within the crop canopy, irrigation events would be captured and logged as leaf wetness.
However, irrigation events were not captured in the Rainfall and DryPeriod variables.
A) B) D)
C)
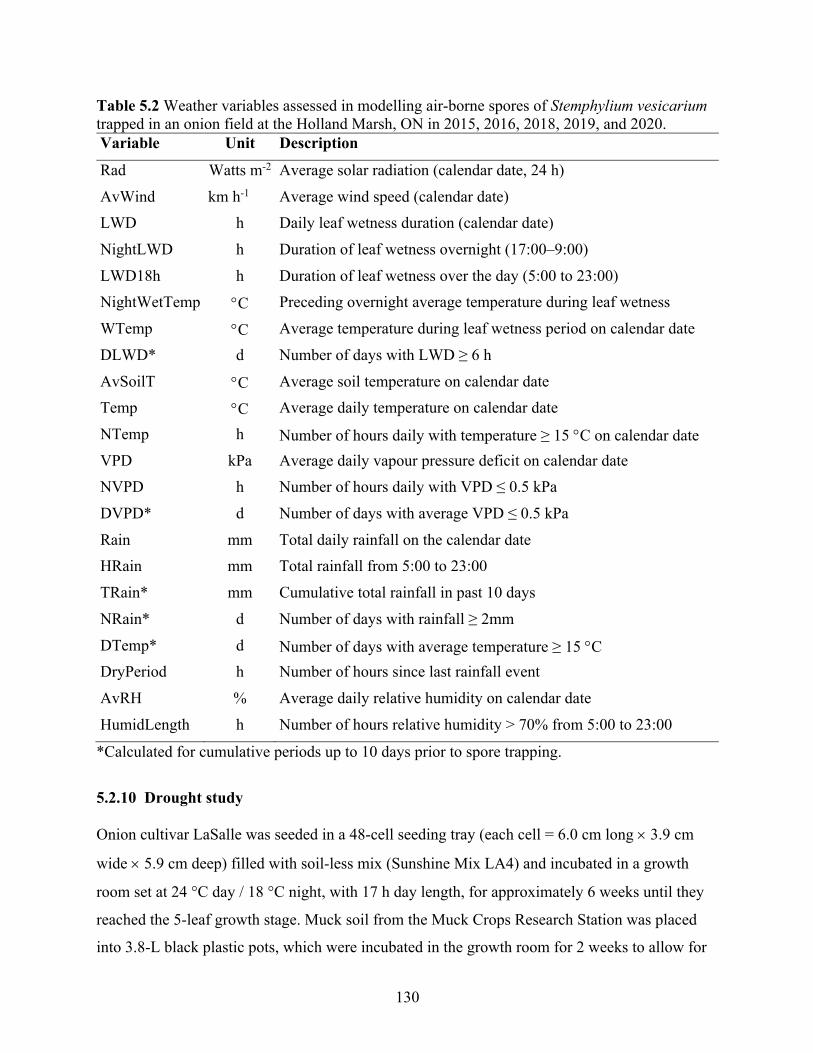
130
Table 5.2 Weather variables assessed in modelling air-borne spores of Stemphylium vesicarium trapped in an onion field at the Holland Marsh, ON in 2015, 2016, 2018, 2019, and 2020. Variable Unit Description
Rad Watts m-2 Average solar radiation (calendar date, 24 h)
AvWind km h-1 Average wind speed (calendar date) LWD h Daily leaf wetness duration (calendar date)
NightLWD h Duration of leaf wetness overnight (17:00–9:00)
LWD18h h Duration of leaf wetness over the day (5:00 to 23:00) NightWetTemp °C Preceding overnight average temperature during leaf wetness
WTemp °C Average temperature during leaf wetness period on calendar date
DLWD* d Number of days with LWD ≥ 6 h
AvSoilT °C Average soil temperature on calendar date Temp °C Average daily temperature on calendar date
NTemp h Number of hours daily with temperature ≥ 15 °C on calendar date VPD kPa Average daily vapour pressure deficit on calendar date NVPD h Number of hours daily with VPD ≤ 0.5 kPa
DVPD* d Number of days with average VPD ≤ 0.5 kPa
Rain mm Total daily rainfall on the calendar date HRain mm Total rainfall from 5:00 to 23:00
TRain* mm Cumulative total rainfall in past 10 days
NRain* d Number of days with rainfall ≥ 2mm
DTemp* d Number of days with average temperature ≥ 15 °C DryPeriod h Number of hours since last rainfall event
AvRH % Average daily relative humidity on calendar date
HumidLength h Number of hours relative humidity > 70% from 5:00 to 23:00
*Calculated for cumulative periods up to 10 days prior to spore trapping.
5.2.10 Drought study
Onion cultivar LaSalle was seeded in a 48-cell seeding tray (each cell = 6.0 cm long ´ 3.9 cm
wide ´ 5.9 cm deep) filled with soil-less mix (Sunshine Mix LA4) and incubated in a growth
room set at 24 °C day / 18 °C night, with 17 h day length, for approximately 6 weeks until they
reached the 5-leaf growth stage. Muck soil from the Muck Crops Research Station was placed
into 3.8-L black plastic pots, which were incubated in the growth room for 2 weeks to allow for
131
weed seedlings to be removed manually. Each pot filled with muck soil was watered to field
capacity and weighed before transplanting one onion into each pot. There were four treatments:
drought inoculated, drought non-inoculated, normal watering inoculated, normal watering non-
inoculated, with eight pots per treatments for a total of 32 pots. An additional eight plants were
grown so these could be destructively sampled to determine plant weight at a later date.
To determine the field capacity of the muck soil, five pots of muck soil were allowed to
air-dry until the weight no longer changed (42 days), and the soil was further oven-dried at 60 °C
for 4 days to determine the dry weight. This value was used to calculate the gravimetric soil
water content (GSWC) using the following formula:
GSWC = (S - D)
´ 100 D
where S = the weight of the soil and D = the mean dry weight of the same volume of soil after
oven drying. Previous research on muck soil from this site determined that the wilting point
occurred at 125% GSWC and field capacity occurred at 175% GSWC (Kora, 2004). Muck soil
can hold an astounding amount of water (385% GSWC near saturation) (Kora, 2004), so it was
important not to over-water the plants because it would take several days or weeks before the soil
would dry enough to simulate drought.
The pots were weighed and watered to 175% GSWC each day for 2 weeks prior to the
start of the drought treatment. Two weeks after transplanting, the pots were assigned into drought
or control treatment groups. The additional plants were destructively harvested and weighed after
removing as much soil from the roots as possible. The mean fresh weight of these eight plants
was subtracted from the sample weight in the GSWC calculation to account for the weight of the
plants when calculating how much water should be added. For the next 14 days, the drought
treatment was watered only enough to maintain the GSWC at 110% (below the wilting point)
and the control treatment was watered according to the previous watering schedule to maintain
field capacity. Each experimental unit consisted of one plant, and there were eight replicates
arranged in a randomized complete block design.
On the 14th day of the watering treatment, half the onions were inoculated, and the other
half were mock-inoculated as a control. The leaves of the inoculated plants were rubbed with
sterile cheesecloth and then sprayed with 2 mL of conidia suspension (~7×10⁴ conidia mL-1 plus
0.01% Tween 20) using a plastic hand spray bottle. The mock-inoculated treatment was rubbed
132
with cheesecloth and sprayed with water plus 0.01% Tween 20. The inoculated and mock-
inoculated treatments were sorted into two sub-plots on the bench to prevent cross-contamination
by leaf contact. The plants were moved to a separate growth chamber with 85% relative humidity
and misted for 30 sec every 30 min for 3 days.
After the 3-day incubation period, all of the treatments were maintained under optimal
watering conditions and assessed for SLB symptoms over the next 3 weeks. The oldest five
leaves (any leaf with > 5 cm green tissue remaining) for each plant were measured to assess total
length and length of tip-dieback or chlorosis using a clear plastic ruler. These data were used to
calculate percent chlorosis (chlorosis (%) = yellowed length / total length × 100%). The number
of dead leaves (naturally senesced on the soil surface) was also counted. The study was repeated.
5.2.11 Data analysis
Spore quantification using qPCR
Kendall’s tau-b (τb) was calculated using PROC CORR in SAS version 9.4 (SAS Institute, Cary,
USA) to test for a correlation between QIAxpert values and qPCR values. No significant
correlation was identified, so outliers of qPCR (higher or lower than 1.5´ interquartile range)
were removed, but the correlation was still not significant (Appendix 5.1).
The normality of the qPCR data was checked using PROC UNIVARIATE with and
without outliers (Appendix 5.2). The effect of individual qPCR reaction plates was assessed
using PROC GLIMMIX, with technical replicate as a random factor and qPCR plate as a fixed
factor (Appendix 5.3). This was run again sorted by year (Appendix 5.4). PROC CORR in SAS
was also used to test for a correlation between qPCR estimates (spores m-3) obtained by the
primer sets for three gene regions (TEf-A, cytB, and ITS). Pair-wise comparisons were made
between each primer (Appendix 5.5).
The assumption of normality of the Sporometrics and cytB qPCR data were assessed
using PROC UNIVARIATE, and then Kendall’s tau-b (τb) was calculated using PROC CORR
in SAS to test for a correlation between spores day-1 values from Sporometrics, cytB qPCR, and
Rotorod (Appendix 5.6). Where sampling dates did not overlap between the two methods under
comparison, the data were excluded. The analyses was assessed with and without removal of
outliers that had been identified using a scatterplot.
Spore concentration modeling
133
Air temperature, total rainfall, and spore counts (cytB spores m-3) were plotted to visually
assess relationships among spores detected and these major weather parameters. Pairwise
correlations among all weather variables were assessed using PROC CORR to create a
correlation matrix. The spore dataset included Rotorod samplers that had been manually counted
(variable names = Rotorod; 2014, 2015, 2016, 2020), a Burkard-type tape spore sampler with
sticky tape that was manually counted (Burkard tape; 2015, 2016 from Tayviah, 2017), and
estimates from cytB qPCR of samples from a Burkard bioaerosol sampler (cytB; 2018, 2019,
2020).
The cytB qPCR values were exponentially higher than the manual spore counts, so the
cytB values were scaled to produce a range similar to that of the manual counts based on the
season-long association between Rotorod spore counts and cytB qPCR estimates of samples
collected on the same date. In this study, the assumption was made that the efficiency of the cytB
qPCR data and the Rotorod sampling methods were equal. The qPCR data was scaled to the
same range as the Rotorod spore counts from the same date using a linear regression (n = 19).
The adjustment equation then applied to all other cytB qPCR estimates was as follows:
Adjusted spore amount = 1.016 + 0.00894´(cytB qPCR estimate)
Multiple stepwise regressions of the effect of weather variables pooled across 5 years on
spore estimates were conducted using PROG REG with an entry level of F = 0.15 and F = 0.10
to stay in the model (Appendix 5.7, Tayviah, 2017). The spore estimates were calculated as
spores per day in order to match the Spornado sampling method. In addition to the weather
variables listed in Table 5.2, the variables were also squared to assess quadratic relationships in
the regression analyses. The analysis was conducted with and without the squared variables, and
the R2 was used to identify the model with the best fit. Stepwise regression was also conducted
for each year individually to determine if certain variables were essential to the model across the
different growing seasons, and to assess the three different spore sampling methods separately.
Cumulative log regression was conducted using PROG LOGISTIC with the option
link = CLOGIT, with and without the squared variables (Appendix 5.8). This proportional odds
model required an ordinal response variable, so spore estimates / counts were as follows: 0 =
< 10 (few or no spores) and 1 ³ 10 spores (many spores). This model was conducted stepwise
with an entry level of F = 0.15 and F = 0.1 to stay in the model.
134
Regression tree analysis, also called classification tree analysis, was conducted using
PROC HPSPLIT with cross-validation using a random seed number of 124 and the option
CVMODELFIT to request a model assessment based on this cross-validation (Appendix 5.9).
The seed number is a random number for the random number generator to start cross-validation
of the model. The model was created using 10 folds, in which the data were divided randomly
into 10 sets and 10 trees are built using 9 training sets, using all but one-fold (the holdout fold)
that is used to calculate the average squared error for that tree. The final tree is grown from the
parameter that has the minimum cross-validated error. The trees were pruned to include only 4
leaves, which represented categories of low, medium, high, and very high spore concentrations.
The models created using stepwise regression, cumulative log regression, and regression
tree analysis, with and without the squared weather variables, with all years pooled or with each
year analyzed separately, were compared in an excel document. The actual spore counts /
estimates were graphed against the expected values from each model and graphed to examine
trends. The error rate was calculated using the following formula:
(Expected - Actual) / Actual ´ 100%
Controlled environment drought study
For the drought study, variance was partitioned into random effects (replicates nested
within repeated experiment) and fixed effects (treatment and inoculation) and analysed using
PROC GLIMMIX procedure of SAS. Each date was analysed separately to investigate disease
progress over time. Means were separated using Tukey’s honest significance test a P = 0.05
(Appendix 5.10). Additionally, the entire data set was analysed as a repeated measured analysis
with regression (Appendix 5.11). For each inoculation treatment (inoculated or non-inoculated),
PROC GLIMMIX was used to create orthogonal regression partitions using a dummy variable.
The covariance parameter estimates were used for the next step where regression coefficients
were estimated using PROC GLIMMIX and the ‘parms’ statement with the ‘noint’ option. The
regression model for each watering treatment was derived from the solutions for fixed effects
with Pr > |t| <0.05.
135
5.3 Results
5.3.1 Quantification of spore samples using Burkard multi-vial sampler and qPCR
The qPCR successfully amplified 132 samples for the cytB region primers, 129 samples for TEf-
A, and 51 samples for ITS for the bioaerosol samples collected using the Burkard multi-vial
sampler. When the inter-run calibration sample (containing 10-5 conidia mL-1) was compared
among reaction plates, runs from 2018 were much higher than runs from 2019 with the TEf-A
primer. When sorted by year, the reaction runs for each primer set individually were not
significantly different and thus could be compared with each other (Appendix 5.4). The
increased spore values in 2018 is likely due to higher disease pressure in 2018.
The data were not normally distributed, so a non-parametric rank correlation, Kendall’s
Tau-b (τb), was used instead of Pearson’s correlation. There was no correlation between DNA
quantification by QIAxpert and the qPCR values (Appendix 5.1). However, the estimates from
the three gene regions amplified by qPCR were correlated. There was a strong correlation
between cytB and TEf-A (τb = 0.84, P < 0.0001, n = 135), and a weaker correlation between cytB
and ITS (τb = 0.49, P < 0.0001, n = 56) and between TEf-A and ITS (τb = 0.49, P < 0.0001,
n = 56) (Appendix 5.5). The cytB region amplified the most samples (n = 132), so the qPCR
values from the cytB primer were used for subsequent analyses to assess the impact of weather
and SLB severity on spore numbers. Whether the low estimates from qPCR for early-season
sampling dates were due to poor DNA extraction or other human error is unknown. An internal
amplification control (Deora et al., 2015) could be used in future studies to account for false
negatives resulting from poor DNA extractions or PCR inhibition.
5.3.2 Comparison of spore sampling methods
Only 35 sampling dates were available for both the cytB qPCR from the Burkard multi-vial
sampler and the Spornado methods. From these samples, there was a weak positive correlation
(τb = 0.36, P < 0.01) between spore estimates from cytB qPCR and the Spornado cassettes
(analyzed by Sporometrics using ITS qPCR). When outliers were removed (one each of the
Sporometrics and cytB estimates), there was still a positive correlation (τb = 0.31, P = 0.02), but
the relationship was not strong (Appendix 5.6). The data were not normally distributed, so a non-
parametric analysis was conducted to compare the rank of the Sporometrics estimates and the
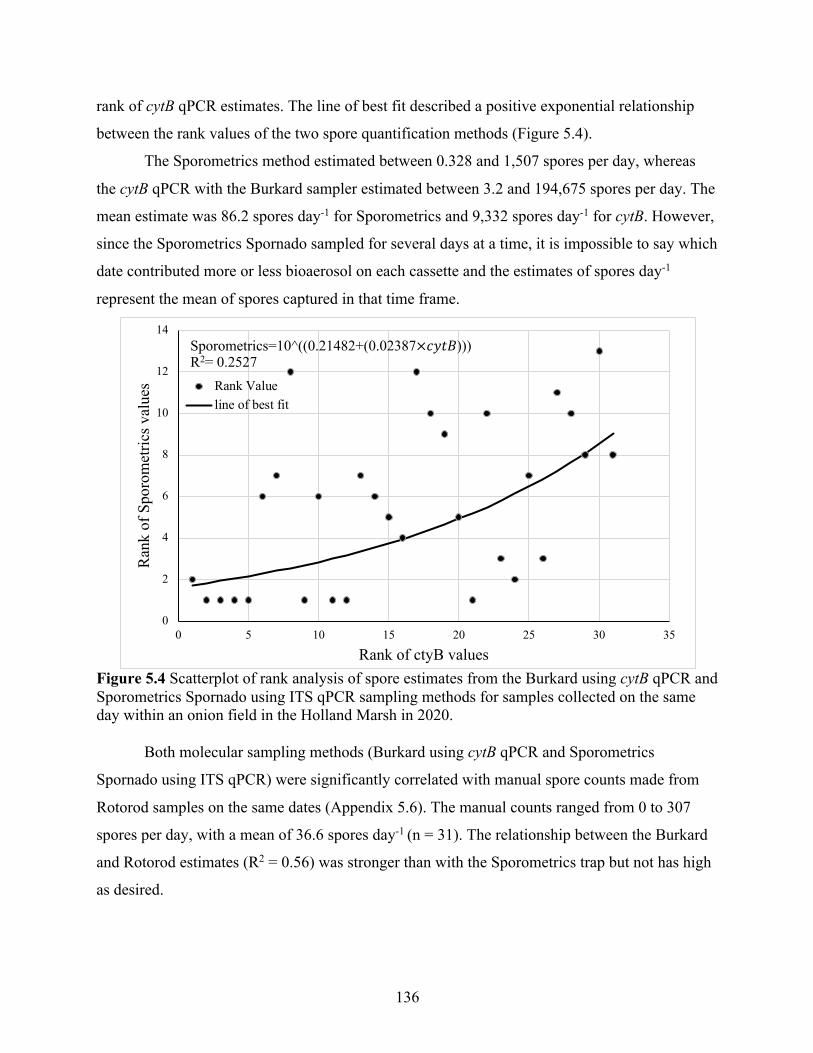
136
rank of cytB qPCR estimates. The line of best fit described a positive exponential relationship
between the rank values of the two spore quantification methods (Figure 5.4).
The Sporometrics method estimated between 0.328 and 1,507 spores per day, whereas
the cytB qPCR with the Burkard sampler estimated between 3.2 and 194,675 spores per day. The
mean estimate was 86.2 spores day-1 for Sporometrics and 9,332 spores day-1 for cytB. However,
since the Sporometrics Spornado sampled for several days at a time, it is impossible to say which
date contributed more or less bioaerosol on each cassette and the estimates of spores day-1
represent the mean of spores captured in that time frame.
Figure 5.4 Scatterplot of rank analysis of spore estimates from the Burkard using cytB qPCR and Sporometrics Spornado using ITS qPCR sampling methods for samples collected on the same day within an onion field in the Holland Marsh in 2020.
Both molecular sampling methods (Burkard using cytB qPCR and Sporometrics
Spornado using ITS qPCR) were significantly correlated with manual spore counts made from
Rotorod samples on the same dates (Appendix 5.6). The manual counts ranged from 0 to 307
spores per day, with a mean of 36.6 spores day-1 (n = 31). The relationship between the Burkard
and Rotorod estimates (R2 = 0.56) was stronger than with the Sporometrics trap but not has high
as desired.
0
2
4
6
8
10
12
14
0 5 10 15 20 25 30 35
Ran
k of
Spo
rom
etric
s val
ues
Rank of ctyB values
Rank Valueline of best fit
Sporometrics=10^((0.21482+(0.02387×𝑐𝑦𝑡𝐵)))R2= 0.2527
137
5.3.3 SLB severity and spore concentration
SLB incidence increased to nearly 100% in all 3 years, but severity differed among years.
Incidence, severity, and spore concentration using cytB qPCR increased during the growing
season, as expected for a foliar disease. The destructive sample at the end of the season counted
all of the leaves on the plant, as compared to the oldest three leaves in the other assessments, so
severity in that assessment was lower than the final in-field assessment in two of the three years
(Figure 5.5).

138
Figure 5.5 Stemphylium leaf blight (SLB) incidence and severity plotted with cytB qPCR estimates of air-borne spore quantity in 2018–2020. Extreme spore values at the top of the graph are (left to right): 2018) 2967, 2254, 7102, 4492, 25536, 2348, 2620, 6838, 62488, 59287; 2019) 2317; 2020) 4957, 32773, 4455.
0
200
400
600
800
1000
1200
1400
1600
1800
2000
0
10
20
30
40
50
60
70
80
90
100
150 160 170 180 190 200 210 220 230 240 250
Spor
e co
ncen
rtatio
n (s
pore
s m-3
)
SLB
Inci
denc
e (%
) & se
verit
y (D
SI) 2018
DSIIncidencecytBline of best fit
log10(y) = -4.31778 + 0.03190 xR2= 0.3315
30 May 9 Jun 19 Jun 19 Jun 9 Jul 19 Jul 29 Jul 8 Aug 18 Aug 28 Aug 7 Sept
0
200
400
600
800
1000
1200
1400
1600
1800
2000
0
10
20
30
40
50
60
70
80
90
100
150 160 170 180 190 200 210 220 230 240 250
Spor
e co
ncen
tratio
n (s
pore
s m-3
)
SLB
Inci
denc
e (%
) & se
verit
y (D
SI) 2019
y = 10148 - 113.27456x + 0.31610x2R2= 0.3740
May 30 Jun 9 Jun 19 Jun 29 Jul 9 Jul 19 Jul 29 Aug 8 Aug 18 Aug 28 Sept 7
0200400
6008001000
120014001600
18002000
01020
304050
607080
90100
150 160 170 180 190 200 210 220 230 240 250
Spor
e co
ncen
tratio
n (s
pore
s m-3
)
SLB
Inci
denc
e (%
)& se
verit
y (D
SI)
Date
2020log10(y) = 12.9-0.14x+0.0004x2R2= 0.4411
20 May 8 Jun 18 Jun 28 Jun 8 Jul 18 Jul 28 Jul 7 Aug 17 Aug 27 Aug 6 Sept
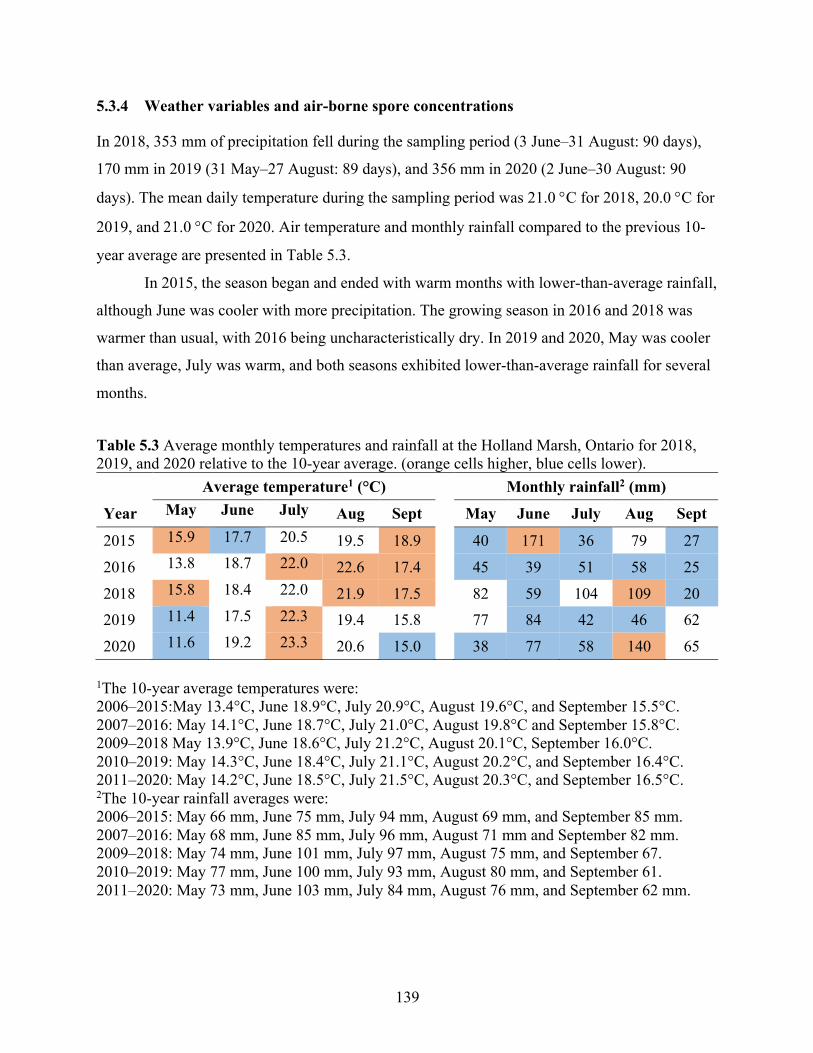
139
5.3.4 Weather variables and air-borne spore concentrations
In 2018, 353 mm of precipitation fell during the sampling period (3 June–31 August: 90 days),
170 mm in 2019 (31 May–27 August: 89 days), and 356 mm in 2020 (2 June–30 August: 90
days). The mean daily temperature during the sampling period was 21.0 °C for 2018, 20.0 °C for
2019, and 21.0 °C for 2020. Air temperature and monthly rainfall compared to the previous 10-
year average are presented in Table 5.3.
In 2015, the season began and ended with warm months with lower-than-average rainfall,
although June was cooler with more precipitation. The growing season in 2016 and 2018 was
warmer than usual, with 2016 being uncharacteristically dry. In 2019 and 2020, May was cooler
than average, July was warm, and both seasons exhibited lower-than-average rainfall for several
months.
Table 5.3 Average monthly temperatures and rainfall at the Holland Marsh, Ontario for 2018, 2019, and 2020 relative to the 10-year average. (orange cells higher, blue cells lower). Average temperature1 (°C) Monthly rainfall2 (mm)
Year May June July Aug Sept May June July Aug Sept
2015 15.9 17.7 20.5 19.5 18.9 40 171 36 79 27
2016 13.8 18.7 22.0 22.6 17.4 45 39 51 58 25
2018 15.8 18.4 22.0 21.9 17.5 82 59 104 109 20 2019 11.4 17.5 22.3 19.4 15.8 77 84 42 46 62
2020 11.6 19.2 23.3 20.6 15.0 38 77 58 140 65
1The 10-year average temperatures were: 2006–2015:May 13.4°C, June 18.9°C, July 20.9°C, August 19.6°C, and September 15.5°C. 2007–2016: May 14.1°C, June 18.7°C, July 21.0°C, August 19.8°C and September 15.8°C. 2009–2018 May 13.9°C, June 18.6°C, July 21.2°C, August 20.1°C, September 16.0°C. 2010–2019: May 14.3°C, June 18.4°C, July 21.1°C, August 20.2°C, and September 16.4°C. 2011–2020: May 14.2°C, June 18.5°C, July 21.5°C, August 20.3°C, and September 16.5°C. 2The 10-year rainfall averages were: 2006–2015: May 66 mm, June 75 mm, July 94 mm, August 69 mm, and September 85 mm. 2007–2016: May 68 mm, June 85 mm, July 96 mm, August 71 mm and September 82 mm. 2009–2018: May 74 mm, June 101 mm, July 97 mm, August 75 mm, and September 67. 2010–2019: May 77 mm, June 100 mm, July 93 mm, August 80 mm, and September 61. 2011–2020: May 73 mm, June 103 mm, July 84 mm, August 76 mm, and September 62 mm.
140
Spores of S. vesicarium were captured throughout the season in all 3 years, but the
concentrations differed substantially. The average daily conidia concentration estimates were
59,287 spores m-3 in 2018, 2,317 spores m-3 in 2019, and 32,773 spores m-3 in 2020 with cytB
qPCR. Spikes in spore concentrations did not consistently correspond with precipitation events
or temperature fluctuations (Figure 5.6).
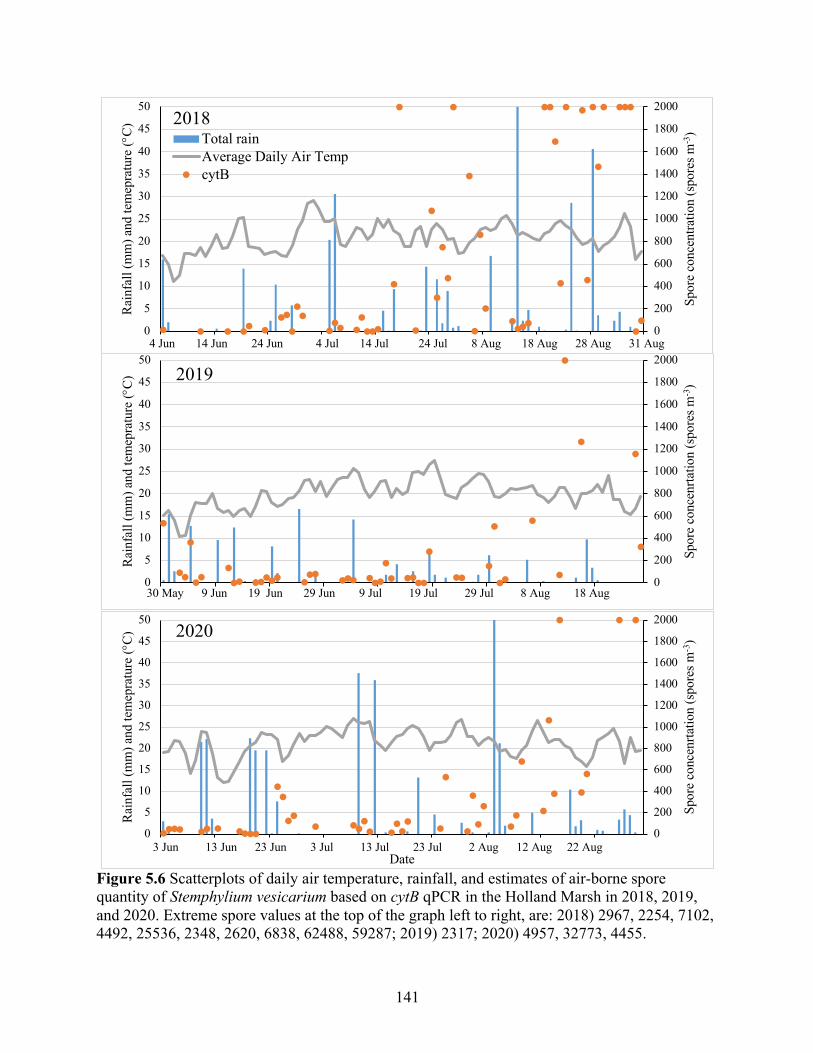
141
Figure 5.6 Scatterplots of daily air temperature, rainfall, and estimates of air-borne spore quantity of Stemphylium vesicarium based on cytB qPCR in the Holland Marsh in 2018, 2019, and 2020. Extreme spore values at the top of the graph left to right, are: 2018) 2967, 2254, 7102, 4492, 25536, 2348, 2620, 6838, 62488, 59287; 2019) 2317; 2020) 4957, 32773, 4455.
0
200
400
600
800
1000
1200
1400
1600
1800
2000
0
5
10
15
20
25
30
35
40
45
50
Spor
e co
ncen
rtatio
n (s
pore
s m-3
)
Rain
fall
(mm
) and
tem
epra
ture
(°C)
2019
30 May 9 Jun 19 Jun 29 Jun 9 Jul 19 Jul 29 Jul 8 Aug 18 Aug
0
200
400
600
800
1000
1200
1400
1600
1800
2000
0
5
10
15
20
25
30
35
40
45
50
155 160 165 170 175 180 185 190 195 200 205 210 215 220 225 230 235 240
Spor
e co
ncen
tratio
n (s
pore
s m-3
)
Rain
fall
(mm
) and
tem
epra
ture
(°C)
2018Total rainAverage Daily Air TempcytB
4 Jun 14 Jun 24 Jun 4 Jul 14 Jul 24 Jul 8 Aug 18 Aug 28 Aug 31 Aug
0
200
400
600
800
1000
1200
1400
1600
1800
2000
0
5
10
15
20
25
30
35
40
45
50
155 160 165 170 175 180 185 190 195 200 205 210 215 220 225 230 235 240
Spor
e co
ncen
rtatio
n (s
pore
s m-3
)
Rain
fall
(mm
) and
tem
epra
ture
(°C)
Date
2020
3 Jun 13 Jun 23 Jun 3 Jul 13 Jul 23 Jul 2 Aug 12 Aug 22 Aug
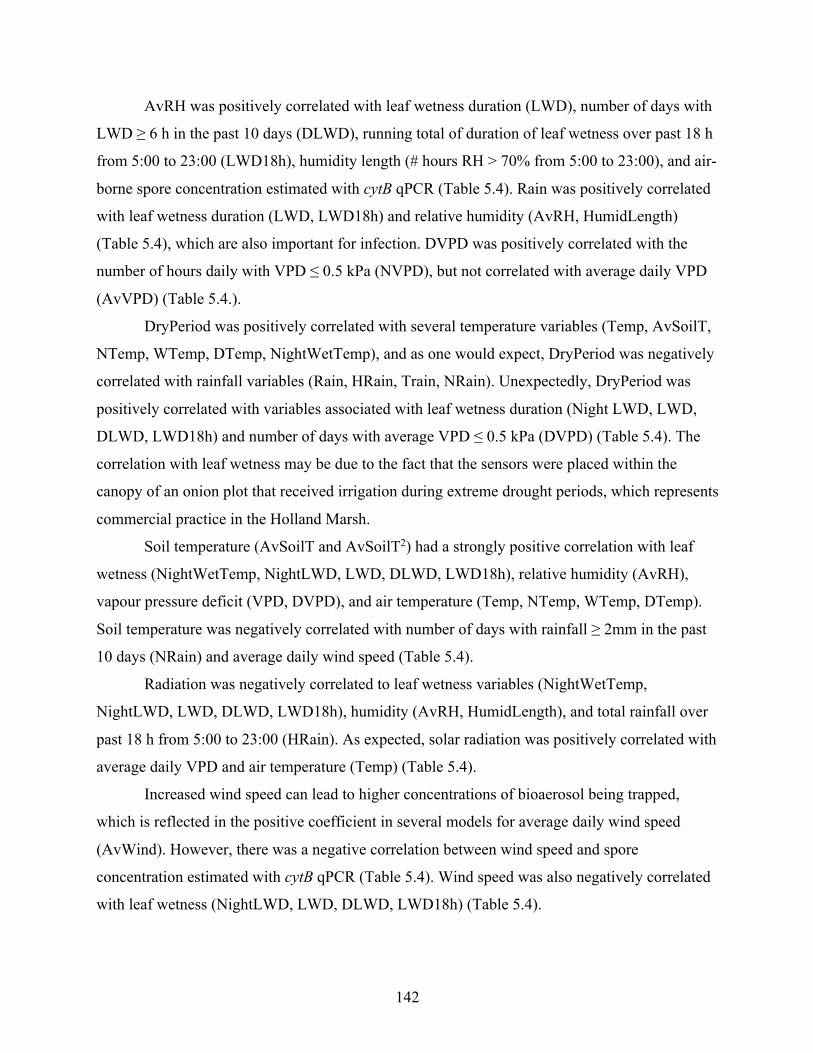
142
AvRH was positively correlated with leaf wetness duration (LWD), number of days with
LWD ≥ 6 h in the past 10 days (DLWD), running total of duration of leaf wetness over past 18 h
from 5:00 to 23:00 (LWD18h), humidity length (# hours RH > 70% from 5:00 to 23:00), and air-
borne spore concentration estimated with cytB qPCR (Table 5.4). Rain was positively correlated
with leaf wetness duration (LWD, LWD18h) and relative humidity (AvRH, HumidLength)
(Table 5.4), which are also important for infection. DVPD was positively correlated with the
number of hours daily with VPD ≤ 0.5 kPa (NVPD), but not correlated with average daily VPD
(AvVPD) (Table 5.4.).
DryPeriod was positively correlated with several temperature variables (Temp, AvSoilT,
NTemp, WTemp, DTemp, NightWetTemp), and as one would expect, DryPeriod was negatively
correlated with rainfall variables (Rain, HRain, Train, NRain). Unexpectedly, DryPeriod was
positively correlated with variables associated with leaf wetness duration (Night LWD, LWD,
DLWD, LWD18h) and number of days with average VPD ≤ 0.5 kPa (DVPD) (Table 5.4). The
correlation with leaf wetness may be due to the fact that the sensors were placed within the
canopy of an onion plot that received irrigation during extreme drought periods, which represents
commercial practice in the Holland Marsh.
Soil temperature (AvSoilT and AvSoilT2) had a strongly positive correlation with leaf
wetness (NightWetTemp, NightLWD, LWD, DLWD, LWD18h), relative humidity (AvRH),
vapour pressure deficit (VPD, DVPD), and air temperature (Temp, NTemp, WTemp, DTemp).
Soil temperature was negatively correlated with number of days with rainfall ≥ 2mm in the past
10 days (NRain) and average daily wind speed (Table 5.4).
Radiation was negatively correlated to leaf wetness variables (NightWetTemp,
NightLWD, LWD, DLWD, LWD18h), humidity (AvRH, HumidLength), and total rainfall over
past 18 h from 5:00 to 23:00 (HRain). As expected, solar radiation was positively correlated with
average daily VPD and air temperature (Temp) (Table 5.4).
Increased wind speed can lead to higher concentrations of bioaerosol being trapped,
which is reflected in the positive coefficient in several models for average daily wind speed
(AvWind). However, there was a negative correlation between wind speed and spore
concentration estimated with cytB qPCR (Table 5.4). Wind speed was also negatively correlated
with leaf wetness (NightLWD, LWD, DLWD, LWD18h) (Table 5.4).
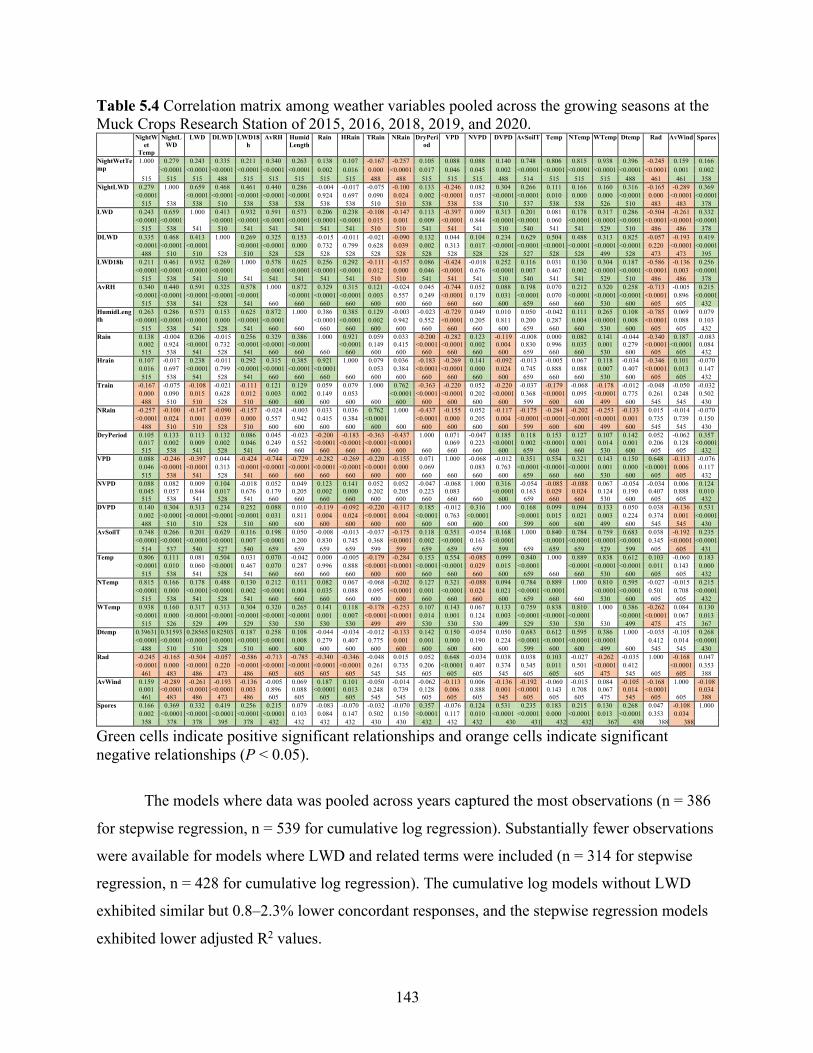
143
Table 5.4 Correlation matrix among weather variables pooled across the growing seasons at the Muck Crops Research Station of 2015, 2016, 2018, 2019, and 2020. NightW
et Temp
NightLWD
LWD DLWD LWD18h
AvRH Humid Length
Rain HRain TRain NRain DryPeriod
VPD NVPD DVPD AvSoilT Temp NTemp WTemp Dtemp Rad AvWind Spores
NightWetTemp
1.000 0.279 0.243 0.335 0.211 0.340 0.263 0.138 0.107 -0.167 -0.257 0.105 0.088 0.088 0.140 0.748 0.806 0.815 0.938 0.396 -0.245 0.159 0.166 <0.0001 <0.0001 <0.0001 <0.0001 <0.0001 <0.0001 0.002 0.016 0.000 <0.0001 0.017 0.046 0.045 0.002 <0.0001 <0.0001 <0.0001 <0.0001 <0.0001 <0.0001 0.001 0.002
515 515 515 488 515 515 515 515 515 488 488 515 515 515 488 514 515 515 515 488 461 461 358 NightLWD 0.279 1.000 0.659 0.468 0.461 0.440 0.286 -0.004 -0.017 -0.075 -0.100 0.133 -0.246 0.082 0.304 0.266 0.111 0.166 0.160 0.316 -0.165 -0.289 0.369
<0.0001
<0.0001 <0.0001 <0.0001 <0.0001 <0.0001 0.924 0.697 0.090 0.024 0.002 <0.0001 0.057 <0.0001 <0.0001 0.010 0.000 0.000 <0.0001 0.000 <0.0001 <0.0001 515 538 538 510 538 538 538 538 538 510 510 538 538 538 510 537 538 538 526 510 483 483 378
LWD 0.243 0.659 1.000 0.413 0.932 0.591 0.573 0.206 0.238 -0.108 -0.147 0.113 -0.397 0.009 0.313 0.201 0.081 0.178 0.317 0.286 -0.504 -0.261 0.332 <0.0001 <0.0001
<0.0001 <0.0001 <0.0001 <0.0001 <0.0001 <0.0001 0.015 0.001 0.009 <0.0001 0.844 <0.0001 <0.0001 0.060 <0.0001 <0.0001 <0.0001 <0.0001 <0.0001 <0.0001
515 538 541 510 541 541 541 541 541 510 510 541 541 541 510 540 541 541 529 510 486 486 378 DLWD 0.335 0.468 0.413 1.000 0.269 0.325 0.153 -0.015 -0.011 -0.021 -0.090 0.132 0.044 0.104 0.234 0.629 0.504 0.488 0.313 0.825 -0.057 -0.193 0.419
<0.0001 <0.0001 <0.0001
<0.0001 <0.0001 0.000 0.732 0.799 0.628 0.039 0.002 0.313 0.017 <0.0001 <0.0001 <0.0001 <0.0001 <0.0001 <0.0001 0.220 <0.0001 <0.0001 488 510 510 528 510 528 528 528 528 528 528 528 528 528 528 527 528 528 499 528 473 473 395
LWD18h 0.211 0.461 0.932 0.269 1.000 0.578 0.625 0.256 0.292 -0.111 -0.157 0.086 -0.424 -0.018 0.252 0.116 0.031 0.130 0.304 0.187 -0.586 -0.136 0.256 <0.0001 <0.0001 <0.0001 <0.0001
<0.0001 <0.0001 <0.0001 <0.0001 0.012 0.000 0.046 <0.0001 0.676 <0.0001 0.007 0.467 0.002 <0.0001 <0.0001 <0.0001 0.003 <0.0001
515 538 541 510 541 541 541 541 541 510 510 541 541 541 510 540 541 541 529 510 486 486 378 AvRH 0.340 0.440 0.591 0.325 0.578 1.000 0.872 0.329 0.315 0.121 -0.024 0.045 -0.744 0.052 0.088 0.198 0.070 0.212 0.320 0.258 -0.713 -0.005 0.215
<0.0001 <0.0001 <0.0001 <0.0001 <0.0001
<0.0001 <0.0001 <0.0001 0.003 0.557 0.249 <0.0001 0.179 0.031 <0.0001 0.070 <0.0001 <0.0001 <0.0001 <0.0001 0.896 <0.0001 515 538 541 528 541 660 660 660 660 600 600 660 660 660 600 659 660 660 530 600 605 605 432
HumidLength
0.263 0.286 0.573 0.153 0.625 0.872 1.000 0.386 0.385 0.129 -0.003 -0.023 -0.729 0.049 0.010 0.050 -0.042 0.111 0.265 0.108 -0.785 0.069 0.079 <0.0001 <0.0001 <0.0001 0.000 <0.0001 <0.0001
<0.0001 <0.0001 0.002 0.942 0.552 <0.0001 0.205 0.811 0.200 0.287 0.004 <0.0001 0.008 <0.0001 0.088 0.103
515 538 541 528 541 660 660 660 660 600 600 660 660 660 600 659 660 660 530 600 605 605 432 Rain 0.138 -0.004 0.206 -0.015 0.256 0.329 0.386 1.000 0.921 0.059 0.033 -0.200 -0.282 0.123 -0.119 -0.008 0.000 0.082 0.141 -0.044 -0.340 0.187 -0.083
0.002 0.924 <0.0001 0.732 <0.0001 <0.0001 <0.0001
<0.0001 0.149 0.415 <0.0001 <0.0001 0.002 0.004 0.830 0.996 0.035 0.001 0.279 <0.0001 <0.0001 0.084 515 538 541 528 541 660 660 660 660 600 600 660 660 660 600 659 660 660 530 600 605 605 432
Hrain 0.107 -0.017 0.238 -0.011 0.292 0.315 0.385 0.921 1.000 0.079 0.036 -0.183 -0.269 0.141 -0.092 -0.013 -0.005 0.067 0.118 -0.034 -0.346 0.101 -0.070 0.016 0.697 <0.0001 0.799 <0.0001 <0.0001 <0.0001 <0.0001
0.053 0.384 <0.0001 <0.0001 0.000 0.024 0.745 0.888 0.088 0.007 0.407 <0.0001 0.013 0.147
515 538 541 528 541 660 660 660 660 600 600 660 660 660 600 659 660 660 530 600 605 605 432 Train -0.167 -0.075 -0.108 -0.021 -0.111 0.121 0.129 0.059 0.079 1.000 0.762 -0.363 -0.220 0.052 -0.220 -0.037 -0.179 -0.068 -0.178 -0.012 -0.048 -0.050 -0.032
0.000 0.090 0.015 0.628 0.012 0.003 0.002 0.149 0.053
<0.0001 <0.0001 <0.0001 0.202 <0.0001 0.368 <0.0001 0.095 <0.0001 0.775 0.261 0.248 0.502 488 510 510 528 510 600 600 600 600 600 600 600 600 600 600 599 600 600 499 600 545 545 430
NRain -0.257 -0.100 -0.147 -0.090 -0.157 -0.024 -0.003 0.033 0.036 0.762 1.000 -0.437 -0.155 0.052 -0.117 -0.175 -0.284 -0.202 -0.253 -0.133 0.015 -0.014 -0.070 <0.0001 0.024 0.001 0.039 0.000 0.557 0.942 0.415 0.384 <0.0001
<0.0001 0.000 0.205 0.004 <0.0001 <0.0001 <0.0001 <0.0001 0.001 0.735 0.739 0.150
488 510 510 528 510 600 600 600 600 600 600 600 600 600 600 599 600 600 499 600 545 545 430 DryPeriod 0.105 0.133 0.113 0.132 0.086 0.045 -0.023 -0.200 -0.183 -0.363 -0.437 1.000 0.071 -0.047 0.185 0.118 0.153 0.127 0.107 0.142 0.052 -0.062 0.357
0.017 0.002 0.009 0.002 0.046 0.249 0.552 <0.0001 <0.0001 <0.0001 <0.0001
0.069 0.223 <0.0001 0.002 <0.0001 0.001 0.014 0.001 0.206 0.128 <0.0001 515 538 541 528 541 660 660 660 660 600 600 660 660 660 600 659 660 660 530 600 605 605 432
VPD 0.088 -0.246 -0.397 0.044 -0.424 -0.744 -0.729 -0.282 -0.269 -0.220 -0.155 0.071 1.000 -0.068 -0.012 0.351 0.554 0.321 0.143 0.150 0.648 -0.113 -0.076 0.046 <0.0001 <0.0001 0.313 <0.0001 <0.0001 <0.0001 <0.0001 <0.0001 <0.0001 0.000 0.069
0.083 0.763 <0.0001 <0.0001 <0.0001 0.001 0.000 <0.0001 0.006 0.117
515 538 541 528 541 660 660 660 660 600 600 660 660 660 600 659 660 660 530 600 605 605 432 NVPD 0.088 0.082 0.009 0.104 -0.018 0.052 0.049 0.123 0.141 0.052 0.052 -0.047 -0.068 1.000 0.316 -0.054 -0.085 -0.088 0.067 -0.054 -0.034 0.006 0.124
0.045 0.057 0.844 0.017 0.676 0.179 0.205 0.002 0.000 0.202 0.205 0.223 0.083
<0.0001 0.163 0.029 0.024 0.124 0.190 0.407 0.888 0.010 515 538 541 528 541 660 660 660 660 600 600 660 660 660 600 659 660 660 530 600 605 605 432
DVPD 0.140 0.304 0.313 0.234 0.252 0.088 0.010 -0.119 -0.092 -0.220 -0.117 0.185 -0.012 0.316 1.000 0.168 0.099 0.094 0.133 0.050 0.038 -0.136 0.531 0.002 <0.0001 <0.0001 <0.0001 <0.0001 0.031 0.811 0.004 0.024 <0.0001 0.004 <0.0001 0.763 <0.0001
<0.0001 0.015 0.021 0.003 0.224 0.374 0.001 <0.0001
488 510 510 528 510 600 600 600 600 600 600 600 600 600 600 599 600 600 499 600 545 545 430 AvSoilT 0.748 0.266 0.201 0.629 0.116 0.198 0.050 -0.008 -0.013 -0.037 -0.175 0.118 0.351 -0.054 0.168 1.000 0.840 0.784 0.759 0.683 0.038 -0.192 0.235
<0.0001 <0.0001 <0.0001 <0.0001 0.007 <0.0001 0.200 0.830 0.745 0.368 <0.0001 0.002 <0.0001 0.163 <0.0001
<0.0001 <0.0001 <0.0001 <0.0001 0.345 <0.0001 <0.0001 514 537 540 527 540 659 659 659 659 599 599 659 659 659 599 659 659 659 529 599 605 605 431
Temp 0.806 0.111 0.081 0.504 0.031 0.070 -0.042 0.000 -0.005 -0.179 -0.284 0.153 0.554 -0.085 0.099 0.840 1.000 0.889 0.838 0.612 0.103 -0.060 0.183 <0.0001 0.010 0.060 <0.0001 0.467 0.070 0.287 0.996 0.888 <0.0001 <0.0001 <0.0001 <0.0001 0.029 0.015 <0.0001
<0.0001 <0.0001 <0.0001 0.011 0.143 0.000
515 538 541 528 541 660 660 660 660 600 600 660 660 660 600 659 660 660 530 600 605 605 432 NTemp 0.815 0.166 0.178 0.488 0.130 0.212 0.111 0.082 0.067 -0.068 -0.202 0.127 0.321 -0.088 0.094 0.784 0.889 1.000 0.810 0.595 -0.027 -0.015 0.215
<0.0001 0.000 <0.0001 <0.0001 0.002 <0.0001 0.004 0.035 0.088 0.095 <0.0001 0.001 <0.0001 0.024 0.021 <0.0001 <0.0001
<0.0001 <0.0001 0.501 0.708 <0.0001 515 538 541 528 541 660 660 660 660 600 600 660 660 660 600 659 660 660 530 600 605 605 432
WTemp 0.938 0.160 0.317 0.313 0.304 0.320 0.265 0.141 0.118 -0.178 -0.253 0.107 0.143 0.067 0.133 0.759 0.838 0.810 1.000 0.386 -0.262 0.084 0.130 <0.0001 0.000 <0.0001 <0.0001 <0.0001 <0.0001 <0.0001 0.001 0.007 <0.0001 <0.0001 0.014 0.001 0.124 0.003 <0.0001 <0.0001 <0.0001
<0.0001 <0.0001 0.067 0.013
515 526 529 499 529 530 530 530 530 499 499 530 530 530 499 529 530 530 530 499 475 475 367 Dtemp 0.39631 0.31593 0.28565 0.82503 0.187 0.258 0.108 -0.044 -0.034 -0.012 -0.133 0.142 0.150 -0.054 0.050 0.683 0.612 0.595 0.386 1.000 -0.035 -0.105 0.268
<0.0001 <0.0001 <0.0001 <0.0001 <0.0001 <0.0001 0.008 0.279 0.407 0.775 0.001 0.001 0.000 0.190 0.224 <0.0001 <0.0001 <0.0001 <0.0001
0.412 0.014 <0.0001 488 510 510 528 510 600 600 600 600 600 600 600 600 600 600 599 600 600 499 600 545 545 430
Rad -0.245 -0.165 -0.504 -0.057 -0.586 -0.713 -0.785 -0.340 -0.346 -0.048 0.015 0.052 0.648 -0.034 0.038 0.038 0.103 -0.027 -0.262 -0.035 1.000 -0.168 0.047 <0.0001 0.000 <0.0001 0.220 <0.0001 <0.0001 <0.0001 <0.0001 <0.0001 0.261 0.735 0.206 <0.0001 0.407 0.374 0.345 0.011 0.501 <0.0001 0.412
<0.0001 0.353
461 483 486 473 486 605 605 605 605 545 545 605 605 605 545 605 605 605 475 545 605 605 388 AvWind 0.159 -0.289 -0.261 -0.193 -0.136 -0.005 0.069 0.187 0.101 -0.050 -0.014 -0.062 -0.113 0.006 -0.136 -0.192 -0.060 -0.015 0.084 -0.105 -0.168 1.000 -0.108
0.001 <0.0001 <0.0001 <0.0001 0.003 0.896 0.088 <0.0001 0.013 0.248 0.739 0.128 0.006 0.888 0.001 <0.0001 0.143 0.708 0.067 0.014 <0.0001
0.034 461 483 486 473 486 605 605 605 605 545 545 605 605 605 545 605 605 605 475 545 605 605 388
Spores 0.166 0.369 0.332 0.419 0.256 0.215 0.079 -0.083 -0.070 -0.032 -0.070 0.357 -0.076 0.124 0.531 0.235 0.183 0.215 0.130 0.268 0.047 -0.108 1.000 0.002 <0.0001 <0.0001 <0.0001 <0.0001 <0.0001 0.103 0.084 0.147 0.502 0.150 <0.0001 0.117 0.010 <0.0001 <0.0001 0.000 <0.0001 0.013 <0.0001 0.353 0.034
358 378 378 395 378 432 432 432 432 430 430 432 432 432 430 431 432 432 367 430 388 388
Green cells indicate positive significant relationships and orange cells indicate significant negative relationships (P < 0.05).
The models where data was pooled across years captured the most observations (n = 386
for stepwise regression, n = 539 for cumulative log regression). Substantially fewer observations
were available for models where LWD and related terms were included (n = 314 for stepwise
regression, n = 428 for cumulative log regression). The cumulative log models without LWD
exhibited similar but 0.8–2.3% lower concordant responses, and the stepwise regression models
exhibited lower adjusted R2 values.
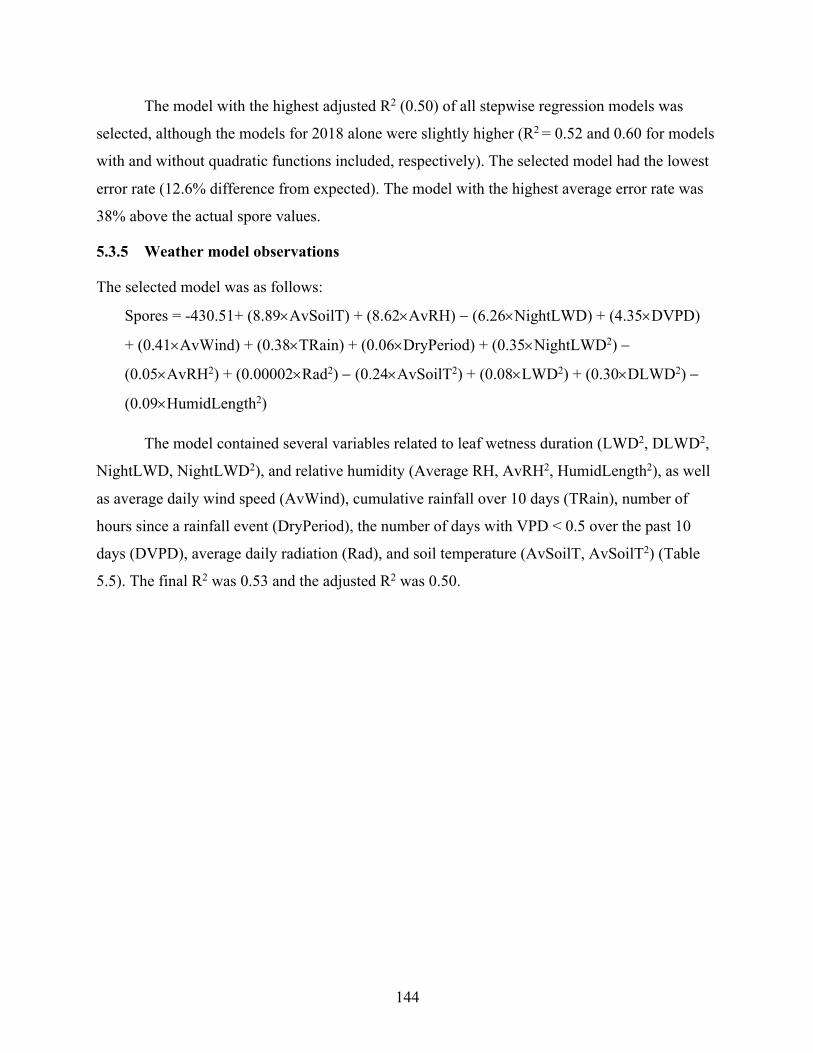
144
The model with the highest adjusted R2 (0.50) of all stepwise regression models was
selected, although the models for 2018 alone were slightly higher (R2 = 0.52 and 0.60 for models
with and without quadratic functions included, respectively). The selected model had the lowest
error rate (12.6% difference from expected). The model with the highest average error rate was
38% above the actual spore values.
5.3.5 Weather model observations
The selected model was as follows:
Spores = -430.51+ (8.89´AvSoilT) + (8.62´AvRH) - (6.26´NightLWD) + (4.35´DVPD)
+ (0.41´AvWind) + (0.38´TRain) + (0.06´DryPeriod) + (0.35´NightLWD2) -
(0.05´AvRH2) + (0.00002´Rad2) - (0.24´AvSoilT2) + (0.08´LWD2) + (0.30´DLWD2) -
(0.09´HumidLength2)
The model contained several variables related to leaf wetness duration (LWD2, DLWD2,
NightLWD, NightLWD2), and relative humidity (Average RH, AvRH2, HumidLength2), as well
as average daily wind speed (AvWind), cumulative rainfall over 10 days (TRain), number of
hours since a rainfall event (DryPeriod), the number of days with VPD < 0.5 over the past 10
days (DVPD), average daily radiation (Rad), and soil temperature (AvSoilT, AvSoilT2) (Table
5.5). The final R2 was 0.53 and the adjusted R2 was 0.50.
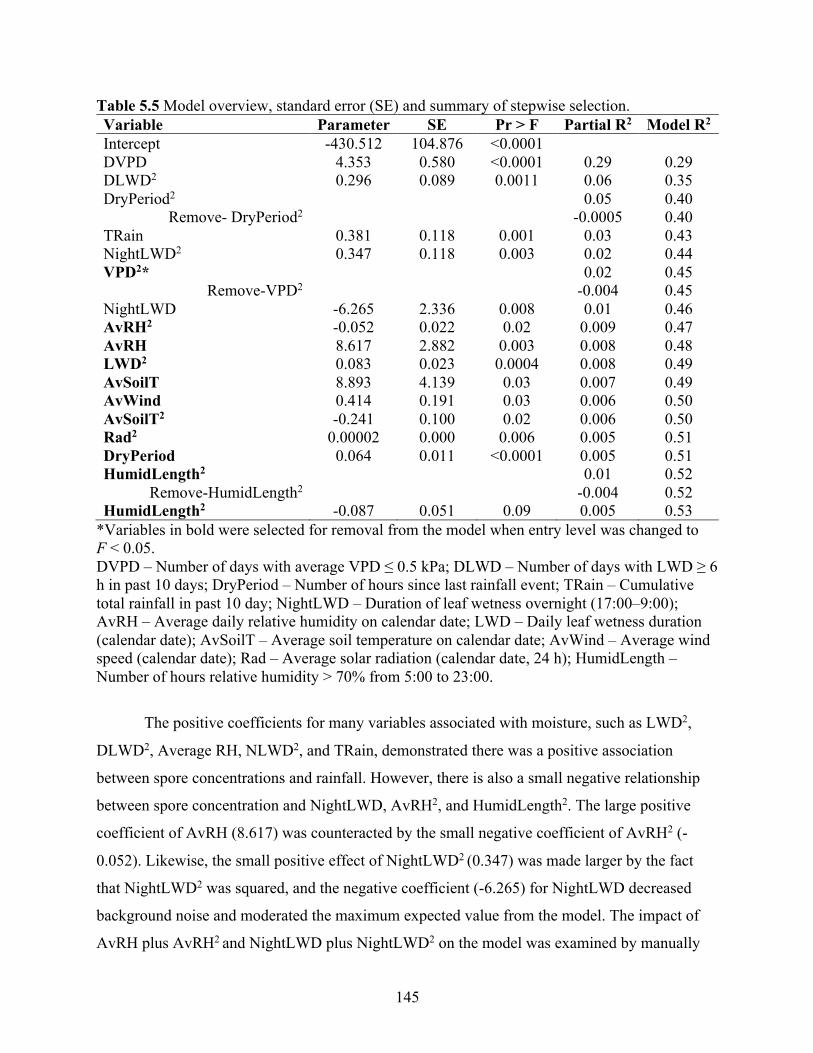
145
Table 5.5 Model overview, standard error (SE) and summary of stepwise selection. Variable Parameter SE Pr > F Partial R2 Model R2 Intercept -430.512 104.876 <0.0001 DVPD 4.353 0.580 <0.0001 0.29 0.29 DLWD2 0.296 0.089 0.0011 0.06 0.35 DryPeriod2 0.05 0.40
Remove- DryPeriod2 -0.0005 0.40 TRain 0.381 0.118 0.001 0.03 0.43 NightLWD2 0.347 0.118 0.003 0.02 0.44 VPD2* 0.02 0.45
Remove-VPD2 -0.004 0.45 NightLWD -6.265 2.336 0.008 0.01 0.46 AvRH2 -0.052 0.022 0.02 0.009 0.47 AvRH 8.617 2.882 0.003 0.008 0.48 LWD2 0.083 0.023 0.0004 0.008 0.49 AvSoilT 8.893 4.139 0.03 0.007 0.49 AvWind 0.414 0.191 0.03 0.006 0.50 AvSoilT2 -0.241 0.100 0.02 0.006 0.50 Rad2 0.00002 0.000 0.006 0.005 0.51 DryPeriod 0.064 0.011 <0.0001 0.005 0.51 HumidLength2 0.01 0.52
Remove-HumidLength2 -0.004 0.52 HumidLength2 -0.087 0.051 0.09 0.005 0.53
*Variables in bold were selected for removal from the model when entry level was changed to F < 0.05. DVPD – Number of days with average VPD ≤ 0.5 kPa; DLWD – Number of days with LWD ≥ 6 h in past 10 days; DryPeriod – Number of hours since last rainfall event; TRain – Cumulative total rainfall in past 10 day; NightLWD – Duration of leaf wetness overnight (17:00–9:00); AvRH – Average daily relative humidity on calendar date; LWD – Daily leaf wetness duration (calendar date); AvSoilT – Average soil temperature on calendar date; AvWind – Average wind speed (calendar date); Rad – Average solar radiation (calendar date, 24 h); HumidLength – Number of hours relative humidity > 70% from 5:00 to 23:00.
The positive coefficients for many variables associated with moisture, such as LWD2,
DLWD2, Average RH, NLWD2, and TRain, demonstrated there was a positive association
between spore concentrations and rainfall. However, there is also a small negative relationship
between spore concentration and NightLWD, AvRH2, and HumidLength2. The large positive
coefficient of AvRH (8.617) was counteracted by the small negative coefficient of AvRH2 (-
0.052). Likewise, the small positive effect of NightLWD2 (0.347) was made larger by the fact
that NightLWD2 was squared, and the negative coefficient (-6.265) for NightLWD decreased
background noise and moderated the maximum expected value from the model. The impact of
AvRH plus AvRH2 and NightLWD plus NightLWD2 on the model was examined by manually
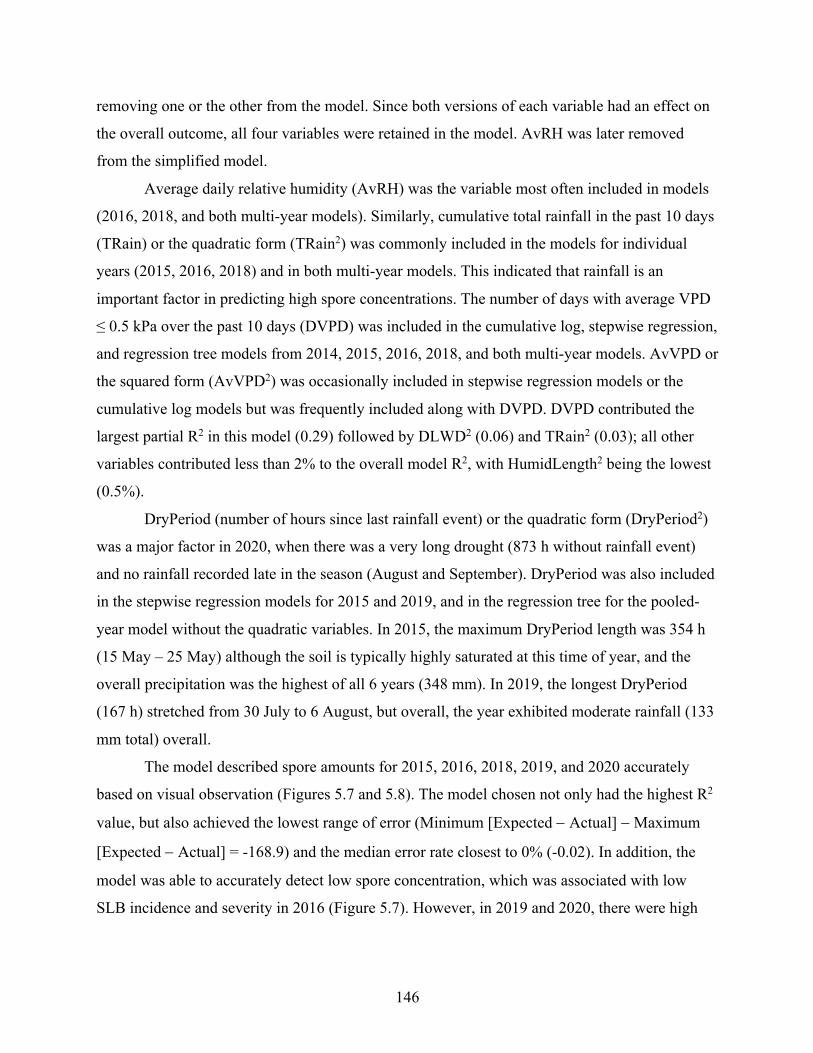
146
removing one or the other from the model. Since both versions of each variable had an effect on
the overall outcome, all four variables were retained in the model. AvRH was later removed
from the simplified model.
Average daily relative humidity (AvRH) was the variable most often included in models
(2016, 2018, and both multi-year models). Similarly, cumulative total rainfall in the past 10 days
(TRain) or the quadratic form (TRain2) was commonly included in the models for individual
years (2015, 2016, 2018) and in both multi-year models. This indicated that rainfall is an
important factor in predicting high spore concentrations. The number of days with average VPD
≤ 0.5 kPa over the past 10 days (DVPD) was included in the cumulative log, stepwise regression,
and regression tree models from 2014, 2015, 2016, 2018, and both multi-year models. AvVPD or
the squared form (AvVPD2) was occasionally included in stepwise regression models or the
cumulative log models but was frequently included along with DVPD. DVPD contributed the
largest partial R2 in this model (0.29) followed by DLWD2 (0.06) and TRain2 (0.03); all other
variables contributed less than 2% to the overall model R2, with HumidLength2 being the lowest
(0.5%).
DryPeriod (number of hours since last rainfall event) or the quadratic form (DryPeriod2)
was a major factor in 2020, when there was a very long drought (873 h without rainfall event)
and no rainfall recorded late in the season (August and September). DryPeriod was also included
in the stepwise regression models for 2015 and 2019, and in the regression tree for the pooled-
year model without the quadratic variables. In 2015, the maximum DryPeriod length was 354 h
(15 May – 25 May) although the soil is typically highly saturated at this time of year, and the
overall precipitation was the highest of all 6 years (348 mm). In 2019, the longest DryPeriod
(167 h) stretched from 30 July to 6 August, but overall, the year exhibited moderate rainfall (133
mm total) overall.
The model described spore amounts for 2015, 2016, 2018, 2019, and 2020 accurately
based on visual observation (Figures 5.7 and 5.8). The model chosen not only had the highest R2
value, but also achieved the lowest range of error (Minimum [Expected - Actual] - Maximum
[Expected - Actual] = -168.9) and the median error rate closest to 0% (-0.02). In addition, the
model was able to accurately detect low spore concentration, which was associated with low
SLB incidence and severity in 2016 (Figure 5.7). However, in 2019 and 2020, there were high
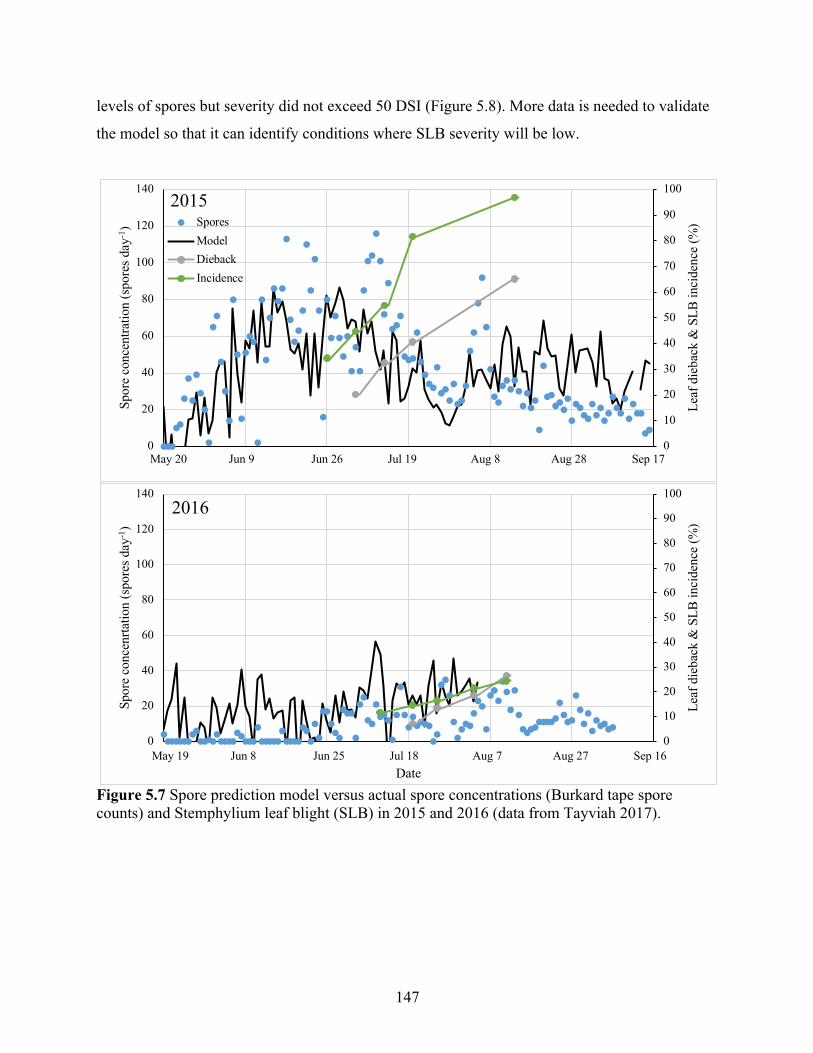
147
levels of spores but severity did not exceed 50 DSI (Figure 5.8). More data is needed to validate
the model so that it can identify conditions where SLB severity will be low.
Figure 5.7 Spore prediction model versus actual spore concentrations (Burkard tape spore counts) and Stemphylium leaf blight (SLB) in 2015 and 2016 (data from Tayviah 2017).
0
10
20
30
40
50
60
70
80
90
100
0
20
40
60
80
100
120
140
140 160 180 200 220 240 260
Leaf
die
back
& S
LB in
cide
nce
(%)
Spor
e co
ncen
tratio
n (s
pore
s day-1
)
2015SporesModelDiebackIncidence
May 20 Jun 9 Jun 26 Jul 19 Aug 8 Aug 28 Sep 17
0
10
20
30
40
50
60
70
80
90
100
0
20
40
60
80
100
120
140
140 160 180 200 220 240 260
Leaf
die
back
& S
LB in
cide
nce
(%)
Spor
e co
ncen
rtatio
n (s
pore
s day-1
)
Date
2016
May 19 Jun 8 Jun 25 Jul 18 Aug 7 Aug 27 Sep 16
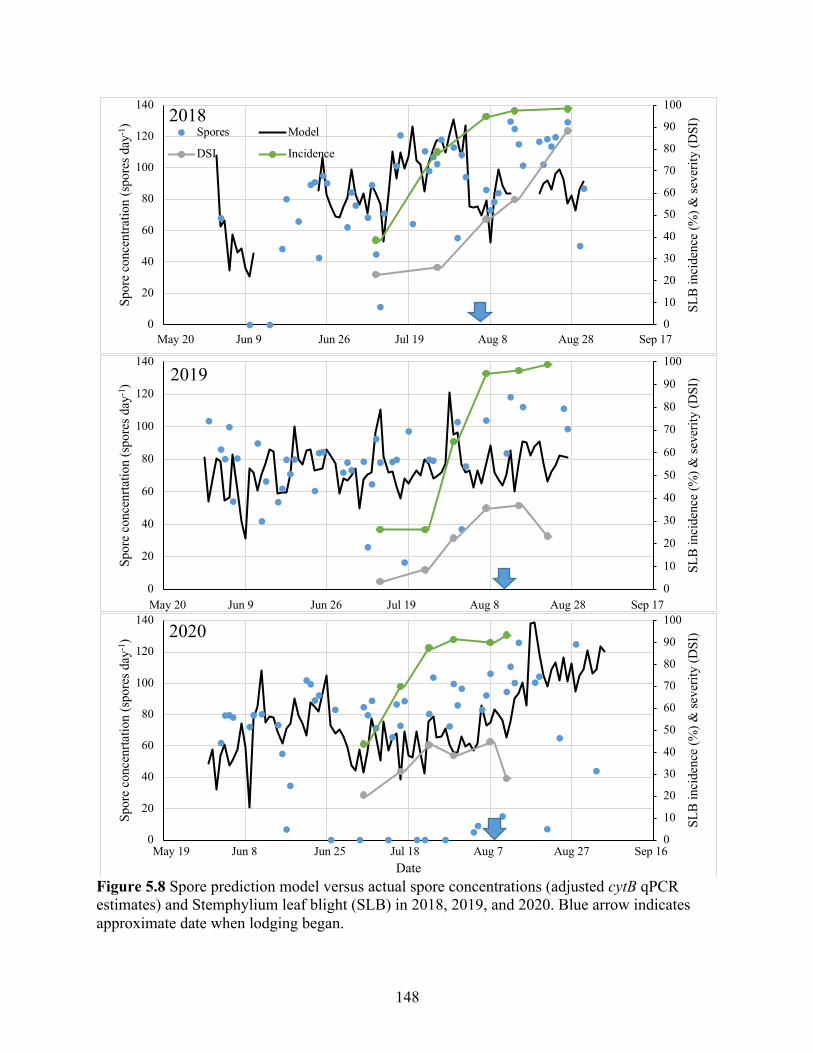
148
Figure 5.8 Spore prediction model versus actual spore concentrations (adjusted cytB qPCR estimates) and Stemphylium leaf blight (SLB) in 2018, 2019, and 2020. Blue arrow indicates approximate date when lodging began.
0
10
20
30
40
50
60
70
80
90
100
0
20
40
60
80
100
120
140
140 160 180 200 220 240 260
SLB
inci
denc
e (%
) & se
verit
y (D
SI)
Spor
e co
ncen
tratio
n (s
pore
s day-1
) 2018Spores Model
DSI Incidence
May 20 Jun 9 Jun 26 Jul 19 Aug 8 Aug 28 Sep 17
0
10
20
30
40
50
60
70
80
90
100
0
20
40
60
80
100
120
140
140 160 180 200 220 240 260
SLB
inci
denc
e (%
) & se
verit
y (D
SI)
Spor
e co
ncen
rtatio
n (s
pore
s day-1
) 2019
May 20 Jun 9 Jun 26 Jul 19 Aug 8 Aug 28 Sep 17
0
10
20
30
40
50
60
70
80
90
100
0
20
40
60
80
100
120
140
140 160 180 200 220 240 260
SLB
inci
denc
e (%
) & se
verit
y (D
SI)
Spor
e co
ncen
rtatio
n (s
pore
s day-1
)
Date
2020
May 19 Jun 8 Jun 25 Jul 18 Aug 7 Aug 27 Sep 16
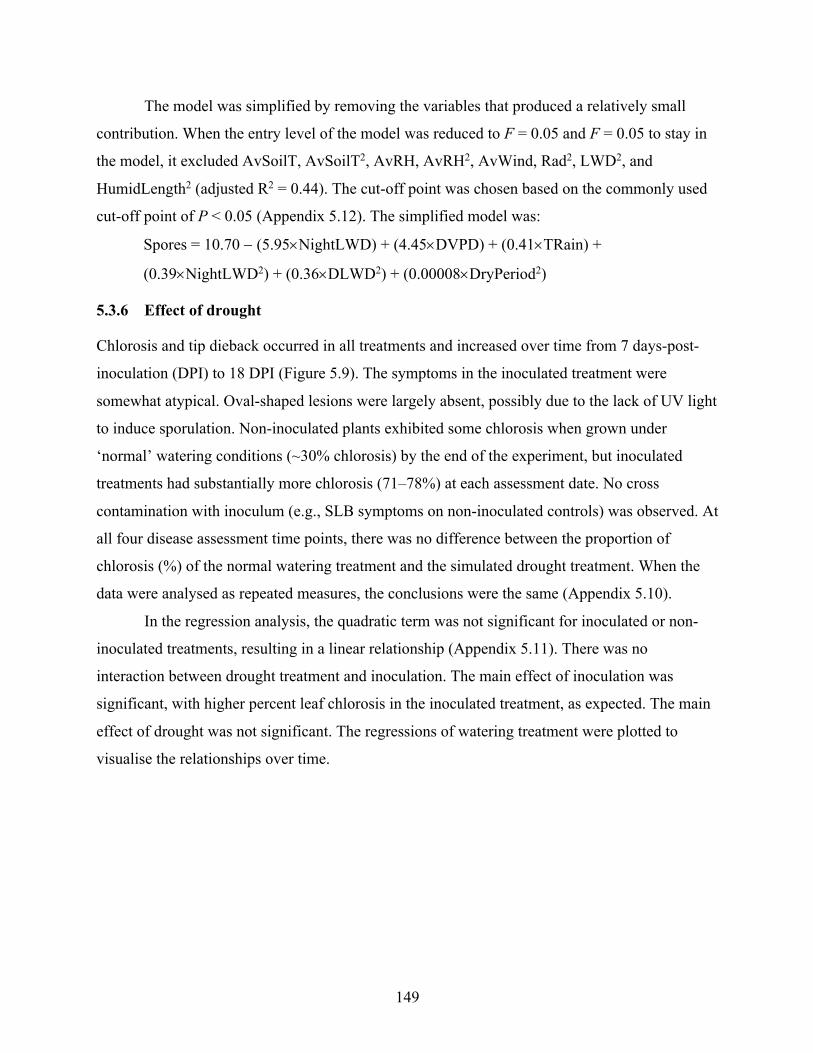
149
The model was simplified by removing the variables that produced a relatively small
contribution. When the entry level of the model was reduced to F = 0.05 and F = 0.05 to stay in
the model, it excluded AvSoilT, AvSoilT2, AvRH, AvRH2, AvWind, Rad2, LWD2, and
HumidLength2 (adjusted R2 = 0.44). The cut-off point was chosen based on the commonly used
cut-off point of P < 0.05 (Appendix 5.12). The simplified model was:
Spores = 10.70 - (5.95´NightLWD) + (4.45´DVPD) + (0.41´TRain) +
(0.39´NightLWD2) + (0.36´DLWD2) + (0.00008´DryPeriod2)
5.3.6 Effect of drought
Chlorosis and tip dieback occurred in all treatments and increased over time from 7 days-post-
inoculation (DPI) to 18 DPI (Figure 5.9). The symptoms in the inoculated treatment were
somewhat atypical. Oval-shaped lesions were largely absent, possibly due to the lack of UV light
to induce sporulation. Non-inoculated plants exhibited some chlorosis when grown under
‘normal’ watering conditions (~30% chlorosis) by the end of the experiment, but inoculated
treatments had substantially more chlorosis (71–78%) at each assessment date. No cross
contamination with inoculum (e.g., SLB symptoms on non-inoculated controls) was observed. At
all four disease assessment time points, there was no difference between the proportion of
chlorosis (%) of the normal watering treatment and the simulated drought treatment. When the
data were analysed as repeated measures, the conclusions were the same (Appendix 5.10).
In the regression analysis, the quadratic term was not significant for inoculated or non-
inoculated treatments, resulting in a linear relationship (Appendix 5.11). There was no
interaction between drought treatment and inoculation. The main effect of inoculation was
significant, with higher percent leaf chlorosis in the inoculated treatment, as expected. The main
effect of drought was not significant. The regressions of watering treatment were plotted to
visualise the relationships over time.
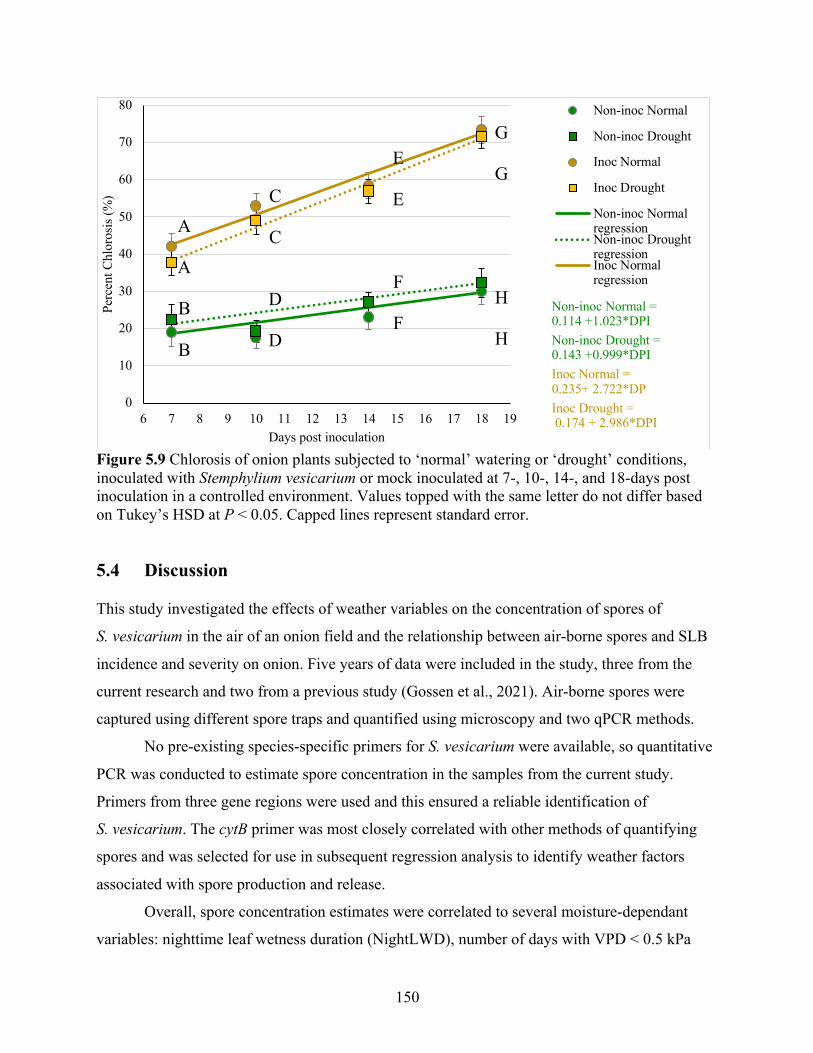
150
Figure 5.9 Chlorosis of onion plants subjected to ‘normal’ watering or ‘drought’ conditions, inoculated with Stemphylium vesicarium or mock inoculated at 7-, 10-, 14-, and 18-days post inoculation in a controlled environment. Values topped with the same letter do not differ based on Tukey’s HSD at P < 0.05. Capped lines represent standard error.
5.4 Discussion
This study investigated the effects of weather variables on the concentration of spores of
S. vesicarium in the air of an onion field and the relationship between air-borne spores and SLB
incidence and severity on onion. Five years of data were included in the study, three from the
current research and two from a previous study (Gossen et al., 2021). Air-borne spores were
captured using different spore traps and quantified using microscopy and two qPCR methods.
No pre-existing species-specific primers for S. vesicarium were available, so quantitative
PCR was conducted to estimate spore concentration in the samples from the current study.
Primers from three gene regions were used and this ensured a reliable identification of
S. vesicarium. The cytB primer was most closely correlated with other methods of quantifying
spores and was selected for use in subsequent regression analysis to identify weather factors
associated with spore production and release.
Overall, spore concentration estimates were correlated to several moisture-dependant
variables: nighttime leaf wetness duration (NightLWD), number of days with VPD < 0.5 kPa
E
E
F
F
A
A
B
B
C
C
D
D
G
G
H
H
0
10
20
30
40
50
60
70
80
6 7 8 9 10 11 12 13 14 15 16 17 18 19
Perc
ent C
hlor
osis
(%)
Days post inoculation
Non-inoc Normal
Non-inoc Drought
Inoc Normal
Inoc Drought
Non-inoc NormalregressionNon-inoc DroughtregressionInoc Normalregression
Non-inoc Normal = 0.114 +1.023*DPINon-inoc Drought = 0.143 +0.999*DPIInoc Normal = 0.235+ 2.722*DPInoc Drought =0.174 + 2.986*DPI
151
(DVPD), rain in the past 10 days (TRain), and number of days with leaf wetness duration > 6 h
in the past 10 days (DLWD).
The use of molecular methods to detect and quantify air-borne spores of important plant
pathogens has advanced dramatically in recent years and there is a great deal of interest in this
approach. Even though it is still in the early stages of research and implementation, some
companies already offer this service on a commercial basis. The current study compared an
active spore trap that drew bioaerosols into a microcentrifuge tube for analysis via qPCR
(Burkard multi-vial sampler), a passive spore trap provided by a private company (Spornado by
Sporometrics), and a commonly used impact-based spore trap which is quantified via manual
counting under a microscope (Rotorod).
To achieve an accurate estimate using qPCR analysis, the efficiency of spore collection,
DNA extraction, collection, and quantification efficiencies for aerosol sampling devices must be
consistent and uniform. qPCR analysis relies on the assumption that the number of gene copies of
the target sequence in the pathogen’s genomic DNA is constant and that the entire gene region was
successfully amplified (Hospodsky et al., 2010). Depending on the organism and sampling
material, qPCR is useful for determining dissimilarity between two samples only if the true values
are greater than 1.3 to 3.2 fold different (Hospodsky et al., 2010). Quantitative PCR generally has
the lowest observed limit of quantification (~10-3 ng μL-1) compared to UV spectroscopy and
fluorometry (Olson and Morrow, 2012). In a previous study, qPCR was able to detect the DNA of
five cells of the bacterial Bacillus atrophaeus Nakamura, less than one spore of Aspergillus
fumigatus Fresenius (Hospodsky et al., 2010), or two spores of Botrytis squamosa (Carisse et al.,
2009).
A major limitation to using qPCR for measuring DNA concentration is that protocol
development, validation, and execution are time-consuming and require skilled operators. Also,
standard qPCR protocols cannot differentiate between living and dead cells, so it is impossible to
know if the spores collected are viable or pathogenic. This is important because the pathogenicity
of S. vesicarium is not uniform; of 44 S. vesicarium isolates collected as spores in a pear orchard,
89% were not pathogenic to pear (Moragrega et al., 2018). However, qPCR is able to measure the
DNA concentration of a specific organism in a mixed sample (e.g., detection of a specific pathogen
in bioaerosol). Unfortunately, no standard reference materials were available for the qPCR assays
used in this study, so the associated uncertainty of the standard curve used in this study could not
152
be determined. In the current study, a serial dilution was used to create a standard curve that
included concentrations as low as 10 spores µL-1.
The methods used in this study represent those that are commonly used in pest diagnostic
laboratories. More accurate DNA measurement methods are available, including digital drop
PCR (Pinheiro et al., 2012) and phosphorus elemental analysis (Holden et al., 2007), which may
be implemented in research and commercial systems in the future. Currently, the equipment
needed for these methods is expensive and not commonly available in most research laboratories.
Differences in DNA extraction protocols may contribute to differences among the
estimates from qPCR. In bioaerosol samples collected using cassettes, such as in the Spornado
method, the accuracy is limited by cell extraction from sample filters and DNA extraction
efficiencies from cells; some bioaerosol particles may not be released from the cassette filter
material. For example, DNA extraction efficiency was only 3.4–13.3% in a study that used
quartz and polycarbonate filters to quantify air-borne spores of Escherichia coli (Migula)
Castellani and Chalmers, B. atrophaeus, and A. fumigatus (Hospodsky et al., 2010). One benefit
of the Burkard sampler was that the DNA extraction occurred within the sampling container,
which prevented any loss due to transferring bioaerosol from the collection device to the reaction
vessel. The PowerSoil extraction kit has been previously used in combination with the Burkard
multi-vial cyclone sampler for analysis of bioaerosol with satisfactory results (Parker, 2012;
Rastrojo et al., 2018).
It was difficult to determine which spore sampling method used in the current study was
the most accurate. The relationship between ranked values of spore estimates trapped using
different methods at the same site over the same time period would normally be expected to be a
straight line. The line of best fit (r = 0.25) between ranked values from the Sporometrics and
Burkard methods was exponential, and the association was low. The exponential relationship
may be due to the fact that the Sporometrics system sampled over several days and the spore
estimate was divided by number of days sampled to provide spores per day for comparison with
the Burkard sampler, resulting in several dates with the same estimated value. It is impossible to
know which dates contributed more or less to the spore estimates. Also, it was difficult to
determine if outliers contributed to the exponential relationship. Unfortunately, the Sporometrics
and Burkard methods only overlapped for 23 sampling dates, so the sample size for this
comparison was very low. Both of these molecular methods were positively correlated with
153
manual spore counts from the Rotorod sampler conducted by researchers at the MCRS, although
the relationship was not very strong (R2 = 0.55 for the Burkard method, R2 = 0.37 for
Sporometrics). The low values of the regression coefficient may be linked to the small sample
size (n < 30), which occurred because the Rotorod counts, Burkard sampling, and Spornado
methods did not always coincide with the same sampling dates.
The ability of air samplers to trap bioaerosol is affected by the equipment used and the
target organism. In a previous study that compared a Burkard-type sampler to Rotorod sampler,
the Rotorod was only 37% as efficient as the Burkard at capturing air-borne spores of Venturia
inaequalis (Aylor, 1993) and 57% for pollen (Solomon et al., 1980). This may be due to the size
and shape of the particles in question, with smaller particles more able to follow air streamlines
around the moving rods of the Rotorod (Muilenberg, 2003). In another study of Urticaceae
pollen, which was small but smooth and spherical, the efficiency of the Rotorod was 75% of the
Burkard (Peel 2014). Non-spherical particles or those with rough surfaces result in greater drag
than do smooth, spherical particles (Solomon, 2003). Stemphylium vesicarium spores are large
and non-spherical, as are V. inaequalis spores, and not as smooth as Urticaceae pollen (Simmons,
1969; Raghavendra Rao and Pavgi, 1975). Large, non-spherical particles should be efficiently
trapped by the Rotorod sampler, which sampled over twice as much air volume as the Burkard
multi-vial cyclone sampler in 2020. However, spore estimates from the Rotorod were
consistently lower than qPCR estimates. It is possible that the DNA copy number calculated by
qPCR may be higher than the actual number of spores. This was the case for a study on
Peronospora effusa, where demonstrated DNA copy values > 500,000 coincided with Rotorod
spore trap samples on the same date of ~200 spores (Klosterman et al., 2014).
Even though spore concentration estimates from the Burkard multi-vial cyclone sampler
were much higher than estimates from Sporometrics, there was a weak but significant correlation
between the rank values of the sampling methods. The maximum value recorded by
Sporometrics was 1,500 spores day-1 (14–17 August 2021), compared to 298,000 spores-1 with
the Burkard sampler (14 August 2020), and 17–307 spores day-1 for the Rotorod (14 and 17
August 2020). On another date, the Sporometrics method reported 9 spores day-1 and the Burkard
method reported 194,000 spores day-1 (25 August 2020).
The large difference in estimates of spore concentration from the three sampling methods
may be associated, at least in part, with differences in the volume of air sampled. The battery-
154
powered motor in the Burkard and whirling rods of the Rotorod sampler actively draw bioaerosol
in, whereas the volume sampled in the passive sampling of the Sporometrics cassette relies on
wind to deliver particles. However, the Spornado was operated for 24 h day-1 whereas the
Burkard and Rotorod samplers ran for only 6 h day-1 in the morning, the time when S. vesicarium
spores are most plentiful (Gossen et al., 2021). The Burkard sampled a total of ~5.9 ´ 103 L of air
per day, the Rotorod sampled ~1.6 ´ 104 L of air per day, and the volume of air sampled by the
Spornado sampled is unknown since it would be affected by the speed of wind that passed
through the cassette filter over multiple days. However, collection by the Spornado would be
expected to be higher (rather than lower) than the others since the sampling period for the
Spornado was longer. It appears likely that battery-assisted methods sampled a larger volume of
air over a shorter time period relative to a passive system.
The Burkard and the Spornado sampling devices are both gust-responsive, whereas the
circular spinning path of Rotorod samplers is largely independent to wind direction (Solomon,
2003). All of these devices are affected by wind speed, with the Burkard operating best at low
and high wind speed and the Rotorod most efficiently at moderate wind speed (Frenz, 2000).
Conversely, a study on A. porri demonstrated that increased wind speed led to increased trapped
spores using a Hirst volumetric sampler, which is similar to the Burkard model (Meredith, 1966).
In this study, all three methods are able to trap spores of S. vesicarium and all methods
demonstrated an increase in spore concentration over the growing season.
To make clearer comparisons between the Rotorod and the Burkard samplers, it would be
useful to compare manual spore counts for both samplers. An undergraduate research project was
previously conducted in 2011 using spore samples collected with the same Burkard air sampler
(from 10:00–13:00) and Stemphylium spores were manually counted under a microscope
(Stricker, unpublished). The values of the hand-counted bioaerosol samples ranged from 10 to
6317 spores per day in samples collected in 2009 and 2011. The sampler ran for a similar time
period (although 3 h shorter and later in the season, 19 August–2 September 2009 and 29
August–21 September 2011), so it is not unreasonable that the quantity of spores captured would
be comparable to the Burkard samples collected in 2018–2020 in the late-season time period.
The average estimate was 84,900 spores day-1 (20–31 August 2018, n = 9), 4400 spores day-1
(26–27 August 2019), and 56,700 spores day-1 (18–28 August 2020, n = 4) for the Burkard
sampler using qPCR for 2018, 2019, and 2020, respectively. The Burkard qPCR spore estimates
155
ranged from 587 to 371,000 spores day-1. This further supports the hypothesis that the qPCR
spore estimates from the Burkard sampler may be overestimations of the actual spore
concentrations.
If users are looking for highly detailed data, the Burkard sampler would be the
recommended method, but only if its use can be combined with improved qPCR protocols. Spore
counting methods using the Rotorod, manually counting bioaerosol from the Burkard sampler, or
an earlier version of the Burkard that trapped spores on sticky tape placed on a revolving drum,
are both viable options that require minimal setup, calibration, and no genomics training, but are
time consuming and may not be as species specific. There is also a commercial service that uses
qPCR to quantify spores trapped using Rotorod samplers. The Spornado by Sporometrics is an
alternative to the Burkard sampler that is easy to operate, but its efficacy must be confirmed with
more sampling dates before it can be recommended for general use. We conclude that the
existing qPCR method identified S. vesicarium to species but appeared to overestimate the spore
concentration, so the manual counting methods (using the Rotorod or the Burkard volumetric
sampler) would be recommended to get an estimate that more closely represented the actual
spore concentration.
qPCR analysis with three primer regions showed that there was a strong correlation
between the estimates generated by cytB and TEf-A primers, but only a weak correlation with the
ITS primer. The ITS primer set did not amplify in many samples. This may have been the result
of poor primer design, or that the ITS region was species specific whereas the cytB and TEf-A
primers may have amplified the DNA of related fungi. The primers were designed based on the
gene sequences of local isolates of S. vesicarium that were compared to GenBank accessions.
The majority of the GenBank BLAST searches turned up S. vesicarium accessions, although
some search results indicated other species (Foster et al., 2019). This may indicate that the gene
regions are not species specific, or that some of the accessions on the worldwide database may
be inaccurately identified. Even though each primer set was not necessarily species-specific,
overall, the results from the three primer sets were correlated (P < 0.05) and followed similar
trends. Therefore, we conclude that the spore capture data likely represents air-borne spores of
S. vesicarium. One limitation of this approach was that it was not possible to differentiate
between ascospores and conidia.
156
A confounding factor in the qPCR analysis could be difference in the calibration between
qPCR reaction runs. To perform an inter-run calibration, there should be at least three repeat
samples on each plate. An inter-run calibration was attempted using one identical sample of a
S. vesicarium conidia suspension per run (raw spore; DNA not extracted). In this study, there
was a significant effect of run (reaction plate) and there was a significant effect for all primers
(Appendix 5.3) but not when sorted by year (Appendix 5.4) because the estimates from the plates
containing samples from 2018 were higher than the other years (Appendix 5.12). These higher
spore concentration estimates may be due to the higher disease pressure in 2018.
DNA concentration was measured using spectrofluorometry and qPCR. Bench-top
spectrofluorometers, such as the QIAxpert, provide fast measurement of DNA concentration.
However, spectrofluorometry does not quantify the DNA of specific species, so much of the
DNA assessed may not be from the target pathogen, and the technique is unreliable at low
concentrations of DNA. The QIAxpert system can detect between 1.5–2000 ng μL-1 dsDNA
(Qiagen, 2017). The DNA quantity estimated by QIAxpert in these samples was low
(average = 0.96 ng μL-1), so most of these samples were below the threshold of detection. This
likely accounts for the fact that QIAxpert measurements were not correlated to the qPCR
estimates.
Based on the lowest error rate, the highest R2 value (0.50), and the intention of
maintaining leaf wetness sensors at the Muck Crops Research Station for future analyses, the
spore forecasting model developed using stepwise regression with quadratic variables was
selected. The models without leaf wetness duration exhibited lower adjusted R2 values, which
further indicated the important of this variable. The model was as follows, with variables in order
from highest partial R2 to lowest:
Spores = -430.51+ (4.35´DVPD) + (0.30´DLWD2) + (0.38´TRain) +
(0.35´NightLWD2) - (6.26´NightLWD) - (0.05´AvRH2) + (8.62´AvRH) +
(0.08´LWD2) + (8.89´AvSoilT) + (0.41´AvWind) - (0.24´AvSoilT2) +
(0.00002´Rad2) + (0.06´Drought) - (0.09´HumidLength2)
This model was further simplified by increasing the rigor at which variables entered the
regression model. The simplified model exhibited a slightly lower R2 value (0.44) but may
be preferred due to ease of use. The simplified model was as follows:
157
Spores = 10.70 - (5.95´NightLWD) + (4.45´DVPD) + (0.41´TRain) +
(0.39´NightLWD2) + (0.36´DLWD2) + (0.00008´Drought2)
It was interesting to note that total daily rainfall (Rain) was not present in the model
(along with several other variables related to rainfall, including Rain, HRain, and NRain). This is
likely because rainfall washes air-borne spores out of the air and off lesions. Surface tension of
rain or dew can also prevent liberation of fungal spores (Meredith, 1966). However, there was a
positive relationship with rainfall in the 10 days before spore release (TRain) and high humidity
(the number of days with average VPD < 0.5 in the past 10 days, DLWD). Rainfall creates the
conditions required for infection, such as long leaf wetness periods, and infection is an essential
precondition for subsequent sporulation events.
Based on previous research, a positive relationship was expected between rainfall and air-
borne spore concentration of S. vesicarium (Tayviah, 2017). Similarly, peaks in ascospore
release on leek and garlic have been linked to rainfall events (Suheri and Price, 2001; Prados-
Ligero et al., 2003). The low SLB severity and spore capture observed in 2019 were likely
associated with lower-than-average rainfall in June–August. However, plentiful early-season
rainfall in 2020 did not produce an early-season spike in spore concentrations or SLB severity.
Several rainfall events appeared to correspond with increases in spore concentration (14 July–28
August 2018), but this is not always the case (10 July–14 July 2020). In 2018 and 2020, the
rainfall in August was above normal, and there was an increase in SLB severity at the end of the
season. Unfortunately, spore estimates were not available for each consecutive date during these
periods, so it is difficult to draw conclusions about the relationships between spore concentration
and air temperature or rainfall based on the graphs alone. However, the stepwise regression,
cumulative log regression, and regression tree analyses all included variables related to leaf
wetness and rainfall, indicating an important relationship between S. vesicarium spore
production and available moisture.
High relative humidity, which is an indicator of environmental conditions conducive to
infection by fungal pathogens (Talley et al., 2002) was associated with low VPD. High relative
humidity (AvRH) was included in the stepwise and cumulative log regression models when
LWD was excluded, likely because they are concordant variables. Average VPD (VPD) was also
included in some stepwise and cumulative log regression models, but both AvRH and VPD were
removed from the simplified model because their inclusion did not substantially improve the
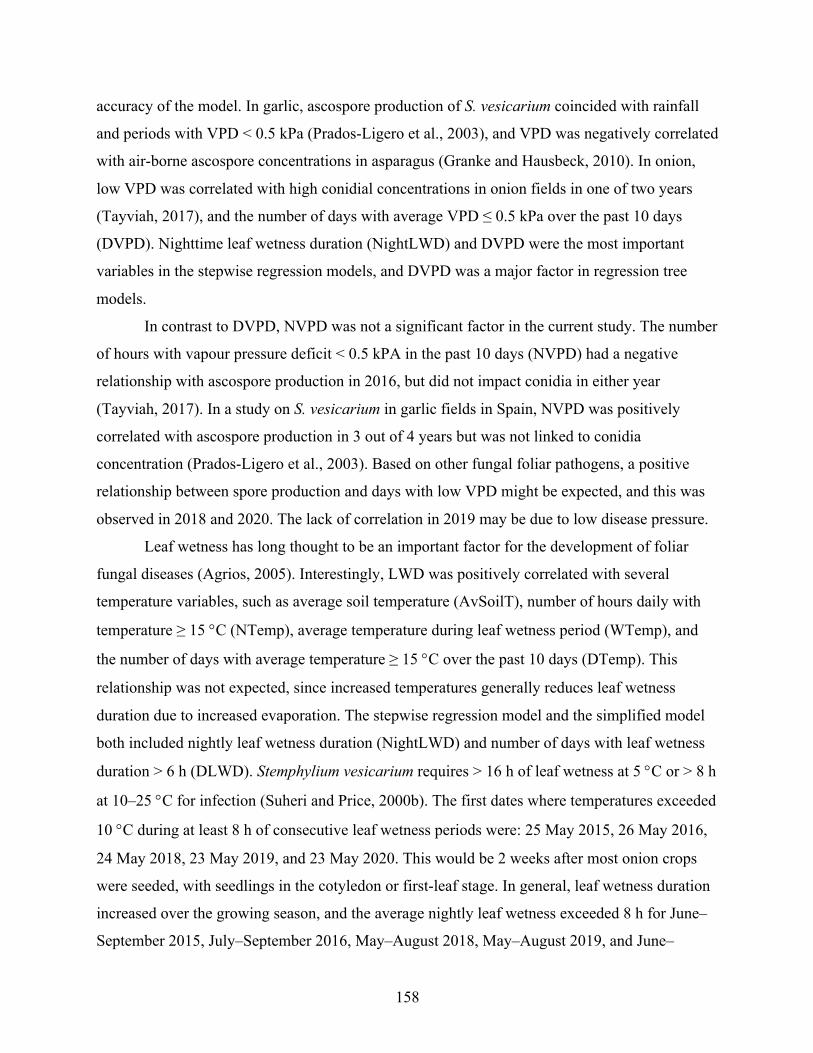
158
accuracy of the model. In garlic, ascospore production of S. vesicarium coincided with rainfall
and periods with VPD < 0.5 kPa (Prados-Ligero et al., 2003), and VPD was negatively correlated
with air-borne ascospore concentrations in asparagus (Granke and Hausbeck, 2010). In onion,
low VPD was correlated with high conidial concentrations in onion fields in one of two years
(Tayviah, 2017), and the number of days with average VPD ≤ 0.5 kPa over the past 10 days
(DVPD). Nighttime leaf wetness duration (NightLWD) and DVPD were the most important
variables in the stepwise regression models, and DVPD was a major factor in regression tree
models.
In contrast to DVPD, NVPD was not a significant factor in the current study. The number
of hours with vapour pressure deficit < 0.5 kPA in the past 10 days (NVPD) had a negative
relationship with ascospore production in 2016, but did not impact conidia in either year
(Tayviah, 2017). In a study on S. vesicarium in garlic fields in Spain, NVPD was positively
correlated with ascospore production in 3 out of 4 years but was not linked to conidia
concentration (Prados-Ligero et al., 2003). Based on other fungal foliar pathogens, a positive
relationship between spore production and days with low VPD might be expected, and this was
observed in 2018 and 2020. The lack of correlation in 2019 may be due to low disease pressure.
Leaf wetness has long thought to be an important factor for the development of foliar
fungal diseases (Agrios, 2005). Interestingly, LWD was positively correlated with several
temperature variables, such as average soil temperature (AvSoilT), number of hours daily with
temperature ≥ 15 °C (NTemp), average temperature during leaf wetness period (WTemp), and
the number of days with average temperature ≥ 15 °C over the past 10 days (DTemp). This
relationship was not expected, since increased temperatures generally reduces leaf wetness
duration due to increased evaporation. The stepwise regression model and the simplified model
both included nightly leaf wetness duration (NightLWD) and number of days with leaf wetness
duration > 6 h (DLWD). Stemphylium vesicarium requires > 16 h of leaf wetness at 5 °C or > 8 h
at 10–25 °C for infection (Suheri and Price, 2000b). The first dates where temperatures exceeded
10 °C during at least 8 h of consecutive leaf wetness periods were: 25 May 2015, 26 May 2016,
24 May 2018, 23 May 2019, and 23 May 2020. This would be 2 weeks after most onion crops
were seeded, with seedlings in the cotyledon or first-leaf stage. In general, leaf wetness duration
increased over the growing season, and the average nightly leaf wetness exceeded 8 h for June–
September 2015, July–September 2016, May–August 2018, May–August 2019, and June–
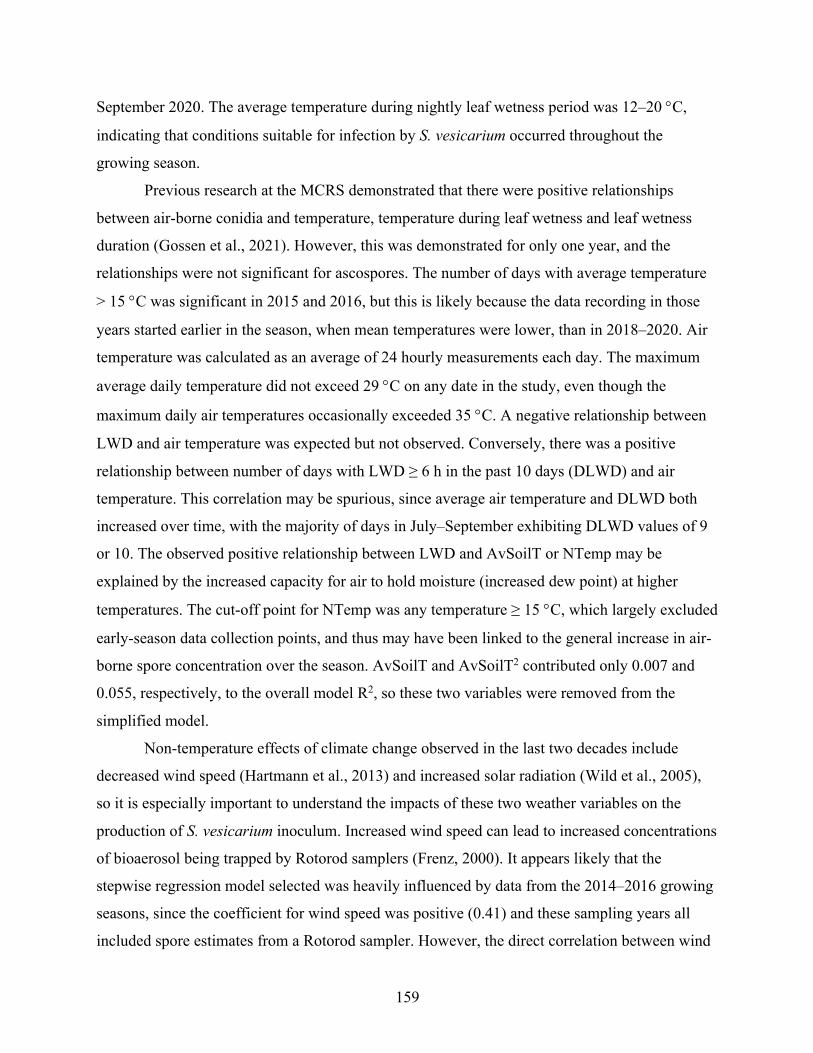
159
September 2020. The average temperature during nightly leaf wetness period was 12–20 °C,
indicating that conditions suitable for infection by S. vesicarium occurred throughout the
growing season.
Previous research at the MCRS demonstrated that there were positive relationships
between air-borne conidia and temperature, temperature during leaf wetness and leaf wetness
duration (Gossen et al., 2021). However, this was demonstrated for only one year, and the
relationships were not significant for ascospores. The number of days with average temperature
> 15 °C was significant in 2015 and 2016, but this is likely because the data recording in those
years started earlier in the season, when mean temperatures were lower, than in 2018–2020. Air
temperature was calculated as an average of 24 hourly measurements each day. The maximum
average daily temperature did not exceed 29 °C on any date in the study, even though the
maximum daily air temperatures occasionally exceeded 35 °C. A negative relationship between
LWD and air temperature was expected but not observed. Conversely, there was a positive
relationship between number of days with LWD ≥ 6 h in the past 10 days (DLWD) and air
temperature. This correlation may be spurious, since average air temperature and DLWD both
increased over time, with the majority of days in July–September exhibiting DLWD values of 9
or 10. The observed positive relationship between LWD and AvSoilT or NTemp may be
explained by the increased capacity for air to hold moisture (increased dew point) at higher
temperatures. The cut-off point for NTemp was any temperature ≥ 15 °C, which largely excluded
early-season data collection points, and thus may have been linked to the general increase in air-
borne spore concentration over the season. AvSoilT and AvSoilT2 contributed only 0.007 and
0.055, respectively, to the overall model R2, so these two variables were removed from the
simplified model.
Non-temperature effects of climate change observed in the last two decades include
decreased wind speed (Hartmann et al., 2013) and increased solar radiation (Wild et al., 2005),
so it is especially important to understand the impacts of these two weather variables on the
production of S. vesicarium inoculum. Increased wind speed can lead to increased concentrations
of bioaerosol being trapped by Rotorod samplers (Frenz, 2000). It appears likely that the
stepwise regression model selected was heavily influenced by data from the 2014–2016 growing
seasons, since the coefficient for wind speed was positive (0.41) and these sampling years all
included spore estimates from a Rotorod sampler. However, the direct correlation between wind
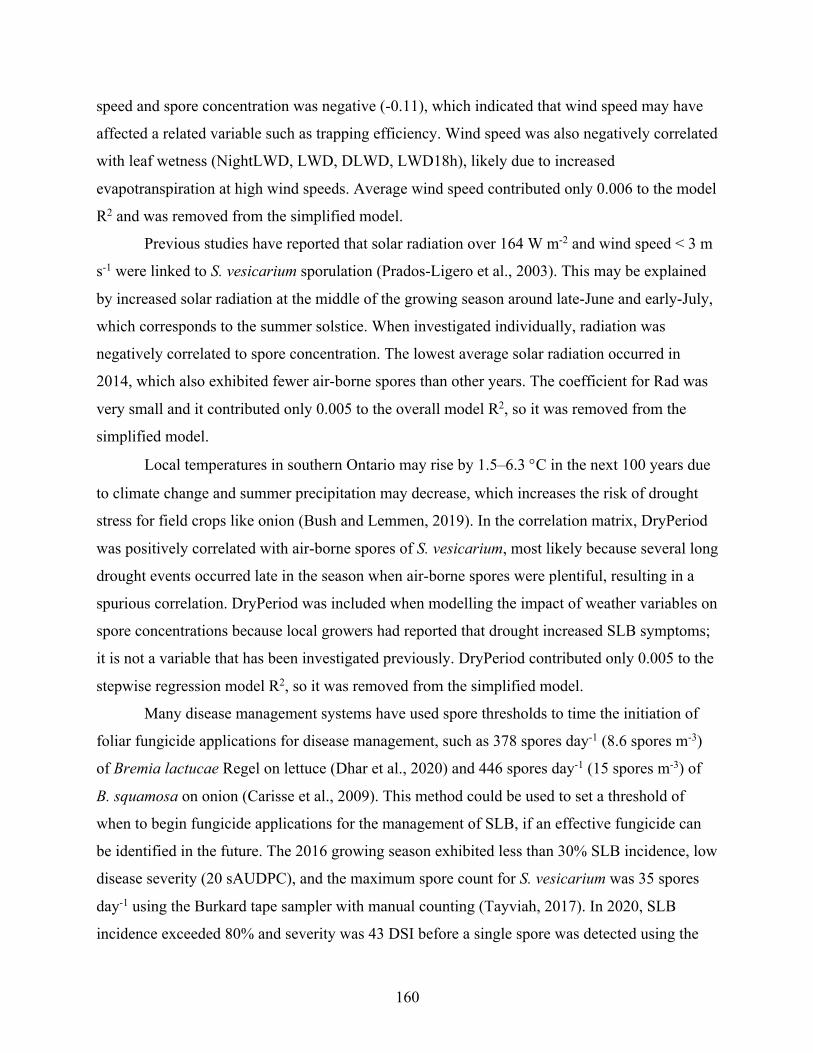
160
speed and spore concentration was negative (-0.11), which indicated that wind speed may have
affected a related variable such as trapping efficiency. Wind speed was also negatively correlated
with leaf wetness (NightLWD, LWD, DLWD, LWD18h), likely due to increased
evapotranspiration at high wind speeds. Average wind speed contributed only 0.006 to the model
R2 and was removed from the simplified model.
Previous studies have reported that solar radiation over 164 W m-2 and wind speed < 3 m
s-1 were linked to S. vesicarium sporulation (Prados-Ligero et al., 2003). This may be explained
by increased solar radiation at the middle of the growing season around late-June and early-July,
which corresponds to the summer solstice. When investigated individually, radiation was
negatively correlated to spore concentration. The lowest average solar radiation occurred in
2014, which also exhibited fewer air-borne spores than other years. The coefficient for Rad was
very small and it contributed only 0.005 to the overall model R2, so it was removed from the
simplified model.
Local temperatures in southern Ontario may rise by 1.5–6.3 °C in the next 100 years due
to climate change and summer precipitation may decrease, which increases the risk of drought
stress for field crops like onion (Bush and Lemmen, 2019). In the correlation matrix, DryPeriod
was positively correlated with air-borne spores of S. vesicarium, most likely because several long
drought events occurred late in the season when air-borne spores were plentiful, resulting in a
spurious correlation. DryPeriod was included when modelling the impact of weather variables on
spore concentrations because local growers had reported that drought increased SLB symptoms;
it is not a variable that has been investigated previously. DryPeriod contributed only 0.005 to the
stepwise regression model R2, so it was removed from the simplified model.
Many disease management systems have used spore thresholds to time the initiation of
foliar fungicide applications for disease management, such as 378 spores day-1 (8.6 spores m-3)
of Bremia lactucae Regel on lettuce (Dhar et al., 2020) and 446 spores day-1 (15 spores m-3) of
B. squamosa on onion (Carisse et al., 2009). This method could be used to set a threshold of
when to begin fungicide applications for the management of SLB, if an effective fungicide can
be identified in the future. The 2016 growing season exhibited less than 30% SLB incidence, low
disease severity (20 sAUDPC), and the maximum spore count for S. vesicarium was 35 spores
day-1 using the Burkard tape sampler with manual counting (Tayviah, 2017). In 2020, SLB
incidence exceeded 80% and severity was 43 DSI before a single spore was detected using the
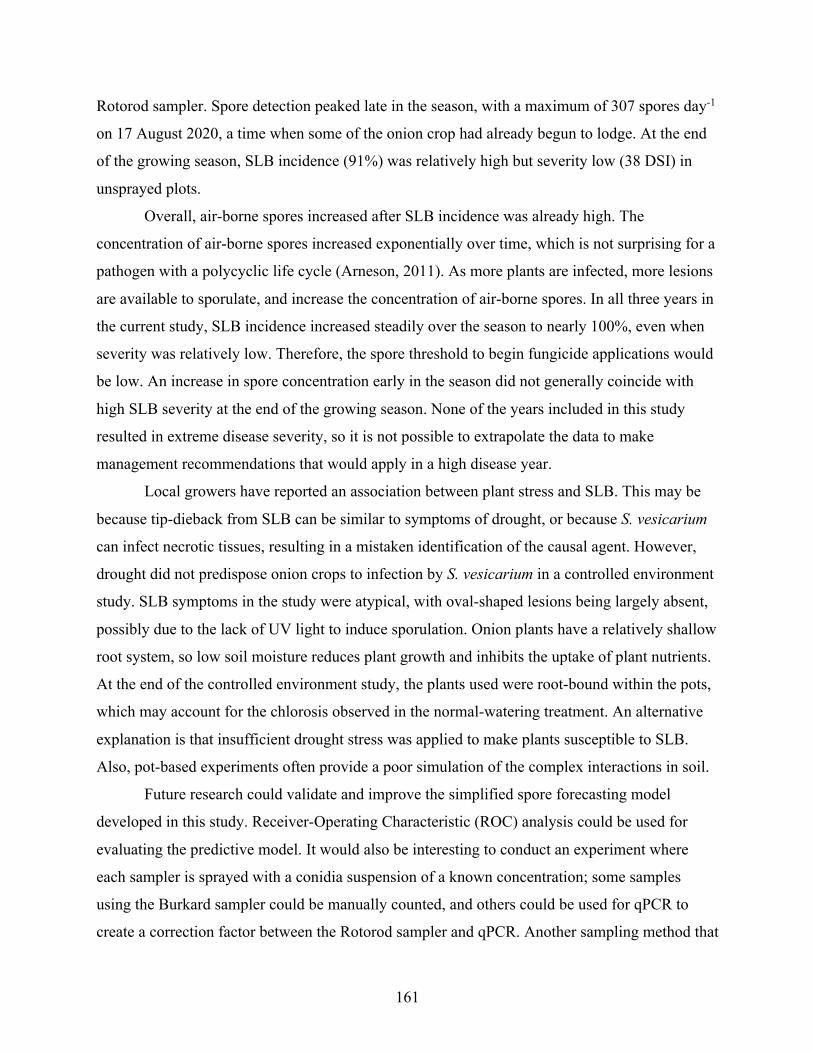
161
Rotorod sampler. Spore detection peaked late in the season, with a maximum of 307 spores day-1
on 17 August 2020, a time when some of the onion crop had already begun to lodge. At the end
of the growing season, SLB incidence (91%) was relatively high but severity low (38 DSI) in
unsprayed plots.
Overall, air-borne spores increased after SLB incidence was already high. The
concentration of air-borne spores increased exponentially over time, which is not surprising for a
pathogen with a polycyclic life cycle (Arneson, 2011). As more plants are infected, more lesions
are available to sporulate, and increase the concentration of air-borne spores. In all three years in
the current study, SLB incidence increased steadily over the season to nearly 100%, even when
severity was relatively low. Therefore, the spore threshold to begin fungicide applications would
be low. An increase in spore concentration early in the season did not generally coincide with
high SLB severity at the end of the growing season. None of the years included in this study
resulted in extreme disease severity, so it is not possible to extrapolate the data to make
management recommendations that would apply in a high disease year.
Local growers have reported an association between plant stress and SLB. This may be
because tip-dieback from SLB can be similar to symptoms of drought, or because S. vesicarium
can infect necrotic tissues, resulting in a mistaken identification of the causal agent. However,
drought did not predispose onion crops to infection by S. vesicarium in a controlled environment
study. SLB symptoms in the study were atypical, with oval-shaped lesions being largely absent,
possibly due to the lack of UV light to induce sporulation. Onion plants have a relatively shallow
root system, so low soil moisture reduces plant growth and inhibits the uptake of plant nutrients.
At the end of the controlled environment study, the plants used were root-bound within the pots,
which may account for the chlorosis observed in the normal-watering treatment. An alternative
explanation is that insufficient drought stress was applied to make plants susceptible to SLB.
Also, pot-based experiments often provide a poor simulation of the complex interactions in soil.
Future research could validate and improve the simplified spore forecasting model
developed in this study. Receiver-Operating Characteristic (ROC) analysis could be used for
evaluating the predictive model. It would also be interesting to conduct an experiment where
each sampler is sprayed with a conidia suspension of a known concentration; some samples
using the Burkard sampler could be manually counted, and others could be used for qPCR to
create a correction factor between the Rotorod sampler and qPCR. Another sampling method that
162
could be used is the Burkard sampler which uses sticky tape, since the tape can be cut
longitudinally; half of the tape could be manually counted, and the other half used for qPCR to
further improve the calculation of spore estimates. Other pathogen identification methods could
be tested, such as immunochromatographic test strips, which have been used for on-site field
immediate test results to identify the downy mildew pathogen Peronospora destructor
(Wakeham et al., 2012). Additionally, other statistical methods such as receiving operating
curves can be used in future studies.
Future studies could use standardized gene fragments purchased from commercial
vendors (gBlocks), which can be used as standards in probe-based qPCR reactions as an
alternative to creating a standard curve from manually-counted spore samples to improve the
accuracy of the qPCR protocols (Conte et al., 2018). It would also be useful to screen the
pathogenicity of local air-borne S. vesicarium spores (similar to Moragrega et al. (2018), since
spores produced on alternative hosts may not be pathogenic to onion. Further experiments on the
effect of drought in a controlled environment should use larger, deeper pots to allow for natural
water percolation and avoid non-uniform soil moisture patterns (Pennypacker et al., 1990).
The current study indicated that high daily average relative humidity, low vapour
pressure deficit for extended duration, and increased leaf wetness, especially at night, were
correlated to an increase in air-borne spores of S. vesicarium. However, the highest concentration
of air-borne spores occurred at the end of the growing season after the onion crop had lodged and
the leaves had begun to naturally die and desiccate. Further research is needed to understand
spore concentrations in years with high SLB severity, to verify if the spore prediction model
developed in this study can predict high spore concentrations, and that a spore threshold could be
identified to recommend when or if fungicide sprays are needed in a growing season.
163
Chapter 6 General discussion Stemphylium leaf blight and other foliar diseases of onion can limit onion yield and storage
quality. Growers in Ontario are concerned about the leaf dieback and the lack of disease
suppression when applying foliar fungicides. To maintain the sustainable production of onion in
the region, it is important to understand this host-pathogen system and to develop improved
management strategies / recommendations. The presented research is the first study in Canada to
confirm the identification of S. vesicarium isolates collected in onion fields in Ontario, confirm
fungicide insensitivity to commonly used fungicides, confirm seed-borne inoculum from
naturally infested flowers, outline the life cycle of S. vesicarium in this region, and propose a
model to predict sporulation events in southern Ontario.
In Ontario, field studies on cultivar resistance and fungicide efficacy on onion have
identified only small differences among cultivars and dwindling fungicide efficacy over the past
decade. The assessment of forecasting models based on weather parameters in the current study,
together with a previous study at the same site, (Tayviah, 2017) has demonstrated that the
number of fungicide applications can be reduced, but the foliar fungicides applied did not
provide effective SLB suppression compared to the unsprayed control. A mineral oil product
with suspected induced systemic resistance properties was tested in one year but also did not
provide SLB suppression. Clearly, more research is needed to provide growers with new tools to
manage this disease.
Cultural management techniques, such as reducing overwintering inoculum, have shown
some efficacy for the diseases caused by S. vesicarium on asparagus (Johnson, 1990) and pear
(Llorente et al., 2010b). Inoculated onion leaf tissue that had been buried in a fabric bag and
exposed to the moist environment decomposed over the winter. Re-isolation of the pathogen
from these buried wet samples was not successful on 11 April, 1 May, or 30 May sampling dates,
but pseudothecia were present. The current study demonstrated that the production and survival
of overwintering structures on onion leaves can occur in Ontario. However, viable ascospores
were only observed on samples which were wet and had not been buried, which suggests that
burial of onion leaf residue can prevent the formation of ascospores by hastening decomposition
and excluding light from pseudothecia. It also showed that many of the common weed species,
such as redroot pigweed, yellow nutsedge, purslane, marshcress, sowthistle, and bull thistle are
asymptomatic hosts of S. vesicarium. The importance of these as sources of inoculum is not yet
164
known, but these weeds could be another source of primary inoculum for onion crops. Onion
growers in the region have many reasons to manage weeds in and around fields and to manage
cull onions to avoid cull piles. This research provides additional reasons to support weed
management and disposal of culls, which will reduce the carry-over of inoculum.
Three of four fungicide active ingredients commonly used in Ontario to suppress SLB
exhibited levels of in vitro insensitivity against S. vesicarium, and none were effective in the
field. Of the isolates collected in southern Ontario, 94% exhibited insensitivity to azoxystrobin,
63% to fluopyram, 41% to pyrimethanil, and only 1% to difenoconazole. Fungicide insensitivity
seems to have developed relatively quickly, in less than 5 years in the Holland Marsh (Stricker et
al., 2020). Stemphylium vesicarium isolates were 7% insensitive to fluopyram in 2018, 43% in
2019, and 100% by 2020 (Stricker et al., 2021b). Future research could investigate fitness of
insensitive and sensitive S. vesicarium isolates to determine if halting the use of one or more
fungicides would result in a reversion to the sensitive wild type.
This study confirmed that S. vesicarium can survive on seed and infect the seedlings that
develop, which is consistent with the results of Aveling et al. (1993). However, the role of seed-
borne inoculum in SLB epidemics remains to be elucidated. Most commercial seeds are heat-
treated before sale for management of Botrytis leaf blight (Stokes Seed, personal
communication), which greatly reduces the risk of primary inoculum from seed. If some
commercial onion seed producers are currently not using seed heat treatments, incorporation of
this practice into their production process could reduce seed infestation with S. vesicarium and
other pathogens. This may be most important for growers of organic onions or in regions where
onion growers save seed. Additionally, commercial onion seed is treated with one or more
fungicides, which could also prevent seed-to-seedling transmission of seed-borne inoculum. It is
possible that S. vesicarium was initially introduced to the Holland Marsh region via seed-borne
inoculum. However, the wide host range of this pathogen makes determination of the initial
source of the pathogen difficult or impossible. Since the pathogen can overwinter in onion debris
and infect local weed species, the majority of primary inoculum in a growing season is likely
from the mycelia, conidia, or pseudothecia in plant residue. The role of weed species in the
overwintering of S. vesicarium has yet to be investigated.
The current study indicated that foliar fungicide sprays in combination with seed
treatments may be the best strategy to manage SLB, but seed treatments or foliar sprays alone
165
did not effectively suppress symptoms. It is possible that the seed treatment increased overall
plant health, thus reducing the end-of-season disease symptoms. Alternatively, the seed treatment
may have provided early-season protection against infection, which delayed symptom
development. The second option seems more likely. The fungicides tested did inhibit some
mycelial growth and germination of ‘insensitive’ isolates (<50% inhibition compared to growth
or germination on unamended media). This slight inhibition could explain why the combination
of foliar sprays and seed treatment with penflufen provided SLB suppression in both field
seasons; the seed treatment may have provided enough early-season suppression to result in
statistical significance among treatments.
Weather variables relating to moisture (high daily average relative humidity, low vapour
pressure deficit, and increased leaf wetness) were correlated with an increase in air-borne spores
of S. vesicarium, which is not surprising for a foliar fungal pathogen. The simplified spore
forecasting model included nighttime leaf wetness duration, number of days with LWD ≥ 6 h,
number of days with average VPD ≤ 0.5 kPa, rainfall in the past 10 days, and the length of time
without rainfall (DryPeriod). All of these variables, except for DryPeriod, were positively
correlated with daily average relative humidity. The model requires validation with more data,
especially from years with high SLB severity. More research needs to be done to develop
effective qPCR methods to quantify ascospores and conidia and relate spore concentration to
disease risk.
The goal of this research was to develop and improve the spore forecasting model so that
the IPM offered through the Muck Crops Research Station can make reliable recommendations
on when or if the local growers need to apply fungicides. The new spore forecasting model
developed in this study could be used to predict high disease years. For example, if the predicted
spore count in the early-season (May–June) exceeds 60 spores per day, the SLB incidence will
likely be high. If it exceeds 120 spores per day, then severity will also be high. However, this
recommendation is based on only 5 years of data, so the model and these thresholds need
continued assessment.
Disease forecasting models have been successfully used against other pathogens of onion
and for diseases of other crops. The model DOWNcast has been used to time fungicide
applications for downy mildew of onion caused by Peronospora destructor (De Visser, 1998)
and Botrytis leaf blight of onion caused by Botrytis squamosa (Sutton et al., 1986). The
166
forecasting models TOMcast and BSPcast used in this study reduced the number of fungicide
applications based on weather parameters by 1 or 2 sprays. Unfortunately, until a product that
can decrease SLB in the field is available, developing a disease forecasting model to recommend
foliar spray applications is not helpful. Future research should focus on new fungicides,
alternative products, and biocontrol agents.
Abiotic stresses, such as drought, were suspected to increase SLB severity, but a number
of stresses can cause tip-dieback and S. vesicarium can easily invade the necrotic tissues. A
controlled environment study did not find a relationship between susceptibility to SLB and
drought. It is conceivable that the controlled-environment study was a poor estimation of field
conditions, especially since growers have reported increased SLB under plant stress conditions.
There are still many questions left unanswered about the management of SLB on onion in
Ontario, Canada. Even the effect of SLB on yield is unknown. Onion growers are hesitant to
forgo fungicide applications entirely because heavy losses have occurred in the past. Also, none
of the fungicides registered in Canada have curative effects against SLB.
Based on the findings of this research, growers are recommended to remove or bury
onion leaf debris from the field because it can act as primary inoculum in the following spring.
Additionally, hand-pulled weeds should be removed from the field and thoroughly composted or
buried away from onion fields to reduce the risk of inoculum from alternative hosts. Fungicides
containing azoxystrobin, pyrimethanil, fluopyram, and difenoconazole are no longer effective at
suppressing SLB symptoms and use of these products should no longer be recommended. There
is a possibility that sensitivity to pyrimethanil, fluopyram, and difenoconazole may return if use
is discontinued. Azoxystrobin insensitivity, however, is likely to remain within the population
indefinitely. If onion growers are using foliar fungicide applications, the TOMcast model is a
user-friendly option that can be calculated based on local weather conditions and can reduce
fungicide applications, resulting in savings to the grower and reduced selection pressure for
fungicide insensitivity. Additionally, resistance management recommendations should be
followed such as rotating between fungicides with different modes of actions, and not applying a
foliar FRAC group 7 fungicide as the first application if the seed has been treated with penflufen.
Research on SLB will continue at the Muck Crops Research Station to address growers’ needs.
167
Literature Cited
Abo-Elyousr, K.A.M., M.A.M. Hussein, A.D.A. Allam, and M.H. Hassan. 2009. Salicylic acid induced systemic resistance on onion plants against Stemphylium vesicarium. Arch. Phytopathol. Plant Prot. 42(11): 1042–1050. doi: 10.1080/03235400701621719.
Agrios, G. 2005. Plant Pathology. 5th Edition. Elsevier Academic Press, Burlington, MA. Ahmad, A. 2014. Stemphylium grey leaf spot disease of lupins in Western Australia. Ahmadpour, A., and A. Poursafar. 2018. Stemphylium vesicarium causing Sansevieria trifasciata
(viper’s bowstring hemp) leaf blight in Iran. Australas. Plant Dis. Notes 13(4): 1–4. doi: 10.1007/s13314-018-0288-3.
Al-Badri, B.A.S., S.S. Al-Maawali, Z.M. Al-Balushi, I.H. Al-Mahmooli, A.M. Al-Sadi, et al. 2020. Cyanide degradation and antagonistic potential of endophytic Bacillus subtilis strain BEB1 from Bougainvillea spectabilis Willd. All Life 13(1): 92–98. doi: 10.1080/26895293.2020.1728393.
Al-Daoud, F., B.D. Gossen, and M.R. McDonald. 2020. Maturation of resting spores of Plasmodiophora brassicae continues after host cell death. Plant Pathol. 69(2): 310–319. doi: 10.1111/ppa.13124.
Alberoni, G., D. Cavallini, M. Collina, and A. Brunelli. 2010a. Characterisation of the first Stemphylium vesicarium isolates resistant to strobilurins in Italian pear orchards. Eur. J. Plant Pathol. 126(4): 453–457. doi: 10.1007/s10658-009-9559-3.
Alberoni, G., M. Collina, and A. Brunelli. 2006. Biological characteristics of dicarboximides resistant isolates of Stemphylium vesicarium from Italian pear orchards. IOBC/wprs Bull. 29: 109–115.
Alberoni, G., M. Collina, C. Lanen, P. Leroux, and A. Brunelli. 2010b. Field strains of Stemphylium vesicarium with a resistance to dicarboximide fungicides correlated with changes in a two-component histidine kinase. Eur. J. Plant Pathol. 128: 171–184. doi: 10.1007/s10658-010-9642-9.
Alberoni, G., M. Collina, D. Pancaldi, and A. Brunelli. 2005. Resistance to dicarboximide fungicides in Stemphylium vesicarium of Italian pear orchards. Eur. J. Plant Pathol. 113: 211–219. doi: 10.1007/s10658-005-2332-3.
Ali, E.M., L.K. Pandit, K.A. Mulvaney, and A. Amiri. 2018. Sensitivity of Phacidiopycnis spp. isolates from pome fruit to six pre- and postharvest fungicides. Plant Dis. 102(3): 533–539. doi: 10.1094/PDIS-07-17-1014-RE.
Andersen, B., M. Solfrizzo, and A. Visconti. 1995. Metabolite profiles of common Stemphylium species. Mycol. Res.: 672–676. doi: 10.1016/S0953-7562(09)80526-1.
Anderson, J. 2005. Evolution of antifungal-drug resistance: mechanisms and pathogen fitness. Nat. Rev. Microbiol. 3: 547–556. doi: 10.1038/nrmicro1179.
Andersson, D.I., and D. Hughes. 2011. Persistence of antibiotic resistance in bacterial populations. FEMS Microbiol. Rev. 35(5): 901–911. doi: 10.1111/j.1574-6976.2011.00289.x.
Arneson, P.. 2011. Plant Disease Epidemiology: Temporal Aspects. Plant Heal. Instr. doi: 10.1094/PHI-A-2001-0524-01.
Arysta LifeScience Canada. 2020. ROYAL MH-30 XTRA. Pesticide Label. Arzanlou, M., S. Khodaei, and A. Babai-Ahari. 2012. Helianthus annuus as a natural host for
Stemphylium vesicarium in Iran. Australas. Plant Dis. Notes 7: 167–170. doi: 10.1007/s13314-012-0076-4.
168
Assante, G., and G. Nasini. 1987. Identity of the phytotoxin stemphylin from Stemphylium botryosum with altersolanol A. Phytochemistry 26(3): 703–705. doi: 10.1016/S0031-9422(00)84768-8.
Aveling, T.A.S. 1993. Studies on Alternaria porri and Stemphylium vesicarium on Allium spp. MSc Thesis, University of Natal.
Aveling, T.A.S., and S.P. Naude. 1992. First report of Stemphylium vesicarium on garlic in South Africa. Plant Dis. 76(4): 426. doi: 10.1094/PD-76-0426E.
Aveling, T.A.S., and H.G. Snyman. 1993. Infection studies of Stemphylium vesicarium on onion leaves. Mycol. Res. doi: 10.1016/S0953-7562(09)80866-6.
Aveling, T.A.S., H.G. Snyman, and S.P. Naude. 1993. Evaluation of seed treatments for reducing Alternaria porri and Stemphylium vesicarium on onion seed. Plant Dis. 77(10): 1009–1011. doi: 10.1094/PD-77-1009.
Avenot, H.F., H. van den Biggelaar, D.P. Morgan, J. Moral, M. Joosten, et al. 2014. Sensitivities of baseline isolates and boscalid-resistant mutants of Alternaria alternata from pistachio to fluopyram, penthiopyrad, and fluxapyroxad. Plant Dis. 98(2): 197–205. doi: 10.1094/PDIS-04-13-0459-RE.
Avenot, H.F., M. Luna, and T.J. Michailides. 2019. Phenotypic and molecular characterization of resistance to the SDHI fungicide fluopyram in populations of Alternaria alternata from pistachio orchards in California. Crop Prot. 124. doi: 10.1016/j.cropro.2019.05.032.
Avenot, H.F., and T.J. Michailides. 2010. Progress in understanding molecular mechanisms and evolution of resistance to succinate dehydrogenase inhibiting (SDHI) fungicides in phytopathogenic fungi. Crop Prot. 29(7): 643–651. doi: 10.1016/j.cropro.2010.02.019.
Avenot, H., P. Simoneau, B. Iacomi-Vasilescu, and N. Bataillé-Simoneau. 2005. Characterization of mutations in the two-component histidine kinase gene AbNIK1 from Alternaria brassicicola that confer high dicarboximide and phenylpyrrole resistance. Curr. Genet. 46(4): 234–243. doi: 10.1007/s00294-005-0568-2.
Avenot, H.F., A. Thomas, R.D. Gitaitis, D.B. Langston, and K.L. Stevenson. 2011. Molecular characterization of boscalid- and penthiopyrad-resistant isolates of Didymella bryoniae and assessment of their sensitivity to fluopyram. Pest Manag. Sci. 68(4): 645–651. doi: 10.1002/ps.2311.
Avila-adame, C., and W. Köller. 2003. Characterization of spontaneous mutants of Magnaporthe grisea expressing stable resistance to the Qo-inhibiting fungicide azoxystrobin. Curr. Genet. 42: 332–338. doi: 10.1007/s00294-002-0356-1.
Avila-Adame, C., and W. Köller. 2002. Disruption of the alternative oxidase gene in Magnaporthe grisea and its impact on host infection. Mol. Plant-Microbe Interact. 15(5): 493–500. doi: 10.1094/MPMI.2002.15.5.493.
Ayer, K.M., M.W. Choi, S.T. Smart, A.E. Moffett, and K.D. Cox. 2020. The effects of succinate dehydrogenase inhibitor fungicide dose and mixture on development of resistance in Venturia inaequalis. Appl. Environ. Microbiol. 86(17). doi: 10.1128/AEM.01196-20.
Aylor, D.E. 1993. Relative collection efficiency of Rotorod and Burkard spore samplers for airborne Venturia inaequalis ascospores. Phytopathology 83(10): 1116–1119. doi: 10.1094/Phyto-83-1116.
Babuschkina, I.. 1995. Ad floram ascomycetum reservati svirensis inferioris notula. Nov. Sist. Vyss. i Nizshikh Rastenii 30: 16–18.
Ban, L.-P., J.-D. Li, M. Yan, Y.-H. Gao, J.-J. Zhang, et al. 2021. Illumina sequencing of 18S/16S rRNA reveals microbial community composition, diversity, and potential pathogens in 17
169
turfgrass seeds. Plant Dis.: PDIS-06-18-0946. doi: 10.1094/pdis-06-18-0946-re. Banno, S., K. Yamashita, F. Fukumori, K. Okada, H. Uekusa, et al. 2009. Characterization of
QoI resistance in Botrytis cinerea and identification of two types of mitochondrial cytochrome b gene. Plant Pathol. 58: 120–129. doi: 10.1111/j.1365-3059.2008.01909.x.
Bansal, R.K., S.A. Menzies, and P.G. Broadhurst. 1991. Pathogenic variation among strains of Stemphylium vesicarium causing leaf spot of asparagus. New Zeal. J. Crop Hortic. Sci. 19: 69–71. doi: 10.1080/01140671.1991.10418108.
Bartlett, D.W., J.M. Clough, J.R. Godwin, A.A. Hall, M. Hamer, et al. 2002. The strobilurin fungicides. Pest Manag. Sci. 58: 649–662. doi: 10.1002/ps.520.
Basallote-Ureba, M.J., A.M. Prados-Ligero, and J.M. Melero-Vara. 1999. Aetiology of leaf spot of garlic and onion caused by Stemphylium vesicarium in Spain. Plant Pathol. 48: 139–145. doi: 10.1046/j.1365-3059.1999.00313.x.
Bauske, M.J., S.K.R. Yellareddygari, and N.C. Gudmestad. 2018. Potential impact of fluopyram on the frequency of the D123E mutation in Alternaria solani. Plant Dis. 102(3): 656–665. doi: 10.1094/PDIS-06-17-0853-RE.
Behera, S., P. Santra, S. Chattopadhyay, S. Das, and T.K. Maity. 2013. Variation in onion varieties for reaction to natural infection of Alternaria porri (Ellis) Ciff. and Stemphylium vesicarium (Wallr.). The Bioscan 8(3): 759–761.
Belisario, A., S. Vitale, and L. Luongo. 2008. First report of Stemphylium vesicarium as causal agent of wilting and root rotting of radish sprouts in Italy. Plant Dis. 92(4): 651. doi: 10.1094/PDIS-92-4-0651C.
Bello, J.C., M.L. Sakalidis, D.E. Perla, and M.K. Hausbeck. 2021. Detection of airborne sporangia of Pseudoperonospora cubensis and P. humuli in Michigan using Burkard spore traps coupled to qPCR. Plant Dis. Epub ahead: 1–36. doi: 10.1094/PDIS-07-20-1534-RE.
Berbee, M.L., M. Pirseyedi, and S. Hubbard. 1999. Cochliobolus phylogenetics and the origin of known, highly virulent pathogens, inferred from ITS and glyceraldehyde-3-phosphate dehydrogenase gene sequences. Mycologia 91(6): 964–977. doi: 10.1080/00275514.1999.12061106.
Bohlen-Janssen, H. 2018. Identification of the causal agent, epidemiology and forecast of purple spot (Stemphylium vesicarium) on asparagus (Asparagus officinalis L.). PhD Thesis. Leibniz University Hannover, Faculty of Natural Sciences.
Bohlen-Janssen, H., P. Racca, B. Hau, and A. Wichura. 2018a. Modelling the effects of temperature and wetness on the polycyclic phase of Stemphylium vesicarium, the pathogen causing purple spot on asparagus (Asparagus officinalis L.). J. Phytopathol. 166: 333–345. doi: 10.1111/jph.12691.
Bohlen-Janssen, H., P. Racca, B. Hau, and A. Wichura. 2018b. Modelling some aspects of the monocyclic phase of Stemphylium vesicarium, the pathogen causing purple spot on asparagus (Asparagus officinalis L.). Eur. J. Phytopathol.: 1–15. doi: 10.1007/s10658-018-1455-2.
Boiteux, I.S., M.F. Lima, J.A. Menezes Sobrinho, and C.A. Lopes. 1994. A garlic (Allium sativum) leaf blight caused by Stemphylium vesicarium in Brazil. Plant Pathol. 43(2): 412–414. doi: 10.1111/j.1365-3059.1994.tb02704.x.
Bolton, M.D., V. Rivera, and G. Secor. 2013. Identification of the G143A mutation associated with QoI resistance in Cercospora beticola field isolates from Michigan, United States. Pest Manag. Sci. 69: 35 – 39. doi: 10.1002/ps.3358.
Bosch Serra, A.., and L. Currah. 2002. Agronomy of onions. In: Rabinowitch, H.D. and Currah,
170
L., editors, Allium crop science: Recent advances. CABI Publishing, New York. p. 187–232 Bossche, H. Van den, G. Willemsens, W. Cools, P. Marichal, and W. Lauwers. 1983. Hypothesis
on the molecular basis of the antifungal activity of N-substituted imidazoles and triazoles. Biochem. Soc. Trans. 11(6): 665–667. doi: 10.1042/bst0110665.
Bowley, S.R. 2015. A Hitchhiker’s Guice to Statistics in Biology. Plants et al., Inc., Kincardne, ON.
Bradley, D.J., G.S. Gilbert, and I.M. Parker. 2003. Susceptibility of clover species to fungal infection: The interaction of leaf surface traits and environment. Am. J. Bot. 90(6): 857–864. doi: 10.3732/ajb.90.6.857.
Brahmanage, R.S., D.N. Wanasinghe, M.C. Dayarathne, R. Jeewon, J. Yan, et al. 2019. Morphology and phylogeny reveal Stemphylium dianthi sp. nov. and new host records for the sexual morphs of S. beticola, S. gracilariae, S. simmonsii and S. vesicarium from Italy and Russia. Phytotaxa 411(4): 243–263. doi: 10.11646/phytotaxa.411.4.1.
Brent, K.J., and D.W. Hollomon. 2007a. Fungicide resistance in crop pathogens: How can it be managed? 2nd edition. Fungicide Resistance Action Committee, Brussels, Belgium.
Brent, K.J., and D.W. Hollomon. 2007b. Fungicide resistance: the assessment of risk. 2nd Ed. Fungicide Resistance Action Committee, Brussels, Belgium.
Brewster, J.L. 2008. Onions and other vegetable Alliums. 2nd edition. CAB International, Cambridge, MA.
Brown, J., M. Atkinson, C. Ridout, S. Sacristan, A. Tellier, et al. 2006. Natural selection in plant-pathogen interactions: from models to laboratory to field (abstract). 13th Conf. Spanish Soc. Phytopathol. Murica: 15.
Brunelli, A., A. Pirondi, I. Portillo, M. Vignini, F. Vigna, et al. 2014. Aggiornamenti sperimentali sull’attivita’ di vecchi e nuovi fungicidi contro la maculatura bruna del pero (Stemphylium vesicarium). Giornate Fitopatol. 2: 109–118.
Bullerman, L.B. 2003. Mycotoxins- Classifications. In: Caballero, B., Trugo, L.C., and Finglas, P.M., editors, Encyclopedia of Food Sciences and Nutrition. Second Edition. Academic Press, San Diego, United States. p. 4080–4089
Bush, E., and D.S. Lemmen. 2019. Canada’s Changing Climate Report; Government of Canada. Gatineau, QC.
Câmara, M.P.S., N.R.O.’ Neill, and P. Van Berkum. 2002. Phylogeny of Stemphylium spp. based on ITS and glyceraldehyde-3-phosphate dehydrogenase gene sequences. Mycologia 94(4): 660–672. doi: 10.1080/15572536.2003.11833194.
Carisse, O., H.A. McCartney, J.A. Gagnon, and L. Brodeur. 2005. Quantification of airborne inoculum as an aid in the management of botrytis leaf blight of onion caused by Botrytis squamosa. Plant Dis. 89(7): 726–733. doi: 10.1094/PD-89-0726.
Carisse, O., N. McRoberts, and L. Brodeur. 2008. Comparison of monitoring- and weather-based risk indicators of Botrytis leaf blight of onion and determination of action thresholds. Can. J. Plant Pathol. 30(3): 442–456. doi: 10.1080/07060660809507542.
Carisse, O., D.M. Tremblay, and A. Lefebvre. 2014. Comparison of Botrytis cinerea airborne inoculum progress curves from raspberry, strawberry and grape plantings. Plant Pathol. 63(5): 983–993. doi: 10.1111/ppa.12192.
Carisse, O., D.M. Tremblay, C.A. Lévesque, K. Gindro, P. Ward, et al. 2009. Development of a taqman real-time pcr assay for quantification of airborne conidia of Botrytis squamosa and management of Botrytis leaf blight of onion. Phytopathology 99(11): 1273–1280. doi: 10.1094/PHYTO-99-11-1273.
171
Cedeño, L., C. Carrero, K. Quintero, H. Pino, and W. Espinoza. 2003. Stemphylium vesicarium, causal agent of severe foliar blight on garlic and onion in Mérida, Venezuela. Interciencia 28(3): 174–177.
Chand, G., and S. Kumar, editors. 2016. Crop diseases and their management integrated approaches. Apple Academic Press, Oakville, ON.
Chaput, J. 1995. Identification of diseases and disorders of onions. http://www.omafra.gov.on.ca/english/crops/facts/95-063.htm (accessed 27 April 2018).
Chase, M.W., J.L. Reveal, and M.F. Fay. 2009. A subfamilial classification for the expanded asparagalean families Amaryllidaceae, Asparagaceae and Xanthorrhoeaceae. Bot. J. Linn. Soc. doi: 10.1111/j.1095-8339.2009.00999.x.
Chen, S.., C.X. Luo, M.J. Hu, and G. Schhabel. 2016. Fitness and competitive ability of Botrytis cinerea isolates with resistance to multiple chemical classes of fungicides. Dis. Control Pest Manag. 106(9): 997–1005. doi: 10.1094/PHYTO-02-16-0061-R.
Chen, W., L. Wei, H. Zheng, P. Zhang, B. Wang, et al. 2020. Biological characteristics and molecular mechanism of procymidone-resistance in Stemphylium eturmiunum from garlic. Plant Dis. First Look: 1–39. doi: 10.1094/pdis-08-20-1764-re.
Chen, C.-J., J.-J. Yu, C.-W. Bi, Y.-N. Zhang, J.-Q. Xu, et al. 2009. Mutations in a β-tubulin confer resistance of Gibberella zeae to benzimidazole fungicides. Phytopathology 99(12): 1403–1411.
Chester, K. 1950. Plant disease losses: their appraisal and interpretation. Plant Dis. Report. Supplement: 190–362. doi: 10.5962/bhl.title.86198.
Choudhary, D.K., A. Prakash, and B.N. Johri. 2007. Induced systemic resistance (ISR) in plants: Mechanism of action. Indian J. Microbiol. 47: 289–297. doi: 10.1007/s12088-007-0054-2.
Chowdhury, H.A., N. Islam, B. Hossain, M. Ahmed, S. Mohsin, et al. 2015. A comparative analysis of culture media for optimizing the mycelial growth and sporulation of Stemphylium vesicarium cause of white blotch of onion. J. Agric. Sci. Technol. A 5(6): 440–448. doi: 10.17265/2161-6256/2015.06.006.
Collina, M., G. Alberoni, and A. Brunelli. 2007. First occurrence of strobilurin-resistant isolates of Stemphylium vesicarium in an Italian pear orchard. Commun. Agric. Appl. Biol. Sci. 71(2): 735–738.
Conte, J., M.J. Potoczniak, and S.S. Tobe. 2018. Using synthetic oligonucleotides as standards in probe-based qPCR. Biotechniques 64(4): 177–179. doi: 10.2144/btn-2018-2000.
Corio-Costet, M.-F., M.-C. Dufour, J. Cigna, P. Abadie, and W.-J. Chen. 2011. Diversity and fitness of Plasmopara viticola isolates resistant to QoI fungicides. Eur. J. Plant Pathol. 129(315–329). doi: 10.1007/s10658-010-9711-0.
Cortes-Barco, A.M., T. Hsiang, and P.H. Goodwin. 2010. Induced systemic resistance against three foliar diseases of Agrostis stolonifera by (2R,3R)-butanediol or an isoparaffin mixture. Ann. Appl. Biol. 157: 179–189. doi: 10.1111/j.1744-7348.2010.00417.x.
Cox, K.D., K. Quello, R.J. Deford, and J.L. Beckerman. 2009. A rapid method to quantify fungicide sensitivity in the brown rot pathogen Monilinia fructicola. Plant Dis. 93(4): 328–331. doi: 10.1094/PDIS-93-4-0328.
Čuš, F., and P. Raspor. 2008. The effect of pyrimethanil on the growth of wine yeasts. Lett. Appl. Microbiol. 47(1): 54–59. doi: 10.1111/j.1472-765X.2008.02383.x.
Dangi, R., P. Sinha, S. Islam, A. Gupta, A. Kumar, et al. 2019. Screening of onion accessions for Stemphylium blight resistance under artificially inoculated field experiments. Australas. Plant Pathol. 48(4): 375–384. doi: 10.1007/s13313-019-00639-x.
172
Das, A., S. Dutta, S. Jash, A.R. Barman, R. Das, et al. 2019. Current knowledge on pathogenicity and management of Stemphylium botryosum in lentils. Pathogens 8(255): 1–16. doi: 10.3390/pathogens8040225.
Davis, V.M., and M.E. Stack. 1991. Mutagenicity of stemphyltoxin III, a metabolite of Alternaria alternata. Appl. Environ. Microbiol. 57(1): 180–182. doi: 10.1128/AEM.57.1.180-182.1991.
Deising, H.B., S. Reimann, and S.F. Pascholati. 2008. Mechanisms and significance of fungicide resistance. Brazilian J. Microbiol. 39(2): 286–295. doi: 10.1590/S1517-83822008000200017.
Dekker, J. 1976. Acquired reistance to fungicides. Annu. Rev. Phytopathol. 14: 405–428. doi: 10.1146/annurev.py.14.090176.002201.
Denis, P., T. Cooke, and S. House. 2010. Diseases of Vegetable Crops in Australia. CSIRO Publishing, Collingwood, Australia.
Deora, A., B. Gossen, S. Amirsadeghi, and M. McDonald. 2015. A multiplex qPCR assay for detection and quantification of Plasmodiophora brassicae in soil. Plant Dis. 99(7): 1002–1009. doi: 10.1094/PDIS-06-14-0608-RE.
Deshpande, R.Y., K.G. Hubbard, D.P. Coyne, J.R. Steadman, and A.M. Parkhurst. 1995. Estimating leaf wetness in dry bean canopies as a prerequisite to evaluating white mold disease. Agron. J. 87(4): 613–619. doi: 10.2134/agronj1995.00021962008700040002x.
Dhar, N., B.E. Mamo, K. V. Subbarao, S.T. Koike, A. Fox, et al. 2020. Measurements of aerial spore load by qPCR facilitates lettuce downy mildew risk advisement. Plant Dis. 104(1): 82–93. doi: 10.1094/PDIS-03-19-0441-RE.
Díaz-Valderrama, J.R., V.H. Casa-Coila, V. Sencia-Torres, D. Macedo-Valdivia, S.J. Zanabria-Gálvez, et al. 2021. First report of Stemphylium leaf spot caused by Stemphylium vesicarium on alfalfa (Medicago sativa) in Peru. Plant Dis. 105(4): 1196. doi: 10.1094/PDIS-09-20-2059-PDN.
Drinkwater, W.O., and B.E. Janes. 1955. Effects of irrigation and soil moisture on maturity, yield and storage of two onion hybrids. Proc. Am. Soc. Hortic. Sci. 66: 267–279.
Dry, I.B., K.H. Yuan, and D.G. Hutton. 2004. Dicarboximide resistance in field isolates of Alternaria alternata is mediated by a mutation in a two-component histidine kinase gene. Fungal Genet. Biol. 41: 102–108. doi: 10.1016/j.fgb.2003.09.002.
Duan, Y., C. Ge, S. Liu, J. Wang, and M. Zhou. 2013. A two-component histidine kinase Shk1 controls stress response, sclerotial formation and fungicide resistance in Sclerotinia sclerotiorum. Mol. Plant Pathol. 14(7): 708–718. doi: 10.1111/mpp.12041.
Dube, J.P., M. Truter, and J.E. van der Waals. 2014. First report of resistance to QoI fungicides in Alternaria alternata isolates from potato in South Africa. Plant Dis. 98(10): 1431. doi: 10.1094/PDIS-03-14-0225-PDN.
Dudka, I.O., V.P. Heluta, Y.Y. Tykhonenko, T.V. Andrianova, V.P. Hayova, et al. 2004. Fungi of the Crimean Peninsula. Kholodny Institute of Botany, National Academy of Sciences of Ukraine.
Dung, J.K.S., J.C. Scott, Q. Cheng, S.C. Alderman, N. Kaur, et al. 2018. Detection and quantification of airborne Claviceps purpurea sensu lato ascospores from Hirst-type spore traps using real-time quantitative PCR. Plant Dis. 102(12): 2487–2493. doi: 10.1094/pdis-02-18-0310-re.
Dyakov, Y.. 2007. Chapter 0- Overview on parasitism. In: Dyakov, Y.., Dzhavakhiya, V.G., and Korpela, T., editors, Studies in Plant Science, Comprehensive and Molecular
173
Phytopathology. Elsevier. p. 3–17 Edgington, L., H. Buchenauer, and F. Grossmann. 1973. Bioassay and transcuticular movement
of systemic fungicides. Pestic. Sci. 4(5): 747–752. doi: 10.1002/ps.2780040517. Eisenman, H.C., and A. Casadevall. 2012. Synthesis and assembly of fungal melanin. Appl.
Microbiol. Biotechnol. 93(3): 931–940. doi: 10.1007/s00253-011-3777-2. Ene, I. V., and R.J. Bennett. 2014. The cryptic sexual strategies of human fungal pathogens. Nat.
Rev. Microbiol. 12(4): 239–251. doi: 10.1038/nrmicro3236. Everts, K.L., and M.L. Lacy. 1990. Influence of environment on conidial concentration of
Alternaria porri in air and on purple blotch incidence on onion. Phytopathology 80(12): 1387–1391. doi: 10.1094/Phyto-80-1387.
Fairchild, K.L., T.D. Miles, and P.S. Wharton. 2013. Assessing fungicide resistance in populations of Alternaria in Idaho potato fields. Crop Prot. 49: 31–39. doi: 10.1016/j.cropro.2013.03.003.
Falloon, P.G., L.M. Falloon, and R.G. Grogan. 1984. Purple spot and Stemphylium leaf spot or asparagus. Calif. Agric. 38(7): 21. doi: 10.3733/ca.v038n07p21.
Falloon, P.G., L.M. Falloon, and R.G. Grogan. 1987. Etiology and epidemiology of Stemphylium leaf spot and purple spot of asparagus in California. Phytopathology 77(3): 407–413. doi: 10.1094/Phyto-77-407.
FAOSTAT. 2020. Food and Agriculture Organization of the United Nations Database. http://www.fao.org/faostat/en/?#data/QC (accessed 1 March 2020).
Fernández-Ortuño, D., A. Pérez-García, M. Chamorro, E. de la Peña, J.A. Torés, et al. 2017. Resistance to the SDHI fungicides boscalid, fluopyram, fluxapyroxad, and penthiopyrad in Botrytis cinerea from commercial strawberry fields in Spain. Plant Dis. 101(7): 1306–1313. doi: 10.1094/PDIS-01-17-0067-RE.
Fernández-Ortuño, D., J.A. Torés, A. de Vicente, and A. Pérez-García. 2008. Mechanisms of resistance to QoI fungicides in phytopathogenic fungi. Int. Microbiol. 11: 1–10. doi: 10.2436/20.1501.01.38.
Fillinger, S., S. Ajouz, P.C. Nicot, P. Leroux, and M. Bardin. 2012. Functional and structural comparison of pyrrolnitrin- and iprodione-induced modifications in the class III histidine-kinase Bos1 of Botrytis cinerea. PLoS One 7(9, e42520): 1–14. doi: 10.1371/journal.pone.0042520.
Fonseka, D., and N. Gudmestad. 2016. Spatial and temporal sensitivity of Alternaria species associated with potato foliar diseases to demethylation inhibiting and anilino-pyrimidine fungicides. Plant Dis. 100: 1848–1857. doi: 10.1094/PDIS-01-16-0116-RE.
Foster, J.M. 2018. Epidemiology and management of foliar diseases in asparagus (Asparagus officinalis L.). PhD Thesis, Plant Agriculture. University of Guelph, Guelph, ON.
Foster, J.M., and M.R. McDonald. 2018. Evaluation of the TOMcast forecasting model in asparagus for management of Stemphylium leaf spot in Ontario, Canada. Plant Dis. 102(November): 2253–2257. doi: PDIS-10-17-1631-RE.
Foster, J.M., C.S. Tayviah, S.M. Stricker, B.D. Gossen, and M.R. McDonald. 2019. Susceptibility to Stemphylium vesicarium of asparagus, onion, pear, and rye in Canada. Can. J. Plant Pathol. 41(2): 228–241. doi: 10.1080/07060661.2019.1574901.
Fraaije, B.A., C. Bayon, S. Atkins, H.J. Cools, J.A. Lucas, et al. 2012. Risk assessment studies on succinate dehydrogenase inhibitors, the new weapons in the battle to control Septoria leaf blotch in wheat. Mol. Plant Pathol. 13(3): 263–275. doi: 10.1111/j.1364-3703.2011.00746.x.
174
FRAC. 2017. FRAC code list 2017: Fungicides sorted by mode of action (including FRAC Code numbering). Fungic. Resist. Action Comm. http://www.frac.info/docs/default-source/publications/frac-code-list/frac-code-list-2017-final.pdf?sfvrsn=fab94a9a_2 (accessed 9 February 2018).
FRAG-UK. 2016. Fungicide resistance management in cereals. Fungicide Resistance Action Group, UK.
French, A.. 1989. California Plant Disease Host Index. Sacramento. Frenz, D.A. 2000. The effect of windspeed on pollen and spore counts collected with the
Rotorod Sampler and Burkard spore trap. Ann. Allergy, Asthma Immunol. 85(5): 392–394. doi: 10.1016/S1081-1206(10)62553-7.
Friesen, N., R.M. Fritsch, and F.R. Blattner. 2006. Phylogeny and new intrageneric classification of Allium (Alliaceae) based on nuclear ribosomal DNA ITS sequences. Aliso 22: 372–395. doi: 10.5642/aliso.20062201.31.
Fritsch, R.M., and N. Friesen. 2002. Evolution, domestication and taxonomy. In: Rabinowitch, H.D. and Currah, L., editors, Allium crop science: Recent advances. CABI Publishing, New York. p. 5–30
Fritz, R., C. Lanen, F. Chapeland-Leclerc, and P. Leroux. 2003. Effect of the anilinopyrimidine fungicide pyrimethanil on the cystathionine β-lyase of Botrytis cinerea. Pestic. Biochem. Physiol. 77(2): 54–65. doi: 10.1016/S0048-3575(03)00094-4.
Gaikwad, K.N., U. Jadhav, S, and V.R. Kakulte. 2014. Management of fungal diseases of onion (Allium cepa L.) by using plant extract. Int. J. Life Sci. Pharma Res. 4(2): 28–30.
Gazzetti, K., E.L. Diaconu, I.M. Nanni, A. Ciriani, and M. Collina. 2019. Genome sequence resource for Stemphylium vesicarium, causing brown spot disease of pear. Mol. Plant-Microbe Interact. 32(8): 935–938. doi: 10.1094/MPMI-11-18-0299-A.
Geary, B., D.A. Johnson, P.B. Hamm, S. James, and K.A. Rykbost. 2007. Potato silver scurf affected by tuber seed treatments and locations, and occurrence of fungicide resistant isolates of Helminthosporium solani. Plant Dis. 91(3): 315–320. doi: 10.1094/PDIS-91-3-0315.
Gedefaw, Y., A. Gezahegn, A. Fekadu, and Z. Mehari. 2019. First report of Stemphylium vesicarium causing onion Stemphylium leaf blight in Ethiopia. Agric. Sci. 10: 1104–1112. doi: 10.4236/as.2019.108083.
Gehmann, K., R. Nyfeler, A. Leadbeater, D. Nevill, and D. Sozzi. 1990. CGA 173506: a new phenylpyrrole fungicide for broad-spectrum disease control. Proceedings of the Brighton crop protection conference pests diseases. British Crop Protection Council, Farnham. p. 339–406
Gent, D.H., and H.F. Schwartz. 2005. Management of Xanthomonas leaf blight of onion with a plant activator, biological control agents, and copper bactericides. Plant Dis. 89(6): 631–639. doi: 10.1094/PDIS-91-7-0871.
Gisi, U., H. Sierotzki, A. Cook, and A. McCaffery. 2002. Mechanisms influencing the evolution of resistance to Qo inhibitor fungicides. Pest Manag. Sci.: 859–867. doi: 10.1002/ps.565.
Gorter, G.J.M.A. 1977. Index of plant pathogens and the diseases they cause in cultivated plants in South Africa. Republic 392: 1-177. (6959). Repub. South Africa, Dep. Agric. Sci. Bull. 392: 1–177.
Gossen, B.D., O. Carisse, H. Van Der Heyden, and M.R. Mcdonald. 2014. Recent changes in fungicide use and the fungicide insensitivity of plant pathogens in Canada. Can. J. Plant Pathol. 36(3): 327–340. doi: 10.1080/07060661.2014.925506.
175
Gossen, B.D., C.S. Tayviah, and M.R. McDonald. 2021. The role of ascospores and conidia, in relation to weather variables, in the epidemiology of Stemphylium leaf blight of onion. Plant Dis. Online. doi: doi.org/10.1094/PDIS-06-20-1283-RE.
Gourlie, R., and T. Hsiang. 2017. Resistance to dicarboximide fungicides in a Canadian population of Microdochium nivale. Int. Turfgrass Soc. Res. J. 13(1): 133–138. doi: 10.2134/itsrj2016.06.0497.
Graf, S., H. Bohlen-Janssen, S. Miessner, A. Wichura, and G. Stammler. 2016. Differentiation of Stemphylium vesicarium from Stemphylium botryosum as causal agent of the purple spot disease on asparagus in Germany. Eur. J. Plant Pathol. 144: 411–418. doi: 10.1007/s10658-015-0777-6.
Granke, L.L., and M.K. Hausbeck. 2010. Influence of environment on airborne spore concentrations and severity of asparagus purple spot. Plant Dis. 94(7): 843–850. doi: 10.1094/PDIS-94-7-0843.
Grenon, G., B. Singh, A. de Sena, C.A. Madramootoo, C. von Sperber, et al. 2021. Phosphorus fate, transport and management on subsurface drained agricultural organic soils: A review. Environ. Res. Lett. 16: 013004. doi: 10.1088/1748-9326/abce81.
Griffith, G.W., G.L. Easton, A. Detheridge, K. Roderick, A. Edwards, et al. 2007. Copper deficiency in potato dextrose agar causes reduced pigmentation in cultures of various fungi. FEMS Microbiol. Lett. 276(2): 165–171. doi: 10.1111/j.1574-6968.2007.00923.x.
Grode, A.S., E. Brisco-McCann, P. Wiriyajitsonboom, M.K. Hausbeck, and Z. Szendrei. 2019. Managing onion thrips can limit bacterial stalk and leaf necrosis in Michigan onion fields. Plant Dis. 103(5): 938–943. doi: 10.1094/pdis-07-18-1271-re.
Groves, J.W., and A.J. Skolko. 1944. Notes on seed-borne fungi: I. Stemphylium. Can. J. Res. 22(4): 190–199. doi: 10.1139/cjr44c-016.
Gupta, P.K. 2016. Natural laws concerning toxicology. Fundamentals of Toxicology: Essential Concepts and Applications. Academic Press, London, United Kingdom. p. 31–43
Gupta, R.P., K.J. Srivastava, and U.B. Pandey. 1994. Diseases and insect pests of onion in India. Acta Hortic. 358: 265–270. doi: 10.17660/ActaHortic.1994.358.43.
Gutarowska, B., and Z. Żakowska. 2009. Mathematical models of mycelium growth and ergosterol synthesis in stationary mould culture. Lett. Appl. Microbiol. 48(5): 605–610. doi: 10.1111/j.1472-765X.2009.02577.x.
Hägerhäll, C. 1997. Succinate: quinone oxidoreductases, Variations on a conserved theme. Biochim. Biophys. Acta - Bioenerg. 1320(2): 107–141. doi: 10.1016/s0005-2728(97)00019-4.
Hanelt, P. 1990. Taxonomy, evolution and history. In: Rabinowitch, H.D. and Brewster, J.L., editors, Onions and Allied Crops. Vol. 1. CRC Press, Boca Raton, Florida. p. 1–26
Hanlin, R.T. 1963. A revision of the Ascomycetes of Georgia. Mimeo Seri. University of Georgia. College of Agriculture, Georgia Experiment Station.
Hanse, B., E.E.M. Raaijmakers, A.H.L. Schoone, and P.M.S. van Oorschot. 2015. Stemphylium sp., the cause of yellow leaf spot disease in sugar beet (Beta vulgaris L.) in the Netherlands. Eur. J. Plant Pathol. 142: 319–330. doi: 10.1007/s10658-015-0617-8.
Hartmann, D.L., A.M.G. Klein Tank, M. Rusticucci, L.V. Alexander, S. Brönnimann, et al. 2013. Observations: Atmosphere and Surface. In: Stocker, T.F., Qin, D., Plattner, G.-K., Tignor, M., Allen, S.K., et al., editors, Climate Change 2013: The Physical Science Basis. Contribution of Working Group I to the Fifth Assessment Report of the Intergovernmental Panel on Climate Change. Cambridge University Press, Cambridge, United Kingdom and
176
New York, NY, USA. p. 159–254 Hassan, M.H.A., A.D.A. Allam, K.A.M. Abo-Elyousr, and M.A.M. Hussein. 2007. First report
of Stemphylium leaf blight of onion caused by Stemphylium vesicarium in Egypt. Plant Pathol. 56: 724. doi: 10.1111/j.1365-3059.2007.01581.x.
Hassan, M., V. Yousuf, Z.A. Bhat, N.A. Bhat, T.A. Shah, et al. 2020. Morpho-cultural and pathogenic variability among isolates of Stemphylium vesicarium (Wallr.) E. Simmons, causing Stemphylium blight in onion collected from different geographical regions of Kashmir valley. Indian Phytopathol. 73(3): 469–481. doi: 10.1007/s42360-020-00253-8.
Hausbeck, M.K., J. Hartwell, and J.M. Byrne. 1999. Epidemiology of Stemphylium leaf spot and purple spot in no-till asparagus. Acta Hortic. 479: 205–210. doi: 10.17660/ActaHortic.1999.479.28.
Hay, F.S., S. Sharma, C. Hoepting, D. Strickland, K. Luong, et al. 2019. Emergence of Stemphylium leaf blight of onion in New York associated with fungicide resistance. Plant Dis. 103(12): 3083–3092. doi: PDIS-03-19-0676-RE.
He, M., Y. Wang, E. Wu, L. Shen, and L. Yang. 2019. Constraining evolution of Alternaria alternata resistance to a demethylation inhibitor (DMI) fungicide difenoconazole. Front. Microbiol. 10: 1609. doi: 10.3389/fmicb.2019.01609.
Health Canada. 2020. Pesticide Label Search. http://pr-rp.hc-sc.gc.ca/ls-re/index-eng.php (accessed 30 June 2020).
Heaney, S., A. Hall, S. Davis, and G. Olaya. 2000. Resistance to fungicides in the QoI-STAR cross resistance group: current perspectives. The BCPC Conference: Pests and disease, Volume 2. Brighton, UK. p. 755–762.
Henriquez, J.S.L., O. V Sarmiento, and P.C. Alarcon. 2011. Sensitivity of Venturia inaequalis Chilean isolates to difenoconazole, fenarimol, mancozeb, and pyrimethanil. Chil. J. Agric. Res. 71(1): 39–44. doi: 10.4067/S0718-58392011000100005.
Hernandez-Perez, P. 2005. Management of Seedborne Stemphylium botryosum and Cladosporium variabile causing Leaf Spot of Spinach Seed Crops In Western Washington. doi: 10.1007/978-1-4614-7990-1.
Hewelke, E., J. Szatylowicz, T. Gnatowski, and R. Oleszczuk. 2016. Effects of soil water repellency on moisture patterns in a degraded sapric histosol. L. Degrad. Dev. 27(4): 955–964. doi: 10.1002/ldr.2305.
Hoepting, C. 2016. Efficacy of fungicide treatments for control of Stemphylium leaf blight on onion in 2015. Plant Dis. 10: V121.
Hoepting, C. 2017a. Efficacy of fungicide treatments for control of Stemphylium leaf blight on onion, 2016. Plant Dis. Manag. Reports 11: V128.
Hoepting, C. 2017b. Effect of fungicide timing on Stemphylium leaf blight on onion, 2016. Plant Dis. Manag. Reports 11: V130.
Hoepting, C. 2017c. Efficacy of fungicide treatments for control of Botrytis leaf blight and Stemphylium leaf blight on onion, 2016. Plant Dis. Manag. Reports 11: V127.
Hoepting, C. 2018a. Efficacy of fungicide treatments for control of Stemphylium leaf blight on onion, 2017. Plant Dis. Manag. Reports 12: V146.
Hoepting, C. 2018b. Effect of fungicide timing on Stemphylium leaf blight on onion, 2017. Plant Dis. Manag. Reports 12: V101.
Hoepting, C. 2018c. Effect of fungicide programs for control of Stemphylium leaf blight on onion, 2017. Plant Dis. Manag. Reports 12: V144.
Hoepting, C. 2019. Efficacy of fungicide treatments for control of Stemphylium leaf blight on
177
onion, 2018. Plant Dis. Manag. Reports 13: V168. Hoepting, C. 2020a. Efficacy of fungicide treatments for control of Stemphylium leaf blight and
Botrytis leaf blight in onion, Elba, 2019. Plant Dis. Manag. Reports 14: V220. Hoepting, C. 2020b. Efficacy of fungicide treatments for control of Stemphylium leaf blight and
Botrytis leaf blight in onion, Sodus, 2019. Plant Dis. Manag. Reports 12: V219. Hoepting, C. 2020c. Effect of fungicide application timing for control of Botrytis leaf blight and
Stemphylium leaf blight in onion, 2019. Plant Dis. Manag. Reports 12: V221. Hoepting, C., and S. Pethybridge. 2016. Management of Stemphylium leaf blight of onion with
fungicides in New York (Abstract only). Phytopathology 106(S2.1): S2.3. doi: http://dx.doi.org/10.1094/PHYTO-106-4-S2.1.
Hoffman, D.W., and N.R. Richards. 1955. Soil survey of York county. Guelph, ON. Holden, M.J., S.A. Rabb, Y.B. Tewari, and M.R. Winchester. 2007. Traceable phosphorus
measurements by ICP-OES and HPLC for the quantitation of DNA. Anal. Chem. 79(4): 1536–1541. doi: 10.1021/ac061463b.
Hopkins, M. 2009. Fluopyram: New Fungicide From Bayer CropScience. CropLife. Hospodsky, D., N. Yamamoto, and J. Peccia. 2010. Accuracy, precision, and method detection
limits of quantitative PCR for airborne bacteria and fungi. Appl. Environ. Microbiol. 76(21): 7004–7012. doi: 10.1128/AEM.01240-10.
Hou, Y.-P., X.-W. Mao, X.-P. Qu, J.-X. Wang, C.-J. Chen, et al. 2018. Molecular and biological characterization of Sclerotinia sclerotiorum resistant to the anilinopyrimidine fungicide cyprodinil. Pestic. Biochem. Physiol. 146: 80–89. doi: 10.1016/j.pestbp.2018.03.001.
Howell, C.R. 2003. Mechanisms employed by Trichoderma species in the biological control of plant diseases: The history and evolution of current concepts. Plant Dis. 87: 4–10. doi: 10.1094/PDIS.2003.87.1.4.
Hradil, C.M., Y.F. Hallock, J. Clardy, D.S. Kenfield, and G. Strobel. 1989. Phytotoxins from Alternaria cassiae. Phytochemistry 28(1): 73–75. doi: 10.1016/0031-9422(89)85011-3.
Hsiang, T., L. Yang A, and W. Barton. 1997. Baseline sensitivity and cross-resistance to demethylation-inhibiting fungicides in Ontario isolates of Sclerotinia homoeocarpa. Eur. J. Plant Pathol. 103: 409–416. doi: 10.1023/A:1008671321231.
Hudson, H.J. 1971. The development of the saprophytic fungal flora as leaves senesce and fall. In: Preece, T.F. and Dickinson, C.H., editors, Ecology of leaf-surface micro-organisms; Proceedings of an international symposium held at the University of Newcastle-Upon-Tyne, September 1970. Academic Press, London. p. 447–455
Hussein, W.T.L., S.A. Ahmad, and M.H.A. Hassan. 2007. Studies on acquired fungicide resistance in Stemphylium vesicarium, the causal pathogen of onion Stemphylium leaf blight (Abstract only). MSc Thesis. Assiut University, Assiut, Egypt.
HyeSun, C., and Y. SeungHun. 1998. Stemphylium vesicarium on garlic and other Allium spp. in Korea. Korean J. Plant Pathol. 14(6): 567–570.
Iacomi-Vasilescu, B., H. Avenot, N. Bataillé-Simoneau, E. Laurent, M. Guénard, et al. 2004. In vitro fungicide sensitivity of Alternaria species pathogenic to crucifers and identification of Alternaria brassicicola field isolates highly resistant to both dicarboximides and phenylpyrroles. Crop Prot. 23: 481–488. doi: 10.1016/j.cropro.2003.10.003.
Ilić, Z., R. Filipović-Trajković, S. Lazić, V. Bursić, and D. Šunjka. 2011. Maleic hydrazide residues in the onion bulbs induce dormancy and hamper sprouting for long periods. J. Food, Agric. Environ. 9(1): 113–118. doi: 10.1234/4.2011.1918.
Inderbitzin, P., J. Harkness, B.G. Turgeon, and M.L. Berbee. 2005. Lateral transfer of mating
178
system in Stemphylium. Proc. Natl. Acad. Sci. 102(32): 11390–11395. doi: 10.1073/pnas.0501918102.
Inderbitzin, P., Y.R. Mehta, and M.L. Berbee. 2009. Pleospora species with Stemphylium anamorphs: a four locus phylogeny resolves new lineages yet does not distinguish among species in the Pleospora herbarum clade. Mycologia 101(3): 329–339. doi: 10.3852/08-071.
Irwin, J.. 1943. On the calculation of the error of biological assays. J. Hyg. (Lond). 43(2): 121–128.
Isenberg, F.M.R., T.H. Thomas, M. Pendergrass, and M. Abdel-Rahman. 1974. Hormone and histological differences between normal and maleic hydrazide treated onions stored over winter. Acta Hortic. 38: 95–125. doi: 10.17660/ActaHortic.1974.38.11.
Issiakhem, F., and Z. Bouznad. 2010. In vitro evaluation of difenoconazole and chlorothalonil on conidial germination and mycelial growth of Alternaria alternata and A. solani causal agent of early blight in Algeria. PPO Spec. Rep. 14: 297–302.
Jaspers, M. V. 2001. Effect of fungicides, in vitro, on germination and growth of Phaeomoniella chlamydospora [Abstract Only]. Phytopathol. Mediterr. 40(2nd workshop on esca and grapevine declines): S453--S458.
Jeschke, P., M. Witschel, W. Krämer, and U. Schirmer, editors. 2019. Modern Crop Protection Compounds. Wiley, Hoboken, New Jersey.
Jespers, A.B.K., L.C. Davidse, and M.A. Dewaard. 1993. Biochemical effects of the phenylpyrrole fungicide fenpiclonil in Fusarium sulphureum (Schlecht). Pestic. Biochem. Physiol. 45(2): 116–129. doi: 10.1006/pest.1993.1014.
Jespers, B.K., and M.A. De Waard. 1995. Effect of fenpiclonil on phosphorylation of glucose in Fusarium sulphureum. Pestic. Sci. 44: 167–175. doi: 10.1002/ps.2780440210.
Jin, L.-H., Y. Chen, C.-J. Chen, J.-X. Wang, and M.-G. Zhou. 2009. Activity of azoxystrobin and SHAM to four phytopathogens. Agric. Sci. China 8(7): 835–842. doi: 10.1016/S1671-2927(08)60285-0.
Johnson, D.A. 1990. Effect of crop debris management on severity of Stemphylium purple spot of asparagus. Plant Dis. 74: 413–415. doi: 10.1094/PD-74-0413.
Johnson, D.A., and J.D. Lunden. 1986. Effects of wounding and wetting duration on infection of asparagus by Stemphylium vesicarium. Plant Dis. 70: 419–420. doi: 10.1094/PD-70-419.
Joseph-Horne, T., and D.W. Hollomon. 1997. Molecular mechanisms of azole resistance in fungi. FEMS Microbiol. Lett. 149: 141–149. doi: 10.1111/j.1574-6968.1997.tb10321.x.
Jurick, W.M., O. Macarisin, V.L. Gaskins, E. Park, J. Yu, et al. 2017. Characterization of postharvest fungicide-resistant Botrytis cinerea isolates from commercially stored apple fruit. Phytopathology 107(3): 362–368. doi: 10.1094/PHYTO-07-16-0250-R.
Kandel, Y.R., D.S. Mueller, T. Legleiter, W.G. Johnson, B.G. Young, et al. 2018. Impact of fluopyram fungicide and preemergence herbicides on soybean injury, population, sudden death syndrome, and yield. Crop Prot. 106(December 2017): 103–109. doi: 10.1016/j.cropro.2017.12.009.
Kanetis, L., H. Förster, and J.E. Adaskaveg. 2010. Determination of natural resistance frequencies in Penicillium digitatum using a new air-sampling method and characterization of fludioxonil- and pyrimethanil-resistant isolates. Phytopathology 100(8): 738–746. doi: 10.1094/PHYTO-100-8-0738.
Karaoglanidis, G.S., C.C. Thanassoulopoulos, and P.M. Ioannidis. 2001. Fitness of Cercospora beticola field isolates - resistant and - sensitive to demethylation inhibitor fungicides. Eur. J. Plant Pathol. 107: 337–347. doi: 10.1023/A:1011219514343.
179
Katoch, S., and S. Kumar. 2017. Perpetuation of Stemphylium blight of garlic under mid hill conditions of Himachal Pradesh. Indian Phytopathol. 70(3): 294–296. doi: 10.24838/ip.2017.v70.i3.72492.
Kent, C.R., P. Ortiz-Bermúdez, S.S. Giles, and C.M. Hull. 2008. Formulation of a defined V8 medium for induction of sexual development of Cryptococcus neoformans. Appl. Environ. Microbiol. 74(20): 6248–6253. doi: 10.1128/AEM.00970-08.
Keon, J.P.R., G.A. White, and J.A. Hargreaves. 1991. Isolation, characterization and sequence of a gene conferring resistance to the systemic fungicide carboxin from the maize smut pathogen, Ustilago maydis. Curr. Genet. 19: 475–481. doi: 10.1007/BF00312739.
Khaleeq, B., and A. Klatt. 1986. Effects of various fungicides and insecticides on emergence of three wheat Cultivars. Agron. J. 78(6): 967–970. doi: 10.2134/agronj1986.00021962007800060007x.
Khan, J., A. Qi, and M.F.R. Khan. 2009. Fluctuations in number of Cercospora beticola conidia in relationship to environment and disease severity in sugar beet. Phytopathology 99(7): 796–801. doi: 10.1094/PHYTO-99-7-0796.
Khokhar, K.M. 2008. Effect of temperature and photoperiod on the incidence of bulbing and bolting in seedlings of onion cultivars of diverse origin. J. Hortic. Sci. Biotechnol. 83(4): 488–496. doi: 10.1080/14620316.2008.11512412.
Khokhar, K.M. 2017. Environmental and genotypic effects on bulb development in onion–a review. J. Hortic. Sci. Biotechnol. doi: 10.1080/14620316.2017.1314199.
Kilani, J., and S. Fillinger. 2016. Phenylpyrroles : 30 years, two molecules and (nearly) no resistance. Fron 7(December): 2014. doi: 10.3389/fmicb.2016.02014.
Kim, Y.-S., E.W. Dixon, P. Vincelli, and M.L. Farman. 2003. Field resistance to strobilurin (QoI) fungicides in Pyricularia grisea caused by mutations in the mitochondrial cytochrome b gene. Phytopathology 93(7): 891–900. doi: 10.1094/PHYTO.2003.93.7.891.
Kim, Y.-M., K. Park, G.-J. Joo, E.-M. Jeong, J.-E. Kim, et al. 2004. Glutathione-dependent biotransformation of the fungicide chlorothalonil. J. Agric. Food Chem. 52(13): 4192–4196. doi: 10.1021/jf040047u.
Kirk, P.M., and B.M. Spooner. 1964. An account of the fungi of Arran, Gigha and Kintyre. Kew Bull. 38(4): 503–587.
Klosterman, S.J., A. Anchieta, N. McRoberts, S.T. Koike, K. V. Subbarao, et al. 2014. Coupling spore traps and quantitative PCR assays for detection of the downy mildew pathogens of Spinach (Peronospora effusa) and beet (P. schachtii). Phytopathology 104(12): 1349–1359. doi: 10.1094/PHYTO-02-14-0054-R.
Köhl, J., B. Groenenboom-De Haas, H. Goossen-Van De Geijn, A. Speksnijder, P. Kastelein, et al. 2009. Pathogenicity of Stemphylium vesicarium from different hosts causing brown spot in pear. Eur. J. Plant Pathol. 124: 151–162. doi: 10.1007/s10658-008-9402-2.
Koike, S.T., N. O’Neill, J. Wolf, P. Van Berkum, and O. Daugovish. 2013. Stemphylium leaf spot of parsley in California caused by Stemphylium vesicarium. Plant Dis. 97(3): 315–322. doi: 10.1094/PDIS-06-12-0611-RE.
Kora, C. 2004. Etiology, epidemiology, and management of Sclerotinia rot of carrot caused by Sclerotinia sclerotiorum (Lib.) de Bary. MSc Thesis. University of Guelph, Guelph, Canada.
Köycü, N.D., and N. Özer. 1997. Determination of seedborne fungi in onion and their transmission to onion sets. Phytoparasitica 24(1): 25–31.
Kranz, J. 1965. A list of plant pathogenic and other fungi of Cyrenaica. Commonw. Mycol. Inst.
180
Phytopathol. Pap. 6: 1–24. Kudryavtseva, N., M.J. Havey, L. Black, P. Hanson, P. Sokolov, et al. 2019. Cytological
evaluations of advanced generations of interspecific hybrids between Allium cepa and Allium fistulosum showing resistance to Stemphylium vesicarium. Genes (Basel). 10(3): 195. doi: 10.3390/genes10030195.
Kunova, A., C. Pizzatti, M. Bonaldi, and P. Cortesi. 2013. Sensitivity of nonexposed and exposed populations of Magnaporthe oryzae from rice to tricyclazole and azoxystrobin. Plant Dis. 98(4): 512–518. doi: 10.1094/PDIS-04-13-0432-RE.
Kurose, D., L.H. Hoang, N. Furuya, M. Takeshita, T. Sato, et al. 2014. Pathogenicity of Stemphylium lycopersici isolated from rotted tobacco seeds on seedlings and leaves. J. Gen. Plant Pathol. 80(2): 147–152. doi: 10.1007/s10327-013-0501-3.
Lacy, M.L. 1982. Purple spot: A new disease of young asparagus spears caused by Stemphylium vesicarium. Plant Dis. 66: 1198–1200. doi: 10.1094/PD-66-1198.
Laidou, I.A., C.C. Thanassoulopoulos, and M. Liakopoulou-Kyriakides. 2001. Diffusion of patulin in the flesh of pears inoculated with four post-harvest pathogens. J. Phytopathol. 149: 457–461. doi: 10.1046/j.1439-0434.2001.00663.x.
Lancaster, J.E., C.M. Triggs, J.M. De Ruiter, and P.W. Gandar. 1996. Bulbing in onions: Photoperiod and temperature requirements and prediction of bulb size and maturity. Ann. Bot. 78: 423–430. doi: 10.1006/anbo.1996.0138.
Lang, J.M., D.H. Gent, and H.F. Schwartz. 2007. Management of Xanthomonas leaf blight of onion with bacteriophages and a plant activator. Plant Dis. 91(7): 871–878. doi: 10.1094/PDIS-91-7-0871.
Leach, C.M. 1967. Interaction of near-ultraviolet light and temperature on sporulation of the fungi Alternaria, Cercosporella, Fusarium, Helminthosporium, and Stemphylium. Can. J. Bot. 45: 1999–2016. doi: 10.1139/b67-218.
Leach, A., F. Hay, R. Harding, K.C. Damann, and B. Nault. 2020. Relationship between onion thrips (Thrips tabaci) and Stemphylium vesicarium in the development of Stemphylium leaf blight in onion. Ann. Appl. Biol. 176(1): 55–64. doi: 10.1111/aab.12558.
Leandro, L.F.S., M.L. Gleason, S.N. Wegulo, and F.W. Nutter. 2002. Survival and sporulation of Colletotrichum acutatum on symptomless strawberry leaves. Acta Hortic. 567(7): 627–629. doi: 10.17660/ActaHortic.2002.567.135.
Lee, R., S. Baldwin, F. Kenel, J. McCallum, and R. Macknight. 2013. FLOWERING LOCUS T genes control onion bulb formation and flowering. Nat. Commun. 4(2884). doi: 10.1038/ncomms3884.
Li, H., W. Barlow, E. Dixon, B.F. Amsden, R.L. Hirsch, et al. 2021. Molecular identification of mutations conferring resistance to azoxystrobin in Cercospora nicotianae . Plant Dis. First Look. doi: 10.1094/pdis-02-20-0441-re.
Li, Y., S.S. Tsuji, M. Hu, M.P.S. Câmara, S.J. Michereff, et al. 2020. Characterization of difenoconazole resistance in Lasiodiplodia theobromae from papaya in Brazil. Pest Manag. Sci. 76(4): 1344–1352. doi: 10.1002/ps.5645.
Li, Q.Q., S.D. Zhou, X.J. He, Y. Yu, Y.C. Zhang, et al. 2010. Phylogeny and biogeography of Allium (Amaryllidaceae: Allieae) based on nuclear ribosomal internal transcribed spacer and chloroplast rps16 sequences, focusing on the inclusion of species endemic to China. Ann. Bot. 106: 709–733. doi: 10.1093/aob/mcq177.
Liang, H.J., Y.L. Di, J.L. Li, H. You, and F.X. Zhu. 2015. Baseline sensitivity of pyraclostrobin and toxicity of SHAM to Sclerotinia sclerotiorum. Plant Dis. 99(2): 267–273. doi:
181
10.1094/PDIS-06-14-0633-RE. Liu, B., L. Stein, K. Cochran, L.J. du Toit, C. Feng, et al. 2020. Characterization of leaf spot
pathogens from several spinach production areas in the U.S. Plant Dis. 104(7): 1994–2005. doi: 10.1094/PDIS-11-19-2450-RE.
Liu, H., H. Wang, J. Zhong, X. Lu, X.T. Pan, et al. 2019. First report of Stemphylium lycopersici and Stemphylium vesicarium causing leaf spot on lettuce (Lactuca sativa) in China. Plant Dis. 103(11): 12–15. doi: 10.1094/PDIS-05-19-1052-PDN.
Liu, X.T., A.L. Winkler, W.R. Schwan, T.J. Volk, M.A. Rott, et al. 2010. The bioactive metabolites of the mangrove endophytic fungus Talaromyces sp. ZH-154 isolated from Kandelia candel (L.) Druce. Planta Med. 76(2): 185–189. doi: 10.1055/s-0029-1186001.
Llorente, I., and E. Montesinos. 2002. Effect of relative humidity and interrupted wetness periods on brown spot severity of pear caused by Stemphylium vesicarium. Phytopathology 92(1): 99–104. doi: 10.1094/PHYTO.2002.92.1.99.
Llorente, I., and E. Montesinos. 2004. Development and field evaluation of a model to estimate the maturity of pseudothecia of Pleospora all on pear. Plant Dis. 88(2): 215–219. doi: 10.1094/PDIS.2004.88.2.215.
Llorente, I., C. Moragrega, L. Ruz, and E. Montesinos. 2012. An update on control of brown spot of pear. Trees - Struct. Funct. 26(1): 239–245. doi: 10.1007/s00468-011-0607-1.
Llorente, I., C. Moragrega, L. Ruz, G. Santamarıa, A. Vilardell, et al. 2010a. Basis for new strategies in integratred control of brown spot of pear (Stemphylium vesicarium, teleomorph Pleospora allii). IOBC/wprs Bull. 54: 35–39.
Llorente, I., P. Vilardell, R. Bugiani, I. Gherardi, and E. Montesinos. 2000. Evaluation of BSPcast disease warning system in reduced fungicide use programs for management of brown spot of pear. Plant Dis. 84(6): 631–637. doi: 10.1094/PDIS.2000.84.6.631.
Llorente, I., A. Vilardell, and E. Montesinos. 2006. Infection potential of Pleospora alli and evaluation of methods for reduction of the overwintering inoculum of brown spot of pear. Plant Dis. 90(12): 1511–1516. doi: 10.1094/PD-90-1511.
Llorente, I., P. Vilardell, and E. Montesinos. 2011. Evaluation of a revision of the BSPcast decision support system for control of brown spot of pear. Phytopathol. Mediterr. 50(1): 139–149. doi: 10.14601/Phytopathol_Mediterr-8639.
Llorente, I., A. Vilardell, P. Vilardell, E. Pattori, R. Bugiani, et al. 2010b. Control of brown spot of pear by reducing the overwintering inoculum through sanitation. Eur. J. Plant Pathol. 128: 127–141. doi: 10.1007/s10658-010-9637-6.
Loebler, M., C. Sánchez, E.M. Maurício, E. Diogo, M. Santos, et al. 2020. Potential application of propolis extracts to control the growth of Stemphylium vesicarium in “Rocha” pear. Appl. Sci. 10(6). doi: 10.3390/app10061990.
Lorbeer, J.W. 1993. A serious outbreak of Stemphylium leaf blight of onion in New York. Proceedings of the 1993 National Onion Research Conference. Cornell University, Ithaca, NY, USA. p. 32–37
Lucas, J.A., N.J. Hawkins, and B.A. Fraaije. 2015. The evolution of fungicide resistance. Adv. Appl. Microbiol. 90: 29–92. doi: 10.1016/bs.aambs.2014.09.001.
Lunn, D. 2011. Fluopyram (243). In: World Health Organization and Food and Agriculture Organization of the United Nations, editors, Pesticide residues in food 2010 Evaluations Part I: Residues. World Health Organization, Rome. p. 1415–1702
Ma, Z., D. Felts, and T.J. Michailides. 2003. Resistance to azoxystrobin in Alternaria isolates from pistachio in California. Pestic. Biochem. Physiol. 77(2): 66–74. doi:
182
10.1016/j.pestbp.2003.08.002. Ma, Z., T.J. Proffer, J.L. Jacobs, and G.W. Sundin. 2006. Overexpression of the 14alpha-
demethylase target gene (CYP51) mediates fungicide resistance in Blumeriella jaapii. Appl. Environ. Microbiol. 72: 2581–2585. doi: 10.1128/aem.72.4.2581-2585.2006.
MacLean, D.E., R. Aboukhaddour, V.A. Tran, H. Askarian, S.E. Strelkov, et al. 2017. Race characterization of Pyrenophora tritici-repentis and sensitivity to propiconazole and pyraclostrobin fungicides. Can. J. Plant Pathol. 39(4): 433–443. doi: 10.1080/07060661.2017.1387178.
Madden, L., S.P. Penny packer, and A.A. MacNab. 1978. FAST, a forecast system for Alternaria solani on tomato. Phytopathology 68: 1354–1358. doi: 10.1094/Phyto-68-1354.
Magarey, R.D., T.B. Sutton, and C.L. Thayer. 2005. A simple generic infection model for foliar fungal plant pathogens. Phytopathology 95(1): 92–100. doi: 10.1094/PHYTO-95-0092.
Mair, W.J., W. Deng, J.G.L. Mullins, S. West, P. Wang, et al. 2016. Demethylase inhibitor fungicide resistance in Pyrenophora teres f. sp. teres associated with target site modification and inducible overexpression of Cyp51. Front. Microbiol. 7: 1279. doi: 10.3389/fmicb.2016.01279.
Malandrakis, A.A., Z.A. Apostolidou, A. Markoglou, and F. Flouri. 2015. Fitness and cross-resistance of Alternaria alternata field isolates with specific or multiple resistance to single site inhibitors and mancozeb. Eur. J. Plant Pathol. 142: 489–499. doi: 10.1007/s10658-015-0628-5.
Malandrakis, A.A., A.N. Markoglou, D.C. Nikou, J.G. Vontas, and B.N. Ziogas. 2006. Biological and molecular characterization of laboratory mutants of Cercospora beticola resistant to Qo inhibitors. Eur. J. Plant Pathol. 116: 155–166. doi: 10.1007/s10658-006-9052-1.
Mancini, V., and G. Romanazzi. 2014. Seed treatments to control seedborne fungal pathogens of vegetable crops. Pest Manag. Sci. 70(6): 860–868. doi: 10.1002/ps.3693.
Markoglou, A.N., A.A. Malandrakis, A.G. Vitoratos, and B.N. Ziogas. 2006. Characterization of laboratory mutants of Botrytis cinerea resistant to QoI fungicides. Eur. J. Plant Pathol. 115: 149–162. doi: 10.1007/s10658-006-0008-2.
Masiello, M., S. Somma, V. Ghionna, A. Francesco Logrieco, and A. Moretti. 2019. In vitro and in field response of different fungicides against Aspergillus flavus and Fusarium species causing ear rot disease of maize. Toxins (Basel). 11(11). doi: 10.3390/toxins11010011.
Maude, R.B., and A.. Presly. 1977. Neck rot (Botrytis allii) of bulb onions. Ann. Appl. Biol. 86(2): 163–180. doi: 10.1111/j.1744-7348.1977.tb01829.x.
Maurizio, Q., S. Giovambattista, C. Alessandro, B. Elena, C. Marina, et al. 2019. Combining quince (Cydonia oblonga) rootstock with soil-applied calcium chloride solution as a strategy to control brown spot (Stemphylium vesicarium) incidence in Abbé Fétel pear fruits. AIMS Agric. Food 4(2): 414–428. doi: 10.3934/AGRFOOD.2019.2.414.
Maynard, D.N., and G.J. Hochmuth. 2006. Knott’s Handbook for Vegetable Growers. Fifth Edition. John Wiley & Sons, Inc., Hoboken, NJ.
McDonald, M.R., S. Janse, K. Vander Kooi, and L. Riches. 2016a. Muck Vegetable Cultivar Trial; Research Report 2016. King, ON.
McDonald, M.R., and K. Vander Kooi. 2014. Evaluation of various fungicides for control of Stemphylium leaf blight on onions, 2014. Guelph, ON.
McDonald, M.R., and K. Vander Kooi. 2015. Evaluation of solatenol for control of Stemphylium leaf blight; purple blotch on green onions, 2015. King, ON.
183
McDonald, M.R., Tesfaedrias M., S. Tayviah, and B.D. Gossen. 2016b. Stemphylium leaf blight of onion in Ontario, Canada – Difficult to understand and challenging to control. Proceedings from the Empire State Producers Expo. Syracuse, N.Y.
McNeill, J., F.R. Barrie, W.R. Buck, V. Demoulin, W. Greuter, et al., editors. 2012. International Code of Nomenclature for algae, fungi, and plants (Melbourne Code). : Regnum vegetabile no. 154.
Mehta, Y.R., and M.A. Oliveira. 1998. Assessment of fungicidal efficiency to control leaf blight of cotton caused by Stemphylium solani. Summa Phytopathol. 23: 48–50.
Menzies, S.A. 1983. Control of Stemphylium leaf spot of asparagus, abstract. 4th International Congress of Plant Pathology. Melbourne, Australia 17-24 August. p. 76
Menzies, S.A., R.K. Bansal, and P.G. Broadhurst. 1991. Effect of environmental factors on severity of Stemphylium leaf spot on asparagus. New Zeal. J. Crop Hortic. Sci. 19: 135–141. doi: 10.1080/01140671.1991.10421791.
Menzies, S.A., P.G. Broadhurst, and C.M. Triggs. 1992. Stemphylium disease of asparagus (Asparagus officinalis L.) in New Sealand. New Zeal. J. Crop Hortic. Sci. 20(4): 427–433. doi: 10.1080/01140671.1992.10418060.
Meredith, D.. 1966. Spore dispersal in Alternaria porri (Ellis) Neerg. on onions in Nebraska. Ann. Appl. Biol. 57(1): 67–73. doi: 10.1111/j.1744-7348.1966.tb06867.x.
Meyer, M.P., and M.K. Hausbeck. 2000. Optimal fungicide management of purple spot of asparagus and impact on yield. Plant Dis. 84(5): 525–530. doi: 10.1094/PDIS.2000.84.5.525.
Miguez, M., C. Reeve, P.M. Wood, and D.W. Hollomon. 2004. Alternative oxidase reduces the sensitivity of Mycosphaerella graminicola to QoI fungicides. Pest Manag. Sci. 60(1): 3–7. doi: 10.1002/ps.837.
Mikaberidze, A., and B.A. McDonald. 2015. Fitness Cost of Resistance: Impact on Management. In: Ishii, H. and Hollomon, D.W., editors, Fungicide Resistance in Plant Pathogens. Springer, Tokyo, Japan. p. 77–92
Miller, M.E., Taber R A, and Amador J M. 1978. Stemphylium blight of onion in South Texas. Plant Dis. Report. 10: 851–853.
Misawa, T. 2008. Optimum conditions of lesion formation of brown oval symptom and yellow mottle symptom of leaf blight of Welsh onion caused by Stemphylium vesicarium (in Japanese). Annu. Rep. Soc. Plant Prot. North 59: 46–49. doi: 10.1007/s10327-017-0711-1.
Misawa, T., D. Kurose, M. Kayamori, Y. Iwadate, and S. Tsushima. 2017. First report of spinach leaf spot caused by Stemphylium sp. subgroups C2 and E3 and pathogenicity comparison of the pathogen with related pathogens. J. Gen. Plant Pathol. doi: 10.1007/s10327-017-0711-1.
Misawa, T., and S. Yasuoka. 2012. The life cycle of Stemphylium vesicarium, the causal agent of Welsh onion leaf blight. J. Gen. Plant Pathol. 78: 18–29. doi: 10.1007/s10327-011-0352-8.
Mishra, R.K., and R.P. Gupta. 2012. In vitro evaluation of plant extracts, bio-agents and fungicides against Purple blotch and Stemphylium blight of onion. J. Med. Plants Res. 6(45): 5658–5661. doi: 10.5897/JMPR10-246.
Mishra, B., and R.P. Singh. 2017. Fungicidal management of Stemphylium blight of onion caused by Stemphylium vesicarium (Wallr.) Simmons. Biosci. Biotechnol. Res. ASIA 14(3): 1043–1049. doi: 10.13005/bbra/2539.
Mizutani, A., N. Miki, H. Yukioka, H. Tamura, and M. Masuko. 1996. A possible mechanism of control of rice blast disease by a novel alkoxyiminoacetamide fungicide, SSF126. Phytopathology 86: 295–300. doi: 10.1094/phyto-86-295.
184
Mondino, P., L. Casanova, A. Celio, O. Bentancur, C. Leoni, et al. 2015. Sensitivity of Venturia inaequalis to trifloxystrobin and difenoconazole in Uruguay. J. Phytopathol. 163(1): 1–10. doi: 10.1111/jph.12274.
Montesinos, E., A. Bonaterra, Y. Ophir, and S. V. Beer. 1996. Antagonism of selected bacterial strains to Stemphylium vesicarium and biological control of brown spot of pear under controlled environment conditions. Phytopathology 86: 856–863. doi: 10.1094/Phyto-86-856.
Montesinos, E., C. Moragrega, I. Llorente, P. Vilardell, A. Bonaterra, et al. 1995. Development and evaluation of an infection model for Stemphylium vesicarium on pear based on temperature and wetness duration. Phytopathology 85(5): 586–592. doi: 10.1094/Phyto-85-586.
Montesinos, E., and P. Vilardell. 1992. Evaluation of FAST as a forecasting system for scheduling fungicide sprays for control of Stemphylium vesicarium on pear. Plant Dis. 76: 1221–1226. doi: 10.1094/PD-76-1221.
Moragrega, C., M. Puig, L. Ruz, E. Montesinos, and I. Llorente. 2018. Epidemiological features and trends of brown spot of pear disease based on the diversity of pathogen populations and climate change effects. Phytopathology 108(2): 223–233. doi: 10.1094/PHYTO-03-17-0079-R.
Morran, L., O. Schmidt, I. Gelarden, R. Parrish, and C. Lively. 2011. Running with the red queen: host-parasite coevolution selects for biparental sex. Science (80-. ). 333(6039): 216–218. doi: 10.1126/science.1206360.
Mosbach, A., D. Edel, A.D. Farmer, S. Widdison, T. Barchietto, et al. 2017. Anilinopyrimidine resistance in Botrytis cinerea is linked to mitochondrial function. Front. Microbiol. 8: 2361. doi: 10.3389/fmicb.2017.02361.
Moslemi, A., P.K. Ades, T. Groom, M.E. Nicolas, and P.W.J. Taylor. 2017. Alternaria infectoria and Stemphylium herbarum, two new pathogens of pyrethrum (Tanacetum cinerariifolium) in Australia. Australas. Plant Pathol. 46: 91–101. doi: 10.1007/s13313-016-0463-y.
Moumni, M., M.B. Allagui, V. Mancini, S. Murolo, N. Tarchoun, et al. 2020. Morphological and molecular identification of seedborne fungi in squash (Cucurbita maxima, Cucurbita moschata). Plant Dis. 104(5): 1335–1350. doi: 10.1094/PDIS-04-19-0741-RE.
Mueller, D.S., K.A. Wise, N.S. Dufault, C.A. Bradley, and M.I. Chlvers, editors. 2013. Part III: Fungicide Stewardship. Fungicides for Field Crops. St Paul, MN. p. 41–46
Muilenberg, M.L. 2003. Sampling Devices. Immunol. Allergy Clin. North Am. 23(3): 337–355. Mulenko, W., T. Majewski, and M. Ruszkiewicz-Michalska. 2008. A preliminary checklist of
Micromycetes in Poland. W. Szafer Institute of Botany, Polish Academy of Sciences. Murtaza, M., A. Wahid, S. Ali, and N. A. 1988. Seedling blight of carrots caused by
Stemphylium radicinum. Pakistan J. Agric. Res. 9: 601–603. Mwakutuya, E. 2006. Epidemiology of Stemphylium blight on lentil (Lens culinaris) in
Saskatchewan. MSc Thesis. University of Saskatchewan, Dept of Plant Sciences. Neergaard, P. 1977. Seed Pathology. John Wiley and Sons, New York. Olson, N.D., and J.B. Morrow. 2012. DNA extract characterization process for microbial
detection methods development and validation. BMC Res. Notes 5: 668. doi: 10.1186/1756-0500-5-668.
OMAFRA, O.M. of A. and R.A. 2009. Stemphylium Leaf Blight. http://www.omafra.gov.on.ca/IPM/english/onions/diseases/stemphylium.html#advanced (accessed 1 June 2019).
185
Owati, A.S., B. Agindotan, J.S. Pasche, and M. Burrows. 2017. The detection and characterization of QoI-resistant Didymella rabies causing Ascochyta blight of chickpea in Montana. Front. Plant Sci. 1165: 1–11. doi: 10.3389/fpls.2017.01165.
Paibomesai, M., M. Celetti, and M. Tesfaendrias. 2012. Update on stemphylium leaf blight of onions in Ontario. HortMatters 12(18): 11–12.
Pande, A., and V.G. Rao. 1998. A Compendium Fungi on Legumes from India. Scientific Publishers (India), Jodhpur, 188 pages. (44903). Scientific Publishers (India), Jodhpur.
Pantidou, M.. 1973. Fungus-host index for Greece. Benaki Phytopathological Institute, Kiphissia, Athens.
Pariaud, B., V. Ravigné, H. Goyeau, J. Carlier, and C. Lannou. 2009. Aggressiveness and its role in the adaptation of plant pathogens. Plant Pathol. 58(3): 409–424. doi: 10.1111/j.1365-3059.2009.02039.x.
Parker, M.L. 2012. Comparative sampling and detection of airborne ascospores of Sclerotinia sclerotiorum for forecasting risk of Sclerotinia rot of carrot, and assessment of induced resistance for disease management. PhD Thesis. University of Guelph, Guelph, ON.
Pasche, J.S., L. Piche, and N.C. Gudmestad. 2005. Effect of the F129L mutation in Alternaria solani on fungicides affecting mitochondiral respiration. Plant Dis. 89(3): 269–278. doi: 10.1094/PD-89-0269.
Pathak, C.S., L.L. Black, S.J. Cheng, T.C. Wang, and S.S. Ko. 2001. Breeding onions for Stemphylium leaf blight resistance. ISHS Acta Hortic. 555: 77–81. doi: 10.17660/ActaHortic.2001.555.7.
Pearce, T.L., C.R. Wilson, D.H. Gent, and J.B. Scott. 2019. Multiple mutations across the succinate dehydrogenase gene complex are associated with boscalid resistance in Didymella tanaceti in pyrethrum. PLoS One 14(6): 1–23. doi: 10.1371/journal.pone.0218569.
Peláez, F., J. Collado, F. Arenal, A. Basilio, A. Cabello, et al. 1998. Endophytic fungi from plants living on gypsum soils as a source of secondary metabolites with antimicrobial activity. Mycol. Res. 102(6): 755–761. doi: 10.1017/S0953756297005662.
Pennycook, S. 1989. Plant diseases recorded in New Zealand. Plant Diseases Division, Auckland, N.Z.
Pennypacker, B.W., K.T. Leath, W.L. Stout, and R.R. Hill. 1990. Technique for simulating field drought stress in the greenhouse. Agron. J. 82(5): 951–957. doi: 10.2134/agronj1990.00021962008200050023x.
Pereira, P.T., M.M. De Carvalho, J.D. Arrabaça, M.T. Amaral-Collaço, and J.C. Roseiro. 1997. Alternative respiratory system and formamide hydro-lyase activity as the key components of the cyanide-resistance mechanism in Fusarium oxysporum. Can. J. Microbiol. 43(10): 929–936. doi: 10.1139/m97-134.
Pesticide Risk Reduction Program. 2012. Crop profile for Allium vegetables in Canada, 2012. Pethybridge, S., F. Hay, E. Maloney, and C. Hoepting. 2016. Digging Deeper: Towards
understanding the Stemphylium leaf blight pathogen of onion in New York. Empire State Producers Expo. Syracuse, NY
Pijls, C.F.N., and M.W. Shaw. 1997. Weak selection by field sprays for flutriafol resistance in Septoria tritici. Plant Pathol. 46(2): 247–263. doi: 10.1046/j.1365-3059.1997.d01-227.x.
Pinheiro, L.B., V.A. Coleman, C.M. Hindson, J. Herrmann, B.J. Hindson, et al. 2012. Evaluation of a droplet digital polymerase chain reaction format for DNA copy number quantification. Anal. Chem. 84(2): 1003–1011. doi: 10.1021/ac202578x.
Pitblado, R.E. 1992. The development and implementation of TOM-CAST. Ontario Ministry of
186
Agriculture and Food. Ridgetown, ON. Polat, Z., G. Besirli, İ. Sönmez, and B. Yavuz. 2012. First report of Stemphylium leaf blight of
garlic (Allium sativum) caused by Stemphylium vesicarium in Turkey. New Dis. Reports 25(29). doi: 10.5197/j.2044-0588.2012.025.029.
Ponti, I., A. Brunelli, C. Tosi, M. Basaglia, T. Bevilacqua, et al. 1993. Verifica dell’attività di diversi preparati contro la maculatura bruna del pero. Inf. Fitopatol. 43(5): 45–52.
Ponti, I., P. Cavanni, and A. Brunelli. 1982. “Maculatura bruna” delle pere: eziologia e difesa. Inf. Fitopatol. 3: 35–40.
Popko, J.T., H. Sang, J. Lee, T. Yamada, Y. Hoshino, et al. 2018. Resistance of Sclerotinia homoeocarpa field isolates to succinate dehydrogenase inhibitor fungicides. Plant Dis. 102(12): 2625–2631. doi: 10.1094/PDIS-12-17-2025-RE.
Prados-Ligero, A.M., J.L. González-Andújar, J.M. Melero-Vara, and M.J. Basallote-Ureba. 1998. Development of Pleospora allii on garlic debris infected by Stemphylium vesicarium. Eur. J. Plant Pathol. 104: 861–870. doi: 10.1023/A:1008619604684.
Prados-Ligero, A.M., J.M. Melero-Vara, C. Corpas-Hervías, and M.J. Basallote-Ureba. 2003. Relationships between weather variables, airborne spore concentrations and severity of leaf blight of garlic caused by Stemphylium vesicarium in Spain. Eur. J. Plant Pathol. 109: 301–310. doi: 10.1023/A:1023519029605.
Price, C.L., J.E. Parker, A.G. Warrilow, D.E. Kelly, and S.L. Kelly. 2015. Azole fungicides - understanding resistance mechanisms in agricultural fungal pathogens. Pest Manag. Sci. 71: 1054–1058. doi: 10.1002/ps.4029.
Primiano, I.V., J.P.E. Molina, L.L.M. de Mio, N.A. Peres, and L. Amorim. 2017. Reduced sensitivity to azoxystrobin is stable in Monilinia fructicola isolates. Sci. Agric. 74(2): 169–173. doi: 10.1590/1678-992X-2015-0469.
Puig, M., C. Moragrega, L. Ruz, E. Montesinos, and I. Llorente. 2014. Postinfection activity of synthetic antimicrobial peptides against Stemphylium vesicarium in pear. Phytopathology 104(11): 1192–1200. doi: 10.1094/PHYTO-02-14-0036-R.
Qiagen. 2017. QIAxpert® Spectral Content Profiling- Technical Information. : 1–8. Raghavendra Rao, N.N., and M.S. Pavgi. 1975. Stemphylium leaf blight of onion.
Mycopathologia 56(2): 113–118. doi: 10.1007/BF00472582. Ranzi, C., and C.A. Forcelini. 2013. Curative sprays of fungicides and their effect on lesion
expansion of the wheat tan spot. Ciência Rural 43(9): 1576–1581. doi: 10.1590/S0103-84782013005000106.
Rastrojo, A., A. Núñez, D.A. Moreno, and A. Alcamí. 2018. A new putative caulimoviridae genus discovered through air metagenomics. Microbiol. Resour. Announc. 7(14): 1–2. doi: 10.1128/mra.00955-18.
Rehfus, A. 2018. Analysis of the emerging situation of resistance to succinate dehydrogenase inhibitors in Pyrenophora teres and Zymoseptoria tritici in Europe. PhD Thesis. University of Hohenheim. http://opus.uni-hohenheim.de/volltexte/2018/1516.
Ren, W., W. Shao, X. Han, M. Zhou, and C. Chen. 2016. Molecular and biochemical characterization of laboratory and field mutants of Botrytis cinerea resistant to fludioxonil. Plant Dis. 100(7): 1414–1423.
Ren, L., X. Zhao, X. Shi, P. Guo, and J. Han. 2017. Pyrimethanil sensitivity and fitness in Botrytis cinerea populations from Shanxi Province, China. J. Plant Dis. Prot. 124: 185–193. doi: 10.1007/s41348-017-0073-0.
Reyes-Vaquero, L., M. Bueno, R.I. Ventura-Aguilar, A.B. Aguilar-Guadarrama, N. Robledo, et
187
al. 2021. Seasonal variation of chemical profile of Ruta graveolens extracts and biological activity against Fusarium oxysporum, Fusarium proliferatum and Stemphylium vesicarium. Biochem. Syst. Ecol. 95(September 2020). doi: 10.1016/j.bse.2021.104223.
Richardson, M.J. 1990. An Annotated List of Seed-Borne Diseases. Fourth Edi. International Seed Testing Association, Zurich.
Riley, E.. 1960. A revised list of plant diseases in Tanganyika Territory. Mycol. Pap. 75: 1–44. Rissler, J.F., and R.L. Millar. 1977. Contribution of a cyanide-insensitive alternate respiratory
system to increases in formamide hydro-lyase activity and to growth in Stemphylium loti in vitro . Plant Physiol. 60(6): 857–861. doi: 10.1104/pp.60.6.857.
Rosenzweig, N., G. Olaya, Z.K. Atallah, S. Cleere, C. Stranger, et al. 2008. Monitoring and tracking changes in sensitivity to azoxystrobin fungicide in Alternaria solani in Wisconsin. Plant Dis. 92(4): 555–560.
Rossi, V., R. Bugiani, S. Giosué, and P. Natali. 2005a. Patterns of airborne conidia of Stemphylium vesicarium, the causal agent of brown spot disease of pears, in relation to weather conditions. Aerobiologia (Bologna). 21(3–4): 203–216. doi: 10.1007/s10453-005-9002-y.
Rossi, V., and E. Pattori. 2009. Inoculum reduction of Stemphylium vesicarium, the causal agent of brown spot of pear, through application of Trichoderma-based products. Biol. Control 49: 52–57. doi: 10.1016/j.biocontrol.2008.12.012.
Rossi, V., E. Pattori, and R. Bugiani. 2008. Sources and seasonal dynamics of inoculum for brown spot disease of pear. Eur. J. Plant Pathol. 121: 147–159. doi: 10.1007/s10658-007-9258-x.
Rossi, V., E. Pattori, S. Giosué, and R. Bugiani. 2005b. Growth and sporulation of Stemphylium vesicarium, the causal agent of brown spot of pear, on herb plants of orchard lawns. Eur. J. Plant Pathol. 111(4): 361–370. doi: 10.1007/s10658-004-5273-3.
Rosslenbroich, H.-J., and D. Stuebler. 2000. Botrytis cinerea — history of chemical control and novel fungicides for its management. Crop Prot. 19(8–10): 557–561. doi: 10.1016/S0261-2194(00)00072-7.
Rossman, A.Y., P.W. Crous, K.D. Hyde, D.L. Hawksworth, A. Aptroot, et al. 2015. Recommended names for pleomorphic genera in Dothideomycetes. IMA Fungus 6(2): 507–523. doi: 10.5598/imafungus.2015.06.02.14.
Russell, P.E. 2004. Sensitivity baselines in fungicide resistance research and management: FRAC Monograph No. 3. AIMPRINT, Brussels, Belgium.
Samac, D.A., J. Willbur, L. Behnken, F. Brietenbach, G. Blonde, et al. 2014. First report of Stemphylium globuliferum causing Stemphylium leaf spot on alfalfa (Medicago sativa) in the United States. Plant Dis. 98(7): 993. doi: 10.1094/PDIS-08-13-0828-PDN.
Sang, H., A. Witte, J.L. Jacobs, H.X. Chang, J. Wang, et al. 2018. Fluopyram sensitivity and functional characterization of SdhB in the Fusarium solani species complex causing soybean sudden death syndrome. Front. Microbiol. 9(OCT): 1–12. doi: 10.3389/fmicb.2018.02335.
Saraswathi, T., V.A. Sapthiyamurthy, N.A. Tamilselvi, and S. Harsh. 2017. Review on aggregatum onion (Allium cepa L. var. aggregatum Don.). Int. J. Curr. Microbiol. Appl. Sci. 6(4): 1649–1667. doi: 10.20546/ijcmas.2017.604.201.
Sasaki, T., Y. Honda, M. Umekawa, and M. Nemoto. 1985. Control of certain diseases of greenhouse vegetables with ultraviolet-absorbing vinyl film. Plant Dis. 69(6): 530–533. doi: 10.1094/PD-69-530.
188
Scalliet, G., J. Bowler, T. Luksch, L. Kirchhofer-allan, D. Steinhauer, et al. 2012. Mutagenesis and functional studies with succinate dehydrogenase inhibitors in the wheat pathogen Mycosphaerella graminicola. Plos 1 7(4): e35429. doi: 10.1371/journal.pone.0035429.
Ščevková, J., J. Dušička, K. Mičieta, and J. Somorčík. 2016. The effects of recent changes in air temperature on trends in airborne Alternaria, Epicoccum and Stemphylium spore seasons in Bratislava (Slovakia). Aerobiologia (Bologna). 32(1): 69–81. doi: 10.1007/s10453-015-9412-4.
Secor, G.A., and V. V Rivera. 2012. Fungicide resistance assays for fungal plant pathogens. In: Bolton, M.D. and Thomma, B.P.H.J., editors, Plant Fungal Pathogens: Methods and Protocols. Springer Science + Business Media, New York. p. 385–414
Seyran, M., T.B. Brenneman, and K.L. Stevenson. 2010. In vitro toxicity of alternative oxidase inhibitors salicylhydroxamic acid and propyl gallate on Fusicladium effusum. J. Pest Sci. (2004). 83(4): 421–427. doi: 10.1007/s10340-010-0312-7.
Sharma, S.N., and R.S. Sain. 2003. RO-1 an improved onion variety for the warmer areas of Rajasthan. Indian J. Genet. 63(3): 281–282.
Sharma, R.C., and S. Sharma. 1999. Fungal diseases of onion and garlic in India. In: Verma, L.R. and Sharma, R.C., editors, Diseases of Horticultural Crops: Vegetables, Ornamentals, and Mushrooms. Indus Publishing Company, New Delhi. p. 350–369
Shaw, M.W. 2009. Fungicide resistance: The dose rate debate. Outlooks Pest Manag. 20(3): 100–103. doi: 10.1564/20jun02.
Shi, F., and T. Hsiang. 2015. Chemical management of Volutella leaf and stem blight of boxwood. Eur. J. Plant Pathol. Vol. 142: 107–115. doi: 10.1007/s10658-015-0595-x.
Shishkoff, N., and J.W. Lorbeer. 1989. Etiology of Stemphylium leaf blight of onion. Phytopathology 79(3): 301–304. doi: 10.1094/phyto-79-301.
Simmons, E.G. 1967. Typification of Alternaria, Stemphylium, and Ulocladium. Mycologia 59(1): 67–92.
Simmons, E.G. 1969. Perfect states of Stemphylium. Mycologia 61: 1–26. doi: 10.2307/3757341. Singh, P., R. Bugiani, P. Cavanni, H. Nakajima, M. Kodama, et al. 1999. Purification and
biological characterization of host-specific SV-toxins from Stemphylium vesicarium causing brown spot of European pear. Phytopathology 89(10): 947–953. doi: 10.1094/PHYTO.1999.89.10.947.
Singh, P., P. Park, R. Bugiani, P. Cavanni, H. Nakajima, et al. 2000. Effects of host-selective SV-toxin from Stemphylium vesicarium, the cause of brown spot of European pear plants, on ultrastructure of leaf cells. J. Phytopathol. 148: 87–93. doi: 10.1046/j.1439-0434.2000.00474.x.
Sinha, J.N., and A.P. Singh. 1993. Effect of environment on the development and spread of Stemphylium blight of lentil. Indian Phytopathol. 46(3): 252–253.
Sokal, R., and F. Rohlf. 1981. Biometry, the Principles and Practice of Statistics in Biological Research. W. H. Freeman and Co., New York.
Solomon, W.R. 2003. How ill the wind? Issues in aeroallergen sampling. J. Allergy Clin. Immunol. 112(1): 3–8. doi: 10.1067/mai.2003.1599.
Solomon, W.R., H.A. Burge, J.R. Boise, and M. Becker. 1980. Comparative particle recoveries by the retracting rotorod, rotoslide and Burkard spore trap sampling in a compact array. Int. J. Biometeorol. 24(2): 107–116. doi: 10.1007/BF02253798.
de Souza, F.C., K.F. da Silva, S.F. da Silveira, L.S. Kowata-Dresch, C.A. dos Santos, et al. 2018. Conidial sporulation of Stemphylium solani under laboratory conditions and infectivity of
189
the inoculum produced in vitro. Eur. J. Plant Pathol. 152(3): 691–700. doi: 10.1007/s10658-018-1511-y.
Souza Machado, V., and A. Ali. 1992. Integrated weed management with onions involving wind erosion abatement. First International Weed Control Conference. Melbourne, Australia. p. 487
Spawton, K.., M. McGrath, and L.J. Du Toit. 2020. First report of Stemphylium leaf spot of spinach (Spinacia oleracea) caused by Stemphylium beticola in New York State. Plant Dis. 104(11): 3068. doi: 10.1094/PDIS-02-20-0343-PDN.
Sreeja, S.J. 2014. Synthetic plant activators for crop disease management – A review. Int. J. Thesis Proj. Diss. 2(1): 19–28.
Statistics Canada. 2020. Table 32-10-0365-01: Area, production and farm gate value of vegetables.
Stricker, S.M., B.D. Gossen, and M.R. McDonald. 2021a. Risk assessment of secondary metabolites produced by fungi in the genus Stemphylium. Can. J. Microbiol. 67(6): 445–450. doi: 10.1139/cjm-2020-0351.
Stricker, S.M., E. McFaul, B.D. Gossen, and M.R. Mcdonald. 2021b. Fungicide sensitivity of Stemphylium vesicarium in Ontario [Abstract only]. Can. J. Plant Pathol. In Press.
Stricker, S.M., C.S. Tayviah, B.D. Gossen, and M.R. Mcdonald. 2020. Fungicide efficacy and timing for the management of Stemphylium vesicarium on onion. Can. J. Plant Pathol. 00(00): 1–13. doi: 10.1080/07060661.2020.1804461.
Suheri, H., and T. V. Price. 2000a. Stemphylium leaf blight of garlic (Allium sativum) in Australia. Australas. Plant Pathol. 29: 192–199. doi: 10.1071/AP00034.
Suheri, H., and T. V. Price. 2000b. Infection of onion leaves by Alternaria porri and Stemphylium vesicarium and disease development in controlled environments. Plant Pathol. 49: 375–382. doi: 10.1046/j.1365-3059.2000.00458.x.
Suheri, H., and T. V. Price. 2001. The epidemiology of purple leaf blotch on leeks in Victoria, Australia. Eur. J. Plant Pathol. 107: 503–510. doi: 10.1023/A:1011244104920.
Sun, H., C. Lu, W. Li, Y. Deng, and H. Chen. 2016. Homozygous and heterozygous point mutations in succinate dehydrogenase subunits b , c and d of Rhizoctonia cerealis conferring resistance to thifluzamide. Pest Manag. Sci. 73: 896–903. doi: 10.1002/ps.4361.
Sutton, J.C., T.D.W. James, and P.M. Rowell. 1986. Botcast: a forecasting system to time the initial fungicide spray for managing Botrytis leaf blight of onions. Agric. Ecosyst. Environ. 18(2): 123–143. doi: 10.1016/0167-8809(86)90136-2.
Talley, S.M., P.D. Coley, and T.A. Kursar. 2002. The effects of weather on fungal abundance and richness among 25 communities in the Intermountain West. BMC Ecol. 2: 7–10. doi: 10.1186/1472-6785-2-7.
Tamura, H., A. Mizutani, H. Yukioka, N. Miki, K. Ohba, et al. 1999. Effect of the methoxyiminoacetamide fungicide, SSF129, on respiratory activity in Botrytis cinerea. Pestic. Sci. 55: 681–686. doi: 10.1002/(SICI)1096-9063(199907)55:7<681::AID-PS16>3.0.CO;2-8.
Taylor, P., K. Lindbeck, W. Chen, and R. Ford. 2007. Lentil diseases. In: Yadav, S., McNeil, D., and Stevenson, P., editors, Lentil: an ancient crop for modern times. Springer Netherlands, Dordrecht. p. 291–313
Tayviah, C.S. 2017. Epidemiology and management of Stemphylium leaf blight on onion (Allium cepa L.) in the Holland Marsh, Ontario. MSc Thesis. University of Guelph, Guelph, Canada.
190
Teixeira, C.S.P. 2005. Are Stemphylium spp. seedborne pathogens of pea (Pisum sativum L .)? MSc Thesis. Lincoln University, Pennsylvania, USA.
Tesfaendrias, M., M. Paibomesai, M. Celetti, and M.R. McDonald. 2014. The battle against Stemphylium leaf blight of onion in Ontario, Canada. Proc. from Emp. State Prod. Expo, Syracuse, N.Y.
Thakur, M., and B.S. Sohal. 2013. Role of elicitors in inducing resistance in plants against pathogen infection: A review. ISRN Biochem. 2013: 1–10. doi: 10.1155/2013/762412.
Thambugala, K.M., D.N. Wanasinghe, A.J.L. Phillips, E. Camporesi, T.S. Bulgakov, et al. 2017. Mycosphere notes 1-50: Grass (Poaceae) inhabiting Dothideomycetes. Mycosphere 8(4): 697–796. doi: 10.5943/MYCOSPHERE/8/4/13.
Thiessen, L.D., T.M. Neill, and W.F. Mahaffee. 2017. Timing fungicide application intervals based on airborne Erysiphe necator concentrations. Plant Dis. 101(7): 1246–1252. doi: 10.1094/PDIS-12-16-1727-RE.
Thomas, A., D.B. Langston, and W.R. Stevenson. 2012. Baseline sensitivity and cross-resistance to succinate-dehydrogenase-inhibiting and demethylation-inhibiting fungicides in Didymella bryoniae. Plant Dis. 96(7): 979–984. doi: 10.1094/PDIS-09-11-0744-RE.
du Toit, L., and D. Inglis, editors. 2002. WSU Vegetable Pathology Team Newsletter. Pacific Northwest Veg. Ext. Gr. http://mtvernon.wsu.edu/path_team/newsjuly02.htm (accessed 5 February 2018).
Tomaz, I., and A. Lima. 1988. An important disease of onion caused by Stemphylium vesicarium (Wallr.) Simmons in Portugal. Hortic. Abstr. 68: 618.
Torres, C., B.A. Latorre, P. Undurraga, and X. Besoain. 2013. Evaluation of DMI fungicides against species of Diplodia and Neofusicoccum associated with Botryosphaeria canker of grapevine. Cienc. e Investig. Agrar. 40(1): 131–138. doi: 10.4067/S0718-16202013000100011.
Unamuno, P.L.M. 1941. Enumeracion y distribucion geografica de los ascomicetos de la Peninsula Iberica y de las Islas Baleares [In Spanish]. Memorias de la Real Academia de Ciencias Exactas. Real Acad. Cienc. Exact., Madrid, Spain. p. 1–403
Urries, M.. 1957. Hongos Microscopicos De Canarias. Museo Canario, Las Palmas de Gran Canaria, Spain.
Vaghefi, N., S.M. Thompson, R.B.E. Kimber, G.J. Thomas, P. Kant, et al. 2020. Multi-locus phylogeny and pathogenicity of Stemphylium species associated with legumes in Australia. Mycol. Prog. 19(4): 381–396. doi: 10.1007/s11557-020-01566-8.
Van Valen, L. 1973. A new evolutionary law. Evol. Theory 1: 1–30. Vega, B., and M.M. Dewdney. 2015. Sensitivity of Alternaria alternata from citrus to boscalid
and polymorphism in iron-sulfur and in anchored membrane subunits of succinate dehydrogenase. Plant Dis. 99(2): 231–239. doi: 10.1094/PDIS-04-14-0374-RE.
Veloukas, T., P. Kalogeropoulou, A.N. Markoglou, and G.S. Karaoglanidis. 2014. Fitness and competitive ability of Botrytis cinerea field isolates with dual resistance to SDHI and QoI fungicides, associated with several sdhB and the cytb G143A mutations. Phytopathology 104(4): 347–356. doi: 10.1094/PHYTO-07-13-0208-R.
Vidhyasekaran, P. 2004. Concise Encyclopedia of Plant Pathology. CRC Press, New York. Villani, S.M., K. Ayer, and K.D. Cox. 2016. Molecular characterization of the sdhB gene and
baseline sensitivity to penthiopyrad, fluopyram, and benzovindiflupyr in Venturia inaequalis. Plant Dis. 100(8): 1709–1716. doi: 10.1094/PDIS-12-15-1512-RE.
Vincelli, P. 2002. QoI (strobilurin) Fungicides: benefits and risks. Plant Heal. Instr. doi:
191
10.1094/PHI-I-2002-0809-02. De Visser, C.L.M. 1998. Development of a downy mildew advisory model based on DOWNcast.
Eur. J. Plant Pathol. 104(9): 933–943. doi: 10.1023/A:1008656122629. Vitale, S., L. Luongo, M. Galli, and A. Belisario. 2017. First report of Stemphylium vesicarium
on chilli pepper in Italy. New Dis. Reports 35: 36. doi: 10.5197/j.2044-0588.2017.035.036. Wakeham, A., G. Keane, M. Proctor, and R. Kennedy. 2012. Monitoring infection risk for air
and soil borne fungal plant pathogens using antibody and DNA techniques and mathematical models describing environmental parameters. In: Mendez-Vilas, A., editor, Microbes in Applied Research- Current Advances and Challenges. Malaga, Spain
Wakelin, S.A., M. Gomez-Gallego, E. Jones, S. Smaill, G. Lear, et al. 2018. Climate change induced drought impacts on plant diseases in New Zealand. Australas. Plant Pathol. 47(1): 101–114. doi: 10.1007/s13313-018-0541-4.
Walters, D.R., and J.M. Fountaine. 2009. Practical application of induced resistance to plant diseases: an appraisal of effectiveness under field conditions. J. Agric. Sci. 147: 523–535. doi: 10.1017/S0021859609008806.
Wang, J., C.A. Bradley, O. Stenzel, D.K. Pedersen, U. Reuter-Carlson, et al. 2017. Baseline sensitivity of Fusarium virguliforme to fluopyram fungicide. Plant Dis. 101(4): 576–582. doi: 10.1094/PDIS-09-16-1250-RE.
Wang, Y., Y. Geng, Y.-F. Pei, and X.-G. Zhang. 2010. Molecular and morphological description of two new species of Stemphylium from China. Mycologia 102(3): 708–717. doi: 10.3852/09-208.
Wang, H., Y. Huang, J. Wang, X. Chen, K. Wei, et al. 2016. Activities of azoxystrobin and difenoconazole against Alternaria alternata and their control efficacy. Crop Prot. 90: 54–58. doi: 10.1016/j.cropro.2016.08.022.
WCPD. 2012. Chapter 10 - Diseases of Vegetable Crops. Guidelines For The Control Of Plant Diseases In Western Canada. The Western Committee on Plant Diseases. p. 5
Weaver, J.E., and W.E. Bruner. 1927. Root development of vegetable crops. First Edit. McGraw-Hill Book Company, New York.
White, T.J., T. Bruns, S. Lee, and J. Taylor. 1990. Amplification and direct sequencing of fungal ribosomal RNA genes for phylogenetics. In: Innis, M.A., Gelfand, D.H., Sninsky, J.J., and White, T.J., editors, PCR protocols: a guide to methods and applications. Academic Press, Orlando, FL. p. 315-322.
Wild, M., H. Gilgen, A. Roesch, A. Ohmura, C.N. Long, et al. 2005. From dimming to brightening: Decadal changes in solar radiation at earth’s surface. Science (80-. ). 308(5723): 847–850. doi: 10.1126/science.1103215.
Williams, R.H., E. Ward, and H.A. McCartney. 2001. Methods for integrated air sampling and DNA analysis for detection of airborne fungal spores. Appl. Environ. Microbiol. 67(6): 2453–2459. doi: 10.1128/AEM.67.6.2453-2459.2001.
Wood, P.M., and D.W. Hollomon. 2003. A critical evaluation of the role of alternative oxidase in the performance of strobilurin and Complex III. Pest Manag. Sci. 59(5): 499–511. doi: 10.1002/ps.655.
Woudenberg, J.H.C., B. Hanse, G.C.M. van Leeuwen, J.Z. Groenewald, and P.W. Crous. 2017. Stemphylium revisited. Stud. Mycol. 87: 77–103. doi: 10.1016/j.simyco.2017.06.001.
Wright, P.J. 1993. Effects of nitrogen fertiliser, plant maturity at lifting, and water during field-curing on the incidence of bacterial soft rot of onions in store. New Zeal. J. Crop Hortic. Sci. 21(4): 377–381. doi: 10.1080/01140671.1993.9513796.
192
Wright, P., J. Tyson, and R. Fullerton. 2019. The current outbreak of Stemphylium leaf blight of onion in New Zealand – identification of cause and review of possible risk factors associated with the disease. New Zeal. Plant Prot. 72: 10–20. doi: 10.30843/nzpp.2019.72.254.
Wu, D.X., R.S. Zhang, X. Han, J.X. Wang, M.G. Zhou, et al. 2015. Resistance risk assessment for fludioxonil in Stemphylium solani. Ann. Appl. Biol. 167(2): 277–284. doi: 10.1111/aab.12230.
Yamaguchi, I., and M. Fujimura. 2005. Recent topics on action mechanisms of fungicides. J. Pestic. Sci. 30(2): 67–74. 10.1584/jpestics.30.67.
Yan, Z., W. Zhang, and T. Duan. 2019. First report of leaf spot caused by Stemphylium vesicarium on Vicia villosa in China. Plant Dis. 103(5): 1039–1039. doi: 10.1094/PDIS-09-18-1667-PDN.
Zandstra, B.H., and D.D. Warncke. 1993. Interplanted barley and rye in carrots and onions. Horttechnology 3(2): 214–218. doi: 10.21273/horttech.3.2.214.
Zapata-Sarmiento, D.H., E.F. Palacios-Pala, A.A. Rodríguez-Hernández, D.L. Medina Melchor, M. Rodríguez-Monroy, et al. 2020. Trichoderma asperellum, a potential biological control agent of Stemphylium vesicarium, on onion (Allium cepa L.). Biol. Control 140: 104105. doi: 10.1016/j.biocontrol.2019.104105.
Zhang, Y., Y. Fu, C. Luo, and F. Zhu. 2021. Pyrimethanil sensitivity and resistance mechanisms in Penicillium digitatum. Plant Dis. First Look. doi: 10.1094/pdis-08-20-1739-re.
Zheng, L., J. Huang, and T. Hsiang. 2008. First report of leaf blight of garlic (Allium sativum) caused by Stemphylium solani in China. Plant Pathol. doi: 10.1111/j.1365-3059.2007.01724.x.
Ziogas, B.N., and A.A. Malandrakis. 2015. Sterol biosynthesis inhibitors: C14 Demethylation (DMIs). In: Ishii, H. and William, D., editors, Fungicide Resistance in Plant Pathogens. p. 199–216
Ziogas, B.N., A.N. Markoglou, and A. Tzima. 2002. A non-Mendelian inheritance of resistance to strobilurin fungicides in Ustilago maydis. Pest Manag. Sci. 58: 908–916. doi: 10.1002/ps.543.
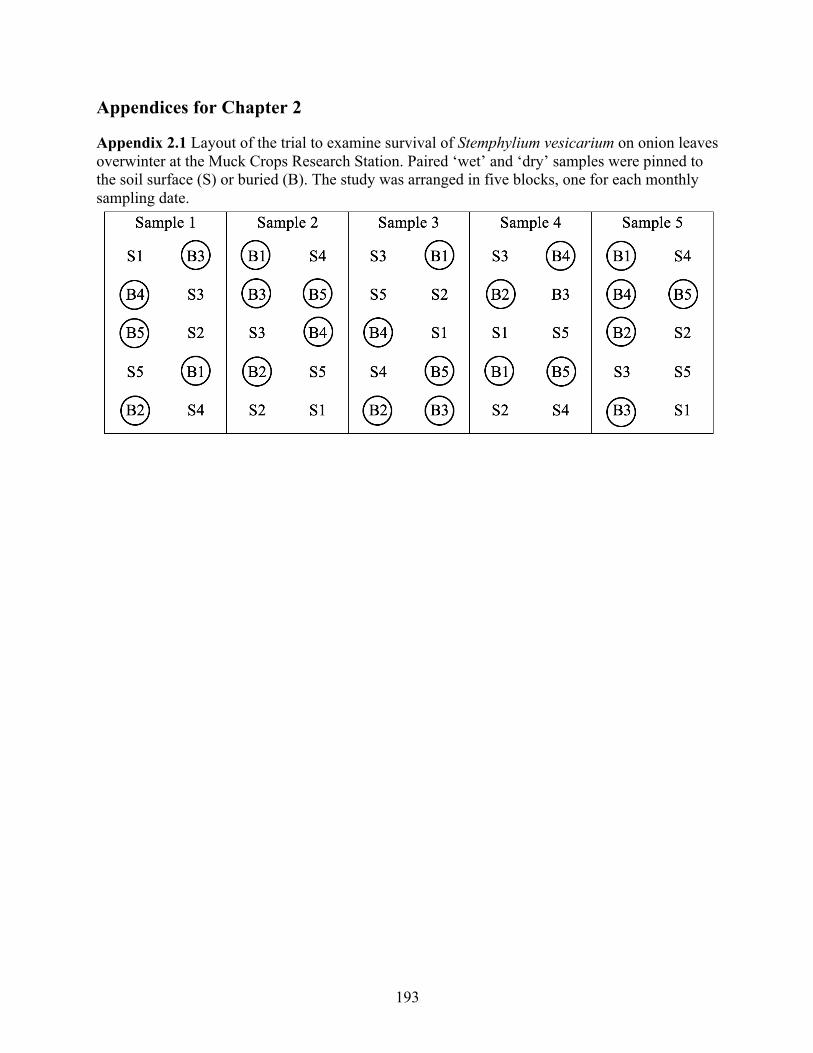
193
Appendices for Chapter 2 2. Appendices for Chapter 2
Appendix 2.1 Layout of the trial to examine survival of Stemphylium vesicarium on onion leaves overwinter at the Muck Crops Research Station. Paired ‘wet’ and ‘dry’ samples were pinned to the soil surface (S) or buried (B). The study was arranged in five blocks, one for each monthly sampling date.
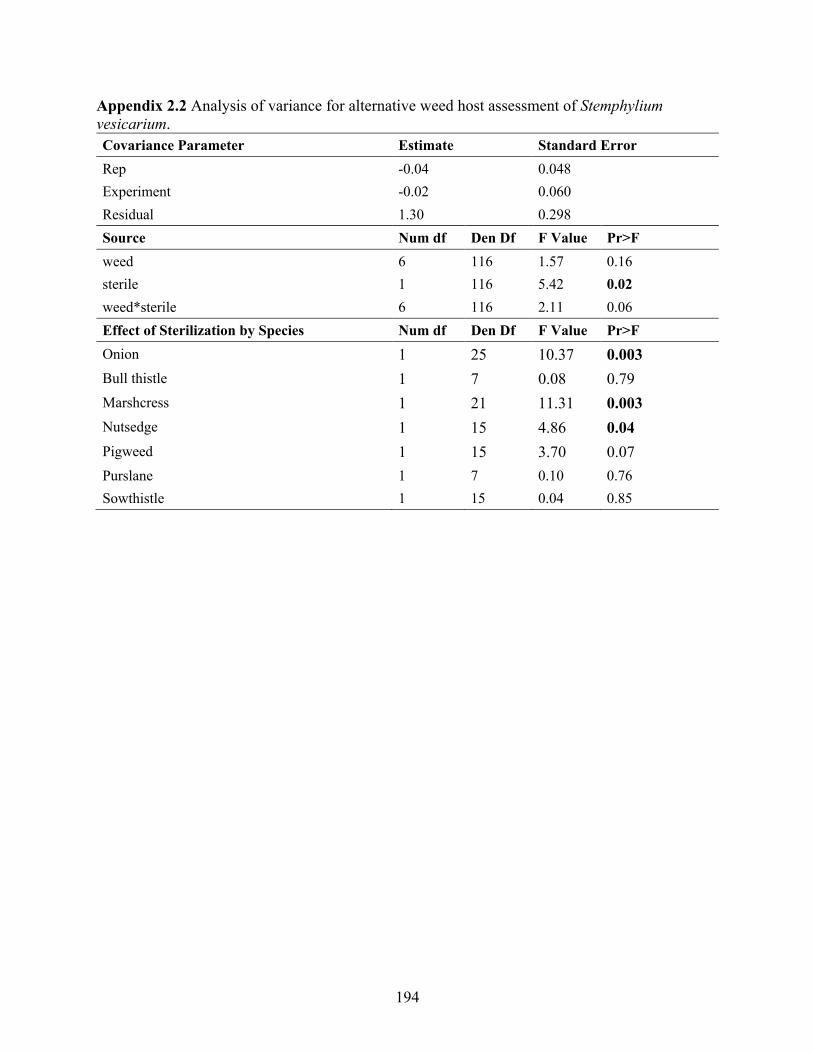
194
Appendix 2.2 Analysis of variance for alternative weed host assessment of Stemphylium vesicarium. Covariance Parameter Estimate Standard Error Rep -0.04 0.048 Experiment -0.02 0.060 Residual 1.30 0.298 Source Num df Den Df F Value Pr>F weed 6 116 1.57 0.16 sterile 1 116 5.42 0.02 weed*sterile 6 116 2.11 0.06 Effect of Sterilization by Species Num df Den Df F Value Pr>F Onion 1 25 10.37 0.003 Bull thistle 1 7 0.08 0.79 Marshcress 1 21 11.31 0.003 Nutsedge 1 15 4.86 0.04 Pigweed 1 15 3.70 0.07 Purslane 1 7 0.10 0.76 Sowthistle 1 15 0.04 0.85
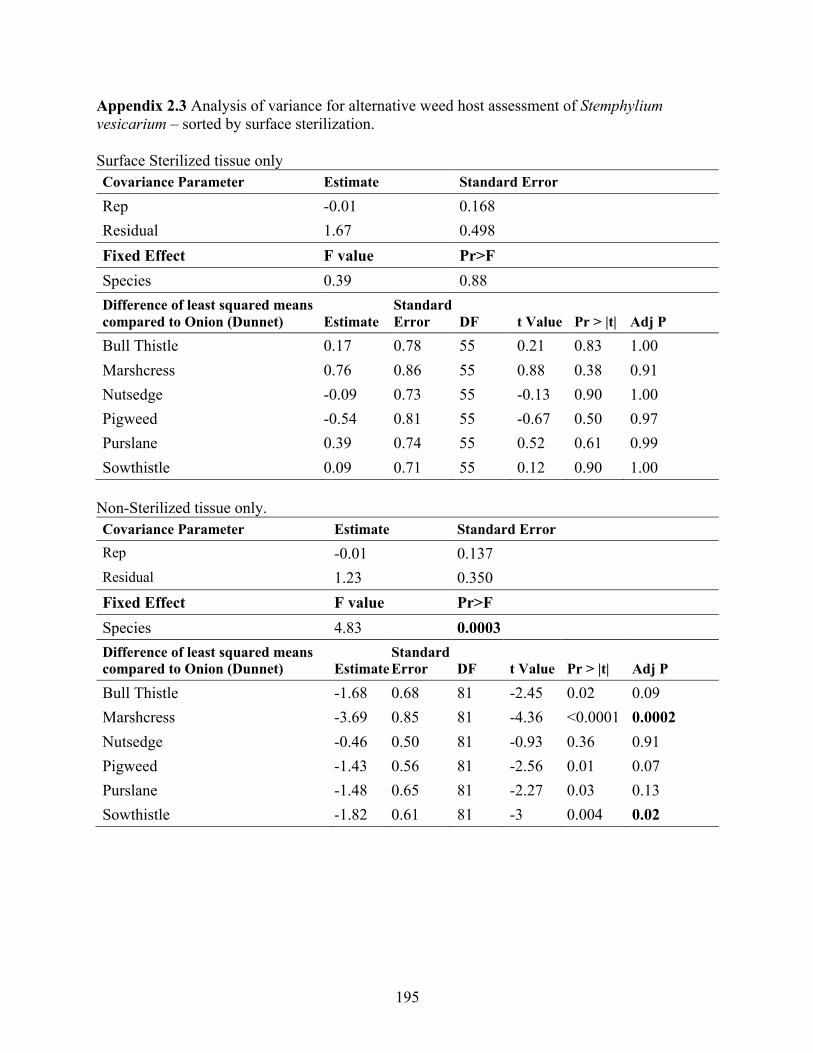
195
Appendix 2.3 Analysis of variance for alternative weed host assessment of Stemphylium vesicarium – sorted by surface sterilization. Surface Sterilized tissue only Covariance Parameter Estimate Standard Error
Rep -0.01 0.168 Residual 1.67 0.498 Fixed Effect F value Pr>F Species 0.39 0.88 Difference of least squared means compared to Onion (Dunnet) Estimate
Standard Error DF t Value Pr > |t| Adj P
Bull Thistle 0.17 0.78 55 0.21 0.83 1.00 Marshcress 0.76 0.86 55 0.88 0.38 0.91 Nutsedge -0.09 0.73 55 -0.13 0.90 1.00 Pigweed -0.54 0.81 55 -0.67 0.50 0.97 Purslane 0.39 0.74 55 0.52 0.61 0.99 Sowthistle 0.09 0.71 55 0.12 0.90 1.00
Non-Sterilized tissue only. Covariance Parameter Estimate Standard Error Rep -0.01 0.137 Residual 1.23 0.350 Fixed Effect F value Pr>F
Species 4.83 0.0003 Difference of least squared means compared to Onion (Dunnet) Estimate
Standard Error DF t Value Pr > |t| Adj P
Bull Thistle -1.68 0.68 81 -2.45 0.02 0.09 Marshcress -3.69 0.85 81 -4.36 <0.0001 0.0002 Nutsedge -0.46 0.50 81 -0.93 0.36 0.91 Pigweed -1.43 0.56 81 -2.56 0.01 0.07 Purslane -1.48 0.65 81 -2.27 0.03 0.13 Sowthistle -1.82 0.61 81 -3 0.004 0.02
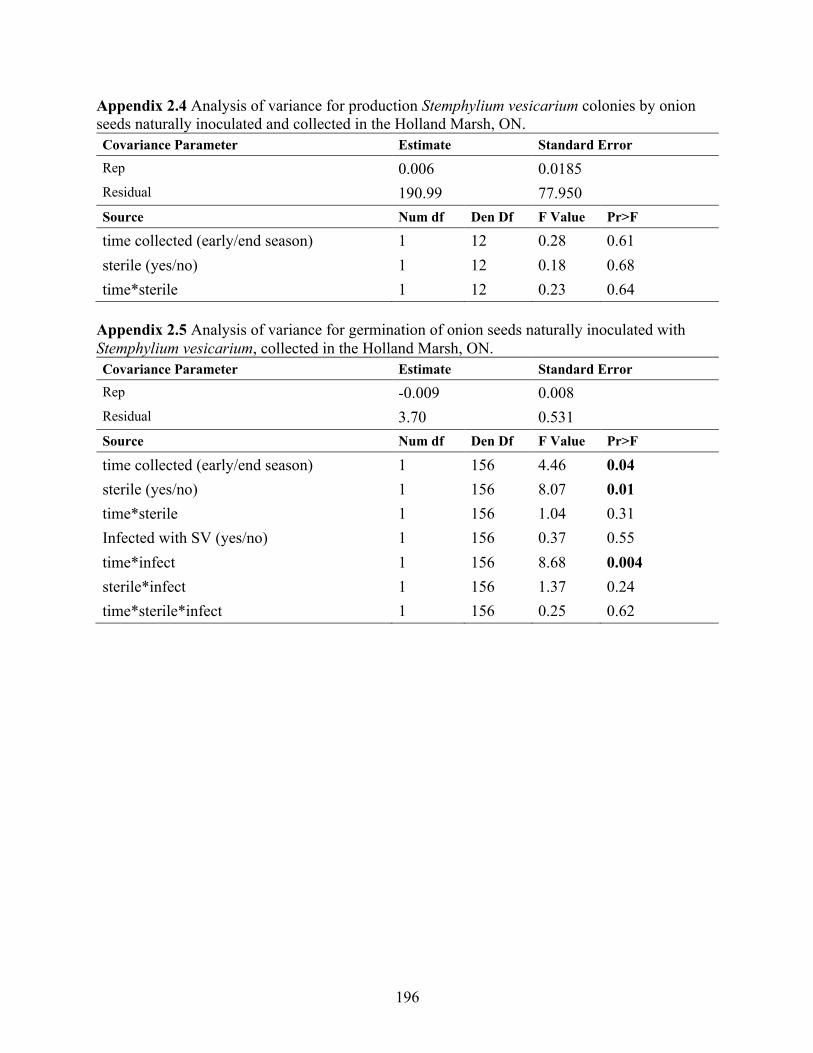
196
Appendix 2.4 Analysis of variance for production Stemphylium vesicarium colonies by onion seeds naturally inoculated and collected in the Holland Marsh, ON. Covariance Parameter Estimate Standard Error Rep 0.006 0.0185 Residual 190.99 77.950 Source Num df Den Df F Value Pr>F
time collected (early/end season) 1 12 0.28 0.61 sterile (yes/no) 1 12 0.18 0.68 time*sterile 1 12 0.23 0.64
Appendix 2.5 Analysis of variance for germination of onion seeds naturally inoculated with Stemphylium vesicarium, collected in the Holland Marsh, ON. Covariance Parameter Estimate Standard Error Rep -0.009 0.008 Residual 3.70 0.531 Source Num df Den Df F Value Pr>F
time collected (early/end season) 1 156 4.46 0.04 sterile (yes/no) 1 156 8.07 0.01 time*sterile 1 156 1.04 0.31 Infected with SV (yes/no) 1 156 0.37 0.55 time*infect 1 156 8.68 0.004 sterile*infect 1 156 1.37 0.24 time*sterile*infect 1 156 0.25 0.62
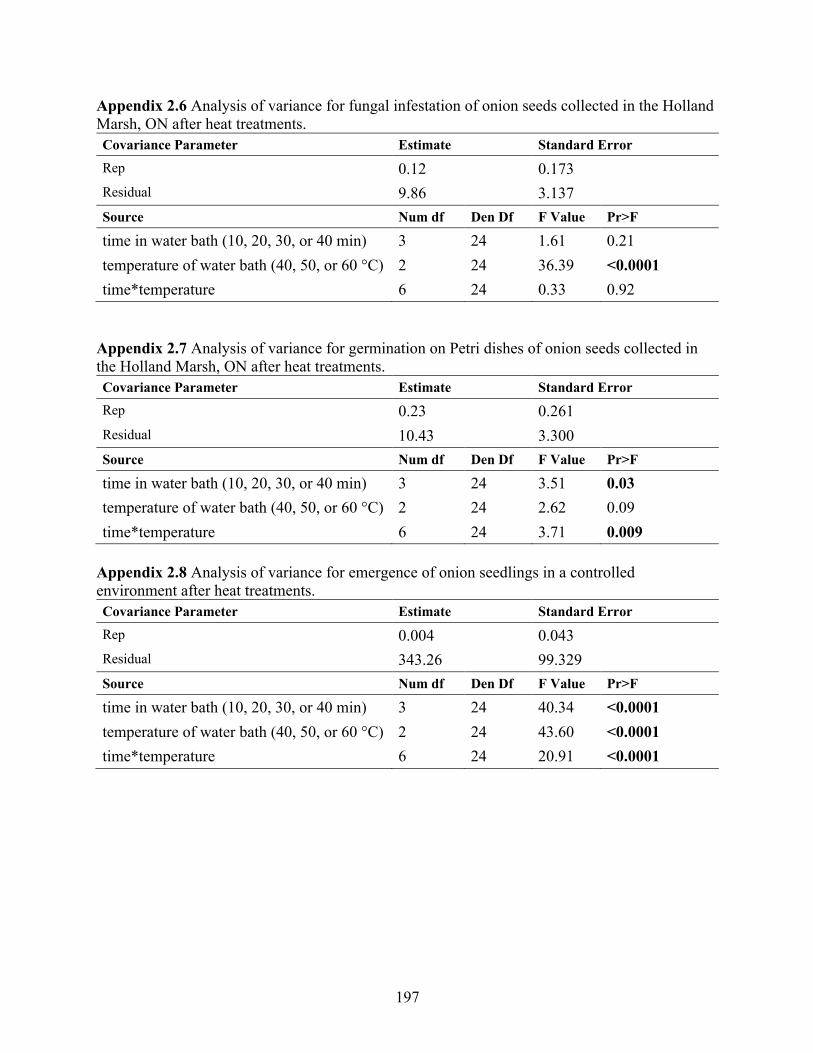
197
Appendix 2.6 Analysis of variance for fungal infestation of onion seeds collected in the Holland Marsh, ON after heat treatments. Covariance Parameter Estimate Standard Error Rep 0.12 0.173 Residual 9.86 3.137 Source Num df Den Df F Value Pr>F
time in water bath (10, 20, 30, or 40 min) 3 24 1.61 0.21 temperature of water bath (40, 50, or 60 °C) 2 24 36.39 <0.0001 time*temperature 6 24 0.33 0.92
Appendix 2.7 Analysis of variance for germination on Petri dishes of onion seeds collected in the Holland Marsh, ON after heat treatments. Covariance Parameter Estimate Standard Error Rep 0.23 0.261 Residual 10.43 3.300 Source Num df Den Df F Value Pr>F
time in water bath (10, 20, 30, or 40 min) 3 24 3.51 0.03 temperature of water bath (40, 50, or 60 °C) 2 24 2.62 0.09 time*temperature 6 24 3.71 0.009
Appendix 2.8 Analysis of variance for emergence of onion seedlings in a controlled environment after heat treatments. Covariance Parameter Estimate Standard Error Rep 0.004 0.043 Residual 343.26 99.329 Source Num df Den Df F Value Pr>F
time in water bath (10, 20, 30, or 40 min) 3 24 40.34 <0.0001 temperature of water bath (40, 50, or 60 °C) 2 24 43.60 <0.0001 time*temperature 6 24 20.91 <0.0001
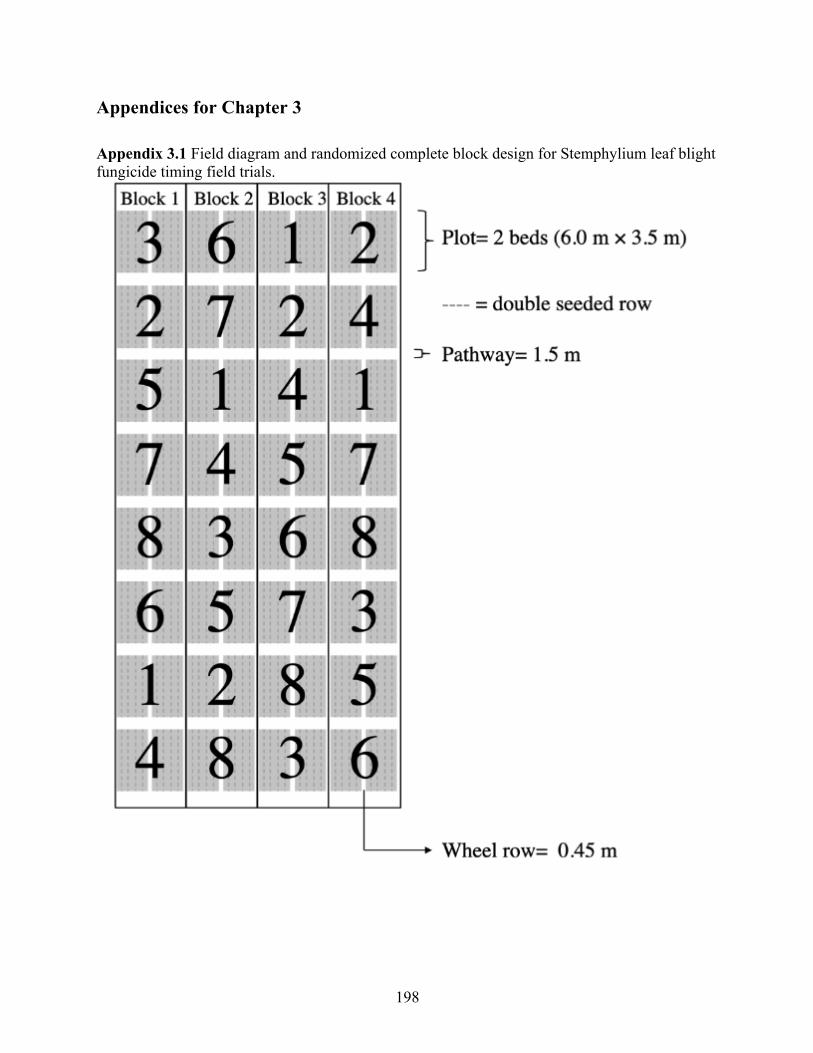
198
Appendices for Chapter 3 3. Appendices for Chapter 3
Appendix 3.1 Field diagram and randomized complete block design for Stemphylium leaf blight fungicide timing field trials.
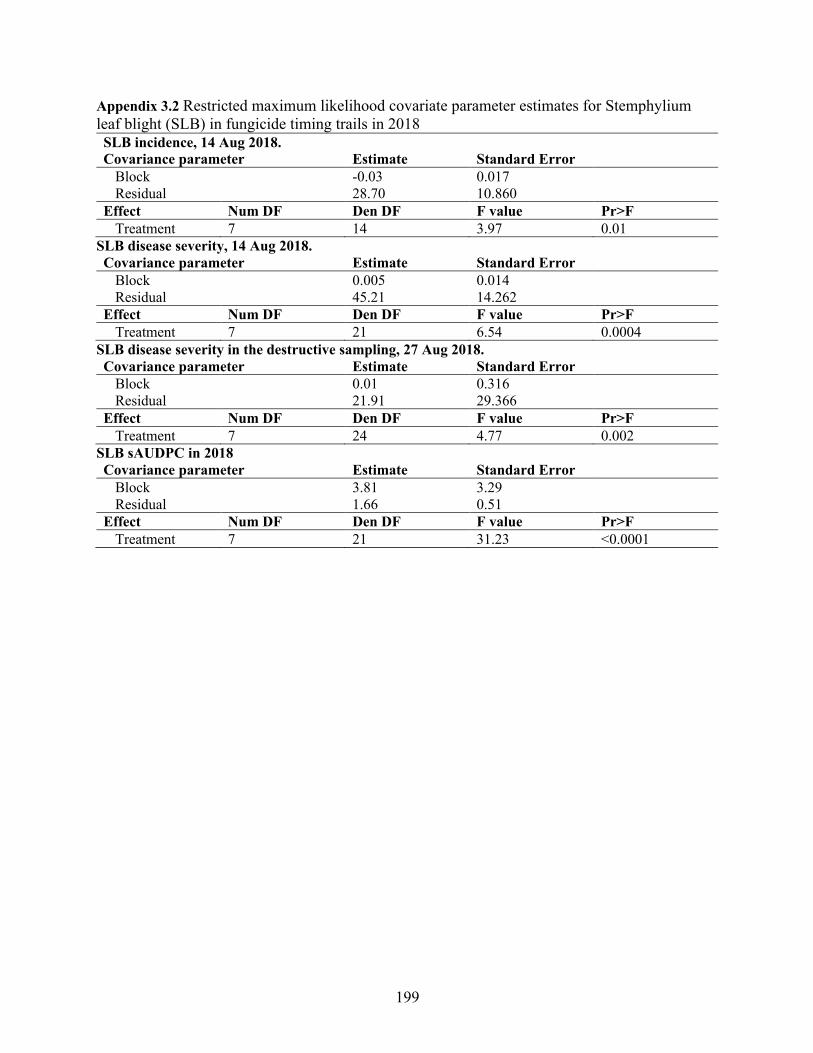
199
Appendix 3.2 Restricted maximum likelihood covariate parameter estimates for Stemphylium leaf blight (SLB) in fungicide timing trails in 2018 SLB incidence, 14 Aug 2018. Covariance parameter Estimate Standard Error
Block -0.03 0.017 Residual 28.70 10.860
Effect Num DF Den DF F value Pr>F Treatment 7 14 3.97 0.01
SLB disease severity, 14 Aug 2018. Covariance parameter Estimate Standard Error
Block 0.005 0.014 Residual 45.21 14.262
Effect Num DF Den DF F value Pr>F Treatment 7 21 6.54 0.0004
SLB disease severity in the destructive sampling, 27 Aug 2018. Covariance parameter Estimate Standard Error
Block 0.01 0.316 Residual 21.91 29.366
Effect Num DF Den DF F value Pr>F Treatment 7 24 4.77 0.002
SLB sAUDPC in 2018 Covariance parameter Estimate Standard Error
Block 3.81 3.29 Residual 1.66 0.51
Effect Num DF Den DF F value Pr>F Treatment 7 21 31.23 <0.0001
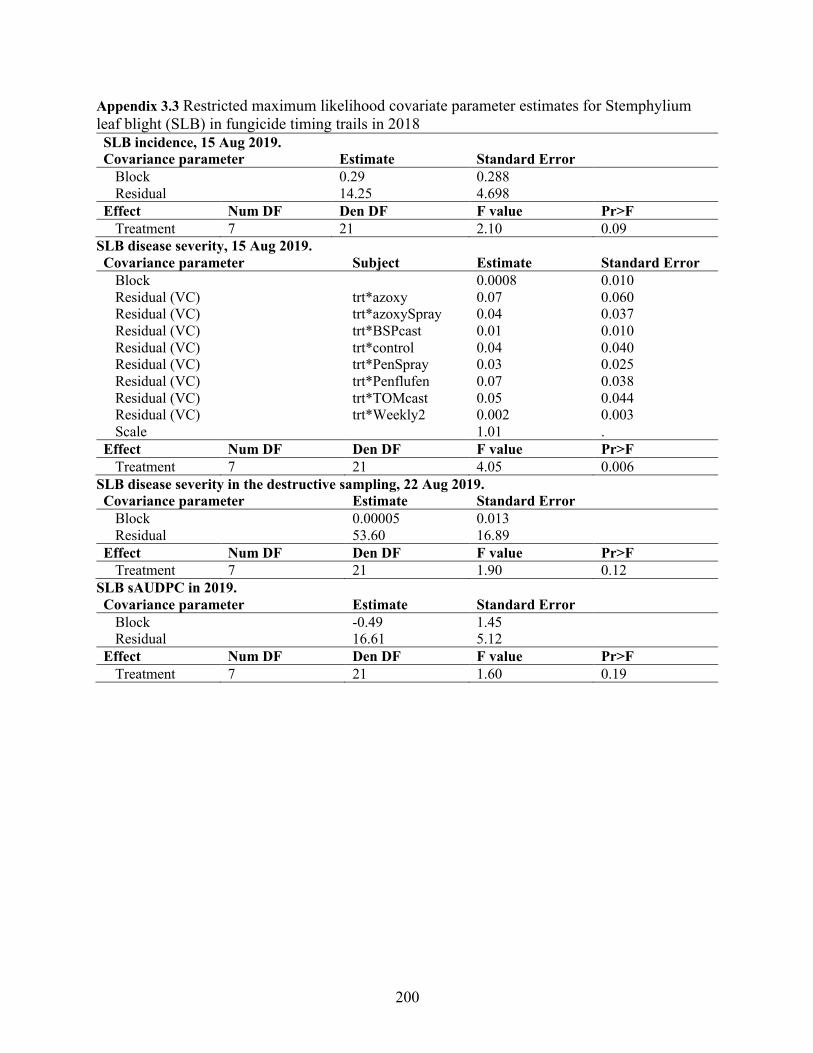
200
Appendix 3.3 Restricted maximum likelihood covariate parameter estimates for Stemphylium leaf blight (SLB) in fungicide timing trails in 2018 SLB incidence, 15 Aug 2019. Covariance parameter Estimate Standard Error
Block 0.29 0.288 Residual 14.25 4.698
Effect Num DF Den DF F value Pr>F Treatment 7 21 2.10 0.09
SLB disease severity, 15 Aug 2019. Covariance parameter Subject Estimate Standard Error
Block 0.0008 0.010 Residual (VC) trt*azoxy 0.07 0.060 Residual (VC) trt*azoxySpray 0.04 0.037 Residual (VC) trt*BSPcast 0.01 0.010 Residual (VC) trt*control 0.04 0.040 Residual (VC) trt*PenSpray 0.03 0.025 Residual (VC) trt*Penflufen 0.07 0.038 Residual (VC) trt*TOMcast 0.05 0.044 Residual (VC) trt*Weekly2 0.002 0.003 Scale 1.01 .
Effect Num DF Den DF F value Pr>F Treatment 7 21 4.05 0.006
SLB disease severity in the destructive sampling, 22 Aug 2019. Covariance parameter Estimate Standard Error
Block 0.00005 0.013 Residual 53.60 16.89
Effect Num DF Den DF F value Pr>F Treatment 7 21 1.90 0.12
SLB sAUDPC in 2019. Covariance parameter Estimate Standard Error
Block -0.49 1.45 Residual 16.61 5.12
Effect Num DF Den DF F value Pr>F Treatment 7 21 1.60 0.19
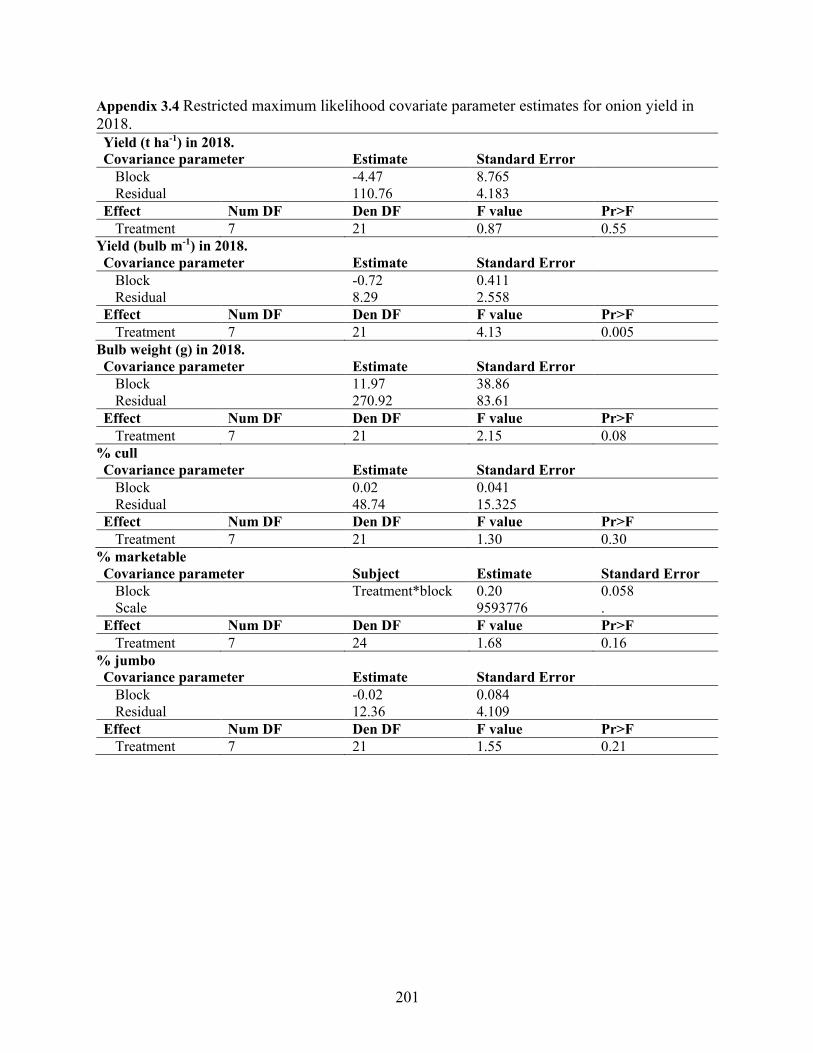
201
Appendix 3.4 Restricted maximum likelihood covariate parameter estimates for onion yield in 2018. Yield (t ha-1) in 2018. Covariance parameter Estimate Standard Error
Block -4.47 8.765 Residual 110.76 4.183
Effect Num DF Den DF F value Pr>F Treatment 7 21 0.87 0.55
Yield (bulb m-1) in 2018. Covariance parameter Estimate Standard Error
Block -0.72 0.411 Residual 8.29 2.558
Effect Num DF Den DF F value Pr>F Treatment 7 21 4.13 0.005
Bulb weight (g) in 2018. Covariance parameter Estimate Standard Error
Block 11.97 38.86 Residual 270.92 83.61
Effect Num DF Den DF F value Pr>F Treatment 7 21 2.15 0.08
% cull Covariance parameter Estimate Standard Error
Block 0.02 0.041 Residual 48.74 15.325
Effect Num DF Den DF F value Pr>F Treatment 7 21 1.30 0.30
% marketable Covariance parameter Subject Estimate Standard Error
Block Treatment*block 0.20 0.058 Scale 9593776 .
Effect Num DF Den DF F value Pr>F Treatment 7 24 1.68 0.16
% jumbo Covariance parameter Estimate Standard Error
Block -0.02 0.084 Residual 12.36 4.109
Effect Num DF Den DF F value Pr>F Treatment 7 21 1.55 0.21
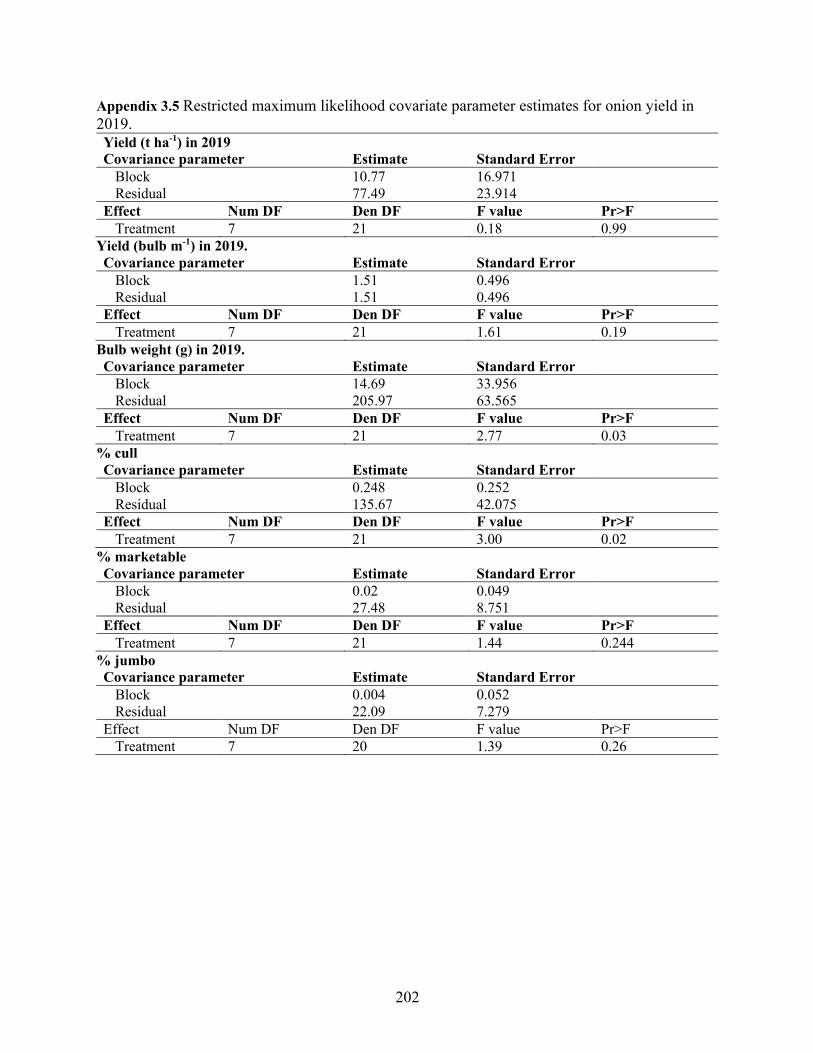
202
Appendix 3.5 Restricted maximum likelihood covariate parameter estimates for onion yield in 2019. Yield (t ha-1) in 2019 Covariance parameter Estimate Standard Error
Block 10.77 16.971 Residual 77.49 23.914
Effect Num DF Den DF F value Pr>F Treatment 7 21 0.18 0.99
Yield (bulb m-1) in 2019. Covariance parameter Estimate Standard Error
Block 1.51 0.496 Residual 1.51 0.496
Effect Num DF Den DF F value Pr>F Treatment 7 21 1.61 0.19
Bulb weight (g) in 2019. Covariance parameter Estimate Standard Error
Block 14.69 33.956 Residual 205.97 63.565
Effect Num DF Den DF F value Pr>F Treatment 7 21 2.77 0.03
% cull Covariance parameter Estimate Standard Error
Block 0.248 0.252 Residual 135.67 42.075
Effect Num DF Den DF F value Pr>F Treatment 7 21 3.00 0.02
% marketable Covariance parameter Estimate Standard Error
Block 0.02 0.049 Residual 27.48 8.751
Effect Num DF Den DF F value Pr>F Treatment 7 21 1.44 0.244
% jumbo Covariance parameter Estimate Standard Error
Block 0.004 0.052 Residual 22.09 7.279
Effect Num DF Den DF F value Pr>F Treatment 7 20 1.39 0.26
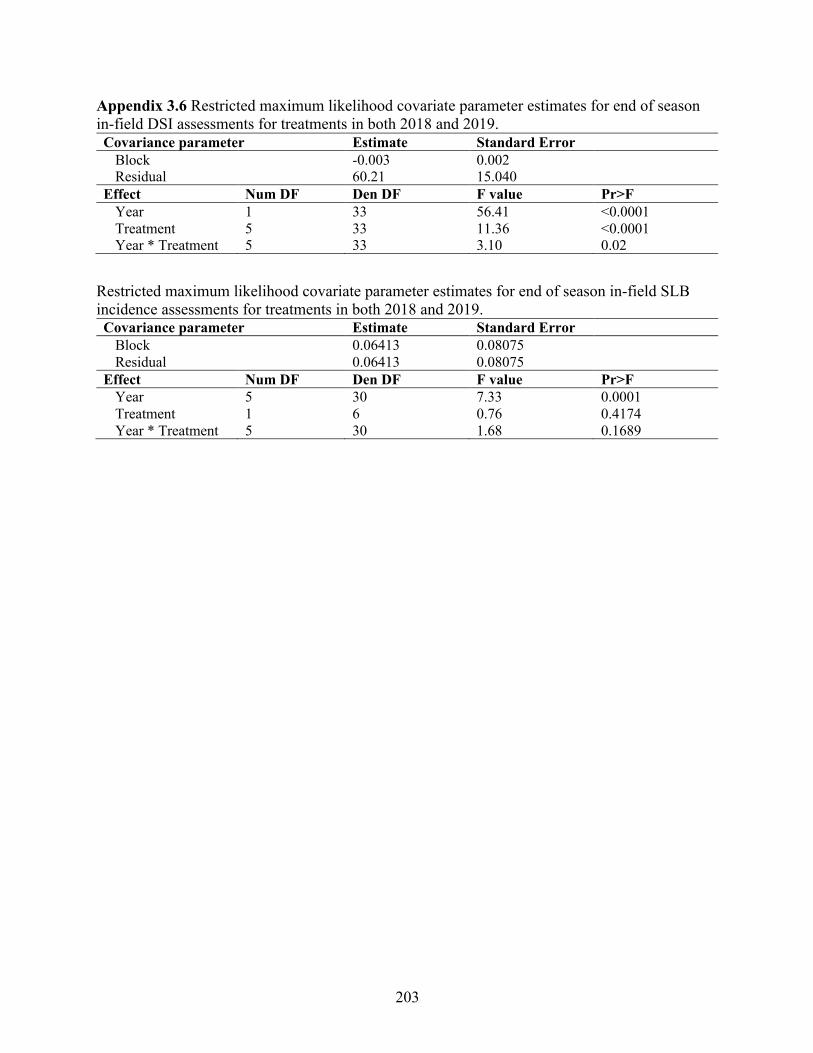
203
Appendix 3.6 Restricted maximum likelihood covariate parameter estimates for end of season in-field DSI assessments for treatments in both 2018 and 2019. Covariance parameter Estimate Standard Error
Block -0.003 0.002 Residual 60.21 15.040
Effect Num DF Den DF F value Pr>F Year 1 33 56.41 <0.0001 Treatment 5 33 11.36 <0.0001 Year * Treatment 5 33 3.10 0.02
Restricted maximum likelihood covariate parameter estimates for end of season in-field SLB incidence assessments for treatments in both 2018 and 2019. Covariance parameter Estimate Standard Error
Block 0.06413 0.08075 Residual 0.06413 0.08075
Effect Num DF Den DF F value Pr>F Year 5 30 7.33 0.0001 Treatment 1 6 0.76 0.4174 Year * Treatment 5 30 1.68 0.1689

204
Appendices for Chapter 4 4. Appendices for Chapter 4
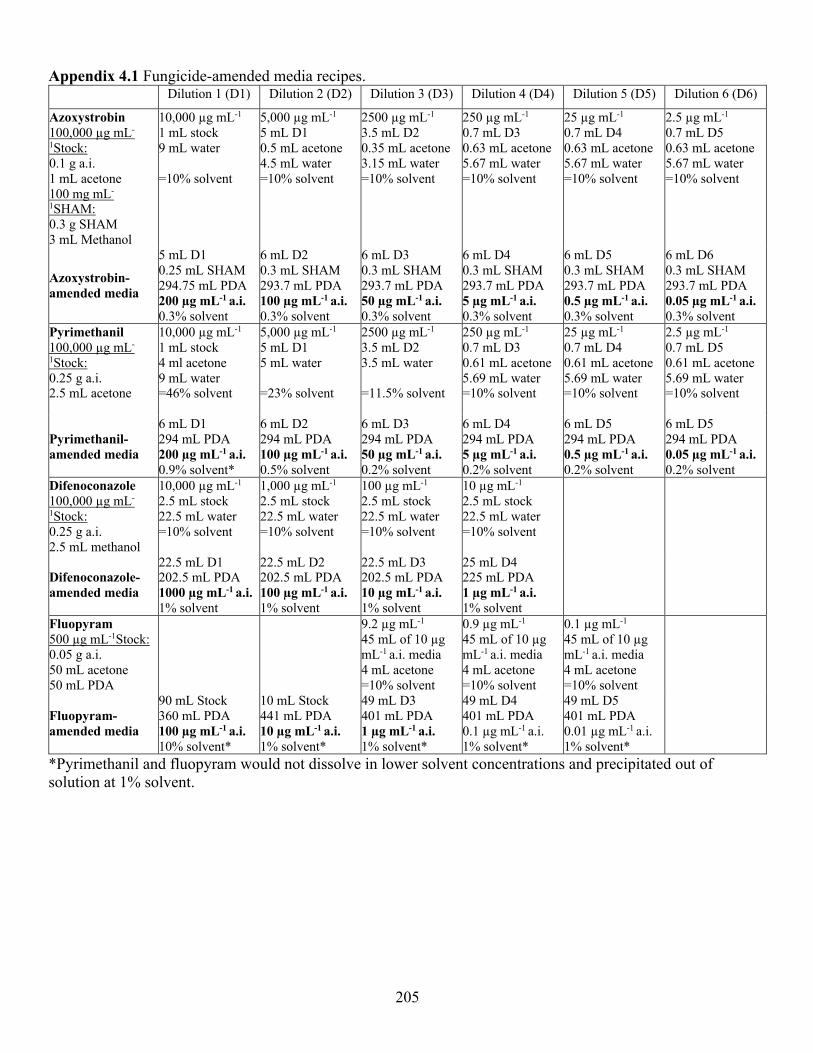
205
Appendix 4.1 Fungicide-amended media recipes. Dilution 1 (D1) Dilution 2 (D2) Dilution 3 (D3) Dilution 4 (D4) Dilution 5 (D5) Dilution 6 (D6)
Azoxystrobin 100,000 µg mL-
1Stock: 0.1 g a.i. 1 mL acetone 100 mg mL-
1SHAM: 0.3 g SHAM 3 mL Methanol
10,000 µg mL-1 1 mL stock 9 mL water =10% solvent
5,000 µg mL-1 5 mL D1 0.5 mL acetone 4.5 mL water =10% solvent
2500 µg mL-1 3.5 mL D2 0.35 mL acetone 3.15 mL water =10% solvent
250 µg mL-1 0.7 mL D3 0.63 mL acetone 5.67 mL water =10% solvent
25 µg mL-1 0.7 mL D4 0.63 mL acetone 5.67 mL water =10% solvent
2.5 µg mL-1 0.7 mL D5 0.63 mL acetone 5.67 mL water =10% solvent
Azoxystrobin-amended media
5 mL D1 0.25 mL SHAM 294.75 mL PDA 200 µg mL-1 a.i. 0.3% solvent
6 mL D2 0.3 mL SHAM 293.7 mL PDA 100 µg mL-1 a.i. 0.3% solvent
6 mL D3 0.3 mL SHAM 293.7 mL PDA 50 µg mL-1 a.i. 0.3% solvent
6 mL D4 0.3 mL SHAM 293.7 mL PDA 5 µg mL-1 a.i. 0.3% solvent
6 mL D5 0.3 mL SHAM 293.7 mL PDA 0.5 µg mL-1 a.i. 0.3% solvent
6 mL D6 0.3 mL SHAM 293.7 mL PDA 0.05 µg mL-1 a.i. 0.3% solvent
Pyrimethanil 100,000 µg mL-
1Stock: 0.25 g a.i. 2.5 mL acetone
10,000 µg mL-1 1 mL stock 4 ml acetone 9 mL water =46% solvent
5,000 µg mL-1 5 mL D1 5 mL water =23% solvent
2500 µg mL-1 3.5 mL D2 3.5 mL water =11.5% solvent
250 µg mL-1 0.7 mL D3 0.61 mL acetone 5.69 mL water =10% solvent
25 µg mL-1 0.7 mL D4 0.61 mL acetone 5.69 mL water =10% solvent
2.5 µg mL-1 0.7 mL D5 0.61 mL acetone 5.69 mL water =10% solvent
Pyrimethanil- amended media
6 mL D1 294 mL PDA 200 µg mL-1 a.i. 0.9% solvent*
6 mL D2 294 mL PDA 100 µg mL-1 a.i. 0.5% solvent
6 mL D3 294 mL PDA 50 µg mL-1 a.i. 0.2% solvent
6 mL D4 294 mL PDA 5 µg mL-1 a.i. 0.2% solvent
6 mL D5 294 mL PDA 0.5 µg mL-1 a.i. 0.2% solvent
6 mL D5 294 mL PDA 0.05 µg mL-1 a.i. 0.2% solvent
Difenoconazole 100,000 µg mL-
1Stock: 0.25 g a.i. 2.5 mL methanol
10,000 µg mL-1 2.5 mL stock 22.5 mL water =10% solvent
1,000 µg mL-1 2.5 mL stock 22.5 mL water =10% solvent
100 µg mL-1 2.5 mL stock 22.5 mL water =10% solvent
10 µg mL-1 2.5 mL stock 22.5 mL water =10% solvent
Difenoconazole-amended media
22.5 mL D1 202.5 mL PDA 1000 µg mL-1 a.i. 1% solvent
22.5 mL D2 202.5 mL PDA 100 µg mL-1 a.i. 1% solvent
22.5 mL D3 202.5 mL PDA 10 µg mL-1 a.i. 1% solvent
25 mL D4 225 mL PDA 1 µg mL-1 a.i. 1% solvent
Fluopyram 500 µg mL-1Stock: 0.05 g a.i. 50 mL acetone 50 mL PDA
9.2 µg mL-1 45 mL of 10 µg mL-1 a.i. media 4 mL acetone =10% solvent
0.9 µg mL-1 45 mL of 10 µg mL-1 a.i. media 4 mL acetone =10% solvent
0.1 µg mL-1 45 mL of 10 µg mL-1 a.i. media 4 mL acetone =10% solvent
Fluopyram- amended media
90 mL Stock 360 mL PDA 100 µg mL-1 a.i. 10% solvent*
10 mL Stock 441 mL PDA 10 µg mL-1 a.i. 1% solvent*
49 mL D3 401 mL PDA 1 µg mL-1 a.i. 1% solvent*
49 mL D4 401 mL PDA 0.1 µg mL-1 a.i. 1% solvent*
49 mL D5 401 mL PDA 0.01 µg mL-1 a.i. 1% solvent*
*Pyrimethanil and fluopyram would not dissolve in lower solvent concentrations and precipitated out of solution at 1% solvent.
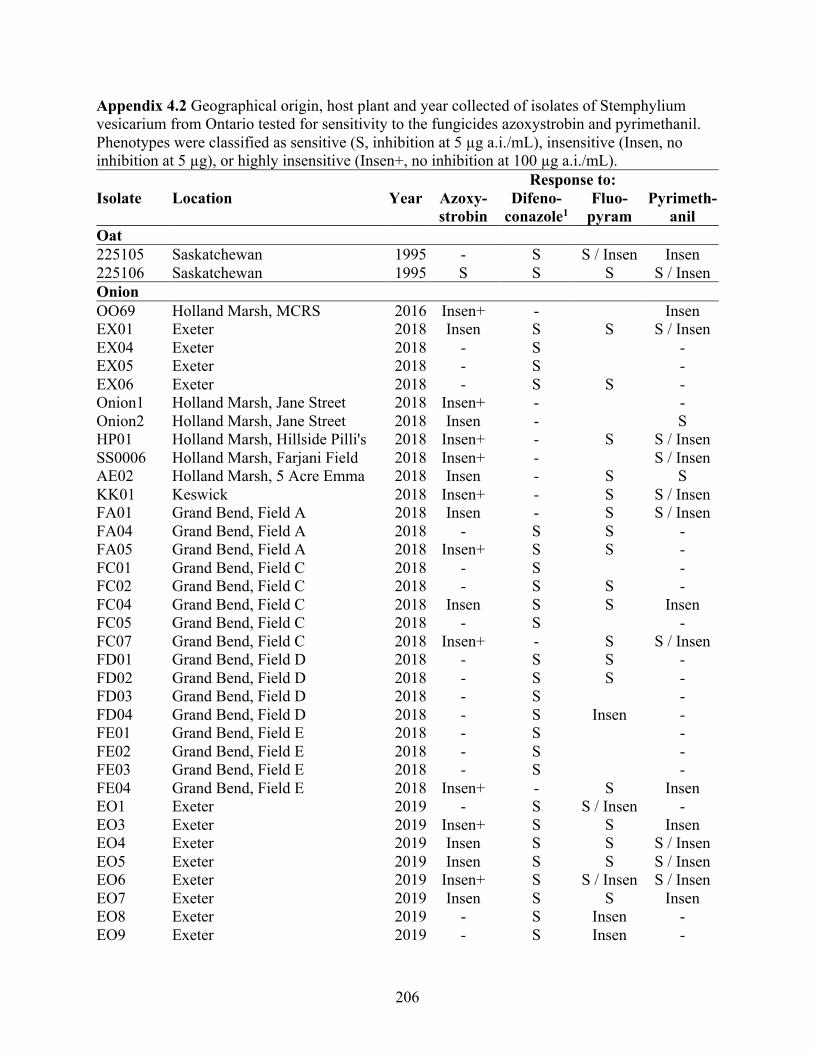
206
Appendix 4.2 Geographical origin, host plant and year collected of isolates of Stemphylium vesicarium from Ontario tested for sensitivity to the fungicides azoxystrobin and pyrimethanil. Phenotypes were classified as sensitive (S, inhibition at 5 µg a.i./mL), insensitive (Insen, no inhibition at 5 µg), or highly insensitive (Insen+, no inhibition at 100 µg a.i./mL). Response to: Isolate Location Year Azoxy-
strobin Difeno-
conazole1 Fluo-
pyram Pyrimeth-
anil Oat
225105 Saskatchewan 1995 - S S / Insen Insen 225106 Saskatchewan 1995 S S S S / Insen Onion
OO69 Holland Marsh, MCRS 2016 Insen+ - Insen EX01 Exeter 2018 Insen S S S / Insen EX04 Exeter 2018 - S - EX05 Exeter 2018 - S - EX06 Exeter 2018 - S S - Onion1 Holland Marsh, Jane Street 2018 Insen+ - - Onion2 Holland Marsh, Jane Street 2018 Insen - S HP01 Holland Marsh, Hillside Pilli's 2018 Insen+ - S S / Insen SS0006 Holland Marsh, Farjani Field 2018 Insen+ - S / Insen AE02 Holland Marsh, 5 Acre Emma 2018 Insen - S S KK01 Keswick 2018 Insen+ - S S / Insen FA01 Grand Bend, Field A 2018 Insen - S S / Insen FA04 Grand Bend, Field A 2018 - S S - FA05 Grand Bend, Field A 2018 Insen+ S S - FC01 Grand Bend, Field C 2018 - S - FC02 Grand Bend, Field C 2018 - S S - FC04 Grand Bend, Field C 2018 Insen S S Insen FC05 Grand Bend, Field C 2018 - S - FC07 Grand Bend, Field C 2018 Insen+ - S S / Insen FD01 Grand Bend, Field D 2018 - S S - FD02 Grand Bend, Field D 2018 - S S - FD03 Grand Bend, Field D 2018 - S - FD04 Grand Bend, Field D 2018 - S Insen - FE01 Grand Bend, Field E 2018 - S - FE02 Grand Bend, Field E 2018 - S - FE03 Grand Bend, Field E 2018 - S - FE04 Grand Bend, Field E 2018 Insen+ - S Insen EO1 Exeter 2019 - S S / Insen - EO3 Exeter 2019 Insen+ S S Insen EO4 Exeter 2019 Insen S S S / Insen EO5 Exeter 2019 Insen S S S / Insen EO6 Exeter 2019 Insen+ S S / Insen S / Insen EO7 Exeter 2019 Insen S S Insen EO8 Exeter 2019 - S Insen - EO9 Exeter 2019 - S Insen -
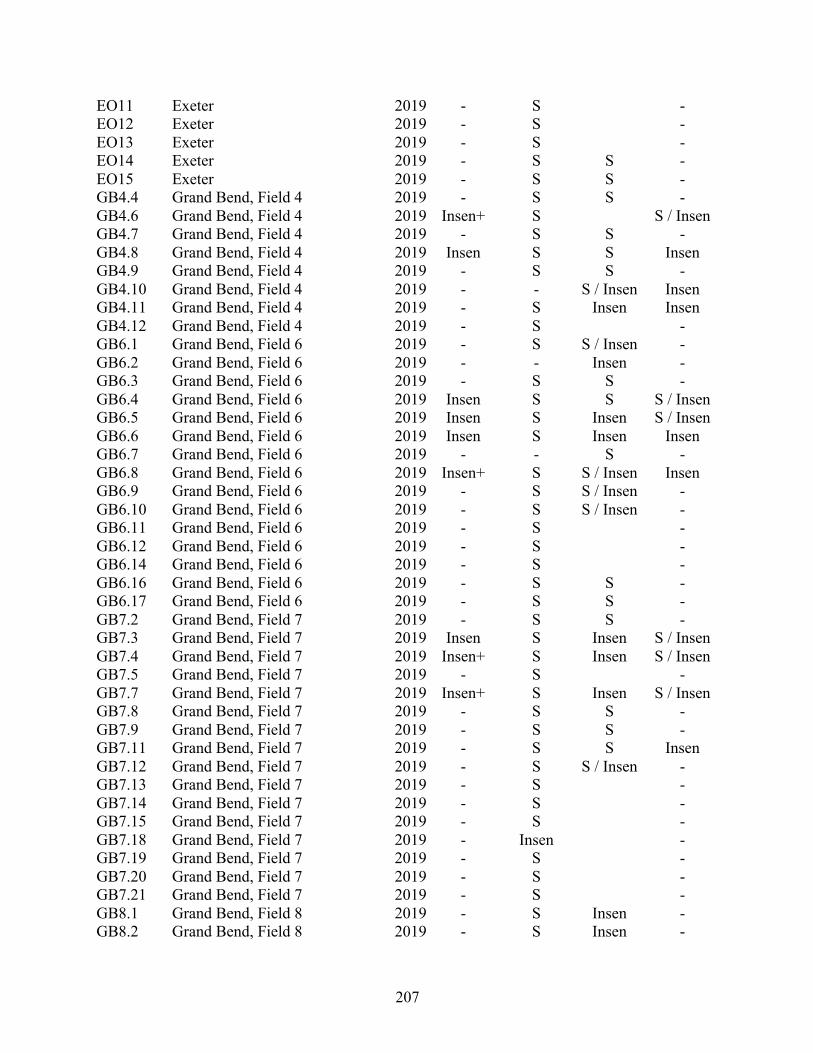
207
EO11 Exeter 2019 - S - EO12 Exeter 2019 - S - EO13 Exeter 2019 - S - EO14 Exeter 2019 - S S - EO15 Exeter 2019 - S S - GB4.4 Grand Bend, Field 4 2019 - S S - GB4.6 Grand Bend, Field 4 2019 Insen+ S S / Insen GB4.7 Grand Bend, Field 4 2019 - S S - GB4.8 Grand Bend, Field 4 2019 Insen S S Insen GB4.9 Grand Bend, Field 4 2019 - S S - GB4.10 Grand Bend, Field 4 2019 - - S / Insen Insen GB4.11 Grand Bend, Field 4 2019 - S Insen Insen GB4.12 Grand Bend, Field 4 2019 - S - GB6.1 Grand Bend, Field 6 2019 - S S / Insen - GB6.2 Grand Bend, Field 6 2019 - - Insen - GB6.3 Grand Bend, Field 6 2019 - S S - GB6.4 Grand Bend, Field 6 2019 Insen S S S / Insen GB6.5 Grand Bend, Field 6 2019 Insen S Insen S / Insen GB6.6 Grand Bend, Field 6 2019 Insen S Insen Insen GB6.7 Grand Bend, Field 6 2019 - - S - GB6.8 Grand Bend, Field 6 2019 Insen+ S S / Insen Insen GB6.9 Grand Bend, Field 6 2019 - S S / Insen - GB6.10 Grand Bend, Field 6 2019 - S S / Insen - GB6.11 Grand Bend, Field 6 2019 - S - GB6.12 Grand Bend, Field 6 2019 - S - GB6.14 Grand Bend, Field 6 2019 - S - GB6.16 Grand Bend, Field 6 2019 - S S - GB6.17 Grand Bend, Field 6 2019 - S S - GB7.2 Grand Bend, Field 7 2019 - S S - GB7.3 Grand Bend, Field 7 2019 Insen S Insen S / Insen GB7.4 Grand Bend, Field 7 2019 Insen+ S Insen S / Insen GB7.5 Grand Bend, Field 7 2019 - S - GB7.7 Grand Bend, Field 7 2019 Insen+ S Insen S / Insen GB7.8 Grand Bend, Field 7 2019 - S S - GB7.9 Grand Bend, Field 7 2019 - S S - GB7.11 Grand Bend, Field 7 2019 - S S Insen GB7.12 Grand Bend, Field 7 2019 - S S / Insen - GB7.13 Grand Bend, Field 7 2019 - S - GB7.14 Grand Bend, Field 7 2019 - S - GB7.15 Grand Bend, Field 7 2019 - S - GB7.18 Grand Bend, Field 7 2019 - Insen - GB7.19 Grand Bend, Field 7 2019 - S - GB7.20 Grand Bend, Field 7 2019 - S - GB7.21 Grand Bend, Field 7 2019 - S - GB8.1 Grand Bend, Field 8 2019 - S Insen - GB8.2 Grand Bend, Field 8 2019 - S Insen -
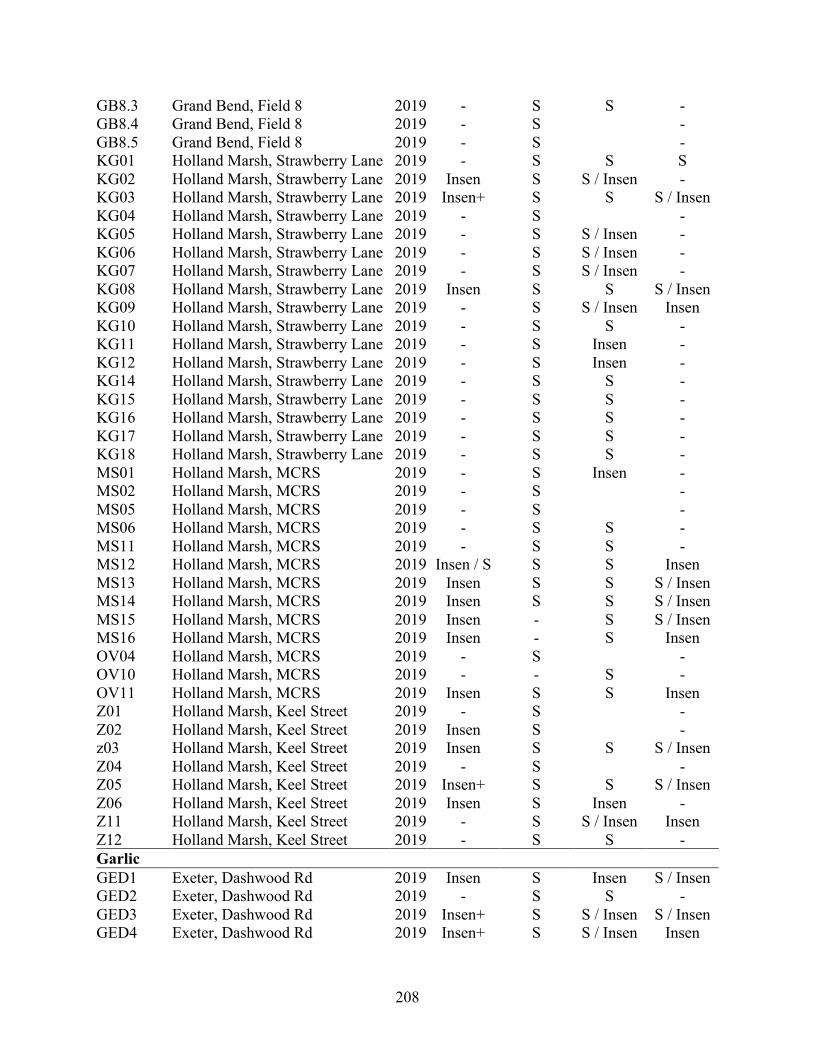
208
GB8.3 Grand Bend, Field 8 2019 - S S - GB8.4 Grand Bend, Field 8 2019 - S - GB8.5 Grand Bend, Field 8 2019 - S - KG01 Holland Marsh, Strawberry Lane 2019 - S S S KG02 Holland Marsh, Strawberry Lane 2019 Insen S S / Insen - KG03 Holland Marsh, Strawberry Lane 2019 Insen+ S S S / Insen KG04 Holland Marsh, Strawberry Lane 2019 - S - KG05 Holland Marsh, Strawberry Lane 2019 - S S / Insen - KG06 Holland Marsh, Strawberry Lane 2019 - S S / Insen - KG07 Holland Marsh, Strawberry Lane 2019 - S S / Insen - KG08 Holland Marsh, Strawberry Lane 2019 Insen S S S / Insen KG09 Holland Marsh, Strawberry Lane 2019 - S S / Insen Insen KG10 Holland Marsh, Strawberry Lane 2019 - S S - KG11 Holland Marsh, Strawberry Lane 2019 - S Insen - KG12 Holland Marsh, Strawberry Lane 2019 - S Insen - KG14 Holland Marsh, Strawberry Lane 2019 - S S - KG15 Holland Marsh, Strawberry Lane 2019 - S S - KG16 Holland Marsh, Strawberry Lane 2019 - S S - KG17 Holland Marsh, Strawberry Lane 2019 - S S - KG18 Holland Marsh, Strawberry Lane 2019 - S S - MS01 Holland Marsh, MCRS 2019 - S Insen - MS02 Holland Marsh, MCRS 2019 - S - MS05 Holland Marsh, MCRS 2019 - S - MS06 Holland Marsh, MCRS 2019 - S S - MS11 Holland Marsh, MCRS 2019 - S S - MS12 Holland Marsh, MCRS 2019 Insen / S S S Insen MS13 Holland Marsh, MCRS 2019 Insen S S S / Insen MS14 Holland Marsh, MCRS 2019 Insen S S S / Insen MS15 Holland Marsh, MCRS 2019 Insen - S S / Insen MS16 Holland Marsh, MCRS 2019 Insen - S Insen OV04 Holland Marsh, MCRS 2019 - S - OV10 Holland Marsh, MCRS 2019 - - S - OV11 Holland Marsh, MCRS 2019 Insen S S Insen Z01 Holland Marsh, Keel Street 2019 - S - Z02 Holland Marsh, Keel Street 2019 Insen S - z03 Holland Marsh, Keel Street 2019 Insen S S S / Insen Z04 Holland Marsh, Keel Street 2019 - S - Z05 Holland Marsh, Keel Street 2019 Insen+ S S S / Insen Z06 Holland Marsh, Keel Street 2019 Insen S Insen - Z11 Holland Marsh, Keel Street 2019 - S S / Insen Insen Z12 Holland Marsh, Keel Street 2019 - S S - Garlic
GED1 Exeter, Dashwood Rd 2019 Insen S Insen S / Insen GED2 Exeter, Dashwood Rd 2019 - S S - GED3 Exeter, Dashwood Rd 2019 Insen+ S S / Insen S / Insen GED4 Exeter, Dashwood Rd 2019 Insen+ S S / Insen Insen
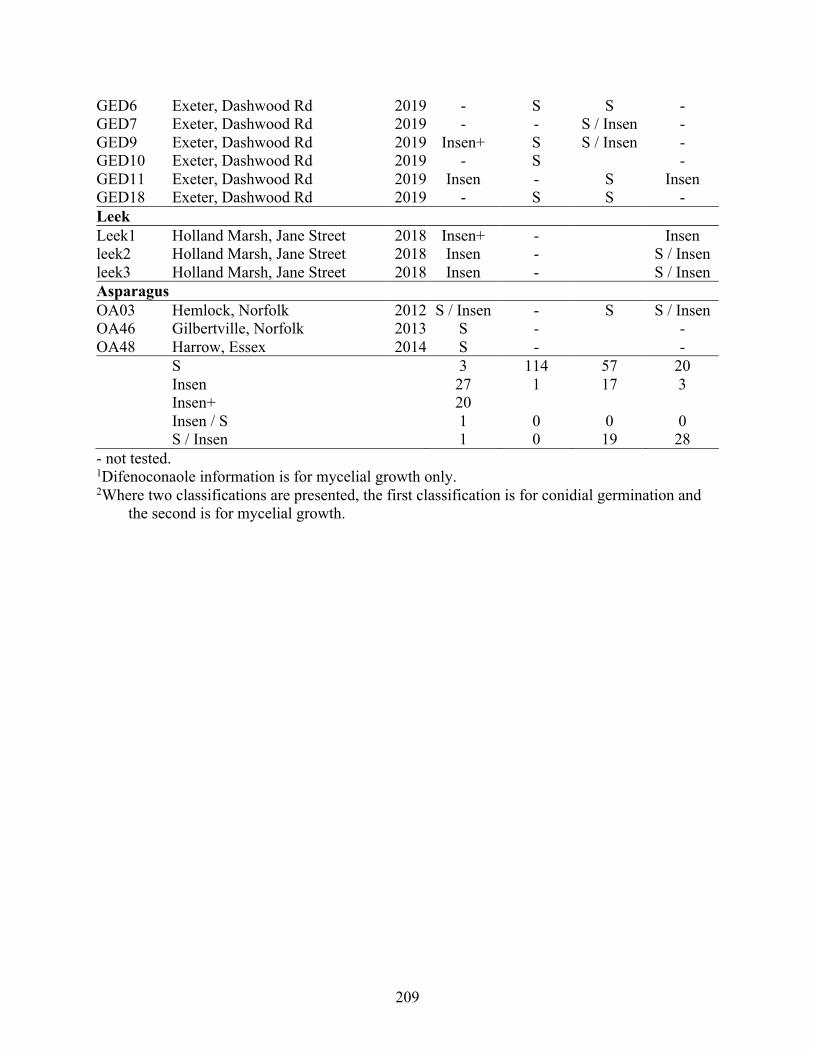
209
GED6 Exeter, Dashwood Rd 2019 - S S - GED7 Exeter, Dashwood Rd 2019 - - S / Insen - GED9 Exeter, Dashwood Rd 2019 Insen+ S S / Insen - GED10 Exeter, Dashwood Rd 2019 - S - GED11 Exeter, Dashwood Rd 2019 Insen - S Insen GED18 Exeter, Dashwood Rd 2019 - S S - Leek
Leek1 Holland Marsh, Jane Street 2018 Insen+ - Insen leek2 Holland Marsh, Jane Street 2018 Insen - S / Insen leek3 Holland Marsh, Jane Street 2018 Insen - S / Insen Asparagus
OA03 Hemlock, Norfolk 2012 S / Insen - S S / Insen OA46 Gilbertville, Norfolk 2013 S - - OA48 Harrow, Essex 2014 S - -
S 3 114 57 20 Insen Insen+
27 20
1 17 3 Insen / S 1 0 0 0 S / Insen 1 0 19 28
- not tested. 1Difenoconaole information is for mycelial growth only. 2Where two classifications are presented, the first classification is for conidial germination and
the second is for mycelial growth.
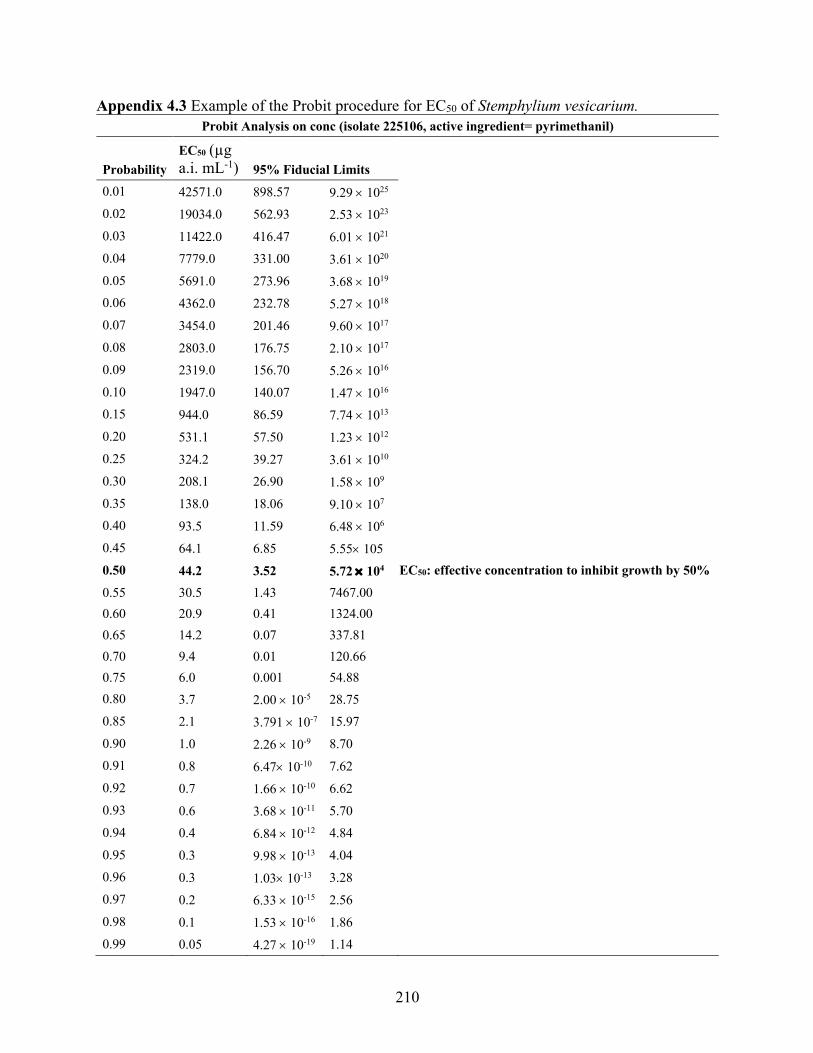
210
Appendix 4.3 Example of the Probit procedure for EC50 of Stemphylium vesicarium. Probit Analysis on conc (isolate 225106, active ingredient= pyrimethanil)
Probability EC50 (µg a.i. mL-1) 95% Fiducial Limits
0.01 42571.0 898.57 9.29 ´ 1025
0.02 19034.0 562.93 2.53 ´ 1023
0.03 11422.0 416.47 6.01 ´ 1021
0.04 7779.0 331.00 3.61 ´ 1020
0.05 5691.0 273.96 3.68 ´ 1019 0.06 4362.0 232.78 5.27 ´ 1018
0.07 3454.0 201.46 9.60 ´ 1017
0.08 2803.0 176.75 2.10 ´ 1017
0.09 2319.0 156.70 5.26 ´ 1016
0.10 1947.0 140.07 1.47 ´ 1016 0.15 944.0 86.59 7.74 ´ 1013
0.20 531.1 57.50 1.23 ´ 1012
0.25 324.2 39.27 3.61 ´ 1010
0.30 208.1 26.90 1.58 ´ 109
0.35 138.0 18.06 9.10 ´ 107 0.40 93.5 11.59 6.48 ´ 106
0.45 64.1 6.85 5.55´ 105
0.50 44.2 3.52 5.72 ´ 104 EC50: effective concentration to inhibit growth by 50%
0.55 30.5 1.43 7467.00 0.60 20.9 0.41 1324.00 0.65 14.2 0.07 337.81 0.70 9.4 0.01 120.66 0.75 6.0 0.001 54.88 0.80 3.7 2.00 ´ 10-5 28.75
0.85 2.1 3.791 ´ 10-7 15.97
0.90 1.0 2.26 ´ 10-9 8.70 0.91 0.8 6.47´ 10-10 7.62
0.92 0.7 1.66 ´ 10-10 6.62
0.93 0.6 3.68 ´ 10-11 5.70
0.94 0.4 6.84 ´ 10-12 4.84
0.95 0.3 9.98 ´ 10-13 4.04 0.96 0.3 1.03´ 10-13 3.28
0.97 0.2 6.33 ´ 10-15 2.56
0.98 0.1 1.53 ´ 10-16 1.86
0.99 0.05 4.27 ´ 10-19 1.14
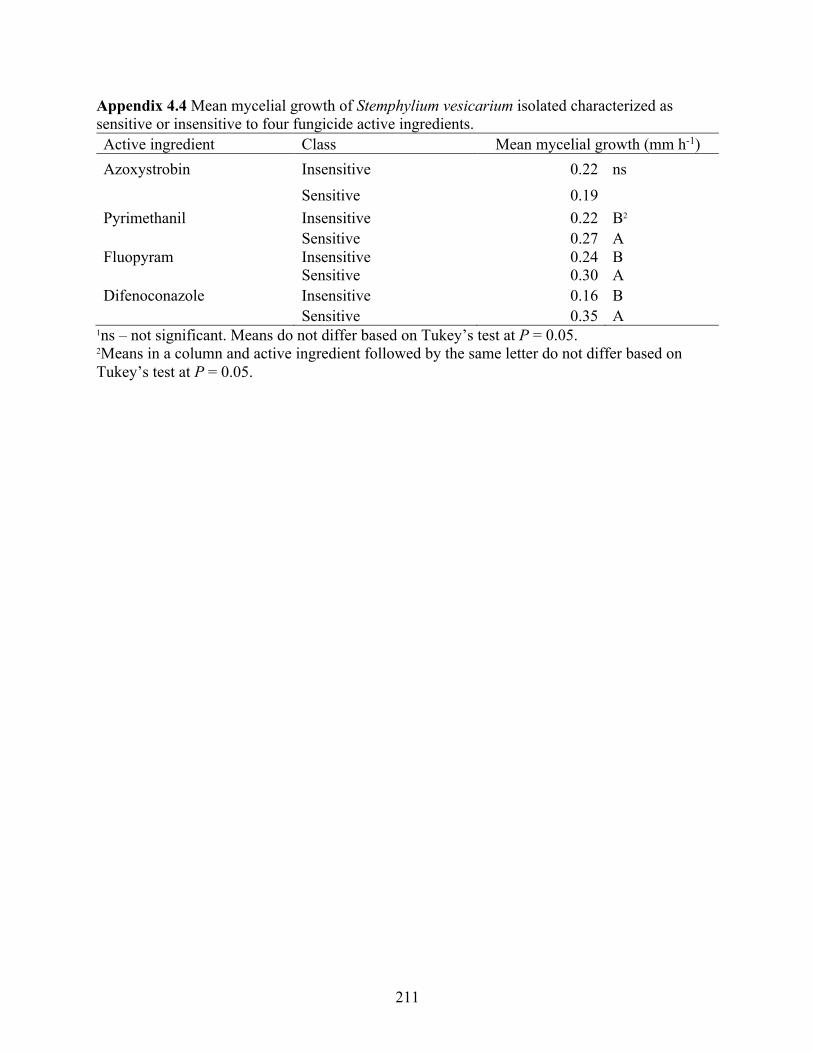
211
Appendix 4.4 Mean mycelial growth of Stemphylium vesicarium isolated characterized as sensitive or insensitive to four fungicide active ingredients. Active ingredient Class Mean mycelial growth (mm h-1) Azoxystrobin Insensitive 0.22 ns Sensitive 0.19 Pyrimethanil Insensitive 0.22 B2 Sensitive 0.27 A Fluopyram Insensitive 0.24 B Sensitive 0.30 A Difenoconazole Insensitive 0.16 B Sensitive 0.35 A
1ns – not significant. Means do not differ based on Tukey’s test at P = 0.05. 2Means in a column and active ingredient followed by the same letter do not differ based on Tukey’s test at P = 0.05.
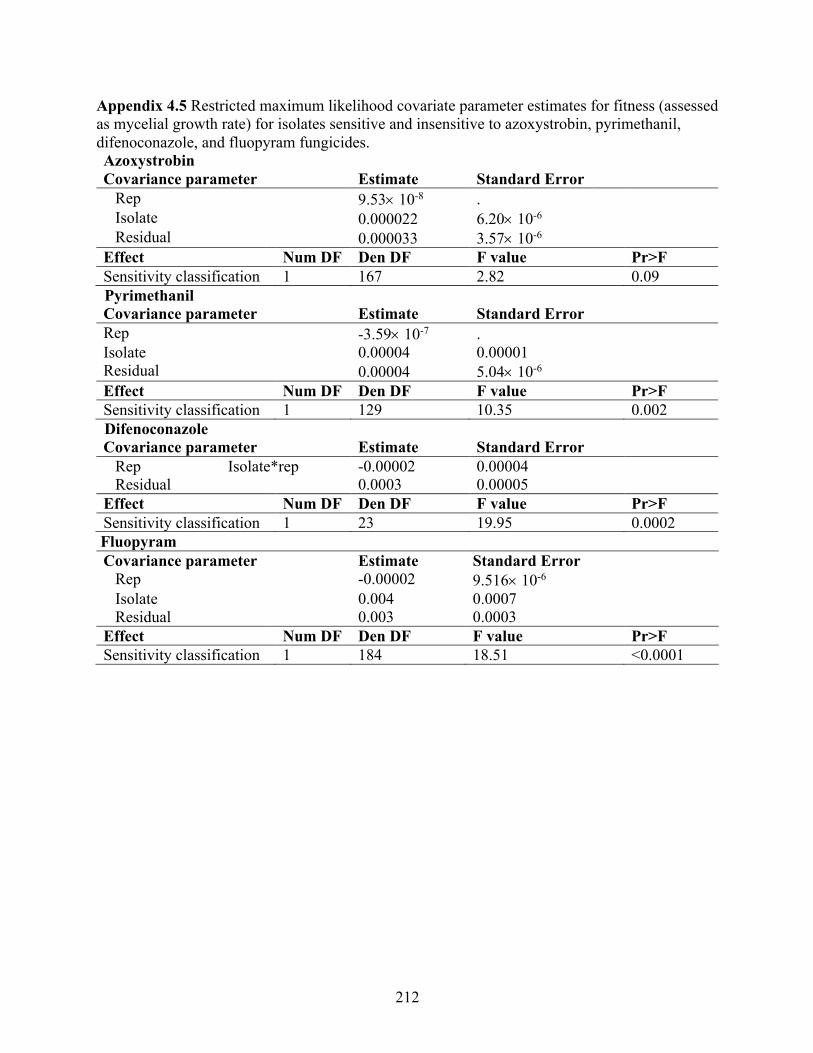
212
Appendix 4.5 Restricted maximum likelihood covariate parameter estimates for fitness (assessed as mycelial growth rate) for isolates sensitive and insensitive to azoxystrobin, pyrimethanil, difenoconazole, and fluopyram fungicides. Azoxystrobin Covariance parameter Estimate Standard Error
Rep 9.53´ 10-8 . Isolate 0.000022 6.20´ 10-6 Residual 0.000033 3.57´ 10-6
Effect Num DF Den DF F value Pr>F Sensitivity classification 1 167 2.82 0.09
Pyrimethanil Covariance parameter Estimate Standard Error Rep -3.59´ 10-7 . Isolate 0.00004 0.00001 Residual 0.00004 5.04´ 10-6 Effect Num DF Den DF F value Pr>F Sensitivity classification 1 129 10.35 0.002
Difenoconazole Covariance parameter Estimate Standard Error
Rep Isolate*rep -0.00002 0.00004 Residual 0.0003 0.00005
Effect Num DF Den DF F value Pr>F Sensitivity classification 1 23 19.95 0.0002
Fluopyram Covariance parameter Estimate Standard Error
Rep -0.00002 9.516´ 10-6 Isolate 0.004 0.0007 Residual 0.003 0.0003
Effect Num DF Den DF F value Pr>F Sensitivity classification 1 184 18.51 <0.0001
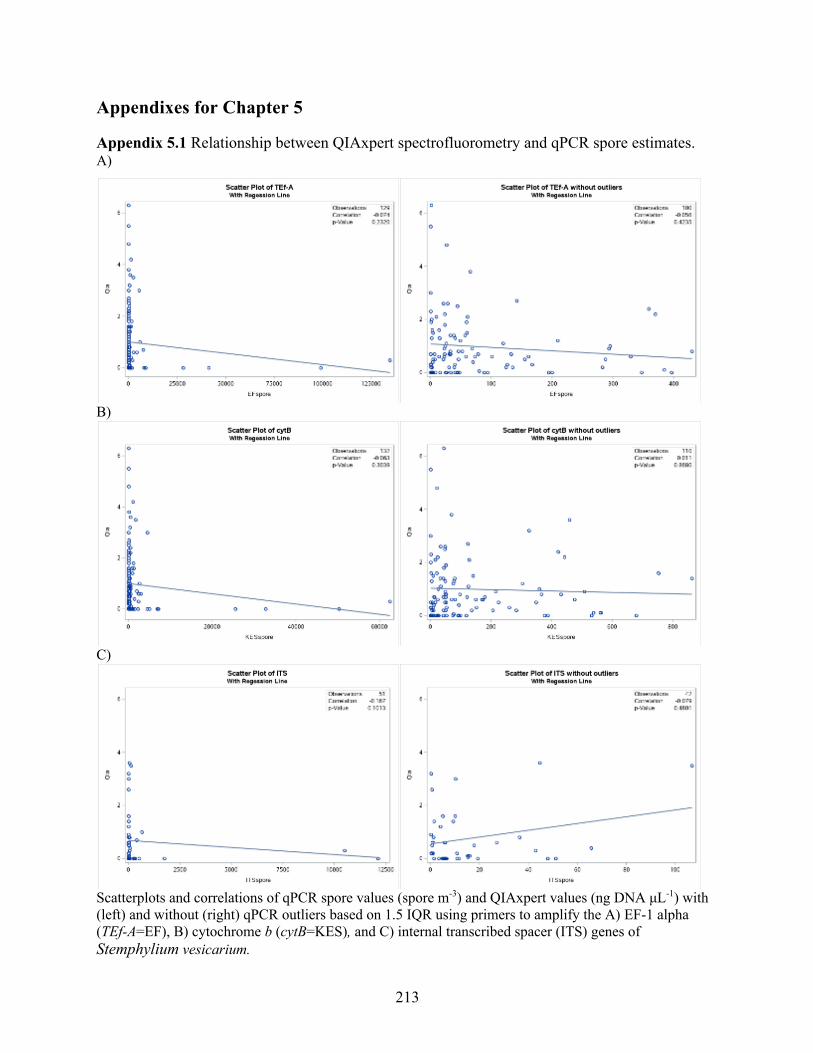
213
Appendixes for Chapter 5 5. Appendixes for Chapter 5
Appendix 5.1 Relationship between QIAxpert spectrofluorometry and qPCR spore estimates. A)
B)
C)
Scatterplots and correlations of qPCR spore values (spore m-3) and QIAxpert values (ng DNA μL-1) with (left) and without (right) qPCR outliers based on 1.5 IQR using primers to amplify the A) EF-1 alpha (TEf-A=EF), B) cytochrome b (cytB=KES), and C) internal transcribed spacer (ITS) genes of Stemphylium vesicarium.
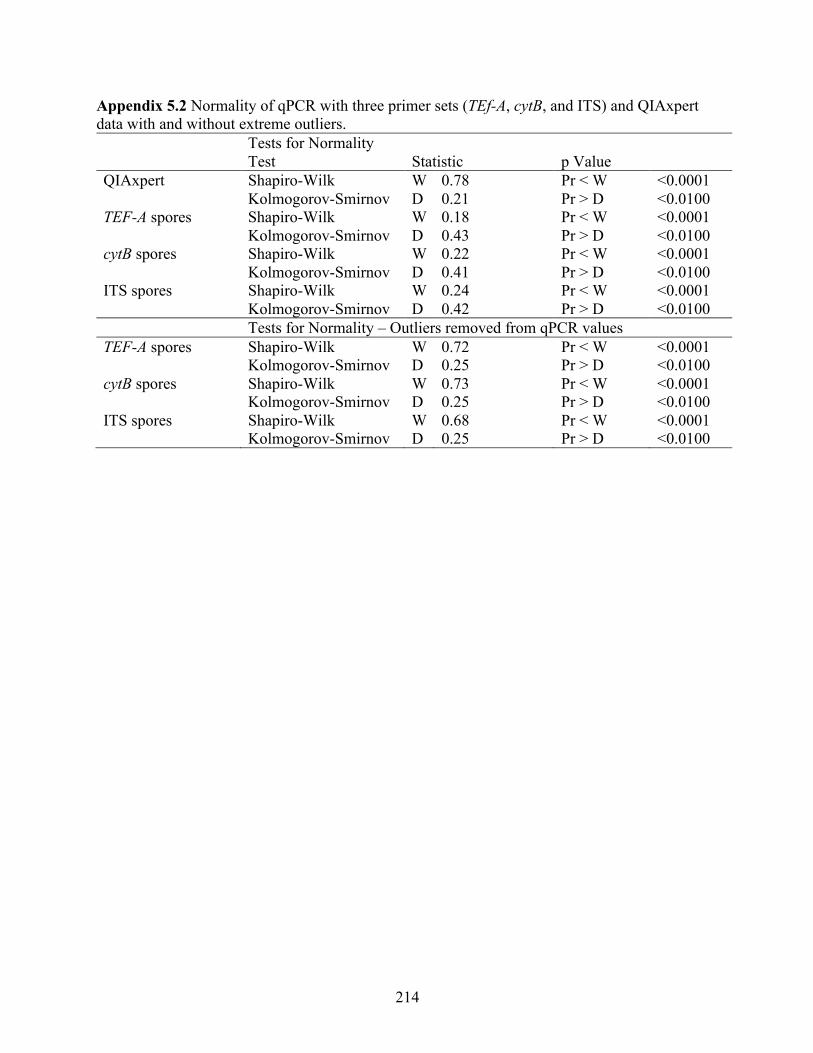
214
Appendix 5.2 Normality of qPCR with three primer sets (TEf-A, cytB, and ITS) and QIAxpert data with and without extreme outliers. Tests for Normality Test Statistic p Value QIAxpert Shapiro-Wilk W 0.78 Pr < W <0.0001 Kolmogorov-Smirnov D 0.21 Pr > D <0.0100 TEF-A spores Shapiro-Wilk W 0.18 Pr < W <0.0001 Kolmogorov-Smirnov D 0.43 Pr > D <0.0100 cytB spores Shapiro-Wilk W 0.22 Pr < W <0.0001 Kolmogorov-Smirnov D 0.41 Pr > D <0.0100 ITS spores Shapiro-Wilk W 0.24 Pr < W <0.0001 Kolmogorov-Smirnov D 0.42 Pr > D <0.0100 Tests for Normality – Outliers removed from qPCR values TEF-A spores Shapiro-Wilk W 0.72 Pr < W <0.0001 Kolmogorov-Smirnov D 0.25 Pr > D <0.0100 cytB spores Shapiro-Wilk W 0.73 Pr < W <0.0001 Kolmogorov-Smirnov D 0.25 Pr > D <0.0100 ITS spores Shapiro-Wilk W 0.68 Pr < W <0.0001 Kolmogorov-Smirnov D 0.25 Pr > D <0.0100
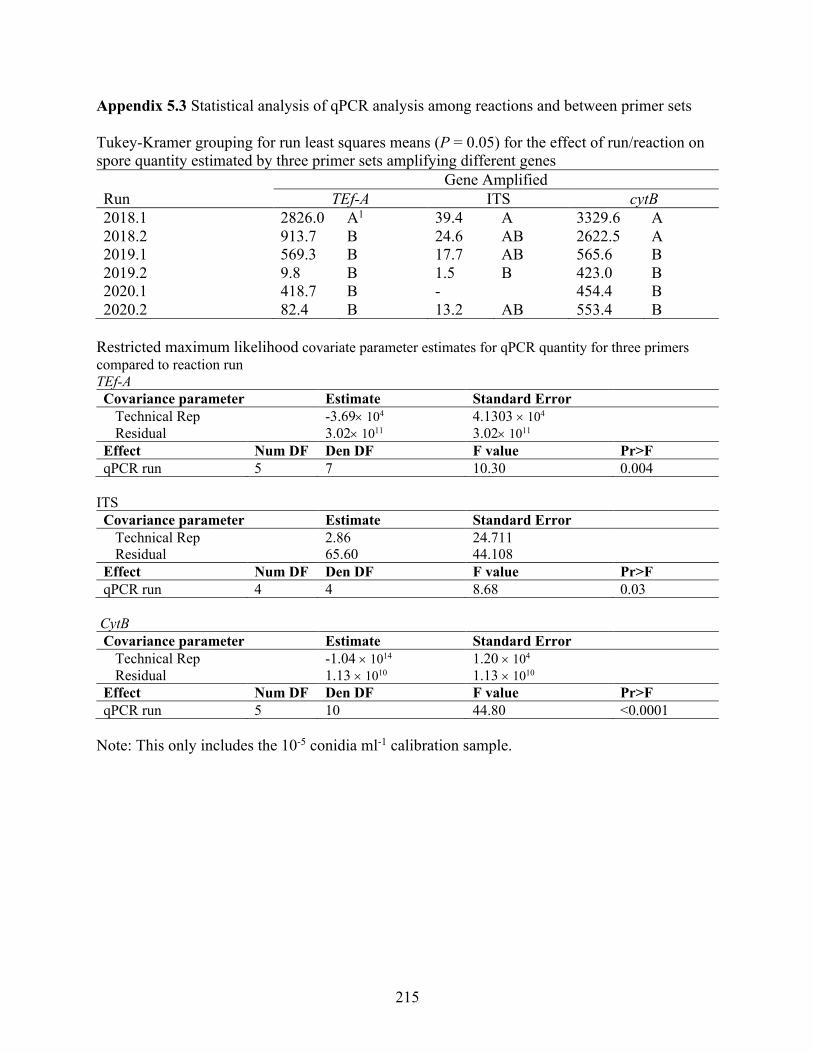
215
Appendix 5.3 Statistical analysis of qPCR analysis among reactions and between primer sets Tukey-Kramer grouping for run least squares means (P = 0.05) for the effect of run/reaction on spore quantity estimated by three primer sets amplifying different genes Gene Amplified Run TEf-A ITS cytB 2018.1 2826.0 A1 39.4 A 3329.6 A 2018.2 913.7 B 24.6 AB 2622.5 A 2019.1 569.3 B 17.7 AB 565.6 B 2019.2 9.8 B 1.5 B 423.0 B 2020.1 418.7 B - 454.4 B 2020.2 82.4 B 13.2 AB 553.4 B
Restricted maximum likelihood covariate parameter estimates for qPCR quantity for three primers compared to reaction run TEf-A Covariance parameter Estimate Standard Error
Technical Rep -3.69´ 104 4.1303 ´ 104 Residual 3.02´ 1011 3.02´ 1011
Effect Num DF Den DF F value Pr>F qPCR run 5 7 10.30 0.004
ITS Covariance parameter Estimate Standard Error
Technical Rep 2.86 24.711 Residual 65.60 44.108
Effect Num DF Den DF F value Pr>F qPCR run 4 4 8.68 0.03
CytB Covariance parameter Estimate Standard Error
Technical Rep -1.04 ´ 1014 1.20 ´ 104 Residual 1.13 ´ 1010 1.13 ´ 1010
Effect Num DF Den DF F value Pr>F qPCR run 5 10 44.80 <0.0001
Note: This only includes the 10-5 conidia ml-1 calibration sample.
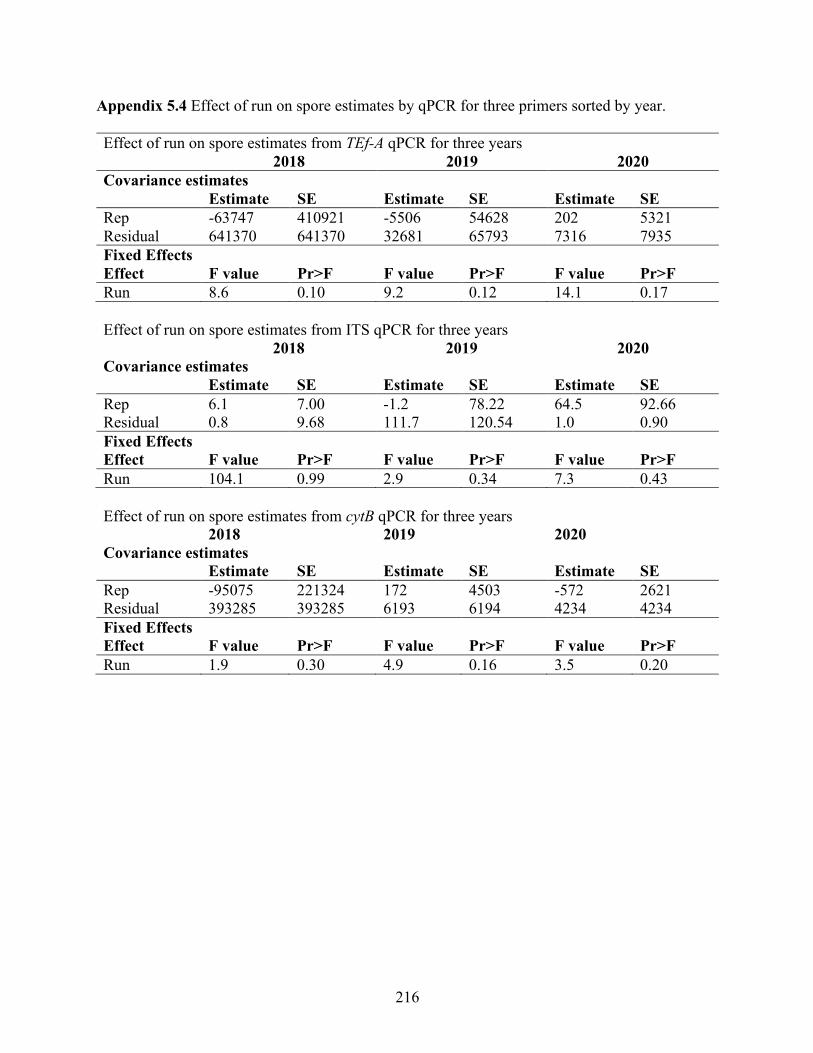
216
Appendix 5.4 Effect of run on spore estimates by qPCR for three primers sorted by year. Effect of run on spore estimates from TEf-A qPCR for three years 2018 2019 2020 Covariance estimates Estimate SE Estimate SE Estimate SE Rep -63747 410921 -5506 54628 202 5321 Residual 641370 641370 32681 65793 7316 7935 Fixed Effects Effect F value Pr>F F value Pr>F F value Pr>F Run 8.6 0.10 9.2 0.12 14.1 0.17
Effect of run on spore estimates from ITS qPCR for three years 2018 2019 2020 Covariance estimates Estimate SE Estimate SE Estimate SE Rep 6.1 7.00 -1.2 78.22 64.5 92.66 Residual 0.8 9.68 111.7 120.54 1.0 0.90 Fixed Effects Effect F value Pr>F F value Pr>F F value Pr>F Run 104.1 0.99 2.9 0.34 7.3 0.43
Effect of run on spore estimates from cytB qPCR for three years 2018 2019 2020 Covariance estimates Estimate SE Estimate SE Estimate SE Rep -95075 221324 172 4503 -572 2621 Residual 393285 393285 6193 6194 4234 4234 Fixed Effects Effect F value Pr>F F value Pr>F F value Pr>F Run 1.9 0.30 4.9 0.16 3.5 0.20
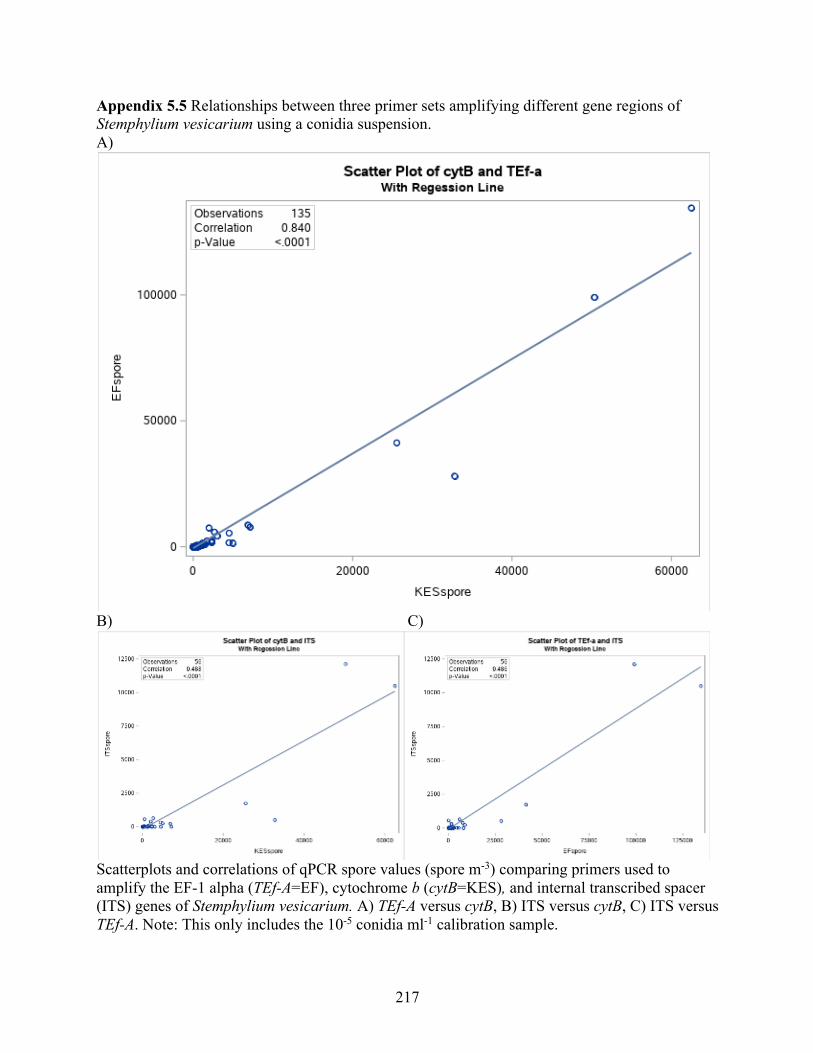
217
Appendix 5.5 Relationships between three primer sets amplifying different gene regions of Stemphylium vesicarium using a conidia suspension. A)
B) C)
Scatterplots and correlations of qPCR spore values (spore m-3) comparing primers used to amplify the EF-1 alpha (TEf-A=EF), cytochrome b (cytB=KES), and internal transcribed spacer (ITS) genes of Stemphylium vesicarium. A) TEf-A versus cytB, B) ITS versus cytB, C) ITS versus TEf-A. Note: This only includes the 10-5 conidia ml-1 calibration sample.
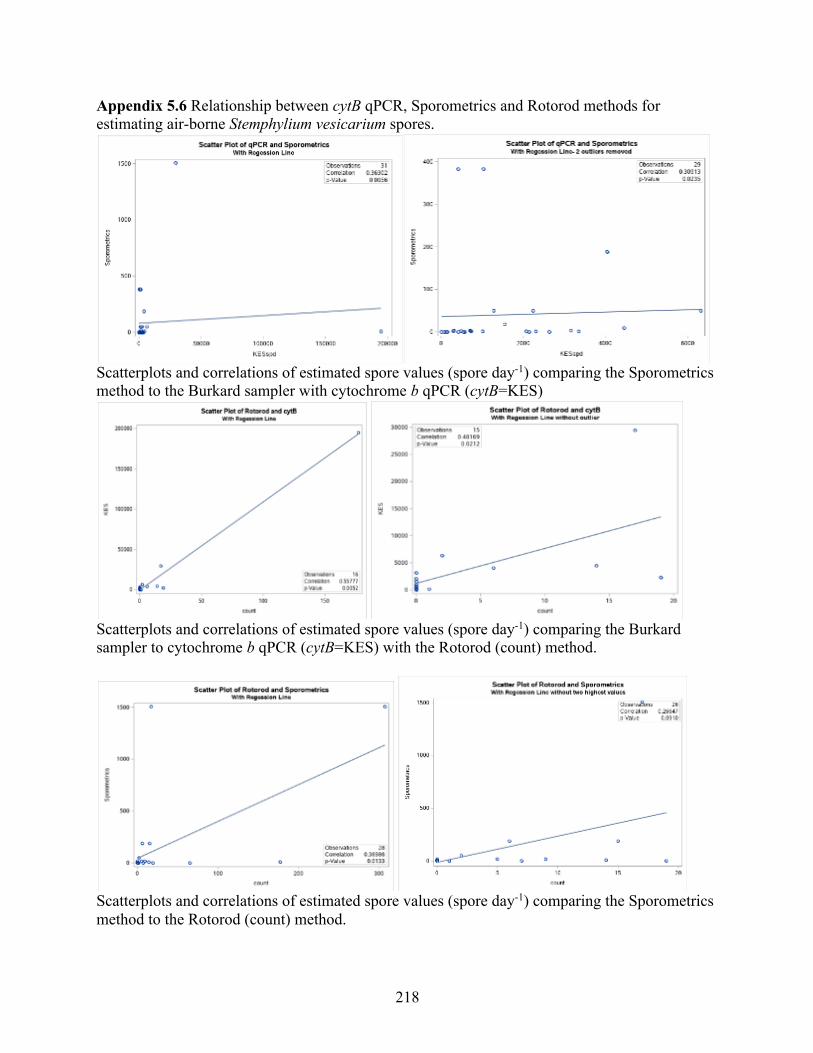
218
Appendix 5.6 Relationship between cytB qPCR, Sporometrics and Rotorod methods for estimating air-borne Stemphylium vesicarium spores.
Scatterplots and correlations of estimated spore values (spore day-1) comparing the Sporometrics method to the Burkard sampler with cytochrome b qPCR (cytB=KES)
Scatterplots and correlations of estimated spore values (spore day-1) comparing the Burkard sampler to cytochrome b qPCR (cytB=KES) with the Rotorod (count) method.
Scatterplots and correlations of estimated spore values (spore day-1) comparing the Sporometrics method to the Rotorod (count) method.
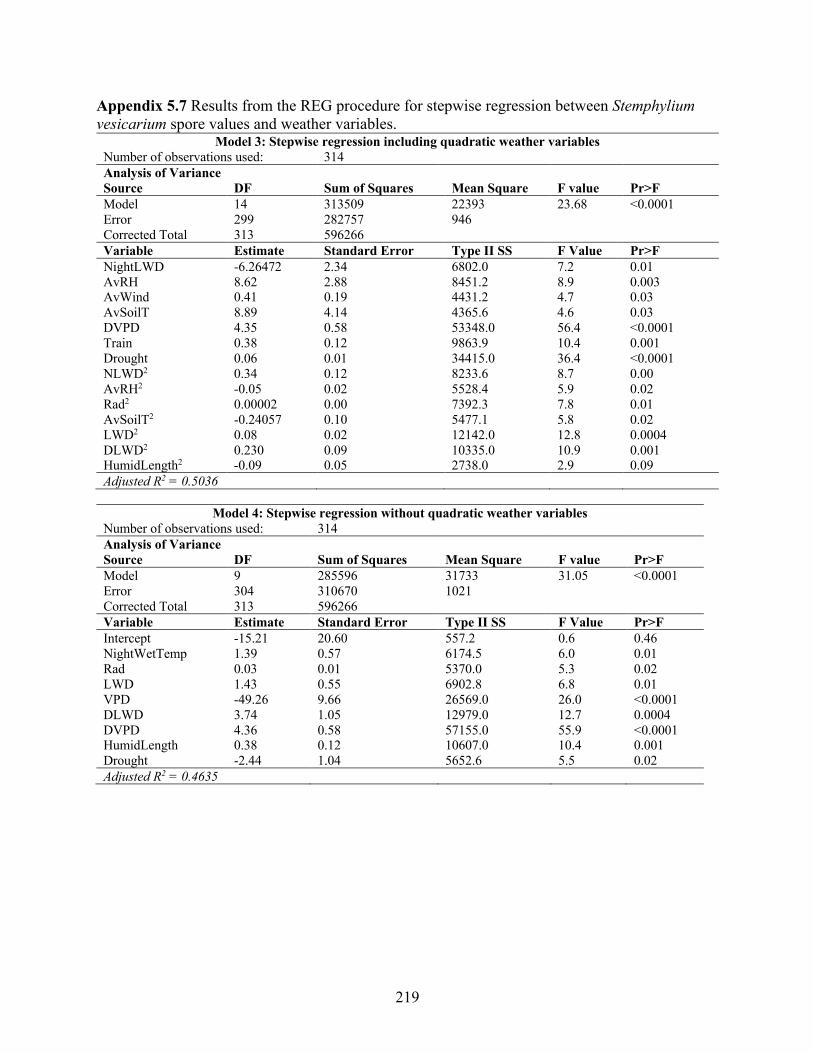
219
Appendix 5.7 Results from the REG procedure for stepwise regression between Stemphylium vesicarium spore values and weather variables.
Model 3: Stepwise regression including quadratic weather variables Number of observations used: 314 Analysis of Variance Source DF Sum of Squares Mean Square F value Pr>F Model 14 313509 22393 23.68 <0.0001 Error 299 282757 946 Corrected Total 313 596266 Variable Estimate Standard Error Type II SS F Value Pr>F NightLWD -6.26472 2.34 6802.0 7.2 0.01 AvRH 8.62 2.88 8451.2 8.9 0.003 AvWind 0.41 0.19 4431.2 4.7 0.03 AvSoilT 8.89 4.14 4365.6 4.6 0.03 DVPD 4.35 0.58 53348.0 56.4 <0.0001 Train 0.38 0.12 9863.9 10.4 0.001 Drought 0.06 0.01 34415.0 36.4 <0.0001 NLWD2 0.34 0.12 8233.6 8.7 0.00 AvRH2 -0.05 0.02 5528.4 5.9 0.02 Rad2 0.00002 0.00 7392.3 7.8 0.01 AvSoilT2 -0.24057 0.10 5477.1 5.8 0.02 LWD2 0.08 0.02 12142.0 12.8 0.0004 DLWD2 0.230 0.09 10335.0 10.9 0.001 HumidLength2 -0.09 0.05 2738.0 2.9 0.09 Adjusted R2 = 0.5036
Model 4: Stepwise regression without quadratic weather variables
Number of observations used: 314 Analysis of Variance Source DF Sum of Squares Mean Square F value Pr>F Model 9 285596 31733 31.05 <0.0001 Error 304 310670 1021 Corrected Total 313 596266 Variable Estimate Standard Error Type II SS F Value Pr>F Intercept -15.21 20.60 557.2 0.6 0.46 NightWetTemp 1.39 0.57 6174.5 6.0 0.01 Rad 0.03 0.01 5370.0 5.3 0.02 LWD 1.43 0.55 6902.8 6.8 0.01 VPD -49.26 9.66 26569.0 26.0 <0.0001 DLWD 3.74 1.05 12979.0 12.7 0.0004 DVPD 4.36 0.58 57155.0 55.9 <0.0001 HumidLength 0.38 0.12 10607.0 10.4 0.001 Drought -2.44 1.04 5652.6 5.5 0.02 Adjusted R2 = 0.4635
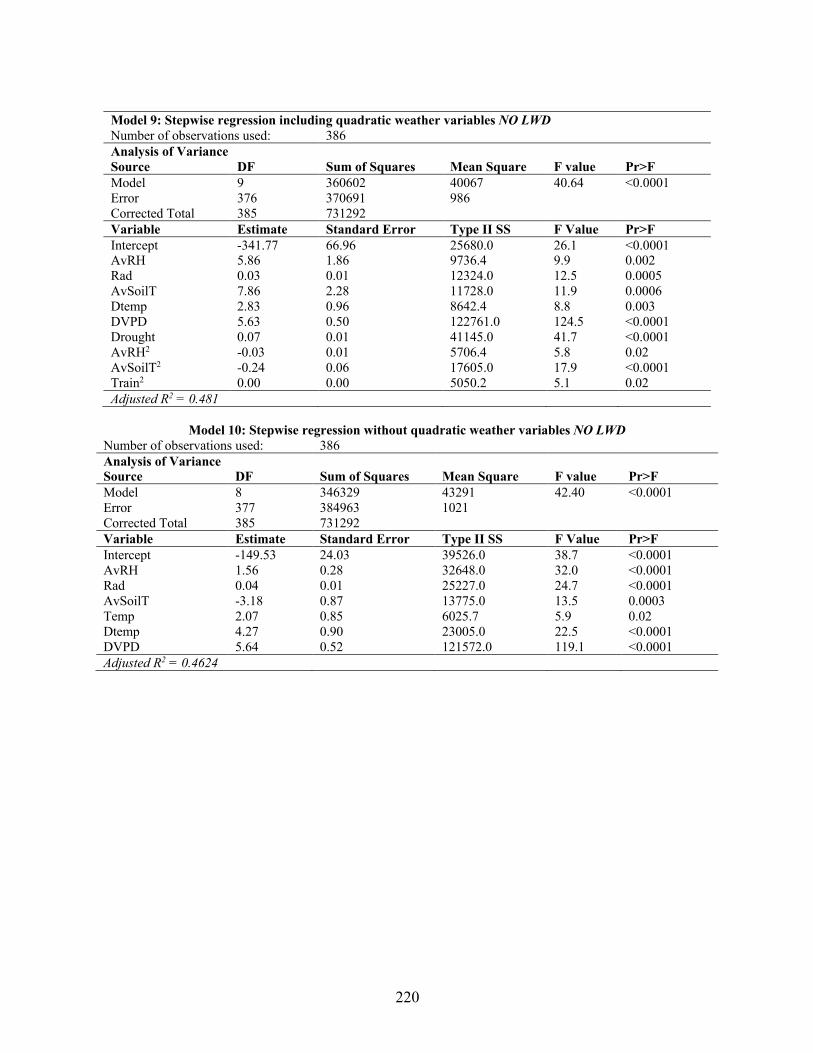
220
Model 9: Stepwise regression including quadratic weather variables NO LWD Number of observations used: 386 Analysis of Variance Source DF Sum of Squares Mean Square F value Pr>F Model 9 360602 40067 40.64 <0.0001 Error 376 370691 986 Corrected Total 385 731292 Variable Estimate Standard Error Type II SS F Value Pr>F Intercept -341.77 66.96 25680.0 26.1 <0.0001 AvRH 5.86 1.86 9736.4 9.9 0.002 Rad 0.03 0.01 12324.0 12.5 0.0005 AvSoilT 7.86 2.28 11728.0 11.9 0.0006 Dtemp 2.83 0.96 8642.4 8.8 0.003 DVPD 5.63 0.50 122761.0 124.5 <0.0001 Drought 0.07 0.01 41145.0 41.7 <0.0001 AvRH2 -0.03 0.01 5706.4 5.8 0.02 AvSoilT2 -0.24 0.06 17605.0 17.9 <0.0001 Train2 0.00 0.00 5050.2 5.1 0.02 Adjusted R2 = 0.481
Model 10: Stepwise regression without quadratic weather variables NO LWD
Number of observations used: 386 Analysis of Variance Source DF Sum of Squares Mean Square F value Pr>F Model 8 346329 43291 42.40 <0.0001 Error 377 384963 1021 Corrected Total 385 731292 Variable Estimate Standard Error Type II SS F Value Pr>F Intercept -149.53 24.03 39526.0 38.7 <0.0001 AvRH 1.56 0.28 32648.0 32.0 <0.0001 Rad 0.04 0.01 25227.0 24.7 <0.0001 AvSoilT -3.18 0.87 13775.0 13.5 0.0003 Temp 2.07 0.85 6025.7 5.9 0.02 Dtemp 4.27 0.90 23005.0 22.5 <0.0001 DVPD 5.64 0.52 121572.0 119.1 <0.0001 Adjusted R2 = 0.4624
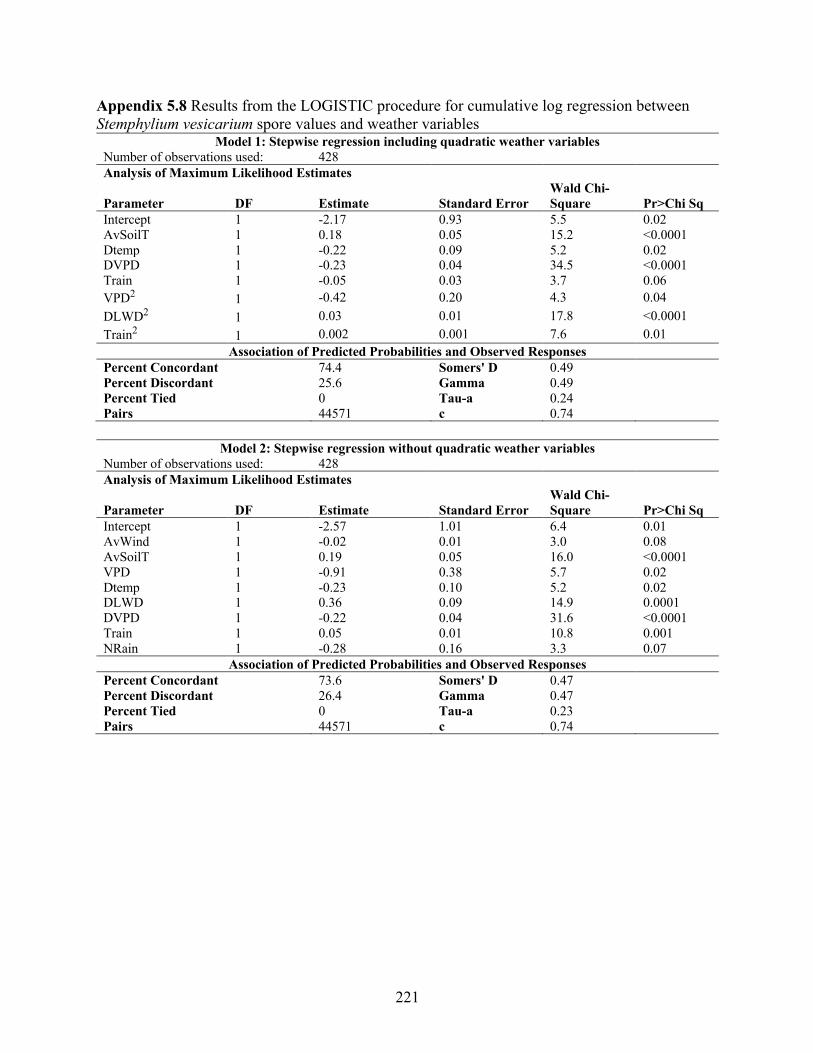
221
Appendix 5.8 Results from the LOGISTIC procedure for cumulative log regression between Stemphylium vesicarium spore values and weather variables
Model 1: Stepwise regression including quadratic weather variables Number of observations used: 428 Analysis of Maximum Likelihood Estimates
Parameter DF Estimate Standard Error Wald Chi-Square Pr>Chi Sq
Intercept 1 -2.17 0.93 5.5 0.02 AvSoilT 1 0.18 0.05 15.2 <0.0001 Dtemp 1 -0.22 0.09 5.2 0.02 DVPD 1 -0.23 0.04 34.5 <0.0001 Train 1 -0.05 0.03 3.7 0.06 VPD2 1 -0.42 0.20 4.3 0.04 DLWD2 1 0.03 0.01 17.8 <0.0001 Train2 1 0.002 0.001 7.6 0.01
Association of Predicted Probabilities and Observed Responses Percent Concordant 74.4 Somers' D 0.49 Percent Discordant 25.6 Gamma 0.49 Percent Tied 0 Tau-a 0.24 Pairs 44571 c 0.74
Model 2: Stepwise regression without quadratic weather variables
Number of observations used: 428 Analysis of Maximum Likelihood Estimates
Parameter DF Estimate Standard Error Wald Chi-Square Pr>Chi Sq
Intercept 1 -2.57 1.01 6.4 0.01 AvWind 1 -0.02 0.01 3.0 0.08 AvSoilT 1 0.19 0.05 16.0 <0.0001 VPD 1 -0.91 0.38 5.7 0.02 Dtemp 1 -0.23 0.10 5.2 0.02 DLWD 1 0.36 0.09 14.9 0.0001 DVPD 1 -0.22 0.04 31.6 <0.0001 Train 1 0.05 0.01 10.8 0.001 NRain 1 -0.28 0.16 3.3 0.07
Association of Predicted Probabilities and Observed Responses Percent Concordant 73.6 Somers' D 0.47 Percent Discordant 26.4 Gamma 0.47 Percent Tied 0 Tau-a 0.23 Pairs 44571 c 0.74
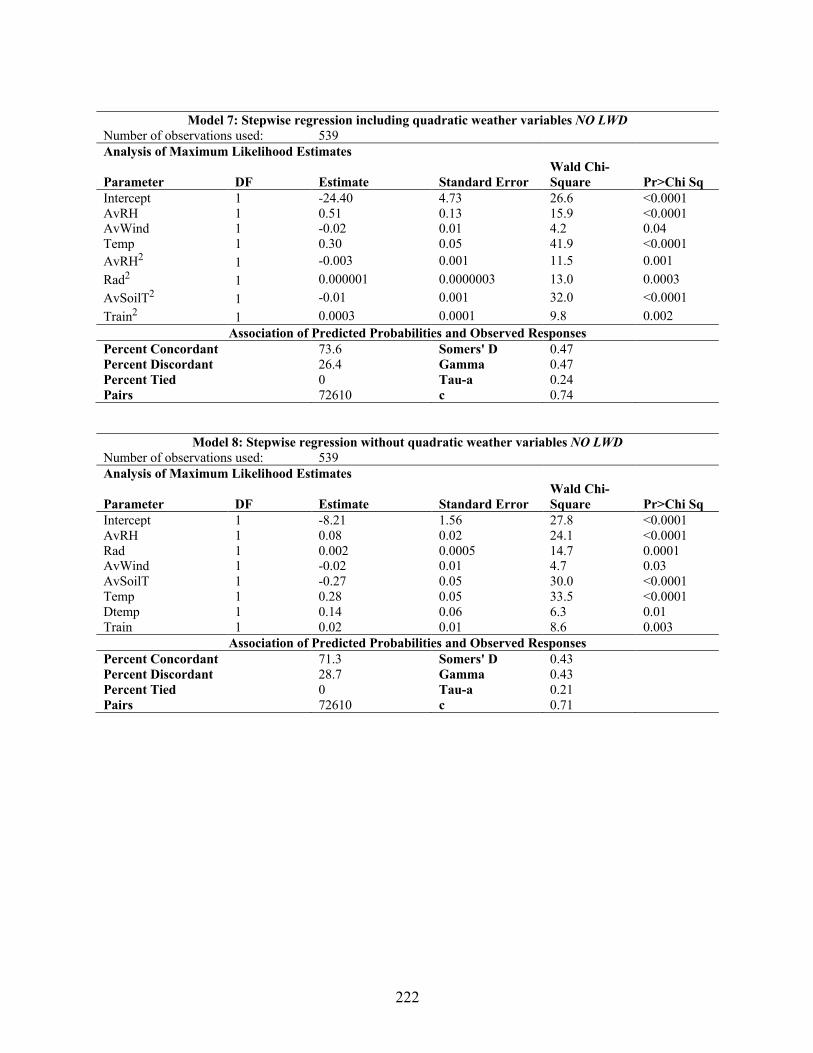
222
Model 7: Stepwise regression including quadratic weather variables NO LWD
Number of observations used: 539 Analysis of Maximum Likelihood Estimates
Parameter DF Estimate Standard Error Wald Chi-Square Pr>Chi Sq
Intercept 1 -24.40 4.73 26.6 <0.0001 AvRH 1 0.51 0.13 15.9 <0.0001 AvWind 1 -0.02 0.01 4.2 0.04 Temp 1 0.30 0.05 41.9 <0.0001 AvRH2 1 -0.003 0.001 11.5 0.001 Rad2 1 0.000001 0.0000003 13.0 0.0003 AvSoilT2 1 -0.01 0.001 32.0 <0.0001 Train2 1 0.0003 0.0001 9.8 0.002
Association of Predicted Probabilities and Observed Responses Percent Concordant 73.6 Somers' D 0.47 Percent Discordant 26.4 Gamma 0.47 Percent Tied 0 Tau-a 0.24 Pairs 72610 c 0.74
Model 8: Stepwise regression without quadratic weather variables NO LWD Number of observations used: 539 Analysis of Maximum Likelihood Estimates
Parameter DF Estimate Standard Error Wald Chi-Square Pr>Chi Sq
Intercept 1 -8.21 1.56 27.8 <0.0001 AvRH 1 0.08 0.02 24.1 <0.0001 Rad 1 0.002 0.0005 14.7 0.0001 AvWind 1 -0.02 0.01 4.7 0.03 AvSoilT 1 -0.27 0.05 30.0 <0.0001 Temp 1 0.28 0.05 33.5 <0.0001 Dtemp 1 0.14 0.06 6.3 0.01 Train 1 0.02 0.01 8.6 0.003
Association of Predicted Probabilities and Observed Responses Percent Concordant 71.3 Somers' D 0.43 Percent Discordant 28.7 Gamma 0.43 Percent Tied 0 Tau-a 0.21 Pairs 72610 c 0.71
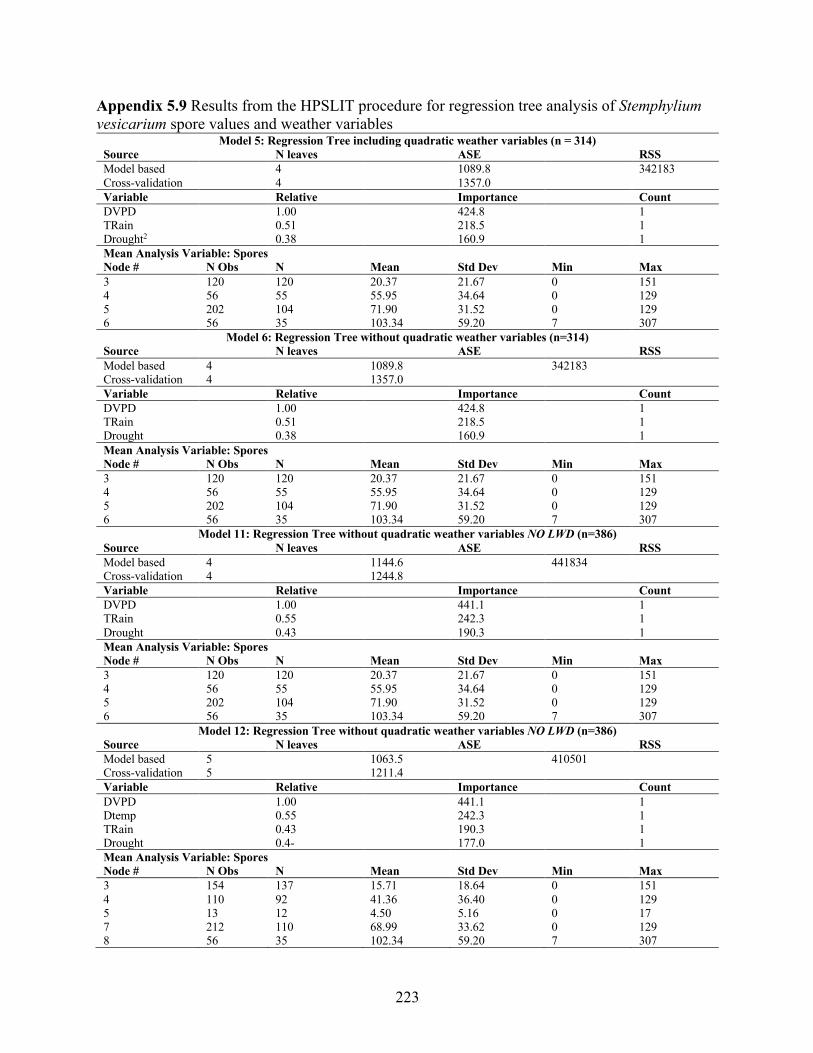
223
Appendix 5.9 Results from the HPSLIT procedure for regression tree analysis of Stemphylium vesicarium spore values and weather variables
Model 5: Regression Tree including quadratic weather variables (n = 314) Source N leaves ASE RSS Model based 4 1089.8 342183 Cross-validation 4 1357.0 Variable Relative Importance Count DVPD 1.00 424.8 1 TRain 0.51 218.5 1 Drought2 0.38 160.9 1 Mean Analysis Variable: Spores Node # N Obs N Mean Std Dev Min Max 3 120 120 20.37 21.67 0 151 4 56 55 55.95 34.64 0 129 5 202 104 71.90 31.52 0 129 6 56 35 103.34 59.20 7 307
Model 6: Regression Tree without quadratic weather variables (n=314) Source N leaves ASE RSS Model based 4 1089.8 342183 Cross-validation 4 1357.0 Variable Relative Importance Count DVPD 1.00 424.8 1 TRain 0.51 218.5 1 Drought 0.38 160.9 1 Mean Analysis Variable: Spores Node # N Obs N Mean Std Dev Min Max 3 120 120 20.37 21.67 0 151 4 56 55 55.95 34.64 0 129 5 202 104 71.90 31.52 0 129 6 56 35 103.34 59.20 7 307
Model 11: Regression Tree without quadratic weather variables NO LWD (n=386) Source N leaves ASE RSS Model based 4 1144.6 441834 Cross-validation 4 1244.8 Variable Relative Importance Count DVPD 1.00 441.1 1 TRain 0.55 242.3 1 Drought 0.43 190.3 1 Mean Analysis Variable: Spores Node # N Obs N Mean Std Dev Min Max 3 120 120 20.37 21.67 0 151 4 56 55 55.95 34.64 0 129 5 202 104 71.90 31.52 0 129 6 56 35 103.34 59.20 7 307
Model 12: Regression Tree without quadratic weather variables NO LWD (n=386) Source N leaves ASE RSS Model based 5 1063.5 410501 Cross-validation 5 1211.4 Variable Relative Importance Count DVPD 1.00 441.1 1 Dtemp 0.55 242.3 1 TRain 0.43 190.3 1 Drought 0.4- 177.0 1 Mean Analysis Variable: Spores Node # N Obs N Mean Std Dev Min Max 3 154 137 15.71 18.64 0 151 4 110 92 41.36 36.40 0 129 5 13 12 4.50 5.16 0 17 7 212 110 68.99 33.62 0 129 8 56 35 102.34 59.20 7 307
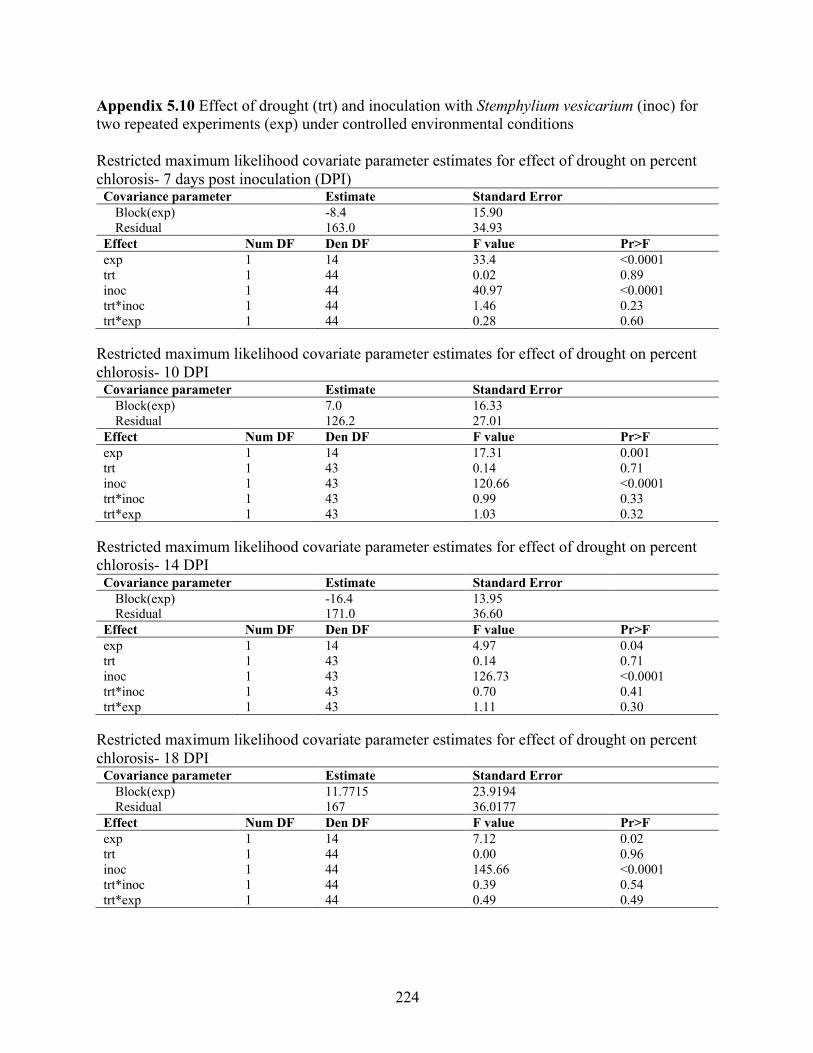
224
Appendix 5.10 Effect of drought (trt) and inoculation with Stemphylium vesicarium (inoc) for two repeated experiments (exp) under controlled environmental conditions Restricted maximum likelihood covariate parameter estimates for effect of drought on percent chlorosis- 7 days post inoculation (DPI)
Covariance parameter Estimate Standard Error Block(exp) -8.4 15.90 Residual 163.0 34.93
Effect Num DF Den DF F value Pr>F exp 1 14 33.4 <0.0001 trt 1 44 0.02 0.89 inoc 1 44 40.97 <0.0001 trt*inoc 1 44 1.46 0.23 trt*exp 1 44 0.28 0.60
Restricted maximum likelihood covariate parameter estimates for effect of drought on percent chlorosis- 10 DPI
Covariance parameter Estimate Standard Error Block(exp) 7.0 16.33 Residual 126.2 27.01
Effect Num DF Den DF F value Pr>F exp 1 14 17.31 0.001 trt 1 43 0.14 0.71 inoc 1 43 120.66 <0.0001 trt*inoc 1 43 0.99 0.33 trt*exp 1 43 1.03 0.32
Restricted maximum likelihood covariate parameter estimates for effect of drought on percent chlorosis- 14 DPI
Covariance parameter Estimate Standard Error Block(exp) -16.4 13.95 Residual 171.0 36.60
Effect Num DF Den DF F value Pr>F exp 1 14 4.97 0.04 trt 1 43 0.14 0.71 inoc 1 43 126.73 <0.0001 trt*inoc 1 43 0.70 0.41 trt*exp 1 43 1.11 0.30
Restricted maximum likelihood covariate parameter estimates for effect of drought on percent chlorosis- 18 DPI
Covariance parameter Estimate Standard Error Block(exp) 11.7715 23.9194 Residual 167 36.0177
Effect Num DF Den DF F value Pr>F exp 1 14 7.12 0.02 trt 1 44 0.00 0.96 inoc 1 44 145.66 <0.0001 trt*inoc 1 44 0.39 0.54 trt*exp 1 44 0.49 0.49
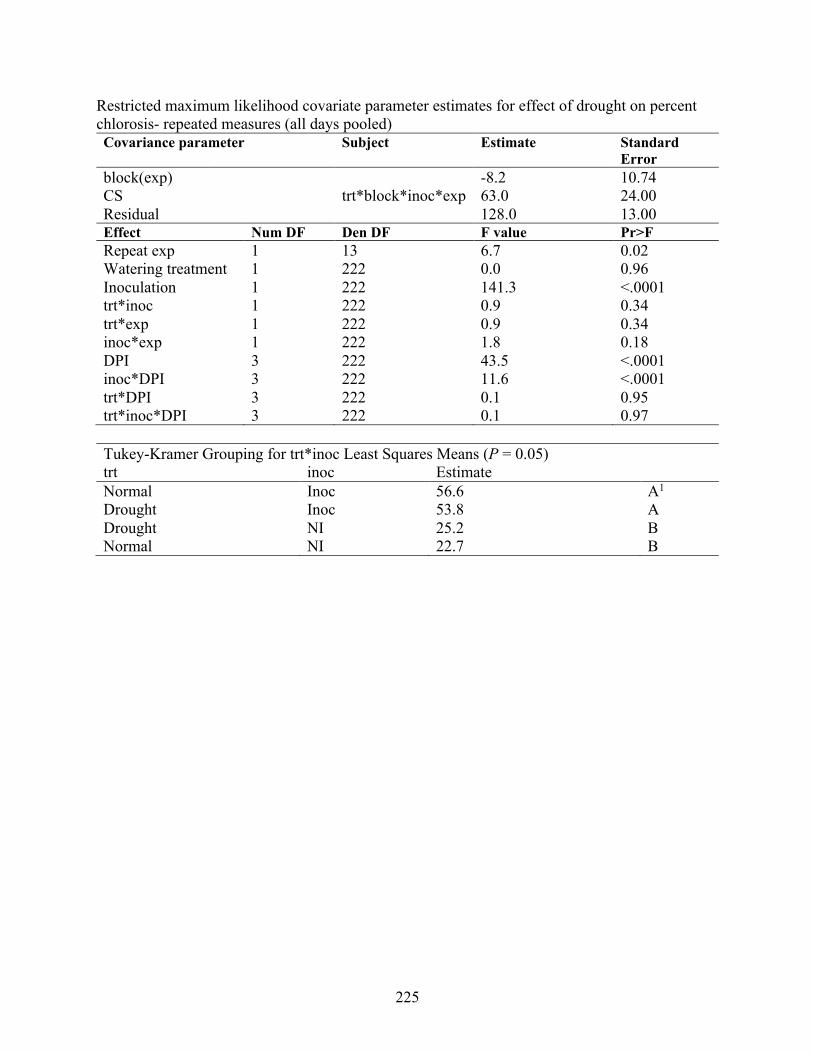
225
Restricted maximum likelihood covariate parameter estimates for effect of drought on percent chlorosis- repeated measures (all days pooled) Covariance parameter Subject Estimate Standard
Error block(exp) -8.2 10.74 CS trt*block*inoc*exp 63.0 24.00 Residual 128.0 13.00 Effect Num DF Den DF F value Pr>F Repeat exp 1 13 6.7 0.02 Watering treatment 1 222 0.0 0.96 Inoculation 1 222 141.3 <.0001 trt*inoc 1 222 0.9 0.34 trt*exp 1 222 0.9 0.34 inoc*exp 1 222 1.8 0.18 DPI 3 222 43.5 <.0001 inoc*DPI 3 222 11.6 <.0001 trt*DPI 3 222 0.1 0.95 trt*inoc*DPI 3 222 0.1 0.97
Tukey-Kramer Grouping for trt*inoc Least Squares Means (P = 0.05) trt inoc Estimate Normal Inoc 56.6 A1 Drought Inoc 53.8 A Drought NI 25.2 B Normal NI 22.7 B
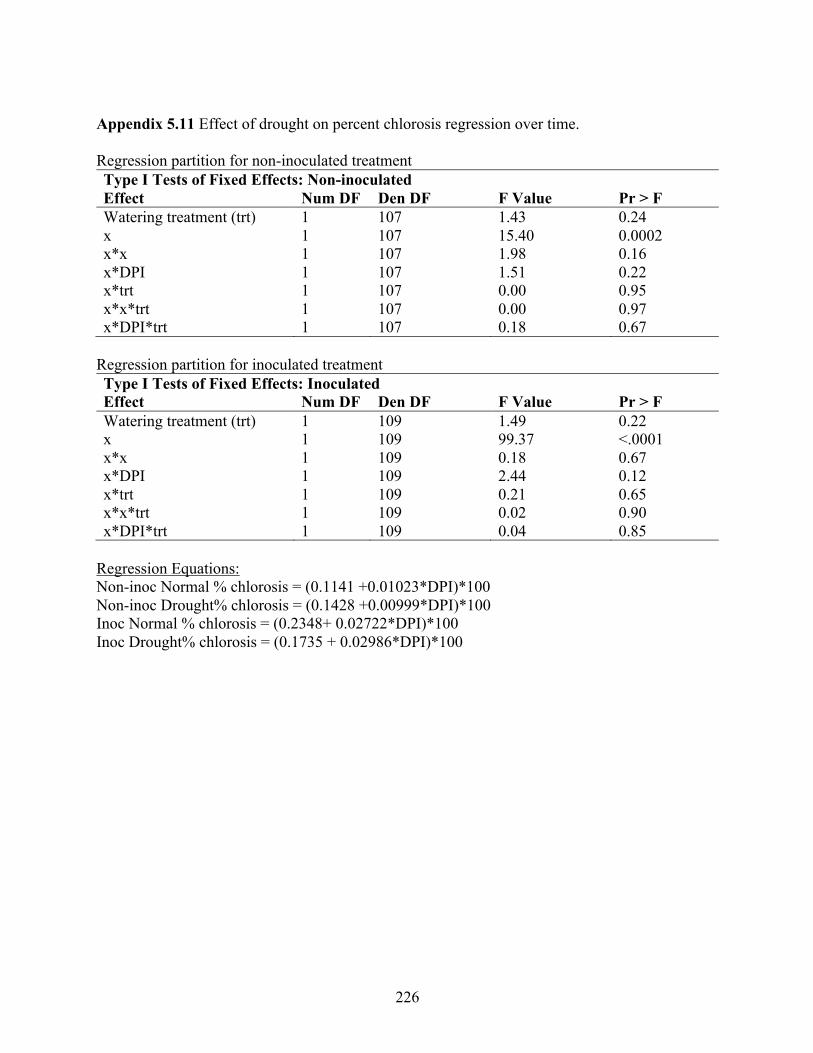
226
Appendix 5.11 Effect of drought on percent chlorosis regression over time. Regression partition for non-inoculated treatment Type I Tests of Fixed Effects: Non-inoculated Effect Num DF Den DF F Value Pr > F Watering treatment (trt) 1 107 1.43 0.24 x 1 107 15.40 0.0002 x*x 1 107 1.98 0.16 x*DPI 1 107 1.51 0.22 x*trt 1 107 0.00 0.95 x*x*trt 1 107 0.00 0.97 x*DPI*trt 1 107 0.18 0.67
Regression partition for inoculated treatment Type I Tests of Fixed Effects: Inoculated Effect Num DF Den DF F Value Pr > F Watering treatment (trt) 1 109 1.49 0.22 x 1 109 99.37 <.0001 x*x 1 109 0.18 0.67 x*DPI 1 109 2.44 0.12 x*trt 1 109 0.21 0.65 x*x*trt 1 109 0.02 0.90 x*DPI*trt 1 109 0.04 0.85
Regression Equations: Non-inoc Normal % chlorosis = (0.1141 +0.01023*DPI)*100 Non-inoc Drought% chlorosis = (0.1428 +0.00999*DPI)*100 Inoc Normal % chlorosis = (0.2348+ 0.02722*DPI)*100 Inoc Drought% chlorosis = (0.1735 + 0.02986*DPI)*100
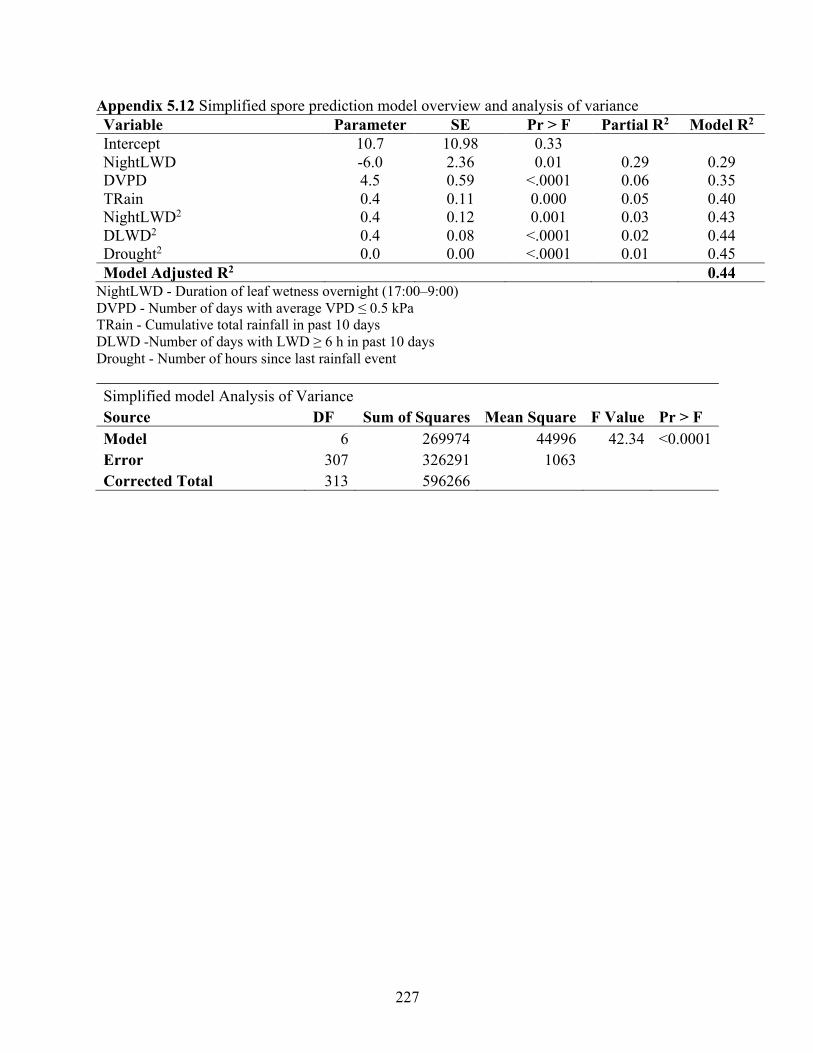
227
Appendix 5.12 Simplified spore prediction model overview and analysis of variance Variable Parameter SE Pr > F Partial R2 Model R2 Intercept 10.7 10.98 0.33 NightLWD -6.0 2.36 0.01 0.29 0.29 DVPD 4.5 0.59 <.0001 0.06 0.35 TRain 0.4 0.11 0.000 0.05 0.40 NightLWD2 0.4 0.12 0.001 0.03 0.43 DLWD2 0.4 0.08 <.0001 0.02 0.44 Drought2 0.0 0.00 <.0001 0.01 0.45 Model Adjusted R2 0.44
NightLWD - Duration of leaf wetness overnight (17:00–9:00) DVPD - Number of days with average VPD ≤ 0.5 kPa TRain - Cumulative total rainfall in past 10 days DLWD -Number of days with LWD ≥ 6 h in past 10 days Drought - Number of hours since last rainfall event Simplified model Analysis of Variance Source DF Sum of Squares Mean Square F Value Pr > F Model 6 269974 44996 42.34 <0.0001 Error 307 326291 1063 Corrected Total 313 596266
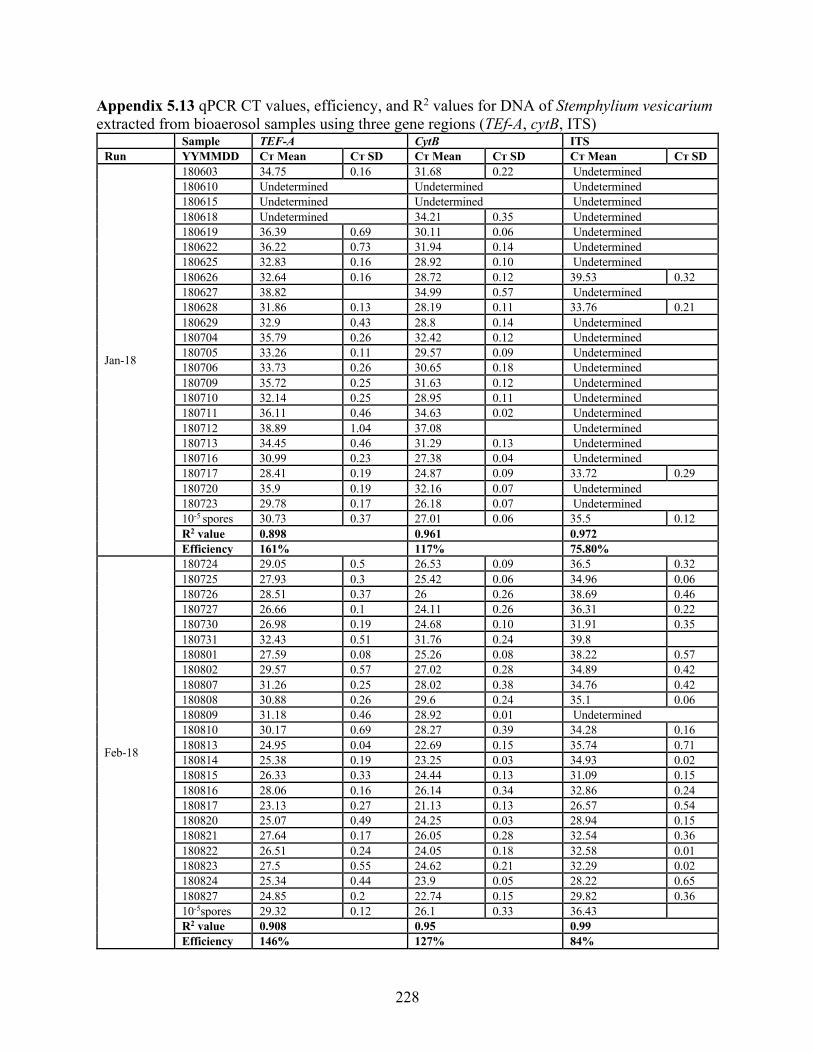
228
Appendix 5.13 qPCR CT values, efficiency, and R2 values for DNA of Stemphylium vesicarium extracted from bioaerosol samples using three gene regions (TEf-A, cytB, ITS)
Sample TEF-A CytB ITS Run YYMMDD Cт Mean Cт SD Cт Mean Cт SD Cт Mean Cт SD
Jan-18
180603 34.75 0.16 31.68 0.22 Undetermined 180610 Undetermined Undetermined Undetermined 180615 Undetermined Undetermined Undetermined 180618 Undetermined 34.21 0.35 Undetermined 180619 36.39 0.69 30.11 0.06 Undetermined 180622 36.22 0.73 31.94 0.14 Undetermined 180625 32.83 0.16 28.92 0.10 Undetermined 180626 32.64 0.16 28.72 0.12 39.53 0.32 180627 38.82 34.99 0.57 Undetermined 180628 31.86 0.13 28.19 0.11 33.76 0.21 180629 32.9 0.43 28.8 0.14 Undetermined 180704 35.79 0.26 32.42 0.12 Undetermined 180705 33.26 0.11 29.57 0.09 Undetermined 180706 33.73 0.26 30.65 0.18 Undetermined 180709 35.72 0.25 31.63 0.12 Undetermined 180710 32.14 0.25 28.95 0.11 Undetermined 180711 36.11 0.46 34.63 0.02 Undetermined 180712 38.89 1.04 37.08 Undetermined 180713 34.45 0.46 31.29 0.13 Undetermined 180716 30.99 0.23 27.38 0.04 Undetermined 180717 28.41 0.19 24.87 0.09 33.72 0.29 180720 35.9 0.19 32.16 0.07 Undetermined 180723 29.78 0.17 26.18 0.07 Undetermined 10-5 spores 30.73 0.37 27.01 0.06 35.5 0.12 R2 value 0.898 0.961 0.972 Efficiency 161% 117% 75.80%
Feb-18
180724 29.05 0.5 26.53 0.09 36.5 0.32 180725 27.93 0.3 25.42 0.06 34.96 0.06 180726 28.51 0.37 26 0.26 38.69 0.46 180727 26.66 0.1 24.11 0.26 36.31 0.22 180730 26.98 0.19 24.68 0.10 31.91 0.35 180731 32.43 0.51 31.76 0.24 39.8 180801 27.59 0.08 25.26 0.08 38.22 0.57 180802 29.57 0.57 27.02 0.28 34.89 0.42 180807 31.26 0.25 28.02 0.38 34.76 0.42 180808 30.88 0.26 29.6 0.24 35.1 0.06 180809 31.18 0.46 28.92 0.01 Undetermined 180810 30.17 0.69 28.27 0.39 34.28 0.16 180813 24.95 0.04 22.69 0.15 35.74 0.71 180814 25.38 0.19 23.25 0.03 34.93 0.02 180815 26.33 0.33 24.44 0.13 31.09 0.15 180816 28.06 0.16 26.14 0.34 32.86 0.24 180817 23.13 0.27 21.13 0.13 26.57 0.54 180820 25.07 0.49 24.25 0.03 28.94 0.15 180821 27.64 0.17 26.05 0.28 32.54 0.36 180822 26.51 0.24 24.05 0.18 32.58 0.01 180823 27.5 0.55 24.62 0.21 32.29 0.02 180824 25.34 0.44 23.9 0.05 28.22 0.65 180827 24.85 0.2 22.74 0.15 29.82 0.36 10-5spores 29.32 0.12 26.1 0.33 36.43 R2 value 0.908 0.95 0.99 Efficiency 146% 127% 84%
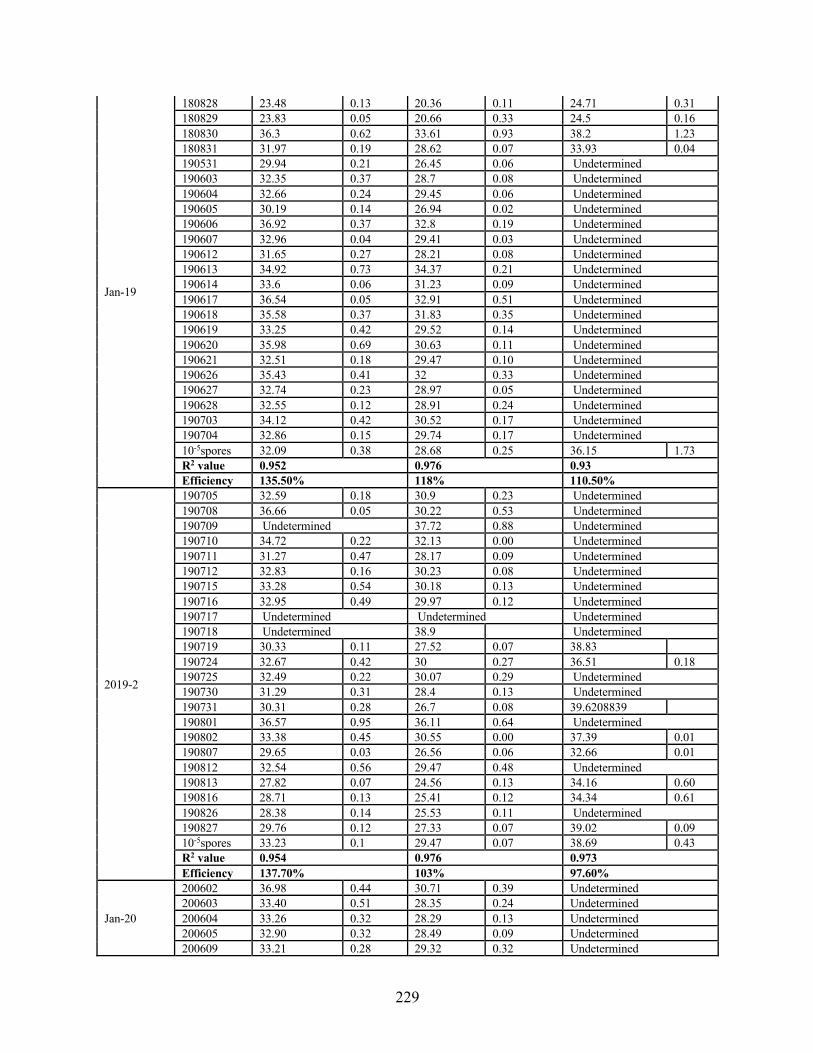
229
Jan-19
180828 23.48 0.13 20.36 0.11 24.71 0.31 180829 23.83 0.05 20.66 0.33 24.5 0.16 180830 36.3 0.62 33.61 0.93 38.2 1.23 180831 31.97 0.19 28.62 0.07 33.93 0.04 190531 29.94 0.21 26.45 0.06 Undetermined 190603 32.35 0.37 28.7 0.08 Undetermined 190604 32.66 0.24 29.45 0.06 Undetermined 190605 30.19 0.14 26.94 0.02 Undetermined 190606 36.92 0.37 32.8 0.19 Undetermined 190607 32.96 0.04 29.41 0.03 Undetermined 190612 31.65 0.27 28.21 0.08 Undetermined 190613 34.92 0.73 34.37 0.21 Undetermined 190614 33.6 0.06 31.23 0.09 Undetermined 190617 36.54 0.05 32.91 0.51 Undetermined 190618 35.58 0.37 31.83 0.35 Undetermined 190619 33.25 0.42 29.52 0.14 Undetermined 190620 35.98 0.69 30.63 0.11 Undetermined 190621 32.51 0.18 29.47 0.10 Undetermined 190626 35.43 0.41 32 0.33 Undetermined 190627 32.74 0.23 28.97 0.05 Undetermined 190628 32.55 0.12 28.91 0.24 Undetermined 190703 34.12 0.42 30.52 0.17 Undetermined 190704 32.86 0.15 29.74 0.17 Undetermined 10-5spores 32.09 0.38 28.68 0.25 36.15 1.73 R2 value 0.952 0.976 0.93 Efficiency 135.50% 118% 110.50%
2019-2
190705 32.59 0.18 30.9 0.23 Undetermined 190708 36.66 0.05 30.22 0.53 Undetermined 190709 Undetermined 37.72 0.88 Undetermined 190710 34.72 0.22 32.13 0.00 Undetermined 190711 31.27 0.47 28.17 0.09 Undetermined 190712 32.83 0.16 30.23 0.08 Undetermined 190715 33.28 0.54 30.18 0.13 Undetermined 190716 32.95 0.49 29.97 0.12 Undetermined 190717 Undetermined Undetermined Undetermined 190718 Undetermined 38.9 Undetermined 190719 30.33 0.11 27.52 0.07 38.83 190724 32.67 0.42 30 0.27 36.51 0.18 190725 32.49 0.22 30.07 0.29 Undetermined 190730 31.29 0.31 28.4 0.13 Undetermined 190731 30.31 0.28 26.7 0.08 39.6208839 190801 36.57 0.95 36.11 0.64 Undetermined 190802 33.38 0.45 30.55 0.00 37.39 0.01 190807 29.65 0.03 26.56 0.06 32.66 0.01 190812 32.54 0.56 29.47 0.48 Undetermined 190813 27.82 0.07 24.56 0.13 34.16 0.60 190816 28.71 0.13 25.41 0.12 34.34 0.61 190826 28.38 0.14 25.53 0.11 Undetermined 190827 29.76 0.12 27.33 0.07 39.02 0.09 10-5spores 33.23 0.1 29.47 0.07 38.69 0.43 R2 value 0.954 0.976 0.973 Efficiency 137.70% 103% 97.60%
Jan-20
200602 36.98 0.44 30.71 0.39 Undetermined 200603 33.40 0.51 28.35 0.24 Undetermined 200604 33.26 0.32 28.29 0.13 Undetermined 200605 32.90 0.32 28.49 0.09 Undetermined 200609 33.21 0.28 29.32 0.32 Undetermined
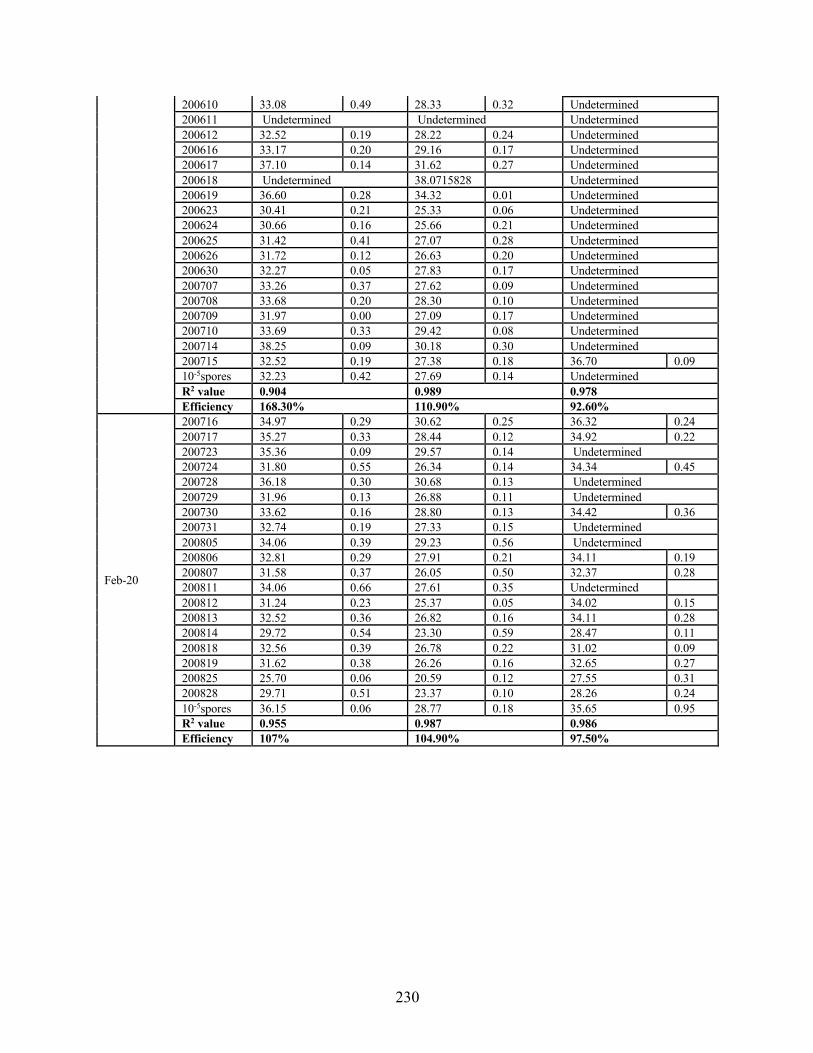
230
200610 33.08 0.49 28.33 0.32 Undetermined 200611 Undetermined Undetermined Undetermined 200612 32.52 0.19 28.22 0.24 Undetermined 200616 33.17 0.20 29.16 0.17 Undetermined 200617 37.10 0.14 31.62 0.27 Undetermined 200618 Undetermined 38.0715828 Undetermined 200619 36.60 0.28 34.32 0.01 Undetermined 200623 30.41 0.21 25.33 0.06 Undetermined 200624 30.66 0.16 25.66 0.21 Undetermined 200625 31.42 0.41 27.07 0.28 Undetermined 200626 31.72 0.12 26.63 0.20 Undetermined 200630 32.27 0.05 27.83 0.17 Undetermined 200707 33.26 0.37 27.62 0.09 Undetermined 200708 33.68 0.20 28.30 0.10 Undetermined 200709 31.97 0.00 27.09 0.17 Undetermined 200710 33.69 0.33 29.42 0.08 Undetermined 200714 38.25 0.09 30.18 0.30 Undetermined 200715 32.52 0.19 27.38 0.18 36.70 0.09 10-5spores 32.23 0.42 27.69 0.14 Undetermined R2 value 0.904 0.989 0.978 Efficiency 168.30% 110.90% 92.60%
Feb-20
200716 34.97 0.29 30.62 0.25 36.32 0.24 200717 35.27 0.33 28.44 0.12 34.92 0.22 200723 35.36 0.09 29.57 0.14 Undetermined 200724 31.80 0.55 26.34 0.14 34.34 0.45 200728 36.18 0.30 30.68 0.13 Undetermined 200729 31.96 0.13 26.88 0.11 Undetermined 200730 33.62 0.16 28.80 0.13 34.42 0.36 200731 32.74 0.19 27.33 0.15 Undetermined 200805 34.06 0.39 29.23 0.56 Undetermined 200806 32.81 0.29 27.91 0.21 34.11 0.19 200807 31.58 0.37 26.05 0.50 32.37 0.28 200811 34.06 0.66 27.61 0.35 Undetermined 200812 31.24 0.23 25.37 0.05 34.02 0.15 200813 32.52 0.36 26.82 0.16 34.11 0.28 200814 29.72 0.54 23.30 0.59 28.47 0.11 200818 32.56 0.39 26.78 0.22 31.02 0.09 200819 31.62 0.38 26.26 0.16 32.65 0.27 200825 25.70 0.06 20.59 0.12 27.55 0.31 200828 29.71 0.51 23.37 0.10 28.26 0.24 10-5spores 36.15 0.06 28.77 0.18 35.65 0.95 R2 value 0.955 0.987 0.986 Efficiency 107% 104.90% 97.50%


