Embed Size (px)
Citation preview

Improving Television Sound for
People with Hearing Impairments
Benjamin Guy Shirley
Acoustics Research Centre
School of Computing, Science and Engineering
College of Science and Technology
University of Salford, Salford, UK
Submitted in Partial Fulfilment of the Requirements of the
Degree of Doctor of Philosophy
2013
Table of Contents
.........................................................................................................................Acknowledgements 1
...............................................................................................................................................Abstract 2
1. ..................................................................................................................................Introduction 3........................................................................................................................................................Research Aim 3..................................................................................................................................................Thesis Structure 3
.............................................................................................................................Contribution of the Author 5........................................................................................................................................De9ining the Problem 6
..............................................................................................................Server Side or Client Side Solution 6.............................................................................................Digital TV and Surround Sound Broadcast 7
............................................................................Possibilities Offered by Surround Sound Broadcast 8...........................................................................................................Dolby Digital Surround Sound 8
............................................................................................................................Multi-‐channel Audio 10.........................................................................................Hearing Impaired (HI) Audio Channel 11
...................................................................................................................................................Metadata 12...............................................................Contribution of the Research into Broadcast Standards 14
.........................................................................................................................Contribution to Knowledge 15
2. .....................................................................................................................Literature Review 16..................................................................................................TV Audio for Hearing Impaired People 16...................................................................................................Hearing Loss and Audio Reproduction 22
..............................................................................................................Prevalence of Hearing Loss 23........................................................................................Application of Hearing Aid Processing 25
................................................................................................The Impact of Multichannel Audio 27.................................................................................................................Audio for Digital TV Broadcast 30
......................................................................................Television Audio Systems and Formats 30.........................................................................................................................Future Developments 34
............................................................................................................Psychoacoustic Test Methodology 34
3. .....................The Clean Audio Project Phase 1: Non-‐Speech Channel Attenuation 38.......................................................................................................................................................Introduction 38
.......................................................................................................................Aims of Clean Audio Phase 1 38......................................................................................................................................................Methodology 39
............................................................................................................................Audio-‐Visual Stimuli 39......................................................................................................................A/B Comparative Tests 39
...............................................................................................................Forced Choice Comparison 40.................................................................................................................Other Test Design Factors 40...........................................................................................................Interviews with Participants 46

......................................................................................................................................................Test Material 46.................................................................................................................................Analysis of Participants 47
......................................................................................................ProTile of Hearing Impairments 47..........................................................................................................................Setup and Calibration 48
......................................................................................................................................Experimental Results 49.................................................................................................................Hearing Impaired Results 51
.......................................................................................................Non-‐Hearing Impaired Results 52...................................................................................................................................Signi9icance of Results 53
.......................................................................................................Hearing Impaired Participants 53.............................................................................................................SigniTicance: Speech Clarity 53
..............................................................................................SigniTicance: Overall Sound Quality 53.....................................................................................................................SigniTicance: Enjoyment 53
.............................................................................................Non-‐Hearing Impaired Participants 54.............................................................................................................SigniTicance: Speech Clarity 54
............................................................................................................................................................Discussion 55...............................................................................................................................LCR, LCR1, LCR2, C 55
.....................................................................................................................LR (downmixed stereo) 55
.........................................................................................................................Analysis of Test Procedures 56............................................................................................................................................Introduction 56
....................................................................................................................................Clip Dependency 57.......................................................................................................................................Playback order 57
...................................................................................................................Analysis of Test Material 59...............................................................................................................................................Visual Cues 59
................................................................................Recommendations for Future Test Design 61.........................................................................................................................................................Conclusions 62
...............................................................................................................................Downmixed Stereo 62..................................................................Level of Left and Right Front Surround Channels 63
..................................................................................................................................................Summary 63.....................................Recommendations for Hard of Hearing Viewers Published by Ofcom 64
.....................................................................................................................................................Further Work 64
4. ...............Clean Audio Phase 2: A Solution for Downmixed Stereo Reproduction? 66......................................................................................................................................................Methodology 68
........................................................................................................................................Experimental Setup 69......................................................................................................................................................Test Material 70........................................................................................................................................................Participants 70
......................................................................................................................................Experimental Results 72.........................................................................................................................................Speech Clarity 72
.........................................................................................................................Overall Sound Quality 73

................................................................................................................................................Enjoyment 73...............................................................................Hearing Impaired Group (20 participants) 74
.....................................................................Non-‐Hearing Impaired Group (20 participants) 75...................................................................................................................................Signi9icance of Results 76
.......................................................................................................Hearing Impaired Participants 76..............................................................................................................SigniTicance: Speech Clarity 76
..............................................................................................SigniTicance: Overall Sound Quality 76.....................................................................................................................SigniTicance: Enjoyment 76
.................................................................................................Non Hard of Hearing Participants 77..............................................................................................................SigniTicance: Speech Clarity 77
..............................................................................................SigniTicance: Overall Sound Quality 77.....................................................................................................................SigniTicance: Enjoyment 78
............................................................................................................................................................Discussion 78....................................................................................................................Hearing Impaired Group 78
.............................................................................................................Non-‐Hard of Hearing Group 79.....................................................................................................................................................Further Work 80
........................................................................................................................Implications for TV Viewers 80
5. .......................................................................................................The Problem with Stereo 81.......................................................................................................................................................Introduction 81......................................................................................................................................................Methodology 82..................................................................................................................................................Overview 82
.....................................................................................................................Speech in Noise Testing 82......................................................................................................................Adaptation of SPIN test 84
.................................................................................................................................................Test Setup 85................................................................................................................................................Calibration 87
.......................................................................................................................................Test Procedure 87...........................................................................................................................................................Pilot Study 87
................................................................................................................................Pilot Study Results 88.....................................................................................................Summary of Pilot Study Results 90
...........................................................................................................................................................Main Tests 90................................................................................................Main Test Results & Data Analysis 90
..............................................................................All Sentences (high and low predictability) 90.......................................High and Low Predictability Sentences Considered Separately 91
............................................................................................................................................................Discussion 93...........................................................................................................Measured Transfer Function 93
....................................................................................Independent Calculated Crosstalk Effect 96........................................................................................................Left/Right Loudspeaker Delay 97
.............................................................................................................Effect of Listening Position 102

......................................................................................................................................................Conclusions 104
6. .........................................................................................Principal Components Analysis 105....................................................................................................................................................Introduction 105
............................................................................................................................................Principles of PCA 106..............................................................................................................................................Example 1 107
..............................................................................................................................Subtract the Mean 107
..............................................................................................................................Covariance Matrix 108......................................................................................................Eigenvectors and Eigenvalues 109
.......................................................................Further Examples of Source Separation using PCA 114.............................................................................................................................................Example 2: 114.............................................................................................................................................Example 3: 116
.............................................................................................PCA Carried out on 5.1 Surround Sound 118....................................................Multichannel from 5 mono wav Tiles -‐ speech in centre 118
..........Speech-‐biased PCA Algorithm: When Speech is Not Only in Centre Channel 121........Speech-‐biased PCA Algorithm: Speech across left, centre and right channels 123
.......................................................................................................................Matrix of Eigenvalues 125............Speech-‐biased PCA Algorithm: Speech between Centre and Left (or right) 126
................................................PCA Algorithm with Dynamically Allocated Components 128.........................................................................................................................................................Discussion 131......................................................................................................................................................Conclusions 132
7. ..................................................................................Accessible Audio Implementations 133....................................................................................................Dolby ‘Clear Audio’ Implementation 133
..........................................................................................................................................Introduction 133........................................................................................................................................Methodology 134
...............................................................................................................................Listener selection 134.................................................................................................................Selection of test material 134
....................................................................................................................................Listening Tests 137.......................................................................................................................Experimental Results 139
..........................................................................................................Statistical Signi9icance of Results 142..........................................................................................Non-‐Hearing Impaired Participants 142
......................................................................................................................................................Conclusions 142........................Object Based Audio Solution: The FascinatE Project and Accessible Audio 145
...........................................................................................................Object Based Audio Review 145..................................................Object Based Accessible Audio in the FascinatE Project 146
.............................................................................Accessible Audio for Live Sports Coverage 147..........................................Method: New Production Techniques for Audio Acquisition 150
...........................................................................................................................................Conclusions 155

8. ..........................................................................................Conclusions and Further Work 157......................................................................................................................................................Conclusions 157..................................................................................................................................................Further Work 161
......................................................................................................The Future for Accessible TV Audio 162
....................................................................................................................................References 164.........................................................................APPENDIX A Dolby Digital Metadata Parameters 177
....................................................................................................APPENDIX B Example Test Material 179................................................................................................APPENDIX C Analysis of Test Material 180
...................................................APPENDIX D Subject Questionnaire for Clean Audio Testing 181......................................................................APPENDIX E Consent Form and Information Sheet 185
.......................................................................................................................APPENDIX F Testing script 187......................................................................................APPENDIX G Classi9ication of Hearing Loss 188................................................................................APPENDIX H Data Analysis Methods Example 189
...................................................APPENDIX I MatLab Code for Principal Component Analysis 190APPENDIX J Correlation of speech clarity ratings against the percentage of on-‐screen
............................................................................................................dialogue for Clean Audio project 199APPENDIX K Liaison statement from the UK Clean Audio Forum to ITU Focus Group on
.....................................................................................................................................................................IPTV 200APPENDIX L Annex E.4 from ETSI TS 101 154 V1.9.1 (2009-‐09) Digital Video Broadcasting (DVB); Speci9ication for the use of Video and Audio Coding in Broadcasting Applications
.......................................based on the MPEG-‐2 Transport Stream (Technical Speci9ication) 204APPENDIX M CM-‐AVC0084 DVB CM-‐AVC Commercial Requirements: Delivering “Clean
...............................................................................................................Audio” for the Hard of Hearing 205

Figures
Figure 1. Loudspeaker layout compatible with ITU-‐R BS 775-‐1, Multichannel stereophonic sound system with and without accompanying picture, 9Figure 2. Derivation of Lt/Rt and LoRo stereo downmixes from 5.1 multichannel audio material. 33Figure 3. Ratings of participants’ hearing impairment by pure tone audiogram according to categories de9ined in (British Society of Audiology, 1988) 47Figure 4. A, B & C Rating of speech clarity, overall sound quality and enjoyment for each condition by hearing impaired participants with error bars indicating 95% con9idence level 51Figure 5. Rating of speech clarity, overall sound quality and enjoyment for each condition by non-‐hearing impaired participants with error bars indicating 95% con9idence level 52Figure 6. Percentage of preferences for clip A or B for speech clarity 57Figure 7. Percentage of preferences for clip A or B for overall sound quality 57Figure 8. Percentage of preferences for clip A or B for enjoyment 58Figure 9. Overall preferences for clip A or B showing recency effect 58Figure 10. Scatter chart of percentage of on-‐screen dialogue against the percentage of times that clips were preferred for dialogue clarity across section B only (the most recent section heard) 60Figure 11. Scatter chart of percentage of on-‐screen dialogue against the percentage of times that clips were preferred for dialogue clarity across section A only (the 9irst section heard) 60Figure 12. Dolby Dynamic Range Control compression indicating gain ranges centred around the de9ined dialogue normalisation level (dialnorm) from Dolby Metadata Guide (Dolby Labs, 2003) 68Figure 13. Age distribution of (a) hard of hearing participants and (b) non hard of hearing participants 71Figure 14. Gender distribution of (a) hard of hearing participants and (b) non hard of hearing participants 71Figure 15. Hearing losses of hard of hearing participants 71Figure 16 A, B & C. Plots showing values obtained for speech clarity, overall sound quality and enjoyment for the hearing impaired group. Error bars indicate 95% con9idence interval. 74Figure 17 A & B. Plots showing values obtained for overall sound quality and enjoyment for the non-‐hearing impaired group. Error bars indicate 95% con9idence interval. 75Figure 18. Test setup used to implement the SPIN test. 85
Figure 19. Signal 9low of plug-‐in used to generate pseudo-‐talker babble 86Figure 20. frequency response of mono to stereo enhancer plugin 86Figure 21. Percentage of correctly identi9ied keywords for each signal to babble ratio assessed. Dashed lines indicate the -‐2dB ratio at which 50% of keywords are correctly identi9ied and which was used for the main tests. 89Figure 22. Number of identi9ied keywords for high and low predictability sentences. 89Figure 23. High & Low Predictability Sentences Considered Separately 91Figure 24 A and B Measured mono to phantom mono transfer function shown with linear (A) and logarithmic (B) scale; this represents the difference in frequency spectra caused by acoustical crosstalk. Note the dip at around 1.5 kHz to 3 kHz 94Figure 25. Fant’s “Speech Banana”(Fant, 1959) 95Figure 26. Sound Intensity of Speech Frequencies (Appalacian State University,2005) 95Figure 27. Speech Frequencies superimposed on mono / phantom mono transfer function plotted on a logarithmic frequency scale. 96Figure 28. Path from left and right loudspeakers 97Figure 29. Signal path for left loudspeaker to left ear 98Figure 30. Distance from right loudspeaker to left ear 99Figure 31. Measured Interaural crosstalk effect on transfer function using a B&K dummy head (solid line) compared to calculations based on a spherical head model (dashed line) 101Figure 32. Ideal (C) and “worst case” (Lf, Rf, Rl, Rr) listening positions adapted from ITU-‐R BS 775-‐1 (ITU, 1994a). 102Figure 33. Front left position (Lf) 103Figure 34 Rear left position (Lr) 103Figure 35. PCA Example 1: 440 Hz sine wave 30% left, white noise 30% right. 107Figure 36. Sample values plotted left channel against right channel. A signal which was identical in both channels (panned centre in the case of an audio example) will show as a set of points following a straight line from point (-‐1,-‐1) to point (1,1) 108Figure 37. Data plot of original data with eigenvectors superimposed, note these are always orthogonal to each other. 110Figure 38. Derived data set using only the principal component in the feature vector. 112Figure 39. Derived data set using only the non-‐principal component in the feature vector. 113Figure 40. new derived data set using both eigenvectors to construct the feature vector. The reconstituted data is a rotated version of the original data with the data now expressed in terms of its eigenvectors rather than original x, y values. 114Figure 41. Input 9ile for PCA processing 115Figure 42. Output File after PCA processing 115

Figure 43. Input2.wav with 440 Hz sine panned 30% left, white noise panned 30% right 116Figure 44. Output2wav -‐ Principal Component Only 116Figure 45. Output for non-‐principal component only 117Figure 46. screenshot of both input and output of the PCA process carried out on 5 channel 9ilm audio 119Figure 47. Scree plot of eigenvalues indicating relative importance of each component 120Figure 48. System diagram showing a ‘speech 9iltered’ covariance matrix determining attenuation or deletion of components in un9iltered path 122Figure 49. Panning reassignment for centre channel across left, centre and right of the 5.1 mix, other channels are mixed as usual 123Figure 50. input and output waveforms shown in screenshot showing some attenuation of non-‐speech elements in left and right but added music in centre 124Figure 51. Scree plot of eigenvalues 124Figure 52. Panning reassignment for centre channel between left and centre of the 5.1 mix, other channels are mixed as usual 126Figure 53. input and output waveforms shown in screenshot showing attenuation of non-‐speech elements in right and surround channels 127Figure 54. Scree plot of eigenvalues 127Figure 55. Input and output waveforms from a dynamically adapting PCA process on a ‘standard’ 5.1 surround mix. Note the gating like effect wherever speech is present in the multichannel content 129Figure 56. Input and output screenshots where speech is between right and centre channels before and after dynamic PCA processing 130Figure 57. Listener hearing pure tone audiogram data for test material selection test 136Figure 58. Listener hearing pure tone audiogram data for test material (38 participants) 137Figure 59 A & B. Plots showing values obtained for sound quality and speech clarity for the hearing impaired group. Error bars indicate 95% con9idence interval. 140Figure 60 A & B. Plots showing values obtained for sound quality and speech clarity for the non-‐hearing impaired group. Error bars indicate 95% con9idence interval. 141Figure 61. Flow diagram illustrating audio object extraction developed in the FascinatE project. 152Figure 62. Hyperbola indicating possible locations of sound event based on time difference of arrival at 2 microphone positions. 152

Figure 63. Intersecting hyperbolas indicating derived location of sound event based on time difference of arrival at multiple microphone positions 153Figure 64. Clean Audio in FascinatE: Extracted audio objects, crowd noise and clean commentary multiplexed for transmission, decoded and reproduced by the FascinatE audio render node 154

TablesTable 1 Age distribution of self assessed hearing loss as published in International Journal of Audiology (Noble et al., 2012) 23Table 2 Criteria used to choose appropriate video clips for subjective tests 46Table 3. P-‐values for each pairwise comparison for speech clarity ratings, highlighted values indicate statistical signi9icance at p<0.05 53Table 4. P-‐values for each pairwise comparison for overall sound quality ratings, highlighted values indicate statistical signi9icance at p<0.05 53Table 5. P-‐values for each pairwise comparison for enjoyment ratings, highlighted values indicate statistical signi9icance at p<0.05 53Table 6. P-‐values for each pairwise comparison for speech clarity ratings, highlighted values indicate statistical signi9icance at p<0.05 54Table 7. Correlation coef9icients between scales for hard of hearing listeners, shaded cells indicate signi9icance at p<0.05. 54Table 8. P-‐values for each pairwise comparison for speech clarity ratings, highlighted values <0.05 indicate statistical signi9icance 76Table 9. P-‐values for each pairwise comparison for overall sound quality ratings, highlighted values <0.05 indicate statistical signi9icance 76Table 10. P-‐values for each pairwise comparison for enjoyment ratings, highlighted values <0.05 indicate statistical signi9icance 76Table 11. Correlation coef9icients between scales for hard of hearing listeners, shaded cells indicate signi9icance at p<0.05. 77Table 12. P-‐values for each pairwise comparison for overall sound quality ratings, highlighted values <0.05 indicate statistical signi9icance 77Table 13. P-‐values for each pairwise comparison for enjoyment ratings, highlighted values <0.05 indicate statistical signi9icance 78Table 14. Correlation coef9icients between scales for non hard of hearing listeners, shaded cells indicate statistical signi9icance at p<0.05. 78Table 15. Tests carried out for each condition in pilot study 88Table 16. Mean key words recognised for each condition 91Table 17. Mean key words recognised for each condition and standard deviation (high predictability sentences only) 92Table 18 Mean key words recognised for each condition (low predictability sentences only) 92Table 19. Calculated Reinforcement and Cancellation Frequencies for calculated crosstalk 101

Table 20. Matrix of eigenvectors 120Table 21. Matrix of eigenvalues 121Table 22. Matrix of eigenvalues 125Table 23. Matrix of eigenvalues 128Table 24. P-‐values for each pairwise comparison for sound quality ratings, highlighted values <0.05 indicate statistical signi9icance. 142Table 25. P-‐values for each pairwise comparison for speech clarity ratings, highlighted values <0.05 indicate statistical signi9icance. 142Table 26. Comparison of number of ball kicks and whistle blows detected and extracted compared to those audible in BBC broadcast of the same football match (Old9ield et al., 2012) 155

Key to Abbreviations Used
AAC Advanced Audio Coding (audio codec)
AC-3 Dolby Digital (A/52) audio codec
AHRL Age Related Hearing Loss
BSI Bit Stream Information
DD+ Dolby Digital Plus
DRC Dynamic Range Control
DVB Digital Video Broadcasting
DVB CM-AVC Digital Video Broadcasting Commercial Module - Audio Video
Coding
E-AC-3 Enhanced AC-3 (Dolby Digital Plus codec)
EBU European Broadcasting Union
ETSI European Telecommunications Standards Institute
FRN FascinatE Render Node
HDTV High Definition Television
HE-AAC High-Efficiency Advanced Audio Coding (audio codec)
HI Hearing Impaired
HoH Hard of Hearing
HTML5 Hypertext Markup Language v5
IP Internet Protocol
IPTV Internet Protocol Television
ITC Independent Television Commission
ITU International Telecommunication Union
LoRo Left only, Right only (stereo downmix)
Lt/Rt Left total, Right total (stereo downmix)
MPEG Moving Picture Experts Group
MUSHRA MUltiple Stimuli with Hidden Reference and Anchor
NICAM Near Instantaneous Companded Audio Multiplex
NIHL Noise Induced Hearing Loss
PCA Principal Components Analysis
PTA Pure Tone Audiogram

S/PDIF Sony/Philips Digital Interface Format
SPIN Speech Perception In Noise
SPL Sound Pressure Level
STB Set Top Box
UKCAF UK Clean Audio Forum
WDRC Wide Dynamic Range Compression

Acknowledgements
Without funding none of this research could have taken place and the support of the following organisations and people is very gratefully acknowledged.The Independent Television Commission and Ofcom especially Michelle Wakefield and Mike Brown who supported the research throughout. Dolby Labs and particularly Hannes Müsch for funding me to test their clean audio implementations, Rich Nicholls for great advice, invaluable introductions and fine company throughout, Mick Dwyer, John Iles and John Couling for support in the early days. The European Commission who funded the FascinatE project.
Many thanks to my supervisor Bill Davies and co-supervisor Jamie Angus for their advice, and for trusting me to do it right.
I had the privilege of working with excellent research assistants during this work and the assistance of Paul Kendrick, Claire Churchill and Rob Oldfield is very gratefully acknowledged.
Many organisations and people gave generously of their time and resource especially the RNID, NADP, TAG, Voice of the Viewer & Listener, the Cicada Club and Linda Hazel of The University of Manchester Age & Cognitive Research Unit who all assisted with recruiting people to take part in listening tests. Their help and that of the many participants who volunteered to help was invaluable. Thank you to Lynne Leeming, John Bamford, of the Centre for Human Communication and Deafness at the University of Manchester, Clive Sparkes of IM&T, Brian Grover of RNID and Rachel Humphriss for their advice on hearing impairment. Thanks also go to SISLive and the BBC for regular access to, and advice on, outside broadcast sites, Earl Vickers and Harald Fuchs for providing real insights into their work via numerous emails and to my amazing colleagues at University of Salford who have provided support and guidance throughout and covered classes for me while I was writing up. All involved in the UK Clean Audio Forum deserve special thanks for taking my work from research papers into international standards. It was a real pleasure to work with all of you.
A huge thank you is due to my family, especially to my wife Rachel who persuaded me I could do this when I doubted myself and was ready to give up.
Finally, I would like to acknowledge the help of Dr Alex Carmichael who started me down this long road but sadly didn't live long enough to see me reach the end of it.
1 of 208

Abstract
This thesis investigates how developments in audio for digital television can be utilised
to improve the experience of hearing impaired people when watching television.
The work has had significant impact on international digital TV broadcast standards; it
led to the formation of the UK Clean Audio Forum whose recommendations based on
the research have been included in ETSI international standards for digital television,
adopted into ITU standards for IPTV and also into EBU and NorDig digital television
receiver specifications. In this thesis listening tests are implemented to assess the impact
of various processes with a phantom centre channel and with a centre loudspeaker. The
impact of non-speech channel attenuation and dynamic range control on speech clarity,
sound quality and enjoyment of audio-visual media are investigated for both hearing
impaired and non-hearing impaired people. For the first time the impact of acoustical
crosstalk in two channel stereo reproduction on intelligibility of speech is quantified
using both subjective intelligibility assessments and acoustic measurement techniques
with intelligibility benefits of 5.9% found by utilising a centre loudspeaker instead of a
phantom centre. A novel implementation of principal component analysis as a pre-
broadcast production tool for labelling AV media compatible with a clean audio mix is
identified, and two research implementations of accessible audio are documented
including an object based implementation of clean audio for live broadcast that has been
developed and publicly demonstrated.
2 of 208

1. Introduction
1.1. Research Aim
A significant proportion of any population suffers from some form of hearing loss. This
has an impact on the ability of people to separate speech from competing sources
therefore there is a need to develop means of improving this groups’ quality of
experience of broadcast programming.
This thesis sets out to develop such algorithms and methods, to assess their effect and
investigate if it is possible to take advantage of the increased broadcast of surround
sound and utilise the additional data associated with surround sound to improve
television sound for hearing impaired viewers.
1.2. Thesis Structure
The origin of this thesis can be found in the Clean Audio Project (funded by the
Independent Television Commission (ITC)) although this work has been continued and
developed considerably beyond the remit of the original project including research
funded by Dolby Labs and Ofcom with the same aim. The thesis presents research from
the initial project and from continuing research into the problems associated with TV
audio for hearing impaired people and investigates a number of possible solutions. For
this reason this thesis does not follow a traditional PhD thesis structure but experimental
work is instead presented in several phases with each containing results, analysis and
discussion leading to the next phase.
Chapter one defines the problem that was investigated, identifies areas in the broadcast
chain where solutions may be implemented and presents the contribution that this
research has made into international broadcast standards, It also outlines the
contribution of the author and the contribution of others in some of the research carried
out.
Chapter two reviews the research to date across a range of fields related to the research
carried out for this thesis. This includes critical analysis of previous work directly
3 of 208

related to TV audio for hearing impaired people, and relevant material on hearing
impairment, clarity and speech intelligibility.
Chapters 3, 4 and 5 present the methods, analysis and findings of the three main phases
of the experimental part of the research.
Chapter 3 documents the first phase of the ITC funded Clean Audio research project,
which led to the formation of the UK Clean Audio Forum1 (UKCAF) and liaison with
international broadcast standards bodies. Test methodology is developed for assessment
of audio reproduction conditions using AV media for hearing impaired people.
Experiments investigate the impact of non-speech channel attenuation, and of stereo
downmixing, on ratings of speech clarity, overall sound quality and enjoyment for
hearing impaired and for non-hearing impaired people.
In chapter 4 further research is presented that implements solutions identified in chapter
3 for existing two channel stereo reproduction equipment.
Chapter 5 investigates the poor ratings of stereo in listening tests carried out in chapters
3 and 4 and documents both subjective assessments and objective measurements of the
impact of acoustical crosstalk on intelligibility of speech in background noise in order to
identify possible causes of these ratings. The chapter uses audio-only test material in
order to investigate the impact of a centre channel for speech on intelligibility based on
key word recognition.
In chapter 6 a solution proposed in response to published research documented in
chapter 3 (utilising principal component analysis to separate speech from noise) is
evaluated for fitness of purpose. The technique is then adapted for offline usage
indicating some usefulness for preprocessing broadcast material prior to broadcast.
Chapter 7 documents two implementations of variations on the clean audio solutions
proposed here. Firstly an experimental process developed by Dolby Labs was assessed
by the author using listening tests, and secondly a solution for accessible audio was
developed and demonstrated for an object-based future broadcast system as part of the
EU FP7 FascinatE project.
4 of 208
1 The UK Clean Audio Forum was sponsored by the UK communications regulator, Ofcom, and consisted of broadcasters and broadcast technology providers. Members included, Dolby, SVT, S4C, BSkyB, CH4, ITV, BT, ST Microelectronics, BBC, University of Salford.

Chapter 8 presents conclusions and future directions that have been identified for
continuing the research.
1.3. Contribution of the Author
Some of the experimental work documented in the thesis was carried out with the
assistance of additional researchers. This section clarifies the contribution of people
contributing to the work. All literature reviews, background research and all text
presented in this thesis is, however, the sole work of the author. In each instance all
decisions relating to the research including test methodology and implementation were
made by the author. In each instance listening tests and statistical analyses were carried
out by the author, where research assistants were employed to assist in tests this is
identified here for clarity.
For the initial work on the project, documented in chapter 3, a research assistant (Paul
Kendrick) was employed, primarily to assist in the execution of listening tests. Tests
were designed, all control software developed, and the statistical analysis presented here
was carried out solely by the author. Listening tests investigating stereo reproduction,
documented in chapter 4, were carried out by the author with the assistance of another
research assistant (Claire Churchill) who also assisted in identifying appropriate test
material based on criteria set by the author. All test design, control software used and
the statistical analysis presented here is the sole work of the author. Some experimental
measurements in chapter 5, investigating the impact of acoustical crosstalk, were carried
out with the assistance of a research assistant (Paul Kendrick) who also developed a
comb filter, implemented as a DirectX plugin, for listening tests. Listening tests for
Dolby Labs, documented in chapter 7 were designed by the author although methods for
selecting test material were developed collaboratively with Hannes Musch from Dolby
Labs, San Francisco. Processing for these tests was carried out using experimental
software developed by Hannes Musch. All statistical analysis and control software were
the sole work of the author. For the FascinatE project (documented in chapter 7) clean
audio implementation research was carried out solely by the author, software
5 of 208

development for audio object extraction was carried out by a research assistant (Rob
Oldfield) under the direction and supervision of the author.
1.4. Defining the Problem
There are estimated to be around 10 million people who are deaf or hard of hearing in
the UK . Of these around 8.3 million suffer from mild to moderate deafness (Hearing
Concern, 2004) and would benefit from any improvements that may be made in
television audio. The ITC received many complaints from hard of hearing people about
the quality of sound on television, primarily that the dialogue is unclear and hard to
understand owing to the level of background ‘noise’. This noise consists of background
music, sound effects and speech and it can have the effect of masking the dialogue and
making it difficult or impossible to understand. This level of complaints to the ITC and
Ofcom has been mirrored in complaints to broadcasters. A survey carried out by the
BBC in 2010 indicates that 60% of viewers had difficulty in understanding speech on
TV (VLV, 2011). Digital TV, and especially the increasing availability of surround
sound, has the potential for much improved TV sound quality and could therefore be of
great benefit to hearing impaired viewers. However the wish to create “rich
multilayered soundtracks” may instead lead to increased problems for hearing impaired
people (Armstrong, 2011) .
1.5. Server Side or Client Side Solution
An important element in the planning of any research into broadcast accessibility
solutions is defining the appropriate point, or points, in the route from producer to
viewer at which change should be implemented. Changes in appropriate legislation,
recommendations and guidelines can be implemented with a ‘top down’ approach; this
can be carried out at an international level and so retain or improve compatibility
between the broadcast systems of different countries. Standards committees and
professional bodies can be influential in bringing accessibility and inclusivity issues to
the fore and in promoting solutions. In collaboration with the major international audio
and broadcast companies they are responsible for publishing the standards to which all
of these companies should comply. Broadcasters themselves can play a key role in
6 of 208

ensuring mixes are appropriate to the programme and avoiding exacerbation of the
problem by poor mixing practice.
An alternative approach is to bring about improvements in the set top box (STB), at the
viewers’ end of the broadcast chain. This approach may be capable of providing more in
the way of a ‘quick fix’ solution; an add-on to a set top box could perform appropriate
audio processing and could be retro-fitted to existing equipment. STB manufacturers
can re-programme the software of much current receiver and decoder hardware and
there is also potential for solutions that would involve viewers altering settings and
choosing equipment based on its accessibility to them and on their individual needs.
Much is possible in this domain but it is sometimes difficult to persuade industry to
commit development funds to benefit what is often seen as a niche market.
1.6. Digital TV and Surround Sound Broadcast
One of the features of digital audio broadcast is the capability of a far greater dynamic
range than was possible with analogue broadcast, the difference in level between the
quietest sounds and the loudest can be far greater. This capability is being utilised to the
full by producers, not least because more and more viewers are listening to their TV sets
connected to hi-fi or home cinema equipment which can cope with reproduction of a
greater dynamic range than built in TV loudspeakers. This increase in dynamic range
has obvious implications for viewers suffering from loudness recruitment2. In loudness
recruitment the difference in level between the quietest sound that can be heard and the
level at which sound level becomes painful is reduced making increased dynamic range
in broadcast uncomfortable or painful for sufferers. Increased use of louder music,
effects and other background noise can make understanding of speech much more
difficult for a range of hearing impairments.
7 of 208
2 “Recruitment is the otological condition in which weak sounds are not heard while strong sounds are heard as loudly as by a normal ear… in recruitment the dynamic range of hearing is narrowed” Yost, W. A. (2000). Fundamentals of Hearing: An Introduction. San Diego, California: Academic Press.

Alongside the implementation of digital TV, although not yet ubiquitous, is the
continuing growth of surround sound broadcast for television. The most widely used
surround sound format for digital TV in the UK is currently Dolby Digital 5.1 surround
sound. At the heart of the Clean Audio project was the premise that by utilising the
presence of additional channels and the extra information contained within the metadata
of the Dolby Digital format it should be possible to improve the clarity of TV sound for
hard of hearing viewers.
1.7. Possibilities Offered by Surround Sound Broadcast
Surround Sound Broadcast offers a number of potential solutions to create ‘clean
audio’. There is additional audio data and there is additional data about the audio data
(metadata). These may both be utilised in an attempt to improve dialogue clarity and
speech intelligibility.
1.7.1. Dolby Digital Surround Sound
Dolby Digital 5.1 is the format chosen by Sky for their current surround sound
broadcasts in the UK and, with around 28 million Dolby Digital receivers in use
throughout the world, Dolby Digital looks set to continue as a market leader for
surround sound TV broadcast (Rumsey, 2009b). Because this is the most common
format in the UK this thesis focuses on Dolby Digital however the same potential for
solutions exists with other codecs such as AAC and HE-AAC.
The Dolby Digital format minimises bandwidth by using data compressed audio and
allows for the use of multiple full frequency range audio channels and one low
frequency effects channel. Loudspeakers for 5.1 are arranged with one central front
channel (normally used for dialogue), front left and right loudspeakers and rear left and
right surround loudspeakers arranged as shown in figure 1 and defined in ITU-R BS
775-1, Multichannel stereophonic sound system with and without accompanying
picture, (ITU, 1994).
The audio is broadcast as an AC-3 or E-AC-3 (Advanced Television Systems
Committee, 2012) bit stream and it is the format and content of this bit stream that may
8 of 208

enable implementation of changes that could be beneficial to hard of hearing viewers.
The original Dolby Digital AC-3 standard has now been superseded by the enhanced
AC-3 format (E-AC-3), also known as Dolby Digital Plus (DD+). E-AC-3 incorporates
a number of enhancements to the AC-3 standard. The changes include, “increased
flexibility, expanded metadata functionality, and improved coding tools” (Fielder et al.,
2004) including the provision of up to 15 full range audio channels instead of AC-3’s 5
full range channels.
Figure 1 Loudspeaker layout compatible with ITU-R BS 775-1, Multichannel stereophonic sound system with and without accompanying picture,
For the purposes of this thesis, and as it is only concerned with investigating 5.1
channel delivery, the term AC-3 will be used throughout on the understanding that, for
current surround sound broadcast using 5.1, this could be delivered using either AC-3 or
E-AC-3 and that, for the purposes of 5.1 broadcast and the scope of this thesis the
difference is unimportant.
The AC-3 bit stream consists of between 1 and 6 discrete channels of audio, and
metadata. AC-3 metadata can be described as data about the audio data and a full
description of defined metadata can be found in Appendix A, Dolby Digital Metadata
Parameters and in The Dolby Metadata Guide issue 2 (Dolby Labs, 2003). The audio is
9 of 208

compressed in the encoding process and AC-3 streams of various bit rates encompass
multi-channel and single channel formats. Additional audio channels can be included
for multiple language support and there is provision to include Hearing Impaired (HI)
and Visually Impaired (VI) audio channels for viewers with sensory impairments.
Accompanying metadata contains information about all of these audio channels; their
format, how they should be decoded, downmix parameters required to convert from 5.1
to stereophonic or mono-aural and the type of audio compression that should be applied
(if any), based on a proprietary compression system, dynamic range control, which is
discussed in more detail later in this thesis.
Unlike some surround sound systems, the AC-3 format maintains a separation between
audio channels in the encoded bit stream, in other words, there are 6 discrete and
separate audio channels present in a 5.1 encoded AC-3 stream. This in itself means that
relative channel levels can be altered relatively simply at the decoder and individual
channels can be attenuated or amplified independently, often this can be accomplished
by changes in metadata interpretation. In most 5.1 encoded material the centre channel
is used as a dialogue channel therefore gains in dialogue clarity should be possible by
attenuating the level of the left, right and surround loudspeakers relative to the dialogue,
at least for material where this would be appropriate.
1.7.2. Multi-channel Audio
The first solution to be investigated in the project was the simplest; Dolby mixing
guidelines state that, “Traditionally, dialog is placed only in the Centre speaker to tie
the on-screen sounds to the picture. When a Centre speaker is used, all centre-panned
dialogue appears to come from the screen regardless of the listener’s position. If the
dialogue comes from the Left or Right speakers, the stereo image differs depending on
the listener’s position. This is highly undesirable. It does not bar voices from the other
channels, but generally only effects or incidental voices should be in any channel other
than centre.” (Dolby Labs, 2005)
10 of 208
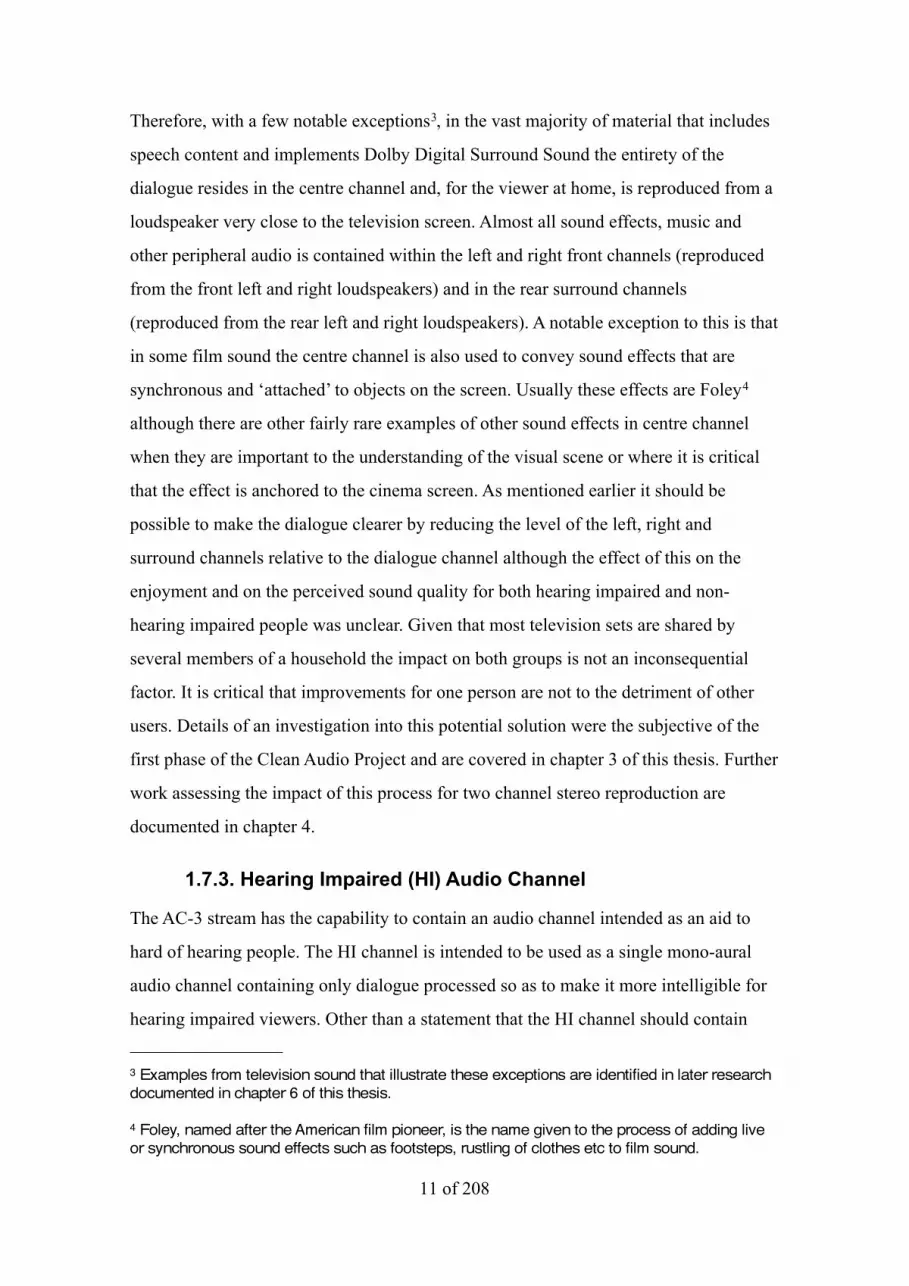
Therefore, with a few notable exceptions3, in the vast majority of material that includes
speech content and implements Dolby Digital Surround Sound the entirety of the
dialogue resides in the centre channel and, for the viewer at home, is reproduced from a
loudspeaker very close to the television screen. Almost all sound effects, music and
other peripheral audio is contained within the left and right front channels (reproduced
from the front left and right loudspeakers) and in the rear surround channels
(reproduced from the rear left and right loudspeakers). A notable exception to this is that
in some film sound the centre channel is also used to convey sound effects that are
synchronous and ‘attached’ to objects on the screen. Usually these effects are Foley4
although there are other fairly rare examples of other sound effects in centre channel
when they are important to the understanding of the visual scene or where it is critical
that the effect is anchored to the cinema screen. As mentioned earlier it should be
possible to make the dialogue clearer by reducing the level of the left, right and
surround channels relative to the dialogue channel although the effect of this on the
enjoyment and on the perceived sound quality for both hearing impaired and non-
hearing impaired people was unclear. Given that most television sets are shared by
several members of a household the impact on both groups is not an inconsequential
factor. It is critical that improvements for one person are not to the detriment of other
users. Details of an investigation into this potential solution were the subjective of the
first phase of the Clean Audio Project and are covered in chapter 3 of this thesis. Further
work assessing the impact of this process for two channel stereo reproduction are
documented in chapter 4.
1.7.3. Hearing Impaired (HI) Audio Channel
The AC-3 stream has the capability to contain an audio channel intended as an aid to
hard of hearing people. The HI channel is intended to be used as a single mono-aural
audio channel containing only dialogue processed so as to make it more intelligible for
hearing impaired viewers. Other than a statement that the HI channel should contain
11 of 208
3 Examples from television sound that illustrate these exceptions are identified in later research documented in chapter 6 of this thesis.
4 Foley, named after the American film pioneer, is the name given to the process of adding live or synchronous sound effects such as footsteps, rustling of clothes etc to film sound.

processed dialogue there is no available guidance as to how this improved intelligibility
should be gained (Dolby Labs, 2000a). It was hoped that the Clean Audio Project could
bring some clarity to this subject and that this may be of benefit in applications beyond
the narrow ‘broadcast’ scope of the project, such as DVD production where bandwidth
is not as much of a limiting factor. In the broadcast environment however bandwidth is
severely limited, every bit of data has an associated cost, and a separate audio feed for
hearing impaired people has not provided a solution that has been taken up by
broadcasters. In this research a decision was made to concentrate on solutions that
would not increase the bandwidth and therefore would be relatively cost neutral for
broadcasters. It seemed likely however that any solution that can be delivered by the
project as a real time process would also be useful in automatically generating
appropriate audio for an HI channel that could be utilised in circumstances where
bandwidth was less of a constraint.
1.7.4. Metadata
In addition to the additional audio channels available in the AC-3 and E-AC-3 formats
the Dolby bit stream also contains information about the audio. In addition to format,
codec and channel information this metadata is also concerned with performing three
main functions:
• Allowing changes between TV programmes and TV channels with no sudden
changes in level.
• Controlling the downmix of the 6 channels in 5.1 surround for stereophonic or
mono-aural reproduction.
• Determining how the programme material is compressed for playback in less
than ideal listening environments when appropriate options are set by users. An
example of this is so-called ‘midnight mode’ (Dolby Labs, 2000b) used to
reduce the dynamic range of audio to avoid disturbing neighbours late at night.
The first of these, ensuring consistent volume levels between programmes, is
accomplished by the use of a value within the metadata that gives an average level
based on the level of the dialogue in the programme material. This value, known as the
12 of 208

dialogue normalisation level, or dialnorm, provides a reference in order that
broadcasters can ensure a standard level between programmes and between channels.
This reference level is based on a dialogue level measured using Dolby’s proprietary
LM100 loudness meter, rather than on the level of the audio content overall. The second
metadata function is to describe how the six channels of 5.1 audio media should be
downmixed for reproduction over a smaller number of loudspeakers. The capability to
downmix the 5.1 surround audio to stereo or mono is vital in a broadcast context in
order that material can be played back on non-surround reproduction systems without
requiring additional audio channels to be broadcast.
The metadata contains parameters that determine the level of rear surround channels
compared to the dialogue channel and also the relative level of front left and right
channels. The information contained within the metadata is known as the Bit Stream
Information (BSI) or the Extended Bit Stream Information depending on whether some
more recent optional parameters are implemented. It seemed likely that metadata
contained within the AC-3/E-AC-3 stream could have potential to help provide a
solution with no extra bandwidth required for broadcasters. Any processing or
downmixing implemented at the STB end of the broadcast chain could potentially be
controlled by values in the metadata that would be set at the broadcast or production end
of the chain.
This potential was explored more fully in phase 2 of the Clean Audio Project during
discussions with Dolby Labs and is documented in chapter 4. The use of metadata to
improve sound for hearing impaired viewers, and particularly the use of the dialnorm
parameter, relies heavily on producers and broadcasters using the metadata
appropriately and the extent to which they comply is discussed in section 2.3 of this
thesis.
A complete list of metadata parameters for Dolby AC-3 and E-AC-3 is contained in
Appendix A.
13 of 208

1.8. Contribution of the Research into Broadcast Standards
Standardisation activity beyond the original project has included presentations by the
author to the Digital Video Broadcast Group Commercial Module (DVB CM-AVC) in
Geneva5. The Commercial Module of this group has the responsibility to develop
commercial requirements for audio/visual multimedia services both in broadcast and
network contexts. Documented outputs from DVB CM-AVC resulting from this
presentation are presented in Appendix M (Sheppard, 2006) (CM-AVC0084 DVB CM-
AVC Commercial Requirements: Delivering “Clean Audio” for the Hard of Hearing).
In this document DVB CM-AVC clearly identify the need for clean audio provision and,
referencing research documented in chapter 3 of this thesis, present a system diagram
developed by the author and others on the UKCAF.
The research presented here led directly to the formation of the UKCAF, and
recommendations on Clean Audio provision stemming from this research were
presented by UKCAF to the International Telecommunications Union (ITU) (UK Clean
Audio Forum, 2007) (reproduced in Appendix K). The recommendations from UKCAF
have been published in ETSI TS101154, Digital Video Broadcasting (DVB);
Specification for the use of Video and Audio Coding in Broadcasting Applications based
on the MPEG-2 Transport Stream, (Annex E.4 - Clean Audio) (ETSI, 2009) standard
for digital broadcast.
The ETSI Clean Audio provision, as defined by the research documented here, is
referenced as a requirement in Open IPTV Release 2 Specification, Volume 2 – Media
Formats [V2.0] (Open IPTV Forum, 2011) for broadcasts where Clean Audio is
provided. These recommendations are now being implemented by some European
broadcasters. For example the recent implementation of the NorDig specification for
14 of 208
5 “The Digital Video Broadcasting Project (DVB) is an industry-led consortium of around 250 broadcasters, manufacturers, network operators, software developers, regulatory bodies and others in over 35 countries committed to designing open technical standards for the global delivery of digital television and data services.Digital Video Broadcasting Project. (2011). DVB - The Global Standard for Digital Television. URL: http://www.dvb.org/index.xml.

Nordic digital TV which makes Clean Audio support as specified by ETSI TS101154
mandatory for all NorDig profiles where STBs are capable of implementation (NorDig,
2013). The EBU standard that specifies “the minimum HDTV receiver requirements of
EBU members (the broadcasting organisations)” (EBU, 2009), also now explicitly
requires Clean Audio as defined by ETSI TS101154 for HDTV receivers.
1.9. Contribution to Knowledge
In addition to contributing to international broadcast standards the research documented
here has contributed the following to knowledge in the field of broadcast audio for
people with a hearing impairment.
Improvements in perceived speech clarity, sound quality and enjoyment of video clips
for hearing impaired people have been identified as a result of simple remixing of 5.1
surround sound audio-visual media that could be carried out at the STB, potentially by
the use of metadata to flag content appropriate for remixing.
5.1 surround sound material downmixed to stereo has been shown to lead to poorer
speech clarity, sound quality and enjoyment for both hearing impaired and non-hearing
impaired people when compared to three channel (left, centre, right) reproduction.
Issues with stereo reproduction have been identified and investigated, listening tests
have been devised that confirmed statistically significant reduced intelligibility for
material utilizing a phantom centre channel compared to a real centre channel based on
keyword recognition. Acoustic measurements have been carried out that confirmed this
to be the result of attenuation of frequencies key to intelligible speech due to acoustical
crosstalk.
Dolby’s dynamic range control compression processing has been shown that it can
significantly improve speech clarity and overall sound quality for hearing impaired
people when compared with the default stereo reproduction found on set top boxes.
The potential of object based audio to provide accessible audio has been demonstrated
and novel methods for extracting audio objects from a complex acoustic scene
demonstrated.
15 of 208

2. Literature ReviewThere is limited previous research into television sound for hard of hearing people other
than that focussing on the use of subtitles and other non-audio cues. For this reason the
existing research in that area has been supplemented by relevant work from a variety of
subject areas which could inform the research. The review is presented in several
sections: a section on the research that has been carried out on TV audio for hearing
impaired people, sections on hearing loss, lessons that could be learned from hearing aid
processing development, the impact of TV audio standards and discussion of various
common standards and formats of relevance to the research including downmix
methods, and more general work on speech intelligibility and clarity. A section is also
presented on the psychoacoustic test methodologies adopted in this research and the
particular problems of adapting listening tests and subjective assessment for hearing
impaired participants.
2.1. TV Audio for Hearing Impaired People
Considerable research has been carried out into usability issues for digital and
interactive TV for older and sensory impaired people including earlier research
commissioned by the ITC (Freeman et al., 2003) and several qualitative methodologies
have been developed for this purpose (Eronen, 2006; Freeman and Lessiter, 2003). A
limited amount of research has been carried out specifically about TV audio for hearing
impaired people, principally by the broadcast community; the ITU have questioned
how TV sound could be made better for hearing impaired people (1994b) and studies
have been carried out by the BBC. A BBC study by Mathers (1991) responded to
complaints from viewers over a number of years complaining about “background sound
(e.g. audience laughter, crowd noise, background music etc.)”. Mathers’ research carried
out subjective testing where participants were presented with three different levels of
background sound; a reference mix between speech and background thought
appropriate by a BBC mixing engineer and mixes with background sound at -6dB and
+6dB relative to this recording. The research was carried out prior to the introduction of
NICAM stereo in 1991 and the audio was reproduced using whatever equipment
participants normally used while watching TV. It is assumed because of this that the
16 of 208

reproduction systems used were monaural. 336 participants in total were asked to assess
the perceived intelligibility of speech in excerpts across a range of programme material
however only 25% of these were tested under controlled conditions. Results from the
research were inconclusive and led to an expressed view that intelligibility was not
highly dependent on background level and that very high or very low levels of
background sound would be needed for a significant impact to be shown.
A second BBC study by Meares (1991) suggests that multichannel sound systems
associated with HDTV could be utilised in providing a Hard of Hearing (HoH) channel,
at least for programming where a discrete commentary channel exists, and potentially
for other programming where access to the original mixes were available. Meares
suggests that hard of hearing listeners would benefit enormously from such a provision
but identifies additional cost in broadcasting additional HoH services. An additional
HoH channel is identified as being an ideal solution by others (Hoeg and Lauterbach,
2009) however where only the premixed audio is present there is no clarity as to how a
clean dialogue channel could be derived from material that is already mixed, as is more
usually the case.
More general research on audio processing to improve intelligibility can be found in
Armstrong’s useful literature review (Armstrong, 2011) which points out the
considerable difficulties inherent in separating speech from competing noise. Hu and
Loizou are cited as carrying out three studies investigating the effect of speech
enhancement algorithms on intelligibility, as opposed to speech quality (2007b; 2007a;
2006) however these studies are based on single channel separation methods. Other
research (Kendrick and Shirley, 2008) illustrates several implementations of algorithms
that provide some separation for multiple microphone configurations. Furthermore
chapter 6 and Zielinski (Zielinski et al., 2005) document processing that can separate
sources for produced media under certain specific conditions. Armstrong’s unequivocal
conclusion that, “Whilst audio processing can be used to create cosmetic improvements
in a speech signal it cannot be used to improve the ability of an audience to follow the
words” is therefore rejected. It is possible that this may be an accurate statement for a
17 of 208

single channel or for a two channel stereo condition, although this is a very active
research topic and some success is claimed using knowledge of individual person’s
speech frequencies, for example (Stark et al., 2011). However for some multichannel
conditions the research presented in this thesis shows that actual intelligibility
improvements can be reliably demonstrated under experimental conditions from
produced multichannel media. The further assertion that “Audio processing cannot be
used to create a viable ‘clean audio’ version for a television audience” is also rejected as
it is based on the same argument. It is possible that a surround sound, or even stereo
mix, where mixing parameters are not simply the result of source and microphone
placement but are produced subject to known guidelines and conventions, may present a
special case where sufficient research had not at that time been carried out for a
conclusion to be drawn.
The methodology and detailed results of the BBC’s own large scale survey into hearing
impairments and TV audibility is unpublished however some key outputs have appeared
in news releases (VLV, 2011). One of the headline findings was that 60% of viewers
“had some trouble in hearing what was said in TV programmes”. Background noise and
background music accounted for 25% of these, other major factors being foreign
language and dialects, poor diction and speech being ‘too fast’. The survey led to a
series of guidelines and training materials for the BBC in order to alleviate problems as
far as was possible through improved production techniques (BBC, 2011).
Over a number of years RNID research published in their annual survey report has held
background noise accountable for a higher proportion of problems with dialogue on TV
than BBC research suggested. Reports indicate that the number of people finding that
background noise affected their ability to hear speech on TV rose from 83% of
respondents in 2005 (RNID, 2005) to 87% in 2008 (RNID, 2008). The problem was
worse for older people with 88% of the over 65 age group reporting problems compared
to 55% of those aged 16-24. Interestingly 45% of those surveyed who had no reported
hearing loss also noted background noise as affecting their ability to hear speech
18 of 208

(RNID, 2005) indicating that different mixes, rather than the use of subtitles, is more
likely to be a useful solution for many.
Some research has been carried out directly aimed at improving intelligibility of speech
on TV audio for hearing impaired people, some of it following recommendations made
after research documented in this thesis.
Early work by Carmichael (2004) on the DICTION project indicated that, at the time of
the research, although signal processing could make speech sound clearer, it could not
improve measures of objective intelligibility in terms of word recognition. Müsch
(2008) has argued that this can still reduce the cognitive effort required for
comprehension and has discussed algorithms developed by Dolby which utilised several
techniques to detect the presence of speech in centre channel and to attenuate other
competing sounds in that, and other, channels. The aim of the techniques used was
twofold; to decrease listener effort and, as a consequence, to improve intelligibility.
Müsch explains that older listeners tend to prefer higher listening levels to younger
listeners because of elevated hearing thresholds but also that the effect of loudness
recruitment reduces the level at which listening becomes uncomfortable or painful.
There is therefore what Rumsey refers to as a reduced “window of comfortable dynamic
range” (Rumsey, 2009a) for older listeners. Müsch argues that the cognitive load caused
by the mental processing used to filter out background sound and ‘clean up’ the speech
means that there is reduced attention for the higher level cognitive processing used to
contextualise sentences and therefore fill any ‘gaps’ caused by words not heard. He
suggests that the problem for older people in understanding speech on TV is not usually
cognitive impairment but is primarily of a sensory nature. Reduced frequency resolution
affecting the recognition of speech formants is cited as one reason, another being
reduced ability of hair cells in the inner ear to detect phase effectively. The argument
here is that audibility is key, that signal processing may not be able to improve
individual word recognition but may be able to reduce listening effort and therefore the
cognitive load that may play a part in preventing comprehension for hearing impaired
people. Others, cited by Carmichael (2004), have argued that there are more factors at
work than simply the sensory impairments themselves. Cervellera (1982) points to age
19 of 208
related degradation of nerve pathways as adding significant ‘noise’ to perceived sounds;
Stine et al (1986) and Rabbit (1991) point to evidence that slower and less efficient
cognitive systems resulting from the ageing process also add to the problem. Certainly
the combination of high dynamic range audio, competing background noise, reduced
comfortable dynamic range, lack of frequency resolution and other effects brought on
by physiological change, degraded nerve pathways and reduced, or slowed, cognitive
performance explain why older viewers may find it difficult to understand speech on
TV and also the number of complaints received by Ofcom and television broadcasters.
Methods developed during work carried out by Uhle et al (2008) as part of the European
project “Enhanced Digital Cinema” (EDCine, IST-038454) aimed to reduce background
noise in the centre channel and so improve speech quality however the methods used,
based on single channel separation had limited success.
The DTV4ALL project, funded under the EU ICT Policy Support Programme, was set
up to “facilitate the provision of access services on digital television across the
European Union” and looked at accessible audio for hearing impaired people as part of
this remit. It recognised that much accessible audio would ideally be produced at
production stage where original unmixed audio was available (thus avoiding the
difficult speech separation problems discussed by Armstrong) and highlighted Dolby
Digital Plus (DD+) (ATSC, 2005)(Fielder et al., 2004), which has the capability to mix
additional audio channels into a 5.1 mix, as being a possible useful implementation
platform. The project specifically excluded the unmixing of stereo and mono broadcast
audio from its scope but did suggest making use of the fact that in much 5.1 audio,
speech is primarily in the centre channel. In tests on material with no separate speech
channel a panel of 18 participants rated processed and unprocessed AV test material
with a “normal level of background noise” including soft rumbling, rustling and
footsteps for ‘audibility’. The nature of background sound was carefully chosen based
on pre-test results that indicated poorer acceptance of the clean audio processes used for
louder non-speech content, such as cheering. The processing was implemented using the
Cedar 1500 processor which enables attenuation of spectral components not utilised by
20 of 208

speech. The processor requires setting up for each acoustic situation and it had to be
carefully monitored to ensure effective operation (Brückner, 2010) and so, although it
was working in real time, it was essentially a manual process used to demonstrate the
current state of the art in the context of clean audio. Some additional manual processing
was carried out by the iZotope (iZotope) processing tool in order to remove additional
piano tones from some sections as the Cedar software was found to be insufficient for
this material. Results indicate that ratings were quite variable both across media clips,
and across different participants. In a number of cases where participants were able to
differentiate between unprocessed and clean audio sections, very varied ratings were
obtained. However generally the clean audio processing achieved high ratings. It was
concluded that demonstrating improvements for some individuals could indicate a basic
principal of providing an optional audio presentation at the set top box for those people.
It was anticipated that this mix would be part of broadcast preparation and would be
provided as a separate clean audio channel. The DTV4ALL project concluded that
“clean audio is a very good solution” but that there was not currently a clear
understanding of the difficulties of delivery. Investment in clean audio was considered
desirable “particularly if clean audio could be generated automatically” (DTV4ALL,
2010).
A number of researchers have suggested that clean audio could be provided via an IP
link in parallel with broadcast and a NEM position paper (MEUNIER et al., 2012)
suggests that this could be undertaken as part of individualisation and personalisation of
connected TV services. Although bringing its own potential synchronisation issues this
is a potentially attractive solution although beyond the scope of this thesis.
Very recent developments by Fraunhofer published during the writing of this thesis have
utilised a ‘dialogue enhancement’ algorithm that pre-prepares material for broadcast in
such a way that it can be unmixed to two individual components at the set top box. In
this implementation dialogue enhancement parameters are generated as part of the
mixing process and these contain sufficient information to effectively derive original
sources from the mixed AV media at the STB. Instead of transmitting separate speech
21 of 208

and background, an AAC or HE-AAC bitstream is transmitted that contains mono,
stereo or 5.1 mixed content. Metadata containing the unmixing parameters required to
separate out sources required to create a clean audio output are transmitted as part of
this transmission. The advantage to this solution is that it could be made backwards
compatible with existing equipment, where no decoder was present in the set top box,
the default stereo or 5.1 mix would be heard. This solution was demonstrated for two
channel stereo material as part of BBC Wimbledon coverage (Fuchs et al., 2012) and
viewers were able to use a PC based software application to adjust levels of
commentary compared to court-side ambience. Although the process brought some
additional complexity to the production process audience response was favourable. The
technology is further described in a paper not published at the time of writing (Fuchs
and Oetting, 2013) as an implementation of MPEG SAOC (Spatial Audio Object
Coding) where the dialogue or commentary is considered as an audio object which can
be extracted from the pre-mixed audio based on the parameters transmitted with the
broadcast audio mix.
2.2. Hearing Loss and Audio Reproduction
It is important to define at an early stage what types of hearing loss may be addressed
by the potential solutions discussed within this thesis. There are broadly two types of
hearing loss; conductive and sensorineural. It is also possible to have a combination of
these types of hearing loss. Conductive hearing loss results when sound vibration is
unable to pass to the inner ear for some physical reason, often as a result of a build up of
ear wax or fluid or by a damaged ear drum. In many, but by no means all, cases this
may be corrected by surgery or other treatment. Sensorineural, or cochlear, hearing loss
is caused by damage to the cochlear or to the auditory nerve which may have a
combination of a number of contributory factors. The most common reason for
sensorineural hearing loss is the ageing process, typically resulting in a loss of high
frequency perception. Other contributing factors include (but are not limited to)
prolonged exposure to noise (Noise Induced Hearing Loss, NIHL), disease and
infections, and some medications (Ototoxicity) (Roland and Rutka, 2004).
Sensorineural hearing loss accounts for the majority of hearing loss in the population
22 of 208

(often estimated at close to 90% (Meier, 2007)). Because of its prevalence, people
suffering from sensorineural hearing loss were considered the main potential
beneficiaries of any solutions generated from this research.
2.2.1. Prevalence of Hearing Loss
Age Related Hearing Loss
The number of people suffering from some form of hearing loss can be difficult to
assess accurately. Action on Hearing Loss (previously the RNID) estimate the number
of people suffering from hearing loss in the UK to be around 10 million (Action on
Hearing Loss, 2012). Davis (1989) carried out a survey across several cities in the UK
and concluded that 16% of UK adults have a bilateral hearing impairment and 25%
have a bilateral or unilateral impairment. Of these only 10% self reported that they had
bilateral hearing difficulty in a quiet environment which indicates the difficulties of
reliance on self reported statistics. The Medical Research Council’s statistics show
clearly the correlation between hearing loss and age.
Adults aged with mild, moderate, severe or profound hearing loss
16 – 60 6%
61 – 80 47%
81 & over 93%
Table 1 Age distribution of self assessed hearing loss as published in International Journal of Audiology (Noble et al., 2012)
Even allowing for inaccuracies from self reporting the use of different classification
systems across different countries has increased the complexities involved in
understanding the prevalence of hearing loss (Roth et al., 2011). A review carried out in
2010 found that 30% of men and 20% of women in Europe were found to have a
hearing loss of 30dB HL or more by age 70 years, and 55% of men and 45% of women
by age 80 years (Roth et al., 2011) indicating the high prevalence of age related hearing
loss (ARHL) in populations. The review also noted the difficulties in assessing
prevalence of hearing loss, namely a lack of standardised method in assessing or of
23 of 208

counting AHRL, commenting that, there were “more information gaps than information
that would allow gaining a meaningful picture of prevalence of ARHL”. Nevertheless,
the data available makes clear that hearing loss as a result of the ageing process is
widespread. The US National Health and Nutrition Examination Survey (Agrawal et al.,
2008) suggests that hearing loss is more prevalent in US adults than had previously
been reported estimating that in 2003-4 16.1% of adults (29 million Americans) had
some degree of hearing loss. The study stated that because the survey results were self
reported the results probably underestimate the true scale of hearing impairment. Again
it is difficult to draw comparisons with UK and European populations owing to the
methods and definitions used in each study; audiograms used during Agrawal’s study in
the US concentrated on speech frequencies and high frequency loss whereas UK
definitions cover a wider range of frequencies.
Noise Induced Hearing Loss
In addition to ARHL, the national burden of hearing difficulties attributable to noise at
work is considered to be substantial in the UK (Palmer et al., 2002) and this
incorporates some demographic variation. Causes for older and for younger people in
particular show considerable variance. Several sources provide indications as to the
prevalence of NIHL in the UK, a Health and Safety Executive (HSE) sponsored report
(Palmer et al., 2001) collates data from a number of sources as follows. In 1995 14,200
people were in receipt of benefit for industrial deafness (HSE., 1997), however this does
not reflect the number of people suffering from NIHL, a Medical Research Council
survey quoted by HSE (HSE.) estimates the true number to be closer to 509,000; the
discrepancy being mainly because of the conditions needed to in order to claim benefit
including a high degree of hearing loss (>50dB in both ears). A self-reported survey by
HSE gives some credence to this with 140,000 people being estimated to have deafness
or tinnitus made worse by their employment (Jones et al., 1998) and in the four year
period 1991-1995 the UK Association of British Insurers handled 230,000 NIHL claims.
Given that all of these surveys only included people currently in work it is likely that,
once those people no longer working are taken into account, the numbers would be
much higher. It could indeed be argued that the prevalence of NIHL in older people will
24 of 208
be considerably higher than in those currently of working age owing to the lack of a
stringent health and safety at work regulatory framework at the time that they were
working.
Amongst young people the impact and cause of noise induced hearing loss (NIHL) may
be different, one substantial component being entertainment. Studies into hearing
impairments from recreational activities (Clark, 1991; Maassen et al., 2001) have found
noise levels substantial enough to cause some permanent hearing damage with repeated
exposure across a wide range of activities. Detailed studies into musicians (Axelsson
and Lindgren, 1978; Axelsson et al., 1995), employees in the entertainment industries
(SADHRA et al., 2002) and young people listening to music on headphones (Peng et al.,
2007) largely indicate substantial impact of entertainment on the hearing of younger
people.
2.2.2. Application of Hearing Aid Processing
Hearing aid processing design has used a number of approaches that could have
application to improving television sound for hearing impaired people. Turner and
Hurtig (1999) investigated using proportional frequency compression as an aid to
intelligibility and found some improvements but concluded that it was less effective
than high frequency amplification in most participants. In a smaller study Mazor et al
(1977) found that frequency compression actually reduced intelligibility in most cases.
Roch et al (2004) discuss the benefits of frequency compression for some listeners with
sensorineural hearing loss and propose a pattern recognition system to compensate for
the material dependent nature of this method. The research found that voices with
different fundamental frequencies required different degrees of frequency compression
to attain the best intelligibility improvements.
Multichannel amplitude compression solutions have been investigated and have shown
superior benefits to conventional linear hearing aids in some studies (Moore, 1987;
Moore et al., 1992; Laurence et al., 1983) although this is not universally accepted.
Plomp (1988) argues that fast acting multichannel amplitude compression has a
25 of 208

negative effect on speech intelligibility and the subject has been the source of
considerable debate. Humes et al (1986) also compared conventional linear hearing aids
with 2 channel, wide dynamic range compression (WDRC) aids and used a longer test
period to allow for acclimatisation effects. This research utilised the Connected Speech
Test designed by Cox et al (2001) and found benefits to both types of hearing aid but
with greater improvements being shown using WDRC, particularly for lower speech
levels. Moore and Glasberg (1986) compared the performance of single channel and
two channel compression in hearing aids and found benefits to both but significantly
better results from the two channel system in noisy situations. Barford (1978), on the
other hand, found multichannel compression to have less intelligibility benefits than an
optimally fitted linear hearing aid. It is important to state that the characteristics of these
multichannel aids are tailored to each individual and may therefore be of limited benefit
in developing any ‘hard of hearing output’ for digital television. However, Moore’s
research (2003) does indicate that compression may be beneficial even when not aiming
to match the characteristics of an individual’s hearing loss. There is also some debate as
to whether hearing aids significantly improve understanding of speech on TV, one study
found no significant benefits to intelligibility for older adults using hearing aids
although significant results were obtained indicating benefits for closed captioning
(Gordon-Salant and Callahan, 2009). Various factors were cited for this, one being that
speech on television is simply too degraded for understanding even with hearing aids
used.
Some recent assistive technology approaches for people with hearing impairments take
advantage of the increasing processor power available in mobile devices and three main
approaches are common: hearing enhancement, visual augmentation, and multi-modal
augmentation. Apps such as BioAid and Aud-1 (Clark, 2012) bring hearing aid
technology to the mobile phone and allow users to adjust parameters according their
own needs. Speculation as to the impact of Google Glass for the hearing impaired
community is rife; bone conduction audio could be beneficial for users suffering from
conductive hearing loss and the potential for real-life closed captioning based on
automatic speech recognition has been discussed (Flacy, 2012) although as yet little
research has been done to investigate further. Other approaches take a multimodal
26 of 208

approach with pattern recognition techniques used to identify important or useful events
and generate appropriate displays (Mielke et al., 2013).
2.2.3. The Impact of Multichannel Audio
The Dolby Digital 5.1 surround sound format may in itself bring advantages for hearing
impaired and other television viewers. Some research suggests that there may be some
benefits for television sound by the addition of a central loudspeaker, as is used in 5.1
surround sound systems, compared to a central ‘phantom’ stereo image.
Often, where both 5.1 surround sound and two channel stereo broadcasts take place only
one mix is carried out in 5.1 and an automated down mix used for stereo broadcast.
Increasingly though, the 5.1 mix is the only available broadcasted format and
downmixing occurs at the set top box in the users’ home. It is suggested by Dressler
(Dressler.R., 1996) that the downmix process, whereby a 5.1 surround sound audio
stream is converted for 2 channel playback, may distort the mix in such a way as to
reduce intelligibility by altering “the subjective balance of the mix”. Holman (1991)
suggested that the addition of a central loudspeaker made the material easier to
understand although stated that this may not actually produce greater intelligibility. This
effect, leading to an apparent difficulty in understanding, is a result of acoustical
crosstalk (Holman.T., 1996) that occurs when two identical signals arrive at the ear with
one slightly delayed compared to the other. This produces a comb filtering effect that
cancels out some frequencies in the audio.
Additionally the comb filtering effect has been found to be detrimental to the listening
experience more generally. Commenting on frequency response problems caused by
signal path delays David Clark states that “Clearly the ‘phantom’ center is an entirely
different listening experience than pure left or pure right. One might ask if stereo is
deeply flawed as [a] sound reproduction technique or if interference notches should
simply be ignored” (Clark, 1983 cited in Vickers, 2009a). Impacts for listeners such as
these that go beyond intelligibility mean that considerable efforts have gone into
attempts to remove, or reduce the impact of crosstalk. Methods have been proposed to
reduce the impact of this crosstalk by Cooper and Bauck (1989) and Bauck and Cooper
27 of 208

(Bauck and Cooper, 1992) but these may be impractical in the context of television
viewing as they utilise crosstalk cancellation techniques that rely heavily on the listener
being in the ideal listening position. Clearly in a home environment this is very rarely
the case. Vickers (2009a) recognises this and goes further pointing out that “when the
listener is not equidistant from the speakers, the comb filter peaks and nulls will be in
different frequency locations at the two ears”. The resultant comb filtered perception in
any given location in the room then becomes very unpredictable and impossible to
compensate with additional comb filters. There is some debate as to the specific cause
of intelligibility problems resulting from crosstalk. Bucklein (1981) suggests that
intelligibility difficulties may actually be made worse by peaks resulting from the
crosstalk effect, rather than the troughs, as might be assumed however the underlying
problem remains regardless of which effect of crosstalk is most detrimental. Other
approaches to reduce crosstalk impact have been suggested; decorrelation methods
(Kendall, 1995; Boueri and Kyriakakis, 2004) have been suggested so as to randomise
the effects of crosstalk and so make the effects less prominent, this can be seen as a
signal processing equivalent of relying on room reflections to even out responses, but
others have found artefacts and distortions from these methods which, with musical
content, have manifested themselves as unacceptable timbre change (Augspurger et al.,
1989).
Vickers also suggests a further possibility for defeating crosstalk; by deriving a centre
channel from two channel stereo content which would then be presented as a real, rather
than a phantom, source. He suggests a method for accomplishing this using frequency
domain upmixing (Vickers, 2009c) and provides a useful review of upmixing methods
(Vickers, 2009b). Clearly this would be a useful direction if it was effective as side
channels (L and R) could be reduced with reference to the new centre channel content in
order to improve intelligibility for people with a hearing impairment. His research
suggested that existing upmixing algorithms either provided inadequate centre channel
separation or produced ‘watery sound’ or ‘musical noise’ artefacts (Vickers, 2009b)
although formal subjective testing was not applied to assess this thoroughly (Vickers,
2013). These methods are specifically about spatial decomposition, rather than signal
28 of 208

separation, a different approach which is beyond the scope of this thesis. Goodwin and
Jot (2007) make reference to primary-ambient decomposition in extracting ambient
information from stereo signals using principal component analysis and a variation on
principal component analysis for accessible TV audio is implemented in chapter 6 of
this thesis.
Much of the limited literature around the subject of broadcast audio for hearing
impaired people covers signal processing methods but is speculative as regards the
impact on people, particularly hearing impaired people. There is a substantial gap in the
literature of robust subjective assessment of how such processes affect people with
hearing impairments and this thesis aims to fill some of these gaps.
When carrying out subjective assessments for perceptual aspects such as clarity there is
an issue of the degree that visual cues can influence understanding of test material, in
addition to the intelligibility of the audio information. Grant at al (1998) found great
variability between participants in their ability to utilise audio/visual integration to
improve understanding of material but estimated potential improvements using visual
content of up to 26% in some individuals. Early research by Sumby and Pollack (1954)
indicates that the visual contribution to speech intelligibility increases significantly as
speech to noise ratio decreases. In the VISTA project (Carmichael et al., 2003) a high
degree of ‘speech reading’ was recognised as being attempted by older participants in
attempting to understand an avatar with a synthetic voice, this was partially
unsuccessful owing to lip sync problems although this in itself indicates a degree of
reliance on visual cues for older users. Other research (Beerends and De Caluwe, 1999)
shows biasing in assessments of AV media quality from both audio and visual
interactions. The research indicates that, in their study, quality of visual presentation had
more impact on assessments of audio quality than quality of audio presentation had on
assessments of visual quality. In each case significant influence was demonstrated. For
the audio researcher this is potentially problematic and care must be taken to ensure that
video quality is consistent throughout AV media presentation. Audio quality
assessments should therefore ideally be carried out in audio only conditions. For some
29 of 208

tests however, for example where audio quality may not be the only descriptor under
scrutiny, audio-visual presentation will be necessary and any test procedures
incorporating visual material must also be carefully designed to eliminate any bias
resulting from visual cues in the media.
2.3. Audio for Digital TV Broadcast
As well as these acoustic and psychoacoustic factors a further consideration is the
implementation of international standards in delivering audio for television. This section
gives an overview of systems currently in place in order to present a clearer
understanding of the potential for broadcast standards to provide a workable solution.
The fast paced rate of change of the broadcast television landscape means that standards
and formats have undergone some changes during the research period this thesis covers
and this section also serves to illustrate the continuing relevance of the research to the
current standardisation situation.
2.3.1. Television Audio Systems and Formats
International television standards are covered by a range of standards bodies however
this thesis focuses on standards applying to the UK. Implementation of any
recommendations and guidelines for 5.1 audio produced as part of the research carried
out is equally applicable to other digital television standards although the detail of the
implementation may differ slightly depending on the specific metadata and audio
channel implementation mandated by a given standards body.
Until the introduction of digital TV broadcast all audio for TV in the UK was either
mono or NICAM stereo (ETSI, 1997). Since digital switchover in the UK between 2008
and 2012 an increasing number of options have become available for broadcasters. One
development has been the spread of high definition (HD) TV services, many of which
have been accompanied by 5.1 surround sound. It is this introduction of 5.1 audio that
this thesis takes as its starting point in order to improve TV sound for hearing impaired
people. 5.1 surround sound is therefore the focus of this review of TV standards.
30 of 208

At the time the research documented here commenced the most popular and widely
accepted standard for broadcasting audio with digital HD television in the UK was
AC-3 (Adaptive Transform Coder 3). This standard, developed by Dolby Laboratories,
is mandatory on DVD and HD-DVD, and optional in Blu-Ray disks. AC-3 is also
utilised in digital TV broadcast in many countries including UK satellite broadcasts
from British Sky Broadcasting (BSkyB) and UK cable TV from VirginMedia. During
the course of this research broadcasters in the UK commenced broadcast of terrestrial
HD content which utilises MPEG I Layer II, MPEG I Layer III (ISO/IEC, 1993) and the
AAC and HE-AAC codecs initially developed by Coding Technologies and specified in
ISO/IEC 14496-3 (ISO/IEC, 2006) (The Digital TV Group, 2012). The AC-3 codec is
optional for UK terrestrial HD broadcast but was considered likely to be adopted for
terrestrial broadcast because of its widespread use in satellite and cable broadcast in the
UK (de Pomerai, 2009). AC-3 / E-AC-3 is specified as mandatory by the ATSC
(Advanced Television Systems Committee) A/52B standard (ATSC, 2005) and is
included as an equivalent second audio coding option within DVB (Digital Video
Broadcasting Project) standards. The DVB specification is published by the European
Telecommunications Standards Institute (ETSI) as TR 101 154 (ETSI, 2000).
An interesting feature of Dolby Digital audio is the way in which it deals with relative
levels of speech in programme material. In addition to the audio material itself the
programme stream contains metadata, or data about the audio data, and contains
information used by the decoder in order to effectively decode the transmitted material.
As briefly mentioned earlier the metadata contained in the AC-3 audio stream contains a
value for dialogue normalisation or dialnorm which gives a value for the average level
of speech in transmitted material. According to Dolby Labs Guide to Metadata (Dolby
Labs, 2003), “The consumer’s Dolby Digital decoder reproduces the program audio
according to the metadata parameters set by the program creator, and according to
settings for speaker configuration, bass management, and dynamic range that are
chosen by the consumer to match his specific home theater equipment and
environmental conditions.” “This control, however, requires the producer to set the
metadata parameters correctly, since they affect important aspects of the audio—and
31 of 208

can seriously compromise the final product if set improperly.” One study carried out by
Dolby (Riedmiller et al., 2003) reveals that only 1 out of the 13 digital services
surveyed in one area of the US had set the dialog normalisation value correctly and, as a
result, the audio level for these services varied by as much as 16dB, much higher than
the 7.8dB “comfort zone” found by Dolby in listening tests (Riedmiller, 2005). In the
case of the single example where the dialnorm value was correctly set the appropriate
dialnorm value happened to be the factory set default. Therefore in the study carried out
no TV broadcaster was utilising and setting this value in an appropriate way. This
misunderstanding of the importance and use of broadcast metadata has serious
implications for the implementation of any metadata controlled processing at the set top
box and therefore for the perceived clarity of speech and intelligibility within
programmes, especially, but not exclusively, for people with some hearing loss.
The Dolby Labs decoder specification for the AC-3 audio stream utilises the dialnorm
value in order to apply what it calls Dynamic Range Control (DRC) to the programme
audio. DRC is usually utilised where audio monitoring is via inferior reproduction
equipment which may not manage high dynamic range content appropriately, and also
to enable what is sometimes referred to as ‘midnight mode’. Midnight mode allows
extreme volume levels of sound effects in the sound track to be reduced so as not to
cause disturbance to neighbours for late night viewing without affecting the level of the
dialogue of the programme material. DRC functions by compressing the audio relative
to the level of the dialogue in the audio stream such that levels below the dialogue level
have some gain applied, levels above the dialogue level are attenuated and a null gain
area is retained for dialogue content which remains unchanged. The level at which this
null area resides is set by the dialnorm value. It is clear that any method for improving
speech clarity that relies on metadata being set appropriately in the broadcast and
production chain, such as utilising DRC compression settings, may fail unless
broadcasters take adequate care in setting appropriate metadata values.
As already stated enhancements to the AC-3 standard are contained in the more recent
Dolby Digital Plus standard (DD+ or E-AC-3 (Enhanced AC-3)) (Fielder et al., 2004).
32 of 208

These enhancements, although including the potential for independent control of
channel levels based on metadata, still rely in equal measure on the validity of the
metadata generated by producers and broadcasters.
Where broadcast is in 5.1 surround sound STBs commonly downmix the multichannel
audio in order to enable reproduction on two channel stereo and mono reproduction
systems rather than broadcast a separate stereo mix of the programme. There are two
downmix methods available on Dolby compatible STBs as follows.
Lt/Rt (left total, right total) stereo downmixing capability is found in every Dolby
compliant STB and DVD player and is the default stereo downmix for Dolby compliant
equipment. By implication this means it is the default implementation for the large
majority of surround audio reproduction equipment currently available. The Lt/Rt mix
contains elements of all 5 full range channels; centre channel is sent to both left and
right at -3dB, surround channels are combined into a single surround channel which is
added to left and centre out of phase and to right and centre in phase. LoRo stereo (left
only right only) is normally generated by attenuating and then adding each surround
channel into its respective front channel, Ls to L, Rs to R. Centre channel is added to
left and right at -3dB as shown in figure 2 although the degree of attenuation can be
altered in metadata at the encoding stage.
Figure 2 Derivation of Lt/Rt and LoRo stereo downmixes from 5.1 multichannel audio material.
33 of 208

2.3.2. Future DevelopmentsCurrent use of 5.1 surround sound in broadcast is likely to be predominant for some
time to come as broadcasters and broadcast manufacturers have invested substantially in
infrastructure developed around these formats. Test broadcast in Japan utilizing a 22.2
audio system suggest that an increased number of channels may be one route forward as
high bandwidth connectivity becomes more widespread. Any such system would
certainly be accompanied by similar metadata that could be utilized in the same way as
any accessible audio system developed for 5.1. Another possibility is that object based
audio may replace channel based audio as a broadcast audio standard. Object based
audio treats individual sound sources as discrete objects with coordinate locations,
regardless of reproduction system, and developments from companies like DTS,
Fraunhofer, Dolby and others suggest that this may become more mainstream although
not in the short term. This is covered in more depth in chapter 7 of this thesis.
2.4. Psychoacoustic Test Methodology
In order to design appropriate test methods to assess the viability and effectiveness of
processes and conditions for TV audio it is firstly important to be clear on definitions of
what is being assessed. At this stage a distinction is drawn between intelligibility of
speech and clarity of speech. Within this thesis the term ‘clarity’ is defined as perceived
clarity, i.e. a measure of how clear the speech appears to be to a listener. Intelligibility
will be used to refer to a measure of how well speech can be understood and assessed
either by correct identification of words or by comprehension of the meaning of phrases
or sentences. Although there are clear similarities between these terms and many
instances in literature where each are used interchangeably there are some examples
where processed speech can appear clearer and yet be no easier to understand
(Carmichael, 2004) so the distinction is an important one. The relationship between the
two factors would be expected to be close in most cases however using the descriptor
‘speech clarity’ could be expected to be more influenced by other factors such as the
more ambiguous ‘quality’ than the more objective, score based measure of
‘intelligibility’. Similarly, the effect of each factor on user experience more generally
34 of 208

could be expected to be similar however there are circumstances where this may not be
the case. A completely isolated speech channel would undoubtedly produce better
intelligibility ratings but the complete absence of music and sound effects important to
scene comprehension may produce poorer ratings for enjoyment for some AV media
with some participants.
In designing subjective assessments for audio conditions it is critical to understand the
nature of the data or information required that will allow the most useful analysis. For
this thesis the use of quantitative methods combined, where appropriate, with objective
measurement of conditions has been used. This approach has however been informed by
informal semi-structured interviews with participants in the research. The outcomes of
the interviews have not been used to derive clear research conclusions but instead have
been used to gain some insight into why particular results may have been obtained and
to inform the development of test methods used during the research.
Zielinski’s review of biases in audio listening quality tests identifies much of the
potential for gaining meaningless or misleading data from listening tests (Zielinski et
al., 2008) and all of this is relevant in the design of tests during the research presented
here. The biases identified include recency effects, listener expectations and
preferences, stimulus related biases such as uneven frequency of presentation, scale and
range related biases and biases resulting from the appearance of the experimental
interface.
The nature of research involving hearing impaired participants mitigates against the
adoption of standard test methodologies used for audio assessment and also creates
substantial challenges for the researcher. When discussing listening tests for
loudspeaker assessment Toole (1985) identified a number of what he called ‘nuisance
variables’ that could cause large variability in subjective assessments, these were split
into those associated with the listening environment, those related to the listeners
themselves and those related to experimental procedure or test design and are presented
35 of 208

here in order to assess the ‘nuisance variables’ that can and can not be excluded from
the research documented in this thesis.
Toole’s ‘Nuisance Variables’
Listening environment factors:
• Listening room
• Loudspeaker position
• Relative loudness (of compared sounds)
• Absolute loudness (of all sounds)
• Program material
• Electronic imperfections
• Stereo (peculiar technical problems)
Listener factors:
• Knowledge of the products
• Familiarity with the programme
• Familiarity with the room
• Familiarity with the task
• Judgement ability or aptitude
• Hearing ability (physical impairment)
• Relevant accumulated experience
• Listener interaction and group pressure
• Stereo (conflicts between spatial and sound
quality aspects of reproduction)
Experimental Procedure:
• Identification of perceptual dimensions
• Scaling of the perceptual dimensions
• Anchoring or normalisation of individual
scales
• Effects of context and contract
• Effects of sequence and memory
• Experimenter bias
36 of 208

(Toole, 1985)
Clearly there are considerable challenges for the researcher in assessing audio
reproduction conditions using subjective test methodologies. Listening tests
documented in international standards have the advantage that where the potential for
biases exist, they are well understood and can therefore be mitigated against to a large
degree. For subjective assessment of audio systems with hearing impaired participants
there is considerably more potential for unpredicted biases to appear and great care must
be taken in developing test methodologies for this group. Perhaps unsurprisingly most
research into improving TV sound for hearing impaired people has focused largely on
signal processing methods and carefully controlled subjective assessments with hearing
impaired participants have been rare. This thesis aims to fill some of these gaps and
develop robust test methods for assessments of potential answers to the problems that
hearing impaired people experience in viewing TV in their homes.
37 of 208

3. The Clean Audio Project Phase 1: Non-Speech Channel Attenuation
This chapter is based on research largely funded by the ITC and then by Ofcom. The
research investigated the problem of TV audio for hearing impaired viewers and
potential solutions that could improve their experience of TV audio. Within the chapter
the use of production guidelines is discussed, Dolby Digital metadata is discussed as a
means of conveying information to the receiver, the effect of attenuating non-speech
channels in a surround sound system is evaluated and a review of test procedures is
carried out in the light of the results obtained in order to identify biases and inform
future test design.
3.1. Introduction
Although many complex solutions have potential to improve TV sound for hearing
impaired people, the potential for metadata to enable independent control of channel
levels makes the need for an investigation into the impacts of reducing non-speech
channels on both clarity and perceived sound quality clear. The fact that most hearing
impaired viewers watch television on a shared television set makes it critical to
understand the effect of this processing on listening pleasure, or perceived sound quality
for both hearing impaired and non-hearing impaired people.
Some of this research has been published in the Technology and Disability journal
article, The ITC Clean Audio Project (Shirley and Kendrick, 2006) on which this
chapter is based.
3.2. Aims of Clean Audio Phase 1
The aims of Clean Audio phase 1 as agreed with the research funders (Independent
Television Commission) were as follows:
• To assess the effect of attenuating left and right channels in a 5.1 surround sound
system for hearing impaired viewers.
• To assess any benefits of 5.1 surround sound compared to downmixed stereo.
• To assess the effect of this remix for non-hearing impaired viewers.
38 of 208

• To produce recommendations for hard of hearing viewers as to how they may
improve their viewing experience.
• To produce guidelines for broadcasters.
3.3. Methodology
The test methodology chosen was a two way forced choice comparison and participants
assessed audio-visual media, rather than audio only. This choice of test method
introduces a number of potential issues for the research however, on balance, other
possible methods were rejected. A summary of these choices and rationale is as follows.
3.3.1.Audio-Visual StimuliIn most assessments of audio quality and in standard test methodologies audio is
assessed in isolation and for good reason. As has already been discussed in section 2.2.3
visual material can have a significant effect on the ratings of audio quality. It was also
considered likely that some degree of lip reading may also have an impact. However in
these tests a further descriptor of the media was being assessed beyond audio quality. It
was considered important that the tests also assessed hearing impaired and non-hearing
impaired participants’ enjoyment of the media overall as this would be a critical factor
in viewers’ acceptance of any recommendations developed form the research. It was
also considered critical that participant’s experience of the audio-visual media in the
tests mirrored as closely as possible their experience of TV in the home. For these
reasons test presentation was of AV media.
3.3.2.A/B Comparative TestsAn option considered during test design was to use a variation on MUSHRA (ITU,
2003) test methods. The MUSHRA test design typically presents the participant with a
selection of media clips simultaneously and the participant is permitted to switch
between conditions at will. Each condition is rated using a descriptor scale. This type of
presentation that allows the participant to take control of the order of playback of the
conditions is useful for assessments of intermediate audio codec quality in that it
reduces the impact of the recency effect noted by Zielinski et al (2008). A disadvantage
of this method becomes apparent when presenting material that varies substantially over
time. For the clips used speech was not constant throughout the duration of the clip.
39 of 208

Inevitably the AV material utilised in the tests had sections where no person was talking
and some sections with clearer speech than others. It is likely that a participant could
inadvertently switch between sections such that one condition had substantially more
clear speech than other conditions and so produce an unknown variable in to the test
procedure. Utilising an AB comparison test was considered to allow more control over
unwanted variables because the impact of recency effect could be factored out by
randomisation of presentation order and by maximising section equivalence across the
section duration. Avoiding more than two stimuli would also assist in reducing the
centering effect discussed in Zielinski et al’s review of listening test biases. The
centering effect refers to a tendency for subjective assessment scores from multiple
stimuli to vary such that the mean of the scores of all stimuli tends to the mean of the
score data. The effect has been shown to be reduced by not using multiple stimuli .
3.3.3.Forced Choice ComparisonA variation of the CMOS and CCR scaled paired comparison methods (ITU, 1996) was
used for the tests. The tests used a forced choice comparison in order to present a rating
of ‘how much better’ rather than a continuous scale between stimuli A preference and
stimuli B preference (as would be the case for CMOS testing) so that the centre point,
where the stimuli were the same, was not visible. Additionally previous scores were
presented on separate sheets and were not visible while subsequent judgements were
being made by participants thus removing any visual cues that may encourage
centering. This was considered likely to further reduce the centering effect.
3.3.4.Other Test Design FactorsThe challenges for the researcher carrying out subjective testing involving hearing
impaired participants become clear when considering Toole’s extensive list presented
earlier and although many of the ‘nuisance factors’ were able to be excluded from tests
in this research, some could not, and for this reason care needed to be taken to ensure
validity of test results.
The subjective assessments presented in this thesis were carried out in a listening room
conforming to ITU-R BS1116 therefore factors stemming from the listening room
acoustics and loudspeaker positions were of limited concern. Great care was taken in
40 of 208

ensuring that relative reproduction levels between conditions tested were consistent,
however because of the nature of the people participating in tests, absolute loudness was
unavoidably variable from participant to participant. Preferred loudness levels between
participants varied by as much as 21dB; those with severe hearing loss required
loudness levels that would be uncomfortable, if not painful, for participants with mild or
no hearing impairment. For this reason it was necessary for participants to conduct
assessments individually and no attempt was made to carry out group subjective
assessment. This mitigated against the problem of listener interaction and group
pressure although added considerably to the time taken to run listening tests.
Considerable care and time was invested in identifying appropriate equivalent
programme material for tests - an extensive review of test methods has been carried out
to attempt identification of biases by studying test outcomes with regards to analysis of
programme material. In order to avoid sequencing and memory biases, these were then
presented in a pseudo-random manner ensuring that clips and processes were both
presented A-B an equal number of times as B-A for each subject. Also every condition
was tested an equal number of times with each media clip. Participants were
appropriately briefed by use of a standard script in order to avoid inadvertent
experimenter bias and were trained in the task with test examples prior to commencing
assessments. Perceptual dimensions, and the interface and scales on which these were
graded, were carefully chosen to make clear exactly what was being assessed at any
given time and to ensure the tests were as simple as possible to understand from the
participants’ perspective. There were however factors identified by Toole that could not
be removed from the assessments. Participants did not have ‘normal hearing’ and there
was no consistency of hearing impairment between participants. Many of the
participants were older people and did not feel comfortable working directly with a
computer interface so programme selection and condition switching was carried out by
the researcher under instruction from participants who marked results on paper instead
of putting the subject in full control of playback and choice of condition. Despite this,
wherever possible, experimental procedures were automated using control software in
order to avoid experimenter error. Also, although an anchor or reference item was
41 of 208

inappropriate for most of the conditions under assessment6, presentation was designed
as far as possible to avoid the centering effects discussed by (Zielinski et al., 2008). It
was clearly understood that the outcomes from tests would be relative measures of
perceptual scales between conditions rather than absolute measures of any given factor
under test and no attempts were made to attempt absolute measures using the data.
Where possible existing and proven test methods were adapted however none of the
existing test standards were considered applicable for adoption in its entirety. For
example the need for hearing impaired participants meant that there were no ‘expert
listeners’ as required by ITU-R BS.1116 (ITU, 1997). The ITU standard states that, “It
is important that data from listening tests assessing small impairments in audio systems
should come exclusively from participants who have expertise in detecting these small
impairment”, and that, “An insufficiently expert subject cannot contribute good data”.
This would effectively exclude all hearing impaired participants who were, after all, the
focus of the research therefore great care had to be taken to control all other potential
effects that may influence experimental data. Standard and uniform reproduction levels
specified in listening test standards are also inappropriate for this research because of
variation in the hearing acuity amongst participants. The ITU-R BS.1116 standard is
aimed at detecting ‘small impairments’ in audio systems and much of the research
documented here is about comparing features of reproduced sound for which was
usually no ‘reference’ that would be expected to be graded better than other processes.
This also excluded ITU-R BS.1534 (MUSHRA)(ITU, 2003) testing which requires an
unprocessed reference condition where other conditions are graded with reference to
this unprocessed audio. In the case of improving audio for hearing impaired people the
reference unprocessed condition is quite likely to be graded lower than processed
conditions thus negating its benefits as an anchor.
42 of 208
6 Typically an anchor reference of known quality - either good or bad - will be used in detecting impairments in audio systems in order to stabilise ratings scales and also to identify ʻoutliersʼ considered insufficiently capable of identifying differences between conditions. For the research presented in this thesis the aim is to improve perceptual factors from the reference position and no reasonable justification could be constructed for any given reference for a group of test participants with differing hearing abilities and impairments.

There is a further issue to be addressed regarding the listening conditions for hearing
impaired people. Participants stated whether they watched TV with or without their
hearing aids in place and answers were mixed. For example some preferred not to use
their hearing aids at all at home, others used hearing aids so that the TV did not have to
be too loud for other members of the family. In order to assess the impact of varying
reproduction conditions and processes on home viewing of material the decision was
made that participants in the research would experience the audio in the way that they
would normally experience television audio. If they normally wore a hearing aid to
view TV, they could wear their hearing aid for the tests. If they would normally remove
the hearing aid to view TV they were asked to do the same prior to tests commencing.
The decision to allow hearing impaired participants to wear hearing aids for the tests
inevitable introduces some additional ‘nuisance variables’ in itself. Each participant’s
hearing aid would be calibrated differently each participant will then be hearing
something different from the others. The impact of these nuisance variables was
considered closely however other factors influenced the decision. The fact that each
participant had a different hearing impairment meant that each was already hearing a
different cue for the same condition, the impact of wearing an aid was considered to not
make this significantly worse. Some participants’ hearing was so impaired that without
an aid they were unable to gain any meaning from the speech in any condition. Also, the
aim of this research is to make a difference to peoples’ experience of TV audio in their
homes. Because substantial numbers of people wear aids to watch TV any solution
developed by the research had to work for these viewers, for these reasons it was
decided that the benefits of allowing hearing aid use outweighed the disadvantages.
Listening tests took place in a listening room that conformed to ITU-R BS.1116-1
Methods for the subjective assessment of small impairments in audio systems including
multichannel sound systems (ITU, 1994a) and ITU-R BS.775-1 Multichannel
stereophonic sound system with and without accompanying picture. (ITU, 2006)
Equipment used:
• DVD Player
• Digital Audio Mixing Console
• Dolby DP562 Reference Decoder
43 of 208

• 3 x Genelec 1029 Active Monitors
• Kamplex BA25 Audiometer
Tests were carried out with each subject utilising the same test material on the same
day; these took the form of forced choice paired comparison assessments for each
condition. An audiogram was carried for each subject in order to assess the hearing
acuity of the test panel and to gauge the degree and nature of each subject’s hearing
impairment. Assessments carried out in this phase of the research were aimed at
assessing dialogue clarity, overall sound quality and enjoyment of clips of AV media
across a range of material. It was considered important that clips used for each condition
should be equivalent to those used for each other process in order to avoid choices being
based on the clip, rather than the process under assessment. Playback of the same clip
for each condition was considered however this was thought likely to be detrimental to
the tests for the following reasons:
• Assessment of the clarity of speech within a section would be biased if the
section had already been viewed and the speech content was therefore known to
the subject.
• Subject fatigue would be increased by repetitious viewing of the same clip.
Pilot experiments using identical clips to identify appropriate volume levels showed the
former concern to be well based. When presented with the same clip for each process
participants consistently set the volume level highest for the first condition played and
lowest for the last regardless of the order of the conditions. In order to avoid this
impacting on and biasing results consecutive clip sections were utilised for all tests.
As far as possible the differences between the sections were minimised by using two
sections within the same clip and utilising clips where the two sections are very similar
in terms of scene, type and amount of background noise and in the identity of the person
speaking.
The clips were played from DVD and visual cues were used to indicate the start of a
new clip and which section was being played. The visual cue consisted of a black screen
44 of 208

with a title giving the clip or section number. The use of an audio cue was tested (a short
steady tone) in addition to the visual cue to separate the two clip sections. Six pilot tests
were carried out in order to identify any potential biases and also to identify any
potential technical problems with the method and apparatus used for the tests. After
some experimentation it was noted that the addition of the audio cue was distracting and
hindered the participants’ auditory memory of the previous section. Results were
inconsistent and participants stated that they found the tone to be a distraction and an
annoyance which they thought was preventing them from remembering the previous
clip’s audio qualities. Instead of using an audio cue, the duration of the visual cues
(black screen with white text label) was increased to ensure that the change in sections
remained noticeable but that the distracting tone could be removed.
An analysis of the test material was carried out subjectively with respect to the loudness
of background sound and music compared with the dialogue in order to choose clips
that were broadly equivalent. The amount of dialogue spoken off-camera and facing
away from camera was also measured by counting words spoken when the speaker’s
mouth was visible compared to when it was not although it was not possible to identify
clip pairs with an identical, or close to identical, proportion of face-to-camera dialogue.
Participants were asked to watch excerpts of video material with a Dolby Digital 5.1
encoded soundtrack. Each excerpt was split into two similar sections with a different
condition being applied to each section. The subject was then asked to assess which of
the two sections was preferred based on three criteria:
• Overall sound quality.
• Their enjoyment of the section.
• The clarity of the dialog.
Participants were also asked to show how much better their preferred section was for
each of these criteria. There was no option for the two sections to be assessed as being
the same. All AB and BA comparisons were assessed by each subject, with the order of
45 of 208

the conditions changed for each subject so ensuring that every process was carried out
on every video clip. An example answer sheet can be seen in Appendix D
3.3.5. Interviews with Participants
During the process of carrying out test procedures, and in order to gain maximum
benefit from access to substantial numbers of hearing impaired people, further work was
carried out to try and gain some insight into the experience of hearing impaired people
as TV viewers. In addition to measured and controlled tests, informal interviews with
participants were carried out between tests. These interviews were useful in order to
give some insight into the issues considered most important by hearing impaired people
and in order to identify any potential biases in test results.
3.4. Test Material
The test material consists of a series of 20 video clips with a Dolby Digital 5.1
soundtrack. Each clip was split into 2 sections and each section treated with a different
process on playback. To this end it was considered important that the amount and type
of side channel audio was consistent throughout the clip so that like was compared to
like.
Clips were introduced by a title reading “Clip x” (where x was the number of the clip),
each section of the clip was introduced with a 3 second title reading “Section A” or
“Section B”.
Clips were chosen according to the following criteria:
Criteria DetailsLength Between 1 min and 1 min 30 secondsAmount of side channel noise
Clips chosen have moderate side channel audio that could possibly mask sounds in the dialogue channel.
Type of side channel ‘noise’ A variety of types of side channel audio including background speech, music and sound effects.
Mix of off-camera and on-camera speech
Consistent amount of face to camera dialogue between clip sections in order to avoid results being biased by lip reading
Table 2 Criteria used to choose appropriate video clips for subjective tests
It was thought important in choosing the clips that each clip should appear to be
complete in itself, i.e. at the end of a clip the subject matter is brought to some sort of
46 of 208

conclusion. This was seen as important in order to give some meaning to the
‘enjoyment’ factor for each section/process combination and in order to reduce
potentially irritating breaks in the video sequences. Within this limitation, the length of
each clip was standardised as far as possible.
Clips were chosen with a moderate amount of different types of background, side
channel audio. The background audio included speech, music and sound effects. A
complete listing of the clips used is included in Appendix B.
All of the paired forced choice comparison tests were carried out with levels calibrated
in order that the overall A-weighted sound pressure level was identical.
3.5. Analysis of Participants
The group was composed of 41 participants with a range of ages and hearing
impairments ranging from profoundly deaf (with cochlear implants) to non-hearing
impaired. The profile of participants was as follows.
3.5.1. Profile of Hearing Impairments
The level of hearing impairments as measured by pure tone audiogram can be seen in
figure 3.
!"#
!!#
!$#
!#%#
!"#$%&'()*+#%$*"&,(-.(/01(
&'()*+,-./01#
2.31#
2'10/-40#
5060/0#
7/'8'9(1#
Figure 3. Ratings of participants’ hearing impairment by pure tone audiogram according to categories
47 of 208

defined in (British Society of Audiology, 1988)
The accepted definitions of degrees of hearing loss in the UK are categorised by the
hearing acuity of a persons best ear (British Society of Audiology, 1988) however
within the subject group for this listening test there were 5 participants with asymmetric
hearing loss who, although classified as ‘non-impaired hearing’ by this definition, had
substantial hearing loss in one ear. As these participants had self-reported that they had
hearing loss and also that they had difficulty understanding speech on TV, and as their
asymmetric loss was substantial, these participants were considered as ‘hearing
impaired’ for the purpose of data analysis.
3.5.2. Setup and Calibration
Equipment setup was as follows:
The subject’s chair, the reference monitors and the television were placed in the ideal
listening positions according to the ITU-R BS.775-1 multi-channel stereophonic sound
with and without accompanying picture (ITU, 1994) recommendations. Control
equipment was situated at the back of the listening room with the operator out of sight
of the viewer. The digital S/PDIF output from the DVD player was converted to AES/
EBU standard using a converter and connected to the AES/EBU input on the Dolby
Reference Decoder. Three outputs from the decoder are used: left, centre and right. Left
and right channels are fed into 3 separate channels on the mixer, centre channel to one
other. One channel was used for each required output level enabling the levels to be
changed by muting and un-muting channels. Each channel was then routed, via the
internal busses of the mixer, to one of three bus outputs, each of which was connected to
the corresponding monitor. All of these faders could be grouped together so that the
initial reference volume level for each subject could be adjusted using a single fader.
In order to minimise the possibility for human error during the testing procedure the test
was designed to be as automated as possible. Level setting for each subject was
accomplished by developing some simple control software capable of sending MIDI
controller information in response to experimenter input. The software was used to
48 of 208

accept the input from a mouse wheel and used to produce MIDI messages that could be
used to alter the output level of the group busses and therefore the input to the
monitoring equipment. In this way each subject was able to set their own preferred
listening level at the start of the tests without any possible bias from the test
administrator and without any clear maximum or minimum levels.
During preliminary testing with 3 participants it became apparent that the overall sound
pressure level (SPL) was being altered considerably by each process and with it, the
subject’s perception of what was the ‘best’ section. Many repeatable listening tests have
shown that there is a significant bias toward audio with a higher sound pressure level
(Nousaine, 1991). For this reason it was important that the overall sound pressure level
remains constant for all of the AB comparison tests.
In order to ensure that this was the case, a test DVD was burned which consisted of pink
noise on the three front channels. The A-weighted sound level was measured for the
lowest level process and the overall bus output levels from the mixing console altered
by the software to ensure that each of the other processes was heard at the same sound
level for every test.
A challenge presented in this listening test design was that, unlike with expert listening
panels called for in listening test standards, participants had varying degrees of hearing
loss and no single listening level was likely to be appropriate for all participants. In
order to mitigate this issue participants were asked to set a comfortable listening level
for the unaltered reference LCR condition at the start of the tests and were not permitted
to alter this level for the duration of the test. All conditions for that subject were then
played back at this reference level.
3.6. Experimental Results
Normally where anchor points are not used it is recommended to that data should be
normalised (ITU, 1998) and as previously discussed no reference anchors were
appropriate for these tests. Participants’ data was therefore normalised according to the
procedure documented in Appendix H. The impact of this normalisation on results was
49 of 208

an improved level of significance when compared to a simple score of how many times
a condition was preferred. The research was intended to assess changes in the
perception of programme material for three factors: speech clarity, overall sound quality
and enjoyment. The same participants experienced all conditions that were assessed
making a series of one way repeated measures ANOVAs appropriate in order to identify
whether there were any significant differences between the mean ratings for each
criteria. Therefore a series of one way repeated measure ANOVAs were carried out for
clarity, overall sound quality and enjoyment ratings. The key to processes tested is as
follows:
LCR Centre channel, plus left and right channels at standard relative levels set using
reference tones.
LCR1 Centre channel, plus left and right channel at -3dB.
LCR2 Centre channel, plus left and right channel at -6dB.
C Centre channel only.
LR Lt/Rt Stereo downmix.
A marked statistical significance at p<0.05 was found for most of the combinations
tested with the hearing impaired subject group. The non-hearing impaired results
showed less significance, probably as a result of the lower number of participants; only
speech clarity results were statistically significant for this group based on a repeated
measure ANOVA.
Analysis of speech clarity ratings indicate a trend for both groups that reducing non-
speech channels improved the perceived clarity of speech within clips. Statistically
significant findings show that for both hearing impaired and non-hearing impaired
groups centre channel only (C) and LCR2 were both judged as having clearer speech
than the LCR reference condition. All conditions were considered to have clearer speech
than LR (Lt/Rt stereo downmix) across both groups. However no statistical significance
was shown in comparisons between LCR and LCR1 or between LCR1 and LCR2.
50 of 208

Additionally there were no statistically significant results in comparisons between LCR1
and C or between LCR2 and C.
For the hearing impaired group, when considering the LCR, LCR1, LCR2 and C
conditions as following a trend of increased non-speech channel reduction, no
significance was shown for adjacent processes (ie between LCR and LCR1, LCR1 and
LCR2, LCR2 and C) although for all non-adjacent conditions, where there was a greater
change in speech to non-speech ratio, significance was unambiguous. In each case the
process with more speech and less competing sounds in side channels was preferred as
having higher overall sound quality. So LCR2 and C were rated more highly than LCR
and C was rated more highly than LCR1.
For ratings of enjoyment of clips under each reproduction condition there were no
significant results for the non-hearing impaired group and no conclusions could be
drawn for this group.
For the hearing impaired group results followed a similar trend to that of overall sound
quality results: C was found to be more enjoyable than LCR and once again every other
process was rated more highly than LR.
3.6.1. Hearing Impaired Results
!"#$%
!"#&%
!"#'%
"%
"#'%
"#&%
"#$%
()*% ()*+% ()*'% )% (*%
!"##$%&'()*+,-&
51 of 208

!"#$%
!"#&%
!"#'%
"%
"#'%
"#&%
"#$%
()*% ()*+% ()*'% )% (*%
!"#$%&&'()*+,'-*%&./0'
!"#$%
!"#&%
!"#'%
"%
"#'%
"#&%
"#$%
()*% ()*+% ()*'% )% (*%
!"#$%&'"()
Figure 4 A, B & C Rating of speech clarity, overall sound quality and enjoyment for each condition by hearing impaired participants with error bars indicating 95% confidence level
3.6.2. Non-Hearing Impaired Results
!"#$%
!"#&%
!"#'%
"%
"#'%
"#&%
"#$%
()*% ()*+% ()*'% )% (*%
!"##$%&'()*+,-&
Figure 5 Rating of speech clarity for each condition by non-hearing impaired participants with error bars indicating 95% confidence level
52 of 208

3.7. Significance of Results
3.7.1. Hearing Impaired Participants
3.7.1.1. Significance: Speech Clarity
Table 3. P-values for each pairwise comparison for speech clarity ratings, highlighted values indicate statistical
significance at p<0.05
3.7.1.2. Significance: Overall Sound Quality
Table 4. P-values for each pairwise comparison for overall sound quality ratings, highlighted values indicate
statistical significance at p<0.05
3.7.1.3. Significance: Enjoyment
Table 5. P-values for each pairwise comparison for enjoyment ratings, highlighted values indicate statistical
significance at p<0.05
53 of 208

3.7.2. Non-Hearing Impaired Participants
3.7.2.1. Significance: Speech Clarity
Table 6. P-values for each pairwise comparison for speech clarity ratings, highlighted values indicate statistical
significance at p<0.05
No overall significance was found for the non-hearing impaired group for overall sound
quality or for enjoyment using a repeated measures ANOVA.
For the hearing impaired group ratings for clarity, overall sound quality and enjoyment
appeared to be closely related and the Pearson correlation coefficient for each rating
combination was calculated to assess this factor. Table 7 shows the Pearson correlation
coefficient of each combination, each of these is a statistically significant result at
p<0.05. Although it could be argued that the correlation between these factors could
have been an artifact of ratings being collected together the fact that there was no
correlation between rating descriptors for the non-hard of hearing participants suggests
that this was probably not the case.
Table 7. Correlation coefficients between scales for hard of hearing listeners, shaded cells indicate significance at
p<0.05.
54 of 208
3.8. Discussion
3.8.1. LCR, LCR1, LCR2, C
In each case where statistical significance was found the clarity of the dialogue was
perceived by both groups as having improved when the side channel levels were
reduced by 6dB or more. For the hearing impaired group ratings of their enjoyment of
the clips, and of the perceived overall sound quality, followed the same trend as for the
perceived clarity of the dialog. For the non-hearing impaired group there was no overall
significance to the ANOVA results for overall sound quality or for enjoyment.
3.8.2. LR (downmixed stereo)
This process scored significantly lower than any other in this test, speech was
considered to be less clear than any other process by both groups, it was perceived to
have a lower overall sound quality and to make clips less enjoyable compared to every
other process by the hearing impaired group.
There are two possible explanations for this consistently poor rating of the LR condition
for each rating scale where significance was shown. The poor rating of the stereo
downmix may be as a result of the downmix process where the 6 channels in the AC-3
audio stream are remixed for 2 channel stereophonic reproduction. As has been
discussed earlier, two types of downmix are specified by Dolby Labs, these are known
as Lt/Rt (left total, right total) and LoRo (left only, right only) (Dolby Labs, 2003). Both
downmixed formats are derived from a mix of all 5 full range channels including left
and right rear surrounds. Lt/Rt is the default output for all current consumer devices and
so was the chosen downmix format for these tests, LoRo, also defined by and
sometimes referred to as the ITU downmix (ITU, 1994a), is the downmix that is
specified for use where derivation of mono signals is required. The inclusion of rear
surround information in this mix reduces the relative level of the centre channel, usually
used for dialogue, and so was very likely to affect the clarity of the dialogue compared
to the other conditions, none of which include rear surround audio. This could explain
the relative perceived lack of clarity in the stereo mix, however if this were the only
55 of 208

factor one might have expected non-hearing impaired participants to rate Lt/Rt stereo
more highly for overall sound quality and enjoyment.
Although this result could perhaps have been predicted the default Lt/Rt derived two
channel stereo provides a useful reference between what a viewer may be listening to
now, and what improvements could be possible with surround sound equipment set up
with a hearing impaired output derived from remixing the 5.1 channel audio at the STB.
For the hearing impaired subject group, perceived overall sound quality and enjoyment
was shown to be directly correlated with the clarity of dialogue. The ratings of the other
processes indicate that hearing impaired viewers may benefit from reducing the level of
lest and right channels, maximum benefit being gained by muting side speakers entirely.
For the non-hearing impaired subject group although clarity was enhanced by reducing
surround channel levels, this did not result in any statistically significant response to the
perceived sound quality and enjoyment of the material.
The most striking result from the tests therefore was the low rating of the Lt/Rt stereo
downmix when compared with all other conditions.
3.9. Analysis of Test Procedures
3.9.1. Introduction
When conducting subjective listening tests it is important to remember that there is
unlikely to be a perfect experiment that will give conclusive, yes/no answers. Inevitably
variables other than those being tested will influence results. Because of this it was
considered important to review test procedures and material for these first tests using
the data gained in order to attempt an analysis of any unpredicted causal effects. In
designing these tests as many of these imperfections were taken into account as
possible. For example, the clips and processes were rotated so that every clip was tested
with every process, clips were chosen to be as similar as possible and each pair of
processes was tested in A/B and B/A order to minimise any effect caused by the order of
processes. It is recognised however that these measures may be only partially
successful. This section is intended to enable improved test design for future work in
56 of 208

this area and describes factors other than the conditions applied to the media that had an
effect on the results.
3.9.2. Clip Dependency
Two factors that can defined as clip dependency were found to be influencing the choice
of participants considerably: the order of the clip playback, and visual cues to the
meaning of dialogue.
3.9.2.1. Playback order
Although it was anticipated that the order of the processes would have some effect on
subject preference, the degree to which this affected results was unforeseen. The
following three graphs (figures 12 to 14) show the percentage that section A was chosen
over section B for each clip used, it clearly shows a marked preference for section B for
most of the clips.
Clarity
Figure 6. Percentage of preferences for clip A or B for speech clarity
Quality
Figure 7. Percentage of preferences for clip A or B for overall sound quality
57 of 208

Enjoyment
Figure 8. Percentage of preferences for clip A or B for enjoyment
0
10
20
30
40
50
60
70
A B
% p
refe
renc
e
A / B
A / B % Preference
Figure 9 Overall preferences for clip A or B showing recency effect
The effect of this preference for section B was more pronounced among the hearing
impaired participants although was marked for both groups (as shown in figure 9). A
number of the hearing impaired participants commented that it often took most of the
first section to get used to the accent of the actors and to “blank out” the background
effects or music. This meant that they found section B considerably easier to understand
and led to the higher preference for section B. The fact that this tendency was so
prevalent with both groups suggests that there are other factors leading to a preference
for the most recently heard section. One potential contributing factor is the so called
‘recency effect’ discussed in (Zielinski et al., 2008). In the tests carried out the order of
the processes was arranged in order that processes were played first and second an equal
number of times in order to avoid this effect biasing results. It is likely however that this
58 of 208
unwanted variable caused some statistical ‘noise’ and so reduced the statistical
significance of the results.
3.9.3. Analysis of Test Material
An analysis of the test material was carried out with respect to the type and loudness of
background noise and the amount of dialogue spoken off-camera and facing away from
camera compared to dialogue spoken where the speaker’s mouth was visible. Some
results of this analysis are shown in Appendix C.
3.9.3.1. Visual Cues
It was considered likely that, consciously or unconsciously, people would be using
visual aids to help their understanding of the dialogue; this might have included such
factors as lip reading and gestures. In order to see how this impacted on the test, graphs
in Appendix C are used to show a comparison of the clarity of each clip and the
percentage of time the speaker was facing the camera. An analysis was carried out to
assess the impact of this on participants’ rating of each clip. This was carried out for
non-hearing impaired, and for hearing impaired participants. The graphs show that there
was a tendency for participants with hearing impairments, especially moderately
impaired hearing, to choose the section with the most ‘face to camera’ dialogue. This
was only true, however for analysis of section B (the second section shown in each
paired comparison). It is unclear why this should apply more to the most recently heard
section however it may be an indication as to how much the bias against section A has
reduced the significance of some of the data gained. Interestingly, when questioned on
this, most participants were unaware of their reliance on visual cues in understanding
the dialogue.
The Pearson’s correlation coefficient of the percentage of total preferences for a clip for
clarity against the percentage of on-screen dialogue for the second section viewed only
was calculated as 0.545 indicating a significant correlation between the two factors
(p<0.05). A graph indicating the relationship is shown in figure 10 for all participants
across all section B clips. For section A (shown in figure 11) Pearson’s correlation
coefficient was calculated as -0.102 with no significance at p<0.05.
59 of 208

!"
#!"
$!"
%!"
&!"
'!"
(!"
)!"
*!"
+!"
#!!"
!" #!" $!" %!" &!" '!" (!" )!" *!" +!" #!!"
!"#$%&%$%$$%'
"
!"(#%%)*"+,")-.%$-"
/$%&("0("(#%%)*"+,")-.%$-1"(%)2,3"4",356"
Figure 10. Scatter chart of percentage of on-screen dialogue against the percentage of times that clips were preferred for dialogue clarity across section B only (the most recent section heard)
!"
#!"
$!"
%!"
&!"
'!"
(!"
)!"
*!"
+!"
#!!"
!" $!" &!" (!" *!" #!!" #$!"
!"#$%&%$$%'
"
!"(#%%)*"+,")-.%$-"
/$%&("0("(#%%)*"+,")-.%$-1"(%)2,3"4",356"
Figure 11. Scatter chart of percentage of on-screen dialogue against the percentage of times that clips were preferred for dialogue clarity across section A only (the first section heard)
Correlations for dialogue clarity and percentage of on-screen dialogue broken down by
participants’ degree of hearing impairment can be found in Appendix J.
This effect was considered to be unavoidable when using existing visual test material.
60 of 208

For hearing impaired participants enjoyment was strongly linked to the percentage of
speech-to-camera with a Pearson correlation coefficient of around 0.523 (p<0.05)
compared with a weaker, but still significant, correlation of 0.335 for speech clarity
(p<0.05). This can perhaps be seen as a result of the fact that when asked, most hearing
impaired participants were unaware that they were using lip reading at all during the
tests. It could be hypothesised that for ratings of speech clarity participants had more of
a conscious focus on the audio exclusively whereas enjoyment was considered as a
more multi-modal rating across both audio and visual features. For non-hearing
impaired participants there was a very weak negative correlation for both speech clarity
and enjoyment with no statistical significance. On considering overall sound quality
correlations for the hearing impaired group there is indication of some positive
correlation between overall sound quality and the percentage of speech-to-camera
dialogue mirroring results discussed earlier that indicated some correlation between
ratings of clarity and sound quality for hearing impaired people. Again no substantial
correlation is indicated for non-hearing impaired participants, for this group the amount
of speech spoken with face clearly visible had little impact on perceived speech clarity,
overall sound quality or enjoyment of the clip section.
3.9.4. Recommendations for Future Test Design
The analysis of test methods presented here indicates that there are potential clear biases
which could have impact on subjective test results. Most of which were considered
during test design stages however the strength of some of the potential biases was
unexpected and some recommendations for future test design can be stated in order to
reduce the impact of these factors on other subjective tests.
• The impact of the playback order of the clips should be minimised. This could
be achieved by allowing the subject to switch between processes at will or by
taking care to ensure that clips are presented first and second an equal number of
times in any paired comparison test.
61 of 208

• Assessment of speech clarity and intelligibility should ideally be done without
visual content where this is possible. In the case of intelligibility assessments
this could be accomplished by utilising or adapting standard test material for
assessment of intelligibility such as the Connected Speech Test (Cox R.M.,
1987) or the Revised Speech in Noise Test (Bilger R.C. Nuetzel J.M. Rabinowitz
W.M. Rzeczkowski C, 1984). In the case of audio for TV this is a step removed
from a ‘real-world’ scenario and so unsuitable for the comparisons documented
here but would ensure more accurate assessment of the audio conditions free
from other influences. Where visual material is essential to tests (for example
when attempting to assess ‘enjoyment’ of AV media) great care should be taken
to ensure that clips are as equivalent as possible.
• When using visual content care should be taken to ensure that all clip/process
combinations are tested. This should minimise the effects of clip dependency on
results.
3.10. Conclusions
3.10.1. Downmixed Stereo
The most statistically significant finding to come out of all of the phase 1 tests has been
the assessment of downmixed stereo. In A/B comparison tests it was the least preferred
process, both groups consistently preferred every other process.
As has been described earlier in this report the downmixed stereo is derived from the
full 5.1 channels and is not a separate stereo track such as can be found on current
broadcast transmissions and many DVDs. It was not, therefore, possible to make
generalised judgements on stereo from these results. It seemed likely that the perceived
clarity of the downmixed stereo was affected by the presence of rear surround channels
in the mix. The downmixed stereo soundtrack is the only option available for listening
to many DVDs and surround sound broadcasts if one has only stereo audio reproduction
equipment.
62 of 208

From these tests we know that downmixed Lt/Rt stereo was considered to make dialog
less clear, to have a lower overall sound quality and to make clips less enjoyable than
using discrete front surround and dialogue channels.
3.10.2. Level of Left and Right Front Surround Channels
For hearing impaired participants, perceived overall sound quality and enjoyment
appeared to be directly related to the clarity of dialog. Close correlation between all
three factors was indicated at p<0.05. Hearing impaired viewers could benefit from left
and right channels being reproduced at lower levels, maximum benefit was gained by
muting side speakers entirely. For non-hearing impaired participants clarity was
enhanced by reducing left and right channel levels however there was no statistically
significant evidence of impact on perceptions of overall sound quality and enjoyment.
There was some weak evidence to suggest that it may have detracted from the perceived
sound quality and enjoyment of the material.
3.10.3. Summary
From these tests we can say that hearing impaired viewers can improve clarity, sound
quality and enjoyment of 5.1 AV media by muting side channels and listening solely to
the dialogue channel where dialogue is present. Hearing impaired viewers sharing a
television with non-hearing impaired viewers may be able to listen to television with
improved clarity, sound quality and enjoyment by reducing the level of the side
channels. It is possible that by experimenting with the level of these channels they may
be able to improve clarity for everyone without significantly detracting from the
enjoyment of non-hearing impaired viewers. This is not a straightforward process using
current AV receiving equipment however metadata could be utilised to activate such a
hearing impaired mode in future.
63 of 208

3.11. Recommendations for Hard of Hearing Viewers Published by Ofcom
• Where only a 5.1 surround soundtrack is available, use of discrete left, centre,
right (LCR) channels can improve clarity, perceived sound quality and
enjoyment of programme material, compared to downmixed stereo, for both
hearing impaired and non-hearing impaired viewers.
• Hard of hearing viewers can significantly improve the dialogue clarity of Dolby
Digital 5.1 programme material television by listening to centre (dialogue)
channel only. This can result in a perceived improvement in sound quality and
may enhance their enjoyment of the programme material.
• Hard of hearing viewers sharing a television can benefit from lowering the level
of the surround channels. This may be less detrimental to the enjoyment of non-
hearing impaired viewers than removing surround channels completely but can
still improve dialogue clarity.
• These recommendations have the most benefit for those having a moderate
hearing impairment.
3.12. Further Work
The questions arising from the research documented in this chapter led to further
assessments that are documented in following chapters as follows:
• Stereo reproduction: further work was carried out in order to investigate the poor
ratings of downmixed stereo derived from a 5.1 soundtrack in order to ascertain
whether implementing the proposed solution would also be beneficial for people
listening to broadcast audio on two channel stereo systems.
64 of 208

• Dynamic Range Control: it is possible that the dynamic range control available
in existing DVD players and AV receivers may provide benefit for hearing
impaired viewers. To this end tests are documented that ascertain the effect of
dynamic range control compression processing on the perception of programme
material for hearing impaired people with a range of impairments. This could
potentially lead to recommendations as to how hearing impaired viewers could
utilise existing equipment settings in order to improve perceived sound quality.
• Compression Techniques: In addition to the above, the literature presented in the
chapter 2 raises a question as to whether band limited compression techniques,
such as those used in hearing aid design, could have potential to facilitate more
inclusive product design for hearing impaired people.
65 of 208

4. Clean Audio Phase 2: A Solution for Downmixed Stereo Reproduction?
A factor that came out of informal discussions with participants in the previous phases
of this research was that although hearing impaired viewers are the most likely to
benefit and hear improvements from using multichannel reproduction, they are the least
likely adopters of surround sound technology. This makes it critical to understand how
attenuation of non-speech channels, one potential solution, will affect outcomes for
people using more common, two-channel stereo reproduction equipment. It has already
been shown that the default stereo mix, Lt/Rt, is detrimental to clarity and perceived
sound quality compared to reproduction with discrete left, centre and right channels.
Phase 2 of the Clean Audio Project aimed to ascertain the impact of implementing the
solution discussed in chapter 3 (non-speech channel attenuation) for the majority of
people, i.e. when presented over Lt/Rt downmixed stereo.
An additional factor investigated in this phase involved compression. The decision to
apply compression to an audio signal in order to aid speech understanding uncovers a
multitude of options that must be carefully considered. Should the same compression
characteristics be applied across the whole of the frequency spectrum, or should it be
implemented differently over two or more frequency channels? Implementing multiple
channel compression adds the complication of how to overlap adjacent channels. How
fast acting should the compression be and what speed of attack and release should the
compression act at in order to preserve important features of the sound such as a speech
envelope? In addition it is by no means certain that STB manufacturers would add
additional processing for what is perceived as a ‘niche audience’. Dolby multichannel
decoders come equipped with their own type of compression, dynamic range control
(DRC). It was unclear from reviewing previous research on compression and hearing
loss what impact DRC may have for hearing impaired viewers and so this was also
factored into this phase of the experimental work. Therefore the work in this phase
aimed to assess the effect that the DRC option as already implemented in Dolby Digital
equipment has on the sound quality, enjoyment, and speech clarity of television sound
66 of 208

for hard of hearing viewers with the aim of enhancing the clarity of the dialogue, the
overall sound quality and their enjoyment of the programme material. These tests were
considered important as any improvements gained using this processing would be a
‘zero cost option’ for hearing impaired viewers and could readily be implemented on
existing equipment. Phase 2 of the Clean Audio project also included preliminary
negotiations with Dolby with a view to facilitating the implementation of findings from
phase 1.
The type of compression used in this pilot study is encoded in the DRC profile found in
the AC-3 and E-AC-3 metadata. Dolby’s DRC is unusual for compression systems in
that it amplitude compresses the audio relative to the average level of dialogue. The bit
stream contains metadata values giving the average level of the dialogue; audio with an
amplitude significantly lower than this level is amplified, audio with a level
significantly higher is attenuated. The levels of gain and attenuation are dependent on
the type of programme material contained within the AC-3 stream. The values for ‘film
standard’ (utilised in this research) at the knee points of the gain plot shown in figure 12
relative to the dialogue level are listed below:
• Max Boost: 6dB (below -43dB)
• Boost Range: -43 to -31dB (2:1 ratio)
• Null Band Width: 5dB (-31 to -26 dB)
• Early Cut Range: -26 to -16dB (2:1 ratio)
• Cut Range -16 to +4dB (20:1 ratio)
67 of 208

Figure 12. Dolby Dynamic Range Control compression indicating gain ranges centred around the defined dialogue normalisation level (dialnorm) from Dolby Metadata Guide (Dolby Labs, 2003)
The implications for inappropriate dialnorm settings are clear from the figure above;
dialogue can either be raised or lowered in the mix depending on whether the value is
set too high or too low, if dialnorm is set at too low a level dialogue will be reduced in
level whereas lower level audio content will be raised leading to increased problems for
all viewers especially hearing impaired people.
4.1. Methodology
This phase of the project involved assessment of dialogue clarity, enjoyment and overall
sound quality for a series of DVD clips in the following listening conditions:
• Lt/Rt stereo at reference levels
• Lt/Rt stereo with left and right channels at -6dB
• Lt/Rt stereo centre channel only (reproduced as phantom centre)
• Lt/Rt stereo with Dynamic Range Control
• Lt/Rt stereo with Dynamic Range Control and left and right channels at -6dB
The methodology adopted was that of forced choice comparison blind A/B listening
tests identical to that utilised in Clean Audio Phase 1. Participants were asked to
68 of 208

compare video material accompanied by a Dolby Digital 5.1 soundtrack presented using
a 2 loudspeaker stereo reproduction system.
4.2. Experimental Setup
Equipment used
• DVD Player
• Digital Mixing Console
• Dolby DP562 Reference Decoder
• 2 x Genelec 1029 Active Monitors
• Notebook PC and MIDI interface
Equipment set up was as follows:
The subject’s chair, the reference monitors and the television were placed in the ideal
listening positions according to the ITU-R BS.775-1 multi-channel stereophonic sound
with and without accompanying picture recommendations. Control equipment was
situated at the back of the room with the operator out of sight of the viewer. The digital
S/PDIF output from the DVD player was converted to AES/EBU standard using a
converter and connected to the AES/EBU input on the Dolby Reference Decoder.
The DP562 reference decoder has a number of engineering and test modes of operation
that allow flexible handling of inputs and outputs. The test procedure was carried out
using the Lt/Rt three channel output (L, R & C) downmix, with and without the DRC
setting. In this mode of the DP562 decoder the five full range channels of the 5.1
surround input are downmixed to Lt/Rt with centre channel remaining as a discrete
output instead of being mixed at -3dB into left and right channels. The L, R and C
channels were routed, via the internal busses of the mixer, to two outputs, each of which
was connected to the corresponding monitor, L and R channels could then be attenuated
relative to centre in order to achieve the 6dB reduction found to be useful in the
previous phase of the research. Preliminary testing showed that the overall sound
pressure level (SPL) was being altered by DRC as well as by L and R channel
69 of 208

attenuation and the subject’s rating of what was the ‘best’ section was therefore likely to
be biased. It was important that there was consistent loudness for all of the AB
comparison tests and so for each test the levels were equalised using an automated
procedure. The level of the L/R channel pair was measured using a Leq(clip duration)
(measured in dB(A)) and the difference calculated. This difference was applied
appropriately by adjusting the overall bus output levels from the mixing console for
each condition using control software capable of sending MIDI controller information
in response to experimenter input.
4.3. Test Material
Previous work in phase 1 of clean audio (documented in chapter 3) demonstrated the
need for testing using multiple clips so a series of 20 video clips with a Dolby Digital
5.1 soundtrack were selected for testing. Clips were selected using the same criteria as
for phase 1.
Each clip was split into two sections and introduced by a title reading “Clip x” (where x
is the number of the clip), followed by a title reading “Section A” for the first part of the
clip and then “Section B” for the second part of the clip. Again it was thought important
in choosing the clips that each clip should appear to be complete in itself, i.e. at the end
of a clip the subject matter is brought to some sort of conclusion. The length of each
clip was standardised as far as possible.
4.4. Participants
Twenty hard of hearing participants and twenty non-hard of hearing participants were
selected to take part in the test. The age distributions of these participants is shown in
figure 13, their gender distributions are shown in figure 14, and the classification of the
hearing losses of the hard of hearing participants is shown in figure 15. The
classification system used is explained in Appendix G, according to this system six of
the hard of hearing participants had asymmetric hearing losses the other fourteen had
bilateral losses.
70 of 208

Figure 13. Age distribution of (a) hard of hearing participants and (b) non hard of hearing participants
Figure 14. Gender distribution of (a) hard of hearing participants and (b) non hard of hearing participants
Figure 15. Hearing losses of hard of hearing participants
71 of 208

4.5. Experimental Results
A detailed explanation of the data normalisation and analysis can be found in appendix
H. The data was normalised according to this procedure. A series of repeated measure
ANOVAs were carried out for clarity, overall sound quality and enjoyment ratings.
Conditions assessed were as follows:
LR Lt/Rt stereo at reference levels
LR6dB Lt/Rt stereo with left and right channels at -6dB
Centre Lt/Rt stereo centre channel only (reproduced as phantom centre)
DRC Lt/Rt stereo with Dynamic Range Control
DRC6dB Lt/Rt stereo with Dynamic Range Control, left and right channels at
-6dB
Speech ClarityFor the hearing impaired subject group the Lt/Rt stereo condition (LR) was rated
significantly lower for clarity than the LR6dB condition and for reproduction with DRC
applied. When compared to DRC6dB the result is close to statistically significant
although falling short of the required confidence level of 95%. Once again this Lt/Rt
condition has an overall mean rating lower than any other condition tested, this mirrors
results from chapter 3 which used three channel reproduction. Centre channel only,
when presented as a phantom centre, received the second lowest mean rating for speech
clarity, its low ratings were however statistically significant only when compared to the
LR6dB condition meaning that few firm conclusions could be drawn. The LR6dB
condition, with left and right channels attenuated by 6dB, received the highest mean
rating of all conditions and for all comparisons apart from against reproduction with
DRC applied these results were statistically significant.
Considering these results alongside those presented in chapter 3 it appears that left and
right channel with 6dB of attenuation once again improved perceived speech clarity for
the hearing impaired group.
72 of 208

Overall Sound QualityMean ratings for overall sound quality for the hearing impaired group largely mirrored
speech clarity ratings; the LR condition was rated on average worse than both LR6dB
and DRC (p<0.05), ratings when compared to centre and DRC6dB had no statistical
significance. Centre channel only (centre) was rated lower than DRC and LR6dB
(p<0.05). Of the conditions with dynamic range control applied DRC was rated higher
than LR, Centre and DRC6dB (p<0.05) indicating that although dynamic range control
improved the Lt/Rt downmix for overall sound quality, reduction in left and right
channels was detrimental to these ratings when DRC was applied.
In pairwise comparisons of overall sound quality for non-hearing impaired participants
the only statistically significant ratings were that all conditions were rated more highly
than the centre condition (p<0.05).
EnjoymentAs was the case with chapter 3 results the enjoyment ratings carried less statistical
significance, only results for LR6dB when compared to LR and centre indicated any
significant preference (p<0.05) for hearing impaired participants.
For non-hearing impaired participants all conditions except for LR6dB were preferred to
the centre condition. LR6dB compared to centre indicated no statistical significance at a
95% confidence level.
73 of 208

4.5.1.1. Hearing Impaired Group (20 participants)
!"#$%&!"#$&!"#'%&!"#'&
!"#"%&"&
"#"%&"#'&
"#'%&"#$&"#$%&
()& ()*+,& -./01.& 2)-& 2)-*+,&
!"##$%&'()*+,-&
!"#$%&!"#$&!"#'%&!"#'&
!"#"%&"&
"#"%&"#'&
"#'%&"#$&"#$%&
()& ()*+,& -./01.& 2)-& 2)-*+,&
!"#$%&&'()*+,'-*%&./0'
!"#$%&!"#$&!"#'%&!"#'&
!"#"%&"&
"#"%&"#'&
"#'%&"#$&"#$%&
()& ()*+,& -./01.& 2)-& 2)-*+,&
!"#$%&'"()
Figure 16 A, B & C. Plots showing values obtained for speech clarity, overall sound quality and enjoyment for the hearing impaired group. Error bars indicate 95% confidence interval.
74 of 208

4.5.1.2. Non-Hearing Impaired Group (20 participants)
!"#$%&!"#$&!"#'%&!"#'&
!"#"%&"&
"#"%&"#'&
"#'%&"#$&"#$%&
()& ()*+,& -./01.& 2)-& 2)-*+,&
!"#$%&&'()*+,'-*%&./0'
!"#$%&!"#$&!"#'%&!"#'&
!"#"%&"&
"#"%&"#'&
"#'%&"#$&"#$%&
()& ()*+,& -./01.& 2)-& 2)-*+,&
!"#$%&'"()
Figure 17 A & B. Plots showing values obtained for overall sound quality and enjoyment for the non-hearing impaired group. Error bars indicate 95% confidence interval.
75 of 208

4.6. Significance of ResultsTables 8 to 13 show the statistical significance of each pairwise comparison based on the repeated measures ANOVA. Highlighted boxes show significant data at p<0.05.
4.6.1. Hearing Impaired Participants
Significance: Speech Clarity
Table 8. P-values for each pairwise comparison for speech clarity ratings, highlighted values <0.05 indicate
statistical significance
Significance: Overall Sound Quality
Table 9. P-values for each pairwise comparison for overall sound quality ratings, highlighted values <0.05 indicate
statistical significance
Significance: Enjoyment
Table 10. P-values for each pairwise comparison for enjoyment ratings, highlighted values <0.05 indicate statistical
significance
76 of 208

Pearson correlation coefficients were calculated to investigate the apparent correlation
between ratings for the hearing impaired group. Results indicated a strong correlation
between all three factors rated in this experiment as can be seen in table 11. The results
show that for the hard of hearing group sound quality, enjoyment and clarity are all
closely interrelated.
Table 11. Correlation coefficients between scales for hard of hearing listeners, shaded cells indicate significance at
p<0.05.
4.6.2. Non Hard of Hearing Participants
Significance: Speech ClarityThere were no statistically significant outcomes for speech clarity rating for this subject
group at a 95% confidence level.
Significance: Overall Sound Quality
Table 12. P-values for each pairwise comparison for overall sound quality ratings, highlighted values <0.05 indicate
statistical significance
77 of 208

Significance: Enjoyment
Table 13. P-values for each pairwise comparison for enjoyment ratings, highlighted values <0.05 indicate statistical
significance
Calculating Pearson correlation coefficients between the three ratings indicates a strong
correlation between overall sound quality and enjoyment as can be seen in table 14.
Table 14. Correlation coefficients between scales for non hard of hearing listeners, shaded cells indicate statistical
significance at p<0.05.
4.7. Discussion
4.7.1. Hearing Impaired Group
This work using the default stereo Lt/Rt downmix indicates that the recommendations
generated from chapter 3 that were effective for three channel reproduction (attenuating
left and right channels by 6dB) may have also improved perceived speech clarity and
overall sound quality for hearing impaired viewers when presented over a two channel
reproduction system. There is also evidence to suggest that applying Dolby’s dynamic
range control compression process may have improved speech clarity and overall sound
quality for this group.
The removal of non-speech channels entirely had been expected to improve speech
clarity ratings when compared to the default Lt/Rt stereo downmix however no
evidence was found to substantiate this expected result. The rating of centre channel
78 of 208

only was rated more poorly than the attenuated left and right condition (LR6dB) for both
perceived speech clarity and for overall sound quality when presented over two
loudspeakers. It could have been expected that there may be some reduction in ratings
due to the centre channel being presented as a phantom centre rather than over a discrete
loudspeaker however this was the case for all of the conditions assessed here. This
possibility is investigated later in chapter 5 of this thesis.
The question remains however as to why the centre only condition was so poorly rated
even when compared to other conditions with speech presented using a phantom centre.
The results here give no firm conclusion to this question although do raise an interesting
point about the differences between assessment of intelligibility versus speech clarity. It
is possible that there could be some positive impact from the presence of side channel
information that may hide some audible distortion or imperfection caused by acoustical
crosstalk. Had the test been for intelligibility, logic would suggest that participants
would have recognised more keywords with less background, side channel, sounds
present. When perceived speech clarity is being tested it may be that participants were
trying to assess the clarity of the speech signal in isolation from the background sound.
With no background sound present the speech may have sounded wrong, or unclear,
because of frequencies being cancelled out. Those same frequency peaks and troughs
may have been disguised to some extent by the presence of side channel sounds that
were sufficient to ‘fill in’ some of the frequency gaps but not sufficiently loud as to
cause difficulty in understanding the speech content. Indeed Vickers (Vickers, 2009a)
paper points out that such notches in the frequency spectrum caused by two channel
reproduction are often filled in by the effect of room reflections. Furthermore he
suggests that, “When audio content includes correlated (center) and decorrelated (side)
information, only the center content is subject to the comb filtering, reducing the
salience of the notches.”.
4.7.2. Non-Hard of Hearing Group
Much less significance was found for the non-hearing impaired group. Centre channel
only, when reproduced over two loudspeakers as a phantom centre, rated lower than all
79 of 208

conditions for overall sound quality (p<0.05) and for enjoyment compared to all
conditions apart from LR6dB (p<0.05) for which result no significance was found.
Correlations between ratings showed that for hearing impaired participants speech
clarity, overall sound quality and enjoyment were all closely correlated and that for the
non-hearing impaired group only overall sound quality and enjoyment showed
correlation.
4.8. Further Work
While it would have seemed reasonable that centre channel only would have been rated
highly for clarity even if this were not reflected in sound quality ratings this was not the
case. There was clearly a substantial difference in perception of the conditions
reproduced over two channel compared to three channel reproduction. Further work was
therefore required in order to ascertain the cause of the poor performance of the
phantom centre channel only when using Lt/Rt downmixed stereo in these tests and to
assess if this could be shown to be the consequence of acoustical crosstalk.
4.9. Implications for TV Viewers
The research presented here lent further weight to the premise at the root of discussions
undertaken with Ofcom and Dolby Laboratories aimed at providing a hard of hearing
setting for STBs. Previous research showed distinct benefits to using attenuated left and
right channels in order to improve clarity, perceived sound quality and enjoyment in a 3
channel reproduction system utilising a centre loudspeaker such as that found in
surround sound systems. This research indicates that the same technique could be
effectively implemented in a 2 channel stereo reproduction system utilising the Lt/Rt
downmix that is standard on set top boxes, DVD players and other Dolby equipment.
Furthermore potential benefits for hearing impaired people could be gained by utilising
Dolby’s dynamic range control compression processing. This has the potential to
provide solutions for hard of hearing viewers who do not yet have surround sound
reproduction equipment and who rely on the downmixed-to-stereo sound produced by
STBs as default for two channel reproduction.
80 of 208

5. The Problem with StereoResults in this chapter have been published in the Journal of the Audio Engineering
Society article, The Effect of Stereo Crosstalk on Intelligibility: Comparison of a
Phantom Stereo Image and a Central Loudspeaker Source (Shirley et al., 2007).
5.1. Introduction
The growth of digital television and the implementation of surround sound broadcast
make work into the intelligibility of sound formats timely. Holman (Holman.T., 1991)
has carried out experiments subjectively comparing a phantom centre image and a real
centre source. The results showed that the addition of the centre channel appeared to
make the dialogue clearer. It was suggested that participants found each method as
intelligible as the other but that more effort may have be required to understand the
stereo playback. It can be argued that this seems counter-intuitive, especially when
applied to older people with cognitive and other factors that may slow understanding of
speech. Holman also mentions the problem of acoustical crosstalk in stereo
reproduction (Holman.T., 1996). This occurs when sound from both loudspeakers reach
the ear at slightly different times causing a comb-filtering effect and a dip in amplitude
at around 2 kHz (Holman.T., 1996). This is particularly apparent when creating a central
phantom stereo image where both sources give the same signal. At each ear there is a
signal and a slightly delayed version of that signal which causes the filtering effect. This
effect was originally noted by Snow (1953). The potential importance of the effect of
crosstalk is also noted by Toole (1985). Dressler (1996) suggests an example of
intelligibility problems where the commonplace downmixing from 5.1 surround to two
channel stereo can lead to excessive level causing clipping that could “alter the
subjective balance of the mix to the detriment of dialogue intelligibility”. It is possible
that some of this detrimental effect on dialogue intelligibility may not be solely as a
result of the process of downmixing and resultant clipping noted by Dressler. This
chapter describes research assessing if there is an actual measurable improvement in
intelligibility (as opposed to perceived clarity) by the addition of a central loudspeaker
for the centre channel of 5.1 material and to assess any benefit to utilising a centre
loudspeaker for speech. The background and the methodology of the experiments are
81 of 208

explained, results and data analysis for pilot tests and the main series of tests are
presented and results are discussed and considered with respect to measured data.
5.2. Methodology
5.2.1. Overview
Previous subjective testing described in this thesis looked at perceived speech clarity,
overall sound quality and enjoyment using audio with accompanying picture from
DVD, encoded with a Dolby Digital 5.1 soundtrack. An analysis of the test procedures
from these tests indicated that subject ratings were influenced by the amount of ‘face to
camera’ speech in each clip. Although this effect was predicted and the test designed to
nullify any influence on the results it seems likely that this factor would have reduced
the statistical significance of the results. It is also quite possible that there can be
conditions whereby dialogue will appear to be clearer and yet not be any more
intelligible. In Holman’s experiments, he saw no improvement in intelligibility but
noted that it may take more effort to understand the speech presented as a phantom
centre image and in order to assess intelligibility as opposed to perceived clarity it was
decided to assess audio in isolation, with no accompanying picture.
It was decided that for the purposes of investigating any intelligibility impact of a
phantom centre channel only non-hearing impaired participants would be required. The
inclusion of hearing impaired participants was considered to introduce further variables
that would reduce the likelihood of gaining significant results. Factors such as varying
degrees of hearing impairment between participants and the unknown impact of
asymmetric hearing loss were considered to reduce the likelihood of finding interesting
generic findings about two channel stereo reproduction effects on intelligibility.
5.2.2. Speech in Noise Testing
Audiometric measures of hearing loss are used to assess the acuity of an individual’s
hearing for specific frequencies however this does not necessarily correspond with the
ability of a person to understand speech in everyday situations. Some research (Festen
and Plomp, 1983) indicates that although the ability to understand speech in quiet is
largely determined by audiometric loss, ability to understand speech in noise is more
82 of 208

closely related to frequency resolution - our ability to resolve adjacent frequencies. Poor
frequency resolution makes it more difficult to distinguish between tones, but also, in
the context of speech comprehension, between different phonemes. Summerfield states
that, “audiometric loss is generally associated with poor frequency
resolution” (Summerfield, 1987) but also, that “impairments in gap detection and
frequency discrimination are not so associated with audiometric loss, and account for
significant amounts of variability in speech understanding after association with
audiometric thresholds have been taken into account.” This suggests that one of the
most critical factors in our ability to understand speech is one which is not measured by
the usual method of assessing hearing acuity, the audiogram. Intelligibility of speech
itself is dependent on many contributing factors. Identification of small phonetic
information elements are a part of comprehension, but also larger prosodic parameters,
such as variations in the pitch and rhythm of speech and also contextual information aid
understanding. For this reason testing of speech perception in noise using sentences
with and without helpful context has been used to determine the hearing ability of
individuals in ‘day-to-day situations’ (Bilger R.C. Nuetzel J.M. Rabinowitz W.M.
Rzeczkowski C, 1984) and a number of tests exist for that purpose.
One of these tests, the Speech in Noise test (SIN) by Killion and Vilchur (1993) is used
to measure the intelligibility of speech against a background of multi-talker pseudo
babble. The test uses a series of sentences with multiple keywords within each sentence.
The test produces an SNR-50 (dB) value that represents the speech to babble ratio
where the listener gets 50 percent of the keywords correct. A variation of the SIN test
was proposed by Kalikow et al (Kalikow D N. Stevens K N. Elliot L L, 1977); the
Speech Perception in Noise test (SPIN) has been used to assess the degree to which
linguistic-situational information is utilised in everyday speech reception. The test
consists of 10 forms of 50 sentences per form. Each of these sentences ends in a
keyword that must be identified by the subject and this is used for scoring. The forms
each have 25 sentences that end with low predictability key words (where the contextual
relevance of the sentence to the keyword is low) and 25 ending in high predictability
key words (where the contextual information relates strongly to the final keyword in the
sentence). Each form has a cognate, or paired, form containing the same key words but
83 of 208

reversing the predictability. For example one form presents the keyword ‘spoon’ in a
contextual setting; “Mr Brown stirred his coffee with a spoon”. Its cognate form
presents the same keyword in a non-contextual setting; “Mrs White considered the
spoon”. The forms were later refined by Bilger et al (Bilger R.C. Nuetzel J.M.
Rabinowitz W.M. Rzeczkowski C, 1984), in order to improve equivalency between
forms. Equivalence assessment was carried out by analysis of phonetic content and
analysis of results from extensive testing with hearing impaired participants to ensure
that equivalent keyword recognition scores were obtained for each form and no forms
contained easier or more difficult keywords than any other. In the SPIN tests, the noise
used to mask the speech is multi-talker babble with 12 talkers. It was designed to be
carried out at a speech to babble ratio of +8dB for hearing impaired participants without
hearing aids. The revised SPIN test media (Bilger R.C. Nuetzel J.M. Rabinowitz W.M.
Rzeczkowski C, 1984) was used as the basis of this research largely because of the
extensive efforts made to maximise form equivalence.
5.2.3. Adaptation of SPIN test
This adaptation of the SPIN test was presented in stereo with the speech coming either
from a centre loudspeaker or from a phantom centre image. It would have been possible
to record a new babble track in stereo and utilise this in the tests however it was
considered that this could adversely affect results. The babble and speech used in the
SPIN test has been phonetically balanced and rigorously tested in order to eradicate any
keywords found to be consistently ‘difficult’ or ‘easy’ as a result of combinations of
particular sections of babble and particular phonemes. For this reason it was decided
that the benefit of utilising the existing babble from the SPIN CD outweighed the
possible disadvantage of processing influencing the results. The authorised SPIN CD
used for these listening tests was designed to be presented in mono and comes as a two
channel stereo recording with multi-talker babble on one channel and speech on the
other. In order to present the babble in a stereo sound field a DirectX plug-in was
developed and applied to the mono babble track in order to generate a stereo signal with
a wide source width.
84 of 208

5.2.4. Test Setup
Sentences ending in keywords were presented using both a phantom centre image and a
real centre loudspeaker in a background of pseudo stereo multi-talker babble as
indicated in figure 18.
The SPIN test recommendation is that it should be presented at a level 55dB SPL above
the listener’s babble threshold in a sound field; the babble threshold being the lowest
level at which the listener can detect the presence of the pseudo-babble. The tests
discussed here were carried out with participants with no hearing impairment and the
appropriate babble threshold calculated from a typical non-hearing impaired audiogram.
All tests were carried out at 68dB SPL, the level recommended in the manual
accompanying the authorised SPIN CD for participants with unimpaired hearing. The
test material was extracted from the authorised version of the revised SPIN test CD
(Bilger R.C. Nuetzel J.M. Rabinowitz W.M. Rzeczkowski C, 1984). Audio data was
imported into a laptop computer with a multi-channel audio interface and a multi-track
audio program. Three buses were created within the program that individually
controlled the levels of the babble and speech while routing them to appropriate outputs.
Figure 18. Test setup used to implement the SPIN test.
A representation of the test setup is shown in figure 18, the area of the diagram inside
the dotted lines is implemented in software within a PC environment. The pseudo stereo
85 of 208

multi-talker babble was generated from the authorised SPIN CD (Bilger R.C. Nuetzel
J.M. Rabinowitz W.M. Rzeczkowski C, 1984) using a plugin implementing a pair of
complementary comb filters. The signal flow for the filter is as shown in figure 19.
Figure 19. Signal flow of plug-in used to generate pseudo-talker babble
The frequency responses of the filters outputs are shown in figure 20. The filter outputs
act as complimentary comb filters and can be added back together to get an
approximation of the input.
Figure 20. frequency response of mono to stereo enhancer plugin
86 of 208

5.2.5. Calibration
Each test condition was carefully calibrated so that each condition had not only the
correct signal to babble ratio, but also the correct overall level. The tests took place in a
listening room conforming to the ITU-R BS.1116-1 (ITU, 1997); three Genelec 1029
reference monitors were placed in loudspeaker positions according to ITU-R BS.775-1
(ITU, 2006) and connected to audio interface outputs. White noise was used to calibrate
the relative level of each speaker using A-weighted Leq levels. The total level for each
test condition was normalised so that each condition and each test was at the same
overall SPL.
5.2.6. Test Procedure
A series of pilot tests were carried out prior to the main batch of tests in order to
determine the appropriate signal to babble ratios required to obtain useful results. The
test procedure was identical for both pilot test and main tests. The procedure was
explained to each subject who was seated in the ideal listening position according to
ITU-R BS.1116-1. Participants were played several examples of SPIN sentences in
babble and asked to repeat the last word as a practice prior to commencing the test. The
subject was then given an answer sheet to record the keywords recognised from SPIN
sentences and the test was started. Each form, consisting of 50 sentences containing
keywords, was played with no pauses, unless the subject raised his / her hand to indicate
they were not ready to proceed to the next sentence. At this point, the test was paused
until the subject was ready to continue.
5.3. Pilot Study
Previous work by Kalikow et al (1977) has shown ceiling effects where listeners get all
keywords correct where the threshold is set too low, or all incorrect if it is set too high.
The pilot study was designed to determine an appropriate signal to noise ratio that could
be used in the main listening tests in order to avoid these ceiling effects. The pilot study
tested a range of signal to babble ratios between +10dB and -10dB. Four participants
87 of 208

with no hearing impairment participated in the pilot study, using six forms; central
stereo image and central loudspeaker conditions were each tested at six signal to babble
ratios. There were two test sessions for each subject. The combinations of subject,
signal to babble ratio, audio process and form number were created for each test so that
everything was tested a uniform number of times. The test order was designed to ensure
that a person was only tested on each form once and that cognate form pairs were only
ever tested across separate sessions. 12 tests were carried out in total for each condition
as indicated in table 15.
Audio
Process
No. Tests
(per person)
No. Tests
(Total)2 Channel 3 123 Channel 3 12
Table 15. Tests carried out for each condition in pilot study
5.3.1. Pilot Study Results
The pilot study results are presented in figure 21 which shows the number of keywords
correctly identified for the seven signal to babble ratios assessed in these pilot tests. A
2nd order polynomial trend line is used to indicate the trend of the data. The ceiling
effects noted by Kalikow where participants get all of the keywords correct or all
incorrect are clearly shown at the upper end of the trend line.
88 of 208

Figure 21. Percentage of correctly identified keywords for each signal to babble ratio assessed. Dashed lines indicate the -2dB ratio at which 50% of keywords are correctly identified and which was used for the main tests.
Figure 22 shows how the contextual information affects the listeners’ ability to identify
keywords. As can be seen the number of correct identifications for high predictability
sentences is higher for corresponding signal to babble ratios.
Figure 22. Number of identified keywords for high and low predictability sentences.
Note that the ratio of -2dB (indicated in figure 21) is on the slope of each trend line and
so unlikely to result in participants getting all keywords correct or all incorrect.
89 of 208
5.3.2. Summary of Pilot Study Results
The results of the pilot study indicate that participants obtained an average of around 50
% total correct at a -2dB signal to babble ratio. The separated high/low predictability
graph (figure 22) shows that a -2dB ratio should avoid ceiling effects for both high and
low predictability sentences. This value was therefore used in the main batch of tests.
5.4. Main Tests
The main listening tests assessed speech intelligibility in multi-talker babble comparing
directly the use of a virtual stereo image source and a real source. 20 normal hearing
participants participated in the tests, which were carried out over two separate test
sessions. The test was carried out at the signal to babble ratio of -2dB, which the pilot
study had suggested was the ideal level to avoid ceiling effects for both high and low
predictability sentences, and at an overall SPL of 67.9dB. Each subject was tested over
two test sessions and each condition was tested twice; four different forms were used.
Each of the four forms was tested 20 times, half from a central stereo image and half
from a real source. The order of playback and audio process combination was changed
for each subject. No cognate form pairs were used.
5.4.1. Main Test Results & Data Analysis
5.4.1.1. All Sentences (high and low predictability)
A two was repeated measures ANOVA was carried out to analyse the results.
Both number of channels (2 or 3) and keyword predictability (high or low) was shown
to have an effect on the number of keywords recognised at p<0.05.
It is clear from the trend lines for high and low predictability sentences in figure 22 that
the ability of participants to identify keywords is influenced, and improved, by
contextual information and so it was expected that overall results considering the
conditions together would reflect the wide variation in keywords correctly identified.
Table 16 shows the average number of keywords correctly identified out of 25 along
with their standard deviation for both two-channel and three-channel reproduction and
for both high and low predictability sentences. Although useful in that the overall mean
90 of 208

values indicated improved recognition for three-channel reproduction, the true
difference in conditions is not represented owing to wide variation in the ability to
recognise keywords between participants.
Table 16. Mean key words recognised for each condition
When all sentences are considered together, the 3-channel condition was seen to give a
small but significant improvement in keyword recognition of 1.025 words at a
confidence level of greater than 95%.
5.4.1.2. High and Low Predictability Sentences Considered
Separately
Figure 23. High & Low Predictability Sentences Considered Separately
Figure 23 shows the average number of words correctly identified out of 25 for high and
low predictability sentences in both two-channel and three-channel listening conditions.
The difference in keyword recognition between high and low predictability sentences
indicated that there may have been benefit in considering these results separately. Table
91 of 208
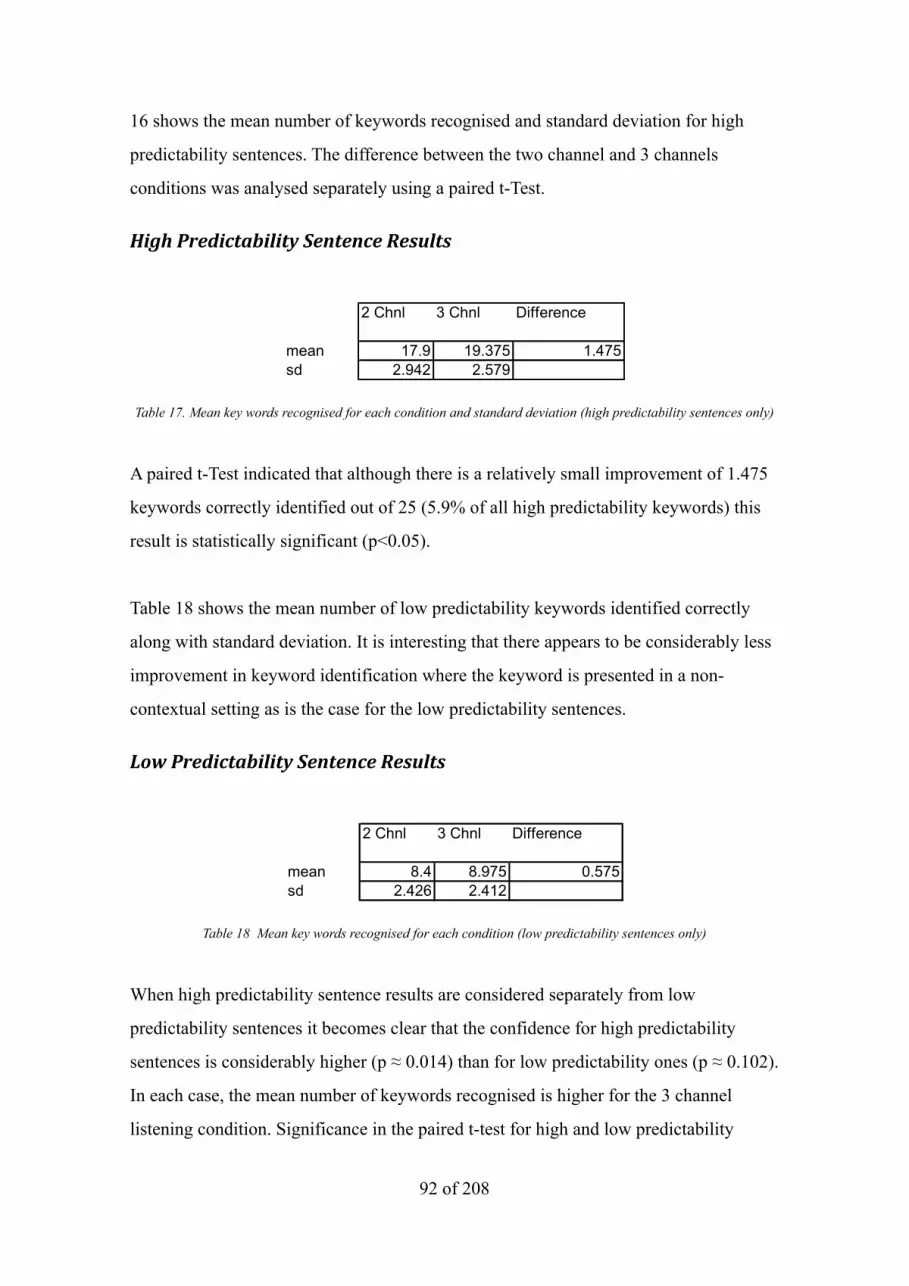
16 shows the mean number of keywords recognised and standard deviation for high
predictability sentences. The difference between the two channel and 3 channels
conditions was analysed separately using a paired t-Test.
High Predictability Sentence Results
Table 17. Mean key words recognised for each condition and standard deviation (high predictability sentences only)
A paired t-Test indicated that although there is a relatively small improvement of 1.475
keywords correctly identified out of 25 (5.9% of all high predictability keywords) this
result is statistically significant (p<0.05).
Table 18 shows the mean number of low predictability keywords identified correctly
along with standard deviation. It is interesting that there appears to be considerably less
improvement in keyword identification where the keyword is presented in a non-
contextual setting as is the case for the low predictability sentences.
Low Predictability Sentence Results
Table 18 Mean key words recognised for each condition (low predictability sentences only)
When high predictability sentence results are considered separately from low
predictability sentences it becomes clear that the confidence for high predictability
sentences is considerably higher (p ≈ 0.014) than for low predictability ones (p ≈ 0.102).
In each case, the mean number of keywords recognised is higher for the 3 channel
listening condition. Significance in the paired t-test for high and low predictability
92 of 208

sentences considered separately is probably diminished in both cases owing to the
smaller number of tests in each group compared to the overall number and only the high
predictability sentences give significant results.
5.5. Discussion
5.5.1. Measured Transfer Function
The results indicate that there is a difference between two-channel (phantom centre) and
three-channel (with centre loudspeaker) presentation. The use of a real, as opposed to a
phantom, source is shown to give a small but statistically significant intelligibility
improvement in these test conditions, based on number of keywords recognised. One
hypothesis for this is that acoustical crosstalk resulting from the stereo image, that has
been noted by Holman (Holman.T., 1996) and others, has had a significantly
detrimental effect and that this effect was not only on the effort required to understand
words, but also on speech intelligibility.
Analysis of the test results indicates an improved average number of keywords
recognised for the high predictability sentences compared to low predictability which
was expected and indeed is utilised in Kalikow’s original test. However the difference
in the statistical significance between the two sets of results was not expected. Referring
back to the pilot test results (figure 22) it is clear that the graph of keywords correct
against speech to babble ratio shows a much steeper gradient for the high predictability
sentences. If the effect of comb filtering caused by crosstalk has a similar influence on
the results as decreasing the signal to babble ratio then a lower significance should
perhaps have been expected.
The magnitude of the effect caused by crosstalk was then measured using a B&K
dummy head as follows. White noise was played through a single loudspeaker located
2.27m away in front of the dummy head. The same signal was then also played through
loudspeakers located at 30° either side of the axis, again 2.27m away. The white noise
was played for 60 seconds under each condition and the frequency response measured at
the left ear for both two channel and single channel conditions. From these measured
93 of 208

frequency responses the mono to phantom mono transfer function was calculated.
Figure 24 (A and B) shows the transfer function, or difference in frequency spectra,
between single channel and two channel playback up to 10 kHz. This is shown using
both linear (24A) and logarithmic (24B) frequency scales.
Figure 24 A and B Measured mono to phantom mono transfer function shown with linear (A) and logarithmic (B) scale; this represents the difference in frequency spectra caused by acoustical crosstalk. Note the dip at around 1.5
kHz to 3 kHz
The dips at around 2 kHz, 8 kHz and 11 kHz (not shown) indicate the presence of a
cancellation and reinforcement pattern typical of comb filter effects. Early work by
94 of 208

Fant, described in 2004 (Fant, 2004), describes the frequency content of speech utilising
a visual representation of what Fant called a ‘speech banana’ (Fant, 1959) to show the
relative power of aspects of speech (figure 25).
Figure 25. Fant’s “Speech Banana”(Fant, 1959)
Another representation of this is shown in figure 39, which more clearly indicates
typical sound intensity of various speech sounds.
Figure 26. Sound Intensity of Speech Frequencies (Appalacian State University)
95 of 208

Figure 26 shows that, as is generally recognised, many of the frequencies most critical
to speech reside in the region above 1 kHz. Superimposing this data onto the derived
transfer function for a phantom mono source compared to a real mono source, as shown
in figure 27, goes some way toward explaining the loss of intelligibility caused by the
phantom centre image measured in the research.
Mono to phantom mono transfer function
-5
-4
-3
-2
-1
0
1
2
3
4
5
10 100 1000 10000
Frequency (Hz)
Gain (dB)
left ear
consonants
vowels
Figure 27. Speech Frequencies superimposed on mono / phantom mono transfer function plotted on a logarithmic frequency scale.
5.5.2. Independent Calculated Crosstalk Effect
Crosstalk is caused by the same signal being received from 2 sources, one arriving later
than the other and it is the duration of this delay and the degree of head shading that
determines the effect of this crosstalk. By calculating the difference in signal path for
each loudspeaker signal to the left ear, as shown in figure 28, a measure of this crosstalk
was calculated independent of room parameters and reproduction equipment. The
additional distance that sound from the furthest loudspeaker must travel to the ear, and
so the actual time delay incurred, was calculated based on the dummy head’s position
(2.27m from the loudspeakers) as follows.
96 of 208

Figure 28. Path from left and right loudspeakers
5.5.2.1. Left/Right Loudspeaker Delay
The length of the signal path from each loudspeaker to the left ear was calculated using
known distances from loudspeaker to subject, the radius of the dummy head and the
known angle of incidence for each loudspeaker (as specified in ITU-R BS.775). A
simple spherical head model was used and the calculations for this are presented here
for each loudspeaker in order to calculate a theoretical value for the time delay and
hence the theoretical crosstalk transfer function.
97 of 208

Left Loudspeaker Signal Path
Figure 29. Signal path for left loudspeaker to left ear
The following calculations are with reference to figure 29.
r = 76mm (for B&K dummy head)
Dlp = 2270mm
Distance from left loudspeaker to left ear
98 of 208

Right loudspeaker signal path
Figure 30. Distance from right loudspeaker to left ear
The following calculations are with reference to figure 30.
Total distance = D1+D2
Angle of incidence
Length of arc describing distance around head (using spherical head model)
where r is in metres and θ is in radians. For θ in degrees
99 of 208

Total distance D = D1+D2 = 2269+42 = 2311mm
Left/Right Loudspeaker Path Difference
Left path = 2231mm
Right path = 2311mm
Difference = 80mm = 0.080m
This figure was used to calculate the time difference of the signal from each of the
loudspeakers as follows:
Left path = 2231mm
Right path = 2311mm
Difference = 80mm = 0.080m
Speed of sound c = 344ms-1
Delay owing to signal path
Independent Crosstalk Transfer Function
Inter-aural crosstalk creates a comb filtering effect that causes alternating dips and
peaks in the transfer function. The first and major anomaly is a dip in the transfer
function when the two acoustic signals arrive out of phase. This is calculated as follows:
First cancellation occurs at:
100 of 208

Table 19 shows the calculated cancellation and reinforcement frequencies for the
calculated value of delay up to 13.5 kHz. Note that head shadowing reduces the
cancellation effects at the higher frequencies
Cancellation 1/2t, 3/2t, 5/2t
Reinforcement2/2t, 4/2t, 6/2t
2250 5500
6750 9000
11250 13500
Table 19. Calculated Reinforcement and Cancellation Frequencies for calculated crosstalk
The transfer function for crosstalk caused by the calculated delay was plotted using
Matlab and superimposed on the measured frequency response observed at the left ear
(figure 31).
Figure 31. Measured Interaural crosstalk effect on transfer function using a B&K dummy head (solid line) compared to calculations based on a spherical head model (dashed line)
The graph clearly shows the effect of comb filtering resulting from crosstalk. The
predicted first cancellation frequency of 2250Hz is seen to be approximately 500 Hz
offset from the measured cancellation. This offset is likely to be a result of the delay
101 of 208

being calculated using a simple spherical head model rather than a more sophisticated
head related transfer function. From experimentation it was shown that the delay
corresponding to the actual measured transfer function was approximately 0.00024s,
rather than the 0.000233 calculated using the spherical head model.
5.5.2.2. Effect of Listening Position
It is important at this point to realise that the effect of this acoustical crosstalk is highly
dependent on the position of the listener with respect to the loudspeaker positions. The
calculation documented here is for the ideal listening position as defined in ITU-R
BS775-1 Moving the listener to another position is certain to change which frequencies
are attenuated and by what degree. In order to gain some insight into this variation
further measurements were carried out using the dummy head.
Measurements were carried out in the same way as in previous measurements with
white noise being played out of both loudspeakers. Loudspeakers were again at
positions defined in ITU-R BS775-1 and measurements taken at the worst case listening
positions defined in the same document as shown.
B
½B30°
Lf Rf
C
Lr Rr
110°
Figure 32. Ideal (C) and “worst case” (Lf, Rf, Rl, Rr) listening positions adapted from ITU-R BS 775-1 (ITU, 1994a).
102 of 208

Transfer Functions Measured with Dummy Head
The transfer functions illustrated here show the difference in amplitude measured for a
real centre loudspeaker source and for a phantom centre source presented using two
loudspeakers up to 16 kHz, for the left-front and left-rear positions illustrated in the
previous figure (figure 32).
Figure 33. Front left position (Lf)
Figure 34 Rear left position (Lr)
The location of the dummy head for these measurements, at the worst case positions
specified in ITU-R BS 775-1 alters the delay considerably between the same sound
103 of 208

arriving at the ear from each loudspeaker and therefore has the effect of offsetting the
entire comb filter response. This offset means that the cancellation frequencies are then
moved beyond the range of speech and therefore will probably have little or no effect on
intelligibility although the fluctuations prior to the initial cancellation frequency may
have an impact. The variations indicated by these graphs probably correspond to the
fluctuations prior to the first cancellation frequency in figure 31.
5.6. Conclusions
This research demonstrated a measurable improvement in intelligibility (as opposed to
perceived clarity) as a result of using a real loudspeaker source to carry speech when
compared with a central phantom stereo image. This improvement can be quantified in
terms of the increase in number of keywords identified in the three channel condition
using a central loudspeaker. By using a central loudspeaker to reproduce speech the
total percentage of keywords correctly identified is improved on average by 4.1% across
both contextual and non-contextually set keywords at a significance level of >95%. The
reason the 2 channel system results in less intelligibility than the 3 channel system is
consistent with an acoustical crosstalk effect causing cancellation and therefore a dip in
the frequency response at frequencies important in speech.
This finding indicates that there are significant intelligibility gains associated with using
a central loudspeaker such as is utilised in 5.1 surround sound broadcast systems
although this benefit is only apparent for surround audio mixes where speech is panned
centrally.
104 of 208

6. Principal Components Analysis
6.1. Introduction
One possibility for making TV sound more intelligible is to develop a method for
separating out the speech element from the broadcast 5.1 audio stream. Various methods
have been proposed for this, one of which, Principal Components Analysis (PCA), was
proposed by Zielinski et al (Zielinski et al., 2005) in response to early work on the
Clean Audio project (Shirley and Kendrick, 2004) documented in chapter 3 of this
thesis. Principal component analysis is a statistical technique widely used to reduce the
dimensionality of complex data sets for analysis or for data compression. It achieves
reduced dimensionality by retaining lower order components which contribute most to
its variance, on the assumption that these are the most important, and discarding higher
order ones. The proposition presented is that the audio presented in a 5.1 multichannel
mix is essentially a complex data set with many variables to which we wish to find a
single component, in this instance, speech.
Zielinski argued that the Clean Audio solution was inappropriate as it assumed all
speech would only be in the centre channel. The work presented an artificial situation
with centre and one rear channel swapped so that speech emanated only from one of the
rear surround channels in order to illustrate perceived shortcomings of the solution
presented in chapter 3 of this thesis and proposed by the UKCAF. The processing
proposed by Zielinski et al utilised a ‘speech filter’ to pre-process audio channels prior
to carrying out PCA. This ‘weighted’ PCA analysis was carried out on a short section of
audio, carefully chosen with speech present to allow the algorithm to work, and the
resultant unmixing matrix was then applied to the entirety of the programme material
with some success. This method allowed the PCA process to pick out the channel
containing speech as the principal component of the material and act appropriately on
other channels, by either muting or attenuating the non-speech channels.
In order to more fully ascertain any benefits to this approach and to assess PCA as fit for
the purpose of producing ‘clean audio’ for broadcast an investigation was carried out
105 of 208

where various synthesised audio mixes were processed using PCA. In this way a clear
understanding of the technique, and of its limitations was gained.
Several 5.1 audio soundtracks mixed to reflect current broadcast and film making
practice were then processed using PCA, using both weighted and unweighted
techniques, in order to ascertain how the technique would work with ‘real world’
broadcast material.
In this chapter the principles of PCA are presented and the potential of PCA for
providing a useful method of speech separation is evaluated in the context of broadcast
5.1 surround audio.
6.2. Principles of PCA
There are many examples of applications for which principal component analysis can be
implemented. It has been used in a number of applications where it is necessary to
reduce the dimensionality of large data sets, one example is in image compression
where it can be used to remove attributes from the image that will not be noticed (Kurita
and Otsu, 1993). It has also been used in image analysis, for example in face
recognition applications it is a useful step in identifying key differences between images
(Zhao et al., 1998).
In this section the process of identifying principal components from a data set is carried
out to illustrate the steps required to implement PCA. The data set in this case was a
two-channel stereo audio file. This example was used in order that data can be easily
represented in two-dimensional graphs and so that the principles of PCA and those on
which the solution proposed by Zielinski, Mayne et al (Zielinski et al., 2005) is based
could be clearly understood. This work is then expanded to cover data sets of more
dimensions including 5.1 audio.
106 of 208

The data in this example consists of a stereo audio file; two channels of 100 samples
each. Test material was generated as mono audio files and imported into a multichannel
audio software package where they were mixed as follows.
6.2.1. Example 1
440 Hz sine wave at 0dB panned 30% left,
White noise at 0dB panned 30% right.
Figure 35. PCA Example 1: 440 Hz sine wave 30% left, white noise 30% right.
6.2.1.1. Subtract the Mean
The first step in PCA is to subtract the mean from each sample in the sample set; in the
case of an audio file this is equivalent to removing any DC offset from the audio media.
Although the data in this example consists of audio samples which are changing in time,
the PCA process is unaware of this fact and simply looks at paired data sets, in this case
of left-right sample values. Here the data is shown with left sample value plotted against
right sample value (figure 36).
107 of 208

Figure 36. Sample values plotted left channel against right channel. A signal which was identical in both channels (panned centre in the case of an audio example) will show as a set of points following a straight line from point
(-1,-1) to point (1,1)
It can be seen from the data when it is plotted in this way that there is some small
degree of correlation between left and right which would indicate some commonality.
For any centrally panned signal the plot would show a set of sample points following a
straight line from point (-1,-1) to point (1,1) indicating perfect correlation between left
and right channels.
6.2.1.2. Covariance Matrix
The covariance of two data sets is a measure of how the data sets vary with respect to
each other. It is given by the following equation (Smith, 2002):
Covariance is always between two data sets so where there are more than two sets of
data and therefore more than a single corresponding covariance value it is necessary to
108 of 208
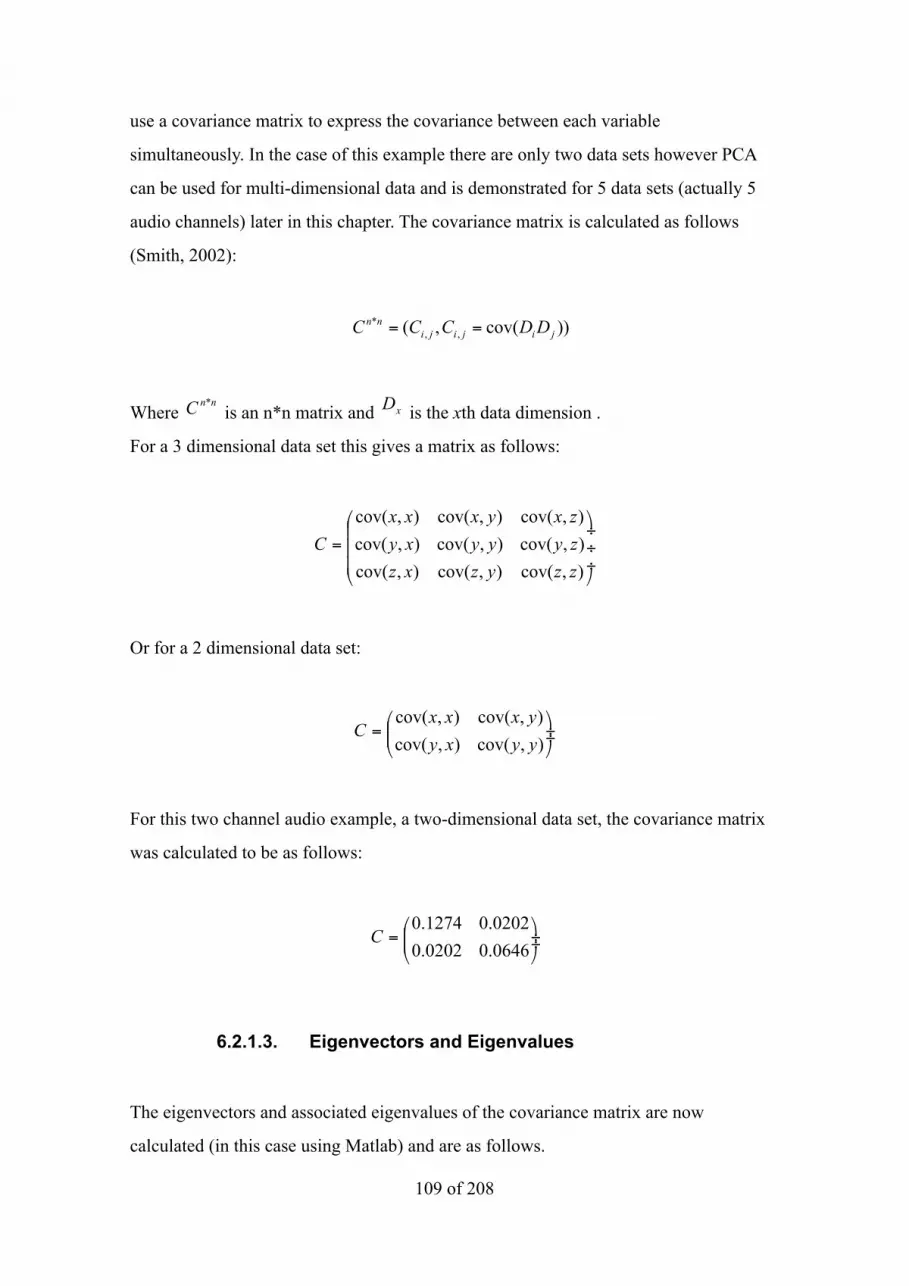
use a covariance matrix to express the covariance between each variable
simultaneously. In the case of this example there are only two data sets however PCA
can be used for multi-dimensional data and is demonstrated for 5 data sets (actually 5
audio channels) later in this chapter. The covariance matrix is calculated as follows
(Smith, 2002):
Where is an n*n matrix and is the xth data dimension .
For a 3 dimensional data set this gives a matrix as follows:
Or for a 2 dimensional data set:
For this two channel audio example, a two-dimensional data set, the covariance matrix
was calculated to be as follows:
6.2.1.3. Eigenvectors and Eigenvalues
The eigenvectors and associated eigenvalues of the covariance matrix are now
calculated (in this case using Matlab) and are as follows.
109 of 208

Eigenvectors:
Eigenvalues:
At this point it is useful to superimpose the eigenvectors for this data onto the data plot
shown earlier.
Figure 37. Data plot of original data with eigenvectors superimposed, note these are always orthogonal to each other.
It can be seen in figure 37 that eigenvector 1 and eigenvector 2 define the signal using
two components. Eigenvector 1 looks like a ‘line of best fit’ (Smith, 2002) for the data
110 of 208

whereas eigenvector 2 indicates how far the data deviates from this line. Between them
the two eigenvectors define the combined data sets in two dimensions.
The eigenvalues calculated earlier are associated with these eigenvectors and are a
measure of the importance of their paired eigenvector, or component. The component
represented by the eigenvector that has the highest associated eigenvalue is known as
the principal component and other components can be ordered in term of decreasing
eigenvalue to indicate their relative significance to the combined data sets. When using
PCA in image and other compression techniques some of these lower order components
are discarded thus reducing the amount of data.
In this example the principal component turns out to be represented by eigenvector 1,
with an eigenvalue of 0.1309 compared to 0.0585 for eigenvector 2.
Once these components are known we can form a feature vector that consists of a
matrix with the eigenvectors that we intend to retain in their order of importance.
Feature Vector = (eig1, eig2, eig3, eig4….eign) (Smith, 2002)
If we keep both of our components from the example we have a feature vector of:
Feature Vector = (both components)
If, on the other hand, we are only interested in a single component the feature vector is
made up of only that eigenvector, in this case the principal component (that eigenvector
which has the highest eigenvalue):
Feature Vector = (principal component only)
111 of 208

At this point the new final data set can be derived with one or more of the lower order
components left out by multiplying the transposed Feature vector with the transposed
normalised data.
Final Data = (Feature Vector)T x (Normalised Data) T
Figure 38 shows the derived data set with the feature vector above utilised and only the
principal component remaining.
Figure 38. Derived data set using only the principal component in the feature vector.
The data set could equally well be derived using only the non-principal component as
shown here in figure 39.
112 of 208

Figure 39. Derived data set using only the non-principal component in the feature vector.
Using both eigenvectors to derive the new, reconstituted data set gives the following
data plot. The data is now expressed in terms of the principal components rather than in
terms of x and y coordinates and is a rotated version of the original data shown in figure
37. In effect the eigenvectors are now the axes.
At this stage we can reconstruct the data using either, all, or a limited number of the
eigenvectors we have defined. Figure 40 shows a new derived data set using both
components with data now expressed in terms of eigenvectors.
113 of 208

Figure 40. new derived data set using both eigenvectors to construct the feature vector. The reconstituted data is a rotated version of the original data with the data now expressed in terms of its eigenvectors rather than original x, y
values. The data in this case was rendered as a two channel audio file containing both components.
6.3. Further Examples of Source Separation using PCA
Code was developed in Matlab to carry out PCA processing on audio files in order to
understand more fully the potential for PCA to be used as a process for separating audio
signals in a mixture. Several test separations were attempted and are documented here.
6.3.1. Example 2: Source file: two channel stereo with white noise at -10dB, panned 40% left, Square
wave at 0dB panned 60% right.
114 of 208

Figure 41. Input file for PCA processing
Figure 42. Output File after PCA processing with only principal component remaining.
The signal mixture can be clearly seen in the input file (figure 41) with particularly the
left channel (upper channel) clearly dominated by noise. After carrying out PCA using
the matlab file PCA_single _vector_recon_mix.m (Appendix I) and selecting only the
principal component, the output file (figure 42) has noise largely removed from the left
channel. It is still present in the right channel although subjectively the stereo output has
much less noise in the signal. It is interesting to see how effective the process can be for
removing noise from an audio signal, a close analogue to removing background noise
from speech components in the broadcast domain.
115 of 208

6.3.2. Example 3:
Again the processing here has been carried out on two channel stereo audio files in
order that the process can be easily visualised and the potential for PCA filtering
evaluated more clearly.
Sin and Noise
Figure 43. Input2.wav with 440 Hz sine panned 30% left, white noise panned 30% right
Original data was then restored using only a single eigenvector as follows:
Figure 44. Output2wav - Principal Component Only
Again the PCA algorithm has managed a reasonable degree of separation, the principal
component (shown in figure 44) contains mainly the sine wave component of the mix,
panned to the left, the non-principal component has no visible sine wave component
116 of 208

remaining (figure 45). Given that this is carried out manually with no ‘weighting’ of the
algorithm the PCA method for speech separation looked promising on this evidence.
Figure 45. Output for non-principal component only
The Matlab code was then automated and adapted to allow processing of multichannel
wav files in order that the process could be evaluated with some real-world examples of
5.1 surround audio media. Code was developed that read multi-channel audio files into
Matlab for this purpose. Unfortunately the somewhat non-standard nature of the
multichannel wav file format meant that none of the multichannel wav files capable of
being output from Adobe Audition could be read using Matlab’s wavex function.
Because of this issue the code was adapted to work on multiple mono wav files that
were extracted from DVD media for processing.
Each mono file was opened and input into the next matrix column in Matlab where
similar code as that already developed could be used to carry out PCA. After processing
the individual columns were read out into separate mono wav files using the wavwrite
function utilising column addresses rather than matrix names in Matlab. The code used
for this can be found in Appendix I.
117 of 208

6.4. PCA Carried out on 5.1 Surround Sound
6.4.1. Multichannel from 5 mono wav files - speech in centre
This example utilised a short audio excerpt from the film The Matrix (Wachowski and
Wachowski, 1999). PCA was carried out on the 5 channels of the 5.1 channel
soundtrack, only the low frequency effect channel being omitted. All but the principal
component of the resulting matrix was deleted and the five individual wav files then
reconstructed.
The speech in this clip is a female voice, the background is loud music in a nightclub
scene. The mix in this case is typical of film material in that the speech is solely present
in the centre channel, no music or atmosphere track is present in centre channel at all
except for a very small amount of foley generated effect (footsteps, rustle of clothes),
left, right left surround and right surround channels all contain music.
This initial experiment with 5.1 material tests the hypothesis that the principal
component of the section of AV material used will be speech and also indicates how an
unweighted PCA algorithm responds to some ‘typical’ film soundtrack material. The
Matlab code used can be found in appendix I, PCA_5_mono_wavs.m.
The Audition screenshot below (figure 46) shows both the original (to the left) and the
processed 5 channel mix (on the right).
118 of 208

Figure 46. screenshot of both input and output of the PCA process carried out on 5 channel film audio
Looking at the input and output waves in figure 46 it can be seen that the PCA process
has effectively muted all but the centre channel so removing all music and background
atmosphere and effects from the clip and leaving only the speech. On the face of it this
would seem to have accomplished what is required; it has removed background noise
detrimental to speech. Also it would be quite feasible to alter the code in such a way that
it merely attenuated the non-principal components by a factor instead of muting
altogether, for example by the 6dB shown to be effective earlier in this thesis.
Given that the eigenvalues associated with each eigenvector indicate the order in which
the components are critical to the overall signal it is useful to view a scree plot of these
eigenvalues which indicates the relative importance of each component (figure 47).
119 of 208

1 2 3 4 50
1
2
3
4
5
6
7x 10⁻³ Eigenvalues for Components
Eige
nval
ue
Component Number
Figure 47. Scree plot of eigenvalues indicating relative importance of each component
Tables 20 and 21 show the eigenvectors and eigenvalues derived from the 5 channel
audio content.
0.2069 -0.1748 0.9614 0.0488 -0.0040
-0.1925 0.6077 0.1899 -0.7467 0.0072
0.0002 -0.0023 0.0032 0.0085 1.0000
-0.6402 -0.6711 0.0346 -0.3723 0.0016
0.7143 -0.3870 -0.1962 -0.5490 0.0043
Table 20. Matrix of eigenvectors
120 of 208

0.0002 0 0 0 0
0 0.0006 0 0 0
0 0 0.0012 0 0
0 0 0 0.0021 0
0 0 0 0 0.0065
Table 21. Matrix of eigenvalues
6.4.2. Speech-biased PCA Algorithm: When Speech is Not Only in Centre Channel
Some 5.1 mixes do not adhere precisely to the Dolby recommendation that speech
should be predominantly in the centre channel only and any solution which attempts to
separate speech from competing background sound must therefore be assessed with
regards to these other, less standard, mixes. Examples include some movie material
analyzed during this research which had speech panned either between left and centre or
between right and centre depending on who was talking e.g. (Altman, 2001)) and a
considerable amount of BBC entertainment and also BBC and BSkyB sport
programming that has speech spread across the front three channels of the 5.1 mix.
In the following experiments a weighted PCA algorithm was used in the same way as
described by Zielinski (2005), the intention being to determine whether this solution is a
credible solution for other real world broadcast material instead of only for material that
only has speech, and speech only in the centre channel throughout the programme
material and the artificial scenario constructed in Zielinski’s work where a pair of
channels were swapped over. The input for these experiments was in two parts; a
reference 5.1 audio section taken from the media to be processed, carefully selected to
contain speech, had a band pass filter applied to it with the same characteristics as
described in the aforementioned paper, discarding those frequencies that contained no
speech components. PCA was carried out on the filtered reference audio and the
principal component identified from the mix with this positive bias towards ‘speech
121 of 208

frequencies’. The second complete unfiltered input had PCA carried out on it and all
components except the principal component based on eigenvectors and eigenvalues that
had already been determined by the filtered reference are attenuated or deleted. The
PCA process is therefore biased, or weighted, as shown in figure 48. Matlab code for
this processing can be found in appendix I,
Figure 48. System diagram showing a ‘speech filtered’ covariance matrix determining attenuation or deletion of components in unfiltered path
For the purpose of ascertaining the effectiveness of the process the attenuation factor
has been set to delete all but the non-principal components however setting a different
value (such as -6dB used in the Clean Audio Project) is a trivial matter of altering a
single variable value.
The following two scenarios have been mixed to reflect examples found in broadcast
practice where Dolby recommendations of speech to be in centre channel have not been
strictly observed.
122 of 208

6.4.3. Speech-biased PCA Algorithm: Speech across left,
centre and right channels
Figure 49. Panning reassignment for centre channel across left, centre and right of the 5.1 mix, other channels are mixed as usual
The input was mixed to reflect common BBC Entertainment and Sport, and Sky Sport
practice of panning speech across the front three channels of the the 5.1 mix (shown in
figure 49). The processed output waveforms had subjectively slightly less background
music than the input but this was much less noticeable than when speech and music
were in discrete channels in a ‘standard’ 5.1 mix. Some speech (panned to centre, left
and right as in some BBC TV entertainment and sport programming) was also present in
the rear surround channels of the output although much of the music had disappeared
from the rear channels.
A screenshot of the input and output waveforms for all 5 channels can be seen in figure
50. Channel order is as follows: 1- left, 2 - right, 3 - centre, 4 - left surround, 5 - right
surround.
123 of 208

Figure 50. input and output waveforms shown in screenshot showing some attenuation of non-speech elements in left and right but added music in centre.
!"#"
$"%"
&"'"
(")"
*"+"
#!"
#" $" %" &" '"
!"#$%&'()$
*
+,-.,%$%/*%)-0$1*
Figure 51. Scree plot of eigenvalues
124 of 208

6.4.3.1. Matrix of Eigenvalues
0.0002 0 0 0 0
0 0.0005 0 0 0
0 0 0.0008 0 0
0 0 0 0.0022 0
0 0 0 0 0.0093
Table 22. Matrix of Eigenvalues
Looking at the eigenvalues derived in the case where speech is spread across left, centre
and right channels, the eigenvalue of the principal component was 0.0093 compared to
an eigenvalue of 0.0065 for the principal component where speech is present in centre
channel only. This indicates that the principal component was much more clearly
defined in this instance. The output waveforms had subjectively less background music
than the input waveforms overall but this was much less noticeable than when speech
and music were in discrete channels in a ‘standard’ 5.1 mix. Most reduction of
background (music in this case) has taken place by removal from the surround channels
which had no speech element present. However some speech (panned to centre, left and
right in the input file as in some TV entertainment and sport programming) was now
present in the rear surround channels. Although the principal component is clearly
defined the PCA process was much less effective at separating speech from competing
sources than in the case where speech was in a separate channel. The principal
component seems to have been a mix of speech and background music.
125 of 208

6.4.4. Speech-biased PCA Algorithm: Speech between Centre
and Left (or right)
One example of a mix that does not adhere to Dolby guidelines is where speech is
panned between centre and either left or right. Typically, although fairly rarely, this is
used in movies for a close up scene with talkers to left and right of the cinema screen.
Speech is still anchored to the cinema screen but the technique serves to give some
separation to the voices.
Figure 52. Panning reassignment for centre channel between left and centre of the 5.1 mix, other channels are mixed as usual
126 of 208

Figure 53. input and output waveforms shown in screenshot showing attenuation of non-speech elements in right and surround channels
!"#"
$"%"
&"'"
(")"
*"+"
#" $" %" &" '"
!"#$%&'()$
*
+,-.,%$%/*%)-0$1*
Figure 54. Scree plot of eigenvalues
127 of 208

0.0002 0 0 0 0
0 0.0006 0 0 0
0 0 0.0007 0 0
0 0 0 0.0023 0
0 0 0 0 0.0086
Table 23. Matrix of eigenvalues
The highest eigenvalue (indicating the principal component) was again high at 0.0086
although not as high as in the previous case when speech was across three channels.
Subjectively the PCA process reduced the background music more effectively and
removed music entirely from right, right surround and left surround. Some music was
also added to the centre channel which previously contained only speech content.
6.4.5. PCA Algorithm with Dynamically Allocated Components
One shortcoming of the proposed PCA method is that after user intervention to identify
a section of media with speech present it is assumed that speech remains panned in this
position for the duration of the programme material. In order to dynamically re-evaluate
components in the PCA system code was developed to operate the PCA process on short
sections of audio. The code operated in a similar way to that described previously; two
parallel paths were utilised as shown in figure 61 with one subject to a speech frequency
bandpass filter and the calculated components being applied to the unfiltered audio path.
An overlapping Hanning window envelope function was implemented into the Matlab
code which split audio into 500ms sections with a 50% overlap. For each 500ms section
of multichannel audio all components other than the principal component were muted
and the audio reconstituted in order to assess the impact of a dynamically adaptive PCA
process on multichannel audio. The input multichannel audio was the same section of
The Matrix as was used in the first example. It is mixed according to Dolby guidelines
with only speech and some foley in the centre channel.
128 of 208

Input Output
Figure 55. Input and output waveforms from a dynamically adapting PCA process on a ‘standard’ 5.1 surround mix. Note the gating like effect wherever speech is present in the multichannel content
It can be seen from the screen shot in figure 55 that the dynamic PCA had no effect on
the multichannel audio until speech was present in the mix. For the period that speech
was present (in centre channel in this example) it is identified as the principal
component because of the weighted PCA algorithm and all other components are
removed. Because of the ‘standard’ mix following Dolby guidelines in this case this
mutes all channels but the centre channel containing dialogue.
For the cases of speech in other common locations documented in 7.1.4 and 7.1.5 the
impact of dynamic analysis of components is predictable based on the examples
documented here. For each period where speech was present the PCA process has the
same effect as already documented, where no speech is present no effect has been
observed. A screen shot example of dynamic PCA output for speech panned between
129 of 208

right and centre is shown in figure 56 where it can be seen that the impact is identical to
that for non-dynamic PCA but only for those sections of audio where speech is present.
Figure 56. Input and output screenshots where speech is between right and centre channels before and after dynamic PCA processing
Again, as with non-dynamic PCA processing on similar mixes of speech between two
channels, there was some reduction in background audio however the effect was much
less noticeable than where speech was panned to a single channel.
Although clearly the process shown here would have a positive impact on intelligibility
for ‘standard’ mixes following Dolby guidelines the audible effect of dynamic PCA for
these mixes was distracting and unpleasant to listen to, sounding much like a ‘gating’
audio effect and so generates a mix that would be unsuitable for a television audience. It
is not therefore a useful process for generating accessible audio at the STB. However it
is proposed that it could have application at post production and pre-broadcast stages of
the broadcast chain as a tool to identify the location of speech content in a 5.1 surround
soundtrack. If run as a preprocessor prior to broadcast it could be utilised to
automatically set or unset the bit already identified in Dolby metadata (encinfo) to
indicate whether clean audio processing (as defined in this thesis and documented in
(ETSI, 2009)) would be beneficial to intelligibility and so would be an appropriate
130 of 208

treatment for the programme material if a HI output was selected. Where speech was
not present in centre channel only no processing or remixing would be carried out.
6.5. Discussion
Some important considerations have to be taken into account before accepting principal
component analysis as a useful process for speech detection and enhancement for
broadcast as suggested by Zielinski in (Zielinski et al., 2005). Firstly some considerable
human interaction needs to take place before the process as defined can be effectively
carried out. In that research the choice of which section was used to generate the
unmixing matrix was key to the success of the method for the media utilised in the
research. Additionally the method assumes that the unmixing matrix generated by PCA
of this section is applied to all of the 5.1 material, the assumption being that this will be
appropriate for the entirety of the remaining media.
There are two main problems with this approach. Firstly the decision to base the
experiments on a contrived 5.1 mix where left surround and centre channels had been
swapped is flawed when looking for a solution that can be applied to real world
broadcast material. It is incorrect to state, as the paper does, that the Clean Audio
solution proposed earlier in this thesis assumes the speech will always be in centre
channel. The Clean Audio work presented in chapter 3 rather proposes a situation where
processing will only be applied if the speech is in centre channel only. A single bit in the
AC-3 metadata would be set to 1 or 0 depending on whether a clean audio process was
appropriate. This bit had been identified by Dolby at the time of the original research
(encinfo) however the imminent release of Dolby Digital+ (E-AC-3) and potential
issues for some legacy equipment made implementation unlikely. Secondly, for all of
the media examples that were analysed during the research carried out in this thesis,
wherever the speech was not present in centre channel, it was always present in more
than one channel, usually centre and left, centre and right or centre, left and right. In
some movie content analysed the speech was also dynamically changing panned
position; for most of these movie examples the speech was usually in centre channel -
the instances stated above, such as between centre and left or right, were for specific
131 of 208
scenes and not consistent throughout the media. In these circumstances the weighted
PCA solution proposed is at best unpredictable and for the fairly common TV broadcast
scenario of mixes with speech across three channels it is largely ineffective as indicated
by the experiments documented here.
The adaptation of the technique using dynamically changing PCA components, while
avoiding the issue of changing mixes scene-by-scene, is also inappropriate to directly
generate accessible audio at the set top box. Its gating effect is unpleasant and
distracting to listen to and the variable attenuation caused by the aforementioned mix
shifts between scenes make it unpredictable. It is possible however that a dynamic PCA
method such as that applied here may be useful in generating metadata to be embedded
in media prior to broadcast.
6.6. Conclusions
Using speech biased principal components analysis as proposed by Zielinski et al
(2005) has been show to be effective only for mixes following Dolby guidelines and
ineffective when assessed using other common mixing paradigms used in film and
television. The technique relies heavily on consistency as to where speech is panned
throughout the duration of the media content and requires user input wherever speech
resides elsewhere in a 5.1 surround mix. An adaptation of the technique documented
here utilising dynamic adaptation of PCA components is shown to be effective at
picking out speech across a range of 5.1 mixes and may have application in
automatically generating metadata which could be appended to untagged media content
prior to broadcast indicating whether a ‘clean audio’ mix would be appropriate as a HI
output. Further experimentation would be required to assess the performance of this use
compared to other speech detection algorithms (Van Gerven and Xie, 1997). For
example, a single tag could state whether speech was consistently in centre channel only
or tags could be added at regular intervals indicating whether it was appropriate for
large or small sections of the media content. Given that Dolby metadata is constantly
received by the STB at the user end it would be feasible to set or unset an accessible
audio bit for almost any duration of programme material and update this option on a
regular basis.
132 of 208

7. Accessible Audio ImplementationsThe research outlined in this thesis has already impacted on the development of
standards and guidelines for digital TV and these have been documented earlier in this
thesis together with details of how the research findings have informed development of
international guidelines for IPTV.
This chapter describes two experimental implementations of accessible audio for
hearing impaired people that have resulted from the research documented in this thesis.
The first was implemented by Dolby Labs (San Francisco) and was based on research to
generate accessible TV audio following their involvement in the UKCAF. The second
example was implemented by the author as part of the EU FP7 FascinatE project which
developed a complete end-to-end future AV broadcast system including an object based
implementation of clean audio. The first section therefore documents test design and
listening tests supervised by the author under a Dolby Labs funded project at the
Acoustics Research Centre at University of Salford which aimed to assess the potential
for a process developed by Dolby Labs to improve TV audio for hard of hearing people.
The second section of this chapter documents the FascinatE clean audio solution and the
developments required in production techniques in order to apply this method to TV
broadcast. These represent both a potential solution driven by industry for current
broadcast systems (in the case of Dolby Labs) and a solution implemented for future
broadcast systems (FascinatE’s object based accessible audio solution).
7.1. Dolby ‘Clear Audio’ Implementation
7.1.1. Introduction
Following the original Clean Audio Project research and it’s presentation at DVB in
Geneva a clean audio implementation was developed by Dolby Labs. The process
utilised a speech detection algorithm to identify if speech was present in centre channel
133 of 208

and attenuated other channels as per the EBU guidelines which came from chapter 3 of
this thesis. In addition it also applied multi-band compression techniques such as those
found in digital hearing aids to the centre channel. The details of the process itself are
not covered in this thesis however test design and subjective assessment of the
processes are relevant and are documented here. A series of tests were implemented in
collaboration with Dolby Labs in order to assess the effectiveness of audio processing
developed with the aim of improving TV sound for hard of hearing people. The
methodology involved subjective assessment of AV media; firstly user assessments to
identify appropriate media clips and secondly subjective assessment of processing on
these clips identified as being effectively equivalent in terms of speech clarity.
7.1.2. Methodology
Methodology was broadly similar to that adopted in previous chapters of this thesis with
forced choice paired comparison tests chosen as the most appropriate means. An
additional testing stage stage for media selection was added with the intention of
ensuring that pairs of clip sections used in the tests were shown to be equivalent by a
panel of test participants. Clips were presented over three loudspeakers setup according
to the left, centre and right loudspeakers in ITU-R BS.775-1 in a listening room
confirming to ITU-R BS.1116-2.
7.1.2.1. Listener selection
Hard of hearing and normal hearing participants were recruited by two methods; via
hard of hearing user groups and via a pool of listeners who had previously taken part in
listening tests. Hard of hearing listeners took part that watched TV either with or
without hearing aids but without the use of subtitles or other accessibility aids. An
analysis of listeners who took part in each part of the testing process was carried out to
assess hearing acuity.
7.1.2.2. Selection of test material
The choice of a paired-comparison test paradigm required generating a set of suitable
pairs of content. In previous tests this content had been chosen based on stated criteria
134 of 208

however for these listening tests an additional stage of assessment was built in to
attempt more stringent identification of suitable clips. These test pairs had to satisfy two
criteria:
1. The two sections of each clip pair had to be rated as equivalent on a scale of the
perceptual attribute to be tested (i.e., perceived ease of understanding) and
2. The difficulty of understanding the items should be rated ‘easy’ by non-hearing
impaired listeners and progressively more ‘difficult’ relative to the hearing loss
of the subject.
The second requirement aimed to eliminate material that was inherently difficult to
understand for reasons other than hearing loss, for example because of poor mixes, poor
enunciation, or of prior knowledge needed to comprehend the speech.
A selection of AV media with audio in 5.1 surround format was collected from
broadcast and fixed media sources. These provided the basis for test material selection
and were sampled from the genres movie/drama, news and documentary, animation,
stage shows, and sport. Initially, the recorded material was edited into 82 clips each split
into two sections. Each section’s duration was approximately 15 seconds. Care was
taken to match the two members of the pair as closely as practical with regard to talker,
speaking style, type and level of background sound, and dialogue spoken with the talker
facing the camera.
Eighteen listeners viewed each of the 82 pairs and answered the question “In which
section was the speech more difficult to understand.” Listeners were also asked to rate
the effort required to understand what was said in the more-difficult section on a labeled
5 point scale. The rating scale was labelled as follows:
1. Complete relaxation possible, no effort required;
2. Attention necessary, no appreciable effort required;
3. Moderate effort required;
4. Considerable effort required;
5. No meaning understood with any feasible effort.
135 of 208
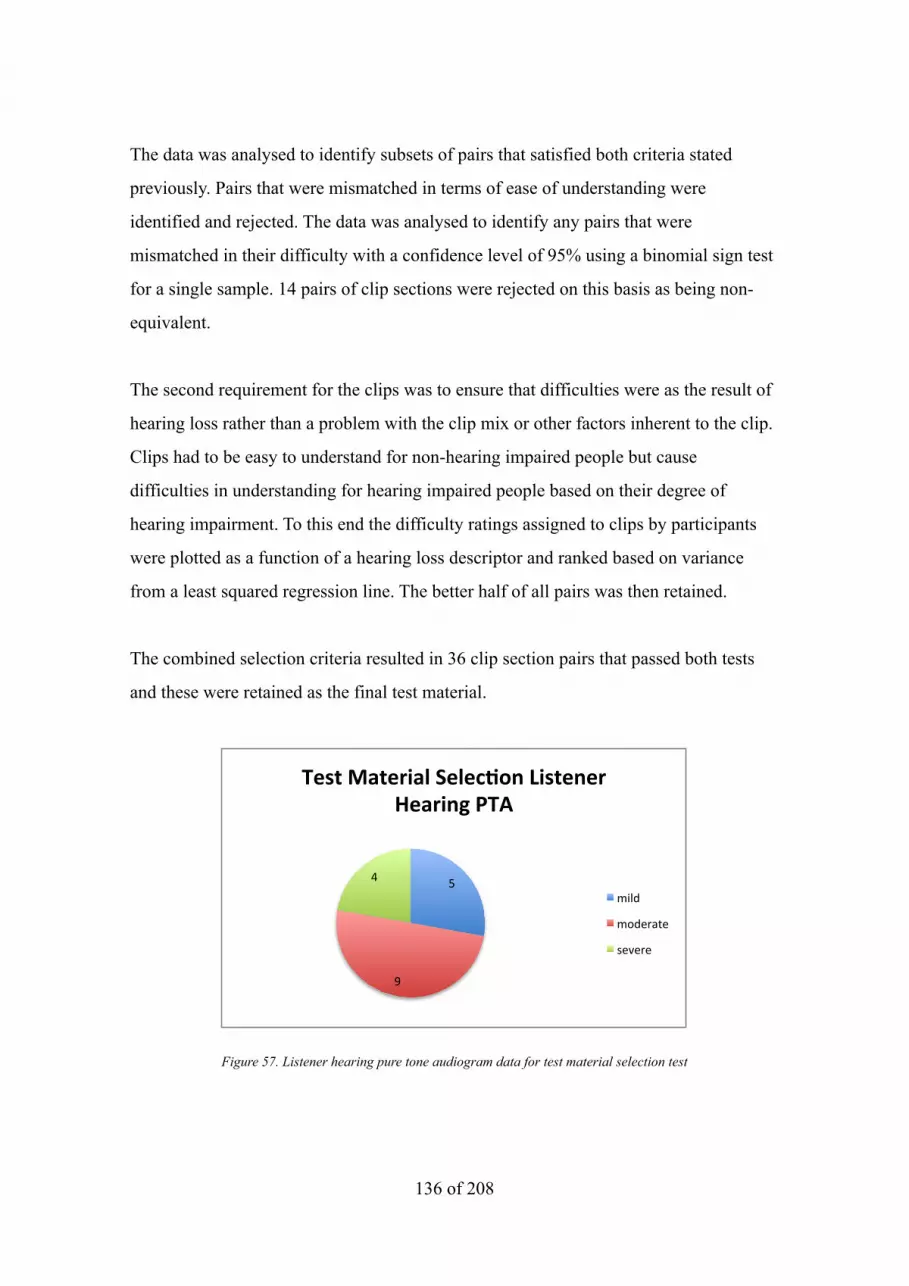
The data was analysed to identify subsets of pairs that satisfied both criteria stated
previously. Pairs that were mismatched in terms of ease of understanding were
identified and rejected. The data was analysed to identify any pairs that were
mismatched in their difficulty with a confidence level of 95% using a binomial sign test
for a single sample. 14 pairs of clip sections were rejected on this basis as being non-
equivalent.
The second requirement for the clips was to ensure that difficulties were as the result of
hearing loss rather than a problem with the clip mix or other factors inherent to the clip.
Clips had to be easy to understand for non-hearing impaired people but cause
difficulties in understanding for hearing impaired people based on their degree of
hearing impairment. To this end the difficulty ratings assigned to clips by participants
were plotted as a function of a hearing loss descriptor and ranked based on variance
from a least squared regression line. The better half of all pairs was then retained.
The combined selection criteria resulted in 36 clip section pairs that passed both tests
and these were retained as the final test material.
!"
#"
$"
!"#$%&'$"()'*%+"*",-./%0)#$"/"(%1"'()/2%3!4%
%&'("
%)(*+,-*"
.*/*+*"
Figure 57. Listener hearing pure tone audiogram data for test material selection test
136 of 208

7.1.2.3. Listening Tests
Listening tests were carried out in a listening room complying with ITU-R BS.1116. 38
hearing impaired and 15 normal hearing participants participated in the tests. Each
subject had an assessment of hearing acuity using standard audiogram techniques prior
to tests being carried out (figure 58).
!"
##"
#$"
%"
!"#$%&"&'()%#$(!"#$%&%*(+%,*"&'(-).(
&'()*(+,-*./012"
2,+)"
2')*(/3*"
0*4*(*"
Figure 58. Listener hearing pure tone audiogram data for test material (38 participants)
Participants were asked to view two sections of AV material subject to different
conditions and to choose their preferred section in terms of overall sound quality and
speech clarity. They were also asked to rate how much better their preferred clip was for
each choice.
Processes assessed were:
• Clean Audio with surround channels removed and left and right channel at -6dB
as per ETSI TS101154 Annex E.4 (based on research documented in chapter 3
of this thesis)
• Variation 1 of Dolby’s clear audio process.
• Variation 2 of Dolby’s clear audio process.
• Unprocessed reference
The answer sheet used by participants can be found in Appendix D. Clip order was
varied such that each condition was compared an equal number of times as first and as
137 of 208

second section in order to avoid the recency effects noted in earlier research (Shirley
and Kendrick, 2004) and documented in chapter 3 of this thesis.
Presentation of material was identical to that used in the previous research already
mentioned: clip sections were played back as follows:
a. Black screen, title: Clip 1
b. Black screen, title: Section A
c. Section A with first condition to be assessed played
d. Black screen, title: Section B
e. Section B with other condition to be assessed played
It was considered useful after each set of tests to informally discuss with each subject
their experience of the tests and of TV sound and their hearing difficulties. In several
studies carried out as part of this PhD such unstructured or semi-structured informal
interviews with participants have been useful in providing understanding of results
obtained, and in several cases provided real insight into the experience of hearing
impaired and older people in interacting with broadcast technology and television audio.
During some of these interviews after early pilot tests it became clear that a small
number of the participants were unclear about, or had misunderstood, the instructions
for the test. Results to that point were considered unreliable and these were discarded.
The test instructions were then redesigned based on information obtained from the
participants who had taken part in the tests so far, and, from then on, a trial test was
carried out with each subject with a researcher present to guide them through the
procedure. A break was also arranged part way through each participant’s tests and a
second researcher queried the subject about how they were finding the test and asked
what they were being asked to do. This functioned both as a natural break to avoid
fatigue and also as a check that the subject understood instructions clearly. After these
alterations had been made to the test procedure it was felt that tests could proceed with
confidence, that participants would understand the test instructions clearly and any
misunderstandings about test procedures would be identified quickly.
138 of 208

7.1.3. Experimental Results
Two factor mixed measures ANOVAs were carried out for speech clarity and for sound
quality ratings. Conditions assessed were as follows:
UP Unprocessed
EBU Clean Audio with surround channels removed and left and right channel at
-6dB as per ETSI TS101154 Annex E.4.
DLB Dolby clear audio process, example 1.
DLB Dolby clear audio process, example 2.
Overall Sound Quality
Main effects from the two factor ANOVA showed no statistically significant difference
in sound quality ratings between hearing impaired and non-hearing impaired groups.
The audio condition main effect however showed a significant effect on ratings of
overall sound quality.
Speech Clarity
Looking at main effects there was a statistically significant interaction between the
participants’ hearing ability and audio condition on perceived speech clarity.
Although there was no statistically significant difference in clarity between HI and non-
HI groups for the UP, EBU and DLB1 conditions there was shown to be a statistically
significant difference in clarity between HI and non-HI groups for the DLB2 condition.
One way repeated measure ANOVAs were carried out for speech clarity and for sound
quality ratings for hearing impaired and non-hearing impaired groups separately.
Overall results from the repeated measures ANOVA for the hearing impaired subject
group at a 95% confidence level indicated no significant differences between the means
for either sound quality or for speech clarity. Because main results across both groups
indicated some significant differences between the hearing impaired and non-hearing
impaired groups the results are presented here for completeness (table 59 A&B).
139 of 208
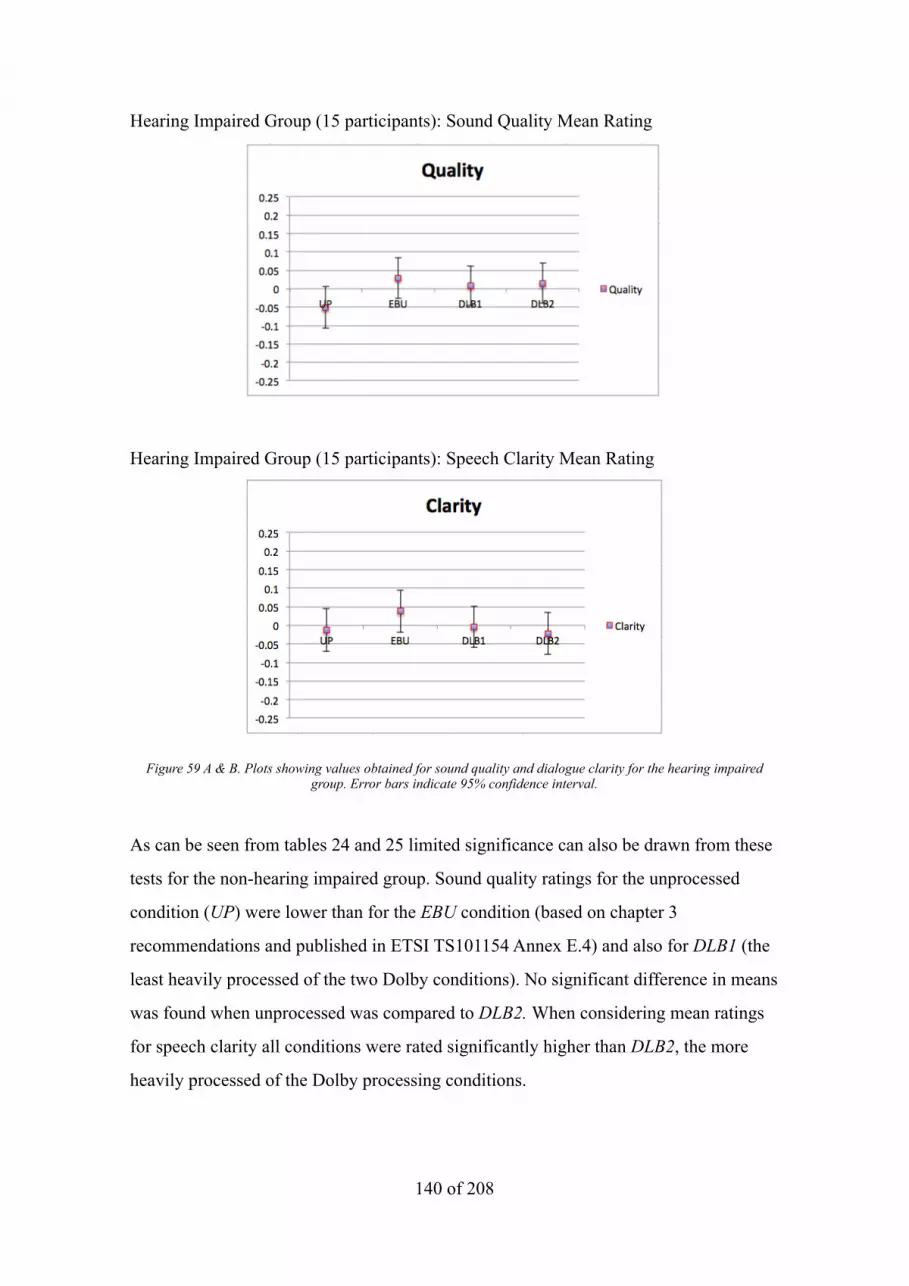
Hearing Impaired Group (15 participants): Sound Quality Mean Rating
Hearing Impaired Group (15 participants): Speech Clarity Mean Rating
Figure 59 A & B. Plots showing values obtained for sound quality and dialogue clarity for the hearing impaired group. Error bars indicate 95% confidence interval.
As can be seen from tables 24 and 25 limited significance can also be drawn from these
tests for the non-hearing impaired group. Sound quality ratings for the unprocessed
condition (UP) were lower than for the EBU condition (based on chapter 3
recommendations and published in ETSI TS101154 Annex E.4) and also for DLB1 (the
least heavily processed of the two Dolby conditions). No significant difference in means
was found when unprocessed was compared to DLB2. When considering mean ratings
for speech clarity all conditions were rated significantly higher than DLB2, the more
heavily processed of the Dolby processing conditions.
140 of 208

Non-Hearing Impaired Group (15 participants): Sound Quality Mean Rating
!"#$%&!"#$&!"#'%&!"#'&
!"#"%&"&
"#"%&"#'&"#'%&"#$&"#$%&
()& *+(& ,-+'& ,-+$&
!"#$%&'(
./01234&
Non-Hearing Impaired Group: Speech Clarity Mean Rating
!"#$%!"#&'%!"#&%!"#('%!"#(%
!"#"'%"%
"#"'%"#(%
"#('%"#&%"#&'%
)*% +,)% -.,(% -.,&%
!"#$%&'(
/012345%
Figure 60 A & B. Plots showing values obtained for sound quality and dialogue clarity for the non-hearing impaired
group. Error bars indicate 95% confidence interval.
141 of 208

7.1.4.Statistical Significance of Results
As already discussed no statistically significant results were obtained for hearing impaired participants. Statistically significant results for the non-hearing impaired group are presented here.
7.1.4.1. Non-Hearing Impaired Participants
Sound Quality
Table 24. P-values for each pairwise comparison for sound quality ratings, highlighted values <0.05 indicate statistical significance.
Speech Clarity
Table 25. P-values for each pairwise comparison for speech clarity ratings, highlighted values <0.05 indicate statistical significance.
7.1.5. Conclusions
For the hearing impaired group no significance was found from ANOVA analysis. One
potential contributing factor for the lack of strong evidence could be that the wide range
of hearing impairments present in the subject group led to them responding very
differently when rating the conditions. Although the range of hearing impairments is
broadly comparable to previous listening tests, this is the first set of tests in this thesis
where a frequency dependent process has been assessed. A contributing factor may be
142 of 208

that the process developed by Dolby carries out some multi-band compression
techniques on the audio, similar to DSP carried out in hearing aids. This could have had
unintended effects in two ways. The parameters of digital hearing aids are adjusted
individually based on an individuals hearing impairment however for DLB1 and DLB2
conditions general settings were attempted based on an ‘average’ hearing impairment. It
is likely that for some hearing impaired individuals this processing actually made
speech clarity and quality worse. For the non-hearing impaired subject group this was
indeed the case and the more extreme of the processed conditions was rated lower than
all other conditions for speech clarity (p<0.05) by this group. Participants experienced
the media ‘as they would at home’ so some of the hearing impaired group wore hearing
aids during testing and the addition of an extra stage of processing could have had
unpredictable consequences on ratings. There is an unfortunate side effect of the nature
of the test method adopted here which was not apparent in previous tests because of the
nature of the conditions assessed. Because every condition is tested against every other
condition many times (AB, BA and every clip with every process to avoid recency and
section non-equivalence effects), where there is a condition, or conditions, present that
are rated very differently by participants in the same group it can create statistical noise
that will reduce any significance in the results. It is thought that this is the main
contributing factor here. Where there is potential for very different experiences between
participants of the same condition (e.g. frequency based processing with participants
using hearing aids) a different test method should perhaps have been used.
An additional factor not present in previous tests was the extensive pre-testing of clips
to try and ensure section equivalence during testing. Given the range of hearing
impairments present in participants who took part in these pre-screening tests, it is also
possible that the sections were less useful and less equivalent than those picked
manually by a non-hearing impaired researcher based on strict criteria for listening tests
(as in chapters 3 and 4 of this thesis).
The clearest conclusion that can be drawn from the results of these tests is on listening
test design; simplicity in test design may be key to reducing unknown variables.
Specifically reducing the number of condition comparisons would reduce the impact of
143 of 208

unpredictable ‘outlier processes’ that are perceived very differently by different
participants in the same group and so reduce significance. More generally the
additional steps introduced to try to make the tests more valid may also have introduced
unexpected additional variables that impacted on results in unknown ways and created
further statistical noise reducing the significance of results.
144 of 208

7.2. Object Based Audio Solution: The FascinatE Project and Accessible Audio
The FascinatE project (Joanneum Research et al., 2010) was an EU FP7 project that
developed a complete end-to-end future broadcast system designed to be format
agnostic and interactive based on user navigation of an ultra high definition panorama
with accompanying 3D audio. As the project partner responsible for much of the audio
part of the FascinatE project the author implemented accessible audio as part of the
project deliverables. The FascinatE project outcomes give an interesting view of how
accessible audio could be implemented in a future object based audio system alongside
other interactivity. This section presents an overview of object based audio and it’s
purpose in the FascinatE project, describes the project implementation of accessible
audio and describes the techniques developed that would need to be adopted by the
broadcast industry in order for these methods to become a reality. The FascinatE project
completed in July 2013. Some of this material is adapted from (Shirley, 2014).
7.2.1. Object Based Audio Review
In the FascinatE project object based audio was utilised as a means to provide a
dynamically matching audio for interactive navigation through an AV scene. The project
captured a very high resolution panorama of 7K resolution (approx 7K x 2K pixels) and
allowed pan, tilt and zoom navigation of the panorama by the user. In order to provide
matching audio for the user defined scene it was necessary to move away from a
conventional channel based audio paradigm.
Instead an object based paradigm was used to capture the audio scene without reference
to any specific target loudspeaker configuration. Instead of defining captured audio
events as emanating from a given loudspeaker or from between two loudspeakers of a
target loudspeaker layout as is the case with channel based audio, events were captured
complete with 3D coordinate information specifying where in the audio scene the event
had taken place. This is analogous to a gaming audio scenario and, in the same way as a
first person game allows navigation around and between audio objects, the object based
audio capture enabled users to pan around and zoom into the AV scene with audio
145 of 208

events remaining in their correct locations. It was possible in the FascinatE system to
zoom across a scene and past audio objects which would then move behind the user’s
viewpoint thus realising a realistic audio scene to match the chosen visual viewpoint.
Other non-spatial uses of object based audio have been proposed; BBC research has
implemented object based audio in a test radio broadcast which used audio objects to
tailor the radio programme depending on the listeners geographical location (Forrester
and Churnside, 2012). Object based audio allowed specific audio events that made up
the programme such as sound effects, actors’ voices and music to be customised based
on geographical location and the date and time of access to the radio programme. The
programme was delivered over IP and used the HTML5 standard to carry out all audio
processing and mixing at the user end. Another use of audio objects proposed by the
BBC was to be able to change the duration of a programme by adjusting the spaces
between audio events, without any need for time stretching or other process that may be
detrimental to audio quality or intelligibility. An implementation of object based audio
by Fraunhofer is described in a paper not yet published at the time of writing and
involves using parametric data to unmix signals from a transmitted stereo, or 5,1, mix.
7.2.2. Object Based Accessible Audio in the FascinatE Project
By combining the production and acquisition techniques developed in the FascinatE
project, and applying some of the customisation principals of perceptive media a system
was developed that could provide an accessible audio output without any need to
address the issue of separating speech components from the background ‘noise’ that has
been the subject of much of this thesis. By maintaining a separation of all audio
components and objects that make up a programme throughout the broadcast chain it
was possible to enable mixing of every aspect of broadcast audio at the user end based
on user preferences including a requirement for accessible audio for hard of hearing
people.
For a produced programme such as that described in the Forrester and Churnside’s work
on perceptive radio it is relatively trivial to enable a hearing impaired mix to be made
146 of 208

via simple user command; sound effects and music could be lowered relative to
dialogue for example, and an implementation of 6dB or any other attenuation of non-
speech content (even one customised based on user requirements) would be
straightforward and could be readily adapted for accessibility purposes. The FascinatE
project however focused on broadcast of live events and this created considerable
challenges for the provision of object based accessible audio. The project covered a
range of event genres as part of test shoots and the example given here, that of live
sports broadcast, is of most relevance to the concept of clean, or accessible audio.
7.2.3. Accessible Audio for Live Sports Coverage
Consideration of providing accessible audio for sports coverage introduces an
interesting question as to what audio should be considered useful and retained, and what
should be considered as background noise that may be considered detrimental for
comprehension of the programme material. The FascinatE project used the example of
live football coverage as one of its test scenarios and this provides a good illustration of
techniques developed that would be of equal relevance to other live event genres.
Clearly, as in other programme genres discussed in this thesis, speech (in this case
commentary) is an important component to understanding the narrative of and meaning
of events during the football game. One could gain a clear understanding of what is
happening on the football pitch by listening to the commentary channel alone however,
for example, the sound of a referees whistle also provides meaning. Sound design
techniques such as hyperreal and exaggerated ball kick sounds that have become
commonplace over the last 20 years indicate that all of these on-pitch sounds are
considered important to the experience of enjoying a televised football game. Indeed the
exaggerated on-pitch sounds introduced to live sport by Sky have been adopted in
computer gaming and have become synonymous with live sports coverage. There is a
parallel here with diegetic and non-diegetic sounds in film. Diegetic sounds are usually
defined as “sounds whose source is visible on the screen or whose source is implied to
be present by the action of the film” (Carlsson). In improving the TV experience of hard
of hearing people it may be that diegetic sounds that are critical to the narrative of the
programme should be treated differently to the background ‘noise’ whose reduction has
147 of 208

been the focus of this thesis. To this end three categories of sounds were considered
here; speech content whose comprehension is critical, background noise that has been
shown to be detrimental to both clarity and to perceived overall sound quality, and other
non-speech sounds that are considered important to comprehension and/or enjoyment of
the material. In approaching an object based audio broadcast these should each be
capable of being processed or mixed independently either directly by the user, or based
on predetermined user preferences at the set top box. In the example of live football
broadcast these categories consisted of speech in the form of live commentary, crowd
noise that could be considered as detrimental to comprehension, and on-pitch sounds
such as ball kicks and the referee’s whistle blows that may be important for
comprehension and also for perceived overall sound quality. In current TV broadcasts
these discrete audio object categories are not available at any point in the broadcast
production chain.
In order to provide these three sound sources as independent and controllable entities
some considerable development had to take place in the acquisition and production
techniques used to capture a complex sound scene such as that found at a live sports
event. Currently the key objectives for audio in football coverage are twofold; picking
up sounds on the pitch as clearly as possible during the game, and utilising the 5.1
surround sound capability to give the viewer a sense of immersion and of ‘being there’.
These objectives are achieved by use of two separate microphone setups common to
Premiere League coverage and also coverage of World Cup and other international
football.7
For on-pitch sounds the ball kicks and whistle blows are happening some distance from
any possible microphone position so shotgun microphones are used to pick them up.
Twelve shotgun microphones are positioned around the football pitch facing towards the
action. If all of the microphones are live in the mix at any given time the background
noise from the crowd swamps the sounds from the pitch making them inaudible. In
order to prevent this from happening, microphones are mixed live so that only the
microphone, or microphones, closest to the ball location is in the mix at any given time.
148 of 208
7 Although this setup is common for football, capture techniques vary between live events.

This requires a skilled sound engineer to follow the action on the pitch on the mixing
console in the outside broadcast truck and ensure that only the appropriate microphones
are active in the mix. As the broadcast is live the engineer must predict where the ball is
going to be next but also has to be aware of what likely camera angles will be chosen by
the producer. At any given moment during the event between one and three
microphones will be active in the mix. All of these microphones are panned centrally,
either to a central loudspeaker, or more often to a phantom centre between left and right
in order to avoid any potential issues from the downmixing process.
The crowd sound for live football coverage is considered key to building the
atmosphere for the television viewer and is usually picked up by a single Soundfield
microphone suspended from the gantry above the crowd. The Soundfield microphone
consists of four near-coincident microphone capsules arranged as a tetrahedron. The
four outputs are encoded into a B-format ambisonic (Gerzon, 1980) signal by a
microphone controller on the gantry. The B-format signals from the Soundfield
microphone define the sound in three dimensions at the microphone location and these
can, if desired, be decoded for periphonic (with height) reproduction. The four B-format
signals (W, X, Y and Z) are sent to the OB truck as AES 3-id (AES, 2009) signals on
unbalanced BNC cables. For television broadcast the Z (height) component is ignored
and the B-format signals are decoded into a 5.1 feed at the OB truck. This 5.1 crowd
noise channel is mixed into surround and left and right channels of the 5.1 programme
audio both to give a more immersive experience for viewers and also to cover up any
audible artefacts from mixing between the pitch-side microphones. Although the pitch-
side shotgun microphones pick up many of the sounds on the pitch that are of interest
the audio feeds from these also contain large amounts of crowd noise. Trying to separate
these on-pitch sounds by reducing the mix of the Soundfield microphone dedicated for
crowd noise leads to unpleasant and disorientating effects as microphones in different
areas of the stadium are faded in and out. Therefore in order to provide an object based
accessible solution such as that described there was a need to develop a method of
separating out on-pitch sounds effectively from crowd noise.
149 of 208

Method: New Production Techniques for Audio AcquisitionThe development documented in this section was carried out as part of Work Package 2
of the FascinatE project (Joanneum Research et al., 2010) by the author and a Research
Assistant on the project (Rob Oldfield) and some parts of the work are published in
(Shirley et al., 2014)(Oldfield et al., 2012) and (Kropp et al., 2011). Research was
carried out by the author, software development for audio object extraction was carried
out by the Research Assistant under the direction and supervision of the author, test
captures of live events were carried out in collaboration with other members of the
FascinatE project consortium and with the cooperation of SISLive, Chelsea Football
Club and the BBC.
In order to extract on-pitch sounds from the audio scene as audio objects techniques
were developed that were designed to cause minimum change to the current workflows
of sound engineers. The methodologies adopted utilised the same microphones that are
already used and were designed to provide a largely automated system for the broadcast
production team. Considerable research was carried out into existing workflows,
interviews were held with sound engineers from SISLive and Sky and site visits carried
out to outside broadcasts to elicit a detailed understanding of the processes currently
carried out and of the problems associated with providing robust separation of sounds
that could both be used for spatially positioning the resultant audio object (in the
FascinatE project) and that would be potentially useful for comprehension and
enjoyment of hard of hearing people in more traditional broadcast scenarios.
Microphone feeds from every microphone used were captured on site including all
pitch-side microphones and a Soundfield microphone and an Eigenmike (Barnhill et al.,
2006) capturing crowd noise. These were stored on hard disc for later processing along
with a separate BBC commentary feed. Audio object templates were developed for each
class of sound that was required to be captured as a discrete object, in this case
templates for ball kicks and whistle blows based on envelope and spectral content were
created. Software was developed that monitored every pitch-side microphone,
comparing it to the stored audio object template. When a matching sound event was
150 of 208

detected in a microphone feed all other microphone feeds were scanned for matching
characteristics to identify all microphones that had some element of the event present in
its feed. For every pair of microphone feeds that picked up the event a hyperbola, along
which the event must have occurred, was calculated based on the difference in time of
arrival of the sound at the two microphones. Where more than two microphone pairs
had captured the sound event the intersections of the calculated hyperbolas gave an
accurate coordinate location for the sound event. In the FascinatE project, which utilised
object based audio for spatial positioning of audio objects in surround and 3D
reproduction systems, these coordinate locations were used to automatically spatially
position the sound dependent on a user defined viewpoint, by a virtual director system
(Weiss and Kaiser, 2012) or on a viewpoint defined by the production team. In the case
of audio objects for accessible audio the critical factor is different; the audio objects
would still be panned centrally, as in current broadcast, and the key outcome is to
identify the event, and extract it from the acoustic scene in isolation from crowd noise
and other sound that may be detrimental to clarity.
In order to accomplish this the microphone feed containing the loudest example of the
sound event was identified based on the derived location of the sound event. Once this
microphone was identified an envelope was applied to the microphone feed based on
the temporal characteristics of the detected sound event. In this way relevant pitch-side
microphones were only ever active in the produced mix for the duration of the sound
event. The short section of crowd noise picked up by that microphone was then
effectively masked by the sound event itself. A flow diagram for the object extraction
process can be seen in figure 61. The resultant audio object, together with its paired
coordinate metadata was coded into the broadcast audio stream for decoding at the
rendering device.
151 of 208

Figure 61. Flow diagram illustrating audio object extraction developed in the FascinatE project.
Figure 62. Hyperbola indicating possible locations of sound event based on time difference of arrival at 2 microphone positions.
152 of 208

Figure 63. Intersecting hyperbolas indicating derived location of sound event based on time difference of arrival at multiple microphone positions
The user of the system was presented with an interface enabling selection of pre-
determined reproduction mixes the input of which was three discrete streams of audio.
1. Clean BBC commentary feed with no background noise taken directly from the
commentary microphone.
2. Crowd noise from the Eigenmike located on the gantry at the camera position
3. On-pitch sounds extracted using the audio object extraction techniques described
here.
The three streams were combined and transmitted over IP to the audio part of the
FascinatE Render Node (FRN). The FRN consisted of the audio composer (developed
by University of Salford) and the audio presenter (developed by Technicolor). The
audio composer was responsible for decoding the various audio streams and metadata
received, arranging them spatially and mixing them based on user input and on scripts
generated as part of the production. User input included the chosen user defined scene
including pan, tilt and zoom information necessary to spatially position the on-pitch
audio appropriately for the chosen camera view, and also user-choices of relative levels
of foreground (commentary and on-pitch) and background (crowd) sound. Script
information was generated in two ways, at both production and user end.
153 of 208

Figure 64. Clean Audio in FascinatE: Extracted audio objects, crowd noise and clean commentary multiplexed for
transmission, decoded and reproduced by the FascinatE audio render node
At the production end scripting data was generated both automatically and manually
including automatically chosen regions of interest determined by the virtual director
(developed for FascinatE by the Joanneum Research Institute) or by producers. At the
user end user preferences in the rendering device would provide further scripting input
and this included choices based on user access requirements such as preferred speech
level relative to background noise.
Results
The effectiveness of the techniques developed here in successfully detecting and
extracting sound events compared to current broadcast methods was assessed by
comparing events detected and extracted with the number of events present in BBC
broadcast of the football match. These results are shown in table 26.
154 of 208

Table 26. Comparison of number of ball kicks and whistle blows detected and extracted compared to those audible in BBC broadcast of the same football match (Oldfield et al., 2012)
7.2.3.1. Conclusions
An object based approach to clean audio, combined with methods to isolate sounds that
are important to the narrative and meaning of a broadcast has the potential to enable
users to have complete control of the relative levels of all aspects of audio from TV
broadcast. Any of the solutions previously discussed, such as non-speech channel
attenuation, dynamic range control and other processing could then be carried out on
only the speech, or other important content of the programme, in isolation depending on
user preferences and on the nature and genre of the programme material. Although the
FascinatE implementation described here was for live event broadcast, object based
methods could be applied to any genre - live sports probably being the most challenging
because of the difficulties in extracting audio objects.
The main limitation of the system described was that of latency. In the FascinatE project
there was sufficient video latency as a result of the stitching together of 6 camera feeds
into a 7K panorama so that all processing could take place and the resultant stream of
audio objects, together with positional metadata could be streamed alongside the
panoramic video stream to the end user. There are substantial challenges associated with
155 of 208

adapting the technique for real time implementation in today’s broadcast systems,
namely a much reduced video processing latency of around 20ms.
This technique for provision of accessible audio was demonstrated using recorded
microphone feeds at the FascinatE project’s final demonstration at the University of
Salford’s campus at MediaCityUK on 30th May 2013. During the demonstration
visitors were able to alter the balance between foreground and background audio where
the foreground audio consisted of commentary and on-pitch sounds and the background
consisted of crowd noise.
156 of 208

8. Conclusions and Further Work
8.1.Conclusions
This thesis set out to investigate and to identify potential solutions to the problems that
hearing impaired people face in understanding speech on television. Specifically the
research set out to look at what solutions could be derived from the roll out of digital
TV and the parallel increase in broadcast of 5.1 surround sound with its associated
metadata. The initial work documented in chapter 3 looked into the possibilities
introduced by the common mixing paradigm of utilising the centre channel of 5.1
primarily for speech and assessed the impact of reducing channels that did not carry
speech content in the mix for both hearing impaired people and also non-hearing
impaired people sharing a TV with them. This initial study indicated significant benefits
to perceived speech clarity, overall sound quality and enjoyment for hearing impaired
people for material that utilised the centre channel for speech. The outputs from this
were presented to international broadcast standards bodies by the author and led to the
formation of the UKCAF which presented recommendations to other international
standards organisations. These recommendations were published in the ETSI standard
for Digital Video Broadcast, referenced as recommendations in ITU standards for IPTV
and have been adopted as mandatory requirements by some national broadcast bodies in
Europe. The recommendations are based on the capability of STBs to generate a
‘hearing impaired’ mix from broadcast 5.1 media and discussions with STB
manufacturers as part of UKCAF activity confirmed that modern devices were certainly
capable of the limited processing that would be required to remix existing audio
channels.
An additional benefit to deriving a hearing impaired mix at the STB rather than at the
production end of the broadcast chain is that there is the potential for a HI output based
on, and customised for, an individual user's preferences and needs. Methods were
identified in collaboration with Dolby Labs to implement broadcast metadata in order to
identify when the recommended 'clean audio' mix would be appropriate so that the
accessible audio mix could be generated at the STB without the overhead of additional
157 of 208

broadcast bandwidth for a dedicated hearing impaired audio channel. The encinfo bit in
Dolby digital metadata was identified by Dolby as being available and unlikely to cause
issues for legacy equipment, always a key requirement for any change in the usage of
metadata. Further investigations would be required from Dolby in order to confirm this
however and as yet these have not taken place partly owing to a refocusing on more
extensive processing techniques at the STB and the need for extensive testing with
legacy devices.
Although the identified solution was effective for hearing impaired people the problem
remained that people with a hearing impairment were the least likely to invest in
surround sound reproduction equipment so the people who could benefit most would
potentially be those excluded from its benefits. The impact of a clean audio mix for
people with stereo reproduction equipment listening to audio downmixed from 5.1 was
investigated in chapter 4 and the recommended method for three loudspeaker
reproduction was found to be compatible with down mixed stereo and to still provide
clarity benefits for hearing impaired people and to improve the overall sound quality
and enjoyment of media for this group.
Although a downmixed version of the clean audio condition was shown to be still useful
in providing increased speech clarity the rating of downmixed Lt/Rt stereo was
consistently worse than for all conditions utilising the three front loudspeakers of a 5.1
system. Poor ratings for default down mixed stereo in these tests have been investigated
using subjective testing based on keyword recognition to assess intelligibility in chapter
5. Significantly poorer word recognition was found to occur where speech was
presented as a phantom centre image rather than over a discrete centre loudspeaker.
Further investigation showed that this was the result of acoustical crosstalk which was
shown to have a significant negative impact on intelligibility of material based on
keyword recognition. The impact of crosstalk was investigated at several listening
positions and the resulting transfer functions showed great variability depending on
listener position but substantial dips in frequency response at frequencies important to
speech at the ideal listening position.
158 of 208

Further work investigated the potential use of principal component analysis to separate
speech from competing noise at the STB. The technique, proposed by a paper in
response to the Clean Audio Project findings, was replicated here in order to assess its
performance when applied to a number of fairly common surround sound mixing
practices. Although the process was found to be unsuitable for the proposed purpose
additional development work has been carried out that identified a modified technique
that could be effective as a pre-processing tool to identify the panned location of speech
content in broadcast media. Chapter 6 of this thesis proposes a scenario where the
modified speech biased PCA algorithm would be applied to broadcast material after
post production and used to set, or unset, the encinfo bit of the Dolby broadcast
metadata. Where speech was in centre channel only encinfo would be set, the STB
would recognise the media as clean audio compatible and would attenuate non-speech
channels as required based on the viewers user preferences if a Hearing Impaired (HI)
output was selected by the user. Where speech was found in other channels (most
typically in left, centre and right, or between centre and either left or right) or where no
speech was present (for example in music programming) encinfo would be unset. The
STB would then recognise the media as incompatible with, or inappropriate for, clean
audio processing and would not apply channel attenuation regardless of whether an HI
output was selected or not. Thus only a combination of encinfo set and HI output
selected would lead to a clean audio output from the STB.
In chapter 7 two further implementations of the research documented in this thesis, in
addition to adoption by international broadcast standards organisations, are discussed.
The first of these, an experimental implementation of research recommendations plus
additional processing from Dolby Labs, was assessed by the author using novel
methods for media selection. Results from this study were inconclusive, it is concluded
from the experience of these experiments that additional testing for media selection
introduced additional variables that had an adverse effect on test results and that in test
design, simpler is better.
159 of 208

The second future implementation of clean audio was developed as part of the author’s
work on the EU FP7 project, FascinatE. The FascinatE project developed a complete
end-to-end future broadcast system which utilised object based audio broadcast. An
object based approach allowed clean audio outputs to be readily provided at the viewer
end of the broadcast chain and for the content of the audio output to be customised
based on user preferences. The potential for object based audio in generating clean
audio has been discussed in the context of produced media and an implementation
developed for live broadcast. In the context of clean audio the parallel was drawn
between diegetic and non-diegetic sounds in cinema, three sound categories were
identified; speech content whose comprehension is critical, background noise that is
detrimental to clarity, sound quality and enjoyment, and other non-speech sounds that
can be considered important to comprehension and/or enjoyment and sound quality. In
the object based audio system developed for live broadcast each of these categories
were dealt with independently at the reproduction side with both speech, and non-
speech factors considered important to comprehension mixed separately to other
background sound or noise that was considered detrimental. The complete system,
including clean audio components, was demonstrated in May 2013 in a live public event
attended by broadcasters, producers, technologists and researchers.
During the course of this research guidelines for people with hearing impairments have
been published by Ofcom, broadcasting standards have been published and are
beginning to be implemented across Europe. It would be interesting to consider what
impact the research documented here has had on the experience of hearing impaired
people, if there is a ‘Shirley effect’. Unfortunately data to base any such conclusion on
is scarce. Action on Hearing Loss commission an annual questionnaire to its members
however questions about the impact of background noise on television sound have only
appeared in 2005 (RNID, 2005) and 2008 (RNID, 2008) surveys. Only one large scale
study has been carried out in the UK (by the BBC and Voice of the Listener and Viewer
(Menneer, 2011)) and no follow up is planned. Although the outcomes from the research
presented here has now been embedded into broadcast standards it takes several years
for such standards to progress from draft to final version. For this reason it is not yet
160 of 208

possible to attribute real-world success in improving the experience of hearing impaired
people at this time.
8.2. Further Work
Further work has been identified that could extend this research area as follows:
Research is needed over a period of several years as clean audio implementations are
rolled out in order to assess the impact of these recommendations, guidelines and
standards. Some limited studies have been carried out but typically as one off surveys.
Work is needed to continue these surveys and to collate data indicating the number of
complaints received by broadcasters each year so that possible correlations between
standards implementations and other clean audio solutions with complaints can be more
clearly understood.
Additional research will be required in order to further assess the impact of clean audio
recommendations for non-hearing impaired people who may share a TV with hearing
impaired relatives. The limited number of non-hearing impaired test participants in
research carried out in chapter 3 meant that limited significance was drawn from the
impact of the recommendations documented here for the perceived overall sound
quality and enjoyment of this group. Additional testing with a larger subject group could
help to identify a compromise position that maximised clarity, quality and enjoyment
for hearing impaired people whilst providing the least negative impact for non-hearing
impaired people.
Further work is required to implement broadcast metadata as suggested in this thesis.
This would require collaboration; firstly with the broadcast industry in identifying any
legacy issues that may result from appropriation of existing metadata, and secondly with
set top box manufacturers in programming switchable clean audio functionality into end
user devices.
Further work is needed to assess PCA as a pre-broadcast tool which could identify the
location of speech in 5.1 TV programming and set or unset a clean audio bit in the
161 of 208

metadata to indicate when a clean audio mix would be appropriate for the programme
content. This should include comparisons with existing speech recognition algorithms
for a range of 5.1 broadcast mixes.
Currently object-based audio is only utilised commercially for AV media in cinema
applications in the Dolby Atmos system (Robinson et al., 2012) which was
commercially released to the public in 2012. A parallel development for TV broadcast
would have to be implemented in order for object based clean audio to be realised in a
broadcast domain. Thus far this is the subject of some commercial research however it
has not yet been implemented other than in a research context.
8.3.The Future for Accessible TV Audio
As requirements for accessible TV audio are rolled out into broadcast standards
documents and as broadcasters and the broadcast technology industry identifies
implementation methods a range of clean audio techniques could be utilised.
Implementation of the metadata tagged clean audio process identified here is currently
recommended as an appropriate minimum requirement for clean audio in ETSI
requirements (ETSI, 2009) and referenced in several more standards documents. This
means that it is likely to be the earliest adopted solution to the problems identified here.
The increased use of second screen devices and IPTV makes transmission of a parallel
audio stream delivered over IP feasible however the problem still remains as to how IP
delivered clean audio is produced. Production of a separate mix for hearing impaired
viewers may be the least likely outcome because of additional expense to the broadcast
industry and an approach such as that adopted in chapter 3 could be more efficiently
delivered via the aforementioned metadata solution. Object based audio is the solution
that would provide the most flexible and effective system however a new approach to
broadcast audio must be adopted for this to occur. This now seems more likely; already
significant technological research is underway with broadcasters, manufacturers and
universities all looking at object based audio as a solution to spatial and interactive
162 of 208

audio broadcast systems generally as well as for accessible audio and this seems very
likely to continue.
163 of 208

References
Action on Hearing Loss. (2012). Statistics. Retrieved 19 Nov 2012 from http://www.actiononhearingloss.org.uk/your-hearing/about-deafness-and-hearing-loss/statistics.aspx.
Advanced Television Systems Committee (2012). ATSC Standard: Digital Audio Compression (AC-3, E-AC-3). Washington DC, USA: ATSC.
AES (2009). AES3-4-2009: AES standard for digital audio - Digital input-output interfacing - Serial transmission format for two-channel linearly-represented digital audio data - Part 4: Physical and electrical. AES.
Agrawal, Y., Platz, E. A. & Niparko, J. K. (2008). Prevalence of hearing loss and differences by demographic characteristics among us adults: Data from the national health and nutrition examination survey, 1999-2004. Archives of Internal Medicine, 168, 1522-1530.
Altman, R. (2001). Gosford Park. USA Films.Appalacian State University. (2005). Speechfrequencies.jpg. Retrieved 4th May
2006 From http://www.acs.appstate.edu/~kms/classes/psy3203/Audition/speechfreq.jpg
Armstrong, M. (2011). Audio Processing and Speech Intelligibility: a literature review. London: BBC.
ATSC (2005). Digital Audio Compression Standard (AC-3, E-AC-3) Revision B. A/52B.: Advanced Television Systems Committee.
Augspurger, G., Bech, S., Brook, R., Cohen, E., Eargle, J. & Schindler, T. A. (1989). Use of Stereo Synthesis to Reduce Subjective/Objective Interference Effects: The Perception of Comb Filtering, Part II. Paper presented at Audio Engineering Society Convention 87, Audio Engineering Society.
Axelsson, A., Eliasson, A. & Israelsson, B. (1995). Hearing in Pop/Rock Musicians: A Follow-up Study. Ear and Hearing, 16, 245-253.
Axelsson, A. & Lindgren, F. (1978). Hearing In Pop Musicians. Acta Oto-laryngologica, 85, 225-231.
164 of 208
Barford, J. (1978). Multichannel Compression Hearing Aids: Experiments and Consideration on Clinical Applicability. Hearing Impairment and Hearing Aids, 6, 315-340.
Barnhill, C., West, J. & Busch‐Vishniac, I. (2006). Impulse response of a spherical microphone array (eigenmike). The Journal of the Acoustical Society of America, 119, 3378.
Bauck, J. L. & Cooper, D. H. (1992). Generalised Transaural Stereo. Paper presented at 93rd Conference of the Audio Engineering Society, San Francisco. Audio Engineering Society.
BBC. (2011). Clear sound: best practice tips. Retrieved 14th August 2013 from http://www.bbc.co.uk/academy/production/article/art20130702112135255.
Bilger R.C. Nuetzel J.M. Rabinowitz W.M. Rzeczkowski C (1984). Standarization of a test of speech perception in noise. Journal of Speech and Hearing Research, 27, 32-48.
Blauert, J. (1997). Spatial Hearing: The Psychophysics of Human Sound Localisation. Cambridge: MIT Press.
Boueri, M. & Kyriakakis, C. (2004). Audio signal decorrelation based on a critical band approach. Paper presented at Audio Engineering Society Convention 117.
British Society of Audiology (1988). Descriptors for pure tone audiograms. British Journal of Audiology, 22, 123.
Brückner, W. (2010). Interim Report on Expert User Tests. IRT.Bücklein, R. (1981). The audibility of frequency response irregularities. Journal
of the Audio Engineering Society, 29, 126-131.Carlsson, S. E. Diegetic and non-diegetic sounds. (2006). Retrieved September
2013 from http://filmsound.org/terminology/diegetic.htm.Carmichael, A., Petrie, H., Hamilton, F. & Freeman, J. (2003). The Vista Project:
Broadening Access To Digital TV Electronic Programme Guides. PsychNology Journal, 1, 229-241.
165 of 208

Carmichael, A. R. (2004). Evaluating digital “on-line” background noise suppression: Clarifying television dialogue for older, hard-of-hearing viewers. Neuropsychological Rehabilitation, 14, 241-249.
Cervellera, G. & Quaranta, A. (1982). Audiologic findings in presbycusis. Journal of Auditory Research, 22, 161-171..
Clark, D. (1983). Measuring Audible Effects of Time Delays in Listening Rooms. Paper presented at Audio Engineering Society Convention 74. New York, USA.
Clark, W. W. (1991). Noise exposure from leisure activities: A review. The Journal of the Acoustical Society of America, 90, 175-181.
Cooper, D. H. & Bauck, J. L. (1989). Prospects for transaural recording. Journal of the Audio Engineering Society, 37, 3-19.
Cox R.M., A. G. C., Gilmore C. (1987). Development of the Connected Speech Test (CST). Ear Hear, 8, 119-126.
Cox, R. M., Gray, G. A. & Alexander, G. C. (2001). Evaluation of a revised speech in noise (RSIN) test. Journal of the American Academy of Audiology, 12, 423-432.
DAVIS, A. C. (1989). The Prevalence of Hearing Impairment and Reported Hearing Disability among Adults in Great Britain. International Journal of Epidemiology, 18, 911-917.
de Pomerai, R. (2009). BBC White Paper WHP 175: Managing a Real World Dolby E Broadcast Workflow. London, UK: BBC, retrieved from http://downloads.bbc.co.uk/rd/pubs/whp/whp-pdf-files/WHP175.pdf.
Digital Video Broadcasting Project. (2011). DVB - The Global Standard for Digital Television. Retrieved January 2013 from http://www.dvb.org.
Dolby Labs (2000a). Dolby Digital Professional Encoding Guidelines. Dolby Labs.
Dolby Labs (2000b). Frequently asked questions about Dolby Digital. Retrieved 2 December 2006 from http://www.dolby.com/uploadedFiles/Assets/US/Doc/Professional/42_DDFAQ.pdf.
166 of 208

Dolby Labs. (2003). Dolby Metadata Guide issue 2. Retrieved 2 January 2005 from http://www.dolby.com/assets/pdf/tech_library/18_Metadata.Guide.pdf.
Dolby Labs. (2005). Dolby Surround Mixing Manual. Retrieved 6 Dec 2008 from http://www.dolby.com/uploadedFiles/zz-_Shared_Assets/English_PDFs/Professional/44_SuroundMixing.pdf.
Dressler.R. (1996). A Step Toward Improved Surround Sound Making the 5.1-Channel Format a Reality. Paper presented in Audio Engineering Society Convention 100. Audio Engineering Society..
DTV4ALL (2010). D3.5, 2nd Phase Emerging Access Service Demonstrators. Theme, I. C. T. P. S. P., & Agreement, G. Competitiveness and Innovation Framework Programme. Changes, 4, 3.
EBU (2009). EBU – TECH 3333: EBU HDTV Receiver Requirements. 7.3 Clean Audio. Geneva, Switzerland: EBU.
Eronen, L. (2006). Five qualitative research methods to make iTV applications universally accessible. Universal Access in the Information Society, 5, 219-238.
ETSI (1997). Television systems; NICAM 728: transmission of two-channel digital sound with terrestrial television systems B, G, H, I, K1 and L. France: ETSI.
ETSI (2000). ETSI Standard TR 101 154, V1.4.1 (2000-07): Digital Video Broadcasting (DVB); Implementation guidelines for the use of MPEG-2 Systems, Video and Audio in satellite, cable and terrestrial broadcasting applications.: ETSI.
ETSI (2009). ETSI TS101154 v1.9.1 Digital Video Broadcasting (DVB); Specification for the use of Video and Audio Coding in Broadcasting Applications based on the MPEG-2 Transport Stream. Annexe E.4 Coding for Clean Audio SA services. FRANCE: ETSI.
Fant, G. (1959). Acoustic Analysis and Synthesis of Speech with Applications to Swedish.: Ericsson Technics.
167 of 208

Fant, G. (2004). Phonetics and Phonology in the last 50 years. Paper presented at From Sound to Sense: 50+ years of discoveries in Speech Communication, 2004. MIT.
Festen, J. M. & Plomp, R. (1983). Relations between auditory functions in impaired hearing. The Journal of the Acoustical Society of America, 73, 652-662.
Fielder, L. D., Andersen, R. L., Crockett, B. G., Davidson, G. A., Davis, M. F., Turner, S. C., Vinton, M. S. & Williams, P. A. (2004). Introduction to Dolby Digital Plus, an Enhancement to the Dolby Digital Coding System. Convention of the Audio Engineering Society Convention 117. San Francisco, CA, USA: AES.
Forrester, I. & Churnside, A. (2012). The creation of a perceptive audio drama. NEM Summit. Istanbul.
Freeman, J. & Lessiter, J. (2003). Using attitude based segmentation to better understand viewersʼ usability issues with digital and interactive TV. In Proceedings of the 1st European conference on interactive television: from viewers to actors. 19-27.
Freeman, J., Lessiter, J., Williams, A. & Harrison, D. (2003). Easy TV 2002 research report. ITC and Consumerʼs Association.
Fuchs, H. & Oetting, D. (2013). Advanced Clean Audio Solution: Dialogue Enhancement. IBC. Amsterdam, Netherlands: IBC.
Fuchs, H., Tuff, S. & Bustad, C. (2012). Dialogue Enhancement - Technology and Experiments. In: Meyer, M. & Vermaele, L. (eds.) EBU Technical Review. Geneva, Switzerland: EBU.
Gerzon, M. A. (1980). Practical periphony: The reproduction of full-sphere sound. In: Audio Engineering Society Convention 65. London, UK.
Goodwin, M. M. & Jot, J. (2007). Primary-ambient signal decomposition and vector-based localization for spatial audio coding and enhancement. Paper presented at IEEE International Conference on Acoustics, Speech and Signal Processing, 2007. ICASSP 2007. IEEE.
168 of 208

Gordon-Salant, S. & Callahan, J. S. (2009). The benefits of hearing aids and closed captioning for television viewing by older adults with hearing loss. Ear and Hearing, 30, 458.
Grant, K. W., Walden, B. E. & Seitz, P. F. (1998). Auditory-visual speech recognition by hearing-impaired subjects: Consonant recognition, sentence recognition and auditory-visual integration. Journal of the Acoustical Society of America, 103, 2677-2690.
Hearing Concern. (2004). Advice and Information, About Hearing Loss, Deaf Awareness. Retrieved 29 February 2004 from http://www.hearingconcern.com/aai_ahl_da.html.
Hoeg, W. & Lauterbach, T. (2009). Digital audio broadcasting: principles and applications of DAB, DAB+ and DMB. Wiley.
Holman.T. (1991). New Factors in Sound for Cinema and Television. J. Audio Eng. Soc., 39, 529-539.
Holman.T. (1996). The number of audio channels. Paper presented at Audio Engineering Society Convention 100, Copenhagen, Denmark.
HSE. (2012). Statistics: Noise Induced Deafness Summary. Retrieved 15 October 2012 from http://www.hse.gov.uk/noise/statistics.htm.
HSE. (1997). Health and Safety Statistics 1996/7. London, UK: Health and Safety Commission.
Hu, Y. & Loizou, P. C. (2006). Subjective comparison of speech enhancement algorithms. Paper presented at IEEE International Conference on Acoustics, Speech and Signal Processing, 2006.
Hu, Y. & Loizou, P. C. (2007a). A comparative intelligibility study of single-microphone noise reduction algorithms. The Journal of the Acoustical Society of America, 122, 1777.
Hu, Y. & Loizou, P. C. (2007). A comparative intelligibility study of speech enhancement algorithms. Paper presented at IEEE International Conference on Acoustics, Speech and Signal Processing, 2007.
Humes, L. E., Dirks, D. D., Bell, T. S., Ahlstrom, C. & Kincaid, G. E. (1986). Application of the Articulation Index and the Speech Transmission Index
169 of 208
to the recognition of speech by normal-hearing and hearing-impaired listeners. Journal of Speech and Hearing Research, 29.
ISO/IEC (1993). Information technology - Coding of moving pictures and associated audio for digital storage media at up to about 1,5 Mbit/s Part 3: Audio. Switzerland: ISO.
ISO/IEC (2006). Information technology — Coding of audio-visual objects — Part 3: Audio. Switzerland: ISO.
ITU (1994a). ITU-R BS.775-1:Multichannel stereophonic sound system with and without accompanying picture. Geneva: International Telecommunications Union.
ITU (1994b). Sound systems for the hearing impaired. International Telecommunications Union..
ITU (1997). ITU-R BS.1116-1: Methods for the subjective assessment of small impairments in audio systems including multichannel sound systems. International Telecommunication Union.
ITU (2003). ITU-R BS.1534-1 Method for the subjective assessment of intermediate quality level of coding systems. International Telecommunication Union.
ITU (2006). ITU-R BS.775-2: Multichannel stereophonic sound system with and without accompanying picture. International Telecommunications Union.
iZotope. iZotope, Inc - Audio Signal Processing Hardware, Software, Plug-ins ... Retrieved 31st October 2013 from http://www.izotope.com.
Joanneum Research, Technicolor, TNO, University of Salford, BBC, TNO, Softeco Sismat, Interactive Institute, Fraunhofer HHI, ARRI & Universitat de Catalunya (2010). FascinatE. Europe: European Commission.
Jones, J., Hodgson, J., Clegg, T. & Elliott, R. (1998). Self-reported Work-Related Illness in 1995. Results from a household survey. HSE Books. Sudbury, UK.
Kalikow D N. Stevens K N. Elliot L L (1977). Development of a test of speech intelligibility in noise using sentence materials with controlled word predictability. Journal of the Acoustical Society of America, 61, 1337 - 1351.
170 of 208

Kendall, G. S. (1995). The decorrelation of audio signals and its impact on spatial imagery. Computer Music Journal, 19, 71-87.
Kendrick, P. & Shirley, B. (2008). Performance of Independent Component Analysis When Used to Separate Competing Acoustic Sources in Anechoic and Reverberant Conditions. Paper presented at Audio Engineering Society Convention 124. Amsterdam, The Netherlands.
Killion, M. C. & Villchur, E. (1993). Kessler was right-partly: But SIN test shows some aids improve hearing in noise. The Hearing Journal, 46.
Kropp, H., Spille, J., Batke, J. M., Abeling, S., Keiler, F., Oldfield, R. & Shirley, B. (2011). Towards A Format-agnostic Approach for Production, Delivery and Rendering of Immersive Media. Paper presented at IBC, Amsterdam, The Netherlands.
Kurita, T. & Otsu, N. (1993). A method of block truncation coding for color image compression. EEE Trans. Commun., 1270-1274.
Laurence, R. F., Moore, B. C. J. & Glasberg, B. R. (1983). A Comparison of Behind-the-Ear High-Fidelity Linear Hearing Aids and Two-Channel Compression Aids, in the Laboratory and in Everyday Life. British Journal of Audiology, 17, 31-48.
Maassen, M., Babisch, W., Bachmann, K. D., Ising, H., Lehnert, G., Plath, P., Plinkert, P., Rebentisch, E., Schuschke, G., Spreng, M., Stange, G., Struwe, V. & Zenner, H. P. (2001). Ear damage caused by leisure noise. Noise & Health, 4, 1-16.
Mathers, C. D. (1991). A Study of Sound Balances for the Hard of Hearing. BBC Research Dept. Report. BBC.
Mazor, M., Simon, H., Scheinberg, J. & Levitt, H. (1977). Moderate frequency compression for the moderately hearing impaired. Journal of the Acoustical Society of America, 62, 1273-1278.
Meares, D. J. (1991). R&D Report 1991-14 : HDTV sound: programme production developments. BBC London: BBC.
Meier, G. R. (2007). Types Of Hearing Loss. Retrieved 17 November 2012 from http://www.audiologyawareness.com/hearinfo_hloss.asp
171 of 208
Meunier, J.-D., Bower, A., Holken, H., Menendez, J. M., Dosch, C., Merkel, K., Neudel, R., Jung, C., Adzic, J., Sesena, J., Stan, A. & Dufourd, J.-C. (2012). Connected TV Position Paper, NEM Summit. Retrieved 15 November 2013 from http://www.nem-initiative.org/fileadmin/documents/PositionPapers/NEM-PP-015.pdf.
Moore, B. C. & Moore, B. C. (2003). An introduction to the psychology of hearing. Academic press San Diego.
Moore, B. C. J. (1987). Design and evaluation of a two channel compression hearing aid. Journal of Rehabilitative Research and Development, 24, 181-192.
Moore, B. C. J. (2003). Speech Processing for the Hearing-Impaired: Sucesses, Failures, and Implications for Speech Mechanisms. Speech Communication, 41, 81-91.
Moore, B. C. J. & Glasberg, B. R. (1986). A Comparison of Two Channel and Single Channel Compression Hearing Aids. Audiology, 25, 210-226.
Moore, B. C. J., Johnson, J. S., Clark, T. M. & Pluvinage, V. (1992). Evaluation of a dual-channel full dynamic range compression system for people with sensorineural hearing loss. Ear and Hearing, 13, 349-370.
Müsch, H. (2008). Aging and Sound Perception: Desirable Characteristics of Entertainment Audio for the Elderly. Paper presented at Audio Engineering Society Convention 125, San Francisco, USA.
Noble, W., Naylor, G., Bhullar, N. & Akeroyd, M. A. (2012). Self-assessed hearing abilities in middle- and older-age adults: A stratified sampling approach. International Journal of Audiology, 51, 174-180.
NorDig (2013). NorDig Unified Requirements for Integrated Receiver Decoders for use in cable, satellite, terrestrial and IP-based networks v2.4. 6.2.4 Clean Audio. NorDig.
Oldfield, R. G., Shirley, B. & Spille, J. (2012). Object Based Audio for Interactive Football Broadcast. Multimedia Tools & Applications.
Open IPTV Forum (2011). OIPF Release 2 Specification Volume 2 – Media Formats. 8.2.3 Clean Audio. France: Open IPTV Forum.
172 of 208

Palmer, K., Griffin, M., Syddall, H., Davis, A., Pannett, B. & Coggon, D. (2002). Occupational exposure to noise and the attributable burden of hearing difficulties in Great Britain. Occup Environ Med, 59, 634-639.
Palmer, K. T., Coggon, D., Sydall, H. E., Pannett, B. & Griffin, M. J. (2001). CRR 361/2001 Occupational exposure to noise and hearing difficulties in Great Britain (No. 361). Health & Safety Executive Books.
Peng, J.-H., Tao, Z.-Z. & Huang, Z.-W. (2007). Risk of damage to hearing from personal listening devices in young adults. Journal of Otolaryngology, 36, 179-183.
Plomp, R. (1988). The negative effect of amplitude compression in multichannel hearing aids in the light of the modulation-transfer function. Journal of the Acoustical Society of America, 83, 2322-2327.
Rabbitt, P. (1991). Mild hearing loss can cause apparent memory failures which increase with age and reduce with IQ. Acta Oto-laryngologica, 111, 167-176.
Riedmiller, J. C. (2005). Dolby Laboratories Recommended Practices For Cable Television Systems: Measuring Equivalent Loudness of Speech in Analog & Digital Audio (DRAFT). San Francisco. Dolby.
Riedmiller, J. C., Lyman, S. & Robinson, C. (2003). Intelligent Program Loudness Measurement and Control: What Satisfies Listeners? Paper presented at 115th Convention of the Audio Engineering Society, New York.
RNID (2005). Annual Survey Report 2005. Royal National Institute for Deaf People.
RNID (2008). Annual Survey Report 2008. Royal National Institute for Deaf People.
Robinson, C. Q., Mehta, S. & Tsingos, N. (2012). Scalable Format and Tools to Extend the Possibilities of Cinema Audio. SMPTE Motion Imaging Journal, 121, 63-69.
Roch, M., Hurtig, R. R., Liu, J. & Huang, T. (2004). Towards a Cohort-Selective Frequency-Compression Hearing Aid. Paper presented at International
173 of 208
Conference on Mathematics and Engineering Techniques in Medicine and Biological Sciences, Las Vegas.
Roland, P. S. & Rutka, J. A. (2004). Ototoxicity. Lewiston, NY, USA: Hamilton.Roth, T., Hanebuth, D. & Probst, R. (2011). Prevalence of age-related hearing
loss in Europe: a review. European Archives of Oto-Rhino-Laryngology, 268, 1101-1107.
Rumsey, F. (2009a). Hearing Enhancement. Journal of the Audio Engineering Society, 57, 353-359.
Rumsey, F. (2009b). High Definition Television: An Update for Audio Engineers. Journal of the Audio Engineering Society, 57, 853-856.
Sadhra, S., Jackson, C. A., Ryder, T. & Brown, M. J. (2002). Noise Exposure and Hearing Loss among Student Employees Working in University Entertainment Venues. Annals of Occupational Hygiene, 46, 455-463.
Sheppard, T. (2006). CM-AVC0084 DVB CM-AVC Commercial Requirements: Delivering “Clean Audio” for the Hard of Hearing. Geneva, Switzerland: Digital Video Broadcast Group.
Shirley, B. (2014). Audio Fundamentals and Acquisition Technology. In: Schreer, O., Macq, J.-F., Niamut, O. A., Ruiz-Hidalgo, J., Shirley, B., Thallinger, G. & Thomas, G. (eds.) Media Production, Delivery and Interaction for Platform Independent Systems: Format-Agnostic Media. UK: Wiley.
Shirley, B., Kendrick, P. & Churchill, C. (2007). The Effect of Stereo Crosstalk on Intelligibility: Comparison of a Phantom Stereo Image and a Central Loudspeaker Source. Journal of the Audio Engineering Society, 55, 852-863.
Shirley, B., Oldfield, R., Melchior, F. & Batke, J. M. (2014). Platform Independent Audio. In: Schreer, O., Macq, J.-F., Niamut, O. A., Ruiz-Hidalgo, J., Shirley, B., Thallinger, G. & Thomas, G. (eds.) Media Production, Delivery and Interaction for Platform Independent Systems: Format-Agnostic Media. UK: Wiley.
Shirley, B. G. & Kendrick, P. (2004). ITC Clean Audio Project. Paper presented at Audio Engineering Society Convention 116, Berlin.
174 of 208

Shirley, B. G. & Kendrick, P. (2006). The Clean Audio Project: Digital TV as assistive technology. Journal of Technology & Disability, 18, 31-41.
Smith, L. I. (2002). A Tutorial on Principal Components Analysis. Retrieved 2 February 2006 from csnet.otago.ac.nz/cosc453/student_ tutorials/principal_components.pdf.
Snow, W. (1953). Basic Principles of Stereophonic Sound. Journal - Society of Motion Picture and Television Engineers, 61, 567 - 589.
Stark, M., Wohlmayr, M. & Pernkopf, F. (2011). Filter-Based Single-Channel Speech Separation Using Pitch Information. Audio, Speech, and Language Processing, IEEE Transactions on, 19, 242-255.
Stine, E. L., Wingfield, A. & Poon, L. W. (1986). How much and how fast: Rapid processing of spoken language in later adulthood. Psychology and Aging, 1, 303.
Sumby, W. H. & Pollack, I. (1954). Visual contribution to speech intelligibility in noise. The Journal of the Acoustical Society of America, 26, 212.
Summerfield, Q. (1987). Speech perception in normal and impaired hearing. Br Med Bull, 43, 909-925.
The Digital TV Group (2012). Digital Terrestrial Television Requirements for Interoperability. The D Book 7 Part B. UK: Digital TV Group.
Toole, F. E. (1985). Subjective Measurements of Loudspeaker Sound Quality and Listener Performance. Journal - Audio Engineering Society, 33, 2-32.
Turner, C. W. & Hurtig, R. R. (1999). Proportional frequency compression of speech for listeners with sensorineural hearing loss. Journal of the Acoustical Society of America, 106, 877-886.
Uhle, C., Hellmuth, O. & Weigel, J. (2008). Speech Enhancement of Movie Sound. Paper presented at Audio Engineering Society Convention 125.
UK Clean Audio Forum (2007). Liaison Statement from UK Clean Audio Forum to ITU FG IPTV. Mountain View, USA: International Telcommunications Union Focus Group on IPTV.
Van Gerven, S. & Xie, F. (1997). A comparative study of speech detection methods. Paper presented at Eurospeech, Rhodes, Greece.
175 of 208

Vickers, E. (2009a). Fixing the phantom center: diffusing acoustical crosstalk. Paper presented at Audio Engineering Society Convention 127, New York, USA.
Vickers, E. (2009b). Frequency-Domain Two-To Three-Channel Upmix for Center Channel Derivation and Speech Enhancement. Paper presented at Audio Engineering Society Convention 127, New York, USA.
Vickers, E. (14 April 2013). RE: re: Papers query and introduction. Personal correspondence to Shirley, B.
Vickers, E. C. (2009c). Two-to-Three Channel Upmix for Center Channel Derivation. Google Patents.
VLV. (2011). VLVʼs Audibility of Speech on Television Project will make a real difference. Retrieved 2 March 2012 from http://www.vlv.org.uk/documents/06.11PressreleasefromVLV-AudibilityProject-0800hrs1532011_002.pdf.
Wachowski, A. & Wachowski, L. (1999). The Matrix. Warner Bros.Weiss, W. & Kaiser, R. (2012). A distributed virtual director for an interactive
event broadcast system. In: Proceedings of the 6th ACM International Conference on Distributed Event-Based Systems. ACM, 375-376.
Yost, W. A. (2000). Fundamentals of Hearing: An Introduction. San Diego, California: Academic Press.
Zhao, W., Chellappa, R. & Krishnaswamy, A. (1998). Discriminant analysis of principal components for face recognition. In: Proceedings of Third IEEE International Conference on Automatic Face and Gesture Recognition. 336-341.
Zielinski, S., Mayne, J. & Rumsey, F. (2005). Improving Intelligibility of Surround Sound Using Principal Component Decomposition. In: Reproduced Sound 21 Conference. Proceedings of the Institute of Acoustics., Oxford, UK. Institute of Acoustics.
Zielinski, S. l., Rumsey, F. & Bech, S. (2008). On Some Biases Encountered in Modern Audio Quality Listening Tests - A Review. Journal of the Audio Engineering Society, 56, 427-451.
176 of 208

APPENDIX A Dolby Digital Metadata Parameters(Parameters in italics are part of the Extended Bit Stream Information)
Program Configuration
Program Description Text
Dialogue Level
Channel Mode
LFE Channel
Bitstream Mode
Line Mode Compression
RF Mode Compression
RF Overmodulation Protection
Centre Downmix Level
Surround Downmix Level
Dolby Surround Mode
Audio Production Information
Mix Level
Room Type
Copyright Bit
Original Bitstream
Preferred Stereo Downmix
Lt/Rt Centre Downmix Level
Lt/Rt Surround Downmix Level
Lo/Ro Centre Downmix Level
177 of 208

Lo/Ro Surround Downmix Level
Dolby Surround EX Mode
A/D Converter Type
DC Filter
Lowpass Filter
LFE Lowpass Filter
Surround 3 dB Attenuation
Surround Phase Shift
Reproduced from Dolby Metadata Guide vol 2 published by Dolby Labs (Dolby Labs,
2003).
178 of 208

APPENDIX B Example Test Material
Clip number Film Start End1 Chocolat 1:10:25 1:11:502 Air force one 00:40:04 00:41:093 Air force one 01:13:28 01:14:504 Air force one 01:21:47 01:22:505 Gosford park 00:16:04 00:17:216 Gosford park 00:19:22 00:20:297 Gosford park 01:32:51 01:33:558 Gosford park 01:45:45 01:47:149 Gosford park 00:34:10 00:35:3110 Gosford park 00:22:12 00:23:2311 Gosford park 01:26:20 01:27:2112 Gladiator 01:53:19 01:54:3713 Gladiator 01:26:50 01:28:0314 LA confidential 00:21:44 00:22:5815 Devils advocate 00:34:40 00:30:1016 Negotiator 01:00:51 01:02:1217 Negotiator 01:30:27 01:31:3218 Chocolat 00:40:30 00:41:4719 Chocolat 00:52:11 00:53:2420 Green Mile 00:07:35 00:08:58
179 of 208

APPENDIX C Analysis of Test Material
180 of 208

APPENDIX D Subject Questionnaire for Clean Audio Testing
OFCOM Clean Audio Research Introduction We want to find out about the sound quality of video clips. We are doing this to help manufacturers improve the sound for viewers who are hard of hearing.
Personal Details In this section you will be asked a series of questions about yourself, all of this information will be treated in the strictest confidence. No one outside the research team at Salford University will see your personal details. Name ______________________________________________ Address _______________________________________
_______________________________________________
_______________________________________________
Tel: _________________ Email: ________________________ Age: Under 30-44 45-59 (Please tick 30 one box) 60-74 75+ Nature of hearing impairment (write none if have no hearing impairment): ________________________________________________ ________________________________________________ Gender: M F
181 of 208

There are a series of questions on the following pages. Each question asks you to compare 2 sections of a video clip. After watching each clip please tick the box to indicate your preference and rate the difference between the sections by making a mark on the line as shown. There are no right or wrong answers. Please tick one box and make a mark on the line as in the example below. Example Which section do you think had the best sound quality.
Section A Section B How much better was your choice? Slightly Much Better Better
182 of 208

Clip x a) Which section do you think had the best overall sound quality?
Section A Section B How much better was your choice? Slightly Much Better Better b) Which section did you enjoy the most?
Section A Section B How much more did you enjoy it? Slightly Much More More c) In which section was the speech clearer?
Section A Section B How much clearer was your choice? Slightly Much Clearer Clearer
183 of 208

Do you have any comments or suggestions?
This concludes this questionnaire, thank you very much for taking the time to help us in our research; your help is very much appreciated.
184 of 208

APPENDIX E Consent Form and Information Sheet
We would be very grateful if you could help us in an important research project about the quality of sound on television.The University of Salford Acoustics Research Centre is carrying out a series of tests on how to improve the quality of sound from television. Of course you are under no obligation and do not have to participate, but it would be extremely valuable if you could assist us in this study.The work is sponsored by the OFCOM (formerly the Independent Television Commission (ITC)) and your responses to the tests will help us develop better sound for television in the future.We need your consent to:
§ Retain some background information on you (name, age, gender, contact details);
§ Carry out a hearing test and retain an audiogram showing your hearing ability.
§ Carry out a series of tests where you listen to speech and other TV programme content and we ask a series of questions intended to assess how well you have heard and enjoyed the recordings. We need your permission to retain the results.
All information will be kept confidential. The work will be used to help improve the quality of TV sound. No individuals will be identified in the results of the research. As some of this data is held on computer, some is covered by the data protection act, and you will be able to see a copy of it on request.Both hearing and hard of hearing people are required for the tests though we are particularly interested in contacting hard of hearing people who may wish to participate. If you would be willing to participate or if you know of anyone else who may be interested my contact details are as follows:Ben ShirleyLecturerAcoustics Research CentreUniversity of Salford0161 [email protected]
185 of 208

Consent Form
I have read and understood the information sheet and this consent form. I understand that participation is voluntary and I am free to withdraw at any time.
Name: _________________________________
Signature: ______________________________
Date: __________________________________
186 of 208

APPENDIX F Testing script
1) Thank you for taking part in our test today. The test will consist of a series of clips from films.
2) Each clip will be split up into two sections, section A and section B.
3) You will then be shown a clip and after the clip has finished (at the end of section B) asked to answer three questions about that clip.
4) These questions will be;
a) Which section had the better overall sound quality? Tick the appropriate box and put a mark on the line stating how much better you thought the sound quality was.
b) Which section did you enjoy the most? Tick the appropriate box and put a mark on the line indicating how much more you enjoyed the better clip.
c) In which section was the speech clearer? Tick the appropriate box and put a mark on the line indicating how much clearer.
6) At the end of each clip the video will be paused until you have finished filling in the three questions for that clip. When you have finished filling in the questions please let me know by saying finished and the next clip will be played.
7) If you would like to see the clip again that is fine just ask me if you could see the clip again and I will play both sections again.
8) I will keep silent during the test so you are not distracted.
187 of 208

APPENDIX G Classification of Hearing Loss
Hearing loss was categorised using a pure tone audiogram with the hearing level threshold levels averaged at the following frequencies:
250, 500, 1000, 2000 and 4000 Hz
Audiometric descriptor of loss dB HLNone < 20Mild 20 – 40Moderate 41 – 70Severe 71 – 95Profound > 95
Reproduced from;The British journal of Audiology, 1988, 22, 123, Descriptors for pure-tone audiograms
To determine whether a subject has asymmetric hearing loss, the definition used was that there is a difference of 30dB or more at two or more frequencies. This is the definition as per the TTSA (Technicians, Therapists and Scientists in Audiology) guidelines for direct referrals for Hearing Aids.
188 of 208

APPENDIX H Data Analysis Methods Example
In the analysis of the data the use of the scales was examined for each subject, and a measurement was made in mm along the length of the scale. The maximum (xmax) and minimum (xmin) values recorded on each scale for each subject were used to normalise the rest of the data using the following formula:
An example of pre-normalised and post-normalised data for one subject on one scale is shown in table 4.
Clip number
Section Preferred
Process selected
Process not selected
Scale Normalised scale
1 B Centre LR 81 0.892 B LR6dB LR 57 0.523 B DRC LR 57 0.524 B DRC6dB LR 62 0.595 B LR6dB Centre 80 0.886 B DRC Centre 42 0.287 A Centre DRC6dB 32 0.138 A LR6dB DRC 24 0.009 A LR6dB DRC6dB 75 0.80
10 B LR Centre 32 0.1311 A LR6dB LR 66 0.6612 B LR DRC 24 0.0013 A DRC6DB LR 75 0.8014 B Centre LR6dB 88 1.0015 B Centre DRC 28 0.0616 B Centre DRC6dB 34 0.1617 B LR6dB DRC 32 0.1318 B LR6dB DRC6dB 79 0.8619 B DRC6dB DRC 81 0.8920 B DRC DRC6dB 77 0.83
Min 24Max 88
An example of pre-normalised and post-normalised data for one subject on the sound quality scale
189 of 208

APPENDIX I MatLab Code for Principal Component Analysis
PCA_single _vector_recon_mix.m
% PCA, Principal Component only% This reconstructs spin1.wav from only it's principal component
samples = wavread('spin1.wav') % get dataave = mean(samples) % mean of l & r columns[m,n] = size(samples) % how many samps?meanmat = repmat(ave,m,1) % expand averages matrix so can % subtract from samp valuesnormsamps = samples - meanmatcovariance = cov(normsamps) % find covariance matrix[vect,val] = eig(covariance) % get eigenvectors and eigenvalues % for covariance matrix% d = eig(cov) % not using this but puts values % into same format as tutorial% need to delete less important vectors at this point % eg. Which is largest n vectors? Delete rest!vect(:,1) = []% Generate new data setFinalData = vect' * normsamps'RowOrigData = vect * FinalDataRowOrigData = RowOrigData + meanmat' % add means in again
wavwrite(RowOrigData', 44100, 'Recon.wav') % write reconstructed wav
190 of 208

Matlab code used for accessing 5 channel audio as multiple mono wav files, in this example all components other than the principal component are deleted before reconstruction.PCA_5_mono_wavs.m
samples = wavread('1_FL.wav')samples(:,2) = wavread('2_FR.wav')samples(:,3) = wavread('3_C.wav')samples(:,4) = wavread('4_LS.wav')samples(:,5) = wavread('5_RS.wav')ave = mean(samples); % mean of channel columns[m,n] = size(samples) % how many samps?% m = numsamps and n = numchannelsmeanmat = repmat(ave,m,1); % expand averages matrix so can% subtract from samp valuesnormsamps = samples - meanmat;covariance = cov(normsamps); % find covariance matrix[vect,val] = eig(covariance) % get eigenvectors and
% eigenvalues% for covariance matrix% need to delete less important vectors at this point.% eg. Which is largest n vectors? Delete rest![C,I] = max(val)[x,y] = max(C)% y now contains the column number of the HIGHEST value ( of the % principal component)% The rest should then be deletedif y == 1 vect(:,5) = [] vect(:,4) = [] vect(:,3) = [] vect(:,2) = []elseif y == 2 vect(:,5) = [] vect(:,4) = [] vect(:,3) = [] vect(:,1) = []elseif y == 3 vect(:,5) = [] vect(:,4) = [] vect(:,2) = [] vect(:,1) = []elseif y == 4 vect(:,5) = [] vect(:,3) = [] vect(:,2) = [] vect(:,1) = []elseif y == 5 vect(:,4) = [] vect(:,3) = [] vect(:,2) = [] vect(:,1) = []end% Generate new data setFinalData = vect' * normsamps';RowOrigData = vect * FinalData;RowOrigData = RowOrigData + meanmat'; % add means in againReconData = RowOrigData'wavwrite(ReconData(:,1),48000,'out1.wav')wavwrite(ReconData(:,2),48000,'out2.wav')
191 of 208

wavwrite(ReconData(:,3),48000,'out3.wav')wavwrite(ReconData(:,4),48000,'out4.wav')wavwrite(ReconData(:,5),48000,'out5.wav')
192 of 208

Matlab code used for processing 5 channel audio from multiple mono wav files using a weighted PCA unmixing matrix based on a speech frequency filter, in this example all components other than the principal component are deleted before reconstruction.
PCA_5_mono1_ref.m%-- 16/03/06 10:05 --%% PCA_5_mono1_ref.m %% carries out weighted PCA on 5 channels of audio %% based on speech filter % % reference for PCA pathrefsamples = wavread('ref1.wav')refsamples(:,2) = wavread('ref2.wav')refsamples(:,3) = wavread('ref3.wav')refsamples(:,4) = wavread('ref4.wav')refsamples(:,5) = wavread('ref5.wav') % samples to carry out PCA onsamples = wavread('1.wav')samples(:,2) = wavread('2.wav')samples(:,3) = wavread('3.wav')samples(:,4) = wavread('4.wav')samples(:,5) = wavread('5.wav') % get filterBPF = speechFltr; % PCA for reference parallel pathrefave = mean(refsamples); % mean of channel columns[o,p] = size(refsamples) % how many samps?% o = numsamps and p = numchannelsrefmeanmat = repmat(refave,o,1); % expand averages matrix so can% subtract from samp valuesrefnormsamps = refsamples - refmeanmat;BPrefnormsamps = filter(BPF, refnormsamps); refcovariance = cov(BPrefnormsamps); % find covariance matrix[refvect,refval] = eig(refcovariance) % get eigenvectors and %eigenvalues% for covariance matrix[D,J] = max(refval)[a,b] = max(D)
% PCA for actual samples based on unmixing matrix from filtered samplesave = mean(samples); % mean of channel columns[m,n] = size(samples) % how many samps?% m = numsamps and n = numchannelsmeanmat = repmat(ave,m,1); % expand averages matrix so can% subtract from samp valuesnormsamps = samples - meanmat;covariance = cov(normsamps); % find covariance matrix[vect,val] = eig(covariance) % get eigenvectors and eigenvalues% for covariance matrix% need to delete less important vectors at this point.% eg. Which is largest n vectors? Delete rest![C,I] = max(val)
193 of 208

[x,y] = max(C)% y now contains the column number of the HIGHEST value ( of the % principal component)% The rest should then be deletedif b == 1vect(:,5) = []vect(:,4) = []vect(:,3) = []vect(:,2) = []elseif b == 2vect(:,5) = []vect(:,4) = []vect(:,3) = []vect(:,1) = []elseif b == 3vect(:,5) = []vect(:,4) = []vect(:,2) = []vect(:,1) = []elseif b == 4vect(:,5) = []vect(:,3) = []vect(:,2) = []vect(:,1) = []elseif b == 5vect(:,4) = []vect(:,3) = []vect(:,2) = []vect(:,1) = []end% Generate new data setFinalData = vect' * normsamps';RowOrigData = vect * FinalData;RowOrigData = RowOrigData + meanmat'; % add means in againReconData = RowOrigData'wavwrite(ReconData(:,1),48000,'out1.wav')wavwrite(ReconData(:,2),48000,'out2.wav')wavwrite(ReconData(:,3),48000,'out3.wav')wavwrite(ReconData(:,4),48000,'out4.wav')wavwrite(ReconData(:,5),48000,'out5.wav')
194 of 208

Matlab code implementing a Hanning window envelope to allow dynamic PCA. Windows are set at 500ms with 50% overlap to ensure unity gain. Variable ‘atten’ sets factor for gain/attenuation of non-principal components, atten = 0 removing or muting all non-principal conponents.
%-- 23/03/06 11:55 --%%============================================================% PCA ON 500MS BLOCKS OF SAMPLES% FROM RAW PCM AUDIO FILES% 48khZ, 16 BIT% Ben Shirley% DELETES OUTPUT FILES FIRST BEFORE RUNNING%============================================================sampsPerWindow = 24000; % define for ease of alteration% - 500ms block = 24000 @ 48KHzatten = 0; % attenuation factor (<1 please!) % 0 = mute, 1 = no atten% open pcm files for readingfid1=fopen('1.pcm','r');fid2=fopen('2.pcm','r');fid3=fopen('3.pcm','r');fid4=fopen('4.pcm','r');fid5=fopen('5.pcm','r'); % open output files then close them to delete existing datafido1 = fopen('out1.pcm', 'w');fido2 = fopen('out2.pcm', 'w');fido3 = fopen('out3.pcm', 'w');fido4 = fopen('out4.pcm', 'w');fido5 = fopen('out5.pcm', 'w');fclose(fido1);fclose(fido2);fclose(fido3);fclose(fido4);fclose(fido5); % open output files for writingfido1 = fopen('out1.pcm', 'r+');fido2 = fopen('out2.pcm', 'r+');fido3 = fopen('out3.pcm', 'r+');fido4 = fopen('out4.pcm', 'r+');fido5 = fopen('out5.pcm', 'r+'); % get size of file based on channel 1status = fseek(fid1, 0, 'eof');sizbytes = ftell(fid1); % number of bytesnumsamps = sizbytes/2; % number of 16 bit samplesnumread = 0;firsttime = 1;numtimes = 1;status = fseek(fid1, 0, 'bof');% =========HERE'S THE MAIN CODE=============% TODO change so not based on numread - some of these while numread < numsamps(1,1)readposn = ftell(fid1); % number of samps into file [samples, count1] = fread(fid1,sampsPerWindow,'short'); [samples(:,2), count2] = fread(fid2,sampsPerWindow,'short');
195 of 208

[samples(:,3), count3] = fread(fid3,sampsPerWindow,'short'); [samples(:,4), count4] = fread(fid4,sampsPerWindow,'short'); [samples(:,5), count5] = fread(fid5,sampsPerWindow,'short'); numread = numread + count1; % Total samples readreadposn = ftell(fid1); % number of samps into file % if count < full window size, fill extra with 0s if count1 < sampsPerWindow samples(count1:sampsPerWindow, 1) = 0; samples(count2:sampsPerWindow, 2) = 0; samples(count3:sampsPerWindow, 3) = 0; samples(count4:sampsPerWindow, 4) = 0; samples(count5:sampsPerWindow, 5) = 0; end %============Here's the PCA code=========== ave = mean(samples); % mean of channel columns [m,n] = size(samples); % how many samps? % m = numsamps and n = numchannels meanmat = repmat(ave,m,1); % expand averages matrix so can % subtract from samp values to normalise normsamps = samples - meanmat; covariance = cov(normsamps); % find covariance matrix [vect,val] = eig(covariance); % get eigenvectors and eigenvalues % for covariance matrix % need to attenuate or delete less important vectors at this point. % eg. Which is largest n vectors? Attenuate rest! [C,I] = max(val); [x,y] = max(C); PCarray(numtimes,1) = y; % store principal component number for THIS window - debugging % y now contains the column number of the HIGHEST value ( of the % principal component) % The rest should then be attenuated. if y == 1 vect(:,5) = vect(:,5) * atten; vect(:,4) = vect(:,4) * atten; vect(:,3) = vect(:,3) * atten; vect(:,2) = vect(:,2) * atten; elseif y == 2 vect(:,5) = vect(:,5) * atten; vect(:,4) = vect(:,4) * atten; vect(:,3) = vect(:,3) * atten; vect(:,1) = vect(:,1) * atten; elseif y == 3 vect(:,5) = vect(:,5) * atten; vect(:,4) = vect(:,4) * atten; vect(:,2) = vect(:,2) * atten; vect(:,1) = vect(:,1) * atten; elseif y == 4 vect(:,5) = vect(:,5) * atten; vect(:,3) = vect(:,3) * atten; vect(:,2) = vect(:,2) * atten; vect(:,1) = vect(:,1) * atten; elseif y == 5 vect(:,4) = vect(:,4) * atten; vect(:,3) = vect(:,3) * atten; vect(:,2) = vect(:,2) * atten;
196 of 208

vect(:,1) = vect(:,1) * atten; else vect(:,5) = vect(:,5) * atten; vect(:,4) = vect(:,4) * atten; vect(:,3) = vect(:,3) * atten; vect(:,2) = vect(:,2) * atten; vect(:,1) = vect(:,1) * atten; end % Generate new data set FinalData = vect' * normsamps'; RowOrigData = vect * FinalData; RowOrigData = RowOrigData + meanmat'; % add means in again ReconData = RowOrigData';%================END OF PCA CODE================ % Windowing function.... w = hann(size(ReconData,1)); ReconData(:,1) = ReconData(:,1) .* w; ReconData(:,2) = ReconData(:,2) .* w; ReconData(:,3) = ReconData(:,3) .* w; ReconData(:,4) = ReconData(:,4) .* w; ReconData(:,5) = ReconData(:,5) .* w; % seek to a bit before the last end of write so can do window overlap if firsttime == 0 fseek(fido1, - (sampsPerWindow), 'eof'); % (*2 for samps not bytes then /4 for last 1/4 0f last window written) fseek(fido2, - (sampsPerWindow), 'eof'); fseek(fido3, - (sampsPerWindow), 'eof'); fseek(fido4, - (sampsPerWindow), 'eof'); fseek(fido5, - (sampsPerWindow), 'eof');readposnop = ftell(fido1); % number of samps into file % read end of last window into temp array [temp1, tmpcount] = fread(fido1, sampsPerWindow/2, 'short'); % should this be /2 as well??? check tmpcount!!! temp2 = fread(fido2, sampsPerWindow, 'short'); % or does the 'short' argument negate this? temp3 = fread(fido3, sampsPerWindow, 'short'); temp4 = fread(fido4, sampsPerWindow, 'short'); temp5 = fread(fido5, sampsPerWindow, 'short');readposnop = ftell(fido1); % number of samps into file % temp1 to same length as ReconData % Fill rest of array with 0s (*2 because this is % BYTES not SAMPLES) - 16 bit files only temp1(sampsPerWindow/2:sampsPerWindow, 1) = 0; % temp2(sampsPerWindow/2:sampsPerWindow, 1) = 0; temp3(sampsPerWindow/2:sampsPerWindow, 1) = 0; temp4(sampsPerWindow/2:sampsPerWindow, 1) = 0; temp5(sampsPerWindow/2:sampsPerWindow, 1) = 0; ReconData(:,1) = ReconData(:,1)+ temp1; ReconData(:,2) = ReconData(:,2)+ temp2; ReconData(:,3) = ReconData(:,3)+ temp3; ReconData(:,4) = ReconData(:,4)+ temp4; ReconData(:,5) = ReconData(:,5)+ temp5; position = ftell(fido1); fseek(fido1, -(sampsPerWindow), 'eof'); fseek(fido2, -(sampsPerWindow), 'eof'); fseek(fido3, -(sampsPerWindow), 'eof'); fseek(fido4, -(sampsPerWindow), 'eof');
197 of 208

fseek(fido5, -(sampsPerWindow), 'eof');readposnop = ftell(fido1); % number of samps into file end firsttime = 0; % add to windowed array (overlap) % write to output files fwrite(fido1, ReconData(:,1), 'short'); fwrite(fido2, ReconData(:,2), 'short'); fwrite(fido3, ReconData(:,3), 'short'); fwrite(fido4, ReconData(:,4), 'short'); fwrite(fido5, ReconData(:,5), 'short');readposnop = ftell(fido1); % number of samps into file % fseek back in input file for next overlapping window fseek(fid1, -(sampsPerWindow), 'cof'); fseek(fid2, -(sampsPerWindow), 'cof'); fseek(fid3, -(sampsPerWindow), 'cof'); fseek(fid4, -(sampsPerWindow), 'cof'); fseek(fid5, -(sampsPerWindow), 'cof'); numread = ftell(fid1); % number of samps into file numtimes = numtimes + 1;endfclose('all')
198 of 208

APPENDIX J Correlation of speech clarity ratings against the percentage of on-screen dialogue for Clean Audio project
199 of 208

APPENDIX K Liaison statement from the UK Clean Audio Forum to ITU Focus Group on IPTV
Contact: Nick Tanton BBC UK
Tel: Fax: Email: [email protected]
Contact: Richard Nicholls Dolby Laboratories Inc. UK
Tel: Fax: Email [email protected]
Attention: This is a document submitted to the work of ITU-T and is intended for use by the participants to the activities of ITU-T's Focus Group on IPTV, and their respective staff and collaborators in their ITU-related work. It is made publicly available for information purposes but shall not be redistributed without the prior written consent of ITU. Copyright on this document is owned by the author, unless otherwise mentioned. This document is not an ITU-T Recommendation, an ITU publication, or part thereof.
INTERNATIONAL TELECOMMUNICATION UNION FOCUS GROUP ON IPTV TELECOMMUNICATION STANDARDIZATION SECTOR STUDY PERIOD 2005-2008
FG IPTV-IL-0039
English only
WG(s): 6 3rd FG IPTV meeting: Mountain View, USA, 22-26 January 2007
INCOMING LIAISON STATEMENT
Source: UK Clean Audio Forum
Title: Liaison Statement from UK Clean Audio Forum to ITU FG IPTV
200 of 208

- 2 - FG IPTV-IL- 0039
Introduction
An estimated 50 million people 1 in Europe find speech (dialogue and narrative) in television programmes difficult to follow. Reducing the background sound (music, effects and ambient sounds) can make the speech clearer thus providing ‘Clean Audio’. Research at the University of Salford in the UK 2 has found that Clean Audio improves the clarity, quality and enjoyment for hard-of-hearing people and their families.
People with good hearing are able easily to more discern the speech from background, but this ability declines naturally with age. For people with even minor hearing loss or reduced cognitive ability, a high level of background audio information often leads to reduction in audibility or intelligibility of the speech; this often manifests itself before hearing loss would be clinically identified by traditional audiometric measures. This can sometimes lead to the viewer turning up the volume, but doing so will not necessarily improve intelligibility and may even exacerbate the problem.
Clean Audio The UK Clean Audio Forum has defined Clean Audio as:
“The provision of television sound in a manner that achieves clarity of speech (programme narrative and dialogue) for the maximum number of viewers, especially those with hearing loss.”
Various measures might be taken to achieve this. • taking particular care in production and/or
• providing specific mechanisms for delivery which allow the user to select and/or control a mix of speech and background sound (music, effects and ambient sounds) to suit his or her taste/capabilities, for example
! by transmitting metadata to generate a separate alternative mix in the receiver 3 or
! by providing a separate alternative mix
The Forum is studying what practicable steps can be taken to offer such improvements and would welcome liaison with other bodies to share a wider understanding of the challenges and opportunities.
1 Derived from Davis, A. Hearing in Adults, 1995, Whurr Publishers, London. 2 Sponsored by the UK Communications Regulator OFCOM
3 An example approach based on processing multi-channel audio in the television receiver is illustrated in annex A.
201 of 208

- 3 - FG IPTV-IL- 0039
Annex A
An example approach to Clean Audio based on processing multi-channel audio in the television receiver
The introduction of multi-channel audio presents new opportunities to offer choice to to the viewer. In particular, the widespread availability of high-definition television programme material, delivered to the home from a variety of sources, will lead to multi-channel audio becoming more generally available in consumer equipment.
One potential approach to providing Clean Audio is therefore to process multi-channel audio in the television receiver so as to offer “cleaner” speech than is usually contained in conventionally delivered television sound. On selection, this could simply be played out through the existing loudspeakers in standard television sets. The commonly employed approach to surround sound production for film has the front centre channel used to carry speech. As a direct result there is already a large (and so far untapped) archive of programme material suitable for delivering Clean Audio.
UK research has found that, for such material, a good combination of enjoyment and clarity of speech is obtained when the speech can be delivered in the front centre channel and the audio level of left and right channels is reduced by a modest amount.
To maximise the potential market, it is foreseen that a common approach should be adopted for the mechanisms used to provide assistive Clean Audio, whether for packaged media, or for broadcast or IP delivery.
The following commercial requirements are intended to cover the interests of end users, service providers and network operators.
1 General ! Technical specifications shall define optional (rather than mandatory) mechanisms.
! The mechanisms defined in those specifications shall not prejudice the enjoyment of television sound for those who wish to listen to television sound produced and delivered conventionally.
! The mechanisms in those specifications shall not prejudice the delivery of other assistive services such as Audio Description.
! The specifications for delivering Clean Audio and associated data shall be simple and coding-technology neutral, i.e. shall be capable of being employed in conjunction with any multichannel audio coding technology that is supported by DVB.
! The specifications shall be suitable for use on any platform that is employed for delivering multichannel audio, including packaged media, broadcast and IP delivery.
! End users should be able easily to select Clean Audio using a simple interface and (optionally) to control the mix of speech and background sound.
2 Signalling and metadata ! Technical specifications shall enable the receiver to identify the incoming multichannel audio as offering a
Clean Audio service 4.
4 For example signalling to support identification of the following possible Clean Audio implementations : (a) as a separate audio stream (b) the conventional television sound-track authored as Clean Audio (c) Clean Audio derived dynamically using transmitted metadata (d) Clean Audio derived automatically without use of metadata (e) programme material not suitable for Clean Audio.
202 of 208

- 4 - FG IPTV-IL- 0039
! Those specifications shall enable electronic programme guides to optionally include an indication of which programmes are available with Clean Audio.
3 Quality of Service ! The timing of the Clean Audio with respect to vision as delivered by the receiver should not differ from that of
the multi-channel audio.
4 Example System Reference Model based on speech in centre channel Note that other styles and methods of speech delivery may be possible.
_______________
L
R
LFE
Ls
Rs
C (speech)
MCA
Encoder
Multichannel Audio (MCA) bitstream
MCA
Decoder (+ signalling/metadata)
L
R
C +
+
LCLEAN
RCLEAN
Multichannel
Clean Audio Outputs
Optional user control of mix of speech and background sound
Clean Audio to stereo speakers / headphones
Reduced level of L, R, and zero level of Ls, Rs, LFE,
when Clean Audio detected and selected
203 of 208

APPENDIX L Annex E.4 from ETSI TS 101 154 V1.9.1 (2009-09) Digital Video Broadcasting (DVB); Specification for the use of
Video and Audio Coding in Broadcasting Applications based on the MPEG-2 Transport Stream (Technical Specification)
204 of 208

APPENDIX M CM-AVC0084 DVB CM-AVC Commercial Requirements: Delivering “Clean Audio” for the Hard of
Hearing
205 of 208
CM-AVC0084
DVB CM-AVC Commercial Requirements:
Delivering “Clean Audio” for the Hard of Hearing
Author: Tim Sheppard with most input from the
UK Clean Audio Forum Date: 18th September 2006 Version: 1 Status: Draft

206 of 208
CM-AVC0084
Introduction An estimated 50 million people in Europe find speech (dialogue and narrative) in television programmes difficult to follow. Reducing the background sound (music, effects and ambient sounds) can make the speech clearer thus providing ‘clean audio’. Ofcom sponsored research at the University of Salford in the UK has found that ‘clean audio’ improves the clarity, quality and enjoyment for hard-of-hearing people and their families. People with good hearing are able to more easily discern the speech from background, but this ability declines naturally with age. For people with even minor hearing loss or reduced cognitive ability, a high level of background audio information often leads to reduction in audibility or intelligibility of the speech; this often manifests itself before hearing loss would be clinically identified by traditional audiometric measures. This can sometimes lead to the viewer turning up the volume, but doing so will not necessarily improve intelligibility and may even exacerbate the problem. With the increasing popularity of multi-channel audio (also known as surround sound) it is now possible to separate the speech from background sound in the TV transmission. This document proposes that a method of signaling such an audio stream is introduced into the relevant DVB standards.
Background For the purposes of this document, Clean Audio is defined as:
“The provision of television sound in a manner that achieves clarity of speech (programme narrative and dialogue) for the maximum
number of viewers, especially those with hearing loss.” Various measures might be taken to achieve this.
• taking particular care in production and/or • providing specific mechanisms for delivery which allow the user to select and/or
control a mix of speech and background sound (music, effects and ambient sounds) to suit his or her taste/capabilities, for example
• by transmitting metadata to generate a separate alternative mix in the receiver or • by providing a separate alternative mix
The additional costs of producing and transmitting a dedicated sound channel to offer an alternative mix solely for Clean Audio preclude the latter approach. However, the introduction of multi-channel audio opens up a new opportunity to offer choice to viewers. In particular, this will be helped over coming years by the widespread

207 of 208
CM-AVC0084
introduction of high-definition television programme material in the home from a variety of sources, leading to multi-channel audio becoming more generally available in consumer equipment. The commonly employed approach to surround sound production for film where the front centre channel is typically used to carry speech has already resulted in a large and so far untapped archive of programme material suitable for delivering Clean Audio. University research has found that a good combination of enjoyment and clarity of speech is obtained when the speech can be delivered in the front centre channel and the level of left and right channels is reduced by a modest amount. To maximise the potential market, it is foreseen that a common approach should be adopted for the mechanisms used to provide assistive Clean Audio, whether for packaged media, or for broadcast or IP delivery.
Commercial Requirements Technical specifications for Clean Audio are required that meet the following commercial requirements covering the interests of end users, service providers and network operators.
General
1. The specifications shall define optional (rather than mandatory) mechanisms. 2. The mechanisms defined in the specifications shall not prejudice the enjoyment of
television sound for those who wish to listen to television sound produced and delivered conventionally.
3. The mechanisms in the specifications shall not prejudice the delivery of other assistive services such as Audio Description.
4. The specifications for delivering Clean Audio and associated data shall be simple and coding-technology neutral, i.e. shall be capable of being employed in conjunction with any multi-channel audio coding technology that is supported by DVB.
5. The specifications shall be suitable for use on any platform that is employed for delivering multi-channel audio, including packaged media, broadcast and IP delivery.
6. End users should be able easily to select Clean Audio using a simple interface and (optionally) to control the mix of speech and background sound.
Signalling and metadata
1. The specifications shall enable the receiver to identify the incoming multi-channel audio as offering a Clean Audio service.

208 of 208
CM-AVC0084
2. The specifications shall enable electronic programme guides to optionally include an indication of which programmes are available with Clean Audio.
Types of Clean Audio
1. The following is a non-exhaustive list of possible types of Clean Audio, the signalling specifications should support at least these and allow room for later additions:
a. Clean Audio as a separate audio stream b. Conventional television soundtrack authored as Clean Audio c. Clean Audio derived dynamically using transmitted metadata d. Clean Audio derived automatically without use of metadata e. Programme material not suitable for Clean Audio
Quality of Service
1. The timing of the Clean Audio with respect to vision as delivered by the receiver should not differ from that of the multi-channel audio.
System Reference Model This model shows the case when the audio is output through stereo speakers (or headphones).
L
R
LFE
Ls
Rs
C (speech)
MCA Encoder
Multichannel Audio (MCA) bitstream
MCA Decoder (+ signalling/metadata)
L
R
C +
+
LCLEAN
RCLEAN
Multichannel Clean Audio Outputs
Optional user control of mix of speech and background sound
Clean Audio to stereo speakers / headphones
Reduced level of L, R, when Clean Audio detected and selected


