Embed Size (px)
Citation preview

R E S E A R C H R E P O R T N O 12
A report on the ATP Young Drivers Study from the collaborative partnership between the Australian Instituteof Family Studies, the Royal Automobile Club of Victoria
and the Transport Accident Commission of Victoria
IN THE DRIVER’S SEATUNDERSTANDING YOUNG ADULTS’
DRIVING BEHAVIOUR

In the driver’s seat
This report is the product of the collaboration between the Aus-tralian Institute of Family Studies, the Royal Automobile Club ofVictoria, and the Transport Accident Commission of Victoria. Thestudy used data gathered from the Australian Temperament Project(ATP) to identify trends in young adult driving behaviour and fac-tors associated with, and pathways to, unsafe driving behavioursamong this age group.
Australian Institute of Family StudiesThe Australian Institute of Family Studies is Australia’s national cen-tre for research and information on families. Now in its 25th year,the Institute’s research on issues that affect family stability and well-being play a key role in the development of family policy andinformed debate in Australia. The Institute if a statutory authorityestablished by the Australian Government in February 1980.
Royal Automobile Club of VictoriaThe Royal Automobile Club of Victoria (RACV) represents over 1.3million members. The organisation was founded in 1903 and isVictoria’s peak motoring organisation. RACV is responsible forinforming members of issues relating to motoring and advocatingon behalf of members on a range of motoring and safety issues.
Transport Accident Commission of Victoria The Transport Accident Commission (TAC) is the sole provider ofpersonal injury insurance for transport accidents in Victoria. Itfunds medical care and support services for people injured in trans-port accidents. A key role of the TAC is to invest in road safety,primarily via public education campaigns. The TAC has workedclosely with other road safety partners to achieve a significantreduction in death and injury on Victoria’s roads. A state govern-ment owned statutory authority; the TAC was established in 1987.
Australian Temperament ProjectThe Australian Temperament Project is a large longitudinal study ofchildren’s development which began in 1983 with the enrolment ofa representative sample of 2443 infants and their families fromurban and rural areas of Victoria. The study investigates pathways topsychosocial adjustment from childhood to adulthood and theinfluence of personal, family and environmental factors. Since earlyin 2000, the Australian Institute of Family Studies has been collab-orating with researchers from the University of Melbourne and theRoyal Children’s Hospital in this ongoing research project.

DIANA SMART AND SUZANNE VASSALLOwith
Ann Sanson, Samantha Cockfield, Anne Harris, Warren Harrison and Allison McIntyre
Published by the Australian Institute of Family Studies
A report on the ATP Young Drivers Study from the collaborative partnership between the Australian Institute of Family Studies, the Royal Automobile Club of Victoria
and the Transport Accident Commission of Victoria
IN THE DRIVER’S SEATUNDERSTANDING YOUNG ADULTS’
DRIVING BEHAVIOUR

© Australian Institute of Family Studies – Commonwealth of Australia 2005
Australian Institute of Family Studies300 Queen Street, Melbourne 3000 AustraliaPhone (03) 9214 7888; Fax (03) 9214 7839Internet www.aifs.gov.au/
This work is copyright. Apart from any use as permitted under the Copyright Act 1968, no part may be reproduced by any processwithout permission in writing from the Australian Institute of Family Studies.
The Australian Institute of Family Studies iscommitted to the creation and disseminationof research-based information on family functioning and wellbeing. Views expressed in its publications are those of individualauthors and may not reflect Institute policy or the opinions of the Editor or the Institute’sBoard of Management.
In the driver’s seat: Understanding young adults’driving behaviour, by Diana Smart and SuzanneVassallo, with Ann Sanson, Samantha Cockfield, Anne Harris, Warren Harrison and Allison McIntyre, AIFS Research ReportNo. 12, May 2005.
BibliographyISBN 0 642 39523 3
Designed by Double Jay GraphicsPrinted by Impact Printing
ISSN 1447-1469 (Print)ISSN 1477-1477 (Online)
Disclaimer
The research presented in this Report has beenfunded by the Australian Institute of FamilyStudies, the Royal Automobile Club of Victoriaand the Transport Accident Commission, andis released in the public interest. The viewsexpressed and conclusions drawn are those ofthe authors and do not necessarily reflectRACV or TAC policy.
Although this Report is believed to be correctat the time of publication, RACV and TAC, tothe extent lawful, exclude all liability for loss(whether arising under contract, tort, statuteor otherwise) arising from the contents of theReport or from its use. Where such liabilitycannot be excluded, it is reduced to the fullextent lawful. Discretion and judgement shouldbe applied when using or applying any of theinformation contained within the Report.

I N T H E D R I V E R ’ S S E AT v
Foreword
Understanding the processes by which young Australians develop into safe orrisky drivers is crucial in increasing road safety, minimising harm and maximis-ing positive outcomes for our young people. This report focuses on the personal,family and social characteristics that are linked to differing patterns of drivingbehaviour, while acknowledging the salient role of situational, mechanical andlegal factors that influence driving behaviour.
The report is the culmination of a collaborative project between the AustralianInstitute of Family Studies, the Royal Automobile Club of Victoria, and the Trans-port Accident Commission of Victoria.
The focus of the collaboration was the longitudinal community study, the AustralianTemperament Project (ATP), which itself is a collaboration between researchers fromthe Institute, the University of Melbourne and the Royal Children’s Hospital. TheATP contains 13 waves of data covering many aspects of life from infancy to earlyadulthood, collected from a representative sample of 2,443 children and parents.
The collaborative project reported here began in 2001 with the realisation that theforthcoming ATP data collection at 19-20 years would provide a valuable oppor-tunity to examine the learner driver and current driving experiences of youngpeople who had recently become licensed drivers (the legal licensing age for mostparticipants was 18 years of age). As a result, the ATP Young Drivers Study formedpart of the ATP’s 2002 data collection.
Among the major findings emerging from the ATP Young Drivers Study was thatrisky driving was still quite prevalent, with speeding and driving when tiredfound to be particularly common. These behaviours continue to be clear targetsfor road safety efforts. Encouragingly, certain behaviours such as drink drivingand failure to use seatbelts were less common, suggesting that road safety effortsaimed at these behaviours have been effective.
The report also highlights the relevance of personal characteristics to drivingbehaviour. The small group who later became high risky drivers had been consis-tently more aggressive, hyperactive, and possessed poorer attention capacitiesand lower social skills from mid childhood than other young drivers. The reportsuggests that, in addition to concentrating on skill development, road safety ini-tiatives and driver education programs could be extended to focus on the linksbetween a person’s individual style and driving behaviour.
Some high risky drivers had a history of problem behaviour, especially antisocialbehaviour and substance use. For these young people, risky driving may be a man-ifestation of a risky lifestyle. These findings further reinforce current efforts tohelp children make the best start in life, which may curb the later developmentof a range of problem behaviours, including risky driving.
On behalf of the three organisations participating in this collaboration, I com-mend the report In the Driver’s Seat: Understanding Young Adults’ Driving Behaviour,and am confident that it will be of widespread interest, value and relevance to pol-icy makers, practitioners, and the broader community.
Professor Alan HayesDirector
Australian Institute of Family Studies

Acknowledgments
The authors of this report would like to thank the Royal Automobile Club of Victoria and the Transport Accident Commission of Victoria for providing the opportunity to undertake this collaborative project, which we believe hasprovided interesting and valuable Australian findings that can inform the development of more effective road safety strategies and policies in Australia.
The leadership and guidance provided over the lifetime of the Australian Temperament Project study by its leading investigators – Associate Professor AnnSanson (Department of Psychology, University of Melbourne), Professor MargotPrior (Departments of Psychology and Paediatrics, University of Melbourne), Professor Frank Oberklaid (Centre for Community Child Health, Melbourne’sRoyal Children’s Hospital) and Associate Professor John W. Toumbourou (Centrefor Adolescent Health, Melbourne’s Royal Children’s Hospital, and Department ofPaediatrics, University of Melbourne) – is particularly acknowledged.
Finally, the authors thank the young people, parents and teachers who have par-ticipated in the Australian Temperament Project. Without their loyalty andcommitment, this research would not have been possible.
A U S T R A L I A N I N S T I T U T E O F F A M I LY S T U D I E Svi

I N T H E D R I V E R ’ S S E AT vii
Contents
Foreword vAcknowledgments viList of tables and figures ixAbout the authors xii
Executive summary xiii
1. Introduction 1
Over-representation of young drivers in traffic accidents 3Factors associated with crash involvement 4
Crash type 4Time and day at which crashes occur 4Alcohol and marijuana use 4Gender 5Passengers 5Speed 6Fatigue 6Seat-belt use 6
Explanations for the higher rate of crashes among young drivers 6Inexperience 7Age 7Risk exposure 7Risk-taking 8
Young problem drivers 8ATP Young Drivers Study 9Structure of the report 9
2. The Australian Temperament Project 11
Driver behaviour measures 15Measures from the longitudinal data set 16
3. Driving behaviour and learner driver experiences 19
Total sample 21Learner driver experiences 21Driving behaviour 24Summary 27
Gender differences 28Learner driver experiences 28Driving behaviour 30Summary 31
Metropolitan, regional and rural differences 32Learner driver experiences 32Driving behaviour 32Summary 33
Motorcyclists and other road users 34

A U S T R A L I A N I N S T I T U T E O F F A M I LY S T U D I E Sviii
4. Precursors and correlates of risky driving, crash involvement and 35
speeding violations
Precursors and correlates of risky driving behaviour 37Formation of groups 37Group characteristics 38Group differences by stage of development 39Summary 46
Precursors and correlates of crash involvement 47Formation of groups 47Group characteristics 47Group differences by stage of development 48Summary 52
Precursors and correlates of speeding violations 52Formation of groups 52Group characteristics 53Group differences by stage of development 54Summary 59
Gender differences in the precursors and correlates of risky driving, 61crash involvement and speeding violations
5. Similarities and differences in the precursors of risky driving, crash 63
involvement and speeding violations
Individual attributes 65Summary of individual precursors 70Social and environmental factors 71Current circumstances 74Summary of social and environmental precursors 75Summary 76
Overlap in membership of the three most problematic driving groups 77
6. Relationship between unsafe driving and other problem behaviours 79
Overlap between the precursors of risky driving and other 81problem behaviours
Summary 84The co-occurrence of problem behaviours at 19-20 years 85
Substance use 85Antisocal behaviour 88Summary 89
Connections between problem behaviours in adolescence and 90driving behaviour at 19-20 years
Substance use 90Antisocial behaviour 92Summary 93
Profile of risks of single-problem and multiple-problem groups 94Correlates of risky driving and alcohol use 94Correlates of risky driving and marijuana use 95Correlates of risky driving and antisocial behaviour 97Summary 97

I N T H E D R I V E R ’ S S E AT ix
7. Discussion of findings and implications 99
Experiences when learning to drive and subsequent driving behaviour 101Precursors and correlates of risky driving behaviour, crash 102involvement and speeding violationsRelationship between unsafe driving behaviour and other 103problem behavioursConclusions and implications 104
References 116
List of tablesExecutive summary
A. Size and gender composition of the risky driving, crash xviinvolvement and speeding violation groups
Chapter 2
1. Data collection at 19-20 years: Driving-related questions and 14response categories in the young adult survey
2. Data collection at 19-20 years: Driving-related questions and 15response categories in the parent survey
3. Domains and dimensions investigated as precursors and 16correlates of differing driving behaviours
Chapter 3
4. Licence status (self and parent reports) 215. Circumstances surrounding, and outcomes of, crash 25
involvement (self and parent reports)6. Rates of unsafe driving behaviours 26
during the previous 10 trips (self report)7. Gender differences in rates of unsafe driving behaviours 30
during the previous 10 trips
Chapter 4
8. Gender composition of risky driving groups 399. Crash involvement and speeding violation rates among the 39
risky driving groups10. Teacher-reported significant differences between the low, 41
moderate and risky driving groups in mid and late childhood11. Parent-reported and self-reported significant differences between 42
the low, moderate and high risky driving groups in early adolescence12. Parent-reported and self-reported significant differences between 44
the low, moderate and high risky driving groups over mid/late adolescence
13. Parent-reported and self-reported significant differences between 45the low, moderate and high risky driving groups in early adulthood
14. Distribution of crashes across ATP sample 4715. Gender composition of the no, single and multiple crash groups 4816. Crash characteristics of the single and multiple crash groups 4817. Parent-reported and self-reported significant differences between 50
the no, single and multiple crash groups over mid/late adolescence18. Parent-reported and self-reported significant differences between 51
the no, single and multiple crash groups in early adulthood

A U S T R A L I A N I N S T I T U T E O F F A M I LY S T U D I E Sx
19. Distribution of speeding violations among the ATP sample 5320. Gender composition of the no, single and multiple speeding 53
violation groups21. Self-reported speeding behaviour of the no, single and multiple 54
speeding violation groups during their past 10 trips22. Parent-reported and teacher-reported significant differences 55
between the no, single and multiple speeding violation groups in late childhood
23. Parent-reported and self-reported significant differences between 56the no, single and multiple speeding violation groups in early adolescence
24. Parent-reported and self-reported significant differences between 57the no, single and multiple speeding violation groups over mid/late adolescence
25. Parent-reported and self-reported significant differences between the 58no, single and multiple speeding violation groups in early adulthood
Chapter 526. Summary of individual attributes associated with different 70
problem driving outcomes27. Summary of environmental aspects and current life circumstances 75
associated with different problem driving outcomes28. Overlap between the problem driving groups 77
Chapter 629. Overlap between the precursors of high risky driving behaviour, 83
persistent adolescent antisocial behaviour and adolescentmulti-substance use
30. Definition and composition of alcohol and marijuana use groups 86at 19-20 years
31. Definition and composition of combined substance use groups 86at 19-20 years
32. Definition and composition of antisocial behaviour groups 89at 19-20 years
33. Characteristics of adolescent substance use groups 9134. Characteristics of adolescent antisocial groups 9335. Significant differences between the high risky driving only (n=36), 95
high alcohol use only (n=199), and dual problem (high risky driving and high alcohol use) (n=20) groups at 19-20 years
36. Significant differences between the high risky driving only, (n=53) 96high marijuana use only (n=46), and dual problem (high risky driving and high marijuana use) (n=8) groups at 19-20 years
37. Significant differences between the high risky driving only 96(n=47), high antisocial only (n=80), and dual problem (high risky driving and high antisocial) (n=27) groups at 19-20 years
List of figuresChapter 31. Number of professional lessons (self report) 222. Frequency of driving practice (self report) 223. Frequency of driving practice with parents (self and parent reports) 234. Frequency of driving practice with others (self and parent reports) 235. Stress and conflict experienced during driving practice with 24
parents (self and parent reports)

I N T H E D R I V E R ’ S S E AT xi
6. Stress and conflict experienced during driving practice with 24others (self report)
7. Number of hours typically spent driving by time of week 258. Self- and parent-reported frequency of unsafe driving behaviours 279. Number of professional lessons, by gender 2910. Gender differences in the frequency of driving practice with others 2911. Stress and conflict experienced during driving practice with 30
parents, by gender12. Number of times detected speeding, by gender 3113. Number of professional lessons, by locality 3214. Frequency of driving practice, by locality 33
Chapter 4
15. Frequency of risky driving behaviours, by cluster groups 38
Chapter 516. Teacher-reported differences in task orientation between the risky 66
driving groups over time17. Parent-reported differences in persistence between the speeding 66
violation groups over time18. Self-reported differences in antisocial behaviour between the 67
risky driving groups across time19. Self-reported differences in multi-substance use between the 67
crash involvement groups across time20. Parent-reported differences in hyperactivity between the speeding 68
violation groups over time21. Parent-reported differences in cooperation between the speeding 69
violation groups over time22. Self-reported differences in empathy between the risky driving 69
groups over time23. Parent-reported differences in school adjustment difficulties 71
between the risky driving groups over time24. Parent-reported differences in school adjustment difficulties 72
between the speeding violation groups over time25. Self-reported differences in association with antisocial peers 72
between the risky driving groups over time26. Self-reported differences in association with antisocial peers 73
between the speeding violation groups over time27. Self-reported differences in association with antisocial peers 73
between the crash involvement groups over time
Chapter 628. Relationship between risky driving and alcohol use at 19-20 years 8729. Relationship between risky driving and marijuana use at 19-20 years 8830. Relationship between risky driving and combined alcohol 88
and marijuana use at 19-20 years31. Relationship between risky driving and antisocial behaviour 89
at 19-20 years32. Relationship between adolescent alcohol use and risky driving 91
at 19-20 years33. Relationship between adolescent marijuana use and risky driving 92
at 19-20 years34. Relationship between adolescent antisocial behaviour and risky 93
driving at 19-20 years
A U S T R A L I A N I N S T I T U T E O F F A M I LY S T U D I E Sxii
About the authors
Mrs Diana Smart is a Research Fellow at the Australian Institute of Family Stud-ies, and has been the Project Manager for the Australian Temperament Projectsince 1988. She has conducted research for the Victorian Education Department’sCurriculum and Research Branch and the Royal Melbourne Institute of Technol-ogy’s Education Unit, and has lectured in Psychology at Rusden Teachers College.Diana has a Master of Arts degree in Psychology and Diploma of Education.
Ms Suzanne Vassallo is Research Officer within the Children and Parenting Pro-gram at the Australian Institute of Family Studies. In this capacity, she is involvedin a number of projects concerned with child and adolescent developmentincluding the Australian Temperament Project. Suzanne has a Masters degree inClinical Psychology. Prior to joining the Institute, Suzanne was a Research Fellowin the School of Psychology at Deakin University.
Associate Professor Ann Sanson is an Associate Professor in the Department ofPsychology at the University of Melbourne, where her teaching and research arein the areas of developmental psychology, developmental psychopathology andconflict resolution. She was formerly Acting Director of the Australian Institute ofFamily Studies, is the Project Director for Growing Up in Australia (the Longitudi-nal Study of Australian Children) and is a leading investigator in the AustralianTemperament Project. Ann is a Fellow of the Australian Psychological Society.
Ms Samantha Cockfield is the Manager, Road Safety at the Transport AccidentCommission of Victoria (TAC), one of the key road safety organisations in Victo-ria. Key functions of the Road Safety Division include the conduct of marketingand public education campaigns addressing high-risk behaviours such as speed-ing and drink-driving, support for police enforcement activities and research anddevelopment projects to lay the foundation for future safety initiatives. Saman-tha has a Bachelor of Economics degree from Monash University and a Master ofBusiness Administration degree.
Ms Anne Harris is the Chief Behavioural Scientist with the Royal AutomobileClub of Victoria. She is responsible for developing road user policy, programs andresearch projects and has worked within the road safety field since 1995. Anne hasa BBSc with Honours in Psychology from La Trobe University and a Master ofBusiness Administration degree.
Mr Warren Harrison is a psychologist and consultant in private practice withmore than 15 years experience in road safety research, during which he held sen-ior research positions at VicRoads, the Monash University Accident ResearchCentre, and ARRB Transport Research. He is a member of the Australian Psycho-logical Society, an associate fellow of the Australasian College of Road Safety, anda member of the International Council on Alcohol, Drugs, and Traffic Safety. Hisresearch interests include novice drivers, the use of enforcement to modify driverbehaviour, and the application of cognitive psychology to road safety. Warren hasa Masters degree in Educational Psychology.
Dr Allison McIntyre is a Research Analyst in the Road Safety Division of the Trans-port Accident Commission. In this role she conducts research projects andanalyses a range of road safety data to support and evaluate TAC’s road safety pro-grams. Prior to joining the TAC she worked in the private sector in research ineducational and organisational psychology settings. Allison has a PhD in socialpsychology and a Bachelor of Behavioural Science with Honours.

I N T H E D R I V E R ’ S S E AT xiii
Executive summary
Young adults are consistently over-represented among those injured or killed intraffic accidents. Risky driving behaviours such as speeding, driving whenfatigued, and driving under the influence of alcohol are often implicated in thesecrashes. In an effort to shed light on these road safety problems, considerableresearch has been devoted to examining the driving patterns and behaviours ofthis age group, as well as the situational, structural and legal factors that influencetheir driving behaviour. However, much less is known about the earlier circum-stances or factors in young drivers’ lives that may have influenced their currentdriving behaviour.
This report presents findings from the ATP Young Drivers Study – a collaborationbetween the Australian Institute of Family Studies, the Royal Automobile Club ofVictoria (RACV), and the Transport Accident Commission (TAC) of Victoria. Thestudy used data gathered over the course of the Australian Temperament Project(ATP) to identify factors associated with, and pathways to, three different types of problematic driving behaviour (risky driving, crash involvement and speedingoffences) among a large sample of young drivers aged 19 to 20 years. The reportalso examined the learner driver experiences and driving behaviours of theseyoung adults, and the association between unsafe driving behaviours and other problem behaviours (substance use and antisocial behaviour). This Executive Summary highlights some of the most important findings emergingfrom this report.
Australian Temperament Project
The Australian Temperament Project (ATP) is a longitudinal community studythat has followed the development and wellbeing of a large group of Victorianchildren from infancy to young adulthood. Upon recruitment, the sample consisted of 2443 infants (aged four to eight months) and their parents, who were representative of the Victorian population. Approximately two-thirds arestill participating in the study. Thirteen waves of data have been collected, viaannual or biennial mail surveys. Parents, teachers and the young people them-selves have completed questionnaires at various stages. Information has been collected on temperament style, behavioural and emotional adjustment,school attachment and achievement, health, social skills, antisocial behaviour,substance use, civic engagement, road safety, peer and family relationships, aswell as family functioning, parenting practices, family structure and family socio-economic background.
The findings presented here are based on a sample of 1135 young adults (56 percent female) and their parents who participated in this most recent data collec-tion wave when the young adults were aged 19-20 years. Self-, parent- andteacher-reported information collected over the course of the study were used inthe longitudinal analyses.
In the following sections, ATP participants’ learner driver experiences are firstdescribed, and are followed by an account of their current driving behaviour,including time spent on the road, risky driving behaviour, incidence of crashes

A U S T R A L I A N I N S T I T U T E O F F A M I LY S T U D I E Sxiv
and apprehension for speeding. The precursors and correlates of risky driving,crash involvement and speeding violations are next discussed, and finally, thedegree to which risky driving behaviour is associated with other problem behav-iours such as antisocial behaviour and substance use is described.
Learning to drive experiences
When reflecting on their learner driver experiences, most young adults (about 80per cent) recalled practising driving on at least a weekly basis. They typically practised with their parents. Many young adults (78 per cent) and parents (87 percent) reported experiencing some stress or conflict when practising drivingtogether, although this was minor for the majority. Driving practice with persons other than parents, while less common, was generally stress-free. While there was considerable diversity in the number of professional driving lessons young adults had undertaken, most commonly it was between one andfive, and only approximately one-fourth of young people had taken more thanten lessons.
Young women tended to have taken more professional driving lessons, experi-enced higher levels of stress and conflict in their driving practice sessions withparents, and had practised driving more frequently with persons other than theirparents, than young men.
Young adults living in metropolitan areas had undertaken more professional driv-ing lessons than those in regional or rural areas, while those in regional areasrecalled practising driving less frequently than rural or metropolitan drivers.
Discussion
These findings suggest that both parents and young adults are generally heedingthe message communicated by road safety authorities that novice drivers shouldgain substantial driving experience before attaining their probationary licence.However, further efforts may be warranted to ensure that learner drivers living inregional and rural areas are provided with sufficient opportunities to acquire andpractice driving skills.
While participants generally rated driving practice with persons other than par-ents as a stress-free experience, most young adults (especially young women) andtheir parents reported experiencing some stress or conflict during practice ses-sions. Hence, parents and learner drivers may benefit from advice or strategies toreduce the stressful nature of this experience.
Driving behaviour
Eighty-six per cent of young adults had obtained their probationary car driver’slicence by 19-20 years of age. Very few (2 per cent) had gained a motorcyclelicence. Most driving was reported to take place during the week in daylighthours. Night-time driving was less common.
Forty-three per cent of young drivers reported that they had been involved in acrash while driving a car or riding a motorcycle. Most crashes (95 per cent) hadresulted in property damage only, and almost two-thirds (62 per cent) occurredwhen the driver was alone. Almost one-third of young drivers (31 per cent) hadbeen detected speeding by police at least once.

I N T H E D R I V E R ’ S S E AT xv
Speeding was also one of the most common unsafe driving behaviours reported.Exceeding the speed limit by up to 10km/h was very common (80 per centreported doing so on at least one of their last ten trips), and almost half reportedexceeding the speed limit by 10-25 km/h on at least one of these occasions. Driving when fatigued was also relatively common, with 64 per cent of youngdrivers reporting that they had recently driven when very tired. Other unsafedriving behaviours, such as failing to wear a seat-belt or motorcycle helmet anddriving when affected by alcohol or illegal drugs were less prevalent, ranging inincidence from 8 -14 per cent.
Young men reported engaging in most unsafe driving behaviours more frequentlythan young women (particularly speeding, driving when affected by alcohol, and non-seat-belt use). Young men were also more likely to have been detectedspeeding by police.
Individuals living in non-metropolitan areas were more likely to engage in certainunsafe driving behaviours such as driving when affected by alcohol (higheramong regional drivers) and not wearing a seat-belt or motorcycle helmet whendriving (higher among rural drivers).
Discussion
Consistent with other research, the findings from the ATP Young Drivers Studysuggest that some level of unsafe driving behaviour is common among youngadults, particularly young males. While the findings strongly reinforce the objec-tives of current initiatives targeting unsafe driving, especially speeding anddriving when fatigued, they also suggest that the current range of initiatives maynot be reaching some people. Further efforts may be needed to understand whythese communications are not connecting with all young drivers and how theymight be better targeted.
Precursors of risky driving, crashes and speeding
The precursors and correlates of three problematic driving outcomes were inves-tigated: risky driving behaviour, crash involvement and speeding violations. Foreach outcome participants were divided into three separate groups on the basis oftheir self-reported driving behaviour:
For risky driving behaviour, young adults were assigned to low, moderate or high risky driving groups on the basis of their self-reported risky driving behaviour (for example, speeding, failure to wear a seat-belt or motorcycle hel-met, driving when fatigued, or driving when affected by alcohol or illegal drugs),during their ten most recent trips.
For crash involvement, young adults were allocated to no, single or multiple crashgroups depending upon the number of crashes they reported having beeninvolved in when driving or riding a motorcycle.
For speeding violations, young adults were assigned to no, single or multiple speeding violation groups based on the number of times they reported havingbeen detected speeding by police.
The composition of these groups is shown in Table A.

A U S T R A L I A N I N S T I T U T E O F F A M I LY S T U D I E Sxvi
The correlates and precursors of each outcome type were then investigated bycomparing the relevant outcome groups (for example, for risky driving; the low,moderate and high risky driving groups) on characteristics assessed at 19-20 years(correlates) or earlier in life (precursors). When investigating the correlates andprecursors of crash involvement and speeding violations, the amount of timeyoung adults reported driving each week was statistically controlled.
While the precursors and correlates of risky driving, crash involvement andspeeding violations were investigated separately (details may be found in the fullreport), only the general trends and common precursors across all three outcometypes are presented here.
Young adults in the high risky driving, multiple crash and/or multiple speedingviolations groups differed from other drivers on a wide range of domains. Mostnotably, in comparison to other drivers they tended to be more aggressive; engagemore frequently in antisocial acts (for example, property offences or violence);have a less persistent temperament style (have difficulty in seeing tasks throughto completion); use more licit and illicit substances; have friendships with peerswho tended to be involved in antisocial activities; and have had more police con-tact for driving-related offences. In addition, those in the high risky driving and/ormultiple speeding violation groups tended to be more hyperactive, less cooperative,and had experienced more school adjustment difficulties than other drivers.Common precursors shared by the high risky driving and multiple crash groups werea more difficult parent–child relationship and a tendency to use drugs or reactexplosively when stressed.
While there was considerable overlap between the predictors and correlates ofrisky driving, crash involvement and speeding violations, group differencesamong the risky driving and speeding violation groups tended to be more powerful, more consistent and emerge earlier (in mid to late childhood) than differences among the crash involvement groups (which emerged in mid to lateadolescence). There were also some personal attributes and environmental characteristics that were uniquely associated with each driving outcome.
Some of the similarity in the profiles of the high risky driving and multiple speed-ing violation groups may have resulted from some overlap in the membership
Outcome Groups n % sample % male
Risky driving Low 675 64 39
Moderate 306 29 50
High 74 7 77
Crash involvement No 596 57 44
Single 312 30 41
Multiple 136 13 54
Speeding violations No 712 69 39
Single 209 20 52
Multiple 113 11 68
Table A. Size and gender composition of the risky driving, crash involvement and speeding violation groups

I N T H E D R I V E R ’ S S E AT xvii
of these two groups. Nevertheless, it is important to note that the majority ofyoung adults in these groups displayed only one of these types of problem driv-ing behaviour. Hence it is likely that other factors also contributed to thesimilarity in the group profiles, for example, shared risk factors.
Discussion
These findings have a number of important implications, which will now be discussed.
Risk factors could be identified from childhoodLooking back in life, high risky drivers and those with multiple speeding viola-tions tended to be more aggressive, more hyperactive and less persistent thantheir counterparts from mid to late childhood. High risky drivers also tended to have experienced more difficulties adjusting to the routines and demands of school life, while those with multiple speeding violations were generally rated as less cooperative and self-controlled from this time. These findings suggest that some antecedents of problematic driving behaviour are noticeable as early as mid to late childhood, many years before a person first drives a car or motorcycle.
There are several ways in which characteristics which develop in childhood andadolescence might influence and contribute to unsafe driving behaviour in earlyadulthood. First, these characteristics may directly influence driving behaviour(for example, aggressive tendencies could lead to road rage). Second, childhoodand adolescent factors may indirectly impact on later driving behaviour, by con-tributing to the development of cognitive, emotional or behavioural responsestyles that are associated with problematic driving behaviours (for example, cog-nitive deficits that underlie attentional difficulties may limit a young driver’sability to divide and switch attention between competing driving tasks). Finally,these factors may be a sign of the onset of a problematic developmental pathway,which may lead to a range of later difficulties, including problematic driving (forexample, aggressive behaviour is a risk factor for antisocial behaviour, which maylead to the development of a constellation of other problem behaviours includingunsafe driving).
Given the connections between childhood and adolescent factors and subse-quent driving outcomes found here, intervention programs implemented atearlier stages of development could reduce the development of a number of prob-lematic outcomes including unsafe driving, and thus may prove a useful additionto current road safety initiatives.
Individual attributes were important predictorsAcross all types of problematic driving, the most problematic drivers could be distinguished from other drivers on a range of individual attributes and behav-iours during adolescence and early adulthood. Common risk factors for alloutcomes were a less persistent temperament style, higher aggression, and higherrates of involvement in antisocial behaviour and multi-substance use.
As well as focusing on skill development, road safety initiatives and driver education programs could be broadened to include a component highlighting thecontribution of individual style and personal factors to driving behaviours andskills. For example, those who are impulsive or risk takers may be more prone to

take impetuous, potentially dangerous actions while those who have a highlyreactive temperament style may be more prone to become upset or irritated by theactions of other drivers. Suggestions on how to manage such individual charac-teristics in the driving situations could be communicated to learner drivers viagroup workshops, road safety websites and/or information kits.
The role of social factorsFactors related to the peer and school environments were important predictors of all types of problematic driving outcomes. During adolescence (and even earlier among risky drivers) those who became the most problematic drivers had consistently experienced more school adjustment difficulties than other drivers and associated more often with peers who engaged in antisocial behaviourand/or multi-substance use. There was also a trend for individuals who engagedin high levels of risky driving and/or had been involved in multiple crashes toexperience more difficulties than other young adults in their relationships withtheir parents.
Thus, it seemed that adolescents who did not feel connected to their school envi-ronment and experienced difficult interpersonal relationships more oftentraversed problematic developmental pathways leading to unsafe or illegal driv-ing behaviours. As stated earlier, it is possible that intervening in these pathwaysmay help to reduce or prevent the development of a number of later problem out-comes, including unsafe driving.
Predicting crash involvement is less easyThe findings suggest it is more difficult to predict crash involvement than riskydriving or speeding offences, presumably because situational factors play a considerable role in whether crashes occur and because crashes are relativelyinfrequent events. Precursors of crash involvement were only apparent from mid adolescence on and were generally less powerful than those identified forrisky driving and speeding violations. Nevertheless, this study did identify some personal and environmental characteristics that appeared to increase therisk that a young adult would be involved in a crash when driving. Those who had been involved in a crash tended to have greater difficulties remaining focused on tasks, react more intensely when frustrated or upset, exhibit morebehaviour problems and engage in more antisocial behaviour and multi-sub-stance use than those who had not been involved in a crash. Many of thesecharacteristics are similar to those identified as precursors of risky driving orspeeding offences.
Which drivers should be targeted? While many young adults were found to engage in some unsafe driving behav-iour, it should be noted that most did so only occasionally. Only a small number(approximately 7 per cent) exhibited a consistent pattern of highly unsafe driv-ing. This small group would appear to represent a major road safety concern, andhence, interventions aimed at this type of driver would appear worthwhile.
These findings prompt an important intervention question. Namely, which groupof young drivers is it more important to target – the large number who occasionallyengage in high risky driving behaviour or the few who frequently engage in unsafedriving behaviour? Targeting the behaviour of which group will lead to the greatestgains for road safety, and will the same types of intervention be equally effectivewith both groups? Further research is needed to examine the efficacy of interven-tion approaches aimed at these two very different groups of young drivers.
A U S T R A L I A N I N S T I T U T E O F F A M I LY S T U D I E Sxviii
I N T H E D R I V E R ’ S S E AT xix
Relationship between unsafe driving behaviour and other
problem behaviours
The relationship between unsafe driving (as measured by risky driving), sub-stance use and antisocial behaviour was examined to determine the extent towhich these problem behaviours were interrelated. First, drawing upon previousATP research, the longitudinal precursors of risky driving, persistent adolescentantisocial behaviour and adolescent multi-substance use were compared, to see ifthese three types of problem behaviour shared similar risk factors. Some overlapin the longitudinal precursors of risky driving, persistent adolescent antisocialbehaviour and multi-substance use was found, with aspects of temperament style,behaviour problems, school adjustment and interpersonal relationships predict-ing all three outcomes.
Second, the co-occurrence of unsafe driving, substance use and antisocial behav-iour was examined. While the overlap between these problem behaviours was farfrom complete, young adults who engaged in high levels of risky driving behav-iour also tended to engage more frequently in antisocial activities and use alcohol,marijuana or both substances more often than less risky drivers. Furthermore,looking back in time, high risky drivers had displayed higher levels of these prob-lem behaviours during adolescence. These trends were particularly notable forantisocial behaviour (40 per cent of risky drivers had consistently engaged in anti-social behaviour across adolescence) and for alcohol use (one-third had beenconsistently high alcohol users across adolescence).
Discussion
The findings of the ATP Young Drivers Study suggest that risky driving, substanceuse and antisocial behaviour are interrelated. These findings offer partial supportfor the view that problem behaviours are related to each other, and may be causedby a common underlying trait or propensity for problem behaviour. This viewthus suggests a shift in focus from preventing specific problem behaviours tointervening in the development of individuals upon problematic pathways.
These findings have important implications, as they suggest that interventionstargeted at a single type of problem behaviour (for example, substance use, anti-social behaviour or risky driving) may have broader benefits and impact on thedevelopment of other types of problem behaviours. Nevertheless, considerablevariability was found among young adults who engaged in high levels of riskydriving behaviour, highlighting the need for a range of prevention and interven-tion approaches.
Conclusion
It is clear from this research that some antecedents of problematic driving behav-iours appear at early developmental stages, well before driving age. Consequently,initiatives aimed at early intervention and prevention that can be targeted atlikely high risk groups should be supported. Ideally, these should be implementedin mid to late childhood.
It is also evident that there is some overlap between young drivers who engage inproblematic driving behaviour and those who engage in other high-risk activities.As a result, broader initiatives that address common risk factors, such as aggressive

A U S T R A L I A N I N S T I T U T E O F F A M I LY S T U D I E Sxx
tendencies, attentional capacities and social skills, should be implemented inaddition to single-issue initiatives that concentrate on a specific outcome – forexample, road safety or substance use.
Some factors which consistently emerged as risk factors (for example, aggression,hyperactivity, attentional problems) were evident from mid childhood and arelikely to be physiologically based. The findings of the ATP Young Drivers Studysuggest that such underlying physiological propensities may be of greater concernthan previously acknowledged in road safety. Further research is needed to inves-tigate this issue, its relevance to the field and its intervention implications.
While this research has helped identify some of the characteristics of high-riskyoung drivers, it is important that future efforts are also channelled to triallingand evaluating various preventative interventions. Re-examination of road safetyissues in the next ATP survey wave (scheduled to take place when participants areaged 24 years) would also be beneficial, to help determine whether any changesin these behaviours have occurred as this cohort of young drivers mature and gainincreased driving experience.
Taken together, the findings from the ATP Young Drivers study have increasedunderstanding of the development of “normal” and “problematic” driving pat-terns, and have implications for the nature and timing of interventions aimed atreducing or preventing risky driving, crash involvement and speeding behavioursamong young novice drivers. The findings are a reminder that the attributes andcapacities that young people bring to the task of driving influence their skills andeffectiveness as drivers, together with situational, structural, and legal factorsassociated with the driving environment.

INTRODUCTION
1

I N T H E D R I V E R ’ S S E AT 3
This report of the ATP Young Drivers Study is the product of a collaborative part-nership between the Australian Institute of Family Studies, the Royal AutomobileClub of Victoria (RACV) and the Transport Accident Commission (TAC) of Victo-ria. The collaboration commenced in 2002 when the RACV and TACcommissioned the Institute to collect and analyse data concerning the nature anddevelopment of driving behaviour among a large group of Victorian young adults(aged 19-20 years) who were participating in the Australian Temperament Project(ATP). The RACV and TAC worked in close partnership with the Institute duringall phases of the project, including the preparation of measurement instruments,determining the nature of the analyses undertaken, the interpretation of studyfindings, and the preparation of this report.
This report provides valuable new information relating to young adults’ ownreported driving behaviour and their experiences when learning to drive, as wellas providing a detailed examination of factors, past and present, which may havecontributed to their current driving behaviour. It is hoped that this informationwill be used to increase understanding of the factors that place a young person at risk of becoming involved in a crash, committing traffic violations, and/orengaging in “risky” driving practices and, in turn, inform road safety programsaimed at preventing young people from engaging in potentially dangerous driv-ing behaviours.
Research concerning young novice drivers is now briefly reviewed.
Over-representation of young drivers in traffic accidents
According to the Australian Bureau of Statistics, the leading cause of death amongyoung Australians aged between 15 and 24 years is injury, and transport accidentsaccount for more injury-related deaths than any other cause (ABS 2003). WithinAustralia, young drivers are significantly over-represented among those killed orinjured in road traffic accidents (Cavallo and Triggs 1996; Dunsire and Baldwin1999; Palamara et al. 2001; TAC 2003). For example, in the State of Victoria,young drivers aged 18 to 25 years accounted for 28 per cent of all drivers killed in2002, despite the fact that they represented only 14 per cent of the licenced pop-ulation (TAC 2003). Crash involvement is particularly high for young novicedrivers, with the TAC (2003) reporting that young Victorians are almost four timesmore likely to be involved in fatal or serious injury crashes during their first yearof driving than more experienced drivers.
This trend for disproportionately high levels of crash involvement among youngdrivers is not unique to Australia. The same phenomenon has been observed inmany other industrialised countries or regions including the United States,Canada, New Zealand, the United Kingdom, and Europe (Begg and Langley 2000;Clarke et al. 2002; Engström et al. 2003; Laapotti et al. 2001; Shope et al. 2001).
Introduction11 Introduction

A U S T R A L I A N I N S T I T U T E O F F A M I LY S T U D I E S4
Considerable research has focused on the crash patterns of young adults and the sit-uational factors associated with crash involvement among this group. However,much less is known about the circumstances, characteristics or factors in youngdrivers’ earlier lives that may have contributed to their later risky or dangerous driv-ing behaviour (Engström et al. 2003; Shope et al. 2001). While acknowledging theimportant influence of situational (such as traffic conditions, time-of-day), struc-tural (such as road design, road conditions), and community (such as norms/lawsregarding driving behaviour, enforcement of road laws) factors on driving behav-iour, this report aims to address this research deficit by primarily focusing on youngdriver characteristics such as their past and present individual attributes, and fea-tures of their current and earlier family and social environments.
Factors associated with crash involvement
As noted, there is an over-representation of young drivers in road traffic accidents.A number of studies suggest that the crashes that young people are involved intend to be different from those of other age groups. To provide some backgroundon the nature of these differences, a brief review of some of these characteristicsnow follows.
Crash type
Young inexperienced drivers are over-represented in most types of crashes butparticularly single-vehicle crashes (Cavallo and Triggs 1996; Clarke et al. 2002;Engström et al. 2003, Palamara et al. 2001; TAC 2003). These crashes typicallyinvolve a single vehicle colliding with a fixed object (such as a tree or pole), orrolling over. More than half of 18 to 25 year-old drivers killed on Victorian roadsin 2002 were involved in a crash of this type (TAC 2003). Young men are morelikely to be involved in crashes resulting from excessive speed, whereas inade-quate driving skills are more likely to play a causal role in crashes involvingyoung women (Cavallo and Triggs 1996; Triggs and Smith 1996).
Time and day at which crashes occur
While the risk of being involved in a crash is highest at night for all age groups(Cavallo and Triggs 1996; Clarke et al. 2002; Triggs and Smith 1996), this risk isparticularly high for young drivers (Cavallo and Triggs 1996; Chen et al. 2000;Clarke et al. 2002; Engström et al. 2003; Palamara et al. 2003; Triggs and Smith1996). Sixty per cent of young drivers killed in Victoria in 2002 were involved incrashes between the hours of 8 pm and 6 am (TAC 2003).
Young drivers are also particularly at risk of being involved in a crash on weekends(Engström et al. 2003). In Victoria in 2002, fatality crashes among young driversmost commonly occurred on Fridays (23 per cent), Saturdays (25 per cent) andSundays (15 per cent) (TAC 2003).
Alcohol and marijuana use
Crashes involving alcohol are more common among young drivers (Cavallo andTriggs 1996; Dunsire and Baldwin 1999; Engström et al. 2003). While researchsuggests that young drivers do not drive under the influence of alcohol more fre-quently than older drivers, it appears that when they do, they are at higher risk ofbeing involved in a crash (Cavallo and Triggs 1996; Engström et al. 2003). Forexample, Palamara and colleagues (2001) compared crash rates among three

I N T H E D R I V E R ’ S S E AT 5
cohorts of Western Australian drivers and found that a higher proportion of firstyear drivers were involved in crashes at low Blood Alcohol Concentration (BAC)levels (up to 0.099 gm per cent) than those with five or ten years licensure.
The relationship between crash involvement and marijuana is less clear. Althoughmarijuana is the most common psychoactive substance after alcohol found in theblood of motorists involved in crashes (Begg et al. 2003), its role as a causal factorin these crashes is unclear (Begg et al. 2003; Fergusson and Horwood 2001). Forexample, Fergusson and Horwood (2001) examined the relationship betweenmarijuana use and crash involvement among a large sample of young adults liv-ing in New Zealand. While they found a higher rate of “at-fault” crashes amongregular marijuana users than non-users, they concluded that the elevated crashrate among this group appeared to be largely due to the characteristics of the mar-ijuana users (that is, they were more prone to “drink-drive”, engage in other riskydriving behaviours, and to have attitudes favourable to driving violations) ratherthan the effects of the drug itself. The findings of Begg and colleagues (2003) sup-ported this conclusion.
Nevertheless, recent research suggests that there may be a direct connectionbetween marijuana use and crash involvement. A large Australian study (Drum-mer et al. 2004) which examined the relationship between drug use and crashculpability among 3398 fatally injured drivers of a variety of ages (not just youngdrivers) found a significant association between THC (the main psychoactiveagent found in marijuana) and crash responsibility. After taking into account awide range of factors associated with each crash (the condition of the road and thevehicle, the driving conditions, crash type, witnesses’ observations, obedience ofthe road law, the difficulty of the task and level of fatigue), drivers with THC intheir blood were significantly more likely to be found “responsible” for the crashthat killed them, than drug-free drivers. This association was particularly appar-ent for drivers with THC concentrations of 5ng/ml or higher, with the likelihoodthat these drivers being found “culpable” being similar to drivers with BAC levelsof at least 0.15g per cent. THC was also found to increase the likelihood of crashculpability in drivers who had been drinking alcohol.
Gender
Overall, young male drivers are involved in more crashes than young female driv-ers (Cavallo and Triggs 1996; Engström et al. 2003, Clarke et al. 2002; Vick 2003).For example, almost 80 per cent of young drivers (18-25 years old) who died in amotor vehicle crash in Australia in 2002 were male (Australian Transport SafetyBureau 2003). The proportion of young male traffic fatalities was even higherwithin Victoria during this time period (88 per cent) (Australian Transport SafetyBureau 2003).
However, males tend to drive more often than females (Kweon and Kockelman2002; Richardson 2001). Consequently, once exposure (the number of kilometresdriven) is taken into account, this gender difference in crash rates disappears, withthe crash risk per kilometre for young Australian males and females generallybeing similar (Cavallo and Triggs 1996; Engström et al. 2003).
Passengers
Some research suggests that young drivers are at higher risk of being involved ina crash than older drivers if they are carrying passengers (Cavallo and Triggs

A U S T R A L I A N I N S T I T U T E O F F A M I LY S T U D I E S6
1996; Chen et al. 2000). For example, Chen and colleagues (2000) examined datarelating to all fatal crashes within the United States between 1992 and 1997, andfound that the risk of fatal injury increased for younger drivers (16-17 years) withthe number of passengers carried in the vehicle. Compared to other drivers of thesame age without passengers, the risk of fatal injury for a 16-year old driver withone passenger was 1.86 times higher; 2.58 times higher with two passengers; and3.07 times higher with three passengers. In contrast, the risk of death for olderdrivers (30-59 years) decreased if there were passengers in the car.
Speed
Another factor that is often associated with crashes among young drivers is speed(Clarke et al. 2002; Engström et al. 2003). Speeding is the most common drivingoffence amongst young drivers, and excessive speed is implicated in many crashesamong this age group (Clarke et al. 2002; Engström et al. 2003; Palamara et al.2001). For example, excessive speed was judged to play a role in about 20 per centof crashes involving first year licenced drivers in Western Australia in 1998, com-pared with only 10 per cent of crashes involving drivers who had held theirlicence for ten years (Palamara et al. 2001).
Fatigue
Research suggests that young drivers are involved in more fatigue-related crashesthan older drivers (Clarke et al. 2002; Dobbie 2002; Engström et al. 2003). In ananalysis of fatigue-related crashes in Australia between 1990 and 1998, Dobbie(2002) found that when the amount of driving exposure was taken into account,fatigued male drivers/riders aged between 17 and 24 years had the highest rate ofsingle vehicle crashes, and were involved in more early morning (midnight to6am) crashes than any other age group.
Seat-belt use
There is some research evidence that suggests that seat-belt use is less common inyoung drivers than other age groups, particularly young men (Begg and Langley2000; Engström et al. 2003; Senserrick and Harrison 2000; Triggs and Smith 1996).For example, Senserrick and Harrison (2000) examined seat-belt-related attitudesand behaviours among 954 Victorian drivers, and found that young drivers (aged17-25 years) were more likely than older drivers (aged 51-90 years) to display apoor road safety profile, characterised by inconsistent seat-belt use, less favourableattitudes towards seat-belt use and road safety, and a more negative perception oftheir own driving ability.
In another study, Begg and Langley (2000) examined rates of self-reported seat-belt use among 948 New Zealander young adults (aged 21 years) and found thatonly 70 per cent of young male drivers reported using a seat-belt at all times com-pared with 85 per cent of young female drivers. Forgetfulness, discomfort and aperceived low risk of injury were the most common reasons cited by participantsin this study for not wearing a seat-belt.
Explanations for the higher rate of crashes among
young drivers
A number of explanations have been posited for the high crash rate among youngdrivers. These include inexperience, age, risk-exposure, and risk-taking.
I N T H E D R I V E R ’ S S E AT 7
Inexperience
Inexperience seems to be a major contributor to the high crash rate among youngdrivers. Support for this conclusion can be found in the observation that crashrisk decreases with driving experience, with the first few months of driving beingconsidered the most dangerous (Cavallo and Triggs 1996; Engström et al. 2003).
New drivers tend to have poorly developed vehicle control skills and lack manyof the cognitive and perceptual skills needed to make them safe and effective driv-ers (Cavallo and Triggs 1996; Triggs and Smith 1996). Research suggests thatinexperienced drivers tend to underestimate the level of risk associated with cer-tain types of driving behaviour or situations, and overestimate their own level ofdriving ability or capacity to deal with such situations. Furthermore, inexperi-enced drivers tend to have greater difficulties in anticipating and accommodatingthe behaviour of other road users and in dividing their attention between com-peting driving tasks than more experienced drivers. Vehicle control skills increaserapidly with experience, however, perceptual and cognitive skills are slower todevelop (Cavallo and Triggs 1996; Triggs and Smith 1996).
Not surprisingly, research suggests that young drivers who gain high levels ofsupervised driving practice prior to attaining their driving licence are at less of riskof being involved in a crash than other young drivers (Engström et al. 2003). Onthe basis of this research, Victorian road safety authorities have introduced com-prehensive road safety programs aimed at encouraging learner drivers to gainhigh levels of supervised driving experience (a minimum of 120 hours), on alltypes of road and in all types of conditions, prior to gaining their drivers’ licence.
Age
Age-related factors are also seen as important. For most young drivers, the attain-ment of their driving license occurs a time when they are attempting to find their own identity and gain independence from their parents (Engström et al.2003; Laapotti et al. 2001). At this developmental stage, conformity with per-ceived social norms is often of great importance, and as a consequence, peerinfluence is particularly potent (Engström et al. 2003). Research suggests thatyoung drivers experience more pressure from their peers to engage in “risky”and/or illegal driving behaviours than older drivers (Engström et al. 2003). Oneway peer pressure may impact on driving behaviour is through the influence ofpassengers, which, as noted previously, has been shown to be a risk factor forcrash involvement among young drivers (Cavallo and Triggs 1996; Chen et al.2000). It has been suggested that the presence of passengers in the car (particu-larly those who are young and male) may encourage young people to engage inrisky driving behaviours, such as speeding or following other vehicles too closely(Chen et al. 2000).
Risk exposure
Another factor that may impact on the high crash rate among young drivers is thetype of driving experiences they are exposed to (Cavallo and Triggs 1996; Cret-tenden and Drummond 1994; Laapotti et al. 2001). While young drivers generallydo not drive further than older drivers (Crettenden and Drummond 1994), theirlifestyles often expose them to more driving risks than other drivers (Laapotti etal. 2001). For example, young drivers are more likely to drive at night or on week-ends, when crash rates are higher (Cavallo and Triggs 1996; Crettenden and

A U S T R A L I A N I N S T I T U T E O F F A M I LY S T U D I E S8
Drummond 1994; Laapotti et al. 2001). Furthermore, young drivers tend to driveolder vehicles, placing them at increased risk of serious injury if they are involvedin a crash (Engström et al. 2003).
Risk-taking
Risk-taking has also been implicated in the over-representation of young driversin traffic accidents. As Williams (1998: 21) notes: “Compared with older people,young drivers are more likely to drive fast, follow too closely, overtake in a riskymanner, allow too little time to merge, and fail to yield to pedestrians.” However,it would appear that the majority of young drivers who engage in risky drivingbehaviour do not do so deliberately. Rather, inexperience and a tendency tounderestimate risk and overestimate one’s own abilities is seen as being responsi-ble for this type of driving behaviour in most of these young drivers (Cavallo andTriggs 1996; Williams 1998). Nevertheless, there is a small sub-group of youngdrivers for whom such risky driving behaviour appears to be intentional (Williams1998). The characteristics of this group will now be discussed.
Young problem drivers
In the research focusing on young drivers, much attention has been paid to asmall sub-group of “young problem drivers” who are excessive risk takers anddeliberately engage in high-risk driving behaviours for the “thrill” they receivefrom them (Cavallo and Triggs 1996; Crettenden and Drummond 1994; Williams1998). These drivers are seen as being at increased risk of being involved in acrash, and hence are perceived as an obvious target for interventions aimed atreducing crashes among young drivers (Crettenden and Drummond 1994;Williams 1998).
A wide range of characteristics have been associated with this group of youngproblem drivers (Cavallo and Triggs 1996; Crettenden and Drummond 1994).These include: high levels of aggression or hostility (Begg et al. 2003; Cavallo andTriggs 1996; Norris et al. 2000; Ulleberg and Rundmo 2003); attentional difficulties(Barkley et al. 2002; Woodward et al. 2000); high alcohol, marijuana and other druguse (Cavallo and Triggs 1996; Lang et al. 1996; Shope et al. 1997; Shope et al. 1996;Shope et al. 2001); a sensation-seeking personality style (Cavallo and Triggs 1996;Jonah 1997; Ulleberg and Rundmo 2003); attitudes favourable to “norm-defying”behaviours (Cavallo and Triggs 1996; Ulleberg and Rundmo 2000); low parentalsupervision (Hartos et al. 2000; Shope et al. 2001); lenient parental attitudes towardsyoung people’s alcohol use (Shope et al. 1996; Shope et al. 1997; Shope et al. 2001);limited/non-existent parent-imposed driving restrictions (Beck et al. 2001; Hartos et al.2000); and high involvement with peers who misuse substances (Lang et al. 1996;Shope et al. 1996; Shope et al. 1997; Shope et al. 2001).
Additionally, those who engage in high risk driving behaviour are often found toengage in a range of other risky or problematic behaviours (Cavallo and Triggs1996; Williams 1998), leading to the suggestion that high risk driving behaviouris just one part of a broader problem behaviour syndrome (Williams 1998). Thisview is consistent with Problem Behaviour Theory (Jessor and Jessor 1977; Jessor1987), which posits that problem behaviours are not isolated events, but areinterrelated and reflect a general underlying trait. Hence, according to this view,risky driving represents just one component of a more general problematiclifestyle (Crettenden and Drummond 1994; Williams 1998).

I N T H E D R I V E R ’ S S E AT 9
ATP Young Drivers Study
As is clear from the above review, much of the road safety literature is concernedwith documenting the driving behaviour of young adults (for example, theircrash and traffic violation rates) and distinguishing risky drivers from other drivers on the basis of their attributes or behaviour at the time at which thesecrashes or violations occur. Since much of the research conducted to date hasbeen cross-sectional, or covered restricted time spans, there is limited knowledgeabout the long-term (or “early”) social, educational and behavioural precursors of unsafe driving behaviours among new drivers (Engström et al. 2003; Williams1999).
Longitudinal studies provide an opportunity to better understand how differingdriving styles develop and, in turn, assist policymakers and practitioners to iden-tify intervention opportunities (Williams 1999). While some promisinglongitudinal research has been conducted into the development of problematicdriving behaviour (see, for example, Caspi et al. 1997; Fergusson and Horwood2001; Norris et al. 2000; Shope et al. 1997), longitudinal research in this area islimited. Furthermore, this research has generally been conducted outside Aus-tralia, making its applicability to the Australian context uncertain. For example,variations in the age at which driving licences may be legally obtained, and theage at which alcohol use is officially permitted, as well as cultural attitudes andvalues, may lessen the applicability of studies conducted outside Australia.
The ATP Young Drivers Study attempted to address this research deficit by usingdata from the longitudinal Australian Temperament Project (ATP) to explore theindividual and environmental precursors of differing patterns of young driverbehaviour. Drawing upon the expertise of the RACV and the TAC on road safetyand driver education issues, the ATP dataset was examined in order to: identifyrisk factors linked to subsequent patterns of young adult driving behaviour; iden-tify social and behavioural predictors of crash involvement and traffic violationsamong young drivers; and examine similarities between the profiles of “unsafedrivers” and those who demonstrate other “high risk” behaviours (for example,antisocial behaviour and substance use). In addition, young adults’ current driv-ing behaviours and learner driver experiences were also examined.
It is hoped that this research will provide insights into the development of both“normal” and “problematic” driving behaviour among young drivers, which inturn can be used to inform road safety, education and prevention efforts withinVictoria.
Structure of the report
The report begins with a brief description of the Australian Temperament Project,the measures used to assess learner driver experiences and young adult drivingbehaviour, and the measures contained in the longitudinal data set. This is fol-lowed by sections examining: the learner driver experiences and current drivingbehaviour of ATP participants; the longitudinal precursors of differing patterns ofunsafe or unlawful driving behaviours (“risky” driving, crash involvement andspeeding violations); and the association between “problem” driving behaviourand other problem behaviours (namely substance use and antisocial behaviour).The report concludes with a discussion of the theoretical and practical implica-tions emerging from these findings.

The Austral ian Temperament Project
2

I N T H E D R I V E R ’ S S E AT 13
The Australian Temperament Project (ATP) is a longitudinal study following thepsychosocial development of a large group of children from infancy to adulthood(for a more detailed account see Prior et al. 2000). Broadly, the project aims toinvestigate the contribution of personal, familial and environmental factors to anindividual’s adjustment and wellbeing.
Commencing in 1983 at a child age of four to eight months, a representative sam-ple of 2,443 infants and their families living in urban and rural areas of Victoriawas recruited via the following process. First, following advice from the Aus-tralian Bureau of Statistics, a sub-set of Victorian local government areas wasselected, which was representative of the State’s population in terms of parentaloccupational and educational levels and ethnic background. Second, all familieswith an infant aged between four and eight months who visited their local InfantWelfare Centre in the selected local government areas during the first two weeksin May 1983 were invited to take part in the project. At that time, the Infant Wel-fare Centres (now called Maternal and Child Health Centres) made contact with94 per cent of live births, and the service was very widely used. Finally, compari-son of the characteristics of the recruited cohort to census data showed that thecohort was representative of the State’s population.
In all, 13 waves of data have been collected over the first 20 years of the children’slives, using mail surveys. There has been some sample attrition over the time spanof the project, with approximately 65 per cent of the sample still participating inthe study after 20 years. More of the families who are no longer participating arefrom a lower socio-economic status background, or include parents who were notborn in Australia. Nevertheless, the retained sample of children closely resemblesthe original cohort on all facets of infant functioning, with no significant differ-ences between the retained and no-longer-participating sub-samples on anyinfancy characteristic. Hence, while the study continues to include young peoplewith a wide range of attributes, it contains fewer families experiencing socio-eco-nomic disadvantage than at the commencement of the study.
The findings presented in this report are based on a sample of 1,135 young adults(499 males, 636 females), who participated in the most recent data collectionwave in 2002.
A broad range of individual, family and environmental attributes and character-istics have been assessed during the life of the project. These include the child’stemperament style, behavioural and emotional adjustment, social skills, health,academic progress, relationships with parents and peers, and the family’s struc-ture and demographic profile.
Parents have completed questionnaires about the child’s functioning and aspects offamily life at every survey wave. Teachers reported on the child’s school and socialprogress, personal adjustment, and temperament style at the Preparatory Grade,Grade 2 and Grade 6 survey waves. From the age of 11 years (which for most was
The Australian Temperament Project22 The Australian Temperament Project

A U S T R A L I A N I N S T I T U T E O F F A M I LY S T U D I E S14
Question Response categories
Type of licence held learner, car, and/or motor bike
Date obtained learner's permit month and year
Date obtained probationary licence month and year
Number of professional lessons 0; 1-5; 6-10; 11-15; 16-20; 21-25;or 26 or more
How often practised driving rarely; once a month; once afortnight; once a week; or more often
How often practised driving with parents rarely; once a month; once afortnight; once a week; or more often
How often practised driving with others rarely; once a month; once afortnight; once a week; or more often
Stress and conflict experienced when practising none; a little; a lot; or not applicablewith parents
Stress and conflict experienced when practising none; a little; a lot; or not applicablewith others
In a normal week, how much time spent driving/riding a number of hoursmotor bike on Monday-Friday in daylight hours
In a normal week, how much time spent driving/riding a number of hoursmotor bike on Monday-Friday in night time hours
In a normal week, how much time spent driving/riding a number of hoursmotor bike on Saturday-Sunday in daylight hours
In a normal week, how much time spent driving/riding a number of hoursmotor bike on Saturday-Sunday in night time hours
Experience of crash/accident when s/he was the driver yes or no
Number of crashes/accidents when s/he was the driver number of times
Crash circumstances and result: driving alone, damage number of timesbut no-one injured/killed
Crash circumstances and result: carrying passengers, number of timesdamage but no-one injured/killed
Crash circumstances and result: driving alone, someone number of timesinjured/killed
Crash circumstances and result: carrying passengers, number of timessomeone injured/killed
Number of times caught for speeding number of times
In last 10 driving trips, how many times - drove up to 0; 1; 2; 3; 4; 5; 6; 7; 8; 9; or 10 times10 km/h over the limit
In last 10 driving trips, how many times - drove between 0; 1; 2; 3; 4; 5; 6; 7; 8; 9; or 10 times10 & 25 km/h over the limit
In last 10 driving trips, how many times - drove more than 0; 1; 2; 3; 4; 5; 6; 7; 8; 9; or 10 times25 km/h over the limit
In last 10 driving trips, how many times - drove when 0; 1; 2; 3; 4; 5; 6; 7; 8; 9; or 10 timesprobably affected by alcohol
In last 10 driving trips, how many times - did not wear a 0; 1; 2; 3; 4; 5; 6; 7; 8; 9; or 10 timesseat belt/helmet at all
In last 10 driving trips, how many times - forgot seat 0; 1; 2; 3; 4; 5; 6; 7; 8; 9; or 10 timesbelt/helmet for part of the trip
In last 10 driving trips, how many times - drove when 0; 1; 2; 3; 4; 5; 6; 7; 8; 9; or 10 timesvery tired
In last 10 driving trips, how many times - drove when 0; 1; 2; 3; 4; 5; 6; 7; 8; 9; or 10 timesprobably affected by an illegal drug
Table 1. Data collection at 19-20 years: Driving-related questions and response categories in the young adult survey

I N T H E D R I V E R ’ S S E AT 15
Grade 6), the children have reported on their own personal adjustment, relation-ships with others, and attitudes and beliefs, with a total of six survey wavescompleted by the young people thus far. A noteworthy aspect of the study is theavailability of multiple sources of report for most domains and at most survey waves,thereby providing a rich and reliable account of this cohort of children as they pro-gressed from infancy, through childhood and adolescence and into early adulthood.
Driver behaviour measures
In the latest data collection wave at 19-20 years of age in the year 2002, youngadult participants and their parents completed questions about the young per-son’s experiences as a learner driver, licensing status, current time spent driving,typical driving behaviour, and their crash and enforcement experiences. Themeasures used to assess these issues are shown in Tables 1 and 2.
Question Response categories
Type of licence held by young adult learner, car, and/or motor bike
How often s/he practised driving with parents rarely; once a month; once a fortnight;once a week; or every few days
How often s/he practised driving with others rarely; once a month; once a fortnight; once a week; or every few days
Stress and conflict experienced when parents practised none; a little; a lot; or not applicablewith young adult
Young adult's experience of crash/accident when s/he yes or nowas the driver
Number of crashes/accidents when s/he was the driver number of times
Crash circumstances and result: driving alone, damage number of timesbut no-one injured/killed
Crash circumstances and result: carrying passengers, number of timesdamage but no-one injured/killed
Crash circumstances and result: driving alone, someone number of timesinjured/killed
Crash circumstances and result: carrying passengers, number of timessomeone injured/killed
Number of times young adult has been caught number of timesspeeding
In general, how often does s/he drive up to 10 km/h never; rarely; sometimes; often;over the limit always; or don't know
In general, how often does s/he drive between never; rarely; sometimes; often;10 & 25 km/h over the limit always; or don't know
In general, how often does s/he drive more than never; rarely; sometimes; often;25 km/h over the limit always; or don't know
In general, how often does s/he drive when probably never; rarely; sometimes; often;affected by alcohol always; or don't know
In general, how often does s/he not wear a seat never; rarely; sometimes; often;belt/(helmet if motor bike) always; or don't know
In general, how often does s/he drive when very tired never; rarely; sometimes; often;always; or don't know
In general, how often does s/he drive when probably never; rarely; sometimes; often;affected by an illegal drug always; or don't know
Table 2. Data collection at 19-20 years: Driving-related questions and response categories in the parent survey

A U S T R A L I A N I N S T I T U T E O F F A M I LY S T U D I E S16
Measures from the longitudinal data set
Data from the multi-wave data set was used to investigate the longitudinal pre-cursors and concurrent correlates of differing patterns of driver behaviour. Whilea wealth of data was available from the 13 survey waves, in the interests of econ-omy, some consolidation1 across time points was undertaken. This consolidationwas designed to parallel the major developmental stages. Thus, the followingeight time points were employed:
infancy, covering 4 to 8 months of age, survey wave 1
toddlerhood, from 1 to 3 years of age, survey waves 2 and 3
early childhood, 3-4 years of age, survey wave 4
mid childhood, 5 to 8 years of age, survey waves 5 and 6
late childhood, from 9 to 12 years, survey waves 7 and 8
early adolescence, 12 to 14 years, survey waves 9 and 10
mid/late adolescence, 15 to 18 years, survey waves 11 and 12
early adulthood 19-20 years, survey wave 13
Table 3 displays the domains, variables and time points used in the longitudinalanalyses. A more detailed description of the data collected at each survey wavemay be found in Appendix 1.
Domain Time Point, Dimension, and Source of Report(P) = Parent report (IWN) = Infant Welfare Nurse report(T) = Teacher report (Ch) = Child/adolescent/adult self report
Temperament style In infancy (4-8 months, survey wave 1) activity/reactivity,approach/sociability, cooperation/manageability, irritability (P);Global temperament rating - how easy/difficult the baby'stemperament is (IWN)
In toddlerhood (composite across 1-3 years, survey waves 2 & 3)reactivity; approach/sociability, irritability, persistence,cooperation/manageability (P)
In early and mid-childhood (4 years of age, survey wave 4 (earlychildhood); composite across 5-8 years, survey waves 5 & 6 (midchildhood) inflexibility, approach/sociability, persistence (P); reactivity,task orientation (T - composite across 5-8 years, survey waves 5 & 6)
In late childhood, early adolescence and mid/late adolescence(composite across 9-12 (late childhood); 13-14 (early adolescence);and 15-18 (mid/late adolescence, survey waves 7 to 12) negativereactivity, approach/sociability, persistence; activity (P); taskorientation (T - in late childhood only)
In early adulthood (20 years, survey wave 13) negative reactivity,approach/sociability, persistence (P & Ch)
Behaviour problems In Infancy behaviour problems composite (sleeping problems,excessive crying, colic) (P)
In toddlerhood behaviour problems composite (e.g. tempertantrums, attention problems, excessive shyness) (P)
Table 3. Domains and dimensions investigated as precursors and correlates of differing driving behaviours
Table 3 continued
1 Where identical measures were available at adjacent time points, composite across-timevariables were constructed, first standardising the original variables and then computing theaverage of the standardised variables. For example, the Rutter Child BehaviourQuestionnaire (Rutter, Tizard & Whitmore 1970) was used to obtain parental ratings ofaggression at 5-6 and 7-8 years, permitting the construction of a single, across-time estimateof parent-reported aggressive tendencies from 5-8 years of age

I N T H E D R I V E R ’ S S E AT 17
In early, mid and late childhood aggression, hyperactivity, anxiety (P& T); depression added in late childhood (P & T); aggression,hyperactivity, anxiety, depression (Ch - in late childhood only)
In early and mid/late adolescence aggression, attention problems,anxiety-withdrawal (P); oppositional behaviour, hyperactivity,anxiety, depression; multi-substance use; antisocial behaviour
1 (Ch)
In early adulthood aggression, anxiety-withdrawal (P); anxiety,depression; multi-substance use; antisocial behaviour (Ch)
Social skills In mid-childhood popularity/social skills (T)
In late-childhood assertiveness, cooperation, self control (T)
In late childhood, early adolescence, mid/late adolescence and earlyadulthood assertiveness, cooperation, self control, responsibility, (P);assertiveness, cooperation, self control, empathy (Ch)
Other individual attributes From early adolescence onwards emotional control (Ch)
In early and mid/late adolescence sensation seeking (Ch)
In late adolescence coping style - use of active adaptive strategies(e.g. seeking support), less adaptive: internally focused (e.g. wishfulthinking); acting out strategies (e.g. react explosively); identitydevelopment - clarity, optimism about the future (Ch)
In early adulthood life satisfaction (Ch); civic engagement andparticipation (P & Ch); social capital (Ch)
School adjustment and In mid-childhood school readiness; academic competence;achievement reading skills (T)
In late-childhood academic competence (T)
In early and mid/late adolescence school achievement /adjustmentdifficulties (P); school achievement /adjustment difficulties in early tomid adolescence (Ch); school attachment/bonding in mid to lateadolescence (Ch)
Peer relationships In late childhood quality of peer relationships; antisocial peerfriendships (P); quality of peer relationships (T); self concept aboutpeer relationships (Ch)
In early and mid/late adolescence peer involvement, participation inorganised peer group activities, antisocial peer friendships (P);attachment to peers, friendship quality, antisocial peer friendships(Ch)
In early adulthood number of close friends, antisocial peerfriendships, in a romantic relationship (P & Ch); positive relationshipswith peers (Ch)
Parent-child relationship At all time points rating of how easy/difficult the parent finds thechild (P)
In infancy how well the mother-baby pair was doing (IWV)
In late childhood self concept about relationships with parents (Ch)
In early and mid/late adolescence warmth of parent-adolescentrelationship (P); attachment to parents (Ch)
In early adulthood degree of conflict in parent-young adultrelationship; positive parent-young adult relationship (P & Ch)
Parenting style In early and mid/late adolescence degree ofsupervision/monitoring, use of inductive reasoning, use of harshdiscipline (P)
Family environment At all time points parents' occupational and educational levels, usedto form a composite family socio-economic background index (P)
In infancy parents' age and ethnic background (P)
From early childhood family size (number of children in the family) (P)
From mid childhood family stress (number of negative familystresses in past 12 months) (P)
In early adolescence parental cigarette and alcohol use (P)
Table 3 continued
Table 3 continued

A U S T R A L I A N I N S T I T U T E O F F A M I LY S T U D I E S18
In late adolescence family residential location (urban/rural), parentalseparation/divorce/death during child's lifetime (P)
In early adulthood parental marital status, unemployment, financialstrain (P)
Young adult current life In early adulthood employment status, average number of hours circumstances employed per week, average weekly income, undertaking higher
education, living at home/away from home, highest year of secondary school completed, (Ch)
Young adult criminal In early adulthood contact with the criminal justice system (P);justice contacts and perceived chance of apprehension for drink driving, contact with the attitudes
1police for a driving offence (Ch)
Table 3 continued
1 Data relating to antisocial behaviour was collected as part of a collaborative project between the AustralianInstitute of Family Studies and Crime Prevention Victoria (CPV).The aspects of functioning measured as part of thecollaboration with CPV included facets of antisocial behaviour, contact with the criminal justice system, experiencesof being a victim of crime, perceptions of the fairness of the criminal justice system and perceptions of the risk ofapprehension for committing an offence.

Driving behaviour and learnerdriver experiences
3

I N T H E D R I V E R ’ S S E AT 21
In this section, the range of learner driver experiences and typical driving behaviour of the 19-20 year old participants in the ATP Young Drivers Study aredescribed, along with their history of crash involvement and speeding violations.This is followed by an examination of gender differences, and differences betweenyoung people living in urban, regional or rural localities, on these aspects. A briefdiscussion of differences between motorcyclists and other drivers is also included.
Total sample
Eighty-six per cent of the sample reported that they had obtained their car driver’slicence, as shown in Table 4 below. Parent reports corroborated this finding. Only6 per cent did not have a licence or learner’s permit. Very few young people hadgained a motorcycle licence (2 per cent). There was considerable diversity in thelength of time licences had been held, which ranged from one month to 38months, the average being 20.82 months (SD of 7.93 months).
Driving behaviour and learner
driver experiences33 Driving behaviour and learner
driver experiences
Source of report
Self (n = 1135) Parent (n = 1066)Types of licence N % N %
None 67 5.9 73 6.8
Learner's permit only 82 7.2 68 6.4
Car licence 983 86.2 922 86.5
Motorcycle licence 25 2.2 26 2.4
Note: Percentages do not add to 100 as some individuals fit more than one category. A small number of parent reportswere of individuals for whom there was no corresponding young adult data; likewise, for some young adult reportsthere was no corresponding parent data.Thus young adult and parent report are not expected to be entirely consistent.
Table 4. Licence status (self and parent reports)
The following discussion focuses on all young adults who reported having alicence (for a car or motorcycle) or learner’s permit at the time of data collection(19-20 years).
Learner driver experiences
Young adults were asked to report how many professional driving lessons theyhad undertaken (that is, lessons with a professional driving instructor), using oneof seven categories provided. This response format was designed to reduce theunreliability inherent in trying to recall a particular number of lessons, whichcould have been undertaken up to three years previously. Figure 1 displays thediversity in the number of lessons taken, which ranged from no lessons at all (12per cent of young people) to 26 or more (2 per cent). Most commonly, betweenone and five lessons were undertaken, with a notable proportion receiving six toten lessons. Overall, approximately three-quarters (78 per cent) had taken ten orfewer professional driving lessons when learning to drive.

Most young adults reported taking part in frequent driving practice when learn-ing to drive. For example, approximately half (53 per cent) reported practisingmore than once a week, while over 80 per cent reported practising on at least aweekly basis (see Figure 2). Only a small number of participants (5 per cent)reported “rarely” engaging in driving practice.
A U S T R A L I A N I N S T I T U T E O F F A M I LY S T U D I E S22
0
10
20
30
40
50
60
70
80
90
100
26+21-2516-2011-156-101-50
Figure 1. Number of professional lessons (self report)
Number of lessons
Pe
rce
nta
ge
of
sam
ple
0
10
20
30
40
50
60
70
80
90
100
More oftenWeeklyFortnightlyMonthlyRarely
Figure 2. Frequency of driving practice (self report)
Frequency of practice
Pe
rce
nta
ge
of
sam
ple
Young adults were questioned about who had assisted them with driving practice, and the amount of stress experienced when practising driving. Almostthree-quarters had practised with their parents on at least a weekly basis, although a sizable number (17 per cent) reported practising monthly or less with parents (see Figure 3). About one-third (37 per cent) had practised driving on a regular basis (at least monthly) with persons other than their parents (Figure 4).
Parent reports provided a similar picture, although there was a trend for parents toreport their sons/daughters had gained slightly more driving practice (both withthemselves and others) than reported by the young people (see Figures 3 and 4).

I N T H E D R I V E R ’ S S E AT 23
0
10
20
30
40
50
60
70
80
90
100
More oftenWeeklyFortnightlyMonthlyRarely
Parent
Self
Figure 3. Frequency of driving practice with parents (self and parent reports)
Frequency of practice
Pro
po
rtio
n (
%)
0
10
20
30
40
50
60
70
80
90
100
More oftenWeeklyFortnightlyMonthlyRarely
Parent
Self
Figure 4. Frequency of driving practice with others (self and parent reports)
Frequency of practice
Pro
po
rtio
n (
%)
The majority of young adults and parents reported experiencing “some” stress orconflict during driving practice sessions (as shown in Figure 5). While parentswere more likely to recall “a bit” of stress or conflict during practice sessions (74 per cent of parents, compared with 58 per cent of young people), young adults were somewhat more likely to rate the experience as highly stressful (20 per cent, compared with 12 per cent of parents). While fewer young peoplehad gained regular driving practice with persons other than their parents, this was generally a less stressful experience (Figure 6). Only 30 per cent recalled some stress and conflict during such practice sessions and this was relatively mildfor most, with only 2 per cent reporting high levels of stress.

A U S T R A L I A N I N S T I T U T E O F F A M I LY S T U D I E S24
Driving behaviour
Time spent drivingThere was considerable variability in the number of hours young adults spentdriving at different times of the day (daylight hours, nightime hours) and week(weekdays, weekends), as displayed in Figure 7.
For example, one in five reported driving less than two hours during the day onweekdays, while in contrast, approximately 14 per cent said that they usually drovefor ten or more hours during these times. Overall, the average number of hoursspent driving during the day on weekdays was almost five hours per week. Weekenddaytime driving was also quite common, with young adults spending an average of2.8 hours each weekend driving. Considerably less driving was undertaken at nighttime both during the week and at weekends, with almost half driving less than twohours and a further one-third driving two to three hours. The average number ofhours spent on night-time driving was 2.4 during the week, and 2.1 at weekends.
0
10
20
30
40
50
60
70
80
90
100
A lotSomeNone
Parent
Self
Figure 5. Stress and conflict experienced during driving practice with parents (self and parent reports)
Degree of stress and conflict
Pro
po
rtio
n (
%)
0
10
20
30
40
50
60
70
80
90
100
A lotSomeNone
Figure 6. Stress and conflict experienced during driving practice with others (self report)
Degree of stress and conflict
Pro
po
rtio
n (
%)

I N T H E D R I V E R ’ S S E AT 25
Crash involvementAbout four in ten young adults (43 per cent) reported that they had been involvedin a crash when they had been the driver of a car or motorcycle. Of those who hadbeen involved in a crash, 70 per cent had experienced one crash, 25 per cent hadbeen involved in two crashes, and 5 per cent had been involved in three or morecrashes, with the highest number of crashes experienced being seven. The averagenumber of crashes reported by those who had been in a crash was 1.36.
Parent reports indicate a good awareness of young adults’ crash involvement,with 39 per cent reporting that their son or daughter had been involved in a crashwhen driving a car or motorcycle. Furthermore, the average number of crashesreported by parents was almost identical to that reported by young adults (1.37).
Young adults and parents were also asked about the circumstances in which thecrash/es had occurred, focusing particularly on whether or not passengers werepresent and the consequences of the crash in terms of property damage orinjury/death. As Table 5 shows, the most frequent type of crashes reported byyoung adults were those in which the driver was alone, there was property dam-age, but no one was injured. Nevertheless, there was also a sizable number(approximately one-third) who were carrying passengers when involved in acrash of this type (resulting in property damage). Crashes involving death orinjury to a person were extremely rare. Parent reports supported these trends.
0
5
10
15
20
25
30
35
40
20 +15-1911-1410987654321<1
Weekends-Night time
Weekends-Daylight
Weekdays-Night time
Weekdays-Daylight
Figure 7. Number of hours typically spent driving by time of week
Number of hours
Pe
rce
nta
ge
of
dri
ve
rs
Source of report
Self ParentNumber of crashes Number of crashes
Circumstances and outcome N Mean S.D. N Mean S.D.
Driving alone, property damage 292 1.12 0.68 257 1.27 0.64
With passengers, property damage 182 0.79 0.65 65 1.10 0.43
Driving alone, injury/death 15 0.09 0.29 7 0.36 0.58
With passengers, injury/death 8 0.06 0.27 7 0.44 0.62
Note: N denotes the number of young adults who had been in a crash of this type when driving.
Table 5. Circumstances surrounding, and outcomes of, crash involvement (self and parent reports)

A U S T R A L I A N I N S T I T U T E O F F A M I LY S T U D I E S26
SpeedingJust under 70 per cent of young adults had never been apprehended for speeding,20 per cent had been apprehended once, and 11 per cent more than once. Thehighest number of speeding apprehensions was eight. Once again, parent reportswere concordant with these trends, with 73 per cent reporting that their son ordaughter had never been caught speeding. As parents were not asked about thenumber of times their son or daughter had been caught speeding, comparisonsbetween young adults and parents cannot be made on this aspect.
Unsafe driving behaviourBoth young adults and parents were asked about the young people’s engagement invarious types of unsafe driving practices, such as speeding, failure to wear a seat belt(or helmet if driving a motorcycle), driving when affected by alcohol or an illegaldrug, or driving when very tired. Young adults were asked to report on how many oftheir last ten trips they had engaged in the behaviour, while parents were asked todescribe how often the behaviour occurred on a five-point scale ranging from“never” to “always” (with an option provided for “don’t know”). Table 6 displays thenumber of young adults who reported engaging in each unsafe driving behaviour onone or more occasions in their last ten trips. It also shows the average number of tripsin which young drivers reported engaging in each type of behaviour.
Mean number Proportion of trips out
Unsafe driving behaviours of sample of last ten
N %
Up to 10 km/h over the limit 886 83.7 4.10
Drove when very tired 676 63.8 1.55
10 to 25 km/h over the limit 522 49.4 1.56
More than 25 km/h over the limit 203 19.2 0.50
Drove when probably affected by alcohol 151 14.2 0.23
Did not wear seat belt (or helmet) for part of the trip 127 12.0 0.28
Drove when probably affected by illegal drug 99 9.3 0.26
Did not wear seatbelt (or helmet) at all 91 8.6 0.23
Table 6. Rates of unsafe driving behaviours during the previous 10 trips (self report)
A very common type of unsafe driving behaviour was speeding up to 10 km/h abovethe limit, with more than four-fifths of young adults reporting such behaviour on atleast one of their last ten trips. This occurred quite frequently (on average, on fourof their past ten trips). In addition, almost half reported they had driven between 10and 25 km/h above the limit at least once during their last ten trips, and close to 20per cent reported driving more than 25 km/h above the limit on one or more occa-sion. However, these higher levels of speeding generally occurred less frequently.
Another common unsafe driving behaviour was driving when very tired, withalmost two-thirds of the sample reporting this type of behaviour on at least oneoccasion. Across the sample, the average number of trips undertaken when verytired was 1.55 (in last ten trips). If young adults’ driving behaviour over the past tentrips can be seen as indicative of their general driving behaviour, these findings sug-gest that young adults drive when very tired on 15 per cent of their driving trips.
Rates of other types of unsafe behaviours were lower, ranging from 9 per cent forfailure to wear a seat-belt or helmet to 14 per cent for driving when affected by

SU
MM
AR
Y
I N T H E D R I V E R ’ S S E AT 27
alcohol. The average number of occasions on which these less common unsafedriving behaviours occurred was also very low.
Figure 8 compares young adults’ and parents’ ratings of the occurrence of eachform of unsafe driving, using young adults’ report of the occurrence of each typeof behaviour on at least one of the past ten trips, and parent’s reports of whetherthe behaviour had occurred (combining ratings of rarely, sometimes, often oralways). There was a consistent trend for parents to underestimate the level ofunsafe driving practices engaged in by young adults (see Figure 8). For example,while 84 per cent of young adults reported driving over the speed limit by up to10 km/h on at least one occasion in their last ten trips, only 65 per cent of parentsreported that this behaviour occurred. Similarly, while parent reports suggest thatdriving under the influence of alcohol was rare (4 per cent), young adult reportssuggest that this behaviour was considerably more prevalent (14 per cent). Theonly unsafe driving behaviour on which parent reports were consistent withyoung adult reports was driving when fatigued (64 per cent of young adults com-pared with 60 per cent of parents).
0
10
20
30
40
50
60
70
80
90
100
DrugsFatigueNo seatbeltAlcohol> 25km/h10-25 km/h <10 km/h
Parent
Self
Figure 8. Self- and parent-reported frequency of unsafe driving behaviours
Note: <10km/h = drove up to 10 km/h over the limit; 10-25km/h =drove between 10 and 25 km/h over the limit;>25km/h = drove more than 25km/h over the limit; alcohol = drove when probably affected by alcohol; no seatbelt =forgot seatbelt (or helmet) for all of the trip; fatigue = drove when very tired; and drugs = drove when probably affectedby an illegal drug.
Unsafe driving behaviours
Pro
po
rtio
n (
%)
Summary
More than four-fifths of young people had obtained a car licence by19-20 years of age. Most young adults reported participating in fre-quent driving practice when learning to drive. For example, about 80per cent reported that they had practised driving on at least a weeklybasis. Parents predominantly provided driving practice, althoughsome young adults also practised with others. Most young peopleexperienced some stress and conflict when practising driving withparents, although this was minor for the majority. In contrast, drivingpractice with persons other than parents, while less common, wasgenerally stress-free. While there was considerable diversity in the

SU
MM
AR
Y
A U S T R A L I A N I N S T I T U T E O F F A M I LY S T U D I E S28
number of professional driving lessons undertaken, it was mostcommonly between one and five. Almost 80 per cent had taken tenor fewer professional lessons while learning to drive.
Turning to the young adults’ current pattern of driving, most driv-ing was reported to take place during the week in daylight hours.The average time per week spent driving at such times was fivehours. Day-time driving during the weekend was also relativelycommon, with an average of 3 hours spent on the road at this time.Night-time driving was somewhat less frequent, with an average oftwo-and-a-half-hours spent driving at night during the week andtwo hours at the weekend.
Over 40 per cent of the sample had been involved in a crash whiledriving a car or motorcycle. Most crashes resulted in property dam-age. Two-thirds of such crashes occurred when the young peoplewere driving alone, and one-third when they were carrying passen-gers. Crashes resulting in injury or death were extremely rare.
Approximately 30 per cent had been apprehended for speeding.Additionally, speeding was one of the most common unsafe drivingbehaviours reported by young people, with over 80 per cent havingdriven up to 10 km/h above the limit at least once during their pastten trips and almost half at 10 to 25 km/h on one or more occasion.Driving while very tried was also relatively common, with 64 percent having done so at least once in their most recent ten trips.Other types of unsafe driving behaviour, such as failure to wear aseat belt and driving when affected by alcohol or illegal drugs, wereless common, and ranged in incidence from 8-14 per cent. Parentsappeared to be less aware of the amount of unsafe driving engagedin by young adults, and generally reported lower rates of unsafedriving behaviours.
Gender differences
There were a number of significant differences between young men and womenin both the type of learner driving experiences gained and in their current driv-ing patterns.
There was a small, but significant difference in the number of young men andwomen who had obtained a motorcycle licence, with slightly more young men (3per cent) than women (1 per cent) having a licence of this type.2 There were nosignificant differences in the proportion of young men and women who had a carlicence, learner’s permit, or did not have a licence of any type.
Learner driver experiences
Young men and women also significantly differed in the number of professionaldriving lessons undertaken when learning to drive.3 In general, young women
2 χ2 (3) = 12.56, p < .01. 3 χ2 (7) = 60.94, p < .001.

I N T H E D R I V E R ’ S S E AT 29
had taken more professional driving lessons than young men when learning todrive. More than half the young women (58 per cent) had taken six or more pro-fessional lessons, compared with 41 per cent of young men, as shown in Figure 9.
0
10
20
30
40
50
60
70
80
90
100
26+21-2516-2011-156-101-50
Females
Males
Figure 9. Number of professional lessons, by gender
Number of lessons
Pro
po
rtio
n (
%)
0
10
20
30
40
50
60
70
80
90
100
More OftenWeeklyFortnightlyMonthlyRarely
Females
Males
Figure 10. Gender differences in the frequency of driving practice with others
Frequency of driving practice
Pro
po
rtio
n (
%)
By their own report, young men and women did not significantly differ in theamount of driving practice provided by parents, or obtained overall. However,young women had more frequently practised driving with people other than par-ents, as shown in Figure 10.4
There was a significant gender difference in the degree of stress and conflict experienced when practising driving with parents.5 While most young drivers ofboth sexes reported “a little” stress, more young men reported that they experiencedno stress or conflict during these practice sessions (28 per cent young men comparedwith 17 per cent young women), while young women more frequently reported
4 χ2 (4) = 16.71, p < .01. 5 χ2 (3) = 59.41, p < .001.

A U S T R A L I A N I N S T I T U T E O F F A M I LY S T U D I E S30
these sessions to be highly stressful and conflictual (22 per cent young women and14 per cent young men). Figure 11 displays these differences. However, there were nogender differences in the stress experienced when practising with others.
0
10
20
30
40
50
60
70
80
90
100
A lotA littleNone
Females
Males
Figure 11. Stress and conflict experienced during driving practice with parents, by gender
Degree of stress and conflict experienced
Pro
po
rtio
n (
%)
Driving behaviour
Young men and women did not significantly differ in the number of daylight ornight-time hours spent driving during the week or at weekends. They reportedsimilar rates of crashes when driving a car or motorcycle (42 per cent of bothyoung men and women). Furthermore, among those individuals who had beeninvolved in a crash, there was no significant gender difference in the number ofcrashes experienced (an average of 1.45 crashes among young men and 1.33among young women). Likewise, there were no significant gender differences inthe circumstances of the crash/es (that is, whether driving alone or with passen-gers), or the outcomes (that is, property damage or injury/death).
Turning to unsafe driving behaviours, young men reported speeding significantlymore frequently than young women during their last ten trips (Table 7). This gen-der difference was evident across all degrees of speeding (up to 10 km/h over thelimit; 10-25 km/h over the limit, and more than 25 km/h above the limit). Given
Mean number of trips Unsafe driving behaviour out of last ten T test result
Males Females
Mean S.D. Mean S.D. t value p <
Up to 10 km/h over the limit 4.79 3.60 3.54 3.14 5.89 .001
10-25 km/h over the limit 2.19 2.81 1.05 1.83 7.54 .001
More than 25 km/h over the limit 0.89 1.91 0.18 0.73 7.64 .001
Drove when affected by alcohol 0.33 1.00 0.16 0.73 3.29 .001
Did not wear seatbelt/helmet at all 0.31 1.21 0.16 0.76 2.33 .020
Did not wear seatbelt/helmet for part of trip 0.35 1.14 0.21 0.86 2.19 .029
Drove when very tired 1.44 1.78 1.64 1.94 -1.74 .086
Drove when affected by an illegal drug 0.33 1.25 0.20 1.02 1.73 .085
Table 7. Gender differences in rates of unsafe driving behaviours during the previous 10 trips

SU
MM
AR
Y
I N T H E D R I V E R ’ S S E AT 31
these findings, it is unsurprising that significantly more young men than youngwomen had been apprehended for speeding (40 per cent young men comparedwith 24 per cent young women), and a higher proportion had been caught speed-ing on multiple occasions (17 per cent of young men and 6 per cent youngwomen).6 These gender differences are shown in Figure 12.
While rates were low overall, more young men than women reported drivingwithout a seat-belt or helmet for the duration of the trip, or for part of the trip.Young men also more frequently drove when under the influence of alcohol thanyoung women, although again the overall rates were low. There were no genderdifferences in rates of driving when fatigued or when affected by an illegal drug.
6 χ2 (4) = 46.02, p < .001.
0
10
20
30
40
50
60
70
80
90
100
More oftenTwiceOnceNever
Females
Males
Figure 12. Number of times detected speeding, by gender
Number of times detected speeding
Pro
po
rtio
n (
%)
Summary
There were numerous differences between young men and women intheir learner driving experiences and in current driving patterns.Slightly more young men than women currently held a car or motor-cycle licence. Young women had taken more professional drivinglessons when learning to drive than young men. Young women andmen received a similar amount of driving practice overall, and prac-tice with parents. However, young women more frequently receiveddriving practice from people other than their parents, and reportedsignificantly more stress when practising with parents than didyoung men. There were no significant gender differences in the hoursspent driving in the day or at night-time during the week, or at week-ends. Nor were there gender differences in the frequency of crashinvolvement, or in the circumstances or outcomes of crashes. How-ever, young men engaged in unsafe driving behaviour significantlymore often than young women, with higher rates of speeding anddriving when affected by alcohol, and lower rates of seat belt or hel-met use than young women (although it should be noted that therates of driving under the influence of alcohol and failure to wear aseat belt or helmet were very low overall).

A U S T R A L I A N I N S T I T U T E O F F A M I LY S T U D I E S32
Metropolitan, regional and rural differences
In general, there were few significant differences in the learner driver experiencesand current driving behaviour of young adults living in metropolitan, regional orrural localities.7
Similar proportions of young people from the different locality types hadobtained a car or motorcycle licence, or a learner’s permit.
Learner driver experiences
Individuals living in the Melbourne metropolitan area had received significantlymore professional driving lessons than those living in regional or rural localities8
(see Figure 13). For example, 60 per cent of young Melburnians had received sixor more professional lessons, compared with 40 per cent of young adults fromregional centres and 21 per cent from rural areas.
Significant differences were also found in the frequency with which young adultsin metropolitan, regional and rural areas reported practising driving.9 While themajority reported practising on a regular basis, a higher proportion of those fromregional centres (27 per cent) practiced driving less than monthly than those inrural (18 per cent) or metropolitan (15 per cent) localities (see Figure 14).
There were no differences in the frequency with which young adults from differ-ent locations practiced driving with parents or others. Nor were there anysignificant differences in the levels of stress and conflict experienced when prac-tising driving with parents or others.
Driving behaviour
Individuals living in the different types of localities did not significantly differ in the number of daylight or night-time hours they spent driving during the
0
10
20
30
40
50
60
70
80
90
100
26+21-2516-2011-156-101-50
Regional
Metropolitan
Rural
Figure 13. Number of professional lessons, by locality
Number of professional lessons
Pro
po
rtio
n (
%)
7 Participants were classified as living in metropolitan, regional or rural localities based upontheir postcode at the time of completing the questionnaire “Metropolitan” = state capitalcity; “Regional” = large regional centre (for example, Geelong, Ballarat, Bendigo); “Rural” =other area of state.
8 χ2 (12) = 117.82, p <.001.9 χ2 (8) = 18.30, p <.05.

SU
MM
AR
Y
I N T H E D R I V E R ’ S S E AT 33
week or at the weekend. While more young people living in the Melbourne metropolitan area (46 per cent) had been involved in a crash than those from regional (35 per cent) and rural areas (38 per cent)10, there were no significant differences between individuals from the different types of localities on the number of crashes experienced, or in the circumstances or outcomes of the crashes. Similarly, rates of apprehension for speeding were notsignificantly different among young people from metropolitan, regional or rurallocalities.
Several significant differences were found between young people from the different types of localities on the frequency of unsafe driving behaviours. Indi-viduals from regional centres were significantly more likely than those frommetropolitan localities to drive when affected by alcohol,11 while young adults from rural areas were more likely to drive without a seat-belt or helmet forthe whole duration of a trip12 or part of a trip13 than those from metropolitanlocalities.
0
10
20
30
40
50
60
70
80
90
100
More OftenWeeklyFortnightlyMonthlyRarely
Regional
Metropolitan
Rural
Figure 14. Frequency of driving practice, by locality
Frequency of practice
Pro
po
rtio
n (
%)
10 χ2 (2) = 6.90, p <.0511 F (2, 945) = 3.48, p<.0512 F (2, 945 = 6.40, p<.0113 F (2, 944) = 6.42, p<.01
Summary
Relatively few differences between young adults from metropolitan,regional or rural localities were found. These differences centredupon learner driver experiences (young adults in metropolitan areashad taken more professional driving lessons, while those in regionalareas tended to practice driving less frequently), rates of crashinvolvement (higher among young adults living in metropolitanlocalities) and unsafe driving behaviours (higher rates of drivingwhen affected by alcohol in regional areas and higher rates of fail-ing to wear a seat-belt or helmet in rural areas).

A U S T R A L I A N I N S T I T U T E O F F A M I LY S T U D I E S34
Motorcyclists and other road users
While it would have been informative to examine the driving patterns of differ-ent classes of road users separately (for example, car drivers versus motorcyclists),the small number of motorcyclists in the ATP sample (n=25) precluded these morefine-grained analyses. Further limiting the feasibility of such analyses was the factthat the majority of motorcyclists in this sample (88 per cent) were also car driv-ers: only three young adults reported having a motorcycle licence alone. Hence,if such comparisons were conducted it would be difficult to determine whethermotorcyclists were reporting on their driving experiences when driving a car, rid-ing a motorcycle or both.
Nevertheless, while recognising these limitations, some exploratory analyses wereconducted to determine whether the driving experiences of motorcyclists differedsubstantially from those who only drove cars. All motorcyclists (including thosewho had a car licence) were compared to those who only had a car licence.14
These comparisons revealed few significant differences in the learner driver expe-riences and current driving behaviour of motorcyclists and car drivers. Forexample, only one significant difference was found between the groups in theirlearner driver experiences (that is, motorcyclists tended to recall less stress in theirdriving practice sessions with parents than those who only drove cars).15 Most ofthe differences that did emerge centred on young adults’ current driving behav-iour. In comparison to car drivers, motorcyclists tended to spend more timedriving,16 engage in more moderate (10-25 km/h over limit)17 to high (in excessof 25 km/h over limit)18 speeding behaviour, and were more likely to be involvedin crashes which resulted in injury or death when not carrying passengers.19
Hence, it appeared that young adults with a motorcycle licence reported a some-what different pattern of driving behaviour from those who only had a carlicence. However, given the limitations previously discussed (small sample size,difficulties separating motorcyclists from car drivers), it was decided to combineboth groups of road users in future analyses, as it was not anticipated that theinclusion of motorcyclists in these analyses would have a strong influence onoverall results.
14 Learner drivers were excluded from these analyses as it could not be determined whethertheir learner's permit was for driving a car or motorcycle.
15 While almost half (46 per cent) of motorcyclists reported experiencing no stress or conflictduring driving practice sessions with parents, the vast majority of car drivers (79 per cent)reporting experiencing at least “a little” stress when practicing driving with their parents (χ2 (3) = 8.87, p<.05).
16 In comparison to young adults who only had a car licence, those with a motorcycle licencetended to spend more time driving during weekday daylight hours (F (1, 950) = 12.00,p<.01); weekend daylight hours (F (1, 934) = 7.29, p<.01); weekday night-time hours (F (1,924) = 8.05, p<.01); and weekend night-time hours (F(1, 910) = 5.99, p<.05).
17 F(1, 981) = 12.86, p<.001.18 F(1, 981)= 14.63, p<.001.19 F (1,161) = 4.41, p<.05.

Precursors and correlates ofr i sky dr iving, crash involvement
and speeding violat ions
4

I N T H E D R I V E R ’ S S E AT 37
Having examined young adults’ learner driver experiences and current driving behav-iour, the precursors of three different types of problematic driving outcomes werenext investigated – risky driving behaviour, crash involvement, and speeding viola-tions. The results of these analyses are presented in this section, beginning withseparate descriptions of the longitudinal precursors and concurrent correlates of riskydriving behaviour, crash involvement, and speeding violations. This is followed by adetailed discussion of the similarities and differences in the profile of precursors andcorrelates identified for each of the different driving outcomes (Section 5). Finally, thedegree of overlap in the membership of the risky driving, crash involvement andspeed violation groups is examined (Section 6). The theoretical, practical and policyimplications of these findings are discussed in detail later in the report (Section 7).
As the amount of driving undertaken by an individual is associated with his/herchance of becoming involved in a crash (Diamantopoulou et al. 1996; Harrison andChristie 2003) or being apprehended by police for a speeding violation (Diaman-topoulou et al. 1997), the effects of driving exposure (the average number of hoursyoung adults reported driving each week) were controlled20 when examining thecorrelates and precursors of crash involvement and speeding violations. However,as risky driving behaviour was measured over a predetermined period (participants’last ten trips), driving exposure was not controlled when examining this outcome.
Precursors and correlates of risky driving behaviour
To assist with the identification of precursors and correlates of risky driving, par-ticipants were grouped on the basis of their recent self-reported driving behaviour.Their level of risky driving was assessed by the frequency of engagement in thefollowing risky driving behaviours during their previous ten trips: drove up to 10km/h over the limit; drove between 10 and 25 km/h over the limit; drove morethan 25km/h over the limit; did not wear a seat belt (or helmet) at all; forgot seat-belt (or helmet) for part of the trip; drove when very tired; drove when probablyaffected by alcohol; and drove when probably affected by an illegal drug.
Formation of groups
Cluster analysis was used to identify groups with differing levels of risky drivingwithin the ATP sample. A three-cluster solution was seen as providing the best representation of the patterns of risky driving.21 The three clusters identified were:
Precursors and correlates of risky driving, crash
involvement and speeding violations44 Precursors and correlates of risky driving, crash
involvement and speeding violations
20 Analyses of Covariance (ANCOVAs) were performed, in which the effects of the covariate(driving exposure) were statistically controlled before group comparisons were undertaken.
21 A two-step clustering procedure was undertaken of young adults’ responses to the eight risky drivingitems. The first step involved identifying the appropriate number of clusters in the data. Randomsamples of approximately 200 cases were hierarchically clustered using Ward’s method, with squaredEuclidean distance used to measure the inter-object similarity. Examination of dendograms showedthat a three-cluster solution produced good differentiation between groups. However, solutionsbetween two to five factors were also possible. Therefore, in the second step, K-means two to fivecluster solutions were imposed on the whole sample, using SPSS QUICK CLUSTER, a procedure thatgroups cases into clusters once the number of clusters is provided. These different solutions wereinspected to find the most meaningful one. The three-cluster solution using running means wasselected as the most appropriate representation of the data (Hair et al. 1998; SPSS Inc. 2002).

A U S T R A L I A N I N S T I T U T E O F F A M I LY S T U D I E S38
a “low risky driving” group (n=675, 64 per cent of the sample) – this cluster gen-erally scored lowest on the risky driving behaviours examined;
a “moderate risky driving” group (n=306, 29 per cent of the sample) – this clusterexhibited rates of risky driving behaviours that were intermediate to the lowrisky driving and high risky driving groups; and
a “high risky driving” group (n=74, 7 per cent of the sample) – this cluster scoredhighest on all types of risky behaviour, but particularly speeding behaviour.
The profile of the three risky driving clusters on each of the eight risky drivingmeasures is displayed in Figure 15, which shows that the high risky driving groupreported the highest frequencies of all risky driving behaviours; the low risky driv-ing group reported the lowest levels, and the moderate risky driving groupsreported intermediate levels on most risky driving behaviours examined (theexception being driving without a seat-belt (or helmet) for the duration of thetrip, on which the low and moderate groups were similar).22 Differences betweenthe groups were most noticeable on levels of speeding behaviour.
01
2
3
4
5
6
7
8
9
10
DrugsFatigueNo seatbelt -part
No seatbelt -all
Alcohol>25km/h 10-25km/h <10km/h
Moderate risky driving
Low risky driving
High risky driving
Figure 15. Frequency of risky driving behaviours, by cluster groups
Risky driving behaviour
Av
era
ge
nu
mb
er
of
tim
es
in
pa
st t
en
tri
ps
Group characteristics
GenderThe gender composition of the three groups (low, moderate and high risky drivinggroups) is shown in Table 8. From this Table it can be seen that that there were sig-nificant differences in the gender composition of the low and high risky drivinggroups.23 While there was an equal proportion of young men and women in the
22 The three risky driving groups significantly differed in the frequency with which they exceededthe speed limit by up to 10km/h (F (2,1052)=1678.17, p<.001); exceeded the speed limit bybetween 10 and 25km/h (F (2, 1052) = 1834.61, p<.001); exceeded the speed limit by over 25km/h (F (2, 1052) = 660.75, p<.001), drove when probably affected by alcohol (F (2, 1052) = 41.38,p<.001); forgot to wear their seat-belt (or helmet ) for part of the trip (F (2, 1052) = 24.50, p<.001);drove when very tired (F(2, 1052) = 71.62, p<.001); or drove when probably affected by an illegaldrug ( F(2, 1052) = 23.80, p <.001). The high risky driving group significantly differed from theother two groups in the frequency with which they forgot to wear a seat-belt (or helmet) for theentire duration of a trip (F (2, 1052) = 27.75, p<.001).
23 A chi-square test of independence revealed a significant difference in the proportion of themales and females in the risky driving groups, χ2 (2) = 44.71, p<.001. An examination of the stan-dardised residuals revealed a significantly higher proportion of males (and a lower number offemales) in the high risky driving group than would be expected by chance; as well as a signifi-cantly higher proportion of females in the low risky driving group, and a lower number of malesin this group, than would be expected by chance.
Note: <10km/h = drove up to 10 km/h over the limit; 10-25km/h = drove between 10 and 25 km/h over the limit;>25km/h = drove more than 25km/h over the limit; alcohol = drove when probably affected by alcohol; seatbelt-all = didnot wear a seat belt (or helmet) at all; seatbelt-part = forgot seatbelt (or helmet) for part of the trip; fatigue = drove whenvery tired; and drugs = drove when probably affected by an illegal drug.

I N T H E D R I V E R ’ S S E AT 39
moderate risky driving group, there were significantly more young men in the highrisky driving group (77 per cent of this group were young men, 23 per cent wereyoung women), and significantly fewer young men in the low risky driving group(39 per cent of this group were young men and 61 per cent were young women).
Group Males Females
n % males % group n % females % group
Low (n=675) 261 55.4 38.7 414 70.9 61.3
Moderate (n=306) 153 32.5 50.0 153 26.2 50.0
High (n=74) 57 12.1 77.0 17 2.9 23.0
Table 8. Gender composition of risky driving groups
Crash involvement and speeding violationsIn order to assess whether the clusters accurately discriminated between types ofrisky drivers, the three groups were compared on two outcomes commonly asso-ciated with risky driving behaviour: crash involvement and speeding violations.The results of these comparisons are presented in Table 9.
As this Table shows, the groups differed significantly on these outcome measuresin the manner expected,24 with the high risky driving group reporting the high-est crash involvement rate and highest number of speeding violations, and thelow risky driving group reporting the lowest. Thus it seemed that the groups iden-tified by cluster analysis were substantially different in terms of their drivingbehaviours. It should also be noted that there was considerable variability in thenumber of crashes and speeding violations reported by the young adults in eachof the groups (as indicated by the large standard deviations). This within-groupvariability was particularly noticeable in the high risky driving group, which wasmuch smaller than the other two cluster groups.
Number of Number of speeding Group crashes violations
Mean SD Mean SD
Low (n=675) .54 .79 .37 .82
Moderate (n=306) .67 .84 .65 .98
High (n=74) .83 1.12 1.41 2.65
Table 9. Crash involvement and speeding violation rates among the risky driving groups
Group differences by stage of development
Having examined young adults’ learner driving experiences and current drivingbehaviour (Section 3), the factors (past and present) that were associated with arisky driving style were next investigated. Separate Multivariate Analyses of Vari-ance (MANOVAs) were performed for each developmental stage25 (infancy,toddlerhood, early childhood, mid childhood, late childhood, early adolescence,mid/late adolescence, and early adulthood) and source of report (parent, teacher,and self report). The strategy of examining each developmental stage
24 One-way Analyses of Variance (ANOVAs) revealed significant differences between the riskydriving groups on rates of crash involvement (F (2, 1032)=5.70, p<.01) and speeding violations(F (2, 1024)=32.04, p<.001). Scheffe tests revealed that the high risky driving group wasinvolved in significantly more crashes than those in the low risky driving group, while all threegroups significantly differed in their number of speeding violations, with the high risky drivinggroup, on average, reporting the highest number of speeding violations and the low riskydriving group, the least.
25 As described in Section 2.

A U S T R A L I A N I N S T I T U T E O F F A M I LY S T U D I E S40
separately enables the identification of the stage of development at which signif-icant group differences emerge. Furthermore, it maximises the number ofparticipants included in the analyses, which is of importance to maintain power.
Due to the large number of variables being examined during adolescence andearly adulthood, a number of MANOVAs were performed for each source of reportfrom early adolescence on. For example, during adolescence, two MANOVAs wereperformed at each timepoint for each source of report (one focusing on individ-ual attributes, the other examining environmental factors), while in earlyadulthood, three MANOVAs were performed for each source of report (examiningindividual attributes, environmental factors, and current life circumstances).
As a large number of analyses were performed, the Bonferroni adjustment proce-dure was used to adjust the significance level to reduce the possibility of Type 1error (the likelihood of showing group differences of statistical significance whenthey are not actually there). Results are reported for differences at the Bonferroniadjusted level of 0.0023 or lower. However, when results were significant at a lessstringent level of p<.05, this is noted as a trend. Scheffe post-hoc contrasts wereused to identify significant differences between particular groups.
Effect sizes26 were used to assess the strength of group differences across variousdomains of functioning. As a guide to interpreting these statistics, larger effect sizesindicate more powerful group differences, and hence, more powerful precursors.
The results of these analyses are summarised separately for each stage of develop-ment in Tables 10 through 13, as well as being described in the text below. Whenexamining the Tables, it should be noted that variables displayed in CAPITALSshowed significant group differences (p<.0023), while the other variables listedshowed only trends (p<.05). The discussion that follows will generally focus onsignificant group differences.
Infancy, toddlerhood and early childhood (0-4 years)No significant differences were found between the three risky driving groups(low, moderate and high) during the earliest years of life.
Mid childhood (5-8 years)During mid childhood, significant differences emerged between the high riskydriving group and the other two groups (moderate and low risky driving) in theareas of temperament style, behaviour problems and school adjustment andachievement (see Table 10). Teacher reports indicated that children in the highrisky driving group were significantly more aggressive and hyperactive than otherchildren, less task-oriented (less able to maintain their attention on tasks or activ-ities), and had greater difficulty adjusting to the routines and demands of schoollife. These differences were all in the medium effect size range.
There was also a trend for multivariate group differences in parent reports. How-ever, the strength of these differences did not reach the adjusted significance level(p<.0023).
Late childhood (9-12 years)Significant differences were once again found between the high risky driving groupand the other two groups during late childhood (see Table 10). Interestingly, as in mid
26 Cohen's (1988) effect size criteria were used to assess the strength of group differences acrossthe various domains. For Analyses of Variance an effect size of .10 represents a small effect,.25 a medium effect, and .40 a large effect (Cohen 1988).

I N T H E D R I V E R ’ S S E AT 41
childhood, they were only apparent from teacher reports. As before, teachers ratedthe high risky driving group as less task-oriented than the moderate and low riskydriving groups. At this time, teachers also noted group differences in social skills,with the high risky driving group being rated as less cooperative than the other twogroups. These differences were in the medium effect size range.
There was a trend for multivariate group differences in mid childhood by parentreport. In late childhood, no significant multivariate group differences wereapparent by parent or self report.
Early adolescence (12-14 years)By early adolescence, the high risky driving group was displaying significantlymore difficulties than both the moderate and low risky driving groups over arange of domains according to parent and adolescent self reports (see Table 11).As before, many of these group differences centred on personal attributes (tem-perament style, behaviour problems and social skills); however, group differenceswere also evident in the areas of school adjustment and achievement, peer rela-tionships and the parent–adolescent relationship.
In terms of individual attributes, the high risky driving group was rated by parentsas less persistent (less able to remain focused on tasks or activities), as engagingmore frequently in antisocial acts by their own report (such as violence, propertyoffences, or the use or sale of illegal drugs), and as less cooperative (by parent andself report), less responsible (by parent report) and less empathic (by self report)
Table 10. Teacher-reported significant differences between the low, moderate and risky driving groups in mid and late childhood
Domain Group differences Effect size
MID CHILDHOOD [F (18, 1330) = 2.91***]
Temperament styleTASK ORIENTATION High group less task oriented than Moderate and Medium
Low groups
Behaviour problemsAGGRESSION High group more aggressive than Moderate and Low groups Medium
Anxiety Moderate group less anxious than High and Low groups Small
HYPERACTIVITY High group more hyperactive than Moderate and Low groups Medium
School adjustment and achievement
Academic competence High group less academically competent than SmallModerate group
SCHOOL READINESS High group less ready for school than Moderate Mediumand Low groups
LATE CHILDHOOD [F (20, 1310) = 2.25 **]
Temperament styleTASK ORIENTATION High group less task oriented than Moderate and Medium
Low groups
Behaviour problemsAggression High group more aggressive than Moderate and Low groups Small
Hyperactivity High group more hyperactive than Moderate group Small
Social skillsAssertiveness High group less assertive than Moderate and Low groups Medium
COOPERATION High group less cooperative than Moderate and Low groups Medium
Self control High group less self controlled than Low group Small
Note: Variables that are displayed in CAPITALS are significant at the Bonferroni adjusted level of significance (p<.0023).All other variables are trends (p<.05), and included for reader interest.
*** p<.001 ** p<.01 * p<.05

A U S T R A L I A N I N S T I T U T E O F F A M I LY S T U D I E S42
Table 11. Parent-reported and self-reported significant differences between the low,moderate and high risky driving groups in early adolescence
Note: Variables that are displayed in CAPITALS are significant at the Bonferroni adjusted level of significance (p<.0023).All other variables are trends (p<.05), and included for reader interest.
*** p<.001 ** p<.01 * p<.05
Domain Group differences Effect size
PARENT-REPORTED DIFFERENCES ON INDIVIDUAL ATTRIBUTES [F (24, 1648) = 2.05**]
Temperament stylePERSISTENCE High group less persistent than Moderate and Low groups Medium
Behaviour problemsHyperactivity High group more hyperactive than Low group Small
Social skillsCOOPERATION High group less cooperative than Moderate and Low groups Medium
RESPONSIBILITY High group less responsible than Moderate and Low groups Medium
PARENT-REPORTED DIFFERENCES ON ENVIRONMENTAL FACTORS [F (22, 1850) = 2.18**]
School achievement and adjustment
SCHOOL ADJUSTMENT High group more school adjustment difficulties than MediumDIFFICULTIES Moderate and Low groups
Peer relationshipsAntisocial peers No two groups significantly differed Small
Parent-adolescent relationship
Warmth of relationship High group less warmth in the parent-adolescent Smallrelationship than Low group
Parenting styleUse of harsh discipline High group received more harsh discipline than Low group Small
Parental characteristicsParent cigarette & Moderate group more parental cigarette and Smallalcohol use alcohol use than Low group
SELF-REPORTED DIFFERENCES ON INDIVIDUAL ATTRIBUTES [F (24, 1808) = 3.19***]
Behaviour problemsAGGRESSION High and Moderate groups more aggressive than Low group Medium
ANTISOCIAL High group more antisocial behaviour than Moderate MediumBEHAVIOUR group; High and Moderate groups more antisocial
behaviour than Low group
Hyperactivity Moderate group more hyperactive than Low group Small
Multi-substance use High and Moderate groups more multi-substance use Smallthan Low group
Social skillsCOOPERATION High group less cooperative than Moderate group; High Medium
and Moderate groups less cooperative than Low group
EMPATHY High group less empathic than Moderate and Low groups Medium
SELF CONTROL High and Moderate groups less self controlled than SmallLow group
Other individual attributesSensation-seeking No two groups significantly differed Small
SELF-REPORTED DIFFERENCES ON ENVIRONMENTAL FACTORS [F (10, 1762) = 4.44***]
School adjustment and achievement
SCHOOL ADJUSTMENT High group more school adjustment difficulties than MediumDIFFICULTIES Moderate and Low groups
Peer relationshipsANTISOCIAL PEERS High group more antisocial friends than Low group Medium
FRIENDSHIP QUALITY High group lower friendship quality than Moderate Mediumand Low groups
Peer attachment High group less attached to peers than Low group Small
Parent-adolescent relationship
QUALITY OF High and Moderate groups more difficult SmallRELATIONSHIP parent-adolescent relationship than Low group
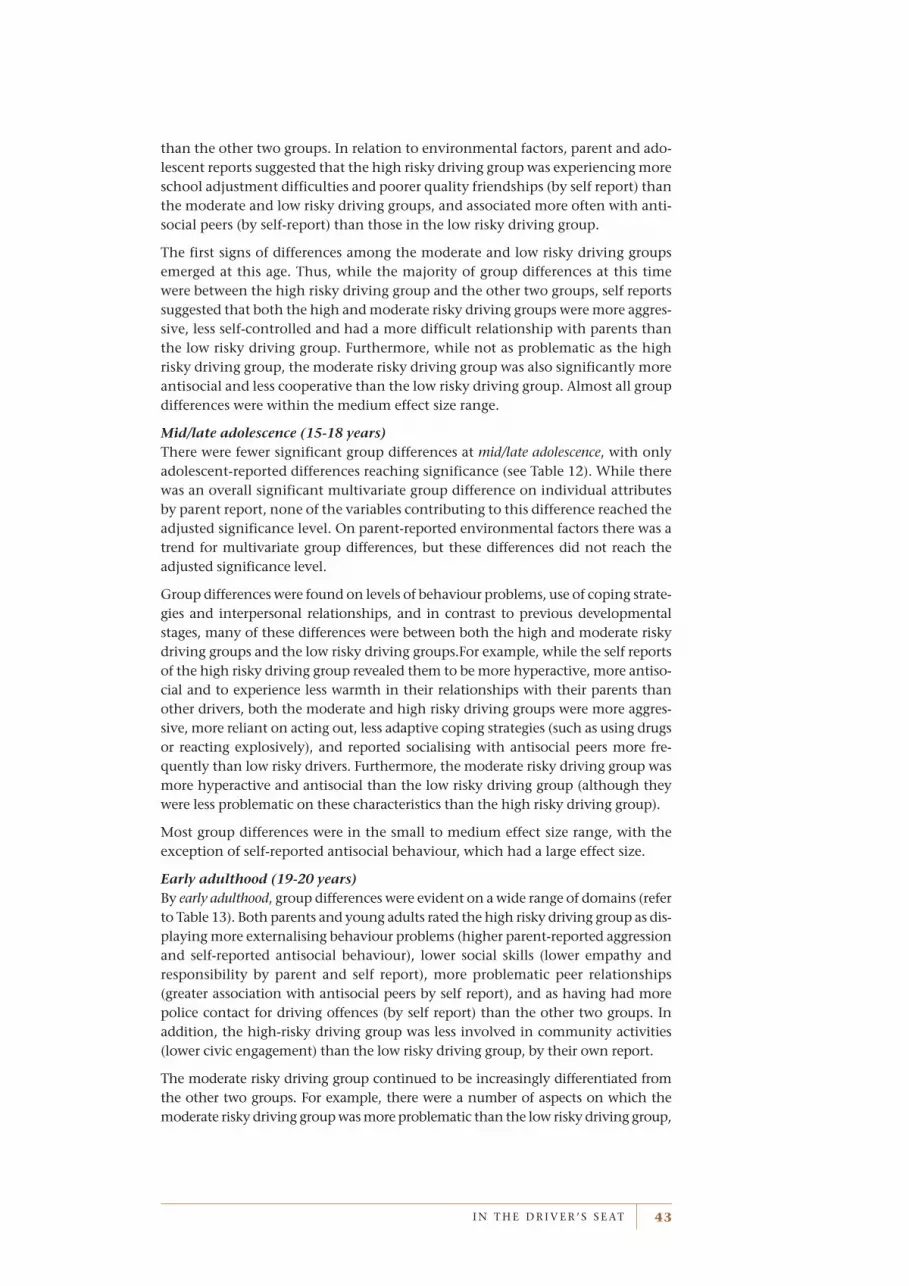
I N T H E D R I V E R ’ S S E AT 43
than the other two groups. In relation to environmental factors, parent and ado-lescent reports suggested that the high risky driving group was experiencing moreschool adjustment difficulties and poorer quality friendships (by self report) thanthe moderate and low risky driving groups, and associated more often with anti-social peers (by self-report) than those in the low risky driving group.
The first signs of differences among the moderate and low risky driving groupsemerged at this age. Thus, while the majority of group differences at this timewere between the high risky driving group and the other two groups, self reportssuggested that both the high and moderate risky driving groups were more aggres-sive, less self-controlled and had a more difficult relationship with parents thanthe low risky driving group. Furthermore, while not as problematic as the highrisky driving group, the moderate risky driving group was also significantly moreantisocial and less cooperative than the low risky driving group. Almost all groupdifferences were within the medium effect size range.
Mid/late adolescence (15-18 years)There were fewer significant group differences at mid/late adolescence, with onlyadolescent-reported differences reaching significance (see Table 12). While therewas an overall significant multivariate group difference on individual attributesby parent report, none of the variables contributing to this difference reached theadjusted significance level. On parent-reported environmental factors there was atrend for multivariate group differences, but these differences did not reach theadjusted significance level.
Group differences were found on levels of behaviour problems, use of coping strate-gies and interpersonal relationships, and in contrast to previous developmentalstages, many of these differences were between both the high and moderate riskydriving groups and the low risky driving groups.For example, while the self reportsof the high risky driving group revealed them to be more hyperactive, more antiso-cial and to experience less warmth in their relationships with their parents thanother drivers, both the moderate and high risky driving groups were more aggres-sive, more reliant on acting out, less adaptive coping strategies (such as using drugsor reacting explosively), and reported socialising with antisocial peers more fre-quently than low risky drivers. Furthermore, the moderate risky driving group wasmore hyperactive and antisocial than the low risky driving group (although theywere less problematic on these characteristics than the high risky driving group).
Most group differences were in the small to medium effect size range, with theexception of self-reported antisocial behaviour, which had a large effect size.
Early adulthood (19-20 years)By early adulthood, group differences were evident on a wide range of domains (referto Table 13). Both parents and young adults rated the high risky driving group as dis-playing more externalising behaviour problems (higher parent-reported aggressionand self-reported antisocial behaviour), lower social skills (lower empathy andresponsibility by parent and self report), more problematic peer relationships(greater association with antisocial peers by self report), and as having had morepolice contact for driving offences (by self report) than the other two groups. Inaddition, the high-risky driving group was less involved in community activities(lower civic engagement) than the low risky driving group, by their own report.
The moderate risky driving group continued to be increasingly differentiated fromthe other two groups. For example, there were a number of aspects on which themoderate risky driving group was more problematic than the low risky driving group,

A U S T R A L I A N I N S T I T U T E O F F A M I LY S T U D I E S44
but less problematic than the high risky driving group, (self-reported antisocialbehaviour, responsibility, association with antisocial peers and police contact for driv-ing offences) and others on which both the moderate and high risk driving groupswere higher than the low risky driving group (multi-substance use, time spent driv-ing per week). In addition, young adults in the moderate risky driving group wererated by parents as less anxious and more assertive than both the other groups.
Interestingly, the three groups did not significantly differ in their family charac-teristics (parental marital or employment status; educational level; level offinancial strain by parent report); or their learner driver experiences and their owncurrent life circumstances (employment and educational status, living arrange-ments, highest year of completed schooling etc) by self report.
Table 12. Parent-reported and self-reported significant differences between the low,moderate and high risky driving groups over mid/late adolescence
Note: Variables that are displayed in CAPITALS are significant at the Bonferroni adjusted level of significance (p<.0023).All other variables are trends (p<.05), and included for reader interest.
*** p<.001 ** p<.01 * p<.05
Domain Group differences Effect size
PARENT-REPORTED DIFFERENCES ON INDIVIDUAL ATTRIBUTES [F (20, 1864) = 2.45***
Temperament stylePersistence High group less persistent than Low group Small
Sociability Moderate group more sociable than Low group Small
Behaviour problemsAggression High group more aggressive than Low group Small
Anxiety Moderate group less anxious than Low group Small
Hyperactivity High group more hyperactive than Moderate group Small
Social skillsAssertiveness High group less assertive than Moderate group Small
SELF-REPORTED DIFFERENCES ON INDIVIDUAL ATTRIBUTES [F (28, 1722) = 3.55***]
Behaviour problemsAGGRESSION High and Moderate groups more aggressive than Low group Medium
ANTISOCIAL High group more antisocial behaviour than Moderate LargeBEHAVIOUR group; High and Moderate groups more antisocial
behaviour than Low group
HYPERACTIVITY High group more hyperactive than Moderate group; High Mediumand Moderate groups more hyperactive than Low group
Multi-substance use No two groups significantly differed Small
Other individual attributesACTING OUT COPING High and Moderate groups greater use of acting out SmallSTRATEGIES coping strategies than Low group
Sensation-seeking High group more sensation seeking than Low group Small
SELF-REPORTED DIFFERENCES ON ENVIRONMENTAL FACTORS [F (16, 1634) = 3.46***]
Peer relationshipsANTISOCIAL PEERS High and Moderate groups more antisocial friends than Small
Low group
Friendship quality High group lower friendship quality than Moderate group Small
Peer attachment- High group less communication with peers than Moderate Smallcommunication and Low groups
Peer attachment - trust No two groups significantly differed Small
Parent-adolescent relationship
Attachment to High group less trust in the parent-adolescent Smallparents - trust relationship than Low group
ATTACHMENT TO High group less warmth in the parent-adolescent MediumPARENTS - WARMTH relationship than Moderate and Low groups
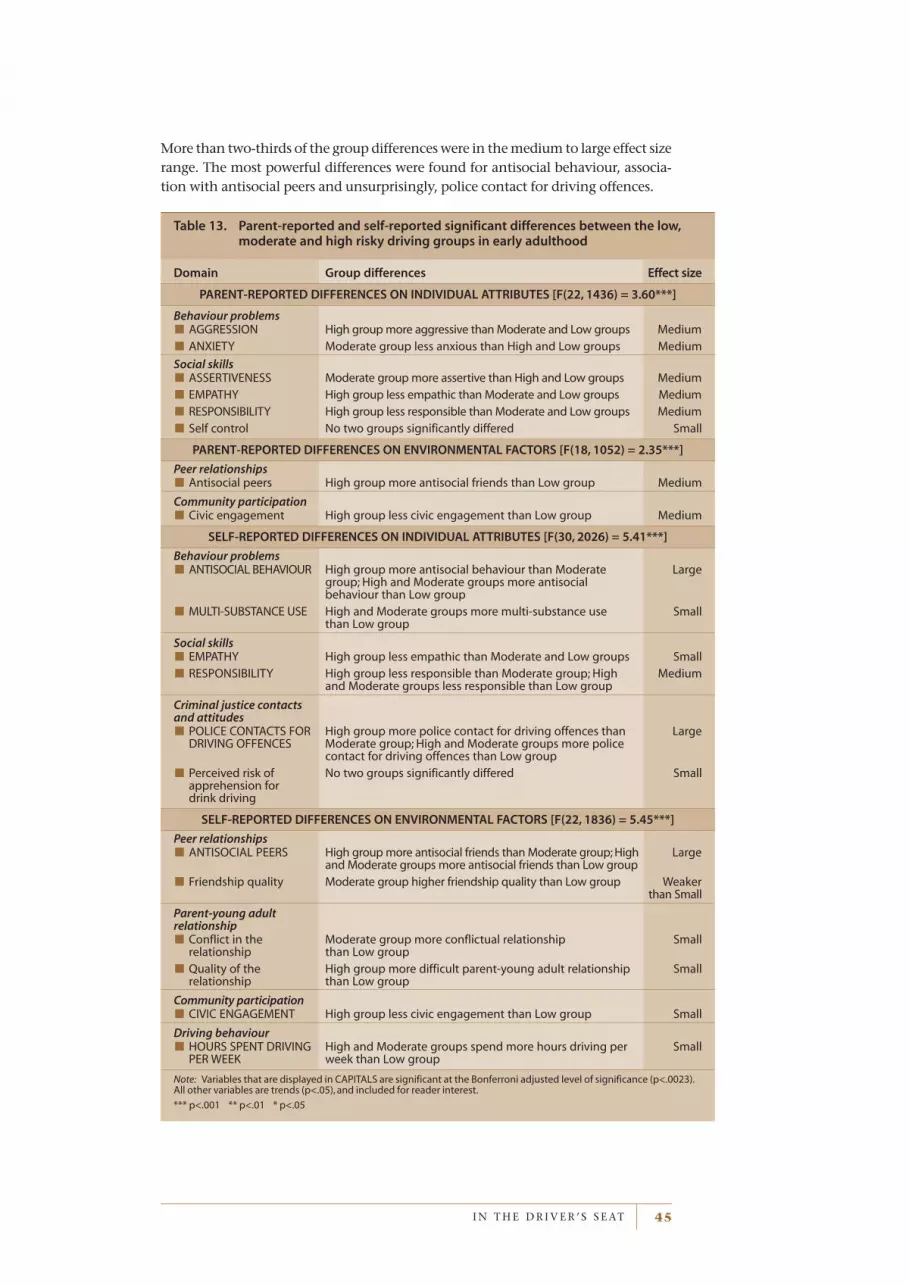
I N T H E D R I V E R ’ S S E AT 45
More than two-thirds of the group differences were in the medium to large effect sizerange. The most powerful differences were found for antisocial behaviour, associa-tion with antisocial peers and unsurprisingly, police contact for driving offences.
Table 13. Parent-reported and self-reported significant differences between the low,moderate and high risky driving groups in early adulthood
Note: Variables that are displayed in CAPITALS are significant at the Bonferroni adjusted level of significance (p<.0023).All other variables are trends (p<.05), and included for reader interest.
*** p<.001 ** p<.01 * p<.05
Domain Group differences Effect size
PARENT-REPORTED DIFFERENCES ON INDIVIDUAL ATTRIBUTES [F(22, 1436) = 3.60***]
Behaviour problemsAGGRESSION High group more aggressive than Moderate and Low groups Medium
ANXIETY Moderate group less anxious than High and Low groups Medium
Social skillsASSERTIVENESS Moderate group more assertive than High and Low groups Medium
EMPATHY High group less empathic than Moderate and Low groups Medium
RESPONSIBILITY High group less responsible than Moderate and Low groups Medium
Self control No two groups significantly differed Small
PARENT-REPORTED DIFFERENCES ON ENVIRONMENTAL FACTORS [F(18, 1052) = 2.35***]
Peer relationshipsAntisocial peers High group more antisocial friends than Low group Medium
Community participationCivic engagement High group less civic engagement than Low group Medium
SELF-REPORTED DIFFERENCES ON INDIVIDUAL ATTRIBUTES [F(30, 2026) = 5.41***]
Behaviour problemsANTISOCIAL BEHAVIOUR High group more antisocial behaviour than Moderate Large
group; High and Moderate groups more antisocial behaviour than Low group
MULTI-SUBSTANCE USE High and Moderate groups more multi-substance use Smallthan Low group
Social skillsEMPATHY High group less empathic than Moderate and Low groups Small
RESPONSIBILITY High group less responsible than Moderate group; High Mediumand Moderate groups less responsible than Low group
Criminal justice contacts and attitudes
POLICE CONTACTS FOR High group more police contact for driving offences than LargeDRIVING OFFENCES Moderate group; High and Moderate groups more police
contact for driving offences than Low group
Perceived risk of No two groups significantly differed Smallapprehension fordrink driving
SELF-REPORTED DIFFERENCES ON ENVIRONMENTAL FACTORS [F(22, 1836) = 5.45***]
Peer relationshipsANTISOCIAL PEERS High group more antisocial friends than Moderate group; High Large
and Moderate groups more antisocial friends than Low group
Friendship quality Moderate group higher friendship quality than Low group Weaker than Small
Parent-young adult relationship
Conflict in the Moderate group more conflictual relationship Smallrelationship than Low group
Quality of the High group more difficult parent-young adult relationship Smallrelationship than Low group
Community participationCIVIC ENGAGEMENT High group less civic engagement than Low group Small
Driving behaviourHOURS SPENT DRIVING High and Moderate groups spend more hours driving per SmallPER WEEK week than Low group

SU
MM
AR
Y
A U S T R A L I A N I N S T I T U T E O F F A M I LY S T U D I E S46
Summary
The three groups (low, moderate, and high risky driving) could not bedistinguished during infancy, toddlerhood and early childhood. The firstsignificant group differences were reported by teachers in mid child-hood, and centred on temperament style (task orientation), behaviourproblems (aggression and hyperactivity), and school adjustment diffi-culties. During late childhood, teachers noted similar differences andalso reported significant group differences in levels of social compe-tence (cooperation). All significant group differences were betweenthe high risky driving group and both the moderate and low risky driv-ing groups, with the former group exhibiting more difficulties than theother two groups. Group differences during mid and late childhoodwere in the medium effect size range.
By early adolescence, the first parent- and self-reported differencesemerged. Parent and adolescent reports suggested that the high riskydriving group was displaying significantly more difficulties than themoderate and low risky driving groups over a range of domains. Asbefore, many of these group differences centred on personal attributes(temperament style, behaviour problems, social competence). However,group differences were also evident in the areas of school adjustment andachievement, peer relationships and the quality of the parent–adolescentrelationship. While the majority of group differences were between thehigh risky driving group and the other two groups, some differentiationbetween the low and moderate risky driving groups became evident.
This differentiation continued into mid/late adolescence, with the mod-erate risky driving group significantly differing from one or both of theother groups (but particularly the low risky driving group) on a numberof aspects. Group differences in coping styles (greater use of less adap-tive, acting out strategies by the high and moderate groups) were alsofound at this developmental stage. Group differences during adoles-cence ranged in strength from small to large effect sizes. The mostpowerful group difference was found for self-reported antisocial behav-iour during mid/late adolescence.
By early adulthood, group differences were evident on a wide range ofdomains. In addition to those problematic characteristics described previ-ously, the high risky driving group also reported lower levels of civicengagement than the low risky driving group and more police contact fordriving offences, while both the high and moderate risky driving groupsreported engaging in more multi-substance use, and spending more timedriving than the low risky driving group. At this time, the moderate riskydriving group continued to become more distinct from the other twogroups, being rated as more problematic than the low risky driving group,but less problematic than the high risky driving group, on many variables.Furthermore, the moderate risky driving group was rated as more assertiveand less anxious than both other groups during early adulthood. Themajority of group differences were in the moderate to large effect sizerange, with the most powerful differences evident on antisocial behaviour,association with antisocial peers and police contact for driving offences.

I N T H E D R I V E R ’ S S E AT 47
Precursors and correlates of crash involvement
In order to identify predictors of crash involvement, young adults were groupedaccording to number of crashes they had been involved in as a driver or rider sincecommencing driving a car or riding a motorcycle.
Formation of groups
Table 14 displays the distribution of crashes among the ATP sample. As the Tableshows, while the majority (57 per cent) had not been involved in a crash, approx-imately one-third had been in one crash, and about one-in-ten had been involvedin two crashes. Very few (less than 3 per cent) reported that they had beeninvolved in more than two crashes as a driver.
Individuals were classified into three groups:
a “no crash” group (n=596, 57 per cent of the sample) – this group reportedthat they had not been involved in a crash as a driver or rider
a “single crash” group (n=312, 30 per cent of the sample) – this group had beeninvolved in one crash as a driver or rider, and
a “multiple crash” group (n=136, 13 per cent of the sample) – this group reportedthat they had been involved in two or more crashes as a driver or rider.
Group characteristics
Gender compositionThe gender composition of the three groups (no, single, and multiple crashgroups) is shown in Table 15. From this Table it can be seen that that there was a weak but significant difference in the gender composition.27 For example,there was a trend for more young men than women to be members of the multiple crash group (54 per cent of this group were male). Hence, while young men and women did not significantly differ in their overall rates of crash involvement, when they were grouped according to the number of crashes they had been involved in, a weak but significant gender differenceemerged.
27 A chi-square test of independence revealed a significant difference in the proportion of themales and females in the crash involvement groups, χ2 (2) = 6.54, p<.05. An examination ofthe standardised residuals revealed a trend for a higher number of males (and a smallernumber of females) in the multiple crash group than would be expected by chance.
Number of crashes N %
0 596 57.1
1 312 29.9
2 112 10.7
3 17 1.6
4 3 0.3
5 2 0.2
6 1 0.1
7 1 0.1
Table 14. Distribution of crashes across ATP sample

A U S T R A L I A N I N S T I T U T E O F F A M I LY S T U D I E S48
Crash characteristicsThe single and multiple crash groups were compared to determine whether the twogroups differed in the circumstances surrounding their crashes (whether they werealone or with passengers) and/or the consequences of these crashes (whether thecrash resulted in property damage, or injury or death). These comparisons revealedthat a higher proportion of the multiple crash group had been involved in crashesresulting in property damage (regardless of whether they were alone28 or had pas-sengers when the crash occurred29) than the single crash group (see Table 16).
Group Males Females
n % males % group n % females % group
No (n=596) 261 56.6 43.8 335 57.5 56.2
Single (n=312) 127 27.5 40.7 185 31.7 59.3
Multiple (n=136) 73 15.8 53.7 63 10.8 46.3
Table 15. Gender composition of the no, single and multiple crash groups
Group Resulted in property damage Resulted in injury or death
Driver Driver + Driver Driver + only passengers only passengers
n % n % n % n %
Single (n=312) 178 57.1 109 34.9 9 2.9 5 1.6
Multiple (n=136) 112 82.4 72 52.9 5 3.7 3 2.2
Table 16. Crash characteristics of the single and multiple crash groups
Group differences by stage of development
The precursors and correlates of crash involvement were next examined. Using asimilar strategy to that employed previously, separate analyses were performed foreach developmental stage and source of report.30 However, unlike the previousanalyses of risky driving, participants’ level of driving exposure (number of hoursdriving per week) was controlled in this next set of analyses.
The results of these analyses are summarised separately for each stage of develop-ment in Tables 17 and 18, as well as being described in the text below. As describedpreviously, variables displayed in CAPITALS showed significant group differences(p<.0023), while the other variables listed showed only trends (p<.05). The sub-sequent discussion will focus on significant group differences.
Infancy, toddlerhood, and early childhood (0-4 years)The no, single and multiple crash groups did not significantly differ duringinfancy, toddlerhood and early childhood.
Mid childhood (5-8 years)There was a trend for multivariate group differences in parent reports at mid child-hood. However, the strength of these differences was not sufficient to reach the
28 χ2 (1) = 26.56, p<.001.29 χ2 (1) = 12.75, p<.001.30 As before, several analyses (in this case, Multivariate Analyses of Covariance - MANCOVAs)
were performed for each source of report from early adolescence on, due to the large numberof variables under investigation during adolescence and early adulthood.

I N T H E D R I V E R ’ S S E AT 49
adjusted significance level of p<.0023.31 No significant group differences were evi-dent by teacher reports at this age.
Late childhood (9-12 years)Parent-, teacher- and self-reports indicated no significant differences between thegroups during late childhood.
Early adolescence (12-14 years)There were trends for multivariate group differences on parent- and self-reportedindividual attributes and parent-reported environmental characteristics duringearly adolescence. However, these differences did not reach the adjusted signifi-cance level of p<.0023. No significant differences were evident on self-reportedenvironmental factors at this age.
Mid/late adolescence (15-18 years)Significant group differences first emerged during mid/late adolescence. These differ-ences were apparent on a wide range of domains, namely, temperament style,behaviour problems, social skills, coping styles, and peer relationships (see Table 17).Only on parent-reported environmental factors were no significant multivariategroup differences found, although there was a trend for such differences (p<.05).
The majority of group differences were between the two crash groups (single andmultiple crashes) and the no crash group. For example, the two crash groups wererated as more aggressive (by parents and adolescents), more antisocial (by adoles-cents), and as more reliant on less adaptive acting out coping strategies such asreacting explosively or using drugs (by adolescents), than the no crash group. Inaddition, the multiple crash group (but not the single crash group) was rated asless persistent (by parents), and as using more licit and illicit substances (by ado-lescents) than the no crash group.
There were also some aspects reflecting interpersonal skills on which the singlecrash group was rated more positively than either the multiple and no crashgroups (self-reported level of communication with peers) or the no crash groupalone (parent-reported assertiveness).
Group differences were generally quite modest at this stage, typically falling in thesmall effect size range. The most powerful group differences were found for self-reported antisocial behaviour and use of less adaptive, acting out copingstrategies, which both were in the medium effect size range.
Early adulthood (19-20 years)The majority of group differences during early adulthood emerged from selfreports, with only one parent-reported difference (conflict in parent–young adultrelationship) evident at this stage (see Table 18). There was a trend for multivari-ate group differences on parent-reported individual attributes, but this did notreach the adjusted significance level.
Similar to the previous stage, many of the group differences were between the two crash groups (single and multiple crashes) and the no crash group, with thosewho had been involved in a crash displaying a more “difficult” temperament style (lower persistence and higher reactivity, by self report) engaging in more
31 As a large number of analyses were performed, the Bonferroni adjustment procedure was usedto adjust the significance level to reduce the possibility of Type 1 error (the likelihood ofshowing group differences of statistical significance when they are not actually there). Resultsare reported for differences at the Bonferroni adjusted level of 0.0023 or lower.

A U S T R A L I A N I N S T I T U T E O F F A M I LY S T U D I E S50
antisocial behaviour and multi-substance use (as reported by young adults); hav-ing more police contact for driving offences; and associating more frequentlywith antisocial peers than those in the no crash group.
However, as in mid/late adolescence, there were also some aspects on which themultiple crash group alone was reported to experience more difficulties than theno crash group (parent-reported conflict in their relationship with their ATPyoung adult, self-reported stress experienced during driving practice), and otherson which the multiple crash group reported more difficulties than the single crashgroup (self-reported antisocial behaviour, police contact for driving offences, andassociation with antisocial peers).
Table 17. Parent-reported and self-reported significant differences between the no,single and multiple crash groups over mid/late adolescence
Note: Variables that are displayed in CAPITALS are significant at the Bonferroni adjusted level of significance (p<.0023).All other variables are trends (p<.05), and included for reader interest.
*** p<.001 ** p<.01 * p<.05
Domain Group differences Effect size
PARENT-REPORTED DIFFERENCES ON INDIVIDUAL ATTRIBUTES [F (20, 1784) = 2.93***]
Temperament stylePERSISTENCE Multiple crash group less persistent than No crash group Small
Sociability Single crash group more sociable than No crash group Small
Behaviour problemsAGGRESSION Multiple and Single crash groups more aggressive than Small
No crash group
Depression No two groups significantly differed Weaker than Small
Social skillsASSERTIVENESS Single crash group more assertive than No crash group Small
SELF-REPORTED DIFFERENCES ON INDIVIDUAL ATTRIBUTES [F (28, 1648) = 2.57***]
Behaviour problemsAGGRESSION Multiple and Single crash groups more aggressive than Small
No crash group
ANTISOCIAL Multiple and Single crash groups more antisocial MediumBEHAVIOUR behaviour than No crash group
Hyperactivity Multiple and Single crash groups more hyperactive than SmallNo crash group
MULTI-SUBSTANCE USE Multiple crash group more multi-substance use than SmallNo crash group
Other individual attributesEmotional control Single crash group less emotional control than No crash group Small
ACTING OUT COPING Multiple and Single crash groups greater use of acting MediumSTRATEGIES out coping strategies than No crash group
Optimism about Multiple crash group less optimistic about the Smallthe future future than No crash group
Sensation-seeking Multiple crash group more sensation seeking than SmallNo crash group
SELF-REPORTED DIFFERENCES ON ENVIRONMENTAL FACTORS [F(16,1562) = 3.38***]
School adjustment and achievement
School adjustment No two groups significantly differed Smalldifficulties
Peer relationshipsAntisocial peers Multiple and Single crash groups more antisocial friends Small
than No crash groupPEER ATTACHMENT- Single crash group more communication with peers than SmallCOMMUNICATION Multiple and No crash groups
Parent-adolescent relationship
Parental attachment - No two groups significantly differed Smallalienation

I N T H E D R I V E R ’ S S E AT 51
The three groups did not significantly differ in their family characteristics accord-ing to parent reports (parental marital or employment status, educational level,level of financial strain) or the young adults’ current life circumstances (employ-ment and educational status, living arrangements, highest year of completedschooling) by self reports.
As before, most group differences were in the small effect size range. However,medium effect sizes were observed for the degree of conflict between parents andyoung adults (parent-report), antisocial behaviour (self-report), and police contactfor driving offences (self-report).
Table 18. Parent-reported and self-reported significant differences between the no,single and multiple crash groups in early adulthood
Domain Group differences Effect size
PARENT-REPORTED DIFFERENCES ON ENVIRONMENTAL FACTORS [F(18,1014) = 2.50**]
Driving practiceStress during practice Multiple crash group more stress during driving practice Small
than No crash group
Peer relationshipsGroup participation Multiple crash group less participation in social/community Small
group activities than Single crash group
Parent-young adult relationship
PARENT-YOUNG Multiple crash group more conflictual parent-young adult MediumADULT CONFLICT relationship than No crash group
SELF-REPORTED DIFFERENCES ON INDIVIDUAL ATTRIBUTES [F(30, 1942=3.08***]
Temperament stylePERSISTENCE Multiple and Single crash groups less persistent than Small
No crash group
REACTIVITY Multiple and Single crash groups more reactive than SmallNo crash group
Behaviour problemsANTISOCIAL Multiple crash group more antisocial behaviour than Single MediumBEHAVIOUR crash group; Multiple and Single crash groups more
antisocial behaviour than No crash group
MULTI-SUBSTANCE USE Multiple and Single crash groups more multi-substance Smalluse than No crash group
Social skillsResponsibility Multiple crash group less responsible than No crash group Small
Criminal justice contacts and attitudes
POLICE CONTACT - Multiple crash group more police contact for driving offence/s MediumDRIVING OFFENCE/S than Single crash group, Multiple and Single crash groups
more police contact for driving offence/s than No crash group
SELF-REPORTED DIFFERENCES ON ENVIRONMENTAL FACTORS [F(20, 1830) = 2.74***]
Driving practiceAmount of practice No two groups significantly differed Small
STRESS DURING Multiple crash group more stress during driving practice SmallPRACTICE than No crash group
Peer relationshipsANTISOCIAL PEERS Multiple crash group more antisocial friends than Single Small
crash group; Multiple and Single crash groups more antisocial friends than No crash group
Parent-young adult relationship
Parent-young adult Multiple and Single crash groups more conflict between Smallconflict parents and young adults than No crash group
Note: Variables that are displayed in CAPITALS are significant at the Bonferroni adjusted level of significance (p<.0023).All other variables are trends (p<.05), and included for reader interest.
*** p<.001 ** p<.01 * p<.05

SU
MM
AR
Y
A U S T R A L I A N I N S T I T U T E O F F A M I LY S T U D I E S52
Summary
The three crash groups (no, single, and multiple) did not significantlydiffer during infancy, toddlerhood, childhood and early adolescence. Thefirst group differences emerged in mid/late adolescence. Group differences were apparent on a wide range of domains at this time(temperament style, behaviour problems, social skills, coping styles,and peer relationships) and were generally between the two groupsthat had experienced crashes and the no crash group. Parent andself reports suggested that those who had been involved in a crashdisplayed more problematic characteristics than those who had not.Group differences were generally in the small effect size range, withthe most powerful group differences found for antisocial behaviourand a less adaptive, acting out coping style, which were both in themedium effect size range.
While there were few parent-reported differences in early adulthood,self reports indicated differences between the groups across a range of domains (temperament style, behaviour problems, peerrelationships, learner driver experiences and contact with the criminal justice system). Similar to mid to late-adolescence, manygroup differences emerged between the two crash groups and the no crash group, with the two crash groups being rated as moreproblematic than the no crash group in these areas of functioning.There were also some aspects (antisocial behaviour, police contactfor driving offences, association with antisocial peers) on which the two crash groups were clearly differentiated from each other,with single crash group being rated as more problematic than the no crash group, but less problematic than the multiple crashgroup. Once again, most group differences were in the small effect size range. The most powerful group differences were foundfor antisocial behaviour, police contact for driving offences and the amount of conflict in the relationship between parents andyoung adults.
Precursors and correlates of speeding violations
To assist with identifying predictors of speeding violations, young adults weregrouped according to the number of times they had been apprehended by policefor exceeding the speed limit, according to self report.
Formation of groups
Table 19 displays the distribution of speeding violations among the ATP sample.
As this Table shows, the majority of participants (69 per cent) had never beendetected speeding. About one-in-five had been caught speeding once, and justover one-in-ten reported multiple speeding violations. Very few participantsreported having been caught speeding more than twice (less than 5 per cent).Consequently, participants were divided into three groups:

I N T H E D R I V E R ’ S S E AT 53
a no speeding violation group (n=712, 69 per cent of the sample) – this groupreported that they had never been caught speeding by the police;
a single speeding violation group (n=209, 20 per cent of the sample) – this groupreported they had been caught speeding by police on one occasion; and
a multiple speeding violation group (n=113, 11 per cent of the sample) – this grouphad been apprehended by police for speeding offences on two or more occasions.
Group characteristics
Gender compositionThe gender composition of the three groups (no, single, and multiple speeding vio-lations) is shown in Table 20, which shows that that there was a significant differencein the gender composition of the no and multiple speeding violation groups.32
While there was a similar proportion of young men and women in the single speed-ing violation group, there was a higher proportion of males in the multiple speedingviolation group (68 per cent of this group were young men and 32 per cent wereyoung women), and significantly more females in the no speeding violation group(62 per cent of this group were young women and 38 per cent were young men).
Number of times caught speeding N %
0 712 68.9
1 209 20.2
2 64 6.2
3 29 2.8
4 12 1.2
5 2 0.2
6 4 0.4
7 0 0.0
8 1 0.1
Table 19. Distribution of speeding violations among the ATP sample
Group Males Females
n % males % group n % females % group
No (n=712) 274 59.6 38.5 438 76.3 61.5
Single (n=209) 109 23.7 52.2 100 17.4 47.8
Multiple (n=113) 77 16.7 68.1 36 6.3 31.9
Table 20. Gender composition of the no, single and multiple speeding violation groups
Self-reported speeding behaviourIn order to determine whether the three speeding violation groups differed in theirlevels of speeding behaviour (and not just their propensity to attract police attention),the frequency of engagement in different levels of speeding behaviour across the threegroups was examined. The results of these comparisons are displayed in Table 21.
32 A chi-square test of independence revealed a significant difference in the proportion of themales and females in the speeding violation groups, χ2 (2) = 40.97, p<.001. An examinationof the standardised residuals revealed a significantly higher proportion of males (and a lowerproportion of females) in the multiple speeding violations group than would be expected bychance; as well as a significantly higher proportion of females in the no violations group(and a lower number of males in this group) than would be expected by chance.

A U S T R A L I A N I N S T I T U T E O F F A M I LY S T U D I E S54
As this Table shows, the three groups significantly differed in their levels of self-reported speeding behaviour.33 As expected, the multiple speeding violationgroup reported speeding more often (at all levels) than the no speeding violationgroup, while the single speeding violation group fell between these two groups,reporting more low to moderate speeding behaviour (up to 25km/h over thelimit) than the no speeding violation group, but less high-level speeding (inexcess of 25km/h above the limit) than the multiple speeding violation group.
Group ≥10km/h over limit 10-25km/h over limit > 25km/h over limit
Mean SD Mean SD Mean SD
No 3.57 3.25 1.18 2.07 0.28 1.07
Single 5.11 3.57 2.18 2.68 0.65 1.32
Multiple 5.66 3.37 2.70 3.01 1.50 2.57
Table 21. Self-reported speeding behaviour of the no, single and multiple speeding violation groups during their past 10 trips
Group differences by stage of development
The correlates and precursors of speeding violations are examined in this next sec-tion. Using the same strategy as employed in the previous section, separateMultivariate Analyses of Covariance (MANCOVAs) were performed for each devel-opmental stage and source of report, with driving exposure included as a covariateto control for its influence on speeding behaviour.34
Tables 22 through 25 summarise the results of these analyses. As a guide to inter-preting these tables, variables displayed in CAPITALS indicate significant groupdifferences (p<.0023),35 while the other variables listed indicate group trends(p<.05). The following discussion will focus only on significant differences.
Infancy, toddlerhood and early childhood (0-4 years)The no, single, and multiple speeding violation groups did not significantly dif-fer from each other during infancy, toddlerhood, and early childhood.
Mid childhood (5-8 years)There were trends for multivariate group differences in parent and teacher reportsduring mid childhood. However, these differences were not strong enough to reachthe adjusted significance level (p<.0023).
Late childhood (9-12 years)The first significant group differences emerged during late childhood (see Table 22).These differences were between the multiple speeding violation group and theother two groups (single and no speeding violations) and all but one were teacher-reported. Both teachers and parents rated the multiple speeding violation groupas more hyperactive than the single and no speeding violation groups, whileteachers also rated the multiple speeding violation group as more aggressive, less
33 One-way Analyses of Variance revealed significant differences between the no, single and mul-tiple speeding violation groups in the frequency with which they drove up to 10km/h above thespeed limit, F (2,1028)=31.2, p<.001; drove between 10-25 km/h over the speed limit, F(2,1026)=30.5, p<.001; and drove more than 25km/h over the speed limit, F(2,1027)=41.2, p<.001.
34 As before, multiple MANCOVAs were performed for each informant (parent, adolescent/youngadult) during adolescence and early adulthood, due to the large number of variables under inves-tigation during this period.
35 Due to the large number of analyses performed, the Bonferroni adjustment procedure wasused to adjust the significance level to reduce the possibility of Type 1 error (the likelihood ofshowing group differences of statistical significance when they are not actually there). Resultsare reported for differences at the Bonferroni adjusted level of 0.0023 or lower.

I N T H E D R I V E R ’ S S E AT 55
cooperative, less self-controlled and less task-oriented than other children. Mostgroup differences were within the medium effect size range.
There was a trend for multivariate group differences in self reports during late-childhood. However, these differences were not sufficiently strong to reachstatistical significance (at the adjusted significance level of p<.0023).
Early adolescence (12-14 years)By early adolescence, numerous differences were apparent between the speeding viola-tion groups (Table 23). As before, the majority of group differences were between themultiple speeding violation group and the other two groups, with the multiple speed-ing violation group appearing more problematic than the single and no speedingviolation groups across a wide range of domains. For instance, the multiple speedingviolation group exhibited a less persistent temperament style (as reported by parents),higher levels of hyperactivity (as reported by parents), lower social skills (lower parent-reported cooperation and self-reported empathy) and more school adjustmentdifficulties (as reported by parents and adolescents) than the single and no speedingviolation groups. There were also some characteristics on which only the multiple andno speeding violation groups differed (parent- and self-reported association with anti-social peers, self-reported aggression), to the disadvantage of the former group.
The first sign of differences between the single speeding violation group and theno speeding violation group was found at this age, with participants in both themultiple and single speeding violation groups rating themselves as more antiso-cial than those in the no speeding violation group.
Table 22. Parent-reported and teacher-reported significant differences between the no, single and multiple speeding violation groups in late childhood
Note: Variables that are displayed in CAPITALS are significant at the Bonferroni adjusted level of significance (p<.0023).All other variables are trends (p<.05), and included for reader interest.
*** p<.001 ** p<.01 * p<.05
Domain Group differences Effect size
PARENT-REPORTED DIFFERENCES [F (32, 1716) = 1.87**]
Temperament stylePersistence Multiple violation group less persistent than Single violation group Small
Behaviour problemsHYPERACTIVITY Multiple violation group more hyperactive than Single and Small
No violation groups
Social skillsCooperation Multiple violation group less cooperative than Single and Small
No violation groups
Peer relationshipsAntisocial peers Multiple violation group more antisocial friends than Single Small
and No violation groups
TEACHER-REPORTED DIFFERENCES [F (20, 1234) = 2.59***]
Temperament styleTASK ORIENTATION Multiple violation group less task oriented than Single and Medium
No violation groups
Behaviour problemsAGGRESSION Multiple violation group more aggressive than Single and Medium
No violation groups
HYPERACTIVITY Multiple violation group more hyperactive than Single and MediumNo violation groups
Social skillsCOOPERATION Multiple violation group less cooperative than Single and Medium
No violation groups
SELF CONTROL Multiple violation group less self controlled than Single and SmallNo violation groups

A U S T R A L I A N I N S T I T U T E O F F A M I LY S T U D I E S56
Table 23. Parent-reported and self-reported significant differences between the no,single and multiple speeding violation groups in early adolescence
Note: Variables that are displayed in CAPITALS are significant at the Bonferroni adjusted level of significance (p<.0023).All other variables are trends (p<.05), and included for reader interest.
*** p<.001 ** p<.01 * p<.05
Domain Group differences Effect size
PARENT-REPORTED DIFFERENCES ON INDIVIDUAL ATTRIBUTES [F (24, 1556) = 3.04***]
Temperament stylePERSISTENCE Multiple violation group less persistent than Single and Medium
No violation groups
Behaviour problemsAggression Multiple violation group more aggressive than Single and Small
No violation groups
Anxiety Single violation group less anxious than No violation group Small
HYPERACTIVITY Multiple violation group more hyperactive than Single and MediumNo violation groups
Social skillsCOOPERATION Multiple violation group less cooperative than Single and Small
No violation groups
Responsibility No two groups significantly differed Small
Self control Multiple violation group les self controlled than No violation group Small
PARENT-REPORTED DIFFERENCES ON ENVIRONMENTAL FACTORS [F(22, 1756) = 2.63***]
School adjustment & achievement
SCHOOL ADJUSTMENT Multiple violation group more school adjustment difficulties MediumDIFFICULTIES than Single and No violation groups
Peer relationshipsANTISOCIAL PEERS Multiple violation group more antisocial friends than Small
No violation group
Parenting styleUse of harsh discipline Multiple violation group received more harsh discipline than Small
No violation group
SELF-REPORTED DIFFERENCES ON INDIVIDUAL ATTRIBUTES [F (24, 1718) = 2.66***]
Behaviour problemsAGGRESSION Multiple violation group more aggressive than No Small
violation group
ANTISOCIAL Multiple and Single violation groups more antisocial behaviour MediumBEHAVIOUR than No violation group
Hyperactivity Multiple violation group more hyperactive than SmallNo violation group
Social skillsCooperation Multiple violation group less cooperative than No violation group Small
EMPATHY Multiple violation group less empathic than Single and MediumNo violation groups
Other individual attributesSensation-seeking Multiple and Single violation groups more sensation seeking Small
than No violation group
SELF-REPORTED DIFFERENCES ON ENVIRONMENTAL FACTORS [F (10, 1672) = 2.89**]
School adjustment and achievement
SCHOOL ADJUSTMENT DIFFICULTIES Multiple violation group more school adjustment difficulties Small
than Single and No violation groups
Peer relationshipsANTISOCIAL PEERS Multiple violation group more antisocial friends than No Small
violation group
Friendship quality Multiple violation group lower friendship quality than No Smallviolation group
Parent- adolescent relationship
Quality of relationship No two groups significantly differed Small

I N T H E D R I V E R ’ S S E AT 57
Group differences ranged in strength from small to medium effect sizes. The mostpowerful group differences were found on persistence (parent report), hyperactivity(parent report), antisocial behaviour (adolescent report), empathy (adolescentreport), and school adjustment (parent report).
Mid/late adolescence (15-18 years)Few significant group differences were found during mid/late adolescence (Table 24).The only significant differences that emerged at this time were in the areas of tem-perament style and behaviour problems.For example, the multiple speedingviolation group was found to be more aggressive (according to parent reports) andmore antisocial (by self reports) than the other two groups.
The single violation group showed further signs of differentiation from the no speed-ing violation group at this age. For example, like the multiple violation group, parentsrated the single violation group as more sociable than the no violation group, and selfreports indicated that they more often engaged in antisocial behaviour than the noviolation group (although the single speeding violation group was not rated as highlyon this aspect as the multiple violation group).
Group differences were generally in the small effect size range at this develop-mental stage. However, a medium effect size was found for differences onself-reported antisocial behaviour. There were trends for significant multivariategroup differences on environmental factors by both parent and self reports (p<.05),but they did not reach the adjusted significance level.
Table 24. Parent-reported and self-reported significant differences between the no,single and multiple speeding violation groups over mid/late adolescence
Note: Variables that are displayed in CAPITALS are significant at the Bonferroni adjusted level of significance (p<.0023).All other variables are trends (p<.05), and included for reader interest.
*** p<.001 ** p<.01 * p<.05
Domain Group differences Effect size
PARENT-REPORTED DIFFERENCES ON INDIVIDUAL ATTRIBUTES [F(20, 1766) =2.46***]
Temperament stylePersistence Multiple violation group less persistent than Single and Small
No violation groups
SOCIABILITY Multiple violation and Single violation groups more sociable Smallthan No violation group
Behaviour problemsAGGRESSION Multiple violation group more aggressive than Single and Small
No violation groups
Anxiety Single violation group less anxious than No violation group Small
Hyperactivity Multiple violation group more hyperactive than Single and SmallNo violation groups
Social skillsAssertiveness Single violation group more assertive than No violation group Small
SELF-REPORTED DIFFERENCES ON INDIVIDUAL ATTRIBUTES [F(28, 1632) =2.89***]
Behaviour problemsANTISOCIAL BEHAVIOUR Multiple violation group more antisocial behaviour than Medium
Single violation group; Multiple and Single violation groups more antisocial behaviour than No violation group
Social skillsAssertiveness Single violation group more assertive than No violation group Small
Other individual attributesOptimism about Multiple violation group less optimistic than Single Smallthe future violation group
Active adaptive Single violation group more use of active adaptive coping Smallcoping strategies strategies than Multiple and No violation groups
Sensation-seeking Multiple and Single violation groups more sensation seeking Smallthan No violation group

A U S T R A L I A N I N S T I T U T E O F F A M I LY S T U D I E S58
Early adulthood (19-20 years)The domains in which group differences appeared became more varied by earlyadulthood (Table 25). Group differences emerged in some areas of functioning inwhich differences had been found in earlier developmental stages (behaviour
Table 25. Parent-reported and self-reported significant differences between the no,single and multiple speeding violation groups in early adulthood
Note: Variables that are displayed in CAPITALS are significant at the Bonferroni adjusted level of significance (p<.0023).All other variables are trends (p<.05), and included for reader interest.
*** p<.001 ** p<.01 * p<.05
Domain Group differences Effect size
PARENT-REPORTED DIFFERENCES ON INDIVIDUAL ATTRIBUTES [F (22, 1352) = 2.57***]
Behaviour problemsAnxiety Single violation group less anxious than No violation group Small
CRIMINAL JUSTICE Multiple and Single violation groups more criminal justice SmallSYSTEM CONTACT contact than No violation group
SELF-REPORTED DIFFERENCES ON INDIVIDUAL ATTRIBUTES [F (30, 1920) =14.99***]
Behaviour problemsANTISOCIAL Multiple and Single violation groups more antisocial MediumBEHAVIOUR behaviour than No violation group
ANXIETY Multiple and Single violation groups less anxious than SmallNo violation group
DEPRESSION Multiple violation group less depressed than No violation group Small
MULTI-SUBSTANCE Multiple violation group more multi-substance use than SmallUSE Single and No violation groups
Social skillsEmpathy Multiple violation group less empathic than No violation group Small
Responsibility Multiple violation group less responsible than No violation group Small
Other individual attributesLife satisfaction Single violation group more life satisfaction than No Small
violation group
Criminal justice contacts and attitudes
POLICE CONTACT- Multiple violation group more police contact for driving offences LargeDRIVING OFFENCE/S than Single violation group; Multiple and Single violation groups
more police contact for driving offences than No violation group
SELF-REPORTED DIFFERENCES ON ENVIRONMENT FACTORS [F (20, 1804) = 3.08***]
Peer relationshipsANTISOCIAL PEERS Multiple violation group more antisocial friends than Single Medium
and No violation groups
Quality of peer No two groups significantly differed Weakerrelationships than Small
Community participationCivic engagement Multiple violation group less civic engagement than Small
No violation group
Learner driver experiencesAmount of practice Multiple violation group more driving practice than No Small
violation group
SELF-REPORTED DIFFERENCES ON OWN LIFE SITUATION [F (10, 1832) = 7.07***]
Current life circumstancesCURRENTLY EMPLOYED Multiple violation group young adults: more currently Medium
employed than Single and No violation group young adults
CURRENTLY STUDYING Multiple violation group young adults: fewer currently Mediumstudying than Single and No violation group young adults
LEVEL OF SCHOOLING Multiple violation group less schooling completed than MediumCOMPLETED Single and No violation groups
History of Multiple violation group less often unemployed since Smallunemployment leaving school than No violation group

SU
MM
AR
Y
I N T H E D R I V E R ’ S S E AT 59
problems, peer relationships), as well as domains that had not been examinedbefore (current life circumstances, contact with the criminal justice system).
While many group differences were between the multiple speeding violationgroup and the other two groups, there were also some characteristics on whichboth the single and multiple speeding violation group differed from the no speed-ing violation group; the multiple speeding violation group alone differed fromthe no speeding violation group; or all three groups differed from each other.
In terms of behavioural and emotional difficulties, self reports indicated thatmultiple speeding violation group engaged in more multi-substance use thanother young adults, and both the single and multiple speeding violation groupswere more antisocial (by self report) and had experienced more contact with thecriminal justice system (by parent report) than the no speeding violation group.Furthermore, both speeding violation groups also reported experiencing morepolice contact for driving offences than the no violation group, although the sin-gle speeding violation group was not as problematic as the multiple speedingviolation group on this aspect. While the two speeding violation groups exhibitedhigher levels of behaviour problems, the no speeding violation group reportedmore emotional adjustment difficulties, with self reports indicating that the nospeeding violation group was more depressed than the multiple speeding viola-tion group, and more anxious than the other two groups.
In relation to current life circumstances, the multiple speeding violation groupwas less likely to have completed school than the other two groups, and less likelyto be currently undertaking a course of study (according to their own reports). Per-haps as a result, the multiple speeding violation group was more likely to be inpaid employment than the other two groups.
The multiple speeding violation group also differed from the other groups interms of their peer relationships, with young people in the multiple speeding vio-lation group associating more frequently with antisocial peers (by self report).
No significant differences were found between the groups in their parent-reportedfamily characteristics (parental marital, educational or occupational status; finan-cial strain) or their self-reported learner driver experiences, although there was atrend for group differences on the amount of driving practice young adultsreceived when learning to drive.
Most group differences were in the small to medium effect size range with the excep-tion of police contact for driving offences, for which a large effect size was found.
Summary
The three speeding violation groups (no, single and multiple viola-tions) could not be distinguished from each other during theearliest years of life. While there were trends for multivariate groupdifferences in mid childhood, the first significant group differencesdid not emerge until late childhood. At this time, significant groupdifferences were found between the multiple speeding violationgroup and both the single and no speeding violation groups ontemperament style (task orientation), behaviour problems (hyper-activity and aggression) and social skills (cooperation andself-control), with the former group exhibiting more difficulties

SU
MM
AR
Y
A U S T R A L I A N I N S T I T U T E O F F A M I LY S T U D I E S60
than the other two groups. Most group differences were teacher-reported, and were within the medium effect size range.
By early adolescence, numerous differences were evident betweenthe speeding violation groups. Consistent with earlier findings, themajority of group differences were between the multiple speedingviolation group and the other two groups, with the multiple speed-ing violation group exhibiting more difficulties than the single andno speeding violation groups across a wide range of domains(exhibiting a more difficult temperament style, more behaviourproblems, lower social skills, and more school adjustment difficul-ties). Group differences ranged in strength from small to mediumeffect sizes, with the most powerful group differences being foundfor persistence, hyperactivity, antisocial behaviour, empathy andschool adjustment.
Interestingly, there were few significant group differences betweenthe speeding violation groups during mid/late adolescence. The onlysignificant group differences emerged in the areas of temperamentstyle and behaviour problems. Furthermore, the pattern of groupdifferences was not as consistent as at previous time points. Whilethe multiple speeding violation group was still more problematicthan both the other groups on some characteristics (aggression andantisocial behaviour), the single speeding violation group showedsome differentiation from the no speeding violation group at thisage. For example, like the multiple speeding violation group, thesingle speeding violation group was found to be more sociable thanthe no speeding violation group and to engage in higher levels ofantisocial behaviour (although not as high as in the multiple speed-ing violation group). Group differences were relatively small at thisdevelopmental stage. However, a medium effect size was found fordifferences on self-reported antisocial behaviour.
The differentiation of the single speeding violation group from theno speeding violation group continued in early adulthood. While themultiple speeding violation group was still generally the most prob-lematic group, the single speeding violation group also exhibitedhigher levels of antisocial behaviour and higher rates of contactwith the criminal justice system than the no speeding violationgroup. Interestingly, the no speeding violation group displayedmore emotional adjustment difficulties (anxiety and depression)than one or both of the other groups at this time.
The domains in which group differences appeared also became morevaried at this time. Group differences emerged in some areas of func-tioning in which differences had been found in earlier developmentalstages (behaviour problems, peer relationships), as well as domainsthat had not been examined before (current life circumstances, con-tact with the criminal justice system). Most group differences were inthe small to medium effect size range, with the exception of policecontact for driving offences, which, not surprisingly, was large.

I N T H E D R I V E R ’ S S E AT 61
Gender differences in the precursors and correlates of risky
driving, crash involvement and speeding violations
As noted earlier, the risky driving, crash involvement and speeding violationgroups differed significantly in gender composition. More specifically, youngmen tended to be over-represented in the most problematic driving groups (highrisky driving, multiple crash and multiple speeding violations), while a higherproportion of young women tended to be members of the low problem drivinggroups (particularly the low risky driving and no speeding violation groups). Thisgender difference was particularly notable in the high risky driving and multiplespeeding violation groups, with more than three-quarters of high risky drivers,and two-thirds of the multiple speeding violation group being young men. Thesegender differences may have contributed to the group differences found.
While it would have been interesting to examine the precursors and correlates ofrisky driving, crash involvement and speeding violations separately for youngmen and women, the small number of women in these groups, particularly in thehigh risky driving (n=17) and multiple speeding violation groups (n=36), wouldhave meant that the statistical power of such analyses would have been severelylimited, and hence, meaningful results would have been difficult to obtain. Con-sequently, it was decided not perform gender-specific analyses.
An alternative approach would have been to statistically control for the influenceof gender on risky driving, crash involvement and speeding violations. However,given the clear interconnectedness between gender and the three problematicdriving outcomes (particularly risky driving and speeding violations), controllingfor the effects of gender was not considered sensible, since this would have effec-tively cancelled out the very real contribution of gender, and may have resultedin findings of limited relevance to real world settings (Tabachnick and Fidell1996), where young males are in fact more likely to engage in risky driving behav-iour and speeding (Beirness and Simpson 1988; Shope, Lang and Waller 1997).Hence, the effects of gender on risky driving, crash involvement and speeding vio-lations were not controlled in the ATP Young Drivers Study.

Similar i t ies and di f ferences in theprecursors of r i sky dr iving, crash
involvement and speeding violat ions
5

I N T H E D R I V E R ’ S S E AT 65
Following the description of group differences at different stages of development,the similarities and differences in the correlates and precursors of risky driving,crash involvement and speeding violations are now examined to determinewhether a particular profile may be identified for different types of problematicyoung drivers. This discussion draws on data already presented in Tables 10-13,17-18, and 22-25. To aid description of group trends, differences between the riskydriving, crash involvement and speeding violation groups are presented pictori-ally on selected characteristics. Figures 16 through 27 present the meanstandardised scores (z-scores36 or adjusted z-scores37) for each of the groups onspecific characteristics measured over time.
Group differences in domains relating to individual attributes will be discussedfirst, followed by domains relating to environmental factors, family characteris-tics and current life circumstances.
When examining these findings, it is important to remember that risk factors, bythemselves, may not be powerfully predictive of problematic outcomes. It is thecumulative impact of multiple risk factors that is often important, and researchsuggests that the likelihood of an individual exhibiting an adverse outcomeincreases with the number of risk factors he or she is exposed to (Bond et al. 2000;Loeber and Farrington 2000). However, for those who are interested in determin-ing the relative importance of different attributes or characteristics in predictingproblem driving outcomes, the effect sizes provided in the earlier Tables may beused as a guide, with larger effect sizes indicating more powerful predictors.
Individual attributes
Temperament styleTask orientation/persistence difficulties appeared to be characteristic of all typesof problem drivers, but particularly those who engaged in high levels of risky driv-ing and/or had been apprehended for speeding on multiple occasions. Thesedifficulties generally first emerged during mid and late childhood and persisted intoadolescence (Figures 16 and 17), and group differences on this characteristic weremoderate in strength.
While individuals who reported having been involved in multiple crashes alsotended to be less persistent than those in the single and no crash groups, signifi-cant differences on this characteristic did not emerge until adolescence and werewithin the small effect size range.
Similarities and differences in the precursors of risky
driving, crash involvement and speeding violations55 Similarities and differences in the precursors of risky
driving, crash involvement and speeding violations
36 The z-score transformation makes variables comparable, as it creates new variables which allhave a mean of 0 and a standard deviation of 1.
36 The scores presented for the speeding violation and crash involvement groups are adjustedto control for amount of driving exposure.

A U S T R A L I A N I N S T I T U T E O F F A M I LY S T U D I E S66
There were also some temperament characteristics that were uniquely associatedwith particular problem driving outcomes. For example, individuals who hadbeen apprehended for speeding were more likely to be characterised by a sociable temperament style (during mid/late adolescence) than other drivers, whilethose who had been involved in a crash were more reactive (moody, volatile) inearly adulthood than those who had not. Group differences on sociability weremoderate in strength, while those on reactivity were small.
Sensation-seeking and risk-takingYoung adults who engaged in high levels of risky driving behaviour, had beeninvolved in multiple crashes, and/or had been apprehended for speeding on mul-tiple occasions, were not found to be more sensation seeking or attracted to risktaking during adolescence than less problematic drivers.
-1.0
-0.8
-0.6
-0.4
-0.2
0.0
0.2
0.4
0.6
0.8
1.0
Late childhoodMid childhood
High risky drivingModerate risky drivingLow risky driving
Figure 16. Teacher-reported differences in task orientation between the risky driving groups over time
Developmental stage
Me
an
z-s
core
-1.0
-0.8
-0.6
-0.4
-0.2
0.0
0.2
0.4
0.6
0.8
Early adulthood
Mid/lateadolescence
Early adolescence
Latechildhood
Midchildhood
Early childhood
Toddlerhood
1.0
Multiple speeding violations
Single speeding violationNo speeding violations
Figure 17. Parent-reported differences in persistence between the speeding violation groups over time
Developmental stage
Me
an
ad
just
ed
z-s
core

I N T H E D R I V E R ’ S S E AT 67
Behavioural and emotional problemsRates of externalising (“acting out”) behaviour problems were higher across alltypes of problem drivers. Thus, the high risky driving group, the multiple crashgroup and the multiple speeding violation group were all consistently moreaggressive and more frequently engaged in antisocial behaviour and multi-sub-stance use than other driver groups (see Figures 18 to 19 for examples). Inaddition, the moderate risky driving, single crash and single violation groups alsoexhibited elevated levels of many of these externalising behaviour problems dur-ing adolescence and early adulthood, although they were generally lessproblematic than the high problem driving groups.
-1.0
1.0
-0.8
-0.6
-0.4
-0.2
0.0
0.2
0.4
0.6
0.8
Early adulthoodMid/late adolescenceEarly adolescence
High risky driving
Moderate risky driving
Low risky driving
Figure 18. Self-reported differences in antisocial behaviour between the risky driving groups across time
Developmental stage
Me
an
z-s
core
-1.0
-0.8
-0.6
-0.4
-0.2
0.0
0.2
0.4
0.6
0.8
1.0
Early adulthoodMid/late adolescenceEarly adolescence
Multiple crashes
Single crash
No crashes
Figure 19. Self-reported differences in multi-substance use between the crash involvement groups across time
Developmental stage
Me
an
ad
just
ed
z-s
core
High risky drivers and those with multiple speeding violations were typicallymore hyperactive during childhood (see Figure 20 for an example). However,hyperactivity problems were not associated with crash involvement at any devel-opmental stage, suggesting hyperactivity was an important precursor only forrisky driving or speeding violations.

A U S T R A L I A N I N S T I T U T E O F F A M I LY S T U D I E S68
The developmental stages at which group differences on behavioural problemsfirst emerged differed greatly for the three problem driving outcomes. Further-more, group differences were generally most powerful among the risky drivinggroups. Group differences ranged in strength from small to large effect sizes, withthe strongest differences found on antisocial behaviour.
In general, problem drivers did not differ from other drivers in their levels of inter-nalising behaviour problems (depression, anxiety). However, the moderate riskydriving group displayed lower anxiety levels during early adulthood, while themultiple violation group was found to be less depressed and less anxious thanother drivers at this same developmental stage, perhaps suggesting a more “out-going” style. Group differences were generally small.
Criminal justice contacts and attitudesNot surprisingly, higher rates of police contact for driving offences were associ-ated with all types of problem driving outcomes. For each outcome, the mostproblematic group (the high risky driving, multiple crash and multiple speedingviolation groups) reported the highest rate of driving offences during early adult-hood, while the least problematic groups (the low risky driving, no crash, and nospeeding violation groups) reported the lowest number of offences. Group differ-ences on this characteristic were moderate to large in strength.
Additionally, individuals who had been apprehended for speeding were morelikely than those who had not to have had contact with criminal justice agenciesfor offences other than driving (as assessed in early adulthood). Group differenceson this characteristic were small.
Social competenceBoth the high risky driving and multiple speeding violation groups appeared to haveless well developed social skills than other drivers. However, these deficiencies weremore widespread and more consistently evident among high risky drivers than thosewith multiple speeding offences. For example, while both groups were consistentlyless cooperative during late childhood and early adolescence (see example in Figure 21),the high risky driving group was also consistently less responsible and less empathicacross adolescence and early adulthood than less risky drivers (see Figure 22).
-1.0
-0.8
-0.6
-0.4
-0.2
0.0
0.2
0.4
0.6
0.8
1.0
Mid/lateadolescence
Early adolescence
Late childhood
Midchildhood
Earlychildhood
Multiple speeding violations
Single speeding violationNo speeding violations
Figure 20. Parent-reported differences in hyperactivity between the speeding violation groups over time
Developmental stage
Me
an
ad
just
ed
z-s
core

I N T H E D R I V E R ’ S S E AT 69
Occasional differences were found between the risky driving and speeding violationgroups on other aspects of social competence (self-control, assertiveness among therisky driving groups; self-control and empathy among the speeding violationgroups). Group differences were generally small to moderate in size. No aspects ofsocial competence consistently differentiated the crash involvement groups.
-1.0
-0.8
-0.6
-0.4
-0.2
0.0
0.2
0.4
0.6
0.8
1.0
Early adolescenceLate childhood
Multiple speeding violations
Single speeding violationNo speeding violations
Figure 21. Parent-reported differences in cooperation between the speeding violation groups over time
Developmental stage
Me
an
ad
just
ed
z-s
core
-1.0
-0.8
-0.6
-0.4
-0.2
0.0
0.2
0.4
0.6
0.8
1.0
Early adulthoodEarly adolescenceLate childhood
High risky driving
Moderate risky driving
Low risky driving
Figure 22. Self-reported differences in empathy between the risky driving groups over time
Note: Empathy was not measured during mid/late adolescence.
Note: Cooporation was only measured during late childhood and early adolescence.
Developmental stage
Me
an
z-s
core
Coping strategiesDuring mid/late adolescence, young adults were asked to indicate how frequentlythey used certain coping strategies when faced with a problem. Young people whoengaged in moderate or high levels of risky driving were more likely to use lessadaptive acting out, strategies to cope with problems (for example, using drugs orreacting explosively) than other drivers who were less risky. Similar differenceswere found between the crash involvement groups. Group differences werewithin the small to medium effect size range. However, problem drivers did notdiffer from other drivers in their propensity to use less adaptive coping strategies

A U S T R A L I A N I N S T I T U T E O F F A M I LY S T U D I E S70
that were internally focused (such as wishful thinking or self blame) or more adap-tive strategies (for example, seeking support from others, using humour to cope). Thespeeding violation groups did not differ on this characteristic.
Emotional controlThere were no significant differences on this aspect when measured in adoles-cence and early adulthood.
Civic engagementLower levels of civic engagement were associated with risky driving, but not crashinvolvement or speeding violations. In comparison to low risky drivers, the highrisky driving group reported being less involved in their community – they wereless likely to attend a public meeting, undertake voluntary or charitable work, signa partition, or take part in a demonstration) during early adulthood. This differencewas small in magnitude.
Future aspirationsProblem drivers did not differ significantly from other drivers in their hopes anddesires for the future, when this aspect was assessed in mid/late adolescence.
Summary of individual precursors
Table 26 provides a summary of the precursors of each of the three problem drivingoutcomes. As a guide to interpreting this table, a “tick” (✔) indicates that a particular
Table 26. Summary of individual attributes associated with different problem driving outcomes
High risky Multiple Multiple speedingAspect driving crashes violations
Temperament style
Less task persistent ✔ ✔ ✔
More negatively reactive ✖ ✔ ✖
More sociable ✖ ✖ ✔
Behavioural problems
More aggressive ✔ ✔ ✔
More hyperactive ✔ ✖ ✔
More antisocial behaviour ✔ ✔ ✔
More multi-substance use ✔ ✔ ✔
Emotional problems
Less anxious ✖ ✖ ✔
Less depressed ✖ ✖ ✔
Social competence
Less cooperative ✔ ✖ ✔
Less responsible ✔ ✖ ✖
Less empathic ✔ ✖ ✔
Less self-controlled ✔ ✖ ✔
Coping strategies
More acting out, less ✔ ✔ ✖adaptive coping
Criminal justice contacts
More driving offences ✔ ✔ ✔
More offences (general) ✖ ✖ ✔
Civic engagement
Lower civic engagement ✔ ✖ ✖

I N T H E D R I V E R ’ S S E AT 71
individual characteristic (for example, lower task persistence) was found to be asso-ciated with a particular driving outcome (for example, risky driving) at a minimumof one developmental stage, while a cross (✖) indicates that this characteristic wasnot associated with a particular outcome at any time at which it was assessed.
As Table 26 shows, a greater number of individual attributes were associated withhigh risky driving and multiple speeding violations, than multiple crash involve-ment. Furthermore, there were more shared risk factors between the high riskydriving and multiple speeding violation groups than between the multiple crashgroup and the other two groups. While the timing at which these aspects wereassociated with the different outcomes is not shown, as previously noted, groupdifferences tended to emerge earlier and be more consistent among the risky driv-ing and speeding violation groups than the crash involvement groups.
Social and environmental factors
School adjustment and achievementYoung drivers who engaged in high levels of risky driving and/or had multiplespeeding violations were more likely to report experiencing school adjustmentdifficulties than other drivers. That is, when they were at school, these groupswere found to experience more difficulties adhering to school rules and routines,understanding school work, completing assigned work on time and getting alongwith teachers and classmates, than other students (see Figures 23 and 24). In con-trast, school adjustment difficulties did not significantly differentiate youngpeople who reported different levels of crash involvement. School adjustment dif-ficulties emerged earlier among the high risky driving group (mid childhood) thanthe multiple speeding violation group (early adolescence), but group differences forboth outcomes were equally strong (that is, moderate in strength).
Despite these adjustment difficulties, problem drivers did not significantly differfrom other drivers in their actual levels of school achievement (for example, read-ing ability, overall level of academic competence) when this aspect was assessedin mid and late childhood.
In addition, a lower level of completed secondary education was uniquely char-acteristic of those in the multiple speeding violation group. Group differences onthis characteristic were moderately strong.
-1.0
-0.8
-0.6
-0.4
-0.2
0.0
0.2
0.4
0.6
0.8
1.0
Mid/late adolescenceEarly adolescence
High risky drivingModerate risky drivingLow risky driving
Figure 23. Parent-reported differences in school adjustment difficulties between the risky driving groups over time
Developmental stage
Me
an
z-s
core

A U S T R A L I A N I N S T I T U T E O F F A M I LY S T U D I E S72
Peer relationshipsA tendency to affiliate with peers who were antisocial and/or engaged in sub-stance use was characteristic of all problem drivers, but particularly those whoengaged in high levels of risky driving behaviour (see Figures 25 to 27). Thesefriendships were generally evident during adolescence and early adulthood, andgroup differences ranged in strength from small to large effect sizes.
In terms of other peer-relationship characteristics, poorer quality peer relationships(during early adolescence) were uniquely associated with high risky driving, whilehigh levels of peer communication (during mid/late adolescence) characterised thefriendships of the single crash group. Group differences on these characteristicsranged from small (peer communication) to moderate (friendship quality) effect sizes.
Problem drivers did not significantly differ from other drivers in their overall lev-els of peer attachment, trust, or participation in structured group activities (forexample, community clubs, sporting groups).
-1.0
-0.8
-0.6
-0.4
-0.2
0.0
0.2
0.4
0.6
0.8
1.0
Mid/late adolescenceEarly adolescence
Multiple speeding violations
Single speeding violationNo speeding violations
Figure 24. Parent-reported differences in school adjustment difficulties between the speeding violation groups over time
Developmental stage
Me
an
ad
just
ed
z-s
core
-1.0
-0.8
-0.6
-0.4
-0.2
0.0
0.2
0.4
0.6
0.8
1.0
Early adulthoodMid/late adolescenceEarly adolescence
High risky driving
Moderate risky driving
Low risky driving
Figure 25. Self-reported differences in association with antisocial peers between the risky driving groups over time
Developmental stage
Me
an
z-s
core

I N T H E D R I V E R ’ S S E AT 73
Parenting practices Problem drivers did not significantly differ from other drivers in the type of par-enting they received during adolescence.
Parental substance useLevels of parental cigarette and alcohol use did not significantly differentiateproblem drivers from other drivers.
Parent–child relationshipDifficulties in relationships between parents and children were characteristic ofrisky drivers and those who had been involved in multiple crashes. For example,individuals who engaged in high or moderate levels of risky driving reportedmore difficulties in their relationship with their parents than the low risky driv-ing group during early adolescence, while higher levels of conflict between parentsand young people were evident among the multiple crash group than the no
-1.0
-0.8
-0.6
-0.4
-0.2
0.0
0.2
0.4
0.6
0.8
1.0
Early adulthoodMid/late adolescenceEarly adolescence
Multiple speeding violations
Single speeding violationNo speeding violations
Figure 26. Self-reported differences in association with antisocial peers between the speeding violation groups over time
Developmental stage
Me
an
ad
just
ed
z-s
core
-1.0
-0.8
-0.6
-0.4
-0.2
0.0
0.2
0.4
0.6
0.8
1.0
Early adulthoodMid/late adolescenceEarly adolescence
Multiple crashes
Single crash
No crashes
Figure 27. Self-reported differences in association with antisocial peers between the crash involvement groups over time
Developmental stage
Me
an
ad
just
ed
z-s
core
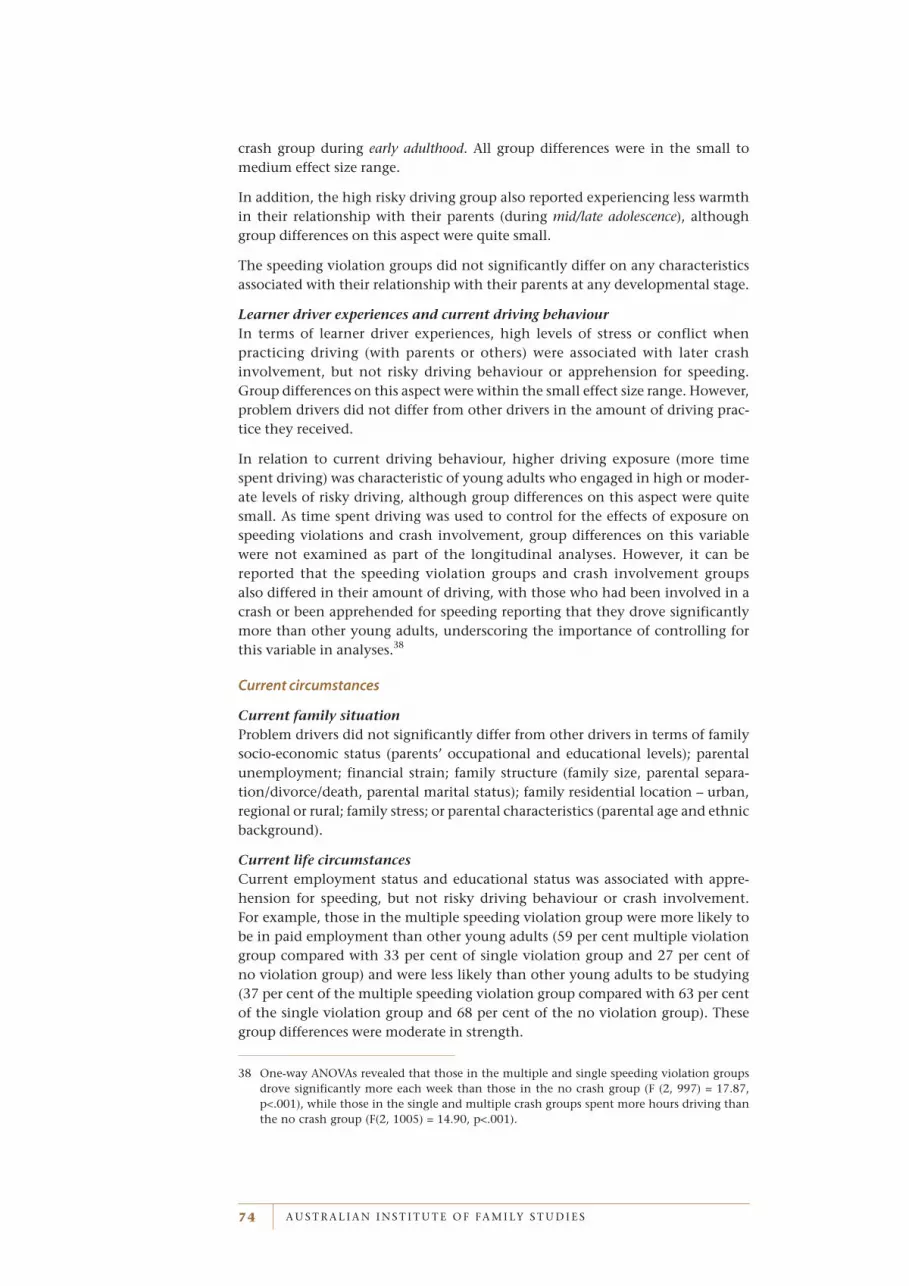
A U S T R A L I A N I N S T I T U T E O F F A M I LY S T U D I E S74
crash group during early adulthood. All group differences were in the small tomedium effect size range.
In addition, the high risky driving group also reported experiencing less warmthin their relationship with their parents (during mid/late adolescence), althoughgroup differences on this aspect were quite small.
The speeding violation groups did not significantly differ on any characteristicsassociated with their relationship with their parents at any developmental stage.
Learner driver experiences and current driving behaviourIn terms of learner driver experiences, high levels of stress or conflict when practicing driving (with parents or others) were associated with later crashinvolvement, but not risky driving behaviour or apprehension for speeding.Group differences on this aspect were within the small effect size range. However,problem drivers did not differ from other drivers in the amount of driving prac-tice they received.
In relation to current driving behaviour, higher driving exposure (more timespent driving) was characteristic of young adults who engaged in high or moder-ate levels of risky driving, although group differences on this aspect were quitesmall. As time spent driving was used to control for the effects of exposure onspeeding violations and crash involvement, group differences on this variablewere not examined as part of the longitudinal analyses. However, it can bereported that the speeding violation groups and crash involvement groups also differed in their amount of driving, with those who had been involved in acrash or been apprehended for speeding reporting that they drove significantlymore than other young adults, underscoring the importance of controlling forthis variable in analyses.38
Current circumstances
Current family situationProblem drivers did not significantly differ from other drivers in terms of familysocio-economic status (parents’ occupational and educational levels); parentalunemployment; financial strain; family structure (family size, parental separa-tion/divorce/death, parental marital status); family residential location – urban,regional or rural; family stress; or parental characteristics (parental age and ethnicbackground).
Current life circumstancesCurrent employment status and educational status was associated with appre-hension for speeding, but not risky driving behaviour or crash involvement. For example, those in the multiple speeding violation group were more likely tobe in paid employment than other young adults (59 per cent multiple violationgroup compared with 33 per cent of single violation group and 27 per cent of no violation group) and were less likely than other young adults to be studying(37 per cent of the multiple speeding violation group compared with 63 per centof the single violation group and 68 per cent of the no violation group). Thesegroup differences were moderate in strength.
38 One-way ANOVAs revealed that those in the multiple and single speeding violation groupsdrove significantly more each week than those in the no crash group (F (2, 997) = 17.87,p<.001), while those in the single and multiple crash groups spent more hours driving thanthe no crash group (F(2, 1005) = 14.90, p<.001).

I N T H E D R I V E R ’ S S E AT 75
However, young adults who engaged in illegal or unsafe driving behaviour did not differ from other drivers in their work histories (constant employment/someunemployment); their current living arrangements (with parents, away from par-ents), or their current involvement in a romantic relationship.
Summary of social and environmental precursors
Table 27 provides a summary of the precursors of each of the three problem driv-ing outcomes. A tick (✔) indicates that a particular social and environmentalcharacteristic or current life circumstance was found to be associated with a par-ticular driving outcome at a minimum of one timepoint, while a cross (✖)indicates that this characteristic was not associated with a particular outcome atany developmental stage.
As this Table shows, there was considerable variability in the type of environ-mental characteristics and aspects of young adults’ current lives that predicted the different driving outcomes. For example, while aspects relating to schoolexperiences predicted both risky driving and apprehension for speeding, characteristics associated with interpersonal relationships (with parents andpeers) were mainly associated with crash involvement and risky driving. Further-more, there were some characteristics that uniquely predicted the differentproblem driving outcomes (for example, high stress during driving practice predicted later crash involvement, while a tendency to be in paid employment,and not to be undertaking tertiary study, was associated only with speeding violations).
Multiple High risky Multiple speeding
Aspect driving crashes violations
School adjustment and achievement
More school adjustment problems ✔ ✖ ✔
Lower level of completed secondary education ✖ ✖ ✔
Peer relationships
Higher antisocial peer affiliations ✔ ✔ ✔
Poorer quality peer relationships ✔ ✖ ✖
Parent-child relationships
Poorer quality parent-child relationship ✔ ✖ ✖
Higher conflict in parent-child relationship ✖ ✔ ✖
Less warmth in parent-child relationship ✔ ✖ ✖
Learner driver experiences & current driving behaviour
Higher stress experienced when practising driving ✖ ✔ ✖
More time spent driving ✔ NA NA
Current circumstances
More likely to be in paid employment ✖ ✖ ✔
Less likely to be studying ✖ ✖ ✔
Table 27. Summary of environmental aspects and current life circumstances associated with different problem driving outcomes
Note: NA = not applicable. As time spent driving was used to control for the effects of exposure on speeding violationsand crash involvement, group differences on this variable were not examined.

SU
MM
AR
Y
A U S T R A L I A N I N S T I T U T E O F F A M I LY S T U D I E S76
Summary
Young adults in the high risky driving, multiple crash, and/or multiplespeeding violations groups differed from other drivers on a wide rangeof domains. For example, in comparison to other drivers they weregenerally found to:
be more aggressive and antisocial;
have a less persistent temperament style;
use more licit and illicit substances;
have more friendships with antisocial peers; and
have higher rates of police contact for driving offences.
In addition, those in the high risky driving and multiple speeding vio-lations group tended to:
be more hyperactive;
be less cooperative; and
experience more school adjustment difficulties, than other drivers.
Both the high risky driving and multiple crash groups also tended to:
use less adaptive, acting out coping strategies; and
experience more parent–child relationship difficulties thanothers.
While there was a considerable overlap between the predictors andcorrelates of risky driving, crash involvement and speeding viola-tions, the strength of these predictors varied between outcomes, asdid the timing in which group differences emerged. Group differ-ences tended to be more powerful, more consistent, and emergeearlier among the risky driving groups and the speeding violationgroups than the crash involvement groups.
There were also some individual attributes and environmentalcharacteristics that uniquely predicted particular problem drivingoutcomes. For example, high risky drivers also tended to be charac-terised by poorer quality peer relationships and lower levels ofresponsibility, empathy, and civic engagement, while those withwho had been involved in multiple crashes were generally more reac-tive (moody, volatile) and reported experiencing more stress andconflict when learning to drive than other drivers. Those with mul-tiple speeding violations, on the other hand, were generallycharacterised by higher levels of sociability, lower anxiety anddepression, higher rates of contact with the criminal justice system,higher rates of paid employment and lower levels of current andpast education.
These implications of these findings will be discussed later in Section 7.

I N T H E D R I V E R ’ S S E AT 77
Overlap in membership of the three most problematic
driving groups
As there were similarities between the correlates and precursors of the three prob-lem driving outcomes (high risky driving, multiple crash and multiple violation),the degree of overlap in these groups was examined to determine whether anoverlap in group composition might have influenced these findings. If the sameindividuals were found in the high risky driving, multiple violation and multiplecrash groups, then the similarity evident between the predictors of these threeoutcomes would not be surprising.
This examination found that the majority of problem drivers were from oneproblem driving group only. Thus, 70 per cent of the multiple crash group hadnot engaged in high levels of risky driving or been apprehended for speeding onmultiple occasions; 62 per cent of the speeding violation group reported high lev-els of this type of unsafe behaviour only; and 54 per cent of the high risky drivinggroup engaged only in high levels of risky driving. However, as Table 28 shows,there was some overlap between high risky driving and other problem drivingoutcomes. For example, a little under half (46 per cent) of the young drivers in thehigh risky driving group reported that they had been involved in multiple crashesand/or been apprehended on multiple occasions for speeding. Group overlap wasalso found for the multiple crash and multiple speeding violation groups,although the clear majority of participants in both groups did not report otherunsafe driving behaviours. Only a small number (n=6) belonged to all three prob-lematic driving groups.
Multiple High risky Multiple speeding
driving crashes violationsCombinations of outcomes n % n % n %
High on this outcome only 37 54.4 94 70.7 69 62.2
High risky driving & multiple speeding violations 14 20.6 -- -- 14 12.6
High risky driving & multiple crashes 11 16.2 11 8.3 -- --
Multiple speeding violations & multiple crashes -- -- 22 16.5 22 19.8
High on all 6 8.8 6 4.5 6 5.4
Table 28. Overlap between the problem driving groups
These findings offer a partial explanation for the similarity of the profiles of thehigh risky driving, multiple crash and multiple speeding violation groups, asthey suggest that, to a certain extent, the findings resulted from having some ofthe same young adults in each of the groups. However, it should be noted that themajority in the high risky driving, multiple crash and multiple speeding violationgroups did not exhibit other problem behaviours. Hence it is likely that other fac-tors, in addition to a possible common factor which the problem driving groupsshared, are primarily responsible for these findings.

Relat ionship between unsafe dr iving and other
problem behaviours
6

I N T H E D R I V E R ’ S S E AT 81
An important issue is taken up in this next section – namely, the degree to whichunsafe driving is associated with other types of problem behaviours. As outlined ear-lier, it has been suggested that many problem behaviours (such as antisocialbehaviour, substance use, other risk-taking behaviours) are related to each other,and may be caused by a common underlying trait or propensity for problem behav-iour. According to this view, certain forms of unsafe driving (such as risky driving)should not be viewed as isolated problems, but rather as manifestations of a broaderproblem behaviour syndrome (Crettenden and Drummond 1994; Jessor 1987; New-comb and McGee 1991; Swisher 1988; Williams 1998; Wilson and Jonah 1988).
If this theory is correct, then it would be expected that the pathways to theseforms of unsafe driving would be similar to those found for other types of prob-lems, such as antisocial behaviour and substance use. This would have importantintervention and prevention implications, as it would mean that appropriatelytargeted efforts could have a broad impact, reducing a range of problematicbehaviours. Nevertheless, without sound research evidence, a broad behavioursyndrome should not be assumed to account for unsafe driving behaviour.
In this section, the relationship between unsafe driving and other problem behav-iours is explored by: investigating the similarity between the precursors of unsafedriving and those of other problem behaviours (that is, antisocial behaviour andsubstance use); examining rates of problem behaviours among unsafe drivers;exploring the connections between problem behaviours in adolescence and laterunsafe driving behaviour in early adulthood; and determining whether there arespecific risk factors for different combinations of problem behaviours in adulthood.
For the purposes of this examination, levels of risky driving (low, moderate orhigh) are used to indicate unsafe driving. This variable was selected as it encom-passes a wide range of unsafe driving behaviours (speeding, failure to wear aseat-belt or helmet, driving when very tired or when under the influence of alco-hol or illicit drugs) and is positively associated with negative driving outcomes(crash involvement and speeding violations).
Substance use (alcohol and marijuana use) and antisocial behaviour are the otherproblem behaviours examined here. These variables were selected due to theirprevalence in this age group, the adverse effects they may have on an individual’slife, and their close association with one another, which suggests they may reflecta broader underlying syndrome (Jessor 1987; Newcomb and McGee 1991).
Overlap between the precursors of risky driving and other
problem behaviours
In order to examine the relationship between risky driving and other problembehaviours, the similarity between the longitudinal precursors of risky driving,antisocial behaviour and substance use was examined to see if similar personal
Relationship between unsafe driving and
other problem behaviours66 Relationship between unsafe driving and
other problem behaviours

A U S T R A L I A N I N S T I T U T E O F F A M I LY S T U D I E S82
and/or environmental characteristics predicted each type of outcome. For thepurposes of this comparison the precursors of high risky driving identified earlierin this report were used, while precursors of antisocial behaviour and substanceuse were drawn from previous Australian Temperament Project (ATP) research.
The precursors of adolescent antisocial behaviour were reported as part of the col-laborative project between the Australian Institute of Family Studies and CrimePrevention Victoria (see Vassallo et al. 2002 for further details).
In the first of a series of reports from this collaborative project,39 three distinct pat-terns of adolescent antisocial behaviour were identified using adolescents’ reports oftheir own antisocial behaviour between the ages of 13 and 18 years. The most prob-lematic of these was a “Persistent” pattern of adolescent antisocial behaviour, whichwas characterised by high levels of antisocial behaviour40 at multiple time pointsover adolescence. Individuals who engaged in Persistent adolescent antisocial behav-iour could be distinguished from those who consistently engaged in little or noantisocial behaviour over adolescence (a Low/non antisocial pattern) from as early asfive to six years of age. Group differences typically centred on individual character-istics (such as temperament style, externalising behaviour problems, social skills,coping styles and attraction to risk taking) as well as aspects of peer relationshipsand school adjustment. However, some family environment characteristics also dif-ferentiated the Persistent and Low/non antisocial groups. Group differences weregenerally to the disadvantage of the Persistent group.
The precursors of adolescent substance use are taken from a report commissioned bythe Ross Trust (Williams et al. 2000). As part of a series of in-depth analyses, ATP par-ticipants who engaged in multiple licit and/or illicit substance use41 duringmid-adolescence were compared to the remainder of the ATP sample on a widerange of characteristics, at each survey wave, to identify precursors for the adolescentmulti-substance use. These analyses revealed that adolescents who became multi-substance users could be differentiated from the rest of the sample from as early asinfancy. More specifically, multi-substance users generally had more problematicpersonal characteristics (such as a more “difficult” temperament style, higher aggres-sion and depression) and experienced poorer quality peer relationships than otheryoung people. They also tended to be more sociable and less fearful.
The risk factors identified for high risky driving, persistent adolescent antisocialbehaviour and multi-substance use are summarised in Table 29. As a guide tointerpreting this table, a “tick” (✔) indicates that a particular characteristic (activ-ity) was found to be a precursor of a specific outcome (persistent adolescentantisocial behaviour), while a cross (✖) indicates that this characteristic was notassociated with the outcome in question. For example, the temperament charac-teristic of “negative reactivity” was found to be a precursor of persistentadolescent antisocial behaviour but not high risky driving or multi-substance use.
39 The first two reports from this collaborative project can be accessed from AIFS website atwww.aifs.gov.au/atp/pubs or by phoning Crime Prevention Victoria on (03) 9651-6933. Athird report is to be released in 2005.
40 Three or more different antisocial acts in the past 12 months (or in the past month for illicitsubstance use).
41 Multi-substance use was defined by the presence of at least four of the following six criteria at15-16 years of age: (i) smoking tobacco on 3 or more occasions in the past month; (ii) drinkingalcohol on three or more occasions in the past month; (iii) drinking to intoxication on one ormore occasions in the past month; (iv) any marijuana use in the past month; (v) any substancesniffing; and (vi) any use of illicit drug such as heroin, cocaine, speed or designer drugs.

I N T H E D R I V E R ’ S S E AT 83
As Table 29 shows, there was considerable overlap in the precursors of high riskydriving, persistent adolescent antisocial behaviour and multi-substance use. Forexample, approximately one-fifth of the precursors listed in Table 29 predicted allthree outcomes. Common predictors were found in the domains of temperamentstyle (task persistence), behaviour problems (aggression, hyperactivity), school
Table 29. Overlap between the precursors of high risky driving behaviour, persistent adolescent antisocial behaviour and adolescent multi-substance use
Note: a risky driving = high risky driving behaviour at 19-20 years.b antisocial behaviour = persistent antisocial behaviour between the ages of 13 and 18 years.c substance use = multi-substance use at 15 to 16 years of age.
Precursors Risky Antisocial Substance driving
abehaviour
buse
c
Temperament/Personality
Task persistence ✔ ✔ ✔
Negative reactivity ✖ ✔ ✖
Activity ✖ ✔ ✔
Approach/withdrawal ✖ ✖ ✔
Behaviour Problems
Aggression ✔ ✔ ✔
Hyperactivity ✔ ✔ ✔
Anxiety ✖ ✔ ✖
Depression ✖ ✔ ✔
Social Competence
Assertiveness ✖ ✔ ✔
Cooperation ✔ ✔ ✖
Empathy ✔ ✔ ✖
Responsibility ✔ ✔ ✖
Self-control ✖ ✔ ✔
Other Individual Attributes
Civic mindedness/engagement ✔ ✔ ✖
Emotional control ✖ ✔ ✔
Sensation-seeking ✖ ✔ ✔
School Adjustment
School readiness at 5-6 yrs ✔ ✖ ✖
School difficulties in adolescence ✔ ✔ ✔
Parenting Practices
Supervision / Monitoring ✖ ✔ ✖
Harsh discipline ✖ ✔ ✔
Warmth of relationship ✔ ✔ ✖
Attachment to parents ✔ ✔ ✔
Parental Substance Use
Father's substance use ✖ ✔ ✔
Mother's Substance use ✖ ✔ ✔
Peer Relationships
Antisocial peer affiliations ✔ ✔ ✔
Participation in organised activities ✖ ✔ ✔
Attachment to peers ✖ ✔ ✔
Friendship quality ✔ ✖ ✔
Peer involvement ✖ ✖ ✔

SU
MM
AR
Y
A U S T R A L I A N I N S T I T U T E O F F A M I LY S T U D I E S84
adjustment (school adjustment difficulties), peer relationships (friendships withantisocial peers) and parent–child relationships (attachment to parents).
The highest degree of overlap was evident between the precursors of persistentadolescent antisocial behaviour and multi-substance use, which may in part bedue to the time period at which these variables were measured. Antisocial behav-iour and substance use were both measured during adolescence (13-18 years and15-16 years, respectively), whereas risky driving was measured later, when partic-ipants were aged 19-20 years. More than half (55 per cent) of the predictors listedwere common to both of the outcomes. However, there was also substantial over-lap between the precursors of high risky driving and persistent adolescentantisocial behaviour (38 per cent of precursors in common), and to a lesser extent,high risky driving and multi-substance use (24 per cent in common). Interest-ingly, school readiness in early childhood (how well a child adapts to thetransition to primary school) was the only characteristic that uniquely predictedhigh risky driving behaviour.
Fewer risk factors were identified for high risky driving than for persistent ado-lescent antisocial behaviour or multi-substance use. For example, whereas severaltemperament factors were identified as predictors of persistent adolescent antiso-cial behaviour and/or multi-substance use, only one temperament factor(persistence) was identified as a precursor of high risky driving. Similarly, morecharacteristics associated with interpersonal relationships (peer and parent–child)predicted persistent adolescent antisocial behaviour and/or multi-substance use,than high risky driving. However, as noted above, risky driving was measured ata later age than these other problem outcomes (early adulthood compared withadolescence), and the longer time span between risks and outcome for risky driv-ing, may have contributed to the fewer number of precursors identified.
Taken together, these findings offer partial support for Problem Behaviour Theory(Jessor and Jessor 1977; Jessor 1987), as they suggest that high risky driving, per-sistent adolescent antisocial behaviour and multi-substance use are somewhatinterrelated in terms of their precursors. However, it should be noted that highrisky driving did not share as many precursors with multi-substance use or per-sistent adolescent antisocial behaviour as these problem behaviours did witheach other; and the degree of overlap between the outcomes was not absolute.
Thus, these findings suggest that while some common factors may contribute tothe development of these three problem behaviours (particularly persistent anti-social behaviour and multi-substance use), it is likely that some unique attributesor factors also play a role in their etiology. Consequently, the precursors and cor-relates of high risky driving, persistent adolescent antisocial behaviour andmulti-substance use should not be assumed to be the same, and hence, need to beexamined separately from each other.
Summary
In summary, there was some overlap in the precursors of high riskydriving, persistent adolescent antisocial behaviour and multi-sub-stance use, with aspects of temperament style, behaviour problems,school adjustment, peer relationships and the parent–child relation-ship, predicting all three outcomes. The highest degree of overlap wasbetween the precursors of persistent adolescent antisocial behaviour

I N T H E D R I V E R ’ S S E AT 85
SU
MM
AR
Y
The co-occurrence of problem behaviours at 19-20 years
Connections between risky driving and other problem behaviours were next inves-tigated to determine whether individuals who engaged in high levels of riskydriving were also more often involved in substance use and antisocial behaviour.42
Substance use
Formation of groupsProblematic substance use was defined in terms of alcohol and marijuana use at 19-20 years of age, as there were insufficient numbers to investigate the use of other illicit substances such as ecstasy, amphetamines or heroin43. Participantscompleted questions about the number of days during the past month in which they had used alcohol or marijuana, as well as questions about harms associated with such use (for example, trouble at work, injury, violence, depend-ence). Further details of the measures used may be found in Appendix 2. Both types of information (pattern of daily use and harms associated with use) were used to form low, moderate and high “Alcohol Use” and “MarijuanaUse” groups.
The criteria used to select the groups, and the characteristics of the groups, aresummarised in Table 30. To investigate whether use of both types of substancesconveyed a heightened risk for risky driving, four groups with differing patternsof substance use were formed, using the criteria described in Table 30. Thesewere: no substance use, marijuana use only, alcohol use only, and use of both substances. The criteria used, and the characteristics of the groups, are summa-rized in Table 31.
42 For reader interest, the relationship between unsafe driving and anxiety and depression werealso examined. However, no significant relationships were found between risky driving andthese types of problems.
43 Only 84 individuals (7.3 per cent) reported the recent use of one or more of such substances.
and multi-substance use, although there was considerable overlapbetween the precursors of high risky driving and persistent adolescentantisocial behaviour, and to a lesser extent, high risky driving andmulti-substance use. Only one risk factor uniquely predicted highrisky driving (school readiness in mid childhood).
There were fewer risk factors for high risky driving than the otherproblem outcomes. This was particularly evident in the domains oftemperament style and interpersonal relationships. However, asrisky driving was measured later than antisocial behaviour and sub-stance use, it is possible that the longer time span between risks andoutcomes may have partly accounted for these findings.
While the findings were seen to partially support Problem BehaviourTheory (Jessor and Jessor 1977; Jessor 1987), given the differencesbetween the precursors of these outcomes, the need to also examineseparately the etiology of high risky driving, persistent adolescentantisocial behaviour and multi-substance use was highlighted.

A U S T R A L I A N I N S T I T U T E O F F A M I LY S T U D I E S86
FindingsIndividuals who engaged in high risky driving behaviour had significantly higherrates of alcohol44 and marijuana45 use than individuals whose driving pattern was lessrisky. Approximately 60 per cent of individuals in the moderate and high risky driv-ing groups were moderate or high alcohol users, compared with 44 per cent of thosein the low risky driving group (see Figure 28). In addition, while the great majorityof individuals in all three risky driving groups were no / low marijuana users (rang-ing from 77 to 94 per cent), there were higher rates of moderate and high marijuanause among individuals in the moderate and high risky driving groups (Figure 29).
Odds ratios can be used to assess the likelihood of a particular outcome (for exam-ple, high levels of substance use) occurring if a certain factor (in this case, high riskydriving) is present. The odds ratio is thus an estimate of the degree to which an indi-vidual who displays the risk factor under study is likely to display the other outcome,as compared to someone who does not display the risk factor46. With regards to high alcohol use, the odds ratios indicated that high risky drivers were twice as likelyas low risky drivers to be high alcohol users, while moderate risky drivers were 1.8times more likely to be high alcohol users than low risky drivers47. With regard to
% %Groups N sample male
Alcohol
No/Low - Use on less than 5 days in past month, no/low harms 474 50.6 36.3
Moderate - Use on 5-9 days in past month & low or moderate harms 218 23.4 45.6
High - Use on 10+ days & low to high harms 239 25.7 57.3
Marijuana
No/Low - Use on less than 5 days in past month, no harms 947 90.7 42.6
Moderate - Use on 5+ days in past month and no harms 36 3.4 47.2
High - Use on 5+ days in past month and some harms 61 5.8 62.3
Table 30. Definition and composition of alcohol and marijuana use groups at 19-20 years
Note: Some individuals were excluded from the alcohol use/harms and marijuana use/harms groups as they did not fitthe criteria developed (e.g. low use but reported harms; high use but no reported harms).
% %Groups N sample male
No - No / low alcohol and no/low marijuana use 424 49.1 36.1
Marijuana only - Moderate / high marijuana use; no /low alcohol use 19 2.2 36.8
Alcohol only - Moderate / high alcohol use; no / low marijuana use 355 41.4 50.1
Both - Moderate / high use of both substances 65 7.5 60.0
Table 31. Definition and composition of combined substance use groups at 19-20 years
44 χ2 (4) = 23.05; p <.001. 45 χ2 (4) = 28.19; p <.001. 46 The odds ratio obtained for a variable denotes the change in the odds of being in the outcome
group (for example, marijuana use) for each change in the level of that variable (for example,risky driving). An odds ratio of 1 represents no change in risk (odds are the same at any levelof the variable). Odds ratios significantly greater than 1 indicate an increased risk at increasedlevels of the variable, whilst odds ratios smaller than 1 indicate a decreased risk at higher levelsof the variable. For example, with regard to marijuana use, the odds ratios suggest that aspropensity to engage in risky driving increases, marijuana use increases.
47 Odds ratio for the comparison of high and low risky driving groups on high alcohol use OR =2.12, CI (1.18 - 3.79); and for the comparison of moderate and low risky driving groups OR =1.81, CI (1.30 - 2.52).

I N T H E D R I V E R ’ S S E AT 87
marijuana use, high risky drivers were four times more likely than low risky driversto engage in high levels of marijuana use, while moderate risky drivers were 2.6times more likely to be high marijuana users than low risky drivers 48.
Turning now to young adults’ use of both alcohol and marijuana49 (shown in Figure 30), more than half of the low risky driving group (56 per cent) wereno/low users of both substances, while in contrast around two-thirds of moderate(62 per cent) and high (69 per cent) risky drivers reported moderate or high use of alcohol, marijuana, or both substances. For example, approximately half the moderate and high risky drivers were alcohol users only, while almost 20 percent of high risky drivers used both alcohol and marijuana, double the rateamong moderate risky drivers (10 per cent) and four times the rate of low riskydrivers (5 per cent).
The odds ratios revealed that high and moderate risky drivers were almost twiceas likely as low risky drivers to be moderate/high alcohol users only50 (that is, notmoderate/high marijuana users as well). With regard to moderate/high use ofboth alcohol and marijuana, high risky drivers were more than six times morelikely than low risky drivers to have engaged in both types of substance use, whilemoderate risky drivers were 2.8 times more likely to have engaged in moder-ate/high use of both substances51. This finding suggests that use of both types ofsubstances was indeed more characteristic of the high risky driving group thanthe moderate and low risky driving groups. Due to the low numbers of individu-als who were high marijuana users only (N = 19 across all three driving groups),adds ratios for this type of substance use could not be reliably completed.
48 Odds ratio for the comparison of high and low risky driving groups on high marijuana use:OR=4.17, CI (1.77- 9.82); and for the comparison of moderate and low risky driving groups:OR = 2.60, CI (1.43-4.73).
49 χ2 (6) = 40.63; p <.001. 50 Odds ratio for the comparison of high and low risky driving groups on moderate/high alcohol
use but not moderate/high marijuana use OR = 2.12, CI (1.08 - 4.19); and for the comparisonof moderate and low risky driving groups on this outcome OR = 1.89, CI (1.36 - 2.62).
51 Odds ratio for the comparison of high and low risky driving groups on moderate/highalcohol use and moderate/high marijuana use OR = 6.71, CI (2.68 - 16.83); and for thecomparison of moderate and low risky driving groups OR = 2.77, CI (1.49 - 5.12).
0
10
20
30
40
50
60
70
80
90
100
High alcohol useModerate alcohol useNo/low alcohol use
Moderate risky driving
Low risky driving
High risky driving
Figure 28. Relationship between risky driving and alcohol use at 19-20 years
Pattern of alcohol use
Pro
po
rtio
n (
%)
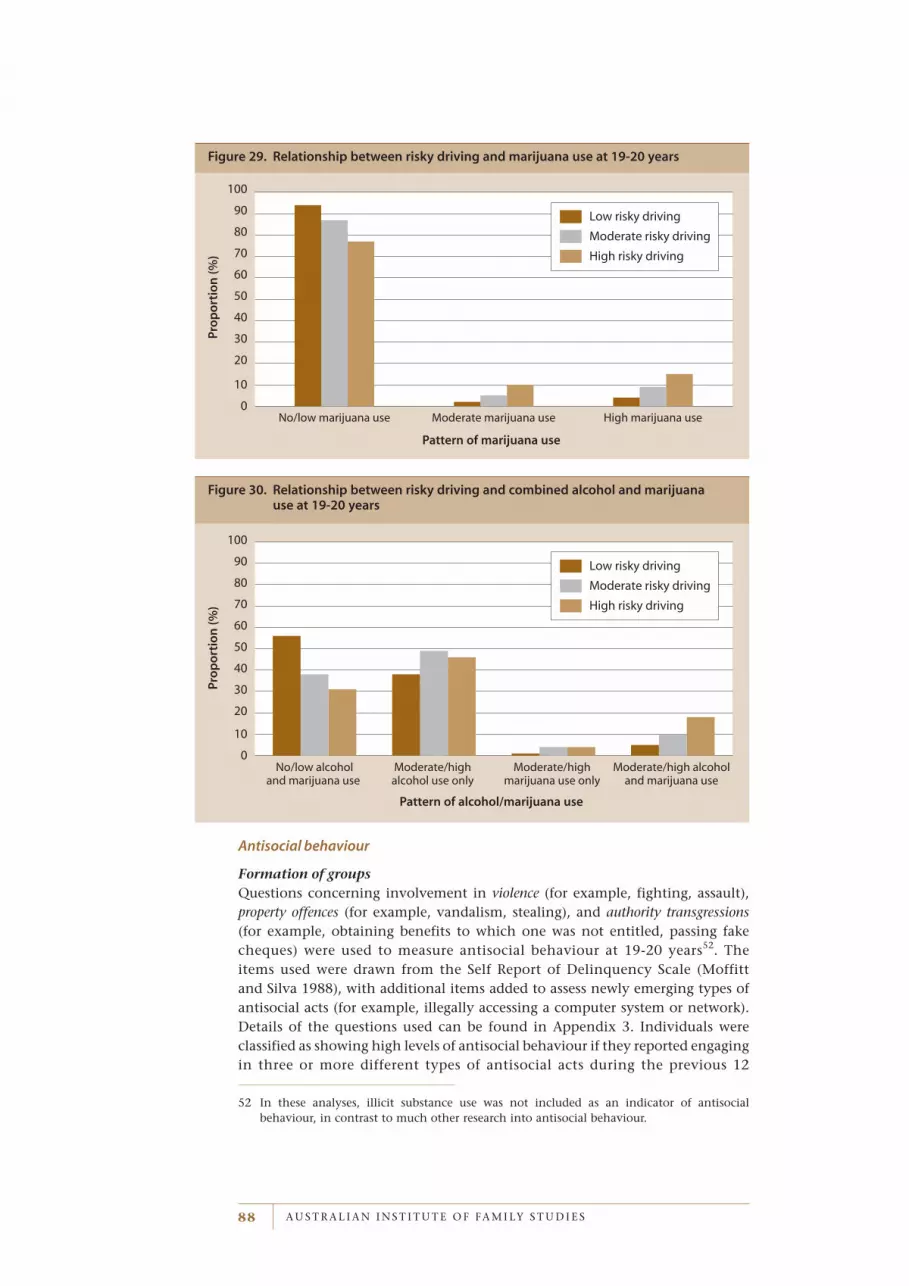
A U S T R A L I A N I N S T I T U T E O F F A M I LY S T U D I E S88
Antisocial behaviour
Formation of groupsQuestions concerning involvement in violence (for example, fighting, assault),property offences (for example, vandalism, stealing), and authority transgressions(for example, obtaining benefits to which one was not entitled, passing fakecheques) were used to measure antisocial behaviour at 19-20 years52. The items used were drawn from the Self Report of Delinquency Scale (Moffitt and Silva 1988), with additional items added to assess newly emerging types ofantisocial acts (for example, illegally accessing a computer system or network).Details of the questions used can be found in Appendix 3. Individuals were classified as showing high levels of antisocial behaviour if they reported engagingin three or more different types of antisocial acts during the previous 12
0
10
20
30
40
50
60
70
80
90
100
High marijuana useModerate marijuana useNo/low marijuana use
Moderate risky driving
Low risky driving
High risky driving
Figure 29. Relationship between risky driving and marijuana use at 19-20 years
Pattern of marijuana use
Pro
po
rtio
n (
%)
0
10
20
30
40
50
60
70
80
90
100
Moderate/high alcohol and marijuana use
Moderate/high marijuana use only
Moderate/high alcohol use only
No/low alcoholand marijuana use
Moderate risky driving
Low risky driving
High risky driving
Figure 30. Relationship between risky driving and combined alcohol and marijuana use at 19-20 years
Pattern of alcohol/marijuana use
Pro
po
rtio
n (
%)
52 In these analyses, illicit substance use was not included as an indicator of antisocialbehaviour, in contrast to much other research into antisocial behaviour.

SU
MM
AR
Y
I N T H E D R I V E R ’ S S E AT 89
months,53 while those who reported fewer than three different antisocial actswithin this time span were classified as showing low levels of antisocial behaviour.Using this criterion, two groups were formed, as described in Table 32.
Groups N % sample % male
Low/non antisocial 1022 89.8 41.0
High antisocial 116 10.2 71.6
Table 32. Definition and composition of antisocial behaviour groups at 19-20 years
53 The cutoff of three or more antisocial acts in the past year is consistent with the criteria forConduct Disorder in the Diagnostic and Statistical Manual of Mental Disorders (DSM-IV;American Psychiatric Association 1994).
54 Odds ratio for the comparison of high and low risky driving groups on antisocial behaviourOR = 9.63, CI (5.42-17.12); and for the comparison of moderate and low risky driving groupsOR=2.68, CI (1.69-4.25).
FindingsAntisocial behaviour was clearly associated with risky driving, as shown in Figure 31.Considerably more high risky drivers (36 per cent) had engaged in high levels ofantisocial behaviour, than moderate (14 per cent) and low (6 per cent) risky drivers.The association between high risky driving and high levels of antisocial behaviourappeared to be very powerful, with high risky drivers being found to be approxi-mately nine times more likely than low risky drivers to engage in high levels ofantisocial behaviour, according to the odds ratio analyses, and moderate risky driv-ers also at heightened likelihood of antisocial behaviour (odds ratio of 2.7)54.
0
10
20
30
40
50
60
70
80
90
100
High antisocialLow/non antisocial
Moderate risky driving
Low risky driving
High risky driving
Figure 31. Relationship between risky driving and antisocial behaviour at 19-20 years
Antisocial behaviour
Pro
po
rtio
n (
%)
Summary
In summary, these findings suggest that individuals who engage inhigh levels of risky driving behaviour also tend to exhibit higherlevels of other problem behaviours during early adulthood thanyoung people who engage in little or no risky driving behaviour. Forexample, about 70 per cent of high risky drivers reported moderate

SU
MM
AR
Y
A U S T R A L I A N I N S T I T U T E O F F A M I LY S T U D I E S90
or high use of alcohol, marijuana, or both substances (comparedwith 44 per cent of low risky drivers). More than one-third engagedin high levels of antisocial behaviour (compared with 14 per cent ofmoderate risky drivers only 6 per cent of low risky drivers).
While the majority of high risky drivers did not engage in mari-juana use or antisocial behaviour (although many engaged inmoderate or high alcohol use) rates of substance use and particu-larly antisocial behaviour were generally substantially higheramong the high risky driving group, as indicated by odds ratios.
Connections between problem behaviours in adolescenceand driving behaviour at 19-20 years
Connections between problem behaviours in adolescence and risky driving pat-terns in early adulthood were next investigated, to determine whether adolescentproblem behaviours were predictive of risky driving behaviours at 19-20 years.
Substance use
Formation of groupsTo investigate this question, groups of adolescents with differing across-time pat-terns of alcohol and marijuana use were identified55. First, patterns of alcohol andmarijuana use at each time point (13-14, 15-16 and 17-18 years) were examined andadolescents were classified as engaging in no/low56 or moderate/high57 substanceuse each time point. With regard to alcohol consumption, 6.8 per cent were classi-fied as moderate/high alcohol users at 13-14 years, 22.6 per cent at 15-16 years and38.1 per cent at 17-18 years. A total of 6.4 per cent were classified as marijuana usersat 13-14 years, 14.0 per cent at 15-16 years and 19.9 per cent at 17-18 years.
Second, patterns of use across the three time points were inspected to identify groupswith differing across-time trajectories of use. Based on adolescents’ reported levels ofalcohol and marijuana use at each time point, three groups were identified for eachsubstance type (alcohol, marijuana). These were: stable low – these individuals hadengaged in low/no use of the substance at all time points; experimental – these indi-viduals engaged in moderate or high use of the substance during early to midadolescence and then ceased this level of use; and stable high – these individualsengaged in moderate or high levels of use of the substance at two or more timepoints, including 17-18 years. Some individuals did not fit these across-time patternsand were therefore excluded. Further details relating to the formation of these groupsare available in Appendix 4. Table 33 summarises the characteristics of these groups.
55 Slightly different criteria were used to assess levels of substance use across the three adolescentsurvey waves (13-14 years, 15-16 years, and 17-18 years). The criteria were designed to takeinto account the normative increase in substance use that occurs across adolescence.
56 For alcohol, low/no use was defined as consumption of alcohol on 0-3 days in the past monthat the 13-14 and 15-16 year survey waves, and as consumption of alcohol on 0-4 days in thepast month at 17-18 years. For marijuana, low/no use was defined as no lifetime use at the 13-14 year survey wave; and as no use in the past month at the 15-16 and 17-18 year waves.
57 For alcohol, moderate/high use was defined as consumption of alcohol on 4 or more days inthe past month at 13-14 and 15-16 years, and as consumption of alcohol on 5 or more days inthe past month at 17-18 years. For marijuana, moderate/high use was defined as any lifetimeuse at 13-14 years; and as any use in the past month at the 15-16 and 17-18 years survey waves.

I N T H E D R I V E R ’ S S E AT 91
Connections between adolescent marijuana use and young adult risky drivingbehaviour were similar60, although less powerful and clear-cut (see Figure 33), per-haps because few adolescents were experimental or high marijuana users (as
Groups N % sample % male
Alcohol
Stable low/non 664 56.9 41.3
Experimental 69 5.9 40.6
Stable high 186 15.9 51.5
Marijuana
Stable low/non 831 71.2 44.3
Experimental 77 6.6 37.7
Stable high 83 7.1 49.4
Table 33. Characteristics of adolescent substance use groups
FindingsAdolescent alcohol use was significantly related to later risky driving behaviour58.Young people who reported high levels of risky driving behaviour were morelikely to have engaged in “stable high” levels of alcohol use during adolescence(35 per cent) than those whose driving pattern was less risky (26 per cent of mod-erate risky drivers and 17 per cent of low risk drivers), as can be seen in Figure 32.Additionally, fewer high risky drivers engaged in “stable low” levels of alcohol useduring adolescence. Nevertheless, the majority of risky drivers (about two-thirds)had not been moderate/high users of alcohol over adolescence. The odds ratiosindicated that high risky drivers were almost three times more likely to haveengaged in stable high alcohol use over adolescence than low risky drivers, whilemoderate risky drivers were almost twice as likely to have done so59.
58 χ2 (4) = 14.78; p <.05.59 Odds ratio for the comparison of high and low risky driving groups on stable high alcohol
use over adolescence: OR= 2.70, CI (1.38-5.29, and for the comparison of moderate and lowrisky driving groups OR = 1.80, CI (1.21-2.68.
60 χ2 (4) = 29.49; p <.001.
0
10
20
30
40
50
60
70
80
90
100
Stable highExperimentalStable low/non
Moderate risky driving
Low risky driving
High risky driving
Figure 32. Relationship between adolescent alcohol use and risky driving at 19-20 years
Pattern of adolescent alcohol use
Pro
po
rtio
n (
%)

A U S T R A L I A N I N S T I T U T E O F F A M I LY S T U D I E S92
shown in Table 33). Only about one-third of high risky drivers had used mari-juana during adolescence. While high risky drivers were more likely to reportsome marijuana use during adolescence this use tended to be “experimental” (tohave ceased by late adolescence) rather than stable. The low risky driving grouphad the lowest rates of adolescent marijuana use, with only 12 per cent of thisgroup engaging in experimental or stable high marijuana use, compared with 19per cent of moderate risky drivers and 37 per cent of high risky drivers. The oddsratios indicated that both high and moderate risky drivers were about twice aslikely as low risky drivers to have engaged in stable high marijuana use over ado-lescence than low risky drivers61.
0
10
20
30
40
50
60
70
80
90
100
Stable highExperimentalStable low/non
Moderate risky driving
Low risky driving
High risky driving
Figure 33. Relationship between adolescent marijuana use and risky driving at 19-20 years
Pattern of adolescent marijuana use
Pro
po
rtio
n (
%)
61 Odds ratio for the comparison of high and low risky driving groups on stable high marijuanause over adolescence: OR=2.47, (CI 0.96-6.32), and for the comparison of moderate and lowrisky driving groups OR=2.01, CI (1.15-3.53).
62 Some individuals did not fit these across-time criteria, and were therefore excluded.
Antisocial behaviour
Formation of groupsGroups of adolescents with differing across-time patterns of antisocial behaviourhave previously been identified in ATP research (see Vassallo et al. 2002). Using acriterion of engagement in three or more different types of antisocial behaviour(such as property offences, violence, authority transgressions, or the sale or use ofillegal drugs) within the previous 12 months to indicate high levels of antisocialbehaviour, individuals were classified as highly antisocial or low/non antisocial,at three separate time points – early adolescence (13-14 years), mid adolescence(15-16 years) and late adolescence (17-18 years). Twelve per cent of adolescentswere classified as highly antisocial at 13-14 years, 20 per cent at 15-16 years, and20 per cent at 17-18 years.
Across-time patterns of antisocial behaviour were then mapped, leading to theformation of the following three groups:62 low/non antisocial – these individualsdisplayed low/no antisocial behaviour at all time points; experimental – theseindividuals exhibited high antisocial behaviour during early to mid adolescence
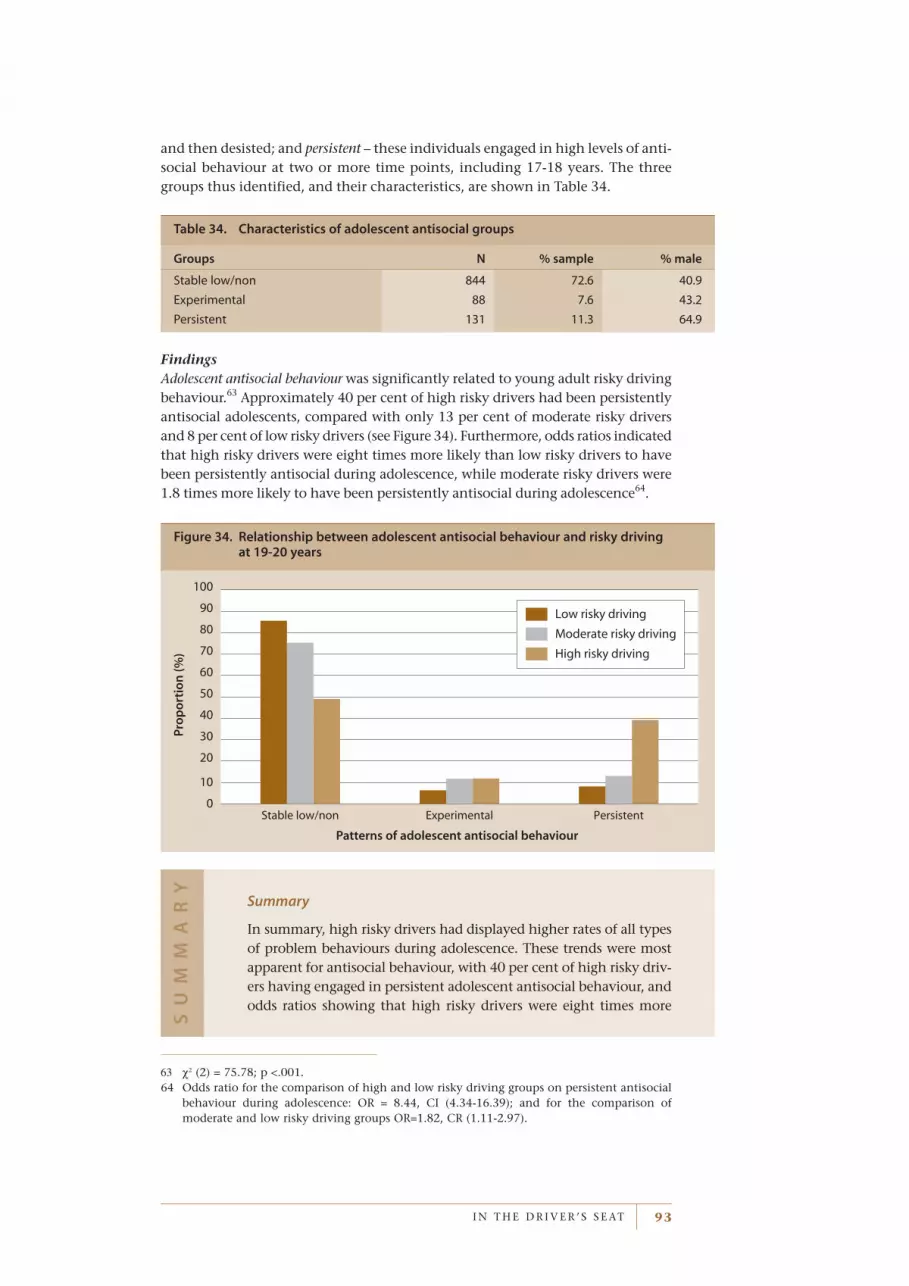
SU
MM
AR
Y
I N T H E D R I V E R ’ S S E AT 93
and then desisted; and persistent – these individuals engaged in high levels of anti-social behaviour at two or more time points, including 17-18 years. The threegroups thus identified, and their characteristics, are shown in Table 34.
0
10
20
30
40
50
60
70
80
90
100
PersistentExperimentalStable low/non
Moderate risky driving
Low risky driving
High risky driving
Figure 34. Relationship between adolescent antisocial behaviour and risky driving at 19-20 years
Patterns of adolescent antisocial behaviour
Pro
po
rtio
n (
%)
FindingsAdolescent antisocial behaviour was significantly related to young adult risky drivingbehaviour.63 Approximately 40 per cent of high risky drivers had been persistentlyantisocial adolescents, compared with only 13 per cent of moderate risky driversand 8 per cent of low risky drivers (see Figure 34). Furthermore, odds ratios indicatedthat high risky drivers were eight times more likely than low risky drivers to havebeen persistently antisocial during adolescence, while moderate risky drivers were1.8 times more likely to have been persistently antisocial during adolescence64.
Groups N % sample % male
Stable low/non 844 72.6 40.9
Experimental 88 7.6 43.2
Persistent 131 11.3 64.9
Table 34. Characteristics of adolescent antisocial groups
63 χ2 (2) = 75.78; p <.001. 64 Odds ratio for the comparison of high and low risky driving groups on persistent antisocial
behaviour during adolescence: OR = 8.44, CI (4.34-16.39); and for the comparison ofmoderate and low risky driving groups OR=1.82, CR (1.11-2.97).
Summary
In summary, high risky drivers had displayed higher rates of all typesof problem behaviours during adolescence. These trends were mostapparent for antisocial behaviour, with 40 per cent of high risky driv-ers having engaged in persistent adolescent antisocial behaviour, andodds ratios showing that high risky drivers were eight times more

SU
MM
AR
Y
A U S T R A L I A N I N S T I T U T E O F F A M I LY S T U D I E S94
likely to have been persistently antisocial adolescents than low riskydrivers. High risky drivers had also more frequently consumed alcoholat moderate or high levels throughout adolescence, with one-third ofhigh risky drivers having been consistently moderate/high alcoholusers compared with 26 per cent of moderate risky drivers and 17 percent of low risky drivers. High risky drivers were also significantlymore likely to have used marijuana during adolescence, but this trendwas less powerful, perhaps because few adolescents overall wereinvolved in marijuana use. High risky drivers tended to engage inexperimental rather than consistently high marijuana use.
These findings suggest that adolescent problem behaviours werepowerful risks for later risky driving behaviour. Nevertheless, itshould also be noted that many risky drivers had not engaged inproblem behaviours during adolescence.
Profile of risks of single-problem and multiple-problem groups
The final issue addressed was whether distinct risk factors could be identified forgroups with differing patterns of problem behaviours. To investigate this issue, sin-gle and multi-problem groups were identified, based upon participants’ self reportsat 19-20 years.
Three types of analyses were conducted in order to identify the correlates of differ-ent combinations of problem behaviours. Single and multi-problem groups werecompared on aspects of personal functioning, relationships with parents and peers,current life circumstances, and attitudes and values, all measured at 19-20 years.
The first set of analyses compared three groups: a high risky driving group whowere not high users of alcohol, a high alcohol use group who were not high riskydrivers, and a dual problem group who were both high risky drivers and high alco-hol users. The second set of analyses also involved three groups: a high riskydriving group who were not high marijuana users, a high marijuana use groupwho were not risky drivers, and a dual problem group who were high risky driv-ers and high marijuana users. Similarly, three groups were used for the third set ofanalyses: a high risky driving group who were not highly antisocial, a high anti-social group who were not high risky drivers, and a dual problem group who wereboth high risky drivers and highly antisocial. Thus, three different high risky driv-ing only and dual problem groups were used in these analyses.
As the number of individuals who met the criteria for some groups was quite small,these findings should be viewed as exploratory only, and interpreted with caution.
Correlates of risky driving and alcohol use
“High risky driving only” (n=36), “high alcohol use only” (n=199), and “dualproblem” (high risky driving and high alcohol use) groups (n=20) were comparedto identify correlates of these patterns on problem behaviours at 19-20 years.Table 35 summarises the significant findings from this analysis.
A consistent trend emerging from these analyses was the higher rate of emotionalproblems (depression, stress, shy (unsociable) temperament, low assertiveness)among the high risky driving only group, particularly in comparison with the

I N T H E D R I V E R ’ S S E AT 95
high alcohol use only group. These findings do not necessarily mean that thehigh risky driving only group was highly problematic on these aspects (that is,that they were clinically depressed), just that they scored higher on these emo-tional problems than the groups to which they were compared.
The high alcohol use only group, on the other hand, tended to report less confi-dence in the police than the high risky driving only group. They also tended toparticipate in civic activities more than the high risky driving only group,although rates of civic engagement among all three groups were low.
Interestingly, only one significant difference was found between the dual problemgroup and the single problem groups: individuals who exhibited high levels ofboth risky driving and alcohol use tended to have more disagreements with par-ents than the high alcohol use only group. Hence, the dual problem group did notsignificantly differ from the single problem groups on any aspects of their per-sonal functioning, their peer relationships, their life circumstances or their attitudesand values, during early adulthood.
While the comparisons of the high risky driving only group with the dual problemgroup did not reach significance (perhaps partly due to the lower power associatedwith the small size of these groups), the gap between these groups was often almost aslarge as found when comparing the high risky driving only group and the high alco-hol use only group. In other words, the dual problem group was similar to the highalcohol use only group on many characteristics.
Correlates of risky driving and marijuana use
Few significant differences were found when comparing the “high risky drivingonly” (n=53), “high marijuana use only” (n=46), and the high risky driving and
Table 35. Significant differences between the high risky driving only (n=36), high alcohol use only (n=199), and dual problem (high risky driving and high alcohol use) (n=20) groups at 19-20 years
*** p <.001 * p<.05
Domain F Group differences
Temperament styleSociability 7.57*** Risky driving only group less sociable than
Alcohol only group
Behavioural and emotional problemsDepression 8.53*** Risky driving only group more depressed than
Alcohol only group
Stress 7.05*** Risky driving only group more stressed than Alcohol only group
Social skillsAssertiveness 4.18* Risky driving only group less assertive than
Alcohol only group
Other individual characteristicsCivic engagement 4.19* Alcohol only group more civic engagement
than Risky driving only group
Confidence in the police 4.60* Alcohol only group less confidence in the police than Risky driving only group
Life satisfaction 4.04* No two groups significantly differed
Parent-young adult relationshipConflict in the relationship 3.18* Dual Problem group more conflictual
relationship than Alcohol only group
Parents' emotional support 3.25* No two groups significantly differed
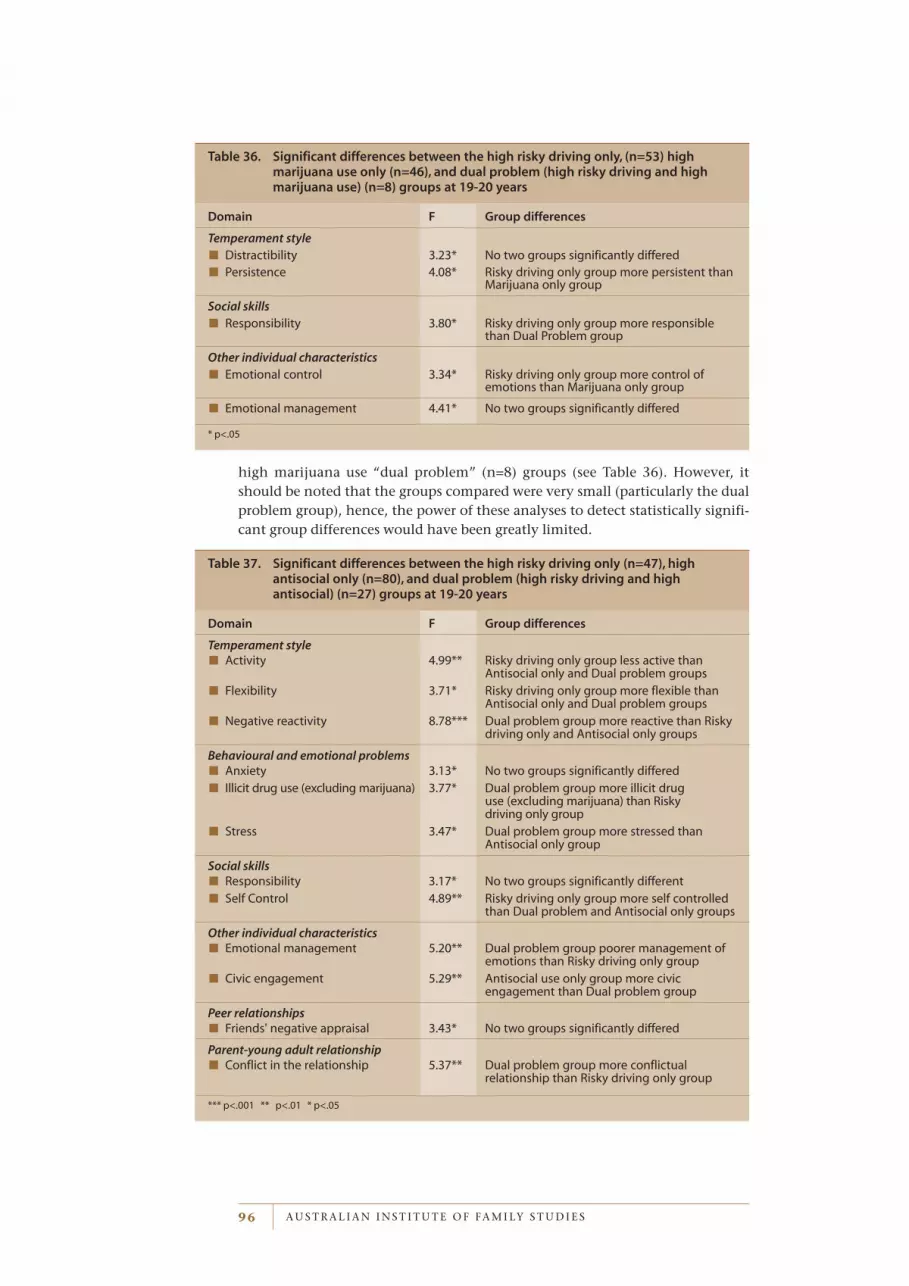
A U S T R A L I A N I N S T I T U T E O F F A M I LY S T U D I E S96
high marijuana use “dual problem” (n=8) groups (see Table 36). However, itshould be noted that the groups compared were very small (particularly the dualproblem group), hence, the power of these analyses to detect statistically signifi-cant group differences would have been greatly limited.
Table 36. Significant differences between the high risky driving only, (n=53) high marijuana use only (n=46), and dual problem (high risky driving and high marijuana use) (n=8) groups at 19-20 years
* p<.05
Domain F Group differences
Temperament style
Distractibility 3.23* No two groups significantly differed
Persistence 4.08* Risky driving only group more persistent than Marijuana only group
Social skills
Responsibility 3.80* Risky driving only group more responsible than Dual Problem group
Other individual characteristics
Emotional control 3.34* Risky driving only group more control of emotions than Marijuana only group
Emotional management 4.41* No two groups significantly differed
Table 37. Significant differences between the high risky driving only (n=47), high antisocial only (n=80), and dual problem (high risky driving and high antisocial) (n=27) groups at 19-20 years
*** p<.001 ** p<.01 * p<.05
Domain F Group differences
Temperament styleActivity 4.99** Risky driving only group less active than
Antisocial only and Dual problem groups
Flexibility 3.71* Risky driving only group more flexible than Antisocial only and Dual problem groups
Negative reactivity 8.78*** Dual problem group more reactive than Risky driving only and Antisocial only groups
Behavioural and emotional problemsAnxiety 3.13* No two groups significantly differed
Illicit drug use (excluding marijuana) 3.77* Dual problem group more illicit drug use (excluding marijuana) than Risky driving only group
Stress 3.47* Dual problem group more stressed than Antisocial only group
Social skillsResponsibility 3.17* No two groups significantly different
Self Control 4.89** Risky driving only group more self controlled than Dual problem and Antisocial only groups
Other individual characteristicsEmotional management 5.20** Dual problem group poorer management of
emotions than Risky driving only group
Civic engagement 5.29** Antisocial use only group more civic engagement than Dual problem group
Peer relationshipsFriends' negative appraisal 3.43* No two groups significantly differed
Parent-young adult relationshipConflict in the relationship 5.37** Dual problem group more conflictual
relationship than Risky driving only group

SU
MM
AR
Y
I N T H E D R I V E R ’ S S E AT 97
Those differences that were found pointed to greater difficulties on emotionalcontrol and persistence among the high marijuana use only group than the highrisky driving only group. The dual problem group (high risky driving and highmarijuana use), on the other hand, tended to be less responsible than the highrisky driving only group.
Correlates of risky driving and antisocial behaviour
A number of significant group differences were found when comparing the “highrisky driving only” (n=47), the “high antisocial only” (n=80), and the “dual prob-lem” high risky driving and high antisocial (n=27) groups. These are shown inTable 37.
Group comparisons consistently indicated greater difficulties among the dualproblem (high risky driving and high antisocial) group than the single problemgroups, especially the high risky driving only group. More specifically, the dualproblem group displayed a more difficult temperament style, tended to havelower social skills, had considerably higher rates of illicit drug use, had more disagreements with parents, and were less involved in civic activities than indi-viduals who only engaged in high levels of risky driving or antisocial behaviour.Hence, young adults who displayed a pattern of high antisocial behaviour andhigh risky driving appeared to experience substantially more difficulties thanthose who engaged in high risky driving behaviour alone.
Summary
These exploratory analyses revealed several significant differencesbetween dual problem groups and single problem groups. For exam-ple, young people who engaged in high risky driving and alcohol usetended to have more disagreements with parents than those whoonly reported a single problem behaviour, while those who engagedin high risky driving and marijuana use were less responsible thanthose who only engaged in high risky driving.
However, the most extensive differences were between young peo-ple who engaged in both high risky driving and high antisocialbehaviour and their counterparts who reported only one of thesebehaviours. Thus, the high risky driving and high antisocial behaviourgroup tended to display a more difficult temperament style, possesslower social skills, experience more conflict with parents, and par-ticipate less in civic endeavours than those who reported a singleproblem behaviour (particularly those who only engaged in highlevels of risky driving). Interestingly, the high risky driving but noalcohol use group tended to report more emotional problems thanthe high alcohol use only and high risky driving and alcohol use groups.These findings suggest that there is substantial variability amongindividuals who engage in high risky driving. However, perhaps notsurprisingly, high risky drivers who also engage in high levels ofantisocial behaviour, high alcohol use or high marijuana use tend toexperience more difficulties overall than those who engage in onlyone of these behaviours.

SU
MM
AR
Y Nevertheless, while a number of group differences were found,there were many aspects on which the single and dual problemgroups did not significantly differ. Thus, it seemed that there wereconsiderable similarities between the single and multiple problemgroups as well, and that they shared many risk factors. However,these findings should be viewed cautiously and as exploratory only,because the small group sizes employed limited the study’s power todetect group differences.
A U S T R A L I A N I N S T I T U T E O F F A M I LY S T U D I E S98

Discuss ion of f indings and implicat ions
7

Discussion of findings and implications77 Discussion of findings and implications
I N T H E D R I V E R ’ S S E AT 101
This report, a product of the collaboration between the Australian institute ofFamily Studies, the Royal Automobile Club of Victoria and the Transport AccidentCommission of Victoria, has examined patterns and precursors of different typesof driving behaviour among a large sample of Victorian young adults (aged 19-20years) participating in the longitudinal Australian Temperament Project (ATP).More specifically, it has examined young people’s learner driver experiences andcurrent driving behaviour, as well as identifying individual attributes and envi-ronmental characteristics in their past or present lives that may have contributedto current driving outcomes (that is, level of risky driving behaviour, crashinvolvement, and number of speeding violations).
While acknowledging the important role of situational factors (such as traffic con-ditions, time-of-day), structural factors (such as road design, road conditions) andcommunity factors (such as norms/laws regarding driving behaviour, enforce-ment of road laws) on driving behaviour, this report focused primarily onindividual and social factors.
A summary of the findings emerging from this research is provided below to pro-vide a framework for discussion later in this section.
Experiences when learning to drive and subsequent
driving behaviour
In the latest ATP data collection wave in 2002, 19-20 year old young adults andtheir parents completed questions relevant to road safety. These included ques-tions about licensing, experiences as a learner, driving exposure, crash andenforcement experiences, and self-reported behaviours in relation to speeding,seat-belt use, fatigue, and drug and alcohol use.
Most young people (86 per cent) had obtained a car licence by 19-20 years of age.The majority of these individuals appeared to have obtained frequent practicewhen learning to drive, with four out of five reporting that they practised drivingon at least a weekly basis. Parents predominantly provided this practice. Whilepractising with parents involved some stress and conflict for most young adults,driving practice with others was generally stress-free. There was considerablediversity in the number of professional driving lessons undertaken by youngadults; however, most commonly it was between one and five.
Regarding young adults’ current pattern of driving, most driving was reported totake place during the week in daylight hours. Over 40 per cent had been involvedin a crash while driving a car or motorcycle. Two-thirds of these crashes occurredwhen young people were driving alone, and most resulted in property damage.Approximately 30 per cent had been apprehended for speeding. Additionally,speeding was one of the most common unsafe driving behaviours reported by

A U S T R A L I A N I N S T I T U T E O F F A M I LY S T U D I E S102
participants, with over 80 per cent having driven up to 10 km/h above the limitat least once during their past ten trips. Driving while very tired was also relativelycommon.
The learner driver experiences of young men and women differed. On average,young women reported taking more professional driving lessons, practising driv-ing more frequently with people other than their parents, and experiencing morestress when practising with their parents than did young men. Similarly, therewere differences between young men and women in their current driving behav-iours, with young men reporting higher rates of unsafe driving behaviours(particularly speeding, driving when affected by alcohol, and failure to wear aseatbelt or helmet) than young women.
The type of locality in which young people lived (metropolitan, regional or rural)had little impact on driving experiences. The only significant differences emergedon aspects of: learner driver experiences (young adults in metropolitan areastended to undertake more professional driving lessons, while those in regionalareas practised driving less frequently); crash involvement (young adults in met-ropolitan localities were more likely to have been involved in a crash); and unsafedriving behaviour (young adults in regional centres were more likely to drivewhen affected by alcohol, while those in rural areas were less likely to wear a seat-belt or helmet).
Precursors and correlates of risky driving behaviour, crash
involvement and speeding violations
An important goal of the research was to identify characteristics which differen-tiated safe from risky drivers. To do this, young adults were divided into separategroups on the basis of three types of driving-related behaviours or outcomes: levelof self-reported risky driving behaviour (low, moderate or high risky driving); thenumber of crashes they had been involved in (no, single, or multiple crashes); andthe number of times they had been apprehended for speeding by police (no, sin-gle or multiple speeding violations). The correlates and precursors of each ofthese problematic driving outcomes were then examined.
The analyses showed a number of differences between groups. In general, prob-lematic drivers (that is, those who engaged in high levels of risky driving, hadbeen involved in multiple crashes or been caught speeding on multiple occasions)tended to have a less persistent temperament style, displayed higher levels ofaggression and hyperactivity, more frequently engaged in antisocial activities,and used more licit and illicit substances. Unsurprisingly, problematic driverstended to report more police contact for driving-related offences. They alsotended to have experienced more school adjustment difficulties earlier in life andhad more frequently formed friendships with antisocial peers than less problem-atic drivers.
The three types of driving-related behaviours examined here (risky driving, crashinvolvement, and speeding violations) overlapped considerably in terms of pre-dictors and precursors, but the strength of predictors varied across the outcomes,as did the timing at which group differences emerged. Group differences tendedto be more powerful, more consistent, and to emerge earlier (mid- to late-child-hood compared with mid/late adolescence) among the risky driving and speedingviolation groups than the crash involvement groups. There were also some

I N T H E D R I V E R ’ S S E AT 103
individual attributes and environmental characteristics that were uniquely asso-ciated with each driving outcome.
Of course, risky driving, crash involvement, and detection for speeding areunlikely to be independent. In fact, an examination of the degree of overlapbetween the three group types revealed that close to half (46 per cent) of theyoung adults in the high risky driving group had also been involved in multiplecrashes or been apprehended for speeding on multiple occasions. Overlap wasalso evident among members of the multiple crash and multiple speeding viola-tion groups. Some of the similarity in the profiles of these groups may haveresulted from some overlap in their membership. Nevertheless, it is important tonote that the majority of young adults in these groups displayed only one of thesetypes of problem driving behaviour. Hence it is likely that other factors also con-tributed substantially to the group profiles.
Relationship between unsafe driving behaviour and other
problem behaviours
Another important question was whether risky driving occurred in conjunctionwith other problematic behaviour. The relationship between unsafe driving (asmeasured by risky driving), substance use, and antisocial behaviour was thereforeexamined to determine whether these problem behaviours were interrelated.
First, the similarity between the risk factors for risky driving, antisocial behaviourand multi-substance use was examined, to see if similar personal and/or environ-mental characteristics predicted each of these outcomes. These comparisonsrevealed some overlap in the risk factors, with temperament style, behaviourproblems, school adjustment, and characteristics of peer and parent–child rela-tionships predicting all three outcomes. The highest degree of overlap was evidentbetween the precursors of persistent adolescent antisocial behaviour and multi-substance use (with 55 per cent of precursors in common). However, there wasalso substantial overlap between the precursors of high risky driving and persist-ent adolescent antisocial behaviour (38 per cent in common), and to a lesserextent, high risky driving and multi-substance use (24 per cent in common). Onlyone characteristic – school readiness (how well a child adapts to the transition toprimary school) – uniquely predicted high risky driving behaviour.
Fewer risk factors were identified for high risky driving than for adolescent anti-social behaviour or multi-substance use. This was particularly evident in thedomains of temperament style and interpersonal relationships (peer and par-ent–child). However, risky driving was measured at a later age than these otherproblem outcomes. Thus, the longer time span between risks and outcomes mayhave diminished these associations.
Second, the co-occurrence of these problem behaviours was examined. Youngadults who engaged in high levels of risky driving behaviours in early adulthoodalso tended to exhibit higher levels of antisocial behaviour and substance use(alcohol, marijuana, or use of both substances) during early adulthood, than lessrisky drivers. Furthermore, looking back in time, high risky drivers had displayedhigher levels of all these problem behaviours during adolescence. These trendswere particularly marked for antisocial behaviour (40 per cent had engaged in per-sistent antisocial behaviour during adolescence) and for alcohol use (one-third ofhigh risky drivers had been consistently high alcohol users). Nevertheless, it

A U S T R A L I A N I N S T I T U T E O F F A M I LY S T U D I E S104
should be noted that there was a sizeable number of high risky drivers who didnot engage in substance use or antisocial behaviour during adolescence and/orearly adulthood.
A further issue addressed was whether common or distinct risk factors could beidentified for young people who engaged in only one type of problem behaviourby comparison with those who engaged in more than one of the problem behav-iours, although small group sizes limited the power of these comparisons. Severalsignificant differences were found between those who engaged in high risky driv-ing only, and those who also engaged in other problem behaviours. There werealso numerous similarities between the single and multiple problem groups, withmany of the same risk factors in common. Given the small group sizes, these find-ings should be seen as exploratory only, and viewed cautiously.
Conclusions and implications
Taken together, these findings provide valuable insights into the development of“normal” and “problematic” driving behaviours, which in turn have importantimplications for prevention and intervention strategies aimed at reducing unsafedriving behaviour.
The learner driver experience
Although there was considerable diversity in the number of professional drivinglessons undertaken by young people, most (about 80 per cent) reported practisingdriving on a regular basis (that is, weekly or more often), and usually with parents.This suggests that both parents and young adults are heeding the message com-municated by road safety authorities, which recommends novice drivers gainextensive driving experience before attaining their licence. As mentioned previ-ously, research suggests that young drivers who gain high levels of supervisedexperience prior to attaining their licence are at lower risk of being involved in acrash than less experienced drivers (Engström et al. 2003).
Nevertheless, while levels of driving practice were high overall, there was a ten-dency for young adults living in regional areas to report less frequent drivingpractice than those living in other areas. Furthermore, rural and regional partici-pants reported undertaking fewer driving lessons with a professional instructorthan those living in metropolitan areas. While it is beyond the capacity of thisstudy to explain this pattern of findings, it is likely that lower access to profes-sional driving instruction in rural and regional areas and fewer suitable practiceopportunities may have contributed to these findings (see Harrison and Seymour2003). If this is true, further efforts may be needed to ensure that learner driversliving in regional or rural areas are provided with sufficient opportunities toacquire and practise driving skills. Further research examining the learner experi-ences of young people living in rural, regional and metropolitan areas may beneeded to better understand these differences.
It should also be noted that while young people generally rated driving practicewith persons other than their parents as a stress-free experience, most youngadults (especially women) and their parents reported experiencing some stress orconflict during their practice sessions together. While we do not know whetherthe level of stress experienced was sufficient to have had a negative effect onyoung adults or parents, or to have lessened the effectiveness of the practice ses-sions, strategies aimed at reducing the stressful nature of this experience (for

I N T H E D R I V E R ’ S S E AT 105
example, providing parents with information or training on how to assist learnerdrivers) may be beneficial. Road safety authorities have a range of materials andprograms available that could assist parents with this process.65 Nevertheless,there may be some circumstances in which practising driving with parents maynot be ideal (for example, if there is a high degree of conflict in the parent–youngadult relationship, or if parents find practice sessions provoke anxiety). In thesecircumstances, it may be preferable to involve other licensed drivers (such astrusted friends or relatives) in this role.
Many exhibit some degree of unsafe driving behaviour
Consistent with previous research (see, for example, Cavallo and Triggs 1996;Clarke et al. 2002; Engström et al. 2003; Williams 1998), the findings of the ATPYoung Drivers Study suggest that some level of unsafe driving behaviour is rela-tively common, particularly for young males. The most common forms of unsafedriving reported were speeding and driving when very tired. Driving up to10km/h above the speed limit was particularly common (with 84 per cent of thesample reporting that they had done so at least once in their past ten trips). Ofparticular concern was the finding that approximately two-thirds of the samplereported driving when fatigued.
Speeding, driving when fatigued and driving when affected by alcohol are allstrong risk factors for crash involvement (Clarke et al. 2002; Engström et al.2003), while failure to wear a seat-belt increases the chance that an individual willbe seriously injured or killed in the event of a collision (Data Analysis Australia2000). Hence, the findings of the ATP Young Drivers Study strongly reinforce theobjectives of current road safety initiatives, as they suggest that these behaviours(particularly speeding and driving when fatigued) are still prevalent among youngdrivers, especially young men. These findings also suggest that the current rangeof initiatives may not be reaching some people. Further research among this agegroup may be needed to understand more clearly why these communications arenot effectively connecting with these young people, and how this age group maybe better targeted. It is possible that a single approach to these unsafe drivingbehaviours may not be the most effective approach, and that a range of newstrategies which specifically target different groups of young people, and particu-larly young men, are needed. Given the higher rates of driving when affected byalcohol among regional participants, and the lower use of seat-belts (or helmets)among rural participants, approaches that specifically target these behavioursamong young adults in regional and rural areas may also be of benefit.
Nevertheless, it should be noted that most young people only occasionallyengaged in risky driving. Only a small number (approximately 7 per cent) exhib-ited a consistent pattern of highly unsafe driving. In comparison with otherdrivers, this group of high risky drivers tended to display a range of less adaptive
65 VicRoads runs free training sessions for learner drivers and their parents (“Keys please: The firststep into the driver's seat”). Contact VicRoads on 1300 360 745 to find out location and datesof these training sessions. VicRoads also provides a wide range of other resources for learnerdrivers and their parents. For example, the booklet “Getting there from Ls to Ps: A step-by-stepguide for learners and supervising drivers on learning to drive” is available from all VicRoadsRegistration and Licensing offices in Victoria or can be ordered via VicRoads website:www.vicroads.vic.gov.au. Information for parents may also be accessed from the followingwebsites: http://www.tacsafety.com.au/jsp/content/NavigationController.do?areaID=3 (clickon the link to “parents”) or http://www.drivertrainers.com.au/parents.html.

A U S T R A L I A N I N S T I T U T E O F F A M I LY S T U D I E S106
personal characteristics, had experienced more school adjustment difficultieswhile growing up, had more difficulties in their relationships with parents, hadmore frequently formed friendships with antisocial peers, were less involved incommunity activities, and had higher rates of police contact for driving-relatedoffences. While these findings reflect overall group differences (that is, not allhigh risky drivers exhibited these characteristics) they point to the broader diffi-culties that can sometimes underlie highly risky driving behaviour.
This small group of high risky drivers would appear to represent a major roadsafety concern, and hence, interventions aimed specifically at this group wouldseem particularly worthwhile. A key question that could be asked is: Why do suchindividuals not heed current road safety messages? Do they underestimate therisks, disregard them, or do their personal tendencies (for example, low frustrationtolerance, inattention, impulsiveness) over-ride their adherence to safer patternsof driving? While the ATP Young Divers Study cannot provide answers to thesequestions, these are important issues for future research to take up, which caninform intervention strategies targeted at this group of young drivers.
It is not the purpose of this research to spell out the details of intervention strate-gies. However, these findings highlight a dilemma for those planningintervention efforts, and that is to decide upon the group of young drivers whomit may be most beneficial to target. Should the large group of young adults whooccasionally engage in risky driving behaviour be the focus, or alternatively, thesmall group who frequently engage in high levels of unsafe driving behaviours?
It is important to consider which group will be more amenable to change and thelikely reduction in road trauma that would be achieved by changing the drivingbehaviour of each group. Clearly further research is needed to compare the effi-cacy of intervention strategies aimed at these two very different groups of youngdrivers. However, a combination of both approaches – targeted approaches aimedat the small group of frequent risky drivers and broad-based interventions aimedat the larger group of occasional risky drivers – may be most effective.
Risk factors for problematic driving practices could be identified from mid childhood
Due to its longitudinal nature, the unique contribution of this study was its abil-ity to examine links between driving behaviour and earlier characteristics. Clearand consistent group differences were observed between high risky drivers andother drivers from mid childhood on, while individuals who subsequently com-mitted multiple speeding violations could be distinguished from other driversfrom late childhood. These findings suggest that antecedents of some types ofunsafe and unlawful driving behaviour are noticeable as early as mid- to late-childhood, many years before a person first drives a car or motorcycle. If this is thecase, then interventions targeting childhood and adolescent precursors may havea positive, flow-on effect on later driving behaviour.
There is a growing recognition among researchers, policymakers, and practition-ers that many problem behaviours that become apparent in adolescence andearly adulthood (for example, antisocial behaviour, risky substance use) havetheir origins in childhood, and that early intervention and prevention can inhibittheir development. The findings of the ATP Young Drivers Study suggest that thisprocess may also apply to unsafe driving.
How might these correlates and antecedent factors influence driving behaviour?First, if an individual fails to learn to regulate difficult childhood characteristics

I N T H E D R I V E R ’ S S E AT 107
these may directly influence his/her later driving behaviour. For example, underly-ing aggressive or impulsive tendencies, which are likely to be influenced by theindividual’s physiological make-up, may cause an individual to respond in anaggressive or impulsive manner when driving. Second, an individual’s characteris-tics may impact indirectly, by influencing other factors that affect drivingbehaviour. For example, childhood factors such as a reactive or impersistent tem-perament style, or aggressive or hyperactive behaviour problems, might influencedriving behaviour by contributing to the development of cognitive, emotional orbehavioural response styles that are associated with problematic driving outcomes.
With regard to childhood aggression, a considerable body of research (for example,Dodge 1986) suggests that this characteristic often underlies the development of aninaccurate ‘social information processing’ style, in which an individual may form adistorted view of events and of the actions of others. Thus, aggressive individualstend to attribute hostile intent to others even when the event was accidental (Dodge1986), and to react negatively and intensely when irritated or stressed (Rutter et al.1998). These less adaptive response styles could lead an individual to respond inap-propriately or hazardously in a driving situation. Social information processingdeficiencies may lead drivers who are prone to aggression to misinterpret theactions of other drivers (for example, perceiving malicious intent when accidentally“cut off” by another driver) while emotional reactions to these perceived slightsmay lead them to respond in an overly aggressive manner (for example, yelling atother drivers, or engaging in unsafe driving practices such as “tailgating”). Furtherresearch examining whether risky driving often involves such attributions andemotions could provide valuable guidance for intervention efforts.
Similarly, childhood hyperactivity and a more inattentive, less persistent tem-perament style may be indicative of cognitive deficits such as a diminishedcapacity to maintain and control one’s attention and to inhibit undesirableresponses. These deficits may limit a young driver’s ability to attend to relevantinformation in the driving environment, increasing the chances that he or shewill be involved in a crash. Thus, cognitive capacities that underlie childhoodattention difficulties may continue to have an effect in young adulthood, andyoung people who tend to be overly active and have difficulty maintaining atten-tion may be less likely to possess or develop the cognitive skills necessary to divideand switch attention between competing driving tasks. Once again, researchexamining the role of such individual differences on driving behaviour appearswarranted and could help inform intervention approaches.
Third, the presence of childhood risk factors could be seen as signalling the onsetof a problematic developmental pathway which may lead on to a range of laterdifficulties, including problematic driving. This explanation emphasises thebroader role of risk factors as indicators that a child’s development is not pro-gressing well. It also highlights the links between childhood and adolescent riskfactors and more proximal factors associated with unsafe or unlawful driving.These proximal factors, which are often more powerfully related to problematicdriving outcomes than distal factors, may be influenced by earlier factors anddevelopmental processes. Hence, earlier risk factors may be important steppingstones in a developmental sequence or chain, for example:
A risky lifestyle in early adulthoodincluding problematic driving
Childhood aggression
➜ ➜Adolescent antisocialbehaviour

A U S T R A L I A N I N S T I T U T E O F F A M I LY S T U D I E S108
These are some of the ways in which childhood and adolescent risk factors mightinfluence and contribute to unsafe driving behaviour in early adulthood. Giventhe connections revealed between childhood and adolescent factors and subse-quent driving outcomes in the ATP Young Drivers study, early interventionprograms targeted at these stages of development may prove a useful addition tocurrent road safety initiatives. From a broad public health perspective, early inter-vention is considered preferable to intervening later on, once problem behaviourshave become established (Greenberg et al. 2001; Homel et al. 1999). Early inter-vention strategies are generally more efficient and cost-effective than remedialprograms (Greenwood et al. 1998; Homel et al. 1999).
Furthermore, given that research suggests that many problem behaviours share thesame risk factors (Jessor and Jessor 1977; Jessor 1987), these strategies may haveadditional benefits in averting the development of a range of behavioural difficul-ties (Greenberg et al. 2001; Homel et al. 1999). However, these types ofinterventions should be seen as an adjunct, not an alternative, to current road safetyinitiatives which primarily target young drivers during the early years of their driv-ing career or in the years just prior to them gaining a Learner Permit (see RoadsCorporation 2003 for examples of some existing road safety initiatives in Victoria).
When might early intervention efforts be most useful? The present findingsshowed that risk factors for risky driving and speeding first became evident dur-ing the primary school years, suggesting that this period is the time whenpathways to such behaviours commence. Hence, interventions implemented atthis time may be valuable in diverting children from problematic pathways at anage when they are most amenable to change. Given that many unsafe driversreported a lack of connectedness to school during the secondary school years, andthose with multiple speeding violations were less likely to have completed formaleducation, interventions aimed at primary school aged students may have anadded benefit of reaching a large proportion of at-risk children, who may not beas accessible or open to intervention at older ages. Given the breadth of the riskfactors identified, such interventions might ideally involve a collaborativeapproach in which families, schools and other stakeholders with an interest inpositive child and/or adolescent development (community organisations, gov-ernment agencies) work in a coordinated manner with one another to implementsuitable intervention or prevention strategies.
There is empirical support for the effectiveness of interventions targeted at pri-mary school aged children in preventing or reducing a range of problematicoutcomes, such as childhood behaviour problems, adolescent antisocial behav-iour, and substance misuse (Farrington 2002; Greenwood et al. 1998; Homel et al.1999). The most successful programs have generally adopted a multi-facetedapproach, involving parent and teacher training in behaviour management (forexample, monitoring child behaviour, use of effective discipline) and interven-tions aimed at enhancing children’s social, cognitive and problem solving skills(see Homel et al. 1999 and Greenberg et al. 2001 for more detailed descriptions ofsuch programs).
These findings support current efforts to assist children to make the best possiblestart in life. They suggest that early intervention programs aimed at primary schoolaged children may help curtail later problematic driving behaviour, among a rangeof other problematic behaviours, complementing current road safety initiativesaimed specifically at reducing unsafe driving behaviour among young drivers.

I N T H E D R I V E R ’ S S E AT 109
Predicting crash involvement was less easy
The findings of this research suggest that it is more difficult to predict crashinvolvement than other problematic driving outcomes. For example, while it waspossible to differentiate individuals in the high risky driving and multiple speed-ing violations groups from other drivers as early as mid- to late-childhood,individuals who were later involved in one or more crashes did not significantlydiffer from their counterparts on any individual attributes or environmental char-acteristics until mid/late adolescence. Furthermore, group differences weregenerally smaller and less consistent among the crash involvement groups thanthe risky driving and speeding violation groups.
A number of reasons may underlie the smaller number of differences found. First,in this study, crash involvement was assessed on the basis of the number ofcrashes young people reported having been involved in when they were driving.Information was not obtained about the cause of the crash, and thus, the singleand multiple crash groups included individuals involved in crashes in whichthey were “at-fault”, and crashes in which they were not culpable. Given this het-erogeneity, it is less surprising that a clear profile of risk factors did not emerge forcrash involvement.
Second, the vast majority (95 per cent) in the single and multiple crash groupsreported being involved in a relatively minor collision which resulted in propertydamage only. Very few (n=23) had been involved in a serious crash in whichsomeone was injured or killed. Much of the previous research that has been con-ducted on crash involvement has focused on serious crashes, as it is thesecollisions that are of particular concern. Hence, it is possible that if the focus herehad been on more severe crashes, a clearer pattern of group differences may haveemerged. The small number of participants who reported having being involvedin a crash resulting in injury or death precluded such a focus. However, it may bepossible to undertake this investigation in future data collection waves, as it canbe anticipated (unfortunately) that over time a larger number of participants willbe involved in a serious crash.
Finally, crashes are singular events, in which situational circumstances (such aserrors of judgement, road conditions, the psychological state of the driver) and toa certain extent, luck, may play important roles. Hence, it is not surprising thatcrashes are generally harder to predict than more habitual behaviours such asspeeding.
Nevertheless, the ATP Young Drivers Study found some individual and environ-mental characteristics that appeared to heighten the risk that a young adult would become involved in a crash when driving. For example, those who hadbeen involved in a crash tended to have more difficulties remaining focused on tasks, react more negatively and intensely when frustrated or upset, andexhibit more behaviour problems (aggression, antisocial behaviour and multi-substance use) than those who had not been involved in a crash when driving.They also tended to have poorer coping skills, experience more conflict in their relationship with parents, and to have had more police contact for driving-related offences than other drivers. Many of these characteristics are similar to those identified as precursors of risky driving and/or speeding behaviour.Hence, while it may be difficult to predict crash involvement in isolation, it may be possible to identify individuals at risk of problematic driving behaviour ingeneral.

A U S T R A L I A N I N S T I T U T E O F F A M I LY S T U D I E S110
Similarities between problem drivers and those who display other
problem behaviours
The findings of this research offer partial support for Problem Behaviour Theory(Jessor and Jessor 1977; Jessor 1987), which posits that problem behaviours areclosely related to each other and are caused by a common underlying propensity.Substantial overlap was found between the precursors of risky driving and theother problem behaviours examined (antisocial behaviour and substance use). Inaddition, rates of alcohol use, marijuana use, combined alcohol and marijuanause, and antisocial behaviour were higher among high risky drivers than thosewho engaged in low or moderate levels of risky driving behaviour. Furthermore,adolescent antisocial behaviour and substance use were potent risk factors for arisky driving pattern in early adulthood. Taken together, these findings suggestthat problem driving, substance use and antisocial behaviour are interrelated.
These findings have important implications for prevention and intervention asthey suggest that preventative interventions targeted at substance use and/orantisocial behaviour may also be effective in preventing or reducing problem driv-ing behaviour. Hence, while there is clearly a need for intervention programsspecifically targeting problem driving behaviour, more broadly-based early inter-vention and/or prevention programs aimed at reducing or inhibiting problembehaviours in general are likely to have pay-offs in decreasing problem driving.Such an approach, which has the capacity to target multiple problems simulta-neously, is likely to be more cost effective than narrower approaches directed at asingle problem outcome.
However, it should be noted that a sizeable proportion of young adults who engagedin high risky driving did not engage in high levels of substance use or antisocialbehaviour in adolescence and/or young adulthood, and there were some precursorsthat uniquely predicted the three problem behaviour outcomes (risky driving, sub-stance use and antisocial behaviour) and their combinations. Hence, while a“common solutions approach” (as described above) may help reduce problem driv-ing behaviour, it is likely that specific programs targeting problem driving willalways be needed if intervention initiatives are to be fully effective.
The importance, and intervention implications, of individual attributes
As noted earlier, for all types of problematic driving, the most problematic driv-ers could be distinguished from other drivers on a range of individual attributesand behaviours. Common risk factors for all types of problem driving were a lesspersistent temperament style, higher aggression, and higher levels of antisocialbehaviour and multi-substance use. There were also some individual characteris-tics that uniquely predicted particular driving behaviours. For example, lowresponsibility was associated with risky driving behaviour only, while high reac-tivity (volatility, moodiness) was only associated with crash involvement.Individual attributes appeared to be particularly important in discriminating thespeeding violation groups.
Thus, broad-based, multi-faceted early interventions, which include a focus onthese individual attributes, may have long-term benefits in preventing or reduc-ing problem driving behaviour (particularly speeding behaviour). Interventionprograms targeted at modifying individual attributes would need to be tailored todifferent developmental stages. Interventions targeted at primary school agedchildren might involve training parents and teachers to better manage difficult

I N T H E D R I V E R ’ S S E AT 111
child behaviour (for example, monitoring child behaviour, using effective disci-pline, rewarding positive behaviour), and assisting children to regulate theirbehavioural responses through cognitive and problem skills training. Examples ofthese types of programs are the Seattle Social Development Project and the FastTrack program, both of which have shown success in reducing problematic childand adolescent behaviour (see Greenberg et al. 2001 for more details). As thesetypes of programs aim to inhibit emerging problem behaviours and move chil-dren onto more positive developmental pathways, they may in turn reduce thelikelihood of later problematic driving behaviour.
In older age groups, interventions targeting individual attributes may involvehelping young people to gain a better understanding of their own temperamen-tal proclivities, how these may impact on their everyday behaviour (includingtheir driving behaviour) and how they can manage these tendencies. For exam-ple, if a young adult has a highly negative reactive temperament style, he or shemay be more likely to become upset or irritated by the actions of other drivers,and/or become impatient when caught in traffic, than would a person with a lessreactive temperament style. Similarly, a person with a less persistent temperamentstyle may find it harder to remain focused when driving, becoming more easilydistracted than would other drivers by the presence of passengers in the car, ormusic from the radio, for example.
Once individuals have gained awareness of their own inherent tendencies theycan then be assisted to develop techniques or strategies to manage these procliv-ities more successfully. During the early adolescent years, young people becomeincreasingly capable of complex cognitive processes, such as abstract thinkingcapacities and developing control of their emotional responses. This increasingcapacity for self-regulation may enable individuals to manage their temperamen-tal characteristics more effectively. For example, highly reactive individuals maybe taught techniques to assist them to regulate their emotional responses to frus-trating events, while individuals with attentional difficulties may learn tominimise distractions or be assisted to better develop attentional capacities.
A broad understanding of how individual differences impact on driving behav-iour may also be of assistance in the driver education process. For example, ratherthan focusing solely on teaching young drivers vehicle handling skills, it wouldalso seem useful to educate them about the influence of these psychologicalattributes on driver safety. This educational component need not be specific tothe individual, but rather provide a broad overview of the impact of individualcharacteristics on driving behaviour and suggestions on how these characteristicsmay be managed in the driving situation. This information may be communi-cated via group workshops, road-safety/learning-to-drive websites and/or writtenmaterials such as fact sheets and information kits. Written information could bedistributed to novice drivers on attaining their Learner Permits or alternatively,via driving instructors, educational institutions (schools, universities, TAFEs)and/or community health centres.
Many of the individual characteristics found to be associated with problem driv-ing behaviour reflect long-term patterns of behaviour that may not be under theconscious control of drivers. Furthermore, research suggests that some of thesecharacteristics (for example, aggression, hyperactivity, attention problems) mayhave underlying physiological bases (see Brennan and Raine 1997; Hill 2002;Spencer et al. 2002; Tremblay et al. 2005 for reviews). One likely consequence isthat road safety programs that focus on conscious decision making may not be

A U S T R A L I A N I N S T I T U T E O F F A M I LY S T U D I E S112
particularly effective for all individuals. As an example, public education pro-grams that attempt to increase conscious or cognitive executive control of drivingbehaviours would not be expected to have a significant effect on the unsafe driv-ing behaviours of young adults with attentional problems. As suggested earlier,more effective approaches might include assisting such individuals to gain adeeper understanding of their typical style of responding and the type of situa-tions that pose particular risks for them, and providing strategies to decrease ormanage risky or dangerous response styles.
The role and implication of social factors
Factors related to the interpersonal relationships and school adjustment wereimportant predictors of all problem driving outcomes. For example, during ado-lescence (and earlier among risky drivers), the most problematic drivers wereconsistently reported to experience more school adjustment difficulties thanother drivers and to associate more often with peers who engaged in antisocialbehaviour and/or substance use. There was a tendency for individuals whoengaged in high levels of risky driving and/or had been involved in multiplecrashes to experience more difficulties in their relationships with their parentsthan other young adults.
These findings suggest that young people who do not feel connected to theirschool environment and experience problematic interpersonal relationships maybe more likely to progress along problematic developmental pathways than thosewho experience a high degree of school bonding and are involved in more posi-tive and adaptive interpersonal relationships. Such individuals, in turn, may bemore likely to engage in a range of problem behaviours, including unsafe orunlawful driving behaviours.
These findings highlight the importance of keeping students connected to school.Interestingly, recent Australian research (Hemphill et al. 2004) suggests that manyadolescents do not show high levels of school engagement, with Year 7 and 9 stu-dents reporting, on average, that they look forward to going to school only aboutonce a month. Further efforts may therefore be needed to engage and nurture stu-dents, providing them with support and encouragement in addition to educationand structure.
The findings of this study also draw attention to the importance of assistingyoung people to form and maintain adaptive interpersonal relationships. Giventhe higher level of parent–child relationship difficulties among the high riskydriving and multiple crash groups, attempts to improve relationships betweenparents and children would appear beneficial. Such attempts may have an addedbenefit of assisting parents to have more influence on their child’s activities andfriendship groups (Kupersmidt et al. 2004), decreasing the chances they willbecome involved with antisocial peers. Affiliation with antisocial peers is a pow-erful and ubiquitous risk factor for many problem outcomes including substanceuse and antisocial behaviour (see Vassallo et al. 2002; Williams 2000), and, asfound here, for unsafe and unlawful driving.
Interestingly, there were generally few differences between the different prob-lematic driving groups and other drivers on other family environment factors. Forexample, no significant group differences were found on family socio-economicstatus (parents’ occupational and educational levels, unemployment, financialstrain); family structure (family size, parental separation/divorce/death, parental

I N T H E D R I V E R ’ S S E AT 113
marital status); family residential location; family stress; parental characteristics(parental age, ethnic background, cigarette and alcohol use); or parenting style(use of harsh disciplinary practices, use of inductive reasoning, amount of super-vision) for any of the outcome groups. Hence, it would appear that the degree towhich individuals are attached to school, the type of peers they associate with,and the quality of their relationships with their parents are salient precursors ofdriving behaviour, but not the other aspects of the family environment studiedin the ATP Young Drivers Study.
Risky drivers are a heterogeneous group
The findings of the ATP Young Drivers Study clearly demonstrate that youngadults who engage in high levels of risky driving behaviour are not all the same.For example, exploratory analyses revealed that the group who engaged only inhigh levels of risky driving behaviour significantly differed from those groups ofhigh risky drivers who also reported high levels of alcohol use, marijuana use orantisocial behaviour, with the dual problem groups generally reporting moreproblems than the single problem groups during early adulthood. Young adultswho engaged in both high risky driving and high antisocial behaviour tended tobe particularly problematic, generally displaying a more difficult temperamentstyle, lower social skills, experiencing more conflict in their relationship withtheir parents, and participating less in civic endeavours than those who engagedin high levels of risky driving only.
These findings suggest that there is considerable variability among individuals whoengage in high levels of risky driving behaviour, and that it is important to distin-guish between single and multi-problem groups. The current findings also serve asa reminder of the potential dangers of stereotyping, and over-simplistic conclu-sions. However, as the groups compared in these analyses were rather small, futureresearch, employing larger sample sizes, is needed to understand the nature of thesedifferences, and their implications for prevention and intervention.
Strengths and limitations of the research
The ATP Young Drivers Study has a number of significant strengths. Most notably,the research draws upon a large pool of data collected over a 20-year period onmany aspects of young peoples’ lives. The young people and their familiesinvolved in the study are drawn from the general population, and come fromdiverse backgrounds. A further strength of this study is the use of multiple time-points and informants to gain a comprehensive and reliable picture of youngpeople’s development and wellbeing.
However, the research also has several limitations. First, some of the groups usedin comparisons were quite small. For example, the high risky driving (n=74), mul-tiple crash (n=136), and multiple speeding violation groups (n=113) weremarkedly smaller than their comparison groups, while the multi-problem groups(risky driving along with high alcohol use, high marijuana use, and/or high anti-social behaviour) ranged in size from only eight to 27 individuals. These smallgroup sizes restricted the statistical power available to detect group differences.Hence, replication of these findings with larger samples is clearly desirable.
Second, the single and multiple crash groups included young adults who wereinvolved in a wide range of different crash types (including crashes in which theywere at fault and those for which they were not responsible; minor collisions

A U S T R A L I A N I N S T I T U T E O F F A M I LY S T U D I E S114
resulting in property damage; and serious crashes resulting in injury and death).As previously discussed, it is likely that the heterogeneity of these groups con-tributed to the limited differences found between the crash involvement groups.Consequently, if more stringent criteria were used to define these groups (forexample, if only young adults who were involved in serious crashes were includedin the single and multiple crash groups) it may be that a clearer profile of risk fac-tors would have been identified for this outcome. However, such an analysis wasnot possible with the ATP data set due to the fact that the young adults had onlybeen driving for a few years, so the number of serious crashes in which they hadbeen involved was still relatively low.
Third, there was some overlap in the membership of the three most problematicoutcome groups, and particularly, the high risky driving and high speeding vio-lations group which may have contributed to some of the similarity observed inthe profiles of these groups. However, as the majority of young adults displayedonly one of the types of problem driving behaviour, clearly other factors also con-tributed to these findings.
Fourth, while the study identified distinct profiles of child and adolescent char-acteristics associated with later unsafe or illegal driving behaviour, given theapparent dearth of longitudinal research in this area, replication of these findingsusing other large-scale, representative samples would be desirable.
Finally, the ATP Young Drivers Study is based on a single cohort of young adultsborn in 1982. Hence, it is a study of problematic driving among the current gener-ation of young adults. As the prevailing socio-economic, social, cultural andtechnological conditions of an era impact on child development, new studies, suchas Growing Up in Australia (otherwise known as the Longitudinal Study of Aus-tralian Children: Sanson et al. 2002) may also provide valuable information to guideintervention and prevention strategies for future generations of young drivers.
Conclusion
This report of the ATP Young Drivers Study resulted from the research collabora-tion between the Australian Institute of Family Studies, the Royal AutomobileClub of Victoria and the Transport Accident Commission of Victoria. The studydrew on extensive longitudinal data gathered by the Australian TemperamentProject to provide a comprehensive description of the learner driver experiencesand current driving behaviours of a large sample of Victorian young adults, as wellas examining the correlates and precursors of risky driving, crash involvementand speeding violations. A number of important conclusions can be drawn fromthe Study findings.
First, it is clear that some antecedents of problematic driving behaviours emergeat early developmental stages, many years prior to driving age. Consequently,support should be given to early intervention and prevention initiatives that canbe targeted at likely high-risk groups. Ideally, these initiatives should be imple-mented in mid to late childhood.
Second, it is also evident that some overlap exists between young drivers whoengage in problematic driving behaviours and those who engage in other high-risk activities. As a result, broader initiatives that address common risk factors (forexample, behaviour problems or social skills) should be implemented in additionto more targeted initiatives that focus on a specific outcome (for example, roadsafety or substance use).

I N T H E D R I V E R ’ S S E AT 115
Third, some of the factors that consistently emerged as risk factors for problematicdriving (for example, aggression, hyperactivity, attention problems) reflect long-standing patterns of development that are likely to be physiologically-based. Hence,underlying physiological propensities may be of greater concern than previouslyacknowledged in road safety. Further research examining this issue is needed todetermine its relevance to the road safety field and its intervention implications.
Finally, while this research has helped identify some characteristics associated withhigh-risk driving among young adults, it is important that future efforts are alsochannelled to trialling and evaluating various preventative interventions. Re-exam-ination of road safety issues in the next ATP survey (planned to take place whenparticipants are aged 24 years) would also be beneficial, to help determine whetherany changes in these behaviours have occurred with increasing age and experience.
Taken together, the findings of this research are a reminder that the attributes andcapacities that young people bring to the task of driving influence their skills andeffectiveness as drivers, together with situational, structural and legal factors asso-ciated with the driving environment. While a number of issues remainunresolved, and there is a clear need for continuing research into the develop-ment and persistence of problem driving, it is hoped that the findings containedin this report have contributed to an understanding of the development of “nor-mal” and “problematic” driving patterns, and provided valuable guidance forpolicy making and interventions aimed at preventing unsafe driving amongyoung novice drivers in Australia.

A U S T R A L I A N I N S T I T U T E O F F A M I LY S T U D I E S116
References
American Psychiatric Association (1994), Diagnostic and statistical manual of mentaldisorders: DSM-IV (4th edn), American Psychiatric Association, Washington, USA.
ABS (2003), Australia Now. 2. Australian Social Trends. Health-Mortality and morbidity:Injuries, Australian Bureau of Statistics, Canberra, ACT.
Australian Transport Safety Bureau (2003), Data accessed from the Fatal Road Crashdatabase. Online: http://tssu.atsb.gov.au/disclaimer.cfm
Barkley, R.A., Murphy, K.R., Dupaul, G. J. & Bush, T. (2002), “Driving in youngadults with attention deficit hyperactivity disorder: Knowledge, performance,adverse outcomes, and the role of executive functioning”, Journal of the InternationalNeuropsychological Society, vol. 8, pp. 655-672.
Beck, K.H., Shattuck, T. & Raleigh, R. (2001), “Parental predictors of teen drivingrisk”, American Journal of Health Behavior, vol. 25, pp. 10-20.
Begg, D.J. & Langley, J.D. (2000), “Seat-belt use and related behaviors among youngadults”, Journal of Safety Research, vol. 31, pp. 211-220.
Begg, D.J., Langley, J.D. & Stephenson, S. (2003), “Identifying factors that predictpersistent driving after drinking, unsafe driving after drinking, and driving afterusing marijuana among young adults”, Accident Analysis and Prevention, vol. 35,pp. 669-675.
Beirness, D.J. & Simpson, H.M. (1988), “Lifestyle correlates of risky driving and acci-dent involvement among youth”, Alcohol, Drugs and Driving, vol. 4, pp.193-204.
Bond, L., Thomas, L., Toumbourou, J., Patton, G. & Catalano, R. (2000), Improving thelives of young Victorians in our community: A survey of risk and protective factors, Centre forAdolescent Health, Parkville, Vic.
Brennan, P.A. & Raine, A. (1997), “Biosocial bases of antisocial behavior: Psychophys-iological, neurological, and cognitive factors”, Clinical Psychology Review, vol. 6, pp. 589-604.
Caspi, A., Begg, D., Dickson, N., Harrington, H., Langley, J., Moffitt, T.E., Silva, P.A.(1997), “Personality differences predict health risk behaviors in young adulthood: Evi-dence from a longitudinal study”, Journal of Personality and Social Psychology, vol. 73,pp.1052-1063.
Cavallo, A. & Triggs, T.J. (1996), Directions for improving young driver safety within Victo-ria: A discussion paper, Monash University Accident Research Centre, Melbourne, Vic.
Chen, L-H., Baker, S.P., Braver, E.R. & Li, G. (2000), “Carrying passengers as a risk fac-tor for crashes fatal to 16- and 17-year-old drivers”, JAMA, vol. 283, pp. 1578-1582.
Clarke, D.D., Ward, P. & Truman, W. (2002), In-depth accident causation study ofyoung drivers, TRL Report TRL542, Transport Research Laboratory, Berkshire, UK.Online: http://www.trl.co.uk/static/dtlr/pdfs/TRL542.pdf.
Cohen, J. (1988), Statistical power analysis for the behavioral sciences (2nd edn),Lawrence Erlbaum, Hillside, New Jersey.
Crettenden, A. & Drummond, A. (1994), The young driver problem versus the youngproblem driver: A review and crash data analysis, CR151, Federal Office of Road Safety,Canberra.
Data Analysis Australia (2000), Analysis of road crash statistics, 1990-1999, RoadSafety Council of Western Australia, Perth, WA.
Diamantopoulou, K., Cameron, M., Dyte, D. & Harrison, W. (1997), The relationshipbetween demerit points accrual and crash involvement, Report 116, Monash UniversityAccident Research Centre, Clayton, Vic.

I N T H E D R I V E R ’ S S E AT 117
Diamantopoulou, K., Skalova, M., Dyte., D. & Cameron, M. (1996), Crash risks ofroad user groups in Victoria, Report 88, Monash University Accident Research Centre,Clayton, Vic.
Dobbie, K. (2002), An analysis of fatigue-related crashes on Australian roads using anoperational definition of fatigue, Report OR23, Australian Transport Safety Bureau,ACT.
Dodge, K.A. (1986), “A social information processing model of social competence inchildren”, in M. Perlmutter (ed.), The Minnesota symposium on child psychology, vol 18, Erlbaum, Hillside, New Jersey.
Drummer, O.H., Gerostamoulos, J., Batziris, H., Chu, M., Caplehorn, J., Robertson,M.D. & Swann, P. (2004), “The involvement of drugs in drivers of motor vehicleskilled in Australian road traffic crashes”, Accident Analysis and Prevention, vol. 36, pp. 239-248.
Dunsire, M. & Baldwin, S. (1999), “Urban-rural comparisons of drink-driving behav-iour among late teens: A preliminary investigation”, Alcohol and Alcoholism, vol. 34,pp. 59-64.
Engström, I., Gregersen, N.P., Hernetkoski, K., Keskinen, E. & Nyberg, A. (2003),Young novice drivers, driver education and training: Literature review, VTI rapport 491A,Swedish National Road and Transport Research Institute, Linköping, Sweden,Online: http://www.vti.se/PDF/reports/R491A.pdf.
Farrington, D.P. (2002), “Key results from the first forty years of the CambridgeStudy in Delinquent Development”, in T.P. Thornberry and M. D. Krohn (eds), Tak-ing stock of delinquency: An overview of findings from contemporary longitudinal studies,Kluwer Academic/Plenum Publishers, New York.
Fergusson, D.M. & Horwood, L.J. (2001), “Marijuana use and traffic accidents in abirth cohort of young adults”, Accident Analysis and Prevention, vol. 33, pp. 703-711.
Fletcher, A.C., Steinberg, L. & Williams-Wheeler, M. (2004), “Parental influences onadolescent problem behaviour: Revisiting Stattin and Kerr”, Child Development, vol.75, pp.781-796.
Greenberg, M.T., Domitrovich, C. & Bumbarger, B. (2001), “The prevention of mentaldisorders in school-aged children: Current state of the field”, Prevention and Treatment,vol. 4, Online: http://journals.apa.org/prevention/volume4/pre0040001a.html.
Greenwood, P.W., Model, K.E. & Rydell, C.P. (1998), Diverting children from a life ofcrime: Measuring costs and benefits, Online: www.rand.org/publications/MR/MR699/.
Hair, J.F., Anderson, R.E., Tatham, R.L., & Black, W.C. (1998), Multivariate data analy-sis (5th edn), Prentice-Hall, New Jersey.
Harrison, W.A. & Christie, R. (2003), Exposure study by motorcycle make and type: FinalReport, Motor Accidents Authority, Sydney.
Harrison, W.A. & Seymour, R. (2003), “Learning to drive in rural areas: Parents’ per-spectives on issues and solutions”, Paper presented at the Road Safety Research,Policing and Education Conference, Sydney, 24-26 September.
Hartos, J. L., Eitel, P., Haynie, D.L., & Simons-Morton, B.G. (2000), “Can I take thecar? Relations among parenting practices and adolescent problem-driving prac-tices”, Journal of Adolescent Research, vol. 15, pp. 352-367.
Hemphill, S.A., Toumbourou, J.W., Catalano, R.F. & Mathers, M. (2004), “Prevalenceand family correlates of positive adolescent development: A cross-national compar-ison”, Family Matters, no.68, Winter, pp. 28-35.
Hill, J. (2002). Biological, psychological and social processes in the conduct disor-ders. Journal of Child Psychology and Psychiatry, vol. 43, pp. 133-164.
Homel, R., Cashmore, J., Gilmore, L., Goodnow, J., Hayes, A., Lawrence, J., Leech,M., O’Connor, I., Vinson, T., Najman, J. & Western, J. (1999), Pathways to prevention:Early intervention and developmental approaches to crime in Australia, Attorney-Gen-eral’s Department, National Crime Prevention, Canberra.
A U S T R A L I A N I N S T I T U T E O F F A M I LY S T U D I E S118
Horwood, L.J. & Fergusson, D.M. (2000), “Drink driving and traffic accidents inyoung people”, Accident Analysis and Prevention, vol. 32, pp. 805-814.
Jessor, R. (1987), “Risky driving and adolescent problem behavior: An extension ofproblem-behavior theory”, Alcohol, Drugs and Driving, vol. 3, pp. 1-12.
Jessor, R. & Jessor, S.L. (1977), Problem behavior and psychosocial development: A longi-tudinal study of youth, Academic Press, New York, USA.
Jonah, B.A. (1997), “Sensation seeking and risky driving: A review and synthesis ofthe literature”, Accident Analysis and Prevention, vol. 29, pp. 651-665.
Kupersmidt, J.B., Coie, J.D. & Howell, J.C. (2004), “Resilience in children exposed tonegative peer influences”, in K.I. Maton, C.J. Schellenbach, B.J. Leadbeater & A.L.Solarz (eds), Investing in children, youth, families and communities, American Psycho-logical Association, Washington.
Kweon, Y-J & Kockelman, K.M. (2003), “Overall injury risk to different drivers:Combining exposure, frequency and severity models”, Accident Analysis and Preven-tion, vol. 35, pp. 313-321.
Laapotti, S., Keskinen, E., Hatakka, M. & Katila, A. (2001), “Novice drivers’ accidentsand violations – a failure on higher or lower hierarchical levels of driving behav-iour”, Accident Analysis and Prevention, vol. 33, pp. 759-769.
Lang, S.W., Waller, P.F. & Shope, J.T. (1996), “Adolescent driving: Characteristicsassociated with single-vehicle and injury crashes”, Journal of Safety Research, vol. 27,pp. 241-257.
Loeber, R. & Farrington, D. P (2000), “Young children who commit crime: Epidemi-ology, developmental origins, risk factors, early interventions, and policyimplications”, Development and Psychopathology, vol. 12, pp. 737-762.
Moffitt, T. E. & Silva, P. (1988), “Self-reported delinquency: Results from an instru-ment for New Zealand”, Australian and New Zealand Journal of Criminology, vol. 21,pp. 227-240.
Newcomb, M. D. & McGee, L. (1991), “Influence of sensation seeking on generaldeviance and specific problem behaviours from adolescence to young adulthood”,Journal of Personality and Social Psychology, vol. 61, pp. 614-628.
Norris, F.H., Matthews, B.A. & Riad, J.K. (2000), “Characterological, situational, andbehavioral risk factors for motor vehicle accidents: A prospective examination”,Accident Analysis and Prevention, vol. 32, pp. 505-515.
Palamara, P.G., Legge, M. & Stevenson, M.R (2001), An investigation of the relationshipbetween years of licensing, traffic offences, and crash involvement: A comparison of firstyear drivers with drivers licensed for yen years and five years, Report RR117, InjuryResearch Centre, The University of Western Australia, Crawley, WA.
Prior, M., Sanson, A., Smart, D. & Oberklaid, F. (2000), Pathways from infancy to ado-lescence: Australian Temperament Project 1983-2000, Australian Institute of FamilyStudies, Melbourne, Vic.
Richardson, A.J. (2001), “Crash rates by age and sex of traveller”, Paper presented atthe 24th ATRF Conference, Hobart, 17-20 April.
Roads Corporation (2003), Enhancing the safety of young drivers: A resource for localcommunities, VicRoads Publication Number 01343, Roads Corporation.
Rutter, M., Giller, H. & Hagell, A. (1998), Antisocial behaviour by young people, Cam-bridge University Press, New York, USA.
Rutter, M., Tizard, J. & Whitmore, K. (1970), Education, health and behaviour, Long-mans, London.
Sanson, A., Nicholson, J., Ungerer, J., Zubrick, S., Wilson, K., Ainley, J., Berthelsen,D., Bittman, M., Broom, D., Harrison, L., Rodgers, B., Sawyer, M., Silburn, S.,Strazdins, L., Vimpani, G. & Wake, M. (2002), Introducing the Longitudinal Study ofAustralian Children, Australian Institute of Family Studies, Melbourne.

I N T H E D R I V E R ’ S S E AT 119
Senserrick, T.M. & Harrison, W.A. (2000), “Self-reported seat-belt use and related atti-tudes”, Paper presented at the Road Safety Research, Policing and EducationConference, Brisbane, 26-28 November.
Shope, J.T., Lang, S.W. & Waller, P.F. (1997), “High-risk driving among adolescents:Psychosocial and substance-use correlates and predictors”, UMTRI Research Review,vol. 28.
Shope, J.T., Waller, P.F. & Lang, S.W. (1996), “Alcohol-related predictors of adoles-cent driving: Gender differences in crashes and offenses”, Accident Analysis andPrevention, vol. 28, pp. 755-764.
Shope, J.T., Waller, P.F., Raghunathan, T.E. & Patil, S.M. (2001), “Adolescentantecedents of high-risk driving behavior into young adulthood: Substance use andparental influences”, Accident Analysis and Prevention, vol. 33, pp. 649-658.
Spencer, T.J., Biederman, J., Wilens, T.E., & Faraone, S.V. (2002). “Overview and neu-robiology of attention-deficit/hyperactivity disorder”, Journal of Clinical Psychiatry,vol. 63 (Supplement 12), pp. 3-9.
SPSS Inc (2002), SPSS 11.0 – Mac OS X Version.
Swisher J.D. (1988). “Problem-behavior theory and driving risk”, Alcohol, Drugs andDriving, vol. 4, pp. 205-219.
Tabachnick, B.G. & Fidell, L.S. (1996), Using multivariate statistics (3rd ed.), HarperCollins, New York.
TAC (2003), Young driver statistics (2002), Updated figures obtained from the TACwebsite: http://www.tac.vic.gov.au/tac/00000242.nsf/WebNavPages/Road+SafetyIs-suesYoung+Drivers?OpenDocument&Start=1&Count=1000&ExpandView
Tremblay, R.E., Hartup, W.W. & Archer, J. (2005). Developmental origins of aggression,Guilford Publications, New York.
Triggs, T.J. & Smith, K.B (1996), Young driver research program: Digest of reports andprincipal findings of the research, CR 164, Australian Government Publishing Service,Canberra.
Ulleberg, P. & Rundmo, T. (2003), “Personality, attitudes and risk perception as predictors of risky driving behaviour among young drivers”, Safety Science, vol. 41,pp. 427-443.
Vassallo, S., Smart, D., Sanson, A., Dussuyer, I., McKendry, W., Toumbourou, J., Prior,M. & Oberklaid, F. (2002), Patterns and precursors of adolescent antisocial behaviour.Crime Prevention Victoria, Melbourne.
Vick, M. (2003), “Danger on the roads! Masculinity, the car, and safety”, Youth Stud-ies Australia, vol. 22, pp. 32-37.
Williams, A.F. (1998), “Risky driving behaviour among adolescents”, in R. Jessors(ed.), New perspectives on adolescent risk behaviour, Cambridge University Press, NewYork.
Williams, B., Sanson, A., Toumbourou, J. & Smart, D. (2000), “Patterns and predic-tors of teenagers’ use of licit and illicit substances in the Australian TemperamentProject cohort”, Report commissioned by the Ross Trust.
Wislon, R. J. & Jonah, B.A. (1988). “The application of problem behavior theory tothe understanding of risky driving”, Alcohol, Drugs and Driving, vol. 4, pp. 173-191.
Woodward, L.J., Fergusson, D.M., & Horwood, L.J. (2000), “Driving outcomes ofyoung people with attentional difficulties in adolescence”, Journal of the AmericanAcademy of Child and Adolescent Psychiatry, vol. 39, pp. 627-634.