Embed Size (px)
Citation preview

6In Vitro Techniques
Edited by J. Robin Harris
Nuclear components
Protocol 6.1 Nucleosome assembly coupled to DNA repair synthesisusing a human cell free system 204
Protocol 6.2 Single labelling of nascent DNA with halogenatedthymidine analogues 210
Protocol 6.3 Double labelling of DNA with different halogenatedthymidine analogues 214
Protocol 6.4 Simultaneous immunostaining of proteins andhalogen-dU-substituted DNA 217
Protocol 6.5 Uncovering the nuclear matrix in cultured cells 220Protocol 6.6 Nuclear matrix–lamin interactions: in vitro blot overlay
assay 228Protocol 6.7 Nuclear matrix–lamin interactions: in vitro nuclear
reassembly assay 230Protocol 6.8 Preparation of Xenopus laevis egg extracts and
immunodepletion 234Protocol 6.9 Nuclear assembly in vitro and immunofluorescence 237
Protocol 6.10 Nucleocytoplasmic transport measurements usingisolated Xenopus oocyte nuclei 240
Protocol 6.11 Transport measurements in microarrays of nuclearenvelope patches by optical single transporter recording 244
Cells and membrane systems
Protocol 6.12 Cell permeabilization with Streptolysin O 248Protocol 6.13 Nanocapsules: a new vehicle for intracellular delivery of
drugs 250Protocol 6.14 A rapid screen for determination of the protective role
of antioxidant proteins in yeast 255Protocol 6.15 In vitro assessment of neuronal apoptosis 259
Cell B iology P rotocols . E dited by J . Robin H arris, John Graham, D avid Rickwood 2006 John Wiley & Sons, L td. ISBN: 0-470-84758-1
202 IN VITRO TECHNIQUES
Protocol 6.16 The mitochondrial permeability transition: PT and��m loss determined in cells or isolated mitochondriawith confocal laser imaging 265
Protocol 6.17 The mitochondrial permeability transition: measuringPT and ��m loss in isolated mitochondria with Rh123in a fluorometer 268
Protocol 6.18 The mitochondrial permeability transition: measuringPT and ��m loss in cells and isolated mitochondria onthe FACS 270
Protocol 6.19 Measuring cytochrome c release in isolatedmitochondria by Western blot analysis 271
Protocol 6.20 Protein import into isolated mitochondria 272Protocol 6.21 Formation of ternary SNARE complexes in vitro 274Protocol 6.22 In vitro reconstitution of liver
endoplasmic reticulum 277Protocol 6.23 Asymmetric incorporation of glycolipids into
membranes and detection of lipid flip-flop movement 280Protocol 6.24 Purification of clathrin-coated vesicles from rat brains 286Protocol 6.25 Reconstitution of endocytic intermediates on a lipid
monolayer 288Protocol 6.26 Golgi membrane tubule formation 293Protocol 6.27 Tight junction assembly 296Protocol 6.28 Reconstitution of the major light-harvesting chlorophyll
a/b complex into liposomes 300Protocol 6.29 Reconstitution of photosystem 2 into liposomes 305Protocol 6.30 Golgi–vimentin interaction in vitro and in vivo 307
Cytoskeletal and fibrillar systems
Protocol 6.31 Microtubule peroxisome interaction 313Protocol 6.32 Detection of cytomatrix proteins by immunogold
embedment-free electron microscopy 317Protocol 6.33 Tubulin assembly induced by taxol and other
microtubule assembly promoters 326Protocol 6.34 Vimentin production, purification, assembly and study
by EPR 331Protocol 6.35 Neurofilament assembly 337Protocol 6.36 α-Synuclein fibril formation induced by tubulin 342Protocol 6.37 Amyloid-β fibril formation in vitro 345Protocol 6.38 Soluble Aβ1 – 42 peptide induces tau
hyperphosphorylation in vitro 348Protocol 6.39 Anti-sense peptides 353Protocol 6.40 Interactions between amyloid-ß and enzymes 359Protocol 6.41 Amyloid-ß phosphorylation 364Protocol 6.42 Smitin–myosin II coassembly arrays in vitro 369Protocol 6.43 Assembly/disassembly of myosin filaments in the
presence of EF-hand calcium-binding protein S100A4in vitro 372
Protocol 6.44 Collagen fibril assembly in vitro 375

INTRODUCTION 203
Introduction
Modern cell biology is increasing moving onwards from the intact cell or componentisolated directly from the cell, to a consideration of the experimental manipulation andreassembly of such components.
This chapter dealing with in vitro techniques in cell biology includes a range of recentmethods that loosely fall within the sphere of experimental reconstitution/assembly pro-cedures. The topics included integrate well with those within the other sections of thebook and often rely upon both EM and advanced light microscopical techniques forassessment of what is achieved or produced experimentally.
Several assays for nuclear components, cellular and membrane systems are presented,together with the assembly of cytoskeletal proteins. In addition, protocols relating toin vitro collagen fibrillogenesis, amyloid-β fibrillogenesis, amyloid-β-enzyme interactionand amyloid-β phosphorylation are also included.
Because of the diversity of this material, most protocols (or a small group of protocols)includes a brief introduction, its own list of references and sometimes examples of typicaldata. It is hoped that these protocols will enable the book to indicate a way ahead forcell biology, as an addition to the well-used classical procedures dealing with cells andsubcellular components presented in the other chapters of the book.

PROTOCOL 6.1
Nucleosome assembly coupled to DNA repairsynthesis using a human cell free system
Genevieve Almouzni and Doris Kirschner
Introduction
The assembly of nucleosomes onto DNA,in two steps, involves the loading of aH3–H4 histone tetramer followed by thesubsequent addition of two H2A–H2Bhistone dimers. In vivo, histone deposi-tion is promoted by histone chaperones,among which the evolutionary conservedthree-subunit complex called the chromatinassembly factor 1 (CAF-1) is the only onethat links nucleosome formation to DNAsynthesis.
Here we describe an assay to moni-tor nucleosome assembly coupled to DNArepair in a human cell free system. Thenucleotide excision repair (NER) pathwayused in this assay repairs most of the UV-photoproducts (mainly cyclobutane pyrim-idine dimers and 6–4 photoproducts) canbe reproduced in vitro [4, 6].
A cell free extract (cytosolic extract)derived from Hela cells is thus used for itsability to support NER reactions on a dam-aged DNA template. This extract, however,cannot ensure the assembly into chromatinof the repaired DNA molecules. It canbe complemented using either a nuclearextract as a crude source of assembly fac-tors or using purified recombinant assem-bly factors such as CAF-1 [1, 3].
Reagents
Agarose (Ultra Pure, Sigma)
Ammonium acetate (5 M)
100 mM ATP (Pharmacia) stored at −80 ◦C(each aliquot is used only once)
Bacculovirus produced recombinant CAF-1 4 ng/µl [5]
Creatine phosphokinase (Boehringer) 2.5mg/ml in H2O 1©
Cytosolic extracts derived from HeLacells [2] 2© 3©
Ethidium bromide, 10 mg/ml (GIBCOBRL)
Glycogen, 20 mg/ml (Roche), store at−20 ◦C
Loading buffer 5×: 0.42% bromophenolblue, 50% glycerol
Nuclear extracts from HeLa (4C Biotech/Belgium or [2])
αP32 dCTP, 3000 Ci/mmol (ICN)
Phenol : chloroform : isoamyl alcohol(25 : 24 : 1) (GIBCO BRL)
Proteinase K, 20 mg/ml (Roche), aliquotsstored at −20 ◦C
5× Reaction buffer: 25 mM MgCl2, 200mM Hepes-KOH (pH 7.8), 2.5 mMdithiothreitol (DTT; Sigma), 200 mMphosphocreatine (di-Tris salt, Sigma) 1©
RNase A (Roche) 10 mg/ml in 0.01 Msodium acetate (pH 5.2), heat for 15 minat 100 ◦C and adjust the pH with 1 volof Tris-HCL (pH 7.4), aliquots stored at−20 ◦C

PROTOCOL 6.1 205
Stop-mix: 30 mM EDTA, 0.7% SDS
TAE 50×: 242 g Tris base, 57.1 ml glacialacetic acid, 37.2 g Na2EDTA, (pH 8.0),adjust to a final volume of 1 l withdeionized water (or 50× TAE from BioMedia)
TE: 10 mM Tris-HCl (pH 8.0), 1 mMEDTA (pH 8.0)
UV treated Bluescript plasmid (pBS) DNA(50 ng/µl) 4© [1]
Equipment
Eppendorf thermomixer 5436
Eppendorf tubes (1.5 ml, siliconized) (pre-cooled on ice)
Gelbox (35 × 20 cm, Biorad)
Germicidal lamp with a 254 nm peak(Philips)
Microfuge (e.g. Eppendorf centrifuge5451)
3 MM Paper (Whatman)
Phosphoimager (Storm 860–MolecularDynamics), and Image Quant 5.2 soft-ware (or films and standard film devel-oper)
Power supply (Pharmacia Biotech, EPS3500)
UV transilluminator (BIORAD Gel Doc2000) equipped with a camera
Vacuum gel dryer (slab gel Dryer, SGD2000, SAVANT)
Waterbath (e.g. polystat, Bioblock Scien-tific)
Procedure
A standard reaction contains 150 ng ofplasmid DNA, 4© 200–400 µg of cytoso-lic extract, 5 mM MgCl2, 40 mM Hepes-KOH (pH 7.8), 0.5 mM DTT, 40 mMphosphocreatine, 4 mM ATP, 2.5 µg crea-tine phosphokinase and 5 µCi α32P dCTPin 25 µl.
1. First, to prepare the DNA-mix, in aprecooled Eppendorf tube, assembleon ice the following reagents (preparea proportionally larger mix for morethan one reaction). 1©DNA-mix (amounts for one reaction):3 µl DNA (50 ng/µl), 5 µl 5× reac-tion buffer, 1 µl ATP, 1 µl creatinekinase, 2.5 µl dilution buffer 3©
2. For each reaction, distribute 1 µl ofHeLa nuclear extract to precooledEppendorf tubes on ice (or a proteincomplex to test for nucleosome assem-bly or buffer controls). In an assaydesigned for an antibody inhibitionstrategy, you can add the antibodiesor the appropriate control serum at thisstep. 5©
3. Add 10 µl of the cytosolic extract (assource of histones and repair factors)to each tube except to the DNAonly control in which buffer is addedinstead. To preserve optimal activity ofcytosolic extracts, defrost the extractjust prior to use, work quickly anddiscard any remaining material. 2©
4. Add α32P dCTP to the prepared DNA-mix (0.5 µl for 150 ng DNA), homog-enize gently by pipetting up and down.
5. Start the reaction by adding 13 µlof DNA-mix containing the labelledprecursor to each reaction tube, andimmediately transfer to a preheatedwater bath, or to a thermo-mixer at37 ◦C for a 3 h incubation, see note6 and ref. 1.
6. Stop the reaction with 50 µl of stop-mix and 25 µl of H2O.
7. Add 5 µl of RNase A (at 2 mg/ml)and incubate 30 min at 37 ◦C.
8. Add 2 µl of proteinase K (at 20 mg/ml)and incubate 30 min at 37 ◦C. 7©
9. Add 110 µl of phenol : chloroform :isoamyl alcohol (25 : 24 : 1) and vortex

206 IN VITRO TECHNIQUES
each tube at least 10 s. Centrifuge10 min at 14 000g in the Eppendorfcentrifuge at room temperature andrecover 90 µl of the aqueous phase ina fresh Eppendorf tube; do not takeany of the interphase.
10. Precipitate the DNA by adding of90 µl ammonium acetate (5 M), 1 µlof glycogen (20 mg/ml) and 300 µl (2vol) of ice-cold ethanol, leave 30 minat −20 ◦C.
11. Centrifuge 30–45 min at 14 000g at4 ◦C, recover the DNA pellet, washwith 500 µl of cold 70% ethanol, cen-trifuge for 5–10 min at 14 000 g at4 ◦C. Remove the supernatant care-fully and air-dry the pellet.
12. Dissolve the pellet in 8 µl of TE bufferand add 2 µl of 5× loading dye.
13. Prepare a 1% agarose gel in 1× TAEwithout ethidium bromide (EtBr). 8©9©
14. Load the samples and migrate at 1.5 V/cm for 20 h at 4 ◦C overnight, for opti-mal resolution of the topoisomers. 7©
15. Soak the gel in EtBr staining solution(1µg/ml), rinse for 30 min in waterat room temperature, and place thegel on a UV transilluminator systemequipped with a camera to visualizethe migration pattern of the total DNAand make your image acquisition.
16. Transfer the gel onto a 3 MM What-man paper of equal size, cover withsaran wrap and dry for 2 h at 80 ◦C ina vacuum gel dryer. Expose the cov-ered and dried gel to a Phosphoimagerscreen to visualize the labelled DNA(repaired), if not available use an X-ray film. Quantification of the topoiso-mer distribution is carried out on boththe labelled DNA (repaired) and thetotal DNA by densitometric scanningof the images. 10©
Notes
1© Thawing and freezing of the 5×reaction buffer alter the concentrationof DTT, phosphocreatine and dNTPs.The buffer is prepared in advance,aliquoted and stored at −80 ◦C, useonly once.
2© Cytosolic and nuclear extracts are pre-pared from unsynchronized adherentHeLa cells, under cooling conditions(4 ◦C), for a detailed protocol see [2].The protein concentration is deter-mined by Bradford assay and usuallyranges between 10 and 20 mg/ml [2].Small aliquots of 50–100 µl frozen inliquid nitrogen are stored at −80 ◦C toavoid waste.
3© The cytosolic extract used in thisassay, which contains only traceamounts of p60 and p150, needs to becomplemented with the nuclear extractor bacculovirus recombinant CAF-1 toensure an efficient chromatin assem-bly coupled to DNA repair synthe-sis [1]. For each extract, optimal con-ditions for both chromatin assemblyand DNA repair synthesis have tobe adjusted (protein/DNA ratio andionic conditions). For example, thecomposition of the dilution buffer forcommercial (4C) HeLa nuclear extractis: 20 mM Hepes (pH 7.8), 100 mMKCl, 0.2 mM EDTA, 0.2 mM PMSF,0.5 mM DTT and 20% glycerol. Thishas to be taken into account.
4© Plasmid DNA is treated with germi-cidal UV light (Philips) with 254 nmpeak and a dose of 500 J/m2. The gen-eral estimation of DNA damage pro-duced by 100 J/m2 is roughly 1 pyrim-idine dimer photoproduct per 1000 bp(the ratio is about 0.75 cyclobutanepyrimidine and 0.25 of 6-4 photoproduct) [1, 5].

PROTOCOL 6.1 207
Topoisomerdistribution of
labelledDNA
Topoisomerdistribution of
totalDNA
1 2 3 4 5 6 7
−Ir/II
−I
−Ir/II
−I
NECAF-1PIanti-p60anti-p150 − − − − − +
− − − − + −− − − + − −− − + − − −− + − + + +
Figure 6.1 Chromatin assembly coupled to nucleotide excision repair synthesis mediated by CAF-1.UV-damaged DNA substrate was incubated in cytosolic extract (CE) competent for NER and comple-mented with nuclear extracts (NE) or recombinant CAF-1 to ensure the nucleosome assembly reaction.Lane 1 shows a DNA-only control (supercoiled DNA molecules) and lane 2 the DNA after incubationwith cytosolic extract, which promotes the relaxation of the DNA and NER, which is visualized by theincorporation of radiolabelled nucleotides. Subsequent supercoiling of the repaired DNA is dependentupon addition of CAF-1, either as nuclear extract (lane 3) or as recombinant complex (lane 4). In thisassay the CAF-1 dependent nucleosome formation was largely impaired by the addition of 1 µl ofpolyclonal antibodies directed respectively against the p60 subunit (lane 6) or the p150 subunit (lane7) of CAF-1 and compared with a pre-immune (PI) serum (lane 5). Total DNA is visualized afterethidium bromide staining (lower panel) and radiolabel incorporation due to repair synthesis (labelledDNA) is visualized on a phosphoimager screen of the dried gel (upper panel). Relaxed/nicked circularDNA (Ir/II) and supercoiled DNA (I) are indicated
5© When antibodies are used as in Figure6.1, the quantity added has to be
adjusted for each serum or clone.
6© Nucleotide excision repair as followedby the DNA synthesis and chromatin
assembly reactions is usually com-pleted after 3 h. Although specificUV-dependent nucleotide incorpora-tion can be detected already after15 min, the chromatin assembly reac-tion is a slower process [1].

208 IN VITRO TECHNIQUES
7© To monitor chromatin assembly, thesupercoiling assay makes use of thetopological properties of closed circu-lar molecules. In the extracts, whichcontain topoisomerase activity, thedeposition of nucleosomes inducestopological stress that is relievedprogressively. Therefore, after depro-teinization, accumulation of topoiso-mers with an increasing number ofnegative supercoils can be used asan indication of the effectiveness ofthe assembly reaction. The repairedmolecules (labelled DNA) are com-pared to the bulk DNA (total DNA)to evaluate a differential effect.
8© The concentration of the agarose gelis adjusted according to the size of theplasmid used. As a guideline, use 1%agarose gels for plasmids of 3–4 kband 0.8% gels for plasmids of 6–7 kbin size.
9© It is crucial to run the supercoiling gelin the absence of EtBr. This interca-lating agent would interfere with theanalysis of the topological state of themolecules.
10© The radiolabelled DNA correspondsto incorporation of nucleotides dur-ing repair synthesis (one of the stepsin NER) and can be analysed quan-titatively and qualitatively using theImage Quant 5.2 software. Adapt theexposure time depending on the repairefficiency of the extract used. A higherproportion of supercoiled molecules inthe radiolabelled DNA as compared tototal DNA is indicative of a preferen-tial assembly of repaired molecules,
reflecting a link between repair syn-thesis and nucleosome assembly.
References
1. Gaillard, P. H., Roche, D. M. and Almouzni,G. A. (1999) Meth. Mol. Biol., 119, 231–243.
2. Martini, E., Roche, D. M., Marheineke, K.,Verreault, A., and Almouzni, G. A. (1998)Recruitment of phosphorylated chromatin as-sembly factor 1 to chromatin after UV irra-diation of human cells. J. Cell Biol., 143,563–575.
3. Mello, J. A., Sillje, H. H., Roche, D. M.,Kirschner, D. B., Nigg, E. A. and Almouzni,G. A. (2002) Human Asf1 and CAF-1 inter-
act and synergize in a repair-coupled nucle-osome assembly pathway. EMBO Rep. 3(4),329–334.
4. Moggs, J. G. and Almouzni, G. A. (1999) As-says for chromatin remodeling during DNArepair. Meth. Enzymol., 304, 333–351.
5. Verreault, A., Kaufman, P. D., Kobayashi, R.and Stillman, B. (1996) Nucleosome assemblyby a complex of CAF-1 and acetylated histonesH3/H4. Cell, 87, 95–104.
6. Wood, R. D., Biggerstaff, M. and Shivji,M. K. K. (1995) Detection and measurement
of nucleotide excision repair synthesis bymammalian cell extracts in vitro. Methods: ACompanion to Methods Enzymol., 7, 163–175.
Acknowledgements
We thank Alain Verreault for the generousgift of CAF-1, Jill Mello for advice andCatherine Green for reading and criticalcomments. D.B.K. was supported by theEEC-RTN (to G.A.), the team of G.A. issupported by the Ligue Contre le Cancer,Euratom, EU-RTN and LCR of CEA.

PROTOCOLS 6.2–6.4
Immunocytochemical studies of DNAreplication in mammalian nuclei
Daniela Dimitrova
Introduction
Indirect immunofluorescent staining ofnewly synthesized DNA and/or proteins ofthe replication machinery has emerged asa powerful technique for identification ofproliferating cells [1] and for cancer diag-
nosis or prognosis [2, 3], as well as forstudies of cell cycle kinetics [1, 4], intra-S-phase checkpoint control [5], organizationof nuclear DNA replication sites [6, 7],establishment and execution of the tempo-ral program for chromosomal DNA repli-cation during the S-phase [8].

PROTOCOL 6.2
Single labelling of nascent DNA withhalogenated thymidine analogues
Reagents
Phosphate-buffered saline (PBS): 8 g NaCl,0.2 g KCl, 1.44 g Na2HPO4 and 0.24 gKH2PO4 per litre at pH 7.2
PBS-T: PBS containing 0.5% (v/v) Tween20 (Sigma)
Halogenated nucleosides: stock solutionsof 10 mg/ml of 5-bromo-2′-deoxyuri-dine (BrdU, Sigma), 5-chloro-2′-deoxy-uridine (CldU, Sigma), or 5-iodo-2′-deoxyuridine (IdU, Sigma) are preparedin cell culture medium (without serum)at pH 7.2. Store frozen at −20 ◦C insmall aliquots
Antibodies: (A) Mouse anti-BrdU (No.347580; Becton Dickinson) is used fordetection of BrdU, CldU and IdU [1].(B) Rat anti-BrdU (MAS250b; Harlan-Sera lab) is used for detection of BrdUand CldU [1]. (C) Secondary antibodies:FITC-conjugated donkey anti-rat IgG(No. 712-095-153; Jackson ImmunoRe-search Laboratories) or FITC-conjugateddonkey anti-mouse IgG (No. 715-095-151; Jackson ImmunoResearch Labora-tories) are used to detect the rat or mouseanti-BrdU antibodies, respectively
Blocking buffer: to suppress non-specificbinding of antibodies to coverslips orto cellular material, antibody dilutionsare made in PBS containing 2% bovineserum albumin and either 10% normaldonkey serum, or 10% fetal bovine
serum. Supplement with NaN3 at 1 mMfinal concentration and store at 4 ◦C
DNA staining dye: a stock solution of1 mg/ml of 4′,6-diamidino-2-phenylin-dole (DAPI; Sigma) is prepared inddH2O and stored frozen in smallaliquots at −20 ◦C. A working solutionof 10 µg/ml can be kept at 4 ◦C
Materials and equipment
Sterile glass coverslips
Cell culture dishes and medium
A pair of fine sharp forceps
Dark humid incubation chamber
Plain glass slides (3 × 1′′)Mounting medium for fluorescent micro-
scopy, e.g. Vectashield (Vector Labora-tories)
Epifluorescent microscope
Procedure1. Grow cells directly on glass cover-
slips 1© submerged in medium insidecell culture dishes. 2© Multi-welldishes can be used if cell cultures needto be grown in separate chambers.Alternatively, several coverslips canbe placed within a single dish. Makesure that the coverslips do not overlap.
2. Add the nucleotide precursor of choice(i.e. BrdU, CldU or IdU) to the culturemedium to a final concentration of

PROTOCOL 6.2 211
10 µM. Mix gently by swirling thedish, taking care not to disturb thecoverslips, and quickly return the dishto the cell culture incubator.
3. Incubate at 37 ◦C for several min-utes to allow incorporation of thethymidine analogue into nascent DNAwithin the S-phase cells. 3©
4. Aspirate the medium and wash thecells with ice-cold PBS to stop thelabelling and to remove traces ofmedium and unincorporated nucleo-sides.
5. Fix the cells with cold 70% ethanol forat least 30 min at 4 ◦C. 4©
6. It is convenient to perform the subse-quent immunostaining steps by trans-ferring the desired number of cover-slips into multi-well dishes. In thisway many coverslips can be processedin batches, while ensuring easy andprecise tracking of the individual cov-erslips. 5©
7. Remove the ethanol and rinse the cellsonce with PBS.
8. Incubate the cells in 1.5 N HCl for30 min at room temperature. 6©
9. Remove the HCl and rinse severaltimes with ample volumes of PBS.Make sure that the pH is neutral at theend of the washing.
10. Wash once with PBS-T. 7©11. Remove the coverslips from the wells
of the dish and blot the excess liquidby placing them on a piece of softtissue (e.g. Kleenex or similar). Do nothandle more than five to six coverslipsat a time to avoid drying of the cells.
12. Invert each coverslip (cell sidedown) 8© over a drop of anti-BrdUantibody diluted in blocking solution.Drops of 3–4 µl, or 7–8 µl, work
well with 12 mm, or 18 mm cover-slips, respectively. Dilutions (usuallyin the range of 1 : 20–1 : 500) must beoptimized empirically for each anti-body. The drops can be placed onany type of clean hydrophobic sur-face, e.g. a piece of Parafilm. In caseswhen numerous coverslips must beprocessed simultaneously, it is best toinvert the coverslips onto microscopeglass slides, which can then be stackedinto tight-closing slide storage boxes.
13. Incubate for 1 h at room tempera-ture 9© in a humid chamber to pre-vent the cells from drying. A humidchamber can be improvised by plac-ing a layer of wet filter paper inside acovered plastic dish or along the innerside of the cover of a microscope slidestorage box.
14. Lift the coverslips carefully (avoiddragging along the surface, which cancause cell damage and/or loss) andreturn to the washing dish. Wash twicewith PBS-T.
15. Remove the coverslips from the wellsas described in steps 11–12 andplace over drops with an appro-priate fluorochrome-conjugated sec-ondary antibody diluted in blockingsolution (1 : 100–1 : 1000).
16. Incubate for 1 h at room temperaturein a dark humid chamber. 10©
17. Return the coverslips to the washingdish. Wash twice with PBS-T.
18. Counterstain the nuclei by incubatingin 0.2 µg/ml solution of DAPI inPBS for 10 min at room temperature.Alternatively, this step can be skippedand DAPI can be diluted directly inthe mounting medium.
19. Mount the coverslips (cell side down)over drops of Vectashield placed onclean microscope slides and observe
212 IN VITRO TECHNIQUES
using an epifluorescent microscope.Do not allow the coverslips to dry out.If long-term preservation is desired,blot excess mounting medium andseal the coverslips with colourless nailpolish. Store inside microscope slideboxes at 4 ◦C or at −20 ◦C. 11©
Notes
This procedure will take approximately5 h.
1© Use clean forceps when handling cov-erslips and always open the box withcoverslips under a laminar hood toavoid contaminations. If these condi-tions are observed, additional steriliza-tion of the coverslips is not usuallyrequired. However, if contaminationoccurs, the coverslips can be sterilizedby immersing in ethanol and flaming.
2© For best results, seed the cells ∼24 hbefore labelling to allow sufficienttime for attachment and good spread-ing of the cells. Seed the cellssparsely, so that the culture is ∼30–50% confluent at the time of labelling.This ensures optimal cell growth con-ditions and also helps to reduce non-specific background fluorescence.
3© The duration of the pulse woulddepend on the purpose of the exper-iment. Limit pulses to 2–5 min whenlabelling of short nascent DNA chainsclose to the replication forks is desired.Longer pulses (10–30 min), resultingin brighter staining, can be adminis-tered when the length of the labelledDNA segment is of no importance(e.g. for scoring the percentage of S-phase cells in the cell population).
4© Fixed cells can be stored indefinitelyunder these conditions, provided thatcare is taken not to allow the ethanol
to evaporate (e.g. seal the dishes withParafilm). After this step, it is criticalnot to allow the cells to dry out,since this will result in destruction ofcell/nuclear morphology.
5© The fragile coverslips must be handledcarefully during transfers to avoidbreaking. Use fine sharp-point forcepsto lift the coverslips from inside thewells of the dish. Keeping the wellsfull facilitates the process, since theliquid momentarily supports the liftedcoverslip in an upright position.
6© This step is critical for successfulimmunostaining. The brief HCl treat-ment causes mild depurination ofDNA, thus exposing the BrdU basesburied inside the double helix forbinding by the anti-BrdU antibodies.If staining is weak or absent, trou-bleshoot by increasing the HCl con-centration (e.g. incubate in 3 N HClfor 15 min at room temperature).
7© Typically, each washing step is per-formed for 5–10 min at room temper-ature. After incubations with fluoro-chrome-conjugated antibodies, thewashing steps must be performed inthe dark (e.g. cover the dishes withaluminum foil).
8© Since the small fragile coverslips arehard to mark, special attention mustbe paid to track the side on which thecells are attached and not to flip thecoverslips.
9© The incubation times are flexible. Toaccelerate the procedure, incubationscan be carried out for 30 min. at 37 ◦C.Alternatively, longer incubations (e.g.several hours, overnight, or up to fewdays) can be performed at 4 ◦C.
10© If a cell culture dish is used as a humidchamber, place a piece of aluminumfoil over it to prevent exposure to

PROTOCOL 6.2 213
light. Alternatively, place the dishinside a dark cabinet or drawer.
11© Two types of control experimentsmust be performed to eliminate thepossibility of non-specific immunos-taining:
(A) Perform the procedure with cellsthat have not been labelled with ahalogenated thymidine analogue,i.e. skip steps 1–3. No immuno-fluorescent signal should be vis-ible and all cells must appearunlabelled in the FITC (green)channel. The DAPI-stained nucleican be observed and/or counted inthe UV (blue) channel.
(B) Perform the procedure with cellsthat have been labelled witha halogenated thymidine ana-logue, but omit the primary anti-BrdU antibody, i.e. skip steps12–14. No immunofluorescentsignal should be visible andall cells must appear unlabelledin the FITC (green) channel.The DAPI-stained nuclei can beobserved and/or counted in theUV (blue) channel.
If non-specific fluorescent background ispresent:
(i) increase the number and/or durationof the washing steps;
(ii) decrease the concentration of theprimary or secondary antibodies;
(iii) test different batches of antibodies.
Safety precautions
Some chemicals used in the procedureare hazardous (e.g. HCl, Tween 20,
concentrated BrdU, IdU or CldU) andcontact with skin must be avoided. Weargloves when performing the procedure.
References
1. Aten, J. A., Bakker, P. J. M., Stap, J.,Boschman, G. A. and Veenhof, C. H. N. (1992)DNA double labelling with IdUrd and CldUrdfor spatial and temporal analysis of cellproliferation and DNA replication. Histochem.J., 24, 251–259.
2. Freeman, A., Morris, L. S., Mills, A. D., Stoe-ber, K., Laskey, R. A., Williams, G. H. andColeman, N. (1999) Minichromosome mainte-nance proteins as biological markers of dys-plasia and malignancy. Clin. Cancer Res., 5,2121–2132.
3. Hunt, D. P., Freeman, A., Morris, L. S., Bur-net, N. G., Bird, K., Davies, T. W., Laskey,R. A. and Coleman, N. (2002) Early recur-rence of benign meningioma correlates withexpression of mini-chromosome maintenance-2 protein. Br. J. Neurosurg., 16, 10–15.
4. Shibui, S., Hoshino, T., Vanderlaan, M. andGray, J. W. (1989) Double labeling with iodo-and bromodeoxyuridine for cell kinetics stud-ies. J. Histochem. Cytochem., 37, 1007–1011.
5. Dimitrova, D. S. and Gilbert, D. M. (2000)Temporally coordinated assembly anddisassembly of replication factories in theabsence of DNA synthesis. Nat. Cell Biol., 2,686–694.
6. Dimitrova, D. S. and Berezney, R. (2002) Thespatio-temporal organization of DNA replica-tion sites is identical in primary, immortalizedand transformed mammalian cells. J. Cell Sci.,115, 4037–4051.
7. Manders, E. M., Stap, J., Strackee, J., van Dri-el, R. and Aten, J. A. (1996) Dynamic behav-ior of DNA replication domains. Exp. CellRes., 226, 328–335.
8. Dimitrova, D. S. and Gilbert, D. M. (1999)The spatial position and replication timing ofchromosomal domains are both established inearly G1 phase. Mol. Cell, 4, 983–993.

PROTOCOL 6.3
Double labelling of DNA with differenthalogenated thymidine analogues
Reagents, materials and equipment
Most reagents and equipment are the sameas in Protocol 6.2.
Antibodies: in addition to the antibod-ies listed in Protocol 6.2, Texas Red-conjugated donkey anti-rat IgG (No.712-075-153; Jackson ImmunoRe-search Laboratories) or Texas Red-conjugated donkey anti-mouse IgG (No.715-075-151; Jackson ImmunoResearchLaboratories) are used to detect the rator mouse anti-BrdU antibodies, respec-tively
High-salt washing buffer (TNT): 50 mMTris-HCl, 0.5 M NaCl and 0.5% (v/v)Tween 20, pH 8
Procedure
1. Grow cells on coverslips as describedin step 1 of Protocol 6.2.
2. Add IdU to the culture medium toa final concentration of 10 µM. Mixgently by swirling the dish and quicklyreturn the dish to the cell cultureincubator.
3. Incubate at 37 ◦C for the desiredtime to allow IdU incorporation intonascent DNA within the S-phasecells. 1©
4. Aspirate the medium and rinse thecells two to three times with amplevolumes of warm (37 ◦C) PBS or
medium to remove all traces of exoge-nous IdU. 2©
5. Fill the dish with warm free mediumand return to the cell culture incubatorfor the desired period of time. 1©
6. Administer a second pulse-label byadding CldU 3© to the medium to afinal concentration of 10–100µM. 4© Mix gently by swirling thedish and quickly return the dish to thecell culture incubator.
7. Incubate at 37 ◦C for the desiredtime to allow CldU incorporation intonascent DNA. 1©
8. Aspirate the medium and wash thecells with ice-cold PBS to stop thelabelling and to remove traces ofmedium and unincorporated CldU.
9. Fix the cells with cold 70% ethanoland depurinate DNA following steps5–11 of Protocol 6.2. The subse-quent immunostaining procedure fordouble-labelled DNA generally fol-lows the protocol developed by Atenet al. [1].
10. Incubate the cells for 1 h at roomtemperature 5© with the rat anti-BrdU antibody diluted in blockingsolution. 6©
11. Wash twice with PBS-T. 7©12. Incubate the cells for 1 h at room
temperature with the FITC-conjugated

PROTOCOL 6.3 215
donkey anti-rat IgG diluted in block-ing solution.
13. Wash twice with PBS-T.
14. Incubate the cells for 1 h at roomtemperature with the mouse anti-BrdUantibody 8© diluted in blocking solu-tion.
15. Wash twice with TNT.
16. Wash once with PBS-T.
17. Incubate the cells for 1 h at roomtemperature with the Texas Red-conjugated 9© donkey anti-mouse IgGdiluted in blocking solution.
18. Wash twice with PBS-T.
19. Counterstain the nuclei with DAPI andmount the coverslips as described insteps 18–19 of Protocol 6.2. Observeusing an epifluorescent microscope. 10©
Notes
Depending on the length of the chaseperiod, this procedure may take fromseveral hours to several days.
1© The duration of the pulse and chaseperiods is determined by the purposeof the experiment. When culturedduring long chase periods (e.g. severaldays), the cells must be passaged toensure proper cell density and optimalgrowth conditions. In this case, thecells are initially grown directly intissue culture dishes during the firstlabel and most of the chase period, andare subsequently seeded on coverslips,preferably ∼24 h before the secondlabel.
2© When followed by long chase peri-ods (>2 h), 200 µM thymidine canbe added to the PBS during the firstwashing step to promote the immedi-ate cease of IdU incorporation. How-ever, use of concentrated thymidine is
not recommended when short chaseperiods (≤1 h) separate the two labels,because it prevents the efficient incor-poration of CldU during the secondpulse-label.
3© The order of addition of IdU andCldU is of no importance and can bereversed.
4© Following short chase periods (<1 h),it is recommended to use higherconcentrations of CldU (e.g. 100 µM)during the second label to ensurethe preferential incorporation of CldUover any residual IdU persisting insidethe cells.
5© All incubations must be performedin a dark humid chamber to preventthe cells from drying and the fluo-rochromes from bleaching. See alsonote 9 in Protocol 6.2.
6© The final concentrations must be opti-mized for each batch of antibodies.Start by testing primary antibody dilu-tions in the range of 1 : 20–1 : 500,and secondary antibody dilutions inthe range of 1 : 100–1 : 1000.
7© Typically, each washing step is per-formed for 5–10 min at room temper-ature. After incubations with fluoro-chrome-conjugated antibodies, thewashing steps must be performed inthe dark (e.g. cover the dishes withaluminum foil).
8© The order of incubation with theprimary rat and mouse anti-BrdUantibodies is important [1] and thesequence described in the proceduremust be followed strictly.
9© The exact combination of fluorochro-me-conjugated secondary antibodiesused to detect the rat and mouse anti-BrdU antibodies is of no importanceand fluorochromes can be selectedat freedom with consideration for

216 IN VITRO TECHNIQUES
the specific needs of each individualexperiment (e.g. Texas Red-conjugat-ed donkey anti-rat IgG in combinationwith FITC-conjugated donkey anti-mouse IgG can be used with equalsuccess). When choosing secondaryantibodies, however, it is essentialto select the highly cross-adsorbedforms to avoid non-specific cross-species reactivity.
10© Three types of control experimentsmust be performed to eliminate thepossibility of non-specific immunos-taining:
(A) Perform the complete procedurewith cells that have not beenlabelled, i.e. skip steps 1–8. Noimmunofluorescent signal shouldbe visible and all cells mustappear unlabelled in the FITC(green) and Texas Red (red) chan-nels. The DAPI-stained nucleican be observed and/or countedin the UV (blue) channel. Thisexperiment will control for non-specific reactivity by all antibod-ies.
(B) Perform the procedure with cellsthat have been labelled witha single halogenated thymidineanalogue (e.g. either IdU orCldU). Incubate the cells withthe primary anti-BrdU antibody,which recognizes the respectivehalogenated nucleoside (e.g. themouse anti-BrdU antibody in thecase of IdU labelling, or the ratanti-BrdU antibody in the caseof CldU labelling). Then use‘the wrong secondary antibody’,i.e. the FITC-conjugated donkeyanti-rat IgG to detect the mouseanti-BrdU antibody within IdU-labelled cells, or the Texas Red-conjugated donkey anti-mouseIgG to detect the rat anti-BrdU
antibody within CldU-labelledcells. No immunofluorescent sig-nal should be visible and allcells must appear unlabelled inthe FITC (green) and Texas Red(red) channels. This experimentwill provide control for the speci-ficity of the secondary antibodies.
(C) Perform the complete procedurewith cells that have been labelledwith a single halogenated thymi-dine analogue (e.g. either IdUor CldU). The positive (S-phase)nuclei must be stained in onecolour only, i.e. nuclei must bestained only in red within IdU-labelled cells, or only in greenwithin CldU-labelled cells. Thisexperiment will provide controlfor the specificity of the primaryantibodies.
If non-specific fluorescent background ispresent:
(i) increase the number and/or durationof the washing steps;
(ii) decrease the concentration of theprimary or secondary antibodies;
(iii) test different batches of antibodies.
Safety precautions
Some chemicals used in the procedure arehazardous (e.g. HCl, Tween 20, concen-trated BrdU, IdU or CldU) and contact withskin must be avoided. Wear gloves whenperforming the procedure.
Reference
1. Aten, J. A., Bakker, P. J. M., Stap, J.,Boschman, G. A. and Veenhof, C. H. N. (1992)DNA double labelling with IdUrd and CldUrdfor spatial and temporal analysis of cellproliferation and DNA replication. Histochem.J., 24, 251–259.

PROTOCOL 6.4
Simultaneous immunostaining of proteinsand halogen-dU-substituted DNA
Reagents, materials and equipment
Most reagents and equipment are the sameas in Protocols 6.2 and 6.3.
1. Antibodies: in addition to the antibod-ies listed in Protocols 6.2 and 6.3,primary antibodies recognizing spe-cific cellular proteins must be avail-able. Appropriate highly cross-adsorbedfluorochrome-conjugated secondary an-tibodies must also be obtained to detectthe respective primary antibodies.
2. Fixative: use fresh formaldehyde solu-tion prepared by depolymerization ofparaformaldehyde (Sigma). Formalde-hyde is toxic and the fixative must beprepared in a chemical fume hood. Toprepare 100 ml 4% formaldehyde inPBS, dissolve 4 g paraformaldehyde in∼40 ml ddH2O by heating to 60–65 ◦Cand vigorous mixing. Add 10 N NaOHdrop by drop until the white powderis completely dissolved (around neutralpH). Remove from the heat and add50 ml of 2× concentrated PBS. Adjustthe pH to 7.2, then bring to 100 mlby adding ddH2O. The fixative can bestored at 4 ◦C for 1–2 weeks.
3. Permeabilizing solution: 0.5% (v/v) Tri-ton X-100 (Sigma) in PBS.
Procedure1. Grow cells on coverslips as described
in step 1 of Protocol 6.2.
2. Depending on the purpose of theexperiment, single- or double-label thecells with CldU and/or IdU followingthe procedures described in Protocols6.2 and 6.3.
3. Aspirate the cell culture medium andwash the cells with ice-cold PBS.
4. Remove the PBS and add appropriatefixative. 1© Three frequently usedfixatives are described below, butother reagents or combinations offixatives can be tested.
Incubate the cells in:
(A) 4% formaldehyde in PBS for10 min, 2© or
(B) cold methanol for 30 min. at−20 ◦C, or
(C) cold ethanol : acetic acid (19 : 1)for 30 min at −20 ◦C.
5. Remove the fixative and wash severaltimes with ample volumes of PBS.
6. Incubate the cells for 10 min at roomtemperature with permeabilizing solu-tion 3© to ensure access of the anti-bodies to their targets. 4©
7. Remove the permeabilizing solutionand wash several times with amplevolumes of PBS.
8. Incubate the cells for 1 h at room tem-perature 5© with a primary antibody(diluted in blocking solution 6©) thatrecognizes the protein of interest.
9. Wash twice with PBS-T. 7©

218 IN VITRO TECHNIQUES
10. Incubate the cells for 1 h at roomtemperature with appropriate fluoro-chrome-conjugated secondary anti-body to detect the protein target-boundprimary antibody.
11. Wash twice with PBS-T.
12. Fix the cells again with 4% formalde-hyde in PBS for 10 min. 8©
13. Remove the fixative and wash severaltimes with ample volumes of PBS.
14. Incubate the cells in 3 N HCl for15 min at room temperature to depuri-nate DNA.
15. Remove the HCl and rinse severaltimes with ample volumes of PBS.Make sure that the pH is neutral at theend of the washing.
16. Wash once with PBS-T.
17. Depending on the type of DNAlabelling, follow steps 11–17 of Pro-tocol 6.2, or steps 10–18 of Protocol6.3 to immunostain the halogen-dU-substituted DNA.
18. Counterstain the nuclei with DAPI andmount the coverslips as described insteps 18–19 of Protocol 6.2. Observeusing an epifluorescent microscope. 9©
Notes
Depending on the length of the pulse/chaseperiod(s), this procedure may take fromseveral hours to several days.
1© Since the immunostaining of halogen-dU-substituted DNA is not dependenton the fixation method, the choice offixative is dictated by the propertiesand sensitivity of the protein target.Try several different fixation proce-dures when testing new primary anti-bodies.
2© The type, concentration and tempera-ture of fixative and the length of treat-ment need to be determined empiri-cally for each protein.
3© Treatment with acetone for 1–2 mincan be used as an alternative to Triton-PBS.
4© Since methanol and ethanol both fixand simultaneously permeabilize thecells, additional permeabilization isusually not required.
5© All incubations must be performedin a dark humid chamber to preventthe cells from drying and the fluo-rochromes from bleaching. See alsonote 9 in Protocol 6.2.
6© The final concentrations must be opti-mized for each antibody. Start bytesting primary antibody dilutions inthe range of 1 : 10–1 : 500, and sec-ondary antibody dilutions in the rangeof 1 : 100–1 : 1000.
7© Typically, each washing step is per-formed for 5–10 min at room temper-ature. After incubations with fluoro-chrome-conjugated antibodies, thewashing steps must be performed inthe dark (e.g. cover the dishes withaluminum foil).
8© During this step, the antibodies usedto detect proteins are covalently fixedin their positions. It is essential to per-form the immunostaining in this order,since the subsequent depurination ofDNA with HCl can be destructive formany cellular components and, if per-formed first, can cause the loss orredistribution of protein antigen epi-topes [1, 2].
9© Control experiments similar to thosedescribed in note 11 of Protocol 6.2and note 10 of Protocol 6.3 must beperformed to test the specificity of allantibodies.

PROTOCOL 6.4 219
Safety precautions
Some chemicals used in the procedure arehazardous (e.g. HCl, Tween 20, concen-trated BrdU, IdU or CldU) and contact withskin must be avoided. Wear gloves whenperforming the procedure. Formaldehydesolutions must be prepared and handled ina chemical fume hood.
References
1. Dimitrova, D. S. and Berezney, R. (2002) Thespatio-temporal organization of DNA replica-tion sites is identical in primary, immortalizedand transformed mammalian cells. J. Cell Sci.,115, 4037–4051.
2. Humbert, C. and Usson, Y. (1992) EukaryoticDNA replication is a topographically orderedprocess. Cytometry, 13, 603–614.

PROTOCOL 6.5
Uncovering the nuclear matrix in cultured cells
Jeffrey A. Nickerson, Jean Underwood and Stefan Wagner
Introduction
Nucleic acid metabolism is temporallyand architecturally organized in the cellnucleus on two nucleic acid contain-ing structures: the DNA containing chro-matin and an RNA containing fibrogran-ular ribonucleoprotein (RNP) network [1].This RNP network seen in unextractednuclei by selective staining for RNA is thenuclear matrix (reviewed in ref. 2). Elec-tron microscopy shows that the RNP net-work consists of interconnected structuresincluding the splicing factor-rich interchro-matin granule clusters and the perichro-matin fibrils which are enriched in newtranscripts [1, 3].
The spatial distribution of nuclear doma-ins where transcription, RNA splicing,DNA replication and other nuclear func-tions occur, remains unchanged after theremoval of chromatin, suggesting thatthe nuclear matrix and not chromatin isthe fundamental structure organizing thenucleus (reviewed by Nickerson [2]). Overthe years numerous protocols have beendeveloped to separate the nuclear matrixfrom chromatin, based on the first pro-cedure of Berezney and Coffey [4]. Aconservative nuclear matrix preparationshould preserve the ultrastructure of theRNP network. In this protocol, we presenttwo methods for uncovering the nuclearmatrix in cultured cells. The first uncov-ers a structure with excellent preserva-tion of RNP network ultrastructure [5].
This is achieved by cross-linking proteinsbefore the removal of chromatin. Thesecond method, performed without cross-linking, is less conservative and removesmore proteins but reveals that the nuclearmatrix is constructed on an underlying net-work of branched 10 nm filaments [6] (seeFigure 6.2).
ReagentsElectron microscopy grade formaldehyde
(16% w/v solution stored under inertgas) Ted Pella (cat. no. 18505)
RNase-free DNase I, e.g. Roche (cat. no.776 785)
Serine protease inhibitor, 4-(2-aminoethyl)benzenesulfonyl fluoride (AEBSF),Roche under the trade name PefablocSC, or from Sigma-Aldrich (cat. no.76307)
Triton X-100, protein grade, as a 10%solution from Roche
Other extraction chemicals (Roche)
Vanadyl riboside complex (VRC), Sigma-Aldrich Co. (cat. no. 94740) or NewEngland Biolabs (cat. no. S1402S)
Solutions
Cytoskeletal buffer: (10 mM PIPES, pH6.8, 300 mM sucrose, 100 mM NaCl, 3 mMMgCl2 and 1 mM EGTA)
To make 1 l of the stock solution use3.024 g of PIPES, 102.69 g of sucrose,

PROTOCOL 6.5 221
(a)
(b)
Figure 6.2 The ultrastructure of the cross-link stabilized nuclear matrix. The nuclear matrix of a CaSkicell was prepared by the cross-link stabilized nuclear matrix preparation procedure and visualized byresinless section electron microscopy. (a) The nuclear matrix consisted of two parts, the nuclear lamina(L) and a network of intricately structured fibres connected to the lamina and well distributed throughthe nuclear volume. The matrices of nucleoli (Nu) remained and were connected to the fibres of theinternal nuclear matrix. Three remnant nucleoli may be seen in this section. Few intermediate filamentswere connected to the outside of the lamina. (b) Seen at higher magnification the highly structuredfibres of the internal nuclear matrix seemed to be built on an underlying structure of 10 nm filamentswhich are occasionally branched. These were seen most clearly when, for short stretches, they werefree of covering material (arrowheads). The classical nuclear matrix procedure, when used with the2 M NaCl step, uncovers this network of core filaments. The bar shown in panel (a) represents 1 µMand in panel (b) it is 100 nm. This figure is reproduced with permission from ref. 6
5.844 g of NaCl, 0.6099 g of MgCl2·6H2O and 0.3804 g of EGTA. Titrate topH 6.8 with 1 M NaOH. Freeze in aliquotsat −20 ◦C.
Before use VRC is added to a finalconcentration of 2 mM from the 100×stock solution, and AEBSF is added toa final concentration of 1 mM from the100× stock solution. Additionally, for
some experiments Triton X-100 is addedto a final concentration of 0.5% from the20× stock solution.
Extraction buffer: (10 mM PIPES, pH 6.8,250 mM ammonium sulfate, 300 mMsucrose, 3 mM MgCl2, 1 mM EGTA)
To make 1 l of this stock solution use3.024 g of PIPES, 102.69 g of sucrose,

222 IN VITRO TECHNIQUES
33.035 g of ammonium sulfate, 0.6099 gof MgCl2·6H2O, and 0.3804 g of EGTA.Titrate to pH 6.8 with 1 M NaOH. Freezein aliquots at −20 ◦C.
Prior to use, Triton X-100 is added to afinal concentration of 0.5% from the 20×stock solution, VRC is added to a finalconcentration of 2 mM from the 100×stock solution, and AEBSF is added toa final concentration of 1 mM from the100× stock solution.
Digestion buffer: (10 mM PIPES, pH 6.8,300 mM sucrose, 50 mM NaCl, 3 mMMgCl2, 1 mM EGTA)
To make 1 l of this stock solution use3.024 g of PIPES, 102.69 g of sucrose,2.922 g of NaCl, 0.6099 g of MgCl2·6H2O and 0.3804 g of EGTA. Titrate topH 6.8 with 1 M NaOH. Freeze in aliquotsat −20 ◦C.
Before use, Triton X-100 is added to afinal concentration of 0.5% from the 20×stock solution, VRC is added to a finalconcentration of 2 mM from the 100×stock solution, and AEBSF is added toa final concentration of 1 mM from the100× stock solution.
2M NaCl buffer: (10 mM PIPES, pH 6.8,300 mM sucrose, 2 M NaCl, 3 mM MgCl2,1 mM EGTA)
To make 1 l of this stock solution use3.024 g of PIPES, 102.69 g of sucrose,116.88 g of NaCl, 0.6099 g of MgCl2·6H2O and 0.3804 g of EGTA. Titrate topH 6.8 with 1 M NaOH. Freeze in aliquotsat −20 ◦C.
Before using, VRC is added to a finalconcentration of 2 mM from the 100×stock solution and AEBSF is added toa final concentration of 1 mM from the100× stock solution.
Triton stock: (10% (w/v) Triton X-100)
This is a 20× stock solution frozen inaliquots at −20 ◦C.
VRC stock: (200 mM Vanadyl ribosidecomplex)
This is a 100× stock solution frozen inaliquots at −20 ◦C.
AEBSF Stock: (100 mM4-(2-Aminoethyl)-benzenesulfonylfluoride, hydrochloride)
This is a 100× stock solution frozen inaliquots at −20 ◦C.
To prepare the 100× stock solution, dis-solve 100 mg in 4 ml water. Other pro-tease inhibitors can be added if proteoly-sis is suspected. Do not use EDTA sincedivalent ions are necessary for structuralintegrity.
Phosphate buffered saline: (10 mMNa2HPO4, 1 mM KH2PO4, 137 mM NaCland 2.7 mM KCl)
To make 1 l use 1.420 g of Na2HPO4,0.136 g of KH2PO4, 8.006 g of NaCl and0.2013 g of KCl. Autoclave and store inaliquots at room temperature.
Formaldehyde fixative: (4% solution)
The 4% formaldehyde fixative is preparedfresh, just before use in cytoskeletal bufferfrom a stock solution of 16% formaldehyde(EM-grade) stored under an inert gas.Alternatively, fresh formaldehyde can beprepared from paraformaldehyde powder.
Equipment
Tissue culture incubator
Low-speed centrifuge (for suspension cells)
PROTOCOL 6.5 223
Procedure
Cells grown in monolayers, either on cov-erslips or in dishes, can be extracted byexchanging solutions. Suspension cells orcells removed from a growth surface canbe sequentially processed by centrifuga-tion, removal of the supernatant and resus-pension in the next solution. 1© These pro-cedures, as presented, uncover the nuclearmatrix in whole cells without prior nuclearisolation. This allows the best preservationof ultrastructure and reveals the nuclearmatrix–intermediate filament scaffold [7].This consists of an internal nuclear matrixand the intermediate filaments of thecytoskeleton integrated into a single cell-wide structure by their attachments to thenuclear lamina. The same procedures can,however, be used to extract isolated nucleiin suspension and this is sometimes prefer-able for biochemical fractionation. Onecompatible method for nuclear isolation isthat of Penman [8, 9].
A. Cross-link stabilized nuclear matrix
This method affords the best conserva-tion of the nuclear matrix, as judgedby the ultrastructural preservation of thenuclear RNP network [6]. This preparationis excellent for microscopy, but the cross-linking can make biochemical analysis dif-ficult.
1. Wash cells in phosphate buffered salineat 4 ◦C. 1©
2. Permeabilize cells in cytoskeletal bufferwith 0.5% Triton X-100 at 4 ◦C for2–5 min. This step will remove solubleproteins, both cytoplasmic and nucleo-plasmic, and prevent their cross-linking.
3. Wash briefly in cytoskeletal buffer at4 ◦C.
4. Cross-link structures using 4% formal-dehyde in cytoskeletal buffer at 4 ◦C for40 min.
5. Wash in cytoskeletal buffer at 4 ◦Cthree times for 2 min each to removeformaldehyde.
6. Cross-linked chromatin is removed bydigestion with 400 units of RNase-freeDNase I in digestion buffer at 32 ◦C for50 min. Most DNA is removed from thestructure at this step. Residual DNA canbe removed by washing:
7. Wash 1: Wash cells with extractionbuffer (which contains 0.25 M ammo-nium sulfate) at room temperature for5 min.
8. Wash 2: Wash cells with 2 M NaClbuffer at room temperature for 5 min.
9. The structure can be processed formicroscopy after a wash with cytoskele-tal buffer.
B. Classical nuclear matrix
This method is more suitable for molecularanalysis. The spatial distribution of nuclearcomponents, for example those involvedin transcription, RNA splicing and DNAreplication, is well preserved as comparedto the unextracted nucleus. The procedurecan be stopped after the DNase I digestionand 0.25 M ammonium sulfate extraction,but further extraction in 2 M NaCl removessome proteins of the RNP fibres, uncov-ering a core structure of branched 10 nmfilaments, the core filaments of the nuclearmatrix [5].
1. Wash cells with phosphate bufferedsaline at 4 ◦C. 1©
2. Permeabilize cells in cytoskeletal bufferwith Triton X-100 at 4 ◦C for 2–5 min.This will remove soluble proteins, bothcytoplasmic and nucleoplasmic.
3. Digest chromatin with 400 units ofRNase-free DNase I in digestion bufferfor 30–50 min at 32 ◦C. This step

224 IN VITRO TECHNIQUES
will remove DNA and the nucleosomalhistones. The nuclear structure at thispoint is the nuclear matrix. 2© 3©
4. Extract cells with extraction buffer at4 ◦C for 3–5 min. This will remove his-tone H1 and will strip the cytoskeletonexcept for the intermediate filamentswhich remain tightly anchored to theoutside of the nuclear lamina. 2©
5. Optional: Extract the structure in 2 MNaCl buffer at 4 ◦C for 3–5 min. Betterpreservation is obtained by increasingthe NaCl concentration slowly–or insteps. This step strips some proteinsfrom the nuclear matrix uncoveringa highly branched network of 10 nmfilaments that form the core structure ofthe nuclear matrix. 4©
6. For microscopy, fix immediately afterfractionation. Incubate the nuclei in 4%formaldehyde in cytoskeletal buffer at4 ◦C for 30–50 min.
Notes
1© Cells in suspension are most con-veniently processed for biochemicalexperiments following trypsinizationor scraping. For suspended cells, weuse about 1 ml for each 107 cells untilthe digestion step and then halve thevolume. Suspension processing can bedone by centrifuging at 1000 × g for3 min at 4 ◦C and sequentially resus-pending cell pellets in the next wash orextraction solution between steps. Thesupernatant fractions can be saved forbiochemical analysis. The extractedcell structure at each step is in the pel-let.
2© Steps 3 and 4 may be reversed,with equivalent results as judgedby electron microscopy. The protein
composition of the resulting nuclearmatrix is also the same. An easy alter-native is to perform the DNase I diges-tion first and then add ammonium sul-fate slowly from a 1 M stock solutionto a final concentration of 0.25 M.
3© DNA release can be evaluated micro-scopically by staining with a fluores-cent DNA-binding dye such as 4′-6-diamidino-2-phenylindole (DAPI; 1–10 ug/ml in phosphate buffered salinefor 5 min), or by pulse-labelling cellsin 3H-thymidine before fractionationand then measuring radioactivity.
4© Nuclear matrix proteins that are notpart of this core filament networkshould be in the supernatant fraction.
References
1. Monneron, A. and Bernhard, W. (1969) Finestructural organization of the interphase nucle-us in some mammalian cells. J. Ultrastruct.Res., 27, 266–288.
2. Nickerson, J. (2001) Experimental observa-tions of a nuclear matrix. J. Cell Sci., 114,463–474.
3. Nash, R. E., Puvion, E. and Bernhard, W.(1975) Perichromatin fibrils as components ofrapidly labeled extranucleolar RNA. J. Ultra-struct. Res., 53, 395–405.
4. Berezney, R. and Coffey, D. S. (1974) Identi-fication of a nuclear protein matrix. Biochem.Biophys. Res. Commun., 60, 1410–1417.
5. Nickerson, J. A., Krockmalnic, G., Wan, K.M. and Penman, S. (1997) The nuclear matrixrevealed by eluting chromatin from a cross-linked nucleus, Proc. Nat. Acad. Sci. USA, 94,4446–4450.
6. He, D. C., Nickerson, J. A. and Penman, S.(1990) Core filaments of the nuclear matrix.J. Cell. Biol., 110, 569–580.
7. Fey, E. G., Wan, K. M. and Penman, S. (1984)Epithelial cytoskeletal framework and nuclearmatrix–intermediate filament scaffold: three-dimensional organization and protein compo-sition. J. Cell Biol., 98, 1973–1984.

PROTOCOL 6.5 225
8. Penman, S. (1966) RNA metabolism in theHeLa cell nucleus. J. Mol. Biol., 17,117–130.
9. Capco, D. G., Krockmalnic, G. and Pen-man, S. (1984) A new method of preparing
embedment-free sections for transmission elec-tron microscopy: applications to the cytoskele-tal framework and other three-dimensional net-works. J. Cell Biol., 98, 1878–1885.

PROTOCOLS 6.6–6.7
Nuclear matrix–lamin interactions
Barbara Korbei and Roland Foisner
Background
The nuclear envelope of the eukaryoticcell nucleus is composed of the outerand inner nuclear membranes, nuclear porecomplexes, and a protein filament mesh-work underlying the inner nuclear mem-brane, termed the nuclear lamina (seeFigure 6.3). The lamina contains nucleus-specific (type V) intermediate filamentproteins, the lamins, plus numerous inte-gral and peripheral proteins of the innermembrane, which bind lamins [1, 2]. Twodifferent types of lamins can be dis-tinguished according to their expressionpatterns and biochemical properties. B-type lamins are constitutively expressedthroughout development and are essentialfor cell viability. A-type lamins, which areexpressed only in differentiated cells, arenot essential for development, but serve yetunknown functions in tissue homeostasis.More recent studies have also identifiedlamins in the nuclear interior, where theyform complexes with nucleoplasmic laminbinding proteins, such as lamina-associatedpolypeptide 2α (LAP2α) [3].
The discovery of novel binding part-ners of lamins and of lamina-associatedpolypeptides has significantly changed ourview of the functions of lamin complexesin recent years. Apart from the long-knownfunction of the lamina as a scaffoldingframework providing mechanical stability
for the nucleus, recent studies suggestedthat lamin complexes are also involved inchromatin organization and chromosomesegregation as well as in DNA replicationand RNA processing [1, 4].
The hypothesis that many diverse nuclearfunctions are directly or indirectly linked tothe nuclear lamina is supported by recentfindings revealing that mutations in A-type lamins or in some of their bind-ing partners give rise to an increasingscope of diverse genetic diseases known aslaminopathies [5]. Mutations in the LMNAgene that encodes A-type lamins resultin a broad range of disease phenotypes,affecting skeletal and heart muscle, adi-pose, nerve and bone tissue. The molecularmechanisms of these diseases are com-pletely unknown. At least some of thepathological phenotypes may be the resultof impaired interactions of mutant laminswith chromatin proteins and with proteinsin transcriptional complexes. The iden-tification of novel (tissue-specific) laminbinding partners is therefore an essentialfirst step in unravelling lamin functions andhas to be followed by a detailed molecu-lar analysis of the interactions, includinganalysis of interaction domains, bindingstrengths, assembly dynamics and molecu-lar structure.
Here we describe two in vitro tech-niques, which have been used to anal-yse the interaction of lamins with LAP2α

PROTOCOL 6.6 227
Lamin C Lamin C
1−171
171−31
9
319−57
2
Vimen
tin
1−171
171−31
9
319−57
2
Vimen
tin
35 S-LAP2a
97 kD
68 kD
43 kD
LAP2a
LAP2a overlay
LAP2a
Ponceau
Ponceau
35 S-Lam
in C
410−69
3
188−69
3
1−693
SWNE
Vimen
tin
410−69
3
188−69
3
1−69
3
SWNE
Vimen
tin
LamicC overlay
97 kD
68 kD
43 kD
29 kD
(b)
(a)
Figure 6.3 (a) Overlay of in vitro translated [35S]-labelled LAP2α onto transblotted fragments oflamin C and the intermediate filament protein vimentin (negative control), showing that LAP2α inter-acts with the C-terminal domain of lamin C. (b) Overlay of in vitro translated [35S]-labelled laminC onto transblotted recombinant LAP2α fragments or salt-washed nuclear envelope fractions of ratliver (SWNE, containing both lamin A and C, as positive control) and vimentin (negative control),revealing binding of lamin C to the C-terminal 78 residues of LAP2α. Ponceau S stains of blots andautoradiograms of in vitro translated proteins (left) and of overlays (right) are shown
and with chromatin: the in vitro overlaybinding assay, which allows identificationof interaction domains, and the in vitro
nuclear assembly assay, which reveals thedynamic properties of lamin–chromatininteractions during the cell cycle.

PROTOCOL 6.6
Nuclear matrix–lamin interactions: in vitroblot overlay assay
Introduction
Transblotted proteins immobilized on anitrocellulose membrane are incubatedwith a radioactively labelled binding part-ner. If various fragments representingdifferent domains of the protein are immo-bilized onto the membrane, this assay iden-tifies interaction domains and may alsoreveal a rough determination of relativebinding strengths of different domains. Amajor pitfall of this assay is the denatura-tion of immobilized proteins during SDS-PAGE and blotting, which may, despitepartial renaturation of proteins on themembrane during incubation in a bind-ing buffer, cause unspecific interactions.Therefore negative controls, applying non-interacting proteins, which have similarstructure and/or properties as analysed pro-teins, should always be included.
Reagents
Blocking buffer: 2% BSA in overlay buffer
Dilution buffer: 1% BSA in overlay bufferwith 1 mM PMSF (phenylmethylsul-fonylfluoride)
Overlay buffer: 10 mM Hepes/KOH (pH7.4), 100 mM NaCl, 5 mM MgCl2,2 mM EGTA, 0.1% Triton X-100
PBST (0.05% Tween 20 in PBS)
Phosphate-buffered saline (PBS): 2.6 mMKCl, 137 mM NaCl, 1.5 mM KH2PO4,8 mM Na2HPO4.7H2O, pH 7.4
Ponceau S: 0.2% (w/v) Ponceau S, 3%(w/v) trichloroaceticacid
Triton X-100, 1 mM dithiothreitol (DTT)
Procedure1. Separate bacterially expressed recom-
binant lamina proteins (bacterial celllysates are usually fine) by SDS-PAGEand transblot onto nitrocellulose mem-branes (0.2 µm). 1©
2. Stain nitrocellulose membranes withimmobilized proteins using PonceauS to visualize proteins and estimateprotein quantity, followed by thoroughwashing in PBST. 2©
3. Incubate in overlay buffer for 1 h withthree changes (to allow renaturation ofproteins), then block the membranes for30 min in blocking buffer.
4. In the meantime, the interaction part-ner to be tested is transcribed andtranslated in vitro and [35S]-labelled,using the TNT Quick coupled tran-scription/translation system (Promega,Madison, WI), according to the man-ufacturer’s protocol.
5. Probe the membranes with 100 µl ofthe standard in vitro translation reactionmixture (diluted 1 : 50 in overlay buffer)containing the [35S]-labelled protein for3 h at room temperature, while gentlymoving the incubation chamber.
6. Wash extensive in overlay buffer andair-dry the nitrocellulose.

PROTOCOL 6.6 229
7. Detect bound protein by autoradiog-raphy. Quantify signals on autoradio-grams by densitometric scanning andnormalize using the intensities detectedon the Ponceau S-stained blot, thus pro-viding a rough estimation of the rel-ative binding strengths of the testedfragments.
Notes
1© Various lamina fragments coveringdifferent regions of the protein can
be applied to one gel in order todetermine the binding domains.
2© If renaturation of proteins is criticalfor interaction, avoid denaturing Pon-ceau S stain on the blot used foroverlay, and use separate membranesprepared in parallel for estimation ofprotein amounts).
PROTOCOL 6.7
Nuclear matrix–lamin interactions: in vitronuclear reassembly assay
Introduction
Metaphase cell lysates containing meta-phase chromosomes and lamina proteins,or isolated chromosomes and chromosome-free metaphase cell lysates, are incubatedat 37 ◦C for different time periods in orderto investigate the dynamic interaction ofdifferent lamina proteins with chromatinduring nuclear reassembly after mitosis.Furthermore, dominant negative mutantsinterfering with the assembly can be testedin this assay.
Reagents
Complete culture medium: Dulbecco’sModified Eagle’s Medium (DMEM),10% fetal calf serum (FCS), 50 U/mlpenicillin, 50 µg/ml streptomycin
KHM buffer: 50 mM Hepes/KOH (pH7.0), 78 mM KCl, 4 mM MgCl2, 10 mMEGTA, 8.4 mM CaCl2, 1 mM dithio-threitol (DTT), 20 µM cytochalasin B
3× SDS-PAGE sample buffer: 186 mMTris/HCl (pH 6.8), 300 mM dithiothre-itol (DTT), 6% sodium dodecyl sul-fate (SDS), 0.1% bromphenol blue, 30%glycerol
Equipment
Heraeus Megafuge 1.0
Incubator (37 ◦C, 8.5% CO2)
Metal ball cell cracker (EMBL, Heidel-berg)
Plastic cell culture flasks 175 cm2 (Nunc)
Sterile hood
Thermoblock for Eppendorf tubes
Procedure (adapted from ref. 6)
A. Synchronization of cells1. Plate NRK (normal rat kidney) cells
in ten 175 cm2 cell culture flasksand allow to grow to approximately60–70% confluency in complete medi-um at 37 ◦C and 8.5% CO2.
2. Replace the medium with completemedium plus 2 mM thymidine in orderto arrest cells at the G1-S phase boun-dary.
3. After 10 h incubation in thymidinemedium, wash the monolayer of cellsthree times with sterile PBS and incu-bate in complete medium for 4 h.
4. Add 0.2 µg/ml nocodazole (from a10 mg/ml stock solution in 100%DMSO) and incubate cells for a further10 h.
5. Harvest the loosely attached prometa-phase cells using a mechanical shake-off.
B. Preparation of mitotic lysates1. Pellet mitotic cells from ten flasks at
1000 rpm (Heraeus Megafuge, 1.0R)for 3 min.
2. Wash twice in PBS and incubate in30 ml complete medium containing

PROTOCOL 6.7 231
nocodazole (0.2 µg/ml) and cytocha-lasin B (20 µM, added from a 20 mMstock in 100% DMSO) for 45 min at37 ◦C to destroy microtubules and actinfilaments.
3. Sediment mitotic cells at 1000 rpm(Heraeus Megafuge, 1.0R) for 3 min,wash twice with ice-cold PBS contain-ing 0.2 µg/ml nocodazole and resus-pend in an equal volume of ice-coldKHM buffer supplemented with pro-tease inhibitors (3.3 µg/ml leupeptin,3.3 µg/ml aprotinin, 3.3 µg/ml pep-statin A, 1 mM PMSF (phenylmethyl-sulfonylfluoride)).
4. Homogenization is accomplished bestby pressing the suspension 10–15 timesthrough a metal ball cell cracker(EMBL, Heidelberg) equipped with atight-fitting ball (r = 8.008 or 8.006mm) on ice. Alternatively, cell sus-pension can be pressed several timesthrough a bent needle (27G), or cellscan be lysed in a potter using a tightlyfitting glass pestle. Efficiency of cellbreakage is controlled in the phase con-trast microscope using a 40× objective.
C. In vitro reassembly
1. For control assembly reactions, dilutethe mitotic NRK cell lysate, containingchromosomes and soluble phosphory-lated lamina proteins, with half thelysis volume of ice-cold KHM buffersupplemented with protease inhibitors(see above).
2. Incubate for different time intervalsbetween zero and 2 h at 37 ◦C, toallow dephosphorylation and assemblyof lamin structures at the chromosomalsurface.
3. At different time points, transfer ali-quots of the incubation mixture to aprecooled tube, mix with phosphatase
inhibitors (0.1 µM calyculin A; 0.1 µMokadaic acid (Invitrogen); 1 mM ortho-vanadate; 0.5 mM beta-glycero-phos-phate (Sigma-Aldrich)) and place on iceto prevent further assembly.
4. Centrifuge the collected samples at2000 rpm (Heraeus Megafuge, 1.0R)for 10 min at 4 ◦C to separate the sol-uble, cytoplasmic from the insoluble,cytoskeleton/chromatin fractions.
5. Resuspend the pellet in 1 12 times the
original aliquot volume of 1× SDS-PAGE sample buffer.
6. Mix the supernatant with half itsvolume of 3× SDS sample buffer.
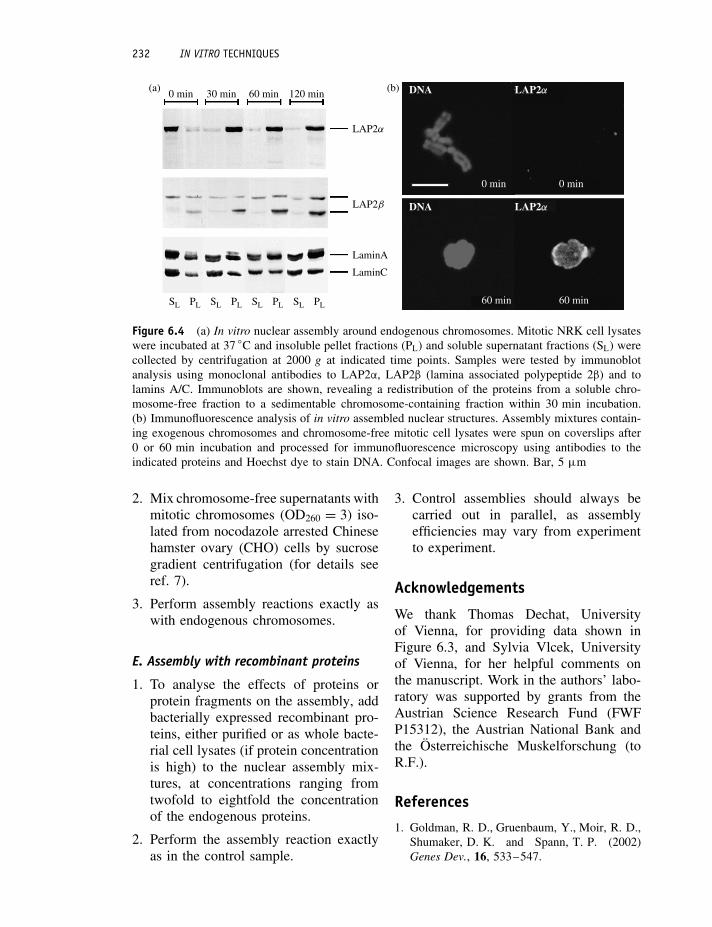
7. Analyse the samples by SDS-PAGEand immunoblotting using specificantibodies to the lamina proteins ofinterest (Figure 6.4A).
8. Samples can also be prepared forimmunofluorescence microscopy (Fig-ure 6.4B). For this, 70 µl aliquots ofcell lysates are mixed with formal-dehyde (37% w/v solution) to a finalformaldehyde concentration of 3.7%(w/v).
9. Spin samples onto 18× 18 mm glasscoverslips for 20–30 s at 500 rpm(Heraeus Megafuge, 1.0R) in a cyto-spin rotor.
10. Following centrifugation, coverslipsshould be immediately immersed in1 ml 3.7% formaldehyde for 20 min,and then processed for immunola-belling.
D. Assembly with exogenous chromosomes
1. Remove endogenous chromosomes frommitotic cell lysates by centrifugationat 2000 rpm (Heraeus Megafuge, 1.0R)for 5 min at 4 ◦C.
232 IN VITRO TECHNIQUES
0 min 30 min 60 min 120 min
LAP2a
LAP2b
LaminA
LaminC
SL SL SL SLPL PL PL PL
DNA
0 min
60 min 60 min
0 min
DNA
LAP2a
LAP2a
(a) (b)
Figure 6.4 (a) In vitro nuclear assembly around endogenous chromosomes. Mitotic NRK cell lysateswere incubated at 37 ◦C and insoluble pellet fractions (PL) and soluble supernatant fractions (SL) werecollected by centrifugation at 2000 g at indicated time points. Samples were tested by immunoblotanalysis using monoclonal antibodies to LAP2α, LAP2β (lamina associated polypeptide 2β) and tolamins A/C. Immunoblots are shown, revealing a redistribution of the proteins from a soluble chro-mosome-free fraction to a sedimentable chromosome-containing fraction within 30 min incubation.(b) Immunofluorescence analysis of in vitro assembled nuclear structures. Assembly mixtures contain-ing exogenous chromosomes and chromosome-free mitotic cell lysates were spun on coverslips after0 or 60 min incubation and processed for immunofluorescence microscopy using antibodies to theindicated proteins and Hoechst dye to stain DNA. Confocal images are shown. Bar, 5 µm
2. Mix chromosome-free supernatants withmitotic chromosomes (OD260 = 3) iso-lated from nocodazole arrested Chinesehamster ovary (CHO) cells by sucrosegradient centrifugation (for details seeref. 7).
3. Perform assembly reactions exactly aswith endogenous chromosomes.
E. Assembly with recombinant proteins
1. To analyse the effects of proteins orprotein fragments on the assembly, addbacterially expressed recombinant pro-teins, either purified or as whole bacte-rial cell lysates (if protein concentrationis high) to the nuclear assembly mix-tures, at concentrations ranging fromtwofold to eightfold the concentrationof the endogenous proteins.
2. Perform the assembly reaction exactlyas in the control sample.
3. Control assemblies should always becarried out in parallel, as assemblyefficiencies may vary from experimentto experiment.
Acknowledgements
We thank Thomas Dechat, Universityof Vienna, for providing data shown inFigure 6.3, and Sylvia Vlcek, Universityof Vienna, for her helpful comments onthe manuscript. Work in the authors’ labo-ratory was supported by grants from theAustrian Science Research Fund (FWFP15312), the Austrian National Bank andthe Osterreichische Muskelforschung (toR.F.).
References
1. Goldman, R. D., Gruenbaum, Y., Moir, R. D.,Shumaker, D. K. and Spann, T. P. (2002)Genes Dev., 16, 533–547.

PROTOCOL 6.7 233
2. Foisner, R. (2001) J. Cell Sci., 114, 3791–3792.
3. Dechat, T., Korbei, B., Vaughan, O. A.,Vlcek, S., Hutchison, C. J. and Foisner, R.(2000) J. Cell Sci., 113, 3473–3484.
4. Cohen, M., Lee, K. K., Wilson, K. L. andGruenbaum, Y. (2001) Trends Biochem. Sci.,26, 41–47.
5. Burke, B. and Stewart, C. L. (2002) Nat. Rev.Mol. Cell Biol., 3, 575–585.
6. Burke, B. and Gerace, L. (1986) Cell, 44,639–652.
7. Vlcek, S., Korbei, B. and Foisner, R. (2002) J.Biol. Chem., 277, 18898–18907.
Safety hazards
Working safely with radioactivity
[35S] emits β-rays with a maximum β
energy of 0.167 MeV and a half-life of87.4 days. A Geiger-Muller counter is suit-able for the detection of β-emitters. β
particles can affect superficial layers oftissues and represent an external hazard.They are also potential internal hazards,if radioactivity gets inside the body viainhaled gas particles or via the mouth orvia skin cuts. Best protection from theexternal hazard can be attained by reducingexposure time to radioactive material. Thiscan be achieved by planning and prepar-ing the experiments carefully before start-ing bench work. Furthermore, intensity ofelectromagnetic radiation decreases withthe square of the increasing distance. Theuse of shields between the body and theradioactive samples is also highly recom-mended, as β-rays may have a range of upto a few metres in air, while 1 cm of Plexi-glas will stop any rays. This will, however,generate Bremsstrahlung, a form of X-rays,which are also potentially harmful. To pro-tect from internal hazards, the most impor-tant rule is to prevent contamination of theworking environment and the individual.This is achieved by restricting the working
area for radioactive substances to a partic-ular location in the lab. Furthermore, allequipment, materials and waste have to belabelled and the working area should bemonitored regularly. Waste should be min-imized and disposed of according to localrules and guidelines.
Other hazards
In principle, all substances which are cyto-toxic or influence cellular functions andparameters, such as phosphorylation, cellcycle progression and proteolytic activ-ities, are to be considered as potentialhazards.
The phosphatase inhibitors are toxicif swallowed or inhaled, and upon pro-longed or repeated exposure are also toxicif absorbed through the skin. Therefore,when handling such substances, one shouldwear gloves. They should be used only ina well-ventilated area and kept closed orcovered when not in use.
Inhalation of protease inhibitor phenyl-methylsulfonylfluoride may result in spasm,inflammation or oedema of the larynx andbronchi, chemical pneumonitis and pul-monary oedema. When handling, avoid dustformation.
Cytochalasin is a cell-permeable fungaltoxin that disrupts contractile microfila-ments by inhibiting actin polymerizationand thus interferes with many cellular pro-cesses. It is a very powerful toxin andshould be handled with extreme caution.
Nocodazole is an antimitotic agent thatdisrupts microtubules by binding to β-tubulin, thus affecting microtubule dynam-ics, spindle function and Golgi complexformation. It arrests the cell cycle at theG2/M phase boundary and induces apop-tosis in several normal and tumour celllines and is therefore also considered verytoxic.

PROTOCOL 6.8
Preparation of Xenopus laevis egg extracts andimmunodepletion
Tobias C. Walther
Introduction
Egg extracts from Xenopus laevis havebeen used as cell-free systems to studymitotic events and nuclear functions suchas nuclear envelope (NE) formation andreplication; see Lohka and Masui [1]. Amajor advantage of the system is that largevolumes of Xenopus eggs can be obtainedcheaply with relatively low effort. Impor-tantly, in contrast to mammalian mitotichomogenates, egg extracts will efficientlypackage naked DNA into chromatin andNE precursors are not limiting in this sys-tem. In combination with immunodeple-tion of proteins, egg extracts provide apowerful system to study nuclear architec-ture, function and dynamics.
Reagents
10 × MMR: 1 M NaCl, 20 mM KCl,10 mM MgCl2, 20 mM CaCl2, 1 mMEDTA, 50 mM HEPES/KOH, pH 8.0
D-buffer: 2% w/v cysteine in 0.25 ×MMR, pH 7.8
Sucrose buffer 250 (S250): 250mM sucrose,50mM KCl, 2.5mM MgCl2, 10mMHEPES/KOH,pH7.5
Sucrose buffer 250+ (S250+) take S250and add to:
Final Stock Per ml Substanceconcen- extracttration
1 mM 1 M 1 µl DTT44 µg/ml 20 mg/ml 2.5 µl Cycloheximide
(CHX)5 µg/ml 10 mg/ml 0.5 µl CytochalasinB
(CytB)1× 100× 10 µl Trasylol2 µg/ml 10 mg/ml 0.2 µl Leupeptin1 µg/ml 10 mg/ml 0.1 µl Pepstatin
Blocking buffer: S250+ supplementedwith 50 mg/ml BSA
Sucrose buffer 500 + (S500+): take S250+and add 1.25 ml 2 M sucrose/10 ml
Ionophore A21387 2 mg/ml in DMSO
100 mM NaBO4 pH 9.0, 100 mM ethanol-amine pH 8.0, 100 mM glycine pH 2.0,10 mM Tris/HCL pH 7.4
Equipment
Beakers (800 ml)
Low-speed refrigerated centrifuge withswinging-bucket rotor
Microcolumns (800 µl)
Microfuge
Ultracentrifuge with swing-out rotor (5 mltubes)

PROTOCOL 6.8 235
Procedure
Day 0
Inject 10 frogs with 500 U pregnantmare’s serum gonadotropin (PMSG) intothe dorsal lymph sac 4–14 days before theextract preparation.
Day 1
Inject 1000 U human chorionic gonadotro-pin (2000 U/ml in water) per frog, incubateat 16 ◦C for 16–18 h in 1 × MMR.
Day 2
A. Collect eggs
1. Pour off buffer with eggs (from frogcontainers). Avoid eggs that are inlarge clumps or ‘ropes’!
2. Wash eggs with c.500 ml 1 × MMR.
3. Dejelly eggs in D-buffer up to 10 min,eggs become closely packed; swirlevery 30 s.
4. Rinse eggs four times with c.500 ml1 × MMR.
5. Activate eggs by adding 8 µl A23187(2 mg/ml) per 100 ml 1 × MMR; ani-mal cap contraction becomes visibleafter 3 min; leave up to 10 min (usu-ally 7 min).
6. Wash three times with 1 × MMR, takecare not to expose eggs to air, removewhite eggs.
7. Incubate up to 25 min at 22 ◦C.
8. Rinse eggs three times with S250.
9. Wash eggs with S250(+).
B. Extract preparation
1. Transfer eggs to 5 ml tubes, spin 60 sat 2000 g to pack the eggs; removeexcess buffer.
2. Spin 20 min at 20 000 g to crush eggs.
3. Take supernatant (= ‘low-speed ex-tracts’) and add to:
f.c. Stock Per ml Substanceextract
1 mM 1 M 1 µl DTT44 µg/ml 20 mg/ml 2.5 µl CHX
5 µg/ml 10 mg/ml 0.5 µl CytBProtease
inhibitorcocktail
4. Spin 35 min at 200 000 g.
5. Remove cytosolic (orange) phase, leav-ing lipids (on top) and pellet behind.
6. Dilute c.0.3 fold with S250+.
7. Spin 35 min at 200 000 g.
8. Remove cytosol, add glycerol to f.c.3% (v/v) snap freeze and/or processfor immunodepletion.
9. Wash membranes: resuspend mem-branes in c.20 × vol. in S250 (+) andlay carefully on top of 800 µl S500(+)buffer cushion.
10. Spin 15 min at 15 000 g.
11. Resuspend membranes in c.10th ofcytosol vol. and snap freeze immedi-ately.
C. Preparation of column forimmunodepletion (should be done inadvance)
1. Rotate 1–2 mg antibody with 0.5 mlprotein A sepharose in a volume of5 ml for 1 h at room temperature.
2. Wash beads with 2 × with 5 ml 0.2 Msodium borate buffer pH 9.0.
3. Resuspend beads in 5 ml 0.2 Msodium borate buffer pH 9.0 andadd 13 mg of dimethylpimelimidate(DMP) from a freshly opened bottle(final concentration 10 mM).
236 IN VITRO TECHNIQUES
4. Rotate for 30 minutes at room temper-ature.
5. Add another 13 mg of DMP, rotate30 min at room temperature.
6. Stop reaction by washing beads 1×with 0.2 M ethanolamine pH 8.0 andincubating at room temperature for 2 hin this buffer. Check coupling effi-ciency by measuring protein concen-tration of antibody solution before andafter cross-link.
7. Wash column with 5 ml PBS, 5 ml10 mM Tris/HCl pH 7.4.
8. Pre-elute column with 5 ml 100 mMglycin pH 2.0.
9. Wash column with 5 ml PBS.
10. Transfer antibody (or mock) beads(250 µl each) to two 800 µl micro-columns.
11. Drain columns mounted on a 2 mltube by spinning 10 s at 1000g.
12. Rotate 30 min with 400 µl blockingbuffer.
D. Immunodepletion
1. Add 400 µl freshly prepared cytosolicextract to antibody or mock column,rotate 30 min to 1 h at 4 ◦C.
2. Collect first depletion as above (step 2),and add to second antibody column.
3. Rotate and collect as above, snap freeze.
Notes
Buffers should be around 16 ◦C beforelysis of eggs and ice-cold for all sub-sequent steps.
When jelly coat has been removed washeggs very carefully.
Reference
1. Lohka, M. J. and Masui, Y. (1983) Roles ofcytosol and cytoplasmic particles in nuclearenvelope assembly and sperm pronuclear for-mation in cell-free preparations from amphib-ian eggs. J. Cell Biol., 98, 1222–1230.

PROTOCOL 6.9
Nuclear assembly in vitro andimmunofluorescence
Martin Hetzer
Introduction
The molecular mechanisms of nuclearassembly are not well understood. Manyanalyses have been carried out in acell-free system based on Xenopus eggextracts that recapitulate pronuclear for-mation after fertilization. The first stepin nuclear assembly is decondensation ofsperm DNA. Subsequent events involvebinding of membranes to chromatin, fusionof membranes to form the nuclear enve-lope (NE), insertion of nuclear pore com-plexes (NPCs) and nuclear growth accom-panied by further chromatin swelling. Fora detailed review see Gant and Wil-son [1]. In egg extracts individual stepsof nuclear assembly can be separated andanalysed biochemically. The formation ofa functional nucleus can be visualized byimmunofluorescence using antibodies spe-cific for NE proteins or NPC components.
Reagents
HSP: 250 mM sucrose, 15 mM Hepes/KOH, pH 7.4, 0.5 mM spermidine tetra-chloride, 0.2 mM spermine
HSPP: HSP + 0.3 mM PMSF, 10 µg/µlleupeptin
PBS
20× Energy mix: Creatine phosphate (CP)200 mM (51 mg/ml), ATP 10 mM, GTP
10 mM, CP-kinase 0.5 mg/ml First mixthe CP, ATP and GTP. Measure pHand add 1 M Hepes/KOH, pH 7.3 forbuffering if necessary. Add sucrose to afinal concentration of 250 mM. Finallyadd kinase. Freeze in aliquots. Keep at−80 ◦C
20× glycogen: 150 mg/ml oyster glycogenin 10 mM Hepes/KOH, pH 7.5
Acetate buffer: 100 mM KAc, 3 mMMgAc, 5 mM EGTA, 20 mM Hepes/KOH, pH 7.4, 150 mM sucrose, 1 mMDTT
30%S: 30% sucrose (w/v) in acetate buffer
FIX: 8% formaldehyde in PBS
IF buffer: 0.1% Triton X-100, 0.02% SDS,10 mg/ml BSA in PBS
Poly-L-lysine 0.1% w/v in water
Vectashield mounting solution
Equipment
Coverslips and slides
Low-speed refrigerated centrifuge withswinging-bucket rotor
Scissors, 1 ml syringe, glass plate, cheese-cloth
Watchmaker’s forceps
Water bath at 20 ◦C

238 IN VITRO TECHNIQUES
Procedure
A. Preparation of sperm head chromatinfrom Xenopus laevis
(see Gurdon, J.B. [2]; for extract prepara-tion, see Protocol 6.8 )
1. Put male Xenopus laevis in ice waterfor ∼40 min.
2. Take frog, cut away upper part of thehead (use strong scissors), kill by stick-ing forceps into spinal chord.
3. Take testis, remove fat and connectivetissue.
4. Resuspend in HSP buffer using for-ceps and chop testis into pieces.
5. Disperse further by pressing piecesthrough 1 ml syringe on glass plate.
6. Filter through cheesecloth, wash (finalvol. from two testes ∼6 ml).
7. Pellet by centrifugation 2000 rpm at4 ◦C, wash once with HSPP 10 ml.
8. Resuspend in 1 ml HSPP, add 50 µl10 mg/ml lysolecithin, incubate 5 minat room temperature.
9. Quench by adding 10 ml HSPP + 3%BSA, chill.
10. Pellet by centrifugation at 2000 rpmfor 10 min.
11. Wash with 3 ml HSPP + 0.3% BSA,centrifuge as above.
12. Resuspend in 2.5 ml HSPP + 0.3%BSA + 30% glycerol.
13. Count 1/10 dilution: No. of sperm in1 ‘grossquadrat’ × 104 = sperm/ml.
14. Dilute to 1000 sperm/µl.
15. Aliquot in 10 µl and freeze in liquidN2.
16. Test: use 2 µl sperm heads + 2 µlTrypan Blue 0.4%; if there is no
exclusion from sperm then permeabi-lization was successful.
B. Nuclear assembly
1. To assay NE formation 13–15 µl ofcytosolic extract (see Protocol 6.8) istransferred into an Eppendorf tube.Demembrenated sperm heads are addedto a concentration of 103/µl (stockis 103/µl). Gently mix with pipetteand place reaction on ice for 5 min(to decondense sperm chromatin). Add2 µl 10× membranes and 1 µl 20×glycogen.
2. Incubate at 20 ◦C in a water bath for60–90 min.
3. Reactions are stopped on ice andimmediately fixed for 20 min by adding100 µl AB-buffer and 100 µl 8% FIX(8% paraformaldehyde).
4. Layer sample on top of ice-cold 30%S in a tube containing a poly-L-lysine-coated coverslip (11 mm diameter).
5. Spin at 1000 g for 10 min.
6. Remove supernatant and recover thecoverslip with watchmaker’s forceps.
7. If the reactions contain fluorescentlylabelled components dip the coverslipin PBS and mount on a microscopyslide.
C. Immunofluorescence
1. Put coverslip on a grid or parafilm andpermeabilize the nuclei for 30 min withIF buffer at room temperature.
2. Incubate for 1 h in IF buffer containingthe primary antibody.
3. Wash 3× with 500 µl IF buffer.
4. Incubate for 1 h in IF buffer contain-ing the secondary antibody coupled toa fluorophor.

PROTOCOL 6.9 239
5. Wash 3× with 500 µl IF buffer.
6. Wash the coverslip with IF buffer(+410 mM NaCl), incubate withHoechst/DAPI for 1 min, mount thecoverslip with Vectashield solution andanalyse samples by confocal fluores-cence microscopy.
Notes
Optimal salt concentration for the washingstep has to be determined for each anti-body. Incubate the coverslips in the dark.
References
1. Gant, T. M. and Wilson, K. L. (1997) Nuclearassembly. Annu. Rev. Cell Dev. Biol., 13,669–695.
2. Gurdon, J. B. (1976) Injected nuclei in frogoocytes: fate, enlargement, and chromatin dis-persal. J. Embryol. Exp. Morphol., 36, 523–540.

PROTOCOL 6.10
Nucleocytoplasmic transport measurementsusing isolated Xenopus oocyte nuclei
Reiner Peters
IntroductionThe exchange of matter between cellnucleus and cytoplasm, involving some ofthe most significant cellular molecules andmolecular assemblies such as ribonucleo-protein particles, ribosomal subunits andtranscription factors, is mediated by thenuclear pore complex (NPC), a large trans-porter spanning the nuclear envelope. Inthe past, transport across the NPC has beenstudied almost exclusively in intact cells(e.g. by expression of GFP constructs, cellfusion and microinjection), in semi-intactcells (e.g. by selective permeabilization ofthe plasma membrane employing the deter-gent digitonin [1]), and in artificial nucleireconstituted in cell extracts [2, 3]. Here,the protocol of a transport assay is givenwhich employs manually isolated nuclei ofXenopus oocytes [4]. The assay is easy,fast and convenient, employs synchronizedprimary cells, completely avoids the use ofdetergents and yields quantitative kineticdata. The large size of Xenopus oocytenuclei facilitates the combination of trans-port measurements with other functionalas well as biochemical and structural stud-ies. A complementary protocol pertainingto isolated nuclear envelopes is given asProtocol 6.11.
Reagents and materialsTissue culture dishes, e.g. Falcon no.
353004
2.5 mm diameter drill
Amphibian Ringer’s solution: 88 mMNaCl, 1 mM KCl, 0.8 mM MgSO4,1.4 mM CaCl2, 5 mM Hepes (pH 7.4)
Mock 3 intracellular medium: 1© 90 mMKCl, 10 mM NaCl, 2 mM MgCl2,0.1 mM CaCl2, 1.0 mM N -(2-hydroxyethyl)ethylene-diaminetriaceticacid (HEDTA), 10 mM Hepes (pH 7.3)
Transport solution: mock 3 containing0.5 µM of a fluorescent protein contain-ing a nuclear localization sequence(NLS) such as GG-NLS [5] or Ale-xa488-P4K [4], 0.5 µM karyopherin α2,0.5 µM karyopherin β1, 2 µm Texas-red-labelled 70 kDa dextran, energy mix(final concentrations: 2 mM ATP, 25mM phosphocreatine, 30 units/ml crea-tine phosphokinase, 200 µM GTP,20 g/l BSA 2©
Piece of Xenopus laevis ovary
EquipmentForceps, e.g. Dumont no. 5
GELoader Tips (i.e. very fine pipettetips made by Eppendorf, Hamburg,Germany)
Stereomicroscope
Confocal laser scanning fluorescencemicroscope
Image processing program (e.g. ImageJ)
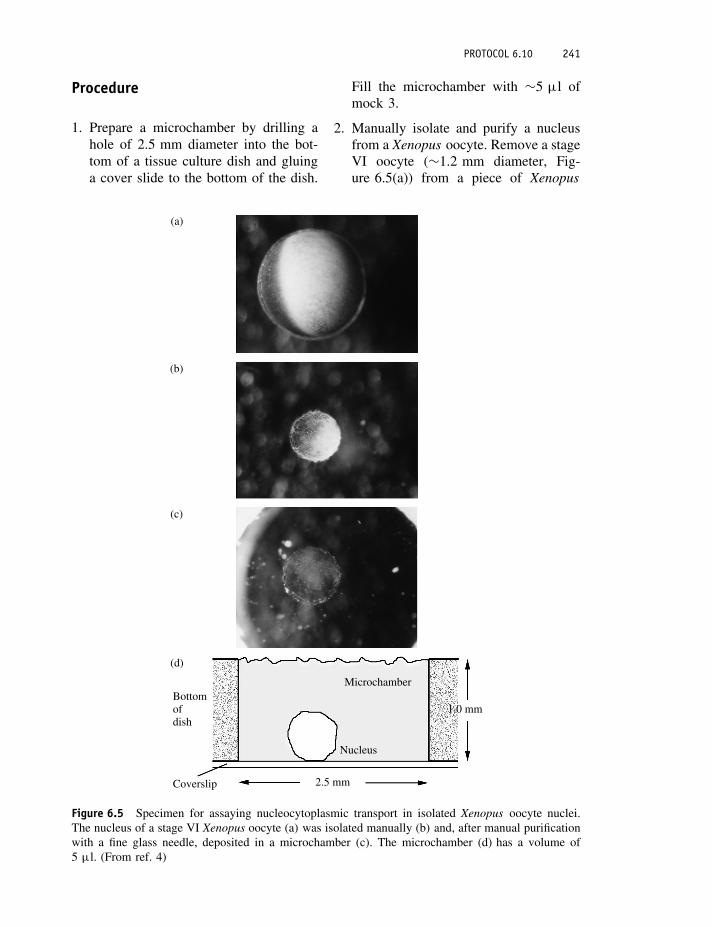
PROTOCOL 6.10 241
Procedure
1. Prepare a microchamber by drilling ahole of 2.5 mm diameter into the bot-tom of a tissue culture dish and gluinga cover slide to the bottom of the dish.
Fill the microchamber with ∼5 µl ofmock 3.
2. Manually isolate and purify a nucleusfrom a Xenopus oocyte. Remove a stageVI oocyte (∼1.2 mm diameter, Fig-ure 6.5(a)) from a piece of Xenopus
Bottomofdish
(d)
(c)
(b)
(a)
Coverslip 2.5 mm
1.0 mm
Nucleus
Microchamber
Figure 6.5 Specimen for assaying nucleocytoplasmic transport in isolated Xenopus oocyte nuclei.The nucleus of a stage VI Xenopus oocyte (a) was isolated manually (b) and, after manual purificationwith a fine glass needle, deposited in a microchamber (c). The microchamber (d) has a volume of5 µl. (From ref. 4)

242 IN VITRO TECHNIQUES
ovary, kept in amphibian Ringer’ssolution, and transfer it into a smallglass dish containing mock 3. Usinga stereomicroscope at ∼16× totalmagnification and fine forceps open theoocyte and set free the nucleus (Fig-ure 6.5(b)). Transfer the nucleus intoanother small glass dish containingfresh mock 3. Further purify the nucleusfrom adhering yolk particles by repeat-edly touching the nucleus with a micro-capillary. Transfer the nucleus into themicrochamber (Figure 6.5(c)), strictlyavoiding the nucleus touching the air–water interface.
3. Mount the microchamber on thestage of a confocal laser scanningmicroscope. Visualize the nucleus inthrough-light at low magnification (10×or 16× objective). Focus onto thelargest perimeter of the nucleus. Adjustlaser power, 3© wavelength, multipliervoltages, pinhole, etc. so that both thetransport substrate (NLS protein) andthe control substrate (Texas-red labelled70 kDa dextran) will be optimallyimaged.
4. Use a GELoader Tip to inject ∼10 µlof the transport solution into the micro-chamber. Start timer and scanner
(a) (b)
(c)
Import substrateP4K
Control substrateTRD70
2 min
5 min
10 min
30 min
1000 mm
e.s e.srim rimintranuclear space
a
30 min
2 min
150
100
50
0
Fe
Fi(∞)
−400 −200 200 4000
Fluo
resc
ence
(a.
u.)
Distance (µm)
control, extranuclear
control, intranuclearsubstrate, intranuclearsubstrate, extranuclearsubstrate, nuclear rim
200
160
120
80
40
00 10 20 30
Fluo
resc
ence
(a.
u.)
Time (min)
b
Figure 6.6 Example of a transport measurement. (a) A Xenopus oocyte nucleus was incubated witha solution containing a NLS-protein (P4K) and a control substrate (TRD70). Scans were taken atindicated times after transport solution addition. (b) Profiles through the nucleus showing the timedevelopment of the transport substrate fluorescence. (c) Time development of mean intra- and extranu-clear fluorescence of transport and control substrate. (From ref. 4)

PROTOCOL 6.10 243
(t = 0). Continue with scanning at inter-vals properly resolving transport kinet-ics (Figure 6.6(a)).
5. Evaluate the image series (Figure6.6(b)), using an image processing pro-gram such as Image J (public domainJava version by W. Rasband, http://rbs.info.nih.gov/ij/) to derive Fsi, Fse, Fci,Fce, the mean corrected intra- and extra-nuclear fluorescence intensities of trans-port or control substrate, as well as thenuclear radius R (Figure 6.6(c)). Thenumber Ni(t) of imported substratemolecules can then be calculatedaccording to:
Ni(t) = (Fi/Fe) Ce VN L
where Ce is the substrate concentrationin the transport solution, VN is the nu-clear volume (= 4/3π R3) and L isAvogadro’s number. In addition, inten-sity profiles (Figure 6.6(b)) may beobtained.
Notes
Thisprocedurewill takeapproximately1h.
1© Mock 3 is an intracellular mock medi-um adjusted, however, to 3 µM freeCa++. Prepare a fresh batch every day.
2© BSA serves to balance intranuclear os-motic pressure. Dialyse stock BSAsolution (100 g/l) against mock 3.
3© Set laser power as low as compati-ble with a sufficient image quality toavoid photobleaching.
References
1. Adam, S. A., Stern-Marr, R. and Gerace, L.(1990) Nuclear protein import in permeabi-lized mammalian cells requires soluble cyto-plasmic factors. J. Cell Biol., 111, 807–816.
2. Forbes, D. J. Kirschner, M. W. and Newport,J. W. (1983) Spontaneous formation ofnucleus-like structures around bacteriophageDNA microinjected into Xenopus eggs. Cell,34, 13–23.
3. Lohka, M. J and Masui, Y. (1983) Formationin vitro of sperm pronuclei and mitotic chro-mosomes induced by amphibian ooplasmiccomponents. Science, 220, 719–721.
4. Radtke,T., Schmalz,D., Coutavas,E., Soliman,T. M. and Peters,R. (2001) Kinetics of protein
import into isolated Xenopus oocyte nuclei.Proc. Natl. Acad. Sci. USA, 98, 2407–2412.
5. Keminer, O., Siebrasse, J. P. Zerf, K. andPeters. R. (1999) Optical recording of signal-mediated protein transport through single nu-clear pore complexes. Proc. Natl. Acad. Sci.USA, 96, 11 842–11 847.

PROTOCOL 6.11
Transport measurements in microarrays ofnuclear envelope patches by optical singletransporter recording
Reiner Peters
Introduction
A most powerful approach to the exper-imental analysis of membrane transportprocesses is single transporter record-ing. However, previously this was pos-sible only in the case of ion chan-nels using the electrophysiological patchclamp method [1]. In optical single trans-porter recording (OSTR) [2, 3] membranesare attached to microarrays of cylin-drical test compartments and transportacross membrane patches that may con-tain single transporter or transporter popu-lations is recorded by confocal microscopy.OSTR features a very high sensitivity,single-transporter resolution, multiplexingof transport substrates and parallel dataacquisition (for review, see ref. 4). Here,a protocol for the measurement of nuclearexport [5, 6] is given. For a complemen-tary method, employing isolated Xenopusoocyte nuclei, see Protocol 6.10.
Reagents and materials
Tissue culture dishes, e.g. Falcon no.353004
3.5 mm diameter drill
Polycarbonate track etched (PCTE) mem-brane filters, type Cyclopore Transpar-
ent (Whatman, Maidstone, Kent, UK),available in pore sizes of 0.1 to 8.0 µm
Eastman Instant Adhesive no. 910
Amphibian Ringer’s solution: 88 mMNaCl, 1 mM KCl, 0.8 mM MgSO4,1.4 mM CaCl2, 5 mM Hepes (pH 7.4)
Mock 3 intracellular medium: 1© 90 mMKCl, 10 mM NaCl, 2 mM MgCl2, 0.1mM CaCl2, 1.0 mM N -(2-hydroxyethyl)ethylene-diaminetriacetic acid(HEDTA), 10 mM Hepes (pH 7.3)
Transport solution: mock 3 containing1 µM of a fluorescent protein containinga nuclear export signal (NES) suchas GG-NES [5], 1 µM of the nuclearexport receptor CRM1, 1 µM Ran-GTP,10 g/l BSA 2©
Piece of Xenopus laevis ovary
Equipment
Forceps, e.g. Dumont no. 5
GELoader Tips (i.e. very fine pipettetips made by Eppendorf, Hamburg, Ger-many)
Stereomicroscope
Confocal laser scanning fluorescence mi-croscope
Image processing program (e.g. Image J)

PROTOCOL 6.11 245
Intact nucleus
Perforated nucleus
Isolated nuclear envelope
Transport substrateand confocal microscopy
(a)
(b)
(c)
(d)
(e)
Objective
NPC
Isoporousfilter
Confocal plane
OilCoverslip
Figure 6.7 Preparation of a specimen for OSTR measurements of nuclear transport
Procedure
1. Prepare an OSTR chamber by drilling ahole of 3.5 mm diameter into the bottomof a tissue culture dish. Apply a pieceof optically clear double-sticky tape to aclean coverslip (15 mm×15 mm). Cut aPCTE membrane filter into small pieces(5 mm×5 mm) and place a filter piece,shiny side up, on the tape. Attach thecover slip-filter assembly to the culturedish such that the filter forms the bottomof the hole. Fill the microchamber with12 µl of mock 3. If the pores of the filterdo not fill spontaneously with mock 3,swim the chamber on an ultrasonic bathand apply a short pulse (some seconds)of ultrasound. Put a moistened piece oflaboratory tissue into the chamber. Closethe chamber lid.
2. Manually isolate and purify a nucleusfrom a Xenopus oocyte, as describedin Protocol 6.10, step 2. Transfer thepurified nucleus into the OSTR cham-ber. Attach the nucleus firmly to thePCTE filter by pressing the nucleusagainst the filter using a small glass rod(Figure 6.7(a)). Use a very fine steelneedle or a glass microcapillary to openthe nucleus (Figure 6.7(b)). Remove thenuclear contents and purify the nuclearside of the nuclear envelope by wash-ing it three times with 15 µl of mock 3(Figure 6.7(c)).
3. Use a GELoader Tip to inject ∼15 µl of the transport solution intothe microchamber (Figure 6.7(d)). Thetransport solution, containing 10 g/lBSA, will sink to the bottom of the

246 IN VITRO TECHNIQUES
2.0
1.5
1.0
0.5
0.0
Fin
/out
GG-NES, CRM1, RanGTPGG-NES, CRM1,Ran(Q69L)GTPGG-NES, CRM1, RanGTPgS
0 100 200 300 400 500 600
Time (s)
(c)
2.0
1.5
1.0
0.5
0.0
Fin
/out
GG-NES, CRM1, RanGTP, GTP
GG-NES, RanGTP, GTP
GG-NES, CRM1, GTPGG-NES, GTP
(b)
Measuring field withinnucleus-covered area
GG-NES 70 kD dextran
2 min
4 min
6 min
8 min
Reference fieldoutside nucleus-covered area
62.5 µm
(a)
Figure 6.8 Example of an OSTR measurement of signal-dependent nuclear protein export. (a) Rawdata. A transport solution containing an export complex (i.e. a 1 : 1 : 1 complex of GG-NES, CRM1 andRanGTP) and a control substrate (Texas-red labelled 70 kDa dextran) was added to the OSTR chamberat t = 0 min and confocal scans of the oil–filter interface of a nucleus-covered area acquired at theindicated times. After transport had reached a plateau a nucleus-free area was imaged for reference. (b)Data showing that only the complete export complex was transported. (c) Data showing that hydrolysisof Ran-bound GTP was required for export. (From ref. 5)
chamber replacing the pure mock 3.Remove surplus buffer. Start the timer(t = 0).
4. Mount the microchamber on the stageof a confocal laser scanning micro-scope. Visualize the nucleus in through-light at low magnification (10× objec-tive). Place the nucleus into the centreof the field of vision. Switch to a 40-fold, oil immersion objective withoutmoving the OSTR chamber. Focus onthe interface between oil and filter. Start
scanner, adjust microscope parameters,and continue with scanning at intervalsproperly resolving transport kinetics(Figure 6.8(a)). After recording trans-port kinetics in the nucleus-coveredarea, shift the nucleus out of thefield of view and obtain scans of afree area of the filter for reference(Figure 6.8(a), bottom).
5. Evaluate the image series, using animage processing program such asImage J (public domain Java version by

PROTOCOL 6.11 247
W. Rasband, http://rbs.info.nih.gov/ij/).We have written a plug-in to thatprogram which automatically finds thefilter pores, measures their fluores-cence intensity, subtracts the local back-ground, and plots the time-dependentbackground-corrected fluorescence foreach filter pore individually (examplesare given in Figure 6.8(b)).
Notes
This procedure will take approximately30 min.
1© Mock 3 is an intracellular mockmedium adjusted, however, to 3 µMfree Ca++. Prepare a fresh batch everyday.
2© Dialyse BSA stock solution (100 g/l)against mock 3.
References
1. Neher, E. and Sakmann, B. (1976). Single-channel currents recorded from membrane ofdenervated frog fibres. Nature, 260, 779–802.
2. Tschodrich-Rotter, M. and Peters, R. (1998)An optical method for recording the activityof single transporters in membrane patches. J.Microsc., 192, 114–125.
3. Peters, R., Sauer, H., Tschopp, J. and Frit-zsch, G. (1990) Transients of perforin poreformation observed by fluorescence micro-scopic single channel recording. EMBO J., 9,2447–2451.
4. Peters, R. (2003) Optical single transporterrecording: transport kinetics in microarrays ofmembrane patches. Ann. Rev. Biophys. Biomol.Struct., 32, 47–67.
5. Siebrasse J. P., Coutavas, E. and Peters, R.(2002) Reconstitution of nuclear protein exportin isolated nuclear envelopes. J. Cell Biol.,158, 849–854.
6. Siebrasse J. P. and Peters, R. (2002) Rapidtranslocation of NTF2 through the nuclearpore of isolated nuclei and nuclear envelopes.EMBO Rep., 3, 887–892.

PROTOCOL 6.12
Cell permeabilization with Streptolysin O
Ivan Walev
Introduction
Delivery of macromolecules into the cyto-sol, with retention of cell viability, isincreasingly being employed by cell biol-ogists. Most of the existing methodsfor introducing macromolecules into thecell require considerable methodologicalexpertise [1]. Pore-forming bacterial tox-ins have found widespread applicationas tools to study protein trafficking ineukaryotic cells because, under appropri-ate experimental conditions, the plasmamembrane can be selectively permeabi-lized while the membranes of internal com-partments remain intact [2, 3]. With theseapproaches, bacterial toxin attack is gen-erally lethal, so the possibilities of con-ducting cell biological studies after perme-abilization have been restricted. Recentlya simple method for reversible cell perme-abilization using the bacterial toxin Strep-tolysin O (SLO) has been described [4].SLO is the prototype of a toxin fam-ily that have been termed oxygen-labileor sulfydryl-activatable toxin (also termedcholesterol-dependent toxins). This is be-cause the toxin spontaneously loses activ-ity in the presence of atmospheric oxy-gen, and regains activity upon reduction(e.g. with DTT). The reactivity of the sin-gle cysteine residue in the SLO-moleculeis responsible for this property. However,the single cysteine residue in SLO can bereplaced by alanine, without loss of activ-ity [5]. This mutagenized SLO can be iso-
lated from E. coli and is no longer proneto oxygen-dependent inactivation [6]. SLOgenerates very large transmembrane pores,readily allowing delivery of moleculeswith mass up to 150 kDa into cytosol. Re-versible permeabilization of adherent andnon-adherent cells requires use of lowSLO concentrations. Resealed cells remainviable for days and retain their capacity toendocytose and to proliferate [4].
Reagents
Streptolysin-O (SLO): available from sev-eral biochemical suppliers 1©
Hepes buffered saline solution (HBSS):30 mM Hepes, 150 mM NaCl (pH7.2)
Procedure
1. Suspend the cells in HBSS withoutCa2+ and Mg2+, for 5–10 min. 2©
2. Permeabilization step: discard the su-pernatants and add SLO dissolved in thesame medium for 10 min at 37 ◦C. 3©The protein or agent to be delivered tothe cytosol is included at the permeabi-lization step.
3. Resealing step: add surplus ice-coldmedium (without washing) containingCa2+ and Mg2+ (final Ca2+ concentra-tion 1–2 mM) and incubate the cells forat least 60 min at 37 ◦C. 4©

PROTOCOL 6.12 249
Notes1© SLO preparations may contain con-
taminating proteases or DNases. Suchcontaminants may create artefacts.Overall, it is therefore worthwhile tocheck whether a given SLO prepa-ration is contaminant-free. Our pro-cedure produces contaminant-free re-combinant SLO (Email to:<[email protected]>).Because this SLO mutant does notcontain a cysteine residue, activationby reduction is not necessary.
2© Cells: adherent and non-adherent cellscan be used. Mouse cells are moreresistant to SLO. Some adherent cellsdo not tolerate the 5–10 min withoutCa2+ and detach from plastic. Per-meabilization can be measured lightmicroscopically by Trypan Blue orpropidium iodide staining.
3© In all cases, selection of an appropri-ate toxin concentration is pivotal tosuccess. Thus, the required SLO con-centration will vary depending on celltarget and density, and must be deter-mined immediately before the delivery
experiment by titration. The goal is toidentify the toxin concentration thatcauses permeabilization of 60–80%of the total cell population under thesame conditions.
4© HBSS: some deviation of pH mayhelp. Addition of serum to the mediumis good, but not absolutely necessary.
References
1. Lauer, J. L. and Fields, G. B. (1997) MethodsEnzymol., 289, 564–571.
2. Bhakdi, S., Weller, U., Walev, I., Martin, E.,Jonas, D. and Palmer, M. (1993) Med. Micro-biol. Immunol., 182, 167–175.
3. Ahnert-Hilger, G., Bader, M. F., Bhakdi, S.and Gratzl, M. (1988) J. Neurochem., 52,1751–1758.
4. Walev, I., Bhakdi, S. C., Hofmann, F., Djon-der, N., Valeva, A., Aktories, K. and Bhakdi,S.(2001) Proc. Natl. Acad. Sci. USA, 98,3185–3190.
5. Pinkney, M., Beachey, E. and Kehoe, M.(1989) Infect. Immun., 57, 2553–2558.
6. Weller, U., Muller,L., Messner,M., Palmer,M.,Valeva, A., Tranum-Jensen, J., Agrawal, P.,Biermann, C., Dobereiner, A., Kehoe, M. A.and Bhakdi, S. (1996) Eur. J. Biochem., 236,34–39.
PROTOCOL 6.13
Nanocapsules: a new vehicle for intracellulardelivery of drugs
Anton I. P. M. de Kroon, Rutger W. H. M. Staffhorst, Ben deKruijff and Koert N. J. Burger
Introduction
Liposomes, aqueous compartments sur-rounded by lipid bilayers, have been widelyused as transport vectors to deliver (imper-meant) substances into the cytoplasm ofcells. Examples include the delivery ofchemotherapeutic agents, DNA for trans-fection, and fluorescent probe molecules(for reviews see refs 1 and 2). The molecu-lar mechanism of the liposome–cell inter-action leading to uptake of the liposomecontents depends on the lipid compositionof the liposome membrane and the celltype involved. Liposome–plasma mem-brane fusion has been reported in a numberof cases (e.g. [3]). Endocytosis is consid-ered the major route of entry for liposomesinto cells (reviewed in ref. 4).
The efficiency of encapsulation of thecompound of interest in the liposomes isan important determinant of the efficiencyof uptake by the cell. The structural proper-ties of liposomes allow for highly efficientencapsulation of hydrophilic compoundsand lipophilic compounds in the aqueousinterior and in the lipid bilayer of the lipo-some, respectively [1]. Compounds that donot meet either of these criteria were so farnot amenable to efficient encapsulation ina lipid bilayer coat.
One such compound is the poorlywater-soluble anti-cancer drug cisplatin,
cis-diamminedichloroplatinum (II), whichis commonly used in the treatment ofa variety of solid tumours, includinggenito-urinary, head and neck, and lungtumours [5]. Encapsulation of this druginto liposomes has many advantages in-cluding the reduction of premature inac-tivation of this highly reactive moleculeupon entry in the blood and the reductionof deleterious side-effects such as nephro-,oto- and neurotoxicity [6].
The liposomal formulations of cisplatindeveloped so far (see e.g. ref 7) sufferfrom a limited bioavailability of the drugin the tumour [8]. A key factor is likelythe low water solubility (7 mM at 37 ◦C)and low lipophilicity of cisplatin, lead-ing to liposomal formulations with lowdrug-to-lipid molar ratios (of the orderof 0.02). Serendipitously, an alternativemethod was recently discovered, enablingthe encapsulation of cisplatin in a lipidformulation with superior efficiency [9].Our method takes advantage of the lim-ited solubility of the drug in water, andproduces cisplatin nanocapsules, nanopre-cipitates of cisplatin surrounded by a singlelipid bilayer, which exhibit an unprece-dented drug-to-lipid ratio and an unprece-dented in vitro cytotoxicity. The cisplatinnanocapsules may turn out to be theparadigm for encapsulating compounds

PROTOCOL 6.13 251
with limited solubility in water and withlow lipophilicity in a lipid bilayer coat.
Technical principle
Repeated freezing and thawing of a con-centrated aqueous solution of cisplatinin the presence of anionic phospholipidsresult in the formation of cisplatin nanocap-sules. The preparation of cisplatin nanocap-sules requires the presence of negativelycharged phospholipids and of positivelycharged aqua-species of cisplatin, point-ing to an essential role for electrostaticinteractions in the mechanism of forma-tion. A solution of cisplatin in water, inthe absence of added chloride, containsa mixture of the neutral dichloride- anddihydroxo-species of cisplatin with lowsolubility in water, and positively chargedaqua-species of cisplatin with a muchhigher solubility [5]. In the model pro-posed for the mechanism of nanocapsuleformation [9], cisplatin is concentrated inthe residual fluid during freezing, form-ing small aggregates when the solubilitylimit of the dichloro-species is exceeded.As freezing proceeds, the nanoprecipitatesof the dichloro-species of cisplatin becomecovered by the positively charged aqua-species, which have a higher solubilitylimit. The negatively charged membranesinteract with the positively charged cis-platin aggregates and then reorganize towrap the aggregates in a phospholipidbilayer coat. The resulting nanocapsules donot redissolve upon thawing.
Procedure1. Cisplatin is dissolved in MilliQ water
to a concentration of 5 mM, whichis facilitated by incubating at 55 ◦Cfor 30 min. The solution is incubatedovernight in the dark at 37 ◦C to ensurefull equilibration.
2. Stock solutions of 1,2-dioleoyl-sn-gly-cero-3-phosphocholine (DOPC) and 1,
2-dioleoyl-sn-glycero-3-phosphoserine(DOPS) are prepared in chloroform(concentration ∼5 mM). The preciseconcentrations are determined by phos-phate analysis [10].
3. Aliquots corresponding to 0.6 micro-mole of each phospholipid are mixed,the solvent is removed by rotatory evap-oration, and the lipid film is furtherdried under vacuum overnight.
4. The dry lipid film is hydrated by adding1.2 ml of the 5 mM cisplatin solutionin water and incubating for 15 min at37 ◦C.
5. After brief homogenization on a vortexmixer, the dispersion is transferredto a glass tube and subjected to 10freeze–thaw cycles using ethanol/dry-ice (−70 ◦C) and a water bath (37 ◦C).
6. The resulting colloidal solution is trans-ferred to microfuge tubes and cen-trifuged for 4 min at 470g (2100 rpmin an Eppendorf centrifuge) to collectthe nanocapsules.
7. After removal of the supernatant, thefluffy white layer on top of the yel-low pellet, corresponding to large lipo-somes, is removed by a micropipette.The yellow pellet containing the cis-platin nanocapsules, is resuspended in1 ml water and centrifuged as above inorder to wash away non-encapsulatedcisplatin.
8. Upon resuspending the final pellet in0.5 ml water, the nanocapsules arestored at 4 ◦C until use.
Alternatively, the nanocapsules are sep-arated from contaminating liposomes bydensity gradient centrifugation. Briefly, thedispersion obtained after the freeze–thawcycles is loaded on top of a step gradi-ent consisting of 1 ml of each 1.8, 0.6and 0.2 M sucrose in 10 mM Pipes-NaOH,1 mM EGTA, pH 7.4. After centrifugation

252 IN VITRO TECHNIQUES
Figure 6.9 Electron micrograph of cisplatin nanocapsules visualised by negative staining. A dilutesuspension of nanocapsules was transferred to a carbon-formvar coated grid, and stained with 4%(w/v) uranyl acetate for 45s. Scale bar, 100 nm
at 4 ◦C for 30 min at 400 000g, the pelletfraction corresponding to the nanocapsulesis collected and washed as above.
Instead of DOPS, other anionic phos-pholipids like dioleoyl-phoshatidylglycerol(DOPG) and dioleoyl-phosphatidic acid(DOPA) can be used to prepare cisplatinnanocapsules. DOPC can be replaced bydioleoyl-phosphatidylethanolamine(DOPE) or sphingomyelin. The method issensitive to high chloride concentrationsand alkaline pH, because these conditionsprevent the formation of the positivelycharged aqua-species. Instead of hydrat-ing a lipid film with 5 mM cisplatin, itis also possible to add the cisplatin solu-tion to preformed DOPC/DOPS liposomesand then start the freeze–thaw cycles. Thecisplatin nanocapsules can be stored afterlyophilization, and retain cisplatin uponrehydration.
Characterization
1. Encapsulation efficiency
The phospholipid content of the nanocap-sules is determined by phosphate anal-ysis [10]. The cisplatin content of the
nanocapsules is assessed by flamelessatomic absorption spectrometry (NFAAS)using K2PtCl2 as a standard [11]. Analy-sis of the cisplatin nanocapsules preparedaccording to the above protocol, typicallyyields a Pt/phosphate molar ratio of 11 ±1. Based on the size of the nanocapsules(see below), this number is estimated tocorrespond to an internal cisplatin con-centration exceeding 0.5 M, which is farbeyond the solubility limit of cisplatin andconsistent with the quasi-crystalline struc-ture of the encapsulated cisplatin [9]. Themethod allows encapsulation of cisplatinwith an efficiency of approximately 30%.
2. Shape and size
Analysis by negative stain electron micro-scopy reveals bean-shaped particles con-sisting of an electron-dense core sur-rounded by a bright layer (excludingstain), corresponding to the bilayer coat(Figure 6.9). The nanocapsules have a het-erogeneous size distribution, with 75% ofthe population having a length between 50and 250 nm and a width of around 50 nm.Size analysis by dynamic light scatter-ing yields consistent results. Nanocapsules

PROTOCOL 6.13 253
of smaller size and with a narrower sizedistribution have been obtained by high-pressure extrusion through polycarbonatefilters with a 200 nm pore size [9].
3. Delivery of contents
The cytotoxicity of the cisplatin nanocap-sules towards the human ovarian carci-noma IGROV-1 cell line has been com-pared to that of free cisplatin. The IC50value (the drug concentration at whichcell growth is inhibited by 50%) of cis-platin administered as nanocapsules is twoorders of magnitude smaller than that ofthe free drug [9]. The higher cytotoxicityis explained by the reduced inactivation ofthe drug, due to the lipid coat sequester-ing it from reaction with substrates in theextracellular environment. Upon binding tothe cell surface or endocytic uptake of thenanocapsules, the coat is destabilized, andafter membrane passage, cisplatin can exertits cytotoxic effect.
Comments
Cisplatin nanocapsules represent a newlipid formulation of cisplatin, distinct fromconventional liposomal formulations inthat the drug is present as a nanoprecipitatesurrounded by a bilayer. This results in adrug-to-lipid ratio that exceeds that of lipo-somal formulations by two to three ordersof magnitude and probably accounts forthe typical bean-like shape of the nanocap-sules. The high encapsulation efficiencyof cisplatin in nanocapsules is expectedto increase the bioavailability of the drugand thus improve the therapeutic index ascompared to liposomal formulations of cis-platin. Data obtained so far indicate thatthe cisplatin nanocapsules can gain accessto the cell interior via endocytosis [9]. Themethod for preparing cisplatin nanocap-sules may be applicable to a variety ofother compounds with limited solubility in
water and low lipophilicity that are not effi-ciently encapsulated in conventional lipo-somes. Alternatively, compounds of inter-est may be co-encapsulated together withcisplatin.
Like the surface of conventional lipo-somes, the membrane surface of nanocap-sules can be engineered to include poly(ethyleneglycol)-conjugated lipids (review-ed in ref. 2). This results in more stablenanocapsules without affecting the cyto-toxicity [12]. It is expected that the tech-nologies developed for liposomes, includ-ing the attachment of ligands or antibodiesfor purposes of targeting, can also beapplied to nanocapsules.
Acknowledgement
Financial support by the Dutch CancerSociety (project UU2001-2493) is grate-fully acknowledged.
References
1. Drummond, D. C., Meyer, O., Hong, K., Kir-potin, D. B. and Papahadjopoulos, D. (1999)Pharmacol. Rev. 51, 691–743.
2. Lian, T. and Ho, R. J. Y. (2001) J. Pharm.Sci., 90, 667–680.
3. Garrett, F. E., Goel, S., Yasul, J. and Koch,R. A. (1999) Biochim. Biophys. Acta, 1417,77–88.
4. Duzgunes, N. and Nir, S. (1999) Adv. DrugDeliv. Rev., 40, 3–18.
5. Lippert, B. (1999) Cisplatin: Chemistry andBiochemistry of a Leading Anticancer Drug.Wiley-VCH, New York.
6. Hacker, M. P. (1991) In: The Toxicity of Anti-cancer Drugs (G. Powis and M. P. Hacker,eds), p. 82. McGraw-Hill, New York.
7. Newman, M. S., Colbern, G. T., Working,P. K., Engbers, C. and Amantea, M. A. (1999)Cancer Chemother. Pharmacol., 43, 1–7.
8. Meerum Terwogt, J. M., Groenewegen, G.,Pluim, D., Maliepaard, M., Tibben, M. M.,Huisman, A., ten Bokkel Huinink, W. W.,Schot, M., Welbank, H., Voest, E. E., Beij-nen, J. H. and Schellens, J. H. M. (2002)

254 IN VITRO TECHNIQUES
Cancer Chemother. Pharmacol., 49,201–210.
9. Burger, K. N. J., Staffhorst, R. W. H. M.,de Vijlder, H. C., Velinova, M. J., Bomans,P. H., Frederik, P. M. and de Kruijff, B.(2002) Nat. Med., 8, 81–84.
10. Rouser, G., Fleischer, S. and Yamamoto, A.(1970) Lipids, 5, 494–496.
11. Burger, K. N. J., Staffhorst, R. W. H. M. andde Kruijff, B. (1999) Biochim. Biophys. Acta,1419, 43–54.
12. Velinova, M. J., Staffhorst, R. W. H. M.,Mulder, W. J. M., Dries, A. S., Jansen, B. A.J., de Kruijff, B. and de Kroon, A. I. P. M.
(2004) Biochim. Biophys. Acta, 1663,135–142.Note added in proof: The molecular archi-tecture of the cisplatin nanocapsules wasrecently solved (Chupin, V., de Kroon, A. I.P. M., and de Kruijff, B. (2004) J. Am. Chem.Soc., 126, 13816–13821.)

PROTOCOL 6.14
A rapid screen for determination of theprotective role of antioxidant proteins inyeast
Luis Eduardo Soares Netto
Introduction
Yeast has been successfully employed asa model to study several biological pro-cesses. Indeed, Leland H. Hartwell andPaul M. Nurse received the Nobel Prize in2001 for the discovery of genes in yeastinvolved in cell cycle regulation, whichhas had a great impact on the understand-ing of processes such as cancer. Some ofthe advantages of using yeast as a modelsystem are: (1) this micro-organism growsvery rapidly and media used to cultivateit are very simple and inexpensive; (2) itis very amenable to genetic manipulationssuch as gene disruption; (3) its biology isvery well studied and (4) its genome hasbeen completely sequenced and is publiclyavailable.
There has been considerable interestin the study of antioxidant enzymes inyeast. Yeast as well as bacteria, mammalsand plants possess several enzymatic sys-tems capable of decomposing peroxides.Saccharomyces cerevisiae possesses fiveperoxiredoxins (a type of thiol-dependentperoxidase, many of them thioredoxin-dependent peroxidases); two catalases; threeglutathione-dependent peroxidases and onecytochrome c peroxidase. Although a partialredundancy of their roles is observed, theydefinitively have distinct roles. For example:
cytosolic thioredoxin peroxidase I (cTPxI)is important for protection of cells withdysfunctional mitochondria, whereas mito-chondrial thioredoxin peroxidase I is im-portant for respiratory-competent cells [1–3]. More recently, resultshavebeenobtainedindicating that cytosolic thioredoxin peroxi-dase II is specifically important for cell pro-tection against organic peroxides indepen-dently of the functional state of mitochon-dria [4]. One approach that has been veryhelpful for us is a viability test based on serialdilutions as described below. Using thisapproach, we were able to test mutant strainsunder several different conditions and foundone in particular, where a gene deletion ren-dered cells very sensitive to oxidative stress.Several concentrations of oxidants can betested as well as the effect of various carbonsources. Changing the carbohydrate presentin the media is an interesting manipulationbecause yeast physiology and biochemistryare very dependent on the carbon source.For example, yeast grown under glucoseget most of its ATP from glycolysis, hasfew mitochondria and this organelle con-tains few cristae. In contrast, when yeast isgrown in glycerol or ethanol it only producesATP from oxidative phosphorylation andpossesses many active mitochondria [5].
It is important to emphasize that thisapproach can also be employed for the

256 IN VITRO TECHNIQUES
study of other protective roles, for exampleagainst heat stress, osmotic stress and alky-lation damage. Proteins from other organ-isms can also be studied. In this case, itwould be necessary to verify if a heterol-ogous gene can complement the sensitivityobserved for a given mutant strain.
After testing several conditions by thisprotocol and finding one where the mutantstrain is specifically sensitive, a more accu-rate and quantitative assay (colony count-ing) can be performed. A disadvantage ofcolony counting assay is that it is very timeconsuming. Examples of this strategy aredescribed in refs [2] and [4].
Reagents
Preparation of medium and plates
A. Synthetic medium
Per litre, add:
1.7 g Yeast nitrogen base without aminoacids or ammonium sulfate (YNB-AA/AS)
5 g (NH4)2SO4
20 g of glucose or other carbon source(2%)
This medium can support the growth ofyeast with no nutritional requirements.Generally, however, yeast strains presentnutritional requirements. Therefore, nutri-ents should be added as described inTable 6.1. Synthetic media should be auto-claved before use. Threonine and asparticacid work better when added after auto-claving, therefore stock solutions of theseamino acids should be prepared and ster-ilized by filtration. These amino acids canthen be added to a synthetic medium inlaminar flow.
B. Preparation of plates
Solid synthetic medium is prepared asdescribed above with addition of agar
Table 6.1 Nutrients to be added with yeaststrains with deficiencies in metabolic processesa
Nutrient Finalconcentration
(ug/ml)
Amountof nutrient
added (mg)b
Adenine(hemisulfatesalt)
40 40
L-arginine (HCl) 20 240L-aspartic acid 100 100L-glutamic acid
(monosodiumsalt)
100 100
L-histidine 20 20L-leucine 60 60L-lysine
(mono-HCl)30 30
L-methionine 20 20L-phenylalanine 50 50L-serine 375 375L-threonine 200 200L-tryptophan 40 40L-tyrosine 30 30L-valine 150 150Uracil 20 20
a These data were obtained from Ausubel et al. [6].b The amount of nutrient was added per litre of syntheticmedia.
2% (20 g of agar per litre of medium).The medium is autoclaved and then leftfor 45–60 min at room temperature untilcooled to about 50 ◦C, which can be feltif one can hold the flask comfortably. Atthis point, the medium should be pouredinto plates. Drugs and other compounds tobe tested should also be added when themedium is at 50 ◦C, to avoid undesirablethermal decomposition. More details aboutpreparation of media can be obtained fromAusubel et al. [6].
Procedure
Determination of hydroperoxide tolerance
1. Grow yeast cells overnight in completesynthetic media with various carbon

PROTOCOL 6.14 257
sources; in most cases, 2% glucose orwith 2% glycerol.
2. The next day, dilute inoculate to 3 ×10⁶ cells per ml (which correspondsto approximately 0.1 OD600 nm) andthen cultivate until the cell densityreaches approximately 3 × 10⁷ cells perml (which corresponds to approxi-mately 1.0 OD600 nm). This takes about10 h, which ensures that cells are welladapted to the carbon source present inthe medium.
3. Dilute cell suspension to OD600 nm =0.2 and make four further 1/5 dilutionsof the cell suspensions.
4. Place a 10 µl droplet of each dilutioninto complete synthetic medium + agarwith 2% glucose or the other carbonsources as described in Figure 6.10. A
control plate should contain media com-ponents alone, whereas the test platecontains peroxide (or other compoundto be investigated).
5. Incubate plates for 30 or 48 h, depend-ing on the results observed. In somecases, a differential effect can only befound after only one of these timeperiods.
Comments1. In the control plate, there is no addition
besides the components of the media.It is important to be very careful inthe determination of OD600 nm beforethe dilutions in order to guarantee thatmutant and wild-type strains will growequally.
2. Cells are grown in synthetic mediumto avoid the reaction of peroxides with
OD600nm = 0.2
10 ul
WT 1/5 1/5 1/5 1/5
10 ul 10 ul
10 ul
10 ul
OD600nm = 0.2
mutant 1/5 1/5 1/5 1/5
10 ul
10 ul 10 ul
10 ul10 ul
controlplate
media +peroxide
Dilution 0 1/5 1/25 1/125 1/625
Dilution 0 1/5 1/25 1/125 1/625
10 ul
10 ul10 ul10 ul
10 ul
10 ul
10 ul10 ul10 ul
10 ul
Figure 6.10 Scheme viability of yeast cells in plates after serial dilutions. Cells were submitted tofour 1/5 dilutions (200 ul to 1 ml) in synthetic media; 10 µl of undiluted and 1/5, 1/25, 1/125 and1/625 diluted suspensions were added to control plates as well as to the plates with the compounds tobe tested. In control plates, the two strains grew equally which showed that their cell densities werethe same in the undiluted samples. In the experimental plate, the mutant strain did not grow in the1/125 and in the 1/625 dilutions, indicating that this gene deletion rendered cells sensitive to peroxidetreatment

258 IN VITRO TECHNIQUES
extracellular components present in arich medium such as glutathione [7].It is important to use synthetic ratherthan rich media such as YPD (yeastpeptone dextrose) because glutathioneand other substances are not very wellcontrolled and their concentration canvary from different lots of media, whichmay compromise the reproducibility ofthe assay.
3. Peroxides, mitochondrial inhibitors orother stressful compounds can be addedto the plates under several different con-ditions, in order to find one where dele-tion of a gene severely retards growth.Plates can be incubated for differentintervals, which can also interfere withthe results. We usually incubate plates for30 or 48 h. It may be interesting to varythe carbon source because it provokesdramatic changes in yeast biochemistryand physiology as mentioned above.
4. It is important not to use small volumesto make the dilutions. We generallydiluted 200 µl of cell suspension into1 ml of synthetic media. In this way,errors due to manipulation of pipettesare minimized.
References
1. Kowaltowski, A. J., Vercesi, A. E., Rhee,S. G. and Netto, L. E. S. (2000) Catalases and
thioredoxin peroxidase protect Saccharomycescerevisiae against Ca2+-induced mitochondrialmembrane permeabilization and cell death.FEBS Lett., 473, 177–182.
2. Demasi, A. P. D., Pereira, G. A. G. and Netto,L. E. S. (2001). Cytosolic thioredoxin peroxi-dase I is essential for the antioxidant defense ofyeast with dysfunctional mitochondria. FEBSLett., 509, 430–434.
3. Monteiro, G., Pereira, G. A. G. and Netto,L. E. S. (2002) Regulation of mitochondrialthioredoxin peroxidase I expression by two dif-ferent pathways: one dependent on CAMP andthe other on heme. Free Radical Biol. Med., 32,278–288.
4. Munhoz, D. C. and Netto, L. E. S. (2004)“Cytosolic thioredoxin peroxidase I and II areimportant defenses of yeast against organichydroperoxide insult, J. Biol. Chem., 279,35219–35227.
5. Pon, L. and Schatz, G. (1991) Biogenesis ofYeast Mitochondria in the Molecular and Cel-lular Biology of the Yeast Saccharomyces.Vol 1: Genome Dynamics, Protein Synthesisand Energetics. Cold Spring Harbor Labora-tory Press, New York.
6. Ausubel, F. M., Brent, R., Kingstone, R. E.,Moore, D. D., Seidman, J. A., Smith, J. A. andStruhl, K. (1994) Saccharomyces cerevisiae.In: Current Protocols in Molecular Biology,John Wiley & Sons, Inc., New York.
7. Maris, A. F., Assumpcao, A. L., Bonatto, D.,Brendel, M. and Henriques J. A. (2001) Di-auxic shift-induced stress resistance againsthydroperoxides in Saccharomyces cerevisiaeis not an adaptive stress response and doesnot depend on functional mitochondria. Curr.Genet., 39, 137–149.

PROTOCOL 6.15
In vitro assessment of neuronal apoptosis
Eric Bertrand
Introduction
Apoptosis is a specific form of cell deathwhich is triggered and executed by thecell’s own machinery; as such it is con-sidered as a kind of ‘suicide’. Elimi-nation of cells through apoptosis con-tributes to many important physiologicalprocesses such as development, inflamma-tion and adult tissue homeostasis [1, 2].Also, excessive apoptosis has been asso-ciated with a number of conditions, likeneurodegenerative diseases, ischaemia orAids. At first, the definition of apopto-sis was essentially based on morphologicalfeatures: cell shrinkage, condensation ofcytoplasm and nucleus, clumping of chro-matin, blebbing of the membrane and ulti-mately fragmentation in apoptotic bodies.Afterwards, it was observed that the alter-ations of chromatin were also accompaniedby a cleavage of nuclear DNA into nucle-osomal fragments; however, this type ofDNA degradation is not entirely specific ofapoptosis. At the biochemical level, mostof the characteristic changes observed dur-ing apoptosis are mediated by the caspases,a family of cysteine proteases. The cas-pases cleave a number of substrates withinthe cell including structural proteins andenzymes, thereby modifying their function.Caspase activation is currently consideredas the most reliable marker of apoptosis.
The protocols included therein shouldprove useful to the reader who wants
to investigate whether a particular treat-ment induces apoptosis on neural cell cul-tures. Some of the issues that should beaddressed in the course of such a studyare: is the treatment toxic, does it induceapoptosis, which caspases are activated?Toxicity can be assessed and quantifiedwith the TUNEL assay, while reversalof the toxic effect by a caspase inhibitorsuch as ZVAD indicates the involvementof apoptosis. ZVAD is a broad-range cas-pase inhibitor, some caspase inhibitors aremore selective than ZVAD, but they areusually not entirely specific. For instance,DEVD preferentially inhibits caspase-3 butis also active against caspase 8, 7 and10 [3]. Therefore, even if DEVD blocksthe apoptosis induced by the treatment,a direct demonstration of caspase-3 acti-vation using immunostaining is required.Finally, a very specific inhibition of agiven caspase can be achieved with anti-sense oligonucleotides coupled to the cellpermeable carrier penetratin.
Reagents
PBS: GIBCO/Invitrogen, cat. no. 14200-059
zDEVD-fmk: Tebu, cat. no. P414
zVAD-fmk: France Biochem, cat. no.727610
Vectastain ABC-AP kit: Vector Laborato-ries, cat. no. AK-5200
NBT/BCIP: Pierce, cat. no. 34042

260 IN VITRO TECHNIQUES
In situ Cell Detection Kit, AP: RocheDiagnostics Cat N◦ 1 684 809
Anti p20 antibody: Pharmingen, cat. no.557035
J peptide: Syntem,
Penetratin peptide and oligonucleotides:Quantum, cat. no. 151300
Procedures
Immunocytochemical methods to studyapoptosis at the single cell level
The protocols within this section areintended for cells that have been cul-tured in ELISA wells; with some adjust-ments on solution volumes they can beadapted to glass coverslips and other plateformats. The cells were fixed with 4%paraformaldehyde at room temperature for30 min or overnight at 4 ◦C.
TUNEL staining
TUNEL stands for TdT mediated dUTPnick end labelling; this reaction labelsDNA strand breaks by incorporating modi-fied nucleotides at the 3′-OH termini. Dur-ing apoptosis, nuclear DNA is degraded tonucleosomal fragments which are detectedby the TUNEL reaction. In this protocolwe used the alkaline phosphatase versionof the In Situ Cell Death Detection Kitprovided by Roche Diagnostics. In mostcases we followed the instructions of themanufacturer, however we obtained a bet-ter specificity of the staining on primarycultures of cortical neurons by reducingthe incubation times for the 1 + 2 reac-tion mixture (DNA labelling solution) andthe converter-AP solution (alkaline phos-phatase coupled antibody). Some adjust-ment of incubation times and other param-eters might be necessary, depending on
the cell type studied and the type of sig-nal observed (fluorescence, alkaline phos-phatase, horseradish peroxydase); the man-ufacturer gives a number of useful piecesof advice in this respect (http://www.roche-applied-science.com). This protocol hasbeen used to detect apoptosis on rat andmouse cortical neurons and it should beapplicable to other species and neuronaltypes.
1. Wash cells 3× with PBS and thenpermeabilize in a 0.1% sodium cit-rate/0.1% triton solution for 2 min onice (at 4 ◦C).
2. Wash wells 2× with PBS.
3. Add 50 µl of TUNEL 1 + 2 reac-tion mixture (enzyme solution + labelsolution) from Roche Diagnostics kitfor 30 min at 37 ◦C.
4. Wash wells 3× with PBS.
5. Incubate the cells for 15 min at 37 ◦Cin 50 µl of converter-AP solution(alkaline phosphatase coupled anti-body).
6. Prepare NBT/BCIP substrate solutionfor alkaline phosphatase:
100 mM Tris pH 9.5
10 mM NaCl
5 mM MgCl2
1 mM levamisole to inhibit endoge-nous phosphatases
7. Add NBT/BCIP according to the man-ufacturer’s guidelines.
8. Wash wells 3× in PBS, add 100 µlof NBT/BCIP substrate solution andincubate for approximately 10 min atroom temperature. Follow the courseof the reaction and block it by adding10 µl of 0.5 M EDTA in the wellswhen the staining is intense enough.
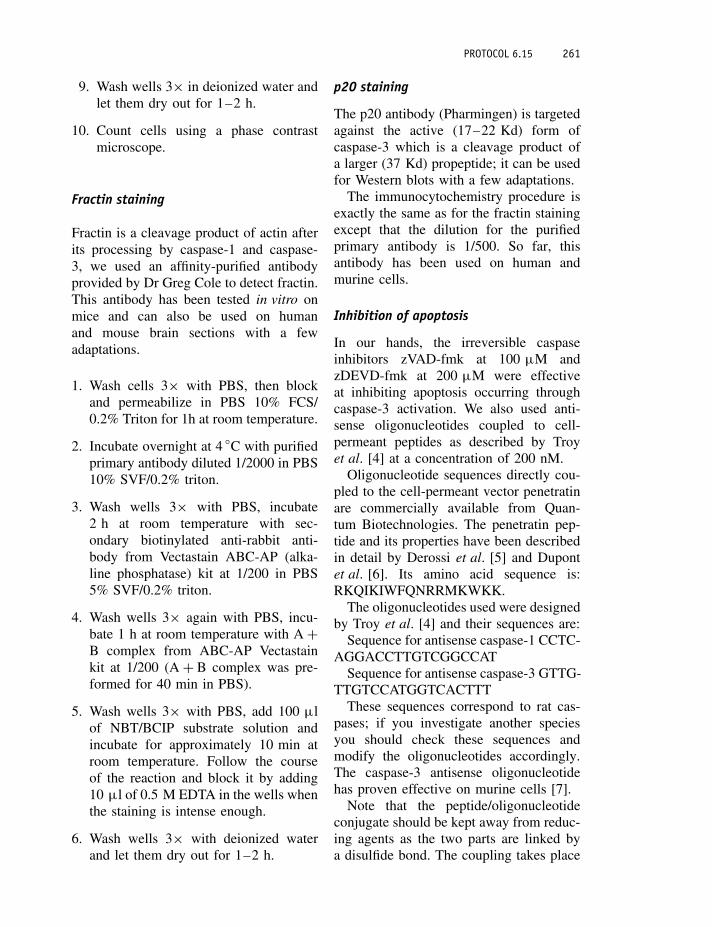
PROTOCOL 6.15 261
9. Wash wells 3× in deionized water andlet them dry out for 1–2 h.
10. Count cells using a phase contrastmicroscope.
Fractin staining
Fractin is a cleavage product of actin afterits processing by caspase-1 and caspase-3, we used an affinity-purified antibodyprovided by Dr Greg Cole to detect fractin.This antibody has been tested in vitro onmice and can also be used on humanand mouse brain sections with a fewadaptations.
1. Wash cells 3× with PBS, then blockand permeabilize in PBS 10% FCS/0.2% Triton for 1h at room temperature.
2. Incubate overnight at 4 ◦C with purifiedprimary antibody diluted 1/2000 in PBS10% SVF/0.2% triton.
3. Wash wells 3× with PBS, incubate2 h at room temperature with sec-ondary biotinylated anti-rabbit anti-body from Vectastain ABC-AP (alka-line phosphatase) kit at 1/200 in PBS5% SVF/0.2% triton.
4. Wash wells 3× again with PBS, incu-bate 1 h at room temperature with A +B complex from ABC-AP Vectastainkit at 1/200 (A + B complex was pre-formed for 40 min in PBS).
5. Wash wells 3× with PBS, add 100 µlof NBT/BCIP substrate solution andincubate for approximately 10 min atroom temperature. Follow the courseof the reaction and block it by adding10 µl of 0.5 M EDTA in the wells whenthe staining is intense enough.
6. Wash wells 3× with deionized waterand let them dry out for 1–2 h.
p20 staining
The p20 antibody (Pharmingen) is targetedagainst the active (17–22 Kd) form ofcaspase-3 which is a cleavage product ofa larger (37 Kd) propeptide; it can be usedfor Western blots with a few adaptations.
The immunocytochemistry procedure isexactly the same as for the fractin stainingexcept that the dilution for the purifiedprimary antibody is 1/500. So far, thisantibody has been used on human andmurine cells.
Inhibition of apoptosis
In our hands, the irreversible caspaseinhibitors zVAD-fmk at 100 µM andzDEVD-fmk at 200 µM were effectiveat inhibiting apoptosis occurring throughcaspase-3 activation. We also used anti-sense oligonucleotides coupled to cell-permeant peptides as described by Troyet al. [4] at a concentration of 200 nM.
Oligonucleotide sequences directly cou-pled to the cell-permeant vector penetratinare commercially available from Quan-tum Biotechnologies. The penetratin pep-tide and its properties have been describedin detail by Derossi et al. [5] and Dupontet al. [6]. Its amino acid sequence is:RKQIKIWFQNRRMKWKK.
The oligonucleotides used were designedby Troy et al. [4] and their sequences are:
Sequence for antisense caspase-1 CCTC-AGGACCTTGTCGGCCAT
Sequence for antisense caspase-3 GTTG-TTGTCCATGGTCACTTT
These sequences correspond to rat cas-pases; if you investigate another speciesyou should check these sequences andmodify the oligonucleotides accordingly.The caspase-3 antisense oligonucleotidehas proven effective on murine cells [7].
Note that the peptide/oligonucleotideconjugate should be kept away from reduc-ing agents as the two parts are linked bya disulfide bond. The coupling takes place

262 IN VITRO TECHNIQUES
40
30
20
10
0Ctrl J 0.25 µM J 0.5 µM J 1 µM
%ag
e of
TU
NE
L-p
ositi
ve c
ells
Figure 6.11 Toxicity of peptide J on primary cultures of cortical neurons (error bars represent standarddeviation)
between a thiol function at the 5′ end of thenucleotide and a modified cysteine at theN -terminal part of the penetratin peptide.More details on the chemistry involved inthe coupling can be found in Troy et al. [8]and Dupont et al. [6].
Examples
The cell-permeable peptide J has been usedto induce apoptosis; it contains a cytoplas-mic juxtamembrane sequence of the amy-loid precursor protein (APP) linked to apenetratin vector. Our intent was to sim-ulate an excessive generation of amyloidprecursor protein (APP) juxtamembranefragments by internalizing J in corticalneurons (more detail in Bertrand et al. [7]).
Peptide J RKQIKIWFQNRRMKWKKKYTSIHHG
(APP juxtamembrane sequence is under-lined)
The following experiments were per-formed on E15 rat cortical neurons whichwere cultured in ELISA wells precoated
with polyornithine, as in ref. 7. The treat-ments were applied 2 h after plating;whenever necessary the cells were incu-bated with ZVAD 1 h before peptideJ addition.
We first wanted to determine whetherthis peptide was toxic at concentrationsin the micromolar range. We comparedthe number of TUNEL-positive cells offour conditions after 24 h of culture: neu-rons treated with 0.25 �M, 0.5 �M, 1�M of peptide J and untreated controls(Figure 6.11). For each condition, about300 cells were counted on the diameterof six ELISA wells (for a total of 2000).There is no significant difference betweencontrol, J 0.25 �M and J 0.5 �M condi-tions (Student, p > 0.05), whereas the per-centage of TUNEL positive cells is higherfor J 1 �M than for the control (Student,p < 0.001). We conclude that the peptideJ is toxic at 1 �M but not at the lowerconcentrations.
In the next experiment we tested whetherthe toxicity of the peptide J can beblocked by the caspase inhibitor ZVAD

PROTOCOL 6.15 263
40
30
20
10
0Ctrl J 1 µM ZVAD J/ZVAD
%ag
e of
TU
NE
L-p
ositi
ve c
ells
Figure 6.12 The caspase inhibitor ZVAD reduces the toxic effect of peptide J (error bars representstandard deviation)
(Figure 6.12). We studied rat E15 corti-cal neurons and observed the effect ofZVAD on J 1 �M treated and untreatedcells, these cells were fixed after 18 hof treatment. For each condition, 300cells were counted on the diameter ofone ELISA well, and the experiment wasrepeated three times with similar results.The toxicity of peptide J is very effectivelyreduced by ZVAD which also reducesTUNEL-staining in the control (p < 0.001in both cases, Khi2 test). This means thatthe toxic effect of peptide J is mediated bythe caspases and that the TUNEL-stainingin our system is caused by apoptosis.
Data on the activation of caspase-3 byAPP juxtamembrane peptides can be foundin Bertrand et al. [7], along with somein vivo results.
References
1. Jacobson, M. D., Weil, M. and Raff, M. C.(1997) Programmed cell death in animaldevelopment. Cell, 88, 347–354.
2. Nagata, S. (1997) Apoptosis by death factor.Cell, 88, 355–365.
3. Garcia-Calvo, M., Peterson, E. P., Leiting, B.,Ruel, R., Nicholson, D. W. and Thornberry,N. A. (1998) Inhibition of human caspases bypeptide-based and macromolecular inhibitors.J. Biol. Chem., 273, 32 608–32 613.
4. Troy, C. M., Rabacchi, S. A., Friedman, W. J.,Frappier, T. F., Brown, K. and Shelanski, M. L.(2000) Caspase-2 mediates neuronal cell deathinduced by beta-amyloid. J. Neurosci., 20,1386–1392.
5. Derossi, D., Chassaing, G. and Prochiantz, A.(1998) Trojan peptides: the penetratin systemfor intracellular delivery. Trends Cell Biol., 8,84–87.
6. Dupont, E., Joliot, A. and Prochiantz, A.(2002) Penetratins. In: CRC Handbook on CellPenetrating Peptides U. Langel, ed.), CRCPress.
7. Bertrand, E., Brouillet, E., Caille, I., Bouil-lot, C., Cole, G. M., Prochiantz, A. and Allin-quant, B. (2001) A short cytoplasmic domainof the amyloid precursor protein induces apop-tosis in vitro and in vivo. Mol. Cell. Neurosci.,18, 503–511.
8. Troy, C. M., Derossi, D., Prochiantz, A.,Greene, L. A. and Shelanski, M. L. (1996)Downregulation of Cu/Zn superoxide dis-mutase leads to cell death via the nitricoxide–peroxynitrite pathway. J. Neurosci., 16,253–261.

PROTOCOLS 6.16–6.20
The mitochondrial permeability transition[1–5]
Judie B. Alimonti and Arnold H. Greenberg†
Introduction
Mitochondrial permeability transition (PT)occurs when the PT pore opens allowingsolutes and water to enter the mitochon-drial matrix, often accompanied with theloss of the mitochondrial membrane poten-tial (��m). Direct measurement of theopening of the PT pore is best ascertainedusing calcein AM. The non-fluorescent cal-cein AM is membrane permeable, andupon entering the cell is cleaved byesterases to become fluorescent and mem-brane impermeable. CoCl2 is added toeliminate calcein fluorescence in the cyto-plasm so that only the mitochondria will
fluoresce. Calcein exits the mitochondriaonly upon opening of the PT pore, there-fore it is an indicator of PT. Since a closedPT pore is required to maintain ��m, theloss of ��m can also be used to determinePT. However, remember that loss of ��mcan occur independently of PT, thereforeyou must verify that it is due to PT byeither adding a PT inhibitor or calcein AM.The utilization of fluorescent cationic dyesthat accumulate around a membrane witha transmembrane potential allow the mea-surement of ��m. The stronger the mem-brane potential the more dye accumulatesat a membrane.

PROTOCOL 6.16
The mitochondrial permeability transition: PTand ��m loss determined in cells or isolatedmitochondria with confocal laser imaging[2, 4, 5]
Equipment
For cells and isolated mitochondria
Chambered glass coverslips (e.g. Nunc 12-565-103N)
Inverted confocal microscope
Pipette and tips
Polystyrene ice container and ice
Tabletop centrifuge and rotors
ReagentsFor cells and isolated mitochondria
Calcein AM (1 mM stock in DMSO)
Tetramethylrhodamine (TMRM: 10 mMstock in DMSO)
Carbonylcyanide m-chlorophenylhydra-zone (CCCP: 100 mM stock in DMSO)
Cyclosporin A (10 mM stock in ethanol)
For cells only
Tissue culture medium
Cell buffer: Hanks balanced salt solutions(HBSS), 10 mM Hepes pH 7.2
For isolated mitochondria only
Buffer H: 300 mM sucrose, 5 mM TES,and 200 µM EGTA, pH to 7.3 withNaOH. (TES = N-tris[hydroxymethyl]-methyl-2-aminoethanesulfonic acid).
Freshly isolated mitochondria and S100(see Protocols 4.7–4.10)
Assay buffer: 220 mM sucrose, 68 mMmannitol, 10 mM Hepes-KOH, 10 mMKCl, 5 mM KH2PO4, 2 mM MgCl2,0.5 mM EGTA, 5 mM succinate, 2 µMrotenone, pH 7.2
Procedure
Cells
1. Seed adherent cells onto a chamberedglass coverslip. 1© Incubate 1–2 days ina humidified 37 ◦C/ 5% CO2 incubatoruntil the cells are in log phase.
2. Pretreat the cells with any PT inhibitors(i.e. 10 µM cyclosporin A or 50 µMBongkrekic acid) as necessary beforeincubating the cells with the PT induc-ers for the required times. 2©
3. Gently wash the cells twice and resus-pend in cell buffer.
4. Load the cells with the fluorescentmarker. Add 1 µM calcein AM and1–5 mM CoCl2. 3© Incubate for 10–15min at room temperature. Wash fourtimes then resuspend in cell buffer.
5. Imaging is performed on an invertedconfocal microscope using a band by-pass filter of 488 nm for calcein, and

266 IN VITRO TECHNIQUES
Nomarski optics for transmitted lightimages of the same cells. Cells con-taining mitochondria with a closed PTpore will fluoresce whereas the cellsthat have undergone PT have less or nofluorescence. The level of fluorescenceper cell can then be quantitated usingimaging software, along with the num-ber of cells with high, medium or lowlevels of fluorescence. 4© If you are alsousing 100 nm TMRM to measure ��min the same cells then you will have toswitch the optics back and forth from488 nm for calcein, to a band bypassfilter of 568 nm for TMRM.
Isolated mitochondria
1. Add 20 µg/ml freshly isolated mito-chondria in H buffer to a chamberedcoverslip. 5© Centrifuge at 1475g,5 min, 4 ◦C. Wash off the excess layersof mitochondria. 6©
2. Resuspend in assay buffer containing100 nM TMRM, 8 µM calcein AM.Incubate 10–15 min at room tempera-ture. Wash four times and resuspend inassay buffer with TMRM, along withthe S100 if required.
3. Pretreat with any PT inhibitors (i.e.10 µM cyclosporin A, 30 min or50 µM Bongkrekic acid) as necessarybefore incubating the mitochondria withthe PT inducers for the required times.
4. Imaging is performed on an invertedconfocal microscope using a band by-pass filter of 488 nm for calcein, and568 nm for TMRM. Take an imagebefore adding the PT inducer, then atvarious time points to follow PT andloss of ��m. 7©
Notes1© For non-adherent cells you can cyto-
spin them onto a glass coverslip, dryoff the surrounding area and apply a
non-toxic, non-reactive grease aroundthe cells to form a well. Alterna-tively, you can use a polylysine-coatedchambered coverslip to help the cellsadhere.
2© If your PT inducer acts rapidly thenyou can stain your cells with thefluorophores first and take a baselinepicture on the confocal microscopebefore adding your PT inducer andfollowing the loss of fluorescence.
3© CoCl2 is toxic to the cells overextended times, therefore must bewashed out. You may have to adjustthe CoCl2 concentration for eachcell line to determine the minimumconcentration of CoCl2 required toquench the cytoplasmic calcein yetremain non-toxic.
4© If you induce PT before stainingthen you must standardize the stain-ing and confocal settings for all ofthe samples. Remember to include anuntreated sample for your negativecontrol, and CCCP 50–100 µM treat-ment for your positive control. The PTinhibitor cyclosporin A (10–20 µM)can be added to block the PT inducersto verify your test substance works onthe PT pore.
5© Alternatively, add 20 µg/ml freshlyisolated mitochondria in H buffer toa six-well plate containing a 22 ×30 mm coverslip. Centrifuge at1475g, 5 min, 4 ◦C. The coverslipcan either be added to an enclosedheated stage that passes buffer overit, or dry off the surrounding areaand apply a non-toxic, non-reactivegrease around the mitochondria toform a well.
6© Mitochondria are sticky but adhereloosely to the coverslip, so you willhave to gently wash off the excessmultiple layers of mitochondria for

PROTOCOL 6.16 267
easier viewing on the confocal micro-scope.
7© The confocal laser can induce PTin isolated mitochondria, thereforelimit the exposure to the laser, andinclude an untreated mitochondria
sample for the same time period as theexperiment to determine the stabilityof the mitochondria under experimen-tal conditions. CCCP 50–100 µMtreatment is your positive control.

PROTOCOL 6.17
The mitochondrial permeability transition:measuring PT and ��m loss in isolatedmitochondria with Rh123 in a fluorometer[1, 2]
Reagents
Freshly isolated mitochondria and S100(see Protocols 4.7–4.10 )
Carbonylcyanide m-chlorophenylhydra-zone (CCCP: 100 mM stock in DMSO)
Rhodamine 123 (Rh123) (16 mM stock inDMF)
Cyclosporin A (10 mM stock in ethanol)
Assay buffer: 220 mM sucrose, 68 mMmannitol, 10 mM Hepes-KOH, 10 mMKCl, 5 mM KH2PO4, 2 mM MgCl2,0.5 mM EGTA, 5 mM succinate, 2 µMrotenone, pH 7.2
Equipment
Fluorometer
96-well non-fluorescent black plates
Pipettes and tips
5% CO2/37 ◦C humidified incubator
Procedure
1. Load freshly isolated mitochondria inassay buffer in triplicate onto a 96-well
plate with a final mitochondrial concen-tration between 0.75 and 1 mg/ml and aminimum volume of 0.1 ml/well. Alsoadd the S100 if required.
2. The positive control for ��m loss isCCCP (50–100 µM final). Pretreatmentwith PT inhibitors like cyclosporin A(10–20 µM, 30 min) should be used toverify that the ��m loss is due to PT.Add the PT inducers for the requiredtime at 37 ◦C.
3. Add the fluorescent dye Rh123(5 µM). 1© The fluorometer requiresan excitation/emission filter of 485/535nm. Take readings during the linearrange (5–20 min) of the accumulationof Rh123. 2© 3©
Notes
1© As Rh123 accumulates around respir-ing mitochondria the fluorescence de-creases since Rh123 fluorescence isquenched at high concentrations, sothe higher the ��m the lower the flu-orescence. This is unique to Rh123.
2© The results can be expressed as thepercentage of maximum ��m loss,

PROTOCOL 6.17 269
using the CCCP sample as the maxi-mum loss. The mitochondria will dete-riorate with time and the backgroundincreases with longer incubations.
3© Alternatively, you can incubate themitochondria with Rh123 until the
quenching is complete. You then addyour PT inducer and watch for theincrease in fluorescence.

PROTOCOL 6.18
The mitochondrial permeability transition:measuring PT and ��m loss in cells andisolated mitochondria on the FACS [1, 4, 5]
Equipment
FACS and FACS tubes
Pipettes and tips
Polystyrene ice container and ice
5% CO2/37 ◦C humidified incubator
Tabletop centrifuge
Reagents
Freshly isolated mitochondria and S100(see Protocols 4.7–4.10 )
Rh123 (16 mM stock in DMF)
JC-1 (10 mg/ml stock in DMSO)
DiOC6 (3) (100 µM stock in DMSO)
For cells: Hanks balanced salt solution(HBSS), 10 mM Hepes pH 7.2
For mitochondria: Assay buffer: 220 mMsucrose, 68 mM mannitol, 10 mM Hep-es-KOH, 10 mM KCl, 5 mM KH2PO4,2 mM MgCl2, 0.5 mM EGTA, 5 mMsuccinate, 2 µM rotenone, pH 7.2
Procedure
Cells
1. Treat the cells with the PT inhibitorsand inducers for the required times. 1©Wash the cells twice with HBSS,
10 mM Hepes pH 7.2. Resuspend at1 × 106 cells in 1
2 ml HBSS, 10 mMHepes pH 7.2.
2. Label the cells with the Rh123 (2 µM)for 10 min at room temperature. 2©Read on a FACS in FL1.
Mitochondria
1. Pre-incubate 50 µg/ml of freshly iso-lated mitochondria in 1
2 ml assay bufferwith PT inhibitors (10–20 µM cyclo-sporin A) for 30 min before adding thePT inducers for the required time. 1©
2. Label the mitochondria with the Rh123(5 µM) for 10 min at room tempera-ture. 2© Read on a FACS in FL1.
Notes1© The positive control for ��m loss
is CCCP (50–100 µM final). Therewill be a shift in fluorescence with achange in ��m.
2© Other dyes that can be utilized includeDiOC6 (3) (25 nM : mitochondria or40 nM : cells), or JC-1 (5 µg/ml :mitochondria or 1 µM : cells). JC-1fluoresces green when it is a monomerbut red when it aggregates about amitochondria with high ��m.

PROTOCOL 6.19
Measuring cytochrome c release in isolatedmitochondria by Western blot analysis [2, 4]
Equipment
SDS-PAGE apparatus
96-well U-bottom tissue culture plate
Pipette and tips
5% CO2/37 ◦C humidified incubator
Reagents
Freshly isolated mitochondria and S100(see Protocols 4.7–4.10)
Assay buffer: 220 mM sucrose, 68 mMmannitol, 10 mM Hepes-KOH, 10 mMKCl, 5 mM KH2PO4, 2 mM MgCl2,0.5 mM EGTA, 5 mM succinate, 2 µMrotenone, pH 7.2
Cyclosporin A (10 mM stock in ethanol)
PT inducers
Cytochrome c antibody (Pharmingen)
Procedure
1. Add 1 mg/ml freshly isolated mito-chondria in assay buffer to a 96-well
U-bottom plate with or without S100,in a final volume of 60 µl.
2. Pretreat with any PT inhibitors (i.e.10 µM cyclosporin A, 30 min) as nec-essary before incubating the mitochon-dria with the PT inducers at 37 ◦C forthe desired time period, usually within0–4 h.
3. Centrifuge the plate at 760g, 5 min.Add 30 µl of supernatant to 7.5 µl of5× SDS loading buffer. Boil for 5 minthen add 10 µl to a standard 15% SDS-PAGE gel for Western blotting. Useantibodies recognizing cytochrome c toverify cytochrome c release into thesupernatant and mitochondrial dysfunc-tion. 1©
Note
1© Cytochrome c release is a measureof mitochondrial dysfunction but notnecessarily PT. Pre-incubating withPT pore inhibitors can confirm that therelease of cytochrome c may be due toPT.

PROTOCOL 6.20
Protein import into isolated mitochondria[3, 4]
The influence of anti-apoptotic proteinssuch as Bcl-2 on the inhibition of PTcan be examined with mitochondria over-expressing Bcl-2. Bcl-2high mitochondriacan be obtained by isolating them fromcells over-expressing Bcl-2, or by loadingthe isolated mitochondria with Bcl-2 usinga protein import protocol.
Reagents
Freshly isolated mitochondria and S100(see Protocols 4.7–4.10 )
Buffer 1: 250 mM sucrose, 10 mM Hepes-KOH, 2 mM K2HPO4, 5 mM Na succi-nate, 1 mM ATP, 0.08 mM ADP, 1 mMDTT, pH 7.5
Buffer 2: 20 mM Hepes-KOH, 10 mMKCl, 2.5 mM Mg Cl2, 1 mM EDTA,1 mM EGTA, 1 mM DTT, pH 7.5
Buffer 3: 250 mM sucrose, 10 mM Hepes-KOH, 1 mM DTT, pH 7.5
Assay buffer: 220 mM sucrose, 68 mMmannitol, 10 mM Hepes-KOH, 10 mMKCl, 5 mM KH2PO4, 2 mM MgCl2,0.5 mM EGTA, 5 mM succinate, 2 µMrotenone, pH 7.2
Bcl-2 protein
Equipment
37 ◦C water bath
Eppendorfs
Pipettes and tips
Microcentrifuge
Procedure
1. 50 µl 1 mg/ml freshly isolated mito-chondria in buffer 1 is added to 50 µlbuffer 2 containing 0.125–0.5 µg/mlBcl-2 protein (higher concentrationsmay be toxic). Incubate 30 min at37 ◦C.
2. Layer 100 µl onto a 500 µl cushionof buffer 3 and centrifuge at 14 500g,5 min, 4 ◦C.
3. Resuspend pellet in 10 µl of assaybuffer. The mitochondria can then beused in the confocal, fluorometer, cell-free (Western), or FACS protocols.
References
1. Susin, S. A., Larochette, N., Gueskens, M.and Kroemer, G. (2000) Quantitation of themitochondrial transmembrane potential in cellsand isolated mitochondria. Meth. Enzymol.,322, 205–208.
2. Alimonti, J. B., Shi, L., Baijal, P. K.and Greenberg, A. H. (2001) Granzyme Binduces BID-mediated cytochrome c releaseand mitochondrial permeability transition. J.Biol. Chem., 276, 6974–6982.
3. Goping, I. S., Gross, A., Lavoie, J. N.,Nguyen, M., Jemmerson, R., Roth, K.,Korsmeyer, S. J. and Shore, G. C. (1998) Reg-ulated targeting of BAX to mitochondria. J.Cell Biol., 143, 207–215.

PROTOCOL 6.20 273
4. Vande Velde, C., Cizeau, J., Dubik, D., Ali-monti, J., Brown, T., Israels, S., Hakem, R.and Greenberg, A. H. (2000) BNIP3 and gene-tic control of necrosis-like cell death throughthe mitochondrial permeability transition pore.Molec. Cell. Biol., 20, 5454–5468.
5. Castedo, M., Ferri, K., Roumier, T., Meti-vier, D., Zamzami, N. and Kroemer, G. (2002)Quantitation of mitochondrial alterations asso-ciated with apoptosis. J. Immunol. Meth., 265,39–47.

PROTOCOL 6.21
Formation of ternary SNARE complexes in vitro
Jinnan Xiao, Anuradha Pradhan and Yuechueng Liu
IntroductionSNARE (soluble NSF attachment proteinreceptor) proteins have been shown to playessential roles in vesicular transport [1].In nervous systems, v (vesicle)-SNAREand t (target)-SNAREs interact with eachother to form a tight ternary complex.The assembly of such a ternary com-plex allows the opposing membranes tobe pulled into close proximity, permit-ting synaptic vesicle fusion to proceed andrelease neurotransmitters [2]. The neuronalSNARE core complex includes v-SNAREsynaptobrevin (also known as VAMP), t-SNAREs syntaxin and SNAP-25. Whileboth synaptobrevin and syntaxin are mem-brane proteins with a single C-terminaltransmembrane domain, SNAP-25 attachesto membranes via post-translational palmi-toylation of its cysteine residues.
Many studies involving vesicular traf-ficking require reconstitution of theSNARE core complex in vitro. For in-stance, GST-fusion protein pull-downassay is often used to investigate pro-teins implicated in regulation of mem-brane fusion via their interactions with theSNAREs. This short protocol will focus onthe isolation of recombinant SNAREs andthe reconstitution of the SNARE core com-plex in vitro (see Figure 6.13).
EquipmentTabletop microcentrifuge and 1.5 ml micro-
centrifuge tubes
Figure 6.13 An example of reconstitutedSNARE ternary complexes analysed by SDS-PAGE and stained with Coomassie Blue. Theapparent molecular weights for the SNAREs are:60 kDa (EST-Syntaxin�TM), 32 kDa (6 × His-SNAP-25), and 20 kDa (Synaptobrevin). Pre-stained molecular weight marker is shown on theleft. The molecular weights for the markers are(in kDa): 106, 78, 50, 32, 26, 20
37 ◦C Incubator, with shaker
Sonicator (e.g. Virtis Virsonic 50)
Rotating shaker (e.g. Labquake Shaker)
Reagents
LB bacterial culture media
IPTG (e.g. Sigma, GIBCO)
Glutathione-agarose (e.g. Pierce Chemi-cals)
Phosphate-buffered saline (PBS)

PROTOCOL 6.21 275
Thrombin cleavage and capture kit (e.g.Novagen)
6 × His-tagged SNAP-25, in a bacterialexpression plasmid vector (e.g. Invitro-gen’s pTrcHis, Qiagen’s pQE)
Syntaxin with deleted transmembranedomain (syntaxin�TM) in pGEX-2T
Synaptobrevin in pGEX-2T
Procedure
1. Prepare 6 × His-SNAP-25, GST-syntaxin�TM and GST-synaptobrevin.The procedure for GST fusion pro-tein purification has been described indetail by Smith and Johnson [3]. Foraffinity purification of 6 × His-taggedproteins using Ni-NTA agarose, followthe manufacturers’ instructions (e.g.Qiagen’s The QIAexpressionist). Dial-yse the purified His-SNAP-25 againstPBS overnight at 4 ◦C with at leastthree buffer changes. The purified pro-teins should be kept at 4 ◦C for short-term (<5 days) storage. For long-termstorage, the proteins can be kept in−20 ◦C freezer (avoid repeated freez-ing/thawing). The GST-syntaxin�TMagarose is kept at 4 ◦C and it is stablefor at least 2 weeks.
2. Add 5 units of biotinated thrombin to∼1 ml slurry of GST-synaptobrevin inPBS containing 0.1% Triton X-100.Mix the sample well by gently reversingthe microcentrifuge tube several timesand put the tube onto a rotating shaker.Incubate overnight at 4 ◦C. 1©
3. Centrifuge for 2 min in a microcen-trifuge at maximum speed at 4 ◦C. Col-lect the supernatant containing synap-tobrevin. Wash the agarose beads oncewith PBS by centrifugation at 4 ◦C.Use ∼0.4–0.5 ml PBS which is aboutthe same volume as the agarose beads.
Combine the supernatants. However, ifone wants a more concentrated synap-tobrevin preparation, it will be betterto keep them separated, since the firstsupernatant usually has more synapto-brevin.
4. Add at least 30 µl streptoavidin-agaroseto the supernatant and incubate for20–30 min at room temperature. Again,use a rotating shaker for continuousmixing of the sample.
5. Centrifuge the sample for 5 min atroom temperature and at maximumspeed. Collect the supernatant and dis-card the pellet. Dialyse the sampleagainst PBS overnight at 4 ◦C with threebuffer changes.
6. Aliquot 100 µl of His-SNAP-25 (0.2mg/ml), 100 µl of synaptobrevin (0.15mg/ml) and 100 µl agarose slurry ofGST-syntaxin�TM (∼0.5 mg/ml) andmix in a 1.5 ml microcentrifuge tubeby gently reversing the tube severaltimes. 2©
7. Place the mixture on a rotator andincubate overnight at 4 ◦C. 3©
8. Centrifuge the sample in a microcen-trifuge at maximum speed for 2 min at4 ◦C. Discard the supernatant (or keepit for further experiments). Wash theagarose resin with 1 ml PBS three timesat 4 ◦C by centrifugation.
9. The agarose beads containing ternarycomplexes can be boiled in SDS samplebuffer and directly analysed by SDS-PAGE, or immunoblot analysis usingspecific antibodies against the SNAREs.Alternatively, the complexes can beeluted with 5 mM reduced glutathionefor further experiments.
Notes
This procedure will take approximately48 h (not including the preparation of

276 IN VITRO TECHNIQUES
His-SNAP-25, GST-syntaxin�TM, andGST-synaptobrevin).
1© Triton X-100 is helpful in releas-ing the synaptobrevin from the GSTagarose.
2© The molar ratio for the ternary com-plex in vivo is 1 : 1 : 1.
3© Incubation time can be shorter, e.g.1 h at room temperature. However,
overnight incubation at 4 ◦C seems toproduce more complexes.
References
1. Jahn R. and Sudhof T. C. (1999) Ann. Rev.Biochem., 66, 863–911.
2. Brunger A. T. (2001) Curr. Opin. Struct. Biol.,11, 163–173.
3. Smith, D. B. and Johnson, K. (1988) Gene,67, 31–40.

PROTOCOL 6.22
In vitro reconstitution of liverendoplasmic reticulum
Jacques Paiement and Robin Young
Introduction
In vitro reconstitution is among the mostimportant and widely used strategies instudying membrane traffic [1]. We describehere an in vitro assay which allows studyof the reconstitution of rat liver endo-plasmic reticulum. Membrane derivativesof liver endoplasmic reticulum (ER) areincubated under specific conditions lead-ing to membrane fusion and the formationof large ER membrane complexes. Follow-ing incubation the reconstituted ER mem-branes are studied by electron microscopy.Depending on the type of ER derivative(i.e. rough or smooth?) used in the recon-stitution assay the assembly products willexhibit different structural properties andcan be distinguished based on morpho-logical criteria. Examples are describedbelow.
Reagents
ATP (100 mM) to be stored in aliquots inpowder form in a dessicator at −80 ◦C(High grade. Sigma Chemicals cat. no.A-7699)
Complete Protease Inhibitor Cocktail(1 tablet/ml = 50 × concentrated) storedat −20 ◦C (Roche Applied Science cat.no. 1697498)
Creatine Phosphokinase (1 U/µl) to bestored in aliquots in powder form ina dessicator at 4 ◦C (Roche AppliedScience cat. no. 127566)
DTT (250 mM) to be stored in aliquotsin powder form in a dessicator at 4 ◦C(Sigma Chemicals cat. no. D-0632)
GTP (25 mM) to be stored in aliquots inpowder form in a dessicator at −80 ◦C(High grade. Sigma Chemicals cat. no.G-8877)
MgCl2 (125 mM), filtered on Whatmanno. 42 ashless filter to remove anyparticulate matter in solution
Phosphocreatine (50 mM) to be stored inaliquots in powder form in a dessicatorat 4 ◦C (Roche Applied Science cat. no.621714)
Sucrose-Imidazole (0.25 mM sucrose,3 mM imidazole, pH 7.4), filtered onWhatman no. 42 ashless filter to removeany particulate matter in solution
tER derived membranes (see ‘Fractiona-tion of rough and smooth microsomesfrom rat liver homogenates’, Protocol6.22 for preparation)
Tris-HCl buffer (200 mM, pH 7.4), fil-tered on Whatman no. 42 ashless fil-ter to remove any particulate matter insolution

278 IN VITRO TECHNIQUES
Equipment
Polypropylene conical microcentrifugetubes (1 ml)
Incubation bath, with shaker (37 ◦C)
Procedure 1©1. Prepare test samples and all stock
solutions on ice (ensure all solutionsare at least 4 ◦C prior to preparationof medium).
2. Prepare stock solutions of DTT, crea-tine phosphokinase and phosphocrea-tine. Remove protease inhibitor stockfrom −20 ◦C and put on ice tothaw.
3. The following reagents are added toeach tube to produce a final incubationmixture of 250 µl:
• 125 µl Tris buffer to produce finalconcentration of 100 mM,
• 10 µl MgCl2 to produce final con-centration of 5 mM,
• 1.8 µl creatine phosphokinase toproduce final concentration of 7.3U/ml,
• 10 µl phosphocreatine to producefinal concentration of 2 mM,
• 10 µl DTT to produce final concen-tration of 0.1 mM,
• 5 µl protease inhibitor cocktail toproduce final concentration of 1×.
4. Take membranes out of −80 ◦C andplace on ice.
5. Add sucrose-imidazole (amount addedis calculated to bring final incubationvolume to 250 µl, after addition of allreagents).
6. Take GTP and ATP out of −80 ◦C andkeep on ice.
7. Prepare stock ATP and add 5 µl toeach tube to produce a concentrationof 2 mM.
8. Prepare stock GTP and add 10 µl toeach tube to produce a concentrationof 1 mM.
9. Verify membranes are thawed and add150 µg of membrane protein to eachtube.
10. Incubate at 37 ◦C for 90 min withconstant oscillation, with additionalmanual agitation every half-hour.
11. At end of 90 min add 5 and 10 µl ofATP and GTP respectively. 2©
12. Continue incubation for an additional90 min at 37 ◦C with constant oscilla-tion, with additional manual agitationof individual tubes every half-hour.
Comments
The incubation medium described herecontains factors that will stimulate fusionof membranes of classical rough micro-somes [2, 3], fusion of membranes of low-density rough microsomes [4–7], fusion ofmembranes of smooth microsomes [4–7]and fusion of membranes of the nuclearenvelope [8]. The reconstituted elementsformed as a consequence of membranefusion have been characterized by a vari-ety of biochemical, histochemical andimmunocytochemical procedures [2–8].The factors involved in the transformationof various ER membrane subdomains aresummarized in a review [9].
Figure 6.14 shows in vitro reconstitutedtransitional endoplasmic reticulum (tER).Derivatives of liver tER were incubatedusing the specific incubation conditionsdescribed above. Following incubation themembrane sample was fixed in suspensionand processed as described previously [7].The two domains of the tER are recogniz-able based on morphological criteria. The

PROTOCOL 6.22 279
Figure 6.14 Micrograph of reconstituted hepatocyte ER showing a membrane complex consistingof branching and anastomosing smooth tubules in continuity with peripheral rough ER cisternae. Thearrow points to closely apposed membranes of two rough ER cisternae. One cisterna is dilated andcontains the arrow and the arrowheads, the other cisterna is flattened and tightly bound at the peripheryof the dilated cisterna. Ribosomes are mainly observed between the two cisternae. Arrowheads pointto ribosomes. f, fenestrations; t, smooth tubes.
rER domain consists of parallel cisternaelimited by ribosome-studded membranesand the sER domain consists of a net-work of interconnecting tubules limitedby smooth membranes devoid of attachedribosomes.
NotesThis procedure will take approximately4 h.
1© Similar cell-free incubation conditionsfor reconstitution of tER have previ-ously been summarized and includevariations in concentration of certainreagents and other parameters of incu-bation [4–6].
2© This will compensate for potentialnucleotide hydrolysis during incuba-tion by membrane nucleotidases.
References1. Mellman, I. and Warren, G. (2000) Cell, 100,
99–112.
2. Paiement, J. and Bergeron, J. J. M. (1983) J.Cell Biol., 96, 1791–1796.
3. Paiement, J., Beaufay, H. and Godelaine, D.(1980) J. Cell Biol., 86, 29–37.
4. Roy, L., Bergeron, J. J. M., Lavoie, C., Hen-driks, R., Gushue, J., Fazel, A., Pelletier, A.,Morre, D. J., Subramaniam, V. N., Hong, W.and Paiement, J. (2000) Mol. Biol. Cell., 11,2529–2542.
5. Lavoie, C. Chevet, E., Roy, L., Tonks, N. K.,Fazel, A., Posner, B. I., Paiement, J. and Berg-eron, J. J. M. (2000) Proc. Nat. Acad. Sci., 25,13 637–13 642.
6. Lavoie, C., Paiement, J., Dominguez, M., Roy,L., Dahan, S., Gushue, J. N. and Berg-eron, J. J. M. (1999) J. Cell Biol., 146,285–299.
7. Lavoie, C., Lanoix, J., Kan, F. W. K. andPaiement, J. (1996) J. Cell Sci., 109, 1415–1425.
8. Paiement, J. (1984) Exp. Cell Res., 151,354–366.
9. Paiement, J. and Bergeron, J. (2001) Biochem.Cell Biol., 79, 587–592.

PROTOCOL 6.23
Asymmetric incorporation of glycolipids intomembranes and detection of lipid flip-flopmovement
Felix M. Goni*, Ana-Victoria Villar, F.-Xabier Contrerasand Alicia Alonso
Introduction
Assemblies of glycosphingolipids and chol-esterol are believed to form microdomains(‘rafts’) with specific functions in membranetraffic and signal transduction. Flask-shaped60 nminvaginationsof thecell plasmamem-brane, termed caveolae, may be the sitesat which these domains cluster and self-stabilize [1, 2]. Rafts and caveolae recruitspecific membrane proteins which are impli-cated in cell signalling [3, 4].
These domains have a particular asym-metric disposition as glycosphingolipidsand glycosylphosphatidylinositol (GPI)-linked proteins locate preferentially in theouter leaflet [1, 2, 5, 6]. While artificial lip-idicvesicles (liposomes)havebeenextreme-ly useful in the understanding of multipleaspects of membrane structure and function,no simple technology was available for thereliable preparation of liposomes with asym-metrically distributed lipids. In view of thestructural and functional importance of raftsand caveolae, we have recently described thepreparation of liposomes with GPI and/orglycosphingolipids located preferentially inthe outer monolayer [7].
Cell membrane asymmetry, however, isnot a static phenomenon. Instead, it arisesfrom a series of concerted transmembrane
movements, leading to a time-invariantdistribution of bilayer components. Lipidasymmetry in particular is known to bealtered in physiological or pathologicalevents such as recognition by phagocytes,blood coagulation, or apoptosis [8]. Thecollapse of lipid asymmetry is often knownas lipid ‘scrambling’.
Sphingomyelinases cleave the sphin-gophospholipid sphingomyelin yieldingphosphorylcholine and ceramide [9, 10]. Inturn, ceramide may alter a number ofmembrane properties: it increases lipidorder, gives rise to ceramide-rich sepa-rate domains, and destabilizes the lamellarstructures, inducing membrane permeabi-lization and membrane fusion [4, 11–14].
In this context, we have developed anassay to test transmembrane (‘flip-flop’)lipid movement induced by sphingomyeli-nase via ceramide formation [15]. Both thepreparation of asymmetric vesicles and theflip-flop assay are described below.
A. Asymmetric incorporationof glycolipids into liposomalmembranesMaterials
GM3 monosialoganglioside (e.g. MatreyaInc. or other supplier) 1©

PROTOCOL 6.23 281
Neuraminidase (EC 3.2.1.18) from Clo-stridium perfringens (Sigma)
FITC-dextran (fluorescein isothiocyanate-dextran, average molecular weight 4400Da) (Sigma)
Egg lipids (sphingomyelin, phosphatidyl-choline, phosphatidylethanolamine) arepurchased from Lipid Products, UK
Cholesterol, 8-aminonaphthalene-1, 3, 6-trisulfonic acid (ANTS) (MolecularProbes Inc.)
p-Xylenebis (pyridinium bromide) (DPX)(Molecular Probes Inc.)
Liposomes (large unilamellar vesicles ob-tained by extrusion through polycar-bonate filters 100–400 nm pore diam-eter [16]) 2©
Procedure
Asymmetric incorporation of glycolipids
1. Incorporate GPI or GM3 to liposomesprepared by extrusion, by drying theglycolipid from organic solvent andresuspend in a volume of methanolequivalent to 5% of the vesicle suspen-sion volume. 3©
2. Add vesicles to the methanolic glycol-ipid solution with vortex mixing.
3. Incubate the vesicles for 15 min [7]. 4©
Representative results
The mild character of the bilayer per-turbation caused by glycolipids dur-ing their incorporation under our condi-tions is demonstrated by an experimentin which fluorescent molecules (FITC-dextran, molecular weight 4400 Da) areentrapped in the vesicles. These moleculesare self-quenching and their fluorescenceincreases upon dilution [17]. As shown
in Figure 6.15, neither methanol nor GPIin methanolic solution is able to releaseFITC-dextran molecules from the lipo-somes. As expected, addition of 0.025%(w/v) Triton X-100 releases the wholevesicular contents. Similar experimentswith GM3 instead of GPI also fail to showany vesicle leakage secondary to ganglio-side insertion (not shown). When ANTS-DPX, the molecular weight of which is oneorder of magnitude below that of FITC-dextran 4400, is entrapped in the vesicles,incorporation of GPI is accompanied bypartial release of the dyes, while GM3 iscompletely inactive in this respect [7].
The asymmetric insertion of GM3into the outer monolayer of liposomesis shown in the following experiment.Large unilamellar vesicles of eitherphosphatidylethanolamine : phosphatidyl-choline : cholesterol (2 : 1 : 1) or phos-phatidylethanolamine : phosphatidylcho-line (2 : 1) are added to GM3 ganglio-side in methanolic solution (5 mole %of total lipid). After vortexing and incu-bation at room temperature, the vesicles(0.3 mM) are treated with neuraminidase(0.16 U/ml), an enzyme known to degradethe glycosidic part of gangliosides, releas-ing sialic acid. In this preparation, lipidsother than GM3 are not hydrolysed by neu-raminidase. Furthermore, neuraminidasecannot cross the membrane and reachthe inner liposomal compartment. Neu-raminidase is assayed in 10 mM Hepes, pH5.6, 39 ◦C, with continuous stirring. Totallipid concentration is 0.3 mM. Enzymeconcentration is 0.16 U/ml. Aliquots areremoved from the reaction mixture at reg-ular intervals and extracted with chloro-form/methanol/hydrochloric acid (200/100/1, by volume). Sialic acid is assayedin the aqueous phase with the resorci-nol method [18]. The enzyme activity isshown as a function of time in Figure 6.16.After 60 min, when c.75% of the gan-glioside appears to have been cleaved,

282 IN VITRO TECHNIQUES
120
100
80
60
40
20
0
−20
−40
0 10 20 30 40
Time (min)
Fluo
resc
ence
(a.
u.)
Methanol GPI inmethanol
TX-100
1 2 3
Figure 6.15 Asymmetric incorporation of GPI into the outer monolayer of liposomes, and its effect onthe permeability barrier properties of the vesicles. Lipid composition was phosphatidylethanolamine :phosphatidylcholine : cholesterol 2 : 1 : 1 mole ratio. Liposomes were large unilamellar vesicles con-taining entrapped FITC-dextran (average molecular weight 4400 Da). The various reagents were addedas indicated by the arrows. The encircled figures at the bottom correspond to the times at which aver-age diameters were measured by quasi-elastic light scattering. Average particle diameters were: 1,131.9 ± 1.1 nm; 2, 129.7 ± 2.3 nm; 3, complete heterogeneity (polydispersity 1.0). Taken from ref. 7,with permission
100
80
60
40
20
00 20 40 60 80 100
(A)
TX-100
% H
ydro
lyse
d G
M3
sial
ic a
cid
Time (min)
Figure 6.16 Neuraminidase cleavage of GM3 that had been asymmetrically inserted into the outermonolayer of liposomes. Lipid composition as in Figure 6.15. Total lipid concentration was 0.3 mM.GM3 concentration was 0.015 mM. Enzyme concentration was 0.16 U/ml. Experiment started in theabsence of detergent, Triton X-100 (0.025% w/v) added at the time indicated by the arrow. Takenfrom ref. 7, with permission
Triton X-100 (0.025% w/v final concen-tration) is added in order to terminatethe membrane barrier effect (Triton X-100under these conditions permeabilizes the
liposomal membranes to large molecules,see Figure 6.15). No further hydrolysisoccurs during the following 30 min. This isinterpreted as an indication that most, if not

PROTOCOL 6.23 283
all, of the GM3 molecules were originallylocated in the outer monolayer and wereaccessible to neuraminidase. Independentexperiments had shown that the lack offurther hydrolysis after membrane perme-abilization by Triton X-100 was not due toa detergent-induced enzyme inactivation.
B. Detection of lipidtransmembrane (flip-flop)movement
Materials
Sphingomyelinase (E.C. 3.1.4.12) fromBacillus cereus (Sigma) 5©
Other materials, liposome preparation andasymmetric incorporation of lipids areperformed as described in section A,above. When required, neuraminidase(0.16 U/ml) is added to the hydrationbuffer. In this case, non-entrapped neu-raminidase is removed by gel filtrationthrough Sephadex G-75
Anti-neuraminidase IgG 6©
Procedure
Ganglioside flip-flop translocationin lipid bilayers
1. Treat LUV composed of SM : PE :Ch (2 : 1 : 1 mole ratio) with GM3 gan-glioside in methanol to obtain vesiclescontaining GM3 (∼10 mole % of totallipid) located exclusively on the outerleaflet, as described above. 7©
2. Add sphingomyelinase to the suspen-sion of these vesicles to induce SMhydrolysis, that reaches equilibriumafter c.20 min, when c.40% of SM hasbeen hydrolysed (Figure 6.17(a)).
3. Addition of Triton X-100 after 60 mincauses membrane disruption, but SMhydrolysis does not go beyond 50%
30 min after detergent addition, i.e.90 min after sphingomyelinase addi-tion. 8©
4. Remove aliquots of the vesicle suspen-sion at fixed times after sphingomyeli-nase addition, and analyse for the GM3product of neuraminidase activity, sialicacid. GM3 is hydrolysed almost in par-allel with SM, except that no saturationwas observed (Figure 6.17(b)). 9©
Comment
It is necessary to rule out the possibil-ity of neuraminidase coming out fromthe vesicles as a result of sphingomyeli-nase activity. Ceramides increase mem-brane permeability, and efflux of moleculesup to 40 kDa has been observed insphingomyelin-treated vesicles [13]. Neu-raminidase has a molecular mass of 70kDa. In order to clarify this aspect, acontrol experiment can be performed inwhich any extravesicular neuraminidasewould be neutralized by a specific anti-body. With this aim, a polyclonal antineu-raminidase antibody was raised in rabbits,and it was checked that the purifiedantineuraminidase IgG at 50 µg/ml com-pletely abolished neuraminidase activityat 0.16 U/ml. The same concentration ofIgG had no effect on sphingomyelinaseactivity. When the experiment describedin Figure 6.17 is repeated with 50 µg/mlantineuraminidase antibody in the medium,the results are exactly the same (data notshown). It can be concluded that GM3hydrolysis is catalysed by neuraminidaseinside the vesicles, thus sphingomyelinaseactivity causes GM3 to flip to the insidelipid monolayer.
Notes
1© Glycosylphosphatidylinositol (GPI) ispurified from rat livers as described byVarela-Nieto et al. [19].

284 IN VITRO TECHNIQUES
Time (min)
% H
ydro
lyse
d S
M20
40
60
80
100
Time (min)
% H
ydro
lyse
d G
M3
0
20
40
60
80
100
00 20 40 60 80
0 20 40 60 80
(a)
(b)
Triton X-100
Triton X-100
Figure 6.17 Flip-flop of GM3 ganglioside induced by sphingomyelinase activity, in large unilamellarvesicles. (a) Time-course of sphingomyelin hydrolysis by external sphingomyelinase. (b) GM3 gan-glioside hydrolysis by entrapped neuraminidase. Average values ± SEM. Vesicle composition wassphingomyelin : phosphatidylethanolamine : cholesterol (2 : 1 : 1, mole ratio) + 10 mole % GM3 onthe outer leaflet only [15]
2© Several lipid compositions based onsphingomyelin, phosphatidylcholineand phosphatidylethanolamine with orwithout cholesterol have been usedwith similar results from the pointof view of glycolipid incorporation.When required, liposomes are pre-pared containing entrapped fluorescentdyes, such as ANTS-DPX [20], orFITC-dextrans [17]. In these cases thefluorescent probes are included in thelipid hydration buffer during liposomepreparation, and the non-entrapped
probes are removed from the vesiclesin a Sephadex G-75 separation col-umn.
3© Glycolipids have been used at molarfractions of up to 0.1 of total lipid.
4© In our experience this incubation isallowed to proceed at room temper-ature because the lipids used in lipo-some preparation are of natural origin,and their mixtures are expected to bein the fluid state at room temperatures.Other lipid compositions may requireincubation at higher temperatures.
PROTOCOL 6.23 285
5© Sphingomyelinase is used in the pres-ence of 2 mM o-phenantroline inorder to inhibit traces of contami-nant phospholipase C activity. Pre-vious studies had shown that o-phenantroline does not affect sphin-gomyelinase activity.
6© Raise antibody in rabbits and purifyusing a Hi-trap protein G affinity col-umn. The crude antibody (1 ml) ispassed through the column and the lat-ter is washed three times with 20 mMphosphate, pH 7 buffer. Antineu-raminidase IgG is eluted from theaffinity column with a 0.1 mM gly-cine-HCl, pH 2.7 buffer.
7© The vesicles contain neuraminidaseand, when kept at 4 ◦C, the vesiclesare stable for at least 12 h. No signifi-cant amount of GM3 is hydrolysed inthis period of time.
8© Previous experiments had shown thatthis Triton X-100 concentration didnot inhibit sphingomyelinase or neu-raminidase.
9© After addition of Triton X-100, vir-tually all GM3 is cleaved by neu-raminidase. The data suggest that, asa consequence of sphingomyelinaseactivity, GM3 is flipping to the innerleaflet, thus becoming accessible toneuraminidase.
References
1. Simons, K. and Ehehalt, R. (2002) J. Clin.Invest., 110, 597–603.
2. Razani, B., Woodman, S. E. and Lisanti,M. P. (2002) Pharmacol. Rev., 54, 431–467.
3. Kenworthy, A. (2002) Trends Biochem. Sci.,27, 435–437.
4. Kolesnick, R. N., Goni, F. M. and Alonso, A.(2000) J. Cell. Physiol., 184, 285–300.
5. Simons, K. and Ikonen, E. (1997) Nature,387, 569–572.
6. Hooper, N. M. (1998) Curr. Biol., 8, R114–R116.
7. Villar, A. V., Alonso, A., Paneda, C., Varela-Nieto, I., Brodbeck, U. and Goni, F. M.(1999) FEBS Lett., 457, 71–74.
8. Bevers, E. M., Comfurius, P., Dekkers,D. W. C. and Zwaal, R. F. A. (1999) Biochim.Biophys. Acta, 1439, 317–330.
9. Barenholz, Y., Roitman, A. and Gatt, S.(1966) J. Biol. Chem., 241, 3731–3737.
10. Goni, F. M. and Alonso, A. (2002) FEBSLett., 531, 38–46.
11. Basanez, G. and Edwards, K. (1997) Bio-phys. J., 72, 2630–2637.
12. Goni, F. M. and Alonso, A. (2000) Biosci.Rep., 20, 443–463.
13. Montes, L. R., Goni, F. M. and Alonso, A.(2002) J. Biol. Chem., 277, 11 788–11 794.
14. Ruiz-Arguello, M. B., Goni, F. M. andAlonso, A. (1998) J. Biol. Chem., 273,22 977–22 982.
15. Contreras, F. X., Villar, A. V., Alonso, A.,Kolesnick, R. N. and Goni, F. M. (2003)278, 37169–37174 .
16. Mayer, L. D., Hope, M. H. and Cullis, P. R.(1986) Biochim. Biophys. Acta, 858, 161–168.
17. Ostolaza, H., Bartolome, B., Ortiz deZarate, I., de la Cruz, F. and Goni, F. M.(1993) Biochim. Biophys. Acta, 1147, 81–88.
18. Wybenga, L. E., Epand, R. F., Nir, S., Chu,J. W. K., Sharon, F. J., Flanagan, T. D. andEpand, R. M. (1996) Biochemistry, 35,9513–9518.
19. Varela-Nieto, I., Alvarez, L. and Mato, J. M.(1993) Handb. Endocr. Res. Tech., 20, 391–405.
20. Ellens, H., Bentz, J. and Szoka, F. C. (1986)Biochemistry, 25, 4141–4147.

PROTOCOL 6.24
Purification of clathrin-coated vesiclesfrom rat brains
Brian J. Peter and Ian G. Mills
Introduction
Clathrin-coated vesicles (CCVs) are endo-cytic and trafficking organelles which arehighly enriched in the coat protein clathrin,as well as AP complexes and a number ofother proteins involved in vesicle buddingand endocytosis. There are other protocolspublished detailing their purification [1, 2],but this protocol is quick (1 day) and use-ful for purifying small amounts of CCVssufficient for Western blots, EM, or furtherclathrin purification.
Reagents
Frozen rat brains 1©HKM buffer (25 mM Hepes pH 7.4,
125 mM potassium acetate, 5 mM mag-nesium acetate, 1 mM dithiothreitol)
HKM buffer with 12.5% Ficoll and 12.5%sucrose, and HKM buffer made up withdeuterium oxide (D2O) with 8% su-crose 2©
Protease inhibitor cocktail III (Calbiochem)
Equipment
Low-speed refrigerated centrifuge androtor (e.g. Sorvall SS34 rotor or equiv-alent)
Potter-Elvehjem homogenizer (with both45 and 15 ml tubes)
Preparative ultracentrifuge and rotors (e.g.Beckman type 70 Ti, type 45 Ti, SW 40Ti + tubes, or equivalent)
Procedure1. Crush 10 rat brains into small pieces
while still frozen; this can be done in asealed bag immediately after removingbrains from freezer, or under liquidnitrogen with a mortar and pestle. 3©
2. Make up to 40 ml with HKM and addCalbiochem protease cocktail set III.
3. Homogenize brains in a 50 ml potter-Elvehjem homogenizer (10–15strokes). Avoid frothing.
4. Spin at 7000 rpm (5800gmax) for20 min in an SS34 rotor.
5. Collect supernatant with a pipette. Becareful to minimize carryover of theloose lipid pellet.
6. Ultracentrifuge at 45 000 rpm(208 000gmax) for 40 min in a type70 Ti rotor.
7. Resuspend pellet in 10 ml of HKM.Homogenize pellet in a 15 ml homog-enizer.
8. Add an equal volume of HKM con-taining Ficoll (12.5% w/v) and sucrose(12.5% w/v). Mix by inversion toensure homogeneity.

PROTOCOL 6.24 287
9. Spin in a type 70 Ti rotor at 25 000 rpm(64 000gmax) for 20 min.
10. Dilute the supernatant 1 : 5 in HKM.
11. Centrifuge at 35 000 rpm (142 000gmax)for 60 min in a type 45 Ti rotor.
12. Resuspend pellet in 15 ml of HKMand homogenize.
13. Leave on ice for about 1 h. 4©14. Spin at 13 000 rpm (17 000gmax) for
10 min in a type 70 Ti rotor tosediment insoluble material.
15. Layer supernatant over a cushionof 8% (w/v) sucrose made up withD2O and HKM. Spin supernatant at25 000 rpm (80 000gmax) in a swing-out rotor (SW40) for 2 h.
16. Resuspend the pellet in HKM to yielda cloudy suspension. Fractions can besnap frozen in liquid nitrogen andstored at −70 ◦C or used immediately.
Notes
This procedure will take approximately9 h. All steps should be done at 4 ◦C.
1© Brains can be purchased from Har-lan Seralab Loughborough, UK andshould be stored at −80 ◦C. (Freshbrains can also be used.)
2© All buffers should be ice-cold duringthe procedure.
3© Alternatively, mince the brains withscissors after adding the cold buffer.
4© For clathrin purification, steps 13 and14 can be omitted, as they decreasefinal protein yield. Pellets should beresuspended in 800 mM Tris-HCl pH8.0 and incubated in rotating tubesovernight at 4 ◦C. Pellet the vesiclesat 50 000 rpm in a Beckman TLA100rotor (20 min spin). The supernatantis highly enriched in clathrin. Clathrincan be purified away from AP com-plexes and other proteins by gel filtra-tion or ion exchange chromatography.
References
1. Pearse, B. M. (1983) Isolation of coated vesi-cles. Methods Enzymol., 98, 320–326.
2. Keen, J. H., Willingham, M. C. and Pastan,I. H. (1979) Clathrin-coated vesicles: isola-tion, dissociation and factor-dependent reasso-ciation of clathrin baskets. Cell, 16, 303–312.

PROTOCOL 6.25
Reconstitution of endocytic intermediates ona lipid monolayer
Brian J. Peter and Matthew K. Higgins
Introduction
Lipid monolayers have been used formany years as templates for the forma-tion of two-dimensional crystals of sol-uble proteins (reviewed in ref. 1) and,more recently, membrane proteins [2]. Theprinciple of the assay is that phospho-lipids, when placed onto an aqueousdroplet, adopt a conformation in whichthe hydrophobic tails point towards the airwhile the hydrophilic head groups contactthe solution. Proteins of interest interactwith the head groups and are concentratedin a two-dimensional array. A hydrophobicelectron microscope grid interacts with thelipid tails, allowing the monolayer to beremoved from the droplet and studied inthe electron microscope. The lipid mono-layer composition can be tailored to sim-ulate the inner leaflet of the plasma mem-brane, and thus can be used in conjunctionwith purified proteins to reconstitute earlystages of endocytosis. While the fluidityand flexibility of a lipid monolayer are notthe same as those of a lipid bilayer withaqueous solution on either side, this tech-nique can nonetheless be useful for study-ing the properties of different proteins andtheir interactions with clathrin. The forma-tion of clathrin coats can be observed usingnegative stain electron microscopy, whilethe use of platinum shadowing can revealthe degree of invagination of these coats.
For examples, see refs 3 and 4. A galleryof images obtained with this technique canbe view on the web (http://www2.mrc-lmb.cam.ac.uk/groups/hmm/epsin/EM/).
Reagents
Chloroform
Cholesterol (Avanti), dissolved to 10 mg/mlin Chloroform
Clathrin (purified) HKM buffer (25 mMHepes pH 7.4, 125 mM potassium ace-tate, 5 mM magnesium acetate, 1 mMdithiothreitol) 1©
Methanol
Phosphatidylinositol and Phosphatidylino-sitol-4,5-bisphosphate (Avanti polar lip-ids), dissolved to 1 mg/ml in 3 : 1 chlo-roform: methanol. 2©
Phosphatidylserine, phosphatidylcholineand phosphatidylethanolamine (Sigma)dissolved in chloroform to 10 mg/ml.
Purified AP180, epsin or other clathrin-and lipid-binding protein.
Uranyl acetate, 2% w/v (Biorad), with0.0025% w/v polyacrylic acid (Sigma)in water 3©
Equipment
Carbon and collodion-coated gold electronmicroscopy grids (e.g. G204G fromAgar Scientific Ltd, coated first with

PROTOCOL 6.25 289
collodion or formvar, and then with athin layer of evaporated carbon)
Forceps for handling EM grids – self-lock-ing spring forceps are especially useful
Humid chamber, or covered container witha wet paper towel inside
Parafilm
Teflon block with 60 µl wells allowing forside injection (see Figure 6.18)
Transmission electron microscope
Vacuum evaporator, 0.2 mm diameter pie-ce of platinum wire (TAAB Labo-ratories), 1 mm thick tungsten wire(also TAAB) (necessary for platinumshadowing)
Whatman filter paper or similar, forblotting EM grids
Procedure1. Make up a lipid mixture containing
10% cholesterol, 40% PE, 40% PC
and 10% PtdIns(4,5)P2 to a final con-centration of 0.1 mg/ml in a 19 : 1mixture of chloroform : methanol(methanol is necessary to maintainPtdIns(4,5)P2 solubility). This mix-ture should be made on the day themonolayer is made. If stored, it shouldbe stored under argon at −80 ◦C in aglass vial with a glass or Teflon lid,for not longer than 3 days.
2. Arrange Teflon block in humid cham-ber, and fill wells of Teflon blockwith HKM buffer. Fill the wells with40–60 µl of buffer, such that the totalvolume in the well will be 60 µl afterinjection of protein samples. 4©
3. Carefully pipette (or inject withHamilton syringe) 1 µl of lipid mix-ture on to the buffer in the well. Asa negative control, inject pure chloro-form without any lipid (this will testfor lipid dependence of any structures
(b)
(b)
(a)
(a)
Figure 6.18 Top (above) and cross-section (below) views of the Teflon block used for monolayer for-mation. The block contains eight wells for processing samples in parallel. Main buffer well (a) shouldbe 4 mm in diameter × 5 mm deep (or deeper) for a 60 µl sample volume. The monolayer is formedon top of a buffer droplet in well (a), and proteins and buffer are injected later through the side port (b)

290 IN VITRO TECHNIQUES
seen, such as whether clathrin basketsform in solution instead of clathrincoats on the monolayer surface). 5©
4. Incubate at room temperature for60 min. The chloroform should evap-orate, leaving a monolayer of lipid onthe surface of the buffer.
5. Carefully place one EM grid, carbonside down, onto the top of each buffer
droplet. Grids should not glow dis-charged before use as a hydropho-bic carbon film is required to adhereto the hydrophobic lipid tails ofthe monolayer.
6. Gently inject proteins into the sideinjection well. Final protein concentra-tions in the well should be 0.5–2 µMfor the AP180/epsin/adaptor protein,
(a) (b)
(c)
Figure 6.19 Electron micrographs of endocytic intermediates formed with the monolayer assay: (a)structures formed by incubation of AP180 and clathrin; (b) structures formed by incubation of epsin1and clathrin; (c) structures formed by incubation of AP180, AP2 complex, and clathrin after shadowingwith platinum. Scale bar in (b) = 300 nm and applies to all panels

PROTOCOL 6.25 291
and 30–500 nM for the clathrin. It isoften useful to try several concentra-tions, to account for differences in pro-tein activity.
7. Incubate 60 min at room temperature.
8. Prepare uranyl acetate stain. Lay afresh piece of Parafilm on the bench,and place two 30 µl drops side by sideon the Parafilm for each grid whichwill be stained. Lay out a piece ofWhatman filter paper to blot bufferand stain from grids. Lay out a secondpiece of filter paper on which to setgrids to air-dry.
9. Gently inject approximately 30 µl ofbuffer into the side injection port; thiswill raise the grid up above the sur-face of the Teflon block. Immediatelygrab the grid with forceps and lift itvertically off of the droplet.
10. Blot the grid briefly by touching it tothe filter paper, then touch it to the firststain droplet and blot immediately.Touch the grid to the second staindroplet, leave for 30 s, and blot briefly.This leaves a film of stain on thesurface of the grid in which the proteinis embedded. If the grids will beplatinum shadowed, hold the grid tothe filter paper for several secondsto ensure that the entire grid surfacedries. Lay the grid on another piece offilter paper to dry.
11. For negative stain EM, grids canbe examined in the EM immediately(see Figure 6.19). They are also stablefor several weeks, at least, at roomtemperature.
12. If platinum shadowing is required, setup the vacuum evaporator with a 2 cmlong piece of platinum wire coiledtightly round a piece of 1 mm thicktungsten wire. Place the grids to beshadowed on a rotary platform at an
angle of 10◦ to the line between theplatform centre and the platinum coil.Create a vacuum in the evaporator.With a shield between the grids andthe wire, turn on the current to thetungsten wire. When the platinum wiremelts, remove the shield and the plat-inum will evaporate onto the grids.For rotary platinum shadowing, startrotation of the platform immediatelybefore removing the shield. For sin-gle angle shadowing, the platform canremain stationary during the evapora-tion; 1–2 min of evaporation is usu-ally sufficient, but trials may need tobe done to account for differences inevaporators.
Notes
This procedure will take approximately3 h. All reagents should be of the highestpurity available, and buffers should befiltered before use.
1© Clathrin should be dialysed into HKMbuffer and centrifuged for 20 min at100 000gmax (e.g. 45 000 rpm in aBeckman TLA100 rotor) immediatelyprior to use to remove aggregates.
2© Lipid stocks were stored at −80 ◦C.
3© The addition of polyacrylic acid helpsto prevent the stain from precipitatingand forming uranyl acetate crystals.
4© It is important to ensure that thesurface of the droplet is either flator slightly concave. Overfilling theTeflon wells leads to a convex dropletsurface, upon which the monolayerdoes not form properly. Also, fill-ing the wells with too little volume(less than 35 µl, or depending on thegeometry of the block) can lead to anuneven surface near the side injectionport.

292 IN VITRO TECHNIQUES
5© Trace lipid contamination (e.g. PtdIns(4,5)P2) on the Teflon block can resultin misleading negative controls. TheTeflon block should be rinsed withhot water, then ethanol, and finally,soaked overnight in a mixture ofchloroform/methanol to remove anyprotein or lipid residue. Hamiltonsyringes are also susceptible to tracelipid contamination.
References
1. Chiu, W., Avila-Sakar, A. J. and Schmid, M.F. (1997) Electron crystallography of macro-molecular periodic arrays on phospholipidmonolayers. Adv. Biophys., 34, 161–172.
2. Levy, D., Mosser, G., Lambert, O., Moeck, G.S., Bald, D. and Rigaud, J. L. (1999) Two-
dimensional crystallization on lipid layer: asuccessful approach for membrane proteins. J.Struct. Biol., 127(1), Aug, 44–52.
3. Ford, M. G., Mills, I. G., Peter, B. J., Val-lis, Y., Praefcke, G. J., Evans, P. R. andMcMahon, H. T. (2002) Curvature of clathrin-coated pits driven by epsin. Nature 419(6905),361–366.
4. Ford, M. G., Pearse, B. M., Higgins, M. K.,Vallis, Y., Owen, D. J., Gibson, A., Hopkins,C. R., Evans, P. R. and McMahon, H. T.
(2001) Simultaneous binding of PtdIns(4,5)P2
and clathrin by AP180 in the nucleationof clathrin lattices on membranes. Science,291(5506), 1051–1055.

PROTOCOL 6.26
Golgi membrane tubule formation
William J. Brown, K. Chambers and A. Doody
Introduction
Membrane tubules emanate from a vari-ety of organelles including the Golgi com-plex, endosomes and lysosomes [1]. Thesetubules are generally 60–80 nm in diam-eter, can extend for many microns inlength, and are believed to play a rolein various intracellular membrane traf-ficking pathways. Although recent studiesstrongly suggest a role for a cytoplasmicCa2+-independent phospholipase A2 en-zyme in initiating the formation of Golgiand endosome tubules [2, 3], the exactmolecular mechanisms of tubule formationhave not been elucidated. Progress in thisarea has been advanced by the develop-ment of an in vitro reconstitution systemthat was used to demonstrate that tubula-tion of Golgi membranes was absolutelydependent on cytosolic protein [4, 5]. Thisassay system should allow for the fur-ther characterization and identification ofcytosolic factors that are required fortubules to form. This system should alsoprovide a means to identify molecular dif-ferences between the tubules and the mainbody of the organelles from which theygrow (see Figure 6.20).
Reagents
Carbon- and formvar-coated electron mi-croscope grids (300 mesh copper)
Extract of bovine brain cytosol (BBC)and isolated rat liver Golgi complexes,
prepared as described [3]. 1© (See alsoProtocol 4.23)
2% w/v Phosphotungstic acid (PTA), pH7.4 (stored at 4 ◦C)
Stock solutions: 10 mM Hepes, pH 7.4(stored at −20 ◦C), 10 mM ATP (storedat −20 ◦C), 100 mM MgCl2 (stored at−20 ◦C), 25 mM Tris containing 50 mMKCl (pH 7.4)
Equipment
Eppendorf 500 µl microfuge tubes, orsimilar
Self-closing, fine-tipped forceps
Transmission electron microscope
Water bath (37 ◦C)
Procedure1. Thaw out all solutions and reagents
and put on ice. Do not thaw out byrunning under hot water.
2. Pick up formvar/carbon-coated gridswith the self-closing forceps. Hold thegrids on the very edge. Be sure thegrids look uniformly coated. Use apiece of white paper as a background.
3. Place the forceps on the white paperwith coated grid side up. Use a box,e.g. the top of a pipette tip box, tocover the ends of the forceps to keepthe grids from accumulating dust.
4. Place 500 µl microfuge tubes in anappropriate holder.

294 IN VITRO TECHNIQUES
(a) (b)
Figure 6.20 (a) shows an example of a negatively stained Golgi stack that was incubated with BSAas a negative control. These control Golgi stacks generally appear somewhat round, with a few vesiclesand possibly some short tubules. (b) shows a negatively stained Golgi stack that was incubated withBBC to induce tubule formation. Under these conditions, numerous tubules, 60–80 nm in diameterand ranging up to several microns in length, can be seen (arrows). Scale bars = 1 µm
5. Prepare Mg-ATP solution in the pro-portions below and put on ice. Youwill need 1 µl/reaction.
80 µl Tris/KCl stock buffer
10 µl ATP
10 µl MgCl2
6. Prepare the tubulation buffer contain-ing BBC. You will need 20 µl/reaction(sample). When using BBC as a pos-itive control, its final concentrationfollowing dilution at this step shouldbe ∼3 mg/ml. For negative controls,we use bovine serum albumin (BSA)at an equivalent concentration. Forsolutions with a high protein con-centration (e.g. BBC, which is oftenprepared and stored at ∼20 mg/ml),use the following proportions: 85 µl 1Tris/KCl, 1 µl Mg-ATP, 1 µl Hepesbuffer, 13 µl BBC.
7. Add 20 µl of Golgi suspension to eachmicrofuge tube.
8. Add 20 µl of tubulation buffer/BBCsolution to the Golgi tubes. Add thetubulation buffer/BBC solution verycarefully to the Golgi suspension inthree aliquots over ∼15 s. Gently mix.
9. Place tubes in 37 ◦C water bath andincubate for up to 30 min.
10. Take 10 µl of a sample and puddleonto the grid that is being held bya forceps. Cover with the box top.Let the suspension sit on the grid for15 min at room temperature.
11. Carefully add 10 µl of 2% PTA to thegrid three times over 5 s. Do not letthe puddle spill over the edges of thegrid.
12. Blot off fluid from the edge of the gridwith a moist kimwipe.
13. Add 10 µl of PTA to the grid and blotoff fluid as in step 12. Repeat oncemore.
14. Let grids dry and then store until EMobservation.

Protocol 6.26 295
Notes
Preparation of BBC (or cytosolic prepara-tions from other tissues/cells) will take 2days. Preparation of rat liver Golgi com-plexes will take 1 day. The tubulationassay will take approximately 2 h.
1© Cytosolic extracts from other tissuescan also be used. These reagents gen-erally give the best results if freshlyprepared, but they can be stored for sev-eral weeks at −80 ◦C and still give goodresults. However, they degrade withtime, so use them as soon as possible.
References
1. Brown, W. J., Chambers, K. and Doody, A.(2003) Phospholipase A2 (PLA2) enzymes in
membrane trafficking:mediators of membraneshape and function. Traffic, 4, 214–221.
2. De Figueiredo, P., Drecktrah, D., Katzenel-lenbogen, J. A., Strang, M. and Brown, W. J.(1998) Proc. Nat. Acad. Sci. USA, 95,8642–8647.
3. De Figueiredo, P., Doody, A., Polizotto, R. S.,Drecktrah, D., Wood, S., Banta, M., Strang,M. and Brown, W. J. (2001) J. Biol. Chem.,276, 47 361–47 370.
4. Banta, M., Polizotto, R. S., Wood, S. A., deFigueiredo, P. and Brown, W. J. (1995) Bio-chemistry, 34, 13 359–13 366.
5. Polizotto, R. S., de Figueiredo, P. and Brown,W. J. (1999) J. Cell Biochem., 74, 670–683.

PROTOCOL 6.27
Tight junction assembly
C. Yan Cheng and Dolores D. Mruk
Introduction
When mammalian epithelial cells, suchas Sertoli cells, keratinocytes and MDCKcells (Madin Darby canine kidney cells),are cultured in vitro on a suitable sub-stratum (e.g., Matrigel for Sertoli cells)in chemically defined medium (e.g., F12/DMEM, Ham’s F12 Nutrient Mixture/Dulbecco’s Modified Eagle’s medium forSertoli cells) in either culture dishes orbicameral units, they assemble tight junc-tions (TJs) within days (for reviews, seerefs 1–3). As such, this represents a use-ful in vitro system to investigate the biol-ogy and regulation of TJ dynamics (forreviews, see refs 3 and 4). There are sev-eral techniques available in the literatureto monitor the assembly of epithelial cellTJs quantitatively or semi-quantitatively,which include restricted diffusion of [3H]-inulin, [125I]-BSA or FITC-dextran acrossthe cell epithelium and maintenance ofnon-equilibrium of the fluid level betweenthe apical and basal compartments ofthe bicameral unit [5, 6] (see Figure 6.21).While these techniques are helpful to mon-itor TJ assembly, they are either tedious,require the use of radioactive isotopes, orexpensive equipment (such as a cytoflu-orometer to quantify FITC). We presentherein the use of a Millicell Electri-cal Resistance System (ERS) (MilliporeCorp.) to quantify the transepithelial elec-trical resistance (TER) across the cell
epithelium. This equipment is not expen-sive to purchase, the maintenance cost isalso minimal (except for the electrodeswhich need periodic replacement), and yetan investigator can quantitatively assessthe assembly, maintenance and/or regula-tion of TJs with precision and reproducibil-ity. This technique has been tested vigor-ously against the other currently availablemethodologies [5–8], and it was shown tobe the best technique to quantify TJ assem-bly in vitro.
Reagents and cell cultures
All reagents and enzymes used shouldbe standard laboratory reagents preparedwith Milli-Q quality water (such as Pure-Lab PLUS from USFilter). Primary cul-tures of Sertoli cells are obtained from20-day-old rat testes using procedures asearlier described [5, 6, 9] and cultured onMatrigel-coated (Matrigel : F12/DMEM,1 : 7) bicameral units (Millicell-HA0.45 µm-pore size culture plate insertcomposed of mixed esters of cellulosewith 12 mm diameter; cat. no. PIHA 01250, Millipore, Bedford, MA). Each treat-ment group should have at least tripli-cate culture inserts. Matrigel-coated bicam-eral units should be prepared 24 h priorto cell plating and stored in a 35 ◦CCO2 incubator (95% air/5% CO2, v/v)as described to allow the Matrigel tocompletely dry, which is essential to

Protocol 6.27 297
Figure 6.21 This is an electron micrograph that shows two Sertoli cells of an epithelium cultured ona Matrigel-coated bicameral unit (nitrocellulose based) on day 4. Ag/AgCl electrodes (one placed intothe apical and the other into the basal compartment of the bicameral unit) are used to quantify theelectrical resistance (in ohms) when an electrical current, ∼20 mA, is sent across the cell epithelium.Also note the non-equilibrium of the level of F12/DMEM between the two compartments when TJsare formed between cells. SC, Sertoli cell nucleus. This figure is adapted from Lee and Cheng [10]and used with permission from the publisher.
obtain TER readings with minimal intra-experimental variations. Care should alsobe taken to avoid trapping air bubbles inthe Matrigel [6].
Equipment
Ag/AgCl electrodes (cat. no. MERS STX01, Millipore) – electrodes need to be re-placed after ∼12 months of routine usewhen visible loss of Ag/AgCl is detected.The electrodes are EVON chopstick elec-trodes. Each leaflet has an outer and innerelectrode; the outer electrode is a smallsilver pad for passing current through thenitrocellulose membrane of the bicameralunit, whereas the inner electrode is a smallAg/AgCl voltage sensor
CO2 humidified incubator at 35 ◦C
Millipore Millicell ERS system (cat. no.MERS 000 01)
Centrifuge set at room temperature
Shaking water bath with variable tempera-ture control
Standard laboratory microscope and trans-mission electron microscope (TEM)
Procedure for TER measurement
1. Sertoli cells isolated from seminiferoustubules immediately after their isolationare plated immediately on Matrigel-coated bicameral units at 0.75–1 × 10⁶
cells/cm2 and designated time 0. Eachculture insert is placed in a well of a24-well dish with triplicate inserts forthe control and each treatment group.Great care should be taken to avoidtrapping air bubbles between Sertolicells and the nitrocellulose membrane,which have a tendency to form on
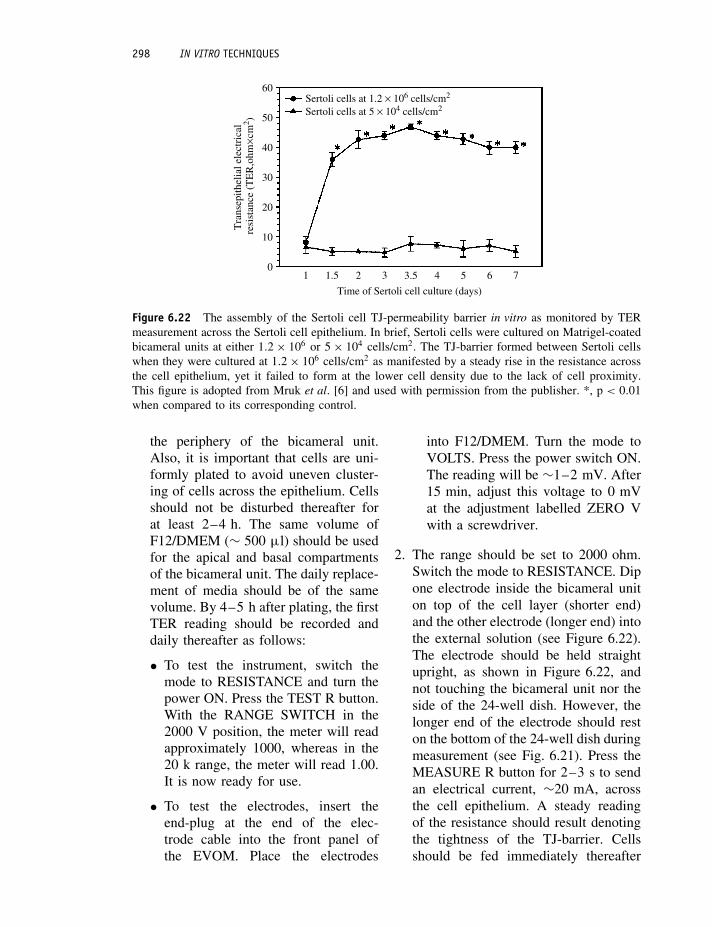
298 IN VITRO TECHNIQUES
1 1.5 2 3 3.5 4 5 6 7
Time of Sertoli cell culture (days)
60
50
40
30
20
10
0
Tra
nsep
ithel
ial e
lect
rica
l r
esis
tanc
e (T
ER
,ohm
×cm
2 )
Sertoli cells at 1.2 × 10⁶ cells/cm2
Sertoli cells at 5 × 10⁴ cells/cm2
Figure 6.22 The assembly of the Sertoli cell TJ-permeability barrier in vitro as monitored by TERmeasurement across the Sertoli cell epithelium. In brief, Sertoli cells were cultured on Matrigel-coatedbicameral units at either 1.2 × 10⁶ or 5 × 10⁴ cells/cm2. The TJ-barrier formed between Sertoli cellswhen they were cultured at 1.2 × 10⁶ cells/cm2 as manifested by a steady rise in the resistance acrossthe cell epithelium, yet it failed to form at the lower cell density due to the lack of cell proximity.This figure is adopted from Mruk et al. [6] and used with permission from the publisher. *, p < 0.01when compared to its corresponding control.
the periphery of the bicameral unit.Also, it is important that cells are uni-formly plated to avoid uneven cluster-ing of cells across the epithelium. Cellsshould not be disturbed thereafter forat least 2–4 h. The same volume ofF12/DMEM (∼ 500 µl) should be usedfor the apical and basal compartmentsof the bicameral unit. The daily replace-ment of media should be of the samevolume. By 4–5 h after plating, the firstTER reading should be recorded anddaily thereafter as follows:
• To test the instrument, switch themode to RESISTANCE and turn thepower ON. Press the TEST R button.With the RANGE SWITCH in the2000 V position, the meter will readapproximately 1000, whereas in the20 k range, the meter will read 1.00.It is now ready for use.
• To test the electrodes, insert theend-plug at the end of the elec-trode cable into the front panel ofthe EVOM. Place the electrodes
into F12/DMEM. Turn the mode toVOLTS. Press the power switch ON.The reading will be ∼1–2 mV. After15 min, adjust this voltage to 0 mVat the adjustment labelled ZERO Vwith a screwdriver.
2. The range should be set to 2000 ohm.Switch the mode to RESISTANCE. Dipone electrode inside the bicameral uniton top of the cell layer (shorter end)and the other electrode (longer end) intothe external solution (see Figure 6.22).The electrode should be held straightupright, as shown in Figure 6.22, andnot touching the bicameral unit nor theside of the 24-well dish. However, thelonger end of the electrode should reston the bottom of the 24-well dish duringmeasurement (see Fig. 6.21). Press theMEASURE R button for 2–3 s to sendan electrical current, ∼20 mA, acrossthe cell epithelium. A steady readingof the resistance should result denotingthe tightness of the TJ-barrier. Cellsshould be fed immediately thereafter

Protocol 6.27 299
and incubated at 35 ◦C in a humidifiedincubator (95% air/5% CO2) until thenext TER reading is taken.
• Do not rinse the electrodes betweenrecordings until readings within thetriplicate set of a treatment groupare completed. The electrodes canthen be dipped into empty wells withF12/DMEM alone to remove treat-ment reagents by limiting dilutions.
• Caution must be exercised to ensurethat the cell layer is not touched withthe electrodes when taking measure-ments.
• If the depth at which the electrodesare immersed into the external andinternal media varies between differ-ent bicameral units, slight differencesin your measurements will result.
• Dishes containing bicameral unitsmust adjust to room temperature forbest measurements (∼20 min).
• To sterilize the electrodes, soak themin 70% alcohol (v/v with Milli Qwater). Electrodes must then be equi-librated in F12/DMEM for at least2 h before use.
• The investigator must ensure thatbicameral units do not tilt to theside of the 24-well dish but insteadsit centred in the 24-well dish whenTER measurements are taken.
• A total of four readings should betaken per bicameral unit at 12-,3-,6- and 9-o’clock positions and aver-aged.
• Data will be obtained and analysedas follows:–Measure background (bicameralunit + media without cells)
–Measure unknown (bicameralunit + media + cells)–RESISTANCE × SURFACEAREA = ohm × cm2
3. TER readings must be taken on a dailybasis. If a reagent is being tested tomonitor its effects on TJ assembly, itshould be removed once an effect isidentified to examine if the perturbedTJ-barrier can be resealed to confirmthe specificity. Figure 6.22 shows thetypical result from an experiment toassess the assembly of Sertoli cell TJ-permeability barrier in vitro. It is notedthat the TJ-barrier assembles by 3–4days when the TER reaches a plateaulevel.
References
1. Gumbiner, B. and Simons, K. (1986) J. CellBiol., 102, 457–468.
2. Grima, J., Wong, C. S. C., Zhu, L. J., Zong,S. D. and Cheng, C. Y. (1998) J. Biol.Chem., 273, 21 040–21 053.
3. Cheng, C. Y. and Mruk, D. D. (2002) Phys-iol. Rev., 82, 825–874.
4. Lui, W. Y., Mruk, D. D., Lee, W. M. andCheng, C. Y. (2003) Biol. Reprod., 68, 1087–1097.
5. Grima, J., Pineau, C., Bardin, C. W. andCheng, C. Y. (1992) Mol. Cell. Endocrinol.,89, 127–140.
6. Mruk, D. D., Siu, M. K. Y., Conway, A. M.,Lee, N. P. Y., Lau, A. S. N. and Cheng,C. Y. (2003) J. Androl., 24, 510–523.
7. Lui, W. Y., Lee, W. M. and Cheng, C. Y.(2001) Endocrinology, 142, 1865–1877.
8. Chung, N. P. Y. and Cheng, C. Y. (2001)Endocrinology, 142, 1878–1888.
9. Cheng, C. Y., Mather, J. P., Byer, A. L. andBardin, C. W. (1986) Endocrinology 118,480–488.
10. Lee, N. P. Y. and Cheng, C. Y. (2003)Endocrinology, 144, 3114–3129.

PROTOCOL 6.28
Reconstitution of the major light-harvestingchlorophyll a/b complex into liposomes
Chunhong Yang, Helmut Kirchhoff, Winfried Haase, StephanieBoggasch and Harald Paulsen
IntroductionThe major light-harvesting chlorophyll(Chl) a/b protein complex of photosystemII (LHCIIb) is the most abundant mem-brane protein which comprises more than50% of the total Chl in plants [1]. It is alsoa very important protein in the biosphere,because LHCIIb has a key function in theconversion of solar energy to biochemi-cal energy in plants. The main functionof LHCIIb is to absorb the solar energyand to transfer excited electronic energy tothe reaction centre of photosystem (PS) IIunder moderate illumination, and to adjustenergy transfer between PS II and PS Iunder strong illumination [2]. LHCIIb canbe assembled in vitro from its recombinantapoprotein and purified pigments in deter-gent solution [3, 4].
This protocol presents methods for recon-stituting either native (Procedure A) or re-combinant LHCIIb (Procedure B) into arti-ficial liposomes made of thylakoid lipids.
ReagentsBio-Beads SM-2 Adsorbent (Bio-RAD)
Chloroform
Ficoll (Amersham Biosciences) in Rb,10%, 20%, 30%, 40%
Lipids (synthetic or isolated from plantthylakoids): phosphatidylglycerol (PG),
digalactosyl diacylglycerol (DGDG),monogalactosyl diacylglycerol (MGDG),sulfolipid (SL)
Liquid nitrogen
Reconstitution buffer for Procedure A(Rb): 10 mM Tricine pH 7.8 (KOH)
2× Reconstitution buffer for ProcedureB (Rb2): 20 mM Tris HCl (pH 7.5),20 mM NaCl, 20 mM β-Mecaptoethanol
Triton X-100
Equipment
Extruder (LiposoFast, Avestin)
Polycarbonate membranes (pore diameter:100 nm)
Rotary evaporator
Sonicator set up with a micro-tip, and abath sonicator
Ultracentrifuge
UV-Vis spectrophotometer
Procedure A
1. Mix 300 nmol lipids dissolved inchloroform in a glass tube with a glassstopper (47 mol% MGDG; 27 mol%DGDG; 39 mol% SL; 14 mol% PG,stoichiometries for grana thylakoids,see ref. 5)

Protocol 6.28 301
2. Evaporate the chloroform phase care-fully under an N2 stream and then in arotary evaporator at 40 ◦C for 45 min(lipids form a thin film on the glasswall).
3. For the following steps the air in theglass tube is removed by N2. Add1.35 ml Rb saturated with N2.
4. Sonicate the suspension three timesfor 10 s in an ice bath at low soni-cation power (the suspension becomesopalescent).
5. Add 0.15 ml 5 mM Triton X-100under constant slow stirring. Incubatefor 10 min under slow constant stir-ring.
6. Add 5 µl LHCIIb preparation (about2 mM Chl in 0.37% (w/v) Triton X-100). See Figure 6.25 for differentresults depending on the amount ofLHCIIb added. Incubate for 20 minunder slow constant stirring. Takea UV spectrum (200–350 nm) ofthe undiluted solution and put thisaliquot back in the reconstitutionbatch. (LHCIIb is isolated accordingto ref. 6 with modifications given inref. 7.)
7. Add 8 mg Bio-Beads and incubateunder constant stirring overnight at4 ◦C. Take a spectrum as in step 6.
8. Remove the solution from Bio-Beadswith a pipette and put it in a freshglass tube. Add 16 mg Bio-Beads andincubate for 1 h at room temperature(RT). Take a spectrum as in step 6.
9. Repeat step 8. Quantity of removedTriton X-100 is calculated from thedifference spectra steps 7–9 minusstep 6, according to the followingequation:
[Triton X-100] = (OD275 − OD300)
∗ 1.46 [mM]
OD275: maximum absorption of TritonX-100, A275 at 1 cm pathlength;OD300: non-specific absorption, A300
at 1 cm pathlength.
10. Freeze (in liquid nitrogen) and thaw atRT twice.
11. Put the sample on a Ficoll step gra-dient (10, 20, 30, 40%) and ultracen-trifuge at 100 000g for 18 h.
12. Collect the green 30% Ficoll step bandin an Eppendorf cup and fill up the cupwith Rb. Centrifuge at about 20 000g
for 10 min at 7 ◦C (removal of Ficoll).
13. Suspend the pellet in 1.2 ml Rb andcentrifuge again. Suspend the pelletin a small volume of Rb (LHCIIb-liposomes).
14. Characterization: lipid analysis by 2Dthin layer chromatography [8], absorp-tion spectra, 77 K fluorescence spectraand electron microscopy.
Procedure B1. Prepare 100 µg recombinant LHCIIb
trimer complex according to refs 3and 4.
2. Mix 1 mg lipids in chloroform at astoichiometry similar to that of naturalthylakoid lipids (without MGDG, PG:21.4%; DGDG 61.9%; SL 16.7%) ina glass tube.
3. Evaporate the chloroform phase in arotary evaporator at 40 ◦C so that athin lipid film is formed on the innerglass wall.
4. Add 100 µl Rb2 and 50 µl bidestwater, incubate at RT for 30 min.
5. Vortex the mixture vigorously until ahomogenous suspension is formed.
6. Sonicate the lipid suspension for 30 swith 5 s interval between every 10 s(the solution becomes opalescent).

302 IN VITRO TECHNIQUES
5
0
−5
−10
−14400 500 600 720
Wavelength (nm)
CD
(m
deg)
Figure 6.23 Circular dichroic absorption spectra of LHCIIb proteoliposomes and LHCIIb in 0.05%(w/v) Triton X-100 solution. (solid line: LHCIIb trimer in Triton X-100 solution; dashed line: recon-stituted LHCIIb trimer in proteoliposome)
6000
2 000 000
4 000 000
6 000 000
8 000 000
10 000 000
12 000 000
14 000 000
16 0000 00
650 700 750
Fluo
resc
ence
Wavelength (nm)
Figure 6.24 77 K Fluorescence emission spectra of LHCIIb proteoliposomes and LHCIIb complexesin 0.05% (w/v) Triton-X 100 solution upon excitation of Chl b at 470 nm. (solid line: LHCIIb trimerin Triton X-100 solution; dashed line: reconstituted LHCIIb trimer in proteoliposome)
7. Freeze (in liquid nitrogen) and thaw(at 25 ◦C) the solution twice.
8. Force the lipid solution through apolycarbonate membrane (pore diam-eter 100 nm) for about 20 times byusing an extruder (LiposoFast).
9. Add Triton X-100 solution so that theend concentration of Triton X-100 is1.5 mM, and add distilled water to200 µl.
10. Add 100 µg LHCIIb trimer complexin maximum 100 µL 0.05% (w/v)

Protocol 6.28 303
2.0
1.5
1.0
0.5
0.0
F700
/F68
1
0 50 100 150
mol lipid / mol chlorophyll
2
1
0
Fluo
resc
ence
nor
mal
ized
650 700 750 800
Wavelength (nm)
3)
3)
2)
2)
1)
1)F681
F700
Figure 6.25 77 K fluorescence emission spectra (excitation: 480 nm) of native LHCIIb liposomes andelectron microscopic pictures of freeze-fractured LHCIIb liposomes. The emission ratio F700/F681 isa measure of the LHCIIb aggregation level. If the molar lipid : Chl ratio for the reconstitution is lowerthan about 40, LHCIIb begins to aggregate (increase in F700/F681). The aggregated samples show ahexagonal arrangement of the proteins (see left-hand EM picture). This is clear evidence for a randomprotein orientation within the liposomes [3]. At high lipid : Chl ratios the protein is diluted enough sothat no aggregation occurs (right-hand EM picture)
Triton X-100 to the liposome solutiondropwise under sonication in a bathsonicator.
11. Vortex the mixture for 1 min, incubateat RT for 30 min.
12. Add 10 mg Bio-Beads, incubate at RTfor 1 h.
13. Centrifuge shortly, collect the super-natant.
14. Add 10 mg new Bio-Beads to thesupernatant and incubate at 4 ◦C over-night.
15. Repeat step 13 and add 20 mg newBio-Beads to supernatant, incubate atRT for 1 h.
16. Repeat step 15.
17. Centrifuge the tube shortly and collectsupernatant.
304 IN VITRO TECHNIQUES
18. Analyse the proteoliposomes by spec-troscopy.
Results
1. Circular dichoism (CD) in the visiblerange shows that the pigment organiza-tion is very similar in LHCIIb proteoli-posomes as it is in detergent solubilizedLHCIIb (Figure 6.23).
2. Low-temperature fluorescence spectros-copy can be used to check whether anLHCIIb preparation is intact and func-tional, i.e. whether Chl b quantitativelytransfers its excitation energy to Chla. Low-temperature fluorescence uponexcitation of Chl b at 470 nm showsthat most fluorescence is emitted by Chla (680 nm) and only very little by Chlb (660 nm) (Figure 6.24), demonstrat-ing that only very little Chl b has beendisconnected from Chl a.
3. 77 K fluorescence emission spectra ofnative LHCIIb liposomes and electronmicroscopic pictures of freeze fracturedLHCIIb liposomes show that LHCIIb
complexes begin to aggregate when thereconstitution has been done at a lowlipids : Chl ratio (see Figure 6.25).
Note
The whole procedure will take ∼2 days.
References
1. Kuhlbrandt, W., Wang, D. N. and Fujiyoshi,Y. (1994) Nature, 367, 614–621.
2. Allen, J. F. (1994) Physiol. Plant., 92,196–205.
3. Hobe, S., Prytulla, S., Kuhlbrandt W. andPaulsen H. (1994) EMBO J., 13, 3423–3429.
4. Rogl, H., Kosemund, K., Kuhlbrandt, W. andCollinson, I. (1998) FEBS Lett., 432, 21–26.
5. Kuhlbrandt, W., Thaler, T. and Wehrli, E.(1983) J. Cell Biol., 96, 1414–1424.
6. Burke, J. J., Ditto, C. L. and Arntzen, C. J.(1978) Arch. Biochem. Biophys., 187,252–263.
7. Duchene, S. and Siegenthaler P. A. (2000)Lipids, 35, 739–744.
8. Christie W. W. and Dobson G. (1999) LipidTechnology, 11, pp. 64–66.
PROTOCOL 6.29
Reconstitution of photosystem 2 intoliposomes
Julie Benesova, Sven-T. Liffers and Matthias Rogner
A. Preparation of liposomes
Reagents
Buffer (20 mM MES, pH 6.5; 10 mMMgCl2; 10 mM CaCl2)
Chloroform
Phosphatidylcholine in chloroform(25 mg/ml)
Phosphatic acid in chloroform (5 mg/ml) [1]
Equipment
Cryostat
Glass container with round bottom (50 ml)
Polycarbonate filter (Ø 10 mm, pore diam-eter 0.2 µm)
Rotavapor-R
Ultrasonication apparatus, with sonicationtip
Waterbath (7 l)
Procedure
1. Cool Rotavapor-R down to 4 ◦C.
2. Mix the lipid stock solutions in theglass with the round bottom.
3. Rotate for 120 rpm at 40 ◦C, 30 min,vacuum at −600 mbar.
4. Rotate for 120 rpm at 40 ◦C, 1 h, vac-uum at −1200 mbar.
5. Resuspend the obtained lipid layercarefully in 3 ml ether and 1 mlbuffer.
6. Use the ultrasonic tip to make the sus-pension homogeneous.
7. Rotate for 120 rpm at 27.4 ◦C, vacuumat −225 mbar until the film is com-pletely detached from the glass wall.
8. Add 2 ml of the buffer.
9. Rotate for 120 rpm at 27.4 ◦C, vacuumat −1200 mbar to remove ether com-pletely.
10. Filter the liposome solution after about90 min through the polycarbonate fil-ter.
B. Reconstitution of photosystem 2[1–3]
Introduction
The importance of this photosyntheticmembrane protein complex is based onits role as a light-driven water-splittingnano machine. It is the first componentof the photosynthetic electron transportchain and transfers the electrons extractedfrom water to plastoquinone. The sizeof the membrane-integral part of thiscomplex is in the case of dimers (about500 kDa) 190 × 100 × 40 A. Beyond this

306 IN VITRO TECHNIQUES
membrane-embedded part, the donor sideof this complex extends up to 55 Aout of the membrane into the lumenand the acceptor side up to 10 Ainto the stromal region [2]. The lumen-exposed part performs the water-splittingprocess while the membrane-embeddedpart harbours the components of theelectron transport chain leading to light-driven charge separation.
Reconstitution of the PS2 complexinto liposomes facilitates various studiesof structure/function relationships of PS2including its assembly, parameters for itsorientation in the membrane, the processof reversible mono-/dimerization and theimpact of the lipid composition on itsfunction.
Reagents
1 M Octylglucopyranosid (OGP): 146 mg/0.5 ml buffer (= 30%)
Buffer (20 mM MES, pH 6,5; 30 mM CaCl2;10 mM MgCl2; 1 M glycin-Betain
Liposome suspension (see above)
110–190 µg Chl PS2 (depending on act-ivity of PS2)
Equipment
Biobeads (BioRad)
Cryostat
Water cooling by self-made glass cooler
Pretreatment of biobeads
• Stir 20–30 g Biobeads in 150–200 mlmethanol for 1 h at RT in a beaker.
• Remove the supernatant by Pasteurpipette (connected to aspirator), aftershort centrifugation.
• Add 200 ml water and stir for 1 h.
• Remove water as above.
• Add again 200 ml water and stir for30 min.
• Keep in 30–50 ml in the fridge (stablefor several weeks!).
Procedure
1. Mix 110–190 µg Chl PS2 (dependenton activity, see above) and 180 µl lipo-some suspension; add buffer to a finalvolume of 900 µl.
2. Add 1 M OGP stock solution in smallparts under mild stirring until the milkysuspension is clear (start with 66 µl1 M OGP = 2% OGP final conc.; if stillcloudy, add in steps of 0.5%)
3. Add buffer up to a final volume of 1 mland stir slowly in the dark at 20 ◦C.
4. Add 80 mg Biobeads and incubate for1 h; repeat this step.
5. Add 160 mg Biobeads and incubateagain for 1 h with slow stirring (seeabove).
References
1. Rigaud, J.-L., Pitard, B. and Levly, D. (1995)Reconstitution of membrane proteins into lipo-somes: application to energy-transducing mem-brane proteins. Biochim. Biophys. Acta, 1231,223–246.
2. Zouni, A., Witt, H. T., Kern, J., Fromme, P.,Krauss, N., Saenger, W. and Orth, P. (2001)Crystal structure of photosystem 2 from Syne-choccus elongatus at 3.8 A resolution. Nature,409, 739–743.
3. Kruip, J., Karapetyan, N. V., Terekhovas, I. V.and Rogner, M. (1999) In vitro oligomerizationof a membrane protein complex: liposome-based reconstitution of trimeric photosystem Ifrom isolated monomers. J. Biol. Chem., 274,18 181–18 188.

PROTOCOL 6.30
Golgi–vimentin interaction in vitro and in vivo
Ya-sheng Gao and Elizabeth Sztul
Introduction
Intermediate filaments constitute one of thethree major cytoskeletal systems of eukary-otic cells. Intermediate filaments, espe-cially those in epithelial cells, play a keyrole in maintaining the physical integrityof cells [1]. In cells of mesenchymal ori-gin and in cultured cells, the intermediatecytoskeleton is predominantly composedof vimentin. The dynamics of the vimentincytoskeleton appear to be regulated by var-ious cellular proteins, including proteinsassociated with the Golgi complex [2].To study the interactions of vimentinwith the Golgi complex, biochemical andlight microscopy based approaches aremost direct and easiest to follow. Impor-tantly, biochemical approaches allow test-ing of compounds that might regulate thevimentin–Golgi interaction by removingor introducing such compounds into theassay. Light microscopy approaches allowthe examination of the vimentin–Golgiinteractions within the architectural contextof the cell.
1. Biochemical assay for vimentinbinding to purified Golgimembranes
Reagents
BSA (10 mg/ml in PBS)
ECL kit (PIERCE Chemical Co. or othervendors)
HKM buffer (25 mM Hepes, 0.115 Mpotassium acetate, 2.5 mM magnesiumchloride, pH 7.4)
HRP conjugated secondary antibodies(Amersham Pharmacia Biotechnologiesor other vendors)
Isolated stacked Golgi membranes [3] puri-fied through additional up-flotation (pro-tocol below)
Mouse anti-GM130 (Transduction Labora-tories) and goat anti-vimentin (ICN Bio-medicals) antibodies
Nycodenz solution (60% in HKM) fromLife Technologies
Protein Assay Kit (from Bio-Rad Labora-tories)
Purified vimentin (unpolymerized) fromcytoskeleton, Inc. or produced asdescribed in ref. 2
Sucrose solution (2 M, in HKM buffer)
Equipment
Densitometer
Eppendorf tubes
Equipment for SDS-PAGE (minigel) andimmunoblotting
Nitrocellulose membrane (Micron Separa-tions Inc. or other vendors)
Pipettes

308 IN VITRO TECHNIQUES
Preparative ultracentrifuge equipped withSW55 Ti and SW41 Ti rotors (BeckmanCoulter) or equivalents
Spectrophotometer
Ultra-Clear centrifugation tubes compat-ible with the above rotors (BeckmanCoulter or equivalent)
Vortex mixer
X-ray film and X-ray developing machine
Procedure 1
Part 1: Purification of Golgi membranes
Golgi membrane fractions isolated bydensity-gradient centrifugation are likelyto be contaminated by cytosolic proteins(such as vimentin subunits, vimentinor Golgi interacting proteins) that mayinterfere with the experiment. Therefore,isolated Golgi membranes need to beseparated from the soluble contaminants byup-flotation in Nycodenz gradient.
1. Isolate stacked Golgi membranes fromrat liver ([3]; see also Protocol 4.26).
2. Make 60% (w/v) Nycodenz in HKMand prechill at 4 ◦C.
3. Mix stacked Golgi membranes withprechilled 60% Nycodenz solution tomake 40% Nycodenz final concentra-tion (total volume should be less than3 ml).
4. Load the Golgi mixture at the bottomof a 5 ml Ultra-Clear centrifugationtube.
5. Overlay the Golgi mixture with 1 mlof prechilled 36% and 1 ml of 32%Nycodenz-HKM.
6. Centrifuge at 135 000g for 7 h at 4 ◦Cin a swinging bucket rotor.
7. Fractionate from top of the gradient bypipetting 0.5 ml samples.
8. Take a portion of each fraction, pro-cess for SDS-PAGE, and transfer thegel to nitrocellulose filter.
9. Immunoblot the nitrocellulose filterwith antibodies against the Golgimarker protein GM130.
10. Pool GM130 containing fractions –this represents purified Golgi mem-branes.
11. Quantify protein concentration in theGolgi preparation using Protein AssayKit with BSA as standard.
12. Use the membrane preparation freshly,or freeze in liquid nitrogen and storeat −80 ◦C.
Part 2: Association of vimentin withpurified Golgi membranes
1. Commercially obtained vimentin shouldbe made up in 10 mM Tris-HCl (pH 7.4)and 0.1% β-mercaptoethanol. For long-term storage, freeze at −80 ◦C [2, 3].
2. Adjust protein concentration of theGolgi membranes to about 0.25 mg/mlwith cold HKM buffer before use.
3. Adjust the concentration of vimentin toabout 2 mg/ml with 10 mM Tris-HCl,pH 7.4 and 0.1% β-mercaptoethanol.
4. Add 0.05–0.075 mg Golgi and 0.01 mgvimentin to an Eppendorf tube on ice,mix briefly.
5. Let the tube sit on ice for 3 h with inter-mittent mixing.
Part 3: Separation of membrane-boundfrom non-bound vimentin
1. Add sufficient cold 2 M sucrose to thevimentin–Golgi membrane mixture tomake 1.6 M sucrose and load the solu-tion (less than 3 ml) at the bottom of a5 ml Ultra Clear centrifugation tube.

Protocol 6.30 309
2. Overlay with 1 ml prechilled 1.3 M and1 ml of 0.8 M sucrose made in HKM.
3. Centrifuge at 135 000g for 7 h at 4 ◦Cin a swinging bucket rotor.
4. Fractionate from top of the gradient bypipetting 0.5 ml samples.
5. Take a portion of each fraction, processfor SDS-PAGE, and transfer the gel tonitrocellulose filter.
6. Immunoblot the nitrocellulose filter withantibodies against the Golgi marker pro-tein GM130 and against vimentin (frac-tions that contain Golgi with associatedvimentin will be in the middle of the gra-dient).
7. Quantify the amount of vimentinrecovered with Golgi membranes bydensitometry. A proporition of vimentinwill fractionate with Golgi membranes(Figure 6.26).
Notes
1. This procedure can be applied to testwhether a protein (or another com-pound) regulates the vimentin–Golgimembrane interaction [4]. The modi-fied procedure to test whether a proteinbinds to Golgi membranes to pro-mote/inhibit the vimentin–Golgi mem-brane interaction is listed below.
(1) Add the protein (purified or com-mercially available) to isolatedstacked Golgi membranes andincubate at 4 ◦C for 2 h.
(2) Add cold 2 M sucrose (in HKMbuffer) to the mixture to make1.6 M sucrose and load (less than3 ml) at the bottom of a 5 mlcentrifugation tube.
(3) Overlay the sample with 1 mlice-cold 1.3 M and 1 ml 0.8 Msucrose in HKM.
(4) Centrifuge at 135 000g for 7 h at4 ◦C in a swinging bucket rotor.
(5) Fractionate from top of the gradi-ent by pipetting 0.5 ml samples.
(6) Take a portion of each fraction,process for SDS-PAGE, and trans-fer the gel to nitrocellulose filter.
(7) Immunoblot the nitrocellulose fil-ter with antibodies against theGolgi marker protein GM130.
(8) Pool GM130 containing frac-tions – this represents purifiedGolgi membranes to which thetested protein has bound.
(9) Quantify protein concentration inGolgi preparation using ProteinAssay Kit (Bio-Rad Laboratories)with BSA as standard.
(10) Use the membrane preparationfor vimentin interaction assay asdescribed above.
2. When incubating vimentin with themembranes, it is desirable to keepthe concentration of vimentin below0.05 µg/ml to maintain vimentin inits subunit form. Polymerized vimentinis likely to aggregate with mem-branes. This makes separation ofmembrane-bound vimentin from non-bound vimentin difficult.
3. To keep vimentin in its subunit form,vimentin stock solution should not con-tain more than 5 mM salt.
Procedure 2: Immunofluorescence analysisof vimentin–Golgi interaction
In cells, vimentin intermediate filaments,microtubules and actin filaments are linkedtogether by cross-linking proteins [5].Conventional immunofluorescence proce-dures cannot dissect the role of vimentinintermediate filaments in Golgi binding

310 IN VITRO TECHNIQUES
(a) Vimentin Only
Vimentin + Golgi
−Vimentin
−Vimentin
−Vimentin
−GM130
1 2 3 4 5 8 11
loading
1 2 3 4 5 6 7
loading
(b)
(Fractions)
−GM130
(Fractions)
Figure 6.26 Binding of vimentin to Golgimembranes in vitro. (a) Recombinant vimentinalone, or recombinant vimentin incubated withpurified Golgi membranes were loaded at the bot-tom of a sucrose density gradient and subjectedto equilibrium centrifugation. Fractions were col-lected from the top of the gradient. An equiva-lent amount of each fraction was processed bySDS-PAGE, transferred to NC and immunoblot-ted with anti-vimentin and anti-GM130 antibod-ies. Vimentin remains in the load when centri-fuged alone, but is recovered in a lower densityfraction containing the Golgi marker GM130when incubated with Golgi elements. (b) Frac-tions 3 and 4 from panel A were combined, loadedat the bottom of a sucrose density gradient andsubjected to another round of equilibrium cen-trifugation. Fractions were collected and analysedas in (a). Vimentin remains associated with Golgimembranes. Reproduced from The Journal of CellBiology, 2001, 152(5), 877–893, by copyrightpermission of the Rockefeller University Press.
from the function of microtubules thatinteract with the Golgi at the micro-tubule organizing centre. To dissociatethe roles of microtubules and vimentinfilaments, we describe a procedure thatdisrupts the microtubular cytoskeleton incells, allowing the visualization of bonafide vimentin–Golgi interactions [2].
Reagents
Antibodies against vimentin (ICN Biomedi-cals) and GM130 (Transduction laborato-ries) or antibodies against another Golgimarker protein
Blocking solution (3% normal goat serumin PBS-T) and anti-fade mounting solu-tion (9 : 1 glycerol/PBS with 0.1% q-phenylenediamine)
Fluorophore conjugated secondary antibod-ies (Molecular Probes)
Methanol, prechilled at −20 ◦C
PBS-T (PBS, 0.05% Tween-20)
Phosphate-buffered saline (PBS)
Nocodazole (10 mg/ml in DMSO) (Sigma-Aldrich)
Round glass coverslips, 12 mm (Fisher Sci-entific)
Equipment
Cell culture facility
Fluorescence imaging system
Image processing software (Photoshop orequivalent)
Procedure
Plate cells (any mammalian cell line) onglass coverslips and culture at 37 ◦C till∼70% confluent.
1. Make nocodazole 1© at 10 µg/ml inculture medium from 10 mg/ml DMSOstock solution and replace normalmedium with nocodazole medium.Incubate cells at 37 ◦C for 5 h.
2. Rinse cells with PBS and immedi-ately transfer coverslips into −20 ◦Cprechilled methanol for 15 min. 2©
3. Move coverslips to a humid box andwash cells with PBS-T (at room temper-ature) for 5 min (three times in total).

Protocol 6.30 311
+ Nocodazole(a) (b)
Figure 6.27 Golgi elements and vimentin filaments interact in vivo. MFT-6 cells were untreated(a) or treated with 10 µg/ml nocodazole for 5 h at 37 ◦C to disrupt microtubules (b). Cells werethen labelled with polyclonal anti-GM130 and monoclonal anti-vimentin antibodies. Extended Golgielements align with vimentin filaments in untreated cells (arrowheads in (a)). In cells with disruptedmicrotubules, Golgi elements associate with vimentin filaments (arrowheads in B). Arrow points toa mass of collapsed vimentin. Reproduced from The Journal of Cell Biology, 2001, 152(5), 877–893, by copyright permission of the Rockefeller University Press.

312 IN VITRO TECHNIQUES
4. Follow immunofluorescence procedureas described (check procedure part 1/1,Protocol 6.26). 3©
Notes
1© Nocodazole (or similar reagents) dis-rupt microtubules, resulting in thecollapse of the majority of vimentin fil-aments to a peri-nuclear region. How-ever, a fraction of peripheral vimentinfilaments remains. Immunofluoresc-ence with antibodies against Golgiproteins allows the visualization of indi-vidual Golgi fragments aligned on thevimentin filaments (Figure 6.27).
2© Alternative fixatives (3% formalde-hyde) and permeabilization reagents(0.07% Triton X-100 in PBS) can beused.
3© Individual filaments (or filament bun-dles) have weak fluorescence, and
anti-vimentin antibodies must be usedat high concentrations. In addition,images may need to be enhanced withsoftware to desired brightness [6].
References
1. Fuchs, E. and Weber, K. (1994) Ann. Rev. Bio-chem., 63, 345–382.
2. Gao, Y.-S. and Sztul, E. (2001) J. Cell Biol.,152, 877–893.
3. Taylor, R. S., Jones, S. M., Dahl, R. H., Nor-deen, M. H. and Howell, K. E. (1997) Mol. Biol.Cell, 8, 1911–1931.
4. Gao, Y.-S., Vrielink, A., MacKenzie, R. andSztul, E. (2002) Euro. J. Cell Biol., 81,391–401.
5. Gurland, G. and Gundersen, G. G. (1995) J.Cell Biol., 131, 1275–1290.
6. Franke, W. W., Grund, C., Kuhn, C., Jackson,B. W. and Illmensee, K. (1982) Differentiation,23, 43–59.

PROTOCOL 6.31
Microtubule peroxisome interaction
Meinolf Thiemann and H. Dariush Fahimi
Introduction
The microtubular system plays a vital rolefor the distribution, translocation anddetermination of the shape of cell orga-nelles. Peroxisomes are ubiquitous membr-ane-bounded organelles with essentialfunctions in lipid metabolism and detox-ification of reactive oxygen species. Theirassociation to microtubules has beenshown and the motor-dependent transportof peroxisomes along microtubules demon-strated [1–4]. The molecular mechanismsof these binding and motility events, how-ever, are far from being understood. Hencewe have developed a semi-quantitativeIn vitro peroxisome–microtubule bindingassay for investigating the physicochemi-cal characteristics of this binding processand to screen for the proteins involved [5].
The peroxisome–microtubule bindingassay presented here could also beadapted to investigate the interaction ofother membrane-bounded organelles withmicrotubules and to identify the proteinsmediating it.
Reagents
MAP-free tubulin from bovine brain (Tebu,Frankfurt/Main, Germany)
Taxol (= paclitaxel) was obtained fromSigma (Taufkirchen, Germany)
(All chemicals should be of analyticalgrade and be prepared with high qualitydeionized water)
Equipment
Microcentrifuge
Shaker
Standard equipment for SDS-PAGE, West-ern blotting and enhanced chemilumi-nescence
Scanner and software for densitometricquantitation of immunoreactive proteinbands
Water bath
96-Well microtiterplates (flat bottom mi-crotiterplates with high binding capac-ity from Costar, Cambridge, MA, USA,proved to be well suited for the attach-ment of microtubules)
Procedure
The protocol of the microtubule–per-oxisome binding assay is summarized inFigure 6.28.
1. Polymerize microtubules by incubat-ing glycerol stabilized MAP-free tubu-lin in P/G/T-buffer (35 mM Pipes,5 mM MgSO4, 1 mM EGTA, 0.5 mMEDTA, 1 mM DTT, 1 mM GTP,20 µM taxol, pH 7.4) at 37 ◦C for15 min.
2. Perform the binding assay (Figure 6.28)at a constant temperature of 25 ◦C in 96-well microtiterplates.
3. Coat wells with microtubules by in-cubating 50 µl of the microtubule

314 IN VITRO TECHNIQUES
Binding of peroxisomes to microtubulesimmobilized to a microtiterplate
Detection and quantitationof peroxisomes bound to microtubules
coat wells with microtubule solution
block with casein solution
1 × washing with buffer
3 × washing with buffer
incubation with purified peroxisome solution
elution of bound proteins with SDS-sample buffer
SDS-PAGE
Western blotting
peroxisome specific primary antibody
secondary antibody (HRP-labelled)
detection of binding by ECL
quantitation by densitometry
Microtubule–peroxisomebinding assay
Figure 6.28 Schematic summary of the proto-col of the microtubule–peroxisome binding assaywhich is carried out in microtiter plates. The bind-ing of peroxisomes to microtubules is quantitatedby the detection of a peroxisomal marker proteinin rat liver (e.g. urate oxidase) by Western blotting
solution per well (final concentration0.25 mg protein/ml) for 45 min. Forcontrols take 50 µl P/G/T-buffer perwell.
4. Block non-specific binding to themicrotiterplate surface by 45 minincubation with 0.3 ml/well casein(2.5 mg protein/ml in P/G/T-buffer).
5. Wash once with 0.3 ml/well P/G/T-buffer.
6. Isolate purified peroxisomes by dif-ferential cell fractionation of rat liverhomogenate according to a proto-col described previously [5, 6]. Add40 µl of the peroxisomal preparation1© – adjusted to 0.1 mg protein/ml
with homogenization buffer (250 mMsucrose, 5 mM MOPS, 0.1% ethanol,
1 mM EDTA, 0.2 mM PMSF, 1 mM6-aminocaproic acid, 5 mM benza-midine, 10 µg/ml leupeptin, 0.2 mMDTT, pH 7.4) – to each well and incu-bate for 30 min.
7. Wash three times with 50 µl/well P/G/T-buffer.
8. Elute bound proteins and organelles in20 µl SDS-sample buffer by pipettingfive times up and down.
9. Perform SDS-PAGE with the samplesby using 10% polyacrylamide gels.
10. Transfer proteins from the gel elec-trophoretically to a PVDF-membrane.
11. Perform immunocomplexing by usingan antibody to a specific peroxisomalprotein, e.g. urate oxidase. 2©
12. Detect immunocomplexes with ahorseradish peroxidase-labelled sec-ondary antibody, employing enhancedchemiluminescence.
13. Quantitate the intensity of immunore-active bands by densitometry.
Examples of data
In vitro binding of peroxisomes to micro-tubules can be demonstrated by neg-ative staining electron microscopy [7](Figure 6.29). Purified rat liver perox-isomes specifically associate to taxol-stabilized microtubules reconstituted frombovine brain tubulin. Binding was observedat the entire length of microtubules andonly very few unbound peroxisomes wereseen. Although this morphological assayemploys different experimental condi-tions than the biochemical binding assaydescribed here, both assay formats pointout the specificity of the In vitro bindingof peroxisomes to microtubules. The bio-chemical assay was saturable for both,the concentrations of peroxisomes and

PROTOCOL 6.31 315
(a) (b)
Figure 6.29 In vitro binding of peroxisomes to microtubules as demonstrated by negative stainingelectron microscopy. Peroxisomes (0.1 mg/ml) were incubated with microtubules (0.25 mg/ml) for 1 hin Eppendorf tubes. After fixation of the peroxisome–microtubule complexes with 0.25% glutaralde-hyde for 5 min, a drop of this mixture was placed on a formvar-coated 200-mesh grid for 2 min.Finally, a washing step was followed by the staining of the preparation with 2% phosphotungstic acidfor 3 min. Negative staining electron microscopy (EM) reveals the specificity of the association ofhighly purified rat liver peroxisomes (PO) to taxol-stabilized microtubules from bovine brain (MT).Bars: 0.25 µm (a), 0.05 µm (b)
microtubules (Figure 6.30). The optimalassay conditions comprised a tubulin con-centration of 0.25 mg/ml and a peroxi-some concentration of 0.1 mg/ml. As anexample, an immunoblot incubated withan antibody to urate oxidase and serv-ing for the quantification of peroxisomesto microtubules is shown (Figure 6.30(c)).The binding assay showed excellent repro-ducibility and high specificity and pro-vided a powerful tool for the evaluation ofbinding conditions and the various factorsinvolved.
Employing this assay, the binding of per-oxisomes to microtubules was character-ized and a CLIP-like protein was shown tobe involved in the binding process [5].
Notes
This procedure will take approximately24 h. Store tubulin and peroxisomes at−80 ◦C and avoid repeated thawing andfreezing.
1© It is essential that peroxisomes are notaggregated. To ensure the removal ofperoxisomal aggregates, briefly cen-trifuge the peroxisomal preparation(10 s, 2000g) prior to use in the assay.
2© An antibody to urate oxidase [8] wasshown to be an excellent marker forthe binding of peroxisomes to micro-tubules in this assay. Urate oxidase isexclusively localized to the crystallinecores of rat liver peroxisomes, whichare not released from the organelle bywashing procedures. Furthermore, iso-lated urate oxidase cores do not bindto microtubules.
References
1. Schrader, M., Burkhardt, J. K., Baumgart, E.,Luers, G., Spring, H., Volkl, A. and Fahimi,H. D. (1996) Eur. J. Cell Biol., 69, 24–35.
2. Rapp, S., Saffrich, R., Anton, M., Jackle, W.,Ansorge, W., Gorgas, K. and Just, W. (1996)J. Cell Sci., 109, 837–849.

316 IN VITRO TECHNIQUES
0
20
40
60
80
100
120
0 0.2 0.4 0.6 0.8
Tubulin concentration (mg/ml)
Spec
ific
bin
ding
(%
)
Tubulin Concentration (mg/ml)
0.05 0.1 0.250 0.5 0.75
14
22
31
45
66
97
MW (kDa)
20
40
60
80
100
0 0.1 0.2 0.3 0.4 0.5
Peroxisome concentration (mg/ml)Sp
ecif
ic b
indi
ng (
%)
120
0
(a)
(b)
(c)
Figure 6.30 The binding of peroxisomes to microtubules depends on the concentrations of peroxi-somes and tubulin. The In vitro binding assay was performed and binding was analysed as described.To optimize the protocol of the binding assay, the concentrations of peroxisomes (a) and tubulin (b,c)were varied. (c) As an example, the immunoblot, generated according to the standard protocol of thebinding assay and incubated with an antibody to urate oxidase, is shown. Data are presented as mean± SE from six experiments. Reproduced by permission of the European Journal of Biochemistry [5]
3. Wiemer, E. A. C., Wenzel, T., Deerinck, T. J.,Ellisman, M. H. and Subramani, S. (1997) J.Cell Biol., 136, 71–80.
4. Schrader, M., King, S. J., Stroh, T. A. and Sc-hroer, T. A. (2000) J. Cell Sci., 113, 3663–3671.
5. Thiemann, M., Schrader, M., Volkl, A.,Baumgart, E. and Fahimi, H. D. (2000) Eur.J. Biochem., 267, 6264–6275.
6. Volkl, A., Baumgart, E. and Fahimi, H. D.(1996) In: Subcellular Fractionation – a Prac-tical Approach (J. Graham and D. Rickwood,eds), pp. 143–167. Oxford University Press,Oxford, UK.
7. Schrader, M., Thiemann, M. and Fahimi, H. D.(2003) Micr. Res. Tech., 11, 171–178.
8. Volkl, A., Baumgart, E. and Fahimi, H. D.(1988) J. Histochem. Cytochem., 36, 329–336.
PROTOCOL 6.32
Detection of cytomatrix proteins byimmunogold embedment-free electronmicroscopy
Robert Gniadecki and Barbara Gajkowska
Introduction
The simple view of the cell as the mem-brane sack containing organelles floatingin the amorphous cytoplasm has over thelast 30 years been replaced by a conceptof a complicated three-dimensional cellu-lar structure comprising spatially separatedyet functionally interconnected compart-ments. The basic scaffold of most cellsis afforded by the cytoskeleton (compris-ing actin microfilaments, intermediate fil-aments and the microtubules) that notonly determines rigidity and motility ofthe cells but also provides support forthe organelles.
However, our understanding of cellularstructure is still incomplete. No imagingtechnique is alone able to visualize theintrinsic structure of the cell. Immunoflu-orescence microscopy with labelled anti-bodies against various cytoskeletal com-ponents turned out to be a very powerfultechnique that accounts for much of theprogress that has been made in the under-standing of the three-dimensional cellstructure. However, the major drawbacksare low resolution and the fact that onlyknown proteins, against which the labelledprobes are available, may be investigated.
Electron microscopy seems to be ide-ally suited for studying cell ultrastructure.
However, this technique has three majorlimitations:
1. The optical properties of the resinsused for embedding are similar tothose of proteins, hence most proteina-ceous structures remain unresolved andthe cytoplasm in electron microscopicimages seems to be quite homoge-neous.
2. In classic electron microscopy onlysome filaments are visualized, and onlythose that happen to lie at the surfaceof the section.
3. Aldehyde fixation, which is a necessarystep during the preparation of the mate-rial, cross-links proteins and lead to theemergence of artificial structures.
Some of these limitations may be over-come by the use of the embedment-freeelectron microscopy (EFEM). It this tech-nique the material is temporarily embed-ded in the mounting medium for cutting,but the embedding material is removedbefore observation. Although fixation isstill necessary, no resin is present at themoment of observation in the microscope.The group of S. Penman should be creditedwith the development and popularizationof EFEM [1, 2]. The main use of EFEM

318 IN VITRO TECHNIQUES
has been the study of the nuclear matrix.Penman et al. successfully visualized thenon-chromatin nuclear matrix as a com-plicated three-dimensional network com-prised of 10 nm ‘core’ filaments decoratedwith globular ribonucleoprotein structuresand dense bodies [3]. The outline of theEFEM protocol is as follows:
1. The cells are extracted with non-ionicdetergent that dissolves the membranesand allows the soluble proteins todiffuse away.
2. DNA is removed by digestion withnuclease.
3. The remaining structure (cellular scaf-fold or cytomatrix) is temporarily em-bedded in diethylene glycol distearate(DGD) and sectioned.
4. Before viewing in the electron micro-scope the DGD is removed so that intactscaffolds are observed.
A recent EFEM protocol may be foundin Nickerson et al. [4]. In our labora-tory we have successfully adopted thisprotocol for the study of diverse celltypes such as normal or transformed ker-atinocytes and cancer cell lines (C6, U-373, MG [glioma lines], COLO 205 [col-orectal adenocarcinoma], PA-1 [ovariancancer cells]) [5–8].
The material processed for EFEM mayalso be used for immunostaining withgold-labelled antibodies. This provides anelegant combination of the clarity andresolution of EFEM with the power ofimmunocytochemistry. It is important tounderline that only proteins associated withthe cytomatrix will be identified. Solubleproteins will be lost during the prepara-tion of the scaffolds and remain unde-tected. We have successfully used single-,double- and triple immunostaining in com-bination with EFEM for the study of thecellular distribution of apoptosis-related
proteins bax, bid, vdac-1 and caspase-8 [5, 8].
Reagents
Chemicals
Aminoethylbenzenesulfonyl fluoride (AE-BSF, Pefablok SC, Roche Applied Sci-ence)
Ammonium sulfate (Sigma)
Bovine serum albumin (Sigma)
Diethylene glycol distearate (PolysciencesInc., Warrington, PA)
DNase I, RNase free (Roche AppliedScience)
Donkey serum (Sigma)
EGTA (Sigma)
Ethanol (100%)
Glutaraldehyde, EM grade, 50% stocksolution (Sigma)
HMDS (hexamethyldisilazane) (Sigma)
Hydrochloric acid (HCl, 1 M)
Isobutanol (Sigma)
Magnesium chloride (Sigma)
Osmium tetroxide (Sigma)
Paraformaldehyde (Merck, Hohenbrunn,Germany)
PBS (phosphate-buffered saline, withoutcalcium and magnesium, pH 7.2) (Sigma)
PIPES (Sigma)
Poly-L-lysine (Sigma)
Propylene oxide (Sigma)
Sodium cacodylate trihydrate, ultra pure(Sigma)
Sodium chloride (Sigma)
Sodium hydroxide (NaOH), 1 M solution
Sucrose (Sigma)
Triton X-100 (Sigma)
Tween 20 (Sigma)
Vanadyl riboside complex (VRC) (Fluka)
Water, double distilled

PROTOCOL 6.32 319
Consumables
Carbon-coated copper or nickel grids (canbe coated with poly-L-lysine for increasedadhesiveness)
Embedding capsules BEEM (LKB, USA)
Equipment
Electron microscope (e.g. JEOL 1200 EXat 80 kV)
Ultramicrotome (e.g. LKB Ultracut fromReichert, Germany) equipped with dia-mond knives (glass knives are reportedto work for fine EFEM, but we haveno experience of our own) carbonevaporator
Laboratory tabletop centrifuge with cooling
pH meter
Forceps
Pasteur and automatic pipettes
Scalpel or razor blades
1. Cell extraction
Reagents
Extraction buffer 1: 10 mM PIPES, pH6.8,300 mM sucrose, 100 mM NaCl, 3 mMMgCl2, 1 mM EGTA,0.5% Triton X-100,20 mM vanadyl riboside complex (VRC),1 mM AEBSF
Remarks: PIPES is dissolved first andpH adjusted with NaOH. Then sucrose,NaCl, MgCl2 and EGTA are dissolvedsequentially at room temperature (RT)under constant magnetic stirring. At thisstage the buffer can be sterile-filtratedand stored for a couple of weeks in arefrigerator or frozen at −20 ◦C for up to3 months. Other components (Triton X-100, VRC and AEBSF) are added beforeuse. Triton X-100 is added v/v with a 1 mlsyringe under constant, slow stirring.
Extraction buffer 2: 10 mM PIPES, pH6.8,250 mM ammonium sulfate, 300 mM su-crose, 3 mM MgCl2, 1 mM EGTA, 0.5%Triton X-100, 20 mM VRC, 1 mM AEBSF
Remarks: Prepared as extraction buffer1 above; in this buffer NaCl is replaced byammonium sulfate.
DNA digestion buffer: 10 mM PIPES,pH6.8, 300 mM sucrose, 50 mM NaCl,3 mM MgCl2, 1 mM EGTA, 0.5% TritonX-100, 20 mM vanadyl riboside complex,1 mM AEBSF, 200 units/ml RNase freeDNase I.
Remarks: Prepared as extraction buffer1. DNase I is added before use.
High salt buffer: 10 mM PIPES, pH6.8, 300 mM sucrose, 2 M NaCl, 3 mMMgCl2, 1 mM EGTA, 20 mM VRC, 1 mMAEBSF
Remarks: PIPES, sucrose, MgCl2 andEGTA are added and dissolved in thissequence. pH is adjusted with NaOH. Thenadd NaCl to the buffer and dissolve atroom temperature. VRC and AEBSF areadded before use.
Procedure 1
Adherent cells may be extracted in mono-layers attached to thick glass coverslipsor grown in chamber slides with a glassbottom. Alternatively, the cells may begently trypsinized or scrapped by the rub-ber policeman. Suspended cells are washedby centrifugation at 600 g, 5 min at 4 ◦Cbetween steps. Coverslips with attachedcells are moved between different solu-tions. We got best results with scrappedor trypsinized cells in suspensions. Sincesome loss of material is inevitable due tomultiple centrifugations, start with a largeamount of cells (>5 million). Most stepsshould be performed at 4 ◦C. Precool allthe buffers. After the last extraction stepwe are left with cellular scaffolds ready fortemporary embedding and sectioning.

320 IN VITRO TECHNIQUES
1. Wash the cells with PBS, twice at 4 ◦C.
2. Extract in 2 ml extraction buffer 1 at4 ◦C for 5 min with occasional agita-tion. At this step the membranes areopened by Triton X-100 and solubleproteins diffuse from the cell to theoutside.
3. Extract in 2 ml extraction buffer 2 at4 ◦C for 5 min with occasional agi-tation. Ammonium sulphate in thisbuffer will extract some of the histones(mainly histone 1) and many cytoplas-mic proteins [4].
4. Incubate in the DNA digestion bufferfor 1 h at 32 ◦C. Stir gently once every7–10 min. At this step DNA is digestedand removed from the nuclei. Accord-ing to Nickerson et al. [4] the com-pleteness of DNA removal should bemonitored in pilot experiments by e.g.assessment of [3H]thymidine release.This is probably necessary in the exper-iments where ultimate control is neededduring the preservation of the structureof nuclear matrix. We found that satis-factory results are obtained for a widerange of different cells with standardconditions.
5. Extract in the high salt buffer at 4 ◦C for5 min. High salt concentration removesthe histones and most of the high mobil-ity group proteins from the nucleus andstabilizes the cellular scaffolding.
2. Preparation for electronmicroscopy
Reagents
Buffered glutaraldehyde: 2.5% glutaralde-hyde in extraction buffer 1
Remarks: Dissolve glutaraldehyde fromthe stock solution in extraction buffer 1,shortly before use. Keep in refrigerator at4 ◦C. Fixative older than 6 h should bediscarded.
Sodium cacodylate buffer: 0.1 M sodiumcacodylate, pH 7.2
Remarks: Prepare stock 0.2 M solutionof sodium cacodylate in distilled water andadjust pH with 0.2 M HCl. The solution isstable for several months when stored at4 ◦C. Before use dilute 1 : 1 (vol/vol) withdistilled water.
Buffered osmium tetroxide: 1% osmiumtetroxide in cacodylate buffer
Remarks: Mix osmium tetroxide stocksolution with 0.2 M sodium cacodylatestock solution and dilute with distilledwater to bring the concentration of sodiumcacodylate to 0.1 M. The solution is stablefor several months at 4 ◦C.
Procedure 2
1. Fixation. We fix routinely in 2.5%buffered glutaraldehyde at 4 ◦C for 40min. Remember that cell pellet shouldideally be approximately 1 mm3 for fur-ther embedding.
2. Wash the pellet or cells on the cover-slip with sodium cacodylate buffer for5 min, 4 ◦C.
3. Post-fix in buffered osmium tetroxidefor 30 min at 4 ◦C.
4. Wash in cacodylate buffer for 30 min.
5. Dehydrate the material by transferthrough the ethanol series: 50, 70, 80,90, 96% two changes for 5 min each.End with three changes of dehydrated100% ethanol for 5 min each. At thisstep the material may be left overnightat 4 ◦C. After transfer through 80%ethanol the pellets are hard enough tobe transferred to BEEM capsules.
6. Transfer the cells to a 1 : 1 (v/v)mixture of ethanol : isobutanol for5 min at room temperature, and thento pure isobutanol, twice for 5 mineach time. Place the samples in theoven at 60 ◦C and allow the solvents

PROTOCOL 6.32 321
to evaporate (15 min). The aim is toremove the rest of ethanol, which isnot miscible with DGD.
7. Prewarm a mixture of 1 : 1 (v/v) DGD: isobutanol in the oven at 60 ◦C andpour over the cells. Leave the samplesin the oven until butanol evaporates(approximately 30 min) and infiltratethe cells with molten DGD (60 ◦C)twice, 60 min each.
8. Place the samples at room temperatureto solidify. For cells on coverslips,peel the coverslip from DGD; thecells will remain embedded in DGDas a monolayer. For samples in thecapsules, cut away the capsule andtrim the block to a surface of 1–2 mm.
9. Cut with glass or diamond knivesat angle of 10◦ on the microtome.Thickness between 0.1 and 1 µm canbe obtained, but we had best resultswith 0.3 µm sections. The interferencecolour of the sections is the same asfor Epon sections.
10. Collect the sections on the carbon-coated copper grinds that have addi-tionally been coated with poly-L-lysine.
11. Remove DGD by immersing the gridsfor 1 h in toluene at room temperature.
12. Transfer the grids to a 1 : 1 (v/v) solu-tion of ethanol : toluene for 5 min, andthen to three changes of 100% ethanol(each 10 min). At this step the sectionsmay be processed for immunogoldstaining, as described in Procedure3 below. If immunocytochemistry isnot required, immerse the grids for5 min in a 1 : 1 (v/v) mixture ethanol: HMDS followed by three changes ofHMDS, 10 min each. Air-dry.
13. The sections may optionally be carbon-coated to increase the robustness of thesamples.
3. Staining with antibodies
Reagents
Buffered paraformaldehyde/glutaralde-hyde: 3.7% paraformaldehyde and 0.1%glutaraldehyde in extraction buffer 1
Comment: Prepared freshly, stored at 4 ◦Cfor up to 3 h.
PTA buffer (PBS-Tween-albumin): 0.05%(v/v) Tween 20, 0.1% (w/v) bovineserum albumin in PBS
Comments: Place a vessel with PBS on amagnetic stirrer and dissolve the requiredamount of Tween 20. Switch the stirreroff, sprinkle albumin pulver on the fluidsurface, switch the stirrer on and stirslowly until albumin is dissolved (about1 h). Sterile filtrate. PTA buffer can bestored at 4 ◦C for a week or frozen forseveral months.
Glutaraldehyde cacodylate buffer: 2.5% glu-taraldehyde dissolved in 0.1 M sodiumcacodylate buffer, pH 7.2
Buffered osmium tetroxide: prepared as forsection 2, above
Antibodies
Primary mouse, rabbit and goat antibod-ies have been used. An antibody thatworked for the post-embedding immuno-gold electron microscopy is also likely towork for EFEM. We used the followingsecondary, gold-labelled antibodies: don-key anti-rabbit (4 nm gold), donkey anti-goat (12 nm), donkey anti-mouse (20 and30 nm) (Jackson ImmunoResearch, WestGrove, PA). We dilute antibodies in PTAbuffer or in PBS. PTA buffer gives lowerbackground staining.
Procedure 3
We have developed the following post-embedding protocol, where the sections

322 IN VITRO TECHNIQUES
are stained after DGD embedding. Analternative pre-embedding protocol can befound in ref. 4. Post-embedding staininggives results with a very low background,but some epitopes may be masked duringprior embedding steps.
1. Cell extraction: performed as above inProcedure 1 (steps 1–5).
2. Fixation. Pure glutaraldehyde is a heav-ily cross-linking agent and may masksome epitopes. If problems are encoun-tered we had good results after fixingwith buffered paraformaldehyde/gluta-raldehyde for 3 h at 4 ◦C. This solutionshouldbepreparedfreshlyfromtheEM-grade reagents. Osmium post-fixation(steps 7–9, Procedure 2) is omitted.
3. Embedding in DGD, sectioning, re-moval of DGD: performed as abovein section 2, steps 10–17.
4. Rehydrate the material by immersingin a series of alcohols: 100, 96, 90,80, 70, 50, 30%, 2 × 5 min at roomtemperature (RT).
5. Rinse the grids with the material byfloating them on PBS for 10 min fol-lowed by PTA buffer 10 min, RT.All incubation/washing steps are per-formed by placing the grids on a largedrop of fluid placed on Parafilm orsimilar hydrophobic membrane, spec-imen side down.
6. Block with 5% normal donkey serumin PTA buffer for 10 min, RT.
7. Incubate with the first antibody. De-pending on the type of antibody, incu-bation times from 2 h to overnight areappropriate. For short times incubationat 37 ◦C rather than at 4 ◦C gives bet-ter results. All antibody dilutions aremade in PTA buffer.
8. Rinse in PTA buffer three times, 5 mineach, RT.
9. If double or triple staining is per-formed incubate with additional pri-mary antibodies.
10. Rinse in PTA buffer three times,5 min each at RT, followed by addi-tional blocking with 5% normal don-key serum in PTA buffer for 10 min.
11. Incubate with gold-labelled secondarydonkey antibodies diluted in PTA.Usually 1–2 h at 37 ◦C would suffice.
12. Rinse in PBS, 3 × 10 min, RT.
13. Rinse in sodium cacodylate buffer,three times, 5 min, RT.
14. Fixed in glutaraldehyde cacodylatebuffer for 1 h at 37 ◦C.
15. Post-fix in buffered osmium tetroxidefor 30 min followed by a rinse for30 min in sodium cacodylate bufferat RT.
16. Dehydrate in ethanol 50–100% asdescribed above (Procedure 2, step 5).
17. Transfer to the mixture 1 : 1 (v/v)100% ethanol : HMDS for 10 minfollowed by three changes of HMDS,10 min each. Air-dry.
18. The grids containing the dried samplescan be lightly carbon coated in aKinlay carbon evaporator and storedin a dessicator.
Results
Images of cell scaffolds after cell extrac-tion and EFEM (Procedures 1 and 2)should reveal a continuous meshwork offilaments in the cytoplasmic and nuclearareas (Figure 6.31). The thickness andarrangement of filaments depend on celltype and state of differentiation. Forexample in C6 glioma the cell linecytomatrix comprises 10–15 nm branchedfibrils, 5 nm microfilaments and short

PROTOCOL 6.32 323
(a)
(b)
Figure 6.31 EFEM of extracted human keratinocyte showing cytomatrix and nuclear matrix.(a) Low magnifications with a meshwork of filaments in the cytoplasmic field (C), nuclear lamina(L) and the coarse nuclear matrix (N). (b) High magnification showing filaments of different diameterin the cytomatrix. Arrows: ultrathin 1 nm filaments

324 IN VITRO TECHNIQUES
(a)
(b)
Figure 6.32 Post-embedding immunogold cytochemistry on extracted COLO 20 cells. (a) Anti-Baxstaining during apoptosis showing concentration of Bax at the nuclear lamin and in the nucleus.(b) Triple immunogold labelling (anti-Bax: 4 nm gold particles, anti-Bid: 12 nm gold, anti-VDAC-1:20 nm gold) of the nuclear matrix of COLO 25 cell during apoptosis. Note clusters of gold particlesof different sizes (arrows)

PROTOCOL 6.32 325
(40–200 nm) very thin (1–3 nm) fib-rils [6]. A similar structure of the cytoma-trix was seen in proliferating human ker-atinocytes, but during cell differentiationthe 5 and 1 nm filaments disappeared andwere replaced by a tight meshwork of15 nm fibrils [7]. The nuclear matrix con-sists of a meshwork of 10–30 nm filamentsattached to a compact nuclear lamina.Ultrathin 1 nm filaments are also presentin the nuclear matrix. The globular por-tion of the nuclear matrix corresponds toribonucleoprotein.
Examples of post-embedding immuno-gold labelling of extracted matrices areshown in Figure 6.32. Details of antibodyconcentration and incubation tomes maybe found in our recent publications [5, 8].Labelling with up to three antibodiesis feasible.
References
1. Capco, D. G., Krochmalnic, G. and Penman, S.(1984) A new method of preparing embed-ment-free sections for transmission electronmicroscopy: applications to the cytoskeletalframework and other three-dimensional net-works. J. Cell Biol., 98, 1878–1885.
2. Penman, S. (1995) Rethinking cell structure.Proc. Nat. Acad. Sci. USA, 92, 5251–5257.
3. Fey, E. G., Krochmalnic, G. and Penman S.(1986) The nonchromatin substructures ofthe nucleus: the ribonucleoprotein (RNP)-containing and RNP-depleted matrices ana-lyzed by sequential fractionation and resinlesssection electron microscopy. J. Cell Biol., 102,1654–1665.
4. Nickerson, J. A., Krochmalnic, G. and Pen-man, S. (1998) Isolation and visualization ofthe nuclear matrix, the nonchromatin structureof the nucleus. In: Cell Biology: A LaboratoryHandbook (J. E. Celis, ed.), 2nd edn, vol. 2,pp. 194–192. Academic Press.
5. Gajkowska, B., Motyl, T., Olszewska-B ¸adar-czuk, H., Gniadecki, R. and Koronkiewicz, M.(2000a) Structural association of Bax withnuclear matrix and cytomatrix revealed byembedment-free immunogold electron micro-scopy. Cell Biol. Int., 24, 649–656.
6. Gajkowska, B., Cholewinski, M. and Gni-adecki, R. (2000b) Structure of cytomatrix andnuclear matrix revealed by embedment-freeelectron microscopy. Acta Neurobiol. Exp., 60,147–158.
7. Gniadecki, R., Olszewska, H. and Gajkow-ska, B. (2001) Changes in the ultrastructure ofcytoskeleton and nuclear matrix during HaCaTkeratinocyte differentiation. Exp. Dermatol.,10, 71–79.
8. Gajkowska, B. and Wojewodzka, U. (2002)A novel immunoelectron embedment freeelectron microscopy reveals association ofapoptosis-regulating proteins with subcellularstructures. Histochem. J., 34, 441–446.
PROTOCOL 6.33
Tubulin assembly induced by taxol and othermicrotubule assembly promoters
Susan L. Bane
Introduction
Substances that affect microtubule assem-bly and dynamics have important thera-peutic applications, particularly in cancerchemotherapy. Taxol was the first exampleof an effector molecule of microtubuledynamics that promotes rather than inhibitsin vitro microtubule polymerization. Thesuccess of Taxol as an anticancer agenthas sparked a tremendous interest in thediscovery of other molecules that promotemicrotubule assembly [1].
Microtubule assembly promoters (MT-APs) generally are screened by assess-ing the ability of the molecule to pro-mote microtubule assembly in vitro. Activ-ity is most commonly assessed as an I50
value, which is the concentration of MTAPrequired to promote tubulin to assem-ble to 50% of its maximum. This is auseful and easily obtainable value; how-ever, some care should be taken in itsinterpretation. 1©
Three procedures follow:
Procedure 1 . Tubulin assembly inducedby Taxol. This is the basic procedurefor measuring tubulin polymerization byassembly-promoting molecules such asTaxol. It can also be used to prepare Taxol-microtubules for other studies.
Procedure 2. Potency measurementsof MTAPs using absorption spectroscopy.
The basic procedure for Taxol assemblyis applied to potency measurements ofnew substances. Absorption spectroscopyis convenient when a small number ofmolecules are to be screened.
Procedure 3. Potency measurements ofMTAPs using fluorescence spectroscopy.Procedures for measuring potency areperformed in a 96-well plate [2]. Thisprocedure is well suited to screening alarger number of molecules.
Reagents
Purified tubulin, free of microtubule-asso-ciated proteins 2© 3©
PMEG buffer: 0.1 M PIPES, 1 mM MgSO4,2 mM EGTA, 0.1 mM GTP, pH 6.9. Thebuffer must be kept cold (4 ◦C) to preventGTP hydrolysis. GTP-containing buffersare discarded after 2 weeks 4©
Taxol, which is available from severalcommercial sources
Sephadex G-50 in PMEG buffer
Dimethylsulfoxide (DMSO), reagent gradeor better
MTAPs to be tested (for Procedures 2and 3)
4′, 6-diamidino-2-phenylindole (DAPI) (forProcedure 3)

PROTOCOL 6.33 327
Equipment
Gel filtration column and fraction collector
Procedures 1 and 2: Absorption spectro-photometer with thermostatted cell holder(Multicell transporter desirable)
Quartz cells for spectrophotometer. A0.4 × 1.0 cm cell requires about 0.5 mlsolution for each polymerization in atypical instrument
Procedure 3: Plate reader capable ofmonitoring emission at 450 nm (excitationat 360 nm).
96-well plates
Procedures
Procedure 1 Taxol-induced tubulinassembly
1. Prepare a stock solution of Taxol ofapproximately 1 mM in DMSO.
2. Equilibrate tubulin in cold PMEG bufferusing Sephadex G-50. 5©
3. Set up absorption spectrophotometer tomeasure absorption at 350 nm for 15 minat a cuvette temperature of 37 ◦C.
4. Add buffer followed by tubulin to thecuvette to yield a tubulin concentrationof 10 µM in a total volume of 0.5 ml.Equilibrate solution to 37 ◦C and beginmeasuring absorption at 350 nm.
5. Add an aliquot of the Taxol solutionto yield a final Taxol concentration of10 µM (and a DMSO concentrationof ≤3% vol/vol 6©), mix rapidly andgently, taking care not to introducebubbles into the cuvette.
6. Collect data until a plateau is reached.
Procedure 2 Potency of MTAPs using anabsorption spectrometer
1. Prepare 1 mM stock solution of Taxolin DMSO and stock solution(s) of theMTAP(s). 7©
2. Prepare tubulin and absorption spec-trometer as above. The rest of thisprotocol assumes that the absorptioninstrument is capable of measuring sixcuvettes simultaneously.
3. Add PMEG buffer followed by tubulinto absorption cell to yield a tubulin con-centration of 10 µM in a total volumeof 0.5 ml. Equilibrate the solutions to37 ◦C and begin measuring absorptionat 350 nm.
4. To the first cuvette add an aliquot ofthe Taxol solution to yield a final Taxolconcentration of 10 µM. To the otherfive cuvettes, add aliquots of the MTAPto yield the chosen final concentrationof MTAP. 6© Mix each cuvette rapidlyand gently, taking care not to introducebubbles into the solution.
5. Continue measuring the absorption ofthe solution with time until a steadystate is reached in the slowest sample.
6. Calculate the relative extent of assem-bly by subtracting the absorption valuebefore addition of Taxol or MTAP fromthe absorption value of the plateau foreach sample.
7. Determine the fraction assembled ineach sample by dividing the change inabsorption for the Taxol sample intothe change of absorption of the othersamples.
8. Plot the fraction assembled versusMTAP concentration and determinethe I50.
Procedure 3 Potency of MTAPs using amulti-well plate and a fluorescence platereader
1. Prepare 1 mM stock solution of Taxolin DMSO and stock solution(s) of theMTAP(s) in DMSO. 7©
2. Prepare a 1 mM stock solution ofDAPI in water. 8©

328 IN VITRO TECHNIQUES
3. Equilibrate tubulin in cold PMEGbuffer using Sephadex G-50. 5©
4. Prepare the tubulin-DAPI solution forpipetting into the plate. The final con-centration of DAPI and tubulin in eachwell will be 10 and 5 µM, respec-tively. 9© Mix DAPI and buffer first,then add tubulin and mix gently. Add194 µl of this solution to each well.
5. Add the MTAP in DMSO (6 µl) to aproduce a final volume of 200 µl. Pre-pare duplicates of each MTAP concen-tration. Quickly mix the solutions inthe wells using a multi-channel pipet-tor, taking care to avoid introductionof bubbles into the wells.
6. Also prepare duplicates of two typesof controls: a ‘no assembly’ control,which contains 5 µM tubulin, 10 µMDAPI, 6 µl of DMSO but no MTAP,and a ‘complete assembly’ control,which contains 5 µM tubulin, 10 µMDAPI and 10 µM Taxol.
7. Initiate the plate reader (excitation =360 nm, emission = 450 nm 10©) andcollect data until a plateau is reachedin the wells. 11©
8. Subtract the average fluorescence valuefor the ‘no assembly’ wells from theaverage of the two fluorescence valuesof each plateau.
9. Divide the average fluorescence valuefor the ‘complete assembly’ controlinto the average fluorescence value foreach of the MTAP concentrations todetermine the fraction assembled.
10. Plot fraction assembled versus concen-tration of MTAP and determine theI50 value.
Examples of data
Figure 6.33 shows an example of Pro-cedure 2 in which tubulin assembly isinduced by increasing concentrations ofbaccatin III, an MTAP. The arrow indi-cates the point at which the baseline
0.4
0.3
0.2
0.1
0.00 200 400 600 800 1000 1200
Time (s)
A35
0
Figure 6.33 Tubulin assembly monitored on an absorption spectrometer according to Procedure 2.Assembly was initiated after a baseline was collected for about 75 s (arrow). The absorption value forthe baseline is subtracted from the absorption value of the plateau (arrow) to evaluate the extent ofassembly. In this illustration, assembly of 10 µM tubulin was induced by baccatin III at concentrationsof 6 µM (solid curve), 3 µM (dashed curve) and 1.5 µM (dotted curve). A control containing nobaccatin III is shown in the dot–dash curve. The extent of assembly of the Taxol control is not shownin this illustration

PROTOCOL 6.33 329
A
D E
B C
Fluo
resc
ence
Time (s)
Figure 6.34 Tubulin assembly in a 96-well plate monitored by fluorescence according to Procedure3. Fluorescence was collected over a period of 100 min at a temperature of 32 ◦C. The x and y scalesof each panel are equal. Panel A is the ‘no assembly’ control, containing 5 µM tubulin without MTAP.The concentration of MTAP in panels B–E was 0.5, 2.0, 4.0 and 5.0 µM, respectively. The ‘completeassembly’ control and duplicates of each well were also run (data not shown)
00.0
0.2
0.4
Frac
tion
poly
mer
ized
0.6
0.8
1.0
1.2
1 2 3
[MTAP] (µM)
4 5 6 7
Figure 6.35 The I50 for the MTAP tested in Figure 6.36 is determined graphically to be 2.3 µM
was taken, and the second arrow indi-cates where the absorption reading for theplateau was taken.
Figure 6.34 shows an example of Pro-cedure 3 in which tubulin assembly isinduced by increasing concentrations of aTaxol analogue.
Figure 6.35 shows a plot of the fractionof tubulin assembled as a function ofMTAP concentration and the I50 value.
Notes1© Assembly promotion is a function
of both the affinity of the MTAPfor the receptor site (Ka) and thecritical concentration of tubulin in
the presence of saturating concentra-tions of the MTAP (Ccrit). A struc-tural alteration of Taxol can affectits Ka, Ccrit or both parameters. Formore detailed discussions, see refs 3and 4.
2© If only a few measurements are antic-ipated, the protein can be purchasedfrom Cytoskeleton, Inc. If many mea-surements are to be done, it ismore cost effective to purify the pro-tein from mammalian brain, describedin ref. 5.
3© These assays can also be performedusing microtubule protein, which istubulin plus microtubule-associated

330 IN VITRO TECHNIQUES
proteins (MAPs). MAPs lower thecritical concentration of tubulin.Therefore, if microtubule protein isused, a lower protein concentrationmay be necessary to prevent polymer-ization of the ‘no assembly’ controls.
4© It is convenient to prepare stock solu-tions of the individual components:0.4 M PIPES, pH 6.9, prepared fromthe free acid and 5 M NaOH; 100 mMEGTA, pH 6.9, prepared from the freeacid and 1 M NaOH; 50 mM MgSO4,and 50 mM GTP. PIPES stock isstored at 4 ◦C, GTP stock is stored at−20 ◦C or below, MgSO4 and EGTAstocks are stored at 25 ◦C.
5© If a low-speed centrifuge is available,tubulin can be quickly equilibratedinto PMEG buffer by the method ofPenefsky [6], in which 1 ml syringesare used instead of a single column.
6© It is known that DMSO inducestubulin to assemble at concentrations≥8% vol/vol [7]. We have found thatDMSO at a concentration of ≤3%does not affect tubulin polymerizationunder these assay conditions.
7© We find it convenient to make serialdilutions of the stock solutions so thatan equal volume of DMSO is addedto each well.
8© This solution may be frozen in smallaliquots for storage at −20 ◦C. The
DAPI solutions are not subjected toa second freeze–thaw cycle.
9© We use a lower tubulin concentrationin the 96-well plates than in theabsorption spectrometer to decreasethe mass of tubulin consumed in eachexperiment.
10© Appropriate cutoff filters can be usedif the plate reader lacks monochrome-ters.
11© A plate reader equipped with a tempe-rature-controlling unit is ideal. In theabsence of such an accessory it isimportant to maintain a constant tem-perature in the 96-well plate. Lowertemperatures will decrease the rates ofthe assembly reactions.
References
1. Altman, K.-H. (2001) Curr. Opin. Cell Biol.,5, 424–431.
2. Barron, D. M., Chatterjee, S. K., Ravindra, R.,Roof, R., Baloglu, E., Kingston, D. G. I. andBane, S. (2003) Anal. Biochem., 315, 49–56.
3. Chatterjee, S. K., Barron, D. M., Vos, S. andBane, S. (2001) Biochemistry, 40, 6964–6970.
4. Andreu, J. M. and Barasoain, I. (2001) Bio-chemistry, 40, 11 975–11 984.
5. Williams, R. C. Jr and Lee, J. C. (1982) Meth-ods Enzymol., 85, 376–385.
6. Penefsky, H. S. (1979) Methods Enzymol., 56,527–530.
7. Robinson, J. and Engelborghs, Y. (1982) J.Biol. Chem., 257, 5367–5371.

PROTOCOL 6.34
Vimentin production, purification, assemblyand study by EPR
John F. Hess, John C. Voss and Paul G. FitzGerald
Introduction
The hallmark of all intermediate filament(IF) proteins is the central rod domain, aregion long predicted to form an alpha heli-cal coiled coil. Although full-length IF pro-teins have not been crystallized, the alphahelical coiled nature of subdomains withinthe central rod has been confirmed by crys-tallization of vimentin fragments [1, 2] andEPR spectroscopy [3]. We use the follow-ing methods to produce, purify, spin labeland then assemble filaments for EPR stud-ies of vimentin structure and assembly.The process of spin labelling a proteinrequires that a single cysteine be substi-tuted at the position where the spin labelis required. Therefore, we have removedthe single endogenous cysteine present inhuman vimentin and substituted cysteineswhere required. All of our constructs con-tain a serine at position 328, the originallocation of the endogenous cysteine. Thus,vimentin cys342 contains a cysteine at posi-tion 342 and a serine at position 328.
Procedures
A. Production of vimentin in E. coli
Expression of vimentin in E. coli is per-formed using a pET7 expression plas-mid generously provided by Roy Quinlan(Durham University, UK). This construct
is introduced into any of several E. coliBL21 (DE3) strains for IPTG induction ofvimentin expression followed by isolationand purification of IBs (inclusion bodies).
Reagents and equipment
For bacterial growth:
37 ◦C Shaking incubator for liquid culture
37 ◦C Incubator for bacterial plates
Bacterial culture media including antibi-otics
IPTG (isopropyl-B-D-galactopyranoside)
For preparation of bacterial lysates and gelelectrophoresis:
Microcentrifuge
SDS gels and apparatus for electrophoresis
Protein standards
Centrifuge and rotors
Procedure
General plasmid transformation and bacte-rial growth protocols can be found in refer-ences such as Molecular Cloning [4]. Pro-tocols related to bacterial induction usingIPTG can be obtained from companiessuch as Novagen, Invitrogen, Stratageneand others.
1. Transform competent E. coli BL21(DE3) (Novagen, Invitrogen or other

332 IN VITRO TECHNIQUES
suppliers), with plasmid DNA and plateon LB plates containing 100 µg ofampicillin (amp)/ml.
2. Pick three or four colonies and grow in2 ml of LB-amp until slightly cloudy(OD 600 ∼0.3–0.4, usually ∼4 h).Then 1 ml of each culture is removedand transferred to a fresh tube and 1 µlof 1 M IPTG is added. The originaltube, with 1 ml remaining, is retainedfor use as an uninduced control. TheIPTG induced culture is returned toa shaking incubator for 4 h. Follow-ing induction, 500 µl of both inducedand uninduced bacteria are harvested bylow-speed centrifugation (5000 rpm for2 min) and the supernatants discarded.Then 100 µl of TE (10 mM Tris pH 8,1 mM EDTA) is added and the bacte-ria resuspended by vigorous vortexing.Then 35 µl of 4× SDS-PAGE gel load-ing dye is added and the solution gen-tly mixed; 15 µl of this bacterial lysateis sufficient to run on a typical SDS-PAGE minigel. If the solution is tooviscous to pipette, a 1 ml syringe fit-ted with a 25-gauge needle can be usedto shear the bacterial genomic DNA.Coomassie blue staining and destain-ing of the gel will reveal which colony(or colonies) provided the best expres-sion. From the original uninduced cul-ture, the best expressing colony shouldbe streaked out onto a fresh LB-ampplate.
3. Day 2: select a single isolated colonyand grow in 11 ml of LB-amp. Thisculture is grown for 6–8 h, until verycloudy, and two glycerol stock tubes areprepared by mixing 500 µl aliquots ofbacteria with an equal volume of sterile50% glycerol and stored at −80 ◦C. Theremainder of the culture (∼10 ml) isstored at 4 ◦C overnight.
4. Day 3: use the entire 10 ml culture fromthe refrigerator to inoculate 500 ml of
LB-amp supplemented with 10 ml of20% glucose. When the culture reachesan A600 of 0.8, IPTG is added to0.5 mM. Induction is allowed to pro-ceed for 6 h, and the bacteria harvestedby centrifugation in a swinging bucketrotor at 4000 rpm for 15 min. The useof a swinging bucket rotor produces athin pellet of bacteria on the bottom ofthe 250 ml bottle, instead of a thickpellet in the corner of a fixed anglerotor. This pellet geometry aids resus-pension of the bacteria; complete andthorough resuspension is essential for aclean inclusion body preparation. Fol-lowing centrifugation, the bacterial pel-let is frozen overnight.
B. Isolation and purification ofinclusion bodies (IBs) [3, 5]
Reagents and equipment
Centrifuge and rotors (for harvesting bac-terial cultures and washing of IBs, e.g.Sorvall RC5C, HS4 rotor, SS34 rotor)
LysozymeDNase IRNase A
Procedure
1. Thaw bacterial pellets in centrifugebottles by the addition of a GET buffer(50 mM glucose, 25 mM Tris pH 8,10 mM EDTA) containing 10 mg/mlegg white lysozyme (Sigma L-6876),10 ml per centrifuge bottle (20 ml per500 ml culture). The bottle is vigor-ously vortexed to resuspend the pelletand create a homogeneous suspen-sion. The cell suspension is trans-ferred to a disposable 50 ml screw-cap tube using a Pasteur pipette. Anyremaining clumps are broken up byrapid pipetting.
2. Incubate the bacterial suspension ina 37 ◦C water bath for ∼15–20 min.

PROTOCOL 6.34 333
During this time, the suspensionshould change from a homogeneousbrown/grey/beige colour into a moreclumped suspension. This indicatescompletion of the lysozyme digestionand beginning of bacterial lysis.
3. Produce complete lysis by the additionof an equal volume of 20 mM TrispH 7.5, 0.2 M NaCl, 1 mM EDTA1% deoxycholic acid, 1%NP-40. Thebacterial solution and the lysis buffershould be gently rocked back and forthseveral times over several minutesto mix the solutions; the solutionshould rapidly turn viscous (more ofa gelatinous blob than a suspension).This indicates lysis and release ofbacterial genomic DNA.
4. Add magnesium chloride (1 M stock),DNase I (Sigma D-5025, stock solu-tion 10 mg/ml) and RNase A (SigmaR4875), 10 mg/ml stock solution)to final concentrations of 10 mM(MgCl2) and 10 µg/ml (RNase andDNase). The bacterial lysate is againmixed by rocking back and forth, thenincubated at 37 ◦C. Over the courseof 15–30 min, digestion of the bac-terial DNA by DNase I will convertthe solution from a viscous gel intoa watery yellowish solution with anoff-white precipitate at the bottom ofthe tube. Mixing of the tube will forma homogeneous solution, but the IBswill again sediment to the bottom.
5. When digestion is complete, as evi-denced by a watery, non-viscous con-sistency, transfer the solution(∼20 ml) to a round bottom centrifugetube and centrifuge in an SS34 rotor at6500 rpm (10 000g) for 10 min. IBsform a large white/tan coloured pel-let; the supernatant is discarded. (Thepellet should be firm, and the super-natant can be poured off without dan-ger of losing the pellet.) Each tube,
corresponding to 250 ml of originalculture, is sequentially washed with10 ml each of no salt, low salt, highsalt, and no salt buffers.
6. Add 10 ml of 0.5% TritonX-100 (TX-100), 1 mM EDTA to the tube andresuspend the IBs by pipetting. IBsare then pelleted by centrifugation asbefore.
7. Add 10 ml of a low salt solution(10 mM Tris pH 8, 5 mM EDTA,0.15 KCl, 0.5% TX-100) to the pelletand resuspend the pellet by pipetting.Careful resuspension and disruptionof clumps are essential to prepareinclusions free of major contaminants.Collect IBs by centrifugation.
8. Wash IBs with 10 ml of a high saltsolution (10 mM Tris pH 8, 5 mMEDTA, 1.5 M KCl, 0.5% TX-100) andcollect by centrifugation.
9. Wash IBs with 10 ml 0.5% TX-100,1 mM EDTA and collect by centrifu-gation.
10. Resuspend each tube of IBs in 4 ml(8 ml total volume for 500 ml cul-ture) of 20 mM Tris pH 8, 1 mMEDTA, 8 M urea. Pipette the solu-tion up and down; the IBs should dis-solve and yield a slightly yellow solu-tion that is not viscous. If viscous,the DNase digestion was incomplete.Small brown clumps with a translu-cent halo around them are clumps ofbacteria that were not resuspended.
C. Purification and preparation of spinlabelled vimentin
Reagents and equipment
FPLC, e.g. Pharmacia
Source S column
Spin label compound (O-87500, (1-oxyl-2,2,5,5,-tetramethyl-�3-pyrroline-3-

334 IN VITRO TECHNIQUES
methyl) methanethiosulfonate [MTSL],Toronto Research Chemicals, Toronto,Canada)
Superose column
TCEP (tris-(2-carboxylethyl) phosphine,Molecular Probes, Eugene, OR)
Procedure
1. Dissolve IBs (from 500 ml of bacterialculture) in 8 ml of 8 M urea (20 mMTris pH 8, 1 mM EDTA, 8 M urea) andfilter through a 0.2 micron filter (PallSerum Acrodisc, Fisher Scientific).
2. Chromatograph 4 ml of inclusion bodysolution on a Hi Load 16/60 Superdex200 column. The column is run with20% buffer B, giving conditions of20 mM Tris, pH 8, 1 mM EDTA, 0.2 MNaCl. Electrophorese column fractionson an SDS-PAG and visualize theproteins by Coomassie blue staining.Pool peak fractions.
3. Desalt the pooled vimentin peak bychromatography over a High-Prep26/10desalting column.
4. Concentrate the desalted vimentin bychromatography over a Source 15 Scolumn. The peak, typically 2.0 ml, isused for spin labelling.
5. Add TCEP (100 mM stock in H2O)to a final concentration of 100 µMand incubate at room temperature for30 min.
6. Spin label the reduced vimentin byaddition of spin label to a final concen-tration of 500 µM; continue incubationfor 1 h.
7. After spin labelling, add 8 ml of bufferA (8 M urea, 20 mM tris, 1 mM EDTA,pH 8.0) and chromatograph the spinlabelled protein over the Source 15Sas before. Collect the purified peak andstore at −80 ◦C.
Figure 6.36 Representative spin-labelled vimen-tin samples. Samples of Source S fractions 21and 22 of spin-labelled vimentin mutants cys342,cys345, cys346 and cys349 are shown followingelectrophoresis on SDS-PAGE and staining withCoomassie Blue. In each pair of lanes, fraction21 is first, followed by fraction 22; Lanes 1,2: vimentin cys342; lanes 3,4, vimentin cys345;lanes 5,6, vimentin cys346; lanes 7,8, vimentincys349. Markers in lane M are Benchmark pro-tein standards from Invitrogen. Vimentin migratesbetween the 50 and 60 kD bands
Figure 6.36 shows the results of theabove purification/labelling scheme, forfour separate vimentin mutants.
D. Assembly of intermediate filaments
Equipment
Dialysis tubing and clips, e.g. Spectra/Por6 regenerated cellulose, 10 000 molecularweight cut-off dialysis tubing (Fisher Sci-entific)
Procedure
1. Assemble purified vimentin in 8 M ureainto filaments by dialysis against bufferswithout urea. Single-step dialysis canbe performed using 20 mM Tris pH 7.5and either 160 mM KCl or NaCl [6, 7].Dialysis is performed at room temper-ature, overnight. For EPR studies, pro-tein concentrations >1 mg/ml are used.For observation of filaments by elec-tron microscopy, protein concentrations

PROTOCOL 6.34 335
Figure 6.37 Intermediate filaments assembledfrom spin-labelled vimentin 342C. Spin-labelledvimentin was assembled by dialysis against20 mM Tris pH 7.5, 160 mM NaCl, overnight fol-lowed by negative staining and visualization byEM
of 0.2–0.5 mg/ml are used. Figure 6.37shows an example of filaments assem-bled from vimentin cys342.
2. If EPR spectra are to be recorded atmultiple steps during vimentin assem-bly, dialysis can be performed in a step-wise fashion [8]. Starting conditions are20 mM Tris pH 8.0, 1 mM EDTA, 8 Murea (buffer A + 8 M urea). Vimentindimers can be produced by dialysisagainst buffer A + 4 M urea. Vimentintetramers can be produced by dialysisagainst 5 mM Tris pH 8 [9]. Filamentscan be assembled from any of theseintermediate steps by dialysis againstassembly buffer, 20 mM Tris pH 7.5,160 mM NaCl. Perform dialysis for6–8 h, followed by overnight dialysis,for filament formation.
EPR
EPR measurements can be carried out ina JEOL X-band spectrometer fitted witha loop-gap resonator (Molecular Special-ties, Inc., Milwaukee, WI), or equiva-lent [10, 11]. An aliquot of purified, spin-labelled protein is placed in a sealed quartzcapillary (0.84 mm OD, Ruska Instrument
8 M urea
4 M urea
IF
Figure 6.38 Normalized EPR spectra fromspin-labelled vimentin cys342. Spectra were col-lected from monomers (8 M urea), dimers (4 Murea) and filaments (20 mM Tris pH 7.5, 160 mMNaCl)
Corp., Houston, TX) and inserted intothe resonator. Spectra of samples at roomtemperature (20–22 ◦C) were obtained bya single 60 s scan over 100 G at amicrowave power of 2 mW, a receivergain of 250–400 and a modulation ampli-tude optimized to the natural line widthof the individual spectrum. For intactfilaments, spin label concentration is typ-ically in the range of 50–70 µM. Inter-mediate filament samples tend to aggre-gate upon further concentration, so instru-ment sensitivity should be optimized toobtain good signal to noise, especially forspecimens displaying broad line widths.However, protofilaments of IF oligomersformed in low ionic strength, can be con-centrated using centrifugal devices provid-ing excellent signal to noise ratio with evenless sensitive instrumentation. For spectraobtained at −100 ◦C, the microwave poweris reduced (100 µW) to avoid saturation.A representative example of EPR data isshown in Figure 6.38.

336 IN VITRO TECHNIQUES
Acknowledgements
This research was supported by a UCDavis Health System Research Grant(JFH), a US Army Medical ResearchAcquisition Activity (grant numberDAMD17-02-1-0664, JFH), National Insti-tutes of Health Grant R01EY08747 (PGF)and core grant P30EY-12576 (JFH andPGF) and The March of Dimes BirthDefect Foundation (JV).
References
1. Strelkov, S., Herrmann, H., Parry, D., Stein-ert, P. and Aebi, U. (2000) J. Invest. Derma-tol., 114, 779.
2. Strelkov, S. V., Herrmann, H., Geisler, N.,Wedig, T., Zimbelmann, R., Aebi, U. andBurkhard, P. (2002) EMBO (European Mo-lecular Biology Organization) J., 21,1255–1266.
3. Hess, J. F., Voss, J. C. and FitzGerald, P. G.(2002) J. Biol. Chem., 277, 35 516–35 522.
4. Sambrook, J. and Russell, D. W. (2001) Mo-lecular Cloning: a Laboratory Manual, 3rdedn (J. Sambrook, ed.), Cold Spring HarborPress, Cold Spring Harbor, NY.
5. Nagai, K. and Thøgersen, H. C. (1987) Meth-od. Enzymol., 153, 461–481.
6. Herrmann, H., Hofmann, I. and Franke, W.W. (1992) J. Mol. Biol., 223, 637–650.
7. Eckelt, A., Herrmann, H. and Franke, W. W.(1992) Euro. J. Cell Biol., 58, 319–330.
8. Carter, J. M., Hutcheson, A. M. and Quin-lan, R. A. (1995) Exp. Eye Res., 60, 181–192.
9. Rogers, K. R., Herrmann, H. and Franke, W.W. (1996) J. Struct. Biol., 117, 55–69.
10. Froncisz, W. and Hyde, J. S. (1982) J. Magn.Reson., 47, 515–521.
11. Hubbell, W. L., Froncisz, W. and Hyde, J. S.(1987) Rev. Sci. Instrum., 58, 1879–1886.

PROTOCOL 6.35
Neurofilament assembly
Shin-ichi Hisanaga and Takahiro Sasaki
Introduction
Neurofilament (NF) is the neuron-specificintermediate filament (IF) [1, 2]. NF is themost abundant cytoskeleton in axon, essen-tial for radial growth of axons. NF is com-posed of three subunits, NF-L (61 kDa),NF-M (95 kDa) and NF-H (110 kDa). Likeother IF proteins, each subunit consistsof three domains; the N-terminal head,central α-helical rod and C-terminal taildomain. The head domain is thought to bethe region regulating the filament assem-bly–disassembly by phosphorylation. Therod domain is involved in the filamentformation via coiled-coil interaction. Thetail domain, which of NF-M and NF-Hare highly phosphorylated and much longerthan NF-L and other IF proteins, extrudesfrom the filament core and interacts witheach other and with other cellular compo-nents [3, 4]. Therefore, NF-L is the basicsubunit for filament formation, and NF-Mand NF-H are suggested to be incorporatedat the surface of filaments.
The assembly of NF has been exten-sively studied, but how these subunits arearranged in NF has not been discoveredyet. Furthermore, abnormal metabolism ofNF proteins has been reported recentlywith several neurodegenerative diseases.Accumulation of NF in the cell bodyand proximal axons of motor neurons isa well-known pathology of amyotrophiclateral sclerosis (ALS) [5]. The deletionand insertional mutations of the NF-H tail
domain are discovered in sporadic ALSpatients and are suggested to be a riskfactor. Several point mutations in the NF-Lgene are recently reported to be associatedwith Charcot-Marie-Tooth disease (CMT),the most common form of hereditary motorand sensory neuropathy [6, 7]. NF-L withCMT mutants (P8R and Q333P) is sug-gested to be an inability to form filamentsproperly and disturbs axonal transport inneurons [8, 9]. The point mutation of NF-M is also found in familial Parkinson’s dis-ease [10]. It will be important to determinethe effects of these mutations on filamentassembly.
The NF assembly has usually beenassessed in vitro with purified proteins andin cultured cells by transfection. The NF-Lpurified in a denaturing solution contain-ing 6 ∼ 8 M urea can assemble into long10 nm filaments upon dialysis against aphysiological solution (i.e. 0.15 M NaCland several mM MgCl2 at pH around 7)at 37 ◦C. NF-M and NF-H need NF-Lto form 10 nm filaments, although theythemselves form small oligomeric aggre-gates. The in vitro reassembly system isused to examine the assembly conditionsand processes, and capable of investigatingthe detailed filament structures by electronmicroscopy. It is also possible to examinedisassembly of filaments by phosphoryla-tion with several protein kinases includingPKA, PKC, CaMKII and Rho kinase [11].The expression of NF proteins in SW-13

338 IN VITRO TECHNIQUES
cl.2/Vim− cells which lack the cytoplasmicIF proteins is also often used to estimatethe filament assembly in cellular condi-tions. This assay can be performed withoutpurification of NF proteins. This methodrevealed that rodent NF proteins are obli-gate heteropolymers; NF-L required coex-pression of either or both NF-M and NF-Hfor filament formation [12, 13]. We willdescribe here the assembly system meth-ods in vitro with NF proteins purified frommammalian spinal cords and from E. coli-expressed NF-L and in SW-13 cl.2/Vim−cells with transfection of cDNAs encodingNF protein.
Reagents
A. For assembly in vitro
PEM buffer (100 mM Pipes, pH 6.8,1 mM EGTA, 2 mM MgCl2, 1 mMDTT, 0.4 mM Pefabloc SC (Merck) 1©and 10 µg/ml leupeptin)
PEMU buffer (PEM buffer containing 6 Murea)
PEMN buffer (PEM buffer containing0.15 M NaCl)
Bovine or porcine spinal cords
Rat or mouse NF-L cDNA cloned into anE. coli-expression vector
B. For assembly in SW-13 cl.2/Vim− cells
cDNAs of NF subunits cloned into humancytomegalovirus promoter- or rous sar-coma virus promoter-driven expressionvectors
Transfection reagent, Fugene 6 (Roche) orLipofectamine 2000 (Invitrogen)
All standard laboratory reagents shouldbe of high purity and good qualitydeionized water used
Equipment
A. For assembly in vitro
Polytron homogenizer for spinal cords 2©or sonicator for E. coli
DEAE cellulose (DE52, Whatman) columnand Mono Q column (Amersham Bio-sciences)
Centricon-10 3© (Millipore)
Centrifuge
Materials for preparation of negativelystained EM specimens
Transmission electron microscope
B. For assembly in SW-13 cl.2/Vim− cells
Facilities for cell culturing
Antibody to NF proteins
Materials for preparation of immunofluo-rescent staining
Fluorescence microscope or laser scanningmicroscope
Procedure
I. NF assembly in vitro
A. Preparation of crude NF proteins
(a) NF proteins from spinal cords1. Bring bovine or porcine spinal cords
from a local slaughterhouse to the labon ice as quickly as possible. 4©
2. Remove meninges from the spinal cordsand measure the weight.
3. Homogenize the spinal cords in anequal volume (w/v) of PEM buffer(100 mM Pipes, pH 6.8, 1 mM EGTA,2 mM MgCl2, 1 mM DTT, 0.4 mMPefabloc SC (Merck) and 10 µg/mlleupeptin) with a polytron homogenizer.
4. Centrifuge the homogenate at 10 000g
for 15 min at 4 ◦C.

PROTOCOL 6.35 339
5. Take the supernatant and recentrifuge itat 100 000g for 60 min at 4 ◦C.
6. Discard the supernatant and dissolve thepellet in PEM buffer containing 6 Murea (PEMU).
7. Centrifuge the suspension at 100 000g
for 30 min at 4 ◦C.
8. Remove the supernatant as the crude NFproteins.
(b) NF-L from E. coli 5©The expression of NF-L protein in E. coliis performed by a standard protocol using aT7 promoter-driven system. E. coli strain‘BL21(DE3) pLysS’ carrying pET23-ratNF-L is induced to express NF-L proteinby 0.5 mM IPTG for 3 h at 37 ◦C.
1. Collect E. coli by centrifugation at8 000g and wash once with 0.85%NaCl.
2. Suspend cells with 5 ml of PEM bufferper 100 ml of culture.
3. Sonicate the suspension to disrupt cellswith cooling.
4. Centrifugate the homogenate at100 000g for 30 min at 4 ◦C.
5. Dissolve the pellet with 5 ml of PEMUper 100 ml of culture. 6©
6. Stand for 1 h at room temperature.
7. Centrifugate the suspension at 100 000g
for 30 min at 4 ◦C.
8. Recover the supernatant as the crudeNF-L preparation.
B. Purification of NF proteins
1. Apply the crude NF proteins or crudeNF-L to a DEAE-cellulose columnequibrated with PEMU.
2. Wash the column with 3 ∼ 5 columnvolumes of PEMU.
3. Elute the NF proteins with 5 columnvolumes of buffer with a linear gradientof NaCl from 0 to 0. 25 M. 7©
4. Collect the NF-L- or NF-M-rich frac-tions and apply it to a Mono Qanion exchanger column equibratedwith PEMU.
5. Wash the column with 5 column vol-umes of PEMU.
6. Elute the NF proteins with 10 columnvolumes of PEMU with a linear gradi-ent of NaCl from 0 to 0.5 M.
7. Collect NF-L and NF-M separately,and concentrate to 2 ∼ 3 mg/ml byCetricon-10.
C. NF assembly
The reconstitution of NF is performedby dialysis of the NF protein solution(2 ∼ 3 mg/ml) against the PEM buffercontaining 0.15 M NaCl (PEMN) at 37 ◦Cfor more than 3 h. 8© For the assemblyof filaments composed of NF-L/M or NF-L/H heteropolymers, their ratio should be2 : 1 for both NF-L/NF-M and NF-L/NF-H. Assembly of filaments can be checkedby pelleting them by centrifugation at100 000g for 30 min, followed by SDS-PAGE. For EM observation, dilute thereassembled filaments to 0.1 mg/ml andprocess them for negative staining.
II. NF assembly in SW-13/cl.2 vim− cells
SW-13/cl.2 vim− cells, established by DrR Evert (Univ. of Colorado Health Sci-ences Center, CO), were cultured in Dul-becco’s modified Eagle’s medium with10% fetal bovine serum at 37 ◦C in5% CO2. SW-13/cl.2 vim− cells can betransfected with calcium phosphate pre-cipitation or lipofection-based reagents,although the latter method is easier. We

340 IN VITRO TECHNIQUES
successfully transfected plasmids usingFugene 6 (Roche) or Lipofectamine 2000(Invitrogen) according to the manufac-ture’s instructions. The human cytomega-lovirus promoter or rous sarcoma viruspromoter can be used to express theNF proteins in the cells. Expressed NFis visualized by the general immunoflu-orescence technique. Alternatively, self-fluorescence of enhanced green fluorescentprotein (EGFP) fused to the NF proteinis also available. EGFP-linked to the N-terminal end, but not C-terminal end, ofNF subunits can assemble into filaments.Observation of NFs can be performed bya standard fluorescence microscope, butobservation by a laser scanning microscopereveals more detailed structures.
Examples of representative data areshown in Figures 6.39 and 6.40.
Notes
1© We use Pefabloc SC as a Serine-protease inhibitor in place of PMSF,because Pefabloc SC is water-solubleand is not inactivated in aqualoussolutions.
H
M
L
1 2 3 4
Figure 6.39 SDS-PAGE of NF proteins purifiedfrom bovine spinal cords and from E. coli. Lanes1–3 are NF-L, NF-M and NF-H from bovinespinal cords, respectively and lane 4 is NF-L fromE. coli
10 µm
(a) (b)
Figure 6.40 (a) A negative staining electron micrograph of NFs reassembled from porcine NF-L and(b) a laser scanning fluorescence micrograph of rat NF-L and EGFP-tagged rat NFH co-expressed inSW-13 cl.2/Vim− cells

PROTOCOL 6.35 341
2© A glass–Teflon homogenizer or juicermixer can be used, although the spinalcords are more finely homogenizedwith a polytron.
3© Filter device for ultrafiltration.
4© Rat or mouse spinal cords can be usedfor preparation of NF. Rat or mousespinal cords are easily ejected froman upper backbone by injecting waterinto the lower part of the backbone.However, the separation of NF-M andNF-L by column chromatographies isdifficult in comparison with porcineor bovine NF. If you want to use rator mouse NF-L, we recommend toexpress it in E. coli as described insection II).
5© Preparation of NF-M and NF-H fromE. coli is not recommended, althoughpurification of NF-H can be done. Notonly is their expression low, but alsoa lot of truncated forms are generatedparticularly for NF-M.
6© NF-L is obtained as a inclusion bodybut is solubilized by 6 ∼ 8 M urea.
7© NF-H is eluted earlier than NF-L andNF-M as a single band on the gel ofSDS-PAGE, but NF-L and NF-M areeluted with a overlap in the order ofNF-M and NF-L.
8© NF-L at lower concentrations (0.1mg/ml) can assemble into filamentsbut higher concentrations are better toobtain longer filaments. The extendeddialysis up to 24 h results in longerfilaments.
References
1. Pant, H. C. and Veeranna (1995) Biochem.Cell Biol., 73, 575–592.
2. Julien, J. P. and Mushynski, W. E. (1998)Prog. Nucleic Acid Res. Mol. Biol., 61, 1–23.
3. Sasaki, T., Taoka, M., Ishiguro, K.,Uchida, A., Saito, T., Isobe, T. andHisanaga, S. (2002) J. Biol. Chem., 277,36 032–36 039.
4. Julien, J. P. and Mushynski, W. E. (1983) J.Biol. Chem., 258, 4019–4025.
5. Carpenter, S. (1968) Neurology, 18, 841–851.6. Mersiyanova, I. V., Perepelov, A. V.,
Polyakov, A. V., Sitnikov, V. F., Dadali,E. L., Oparin, R. B., Petrin, A. N. andEvgrafov, O. V. (2000) Am. J. Hum. Genet.,67, 37–46.
7. De Jonghe, P., Mersivanova, I., Nelis, E.,Del Favero, J., Martin, J. J., Van Broeck-hoven, C., Evgrafov, O. and Timmerman, V.(2001) Ann. Neurol., 49, 245–249.
8. Perez-Olle, R., Leung, C. L. and Liem, R. K.(2002) J. Cell Sci., 115, 4937–4946.
9. Brownlees, J., Ackerley, S., Grierson, A. J.,Jacobsen, N. J. O., Shea, K., Anderton,B. H., Leigh, P. N., Shaw, C. E. and Miller,C. C. J. (2002) Hum. Mol. Gen., 11, 2837–2844.
10. Lavedan, C., Buchholtz, S., Nussbaum, R. L.,Albin, R. L. and Polymeropoulos, M. H.(2002) Neurosci. Lett., 322, 57–61.
11. Hisanaga, S., Gonda, Y., Inagaki, M., Ikai, A.and Hirokawa, N. (1990) Cell Regul., 1,237–248.
12. Ching, G. Y. and Liem, R. K. (1993) J. CellBiol., 122, 1323–1335.
13. Lee, M. K., Xu, Z., Wong, P. C. and Cleve-land, D. W. (1993) J. Cell Biol., 122, 1337–1350.

PROTOCOL 6.36
α-Synuclein fibril formation induced bytubulin
Kenji Ueda and Shin-ichi Hisanaga
Introduction
Human α-synuclein was originally iden-tified as the precursor protein of non-β-amyloid β component (NAC) in an amy-loid-enriched fraction from Alzheimer’sdisease brains [1]. Later, three missensemutations in the α-synuclein gene werediscovered in certain pedigrees with auto-somal-dominant familial Parkinson’s dis-ease and dementia with Lewy bod-ies. Increasing evidence suggests thatα-synuclein is a common pathogenicmolecule in several neurodegenerative dis-eases, collectively known as synucle-inopathies. α-Synuclein is a soluble neu-ronal protein of unknown function, butis the major filamentous component ofpathological inclusions in those diseasedbrains. α-Synuclein has the property offorming fibrils by itself in vitro, and muta-tions of α-synuclein accelerate the fib-ril formation [2]. Furthermore, several fac-tors are known to accelerate fibril forma-tion in vitro. It is essential to understandthe mechanism for filament formation inneurodegenerative diseases. Recently, itwas demonstrated that tubulin seeds α-synuclein fibril formation under physiolog-ical conditions [3]. Here, the proceduresfor preparing proteins and fibril formation,and the detection of fibrils are described.
Reagents
Express human α-synuclein in Escherichiacoli BL21(DE3)pLysS using an expressionvector with isopropyl-1-thio-β-D-galacto-pyranoside (IPTG) and purified by HPLCmethods [3, 4]. Briefly, a soluble frac-tion of E. coli expressing α-synucleinwas fractionated by HPLC column chro-matographies of anion exchange (DEAE5PW, TOSO, Tokyo, Japan), hydropho-bic (Phenyl TOYOPEARL, TOSO), andreversed phase (TSK-gel phenyl 5PW,TOSO) columns sequentially. From 1 l cellculture, 80 ∼ 100 mg of α-synuclein isobtained with a purity of more than 98%.1© Purified α-synuclein can be lyophilized
and stored at −80 ◦C. Microtubule proteinscan be isolated from rat or porcine brainsby two cycles of a temperature-dependentassembly and disassembly according toShelanski et al. [5]; see also Protocol 6.34.Purify tubulin from the microtubule pro-teins by phosphocellulose (Whatman P11)column chromatography [6] and store at−80 ◦C. All standard laboratory reagentsshould be of high purity and good quality.Milli Q water should be used.
Equipment
Eppendorf or other laboratory tubes

PROTOCOL 6.36 343
(a) (b)
0.4
0.3
0.2
0.1
0
0 24 48 72 96
A40
0 nn
controlsα – syn + tub
Time (h)
Figure 6.41 Fibril formation of α-synuclein in the presence of tubulin: (a) Fibril formation ofα-synuclein monitored by quasi-elastic light scattering. α-Synuclein (300 µM) in 25 µl of PBS wasincubated at 37 ◦C with 1 µM of tubulin, and 1 µl of the reaction mixture was taken and measuredits scattering at 400 nm at various times. The fibrils began to form after 6 h of incubation, and thisformation steadily increased and reached a plateau in 3 days. An open square represents four kinds ofcontrols that were completely flat. Controls: (1) 300 µM α-synuclein; (2) 1 µM tubulin; (3) 300 µMα-synuclein+1 µM BSA; (4) 300 µM BSA + 1 µM tubulin. The value represents the average of threedeterminations. (b) A negative staining electron micrograph of representative α-synuclein fibrils. Anumber of long, 10-nm-wide filaments are formed. Bar = 100 nm
37 ◦C water bath
Materials for preparation of negativelystained EM specimens (see Protocol2.4 ) Microcentrifuge
Spectrophotometer equipped with a ultra-micro amount sample cell (we usea Hitachi Gene Spec III, which hasenabled ultra-micro volume quantitativeanalysis, using as little as 1 µl)
Transmission electron microscope
Procedure
1. Thaw α-synuclein and tubulin stored at−80 ◦C quickly in a water bath andkeep them on ice. 2©
2. Add ice-cold sterilized PBS, pH 7.4 tomake 300 µM solution of α-synucleinwith 1 µM of tubulin in 25 µl.
3. Incubate at 37 ◦C without agitation for24 h (or longer, as required). Fibrilsbegin to form after 6 h of incubation.
4. Monitor fibril formation by light scat-tering at OD 400 nm using 1 µl of thereaction mixture with a Gene Spec IIIspectrophotometer. 3© 4© 5©
5. Prepare EM specimens negativelystained with 2% uranyl acetate.
6. Assess the fibril formation on specimengrids by an EM.
An example of fibril formation by α-synuclein is shown in Figure 6.41.
Notes1© Purified recombinant α-synuclein is
unstructured, heat-stable, highly solu-ble, and exists as a monomer in anaqueous solution.
2© Tubulin is an unstable protein, losingits polymerization activity upon keep-ing it on ice for long time. Tubulinshould be stored in aliquots to avoidrepeated freezing/thawing and thawedfreshly on each experimental day.

344 IN VITRO TECHNIQUES
3© Take 1 µl aliquots from the incubationmixture into an ultra-micro samplecell without agitation at the time ofmonitoring.
4© α-Synuclein can undergo self-aggre-gation under certain conditions, suchas increasing time lag, high tempera-ture, high concentration and low pH.
5© Light scattering intensity indicates thetotal mass of fibrils formed.
References
1. Ueda, K., Fukushima, H., Masliah, E., Xia, Y.,Iwai, A., Yoshimoto, M., Otero, D. A. C.,
Kondo, J., Ihara, Y. and Saitoh, T. (1993) Proc.Nat. Acad. Sci. USA, 90, 11 282–11 286.
2. Ma, Q. L., Chan, P., Yoshii, M. and Ueda, K.(2003) J. Alzheimer Dis., 5, 139–148
3. Alim, M. A., Hossain, M. S., Arima, K., Take-da, K., Izumiyama, Y., Nakamura, M., Kaji, H.,Shinoda, T., Hisanaga, S. and Ueda, K. (2002)J. Biol. Chem., 277, 2112–2117.
4. Hossain, S., Alim, A., Takeda, K., Kaji, H.,Shinoda, T. and Ueda, K. (2001) J. AlzheimerDis., 3, 577–584.
5. Shelanski, M. L., Gaskin, F. and Cantor, C. R.(1973) Proc. Nat. Acad. Sci. USA, 70, 765–768.
6. Weingarten, M. D., Lockwood, A. H., Hwo,S. Y. and Kirschner, M. W. (1975) Proc. Nat.Acad. Sci. USA, 72, 1858–1862.
PROTOCOL 6.37
Amyloid-β fibril formation in vitro
J. Robin Harris
Introduction
Fibrillogenesis of the amyloid-β pep-tide (Aβ) and inhibition of fibrillogenesisis of considerable interest for biomed-ical scientists and clinicians concernedwith the development and prevention ofAlzheimer’s disease. The Aβ peptide, pro-teolytically cleaved in vivo from the solu-ble amyloid precursor protein, exists as arange of peptide length, between 39 and 44amino acids. The 42 amino acid peptide(Aβ1−42) is believed to be the predomi-nant amyloid peptide incorporated in fibrilform within Alzheimer senile plaques [1].Although biophysical (e.g. spectroscopyand atomic force microscopy), and bio-chemical studies (e.g. thioflavin-T fluores-cence, Congo red binding) have been usedto assess Aβ fibrillogenesis [2], TEM isthe most rapid and direct procedure, andit enables comment to be made on theprogression of different oligomerization,protofibril and fibril states, and the inter-action of fibrils with other proteins andphysiological reagents such as cholesteroland sphingomyelin [3].
Reagents
Synthetic amyloid-β (Aβ) peptide (1–42)(human, mouse or rat sequence, and syn-thetic equivalents of Aβ mutants), isavailable from most biochemical sup-pliers, often as the trifluoroacetate salt.Store at −20 ◦C, or below.
Chemicals that potentiate (e.g. cholesterol,ganglioside GM1, metal ions) or inhibit(e.g. aspirin, nicotine, vitamin E) fib-rillogenesis can also be incorporatedwithin this system, as required.
All standard laboratory reagents shouldbe of high purity and good qualitydeionized water used. 1©
EquipmentIncubator (37 ◦C), with shaker
Microcentrifuge or other laboratory tubes
Microcentrifuge
Materials for preparation of negativelystained EM specimens (see Proto-col 2.4 )
Spectrometer/fluorescence spectrometer (ifbiochemical quantitation of fibrillogene-sis is required)
Access to a transmission electron micro-scope (TEM)
Procedure1. Warm the lyophilized Aβ peptide to
room temperature before opening.
2. Add ice-cold deionized water (or bufferat defined pH) to produce a ∼0.2 mM/∼1 mg/ml solution of Aβ peptide. Keepon ice.
3. Disperse and solubilize the peptide byrepeated gentle pipetting for ∼2–5 min.Remove any insoluble aggregates bycentrifugation, if necessary. 2©

346 IN VITRO TECHNIQUES
(a) (b)
Figure 6.42 Example of human Aβ1−42 peptide following 24 h incubation at 37 ◦C in the absence(a) and presence (b) of cholesterol microcrystals. Note that in (a) there is a background spread ofoligomeric Aβ particles, alongside short and longer A fibrils. In (b) all the oligomeric particles havepolymerized to generate single and clustered fibrils which also bind to the cholesterol microcrys-tals. Negatively stained with 2% uranyl acetate. The scale bars indicate 200 nm (JRH, previouslyunpublished data)
4. Aliquot the Aβ solution into severaltubes containing an equal volume con-taining differing additives. 3© 4©
5. Incubate at 37 ◦C with constant oscilla-tion for 24 h (or longer, as required).
6. Prepare EM specimens negativelystained with 2% uranyl acetate (or othersuitable negative stain [4].
7. Assess the formation of protofibrils andhelical fibrils by studying specimengrids in a TEM.
8. Aβ fibril formation can also be assessedby light microscopy/spectroscopy todetermine Congo red binding or bythioflavin-T fluorescence, both of whichindicate alpha-helix to beta-sheet con-version [2].
A representative example of Aβ1−42
fibrillogenesis is shown in Figure 6.42.
Notes
This procedure will take approximately24 h.
1© Use HPLC grade, deoxygenated water.Metal ion contamination (e.g. Cu, Zn,Fe, Al) should be avoided.
2© This will necessitate determinationof the protein concentration of thesupernatant.
3© That is, water/buffer alone, plus andappropriate concentration of a com-pound that may potentiate (cholesterol,sphingomyelin, gangliosides, multiva-lent metal ions) or inhibit Aβ fibrillo-genesis (e.g. vitamin E, Aβ fragments,apolipoprotein E4, catalase, aspirin,nicotine, Congo red and other drugs)[3, 5].
4© In view of the potentially hazardousnature of amyloid peptides and the

PROTOCOL 6.37 347
various additives or drugs used in thisprotocol, if injested, appropriate careshould be taken throughout.
References
1. Rochenstein, E., Mallory, M., Mante, M.,Sisk, A. and Masloaja, E. (2001) J. Neurosci.Res., 66, 573–582.
2. Nybo, M., Svegag, S.-E. and Nielsen, E. H.(1999) Scan. J. Immunol., 49, 219–223.
3. Harris, J. R. (2002) Micron, 33, 609–626.
4. Harris, J. R. and Scheffler, D. (2002) Micron,33, 461–480.
5. Ono, K., Hasegawa, K., Yamada, M. andNaiki, H. (2002) Biol. Psychiatry, 52, 880–886.

PROTOCOL 6.38
Soluble Aβ1–42 peptide induces tauhyperphosphorylation in vitro
Terrence Town and Jun Tan
Introduction
Alzheimer’s disease (AD) has two keypathologies: the presence of neurofibrillarytangles (NFTs) and deposition of amyloid-β peptide (Aβ) as senile plaque. NFTs arepredominately comprised of hyperphos-phorylated tau protein, assembled primar-ily in the paired helical filament (PHF)conformation [1, 2]. While the mechanisticlink between tau hyperphosphorylation andNFTs is not well understood, it is gener-ally thought that increased phosphorylationpromotes PHFs, resulting in disruption ofthe physiological role of tau in stabilizingneuronal microtubules that are necessaryfor axoplasmic flow [3]. Tau appears to behyperphosphorylated at specific epitopes(particularly in the proline-rich region thatcontains several serine/threonine-prolinemotifs) in AD brain [2].
One key question concerning tau hyper-phosphorylation is whether or not it is pro-moted by Aβ. It is now generally acceptedthat Aβ directly promotes increased levelsof intracellular Ca2+ in neurons, therebycausing neuronal injury and apoptosis [4].Recent evidence has established the sig-nalling cascade that promotes neuronalcyclin-dependent kinase 5 (Cdk5) activa-tion induced by p25, with the first eventbeing increased intracellular Ca2+ lev-els, which then promotes calpain activa-tion, which, in turn, goes on to directly
cleave p35 to p25 [5]. Excess p25 thencomplexes with Cdk5, thereby boostingits activity, an event that is associatedwith tau hyperphosphorylation at AD-specific phosphoepitopes and, not surpris-ingly, neurotoxicity [5, 6]. Further, as stud-ies of human biopsies and aged canine andprimate brains have consistently shownthat dystrophic neurites precede deposi-tion of Aβ in the formation of neuriticplaques [7–10], the putative role of sol-uble forms of Aβ peptide per se in pro-motion of tau phosphorylation is of inter-est. We have recently demonstrated that,in p35-overexpressing neuron-like cells,soluble Aβ is a potent activator of theCdk5/p25 pathway, leading AD-like tauphosphorylation in vitro [11].
Reagents
1. The p35-overexpressing N2a cell lineis required for these experiments andis available from our laboratory uponrequest. These cells are grown inEagle’s minimum essential media sup-plemented with 2 mM L-glutamine andEarle’s balanced salt solution adjustedto contain 1.5 g/l sodium bicarbon-ate, 0.1 mM non-essential amino acids,1.0 mM sodium pyruvate, 10% fetalbovine serum and 400 µg/ml of G418,and are induced to differentiate intoneuron-like cells by serum withdrawal

PROTOCOL 6.38 349
and the addition of 0.3 mM dibutyrylcAMP for 48 h.
2. To examine phospho-tau and total taulevels, the following anti-tau antibodiesare needed: AT8 (Innogenetics, Norcro-sis, GA), AT270 (Innogenetics), pS199(BioSource International, Inc. Camar-illo, CA), and pS396 (BioSource Inter-national, Inc.) against phosphorylatedforms of tau, and C-17 (Santa CruzBiotechnology, Santa Cruz, CA) againsttotal tau protein.
3. Synthetic human Aβ1–42 peptide isavailable from QCB Biosource Interna-tional (Camarillo, CA) and other sup-pliers.
4. To perform Western immunoblotting,the following reagents are needed inaddition to the above-mentioned pri-mary antibodies: buffers [cell lysisbuffer containing phosphatase and pro-tease inhibitors supplied as 10× fromNEB, Beverly, MA; Tris-buffered saline(TBS), Tris/glycine/SDS buffer, lae-mmli sample buffer, and blocking andantibody dilution buffer consisting ofTBS with 5% w/v non-fat dry milkand 0.05% Tween-20, obtained fromBio-Rad]; 10% ready gels (Bio-Rad);Hybond PVDF membranes (Bio-Rad);appropriate secondary antibodies con-jugated with horseradish peroxidase(HRP) and luminol reagent (Santa CruzBiotechnology).
5. To perform immunocytochemistry, acell permeabilizing solution of 0.05%v/v Triton X-100 diluted in completemedium described above is needed,and a phosphate-buffered saline (PBS)rinse solution, a fixing solution of4% w/v paraformaldehyde in PBS,serum-free blocking solution (Dako,Carpinteria, CA), and the LSAB +immunochemistry kit (Dako, Carpinte-ria, CA) are needed.
Equipment
Immunoblot Apparatus
Fluor-S MultiImager with Quantity Onesoftware (Bio-Rad), for densitometricanalysis of protein bands
Freezer −80 ◦C
Inverted light microscope, for tissue cul-ture observation
Light microscope, preferably with a digi-tizing camera system
Microcentrifuge tubes
Microcentrifuge, 4 ◦C
Protein gel electrophoresis system
Tissue culture CO2 incubators, for growingcell cultures
Spectrophotometer
Procedure
Preparation of Aβ1–42 peptide
Add Sigma water to human Aβ1–42 pep-tide to a concentration of 250 µM imme-diately before all experiments. This stocksolution can then be diluted to 1, 3or 5 µM in cell culture media for tauphosphorylation experiments. Based onour recent data [11], more than 95% ofthe Aβ1–42 employed in this experimen-tal paradigm (including all doses studied,under both cell-free and cell-present condi-tions) remains in soluble form throughoutthe experiments.
Cell culture conditions
1. Plate p35-overexpressing N2a cells at5 × 105 cells/well in six-well tissue cul-ture plates (for Western immunoblot-ting analysis of phospho-tau), or plateon glass coverslip inserts in six-welltissue culture plates (for immunocyto-chemistry of phospho-tau) in completemedia described above.
2. To differentiate these cells, subjectp35-overexpressing N2a cells to serum

350 IN VITRO TECHNIQUES
(a) (b)
N2a/p35 cells N2a/mock 0
0.2
0.4
0.6
0.8
1
N2a/p35 cells N2a/mock
phos
pho-
tau/
tota
l tau
rat
io Control Abeta1-42 (1 microM)Abeta1-42 (3 microM)Abeta1-42 (5 microM)Con
trol
1 micr
oM A
beta
3 micr
oM A
beta
5 micr
oM A
beta
Contro
l
1 micr
oM A
beta
3 micr
oM A
beta
5 micr
oM A
beta
-phospho-tau
-total tau
Figure 6.43 Treatment of p35-overexpressing N2a cells with Aβ1 – 42 results in increased tau phos-phorylation by Western blot. p35 or mock-transfected N2a cells were differentiated and treated witha dose range of Aβ1 – 42 (1, 3 or 5 µM Aβ) or went untreated (control) for 24 h. After incubation,phospho-tau epitopes were detected by Western blot and were normalized to total tau protein (asdetected by anti-tau antibody C-17). (a) membranes were probed with AT8 (above) or C-17 (below),and representative blots illustrate an Aβ1 – 42 dose–response relationship only in p35-transfected N2acells. (b) densitometric analysis (ratio of phospho-tau to total tau signal ±1 SEM, n = 3 for eachcondition presented) for pooled results from (A) reveals significant treatment effects of Aβ1 – 42 doseon p35-transfected N2a cells (P < 0.001) but not on mock-transfected cells (P > 0.05)
withdrawal and give 0.3 mM dibutyrylcAMP for 48 h.
3. These cells then remain untreated (as acontrol), or are treated with a dose rangeof Aβ1–42 (1, 3 or 5 µM) for 24 h.
Western immunoblotting analysis of tauhyperphosphorylation
1. Preparation of cell lysate:
(a) Wash treated N2a cells twice inthe six-well plate with ice-cold PBSand drain off the PBS.
(b) Add ice-cold lysis buffer (contain-ing 20 mM Tris, pH 7.5, 150 mMNaCl, 1 mM EDTA, 1 mM EGTA,1% Triton X-100, 2.5 mM sodiumpyrophosphate, 1 mM β-glycerol-phosphate, 1 mM Na3VO4, 1 µg/mlleupetin and 1 mM PMSF) at avolume of 0.1 ml lysis buffer per1 × 106 cells.
(c) Scrape these cells off the plate witha plastic cell scraper and transfer thelysate into a microcentrifuge tube.
Gently rock the suspension on arocker in the cold room for 15 minto lyse the cells.
(d) Centrifuge the lysate at 14 000g ina pre-cooled centrifuge (4 ◦C) for15 min. Immediately transfer thesupernatant to a fresh centrifugetube.
(e) Quantify the total protein contentof supernatants for each sampleusing the Bio-Rad protein assaykit and aliquot the sample intoseveral tubes and keep these tubesat −80 ◦C.
2. Western immunoblotting:
(a) Perform SDS-polyacrylamide gelelectrophoresis (SDS-PAGE) oncell lysates (50 µg of total proteinof each sample) and transfer elec-trophoretically to Hybond PVDFmembranes.
(b) Wash the Hybond PVDF membranetwice with dH2O and mark thetransferred side of membrane witha pencil.

PROTOCOL 6.38 351
50 µm
Figure 6.44 Increased tau phosphorylation in situ following treatment of p35-transfected N2a cellswith Aβ1 – 42. p35 or mock-transfected N2a cells were differentiated and incubated with Aβ1 – 42 (3 µM)for 24 h. Tau phosphorylation was then detected using the AT270 antibody, as indicated by the brownreaction. Bright field (upper panels) and phase contrast (lower panels) micrographs showing phos-pho-tau in p35-transfected N2a cells in the absence (right panels) or presence (left panels) of treatmentwith 3 µM of Aβ1 – 42
(c) Block the membrane in freshly pre-pared TBS containing 5% non-fatdry milk for 2 h at room tempera-ture with agitation.
(d) Apply either anti-phospho-tau(AT8, 1 : 1000; AT270, 1 : 1000;pS199, 1 : 1500; pS396, 1 : 1500) oranti-total tau (C-17, 1 : 100) anti-body diluted in fresh TBS contain-ing 5% non-fat dry milk to themembrane and incubate for 2 h atroom temperature with agitation.
(e) Wash the membrane three times for5 min each with dH2O.
(f) Incubate the membrane in the ap-propriate second antibody conju-gated with HRP for 1 h at roomtemperature with agitation.
(g) Wash the membrane five times for5 min each with dH2O.
(h) Perform detection of proteins usingthe luminol reagent.
(i) Densitometric analysis is performedfor the blots using the Fluor-S Mul-tiImager with Quantity One soft-ware, and data are represented asa ratio of phospho-tau to total tausignal (see Figure 6.43).
Immunocytochemistry
1. Culture N2a cells at 5 × 10⁵ cells/wellon glass coverslips in six-well tis-sue culture plates and differentiate asdescribed above. Twenty-four hoursafter treatment with a dose rangeof Aβ1–42 as described above, fix

352 IN VITRO TECHNIQUES
these cultured cells with ice-cold 4%paraformaldehyde in PBS (0.1 M, pH7.4) for 10 min at 4 ◦C, and then perme-abilize in 0.05% Triton X-100 diluted incomplete medium.
2. After three rinses with ice-cold PBS,treat these cultured cells with endoge-nous peroxidase quenching (0.3% H2
O2) and pre-block with serum-free pro-tein blocking solution prior to primaryantibody incubation.
3. Apply an anti-phospho-tau mouse mon-oclonal antibody (AT270, 1 : 100 dilu-tion) to these cells overnight at 4 ◦C.
4. Perform immunocytochemistry usingthe LSAB + kit (utilizing an HRP-conjugated diaminobenzidine chromo-gen system).
5. Record morphology and phospho-tauimmunoreactivity in these cells bybrightfield microscopic examination,using a light microscope (see Fig-ure 6.44).
References
1. Grundke-Iqbal, I., Iqbal, K., Tung, Y. C.,Quinlan, M., Wisniewski, H. M. and Binder,L. I. (1986) Abnormal phosphorylation of
the microtubule-associated protein tau (tau) inAlzheimer cytoskeletal pathology. Proc. Nat.Acad. Sci. USA, 83, 4913–4917.
2. Friedhoff, P., von Bergen, M., Mandelkow,E. M. and Mandelkow, E. (2000) Structureof tau protein and assembly into pairedhelical filaments. Biochem. Biophys. Acta,1502, 122–132.
3. Drubin, D. G. and Kirschner, M. W. (1986)Tau protein function in living cells. J CellBiol., 103, 2739–2746.
4. Mattson, M. P., Cheng, B., Davis, D., Bry-ant, K., Lieberburg, I. and Rydel, R. E.(1992) β-amyloid peptides destabilize cal-cium homeostasis and render human corticalneurons vulnerable to excitotoxicity. J. Neu-rosci., 12, 376–389.
5. Lee, M. S., Kwon, Y. T., Li, M., Peng, J.,Friedlander, R. M. and Tsai, L. H. (2000)Neurotoxicity induces cleavage of p35 to p25by calpain. Nature, 405, 360–364.
6. Patrick, G. N., Zukerburg, L., Nikolic, M.,de la Monte, S., Dikkes, P. and Tsai, L. H.(1999) Conversion of p35 to p25 deregulatesCdk5 activity and promotes neurodegenera-tion. Nature, 402, 615–622.
7. Terry, R. D. and Wisniewski, H. M. (1970)The ultrastructure of the neurofibrillary tan-gle and the senile plaque. In: CIBA Founda-tional Symposium on Alzheimer’s Disease andRelated Conditions (G. E. W. Wolstenholmeand M. O’Connor, eds), pp. 145–168. J&HChurchill, London.
8. Wisniewski, H. M., Johnson, A. B., Raine,C. S., Kay, W. J. and Terry, R. D. (1970)Senile plaques and cerebral amyloidosis inaged dogs. A histochemical and ultrastruc-tural study. Lab. Invest., 23, 287–296.
9. Wisniewski, H. M., Ghetti, B. and Terry, R.D. (1973) Neuritic (senile) plaques and fila-mentous changes in aged rhesus monkeys. J.Neuropath. Exp. Neurol., 32, 566–584.
10. Martin, L. J., Pardo, C. A., Cork, L. C. andPrice, D. L. (1994) Synaptic pathology andglial responses to neuronal injury precedethe formation of senile plaques and amyloiddeposits in the aging cerebral cortex. Am. J.Pathol., 145, 1358–1381.
11. Town, T., Zolton, J., Shaffner, R., Schnell, B.,Crescentini, R., Wu, Y., Zeng, J., DelleDonne, A., Obregon, D., Tan, J. and Mul-lan, M. (2002) p35/Cdk5 pathway mediatessoluble amyloid-β-peptide-induced tau phos-phorylation in vitro. J. Neurosci. Res., 69,362–372.

PROTOCOL 6.39
Anti-sense peptides
Nathaniel G. N. Milton
Introduction
Anti-sense peptide sequences are derivedfrom the complementary strand of DNAencoding a given protein, read in the sameopen reading frame. The complementarystrand DNA for each individual amino acidcan be read in either the forward 3′-5′ orreverse 5′-3′ direction, adding degeneracy tothe potential anti-sense peptide sequences.For a given peptide sequence it is possi-ble to derive two anti-sense peptides fromthe DNA sequence. These sequences canthen be used for synthesis of binding pep-tides and for screening databases for pro-teins with sequence similarity, which mayact as binding proteins. Studies have shownthat such anti-sense peptides bind with highaffinity to the given protein and that theycan also have sequence similarity to proteinbinding domains including receptor bindingsites [1, 2]. Anti-sense peptide sequencescan also be derived directly from the aminoacid sequence of a protein, via reverse trans-lation to produce a complementary DNA se-quence. However, due to the degeneracy ofthe genetic code, there is typically more thanone anti-sense sequence for any one proteinsequence. The binding interactions betweensense and anti-sense encoded peptides aremediated via hydropathic interactions [1].Hydropathy profiles can also be used to de-rive anti-sense binding peptides [3].
The availability of vast protein andnucleotide sequence databases can be usedboth to derive anti-sense peptides and for
sequence comparisons to identify poten-tial protein–protein interactions. The sim-plicity of the anti-sense peptide sequencederivation plus availability of powerfulsequence comparison programs to screenthese databases makes this technique acheap and rapid method for identifica-tion of potential protein–protein inter-actions, which can then form the basisfor experimental studies. The use of thistechnique has been applied to identifynovel Alzheimer’s amyloid-ß peptide (Aß)binding proteins [4–6] and to characterizebinding domains within known Aß bind-ing proteins [7]. Such techniques are appli-cable to any protein or peptide and theresultant anti-sense sequences or proteinbinding domains can also be used in a sim-ilar manner to antibodies.
Reagents
Synthetic anti-sense peptides can be cus-tom synthesized commercially or producedin-house. Biotin labelling of proteins canbe carried out using commercially avail-able kits [7]. Antibodies to target proteinscan be obtained commercially or raised inhouse. Standard laboratory reagents shouldbe of high purity and good quality deion-ized water used.
Equipment
Computer (PC or Macintosh) with accessto Internet and Microsoft Word

354 IN VITRO TECHNIQUES
ELISA plate reader with filters for absorb-ance at 405 and 450 nm
ELISA plate washer
Eppendorf or other laboratory tubes
Microtiter plates – NUNC Polysorb orMaxisorb for binding assays
Procedures
A. Derivation of anti-sense peptidesequences
The following method makes use of theGenbank nucleotide database available onthe National Centre for Biotechnology In-formation website (http://www.ncbi.nlm.nih.gov/Entrez).
1. Access http://www.ncbi.nlm.nih.gov/Entrez website and perform a nucleotidesequence search for the protein beinginvestigated. Copy the DNA sequenceand paste into a Microsoft Word doc-ument. Delete all non-coding sectionsof DNA sequence to leave the cod-ing sequence of interest. The resultantDNA sequence, typically starting withatg, should be converted to FASTA for-mat by deletion of all spaces and num-bers – use Microsoft Word Find andReplace options in the Edit toolbar.Alternatively a FASTA format DNAcoding sequence can be imported fromanother source.
2. Convert the FASTA format sequenceinto a ‘coding sequence’ by insertionof spaces every three digits. This canbe done using Find and Replace inMicrosoft Word. In the Find Whatsection, select ‘Any Letter’ three times.In the Replace With section select,‘Find What Text’ followed by a singlespace. The resultant ‘coding sequence’should be in the format ‘atg gtc cag’.Save resultant ‘coding sequence’ textfile.
3. Make a duplicate file of the coding se-quence and convert each nucleotide trip-licate to a 5′ to 3′ anti-sense amino acidbased on Table 6.2 using Find and Re-place. Where the anti-sense amino acidis a stop codon, replace the DNA tripletwith X. Save the resultant 5′ to 3′ anti-sense peptide text file.
4. Make a duplicate file of the coding se-quence and convert each nucleotide trip-licate to a 3′ to 5′ anti-sense amino acidbased on Table 6.2 using Find and Re-place. Where the anti-sense amino acidis a stop codon, replace the DNA tripletwith X. Save the resultant 3′ to 5′ anti-sense peptide text file.
B. Comparison of anti-sense peptidesequences with known proteins
The following methods make use of theBLAST program for sequence comparisonwith protein databases [8] available on theNational Centre for Biotechnology Infor-mation website (http://www.ncbi.nlm.nih.gov/BLAST). Alternative sequence data-bases and comparison programs are avail-able or can be obtained commercially.Protein binding can occur in both par-allel and anti-parallel orientations. TheBLAST search is restricted to compar-isons of sequences in a parallel man-ner since it compares N to C terminallyentered sequences. To overcome this prob-lem it is possible to enter anti-sense peptidesequences in the C to N terminus orienta-tion and perform BLAST searches. There-fore, four potential anti-sense sequencecomparisons can be carried out.
1. Access the BLAST program on the In-ternet at http//www.ncbi.nlm.nih.gov/BLAST.
2. Select Protein BLAST.
3. Then select Search for short nearlyexact matches. This search uses aPAM30 matrix with Gap Costs of

PROTOCOL 6.39 355
Table 6.2 Identification of an alternative anti-sense amino acid that wouldrecognize the respective sense amino acid
Aminoacid
CodingDNA(5′-3′)
Anti-senseDNA(3′-5′)
Anti-sense5′-3′
direction
Amino acid3′-5′
direction
Ala (A) GCA CGT Cys (C) Arg (R)GCC CGG Gly (G) Arg (R)GCG CGC Arg (R) Arg (R)GCT CGA Ser (S) Arg (R)
Arg (R) AGA TCT Ser (S) Ser (S)AGG TCC Pro (P) Ser (S)CGA GCT Ser (S) Ala (A)CGC GCG Ala (A) Ala (A)CGG GCC Pro (P) Ala (A)CGT GCA Thr (T) Ala (A)
Asn (N) AAC TTG Val (V) Leu (L)AAT TTA Ile (I) Leu (L)
Asp (D) GAC CTG Val (V) Leu (L)GAT CTA Ile (I) Leu (L)
Cys (C) TGC ACG Ala (A) Thr (T)TGT ACA Thr (T) Thr (T)
Glu (E) GAA CTT Phe (F) Leu (L)GAG CTC Leu (L) Leu (L)
Gln (Q) CAA GTT Leu (L) Val (V)CAG GTC Leu (L) Val (V)
Gly (G) GGA CCT Ser (S) Pro (P)GGC CCG Ala (A) Pro (P)GGG CCC Pro (P) Pro (P)GGT CCA Thr (T) Pro (P)
His (H) CAC GTG Val (V) Val (V)CAT GTA Met (M) Val (V)
Ile (I) ATA TAT Tyr (Y) Tyr (Y)ATC TAG Asp (D) Stop (X)ATT TAA Asn (N) Stop (X)
Leu (L) CTA GAT Stop (X) Asp (D)CTC GAG Glu (E) Glu (E)CTG GAC Gln (Q) Asp (D)CTT GAA Lys (K) Glu (E)TTA AAT Stop (X) Asn (N)TTG AAC Gln (Q) Asn (N)
Lys (K) AAA TTT Phe (F) Phe (F)AAG TTC Leu (L) Phe (F)
Met (M) ATG TAC His (H) Tyr (Y)Phe (F) TTC AAG Glu (E) Lys (K)
TTT AAA Lys (K) Lys (K)Pro (P) CCA GGT Trp (W) Gly (G)
CCC GGG Gly (G) Gly (G)CCG GGC Arg (R) Gly (G)CCT GGA Arg (R) Gly (G)
(continued overleaf )

356 IN VITRO TECHNIQUES
Table 6.2 (continued )
Aminoacid
CodingDNA(5′-3′)
Anti-senseDNA(3′-5′)
Anti-sense5′-3′
direction
Amino acid3′-5′
direction
Ser (S) TCA AGT Stop (X) Ser (S)TCC AGG Gly (G) Arg (R)TCG AGC Arg (R) Ser (S)TCT AGA Arg (R) Arg (R)AGC TCG Ala (A) Ser (S)AGT TCA Thr (T) Ser (S)
Thr (T) ACA TGT Cys (C) Cys (C)ACC TGG Gly (G) Trp (W)ACG TGC Arg (R) Cys (C)ACT TGA Ser (S) Stop (X)
Trp (W) TGG ACC Pro (P) Thr (T)Tyr (Y) TAC ATG Val (V) Met (M)
TAT ATA Ile (I) Ile (I)Val (V) GTA CAT Tyr (Y) His (H)
GTC CAG Asp (D) Gln (Q)GTG CAC His (H) His (H)GTT CAA Asn (N) Gln (Q)
9 for Existence and 1 for Exten-sion. The Expect is set to 20 000.A Standard protein–protein BLAST[blastp] which uses the BLOSUM62matrix with Gap Costs of 11 for Exis-tence and 1 for Extension can also beused. For a Standard protein–proteinBLAST [blastp] the Expect (statisti-cal significance threshold for reportingmatches against database sequences)can be reset to 100 or greater toaccount for the use of short peptidesequences in the search and increasethe number of hits.
4. Alignments of peptides of <5 aminoacids are considered non-significant un-der these conditions.
5. Sequences containing significant gaps(>10%) should also not be used sincehydropathic binding interactions re-quire a direct alignment between eachsense protein residue and its comple-mentary anti-sense peptide or bindingdomain residue.
6. The sequence information obtainedwithin a BLAST search can be printed,copied and stored as required.
7. Using the options section it is possibleto limit searches to sequences fromdifferent databases and select thespecies to be searched.
8. Within the BLAST search resultsaccess to the aligned sequences is alsoavailable and from this informationabout proteins interacting with thetarget protein can be obtained.
9. If a specific protein is known to bindthe target protein a Pairwise BLASTwith selection of BLAST 2 sequencescan be performed. Select BLAST 2sequences and the blastp (protein)comparison. Either the BLOSUM62matrix with Gap Costs of 11 forExistence and 1 for Extension or thePAM30 matrix with Gap Costs of 9 forExistence and 1 for Extension can beselected.

PROTOCOL 6.39 357
10. The Expect (statistical significancethreshold for reporting matches againstdatabase sequences) should be reset to100 or greater to account for the use ofshort peptide sequences in the searchand increase the number of hits.
11. Enter the anti-sense peptide sequenceas sequence 1 and the interacting pro-tein sequence as sequence 2. The inter-acting protein sequence identificationeither as a protein accession numberor GI number can be entered ratherthan the full FASTA format proteinsequence.
Choice of anti-sense peptide for synthesis
Anti-sense peptides can be synthesizedbased on the sequences obtained inProcedure A above. A good discussionof the choice of anti-sense peptideto synthesize is included in Bost andBlalock [1]. Regions of binding proteinsidentified in Procedure B can also besynthesized. Shorter anti-sense peptideswill show less specificity, in general a10-amino-acid peptide will be sufficient.The results from the comparison of anti-sense sequences with known proteins willhelp in determining the peptide to besynthesized and should help in decidingwhether to use the 3′ to 5′ or 5′ to 3′anti-sense peptide sequences. Informationon structural features of a protein isparticularly useful and a simple computerprogram to predict protein secondarycharacteristics is available [9]. If thesequence of interest contains an X, i.e.the non-coding DNA strand encodes astop codon, then an alternative aminoacid must be substituted. From Table6.2 an alternative anti-sense amino acidthat would recognize the respective senseamino acid can be identified. Where thereis a choice then information from theBLAST comparisons may be of use and
an amino acid substitution could use aresidue found in a protein with sequencesimilarity. The use of N or C terminalCys residues to allow chemical linkageto carrier proteins, agarose or biotinlabels should be considered. N-terminalacetylation and C terminal amidation canalso be considered [1].
C. Direct binding of anti-sense peptides totarget proteins
For this assay either a biotin labelled formof the target protein or an antibody specificfor the target protein is required.
1. A 500 ml solution of carbonate buffercontaining 15 mM Na2CO3, 35 mMNaHCO3, 0.01% NaN3 (w/v) pH 9.6should be prepared (can be stored for<14 days at 4 ◦C).
2. Anti-sense peptides (1 µg/ml) shouldbe prepared in carbonate buffer (10 ml/plate).
3. To each of the inner 60 wellson a NUNC Polysorb or Maxisorb96-well ELISA plate add 100 µlof anti-sense peptide solution orcarbonate buffer (for control non-specific binding determination). Coverplates with plate sealer (NUNC).Incubate plates at 4 ◦C overnight.
4. Remove plate sealer and wash platesthree times with carbonate buffer(200 µl/well).
5. Prepare a 0.2% casein solution incarbonate buffer (20 ml/plate) and add200 µl/well to each well. Incubateplates at room temperature for 1 h.
6. Prepare a 1 l solution of assay buff-er containing 50 mM Tris-HCl, 0.01%NaN3 (w/v), 0.1% BSA (CohnsFraction V) (w/v), 0.1% Triton X-100(v/v) pH 7.5.

358 IN VITRO TECHNIQUES
7. Wash plates three times with assaybuffer (200 µl/well).
8. Prepare a 5× stock solution of targetprotein (either biotin labelled or unla-belled as available) in assay buffer foraddition to plates in the presence ofcompeting anti-sense peptides or testcompounds. Prepare competing anti-sense peptides and test compounds inassay buffer in polypropylene tubes at5× required test concentration.
9. Prepare tubes containing target proteinplus competing anti-sense peptides ortest compounds and add 100 µl/wellto coated ELISA plates. Incubate over-night at 4 ◦C.
10. Wash plates three times with 200 µl/well assay buffer.
11. For biotin labelled target proteinsprepare alkaline phosphatase polymer-streptavidin conjugate (1 : 1000 dilu-tion of stock solution) in assay buffer.Add 100 µl/well to ELISA plates andincubate at 37 ◦C for 2 hs. Go to step15.
12. For unlabelled target proteins prepareantibody at an appropriate dilution inassay buffer. Add 100 µl/well to ELISAplates and incubate at 37 ◦C for 2 h.
13. Wash plates three times with 200 µl/well assay buffer.
14. Add 100 µl/well appropriate anti-IgG-alkaline phosphatase conjugate(1 : 2000 dilution of neat conjugate inassay buffer) and incubate for 2 h atroom temperature.
15. Wash plates three times with 200 µl/well assay buffer.
16. Prepare substrate containing 2.7 mMp-nitrophenylphosphate, 10 mM di-ethanolamine, 0.5 mM MgCl2 pH9.8. Add 100 µl/well and allow
sufficient colour development. Colourdevelopment can be stopped byaddition of 50 µl/well 3 M NaOH ifrequired.
17. Read absorbance at 405 nm using anELISA plate reader.
References
1. Bost, K. L. and Blalock, J. E. (1989) Prepara-tion and use of complementary peptides. Meth-ods Enzymol., 168, 16–28.
2. Heal, J. R., Roberts, G. W., Raynes, J. G.,Bhakoo, A. and Miller, A. D. (2002) Specificinteractions between sense and complementarypeptides: the basis for the proteomic code.ChemBioChem., 3, 136–151.
3. Villain, M., Jackson, P. L., Manion, M. K.,Dong, W. J., Su, Z., Fassina, G., Johnson,T. M,. Sakai, T. T., Krishna, N. R. and Bla-lock, J. E. (2000) De novo design of peptidestargeted to the EF hands of calmodulin. J. Biol.Chem., 275, 2676–2685.
4. Milton, N. G. N. (2001) Phosphorylation ofamyloid-ß at the serine 26 residue by humancdc2 kinase. NeuroReport, 12, 3839–3844.
5. Heal, J. R., Roberts, G. W., Christie, G. andMiller, A. D. (2002) Inhibition of ß-amyloidaggregation and neurotoxicity by complemen-tary (antisense) peptides. ChemBioChem 3,86–92.
6. Milton, N. G. N. (2002) Peptides for use inthe treatment of Alzheimer’s disease. PatentPublication, WO 02/36614 A2.
7. Milton, N. G. N., Mayor, N. P. and Rawlin-son, J. (2001) Identification of amyloid-ß bind-ing sites using an antisense peptide approach.NeuroReport, 12, 2561–2566.
8. Altschul, S. F., Madden T. L., Alejandro A.Schaeffer, A. A., Zhang, J., Zhang, Z., Mil-ler, W. and Lipman D. J. (1997) GappedBLAST and PSI-BLAST: a new generationof protein database search programs. NucleicAcids Res., 25, 3389–3402.
9. Krchnak, V., Mach, O. and Maly, A. (1989)Computer prediction of B-cell determinantsfrom protein amino acid sequences based onincidence of beta turns. Methods Enzymol.,178, 586–611.

PROTOCOL 6.40
Interactions between amyloid-ß and enzymes
Nathaniel G. N. Milton
Introduction
The neurotoxicity of the amyloid-ß peptide(Aß) is thought to be of major importancein the pathology of Alzheimer’s disease [1]and compounds that prevent Aß neuro-toxicity have therapeutic potential. TheAß peptide also interacts with a range ofenzymes including catalase [2] and cyclin-dependent kinase-1 (CDK-1) [3]. Catalaseenzyme activity is inhibited by Aß [2] andCDK-1 activity enhanced [3] allowing theuse of these enzymes in functional bioas-says to identify compounds that preventactions of Aß. The binding characteris-tics of these enzymes [4, 5] can be used toidentify compounds that interact with dif-ferent regions of Aß and provide a methodfor rapid screening to identify Aß bind-ing compounds. Microtiter plate bindingand functional enzyme activity assays arerapid methods for identifying compoundsthat interact with Aß prior to screeningfor ability to influence Aß neurotoxicity.Compounds identified using these meth-ods can be further screened for effects onAß fibrillogenesis (see Protocol 6.38), Aßphosphorylation (see Protocol 6.42) or Aßneurotoxicity (see Protocol 6.42).
Reagents
Synthetic Aß peptides (commerciallyavailable)
N-terminal Biotin labelled Aß 1–40 andAß 25–35 (commercially available)
Biotinylated H1 peptide (PKTPKKAKKL)available from Promega
Control peptides should be unrelated to Aßor scrambled sequence variants of Aß.
The reverse Aß 40-1 peptide interactswith the catalase Aß binding domain(Human catalase residues 400–409) andshould not be used in binding assaysor catalase inhibition assays. Purifiedor recombinant enzyme preparations arereadily available commercially.
Anti-phosphoserine and phosphothreonineantibodies, secondary antibody alkalinephosphatase and HRP conjugates andTMB substrate systems are all com-mercially available. For enzyme activityassays preparations with known activ-ity are required and should be stored at−70 ◦C; 30% hydrogen peroxide solu-tions are readily available.
The [γ32P]-ATP with a specific activityof 3000 Ci/mmol 10 µCi/µl is commer-cially available and fresh batches shouldbe obtained just prior to carrying outProcedure D (see below).
A liquid scintillation cocktail for non-aqueous samples is required; the choiceshould be appropriate for the labora-tory disposal regulations and ß-counteravailable. All other standard laboratoryreagents should be of high purity andgood quality deionized water used.

360 IN VITRO TECHNIQUES
Equipment
β-Counter
ELISA plate reader with filters for absorb-ance at 405 and 450 nm
ELISA plate washer
Eppendorf or other laboratory tubes
Freezer, −70 ◦C
Glass tubes
Incubator, 37 ◦C
Microtiter plates – NUNC Polysorb orMaxisorb for binding assays
Microcentrifuge
Nitrogen gas supply
Scintillation tubes
Sonicator
Procedures
A. Preparation of unaggregated Aß
For Aß binding and enzyme activity bioas-says monomeric unaggregated Aß peptideis required and the peptide should be pre-pared as follows. This method can be usedfor all Aß forms, including N-terminallybiotinylated derivatives, and should also beused for appropriate control peptides.
1. Lyophilized Aß peptide should be resus-pended in neat HPLC grade trifluo-roacetic acid to produce a 1 mg/mlsolution in a glass tube.
2. Sonicate the resuspended peptide for15 min at 24 ◦C and if not com-pletely dissolved add further trifluo-roacetic acid.
3. Remove trifluoroacetic acid under astream of nitrogen.
4. Resuspend peptide in hexafluoroiso-propanol.
5. Remove hexafluoroisopropanol under astream of nitrogen.
6. Repeat steps 4 and 5 two further times.
7. For storage resuspend peptide in hex-afluoroisopropanol, aliquot into poly-propylene tubes, remove hexafluoroiso-propanol under a stream of nitrogen andstore tubes at −70 ◦C.
8. Resuspend dried down peptide in appro-priate buffer prior to use in binding andenzyme activity assays.
B. Binding of Aß to catalase and CDK-1
For Aß binding assays purified or recombi-nant enzyme preparations can be used. AllAß peptides should be prepared as above.
1. A 500 ml solution of carbonate buffercontaining 15 mM Na2CO3, 35 mMNaHCO3, 0.01% NaN3 (w/v), pH 9.6should be prepared (can be stored for<14 days at 4 ◦C).
2. Catalase or CDK-1 (1 µg/ml) shouldbe prepared in carbonate buffer (10 ml/plate).
3. To each of the inner 60 wells ona NUNC Polysorb or Maxisorb 96-well ELISA plate add 100 µl ofenzyme solution or carbonate buffer(for control non-specific binding deter-mination). Cover plates with platesealer (NUNC). Incubate plates at4 ◦C overnight.
4. Remove plate sealer and wash platesthree times with carbonate buffer(200 µl/well).
5. Prepare a 0.2% casein solution incarbonate buffer (20 ml/plate) and add200 µl/well to each well. Incubateplates at room temperature for 1 h.
6. Prepare a 1 l solution of assay buffercontaining 50 mM Tris-HCl, 0.01%NaN3 (w/v), 0.1% BSA (Cohns Frac-tion V) (w/v), 0.1% Triton X-100(v/v), pH 7.5.

PROTOCOL 6.40 361
7. Wash plates three times with assaybuffer (200 µl/well).
8. Prepare a 1 nM solution of biotiny-lated Aß peptide in assay buffer. Thisis a 5× stock for addition to platesin the presence of test compoundand competing unlabelled Aß pep-tides. Prepare unlabelled Aß peptidesand test compounds in assay bufferin polypropylene tubes at 5× requiredtest concentration.
9. Prepare tubes containing biotinylatedAß, competing peptides and test com-pounds and assay buffer to give afinal 1× solution. Add 100 µl/well tocoated ELISA plates and incubate at37 ◦C for 4 h.
10. Wash plates three times with assaybuffer (200 µl/well).
11. Prepare alkaline phosphatase polymer-streptavidin conjugate (dilute stocksolution to 0.5 µg/ml) in assay buffer.Add 100 µl/well to ELISA plates andincubate at 37 ◦C for 2 h.
12. Wash plates three times with assaybuffer (200 µl/well).
13. Prepare substrate containing 2.7 mMp-nitrophenylphosphate, 10 mM di-ethanolamine, 0.5 mM MgCl2, pH 9.8.Add 100 µl/well and allow sufficientcolour development. Colour develop-ment can be stopped by addition of50 µl/well 3 M NaOH if required.
14. Read absorbance at 405 nm using anELISA plate reader.
C. Inhibition of catalase activity bioassayfor Aß
Catalase EC 1.11.1.6 from human erythro-cytes has been used for the developmentof this bioassay for Aß [2]. Purified cata-lase from other sources and immunoprecip-itated catalase can also be used. If catalase
from another source is used an Aß bind-ing assay (Procedure B) should be carriedout initially to confirm the presence of anAß binding domain. It is essential to usemonomeric Aß preparations as describedabove since aggregated material shows areduced ability to inhibit catalase activ-ity [2]. Many compounds and buffer com-ponents can influence catalase activity andall assays should include controls to ensurethat only a direct action on Aß inducedcatalase inhibition is being observed. Thecatalase inhibitor 3-amino-triazole is a use-ful control material that acts via a similarmechanism to Aß [2, 6].
1. Prepare a 32.4 mM solution of ammo-nium molybdate (20 g/500 ml) andmix on a heated stirrer until a clearsolution is obtained. This solution isstable for <14 days and can be storedat room temperature.
2. Freshly prepare a 100 mM phosphatebuffer containing 88 mM Na2HPO4,12 mM NaH2PO4, pH 7.4.
3. Prepare a 5% marvel solution in phos-phate buffer (20 ml/plate) and add200 µl/well to each well of a 96-wellmicrotiter plate. Incubate at 37 ◦C for1 h.
4. Wash plates three times with phos-phate buffer (200 µl/well).
5. Prepare a 100 U/ml solution of cata-lase in phosphate buffer in a polypro-pylene tube. In 1.5 ml microcentrifugetubes prepare dilutions of this topstandard to give solutions of 50, 25,12.5, 6.25, 3.13 and 1.56 U/ml. Alsoprepare a 50 U/ml solution for incuba-tion with Aß and test compounds.
6. Prepare Aß peptides (10 µM stock)and test compounds in phosphatebuffer.
7. Add Aß and test compounds to bufferto give a final Aß concentration of

362 IN VITRO TECHNIQUES
4 µM in 1.5 ml microcentrifuge tubes.Add 10 µl of each test solution or10 µl phosphate buffer for controlsand standards to wells of a 96-wellmicrotiter plate.
8. Add 10 µl of 50 U/ml catalase solu-tion to each test well and 10 µl ofstandards to appropriate wells. Add30 µl phosphate buffer to each welland incubate at 37 ◦C for 1 h.
9. Prepare substrate solution containing15 µl (6.5 µmol) H2O2 in phosphatebuffer.
10. Add 50 µl/well substrate to each wellof the microtiter plate using a multi-channel pipette, wait 60 s and thenadd 100 µl/well 32.4 mM solution ofammonium molybdate. It is essentialthat the timing of the additions to eachwell is consistent so that the enzymeis exposed to H2O2 for the same time(60 s) in all wells.
11. Read absorbance at 405 nm using anELISA plate reader.
12. Calculate enzyme activity in each testwell from the standard curve.
D. Activation of CDK-1 bioassay foramyloid-ß
CDK-1 activity is dependent on its phos-phorylation state and requires the presenceof a cyclin component [3, 4]. RecombinantCDK-1/Cyclin-B1 preparations which arebiologically active are available. Alterna-tively active CDK-1 can be immunoprecip-itated from cell lysates. An ELISA-basedprotocol for determination of CDK-1 phos-phorylation of either Histone H1 or CSH103 peptide substrates can be used forcomparison.
1. Prepare a Tris assay buffer contain-ing 50 mM Tris-HCl, 10 mM MgCl2,
1 mM EGTA, 2 mM DTT, 40 mM ß-glycerophosphate, 20 mM p-nitrophe-nylphosphate, 0.1 mM sodium vana-date, 50 µM ATP, pH 7.4.
2. Biotinylated H1 peptide (PKTPKKA-KKL) is used as substrate at a finalconcentration of 25 µM. Prepare astock of 125 µM peptide in Tris assaybuffer.
3. Test compounds and Aß peptidesshould be prepared in Tris assay bufferat 5× final concentration.
4. Prepare a 5× stock of [γ32P]-ATP(with a specific activity of 3000 Ci/mmol) in Tris assay buffer.
5. Prepare a 200 U/ml solution of CDK-1/Cyclin-B1 in Tris assay buffer.
6. In 1.5 ml polypropylene tubes add5 µl substrate, 5 µl test compounds,5 µl [γ32P]-ATP and 5 µl Aß orcontrol peptide. Mix well and thenadd 5 µ1/tube of CDK-1/Cyclin-B1solution. Incubate for 10 min at 30 ◦Cin a shaking water bath.
7. Prepare a 7.5 M guanidine HCl solu-tion.
8. At the end of the incubation timeadd 12.5 µl guanidine HCl solution toeach tube to terminate the reaction.
9. Spot a 15 µl aliquot of each sam-ple onto a SAM2 streptavidin mem-brane (Promega, UK) to isolate thebiotinylated substrate.
10. Wash the membrane four times in 2M NaCl.
11. Wash the membrane four times in 2 MNaCl containing 1% (v/v) H3PO4.
12. Wash the membrane twice in deion-ized H2O.
13. Cut out spots from membrane andplace in scintillation tubes.

PROTOCOL 6.40 363
14. Add an appropriate liquid scintillationcocktail suitable for non-aqueous sam-ples and measure the radioactivity of[γ32P] incorporated into the biotiny-lated substrate.
15. The enzyme activity of each sampleshould be determined from a standardcurve.
E. ELISA-based activation of CDK-1bioassay for amyloid-ß
1. For ELISA-based assay use carbon-ate buffer (Procedure B, step 1, above)to prepare 1 µg/ml solutions of eitherHistone H1 or CSH 103 peptide sub-strates. Coat and block ELISA platesas described in Procedure B, steps3–5 (above).
2. Prepare an assay buffer containing50 mM Tris-HCl, 10 mM MgCl2,1 mM EGTA, 2 mM DTT, 40 mM ß-glycerophosphate, 20 mM p-nitrophe-nylphosphate, 0.1 mM sodium vana-date, pH 7.4.
3. Prepare 250 µM ATP in assay buffer.
4. Test compounds and Aß peptidesshould be prepared in assay buffer at5× final concentration.
5. Prepare a 200 U/ml solution of CDK-1/Cyclin-B1 in assay buffer.
6. To each well of a substrate coatedELISA plate add 20 µl ATP, 20 µltest compounds and 20 µl Aß peptidesand 20 µl assay buffer and then add20 µ1/well of CDK-1/Cyclin-B1 solu-tion. Incubate for 60 min at 30 ◦C.
7. Wash plates three times with 200 µl/well 50 mM Tris-HCl containing 0.1%Triton X-100, pH 7.5.
8. Add 100 µl/well anti-phosphoserineor anti-phosphothreonine antiserum(1 : 2500 dilution of neat antibody) andincubate for 2 h at room temperature.
9. Wash plates three times with 200 µl/well 50 mM Tris-HCl containing 0.1%Triton X-100, pH 7.5.
10. Add 100 µl/well anti-rabbit IgG-HRPconjugate (1 : 2000 dilution of neatconjugate) and incubate for 2 h atroom temperature.
11. Wash plates three times with 200 µl/well 50 mM Tris-HCl containing 0.1%Triton X-100, pH 7.5.
12. Add 100 µl/well TMB substrate. Aftersufficient colour development add50 µl/well 1 M phosphoric acid andmeasure absorbance at 450 nm usingan ELISA plate reader.
References
1. Selkoe, D. J. (1999) Translating cell biologyinto therapeutic advances in Alzheimer’s dis-ease, Nature, 399 (Suppl.), A23–A31.
2. Milton, N. G. N. (1999) Amyloid-ß binds cata-lase with high affinity and inhibits hydro-gen peroxide breakdown. Biochem. J., 344,293–296.
3. Milton, N. G. N. (2002) The amyloid-ß pep-tide binds to cyclin B1 and increases humancyclin-dependent kinase-1 activity. Neurosci.Lett., 322, 131–133.
4. Milton, N. G. N. (2001) Phosphorylation ofamyloid-ß at the serine 26 residue by humancdc2 kinase. NeuroReport, 12, 3839–3844.
5. Milton, N. G. N., Mayor, N. P. and Rawlin-son, J. (2001) Identification of amyloid-ß bind-ing sites using an antisense peptide approach.NeuroReport, 12, 2561–2566.
6. Milton, N. G. N. (2001) Inhibition of catalaseactivity with 3-amino-triazole enhances thecytotoxicity of the Alzheimer’s amyloid-ßpeptide. NeuroToxicology, 22, 767–774.
PROTOCOL 6.41
Amyloid-ß phosphorylation
Nathaniel G. N. Milton
Introduction
Phosphorylation of the amyloid-ß peptide(Aß) is thought to be of major importancein the neurotoxicity of the Aß peptide [1].The cyclin-dependent kinase-1 (CDK-1)enzyme is able to phosphorylate the Aßpeptide at the serine 26 residue. Inhibi-tion of CDK-1 and related kinases canprevent both neurotoxicity and phosphory-lation of Aß [1, 2]. Mutation of the serine26 residue to an alanine prevents Aß neu-rotoxicity, suggesting that the phosphory-lated form may represent the neurotoxicintermediate. Observations that the phos-phorylated forms of Aß show markedlyincreased cytotoxicity [2] further supportthis view. The presence of phosphorylatedAß in extracts from differentiated humanteratocarcinoma cell line, Ntera 2/cl-D1neurons (NT-2N) and Alzheimer’s brainsuggests that this form of Aß may be alegitimate target for therapeutic interven-tion. These results also suggest that mea-surement of phosphorylated Aß could havediagnostic potential as well as a use inscreening for therapeutic compounds.
Reagents
Synthetic phosphorylated Aß peptides canbe commercially synthesized as custompeptides. All Aß peptides should be pre-pared as described in Protocol 6.41, Pro-cedure A. Full details of all other reagentsrequired are detailed in Protocol 6.41.
Equipment
As described in Protocol 6.40. Cell culturefacilities are required, including a sterilehood and 37 ◦C CO2 incubator
Procedures
A. Culture of human NT-2N cells forneurotoxicity and phosphorylation ofamyloid-ß
Human teratocarcinoma cell line, Ntera2/cl-D1 (NT2), can be obtained from theAmerican Type Culture Collection (ATCC,Rockville, MD, USA). Differentiation intoneuronal (NT2N) cells should be carriedout as follows:
1. NT2 cells are maintained in Dulbecco’smodified high glucose Eagle’s medium(DMEM), supplemented with 5% fetalbovine serum and 1% antibiotic mixturecomprising penicillin–streptomycin–amphotericin, in a humidified atmo-sphere at 37 ◦C with 10% CO2. Cellsshould be split 1 : 3 twice a week.
2. For differentiation 1 × 10⁶ cells shouldbe plated in a 75 cm2 culture flask inDMEM, supplemented with 10% fetalbovine serum, 1% antibiotic mixturecomprising penicillin–streptomycin–amphotericin and 10 µM all transretinoic acid (10 mM stock retinoicacid in DMSO should be diluted into

PROTOCOL 6.41 365
media just prior to use). Media shouldbe changed three times a week andcells maintained in retinoic acid for5 weeks.
3. Cells should be replated at a 1 : 6split ratio in DMEM supplementedwith 10% fetal bovine serum and 1%antibiotic mixture comprising peni-cillin–streptomycin–amphotericin.
4. Change medium three times over a 1week period.
5. After 1 week add medium further sup-plemented with the mitotic inhibitorscytosine arabinoside (1 µM), fluo-rodeoxyuridine (10 µM) and uridine(10 µM) to inhibit the division of non-neuronal cells.
6. Culture for 2 weeks in DMEM sup-plemented with mitotic inhibitors withthree medium changes/week.
7. Prepare a 1 mg/ml stock solution ofpoly-D-lysine in sterile water. Ster-ilize using a 0.2 µm syringe fil-ter (can be stored in aliquots at−20 ◦C). Dilute stock solution 1 : 100in sterile distilled water and adddiluted poly-D-lysine solution into cul-ture dishes (for 96-well tissue cul-ture plates add 125 µl/well; for 24-well culture plates add 1.25 ml/well).After 3 h remove poly-D-lysine solu-tion and allow dishes to air-dry in asterile cabinet.
8. Matrigel matrix should be thawed at4 ◦C overnight and diluted 1 : 25 incold DMEM. Add Matrigel dropwise(for 96-well tissue culture plates add1 drop/well; for 24-well culture platesadd 5 drops/well) and spread evenlyover surface. Allow to air-dry in asterile cabinet. Store plates until use(stable for 2 months).
9. Repeat application of Matrigel on dayof use.
10. After 2 weeks treat cells with trypsinfor 2 min, mechanically dislodge cellsby gently striking flasks and removecell suspension.
11. Replate the cell suspension using cul-ture plates pretreated with poly-D-lysine and Matrigel matrix. For neu-rotoxicity experiments 5 × 10³ cells/100 µl culture medium should beplated in 96-well tissue culture plates.For Aß phosphorylation determination5 × 104 cells/1 ml culture mediumshould be plated in 24-well tissue cul-ture plates.
12. Cells should be cultured in DMEM,supplemented with 10% fetal bovineserum and 1% antibiotic mixture com-prising penicillin–streptomycin–amphotericin for a further 2 weeks priorto experimentation. Medium should bechanged twice a week.
13. On day of experimentation test com-pounds can be added in fresh mediumand neurotoxicity or Aß phosphory-lation determined after an appropriateincubation period.
14. The neurotoxicity of phosphorylatedAß can be measured using MTTreduction or trypan blue dye exclusionas indicators of cell viability. ForMTT reduction prepare a 5 mg/mlsolution of MTT in DMEM, sonicatebriefly and sterilize using a 0.2 µmsyringe filter (can be stored in aliquotsat −20 ◦C). After incubation of cellswith test compounds add MTT to afinal concentration of 0.4 mg/ml toeach well and incubate cells for afurther 6 h. Prepare cell lysis buffer,sufficient for 100 µl/well, containing20% sodium dodecyl sulfate and 50%N,N-dimethylformamide pH 4.7. Afterincubation with MTT add cell lysisbuffer (100 µl/well) and leave plateat 37 ◦C overnight. Read absorbance

366 IN VITRO TECHNIQUES
at 570 nm. For trypan blue exclusionafter incubation of cells with testcompounds dislodge cells from wellsand add an equal volume of 0.4%trypan blue. Count the numbers ofviable (non-stained) and dead cellsusing a haemacytometer.
B. Extraction of phosphorylatedamyloid-ß from cells
The following procedure should be used toextract Aß peptides from cells:
1. Prepare a 100 ml extraction buffer con-taining 0.2% DEA, 50 mM NaCl and0.1 mM sodium vanadate. Remove cul-ture medium from cells in 24-well cul-ture plates and add 0.5 ml extractionbuffer to each well. Disrupt cells byscraping and repeated pippetting.
2. Transfer disrupted cell suspension to a1.5 ml polypropylene microcentrifugetube, sonicate for 15 min and thencentrifuge for 10 min at 13 000 rpm toremove cell debris.
3. Transfer supernatant to a 1.5 ml poly-propylene microcentrifuge tube andadd to an equal volume of 1 M Triscontaining 0.2% Triton X-100 pH 8.0.Add 100 µl of anti-Aß 15–30 anti-serum (1 : 5000 dilution of neat anti-serum), mix and incubate at 4 ◦C over-night.
4. After incubation add 100 µl of protein-A agarose and incubate for 2 h at roomtemperature.
5. Centrifuge for 10 min at 13 000 rpmto pellet protein-A agarose. Removesupernatant and resuspend protein-Aagarose in 1 ml 50 mM Tris contain-ing 0.1% Triton X-100, pH 7.5.
6. Repeat step 5 twice.
7. Prepare elution buffer containing 20%acetonitrile in 0.1% trifluoroacetic acid.
8. Remove supernatant and resuspendprotein-A agarose in 0.5 ml elutionbuffer, mix for 10 min. Centrifuge for10 min at 13 000 rpm to pellet protein-A agarose. Transfer supernatant toa glass tube and resuspend protein-A agarose in 0.5 ml elution buffer.Repeat this step twice and pool thesupernatants.
9. Prepare a Sep-Pak C18 column on a10 ml syringe. Pass 5 ml methanol fol-lowed by 5 ml 0.5 M acetic acid overthe column. Pass 5 ml 20% acetoni-trile in 0.1% trifluoroacetic acid overthe column and add the sample. Washthe column with 10 ml 20% acetoni-trile in 0.1% trifluoroacetic acid fol-lowed by 10 ml deionized water. Elutebound peptides with 2 ml 70% ace-tonitrile in 0.1% trifluoroacetic acid.
10. Purified peptides should be dried downunder a stream of nitrogen, resus-pended in 1 ml of trifluoroethanol anddried down under a stream of nitrogen.Dried down extracts can be stored at−70 ◦C prior to assay.
C. Immunoassay measurement ofphosphorylated amyloid-ß
1. A 500 ml solution of carbonate buffercontaining 15 mM Na2CO3, 35 mMNaHCO3, 0.01% NaN3 (w/v), pH 9.6should be prepared (can be stored for< 14 days at 4 ◦C).
2. Rabbit anti-phosphoserine antibody(1 : 1000 dilution of neat antibody)should be prepared in carbonate buffer(10 ml/plate).
3. To each of the inner 60 wells ona NUNC Polysorb or Maxisorb 96-well ELISA plate add 100 µl ofanti-phosphoserine antibody solutionor carbonate buffer (for control non-specific binding determination). Cover

PROTOCOL 6.41 367
plates with plate sealer (NUNC). Incu-bate plates at 4 ◦C overnight.
4. Remove plate sealer and wash platesthree times with carbonate buffer(200 µl/well).
5. Prepare a 5% marvel solution in car-bonate buffer (20 ml/plate) and add200 µl/well to each well. Incubateplates at room temperature for 1 h.
6. Prepare 500 ml of assay buffer–50 mMTris-HCl containing 0.1% BSA (CohnFraction V), 0.1% Triton X-100, pH 7.5.
7. Wash plates three times with 200 µl/well assay buffer.
8. Prepare synthetic phosphorylated Aßpeptide standards (0–10 nM) and sam-ples in assay buffer, add 100 µl/wellto anti-phosphoserine coated plates,seal plates with plate sealer and incu-bate at 4 ◦C overnight.
9. Wash plates three times with 200 µl/well assay buffer.
10. Add 100 µl/well mouse anti-Aß mon-oclonal antibody 6F3D (1 : 3000 dilu-tion of neat antibody in assay buffer)and incubate for 2 h at room tempera-ture.
11. Wash plates three times with 200 µl/well assay buffer.
12. Add 100 µl/well anti-mouse IgG-HRPconjugate (1 : 2000 dilution of neatconjugate in assay buffer) and incubatefor 2 h at room temperature.
13. Wash plates three times with 200 µl/well assay buffer.
14. Add 100 µl/well TMB substrate (KPL).After sufficient colour development add50 µl/well 1 M phosphoric acid andmeasure absorbance at 450 nm using anELISA plate reader.
D. Phosphorylation of amyloid-ß by CDK-1
CDK-1 activity can be measured asdescribed in Protocol 6.41, ProcedureD, using biotinylated Aß 1–42, Aß1–40 or Aß 25–35 in place of thebiotinylated H1 peptide substrate. Thefollowing immunoassay method has theadvantage of not using a radioactive label:
1. A 500 ml solution of carbonate buffercontaining 15 mM Na2CO3, 35 mMNaHCO3, 0.01% NaN3 (w/v), pH 9.6should be prepared (can be stored for< 14 days at 4 ◦C).
2. Streptavadin (1 µg/ml) should be pre-pared in carbonate buffer (10 ml/plate).
3. To each of the inner 60 wells ona NUNC Polysorb or Maxisorb 96-well ELISA plate add 100 µl of strep-tavidin solution or carbonate buffer(for control non-specific binding deter-mination). Cover plates with platesealer (NUNC). Incubate plates at4 ◦C overnight.
4. Remove plate sealer and wash platesthree times with carbonate buffer(200 µl/well).
5. Prepare a 0.2% casein solution incarbonate buffer (20 ml/plate) and add200 µl/well to each well. Incubateplates at room temperature for 1 h.
6. Prepare 500 ml 50 mM Tris-HCl con-taining 0.1% Triton X-100, pH 7.5.
7. Wash plates three times with 200 µl/well 50 mM Tris-HCl containing 0.1%Triton X-100, pH 7.5.
8. Prepare an assay buffer containing50 mM Tris-HCl, 10 mM MgCl2,1 mM EGTA, 2 mM DTT, 40 mMß-glycerophosphate, 20 mM p-nitro-phenylphosphate, 0.1 mM sodiumvanadate, pH 7.4.
9. Prepare 250 µM ATP in assay buffer.

368 IN VITRO TECHNIQUES
10. Biotinylated Aß peptides are used assubstrates at a final concentration of25 µM. Prepare a stock of 125 µMpeptide in Tris assay buffer.
11. Test compounds should be prepared inassay buffer at 5 × final concentration.
12. Prepare a 200 U/ml solution of CDK-1/Cyclin-B1 in assay buffer.
13. In 1.5 ml polypropylene tubes mix5 µl substrate, 5 µl ATP, 5 µl testcompounds and 5 µl assay buffer andthen add 5 µ1/tube of CDK-1/Cyclin-B1 solution. Incubate for 30 min at30 ◦C in a shaking water bath.
14. Add 200 µl 50 mM Tris-HCl contain-ing 0.1% Triton X-100, pH 7.5 to eachsample. Pipette 100 µl of each sampleinto duplicate wells of a streptavidincoated ELISA plate. Incubate for 4 hat 4 ◦C.
15. Wash plates three times with 200 µl/well 50 mM Tris-HCl containing 0.1%Triton X-100, pH 7.5.
16. Add 100 µl/well anti-phosphoserineantiserum (1 : 2500 dilution of neat
antibody) and incubate for 2 h at roomtemperature.
17. Wash plates three times with 200 µl/well 50 mM Tris-HCl containing 0.1%Triton X-100, pH 7.5.
18. Add 100 µl/well anti-rabbit IgG-HRPconjugate (1 : 2000 dilution of neatconjugate) and incubate for 2 h atroom temperature.
19. Wash plates three times with 200 µl/well 50 mM Tris-HCl containing 0.1%Triton X-100, pH 7.5.
20. Add 100 µl/well TMB substrate (KPL).After sufficient colour development add50 µl/well 1 M phosphoric acid andmeasure absorbance at 450 nm using anELISA plate reader.
References
1. Milton, N. G. N. (2001) Phosphorylation ofamyloid-ß at the serine 26 residue by humancdc2 kinase. NeuroReport, 12, 3839–3844.
2. Milton, N. G. N. (2002) Peptides for use inthe treatment of Alzheimer’s disease. PatentPublication, WO 02/36614 A2.

PROTOCOL 6.42
Smitin–myosin II coassembly arrays in vitro
Richard Chi and Thomas C. S. Keller III
Introduction
Smitin is a large smooth muscle pro-tein that colocalizes with smooth musclemyosin II filaments in vivo and asso-ciates with reconstituted smooth musclemyosin II filaments in vitro [1]. Althoughthe unusually high molecular weight andmolecular morphology of the long, fibroussmitin molecules resemble those propertiesof striated muscle titin, an understanding ofthe molecular relationship between smitinand titin awaits determination of smitinprotein or gene sequence.
Smitin can be isolated from a vari-ety of smooth muscle tissues includingavian gizzard, which provides an excel-lent source of the protein. Published proto-cols designed for the purification of smoothmuscle myosin II routinely yield prepa-rations of myosin II contaminated withsignificant amounts of smitin, not readilydetected with SDS-PAGE protocols com-monly used to analyse such preparations.Likewise, the following protocol, which isdesigned to maximize isolation of smitin,yields smitin preparations contaminatedwith significant amounts of myosin II butlittle or no other proteins. This preparationis useful for investigating the properties ofsmitin–myosin II coassembly in vitro [1].
In physiological ionic strength condi-tions, myosin in the smitin–myosin prepa-rations self-assembles into long, sidepolarfilaments similar to those found in the con-tractile apparatus of smooth muscle cells
in vivo. In the presence of smitin, thesemyosin II filaments aggregate into irregu-lar arrays. In low ionic strength conditions,smooth muscle myosin self-assembles intosmall bipolar myosin II filaments, whichin the presence of smitin align end to endand side by side into highly regimentedarrays. The organization of these coassem-bly arrays resembles that of the coassemblyarrays formed by cellular titin and myosinII In vitro and may represent the organiza-tion of smitin and smooth muscle myosinII in the stress fibre-like structures in pro-liferative, motile smooth muscle cells.
ReagentsBuffer A: 50 mM KCl, 2 mM MgCl2,
1 mM EDTA, 1 mM EGTA, 0.5 mMDTT, 0.2 mM PMSF, 1© 0.002 mMleupeptin, 10 mM imidazole-Cl (pH 7.0)
Buffer B: 0.6 M KCl, 4 mM ATP, 2 mMMgCl2, 1 mM EDTA, 1 mM EGTA,0.5 mM DTT, 0.2 mM PMSF, 0.002 mMleupeptin, 10 mM imidazole-Cl (pH 7.0)
Buffer C: 0.2 M KCl, 1 mM EGTA,0.5 mM EDTA, 0.2 mM DTT, 10 mMimidazole-Cl (pH 7.5)
Buffer D: 0.6 M KCl, 0.2 mM DTT,10 mM imidazole-Cl (pH 6.9) (usedalso with inclusion of 0.4 M potassiumphosphate)
Buffer E: 50 mM KCl, 2 mM MgCl2,5 mM EDTA, 0.1 mM EGTA, 0.2 mMDTT, 10 mM imidazole-Cl (pH 7.0)

370 IN VITRO TECHNIQUES
Buffer F: 150 mM KCl, 2 mM MgCl2,5 mM EDTA, 0.1 mM EGTA, 0.2 mMDTT, 10 mM imidazole-Cl (pH 7.0)
Equipment
Waring Blender
Preparative Superspeed Refrigerated Cen-trifuge with large capacity rotor (e.g.GSA fixed-angle rotor and 250 ml cen-trifuge bottles or equivalent)
Sephacryl S-1000 Superfine Matrix col-umn (2.5 × 90 cm)
Hydroxylapatite Matrix column (2.5 ×13.5 cm)
Fraction collector
Procedure
Three fresh adult chicken gizzards willprovide 20 g of smooth muscle tissue, theoptimal amount of smooth muscle for thisprotocol. 2©
1. Remove and discard the gizzard sur-face fat tissue. Dissect the smoothmuscle tissue off the tough gizzardlining. Dice the smooth muscle tissueinto pieces smaller than 1 cm2 with asharp scalpel or razor blade.
2. Mix the gizzard tissue with buffer A(50 ml/g of starting smooth muscletissue) in a blender and homogenizewith three bursts of 10 s each atmaximum speed.
3. Pellet the tissue by centrifugation at5000g for 15 min.
4. Repeat steps 2 and 3 twice.
5. Resuspend the pellet with buffer B(2 ml/g of starting smooth muscletissue) and stir gently for 30 min inan ice bath.
6. Pellet the tissue by centrifugation at15 000g for 30 min.
7. Decant the extract supernatant. Load20 ml of the extract onto a SephacrylS-1000 column (2.5 × 90 cm) equi-librated and eluted with degassedbuffer C. 3© Smitin and myosin coe-lute near the void volume of the col-umn (∼240–280 ml).
8. Assay column fractions for smitin bySDS-PAGE. 4© Pool the peak smitinfractions, minimizing actin contamina-tion.
9. To remove contaminating actin, α-actinin, and other proteins, applypooled smitin–myosin II fractionsto a hydroxyapatite column (2.5 ×13.5 cm) equilibrated with buffer Dand eluted with a gradient of 0.0–0.4 M potassium phosphate in bufferD. Purified fractions containing smitinand myosin typically elute in fractionsbetween 0.23 and 0.26 M phosphate.
10. Smitin and myosin in preparationscontaining both proteins coassemblewhen dialysed into low ionicstrength (buffer E) or physiologicalionic strength (buffer F) conditionslacking ATP for 6–48 h. 5©
11. Smitin–myosin coassemblies can bepelleted by centrifugation at 10 000g
for 5 min.
Notes
The protein purification steps of this proce-dure require approximately 2 working daysto complete. Prolonged preparation timeresults in high actin contamination andirreversible smitin/myosin aggregation. Allsteps should be performed at 4 ◦C.
1© PMSF is hazardous; handle with care.Make a stable 0.2 M PMSF stock

PROTOCOL 6.42 371
solution in ethanol. Minimize precipi-tation of PMSF on dilution into aque-ous solution, by slowly expelling thealiquot of PMSF stock solution froma pipette tip submersed in vigorouslystirring buffer solution. PMSF has ahalf-life as short as 30 min in someaqueous solutions; add to the buffersolution immediately before use.
2© Chill the gizzards on ice as soon aspossible after acquisition. Keep thesmooth muscle tissue cold through-out the initial steps of the protocol tominimize actin contamination of thepurified smitin–myosin II preparation.For optimal purity of smitin–myosinII preparations, use the gizzards within2 h of sacrifice. Cleaned and dicedgizzard smooth muscle that has beenrapidly frozen in liquid N2 and storedat −20 ◦C until use also provides asuitable source of smitin for purifica-tion.
3© Use of Sephacryl S-500 instead of S-1000 yields similar results. Minimizeactin filament contamination of thesmitin–myosin II Sephacryl S-1000fractions by loading the column witha 50 ml front of 0.6 M KI (made inbuffer C) immediately ahead of theprotein load. For convenience, thiscolumn can be run overnight.
4© SDS-PAGE: To maximize protein con-centration in gel samples of the columnfractions, make gel samples using 8 ×or10 × Laemmli sample buffer. Heat-ing the samples to 90 ◦C for 3 min min-imizes the amount of myosin heavychain trapped in the smitin band on
the gel. Overheating can cause lossof full-length smitin from the sample.Samples can be analysed in large ormini gel formats. Using an acrylamidestock with a 75 : 1 ratio of acrylamideto bis-acrylamide to form the runningand stacking gels enhances migrationof smitin into the gel. Proteins withpolypeptide molecular weights rangingfrom greater than 3 MDa to 15 kDa,including smitin, myosin heavy andlight chains, and actin, can be fraction-ated in lanes on a 4–20% acrylamidegradient running gel with a 3% stack-ing gel. Allowing the gel to run for anadditional 25–33% of the time it takesthe dye front to reach the bottom of thegel increases migration of smitin intothe gel and increases fractionation res-olution of the proteins in the sample.
5© Prepare dialysis tubing according tothe manufacturer’s recommendations.Select the dimensions of the tub-ing to maximize the surface to vol-ume ratio of the bag. The rate ofcoassembly formation is inverselyrelated to the protein concentrationof the sample. At high protein con-centration, smitin–myosin coassem-bly aggregates may be visible in thedialysis bag as white flocculent mate-rial in less than 6 h.
References
1. Kim, K. and Keller, T. C. (2002) Smitin, anovel smooth muscle titin-like protein, inter-acts with myosin filaments in vivo and in vitro,J. Cell Biol., 156, 101–112.

PROTOCOL 6.43
Assembly/disassembly of myosin filaments inthe presence of EF-hand calcium-bindingprotein S100A4 in vitro
Marina Kriajevska, Igor Bronstein and Eugene Lukanidin
Reagents
pQE30 expression vector (QIAGEN),enzymes for RT-PCR and cloning, E.coli M15 competent cells (QIAGEN),IPTG (1 M in H2O), 50% slurry of Ni-NTA resin (QIAGEN), buffer A (6 MGuHCl, 0.1 M Na-phosphate, 0.01 M Tris-HCl pH 8.0), buffer B (8 M urea, 0.1 MNa-phosphate, 0.01 M Tris-HCl pH 8.0),buffer C (8 M urea, 0.1 M Na-phosphate,0.01 M Tris-HCl pH 6.3), 1 M imidazole,5 M NaCl, 1 M DTT, glycerol, 1 M MESpH 6.2, acetic acid glacial, 0.5 M EDTA,1 M CaCl2, Protein assay reagent (Pierce),Ezblue gel staining reagent (Sigma)
Procedures
A. Isolation of the recombinantC-terminal fragment of the heavy chain ofnon-muscle myosin IIA
1. Clone cDNA corresponding to the C-terminal fragment of the heavy chainof non-muscle myosin IIA in BamHIsite of pQE30 bacterial expressionvector 1© and use it for the transfor-mation of E. coli M15 cells.
2. Prepare overnight culture and use it forthe preparation of large-scale culture(0.5 l) according to the QIAGEN pro-tocol.
3. Perform IPTG induction (1 mM) ofculture for 5 h. Harvest cells by cen-trifugation at 3000g for 20 min.
4. Store cell pellet at −80 ◦C or pro-cess immediately purification of themyosin fragment in denaturing condi-tions according to the QIAGEN rec-ommendations.
5. Briefly, resuspend pellet in buffer A(5 ml/g wet weight) and stir cells atroom temperature until lysis of cellsis completed.
6. Centrifuge the lysate at 20 000g for20 min and mix supernatant with 4 mlof 50% slurry of Ni-NTA resin, whichwas previously equilibrated in buffer A.
7. After 1 h of stirring at room temper-ature (RT), apply resin to the columnand wash consequently with buffers A,B and C until the A280 of the flow-through is lower than 0.01 at each step.
8. Perform refolding of the myosin frag-ment with the 30 ml of the linear6 M–1 M urea gradient in 0.5 M NaCl,20% glycerol, 10 mM Tris pH 7.4.
9. Elute protein in 0.5 ml fractions using5 ml of the elution buffer (1 M urea,0.5 M NaCl, 10% glycerol, 10 mMTris pH 7.4, 250 mM imidazole).
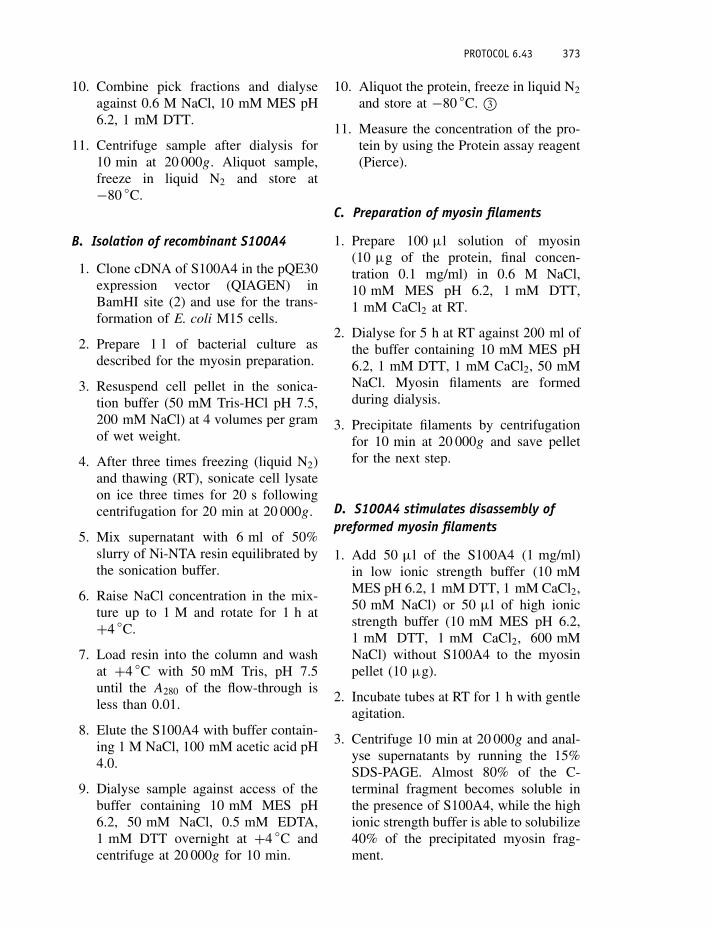
PROTOCOL 6.43 373
10. Combine pick fractions and dialyseagainst 0.6 M NaCl, 10 mM MES pH6.2, 1 mM DTT.
11. Centrifuge sample after dialysis for10 min at 20 000g. Aliquot sample,freeze in liquid N2 and store at−80 ◦C.
B. Isolation of recombinant S100A4
1. Clone cDNA of S100A4 in the pQE30expression vector (QIAGEN) inBamHI site (2) and use for the trans-formation of E. coli M15 cells.
2. Prepare 1 l of bacterial culture asdescribed for the myosin preparation.
3. Resuspend cell pellet in the sonica-tion buffer (50 mM Tris-HCl pH 7.5,200 mM NaCl) at 4 volumes per gramof wet weight.
4. After three times freezing (liquid N2)and thawing (RT), sonicate cell lysateon ice three times for 20 s followingcentrifugation for 20 min at 20 000g.
5. Mix supernatant with 6 ml of 50%slurry of Ni-NTA resin equilibrated bythe sonication buffer.
6. Raise NaCl concentration in the mix-ture up to 1 M and rotate for 1 h at+4 ◦C.
7. Load resin into the column and washat +4 ◦C with 50 mM Tris, pH 7.5until the A280 of the flow-through isless than 0.01.
8. Elute the S100A4 with buffer contain-ing 1 M NaCl, 100 mM acetic acid pH4.0.
9. Dialyse sample against access of thebuffer containing 10 mM MES pH6.2, 50 mM NaCl, 0.5 mM EDTA,1 mM DTT overnight at +4 ◦C andcentrifuge at 20 000g for 10 min.
10. Aliquot the protein, freeze in liquid N2
and store at −80 ◦C. 3©11. Measure the concentration of the pro-
tein by using the Protein assay reagent(Pierce).
C. Preparation of myosin filaments
1. Prepare 100 µl solution of myosin(10 µg of the protein, final concen-tration 0.1 mg/ml) in 0.6 M NaCl,10 mM MES pH 6.2, 1 mM DTT,1 mM CaCl2 at RT.
2. Dialyse for 5 h at RT against 200 ml ofthe buffer containing 10 mM MES pH6.2, 1 mM DTT, 1 mM CaCl2, 50 mMNaCl. Myosin filaments are formedduring dialysis.
3. Precipitate filaments by centrifugationfor 10 min at 20 000g and save pelletfor the next step.
D. S100A4 stimulates disassembly ofpreformed myosin filaments
1. Add 50 µl of the S100A4 (1 mg/ml)in low ionic strength buffer (10 mMMES pH 6.2, 1 mM DTT, 1 mM CaCl2,50 mM NaCl) or 50 µl of high ionicstrength buffer (10 mM MES pH 6.2,1 mM DTT, 1 mM CaCl2, 600 mMNaCl) without S100A4 to the myosinpellet (10 µg).
2. Incubate tubes at RT for 1 h with gentleagitation.
3. Centrifuge 10 min at 20 000g and anal-yse supernatants by running the 15%SDS-PAGE. Almost 80% of the C-terminal fragment becomes soluble inthe presence of S100A4, while the highionic strength buffer is able to solubilize40% of the precipitated myosin frag-ment.

374 IN VITRO TECHNIQUES
E. S100A4 prevents aggregation ofmyosin filaments in the presence ofcalcium
1. Prepare 100 µl mixture of myosin(10 µg with final concentration 0.1mg/ml) and S100A4 (50 µg) in a buffer(0.6 M NaCl, 10 mM MES pH 6.2,1 mM DTT) containing 1 mM CaCl2 or5 mM EDTA.
2. Dialyse proteins for 5 h at RT against200 ml of buffer, 10 mM MES pH 6.2,1 mM DTT, 1 mM CaCl2 or 5 mMEDTA and different NaCl concentra-tions, 50, 100, 200, 300 and 400 mM.
3. Centrifuge samples for 10 min at20 000g.
4. Analyse supernatant in the presence ofthe myosin fragment by running a 15%SDS-PAGE and staining with Ezbluegel staining reagent (Sigma). 4©
Notes
1© Synthesis of the cDNA correspondingto the C-terminal 202 aa fragment ofthe heavy chain of the human non-muscle myosin IIA: prepare total RNAfrom human platelets and perform RT-
PCR using specific myosin primers,forward primer, CGGGATCCCAGATCAACGCCGAC (+5303 to +5317),and reverse primer, CGGGATCCGGCTTATTCGGCAGG (+5894 to+5908).
2© Synthesis of the human S100A4cDNA: prepare total RNA fromhuman platelets and perform RT-PCR with specific S100A4 primers,forward primer, CGGGATCCATGGCGTGCCCTCTG (+65 to +79) andreverse primer, CGGGATCCGAGTTTTCATTTCTTCCTGGG (+356 to+376).
3© Fresh prepared S100A4 keep at−80 ◦C in order to prevent aggrega-tion of the protein.
4© In the presence of S100A4 and cal-cium, the myosin fragment remains ina soluble form in low ionic buffer.
Acknowledgements
This work was supported by grants fromthe Danish Cancer Society, DanskKræftforsknings Fond, Novo NordiskFonden and Yorkshire Cancer Research.

PROTOCOL 6.44
Collagen fibril assembly in vitro
David F. Holmes and Karl E. Kadler
Introduction
It has long been known that native-like col-lagen fibrils can be produced in vitro byself-assembly by incubation of extractedand purified type I collagen molecules inwarm, neutral solution conditions [1, 2].The individual fibrils have a polarizedarrangement of molecules with an axialD-periodicity of 67 nm and are of near-uniform diameter. Collagen fibrils are sta-bilized in tissue by the formation of inter-molecular cross-links involving specificlysine/hydroxylysine residues and aldiminederivatives of these. Collagen is commonlyextracted from young tissues (typicallycalf skin or rat tail tendon) using aceticacid solution [3] which breaks these inter-molecular cross-links. Alternatively colla-gen can be released by pepsin treatmentwhich cleaves the telopeptides (terminalnon-triple-helical domains) where cross-link sites are located. Fibril assembly is,however, critically dependent on the intact-ness of the telopeptides [2, 4]. Partial losscan lead to a changed morphology and lossof polarity. Extensive loss can completelyinhibit fibril formation [4].
The fibrils in the final reconstituted gel oftype I collagen have a fairly broad diame-ter distribution, compared with those in tis-sue, and this is dependent on the solutionconditions at pH 7.4 (temperature and ionicstrength, as well as ion type). Optimal condi-tions for the formation of compact, uniform-diameter, native-like fibrils have generally
involved a temperature of 34 ◦C or less anda phosphate buffer [5, 6].
Different assembly pathways have beenobserved in the reconstitution of collagenfibrils [5, 7]. The transfer route used toraise pH, temperature and ionic strengthfrom the initial conditions (cold, acidsolution) to the reconstitution conditions(warm, neutral solution) has been found tobe a major determinant of the assemblypathway [5]. Warming before neutraliza-tion (‘warm start initiation’) leads to abun-dant short ‘early fibrils’ with tapered tips.Similar ‘early fibrils’ are also observedduring collagen fibril assembly in tis-sue [8]. In contrast, neutralization fol-lowed by warming (‘neutral start initia-tion’) leads to the early accumulation offilaments [5, 7].
The procedure described here is basedon a set of ‘optimal’ reconstitution con-ditions: 200 µg/ml collagen, I 0.2, pH7.4 phosphate buffer and a temperatureof 34 ◦C. These conditions are estab-lished using the ‘warm start’ initiation(Figure 6.45(a)). The kinetics of assem-bly can be monitored by turbidimetry(Figure 6.45(b)) and the assembly productscan be studied by transmission electronmicroscopy (Figure 6.45(c)).
Reagents
Extracted and purified type I collagen isavailable from biochemical suppliers.1© 2©
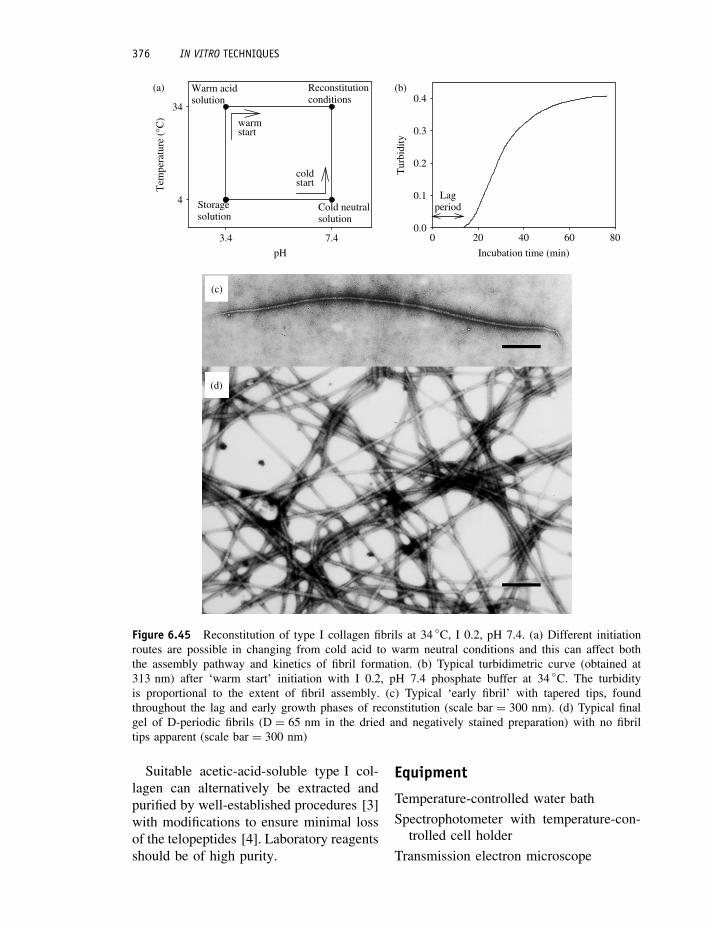
376 IN VITRO TECHNIQUES
pH
3.4 7.4
Tem
pera
ture
(°C
)
4
34
(a)
Storagesolution
Warm acidsolution
Cold neutralsolution
Reconstitutionconditions
warmstart
coldstart
Incubation time (min)
0 20 40 60 80
Tur
bidi
ty
0.0
0.1
0.2
0.3
0.4(b)
Lagperiod
(c)
(d)
Figure 6.45 Reconstitution of type I collagen fibrils at 34 ◦C, I 0.2, pH 7.4. (a) Different initiationroutes are possible in changing from cold acid to warm neutral conditions and this can affect boththe assembly pathway and kinetics of fibril formation. (b) Typical turbidimetric curve (obtained at313 nm) after ‘warm start’ initiation with I 0.2, pH 7.4 phosphate buffer at 34 ◦C. The turbidityis proportional to the extent of fibril assembly. (c) Typical ‘early fibril’ with tapered tips, foundthroughout the lag and early growth phases of reconstitution (scale bar = 300 nm). (d) Typical finalgel of D-periodic fibrils (D = 65 nm in the dried and negatively stained preparation) with no fibriltips apparent (scale bar = 300 nm)
Suitable acetic-acid-soluble type I col-lagen can alternatively be extracted andpurified by well-established procedures [3]with modifications to ensure minimal lossof the telopeptides [4]. Laboratory reagentsshould be of high purity.
Equipment
Temperature-controlled water bath
Spectrophotometer with temperature-con-trolled cell holder
Transmission electron microscope

PROTOCOL 6.44 377
(b)
(a)overlap gap
N
N
N
N
N
C
C
C
C
C
D = 67 nm(234 residues)
Figure 6.46 Axial structure of type I collagen fibril. (a) Schematic diagram to show the axial arrange-ment of collagen molecules in the fibrils. Short non-triple domains (‘telopeptides’) are located atthe ends of the long triple helical (300 nm) domain. (b) Characteristic negative stain pattern (using1% sodium phosphotungstate, pH 7) of native-type D-periodic collagen fibril reconstituted fromacetic-acid-soluble type I collagen. This is shown at the same magnification and aligned with theschematic axial structure in (a). The gap/overlap structure of the fibril and the fine stain excludingtelopeptide regions at the gap/overlap junctions are apparent
Procedure
1. Start with a collagen solution in 10 mMacetic acid solution (using dialysis ifnecessary) at 4 ◦C.
2. Dilute 3© the collagen to ∼400 µg/mlwith 10 mM acetic acid solution andkeep at 4 ◦C.
3. Warm equal volumes of collagen solu-tion and double strength phosphatebuffer (124 mM Na2HPO4, 29.2 mMKH2PO4) separately to 34 ◦C for about5 min. This yields final solution condi-tions of I 0.2, pH 7.4.
4. Mix the two volumes (acid collagensolution and double strength buffer) tostart fibril reconstitution and incubate at34 ◦C for several hours. 4©
5. A uniform, cloudy gel will form. Thiscan be pulled from the tube withforceps.
6. Prepare TEM specimens by wiping asmall portion of gel over a carbon-filmed grid, washing with several dropsof water and negatively staining with1–2% sodium phosphotungstate, pH
7.0 (or other suitable stain, e.g. 1–2%uranyl acetate).
7. Examine the grid sample by TEM.The fibrils should be compact witha polarized, D-periodic stain patternand uniform diameter along individualfibrils (Figures 6.45(d) and 6.46). Fibrildiameters are typically in the range30–90 nm.
Notes
1© Suppliers include BD Biosciences,USA and Elastin Products Company,USA.
2© The fibril reconstitution proceduredescribed here is appropriate for ace-tic-acid-extracted collagen rather thanpepsin-extracted.
3© Collagen concentration can be deter-mined by a direct colorimetric assay(‘Sircol’ kit available from BiocolorLtd, Northern Ireland).
4© The kinetics of assembly can be sim-ply monitored by turbidimetry mea-surements using a spectrophotometer

378 IN VITRO TECHNIQUES
and recording the absorbance withtime (see Figure 6.46(b)).
References
1. Gross, J. and Kirk, D. (1958) J. Biol. Chem.,233, 355–360.
2. Kadler, K. E., Holmes, D. F., Trotter, J. A. andChapman J. A. (1996) Biochem. J., 316, 1–11.
3. Jackson, D. S. and Cleary, E. G. (1967) Meth-ods Biochem. Anal., 15, 25–76.
4. Capaldi, M. J. and Chapman, J. A. (1982) Bio-polymers, 21, 2291–2313.
5. Holmes, D. F., Capaldi, M. J. and Chapman,J. A. (1986) Int. J. Biol. Macromol., 8,161–166.
6. Williams, B. R., Gelman, R. A., Poppke, D. C.and Piez, K. A. (1978) J. Biol. Chem., 253,6578–6585.
7. Gelman, R. A., Willaims, B. R. and Piez, K. A.(1979) J. Biol. Chem., 254, 180–186.
8. Birk, D. E., Hahn, R. A., Linsenmeyer, C. Y.and Zycband, E. I. (1996) Matrix Biol., 15,111–118.


