Embed Size (px)
Citation preview

LAVINIA PARISI* – FERNANDA MAZZOTTA* CARMEN AINA**
Income inequality among family members in Italy:who gains and who loses?
1. INTRODUCTION
Several researchers have analysed the evolution of income distribution todetect the levels of inequality and poverty that characterise a specific popula-tion (see for instance Atkinsons and Brandolini, 2001). These contributions gen-erally aim at providing a picture of increases in inequality, household impover-ishment or the disappearance of the middle class often discussed in publicdebate. The present paper builds on this strand in the literature, taking intoaccount the considerable changes that have occurred in the labour market, in thesocial security system, and Italian society more generally. First, we define anindicator to capture income inequality amongst households under the assump-tion of equal sharing of resources; second, we analyse the flow of monetarycontribution within the family (i.e. we identify who gains and who loses fromthis hypothesised equal sharing) and its determinants, using the 2010 ItalianStatistics on Income Living Conditions (IT-Silc).
The estimates show that monetary contributions vary by gender. Moreeducated women are more likely to be able to equalise consumption amongfamily components, while for men education is not significant once economicactivities are controlled for. As expected, more stable labour contracts enhancethe probability of making a positive contribution to the other family members.Households more involved in family activities have less time to allocate to paidjobs, and therefore they contribute less than other members to reducing incomeinequalities. Predicted values underline that men and women behave different-ly based on age, and recognise males as the primary breadwinner.
The paper is organised as follows. Section 2 analyses the relationshipsbetween the determinants of income differences among family components andthe empirical evidence and presents the theoretical framework. Section 3describes the data; Section 4 presents the results; and Section 5 contains con-cluding remarks.
23
GENUS, LXVIII (No. 3), 23-41
* Dipartimento di Scienze Economiche e Statistiche, Università degli Studi di Salerno, Salerno,Italy.** Dipartimento di Studi per l’Economia e l’Impresa (DiSEI), Università degli Studi del PiemonteOrientale, Novara, Italy.Corresponding author: Lavinia Parisi; e-mail: [email protected].

LAVINIA PARISI – FERNANDA MAZZOTTA – CARMEN AINA
24
2. BACKGROUND
Italy exhibits the most unequal distribution of wages and salaries amongstindividuals, especially because of differences in demographic structure, socialcomposition, and employment conditions. This paper aims to provide some use-ful insights into the factors related to income differences among family compo-nents. For instance, families where the household head is aged 40 years or lessare not particularly widespread in Italy (about 14.5% of our sample). This is dueto the higher propensity of Italian young adults to postpone departure from theirparental home. It also reflects the role played by employment conditions andparents’ and children’s incomes in the latter’s decision to leave the parentalhome and take the relative risk of being poor (see Belloc, 2009; Manacorda andMoretti, 2006; Mazzotta, 2007; Parisi, 2008; Iacovou and Parisi, 2009; Beckeret al., 2010). The inclusion of other demographic characteristics should providea better understanding of the income differences that emerge at the family level,including the gender of the family’s components. Discerning the link betweenpersonal characteristics and the attitude to income differences at the micro level(i.e. within the household) might help policy makers to define interventions toovercome income inequalities at the macro level.
However, survey data providing reliable information that describes thesharing of resources in the household are scarce (see Jenkins, 1991). For exam-ple, the Bank of Italy (Survey on Household Income and Wealth - SHIW) col-lects information on income transfers exclusively between family members liv-ing in different households; the Survey of Health, Ageing and Retirement inEurope (SHARE) provides information on monetary transfers between individ-uals within a family, but includes only people aged 50 and over, which means thesample is composed almost entirely of retired individuals. The ECHP datasetcollects individual money transfers received and assumes that transfers occurbetween household heads in the form of financial support from relatives, friendsor others not living in the household, but provides no information on monetarycontributions made among members of families living in the same household.
This paper attempts to fill in some of these gaps. It employs the OECDprocedure (OECD, 2001) to calculate individual monetary contributions, basedon the 2010 Italian Statistics on Income and Living Conditions (IT-Silc) surveyquestionnaire, which uses a comprehensive set of up-to-date measures ofobserved characteristics at the individual and family levels. Our indicator isdefined as the difference between the personal and per-capita income dividedby the equivalent family income. We make certain assumptions: first, for eachfamily member we assume personal consumption is equal to per-capita income.This hypothesis of equal sharing of resources among all family members relieson the unitary household decision making model (Becker, 1974 and 1981;Samuelson, 1956). Although the income pooling hypothesis is controversial inthe literature (see for instance: Browning et al., 1994; Browning and Chiappori,

INCOME INEQUALITY AMONG FAMILY MEMBERS IN ITALY: WHO GAINS AND...
25
1998, Findlay and Wright, 1996; Jianakoplos and Bernasek, 2008), in the exer-cise in this paper, we are not interested in modelling individual bargainingpower. The baseline objective is to identify the determinants explaining incomedifferences amongst family components and how they might increase the needof individual family members to share a part of their personal income with oth-ers, in order to offset the emerging inequality. Second, we assume that a fami-ly component should give (receive) to (from) the others the amount of his per-sonal income that exceeds (is less than) the per-capita amount. This resultsdirectly from implementation of the OECD procedure and relies on the motiva-tions embedded in Becker’s ‘altruistic model’ (1974), Berneheim et al.’s (1985)and Cox’s (1987) ‘exchange models’, and complies with family rules (i.e. fam-ily constitution) (Cigno, 1993). In particular, the altruistic model suggests thatindividuals’ transfers of money to others stems from a desire to increase theother’s well-being. In other words, the giver of money derives direct utilityfrom the increased utility of the receiver. According to the exchange model,transfers to other individuals are made in return for services received; forinstance, a parent might promise a bequest in exchange for an offspring’s com-panionship. Another explanation for voluntary money transfers might be theexistence of a self-enforcing ‘family constitution’ (Cigno, 1993), which is a setof unwritten rules prescribing the amount of money that a family component isrequired to donate to the components in need. Regardless of the prevailingframework and relative implications in the form of different outcomes frompublic policies to redistribute income, these other motives that undoubtedlydrive transfer behaviour and predict and support similar qualitative resultsregarding removing income inequality since we assume that family membersact as an income-equalising institution.
Thus, we include personal and family characteristics in the analysis inorder to capture their effects on reducing income inequality amongst familycomponents. Our indicator depends on whether the individual has a job and alsoon the amount of the salary received, compared to other members of the house-hold. Consequently, the specifications take account of labour supply theory(Becker, 1965 and 1981; Gilbert and Becker, 1975) as well as the motives ofintra-household transfer discussed above (i.e. Becker, 1974; Cox, 1987). Gen-der, age and education level are used as proxies for the different labour marketparticipation of individuals (for gender and education see Becker, 1965, 1981;for an age and life cycle hypothesis see Gilbert and Becker, 1975; Heckman andMacurdy, 1980; Macurdy, 1981).
According to the literature, all these variables influence the decision towork. Overall females, all other things being equal, are less likely to have a jobthan their male counterparts because of potential exposure to interruptions, espe-cially due to pregnancy at the beginning of their work careers (Del Boca1997 and 2002; Del Boca and Locatelli, 2006; Chiuri, 2000). The more limitedfemale participation in the job market is also a consequence of the bargaining

LAVINIA PARISI – FERNANDA MAZZOTTA – CARMEN AINA
26
power in the family, in which women are charged with child/elderly care andmales are considered the breadwinners. Thus, these social and cultural norms donot help women reconcile their household responsibilities with work activities(Gauthier and Hatzius, 1997; Engelhardt and Prskawetx, 2004; Del Boca andSauer, 2009), as observed in their employment patterns. The propensity to workis also positively correlated with the level of education achieved (Del Boca, 1993and 2002; Colombino and Di Tommaso, 1996; Addabbo, 1999; Bratti andStaffolani, 2012). In fact, education can be seen as a proxy variable for “a posi-tive taste” or “pure preference” for market work (Bowen and Finegan, 1969).Type of contract and economic status are used to control for the different oppor-tunities available to family components to give (receive) monetary contributionsto (from) the others (i.e. people with stable job conditions earn more than othercategories of workers) (Mussida and Picchio, 2011). Degree of kinship providesevidence of gender attitudes towards reducing income inequality based on therole in the household (i.e. head of household, spouse/partner, children). Detailsof family composition, such as number of females, number of unemployed, etc.,highlight how differences in the characteristics of households may emphasiseincome inequalities among members. The geographic area of residence providesinformation about labour market conditions and social capital (i.e. acceptabilityof women working). Finally, controlling for the number of hours spent on child-care and care for the elderly serves as a proxy for the time spent on unpaid work,which contributes to explaining a lower ‘wage’ or share of income, compared toother components that are relieved of this burden. Clearly, those more involvedin family activities have less time to allocate to a paid job, which explains therisk of facing income inequality within the family and responds to the exchangeframework (Berneheim et al., 1985; Cox, 1987).
3. DATA
Applying the OECD (2001) procedure, for each family component wedefine the monetary contribution given (received) to (from) the other mem-bers to reduce income inequality within the household, and provide evidenceof the determinants of these differences using the 2010 IT-Silc. The selectedsample consists of individuals over 17 years of age, living in a householdcomposed of at least two members (required to calculate the amount sharedwith any other component). Self-employed people are excluded since this cat-egory of worker has some specific characteristics that could bias our esti-mates (e.g. income declared) and outliers with respect to income, accordingto Hadi (1992 and 1994).1 The resulting sample size is 21,729 individuals, ofwhich 51.2% are female (see Table1). According to family status, in the sam-
1All these observations – apart from single households – were accounted for in the definitionof the variables related to the family, and only subsequently excluded.

INCOME INEQUALITY AMONG FAMILY MEMBERS IN ITALY: WHO GAINS AND...
27
ple, around 32% are male household heads, 8% are female household heads,31% are wives, 3% are husbands, 10% are daughters, and 12% are sons.
3.1 Dependent variable
The dependent variable is the amount of the monetary contribution eachcomponent should give (receive) to (from) other family members to removepotential income inequality. Since we do not have direct information on intra-household transfers (IT-Silc data contain details only on monetary transfersbetween households) we calculate this by applying the following strategy whichis in line with the OECD (2001) procedure.
Assuming that each family member’s consumption is equal to the per-capi-ta income, we define and calculate several types of incomes.
Let Y1 be the total equivalent net household income defined as the sum ofpersonal income from labour and pensions of all family members plus othersources of income at the household level,2 divided by the OECD equivalencescale, which takes account of economies of scale based on family composition.
Table 1 – Sample size by gender and family status (number of observations)
Sources: Own elaboration of IT-Silc data (2010).
2To define the total household income we consider the following sources: imputed rent, incomefrom rentals, interest, dividends and other capital income, family/children allowances, othersocial benefits, housing allowances, and regular inter-household cash transfers received.

LAVINIA PARISI – FERNANDA MAZZOTTA – CARMEN AINA
28
Let Y2 be the equivalent income calculated as the sum of only personal incomefrom labour and pensions of all household members, divided by the OECDequivalence scale. Let Y3 be the per-capita income defined as the sum of person-al income from labour and pensions of the individuals living in the household,divided by the number of components. Finally, Y4 is the personal income fromlabour and pensions.
According to the OECD procedure (OECD 2001), three types of variablesare defined: T1 is unidentified resources, resulting from the difference betweenY1 and Y2 (i.e. Y1–Y2); T2 refers to the economies of scale and is defined as thedifference between Y2 and Y3; (i.e. Y2–Y3); and T3 is inaccurately termed intra-household transfers, and is the difference between Y4 and Y3 (i.e. Y4 – Y3). Next,we divide each of these monetary components by the total equivalent householdincome (Y1) to provide the share of each component.
T3 is the core variable in our empirical exercise and may be negative or pos-itive. We are aware that this variable does not properly show effective intra-household transfers among family components, but rather measures the amountan individual should give (receive) to (from) other family components in orderto nullify the income inequality amongst them (i.e. assuring that each memberhas disposal of the per-capita income in the context of equal sharing ofresources).
Tables 2 and 3 report income decomposition using the OECD procedure(i.e. the three variables ‘T’ described above and the personal income), by gen-der and status respectively. In the male sub-sample (Table 2), about 99% ofthe household’s disposable equivalent income derives from each individual’sown financial sources (pension or wage), thus, they must contribute on aver-age 37% of this amount to remove family income disparities. In the femalesubsample, only 47% of their income derives from their personal income, andthey need to receive monetary contributions from the other components(about 16%) to overcome their income inequality. Descriptive statistics showthat there are economies of scale, meaning that families composed of at leasttwo individuals can live more cheaply than single households (the benefitprovided by the economies of scale is around 33%) . Men are the main bread-winners as they are more likely than women to promote equal consumptionamong all family components.
With regard to family status (Table 2), we notice a significant difference forthe category of household head, namely that men contribute with 58% of the per-capita income from labour and pensions to ensure income equality in the fami-ly. Wives benefit from economies of scale related to the partnership (32.6%) andfrom the contributions received (18.6%) from the other family members. Theseresults confirm the existence of gender differences, and suggest that men, onaverage, provide more support in the form of income than women. Also, womenare generally recipients but female household heads positively contribute (about14%). Overall, the personal incomes of children are below per-capita income,but gender differences still emerge. In particular, daughters require a smaller

INCOME INEQUALITY AMONG FAMILY MEMBERS IN ITALY: WHO GAINS AND...
29
contribution (about 18%) than sons (29%), from the other family members toachieve per-capita income levels.
Figure 1 shows the distribution of monetary contributions by age and gen-der. The age distribution is characterised by an inverted U shape and gender dif-ferences are more pronounced if individuals are more likely to have a job.
Table 2 – Income decomposition by gender and family status (%)
Sources: Own elaboration of IT-Silc data (2010).
Note: T1 (unidentified resources) results from the difference between total net equivalent and equivalentnet income from labour and pensions, T2 (economies of scale) results from the difference between netequivalent and net per-capita income from labour and pensions; T3 (intra-households transfer) results fromthe difference between net personal and net per-capita income from labour and pensions. All the variablesin the table are divided by the total net household equivalent income to obtain the share of it.Source: Own elaboration of IT-Silc data (2010).
Figure 1 – Intra-household contribution by gender and age

LAVINIA PARISI – FERNANDA MAZZOTTA – CARMEN AINA
30
Relying on how T3 is defined has two important implications for our esti-mates. First, family members with no personal income (e.g. inactive or unem-ployed people), by construction, must benefit from the monetary contributionsof the other members to make consumption equal to the per-capita income. How-ever, to avoid sample bias and misleading interpretations of the estimates, we didnot exclude them from our sample. Second, T3 may vary according to: 1) indi-vidual personal income; 2) personal incomes of every other family componentas they affect household income; and 3) number of family members in the house-hold, which affects both per-capita and equivalent income. The distribution ofthe three types of income by gender and family status are presented in Table 3.
According to the distribution of incomes, what emerges is that womengenerally have lower personal incomes than per-capita incomes (except forfemale household heads) and males have higher personal incomes than per-capita incomes, especially once they are household heads. Table 3 shows thatthe difference between per-capita and personal income is smallest for femalehousehold heads and largest for sons.
3.2 Explanatory variables
To test the effects of the determinants on the dependent variable, namely theindividual monetary contribution, we apply several controls: education level,participation in the labour market, individuals' preferences, cultural and institu-tional aspects, and the role within the family.
The covariates can be grouped into two categories. The first set of explana-tory variables refers to individual characteristics. It includes age, age squared,
Sources: Own elaboration of IT-Silc data (2010).
Table 3 – Income distribution by gender and family status (euros)

INCOME INEQUALITY AMONG FAMILY MEMBERS IN ITALY: WHO GAINS AND...
31
education dummies, area of residence, family status, type of contract, numberof hours spent on caring. The second identifies the set of information relatedto family composition. It includes number of females, number of componentswith permanent and fixed term contracts, number of unemployed, and house-holds not in the labour force. Each of these variables is defined excluding therespondent. In order to account for unpaid work, we include hours spent oncaring3 (for children, elderly, and the household) by each family component.
Table 4 presents a statistical summary of the explanatory variables bygender. The average age of males and females is 48. Three dummies - North,Centre, and South - capture the geographical area of residence: the majorityof our sample lives in the North.
Education dummies are defined according to the International StandardClassification of Education (ISCED). We distinguish particularly betweenlower secondary or compulsory education, upper secondary and tertiary edu-cation. For education, we find no gender differences: more than half of eachsub-sample achieved only compulsory education (about 51%). However, gen-der differences emerge if we account for family status (around 66% of menand 15% of women are household heads). The number of sons is slightlyhigher than the number of daughters (25% vs 21%). With regard to type ofcontract, the percentage of men with a full-time permanent contract is almosttwice that of women (43% vs 22%). Women are mainly inactive because thiscategory includes housewives (about 43% vs 13% of men). Finally, for thevariables on family composition, the descriptive statistics generally do notshow gender differences except for number of women, which is related to theconstruction of the variable which excludes the respondent.
Regardless of any specific characteristics, men are more active thanwomen in equalizing family income (see Table 5).
Table 4 – Descriptive statistics by gender
...Cont’d...
3The variable describes the time spent on household work, child care and care for other depend-ents, and is available only in the IT-Silc 2010 module on intra-household sharing resources.

LAVINIA PARISI – FERNANDA MAZZOTTA – CARMEN AINA
32
4. FINDINGS
4.1 Estimates
The OLS regressions run on the entire sample and on the samples split bygender are presented in Table 6. The dependent variable indicates the share of
Sources: Own elaboration of IT-Silc data (2010).
Table 4 – Cont’d
Table 5 – Mean of T3 by explanatory variables
Sources: Own elaboration of IT-Silc data (2010).
INCOME INEQUALITY AMONG FAMILY MEMBERS IN ITALY: WHO GAINS AND...
33
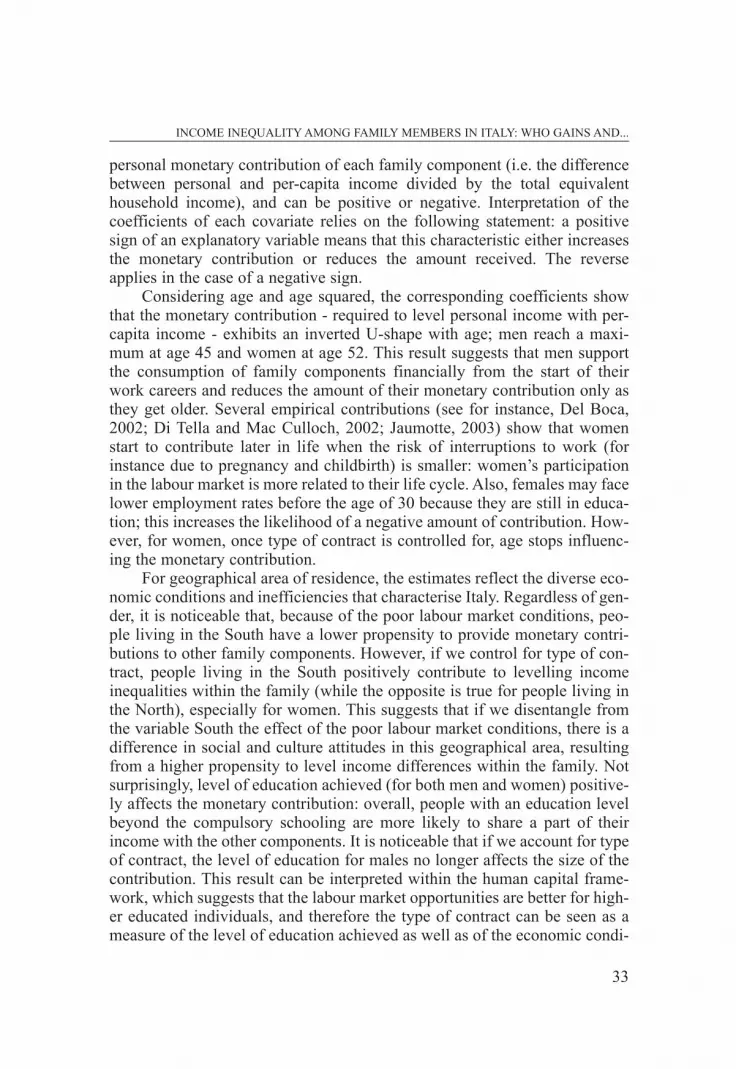
personal monetary contribution of each family component (i.e. the differencebetween personal and per-capita income divided by the total equivalenthousehold income), and can be positive or negative. Interpretation of thecoefficients of each covariate relies on the following statement: a positivesign of an explanatory variable means that this characteristic either increasesthe monetary contribution or reduces the amount received. The reverseapplies in the case of a negative sign.
Considering age and age squared, the corresponding coefficients showthat the monetary contribution - required to level personal income with per-capita income - exhibits an inverted U-shape with age; men reach a maxi-mum at age 45 and women at age 52. This result suggests that men supportthe consumption of family components financially from the start of theirwork careers and reduces the amount of their monetary contribution only asthey get older. Several empirical contributions (see for instance, Del Boca,2002; Di Tella and Mac Culloch, 2002; Jaumotte, 2003) show that womenstart to contribute later in life when the risk of interruptions to work (forinstance due to pregnancy and childbirth) is smaller: women’s participationin the labour market is more related to their life cycle. Also, females may facelower employment rates before the age of 30 because they are still in educa-tion; this increases the likelihood of a negative amount of contribution. How-ever, for women, once type of contract is controlled for, age stops influenc-ing the monetary contribution.
For geographical area of residence, the estimates reflect the diverse eco-nomic conditions and inefficiencies that characterise Italy. Regardless of gen-der, it is noticeable that, because of the poor labour market conditions, peo-ple living in the South have a lower propensity to provide monetary contri-butions to other family components. However, if we control for type of con-tract, people living in the South positively contribute to levelling incomeinequalities within the family (while the opposite is true for people living inthe North), especially for women. This suggests that if we disentangle fromthe variable South the effect of the poor labour market conditions, there is adifference in social and culture attitudes in this geographical area, resultingfrom a higher propensity to level income differences within the family. Notsurprisingly, level of education achieved (for both men and women) positive-ly affects the monetary contribution: overall, people with an education levelbeyond the compulsory schooling are more likely to share a part of theirincome with the other components. It is noticeable that if we account for typeof contract, the level of education for males no longer affects the size of thecontribution. This result can be interpreted within the human capital frame-work, which suggests that the labour market opportunities are better for high-er educated individuals, and therefore the type of contract can be seen as ameasure of the level of education achieved as well as of the economic condi-

LAVINIA PARISI – FERNANDA MAZZOTTA – CARMEN AINA
34
tions. By contrast, women with higher levels of education are shown to con-tribute more than their male counterparts if we include information on eco-nomic status. This result is in line with national statistics that show thatlabour market participation is higher for better educated women (i.e. 58.5%and 72% for upper secondary school and tertiary education, respectively)(ISTAT, 2009), and with the empirical evidence provided by Bratti andStaffolani (2012), which suggests that women with university education tendto have a full-time job.
Each household member has a specific role in the family: householdheads (regardless of gender) are more generous, since they contribute morethan any other household member. Sons show a lower propensity to positive-ly contribute to reduce income inequality compared to other household mem-bers. Also husbands (not classified as household heads) contribute more tolevelling income inequalities, while the opposite is true for wives.
As expected, the results for type of contract show that individuals withpermanent jobs are significantly more likely to share a part of their personalincome within the family. Clearly, intrinsic characteristics associated withthis type of contract - job tenure, higher wage, and better welfare provision -explain why this variable is a good predictor of the propensity to reduceincome inequality within the family. Apart from those with atypical contractforms, part-time workers experience less favourable financial conditions.Those who are not part of the labour market contribute negatively to level-ling income differences, regardless of gender.
Considering the explanatory variables related to the household compo-sition of respondents, excluding the focal respondent, the patterns by genderare quite similar, but the size of the coefficients differs. A unit change in thenumber of women living in a specific household increases the amount anindividual gives to a family component or reduces the amount received,mainly in the case of males. Regardless of gender, the dynamics are similarfor inactive and unemployed members. Overall, independent of the type ofcontract, the higher the number of employed (unemployed) individuals in thefamily, the smaller (greater) is the amount given to (received by) each com-ponent, especially in the case of men.
Finally, family members who are more involved in family activities haveless time to allocate to paid jobs; hence, they can be expected to contributeless than other members to reducing income inequalities, and the unpaidwork is exchanged for monetary contributions from the other family compo-nents.

INCOME INEQUALITY AMONG FAMILY MEMBERS IN ITALY: WHO GAINS AND...
35
4.2 Further investigations
To ease interpretation of the flows of monetary contributions and theamounts potentially received from or given to other family components, we cal-culated predicted values for some individuals. The plots are reported in Figure2. We separate individuals into seven categories according to their economicstatus in the labour market. Workers are categorised according to type of con-
Table 6 – Estimates of monetary contribution using OLS model
Note: * p<.1; **'p<.05; *** p<.01 Reference categories: Centre; Compulsory education; Other members;Permanent full-time.Sources: Own elaboration of IT-Silc data (2010).

LAVINIA PARISI – FERNANDA MAZZOTTA – CARMEN AINA
36
tract (permanent vs temporary), and the work hours (part-time vs full-time);non-workers are categorised as unemployed or inactive. Each value is comput-ed assuming that the monetary contribution will vary with gender, age and rolein the household, for example, household head or child. Household heads andchildren living in the North with upper secondary school diplomas, and theremaining covariates (number of women, of unemployed, of components withpermanent and temporary contracts, and hours spent caring) are held constant;each value is equal to the sample mean. We can provide this graphical infor-mation because economic status is treated as an ordinal variable, that is, weassume that a temporary contract is less good than a permanent contract thusfull-time work is preferable to part-time work. The predicted values are pro-vided by gender for each category; hence, we can only compare between sonsand male household heads and between daughters and female householdheads, taking all the remaining family components as the reference categoryfor each sub-sample.
In general, independent of gender, the predictions highlight that individu-als with more stable work contracts are more likely to support the consumptionof other family components since they will provide a positive monetary contri-bution. As expected, sons contribute less than other male family members anddaughters less than other female family members. Figure 2 shows that the sizeof the contribution increases with age. For instance, in the category of full-timepermanent workers, the contribution of a 50-year-old male household head isbigger than the contribution of a younger household head. A 30-year old house-hold head with a part-time permanent contract contributes up to 74.2% towardsequalising household income differences, rising to about 83.7% at age 60. Thefemale sub-sample shows several differences. The monetary contribution of awoman of the same economic status does not significantly change with age.This might be due to the fact that women are more likely to be hired in sectorswhere career prospects are limited and wage profiles flatten.
Finally, and probably not surprisingly, sons and daughters provide lesssupport to the rest of the family even if they are employed: their monetary con-tribution is positive only if they have a permanent contract.
5. CONCLUSIONS
This paper set out to define and investigate intra-family income differ-ences in Italy. We calculated an indicator using information on personal andhousehold incomes. On this measure, family components can positively con-tribute to promoting equal consumption among family members through thesharing of part of their resources with member(s) with lower personalincomes. Considering that this kind of survey rarely collects data on mone-tary transfers within the family, the empirical evidence is narrow, and pro-

INCOME INEQUALITY AMONG FAMILY MEMBERS IN ITALY: WHO GAINS AND...
37
vides little information on what determines the size of the monetary contribu-tion made to negate family income differences. In this work, in order to pro-vide more evidence on income differences in Italy among family componentswe used 2010 IT-Silc data. We applied an indicator for monetary transferswithin the family and then described the variables for family income differ-ences in Italy. Our focus on the Italian case was driven by the typical house-hold composition in Italy where it is common to find intergenerational co-residence, the tendency of young adults to postpone departure from theirparental home, lower female labour force participation, and disparitiesamongst family components about time spent on household work, child careand care for other members. In order to highlight gender differences, we alsoperformed the regressions separately for men and women.
Our results show that monetary contributions vary by gender. In particu-lar, more educated women are more likely to be able to equalise consumption
Figure 2 – Predicted values by type of contract, gender, whether head of household or spouse or children and age profile
Note: For each predicted value we assume that the individual is living in the North, has achieved highschool diploma level, and is living in a family composed of some women, some unemployed components,some components with permanent and temporary contracts, which is equal to the sample mean. 1 = per-manent full time; 2 = permanent part time; 3 = full-time, not permanent; 4 = permanent part time; 5 = otherworkers; 6 = retired and other inactive; 7 = unemployed.Sources: Own elaboration of IT-Silc data (2010).
LAVINIA PARISI – FERNANDA MAZZOTTA – CARMEN AINA
38
among family components than less educated women. For men, education isnot significant if we introduce economic activities into the regression. In rela-tion to predicted values, we find that men and women behave differentlybased on age. Men provide more support as they get older, but for womenthere are no significant differences across ages. As expected, more stablelabour contracts enhance the probability of making a positive contribution tothe other family members. Regardless of gender, part-time workers have theleast favourable financial conditions. In relation to the children in the family,sons and daughters are more likely to be in need of monetary contributions toachieve the per-capita income level of the other family components.
In summary, what emerges from this exercise is the persistence of gen-der differences in attitudes to removing family income inequalities. In thefamily structure analysed, the estimates confirm the persistence of a model inwhich men are the breadwinners. Individuals more involved in unpaid workhave less time to allocate to a paid job, which enhances the risk of facingincome inequality. Despite employment flexibility and equal wage laws,women’s earnings still lag behind those of men. Only those women who arehigher educated and/or have stable job contracts are able to share a larger partof their income with others in the family. The persistence of gender differ-ences amongst family members suggests that policy interventions implement-ed to promote equal opportunities during the recent years failed once weanalysed the effects at the household level. In fact, the emerging incomeinequality within the family is related to the behaviour of the women, whichis related to the life cycle events (i.e. pregnancy, childbirth, child and familycare, discontinuity in labour force participation), the bargaining power in thefamily, the lack of family friendly schemes, and social and cultural norms (i.e.males as the breadwinners). As a consequence, to overcome income inequal-ities between households, policy makers should define interventions to pro-mote equal opportunities for family members despite their role and gender.
References
ADDABBO T. (1999), “Labor supply and employment probabilities in Italy: Agender analysis in a regional perspective”, Economia e Lavoro, 33:189–207.
AINA C., MAZZOTTA F., PARISI L. (2010), “Do Flexible Employment ContractsChange Household Income Differences in Italy?”, Working Papers 129,SEMEQ Department – Faculty of Economics – University of EasternPiedmont.

ATKINSON A., BRANDOLINI A. (2001), “Promise and Pitfalls in the Use of Sec-ondary Data-Sets: Income Inequality in OECD Countries as a CaseStudy”, Journal of Economic Literature, 39(3): 771-779.
BECKER G. (1965), “A Theory of the Allocation of Time”, The Economic Jour-nal, Vol. 75(299): 493-517.
BECKER G. (1974), “ATheory of Social Interactions”, Journal of Political Econ-omy, 82(6): 1063-1093.
BECKER G. (1981), “Altruism in the Family and Selfishness in the MarketPlace”, Economica, 48 (1): 1-15.
BECKER S., BENTOLILA S., FERNANDES A., ICHINO A. (2010), “Youth emancipa-tion and perceived job in security of parents and children”, Journal of Pop-ulation Economics, 23(3): 1047-1071.
BELLOC F. (2009), “Are we really mama’s boys? How incomes affect Italians’leaving home decisions”, Journal of Income Distribution, 18(3): 63-78.
BERNHEIM B. D., SHLEIFER A., SUMMERS L.H, (1985), “The Strategic BequestMotive”, Journal of Political Economy, 93: 1045-76.
BOWEN W.G., FINEGAN T.A. (1969), The Economics of Labor Force Participa-tion, Princeton: Princeton Univ. Press.
BRATTI M., STAFFOLANI S. (2012), “A microeconometric analysis of femalelabour force participation using Italian Quarterly Labour Force Surveydata”, forthcoming in ADDABBO T., SOLINAS G., Non-Standard Employ-ment and Quality of Work. The Case of Italy, Physica-Verlag.
BROWNING M., BOURUIGNON F., CHIAPPORI P.A., LECHENE V. (1994), “Incomeand Outcomes: A Structural Model of Intra-household Allocation”, Jour-nal of Political Economy, 102 (6): 1067-1096.
BROWNING M., CHIAPPORI P.A. (1998), “Efficient Intra-Household Allocations:A General Characterization and Empirical Tests”, Econometrica, 66 (6):1241- 1278.
CIGNO A. (1993,) “Intergenerational transfers without altruism : Family, mar-ket and state”, European Journal of Political Economy, Elsevier, 9(4):505-518.
CHIN S.H. (1995), “The determinants and patterns of married women’s laborforce participation in Korea”, Korea Journal of Population and Develop-ment, 24(1): 77-89.
CHIURI M.C. (2000), “Quality and demand of child care and female labor supplyin Italy”, Labour, CEIS, Fondazione Giacomo Brodolini and Wiley Black-well Ltd., 16: 97-118.
COLOMBINO U., DI TOMMASO M.L. (1996), “Is the Preference for Children soLow or is the Price of Time so High? A simultaneous model of fertility andparticipation in Italy with cohort effects”, Labour, CEIS, Fondazione Gia-como Brodolini and Wiley Blackwell Ltd., (10)3: 475-493.
LAVINIA PARISI – FERNANDA MAZZOTTA – CARMEN AINA
39

COX D. (1987), “Motives for Private Income Transfers,» Journal of PoliticalEconomy”, University of Chicago Press, 95(3): 508-546.
DEL BOCA D. (1993), Offerta di lavoro e politiche pubbliche. Roma: NIS.DEL BOCA D. (1997). “Intrahousehold distribution of resources and labor mar-
ket participation decisions”, in PERSSON I., JONUNG C., Economics of thefamily and family policies, London: Routledge Press, 65-68.
DEL BOCA D. (2002), “The effect of child care and part-time opportunities onparticipation and fertility decisions in Italy”, Journal of Population Eco-nomics, 15 (3): 549-573.
DEL BOCA D., LOCATELLI M. (2008), “Motherhood and Participation”. in DELBOCA D., WETZELS C., Social Policies, Labor Markets and Motherhood,Cambridge University Press, 155-180.
DEL BOCA D., SAUER R.M. (2009), “Life cycle employment and fertility acrossinstitutional environments”, European Economic Review, 53: 274-292.
DI TELLA R., MACCULLOCH R. (2002), “Informal Family Insurance and TheDesign of the Welfare State”, The Economic Journal, 112(481): 481-503.
ENGELHARDT H., PRSKAWETZ A. (2004), “On the Changing CorrelationBetween Fertility and Female Employment over Space and Time”, TheEuropean Journal of Population, 20: S35-S62.
FINDLAY J., WRIGTH R.E. (1996), “Gender, Poverty and the Intra-Household Dis-tribution of Resources”, Review of Income and Wealth, 42(3): 335-351.
GAUTHIER, A.H., HATZIUS J. (1997), “Family Benefits and fertility: An econo-metric analysis”, Population Studies, 51: 295-306.
GILBERT, G., BECKER G.B. (1975), “The Allocation of Time and Goods over theLife Cycle”, NBER Chapters, in: The Allocation of Time and Goods overthe Life Cycle, National Bureau of Economic Research, Inc., 1-45.
HADI A.S. (1992), “Identifying multiple outliers in multivariate data”, Journal ofthe Royal Statistical Society, Series (B), 54: S761-771.
HADI A.S. (1994), “A Modification of a method for the detection of outliers inmultivariate samples”, Journal of the Royal Statistical Society, Series (B),56: 393-396.
HECKMAN J.J., MACURDY T. (1980), “A Life Cycle Model of Female LabourSupply”, The Review of Economic Studies, 47(1): 47-74.
IACOVOU M., PARISI L. (2009), “Leaving home”, in ERMISCH, J., BRYNIN, M.,Changing Relationships, Routledge: New York, London, 59-72.
ISTAT (2009), Rilevazione sulle Forze di Lavoro, Roma. JAUMOTTE F. (2003), “Labour Force Participation of Women: Empirical Evi-
dence on the Role of Policy and Other Determinants”, OECD Countries,OECD, Economic Studies, 37: 54-108.
JENKINS S.P. (1991), “Poverty Measurement and the Within-household Distrib-ution: Agenda for Action”, Journal of Social Policy, 20: 457-483.
LAVINIA PARISI – FERNANDA MAZZOTTA – CARMEN AINA
40

JIANOKOPLOS N.A., BERNASEK A. (2008), “Family financial risk taking when thewife earns more”, Journal of Family and Economic Issues, 29: 289-306.
KILLINGSWORTH M.R., HECKMAN J.J. (1986), “Female Labor Supply: A Survey“,in ASHENFELTER O., LAYARD R., Handbook of Labor Economics, Chapter2, Volume I, Elsevier Science Publishers B V, 1986 Press.
MANACORDA M., MORETTI E. (2006), “Why do most Italian Youths Live withtheir Parents? Intergenerational Transfers and Household Structure”, Jour-nal of the European Economic Association, 4(4): 800-829.
MACURDY T.E. (1981), “An Empirical Model of Labor Supply in a Life-CycleSetting”, Journal of Political Economy, 89(6): 1059-1085.
MAZZOTTA F. (2007), “Disoccupazione e povertà giovanile: il ruolo del back-ground familiare”, Economia & Lavoro, Maggio Agosto 2007, 2: 35-59.
MUSSIDA C., PICCHIO M. (2012), “The Gender Wage Gap by Education in Italy”,IZA Discussion Papers 6428, Institute for the Study of Labor (IZA).
OECD (2001), Ageing and Income: Financial Resources and Retirements in nineOECD Countries, Social Issues, Paris.
PARISI L. (2008), “Leaving Home and the Changes of Being Poor: The case ofYoung People in Southern European Countries”, Labour, CEIS, Fon-dazione Giacomo Brodolini and Wiley Blackwell Ltd., 22(s1): 89-114.
SAMUELSON P. (1956), “Social Indifference curves”, Quarterly Journal of Eco-nomics, 70 (1): 1-22.
LAVINIA PARISI – FERNANDA MAZZOTTA – CARMEN AINA
41


