Embed Size (px)
Citation preview
Incorporating Data and Theory inRoundwood Supply and Demand
stimationLauri Hetemeki and Jari Kuuluvarnen
This paper examines the aggregate pulpwood market in Finland using the econometricapproach advocated by Hendry, Neale, and Joba and Spanos, who propose a
statistically consistent way to estimate simultaneous-equations models. Privatenonindustrial timber supply is estimated along with a three-input demand function(capital, labor, and wood). Results indicate that short-term supply reacts positively to an
increase in stumpage price, while the long-term (total) elasticity is negative and small inabsolute terms. Capital is a complement while labor is a substitute for roundwood input.Dynamic adjustment process, substitution and cross-price effects, and capital marketimperfections implied by the present study differ from those obtained in previousresearch.
Key words: roundwood markets, simultaneous-equations model, statistical validity.
Since the pioneering study by McKillop, a num-ber of econometric analyses of roundwood andforest product markets have appeared in the U.S.(Adams and Haynes; Newman) and in Scandi-navia (Brdnnlund, Johansson, and Lofgren; Ku-uluvainen et al.; Hultkranz and Aronsson). Al-though these studies have greatly increased ourunderstanding of the basic relationships affect-ing roundwood markets, recent developments intime-series methods and simultaneous-equationsestimation (Engle and Granger; Hendry, Neale,and Srbal 1988, Phillips and Durlauf; Spanos1990) provide new insights. For example, as-sumptions made in earlier studies concerningshort-term dynamics, substitution and cross-priceeffects, and effects of capital market imperfec-tions on nonindustrial private wood supply canbe examined in a more systematic way.
The purpose of this paper is to provide newevidence on the functioning of the pulpwoodmarket in Finland. The study should also be ofgeneral interest for empirical applications of smallsimultaneous equations systems. We apply re-cent advances in time-series econometrics and
Lauri Hetemiiki and Jari Kuuluvainen are research economists atthe Department of Forest Resources, Finnish Forest Research In-sitiute.
The authors gratefully acknowledge helpful comments from Dar-ius Adams, David Newman, and Ville Ovaskainen. We also wantto express our gratitude to the late Jorma Salo for valuable contri-butions to Finnish roundwood market studies. The first author ac-knowledges finanical support from the Academy of Finland.
simultaneous-equations estimation as proposedby Hendry, Neale, and Srba (1988) and Spanos(1990) (hereafter the HS approach) to estimatedemand for and supply of pulpwood using an-nual data from 1960 to 1988. Results are com-pared with an earlier specification of the pulp-wood market (Kuuluvainen et al.), which wereestimate using a number of tests not previ-ously employed in roundwood market studies.The new model implies revisions of several hy-potheses concerning the pulpwood market.
Theoretical Model of Pulpwood Market
Nonindustrial private forest (NIPF) owners arethe main suppliers of raw material to forest-basedindustries in Finland (see Kuuluvainen et al. fora description of the institutional framework ofthe Finnish pulpwood market). Assuming im-perfect capital markets (Kuuluvainen), or un-certainty (Koskela), optimal timber supply andconsumption must be decided simultaneously.Variables affecting optimal consumption deci-sions also affect optimal harvest decisions. Us-ing a two-period Fisherian consumption-savingsmodel for optimal harvest decisions under se-lective credit rationing, the behavioral supplyequation becomes (Kuuluvainen and Salo)
,1 \ Qi: Q' (P,, P,*t, R,+ t, V,, 1,, I,*r, 8,, 6S(r/ +/- -/+ -/+ + - + +
Copyright 1992 American Agricultural Economics Association
H etemciki and Kuuluvainen
where P, is pulpwood price net of harvest costs(i: t, t + l), R,*, is market interest rate, V, isstock of growing merchantable timber, 1, is ex-ogenous nonforestry income (i : t, t + 1;, B isexogenous credit limit faced by an individualforest owner, 6 is subjective rate of time pref-erence, and pluses and minuses refer to hypoth-esized coefficient signs.
Under selective credit rationing, effects ofprices and interest rate cannot be determined apriori. The price effect of the credit-rationedforest owner contains both a positive substitu-tion effect and a negative income effect. Thesign of the interest rate is undetermined becausefor credit-rationed suppliers its effect is negativebut for nonrationed ones positive. Implicationsof other types of market imperfections are sim-ilar to those of selective credit rationing. Theessential point is that, in the presence of marketimperfections, forest owners' income also af-fects supply. When aggregated data are used, itis reasonable to assume that neither credit ra-tioning faced by individual forest owners nor thesubjective rate of time preference have a sys-tematic pattern over time. Further, because it isnot generally possible to measure these vari-ables with aggregated data, they are not in-cluded in the empirical analysis. The allowabledrain series is used to approximate the stock ofgrowing timber (see appendix).
Paper industry output can be described usingthe production function
(2) Y, : F(K, L, Q)
where K is capital input, L is labor input, and
Q is the wood raw-material input needed to pro-duce an amount Y, of final product. It is im-plicitly assumed that K, L, and Q inputs areweakly separable as a group from the residualinputs (materials and energy). Firms in the pulpand paper industry are assumed to sell finalproducts on competitive export markets at givenprices PX,. lgnoring raw material inventory de-cisions and uncertainty in short-term productiondecisions, the profit-maximrzing problem of therepresentative firm can be used to derive theshort-term demand function for pulpwood(Brrinnlund, Johansson, and Lofgren):
,.\ Qf : Qo (PX,, P,, w,, c,)(r/ + +/-+/-where Ql it demand for pulpwood, PX,is exportprice of final products, P, is stumpage price, W,is unit labor cost, and C, is price of capital. Ef-fects of wages and capital are uncertain because
Roundwood Supply and Demand l0l I
we cannot deduce a priori whether roundwoodis a technical complement or a substitute for theseinputs.
Research Results
The modeling strategy is determined by the time-series properties of the data. For example, "er-ror coffection" or "cointegration" models havebecome popular for analyzing nonstationary timeseries data (Engle and Granger; Hendry and Er-icsson). Further, for statistical validity it is im-portant to know whether the series are stationaryor not (Phillips; Phillips and Durlauf). Thus wecomputed the autocorrelation functions and au-toregressive processes of our series and testedtheir normality and stationarity. Logarithmictransformations of the original (annual) seriesfrom 1960 to 1988 are used and all price seriesare deflated (see appendix).
Properties of Time Series
Time-series properties were examined by com-puting for each series the autocorrelation func-tions, autoregressive processes (AR), distribu-tion functions, Jarque-Bera normality test(Hendry 1989), Dickey-Fuller test (Fuller),modified Dickey-Fuller test (DF*) (Perron), andDurbin-Watson unit root test (CRDW) (Bhar-gava, Engle and Granger).
Results (reported in Hetemiiki and Kuuluvai-nen) of the autocorrelation functions showed thatuser cost (C,), wages (%), exogenous income(1,), and allowable drain (%) levels are not sta-tionary. However, their first differences appearto be stationary, and they can be regarded as
1(l) series. All the other series appear to be 1(0).Results of regressing each level series on its fiveown-lags indicated that all the series follow a
first-order autoregressive tAR(1)l process.According to the DF and CRDW test, the Q,
series follows a 1(0) process, the P, series beingjust below the 57o critical values, while all otherseries are clearly nonstationary. The DF* testshowed that if the one-time changes (1967 de-valuation and 1973 oil crisis) are filtered out anda time trend is included, all series except W, andV, are 1(0). Thus, nonstationarity, apparent inmany expanding roundwood markets (Brdnnlund,Johansson, and Lofgren, and Newman), is nota problem for the Finnish pulpwood market dataused here. Therefore, cointegration models arenot relevant for modeling pulpwood supply and
l}l2 November 1992
demand in the present study (Engle and Gran-ger). Tests on W, and C, on the one hand, andon % and I, on the other, indicated that althoughthe series themselves are 1(1), their linear com-binations are stationary (i.e., they are cointe-grated).t Thus their OLS estimates are asymp-totically (super) consistent, but their distributionsare nonnormal.
Statistical and Econometric Model
Following Hendry, Neale, and Srba (1988) andSpanos (1990), we draw a distinction betweenthe statistical model (system or reduced form)and the econometric model of the system. Thestatistical model is defined by the relevant vari-ables suggested by theory, by the variables' sta-tus (modeled versus nonmodeled variables), andby the lag polynomials involved. The statisticalmodel summarizes the sample information andensures the statistical assumptions are valid forthe data used. If the reduced form is not statis-tically valid, there is little point in imposing fur-ther restrictions on it, because tests thereof willbe against an invalid baseline. Once the reducedform has been found to be statistically adequate,the structural model is derived through imposingzero restrictions implied by theory. Validity ofthe structural econometric model is judged onthe basis of overidentifying restrictions and di-agnostic tests.
In the process of model specification, the HSapproach emphasizes statistical adequacy ratherthan the modeler's subjective decisions. For ex-ample, the problem of "multiple hypotheses"-too many structural models supporting the data-is tackled in a systematic framework. To makestructural models directly comparable, a com-mon statistical moddl (reduced form) is first es-timated and its statistical validity checked. Sec-ond, the overidentifying restrictions implied bytheoretical hypotheses and their statistical valid-ity are tested. Among the models that survivethe first two stages, selection is made on the ba-sis of parameter constancy, parsimony, and theencompassing test (Hendry 1988).
Statistical Model
Supply and demand equations (1) and (3) de-termine the basic variables to be included in our
Amer. J. Agr. Econ.
statistical model, but dynamics are dictated bythe data. Even in the case of a "two-period" the-oretical pulpwood supply equation, it is not pos-sible to derive a priori the explicit adjustmentprocess. Theory does not specify how quicklyagents react to changes in prices and the choiceof expectations structure is ad hoc. We make noa priori assumptions about dynamic behavior andconsequently do not address the role of expec-tations explicitly.
Short-term dynamics are taken into accountby including lagged variables. Because of thesmall sample size and large number of vari-ables, only a limited number of lags can be in-troduced simultaneously. Based on experimentswith differing lag structures, a system consistingof (4) and (5) was found (using tests similar tothose reported in table 1) to be statistically themost adequate summary of the sample infor-mation:
(4) P,: do * arQ,-t -f arQ,-, * a3P,-1I aoPX, I a5R, I a6R,-1 I arl,
I asV, * aeW,l arsC, * a,
(5) Q,: Fo i FrQ,-, * QrQ,-, t FtP,-r+ B4P& * FrR, * FuR,_r t FrI,r Brv, * Fnw, * Broc, r u,
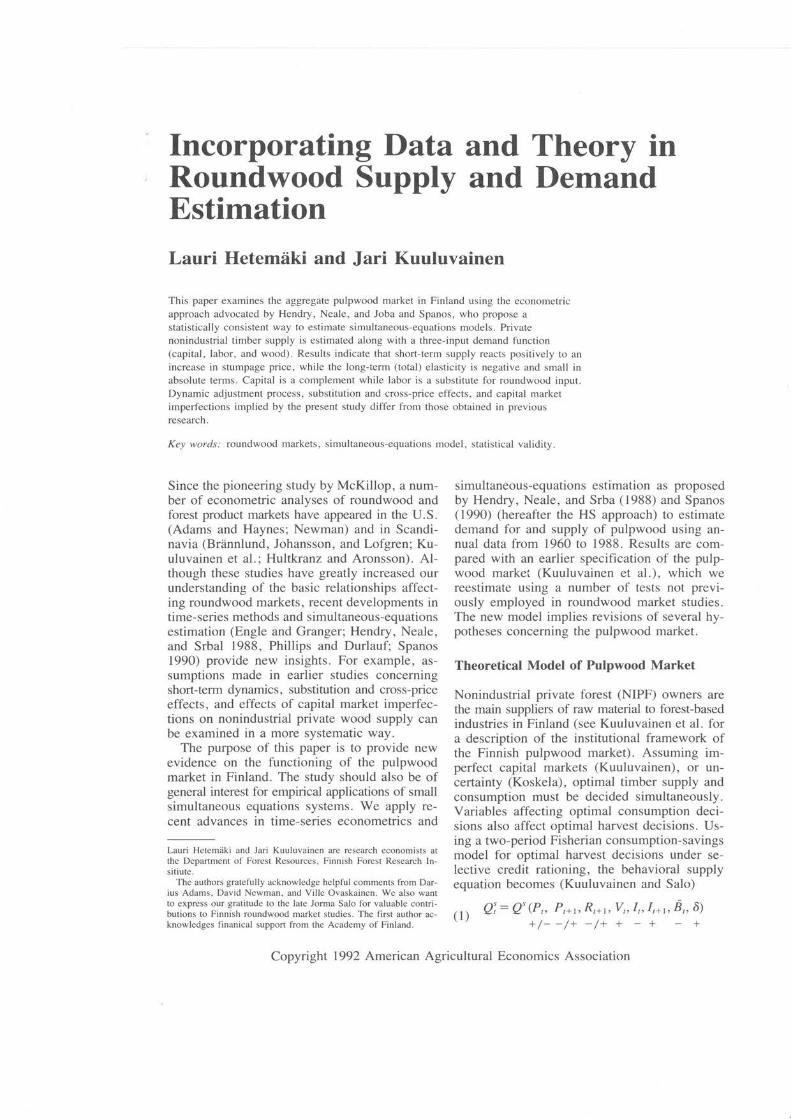
where a, and ut are error terms (:/N(0, a')).Because the reduced form is a statistical sum-mary of sample information, parsimony is notrequired at this stage and the model is deliber-ately overparametefized. When estimated withOLS, (4) and (5) passed all tests derived fromthe classical assumptions of a linear regressionmodel (see table 1). However, because of thesmall sample srze, precise estimation of re-duced-form parameters is not possible.
Econometric Model
The structural supply equation was derived byimposing on (4) the zero restrictions implied by(1). The demand equation was derived by im-posing on (5) the zero restrictions suggested by(3). However, we were unable to find a statis-tically valid demand equation when the exportprice (PX,) was included explicitly in the struc-tural model.2 High collinearity of the real exportprice and real stumpage price indicates that fluc-tuations in export prices are transmitted to stum-
I Although the DF* test indicates the lV, series is not 1(0), whileC, is 1(0), DF and CRDW tests show that these series are both 1(1)and cointegrated. As the structural changes are not filtered out inour estimates, the cointegration result appears reasonable.
' When export price was included in the reduced form instead oflagged stumpage price, the structural form did not pass the overi-dentifying test and the demand equation fitted the data poorly with2SLS.
H etemciki and Kuuluvatnen
Table 1. Estimated OLS1960-1988
Roundwood Supply and Demand l0l3
Results for Reduced Form Equations (Statistical Model)'
P,: -8.14+0.42P, t+O.O9Q, I
(1.02) (1.e6) (0.50)
Q,: -9.12 - .82P, | + .29Q,-r(1. 14) (3.80) (1.69)
Model RSS R2
+o.14Q,2+0.25C,(o.77) (0.33)
- .12Q,_, + .45C,(0.59) (0.s9)
DW F,O'
- o.o7w, - o.27t, + 0.0IR,(0. l8) (0.36) (o.es)
- .33W, - .051, + .003R, -(0.88) (0.06) (0.33)
xiF
- 0.01R, | + 0.66v, + l.35PX,(1.34) (0.28) (2.r2)
.004R, | + 3.06V, + .34PX,
Q.44s) (r.32) (0.s3)
F, Fu,,h
P,df.Q,df.
Notes: d/ denotes degrees of freedom. Symbols of test statistics are explained in the appendix; /-statistics are in paren-
theses, P, is stumpage price, Q, is pulpwood quantity, C is user cost, W, is wages, 1, is disposable income, R, is bank
lending rate, V, is allowable drain, and PX, is export price.
0.40
0.40
0.74
o.15
2.OO
3,132.16
3, 13
0.082
1.382
4.6610,16
4.7410, l6
0.201,15
2.87l,l5
0.633,10
0.283,10
1.99
2.O7
page prices (Forsman and Heinonen). Becausethe demand equation is homogeneous of degreezero in product and factor prices, one of the pricescan be factored out. We used the production priceindex in the demand equation as a proxy for theprice of "other inputs" (energy and residual ma-terials) and the export price, and consequentlyas a deflator. Because the production price in-dex is almost identical to the nominal export priceseries, export price information is implicitly in-cluded. However, we are not able to obtain an
estimate for the elasticity of demand with re-spect to the export price.
On the basis of several diagnostic tests (tables2 and 3) the structural model was derived as
(6) Qi : as I a1P, * arP,-t I aJ,t aoV, * arAR, * a6AQ,-, I €,
e,: IN(o, 02)
(7) Ql : Fo + F,P, * FrP,-, t FrW,t FoC, * FsQ,-t * lt,
tr,: IN(O, a2).
Both supply and demand equations include vari-ables that are 1(1) series. Because the I, and V,
series in (6) are cointegrated, as are W, and C,in (7), their parameter estimates are asymptoti-cally super consistent, but the distribution of their/-values is nonstandard (Fuller; Engle and Gran-ger). Equations (6) and (7) were estimated withOLS, Recursive lrast Squares (RLS), 2SLS, and3SLS. Because 3SLS results did not differ sig-nificantly from 2SLS, we report only the latter.
Supply Results
Estimated results for supply equation (6) (re-ferred to as SIA and SIB) are given in table 2.Reestimations of the pulpwood supply equation
of Kuuluvainen et al., where
(8) Q,: Qo * 6,P, t QrP,-t + OTSPI* QoQ,_, * $rAI, t rr,
are also reported in table 2 (refened to as S2Aand S2B). In (8), adaptive pulpwood price ex-pectations are assumed, the cross effect from thesawtimber stumpage price (.SP,) is specified, anddisposable income is included as a first differ-ence.' Estimates of the Kuuluvainen et al. modelwere originally computed for the period 1965-1985 using 2SLS, employing a correction forautocorrelation. Here we have reestimated it forthe period 1960-1988 without the autocorrela-tion correction.
Estimated parameters of the 1(0) variables in(6) are significant using OLS. The overidenti-fication test (72o, - test) in 2SLS estimates in-dicated the restrictions imposed on the reducedform are valid. This implies that the structuralmodel parsimoniously encompasses the unre-stricted reduced form (Hendry 1988). Parameterestimates are not very sensitive to estimationmethod, except for the stumpage price variable.All other coefficients are of similar magnitudeand l-values show that 2SLS does not increaseefficiency. OLS produces markedly higher r-
values of some of the parameters (P,, P,-r, V,,
4R,) than does 2SLS.Comparing OLS results of the two alternative
modeling approaches, one can see that the newspecification (SlA) has a better fit than the oldone (S2A). Further, model S1A is a statisticallyvalid representation of the data, while model S2Ais not. S2A does not pass the F-test (F*o.) for
3 According to the omitted variable test, the cross effect of thesawtimber stumpage price was not significant and was omitted fromthe new specification (6) of the supply function.
1Ol4 November 1992
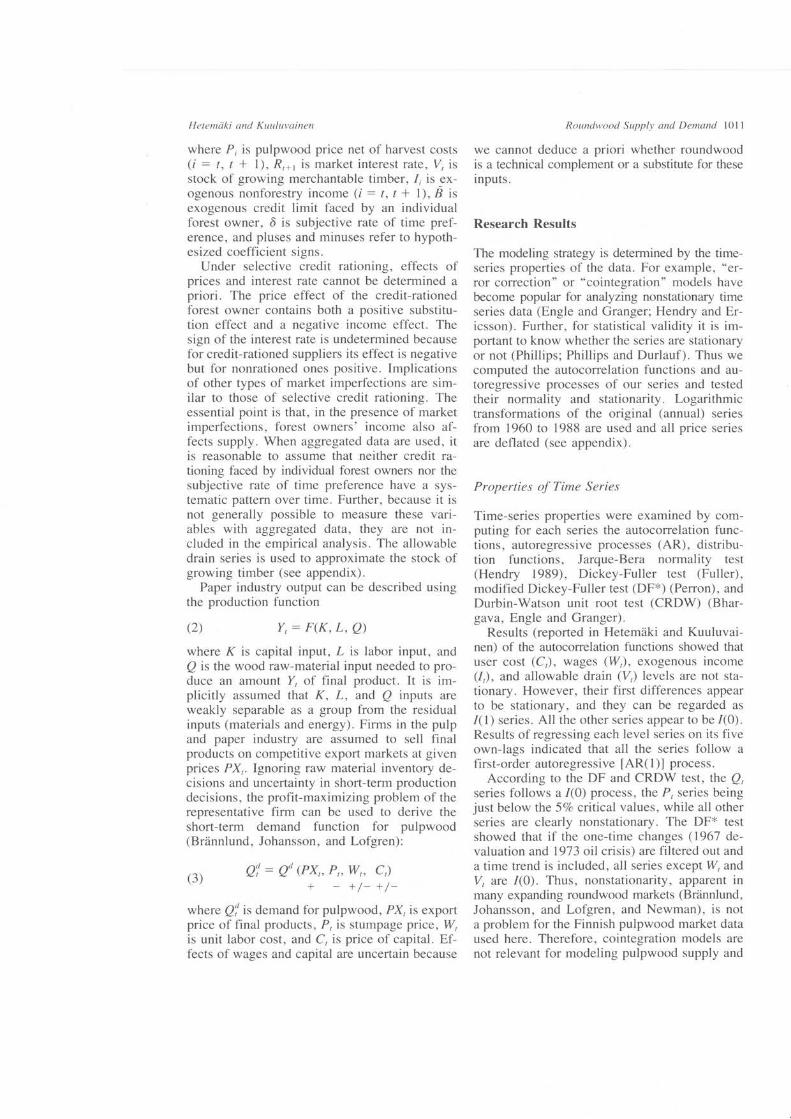
Table 2. Estimated Results for Supply of Pulpwood, 1960-1988
Amer. J. Agr. Econ.
Independentvariable
S1AOLS
SIB25LS
S2B25LS
S24'OLS
Constant
Pulpwood price, P,
Lagged pulpwoodprice, P,-1Disp. income, I
4 Disp. income, 41,
Allowable drain, V,
Lagged endogenousvariable, Q,-1A Lagged endog.variable, AQ,-14 Interest rate, AR,
Sawtimber price, SP,
-7.08(4.16)0.6s
(4.es)- 1.01(8.68)
-0.59(2.8s)
4.41(s.24)
o.2l(2.48)
-0.01(2.37)
-7.42(3.76)0.81
(r.86)- 1.08(4.ee)
-0.68(2.1s)
4.66(4.30)
o.22(2.3e)
-o.o2(1.63)
3.26(2.73)0.53
(2.s7)-o.82(s.2o)
-0.14(-0.19)
o.44(3.34)
-o.r2(0.46)
2.O0( 1 .8s)0.07
(0.17)
-0.61(2.7o)
-0.40(0.4e)
0.49(3.28)
0.20(0.57)
Model FfF,2
X"R, DW F ,o,
SIAdf.S24df.
0.21
o.54
0.85
0.66
1.94 0.333,17
1.29 4.t23,19
1.2020.332
22.36,20
8.49\))
1.33r,l9
7.54t,20
o.23 0.663,14 3,17
o.t7 0.963,16 3,19
Model2
Xi DW x?".2
X" Xtr:o2
Xoi F or"h
2
XT
SlBdf.S28df.
o.22
0.66
o.44(2)/2
5.29(2)/2
1.80 0.11 0.854 2188(3)/3 2 (7)/7
1.60 4.O9 0.49 968(3)/3 2 (6)/6
8.475
32.464
0.05 1. 19
3,r4 (3)/3o.45 1.84
3,t6 (3) /3
Notes: d/. denotes degrees of freedom. Symbols of test statistics are explained in appendix;2 t-statistics are in parentheses. Because ofthe different estimation methods, A and B models have different test statistics.
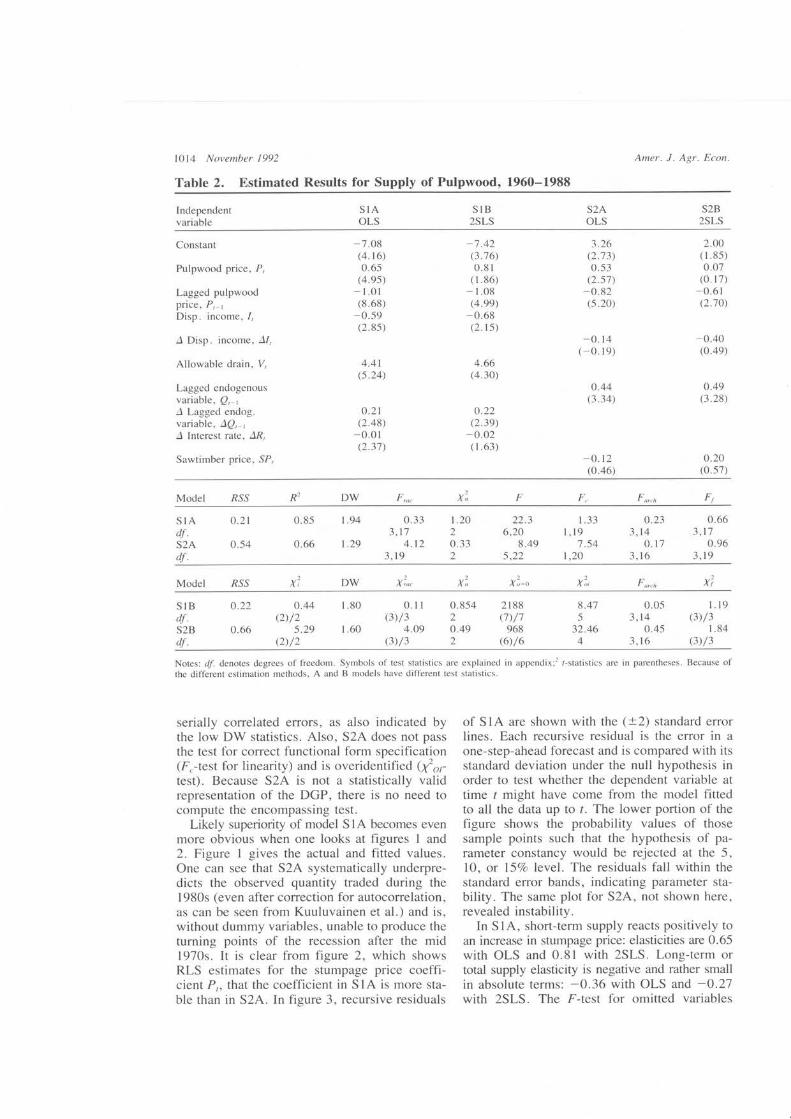
serially correlated errors, as also indicated bythe low DW statistics. Also, S2A does not passthe test for correct functional form specification(F.-test for linearity) and is overidentified (f o,test). Because S2A is not a statistically validrepresentation of the DGP, there is no need tocompute the encompassing test.
Likely superiority of model SIA becomes evenmore obvious when one looks at figures 1 and2. Figure 1 gives the actual and fitted values.One can see that S2A systematically underpre-dicts the observed quantity traded during the1980s (even after correction for autocorrelation,as can be seen from Kuuluvainen et al.) and is,without dummy variables, unable to produce theturning points of the recession after the mid1970s. It is clear from figure 2, which showsRLS estimates for the stumpage price coeffi-cient P,, that the coefficient in S1A is more sta-ble than in S2A. In figure 3, recursive residuals
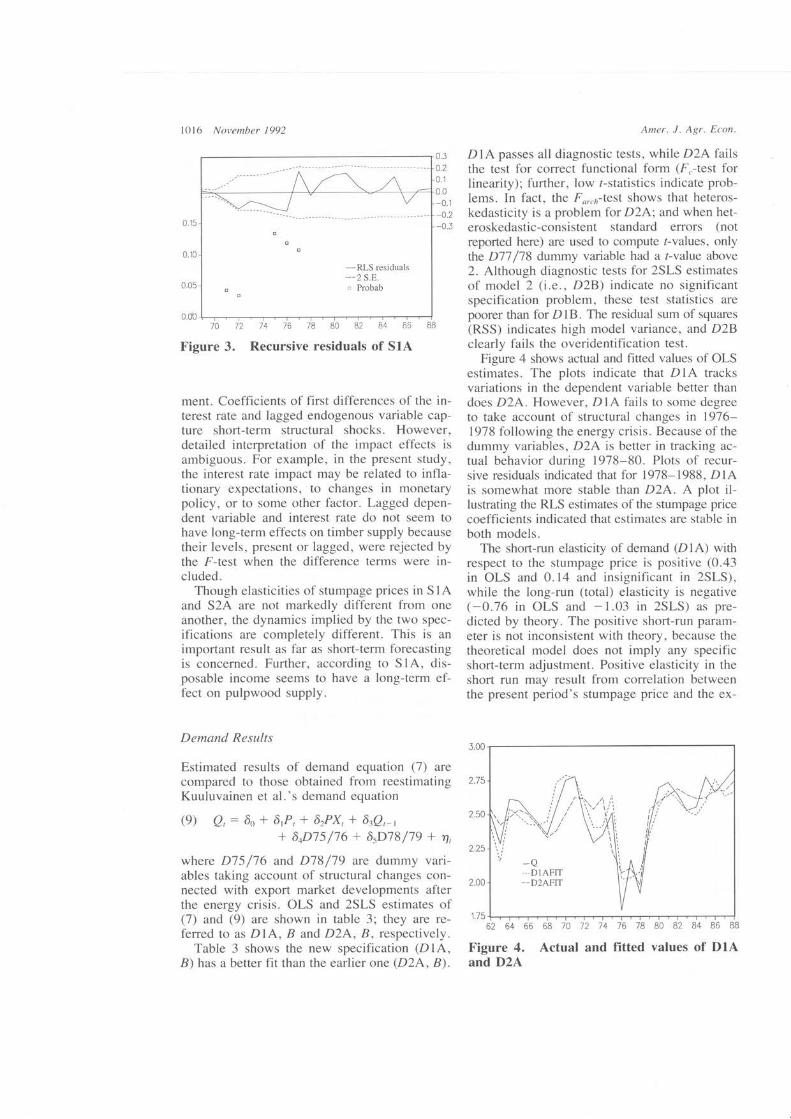
of S1A are shown with the (!2) standard efforlines. Each recursive residual is the error in a
one-step-ahead forecast and is compared with itsstandard deviation under the null hypothesis inorder to test whether the dependent variable attime / might have come from the model fittedto all the data up to r. The lower portion of thefigure shows the probability values of thosesample points such that the hypothesis of pa-rameter constancy would be rejected at the 5,10, or 157o level. The residuals fall within thestandard error bands, indicating parameter sta-bility. The same plot for S2A, not shown here,revealed instability.
In SlA, short-term supply reacts positively toan increase in stumpage price: elasticities are 0.65with OLS and 0.81 with 2SLS. Long-term ortotal supply elasticity is negative and rather smallin absolute terms: -0.36 with OLS and -0.27with 2SLS. The F-test for omitted variables
Hetemciki and Kuuluvainen
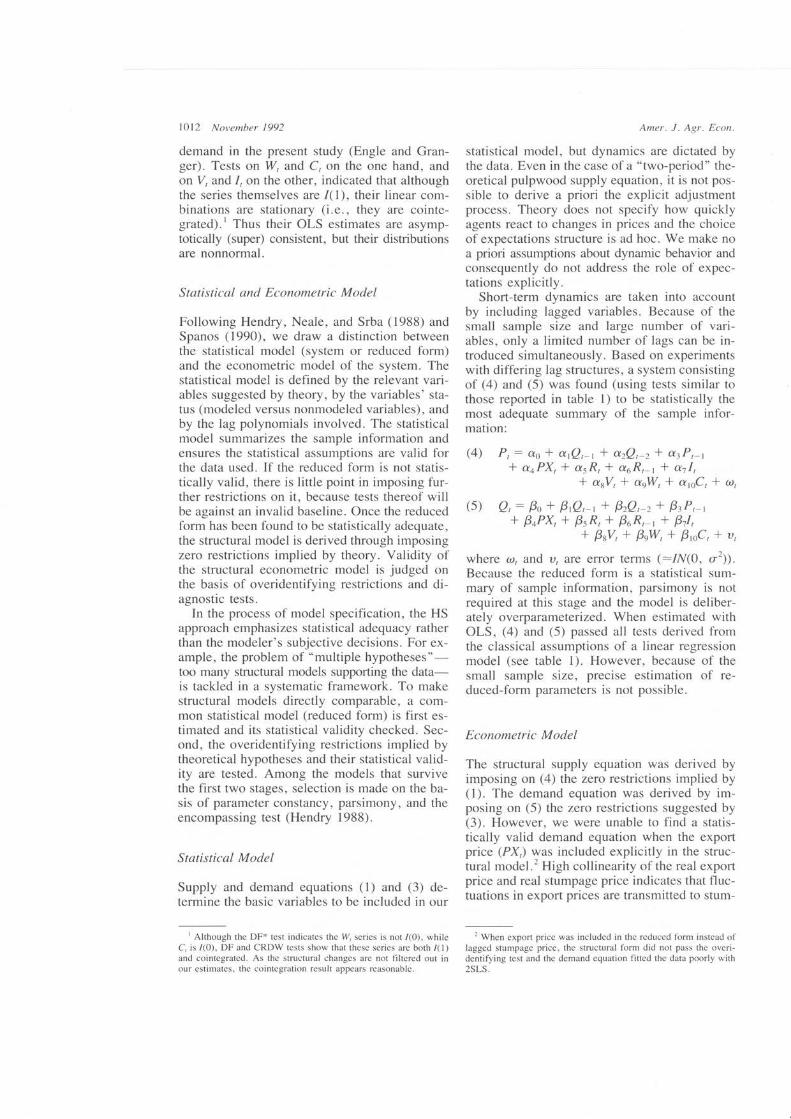
Table 3. Estimated Results for Demand for
Roundwood Supply and Demand l0l5
Pulpwood, 1960-1988
Independentvariable
DIAOLS
DIB2SLS
D2AOLS
D2B25LS
Constant
Pulpwood price, P,
Export price, PX,
Lagged pulpwoodprice, P,-,Lagged endogenousvariable, Q,-,User cost, C,
Wage, W,
D7s/76
D77 /78
3.83(s.34)0.43
(3.21)
-0.92(6.13)0.35
(3.2s)-o.34(0.e8)0.38
(2.48)
4.54(4.84)0.t4
(0.4e)
-0.79(3.83)0.36
(2.83)
-0.24(0.se)0.37
(2.1o)
-2.22(0.6e)0.39
( 1 .87)0.36
(0.80)
0.09(0.s4)
-6.96(1.48)
-0.35(0.77)1.29
(1.76)
0.30(1.28)
-0.69(4.47)
-0.59(3.71)
-0.48(2.ts)
-0.40(r.80)
Model R2 DW F,o, F"2
X" F or"n Ff
DlAdf.D2Adf.
0.35
0.56
0.78
0.65
r.64
2.O9
1.153,19
0.703,t9
L7t20.302
15.705))
8.065))
3. l81,21
1.06I,21
0.153,16
4.003,16
0.673,19
0.063,19
Model X? DW Xt", Xi Xt":o2
Xoi XiF or"h
DIBdf.D2Bdf.
1.99(3)/3
2.77(2)/2
1.80
2.52
1408(6)/6
734(6)/6
8.475
32.464
0.333,15
l 9l3,16
0.65(3)/3
0.15(3)/3
o.42
0.87
0.95 2.21(3)/3 2
3.3s 0.69(3)/3 2
Notes: d/. denotes degrees of freedom. Symbols of test statistics are explained in apppendix;2 t-statistics are in parentheses. Because ofthe different estimation methods, A and B models have different test statistics.
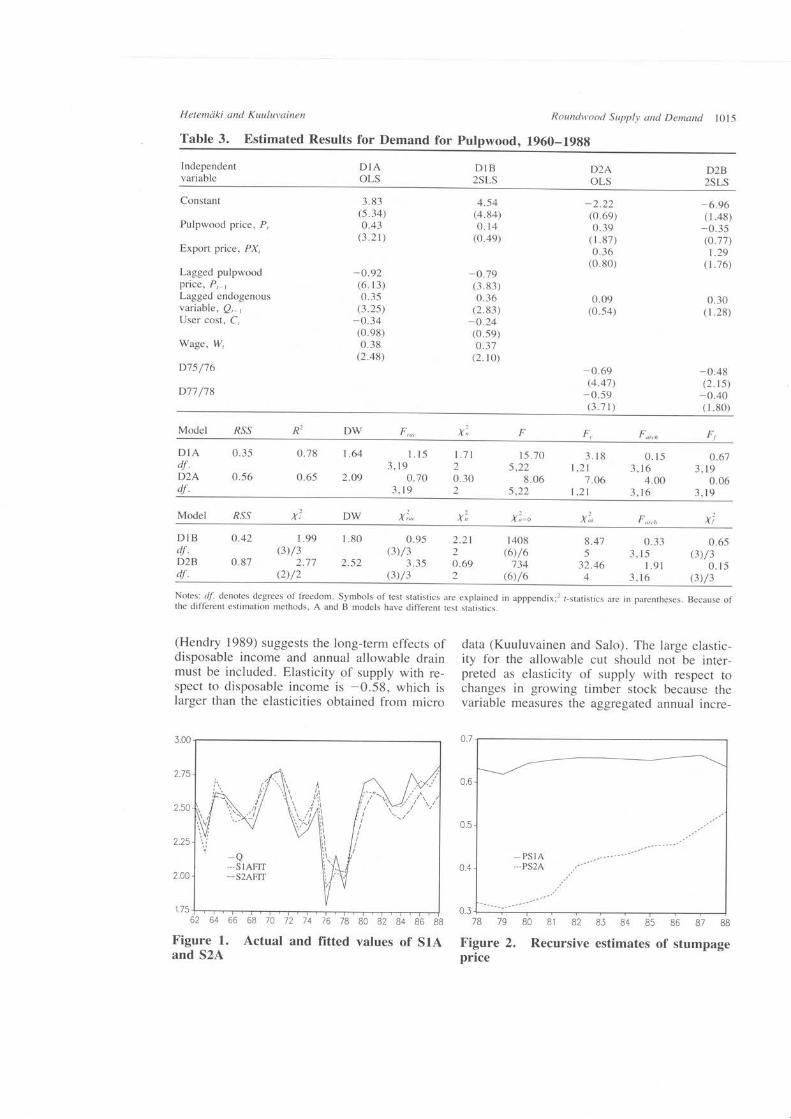
(Hendry 1989) suggests the long-term effects ofdisposable income and annual allowable drainmust be included. Elasticity of supply with re-spect to disposable income is -0.58, which islarger than the elasticities obtained from micro
data (Kuuluvainen and Salo). The large elastic-ity for the allowable cut should not be inter-preted as elasticity of supply with respect tochanges in growing timber stock because thevariable measures the aggregated annual incre-
0.7J.00
j.,. i./ ".,\\, Ir \\ ir\\l
"-\.'/',/ I'l
-a--SIAFIT--S2AFIT
2.15
2.50
2.25
1.75
2.00
62 64 66
Figure 1.and s2A
68 70 72 74
Actual and
76 78 80 82 84 86 88
fitted values of SIA
78 79 80 81 82 8J 84 85 86 87 88
Figure 2. Recursive estimates of stumpageprice
l0l6 November 1992
o.do70 72 74 76 78 80 82 84 86 88
Figure 3. Recursive residuals of SIA
ment. Coefficients of first differences of the in-terest rate and lagged endogenous variable cap-ture short-term structural shocks. However,detailed interpretation of the impact effects isambiguous. For example, in the present study,the interest rate impact may be related to infla-tionary expectations, to changes in monetarypolicy, or to some other factor. Lagged depen-dent variable and interest rate do not seem tohave long-term effects on timber supply becausetheir levels, present or lagged, were rejected bythe F-test when the difference terms were in-cluded.
Though elasticities of stumpage prices in S lAand S2A are not markedly different from oneanother, the dynamics implied by the two spec-ifications are completely different. This is animportant result as far as short-term forecastingis concerned. Further, according to S1A, dis-posable income seems to have a long-term ef-fect on pulpwood supply.
Demand Results
Estimated results of demand equation (7) arecompared to those obtained from reestimatingKuuluvainen et al.'s demand equation
(9) Q, : 6o + 6rP, + 62PX, * 6tQ, t
+ 6p75/76 + 65D78/79 + q,
where D75/76 and D78/79 are dummy vari-ables taking account of structural changes con-nected with export market developments afterthe energy crisis. OLS and 2SLS estimates of(7) and (9) are shown in table 3; they are re-ferred to as DlA, B and DzA, B, respectively.
Table 3 shows the new specification (D1A,B) has a better fit than the earlier one (D24, B).
Amer. J. Agr. Econ.
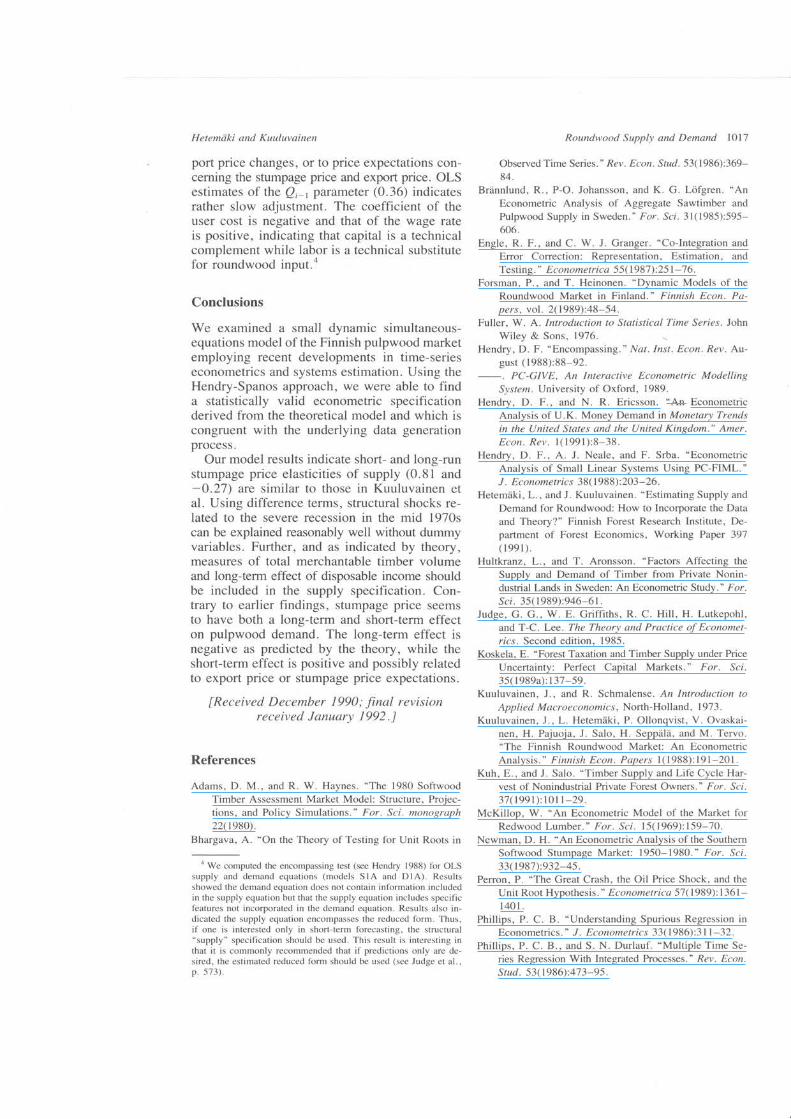
DIA passes all diagnostic tests, while D2Afallsthe test for correct functional form (F..-test forlinearity); further, low r-statistics indicate prob-lems. In fact, the Fo,,o-test shows that heteros-kedasticity is a problem for D2A; and when het-eroskedastic-consistent standard effors (notreported here) are used to compute /-values, onlythe D77/78 dummy variable had a /-value above2. Although diagnostic tests for 2SLS estimatesof model 2 (i.e., DzB) indicate no significantspecification problem, these test statistics arepoorer than for DlB. The residual sum of squares(RSS) indicates high model variance, and DzBclearly fails the overidentification test.
Figure 4 shows actual and fitted values of OLSestimates. The plots indicate that DIA tracksvariations in the dependent variable better thandoes D2A. However, DIA fails to some degreeto take account of structural changes in 1976-1978 following the energy crisis. Because of thedummy variables, D2A is better in tracking ac-tual behavior during 1978-80. Plots of recur-sive residuals indicated that for 1978-1988, DIAis somewhat more stable than D2A. A plot il-lustrating the RLS estimates of the stumpage pricecoefficients indicated that estimates are stable inboth models.
The short-run elasticity of demand (DlA) withrespect to the stumpage price is positive (0.43in OLS and 0.14 and insigniticant in 2SLS),while the long-run (total) elasticity is negative(-0.76 in OLS and -1.03 in 2SLS) as pre-dicted by theory. The positive short-run param-eter is not inconsistent with theory, because thetheoretical model does not imply any specificshort-term adjustment. Positive elasticity in theshort run may result from correlation betweenthe present period's stumpage price and the ex-
J.00
2.15
2.50
_o.--DlAFIT__D2AFIT
(l
0.3
0.2
0.1
0.0
-0.1-0.2-0.J0.15
0.10
0.05
2.25
2.00
1.75
62 64 66 68 l0 12 14
Figure 4. Actual andand D2A
76 t8 80 82 84 86 88
fitted values of DIA
Hetemriki and Kuuluvainen
port price changes, or to price expectations con-ceming the stumpage price and export price. OLSestimates of the Q,-, parameter (0.36) indicatesrather slow adjustment. The coefficient of theuser cost is negative and that of the wage rateis positive, indicating that capital is a technicalcomplement while labor is a technical substitutefor roundwood input.a
Conclusions
We examined a small dynamic simultaneous-equations model of the Finnish pulpwood marketemploying recent developments in time-serieseconometrics and systems estimation. Using theHendry-Spanos approach, we were able to finda statistically valid econometric specificationderived from the theoretical model and which iscongruent with the underlying data generationprocess.
Our model results indicate short- and long-runstumpage price elasticities of supply (0.81 and
-0.27) are similar to those in Kuuluvainen etal. Using difference terms, structural shocks re-lated to the severe recession in the mid 1970scan be explained reasonably well without dummyvariables. Further, and as indicated by theory,measures of total merchantable timber volumeand long-term effect of disposable income shouldbe included in the supply specification. Con-trary to earlier findings, stumpage price seemsto have both a long-term and short-term effecton pulpwood demand. The long-term effect isnegative as predicted by the theory, while theshort-term effect is positive and possibly relatedto export price or stumpage price expectations.
[Received December ]990; final revisionreceived January 1992.1
References
Adams, D. M., and R. W. Haynes. "The 1980 SoftwoodTimber Assessment Market Model: Structure, Projec-tions, and Policy Simulations." For. Sci. monograph22(t980).
Bhargava, A. "On the Theory of Testing for Unit Roots in
a We computed the encompassing test (see Hendry 1988) for OLSsupply and demand equations (models SIA and DIA). Resultsshowed the demand equation does not contain information includedin the supply equation but that the supply equation includes specificfeatures not incorporated in the demand equation. Results also in-dicated the supply equation encompasses the reduced form. Thus,if one is interested only in short-term forecasting, the structural"supply" specification should be used. This result is interesting inthat it is commonly recommended that if predictions only are de-sired, the estimated reduced form should be used (see Judge et al.,p. 573).
Roundwood Supply and Demand 1017
Observed Time Series." Rev. Econ. Stud.53(1986):369-84.
Brdnnlund, R., P-O. Johansson, and K. G. Lcifgren. "AnEconometric Analysis of Aggregate Sawtimber andPulpwood Supply in Sweden." For. Sci.31(1985):595-606.
Engle, R. F., and C. W. J. Granger. 'Co-Integration and
Error Correction: Representation, Estimation, and
Testing. " Econometrica 55(1987):251-76.Forsman, P., and T. Heinonen. "Dynamic Models of the
Roundwood Market in Finland." Finnish Econ. Pa-pers, vol. 2(1989):48-54.
Fuller, W. A. Introduction to Statistical Time Series. JohnWiley & Sons, 1976.
Hendry, D. F. "Encompassing." Nat. Inst. Econ. Rev. Au-gust (1988):88-92.
PC-GM, An Interactive Econometric ModellingSystem. University of Oxford, 1989.
Hendry, D. F., and N. R. Ericsson. *An EconometricAnalysis of U.K. Money Demand in Monetary Trends
in the United States and the United Kingdom." Amer.Econ. Rev. l(1991):8-38.
Hendry, D. F., A. J. Neale, and F. Srba. "Econometric
Analysis of Small Linear Systems Using PC-FIML."J . Econometric s 38(1988):203-26.
Hetemdki, L., and J. Kuuluvainen. "Estimating Supply and
Demand for Roundwood: How to Incorporate the Data
and Theory?" Finnish Forest Research Institute, De-partment of Forest Economics, Working Paper 397(1991).
Hultkranz, L., and T. Aronsson. "Factors Affecting the
Supply and Demand of Timber from Private Nonin-dustrial Lands in Sweden: An Econometric Study." For.Sci. 35(1989):946-61.
Judge, G. G., W. E. Griffiths, R. C. Hill, H. Lutkepohl,and T-C. Lee. The Theory and Practice of Economet-
rics. Second edition, 1985.Koskela, E. "Forest Taxation and Timber Supply under Price
Uncertainty: Perfect Capital Markets. " For. Sci.
35( 1989a):137-59.Kuuluvainen, J., and R. Schmalense. An Introduction to
Applied Macroeconomics, North-Holland, 1973.Kuuluvainen, J., L. Hetemdki, P. Ollonqvist, V. Ovaskai-
nen, H. Pajuoja, J. Salo, H. Seppiilii, and M. Tervo."The Finnish Roundwood Market: An EconometricAnalysis." Finnish Econ. Papers l(1988): l9l-201.
Kuh, E., and J. Salo. "Timber Supply and Life Cycle Har-vest of Nonindustrial Private Forest Owners." For. Sci.
37(199t):t0rt-29.McKillop, W. "An Econometric Model of the Market for
Redwood Lumber." For. Sci. 15(1969):159-7O.Newman, D. H. "An Econometric Analysis of the Southern
Softwood Stumpage Market: 1950-1980." For. Sci.
33(1987):932-45.Perron, P. "The Great Crash, the Oil Price Shock, and the
Unit Root Hypothesis. " Econometrica 57(1989):l36l-1401.
Phillips, P. C. B. 'Understanding Spurious Regression inEconometrics. " /. Econometrics 33(1986):3ll-32.
Phillips, P. C. B., and S. N. Durlauf. "Multiple Time Se-
ries Regression With Integrated Processes." Rev. Econ.
Stud. 53(1986):473-95.
1018 November 1992
Spanos, A. Statistical Foundations of Econometric Mod-eling. Cambridge University Press, 1986.
"simultaneous-Equations Model Revisited." "I.Econometrics, ( I 990):87 -1O5.
Appendix I
Data and Variables
Stumpage quantity (O) is the total quantity of spruce, pine,
and nonconiferous pulpwood from nonindustrial forests
traded in felling seasons (mill cu m). Roundwood pur-
chased in a particular felling season is mainly used in in-
dustry during the following calendar year. Source: Archives
of the Department of Mathematics, Finnish Forest Re-
search Institute (FFRI ).Stumpage price (P,) is the (quantity) weighted average of
stumpage prices (FIM/cu m) for different types of wood in
cutting seasons. Stumpage prices are prices agreed upon in
sales on the stump. Source: Yearbook of Forest Statistics,
FFRI.Export price (PX,) is the price index (1949 : 100) of
exports (fob) for the manufacture of paper and paperboard
(SITC 64). Source: ASTIKA, Central Statistical Office ofFinland (CSOF).
User cost of capital (C,) was calculated using the for-mula, C, : e,(r, + d - g)/p,, where C, is user cost, r, isaverage bank lending rate, q, is implicit price index of in-vestment, d is depreciation rate, g, is capital gains (ex-
pected change in prices of capital goods), and p, is pro-
duction price index. The constant rate of economicdepreciation was obtained using the procedure presented inKuh and Schmalense. Sources: The series for gross fixedcapital formation in current and 1985 prices (used to con-struct the implicit price index of investment) were taken
from National Accounts, and the production price index and
wholesale price index from Statistical Yearbook of Finland,both published by the CSOF.
Wages (W,) are defined as total wages plus social securitycharges divided by hours worked, normalized to 1985 : l.Source: National Accounts, CSOF.
Amer. J. Agr. Econ.
Average bank lending rate (R,). Source: Bank of Finland,Monthly Bulletin.
Disposable income (d) is aggregate household disposable
income (FIM million). Source: Bank of Finland QuarterlyModel of the Finnish Economy.
Allowable drain (lz). Because the total wood volume isnot available on an annual basis, we use the allowable drain(growth adjusted for age structure) as a proxy for this vari-
able. Allowable drain has been estimated using the latest
results of the National Forest Inventory and it is assumed
that the present level of silvicultural and forest improve-ment work will be maintained and that intensive utilizationof forest resources will be extended to cover all parts of the
country. Source: Yearbook of Forest Statistics, FFRI .
Appendix 2
List of symbols used for tests
The test symbols used in the tables are explained below.
For a detailed description of the tests, see, e.g., Hendry(1989) and Hendry and Ericsson (1991). Residual sum ofsquares is RSS; R2 is coefficient of multiple determination;DW is Durbin-Watson autocorrelation statistic; F is F -test
for whether all parameters, except the constant, are signif-icant; DF is Dickey-Fuller unit root test; DF. is modified
Dickey-Fuller test (Perron 1989); CRDW is CointegratedDurbin-Watson unit root test; F.o. is F -test for autocorre-
lation with lagged dependent variables; F. is F (RESET) -
test for correct functional specificatiot, Fo,"n is Auto Re-
gressive Conditional Heteroskedasticity -test; Fr is Chowtest for parameter constancy for N forecasts; 1l is Jarque-
Bera normality test; Xl is test for the validity of the instru-
ments used in 2SLS estimation; fi:o is test for whether all
the parameters, except the constant, are significant in 2SLS;
X?", is test for autocorrelation with lagged dependent vari-
ables in 2SLS; Xj is index of numerical parameter con-
stancy for N forecasts; fr; is overidentification test for the
validity of restrictions imposed on the reduced form.


