Embed Size (px)
Citation preview
Working Paper in Economics and Development Studies
Department of EconomicsPadjadjaran University
Indonesia’s Changing Economic Geography
Hal Hill,
No. 200713
Center for Economics and Development Studies,Department of Economics, Padjadjaran UniversityJalan Cimandiri no. 6, Bandung, Indonesia. Phone/Fax: +62-22-4204510http://www.lp3e-unpad.org
For more titles on this series, visit:http://econpapers.repec.org/paper/unpwpaper/
Hal Hill, Budy Resosudarmo, Yogi Vidyattama
Division of Economics Research School of Pacific and Asian StudiesAustralian National University
November 2007
Page 1 of 29
Indonesia’s Changing Economic Geography •••• Hal Hill, Budy Resosudarmo, Yogi Vidyattama Division of Economics Research School of Pacific and Asian Studies Australian National University November 2007 Abstract Indonesia is the world’s largest archipelagic state, and one of the most spatially diverse nations on earth in its resource endowments, population settlements, location of economic activity, ecology and ethnicity. The regional socio-economic data base now extends over 30 years, and so it is possible to draw conclusions about the country’s regional development dynamics since the 1970s. In this paper, we examine economic growth, inequality, convergence, structural change and social indicators for a consolidated group of 26 provinces, ie, the 27 of the late Soeharto period excluding East Timor. Our major conclusions include the following: (a) There continues to be great diversity in economic and social outcomes, but growth and social progress have been remarkably even. The poorest regions, mainly located in Eastern Indonesia, have generally performed about as well as the national average. (b) The better performing regions are typically those that are the most ‘connected’ to the global economy. In this respect, Jakarta stands out as a special case, growing richer than the rest of the country over time. (c) As expected, conflict is particularly harmful to economic development, as illustrated in the case of Maluku and to a lesser extent Aceh. (d) There is no clear natural resource story, in that the performance of the resource-rich provinces has varied considerably. (1) Introduction With its 13,000 islands, Indonesia is the world’s largest archipelagic state, and one of the most spatially diverse nations on earth in its resource endowments, population settlements, location of economic activity, ecology and ethnicity. There are about 350 identified ethnic groups. In the early 2000s, per capita regional product in the richest province, East Kalimantan, is around 16 times that of the poorest, Maluku. The range of poverty incidence is from 3.4% of the population in Jakarta to 42% in Papua. The country’s regional development patterns are therefore of great analytical and policy interest. Indonesia is formally a unitary state, but all national governments have had to deal with major regional development challenges. The country’s international boundaries have changed twice since Independence, with the formal
• We thank Chris Manning and seminar participants at the Australian National University for helpful comments on an earlier draft, and Terry Hull for advice on the demographic and social data base.
Page 2 of 29
entry of Papua (then Irian) in 1969, and the entry and later exit of East Timor in 1976 and 1999 respectively. Sub-national boundaries have changed frequently. While national economic fortunes and policies also explain much of the local development outcomes, regional responses to international and domestic events inevitably vary. Four examples briefly illustrate this proposition. First, the 1970s oil boom disproportionately benefited the country’s four resource-rich provinces, even though much of the windfall gains accrued to the central government and oil companies. Second, the major policy reforms of the 1980s resulted in rapid, export-oriented industrialization, mainly concentrated on Java and Bali, and which in turn boosted the economic fortunes of these islands. Third, the economic crisis of 1997/98 particularly affected the modern sector construction, finance and import substituting manufacturing sectors and, since these are mainly located on Java, particularly Jakarta and West Java, these regions experienced the sharpest decline in economic activity. Fourth, the decentralization program has transferred considerable financial resources and administrative authority from the central government to the second-level tiers of government (kabupaten and kota), and in the process it is likely to significantly alter Indonesia’s economic geography. While much has been written on various aspects of regional development in Indonesia, there are two reasons to revisit the issue. These in turn constitute the motivation for this paper. First, it has only been possible to accurately measure and quantify regional trends since the mid 1970s. Development dynamics are a long term phenomenon, involving decades rather than years, and we are only now in a position to analyze Indonesia’s regional economic, social and demographic development over a period of 30 years. The second motivation has to do with the renaissance of regional economics and science in recent years. Traditionally regarded as inhabiting the backwaters of the profession, ‘new economic geography has come of age’ in the words of Neary (2001). This has arisen principally owing to the intellectual fusion between international trade and geography. As Krugman (1991, p. 3), the most influential contributor in this field, has argued:
‘… one of the best ways to understand how the international economy works is to start by looking at what happens inside nations. If we want to understand differences in national growth rates, a good place to start is by examining differences in regional growth; if we want to understand international specialization, a good place to start is with local specialization.’
A key insight from this literature concerns the interaction between the international economy and local development patterns. As countries remove regulatory impediments to the cross-border flow of goods, services, capital, technology and people, those regions most connected to the global economy – by dint of location, infrastructure and enabling institutions – are likely to grow the most quickly. In cases where domestic infrastructure lags, or there are regulatory barriers to domestic commerce, these internationally oriented regions may become in effect enclaves, more connected to the global economy than to the hinterland.
Page 3 of 29
As a corollary, to the extent that national economic policies – openness, macroeconomic management, etc – are tending to converge around the world, local level governance and institutions are likely to become increasingly important determinants of regional development outcomes. In the search for markets and mobile factors, for example, Jakarta is competing with both Surabaya and Shanghai, albeit in different dimensions. There are numerous unresolved issues in this new economic geography literature. For example, is the notion of convergence as relevant to intra-country development as it is to international comparisons? In turn, are the variables that are presumed to be important determinants of national growth rates also relevant to an understanding of regional (sub-national) growth? Does the Williamson (1965) conjecture, of a Kuznets-type relationship between regional inequality and national development, receive empirical support? At a policy level, too, much remains unresolved. A generally accepted notion might be that regional policy is anything that affects the allocation of resources across regions. If this is the case, then regional policy formally defined is likely to have a relatively minor impact on regional dynamics. For example, of the four key events mentioned above in the Indonesian context, only one – the decentralization program – was an example of explicit regional policy. There are also many different modalities of regional policy, ranging from formula-driven allocation of financial resources, through to specific delegations of authority from central governments, and a range of region-specific programs such as those targetting so-called by-passed regions. This paper will draw on this rapidly expanding literature and the now rich Indonesian regional data base to address the following issues, each of which constitutes a section of the paper. First, in section 2 we provide an overview of Indonesia’s changing regional economic geography, examining how the location of economic activity and provincial economic rankings have changed since the 1970s. We also consider whether regional price variations affect these conclusions. Next, in section 3, we investigate patterns of regional economic growth and structural change. Here we examine regional growth dynamics, followed by the interrelationships between growth, structural change and demographic dynamics. Section 4 examines convergence and inequality, both in terms of the ‘four-quadrants’ story of initial incomes and subsequent growth and the various measures of convergence. These results are compared with convergence estimates for other countries, and with Indonesia’s provincial social indicators. In section 5 we focus on conflict at the regional level, and assess various explanatory hypotheses. This section is exploratory, particularly owing to data limitations. In section 6 we summarize our main findings. To address these issues, we have assembled a large regional data base from various series of Indonesia’s Badan Pusat Statistik (BPS). These data are discussed in detail in the relevant sections, but we note here two general points. First, the analysis is conducted at the provincial level and is based on a standard set of 26 provinces. These are the 27 provinces that existed for most of the Soeharto era, excluding the special case of East Timor. Since 2000, there has been considerable fragmentation (pemekaran) of provincial boundaries, and so it is necessary to adjust
Page 4 of 29
the published data back to the pre-2000 provincial boundaries.1 We have also resisted the temptation to conduct the analysis at second-level administrative boundaries. The data series span a shorter time period (generally from the late 1980s) and since 2000 the fragmentation of boundaries has proceeded much more quickly.2 The second general point to note is that, reflecting data constraints, our story commences in the 1970s, the period when reliable regional socio-economic data became available (see Arndt, 1973). In the case of demographic and related data the starting point is the 1971 Population Census, while the regional accounts effectively commence in 1975. (2) Indonesia’s Economic Geography: An Overview In this section, we address the following questions. Where are the principal locations of economic activity, and have they changed over time? Which provinces have the highest level of economic welfare and have these rankings changed over time? Are the latter measures sensitive to the selection of economic welfare measures, and do regional price differentials make a difference? We later sum up with some general observations on Indonesia’s changing economic geography since the 1970s. As is well known in the Indonesian context, there are two relevant measures of regional economic activity and three indicators of economic welfare. There is no ‘true’ measure of economic activity and welfare, as each one measures a different concept. We therefore present and examine below the three series. The activity measures are Gross Regional (Domestic) Product (GRP) and GRP excluding mining, in particular oil and gas. The latter measure is frequently employed in Indonesia owing to the presence of extractive activities which significantly affect measured local economic activity but have much less effect on local economic and social welfare. This difference between the two series arises because a large proportion of the returns to extractive activities accrue to extra-provincial entities, principally the central government, and foreign and domestically owned mining companies. With the introduction of the decentralization measures in January 2001, regions now receive a higher proportion of mining revenue, and thus the differences between the welfare measures might be expected to gradually narrow over time.3
1 Thus, for example, ‘West Java’ refers to the currently existing provinces of West Java and Banten, ‘North Sulawesi’ to North Sulawesi and Gorontalo, and so on. 2 For example, since 1997, the number of provinces has risen from 26 (ie, excluding East Timor) to 33, while the number of second-level districts has risen from 341 to more than 456 by the end of 2006. 3 Commencing in January 2001, the regions receive 80%, 15% and 30% of the government’s net returns from timber, gas and oil revenues. Note that most of these revenues flow to kabupaten/kota rather than the provinces. Since 2002 special arrangements have been in place for the province of Papua, whereby it receives 80%, 70% and 70% of net returns from timber, gas, and oil revenues respectively.
Page 5 of 29
In principle, the output of any ‘enclave’ activity might be deducted from GRP to provide a better indication of local economic activity and welfare. In practice, the choice is between oil and gas, and mining. Other resource-based activities, notably forestry, are substantially more labour intensive and therefore have larger local employment and income spinoffs. Some mining activities are also quite labour-intensive (eg, small-scale gold mining), and therefore perhaps do not need to be deducted from GRP. But in practice the distinction is inevitably somewhat arbitrary. In this paper, we employ GRP and non-mining GRP. The latter is selected for two reasons. First, the non-mining GRP series is available for a longer time period – since 1975 as compared to 1983 for the non-oil series.4 Second, the difference between the non-mining and non-oil series is not large, as oil and gas are the major component of Indonesian mining output, accounting for 68% of mining value added in 2004. The only regional exception, that is of a very large non-oil mining sector, is Papua. In addition to GRP and non-mining GRP, there are estimates of personal consumption expenditure (PCE) per capita. The latter are available for a shorter time period, since 1983. They are particularly useful for computing poverty estimates. They would not be regarded as a superior indicator of economic welfare – by definition they exclude personal saving and government consumption and saving – but rather they provide an additional dimension. This series would be expected to correlate more closely with non-mining GRP. We present the regional accounts data at three points of time, 1975 (1983 for the PCE data), 1990, and 2004. These correspond to important time periods in Indonesia’s recent economic history. These are, respectively, the early years of the oil boom, the year at which the major post oil-boom policy reforms had been introduced, and the year at which income per capita nationally had returned to pre-crisis levels. (2.1) Major Concentrations of Economic Activity It is convenient initially to divide the country into five major island groupings, Java-Bali, Sumatra, Kalimantan, Sulawesi, and ‘Eastern Indonesia’.5 Java dominates Indonesia’s economy, in 2004 contributing almost 60%, 64% and 66% of the country’s total GDP, non-mining GDP and household expenditure respectively. Sumatra comes next, with 22%, 20% and 20%. Kalimantan has 9%, 8% and 5%, Sulawesi 4% on all measures, and the Eastern provinces around 3%. We examine the factors underlying these regional dynamics in the following section. (Table 1 about here) Over time, and regardless of the measure used, there has been a clear shift of economic activity towards Java-Bali, and in particular the national capital Jakarta. Jakarta generated one-sixth of Indonesian GDP in 2004, double that of 1975. Its
4 For simplicity, we henceforth use the phrase ‘non-oil’ to refer to ‘non-oil and gas’. 5 Note that there are various definitions of the latter, ranging from the grouping used here to a broader one including Sulawesi, Kalimantan and Bali. The current official definition comprises Kalimantan, Sulawesi and all the Eastern islands except Bali.
Page 6 of 29
share of non-mining GDP has also increased significantly, though not as fast. It accounts for virtually all of the increase in the Java-Bali share of GDP, and more than 100% of the increase in non-mining GDP. That is, the Java-Bali share excluding Jakarta is stable for the total GRP series, while declining slightly for the other two series. In fact, the increase in Jakarta’s share is under-stated, as some of its growth has spilled over the border to West Java, the only other province in the group with an increased share of GDP. The three big Java provinces – these two and East Java – account for half of Indonesia’s GDP and a slightly higher share of non-mining GDP. Sumatra’s share of non-mining GDP and household expenditure has been stable at 20-21%. Its share of GDP has been declining, owing to the falling share of oil/gas in the national economy, and reflected in the declining shares for the island’s main producers, Riau and Aceh. The two largest economies have been Riau with mining included and North Sumatra in the case of non-mining GRP. Riau is a particularly unusual regional economy, with a large oil enclave, a cash crop economy, a relatively wealthy capital city, and a strong export-oriented manufacturing and service economy in the islands adjacent to Singapore.6 Thus, although its share of national GDP has declined since 1975 owing to the oil effects, its share of national non-mining GDP (and household expenditure) has more than doubled since 1990, the fastest increase in the country for this period. Also of note is the fact that the three southern provinces of Sumatra, South Sumatra, Bengkulu and Lampung, have been slipping. In 2004 their share of non-mining GDP was about two-thirds of that in 1975. Evidently, their proximity to stronger economies to their south and north has not had a growth spillover effect. Lampung in particular was seen as a solution to Java’s alleged problems of over-population and poverty, but since the 1970s its economic performance has lagged behind that of Java. The largest and most dynamic regional economy in Kalimantan is East Kalimantan, with its large oil and gas resources. In fact, it has experienced ‘twin booms’ in the words of Pangestu (1989), from both its hydrocarbons and timber. Downstream industrial processing has provided a further boost, while since 2001 the decentralization program is further enriching kabupaten Kutai Kartanegara, which has the nation’s highest per capita GRP.7 Both GRP series are however a misleading indicator of the region’s living standards, as indicated by the much lower share of household expenditure. Nevertheless, the latter is growing quickly, rising 50% as a proportion of the national total since 1990. The share of the eight Eastern provinces in the national economy is gradually declining. This generalization applies to the largest regional economy in the East, South Sulawesi, and its traditionally most prosperous region, North Sulawesi. The share of Maluku, the site of the country’s most serious religious conflict, is now less than one-third of the 1975 figure. The only exceptions to this picture of declining shares are the two small Sulawesi provinces, boosted by in-migration, West Nusa
6 See Rice (1989) for an earlier survey. The province has since been subdivided, with the off-shore islands now the province of Riau Islands. 7 The revenues of all kabupaten and kota governments in the province have increased by at least 300% since the 2001 decentralization.
Page 7 of 29
Tenggara, which recently experienced a major mining expansion, and household expenditure in Papua since 1990. The latter reflects the combined effects of the mining boom and special government programs.8 The analysis above is with reference to provincial economic activity. There are two reasons why it is desirable to probe below the provincial boundaries. First, some concentrations of economic activity straddle provincial boundaries. Second, some provinces have unusual spatial patterns of economic activity. Unfortunately, owing to the rapid fragmentation of kabupaten/kota borders since 1998, it is beyond the scope of this paper to compute consistent estimates of economic activity over the period 1975-2004. We therefore present estimates just for 2004. (2.2) Provincial Economic Rankings We examine these rankings with reference to the three measures discussed above. All data are normalized around the national average of 100. There are large inter-provincial income and welfare differences, and evidence of both continuity and change in these rankings (Table 2). In 2004, the gap between the richest and poorest provinces was very large, depending on which series is used. The ratio of the richest to poorest is 15.9 for per capita GRP (East Kalimantan:Maluku), 14.7 for per capita non-mining GRP (Jakarta:Maluku), and 11.3 for household expenditure (Jakarta:West Nusa Tenggara).
(Table 2 about here)
The first three columns indicate how the inclusion of mining inflates the regional per capita GRP estimates for the resource-rich regions, especially in the earlier years. For example, in the case of Riau, GRP per capita was nine times higher than non-mining GRP in 1975. By 2004, these effects were much smaller. The total series were about 37% higher in Aceh, 52% in Riau (and also in West Nusa Tenggara owing to its recent mining expansion), 63% in East Kalimantan, and almost double in Papua. In the first and last of these provinces non-mining GRP had fallen below the national average. We therefore develop our main story around the non-mining GRP series, which excludes the enclave mining effects. We identify what may be termed consistently ‘wealthy’ and ‘poor’ regions, those close to the national average, and those that have experienced a significant change in relative incomes. (a) ‘Consistently Wealthy’ There are two really wealthy provinces, Jakarta and East Kalimantan. Jakarta is now by far the richest province as measured by non-mining GRP per capita, at about four times the national average and double the next richest province. It has been getting relatively richer, especially since 1990. This is notwithstanding first, the 1980s liberalizations, which reduced the regulatory powers of the capital, second, the
8 In 2002, following the introduction of special autonomy measures, the budget of the Papuan provincial government was three times that of 1999/2000 in nominal terms.
Page 8 of 29
decentralization of 2001, which transferred resources and funds to the regions, and third, the 1997-98 crisis which affected it more severely than any other province apart from West Java.9 However, it also recovered more quickly than most provinces. It should also be noted that, in spite of its role as the national capital, the public sector is one of the smallest in the country. East Kalimantan’s per capita non-mining GRP is always at least three times the national average, indicating that its economic wealth extends well beyond the mining enclaves. However, its household expenditure suggests that community living standards are much closer to the national average. About 60% of East Kalimantan’s non-mining GRP comes from oil and gas processing industries. These are relatively capital-intensive activities, and much of the return on these investments accrues to entities outside the province. A third province, Riau, is generally well above the national averages for both non-oil series. Its fortunes declined sharply during the 1980s in the wake of the fading oil boom, resulting in its income/expenditure being close to the national average. However, as noted, strong growth in the islands close to Singapore, combined with export-oriented cash crops on the mainland, resulted in it being the third richest province in 2004 according to both series. (b) ‘Consistently Non-Poor’ A second group of provinces may be termed consistently well-off, with non-mining GRP per capita at least 85% of the national average. This includes the traditionally strongest agricultural exporter, North Sumatra, the frontier province of Central Kalimantan (initially driven by timber but in which cash crops are now the major agricultural activity), the country’s two major industrial provinces, West and East Java (the latter’s ranking rising appreciably), the major tourist region, Bali,10 and West Sumatra (where both agriculture and a range of services are important). Aceh would have belonged in this group until recently, but the protracted conflict (at least until 2005) has resulted in sharply lower living standards. (c) ‘Very Poor’ At the other extreme are the poor provinces, with a ratio of about half the national average or less. They are all located in Eastern Indonesia. The two Nusa Tenggara provinces are consistently poor, and evidently slipping further behind, from just over half the national average in both series to 35-40%. Maluku, the most serious case of conflict since 1998, has fallen sharply, from above the national average (in non-mining GRP per capita) to one-third of it. Southeast Sulawesi, the poorest province on this island, is about half the national figure in all series. (d) ‘Slipping Behind’
9 In 1997-98, the economies of Jakarta and West Java contracted by about 50% more than that of the economy as a whole. This was explained mainly by the effects in finance, construction and import-substituting manufacturing, all disproportionately important in these two provinces (Akita and Alisjahbana, 2002). 10 But note that Bali’s position has slipped significantly since the 1990s, mainly due to the downturn in international tourism following the terrorist incidents.
Page 9 of 29
A number of provinces have slipped significantly in their rankings in both the non-mining GRP and expenditure series. These are mainly traditional agricultural exporters that have not been able to capitalize on initial advantages. Examples include South Sumatra,11 Jambi, Bengkulu (all in Sumatra), West and South Kalimantan, North and South Sulawesi, and resource-rich Papua (though its household expenditure has risen). It is notable also that Central Java and Yogyakarta have slipped according to both series, although not as much as the others in this group. The latter case is puzzling given its traditional importance as a major centre of higher education. This is such a heterogeneous group of provinces as to render hazardous any attempt at a common set of explanations. Perhaps the most important observation is that they generally lack a major, internationally-oriented engine of growth. We return to this issue shortly. These inter-provincial rankings shed much light on Indonesian regional dynamics. In the first three decades of Indonesian Independence, Java was regarded as the country’s most serious development challenge, with the island ‘asphyxiating for want of land’ in the words of Keyfitz (1965, p. 503). By contrast, in spite of their poorer human and physical infrastructure, the resource rich regions in the ‘Outer Islands’ were considered to have less poverty and better development prospects. However, from the 1980s a different picture emerges. The major economic policy reforms increased the relative profitability of export-oriented manufacturing, and related higher value services, which are located mainly on Java-Bali. Declining commodity prices adversely affected many off-Java regions. Thus, Sumatra’s ranking on all three series declined significantly. It was overtaken by Java-Bali by 1990, and was below the national average for both series in 1990 and 2004. A particularly noticeable decline is Lampung, historically seen as the solution to Java’s ‘population problem’. In 2004, its income and expenditures were less than half those of Java-Bali in all three series. Kalimantan displays above income but below average expenditure, owing to the distributional effects of the natural resource sectors. The eight provinces of Eastern Indonesia are both poor and slipping further behind, with the partial exception of Papua’s enclaves. (2.3) Do Regional Price Variations Matter? The relativities in Table 2 are measured at current prices and make no allowance for inter-provincial variations in prices. These are known to be large in Indonesia, reflecting its vast and unusual geography, the limited spread of infrastructure, and barriers to inter-regional commerce. The non-mining GRP and household expenditure series are also interpreted as indicators of relative living standards, and therefore should be adjusted for price differentials.
11 After having one of the highest per capita incomes in the country, this province has slipped more than most in this group. Part of the explanation is that it was one of the first oil refining centres in the country, with Pertamina’s Musi plant. However, this large sector of its economy has grown slowly since the 1970s and, unlike Riau, new growth engines have yet to emerge, apart from palm oil.
Page 10 of 29
We lack detailed, time-consistent inter-provincial price data, but Nashihin (2007) provides the most comprehensive set of estimates.12 We use these estimates to adjust the three series for 2004 (see Table 3). As would be expected, the richer and more remote provinces also have higher living costs. Thus Jakarta’s relative income falls significantly, from 4.2 times the national average GRP/capita to 3.4. East Kalimantan falls from 4.6 to 4.2 (Central Kalimantan also falls substantially), while in Papua it is from 1.23 to 1.06. Elsewhere, the effects are mixed and not significant. The relative incomes of Central and East Java and Yogyakarta rise somewhat, while some poor, remote provinces such as Maluku become even poorer. We also include regional GRP deflators for each province over this period. These show that prices have risen more rapidly in Jakarta than any other province, hence inflating its relative income in the current price series.
(Table 3 about here) Thus, on balance, income differentials narrow, but only slightly, except for the special case of Jakarta. It is important to note in any case that the price data are necessarily approximate. Moreover, they refer only to prices in provincial capitals. Especially in the remote, sparsely population regions off-Java, there are likely to be large intra-provincial price differences. (3) Regional Economic Growth and Structural Change (3.1) Patterns of Regional Economic Growth We now examine provincial economic growth rates over the same periods and for the same series. Since population growth rates vary considerably (see below), we calculate both total and per capita growth rates. First, the total growth rates (Table 4b). Indonesian GDP grew at an annual average growth of 5.6%, 1975-2004. Java-Bali, Kalimantan, and Sulawesi grew faster than the national average, which was pulled down by Sumatra. Eastern Indonesia grew at the same rate as the national average. However, the Sumatran figure is depressed by the special case of Riau. In the non-mining series, the national average growth rate was 6.4%, and so too (very nearly) was that of Sumatra, Java and Sulawesi. Kalimantan grew slightly faster and Eastern Indonesia a bit slower. The growth rates for household expenditure were also fairly similar. (Table 4b about here) Population growth has generally been higher in the richer and ‘frontier’ regions (see below, Table 6). On a per capita basis, Java-Bali was the fastest growing region, followed by Sulawesi (Table 4a). Here too Sumatra was pulled down by the oil sector. In the case of growth in non-mining GRP per capita, there is the same relatively even growth pattern across island groupings: Java-Bali was the only major
12 The first systematic set of estimates was prepared by Arndt and Sundrum (1975), but these are not comparable with the Nashihin (2007) estimates, and therefore we are restricted to the 2004 adjustments.
Page 11 of 29
region to grow (slightly) faster than the national figure of 4.6%. Kalimantan and Sulawesi were just below it, followed by Sumatra, and Eastern Indonesia 0.9 percentage points below the average. The growth rates of household expenditure are similarly quite even. (Table 4a about here) It is not easy to identify obvious groupings and characteristics of provinces based on growth rates. The fastest growth rates (in GRP per capita) over the period 1975-2004 occurred in Bali, West Nusa Tenggara, West Sumatra, Jakarta, Central Java, and North Sulawesi. The slowest rates were recorded in Riau, Papua, South Sumatra, Maluku, East Kalimantan and Jambi. Thus the fast growers included both small and large provinces, ‘central’ and remote locations, and initially high and low per capita incomes. The only common element appears to be the absence of a major resource sector, whereas this is a feature of all but one of the slow growers. For a more detailed examination, we focus on the non-mining per capita series, which is arguably the most accurate indicator of provincial economic performance. The fastest growing provincial economy by a significant margin (1.1 percentage point over number 2) has been Bali. Also in the high-growth group (at least 5%) are Southeast Sulawesi,13 Jakarta and West Sumatra. A further four provinces are just above the average: North Sumatra, West and Central Java, and North Sulawesi. Conversely, a number of provinces have grown at a rate at least a percentage point slower than the national average. These are Papua and Maluku in the east, and Riau, Jambi and South Sumatra in Sumatra. The remaining 13 provinces grew close to but slower than the national average. The story differs for the shorter (and not directly comparable) PCE series. The fastest growing provinces from 1983 to 2004 were East Java, North Sulawesi, East Nusa Tenggara, West Sumatra and Central Java. The slowest growth was recorded in Yogyakarta, Southeast Sulawesi, Riau, Bali and Bengkulu. The story also differs by sub-periods. Aceh grew very fast over the period 1975-90 as its gas production came on stream, but very slowly since 1990 in an era of (mostly) lower energy prices and as conflict increasingly affected economic activity. Similarly, East Kalimantan slowed down in the second period of lower energy prices and slower timber exploitation. In fact, Kalimantan experienced the greatest growth deceleration among the major island groupings, mainly owing to these factors, principally the former. Bali also slowed down from its exceptionally rapid growth, but was still above average after 1990. By contrast, some provinces which grew slower than the national average in the first period recorded above average rates in the second. This appears to be especially the case for a number of export-oriented economies, which benefitted from the
13 The very high growth rates of small provinces like Southeast Sulawesi in the earlier period need to be interpreted with great caution. The statistical infrastructure was still rudimentary, and the transition from subsistence to a monetary economy may have inflated measured growth rates. The regional accounts for Papua were similarly very approximate.
Page 12 of 29
1980s reforms and which weathered the economic crisis better than other regions. Examples include the predominantly agricultural producers, North, West and South Sumatra (the latter the only province to actually grow faster in the second period as compared to the first), Lampung, all of Sulawesi except the Southeast, and the industrial province of West Java. Although in aggregate growing more slowly than the national average, the four Eastern provinces experienced mixed fortunes. Maluku as noted was severely affected by the post-crisis conflict. East Nusa Tenggara grew a percentage point faster than the national average in the second period, and the West at about the average. Papua’s growth was dependent on commodity prices, but its household expenditure grew at almost the national rate. There are several cases of provinces growing faster than the national average but slipping in the relative income rankings. For example, North Sulawesi grew faster than the Indonesian (non-mining) average 1975-2004, but its relative GRP per capita fell very sharply, from 109 to 60. East Nusa Tenggara grew at the national average, but its income fell from 52% of the national average to just 33%. There are also converse cases, such as Riau, where non-oil per capita growth was less than half the national average, but its relative income rose. These are presumably the result of local terms of trade effects, that is of local economies specializing in the production of goods and services whose prices have risen faster or slower than the general price level (or specifically the national accounts deflator). This is confirmed for example in the case of North Sulawesi: using constant rather than current prices, its per capita income ranking rises considerably. It is also apparent from the regional deflators in Table 3: Maluku and North Sulawesi have the country’s lowest figures. There are no obvious correlates among the fast growers. Just two (Jakarta and North Sumatra) had above average incomes in 1975. The explanations for Jakarta and Bali are relatively straightforward – the seat of government, global connections and high value services and industry in the former, and the tourism success story and resultant spillovers in the latter. In West and Central Java, export-oriented industrialization, especially in West Java from the mid 1980s, and the earlier agricultural successes, especially in Central Java, were important. North Sumatra has a strong agricultural base, and was traditionally the most industrialized province outside Java. West Sumatra and North Sulawesi had traditionally strong agricultural bases and quite good education records. But both are somewhat distant from the main centres of commerce, and neither has had a ‘booming sector’. West Sumatra’s service sector growth is probably connected to high levels of inward remittances, as a result of its long history of mainly male out-migration (merantau). In the case of North Sulawesi, tourism, shipping, and agro processing (mainly based on coconuts and fisheries) have all done quite well. More recently, its tolerance of diverse religions and ethnicities has reportedly attracted investment from neighbouring conflict-prone regions.14
14 For an economic survey of the province since the crisis, see Sondakh and Jones (2003), which extends their earlier work on this province, in Hill (ed, 1989). Note that it, too, has been subject to boundary changes, following the establishment of Gorontalo as a separate province.
Page 13 of 29
Are these regional growth differences amenable to quantitative explanation? There is a large literature attempting to explain international differences in growth rates, but much less on inter-regional differences. Can one draw on the former to help explain the latter? Within a country, it is reasonable to assume something approaching perfect factor mobility and homogeneous nation-wide institutions. Moreover, regions within a country have the same macroeconomic environment and trade regime, and generally operate within the same institutional context (a common legal system, etc). Hence the answer is presumably no. Conversely, as a growing literature has argued, the growth literature can be productively employed, in a modified form.15 That is, openness can be redefined to mean ‘connected’ (to the global economy); institutions clearly do differ among regions in many countries; and factor and product markets in developing countries are often poorly integrated. The international evidence suggests, first, that regions which are the most connected to the global economy (ie, in the sense of location, infrastructure and trade regime) are likely to grow more quickly, as in the case of coastal China and Penang in Malaysia. This seems to fit the story for Jakarta, Bali and in recent times Riau (at least the islands adjacent to Singapore). These are arguably the regions most connected to the global economy, in terms of facilitating physical infrastructure, trade in goods and services and the movement of people. It is significant that they have all grown quickly as Indonesia has become more open. A second factor is clustering and increasing returns to scale, as forward and backward linkages develop and spill over from growth centres. The best example in the Indonesian context is probably the rapid industrialization in West Java since 1980 around the periphery of Jakarta. This region has now become the industrial heartland of Indonesia. The evidence on regional institutions and governance is mixed and incomplete. We lack reliable long term estimates of any ‘quality’ variables, and in any case the provinces have enjoyed significant political authority only since the decentralization of 2001, while local-level democracy has arrived even more recently. There is some anecdotal evidence to suggest that the higher growth regions have been quite well governed. Fox et al (1992) argued that East Java’s rapid and balanced development, and the quality of provincial governance was a factor. Government programs have generally been effective in Bali, while concerted inter-faith leadership in North Sulawesi has resulted in that religiously mixed province being largely free of communal tensions. The indifferent record of the resource rich provinces is suggestive of a Sachs-Warner (2001) ‘resource curse’ at work. Two of the four provinces have experienced very serious conflict, and most of the resource wealth (at least until 2001) accrued to entities outside the province. However, there is sufficient diversity within this group to caution against sweeping generalizations. Two of the provinces, East Kalimantan and Riau, have become increasingly prosperous. (3.2) Growth and Structural Change
15 See for example Barro and Sala-I-Martin (1991) and Rey and Montouri (1999).
Page 14 of 29
Indonesia was a predominantly agrarian economy in the mid 1970s. Reflecting this, agriculture was more than one-third of GRP in 21 out of the 26 provinces in 1975. In 10 it was at least half (Table 5). By 2004, only eight were above this threshold. Thus, consistent with the well-known hypothesis linking economic growth and structural change, there has been a rapid shift out of agriculture. The provinces that have been slow to make this transition are either among the poorest in the country (Maluku, Southeast and Central Sulawesi, East Nusa Tenggara), or have a very strong comparative advantage in agriculture (Central Kalimantan, Jambi) or a combination of both (Lampung, Bengkulu). (Table 5 about here) Industrialization is the flip side of the coin: no province had a share of manufacturing in GRP in excess of 20% in 1975. By 2004, seven provinces registered shares greater than 20%: the three big Java provinces dominated, particularly West Java with 43%. Off Java, the higher shares are found in Riau, owing principally to Singapore industrial spillover, the two Sumatran provinces with large agricultural/industrial processing sectors (North and South Sumatra), and East Kalimantan with its timber processing and oil-related fertilizer and heavy industries. There has been only one significant case of ‘deindustrialization’, in Jakarta, where the manufacturing share is little over half the 1985 figure as factories have migrated across the border to West Java/Banten. There has also been a general increase in the services sector share. In 1975 there were just two provinces in which services contributed at least one-half of GRP. By 2004, five provinces were in this group, and several more were close to it. Only resource-rich Riau, Papua and East Kalimantan recorded a share below 25% of GDP. Interestingly, high and/or increased service sector shares have occurred in a variety of development contexts. Land-scarce Jakarta has always had the highest service sector share, as the seat of national government, the provider of high value commercial services, and the national transport and communication hub. There are high shares in Bali and Yogyakarta, reflecting their status as leading tourism and education centres respectively. The share is also high in West Sumatra, reflecting the traditional importance of remittances. But the share is also high in poorer and/or more remote regions, including Maluku, East Nusa Tenggara and North Sulawesi. For the poorer regions, the explanation has more to do with a relatively large government sector, as fiscal transfers have been weighted in their favour. Higher transport shares in remote regions is also a factor. Theory also predicts that there is a positive association between economic growth and the speed of structural change. We test this by calculating a simple index of structural change between the A, I, and S sectors for each province. The estimates for structural change are presented in Tables 5a and 5b for total and non-mining GRP respectively. The index is calculated both at the 3-sector and 9-sector national accounts classification, and the results (in the final two columns of the tables) are generally not sensitive to the level of disaggregation. A simple plot of growth and the relevant index is presented in Figure 1 (a and b). There appears to be quite a weak correlation between growth and structural change. In the case of non-mining GRP (Figure 1b), the fastest structural change has
Page 15 of 29
occurred in a diverse group of provinces: East Kalimantan (reflecting the resource boom and spillovers), West Java (rising industrialization), Riau (resource boom plus Singapore-related industrialization), Maluku, Bali (tourism growth), and the Nusa Tenggaras. Structural change has been relatively slow in many of the agricultural provinces of Sumatra, Kalimantan and Sulawesi, reflecting the slow movement out of this sector in many of them. It is surprisingly low in Jakarta, presumably because the classification is too aggregated to pick up many of the new service sector activities. The correlation between growth and structural change is somewhat stronger if mining is included (Figure 1a). (Figure 1 about here) (3.3) Demographic Dynamics Finally, how closely do Indonesia’s regional demographics correlate with these economic changes?16 The country’s demographics reflect the interplay of four main factors: highly uneven ‘initial conditions’ (in the patterns of spatial settlements); the uneven location of opportunities for employment, economic advancement and education, which in turn triggers migration; official migration policy (a factor especially in the period 1970-85); and the speed of the demographic transition towards low fertility and mortality. Table 6 highlights these patterns over the period 1971-2000.17 First, the population is heavily concentrated on Java-Bali, though becoming less so, especially outside Jakarta-West Java. Sumatra and Kalimantan have been gaining most of the declining Java-Bali population share, while that of Sulawesi and Eastern Indonesia (excluding Papua) has been constant over the three decades. (Table 6 about here) Provincial population growth is a combination of natural increase and net migration. There is no recent decomposition of these two elements available (see the references in footnote 16 for earlier estimates), and thus low population growth could be the result of either a very fast decline in fertility, continuing high mortality or outmigration. These factors have very different economic/demographic implications. However, the percentage of the population born outside the province (see Table 10) gives a reasonably accurate indication of the extent of in-migration. The major magnets are predictably those provinces that offer opportunities for socio-economic advancement. Thus they tend to be the richer ones or the frontier regions. Jakarta is quintessentially a migrant city, as it always has been (Castles, 1989), with by far the highest proportion. There are also very high shares in resource-rich/frontier East and Central Kalimantan, almost all of southern Sumatra (proximity to Java and employment opportunities), Central and Southeast Sulawesi, and
16 For analyses of Indonesian regional demographics, see Hugo, Hull, Hull and Jones (1987), Jones and Hull (eds, 1997), Muhidin (2002). 17 That is, independent Indonesia’s second and fifth decennial population censuses.
Page 16 of 29
Papua.18 Yogyakarta, a major education centre, has the highest figure for Java-Bali outside Jakarta. (4) Regional Inequality and Convergence (4.1) An Overview We extend this analysis with reference to the ‘four-quadrant’ story relating initial (ie, 1975) levels of per capita GRP and per capita growth over the period 1975-2004 (Figure 2a). In 1975, only four provinces had above average income – East Kalimantan, Jakarta, Papua and Riau. Subsequently, only Jakarta grew at above the national average. Conversely, of the 22 provinces with below average income in 1975, only four – Jambi, South Sumatra and Maluku – grew at a slower rate than the national average. Thus, most provinces were in either the ‘above average growth/below average income’ category, or the converse, suggesting that inter-provincial inequality was declining over this period. Many were in fact very close to the national average growth rate. We shortly test this formally with reference to convergence estimates. (Figure 2a about here) When mining is excluded, the story changes somewhat (Figure 2b). Two of the seven provinces with above average non-mining GRP in 1975 also registered above average growth 1975-2004. These were Jakarta and East Kalimantan. Reassuringly from the point of view of inter-regional equity, although there are five provinces in the below average income/slow growth quadrant for the non-mining GRP series, all but one is close to one or other of the national averages. The one exception is the special and recent case of Maluku. In the case of the expenditure series (Figure 2c), six provinces are in the bottom left quadrant, that is, poor and apparently slipping behind: Bengkulu, Yogyakarta, West Kalimantan, Maluku, Central Sulawesi and Southeast Sulawesi. Here too most of these are very close to one or other national average. The latter three are furthest inside the quadrant, and therefore regions of concern from the point of view of regional equity. (Figures 2b & 2c about here) (4.2) Methodology We now examine the evidence on inequality and convergence, with reference to the two usual measures, absolute β convergence, that is whether poorer provinces are catching up to richer ones, and σ convergence, an overall measure of inequality. Furthermore, there are two types of β convergence, absolute and conditional. The former refers to the absence of any of the control variables presumed likely to
18 The special case of Lampung deserves note. It was traditionally designated as a major transmigrant-recipient region, and in 1971 had by far the highest share of migrants outside Jakarta (Bakir and Humaidi, 1989). However, its slower growth, combined with the emergence of other more attractive destinations and the lower cost of movement, meant that by 2000 it had slipped to seventh ranking in terms of the proportion born outside the province.
Page 17 of 29
influence convergence. In this paper we focus just on this concept, since an analysis of conditional convergence entails a much larger and more complex exercise. Here too we examine the evidence for the three series. We also compare the Indonesian data with international evidence. Note that, owing to differences in economic welfare concepts and the number of regional administrative units, the data are not strictly comparable across countries. However, they provide a reasonably accurate picture of trends. As noted, growth theory predicts that absolute convergence is more likely to apply across regions than among countries, principally because there are fewer barriers to mobility in the former, and less variation in policies and institutions. However, much depends on centre-region policies, particularly concerning fiscal arrangements (Sala-I-Martin, 1996). Formally, β convergence is the partial correlation between income growth and its initial value in the standard Solow-Swan growth model. That is, ln yt–ln y* = e-βt ln y0 – e-βt ln y* = e-βt (ln y0 –ln y*)…. Where:
yt = the income per capita at time t, y0 = the initial income per capita(at time 0) and y* = the steady state income per capita
The growth trajectory is estimated in its reduced form as: ln (yt / y0)/t= α + (eβ –1) ln y0+ ut. … The second concept, σ convergence, employs a measure of standard deviation. A lower value simply indicates a smaller variation in inter-regional income. The most common measure, widely used in growth economics, is the variance of the log value of income per capita. That is:
∑=
−=n
ii n
yy1
22 1)ln(lnσ
where: iy= income per capita in region i
y = average income per capita n = number of regions.
Alternative measures include the coefficient of variation (popularized in the regional economics literature by Williamson, 1965) and the Thiel index of inequality. In this paper, following Williamson, we employ coefficients of variation.19 It should be noted that β convergence is a necessary not sufficient condition to achieve σ convergence. That is, poorer regions catching up to richer ones is necessary for aggregate inequality to decline. But catch-up does not guarantee
19 The series generally display a similar trend. For analyses of Indonesian inequality employing these measures, see for example Akita and Lukman (1995).
Page 18 of 29
reduced inequality. For example, the catch-up process may involve the once poorer provinces overtaking the formerly richer ones; if the margin between them remains the same, β convergence has occurred but there is no σ convergence. The development of China’s coastal provinces over the past quarter century is an approximate illustration of such a phenomenon. (4.3) The Indonesian Evidence We report here estimates of provincial growth rates relative to initial (ie, 1975) incomes, that is, whether absolute β convergence is present (Table 7). These extend the first estimates for Indonesia by Garcia Garcia and Soelistianingsih (1998), who found both absolute and conditional convergence of provincial GRP for the period 1983-93. For GRP per capita, we find a β coefficient of 1.5% for the period since 1975, suggesting that the observed disparity would halve over 46 years. The results are statistically very significant. (Table 7 about here) However, these findings are sensitive to the period of analysis, as they are heavily influenced by the very high incomes in the resource-rich provinces in 1975, and the declining relativities since as the oil/gas sector has become less important. For example, for the years 1975-81, coinciding with the oil boom, the absolute β convergence was higher still (2.0%) and significant at 5%. In fact, excluding mining, the absolute β convergence for the whole period falls to 0.4% and it is insignificant. In the case of household consumption, available only since 1983, the coefficient is also low, 0.2%, and statistically insignificant. The pace of β convergence varies significantly across development periods. It was quite rapid (2%) during the oil boom, 1975-81, with the coefficient significant at 5%. This is to be expected, with the oil-rich provinces such as Riau and East Kalimantan having high initial incomes but slower growth over the period. Moreover, central government grants to the regions, mainly the SDO and Inpres, became increasingly important towards the end of this period. The process of convergence accelerated still further in the wake of the oil boom, with a coefficient of 2.8% for 1981-86, reflecting the impact of the major policy reforms. It was also positive, though slower, for the other series. As the export-oriented reforms took hold, the speed of convergence slowed, to 1.7% for the period 1986-92, and further still during the 1990s, to just 1%. During the crisis period, no significant convergence occurred. This may appear surprising, given the widely held presumption that this event particularly affected the country’s richer regions, such as Jakarta. However, it needs to be remembered that some poorer regions were very badly affected by post-crisis conflicts (eg, Maluku), and that some strong agricultural exporters off-Java capitalized on the sharp exchange rate depreciation. For σ convergence, measured as coefficients of variation, the estimates are similarly highly sensitive to whether the mining sector is included (Figure 3). With mining, inequality is high and variable during the oil boom period. It then declines significantly, and more or less continuously, through until the crisis period, after which it slightly increases again. The coefficients for the non-mining GRP and household expenditure series are initially much lower, less than half the value of the
Page 19 of 29
GRP series. They remain fairly stable during the 1980s reform period, but both begin to increase after the crisis, again only slightly.20 By 2004, reflecting the declining share of the mining sector, the two GRP series had almost converged.
(Figure 3 about here) Additional insights are obtained by decomposing the variations in provincial income by sector. The results of this analysis are not shown here, but the broad summary is as follows. Overall, and as would be expected, regional inequality in agricultural and services output is much lower than that of mining and manufacturing. Mining is of course the highest, owing to the uneven spatial distribution of major mineral deposits. The inequality for the aggregated industrial sector (ie, mining, manufacturing, construction and utilities) has therefore always been high, though it has been falling for most of the period, reflecting mainly the declining share of mining since the late 1970s. Regional inequality in agricultural output has risen for most of the period, but this sector’s share of GDP has fallen rapidly, hence the increase has had little overall impact. By contrast, inequality in services has been declining, and this sector’s share has risen.21 (4.4) Indonesia in International Perspective Table 8 shows Indonesia’s absolute β convergence estimates in comparative perspective. Sala-I-Martin (1996) argued on the basis of several OECD countries that most developed countries experience absolute regional convergence, with an absolute β convergence of up to 2%. This is similar to Indonesia’s with-mining series, which we have argued is not an accurate representation of its regional dynamics.22 (Table 8 about here) The Chinese record is summarized by Song (2007).23 The central planning period led to egalitarian development, with large SOE investments in some inland regions. Institutional barriers to mobility, particularly the household registration system (hukao), were high. The reforms from the late 1970s had profound implications for regional development patterns. Resources were progressively transferred to
20 The small increase in inequality since the crisis appears to be due mainly to regional differences in inflation. The constant price series show very little change, whereas the current price series increases slightly. 21 As the regional data base has expanded, it has also become possible to calculate regional inequality among second tier regions. For example, Akita and Alisjahbana (2002) decomposed Indonesian inequality into within-province, between-province and between-region over the period 1993-98. (The regions are the main island groupings, that is Java-Bali, Sumatra, Kalimantan, Sulawesi and other Eastern Indonesia.) They found the former to be the largest source of inequality in 1997 (50% of the total), while between-province inequality accounted for most of the remainder (43%). 22 See Shankar and Shah (2003) for a comprehensive summary through to around 2000. 23 See also Garnaut, Song and Zhao (eds, 2007).
Page 20 of 29
provincial governments. The rapidly rising private sector investment located in profitable locations, mostly on the eastern seaboard, propelled also by favourable trade and fiscal concessions in the export zones. Barriers to mobility were gradually relaxed. Infrastructure in the more remote western region lagged. As a result, rural-urban and inter-regional inequality rose. There appears to have been absolute β convergence over the period 1978-92, particularly in the early years; estimates of the coefficient range from 1.7% to 2.5% (Jian, Warner and Sachs, 1996). Most estimates suggest rising absolute β divergence from around 1990. In the Philippines, Balisacan (2007) and Balisacan and Fuwa (2004) found evidence of absolute β convergence among 73 provinces over the period 1988-2003, at a rate of 2.2%. This is higher than the estimate of Manasan and Chatterjee (2003) for the period 1987-2000, of 0.7%. The latter’s analysis pertains to the aggregated regions (16 in total then), which are quite diverse in terms of socio-economic characteristics; they also use GRP rather than household income data. Balisacan (2007) also finds a wide dispersion of means around the fitted line, suggesting that there are factors other than initial income that influence long-term provincial income growth. He then introduces a range of growth conditioning variables, finding that infrastructure, human capital and supportive agricultural policies are important drivers of regional growth. In the case of India, Cashin and Sahay (1996) found absolute β divergence rather than convergence for most of the post-independence period. Ahluwalia (2002) reaches a similar conclusion. He also notes the importance of migration, and the associated rise in remittances, in ameliorating inter-regional inequality, while also observing various barriers to inter-state mobility. The Latin American literature concludes there are generally high levels of regional inequality, and mixed evidence on convergence. For six large, middle-income countries,24 Serra et al (2006) concluded that there was a very slow rate of convergence between rich and poor regions since around 1970. Chile experienced the fastest rate of convergence (but still a slow 1.2%). In Argentina and Mexico there was no convergence. There was some evidence of regional ‘convergence clubs’ within Brazil and Peru. Interestingly, regional inequality increased, at least temporarily, after countries pursued trade liberalization. Mexican regional inequality is among the highest in the world, and has been largely unaffected by various regional development programs. A major development dynamic has been the growth of economic activity adjacent to the US border, particularly since the signing of the North American Free Trade Agreement (Giugale and Webb, eds, 2000). (4.5) Social Correlates Finally, how do economic and social indicators correlate, both across provinces and over time?25 Table 9 provides a summary picture. We include here a health indicator (infant mortality), an education indicator (average years of schooling), and the
24 Namely, Argentina, Brazil, Chile, Colombia, Mexico and Peru. 25 For studies of Indonesian social outcomes at the regional level, see Ananta (ed, 2003), Balisacan, Pernia and Asra (2003), and UNDP (2004).
Page 21 of 29
percentage of the population below the poverty line. The first two are based on the Population Censuses of 1971 and 2000, while the poverty estimates are available only from 1984. (Table 9 about here) Two general points deserve emphasis. First, there are dramatic improvements in the social indicators: by 2000, infant mortality was just a third of the 1971 rate, while average years of schooling had risen almost three-fold. Moreover, these improvements have been experienced practically throughout the country. Although the rankings have not changed significantly, in all but one case infant mortality rates have at least halved, and years of schooling have doubled. The one exception is Papua, for which the early data series are incomplete. For the shorter time series of the poverty estimates, also, there is broad-based decline. Here too, Papua goes against the trend, partly owing to data weaknesses, but also reflecting the unequal nature of its development referred to above. Aceh is the only other province where poverty has increased, owing to the effects of the prolonged conflict. Second, coefficients of variation are low, but there is no clear trend in them. The health and education CV’s are very low, well below that of the regional accounts series. They reflect the fact that, as with inter-country comparisons, inter-provincial social inequalities are lower than economic inequality. The poverty CV is higher, to be expected since it is generated from the consumption expenditure estimates. There is a slight increase in the poverty and health CV’s, while for education they fall. These trends are to be expected, and indicate in particular the government’s emphasis on universal mass primary and lower secondary education since the 1970s. There are now several estimates of Human Development Indices for Indonesian provinces. They are not presented here, but they show the expected positive relationship between non-mining GRP per capita and HDI, albeit with much clustering close to the averages. Jakarta stands out with the highest on both measures, while the Nusa Tenggaras and Papua are among the lowest. There are several provinces with below average income per capita but above average HDI. The two major cases are North Sulawesi and Yogyakarta, both with traditionally strong education achievement. Interestingly, there are no cases of above average (non-mining) GRP per capita but below average HDI. This suggests that the resource rich provinces (with the possible exceptions of Papua and Aceh noted above) have been reasonably successful at translating the benefits of the resource booms into improved social indicators. One qualification that needs to be attached to these conclusions is that all the provincial HDI’s thus far prepared include an income or expenditure variable, typically with a weight of one-third, thus limiting their value as an independent check on economic and social correlates. (5) Vulnerability to Social Conflict Particularly since the fall of the Soeharto regime, several regions have experienced episodes of severe social conflict (see Coppel (ed, 2006)). The most serious incidents have occurred in Aceh, Maluku and Papua. Are there any systematic

Page 22 of 29
explanators of this conflict, drawing on the international literature on the subject and the Indonesian experience? Measuring conflict – its nature, intensity, and origins – is of course extremely complex. The only reasonably comprehensive provincial data base on the subject is provided by BPS’s PODES (Potensi Desa, Village Potential) series. The data relate to 2003 and define conflict as beyond some threshold of violence, associated with loss of life, serious injury, or property damage. Data were collected at the village level, from the country’s 69,000 villages and urban communities. They are presented in the final column of Table 10. There are well-known weaknesses with the data, which in any case relate to a specific and unusual period of Indonesian development. The survey does not appear to have collected data as thoroughly as some of the in-depth field surveys, and there are probably some region-specific reporting biases. The data reporting mechanism through the village head probably resulted in some negative statistics being filtered out, with these official not surprisingly wishing to play down evidence of a failure of local administration. The survey reports high levels of violence in Aceh and Maluku, as expected. But there are some surprising results: above average figures for Jakarta and West and East Nusa Tenggara, and low figures for Papua. Nevertheless, they are the only data set available, and they are at least indicative of the extent of conflict. (Table 10 about here) We do not attempt a formal econometric estimation of the determinants of inter-provincial variations in conflict. But as an indicative exercise, we present estimates of a number of variables hypothesized to be likely explanators. A number of these are inter-related, and therefore any quantitative approach would need to deal with the problem of multicollinearity. The first indicator is the volatility of provincial growth rates, defined as the coefficient of variation (CV). Its inclusion is based on the premise that higher variations in growth rates will lead to increased insecurity and therefore possibly conflict. These are shown in columns 1-3 for each of the indicators used above. As would be expected, the resource-rich regions experience higher growth volatility, with the CVs of Aceh, Riau, East Kalimantan, Maluku and Papua at least double the national average, and Papua four times. The high figures for Aceh and Papua lend prima facie support to the hypothesis. However, it is not obvious that there is a clear determining pattern here, for several reasons. First, the household expenditure data are arguably a much better indicator of fluctuations in economic welfare, and the volatility in this variable is generally lower. Nor are the more volatile growth rates found just in these four cases. In fact, the most volatile household expenditure patterns are Maluku, North Sulawesi and Central Kalimantan. Second, the direction of causality is also unclear. For example, Maluku was peaceful and experienced fairly stable growth patterns until the onset of serious conflict in 1998. In other words, this was a case of conflict causing the growth volatility, rather

Page 23 of 29
than the converse. A similar observation applies to some extent in the case of Central Kalimantan. Third, there are cases of both high growth volatility and low conflict, and the converse. North Sulawesi has the highest CV for household expenditure, and it is religiously mixed, but it has experienced little conflict. Jakarta, West Java and Yogyakarta are also above average but largely peaceful. The second indicator is the share of natural resources in provincial GRP (see above, Table 4). This is a sub-national variant of the ‘natural resource curse’, that a large natural resource sector will result in a more volatile income stream (that is, the first factor) and also possibly exacerbate conflict over the allocation of natural resource rents. In 2004, mining generated over one-third of provincial GRP in three of the resource-rich provinces, and more than one quarter in the fourth, Aceh.26 High shares are also evident in West Nusa Tenggara (of very recent origins), South Sumatra and South Kalimantan. Severe and protracted conflict has occurred in two of these provinces, Aceh and Papua, again lending prima facie support to this hypothesis. Nevertheless, the other resource-rich regions have been relatively peaceful, while serious conflict has occurred where mining shares are low, for example Maluku, Central Kalimantan and Southeast Sulawesi. Hence, the presence of mining enclaves per se is an insufficient explanation for conflict. A third variable relates to ethnic fragmentation, data for which we include on the grounds that greater ethnic diversity is alleged by some to hinder the development of local cohesion and trust, and to heighten the potential for conflict.27 We lack precise estimates of ethnic diversity at the provincial level in Indonesia, but a good proxy for it is religious belief, especially as the latter has been a source of tension in some of Indonesia’s most serious conflicts, such as Poso (Central Sulawesi) and Maluku. A convenient proxy for religious diversity is the percentage share of the largest religion in each province, with the hypothesis being the lower the share the greater the possibility of conflict.28 There does not appear to be a clear relationship between the incidence of conflict and religious diversity. There are cases of an apparently strong association, such as Maluku, East Nusa Tenggara and to some extent Jakarta. Yet there are more examples where the converse applies. Aceh has one of the highest majority-religion shares but serious conflict. North Sulawesi is at the opposite end of the spectrum, with the highest religious diversity but little conflict. North Sumatra and some of the Kalimantan provinces are religiously mixed but have low recorded conflict (but note
26 The high share for mining in West Nusa Tenggara is of recent origins, and dates from the establishment of the sometimes controversial Newmont copper and gold mine on Sumbawa. The share of mining in the province’s GRP rose from 4% in 1999 to 28% in 2000. 27 See for example Alesina, Baqir and Easterly (1999). 28 We choose this variable rather than simply the share of the Moslem population since there are four provinces in which adherents to Islam are in the minority – North Sulawesi, East Nusa Tenggara, Papua (all majority Christian), and Bali (majority Hindu). But in Bali especially there is little religious diversity, and thus the Moslem share would be a misleading indicator of religious diversity.
Page 24 of 29
caveats). There are also instances of little religious diversity but considerable conflict, such as West Nusa Tenggara. Papua is a special case in this context. There are two main sources of spatial inequality, which together explain the perception that the benefits of growth have been enjoyed primarily by immigrant communities. The first is the urban-rural divide. Much of this was fuelled by the growth of the provincial capital, Jayapura, the centre of the rapid expansion of the mainly non-Papuan civil service and major development projects. These growing centres also attracted many migrants from other provinces in search of business opportunities. Poverty in the urban areas in 2004 is quite low, around 8% in 2004. By contrast, in rural areas, where the majority of Papuans reside, poverty is still around 50%. The second major source is the huge Freeport mine, whose impact is mainly confined to Timika. Fourth, the percentage of the population born outside the province indicates the extent of settler arrivals. It too is suggestive of the possibility of conflict, as in-migrants compete for jobs and land access, and sometimes introduce customs at variance with local traditions (eg, concerning gender relations, diet, etc). Obviously, this variable is highly correlated with the share of the natural resource sector. As would be expected, a high migration presence is found in Jakarta, the resource-rich regions, remote ‘frontier’ regions, and areas formerly designated by the central government as transmigration sites. Here too the evidence for this variable is mixed. There are examples where conflict and in-migration are significantly correlated, such as Papua, Southeast Sulawesi, Central Kalimantan and Jakarta. Yet, there are also cases of large migrant communities generally living in harmony (eg, some of the Sumatran provinces and Yogyakarta); while some of the most serious conflict has occurred in regions with below-average in-migration, such as Aceh and Maluku. Finally, it might be expected that intra-provincial inequality in income/expenditure would predispose a province to conflict. That is, cet par, high inequality provinces are more likely to experience conflict. We include estimates of provincial expenditure inequality for 1984 (the first year they were available) and 2002 to examine this proposition. Predictably, above average inequality is found in the resource-rich provinces, except Aceh. Papua particularly stands out. There is also high inequality in the two most urbanized provinces of Java, Jakarta and Yogyakarta. With the exception of Papua, all the high inequality provinces have been quite peaceful. By contrast, inequality is generally below average in areas of major conflict, such as Maluku and Central Sulawesi. Therefore, inequality per se does not appear to be a major explanatory factor. This discussion highlights the fact that the magnitude and determinants of local conflict are complex, interrelated and not easily amenable to quantitative explanation. The quality of local leadership is a key factor, and thought to be one of the reasons why one of the most religiously diverse provinces, North Sulawesi, has been largely free of conflict. In the case of Aceh, one of the most conflict-prone provinces, the conflict has been principally between the central government and the very strong local identity which, when mismanaged, has spawned a separatist movement. It required a terrible natural disaster (the December 2004 tsunami), presidential leadership, and a local capacity to negotiate to reach the 2005 peace
Page 25 of 29
settlement. Similarly, the protracted conflict in Papua reflects its complex history and a troubled record of central government and military intervention.29 (6) Conclusion Our major conclusions include the following. First, there continues to be great diversity in economic and social outcomes, but growth and social progress have been remarkably even. There has been no significant change in the concentration of economic activity across the major island groupings. As with all the economic variables, this conclusion is somewhat sensitive to whether or not the mining sector is included. Excluding mining, Java’s share has risen, mainly at the expense of Sumatra. More generally, economic activity has continued to cluster around some key regional economies. Java has remained dominant, and more broadly Java, Bali, Sumatra, and Kalimantan as compared to the Eastern region. (Although Sulawesi has gone from below-average to above-average growth over the two periods.) Moreover, ‘Greater Jakarta’ has assumed ever greater prominence in the nation’s key economic agglomeration. Nevertheless, the poorest regions, mainly located in Eastern Indonesia, have generally performed about as well as the national average. There is no case of a province with consistently poor performance for decades, in the sense of being well below the national average growth rate, let alone protracted periods of negative growth. Second, as a corollary, regional disparities are either high and declining or moderate and stable, depending on which series is used. The former conclusion is based on the with-mining series. However, these provide a misleading indicator of local-level welfare, and therefore should be interpreted with caution. The other two series, that is non-mining GRP and personal consumption expenditure, suggest no significant change in inequality or catch-up during both the 1980s reforms and the crisis periods. Over the entire period, there was no convergence in non-mining GRP per capita, while household expenditure has shown weak convergence. It is also notable that the policy reform period of 1984-96 produced a most even record of provincial economic performance, as compared to the mining boom and crisis/post-crisis periods, when major exogenous events had uneven sub-national impacts. Third, while there have been strong performers – notably Bali, Jakarta, and occasionally East Kalimantan and Riau – the group of top performers has been quite diverse, as to location, size and socio-economic characteristics. In general, the
29 There is now an extensive literature on these regional conflicts. See for example McGibbon (2006) on Papua and Bouvier and Smith (2006) on Kalimantan For a detailed analysis of the origins and course of Southeast Asia’s most serious regional conflict, which still persists, see PHDR (Philippine Human Development Report) 2005.
Page 26 of 29
better performing regions are typically those that are the most ‘connected’ to the global economy. In this respect, Jakarta stands out as a special case, growing richer than the rest of the country over time. Although two of the strongest performers are resource-rich regions, there is no clear natural resource story, in that the performance of this group of provinces has varied considerably. The impact of enclave-style development has also varied among them, with the most challenging arguably being the special case of Papua. Moreover, it is evident that conflict is particularly harmful to economic development, as illustrated in the case of Maluku since 1997 and to a lesser extent Aceh. Future research in this area might focus on two areas. The first is an examination of the impact of decentralization on regional dynamics. This will need to be a longer-term project since, as illustrated by the experience in the Philippines and elsewhere, it will arguably take at least a decade to discern impacts. Second, the fragmentation (pemekaran) of administrative boundaries is greatly complicating longitudinal analysis. This paper has consolidated the current 34 provinces back to 26, to facilitate comparisons over time. Even this process is a laborious one. It is currently not possible to draw inferences at the kabupaten level, the administrative unit to which authority and resources have been decentralized, since the process of boundary changes has proceeded much further. However, it may be possible to develop such a data base with the cooperation of Indonesia’s Central Board of Statistics. With a finer level of disaggregation, it would be possible to examine the development of regional clusters in more detail, since these invariably straddle provincial boundaries. It may also be the case that our main conclusions, of no major change in inter-regional inequality and no major ‘drop-outs’ (apart from Maluku in recent years), would have to be modified. References Ahluwalia, M.S. (2002), ‘State-Level Economic Performance under Economic Reforms in India’, in A.O. Krueger (ed), Economic Policy Reforms and the Indian Economy, Oxford University Press, New Delhi, pp. 91-122. Akita, T. and A.S. Alisjahbana (2002), ‘Regional Income Inequality in Indonesia and the Initial Impact of the Economic Crisis’, Bulletin of Indonesian Economic Studies, 38 (2), pp. 201-222. Akita, T. and R.A. Lukman (1995), ‘Interregional Inequalities in Indonesia: A Sectoral Decomposition Analysis for 1975-92’, Bulletin of Indonesian Economic Studies, 31 (2), pp. 61-81. Alesina, A., R. Baqir and W. Easterly (1999), ‘Public Goods and Ethnic Divisions’, Quarterly Journal of Economics, 114 94), pp. 1243-1284. Ananta, A. (ed) (2003), The Indonesian Crisis: A Human Development Perspective, Institute of Southeast Asian Studies, Singapore.
Page 27 of 29
Arndt, H.W. (1973), ‘Regional Income Estimates, Bulletin of Indonesian Economic Studies, 9 (3), pp. 87-102. Arndt, H.W. and R.M. Sundrum (1975), 'Regional Price Disparities', Bulletin of Indonesian Economic Studies, 11 (2), pp. 30-68. Bakir, S.Z. and M. Humaidi (1989), ‘Lampung: Spontaneous Transmigration’, in Hill (ed), pp. 349-362. Balisacan, A.M. (2007), ‘Local Growth and Poverty Reduction’, in Balisacan and Hill (eds), pp. 398-421. Balisacan, A.M. and N. Fuwa (2004), ‘Going Beyond the Cross-Country Averages: Growth, Inequality and Poverty Reduction in the Philippines’, World Development, 32 (11), pp. 1891-1907 Balisacan, A.M. and H. Hill (eds) (2007), The Dynamics of Regional Development: The Philippines in East Asia, Edward Elgar, Cheltenham. Balisacan, A.M., E.M. Pernia, and A. Asra (2007), ‘Revisiting Growth and Poverty Reduction in Indonesia: What do Subnational Data Show?’ Bulletin of Indonesian Economic Studies, 39 (3), pp. 329-351. Barro, R.J. and X. Sala-I-Martin (1991), ‘Convergence across States and Regions’, Brookings Papers on Economic Activity, 1, pp. 107-158. Bouvier, H. and G. Smith (2006), ‘Of Spontaneity and Conspiracy Theories: Explaining Violence in Central Kalimantan’, Asian Journal of Social Science, 34 (3), pp. 475-491. Cashin, P. and R. Sahay (1996), 'Regional Growth and Convergence in India', Finance and Development, 33 (1), pp. 49-52. Castles, L. (1989), ‘Jakarta: The Growing Centre’, in Hill (ed), pp. 233-253. Coppel, C.A. (ed) (2006), Violent Conflict in Indonesia: Analysis, Representation, Resolution, Routledge, Oxford. Garcia Garcia, J. and L. Soelistianingsih (1998), ‘Why do Differences in Provincial Incomes Persist in Indonesia?’, Bulletin of Indonesian Economic Studies, 34 (1), pp. 95-120. Garnaut, R., L. Song, and Z. Zhao (eds (2007), Reducing Regional Disparities in China, Asia Pacific Press, Canberra. Giugale, M.B. and S.B. Webb (eds) (2000), Achievements and Challenges of Fiscal Decentralization: Lessons from Mexico, World Bank, Washington DC. Hill, H. (ed, 1989), Unity and Diversity: Regional Economic Development in Indonesia since 1970, Oxford University Press, Singapore.
Page 28 of 29
Hugo, G., T.H. Hull, V.J. Hull, and G.W. Jones (1987), The Demographic Dimension in Indonesian Development, Oxford University Press, Singapore. Jian, T., J.D. Sachs and A.M. Warner (1996), ‘Trends in Regional Inequality in China’, NBER Working Paper No. 5412, Cambridge Mass. Jones, G.W. and T.H. Hull (eds, 1997), Indonesia Assessment: Population and Human Resources, Institute of Southeast Asian Studies, Singapore. Keyfitz, N. (1965), ‘Indonesian Population and the European Industrial Revolution’, Asian Survey, 10, pp. 503-514. Krugman, P. (1991), Geography and Trade, MIT Press, Cambridge, Mass. McGibbon, R. (2006), Pitfalls of Papua: Understanding the Conflict and its Place in Australia-Indonesia Relations, Lowy Institute, Sydney. Manasan, R.G. and S. Chatterjee (2003), ‘Regional Development’, in A.M. Balisacan and H. Hill (eds), The Philippine Economy: Development, Policies and Challenges, Oxford University Press, New York, pp. 342-380. Manning, C. and M. Rumbiak (1989), ‘Irian Jaya: Economic Change, Migrants, and Indigenous Welfare’, in Hill (eds), pp. 77-106. Muhidin, S. (2002), The Population of Indonesia: Regional Demographic Scenarios Using a Multiregional Method and Multiple Data Sources, Rozenberg Publishers, Amsterdam. Nashihin, M. (2007), Poverty Incidence in Indonesia, 1987-2002: A Utility-Consistent Approach based on a New Survey of Regional Prices, unpublished PhD dissertation, Australian National University, Canberra. Neary, J.P. (2001), ‘Of Hype and Hyperbola: Introducing the New Economic Geography’, Journal of Economic Literature, 39 (2), pp. 536-561. Pangestu, M. (1989), ‘East Kalimantan: Beyond the Timber and Oil Boom’, in Hill (ed), pp. 151-175. PHDR (Philippine Human Development Report) 2005 (2005), Peace, Human Security and Human Development in the Philippines, Human Development Network, Manila. Resosudarmo, B.P. and Y. Vidyattama (2007), ‘The East Asian Experience: Indonesia’, in Balisacan and Hill (eds), pp. 123-155. Rey, S. and B. Montouri (1999), ‘US Regional Income Convergence: A Spatial Econometric Perspective’, Regional Studies, 33, pp. 143-156. Rice, R.C. (1989), ‘Riau and Jambi: Rapid Growth in Dualistic Natural Resource-Intensive Economies’, in Hill (ed), pp. 125-150.
Page 29 of 29
Sachs, J.D. and A.M. Warner (2001), ‘The Curse of Natural Resources’, European Economic Review, 45, pp. 827-838. Sala-I-Martin, X. (1996), ‘The Classical Approach to Convergence Analysis’, Economic Journal, 106, pp. 1019-1036. Serra, M.A. et al (2006), ‘Regional Convergence in Latin America’, IMF Working Paper, WP/06/125, Washington DC. Shankar, R. and A. Shah (2003), ‘Bridging the Economic Divide Within Countries: A Scorecard on the Performance of Regional Policies in Reducing Regional Income Disparities’, World Development, 31 (8) pp. 1421-1443. Sondakh, L. and G. Jones (2003), ‘An Economic Survey of Northern Sulawesi: Turning Weaknesses into Strengths under Regional Autonomy’, Bulletin of Indonesian Economic Studies, 39 (3), pp. 273-302. Song, L. (2007), ‘The East Asian Experience: The People’s Republic of China’, in Balisacan and Hill (eds), pp. 93-122. UNDP (2004), Indonesian Human Development Report 2004, Jakarta, 2004. Williamson, J.G. (1965), 'Regional Inequality and the Process of National Development: A Description of Patterns', Economic Development and Cultural Change, 13, pp. 3-45. (This draft: 141107, 13,400 words of text)
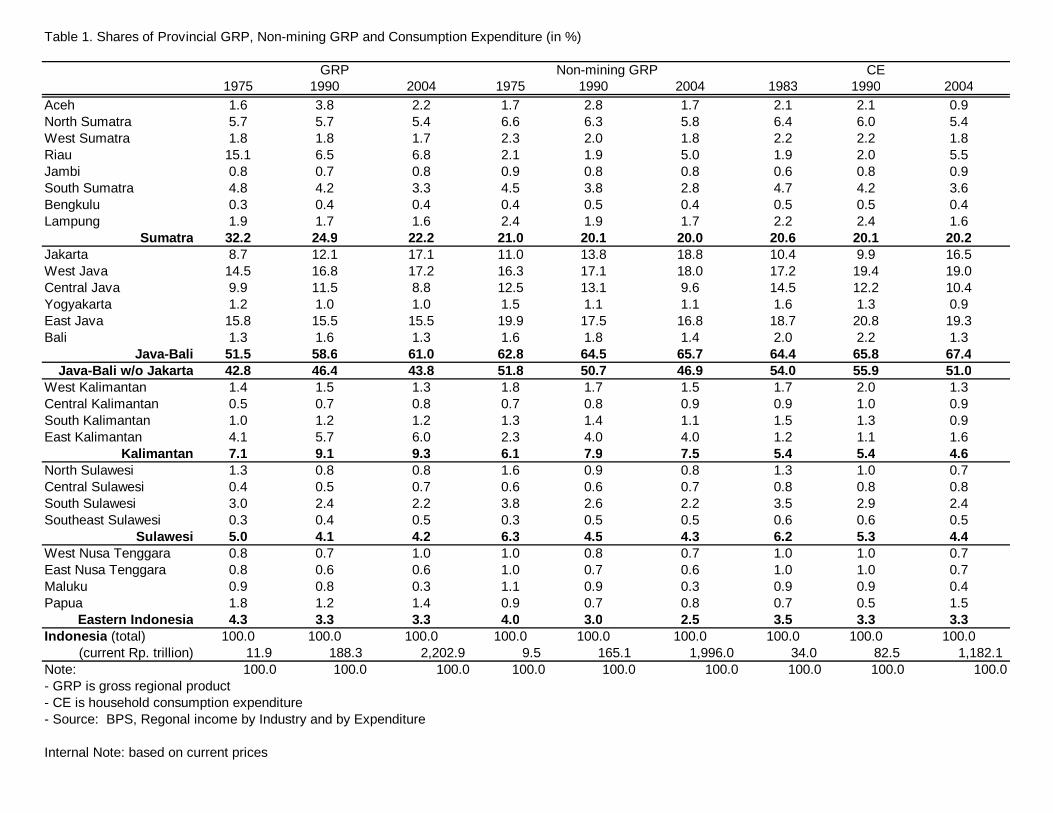
Table 1. Shares of Provincial GRP, Non-mining GRP and Consumption Expenditure (in %)
1975 1990 2004 1975 1990 2004 1983 1990 2004Aceh 1.6 3.8 2.2 1.7 2.8 1.7 2.1 2.1 0.9North Sumatra 5.7 5.7 5.4 6.6 6.3 5.8 6.4 6.0 5.4West Sumatra 1.8 1.8 1.7 2.3 2.0 1.8 2.2 2.2 1.8Riau 15.1 6.5 6.8 2.1 1.9 5.0 1.9 2.0 5.5Jambi 0.8 0.7 0.8 0.9 0.8 0.8 0.6 0.8 0.9South Sumatra 4.8 4.2 3.3 4.5 3.8 2.8 4.7 4.2 3.6Bengkulu 0.3 0.4 0.4 0.4 0.5 0.4 0.5 0.5 0.4Lampung 1.9 1.7 1.6 2.4 1.9 1.7 2.2 2.4 1.6
Sumatra 32.2 24.9 22.2 21.0 20.1 20.0 20.6 20.1 20.2Jakarta 8.7 12.1 17.1 11.0 13.8 18.8 10.4 9.9 16.5West Java 14.5 16.8 17.2 16.3 17.1 18.0 17.2 19.4 19.0Central Java 9.9 11.5 8.8 12.5 13.1 9.6 14.5 12.2 10.4Yogyakarta 1.2 1.0 1.0 1.5 1.1 1.1 1.6 1.3 0.9East Java 15.8 15.5 15.5 19.9 17.5 16.8 18.7 20.8 19.3Bali 1.3 1.6 1.3 1.6 1.8 1.4 2.0 2.2 1.3
Java-Bali 51.5 58.6 61.0 62.8 64.5 65.7 64.4 65.8 67.4Java-Bali w/o Jakarta 42.8 46.4 43.8 51.8 50.7 46.9 54.0 55.9 51.0
West Kalimantan 1.4 1.5 1.3 1.8 1.7 1.5 1.7 2.0 1.3Central Kalimantan 0.5 0.7 0.8 0.7 0.8 0.9 0.9 1.0 0.9South Kalimantan 1.0 1.2 1.2 1.3 1.4 1.1 1.5 1.3 0.9East Kalimantan 4.1 5.7 6.0 2.3 4.0 4.0 1.2 1.1 1.6
Kalimantan 7.1 9.1 9.3 6.1 7.9 7.5 5.4 5.4 4.6North Sulawesi 1.3 0.8 0.8 1.6 0.9 0.8 1.3 1.0 0.7Central Sulawesi 0.4 0.5 0.7 0.6 0.6 0.7 0.8 0.8 0.8South Sulawesi 3.0 2.4 2.2 3.8 2.6 2.2 3.5 2.9 2.4Southeast Sulawesi 0.3 0.4 0.5 0.3 0.5 0.5 0.6 0.6 0.5
Sulawesi 5.0 4.1 4.2 6.3 4.5 4.3 6.2 5.3 4.4West Nusa Tenggara 0.8 0.7 1.0 1.0 0.8 0.7 1.0 1.0 0.7East Nusa Tenggara 0.8 0.6 0.6 1.0 0.7 0.6 1.0 1.0 0.7Maluku 0.9 0.8 0.3 1.1 0.9 0.3 0.9 0.9 0.4Papua 1.8 1.2 1.4 0.9 0.7 0.8 0.7 0.5 1.5
Eastern Indonesia 4.3 3.3 3.3 4.0 3.0 2.5 3.5 3.3 3.3Indonesia (total) 100.0 100.0 100.0 100.0 100.0 100.0 100.0 100.0 100.0
(current Rp. trillion) 11.9 188.3 2,202.9 9.5 165.1 1,996.0 34.0 82.5 1,182.1 Note: 100.0 100.0 100.0 100.0 100.0 100.0 100.0 100.0 100.0- GRP is gross regional product- CE is household consumption expenditure - Source: BPS, Regonal income by Industry and by Expenditure
Internal Note: based on current prices
GRP Non-mining GRP CE
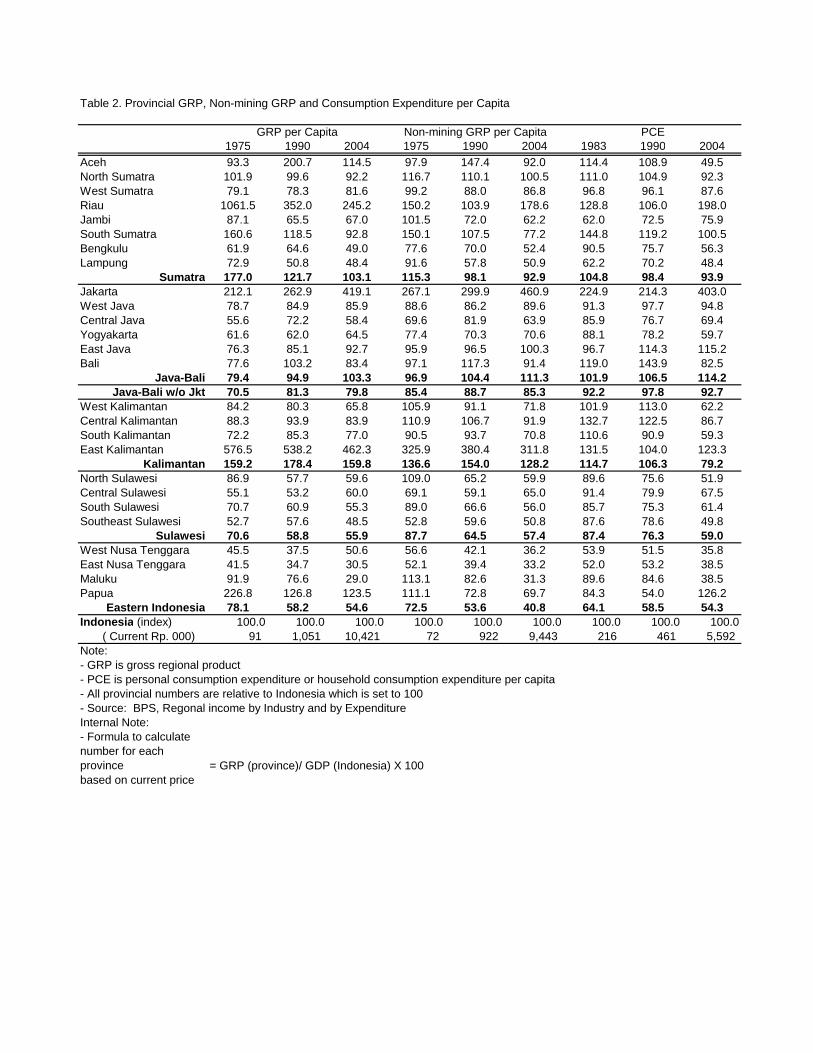
Table 2. Provincial GRP, Non-mining GRP and Consumption Expenditure per Capita
1975 1990 2004 1975 1990 2004 1983 1990 2004Aceh 93.3 200.7 114.5 97.9 147.4 92.0 114.4 108.9 49.5North Sumatra 101.9 99.6 92.2 116.7 110.1 100.5 111.0 104.9 92.3West Sumatra 79.1 78.3 81.6 99.2 88.0 86.8 96.8 96.1 87.6Riau 1061.5 352.0 245.2 150.2 103.9 178.6 128.8 106.0 198.0Jambi 87.1 65.5 67.0 101.5 72.0 62.2 62.0 72.5 75.9South Sumatra 160.6 118.5 92.8 150.1 107.5 77.2 144.8 119.2 100.5Bengkulu 61.9 64.6 49.0 77.6 70.0 52.4 90.5 75.7 56.3Lampung 72.9 50.8 48.4 91.6 57.8 50.9 62.2 70.2 48.4
Sumatra 177.0 121.7 103.1 115.3 98.1 92.9 104.8 98.4 93.9Jakarta 212.1 262.9 419.1 267.1 299.9 460.9 224.9 214.3 403.0West Java 78.7 84.9 85.9 88.6 86.2 89.6 91.3 97.7 94.8Central Java 55.6 72.2 58.4 69.6 81.9 63.9 85.9 76.7 69.4Yogyakarta 61.6 62.0 64.5 77.4 70.3 70.6 88.1 78.2 59.7East Java 76.3 85.1 92.7 95.9 96.5 100.3 96.7 114.3 115.2Bali 77.6 103.2 83.4 97.1 117.3 91.4 119.0 143.9 82.5
Java-Bali 79.4 94.9 103.3 96.9 104.4 111.3 101.9 106.5 114.2Java-Bali w/o Jkt 70.5 81.3 79.8 85.4 88.7 85.3 92.2 97.8 92.7
West Kalimantan 84.2 80.3 65.8 105.9 91.1 71.8 101.9 113.0 62.2Central Kalimantan 88.3 93.9 83.9 110.9 106.7 91.9 132.7 122.5 86.7South Kalimantan 72.2 85.3 77.0 90.5 93.7 70.8 110.6 90.9 59.3East Kalimantan 576.5 538.2 462.3 325.9 380.4 311.8 131.5 104.0 123.3
Kalimantan 159.2 178.4 159.8 136.6 154.0 128.2 114.7 106.3 79.2North Sulawesi 86.9 57.7 59.6 109.0 65.2 59.9 89.6 75.6 51.9Central Sulawesi 55.1 53.2 60.0 69.1 59.1 65.0 91.4 79.9 67.5South Sulawesi 70.7 60.9 55.3 89.0 66.6 56.0 85.7 75.3 61.4Southeast Sulawesi 52.7 57.6 48.5 52.8 59.6 50.8 87.6 78.6 49.8
Sulawesi 70.6 58.8 55.9 87.7 64.5 57.4 87.4 76.3 59.0West Nusa Tenggara 45.5 37.5 50.6 56.6 42.1 36.2 53.9 51.5 35.8East Nusa Tenggara 41.5 34.7 30.5 52.1 39.4 33.2 52.0 53.2 38.5Maluku 91.9 76.6 29.0 113.1 82.6 31.3 89.6 84.6 38.5Papua 226.8 126.8 123.5 111.1 72.8 69.7 84.3 54.0 126.2
Eastern Indonesia 78.1 58.2 54.6 72.5 53.6 40.8 64.1 58.5 54.3Indonesia (index) 100.0 100.0 100.0 100.0 100.0 100.0 100.0 100.0 100.0 ( Current Rp. 000) 91 1,051 10,421 72 922 9,443 216 461 5,592 Note:- GRP is gross regional product- PCE is personal consumption expenditure or household consumption expenditure per capita- All provincial numbers are relative to Indonesia which is set to 100- Source: BPS, Regonal income by Industry and by ExpenditureInternal Note:- Formula to calculate number for each province = GRP (province)/ GDP (Indonesia) X 100based on current price
GRP per Capita Non-mining GRP per Capita PCE
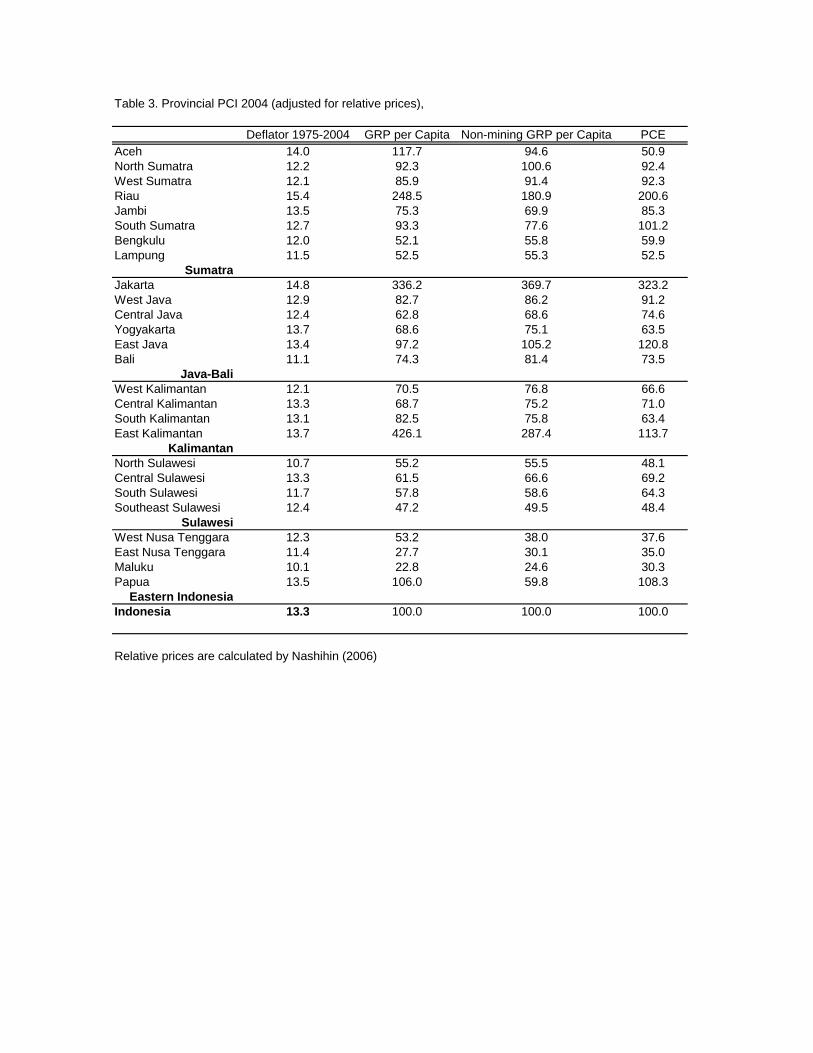
Table 3. Provincial PCI 2004 (adjusted for relative prices),
Deflator 1975-2004 GRP per Capita Non-mining GRP per Capita PCEAceh 14.0 117.7 94.6 50.9North Sumatra 12.2 92.3 100.6 92.4West Sumatra 12.1 85.9 91.4 92.3Riau 15.4 248.5 180.9 200.6Jambi 13.5 75.3 69.9 85.3South Sumatra 12.7 93.3 77.6 101.2Bengkulu 12.0 52.1 55.8 59.9Lampung 11.5 52.5 55.3 52.5
SumatraJakarta 14.8 336.2 369.7 323.2West Java 12.9 82.7 86.2 91.2Central Java 12.4 62.8 68.6 74.6Yogyakarta 13.7 68.6 75.1 63.5East Java 13.4 97.2 105.2 120.8Bali 11.1 74.3 81.4 73.5
Java-BaliWest Kalimantan 12.1 70.5 76.8 66.6Central Kalimantan 13.3 68.7 75.2 71.0South Kalimantan 13.1 82.5 75.8 63.4East Kalimantan 13.7 426.1 287.4 113.7
KalimantanNorth Sulawesi 10.7 55.2 55.5 48.1Central Sulawesi 13.3 61.5 66.6 69.2South Sulawesi 11.7 57.8 58.6 64.3Southeast Sulawesi 12.4 47.2 49.5 48.4
SulawesiWest Nusa Tenggara 12.3 53.2 38.0 37.6East Nusa Tenggara 11.4 27.7 30.1 35.0Maluku 10.1 22.8 24.6 30.3Papua 13.5 106.0 59.8 108.3
Eastern IndonesiaIndonesia 13.3 100.0 100.0 100.0
Relative prices are calculated by Nashihin (2006)
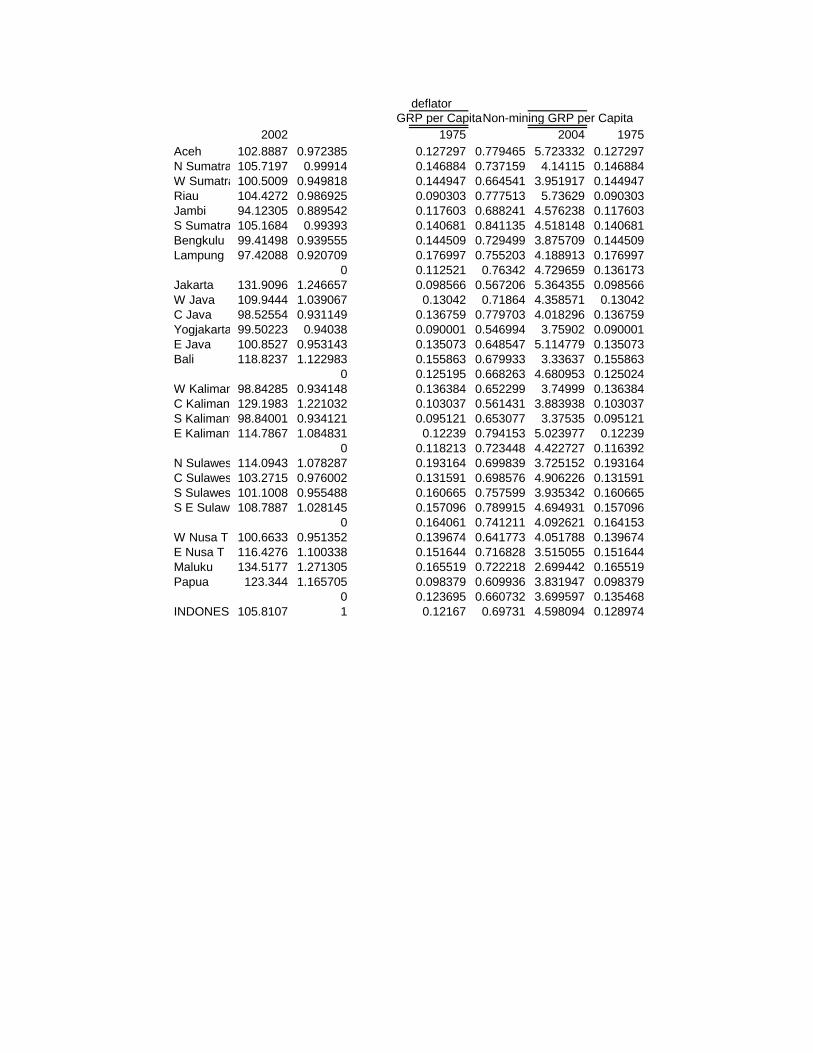
deflatorGRP per CapitaNon-mining GRP per Capita
2002 1975 2004 1975Aceh 102.8887 0.972385 0.127297 0.779465 5.723332 0.127297N Sumatra 105.7197 0.99914 0.146884 0.737159 4.14115 0.146884W Sumatra 100.5009 0.949818 0.144947 0.664541 3.951917 0.144947Riau 104.4272 0.986925 0.090303 0.777513 5.73629 0.090303Jambi 94.12305 0.889542 0.117603 0.688241 4.576238 0.117603S Sumatra 105.1684 0.99393 0.140681 0.841135 4.518148 0.140681Bengkulu 99.41498 0.939555 0.144509 0.729499 3.875709 0.144509Lampung 97.42088 0.920709 0.176997 0.755203 4.188913 0.176997
0 0.112521 0.76342 4.729659 0.136173Jakarta 131.9096 1.246657 0.098566 0.567206 5.364355 0.098566W Java 109.9444 1.039067 0.13042 0.71864 4.358571 0.13042C Java 98.52554 0.931149 0.136759 0.779703 4.018296 0.136759Yogjakarta 99.50223 0.94038 0.090001 0.546994 3.75902 0.090001E Java 100.8527 0.953143 0.135073 0.648547 5.114779 0.135073Bali 118.8237 1.122983 0.155863 0.679933 3.33637 0.155863
0 0.125195 0.668263 4.680953 0.125024W Kalimantan98.84285 0.934148 0.136384 0.652299 3.74999 0.136384C Kalimantan 129.1983 1.221032 0.103037 0.561431 3.883938 0.103037S Kalimantan98.84001 0.934121 0.095121 0.653077 3.37535 0.095121E Kalimantan114.7867 1.084831 0.12239 0.794153 5.023977 0.12239
0 0.118213 0.723448 4.422727 0.116392N Sulawesi 114.0943 1.078287 0.193164 0.699839 3.725152 0.193164C Sulawesi 103.2715 0.976002 0.131591 0.698576 4.906226 0.131591S Sulawesi 101.1008 0.955488 0.160665 0.757599 3.935342 0.160665S E Sulawesi 108.7887 1.028145 0.157096 0.789915 4.694931 0.157096
0 0.164061 0.741211 4.092621 0.164153W Nusa T 100.6633 0.951352 0.139674 0.641773 4.051788 0.139674E Nusa T 116.4276 1.100338 0.151644 0.716828 3.515055 0.151644Maluku 134.5177 1.271305 0.165519 0.722218 2.699442 0.165519Papua 123.344 1.165705 0.098379 0.609936 3.831947 0.098379
0 0.123695 0.660732 3.699597 0.135468INDONESIA105.8107 1 0.12167 0.69731 4.598094 0.128974
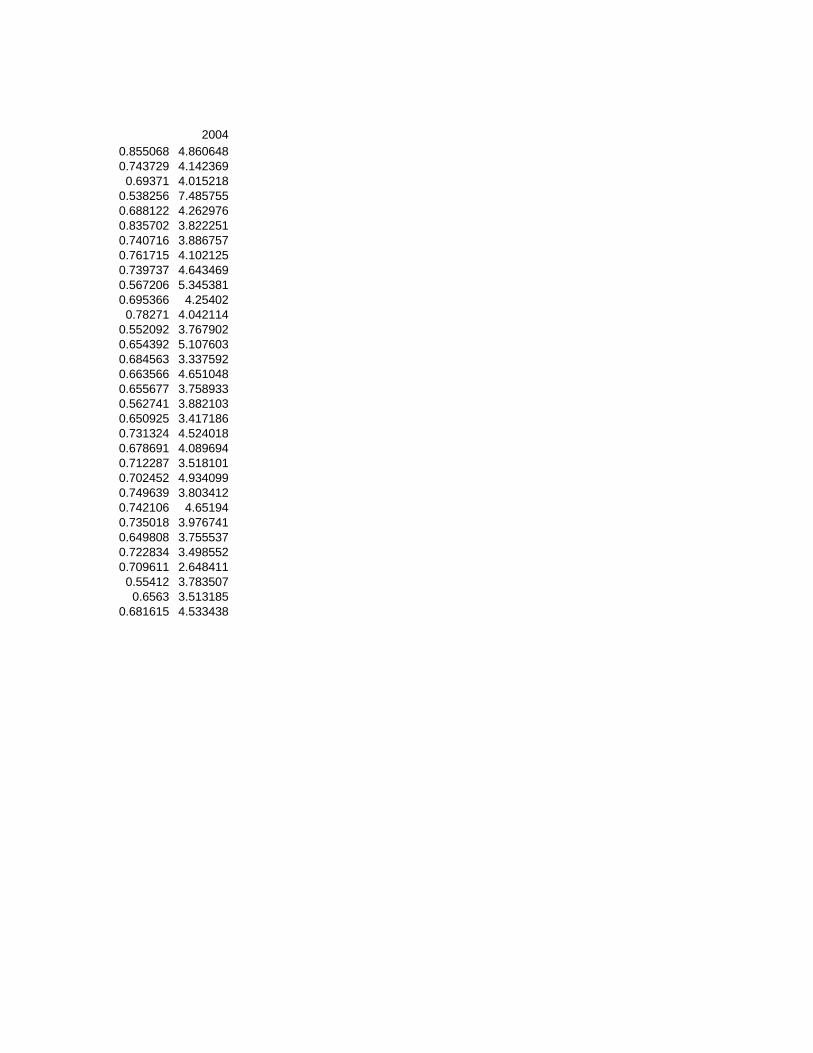
20040.855068 4.8606480.743729 4.1423690.69371 4.015218
0.538256 7.4857550.688122 4.2629760.835702 3.8222510.740716 3.8867570.761715 4.1021250.739737 4.6434690.567206 5.3453810.695366 4.254020.78271 4.042114
0.552092 3.7679020.654392 5.1076030.684563 3.3375920.663566 4.6510480.655677 3.7589330.562741 3.8821030.650925 3.4171860.731324 4.5240180.678691 4.0896940.712287 3.5181010.702452 4.9340990.749639 3.8034120.742106 4.651940.735018 3.9767410.649808 3.7555370.722834 3.4985520.709611 2.6484110.55412 3.7835070.6563 3.513185
0.681615 4.533438
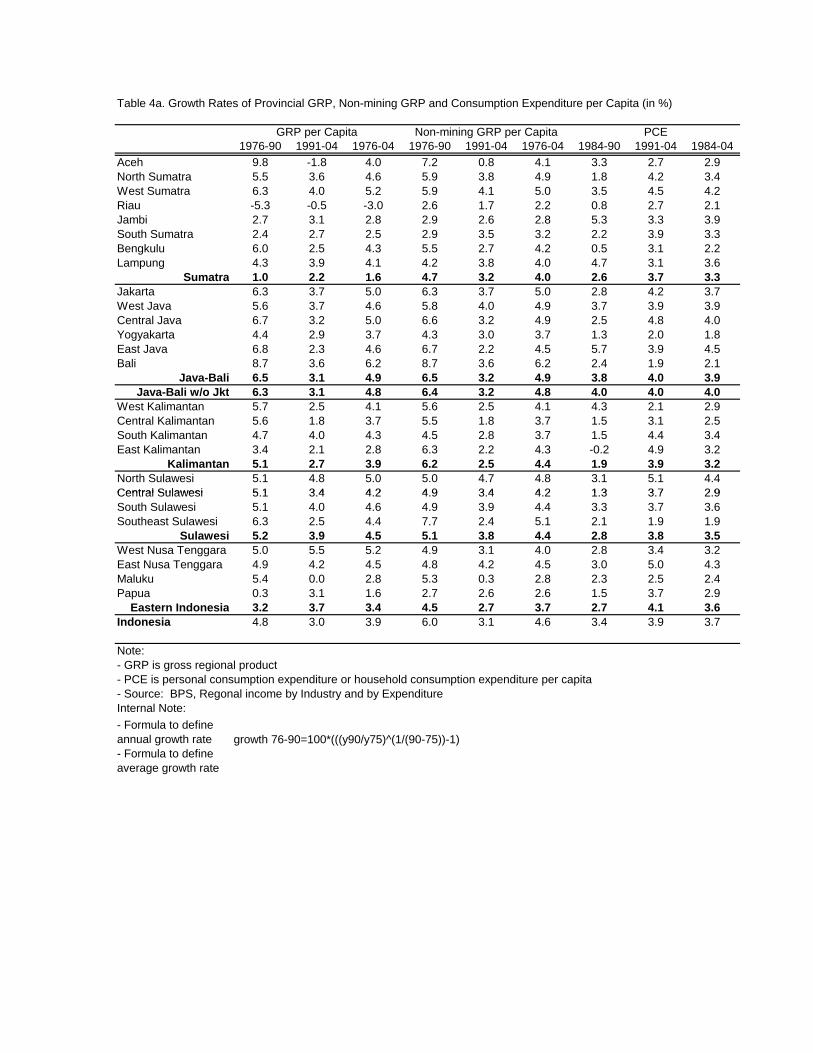
Table 4a. Growth Rates of Provincial GRP, Non-mining GRP and Consumption Expenditure per Capita (in %)
1976-90 1991-04 1976-04 1976-90 1991-04 1976-04 1984-90 1991-04 1984-04Aceh 9.8 -1.8 4.0 7.2 0.8 4.1 3.3 2.7 2.9North Sumatra 5.5 3.6 4.6 5.9 3.8 4.9 1.8 4.2 3.4West Sumatra 6.3 4.0 5.2 5.9 4.1 5.0 3.5 4.5 4.2Riau -5.3 -0.5 -3.0 2.6 1.7 2.2 0.8 2.7 2.1Jambi 2.7 3.1 2.8 2.9 2.6 2.8 5.3 3.3 3.9South Sumatra 2.4 2.7 2.5 2.9 3.5 3.2 2.2 3.9 3.3Bengkulu 6.0 2.5 4.3 5.5 2.7 4.2 0.5 3.1 2.2Lampung 4.3 3.9 4.1 4.2 3.8 4.0 4.7 3.1 3.6
Sumatra 1.0 2.2 1.6 4.7 3.2 4.0 2.6 3.7 3.3Jakarta 6.3 3.7 5.0 6.3 3.7 5.0 2.8 4.2 3.7West Java 5.6 3.7 4.6 5.8 4.0 4.9 3.7 3.9 3.9Central Java 6.7 3.2 5.0 6.6 3.2 4.9 2.5 4.8 4.0Yogyakarta 4.4 2.9 3.7 4.3 3.0 3.7 1.3 2.0 1.8East Java 6.8 2.3 4.6 6.7 2.2 4.5 5.7 3.9 4.5Bali 8.7 3.6 6.2 8.7 3.6 6.2 2.4 1.9 2.1
Java-Bali 6.5 3.1 4.9 6.5 3.2 4.9 3.8 4.0 3.9Java-Bali w/o Jkt 6.3 3.1 4.8 6.4 3.2 4.8 4.0 4.0 4.0
West Kalimantan 5.7 2.5 4.1 5.6 2.5 4.1 4.3 2.1 2.9Central Kalimantan 5.6 1.8 3.7 5.5 1.8 3.7 1.5 3.1 2.5South Kalimantan 4.7 4.0 4.3 4.5 2.8 3.7 1.5 4.4 3.4East Kalimantan 3.4 2.1 2.8 6.3 2.2 4.3 -0.2 4.9 3.2
Kalimantan 5.1 2.7 3.9 6.2 2.5 4.4 1.9 3.9 3.2North Sulawesi 5.1 4.8 5.0 5.0 4.7 4.8 3.1 5.1 4.4Central Sulawesi 5.1 3.4 4.2 4.9 3.4 4.2 1.3 3.7 2.9
GRP per Capita Non-mining GRP per Capita PCE
Central Sulawesi 5.1 3.4 4.2 4.9 3.4 4.2 1.3 3.7 2.9South Sulawesi 5.1 4.0 4.6 4.9 3.9 4.4 3.3 3.7 3.6Southeast Sulawesi 6.3 2.5 4.4 7.7 2.4 5.1 2.1 1.9 1.9
Sulawesi 5.2 3.9 4.5 5.1 3.8 4.4 2.8 3.8 3.5West Nusa Tenggara 5.0 5.5 5.2 4.9 3.1 4.0 2.8 3.4 3.2East Nusa Tenggara 4.9 4.2 4.5 4.8 4.2 4.5 3.0 5.0 4.3Maluku 5.4 0.0 2.8 5.3 0.3 2.8 2.3 2.5 2.4Papua 0.3 3.1 1.6 2.7 2.6 2.6 1.5 3.7 2.9
Eastern Indonesia 3.2 3.7 3.4 4.5 2.7 3.7 2.7 4.1 3.6Indonesia 4.8 3.0 3.9 6.0 3.1 4.6 3.4 3.9 3.7
Note:- GRP is gross regional product- PCE is personal consumption expenditure or household consumption expenditure per capita- Source: BPS, Regonal income by Industry and by ExpenditureInternal Note:
- Formula to define annual growth rate growth 76-90=100*(((y90/y75)^(1/(90-75))-1)- Formula to define average growth rate
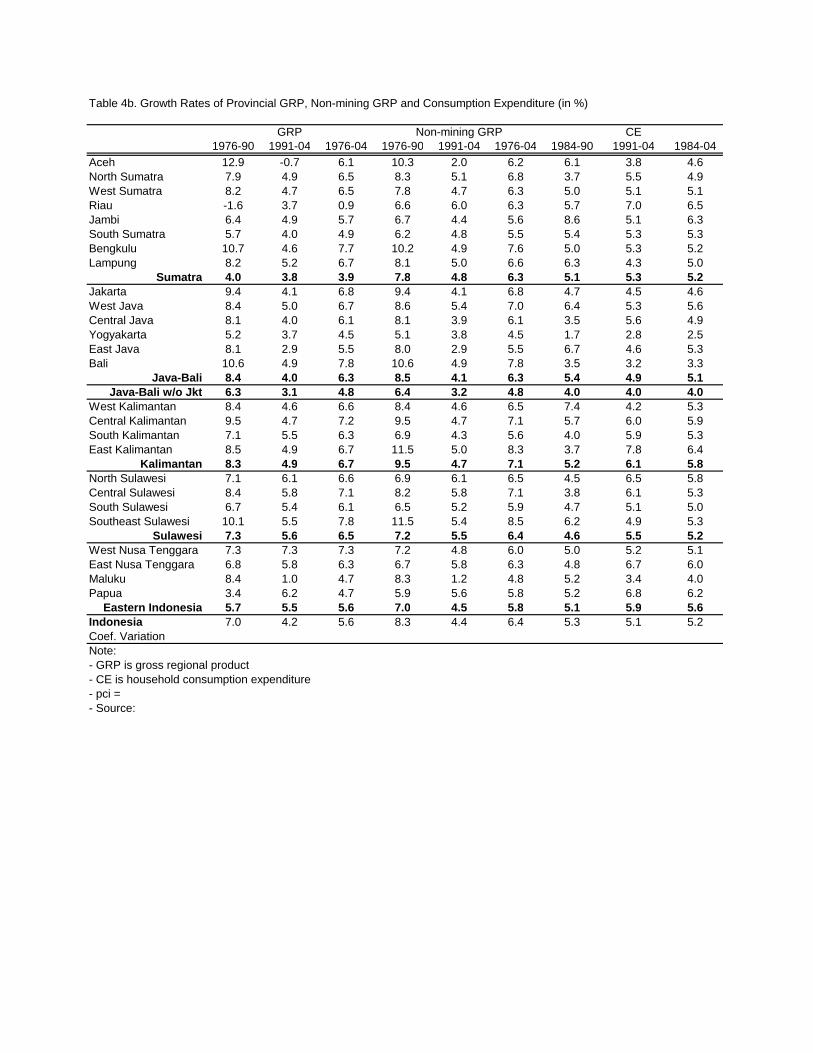
Table 4b. Growth Rates of Provincial GRP, Non-mining GRP and Consumption Expenditure (in %)
1976-90 1991-04 1976-04 1976-90 1991-04 1976-04 1984-90 1991-04 1984-04Aceh 12.9 -0.7 6.1 10.3 2.0 6.2 6.1 3.8 4.6North Sumatra 7.9 4.9 6.5 8.3 5.1 6.8 3.7 5.5 4.9West Sumatra 8.2 4.7 6.5 7.8 4.7 6.3 5.0 5.1 5.1Riau -1.6 3.7 0.9 6.6 6.0 6.3 5.7 7.0 6.5Jambi 6.4 4.9 5.7 6.7 4.4 5.6 8.6 5.1 6.3South Sumatra 5.7 4.0 4.9 6.2 4.8 5.5 5.4 5.3 5.3Bengkulu 10.7 4.6 7.7 10.2 4.9 7.6 5.0 5.3 5.2Lampung 8.2 5.2 6.7 8.1 5.0 6.6 6.3 4.3 5.0
Sumatra 4.0 3.8 3.9 7.8 4.8 6.3 5.1 5.3 5.2Jakarta 9.4 4.1 6.8 9.4 4.1 6.8 4.7 4.5 4.6West Java 8.4 5.0 6.7 8.6 5.4 7.0 6.4 5.3 5.6Central Java 8.1 4.0 6.1 8.1 3.9 6.1 3.5 5.6 4.9Yogyakarta 5.2 3.7 4.5 5.1 3.8 4.5 1.7 2.8 2.5East Java 8.1 2.9 5.5 8.0 2.9 5.5 6.7 4.6 5.3Bali 10.6 4.9 7.8 10.6 4.9 7.8 3.5 3.2 3.3
Java-Bali 8.4 4.0 6.3 8.5 4.1 6.3 5.4 4.9 5.1Java-Bali w/o Jkt 6.3 3.1 4.8 6.4 3.2 4.8 4.0 4.0 4.0
West Kalimantan 8.4 4.6 6.6 8.4 4.6 6.5 7.4 4.2 5.3Central Kalimantan 9.5 4.7 7.2 9.5 4.7 7.1 5.7 6.0 5.9South Kalimantan 7.1 5.5 6.3 6.9 4.3 5.6 4.0 5.9 5.3East Kalimantan 8.5 4.9 6.7 11.5 5.0 8.3 3.7 7.8 6.4
Kalimantan 8.3 4.9 6.7 9.5 4.7 7.1 5.2 6.1 5.8North Sulawesi 7.1 6.1 6.6 6.9 6.1 6.5 4.5 6.5 5.8Central Sulawesi 8.4 5.8 7.1 8.2 5.8 7.1 3.8 6.1 5.3South Sulawesi 6.7 5.4 6.1 6.5 5.2 5.9 4.7 5.1 5.0Southeast Sulawesi 10.1 5.5 7.8 11.5 5.4 8.5 6.2 4.9 5.3
Sulawesi 7.3 5.6 6.5 7.2 5.5 6.4 4.6 5.5 5.2West Nusa Tenggara 7.3 7.3 7.3 7.2 4.8 6.0 5.0 5.2 5.1East Nusa Tenggara 6.8 5.8 6.3 6.7 5.8 6.3 4.8 6.7 6.0Maluku 8.4 1.0 4.7 8.3 1.2 4.8 5.2 3.4 4.0Papua 3.4 6.2 4.7 5.9 5.6 5.8 5.2 6.8 6.2
Eastern Indonesia 5.7 5.5 5.6 7.0 4.5 5.8 5.1 5.9 5.6Indonesia 7.0 4.2 5.6 8.3 4.4 6.4 5.3 5.1 5.2Coef. VariationNote:- GRP is gross regional product- CE is household consumption expenditure- pci = - Source:
GRP Non-mining GRP CE
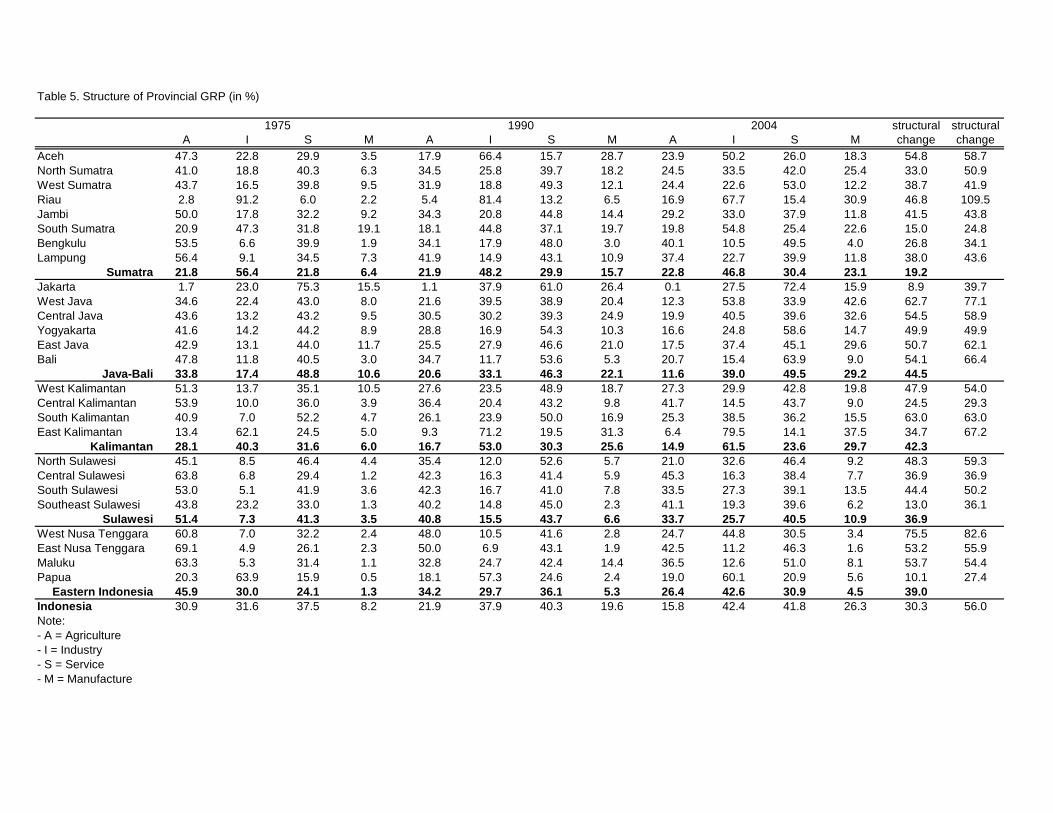
Table 5. Structure of Provincial GRP (in %)
structural structuralA I S M A I S M A I S M change change
Aceh 47.3 22.8 29.9 3.5 17.9 66.4 15.7 28.7 23.9 50.2 26.0 18.3 54.8 58.7North Sumatra 41.0 18.8 40.3 6.3 34.5 25.8 39.7 18.2 24.5 33.5 42.0 25.4 33.0 50.9West Sumatra 43.7 16.5 39.8 9.5 31.9 18.8 49.3 12.1 24.4 22.6 53.0 12.2 38.7 41.9Riau 2.8 91.2 6.0 2.2 5.4 81.4 13.2 6.5 16.9 67.7 15.4 30.9 46.8 109.5Jambi 50.0 17.8 32.2 9.2 34.3 20.8 44.8 14.4 29.2 33.0 37.9 11.8 41.5 43.8South Sumatra 20.9 47.3 31.8 19.1 18.1 44.8 37.1 19.7 19.8 54.8 25.4 22.6 15.0 24.8Bengkulu 53.5 6.6 39.9 1.9 34.1 17.9 48.0 3.0 40.1 10.5 49.5 4.0 26.8 34.1Lampung 56.4 9.1 34.5 7.3 41.9 14.9 43.1 10.9 37.4 22.7 39.9 11.8 38.0 43.6
Sumatra 21.8 56.4 21.8 6.4 21.9 48.2 29.9 15.7 22.8 46.8 30.4 23.1 19.2Jakarta 1.7 23.0 75.3 15.5 1.1 37.9 61.0 26.4 0.1 27.5 72.4 15.9 8.9 39.7West Java 34.6 22.4 43.0 8.0 21.6 39.5 38.9 20.4 12.3 53.8 33.9 42.6 62.7 77.1Central Java 43.6 13.2 43.2 9.5 30.5 30.2 39.3 24.9 19.9 40.5 39.6 32.6 54.5 58.9Yogyakarta 41.6 14.2 44.2 8.9 28.8 16.9 54.3 10.3 16.6 24.8 58.6 14.7 49.9 49.9East Java 42.9 13.1 44.0 11.7 25.5 27.9 46.6 21.0 17.5 37.4 45.1 29.6 50.7 62.1Bali 47.8 11.8 40.5 3.0 34.7 11.7 53.6 5.3 20.7 15.4 63.9 9.0 54.1 66.4
Java-Bali 33.8 17.4 48.8 10.6 20.6 33.1 46.3 22.1 11.6 39.0 49.5 29.2 44.5West Kalimantan 51.3 13.7 35.1 10.5 27.6 23.5 48.9 18.7 27.3 29.9 42.8 19.8 47.9 54.0Central Kalimantan 53.9 10.0 36.0 3.9 36.4 20.4 43.2 9.8 41.7 14.5 43.7 9.0 24.5 29.3South Kalimantan 40.9 7.0 52.2 4.7 26.1 23.9 50.0 16.9 25.3 38.5 36.2 15.5 63.0 63.0East Kalimantan 13.4 62.1 24.5 5.0 9.3 71.2 19.5 31.3 6.4 79.5 14.1 37.5 34.7 67.2
Kalimantan 28.1 40.3 31.6 6.0 16.7 53.0 30.3 25.6 14.9 61.5 23.6 29.7 42.3North Sulawesi 45.1 8.5 46.4 4.4 35.4 12.0 52.6 5.7 21.0 32.6 46.4 9.2 48.3 59.3Central Sulawesi 63.8 6.8 29.4 1.2 42.3 16.3 41.4 5.9 45.3 16.3 38.4 7.7 36.9 36.9South Sulawesi 53.0 5.1 41.9 3.6 42.3 16.7 41.0 7.8 33.5 27.3 39.1 13.5 44.4 50.2Southeast Sulawesi 43.8 23.2 33.0 1.3 40.2 14.8 45.0 2.3 41.1 19.3 39.6 6.2 13.0 36.1
Sulawesi 51.4 7.3 41.3 3.5 40.8 15.5 43.7 6.6 33.7 25.7 40.5 10.9 36.9West Nusa Tenggara 60.8 7.0 32.2 2.4 48.0 10.5 41.6 2.8 24.7 44.8 30.5 3.4 75.5 82.6East Nusa Tenggara 69.1 4.9 26.1 2.3 50.0 6.9 43.1 1.9 42.5 11.2 46.3 1.6 53.2 55.9Maluku 63.3 5.3 31.4 1.1 32.8 24.7 42.4 14.4 36.5 12.6 51.0 8.1 53.7 54.4Papua 20.3 63.9 15.9 0.5 18.1 57.3 24.6 2.4 19.0 60.1 20.9 5.6 10.1 27.4
Eastern Indonesia 45.9 30.0 24.1 1.3 34.2 29.7 36.1 5.3 26.4 42.6 30.9 4.5 39.0Indonesia 30.9 31.6 37.5 8.2 21.9 37.9 40.3 19.6 15.8 42.4 41.8 26.3 30.3 56.0Note:- A = Agriculture- I = Industry- S = Service- M = Manufacture
1975 1990 2004
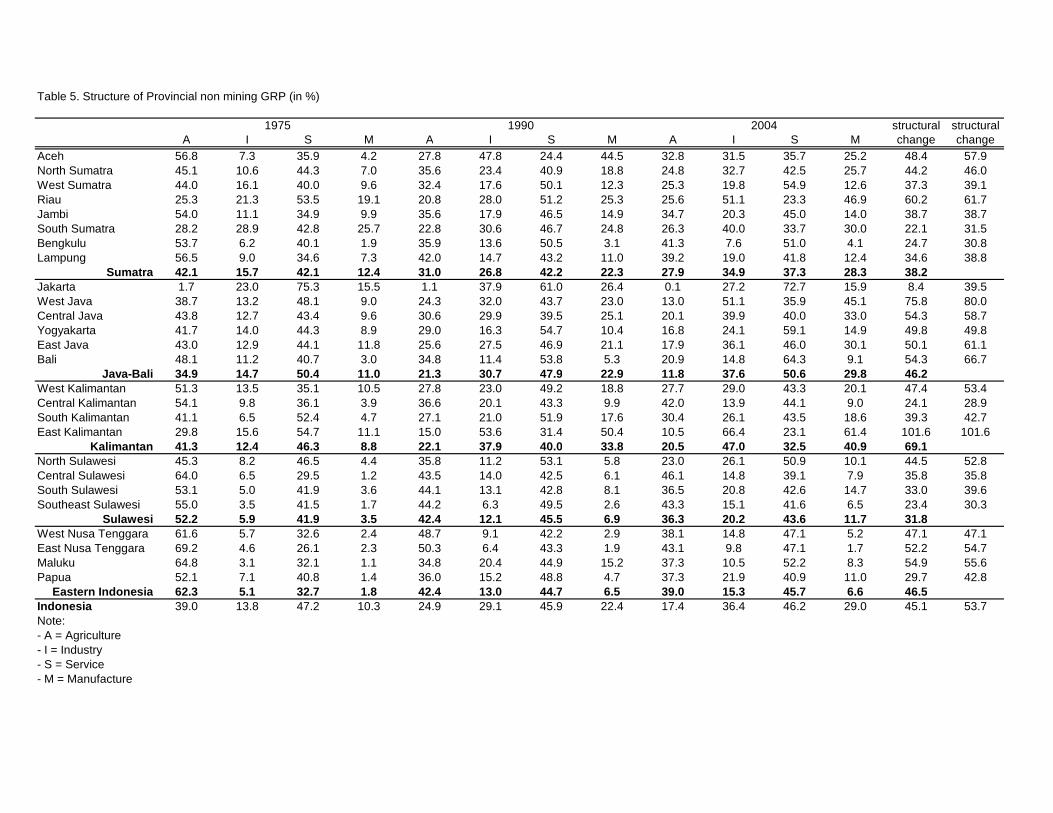
Table 5. Structure of Provincial non mining GRP (in %)
structural structuralA I S M A I S M A I S M change change
Aceh 56.8 7.3 35.9 4.2 27.8 47.8 24.4 44.5 32.8 31.5 35.7 25.2 48.4 57.9North Sumatra 45.1 10.6 44.3 7.0 35.6 23.4 40.9 18.8 24.8 32.7 42.5 25.7 44.2 46.0West Sumatra 44.0 16.1 40.0 9.6 32.4 17.6 50.1 12.3 25.3 19.8 54.9 12.6 37.3 39.1Riau 25.3 21.3 53.5 19.1 20.8 28.0 51.2 25.3 25.6 51.1 23.3 46.9 60.2 61.7Jambi 54.0 11.1 34.9 9.9 35.6 17.9 46.5 14.9 34.7 20.3 45.0 14.0 38.7 38.7South Sumatra 28.2 28.9 42.8 25.7 22.8 30.6 46.7 24.8 26.3 40.0 33.7 30.0 22.1 31.5Bengkulu 53.7 6.2 40.1 1.9 35.9 13.6 50.5 3.1 41.3 7.6 51.0 4.1 24.7 30.8Lampung 56.5 9.0 34.6 7.3 42.0 14.7 43.2 11.0 39.2 19.0 41.8 12.4 34.6 38.8
Sumatra 42.1 15.7 42.1 12.4 31.0 26.8 42.2 22.3 27.9 34.9 37.3 28.3 38.2Jakarta 1.7 23.0 75.3 15.5 1.1 37.9 61.0 26.4 0.1 27.2 72.7 15.9 8.4 39.5West Java 38.7 13.2 48.1 9.0 24.3 32.0 43.7 23.0 13.0 51.1 35.9 45.1 75.8 80.0Central Java 43.8 12.7 43.4 9.6 30.6 29.9 39.5 25.1 20.1 39.9 40.0 33.0 54.3 58.7Yogyakarta 41.7 14.0 44.3 8.9 29.0 16.3 54.7 10.4 16.8 24.1 59.1 14.9 49.8 49.8East Java 43.0 12.9 44.1 11.8 25.6 27.5 46.9 21.1 17.9 36.1 46.0 30.1 50.1 61.1Bali 48.1 11.2 40.7 3.0 34.8 11.4 53.8 5.3 20.9 14.8 64.3 9.1 54.3 66.7
Java-Bali 34.9 14.7 50.4 11.0 21.3 30.7 47.9 22.9 11.8 37.6 50.6 29.8 46.2West Kalimantan 51.3 13.5 35.1 10.5 27.8 23.0 49.2 18.8 27.7 29.0 43.3 20.1 47.4 53.4Central Kalimantan 54.1 9.8 36.1 3.9 36.6 20.1 43.3 9.9 42.0 13.9 44.1 9.0 24.1 28.9South Kalimantan 41.1 6.5 52.4 4.7 27.1 21.0 51.9 17.6 30.4 26.1 43.5 18.6 39.3 42.7East Kalimantan 29.8 15.6 54.7 11.1 15.0 53.6 31.4 50.4 10.5 66.4 23.1 61.4 101.6 101.6
Kalimantan 41.3 12.4 46.3 8.8 22.1 37.9 40.0 33.8 20.5 47.0 32.5 40.9 69.1North Sulawesi 45.3 8.2 46.5 4.4 35.8 11.2 53.1 5.8 23.0 26.1 50.9 10.1 44.5 52.8Central Sulawesi 64.0 6.5 29.5 1.2 43.5 14.0 42.5 6.1 46.1 14.8 39.1 7.9 35.8 35.8South Sulawesi 53.1 5.0 41.9 3.6 44.1 13.1 42.8 8.1 36.5 20.8 42.6 14.7 33.0 39.6Southeast Sulawesi 55.0 3.5 41.5 1.7 44.2 6.3 49.5 2.6 43.3 15.1 41.6 6.5 23.4 30.3
Sulawesi 52.2 5.9 41.9 3.5 42.4 12.1 45.5 6.9 36.3 20.2 43.6 11.7 31.8West Nusa Tenggara 61.6 5.7 32.6 2.4 48.7 9.1 42.2 2.9 38.1 14.8 47.1 5.2 47.1 47.1East Nusa Tenggara 69.2 4.6 26.1 2.3 50.3 6.4 43.3 1.9 43.1 9.8 47.1 1.7 52.2 54.7Maluku 64.8 3.1 32.1 1.1 34.8 20.4 44.9 15.2 37.3 10.5 52.2 8.3 54.9 55.6Papua 52.1 7.1 40.8 1.4 36.0 15.2 48.8 4.7 37.3 21.9 40.9 11.0 29.7 42.8
Eastern Indonesia 62.3 5.1 32.7 1.8 42.4 13.0 44.7 6.5 39.0 15.3 45.7 6.6 46.5Indonesia 39.0 13.8 47.2 10.3 24.9 29.1 45.9 22.4 17.4 36.4 46.2 29.0 45.1 53.7Note:- A = Agriculture- I = Industry- S = Service- M = Manufacture
1975 1990 2004
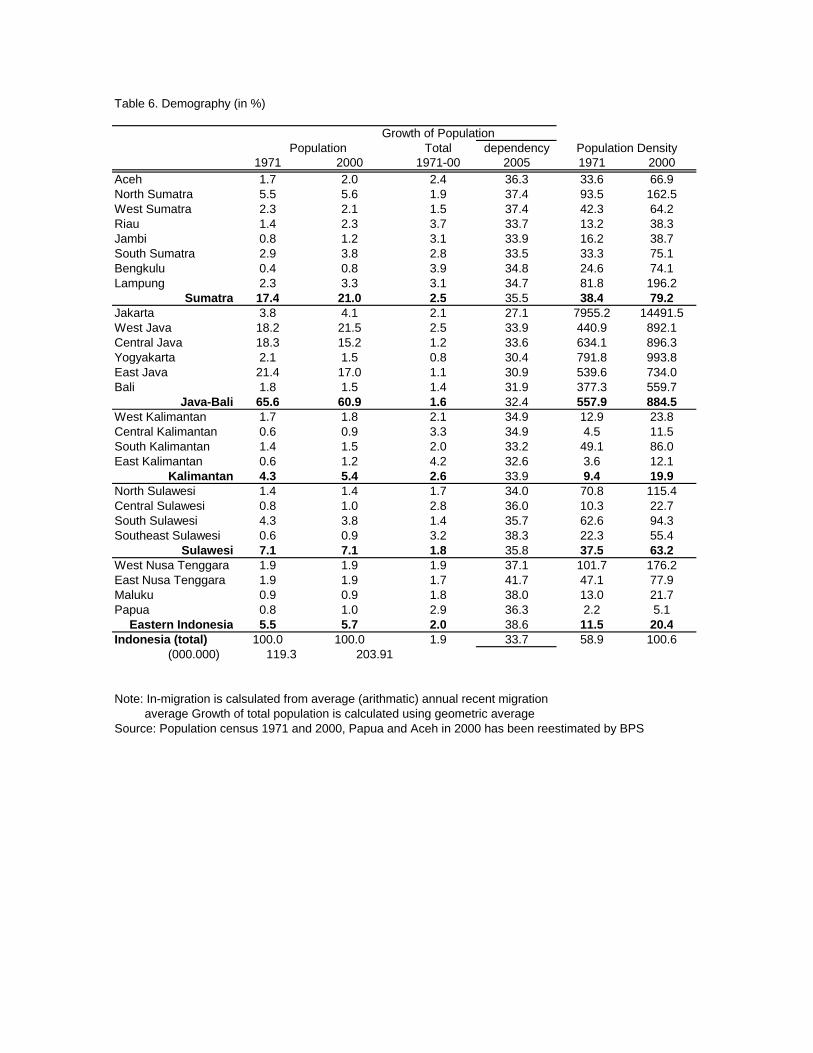
Table 6. Demography (in %)
Growth of PopulationTotal dependency
1971 2000 1971-00 2005 1971 2000Aceh 1.7 2.0 2.4 36.3 33.6 66.9North Sumatra 5.5 5.6 1.9 37.4 93.5 162.5West Sumatra 2.3 2.1 1.5 37.4 42.3 64.2Riau 1.4 2.3 3.7 33.7 13.2 38.3Jambi 0.8 1.2 3.1 33.9 16.2 38.7South Sumatra 2.9 3.8 2.8 33.5 33.3 75.1Bengkulu 0.4 0.8 3.9 34.8 24.6 74.1Lampung 2.3 3.3 3.1 34.7 81.8 196.2
Sumatra 17.4 21.0 2.5 35.5 38.4 79.2Jakarta 3.8 4.1 2.1 27.1 7955.2 14491.5West Java 18.2 21.5 2.5 33.9 440.9 892.1Central Java 18.3 15.2 1.2 33.6 634.1 896.3Yogyakarta 2.1 1.5 0.8 30.4 791.8 993.8East Java 21.4 17.0 1.1 30.9 539.6 734.0Bali 1.8 1.5 1.4 31.9 377.3 559.7
Java-Bali 65.6 60.9 1.6 32.4 557.9 884.5West Kalimantan 1.7 1.8 2.1 34.9 12.9 23.8Central Kalimantan 0.6 0.9 3.3 34.9 4.5 11.5South Kalimantan 1.4 1.5 2.0 33.2 49.1 86.0East Kalimantan 0.6 1.2 4.2 32.6 3.6 12.1
Kalimantan 4.3 5.4 2.6 33.9 9.4 19.9North Sulawesi 1.4 1.4 1.7 34.0 70.8 115.4Central Sulawesi 0.8 1.0 2.8 36.0 10.3 22.7South Sulawesi 4.3 3.8 1.4 35.7 62.6 94.3Southeast Sulawesi 0.6 0.9 3.2 38.3 22.3 55.4
Sulawesi 7.1 7.1 1.8 35.8 37.5 63.2West Nusa Tenggara 1.9 1.9 1.9 37.1 101.7 176.2East Nusa Tenggara 1.9 1.9 1.7 41.7 47.1 77.9Maluku 0.9 0.9 1.8 38.0 13.0 21.7Papua 0.8 1.0 2.9 36.3 2.2 5.1
Eastern Indonesia 5.5 5.7 2.0 38.6 11.5 20.4Indonesia (total) 100.0 100.0 1.9 33.7 58.9 100.6 (000.000) 119.3 203.91
Note: In-migration is calsulated from average (arithmatic) annual recent migration average Growth of total population is calculated using geometric averageSource: Population census 1971 and 2000, Papua and Aceh in 2000 has been reestimated by BPS
Population Population Density
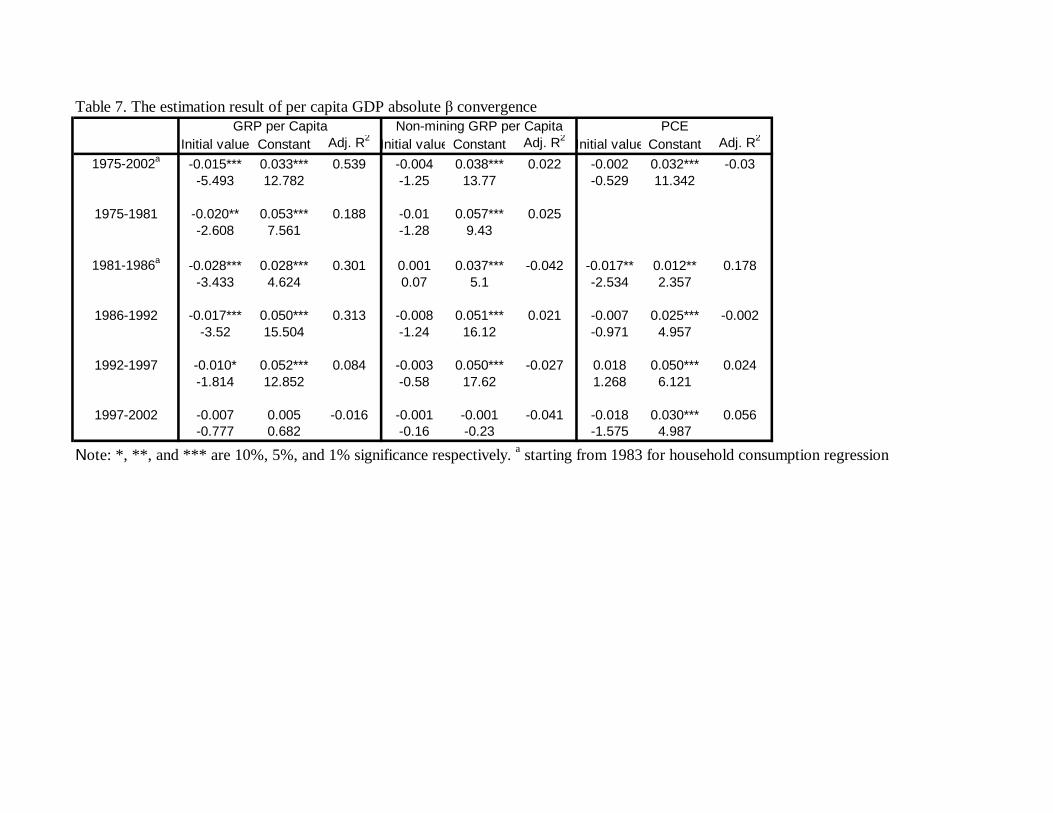
Table 7. The estimation result of per capita GDP absolute β convergence
Initial value Constant Adj. R2Initial value Constant Adj. R2
Initial value Constant Adj. R2
1975-2002a -0.015*** 0.033*** 0.539 -0.004 0.038*** 0.022 -0.002 0.032*** -0.03-5.493 12.782 -1.25 13.77 -0.529 11.342
1975-1981 -0.020** 0.053*** 0.188 -0.01 0.057*** 0.025-2.608 7.561 -1.28 9.43
1981-1986a -0.028*** 0.028*** 0.301 0.001 0.037*** -0.042 -0.017** 0.012** 0.178-3.433 4.624 0.07 5.1 -2.534 2.357
1986-1992 -0.017*** 0.050*** 0.313 -0.008 0.051*** 0.021 -0.007 0.025*** -0.002-3.52 15.504 -1.24 16.12 -0.971 4.957
1992-1997 -0.010* 0.052*** 0.084 -0.003 0.050*** -0.027 0.018 0.050*** 0.024-1.814 12.852 -0.58 17.62 1.268 6.121
1997-2002 -0.007 0.005 -0.016 -0.001 -0.001 -0.041 -0.018 0.030*** 0.056-0.777 0.682 -0.16 -0.23 -1.575 4.987
Note: *, **, and *** are 10%, 5%, and 1% significance respectively. a starting from 1983 for household consumption regression
GRP per Capita Non-mining GRP per Capita PCE
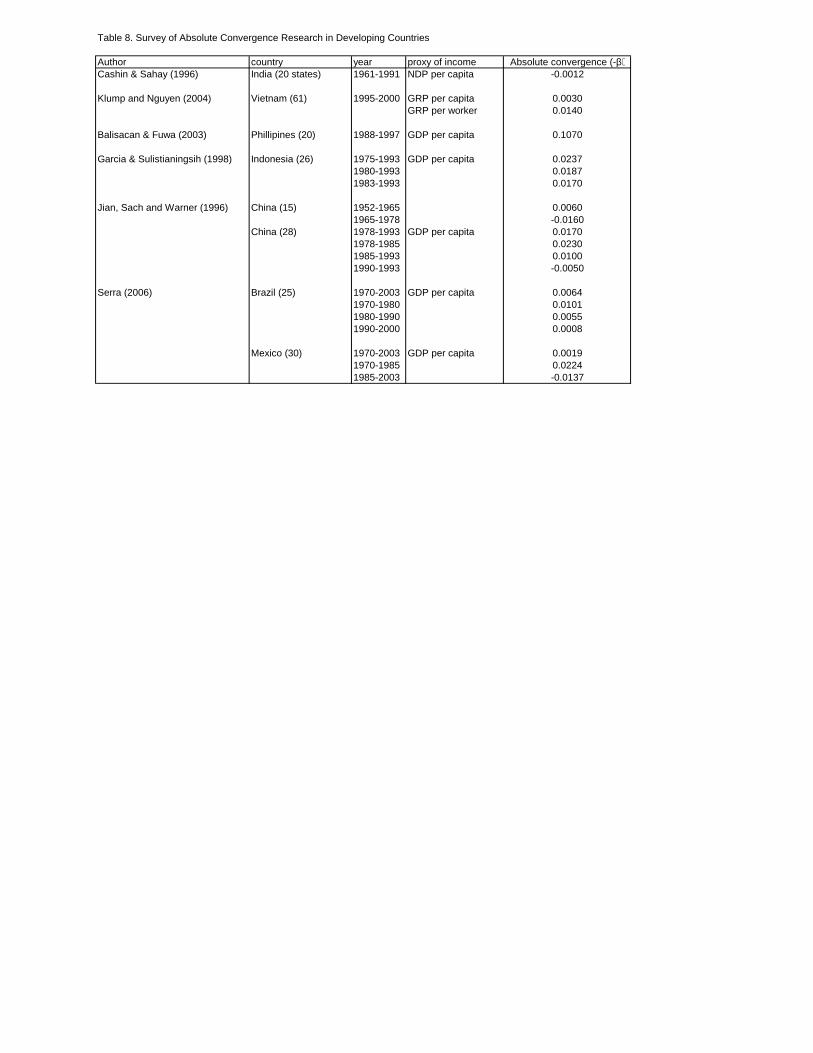
Table 8. Survey of Absolute Convergence Research in Developing Countries
Author country year proxy of income Absolute convergence (-β)Cashin & Sahay (1996) India (20 states) 1961-1991 NDP per capita -0.0012
Klump and Nguyen (2004) Vietnam (61) 1995-2000 GRP per capita 0.0030GRP per worker 0.0140
Balisacan & Fuwa (2003) Phillipines (20) 1988-1997 GDP per capita 0.1070
Garcia & Sulistianingsih (1998) Indonesia (26) 1975-1993 GDP per capita 0.02371980-1993 0.01871983-1993 0.0170
Jian, Sach and Warner (1996) China (15) 1952-1965 0.00601965-1978 -0.0160
China (28) 1978-1993 GDP per capita 0.01701978-1985 0.02301985-1993 0.01001990-1993 -0.0050
Serra (2006) Brazil (25) 1970-2003 GDP per capita 0.00641970-1980 0.01011980-1990 0.00551990-2000 0.0008
Mexico (30) 1970-2003 GDP per capita 0.00191970-1985 0.02241985-2003 -0.0137
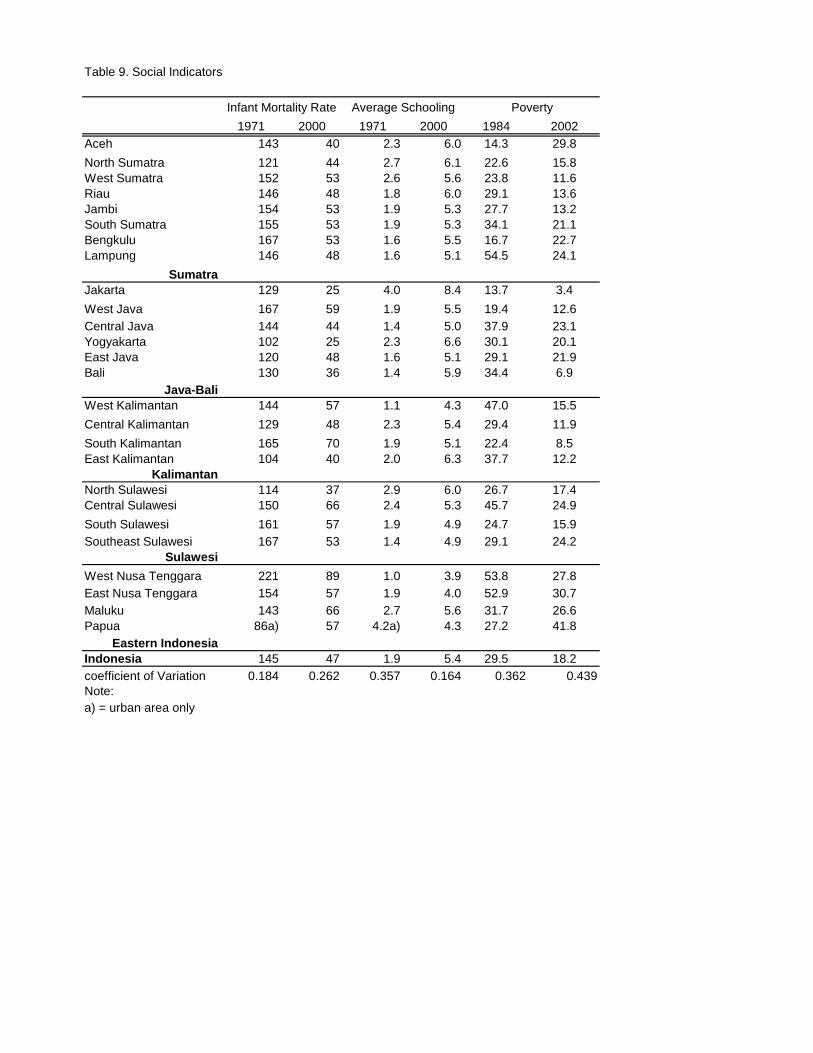
Table 9. Social Indicators
1971 2000 1971 2000 1984 2002Aceh 143 40 2.3 6.0 14.3 29.8
North Sumatra 121 44 2.7 6.1 22.6 15.8West Sumatra 152 53 2.6 5.6 23.8 11.6Riau 146 48 1.8 6.0 29.1 13.6Jambi 154 53 1.9 5.3 27.7 13.2South Sumatra 155 53 1.9 5.3 34.1 21.1Bengkulu 167 53 1.6 5.5 16.7 22.7Lampung 146 48 1.6 5.1 54.5 24.1
SumatraJakarta 129 25 4.0 8.4 13.7 3.4
West Java 167 59 1.9 5.5 19.4 12.6Central Java 144 44 1.4 5.0 37.9 23.1Yogyakarta 102 25 2.3 6.6 30.1 20.1East Java 120 48 1.6 5.1 29.1 21.9Bali 130 36 1.4 5.9 34.4 6.9
Java-BaliWest Kalimantan 144 57 1.1 4.3 47.0 15.5
Central Kalimantan 129 48 2.3 5.4 29.4 11.9
South Kalimantan 165 70 1.9 5.1 22.4 8.5East Kalimantan 104 40 2.0 6.3 37.7 12.2
KalimantanNorth Sulawesi 114 37 2.9 6.0 26.7 17.4Central Sulawesi 150 66 2.4 5.3 45.7 24.9
South Sulawesi 161 57 1.9 4.9 24.7 15.9Southeast Sulawesi 167 53 1.4 4.9 29.1 24.2
Sulawesi
West Nusa Tenggara 221 89 1.0 3.9 53.8 27.8East Nusa Tenggara 154 57 1.9 4.0 52.9 30.7Maluku 143 66 2.7 5.6 31.7 26.6Papua 86a) 57 4.2a) 4.3 27.2 41.8
Eastern IndonesiaIndonesia 145 47 1.9 5.4 29.5 18.2coefficient of Variation 0.184 0.262 0.357 0.164 0.362 0.439Note:a) = urban area only
Infant Mortality Rate Average Schooling Poverty
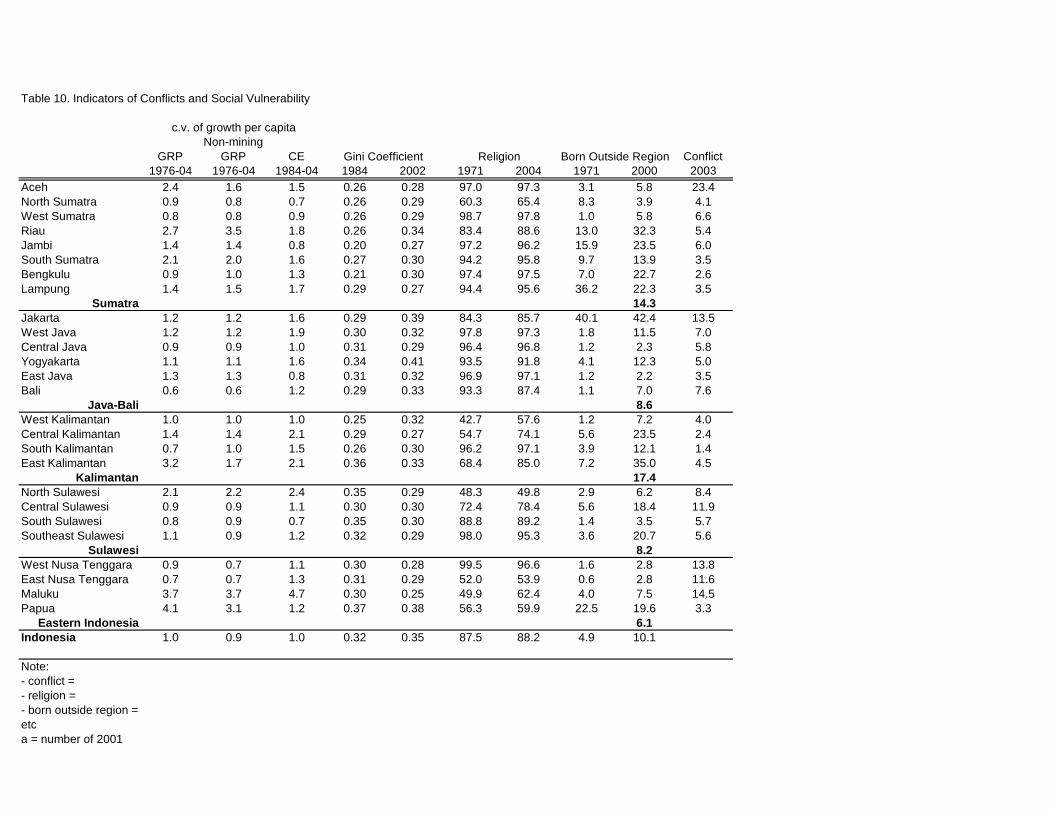
Table 10. Indicators of Conflicts and Social Vulnerability
GRPNon-mining
GRP CE Conflict1976-04 1976-04 1984-04 1984 2002 1971 2004 1971 2000 2003
Aceh 2.4 1.6 1.5 0.26 0.28 97.0 97.3 3.1 5.8 23.4North Sumatra 0.9 0.8 0.7 0.26 0.29 60.3 65.4 8.3 3.9 4.1West Sumatra 0.8 0.8 0.9 0.26 0.29 98.7 97.8 1.0 5.8 6.6Riau 2.7 3.5 1.8 0.26 0.34 83.4 88.6 13.0 32.3 5.4Jambi 1.4 1.4 0.8 0.20 0.27 97.2 96.2 15.9 23.5 6.0South Sumatra 2.1 2.0 1.6 0.27 0.30 94.2 95.8 9.7 13.9 3.5Bengkulu 0.9 1.0 1.3 0.21 0.30 97.4 97.5 7.0 22.7 2.6Lampung 1.4 1.5 1.7 0.29 0.27 94.4 95.6 36.2 22.3 3.5
Sumatra 14.3Jakarta 1.2 1.2 1.6 0.29 0.39 84.3 85.7 40.1 42.4 13.5West Java 1.2 1.2 1.9 0.30 0.32 97.8 97.3 1.8 11.5 7.0Central Java 0.9 0.9 1.0 0.31 0.29 96.4 96.8 1.2 2.3 5.8Yogyakarta 1.1 1.1 1.6 0.34 0.41 93.5 91.8 4.1 12.3 5.0East Java 1.3 1.3 0.8 0.31 0.32 96.9 97.1 1.2 2.2 3.5Bali 0.6 0.6 1.2 0.29 0.33 93.3 87.4 1.1 7.0 7.6
Java-Bali 8.6West Kalimantan 1.0 1.0 1.0 0.25 0.32 42.7 57.6 1.2 7.2 4.0Central Kalimantan 1.4 1.4 2.1 0.29 0.27 54.7 74.1 5.6 23.5 2.4South Kalimantan 0.7 1.0 1.5 0.26 0.30 96.2 97.1 3.9 12.1 1.4East Kalimantan 3.2 1.7 2.1 0.36 0.33 68.4 85.0 7.2 35.0 4.5
Kalimantan 17.4North Sulawesi 2.1 2.2 2.4 0.35 0.29 48.3 49.8 2.9 6.2 8.4Central Sulawesi 0.9 0.9 1.1 0.30 0.30 72.4 78.4 5.6 18.4 11.9South Sulawesi 0.8 0.9 0.7 0.35 0.30 88.8 89.2 1.4 3.5 5.7Southeast Sulawesi 1.1 0.9 1.2 0.32 0.29 98.0 95.3 3.6 20.7 5.6
Sulawesi 8.2West Nusa Tenggara 0.9 0.7 1.1 0.30 0.28 99.5 96.6 1.6 2.8 13.8East Nusa Tenggara 0.7 0.7 1.3 0.31 0.29 52.0 53.9 0.6 2.8 11.6Maluku 3.7 3.7 4.7 0.30 0.25 49.9 62.4 4.0 7.5 14.5Papua 4.1 3.1 1.2 0.37 0.38 56.3 59.9 22.5 19.6 3.3
Eastern Indonesia 6.1Indonesia 1.0 0.9 1.0 0.32 0.35 87.5 88.2 4.9 10.1
Note:- conflict =- religion = - born outside region =etca = number of 2001
c.v. of growth per capita
Gini Coefficient Religion Born Outside Region

4.0
6.0
8.0
GD
P p
er c
apit
a G
row
th (
%)
Figure 1a. Structural Change and Growth 1975-2004
NTTW.Sum.
Bali
Jkt
-4.0
-2.0
0.0
2.0
0.0 10.0 20.0 30.0 40.0 50.0 60.0 70.0 80.0GD
P p
er c
apit
a G
row
th (
%)
Structural Change
Riau
Papua
Structural Change: i=Agriculture, Industry, Services
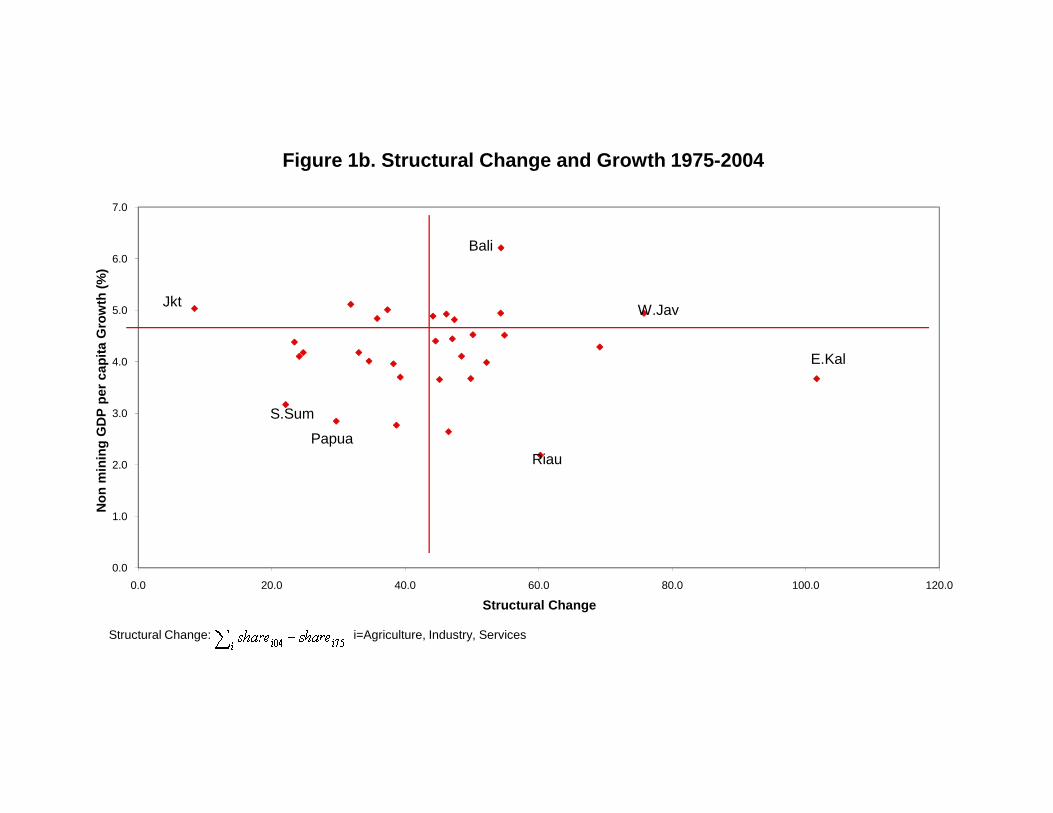
4.0
5.0
6.0
7.0
No
n m
inin
g G
DP
per
cap
ita
Gro
wth
(%
)
Figure 1b. Structural Change and Growth 1975-2004
E.Kal
Bali
W.JavJkt
0.0
1.0
2.0
3.0
0.0 20.0 40.0 60.0 80.0 100.0 120.0
No
n m
inin
g G
DP
per
cap
ita
Gro
wth
(%
)
Structural Change
Riau
S.Sum
Papua
Structural Change: i=Agriculture, Industry, Services
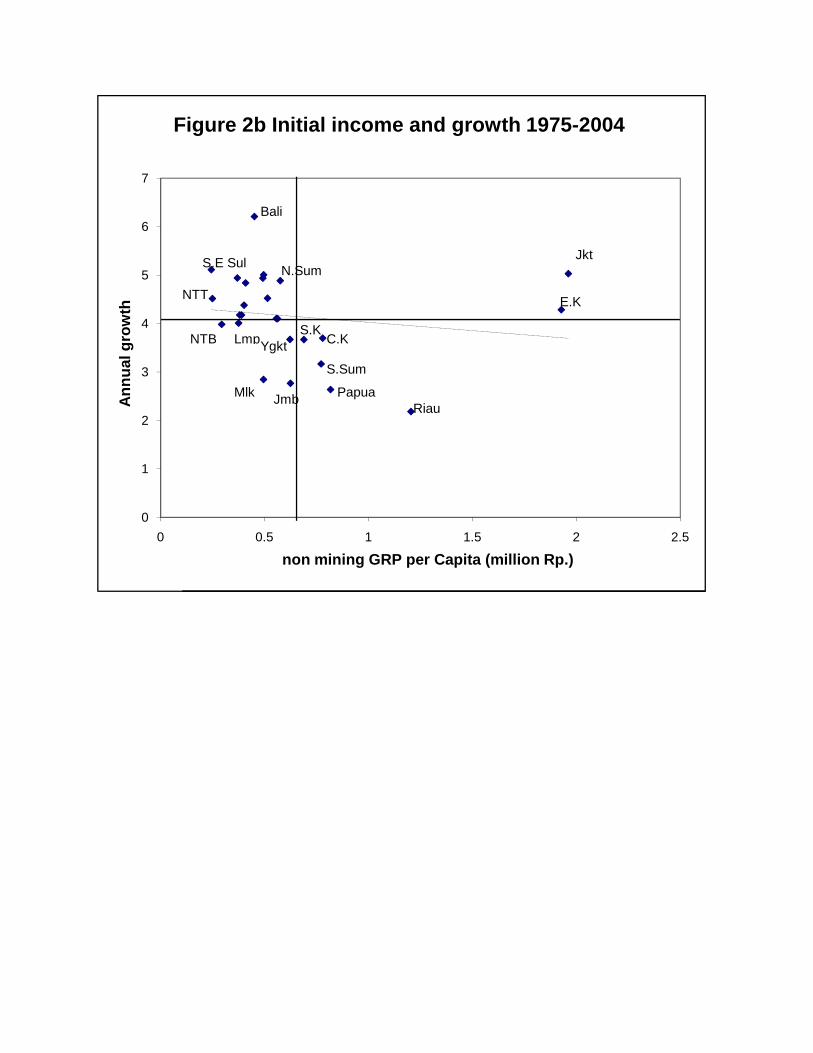
0
1
2
3
4
5
6
7
0 0.5 1 1.5 2 2.5
An
nu
al g
row
th
non mining GRP per Capita (million Rp.)
Figure 2b Initial income and growth 1975-2004
Riau
Jkt
E.K
Papua
S.Sum
C.KS.K
Ygkt
JmbMlk
LmpNTB
NTT
Bali
S.E SulN.Sum

0
1
2
3
4
5
6
7
0 0.5 1 1.5 2 2.5
An
nu
al g
row
th
non mining GRP per Capita (million Rp.)
Figure 2b Initial income and growth 1975-2004
Riau
Jkt
E.K
Papua
S.Sum
C.KS.K
Ygkt
JmbMlk
LmpNTB
NTT
Bali
S.E SulN.Sum
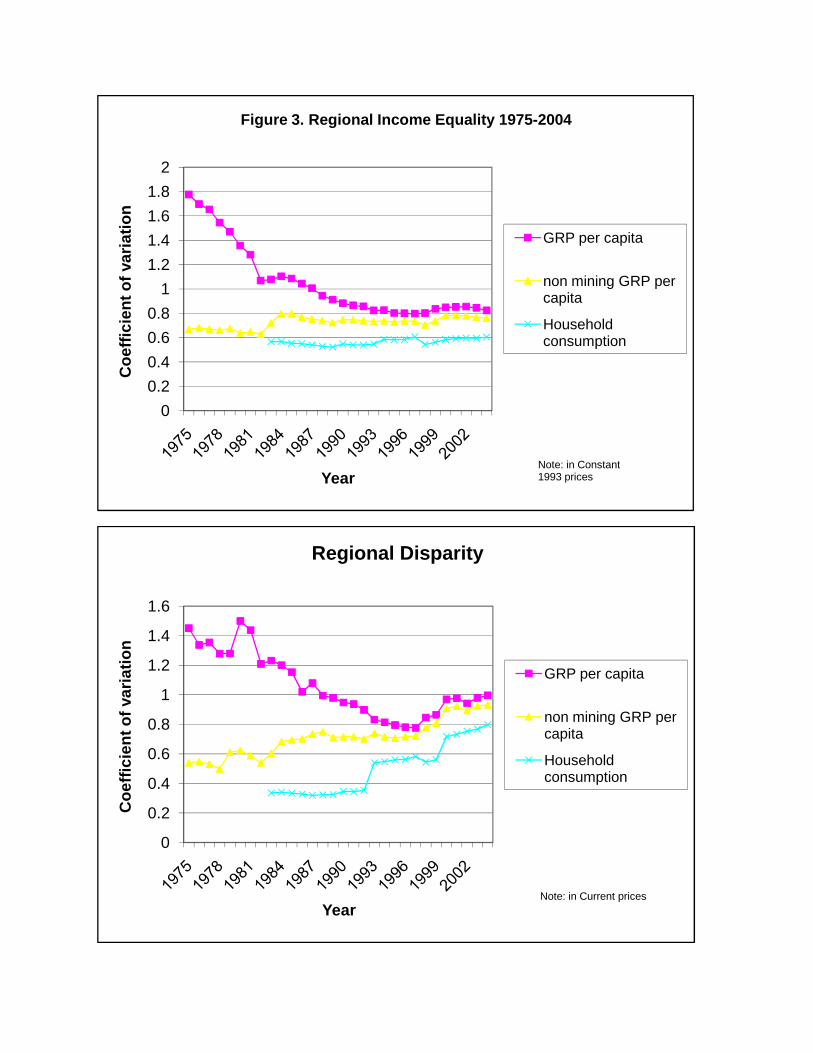
0
0.2
0.4
0.6
0.8
1
1.2
1.4
1.6
1.8
2
Co
effi
cien
t of
vari
atio
n
Year
Figure 3. Regional Income Equality 1975-2004
GRP per capita
non mining GRP per capita
Household consumption
Note: in Constant 1993 prices
0
0.2
0.4
0.6
0.8
1
1.2
1.4
1.6
Co
effi
cien
t of
vari
atio
n
Year
Regional Disparity
GRP per capita
non mining GRP per capita
Household consumption
Note: in Current prices


