Embed Size (px)
Citation preview
Inferences about winter temperatures and summer rains from the late Quaternary record of C4 perennial grasses and C3 desert shrubs
in the northern Chihuahuan Desert
Camille A. Holmgren*1, Jodi Norris2, Julio L. Betancourt3
1 Department of Geography, California State University, Long Beach, 1250 Bellflower Blvd.,
Long Beach, CA 90840
2 Department of Botany, University of Wyoming, Laramie, WY 82071
3 Desert Laboratory, U.S. Geological Survey, 1675 W. Anklam Rd., Tucson, AZ 85745
Short Title: Late Quaternary winter temperatures and summer rains in the N. Chihuahuan Desert
Keywords: Chihuahuan Desert; bioclimatic envelopes; Pleistocene; Holocene; North American
monsoon
* Corresponding author. Tel.: 562-985-8432, Fax: 562-985-8993
E-mail: [email protected]
ABSTRACT: Late Quaternary histories of two North American desert biomes- C4 grasslands
and C3 shrublands- are poorly known despite their sensitivity and potential value in
reconstructing summer rains and winter temperatures. Plant macrofossil assemblages from
packrat midden series in the northern Chihuahuan Desert show that C4 grasses and annuals
typical of desert grassland persisted near their present northern limits throughout the last glacial-
interglacial cycle. By contrast, key C3 desert shrubs appeared somewhat abruptly after 5000 cal
yr B.P. Bioclimatic envelopes for select C4 and C3 species are mapped to interpret the glacial-
interglacial persistence of desert grassland and the mid-to-late Holocene expansion of desert
shrublands. The envelopes suggest relatively warm Pleistocene temperatures with moist
summers allowed for persistence of C4 grasses, whereas winters were probably too cold (or too
wet) for C3 desert shrubs. Contrary to climate model results, core processes associated with the
North American Monsoon and moisture transport to the northern Chihuahuan Desert remained
intact throughout the last glacial-interglacial cycle. Midlatitude effects, however, truncated
midsummer (July-August) moisture transport north of 35ºN. The sudden expansion of desert
shrublands after 5000 cal yr B.P. may be a threshold response to warmer winters associated with
increasing boreal winter insolation, and El Niño-Southern Oscillation variability.
Introduction
Despite steady and focused research that now spans half a century, questions linger about the
changing seasonality of southwestern U.S.A. paleoclimates. There is general consensus that late
Pleistocene (30,000-13,000 yr B.P.; all ages are reported in calendar yrs B.P.) winters were
wetter and temperatures were generally cooler than today (Thompson et al., 1993). The resulting
increases in effective moisture permitted large pluvial lakes to grow and persist in what are now
dry playas along the Arizona-New Mexico border (Long, 1966; Fleishhauer and Stone, 1982;
Waters, 1989; Krider, 1998; Hawley et al., 2000). Increases in effective moisture also supported
mixed-conifer forests and open woodlands where there are now pinyon-juniper woodlands, and
pinyon-juniper woodlands where there are now deserts (see regional summaries in Van Devender
et al.1987; Betancourt et al. 1990; Thompson et al. 1993; Thompson and Anderson 2000).
Uncertainties remain, however, about the history of summer rains and winter temperatures as
could be inferred primarily from biological indicators. In the most recent synthesis of past
biomes in western North America based on pollen and packrat midden data, Thompson and
Anderson (2000) conclude that the Last Glacial Maximum (~21,000 yr B.P.) was characterized
by (1) southward displacement of the westerlies and enhanced persistence throughout the year;
(2) virtual elimination of the present summer monsoon circulation; and (3) a strong temperature
gradient throughout the interior, with very cold temperatures to the north and mild conditions
along the Mexican border. Here, we aim to refine these inferences by evaluating the packrat
midden record and modern bioclimatic distributions of select species in two functional plant
groups- C4 desert grasses and C3 desert shrubs- that characterize the northern Chihuahuan Desert
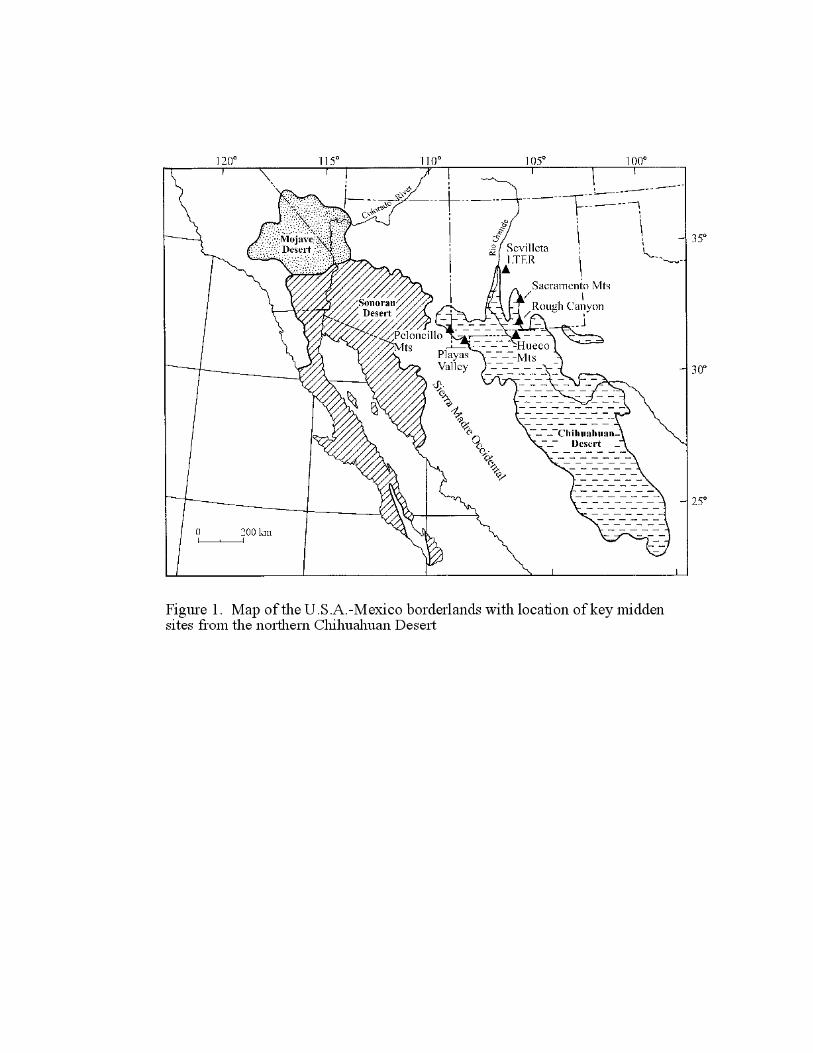
in the U.S.A.-Mexico borderlands (Figure 1).
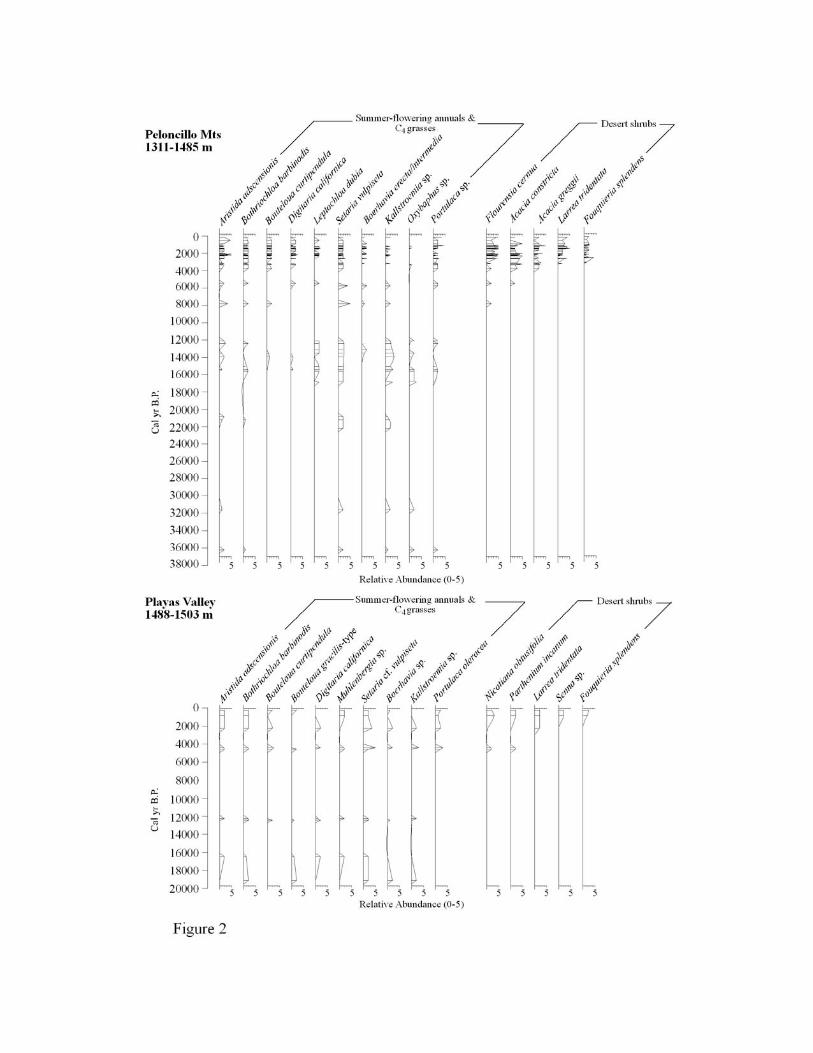
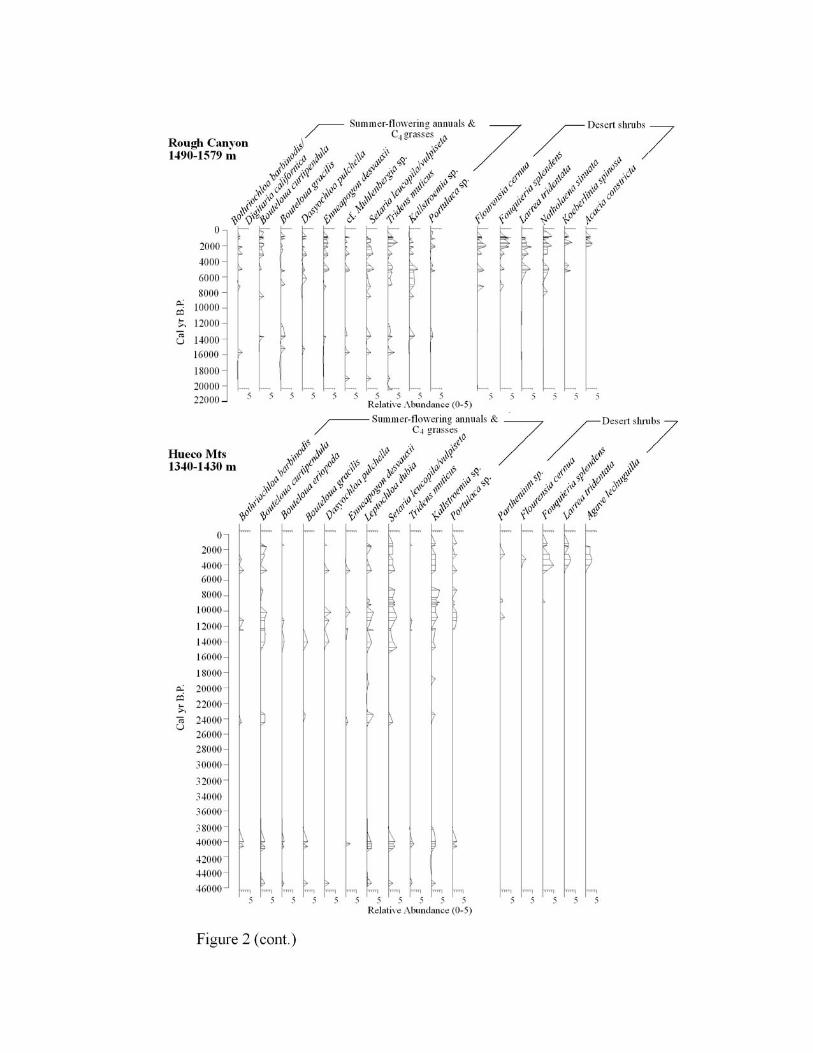
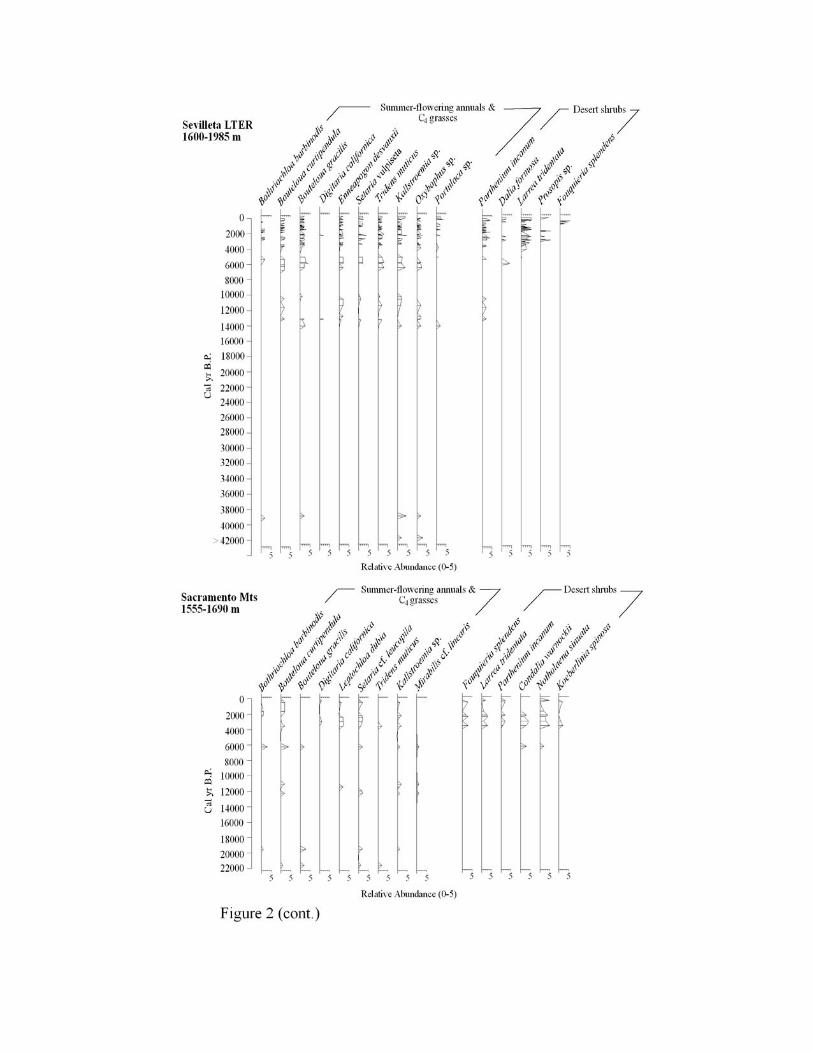
The presence and abundance of select C4 herbs and perennial grasses and C3 desert
shrubs in middens from the northern fringe of the northern fringes of the Chihuahuan Desert
(Figure 2), all of which occur today at or near the midden sites, demonstrate interestingly
disparate histories. C4 herbs and grasses persisted from late Pleistocene (Marine Isotope Stages 2
& 3) to the present (MIS 1), whereas many C3 desert shrubs did not occupy the northern extent
of their ranges until the last 4000-5000 years. To evaluate the climatic significance of these
patterns, we focused on several C4 grasses (Botriochloa barbinodis, Digitaria californica,
Leptochola dubia, Setaria vulpiseta) and C3 shrubs (Acacia constricta, Acacia greggii,
Flourensia cernua, Fouquieria splendens, and Larrea tridentata) common in midden records
from the northern Chihuahuan Desert and with easily obtainable distributional data from
herbarium collections. We added Simmondsia chinensis to the suite of C3 shrubs species because
it represents a unique case where a Sonoran Desert species is in the process of invading the
northwestern edge (Peloncillo Mts. in Figures 1 and 2) of the Chihuahuan Desert. We used
distributional data to construct a multi-dimensional climatic niche for each species, and distances
from the niche were calculated and mapped on a 4-km grid for each of ten climatic variables.
The maps are used to evaluate hypotheses about the late Quaternary history of summer rains and
winter temperatures in the southwestern United States.
Bioclimatic Envelopes
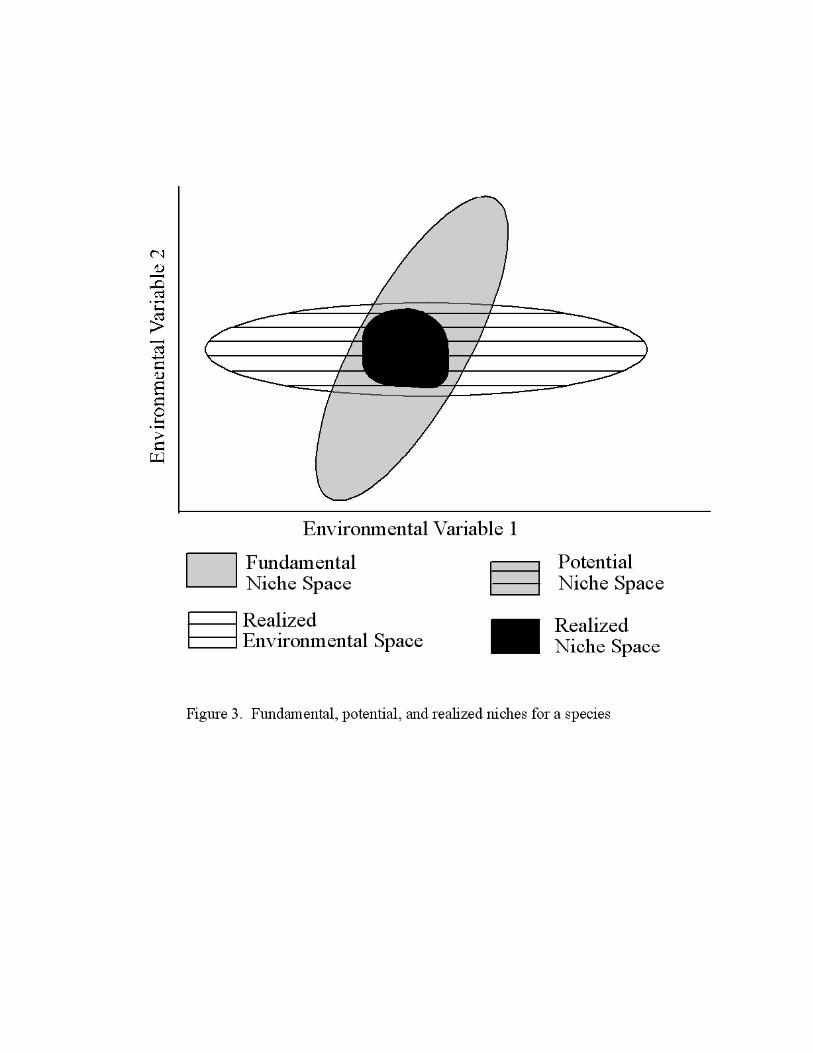
Bioclimatic envelopes can be used to relate physiological functioning of species to conditions
found along environmental gradients, such as light, temperature, and moisture. The
environmental conditions in which a species can survive and reproduce comprise the
fundamental ecological niche of a species. Hutchinson (1957) defined the fundamental niche as
an n-dimensional space consisting of all the environmental conditions within which a species can
survive and reproduce. Following Jackson and Overpeck (2000), parts of the fundamental niche
can be broken down further into potential and realized niches. Not all climatic combinations
occur in nature, so species distributions are limited to areas where the realized environmental
variables and the fundamental niche overlap, forming the potential niche space. Within this area
of overlap, the species’ range may not entirely fill the potential niche if it is limited by other
factors such as competition, dispersal ability, etc. As shown in Figure 3, the realized niche
comprises the niche space actually occupied by the species (Jackson and Overpeck, 2000).
The geographic range of a species can be viewed as a spatial reflection of its niche: the
species occurs where all environmental conditions are suitable and is absent from areas where
one or more conditions are unsuitable (Brown and Lomolino, 1998). Thus, it is possible to re-
map distribution patterns from geographic space into climatic space to produce a bioclimatic
envelope for a species. We can also map the distance, in terms of climate, that an area falls
outside of the bioclimatic envelope to understand potential limiting factors. Once we have
constructed present-day bioclimatic envelopes for individual species, the envelopes for
assemblages of species found in the fossil record can be determined. The climate at some time in
the past is inferred to lie within the area of overlap of the climatic ranges for the species present
(Atkinson et al., 1986; Elias, 1997).
Two limitations of this technique warrant discussion. First, bioclimatic envelopes
produced using geographic ranges are based on realized niches rather than fundamental niches,
because non-climatic factors also constrain plant distributions. On smaller spatial scales, non-
climatic variables such as topography, canopy cover, soil texture and moisture, nutrient
availability, or competitive interactions may be key factors in determining species’ distributions.
At the continental scale, however, climate is considered the dominant factor regulating plant
distribution (Woodward, 1987). In fact, bioclimatic envelopes have been shown to perform well
at the macroscale where climatic influences dominate and the impact of biotic interactions is
minimized (Pearson et al., 2002; Pearson and Dawson, 2003). A second limitation is the
assumption that vegetation, whether today or in the past, is in equilibrium with the contemporary
climate. While species ranges continually adjust to both natural and human-induced changes in
climate, land use, and disturbance, we believe the assumption of equilibrium is generally sound
for modern vegetation. Consistent replication in the nature and timing of assemblage changes
across remote sites in the same region suggests that, in most cases, this assumption is also valid
for the past. Reasonable agreement between vegetation simulated from climate models and
observed in the fossil record likewise supports the assumption of equilibrium (Williams et al.,
2001; Brewer et al., 2002).
The high taxonomic resolution afforded by packrat midden records, where species-level
identification of taxa is common, provides a unique opportunity for assessing past climates using
information about species’ ranges. Bioclimatic envelopes have been used only sparingly,
however, to infer climate from packrat midden records. (Thompson et al., 1999; Arundel, 2002;
Sharpe, 2002; Norris et al., in press). Here, we used georeferenced herbarium records and a
Geographic Information System (GIS)-based approach to construct bioclimatic climatic
envelopes for indicator species. Although other platforms such as the GARP modeling system
(Genetic Algorithms for Rule-set Prediction; Stockwell and Nobel, 1991) improve statistical
confidence, the envelope method works well for continuous variables such as climatic data,
where range limits represent extremes of tolerance for a species. The envelope method thus
allows us to easily extract climatic tolerance data for species to evaluate climatic controls on (1)
the relative stability of C4 grasses and herbs throughout the late Quaternary and (2) the arrival of
C3 desert shrubs in the late Holocene.
Methods
Species presence data for key midden taxa were compiled by integrating georeferenced
herbarium data from several different institutions (Table C.1). Point-specific data are preferable
to generalized (flat) range maps, an important factor when constructing bioclimatic envelopes in
mountainous regions where vegetation varies greatly with elevation (Betancourt, 2004). After
compiling the database, we removed records that did not contain adequate location data or for
which location data were coarser than a minute in latitude/longitude (1.8 km-resolution). Any
sites were excluded where species were either cultivated or introduced. All latitude-longitude
data, as well as township-range-section locations, were standardized to decimal degree. In cases
where multiple herbarium records for a species had been collected at a particular site, we
removed replicate records. Species occurrence points were then plotted on a base map and any
geographic outliers checked for accuracy against location information in the database. Finally,
the occurrence data for each species were converted into a separate GIS point coverage.
A grid of climate variables was created from PRISM (Parameter-elevation Regressions
on Independent Slopes Model) data (Daly, 1997). PRISM uses average climatic values from
1960-1990 derived from National Oceanic and Atmospheric Administration (NOAA) weather
station data and a moving window of topographically-adjusted regression equations to produce
2.5 minute- (~4 km) resolution gridded climate data for the western United States (Daly, 1997).
In other words, the climatic values at each of the grid points represents the climate at the average
elevation computed for each grid cell. To create our climate grid, the following variables were
selected or derived from PRISM data and overlain in the GIS: mean frost-free period, mean
January temperature, mean minimum January temperature, mean July temperature, mean
maximum July temperature, mean winter (DJF) precipitation, mean summer (JJA) precipitation,
mean growing season precipitation, mean annual precipitation, and summer
precipitation/temperature as a measure of heat stress. Because precipitation tends to exhibit a
non-normal distribution, we also incorporated grids of logged values for each of the precipitation
variables in our climate grid.
Next, we combined the point coverage and climate grid to find the niche space for each
species. After joining the point coverage and climate grid, climate data for all variables were
extracted at each presence point. Climate data were exported into a spreadsheet and the mean and
standard deviation calculated for each variable. All points with values lying outside two
standard deviations of the mean for any variable were removed; in the case of precipitation
variables, we used the logged variables to trim the data points. We chose to trim the data for
several reasons. First, although the PRISM data provide high (~4 km) spatial resolution, we
expect that some presence points occur at much lower/higher elevation than the average
elevation of grid cells that encompass a broad range of elevations. Second, species occurrence
data may contain inaccuracies due to poor initial field location determinations, errors in
estimation of latitude and longitude from township-range-section data, or database errors.
Removing points that fall outside of two standard deviations should minimize these types of
errors. In addition, with few exceptions, visual inspection of the niche spaces created with the
trimmed data compared more favorably with known distributions than those created using
untrimmed data. After trimming the data, we selected only those cells where climatic conditions
fell within the trimmed minimum and maximum values to construct the niche space. For points
falling outside of the niche space, we calculated the distance, in terms of climate, from the niche
space for each variable. In the case of precipitation variables, we calculated distances using the
non-logged values to facilitate interpretation.
Results
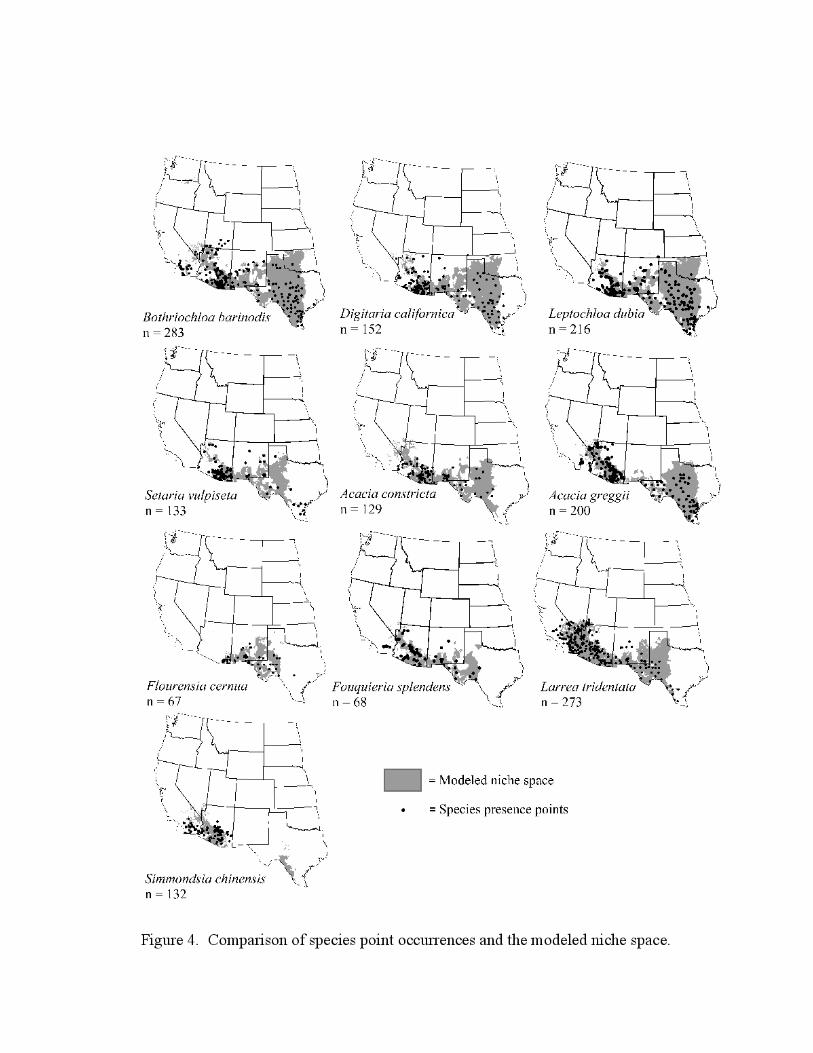
Species presence points versus the modeled niche space
Figure 4 shows species presence points versus the modeled niche space for all species. Points
falling outside of the modeled niche space are the trimmed points, i.e., those that exceeded the 2-
sigma range for one or more variables. The modeled niche space extending beyond the presence
points represents potential niche space for the species. Again, one possible source of error
derives from the fact that the climatic values for each point used to construct the niche space
represent climate at the average elevation for the grid cell, which may be higher or lower than the
actual elevation. Even so, this technique is a significant improvement over the use of flat range
maps that are not elevation-specific, and good agreement between the modeled niches and
known distributional data [i.e., Turner et al. (1995), although this work does not extend east of
the Arizona-New Mexico border] suggests error is minimal.
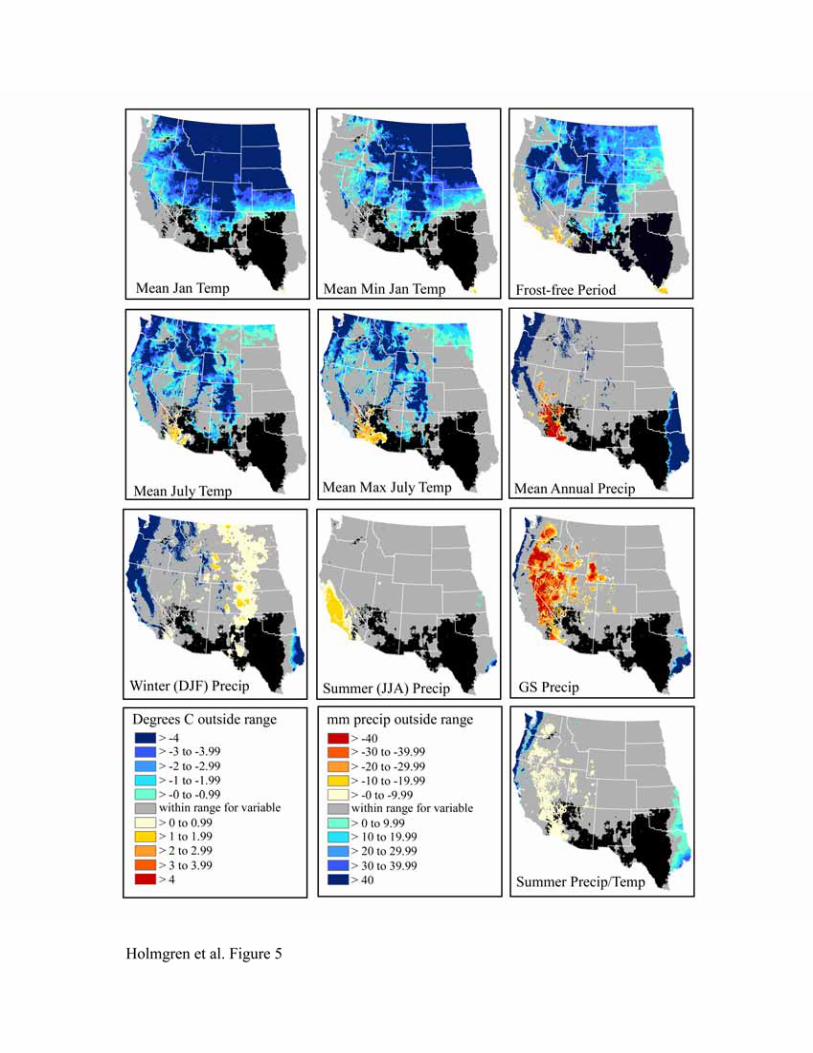
Climatic envelopes for C4 grasses
The climatic controls on the distribution of the C4 grasses Bothriochloa barbinodis, Digitaria
californica, Leptochloa dubia and Setaria vulpiseta are apparent in Figures 5-8. The northern
limits for these species are strongly influenced by mean January temperature, mean minimum
January temperature, and frost-free period, with mean January temperature having an effect over
the greatest spatial extent. We expect these variables to be highly correlated since areas with
colder mean January temperatures are also likely to have colder minimum temperatures and a
shorter frost-free period. Cold summers (mean July temperature, mean maximum July
temperature) also appear to be limiting north of the physiographic break that separates the low,
warm deserts from the higher, colder ones to the north (the Great Basin and Colorado Plateau).
Lowlands in the basins and valleys to the north, however, are apparently warm enough in the
summer but too cold in the winter for these desert grassland species. The latter may be due to the
large temperature inversions in winter that characterize the Colorado Plateau and Great Basin
(Whiteman et al., 1999).
Summer (JJA) precipitation and growing season precipitation are the main limiting
factors to the west, although these are somewhat less important for Bothriochloa barbinodis than
the other grasses (Figure 5). During summer, high temperatures also restrict the presence of these
C4 grasses in southwestern Arizona and southeastern California. The combined influence of high
summer temperatures and moisture deficit is notable in the map of heat stress (summer
precipitation/temperature). Conversely, maps of mean annual precipitation, growing season
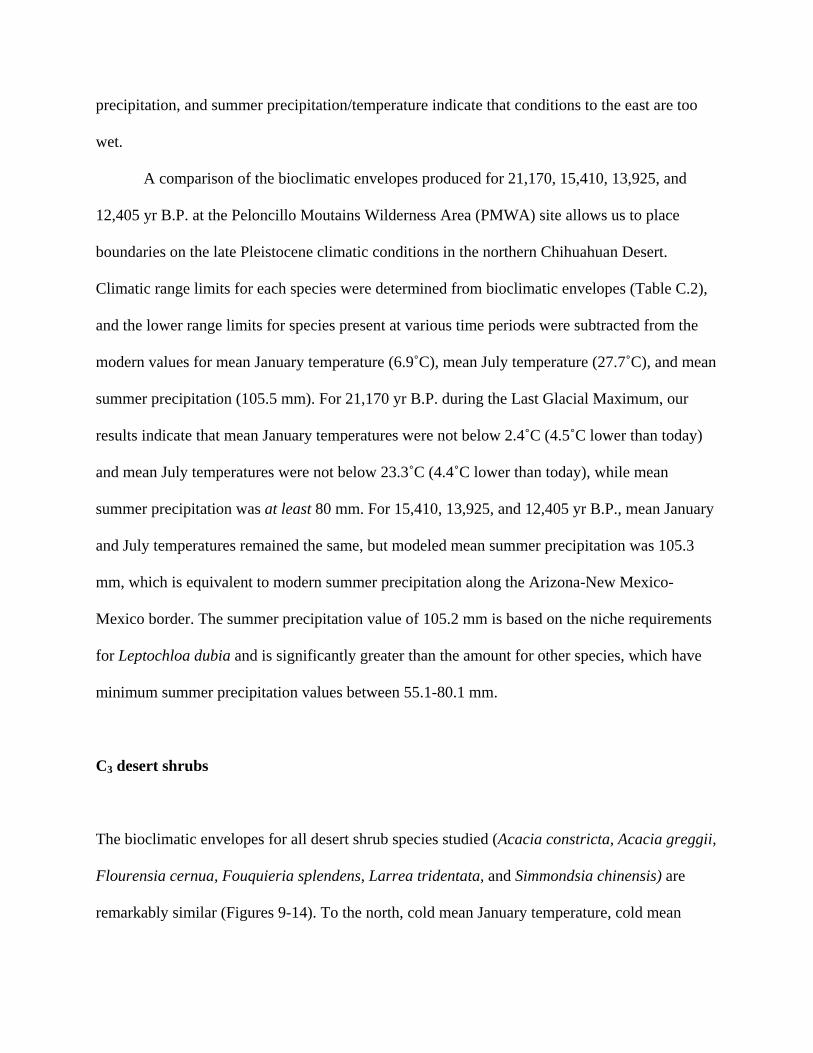
precipitation, and summer precipitation/temperature indicate that conditions to the east are too
wet.
A comparison of the bioclimatic envelopes produced for 21,170, 15,410, 13,925, and
12,405 yr B.P. at the Peloncillo Moutains Wilderness Area (PMWA) site allows us to place
boundaries on the late Pleistocene climatic conditions in the northern Chihuahuan Desert.
Climatic range limits for each species were determined from bioclimatic envelopes (Table C.2),
and the lower range limits for species present at various time periods were subtracted from the
modern values for mean January temperature (6.9˚C), mean July temperature (27.7˚C), and mean
summer precipitation (105.5 mm). For 21,170 yr B.P. during the Last Glacial Maximum, our
results indicate that mean January temperatures were not below 2.4˚C (4.5˚C lower than today)
and mean July temperatures were not below 23.3˚C (4.4˚C lower than today), while mean
summer precipitation was at least 80 mm. For 15,410, 13,925, and 12,405 yr B.P., mean January
and July temperatures remained the same, but modeled mean summer precipitation was 105.3
mm, which is equivalent to modern summer precipitation along the Arizona-New Mexico-
Mexico border. The summer precipitation value of 105.2 mm is based on the niche requirements
for Leptochloa dubia and is significantly greater than the amount for other species, which have
minimum summer precipitation values between 55.1-80.1 mm.
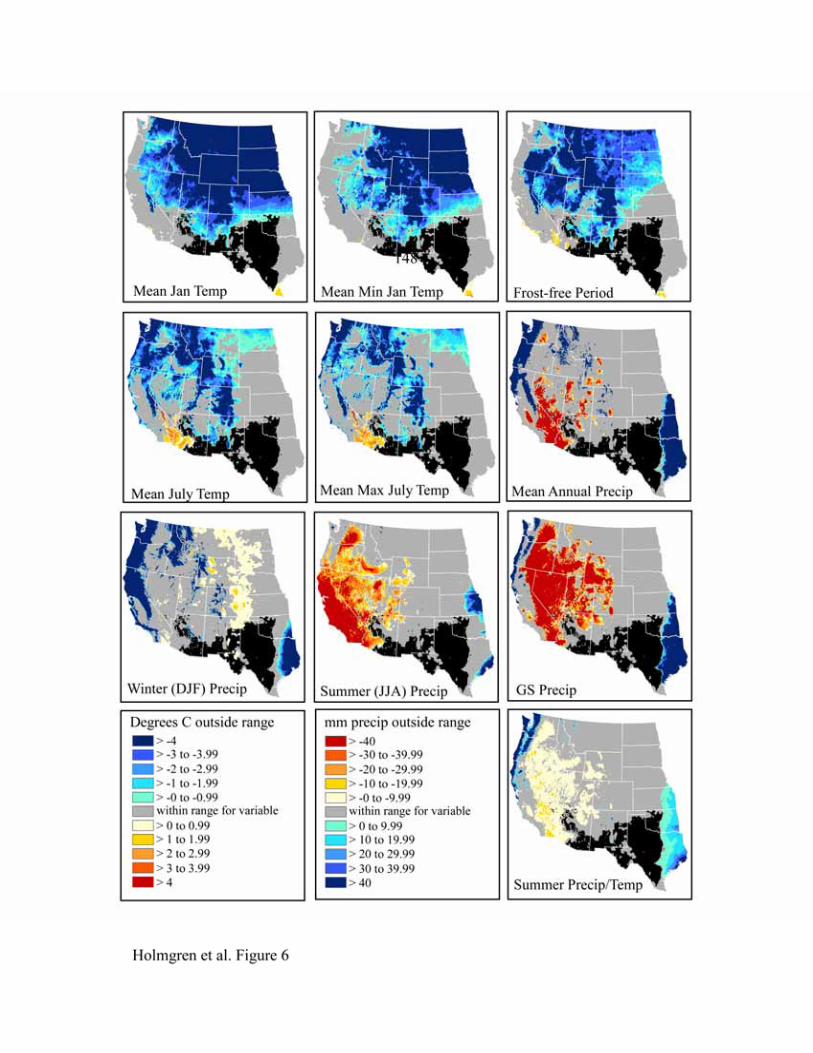
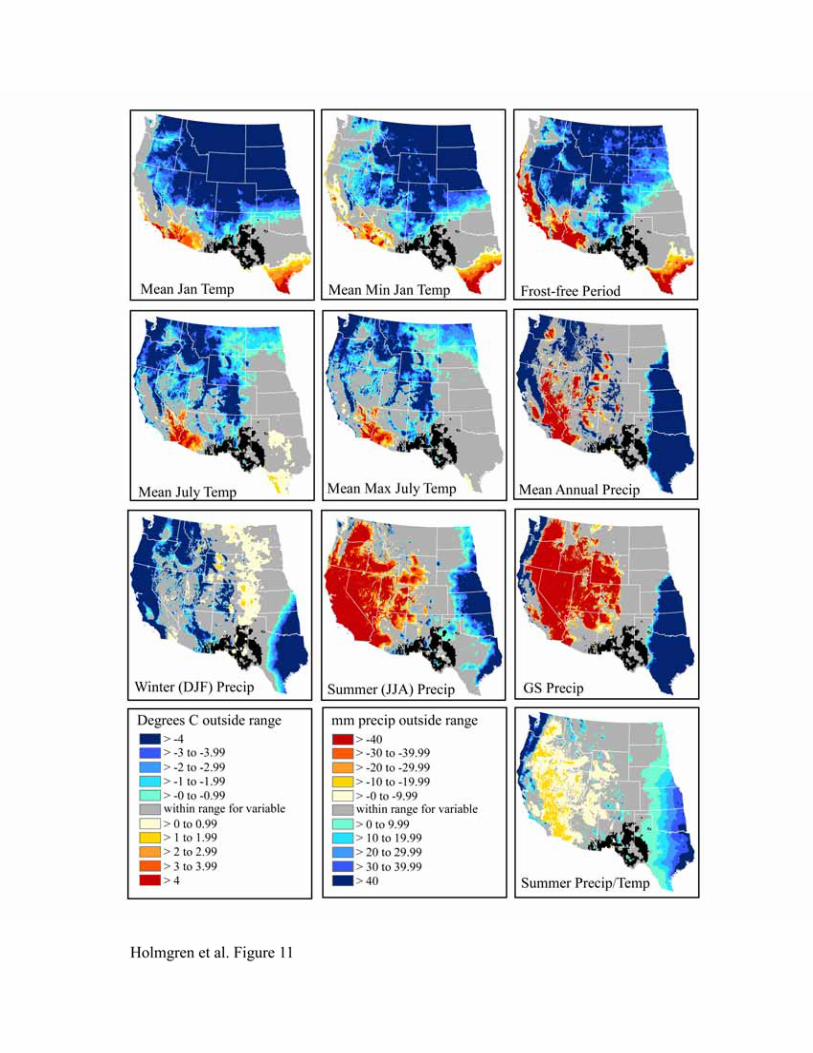
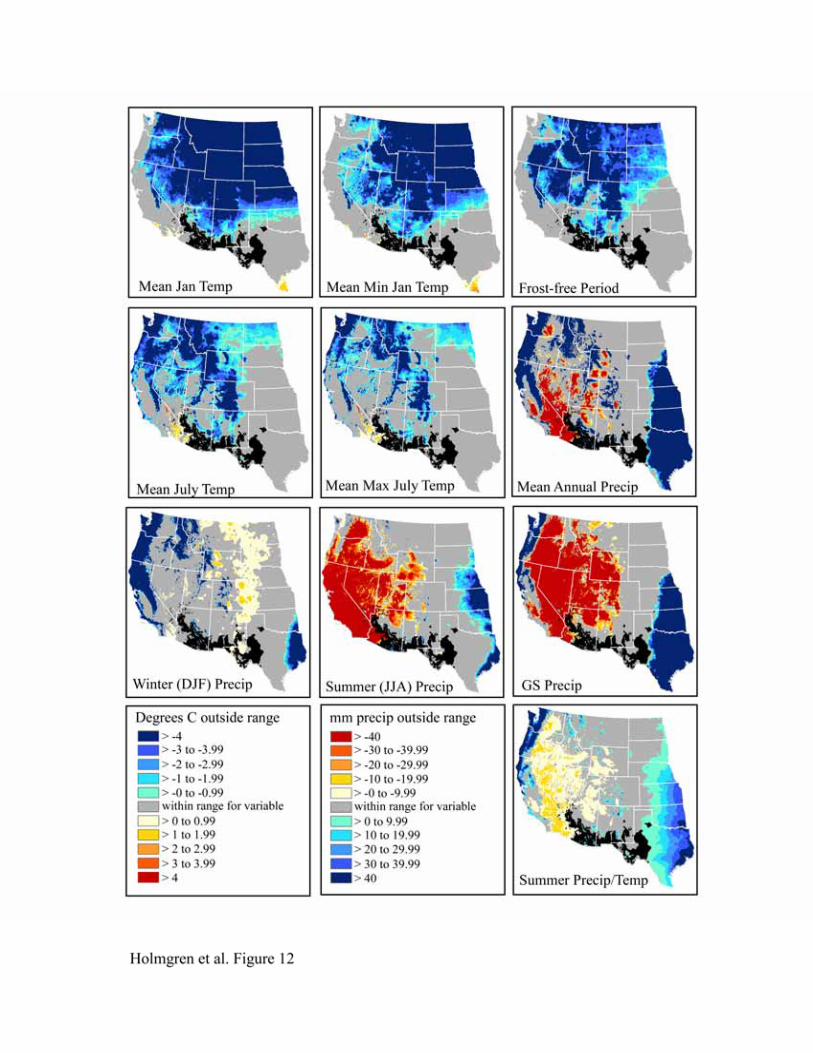
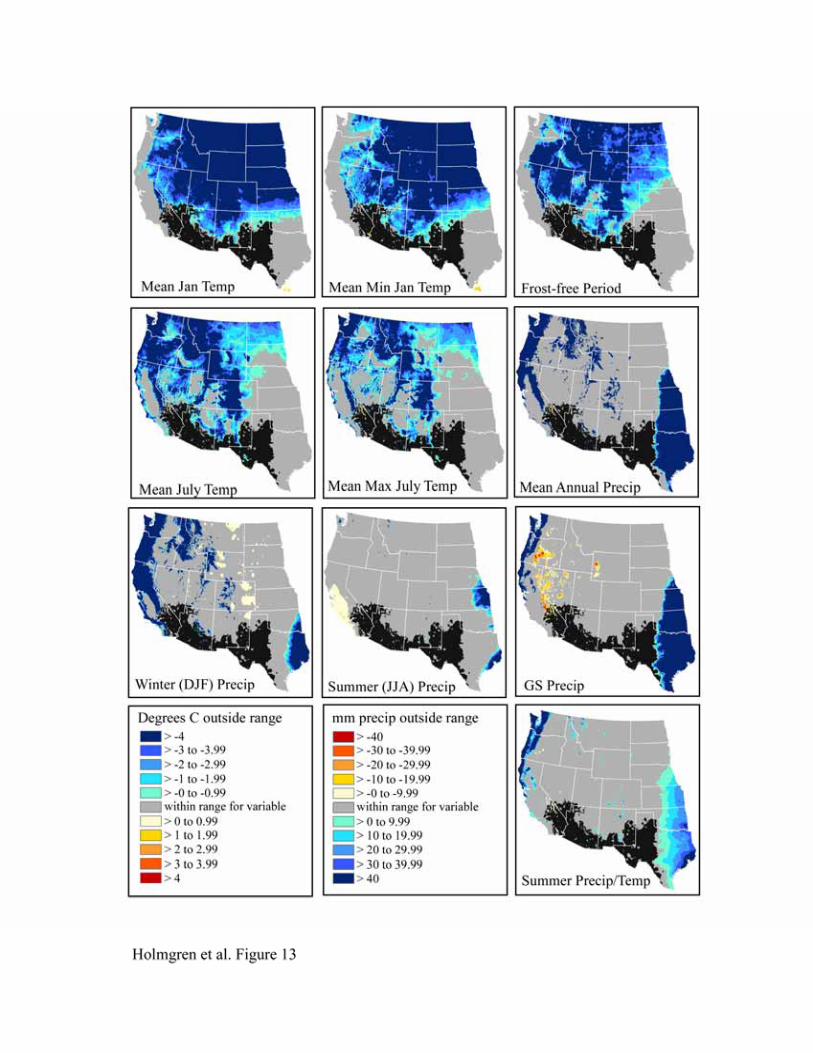
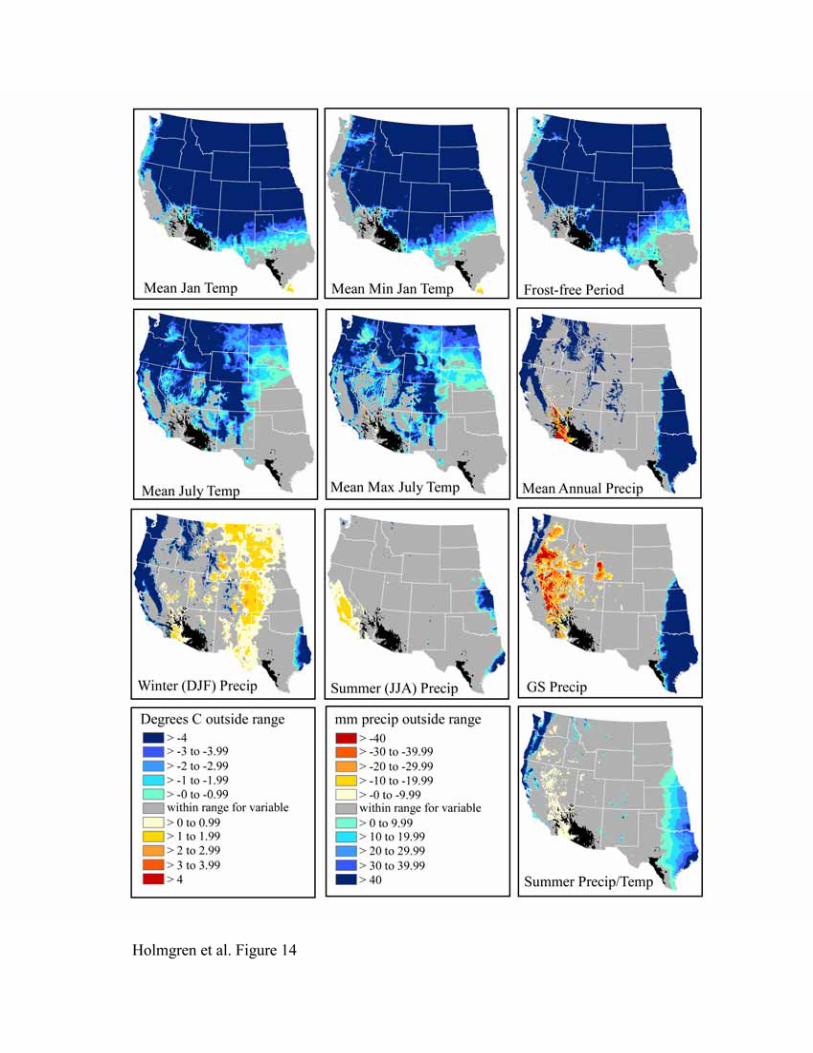
C3 desert shrubs
The bioclimatic envelopes for all desert shrub species studied (Acacia constricta, Acacia greggii,
Flourensia cernua, Fouquieria splendens, Larrea tridentata, and Simmondsia chinensis) are
remarkably similar (Figures 9-14). To the north, cold mean January temperature, cold mean
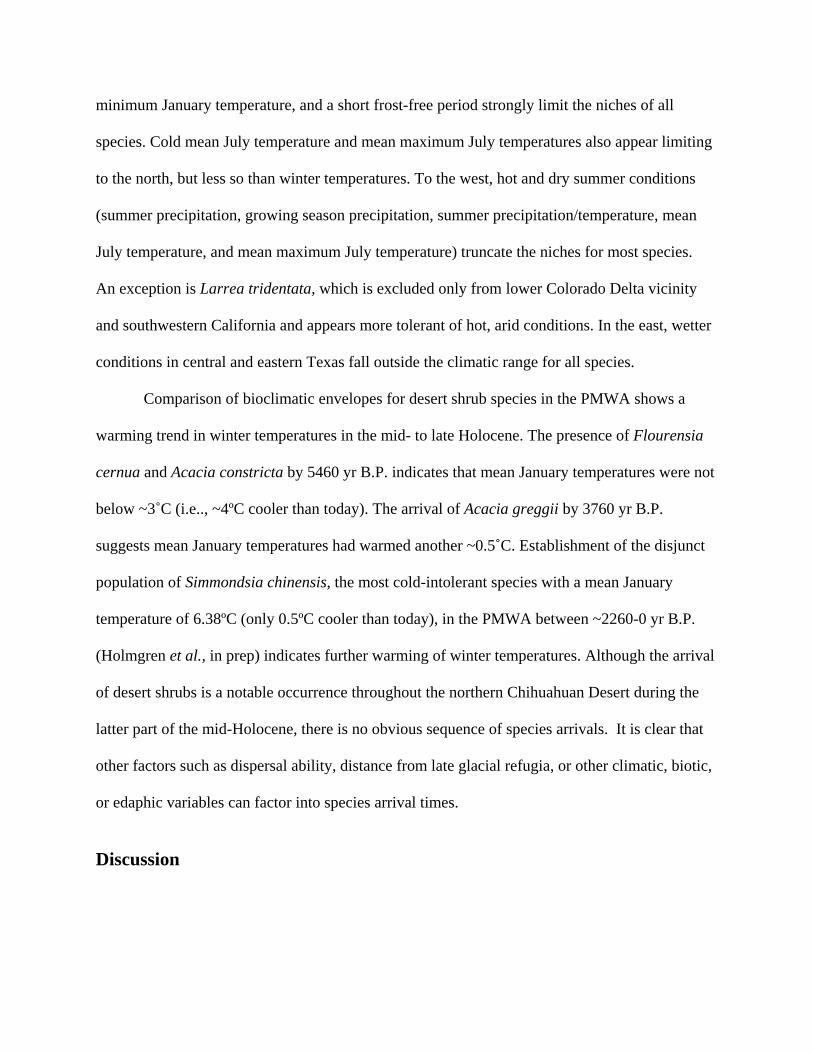
minimum January temperature, and a short frost-free period strongly limit the niches of all
species. Cold mean July temperature and mean maximum July temperatures also appear limiting
to the north, but less so than winter temperatures. To the west, hot and dry summer conditions
(summer precipitation, growing season precipitation, summer precipitation/temperature, mean
July temperature, and mean maximum July temperature) truncate the niches for most species.
An exception is Larrea tridentata, which is excluded only from lower Colorado Delta vicinity
and southwestern California and appears more tolerant of hot, arid conditions. In the east, wetter
conditions in central and eastern Texas fall outside the climatic range for all species.
Comparison of bioclimatic envelopes for desert shrub species in the PMWA shows a
warming trend in winter temperatures in the mid- to late Holocene. The presence of Flourensia
cernua and Acacia constricta by 5460 yr B.P. indicates that mean January temperatures were not
below ~3˚C (i.e.., ~4ºC cooler than today). The arrival of Acacia greggii by 3760 yr B.P.
suggests mean January temperatures had warmed another ~0.5˚C. Establishment of the disjunct
population of Simmondsia chinensis, the most cold-intolerant species with a mean January
temperature of 6.38ºC (only 0.5ºC cooler than today), in the PMWA between ~2260-0 yr B.P.
(Holmgren et al., in prep) indicates further warming of winter temperatures. Although the arrival
of desert shrubs is a notable occurrence throughout the northern Chihuahuan Desert during the
latter part of the mid-Holocene, there is no obvious sequence of species arrivals. It is clear that
other factors such as dispersal ability, distance from late glacial refugia, or other climatic, biotic,
or edaphic variables can factor into species arrival times.
Discussion
We have considered the large-scale climatic factors limiting modern species distributions in
order to understand climatic controls on late Pleistocene and Holocene vegetation in the northern
Chihuahuan Desert. Our analysis is based on correlations among species distributions and
climatic variables, and as such, we cannot establish causal relationships. Because autecological
and physiological information is incomplete for all of the selected species, our models are by
necessity statistical and not deterministic. The similarity of the limiting factors identified for
related plant functional types (perennial C4 grasses, desert shrubs), however, lends credence to
their importance in influencing plant distributions.
Late Pleistocene climate
The presence of C4 herbs and grasses in late Pleistocene middens from the Bolson de Mapimi
(~26-27ºN) in Mexico and Big Bend (~29ºN) in Texas to the Tularosa Basin (32-33ºN), southern
New Mexico was long noted by Van Devender (Van Devender and Riskind, 1979; Van
Devender et al., 1984; Van Devender and Burgess, 1985; Van Devender and Toolin, 1983; Van
Devender et al., 1990; Van Devender, 1995). The prevalence of these summer-flowering species
has been confirmed for the Tularosa Basin (Betancourt et al., 2001), the middle Rio Grand
Valley south of Albuquerque (Betancourt, Rylander, and Anderson, in prep.), and Playas
(Holmgren et al., 2003) and San Simon Valleys (Holmgren et al., in prep) of SW New Mexico
and SE Arizona, respectively. Along the northern fringes of the Chihuahuan Desert, many of the
species that characterize the modern desert grassland commonly occur throughout MIS 1, 2 and
3, in other words the last 40,000 years (Figure 2). Recent work integrating carbon isotopes from
soil carbonates (Liu et al. 1996; Monger et al. 1998) and tooth enamel from megaherbivores
(Connin et al. 1998; Koch et al. 2004) suggests that the C4 grass occurrences represent more than
just secondary elements in woodland understories. Instead, they were part of an expansive
summer-flowering C4 grassland that stretched from central Texas to southern Arizona, mostly
south of 35ºN. These may have been the northernmost grasslands in western North America to
green up in response to mid-to-late summer rains during the glacial period. Although some C4
grass species may respond opportunistically to available moisture regardless of season (Van
Devender et al., 1990), this argument is less likely to apply to the diverse suite of C4 grasses and
summer-flowering annuals identified from Pleistocene middens. Surprisingly, many of the C4
grasses (e.g., Botriochloa barbinodis, Digitaria californica, Leptochola dubia, Setaria vulpiseta)
that appear in the late Pleistocene midden record of the northern Chihuahuan Desert do not
extend much further north today, and thus can help constrain the magnitude of glacial-age
cooling.
The results of our bioclimatic envelopes suggest cold winter temperatures are an
important factor limiting the distribution of many C4 grass species along their northern and upper
elevation range margins. There is currently little consensus, however, regarding physiological
constraints on C4 plant distribution in cold climates. Dissociation of the C4 enzymes pyruvate-
phosphate dikinase and PEP carboxylase (Long, 1983; Potvin et al., 1986), Rubisco limitation
(Long 1999; Kubien et al., 2003), and lower quantum yield of C4 versus C3 grasses (Ehleringer
et al., 1997) at lower temperatures have all been proposed as explanations for the scarcity of C4
species in cold environments. Most of these studies have focused on low temperatures during the
growing season, but our results suggest that winter temperatures may be equally important in
limiting C4 grasses. Some C4 species can tolerate cold temperatures when dormant (Schwarz and
Reaney, 1989) and during the growing season (Sage and Sage, 2002), but a late hard freeze after
germination may limit establishment by impacting the chilling-susceptible seedlings in many
species. For example, Zea mays exhibits loss of photosynthetic capacity due to photoinhibition
during periods of high light intensity and low temperatures. Seedlings may be especially
vulnerable to light-dependent damage because they emerge when periods of low chilling
temperatures coincide with high light levels (Long, 1983; Long, 1999). Although we currently
cannot resolve the physiological basis for limited C4 grass distribution in cold climates, the
presence of C4 grasses in late Pleistocene middens nevertheless provides evidence for relatively
mild winter temperatures. Continued investigation of the role of cold winter temperatures and
length of frost-free period is warranted.
Reconstructed summer temperatures during the late Pleistocene were also cooler than
modern, although the amount of cooling is uncertain. C4 grass bioclimatic envelopes indicate
mean July temperature was no more than 5.5˚C cooler than today. However, this low
temperature limit may have been altered during the late Pleistocene due to shifts in dominance
between C3 and C4 species. The higher quantum yield of C3 species at low temperatures may
limit C4 grass distribution at sites with cooler growing season temperatures via competitive
exclusion (Ehleringer et al, 1997). During the late Pleistocene, however, C4 photosynthesis may
have been favored at lower summer temperatures when reduced crossover temperatures (the
mean monthly temperature at which C4 plants have a higher quantum yield than C3 plants)
resulted from decreased atmospheric CO2 concentration (Ehleringer et al., 1997; Koch et al.,
2004). Thus, minimum summer temperatures for C4 grasses may have been more than 5.5˚C
cooler during the late Pleistocene, assuming that low summer temperatures are regulated via
competition with C3 species rather than other physiological mechanisms. In contrast, changes in
crossover temperatures would have had negligible effects in winter when C4 grasses are inactive.
Bioclimatic envelopes also allow us to quantify the amount of late Pleistocene summer
precipitation in the Borderlands. The opportunity for assessing the seasonality of precipitation
changes, a rare opportunity in proxy records, is possible due to the high taxonomic resolution
afforded by packrat midden records where species-level identifications are common. The
importance of summer precipitation in the Borderlands was inferred previously from the diverse
suite of C4 grasses and summer-flowering annuals found in glacial-aged packrat middens
(Betancourt et al., 2001; Holmgren et al., 2003; Holmgren et al., in prep), although the amount
of summer precipitation was unknown. We now estimate that summer precipitation was
equivalent to at least 50% of modern values and may have reached amounts similar to today.
In contrast to models suggesting the virtual elimination of summer monsoonal
precipitation (Thompson and Anderson, 2000), we find that at least moderate amounts of
summer precipitation characterized late Pleistocene climate in what is now the northern fringe of
the Chihuahuan Desert. Note that we do not imply a diminished role for winter precipitation
during the late Pleistocene, because greater-than-present winter precipitation is still necessary to
account for the increased effective moisture needed to fill pluvial lakes and support displacement
of highland species into the lowlands. Rather, we suggest that summer precipitation was more
extensive in the U.S.A-Mexico borderlands than previously thought. Thus, it appears that key
atmospheric and topographic features anchoring the core of the North American monsoon over
the Sierra Madre Occidental in Mexico and the tongue of moisture extending northward to the
Arizona-New Mexico border remained intact during the glacial period. In the midlatitudes, on
the other hand, persistent snowpack and southward displacement of the westerlies may have
curtailed monsoonal precipitation to the north, as indicated by the scarcity of C4 grasses and
annuals in midden records from the Colorado Plateau (Betancourt, 1984; 1990).
In contrast to C4 grasses, C3 desert shrubs remained absent from the U.S.A.-Mexico
borderlands during the late Pleistocene. Although the northern limits of C3 desert shrub are
similar to those of C4 grasses, their absence during the late Pleistocene may have been due to the
somewhat higher minimum winter temperature requirements. Both low mean January
temperatures and mean minimum January temperatures for desert shrub species are generally
higher than those for C4 grasses (1.79 to 6.38˚C vs. 0.63 to 2.40˚C and -6.44 to –1.53˚C vs. –7.47
to –5.22˚C, respectively), which may have been sufficient to exclude them during the late
Pleistocene. Alternatively, wetter late Pleistocene conditions may have prevented the
establishment of desert shrub species via competitive exclusion by more mesic-adapted species.
Whatever the case, the majority of desert shrubs species remained notably absent from the
northern Chihuahuan Desert prior to their abrupt arrival around 5000-4000 yr B.P.
Mid- to Late Holocene
A repeating theme across midden records (Figure 1) is the early to mid-Holocene (13,000-5000
yr B.P.) absence and surprisingly late arrival (last 4000-5000 years) of C3 desert shrubs
(including Acacia constricta, Acacia greggii, Flourensia cernua, Fouquieria splendens, and
Larrea tridentata) now common in the northern Chihuahuan Desert. During the mid-Holocene,
conditions in the northern Chihuahuan Desert were marked by hot, moist summers and cold, dry
winters. Expanded upper and lower treelines (Fall, 1997), northward expansion of C4 grasses and
tropical elements in packrat middens (Van Devender, 1990; McAuliffe and Van Devender,
1998), and climate model output (Rind, 1994; Kutzbach, 1998) all indicate greater-than-modern
summer temperatures and precipitation during the mid-Holocene (~8000-4000 yr B.P). In
contrast, desiccating or intermittent lakes from the U.S.A.-Mexico borderlands northward
(Waters, 1989; Davis and Shafer, 1992; Anderson, 1993; Hasbargen, 1994; Krider, 1998), peak
dune activity in the Great Plains (Forman, 2001) and the decline in midden production
throughout the southwestern United States (Webb and Betancourt, 1990; Spaulding, 1991)
indicate pervasive mid-Holocene winter drought. While warm wet summers and dry winters
would tend to favor C4 grasses over C3 desert shrubs, we suggest the absence of C3 desert shrubs
during the mid-Holocene was due to colder-than-present winter temperatures prior to ~5000-
4000 yr B.P. noted in climate model simulations (Rind, 1994; Kutzbach, 1998).
Bioclimatic envelopes from desertscrub species clearly demonstrate the role of cold
winter temperatures in defining the northern range limits for these species. This is consistent
with evidence for reduced stature and vigor in Fouquieria splendens near its northern limit
(Bradley, 1966), and freezing-induced xylem cavitation limiting the northern distribution of
Larrea tridentata (Pockman and Sperry, 1997). Van Devender (1990) suggests that the
northward advance of subtropical species was stymied by high frequencies of hard advective
freezes due to incursions of Arctic air masses in the mid-Holocene (8000-4000), but accelerated
when such freezes became less common in the late Holocene (4000-0 yr B.P.). Furthermore,
desert shrubs may also have been limited by radiative freezes resulting from lower winter
insolation during the early to mid-Holocene.
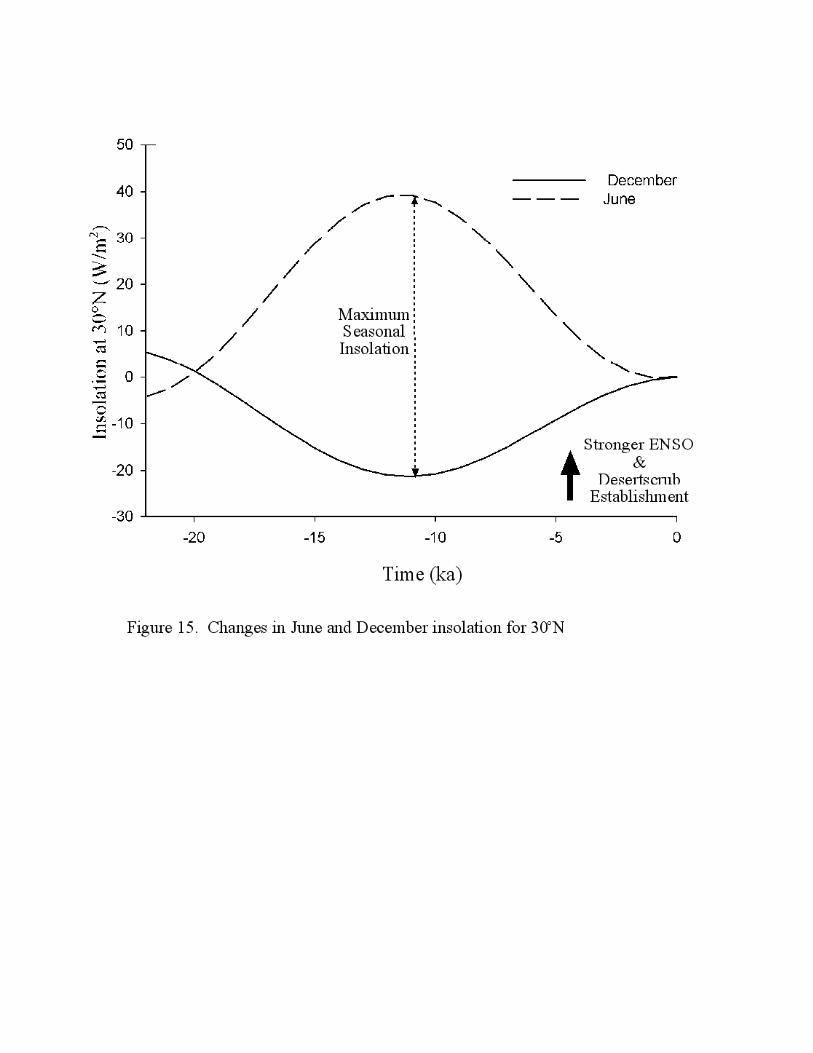
The arrival of desertscrub species in the northern Chihuahuan Desert around 5000-4000
yr B.P. corresponds to increasing winter insolation after reaching a minimum ~11,000 yr B.P.
(Figure 15), consistent with the advent of milder winter temperatures and a decrease in winter
freezes. The northward expansion of desert shrub species appears to have occurred fairly
quickly. For example, Larrea tridentata abruptly advanced to sites ranging from 1340-1430 to
1600-1985 m and was near its northernmost and uppermost limits at the Sevilleta Long Term
Ecological Research (LTER) site by ~4100 cal yr B.P. Exceptions are isolated, northern
outposts, such as Isleta north of the Sevilleta LTER, where Larrea arrived more recently (after
300 yr B.P.)(Van Devender, 1990). After attaining their northern limits, subsequent northward
progression for most desert shrubs appears to have been blocked by the higher topography and
colder temperatures of the Colorado Plateau. We note that the northward migration of desert
species tended to occur earlier in the Sonoran Desert (Van Devender, 1990; McAuliffe and Van
Devender, 1998), which may have been due to pockets of warmer temperatures in the lower,
hotter Sonoran Desert. There is also some evidence to indicate that other subtropical shrubs are
continuing to move into the northern Chihuahuan Desert, such as Simmondsia chinensis from the
warmer Sonoran Desert to the west (Holmgren et al., in prep). Despite these exceptions, the
transition to vegetation more modern in character around 5000-4000 yr B.P. in the northern
Chihuahuan Deserts appears to have been due, at least in part, to the ameliorization of winter
temperatures. The seemingly abrupt expansion of desert shrubs ~5000-4000 cal yr B.P. could
mean that the climate forcing was equally abrupt or that some critical temperature threshold was
crossed early on as winters warmed gradually.
Factors other than increasing winter temperatures also may have played a role in the
modernization of flora in the northern Chihuahuan Desert. For example, increased aridity and the
resultant reduction in plant cover, leading to progressive erosion of the soil mantle and increased
bare ground for colonization, would tend to favor desertscrub species at the expense of grasses
(Van Devender, 1995). Likewise, there is general consensus in proxy records and climate models
that orbitally-driven enhancement of the seasonal cycle during the mid-Holocene led to reduced
ENSO variability prior to ~5000 yr B.P. and a more La-Niña-like average state, a condition
correlated with drier winter conditions in the Southwest (e.g. Rodbell et al., 1999; Clement et al.,
2000). With the onset of greater ENSO frequency and magnitude in the later part of the mid-
Holocene, the southwestern United States would have experienced more regular winter
precipitation with greater extremes (Cane, 2005) and possibly higher freezing level heights, i.e.,
the elevation above sea level at which the air temperature is close to 0˚C (Diaz et al., 2003).
Increased ENSO strength beginning ~5000 yr B.P., combined with warmer winter temperatures,
may have favored the expansion of woody C3 desert shrubs that respond to winter precipitation.
Finally, we acknowledge that the progressive “modernization” of vegetation in the
northern Chihuahuan Desert may not be wholly in equilibrium with climate, but may be
contingent on the exact sequence of climatic events and lagged ecological responses. The greater
similarity of more recent fossil assemblages to present-day vegetation is likely to result, to some
extent, from a shared history of climate variability, since the effects of drought-related mortality
or greater recruitment during exceptionally wet years may leave a lasting imprint on the
landscape (Swetnam and Betancourt, 1998). Likewise, landscape modification over time by
species can lead to changes in plant community structure. For example, establishment of woody
desert shrubs can alter microclimate and soil properties beneath their canopies where litter and
nutrients accumulate, providing favorable microsites for some species while depleting resources
in intercanopy areas. The resulting microsite heterogeneity between canopy and intercanopy
areas may in turn affect the composition and spatial distribution of species (Charley and West,
1977; Vinton and Burke, 1995). The progressive modernization of flora may have been due to
such a feedback mechanism subsequent to mid-Holocene establishment of pioneer desert shrub
species.
Conclusions
C4-dominated desert grasslands represent one of the most stable biomes in North America. At
their northern extent, these grasslands persisted in more or less the same geographic location
through MIS 1, 2 and 3. This persistence is most easily explained by the glacial-interglacial
permanence of warm winters and summer rainfall in the region. It should follow then that the
core of the monsoon in the U.S.A.-Mexico borderlands and northern Chihuahuan Desert must
have remained relatively intact throughout the last glacial-interglacial cycle. In its present form,
the North American monsoon is primarily a Neogene phenomenon associated with formation of
the Gulf of California (Lonsdale, 1989), which substituted cold, upwelling Pacific waters with
the warm Sea of Cortez immediately west of the Sierra Madre Occidental.
The persistence of the core of the monsoon contrasts with conventional wisdom, mostly
derived from coarsely-resolved general circulation models, that southward displacement of the
westerlies in glacial summers suppressed monsoonal circulation and rainfall over the
southwestern U.S.A. (Kutzbach et al., 1998; Thompson et al., 2000). Mesoscale climate models
have been able to resolve the present-day role of the Sea of Cortez and Sierra Madre Occidental
in the multistage transport of moisture in the North American monsoon (Fawcett et al. 2002).
We submit that mesoscale models will eventually show a similar role during the Last Glacial
Maximum and throughout the Quaternary. This permanence of summer rains and desert
grassland, and the inconstancy of adjacent desert and woodland biomes, surely have left clear
imprints on the biogeographic and evolutionary history of the region, akin to those outlined by
Hafner and Riddle (2005).
Finally, the location of Pleistocene refugia for desert shrubs, presumably to the south in
Mexico, remains elusive and warrants future study. Their abrupt arrival and expansion in the
northern Chihuahuan Desert did not occur until ~5000-4000 cal yr B.P., concurrent with
increasing winter insolation and the onset of modern ENSO variability. It remains to be sorted
out whether the warming that forced this expansion happened gradually or abruptly as a series of
steps that may be ongoing.
Acknowledgements
We thank J. Pelletier for providing computing resources and the following individuals for
assistance obtaining herbarium records: K. Allred (NMCR), K. Birgy (UNLV), S. Boyd (RSA),
B. Boyle (SALVIAS), Chris Frazier (UNM), R. Kaul (NEB), A. Kelsey (UT), C. Malone
(RENO), R. Moe (JEPS, UC), C. Morse (KANU), A. Sanders (UCR), L. Schauer and R.
Spellenberg (NMC), and D. Sutherland (OMA).
References
Anderson RS. 1993. A 35,000 year vegetation and climate history from Potato Lake, Mogollon Rim, Arizona. Quaternary Research 40: 351-359.
Arundel S. 2002. Modeling climate limits of plants found in Sonoran Desert packrat middens. Quaternary Research 58: 112-121.
Atkinson TC, Briffa KR, Coope GR, Joachim MJ, Perry DW. 1986. Climatic calibration of coleopteran data. In Handbook of Holocene Palaeoecology and Palaeohydrology Berglund BE (ed). Wiley-Interscience, Chichester, UK; 851-858.
Betancourt JL. 1984. Late Quaternary plant zonation and climate in southeastern Utah. Great Basin Naturalist 44: 1-35.
Betancourt JL. 1990. Late Quaternary biogeography of the Colorado Plateau. In Packrat Middens-The Last 40,000 Years of Biotic Change. Betancourt JL, Van Devender TR, Martin, PS (eds). University of Arizona Press, Tucson, AZ; 259-292.
Betancourt JL. 2004. Arid lands paleobiogeography: the rodent midden record in the Americas. In Frontiers in Biogeography. Lomolino MV, Heaney, LR (eds). Sinauer Associates, Inc. Sunderland, MA; 27-46.
Betancourt JL, Rylander KA, Peñalba C, McVickar JL. 2001. Late Quaternary vegetation history of Rough Canyon, south-central New Mexico, USA. Palaeogeography, Palaeoclimatology, Palaeoecology 165: 71-95.
Bradley WG. 1966. Populations of two Sonoran Desert plants, and deductions as to factors limiting their northward extension. Southwestern Naturalist 11: 395-401.
Brewer S, Cheddadi R, de Beaulieu JL, Reille M. 2002. The spread of deciduous Quercus throughout Europe since the last glacial period. Forest Ecology and Management 156: 27-48.
Brown JH, Lomolino MV. 1998. Biogeography. Sinauer Associates, Inc. Sunderland, MA. Cane MA. 2005. The evolution of El Niño, past and future. Earth and Planetary Science Letters
230: 227-240. Charley JL, West NE. 1977. Micro-patterns of nitrogen mineralization activity in soils of some
shrub-dominated semi-desert ecosystems of Utah. Soil Biology and Biochemistry 9: 357-365.
Clement AC, Seager R, Cane MA. 2000. Suppression of El Niño during the mid-Holocene by changes in the Earth’s orbit. Paleoceanography 15: 731-737.
Connin SL, Betancourt JL, Quade J. 1998. Late Pleistocene C4 plant dominance and summer rainfall in the southwestern United States from isotopic study of herbivore teeth. Quaternary Research 50:197-193.
Diaz HF, Eischeid JK, Duncan C, Bradley RS. 2003. Variability of freezing levels, melting season indicators, and snow cover for selected high-elevation and continental regions in the last 50 years. Climatic Change 59: 33-52.
Daly C, Taylor GH, Gibson WP. 1997. The PRISM approach to mapping precipitation and temperature. In Proceedings of the 10th American Meteorological Society Conference, American Meteorological Society, Boston, MA; 10-12.
Davis OK, Shafer WD. 1992. A Holocene climatic record for the Sonoran Desert from pollen analysis of Montezuma Well, Arizona, USA. Palaeogeography, Palaeoclimatology, Palaeoecology 92: 107-119.
Ehleringer JR, Cerling TE, Helliker BR. 1997. C4 photosynthesis, atmospheric CO2, and climate. Oecologia 112: 285-299.
Elias SA. 1997. The mutual climatic range method of palaeoclimate reconstruction based on insect fossils: new applications and interhemispheric comparisons. Quaternary Science Reviews 16: 1217-1225.
Fall PL. 1997. Timberline fluctuations and late Quaternary paleoclimates in the Southern Rocky Mountains, Colorado. GSA Bulletin 109: 1306-1320.
Fawcett PJ, Stalker JR, Gutzler DS. 2002. Multistage moisture transport into the interior of northern Mexico during the North American summer monsoon. Geophysical Research Letters 29: 1-4.
Fleischhauer Jr. HL, Stone WJ. 1982. Quaternary geology of Lake Animas, Hidalgo County, New Mexico. New Mexico Bureau of Mines and Mineral Resources Circular 174. Socorro, New Mexico, 25 pp.
Forman SL, Oglesby R, Webb RS. 2001. Temporal and spatial patterns of Holocene dune activity on the Great Plains of North America: megadroughts and climate links. Global and Planetary Change 29: 1-29.
Hafner DJ, Riddle BR. In press. Mammalian phylogeography and evolutionary history of northern Mexico's deserts. In Biodiversity, ecosystems, and conservation in northern Mexico, Ceballos G, Catron J-L (eds). Oxford University Press.
Hasbargen J. 1994. A Holocene paleoclimatic and environmental record from Stoneman Lake, Arizona. Quaternary Research 42: 188-196.
Hawley JW, Hibbs HJ, Kennedy JF, Creel BJ, Remmenga MD, Johnson M, Lee M., Dinterman
P. 2000. Trans-International boundary aquifers in southwestern New Mexico. New Mexico Water Resources Research Institute, Technical Completion Report, Interagency Contract No. X-996-350-01-3 (http://wrri.nmsu.edu/publish/otherrpt/swnm/).
Holmgren CA, Betancourt JL, Rylander KA, In prep. A 36 200-yr vegetation history from the Peloncillo Mountains, southwestern Arizona, USA. Palaeogeography, Palaeoclimatology, Palaeoecology.
Holmgren CA, Peñalba MC, Rylander KA, Betancourt JL. 2003. A 16,000 14C yr B.P. packrat midden series from the USA-Mexico Borderlands. Quaternary Research 60: 319-329.
Hutchinson GE. 1957. Concluding remarks. Cold Spring Harbour Symposium on Quantitative Biology 22: 415-427.
Jackson ST, Overpeck JT. 2000. Responses of plant populations and communities to long-term environmental changes of the late Quaternary. In Deep Time: Paleobiology’s Perspective, Erwin DH, Wing SL. (eds). Supplement to Paleobiology 26: 194-220.
Koch PL, Diffenbaugh NS, Hoppe KA. 2004. The effects of late Quaternary climate and pCO2 change on C4 plant abundance in the south-central United States. Palaeogeography, Palaeoclimatology, Palaeoecology 207: 331-357.
Krider PR. 1998. Paleoclimatic significance of late Quaternary lacustrine and alluvial stratigraphy, Animas Valley, New Mexico. Quaternary Research 50: 283-289.
Kubien DS, von Caemmerer S, Furbank RT, Sage RT. 2003. C4 photosynthesis at low temperature. A study using transgenic plants with reduced amounts of Rubisco. Plant Physiology 132: 1577-1585.
Kutzbach J, Gallimore R, Harrison S, Behling P, Selin R, Laarif F. 1998. Climate and biome simulations for the past 21,000 years. Quaternary Science Reviews 17: 473-506.
Liu B, Phillips FM, Campbell AR. 1996. Stable carbon and oxygen isotopes of pedogenic carbonates, Ajo Mountains, southern Arizona: implications for paleoenvironmental change. Palaeogeography, Palaeoclimatology, Palaeoecology 124: 233-246.
Long A. 1966. Late Pleistocene and Recent Chronologies of Playa Lakes in Arizona and New Mexico. Unpublished Ph.D. dissertation, University of Arizona, Tucson.
Long SP. 1983. C4 photosynthesis at low temperatures. Plant, Cell and Environment 6: 345-363. Long SP. 1999. Environmental responses. In The biology of C4 photosynthesis, Sage RF,
MonsonRK, (eds). Academic Press, San Diego, CA; 215-249. Lonsdale P. 1989. Geology and tectonic history of the Gulf of California. Pp. 499-521, In The
Eastern Pacific Ocean and Hawaii. Winterer EL, Hussong DM, Decker RW, (eds). The Geological Society of America, Vol. N; 499-521.
McAuliffe JR, Van Devender TR. 1998. A 22,000-year record of vegetation change in the north- central Sonoran Desert. Palaeogeography, Palaeoclimatology, Palaeoecology 141: 253-375.
Monger HC, Cole DR, Gish JW, Giordano TH. 1998. Stable carbon and oxygen isotopes in Quaternary soil carbonates as indicators of ecogeomorphic changes in the northern Chihuahuan Desert, USA. Geoderma 82: 137-172
Norris J, Jackson ST, Betancourt JL. In Press. A classification tree analysis of the distribution of ponderosa pine in the western U.S.A. Journal of Biogeography.
Pearson RG, Dawson TP, Berry PM, Harrison PA. 2002. SPECIES: a spatial evaluation of climate impact on the envelope of species. Ecological Modelling 154: 289-300.
Pearson RG, Dawson TP. 2003. Predicting the impacts of climate change on the distribution of
species: are bioclimatic envelope models useful? Global Ecology and Biogeography 12: 361-371.
Pockman WT, Sperry JS. 1997. Freezing-induced cavitation and the northern limit of Larrea tridentata. Oecologia 109: 19-27.
Potvin C, Simon J-P, Strain BR. 1986. Effect of low temperature on the photosynthetic metabolism of the C4 grass Echinochloa crus-galli. Oecologia 69: 499-506.
Rind D. 1994, General Circulation Model Output Data Set. IGBP PAGES/World Data Center for Paleoclimatology Data Contribution Series # 94-012. NOAA/NGDC Paleoclimatology Program, Boulder CO, USA.
Rodbell DT, Seltzer GO, Anderson DM, Abbott MB, Enfield DB, Newman JH. 1999. An ~15,000-year record of El Niño-driven alluviation in southwestern Ecuador. Science 283: 516-520.
Sage RF, Sage TL. 2002. Microsite characteristics of Muhlenbergia richardsonis (Trin.) Rydb., an alpine C4 grass from the White Mountains, California. Oecologia 132: 501-508.
Schwarz AG, Reaney, JT. 1989. Perenniating structures and freezing tolerance of northern and southern populations of C4 grasses. Botanical Gazette 150: 239-246.
Sharpe SE. 2002. Constructing seasonal climograph overlap envelopes from Holocene packrat midden contents, Dinosaur National Monument, Colorado. Quaternary Research 57: 306-313.
Spaulding WG. 1991. A middle Holocene vegetation record from the Mojave Desert of North America and its paleoclimatic significance. Quaternary Research 35: 427-437.
Stockwell DRB, Noble IR. 1991. Induction of sets of rules from animal distribution data: a robust and informative method of data analysis. Mathematics and Computers in Simulation 32: 49-254.
Swetnam TW, Betancourt JL. 1998. Mesoscale disturbance and ecological response to decadal- scale climate variability in the American Southwest. Journal of Climate 11: 3128-3147.
Teeri JA, Stowe LG. 1976. Climatic patterns and the distribution of C4 grasses in North America. Oecologia 23: 1-12.
Thompson RS, Anderson KH. 2000. Biomes of western North America at 18,000, 6000 and 0 14C yr BP reconstructed from pollen and packrat midden data. Journal of Biogeography 27: 555-584.
Thompson RS, Anderson KH, Bartlein PJ. 1999. Quantitative paleoclimatic reconstructions form late Pleistocene macrofossils of the Yucca Mountain region. USGS Open-File Report 99-338.
Thompson RS, Whitlock C, Bartlein PJ, Harrison SP, Spaulding WG. 1993. Climatic changes in the western United States since 18,000 yr BP. In Global Climates Since the Last Glacial Maximum. Wright HE (ed). University of Minnesota Press, MN; 468-513.
Turner RM, Bowers JE, Burgess TL. 1995. Sonoran Desert Plants: An Ecological Atlas. The University of Arizona Press, Tucson, AZ.
Van Devender TR. 1987. Holocene vegetation and climate in the Puerto Blanco Mountains, southwestern Arizona. Quaternary Research 27: 51-72.
Van Devender TR. 1990. Late Quaternary vegetation and climate of the Chihuahuan Desert, United States and Mexico. In Packrat Middens-The Last 40,000 Years of Biotic Change. Betancourt JL, Van Devender TR, Martin, PS (eds). University of Arizona Press, Tucson, AZ; 104-133.
Van Devender TR. 1995. Desert Grassland History. In The Desert Grassland:
Changing climates, evolution, biogeography, and community dynamics McClaran MP, Van Devender TR (eds). University of Arizona Press, Tucson, AZ; 65-99.
Van Devender TR, Betancourt JL, Wimberley M. 1984. Biogeographic implications of a packrat midden sequence from the Sacramento Mountains, south-central New Mexico. Quaternary Research 22: 344-360.
Van Devender TR, Burgess TL. 1985. Late Pleistocene woodlands in the Bolson de Mapimi: A refugium for the Chihuahuan Desert biota? Quaternary Research 24: 346-353.
Van Devender TR, Riskind DH. 1979. Late Pleistocene and early Holocene plant remains from Hueco Tanks State Historical Park: the development of a refugium. Southwestern Naturalist 24: 147-140.
Van Devender TR, Thompson RS, Betancourt JL. 1987. Vegetation history of the deserts of southwestern North America: The nature and timing of the Late Wisconsin-Holocene transition. In North America and adjacent oceans during the last deglaciation. The Geology of North America. Ruddiman WF, Wright, HE (eds). Geological Society of America, Boulder, CO; 323-352.
Van Devender TR, Toolin LJ. 1983. Late Quaternary vegetation of the San Andres Mountains, Sierra County, New Mexico. In The prehistory of Rhodes Canyon: Survey and mitigation. Eidenbach PL (ed). Tularosa, N.M.: Human Systems Research, Inc. Report to Holloman Air Force Base; 33-54.
Vinton MA, Burke IC. 1995. Interactions between individual plant species and soil nutrient status in shortgrass steppe. Ecology 76: 1116-1133.
Waters MR. 1989. Late Quaternary lacustrine history and paleoclimatic significance of pluvial Lake Cochise, southeastern Arizona. Quaternary Research 32: 1-11.
Webb RH, Betancourt JL. 1990. The spatial and temporal distribution of radiocarbon ages from packrat middens. In Packrat Middens-The Last 40,000 Years of Biotic Change. Betancourt JL, Van Devender TR, Martin, PS (eds). University of Arizona Press, Tucson, AZ; 85-102.
Williams JW, Shuman BN, Webb III T. 2001. Dissimilarity analyses of late-Quaternary vegetation and climate in eastern North America. Ecology 82: 3346-3362.
Woodward FI. 1987. Climate and Plant Distribution. Cambridge University Press, Cambridge, MA; 173 pp.
Captions
Table 1. List of herbarium data souces
Table 2. Table of climatic ranges from bioclimatic envelopes
Figure 1. Map of the U.S.A.-Mexico borderlands with locations of key midden sites from the
northern Chihuahuan Desert.
Figure 2. Relative abundance of summer-flowering annuals and C4 grasses and C3 desert shrubs
through time for sites in the northern Chihuahuan Desert. Note that midden records are
discontinuous, with occurrences of midden samples indicated by horizontal bars.
Figure 3. Graphical representation of the fundamental niche space, realized environmental space,
potential niche space, and realized niche space. After Jackson and Overpeck, 2000.
Figure 4. Comparison of species point-occurrences from herbarium data and modeled niche
space.
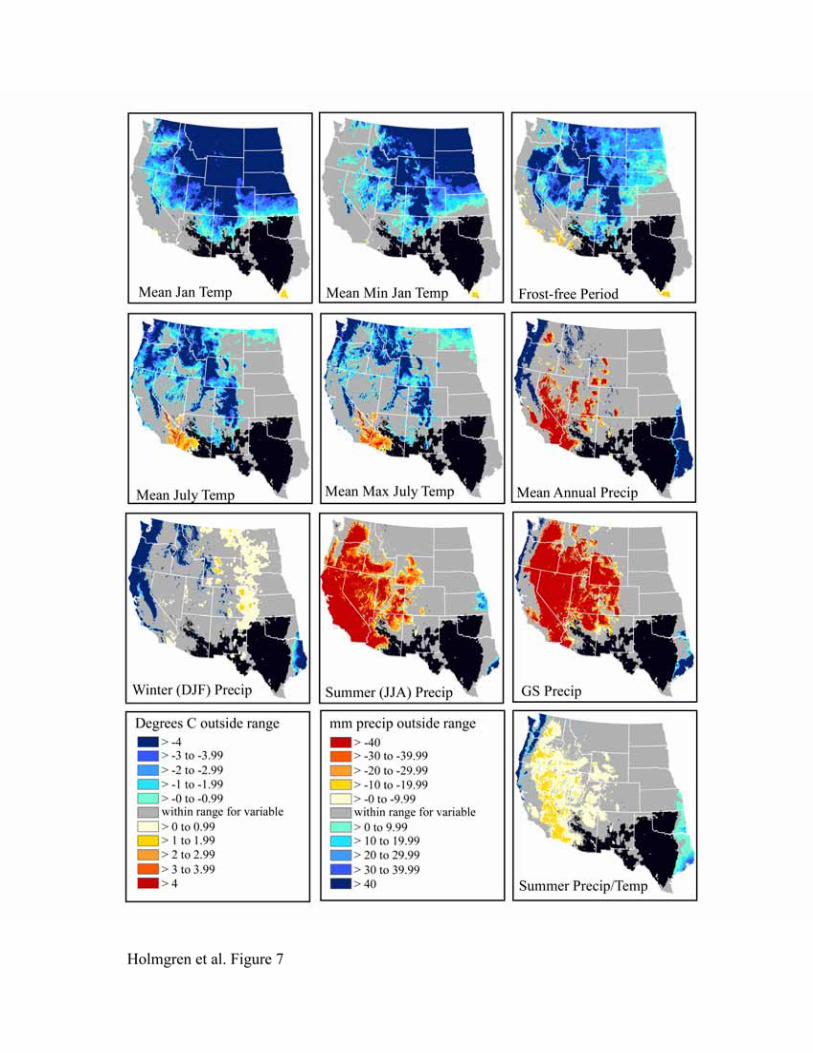
Figure 5. Niche space for Bothriochloa barbinodis (shown in black) with the distance from the
niche space for 10 variables. For figures 3-12, the area in gray indicates the area outside of the
niche space when all variables are considered, but within the potential niche space for a
particular variable.
Figure 6. Niche space for Digitaria californica.
Figure 7. Niche space for Leptochloa dubia..
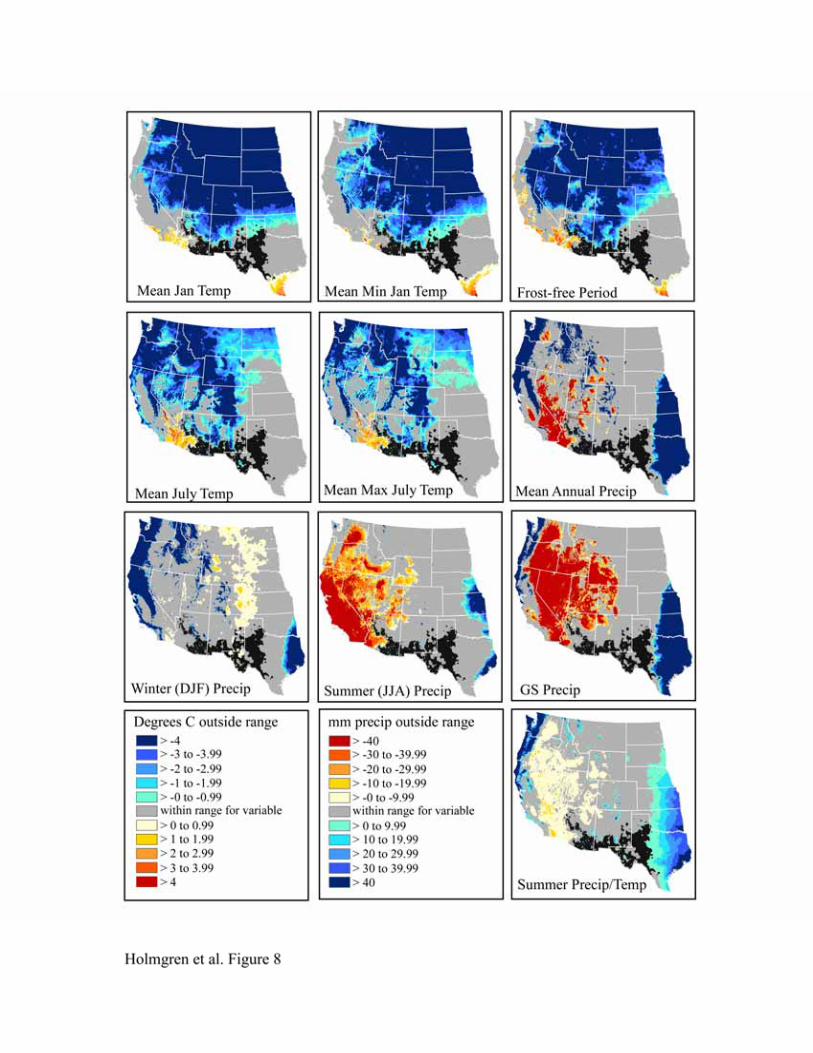
Figure 8. Niche space for Setaria vulpiseta.
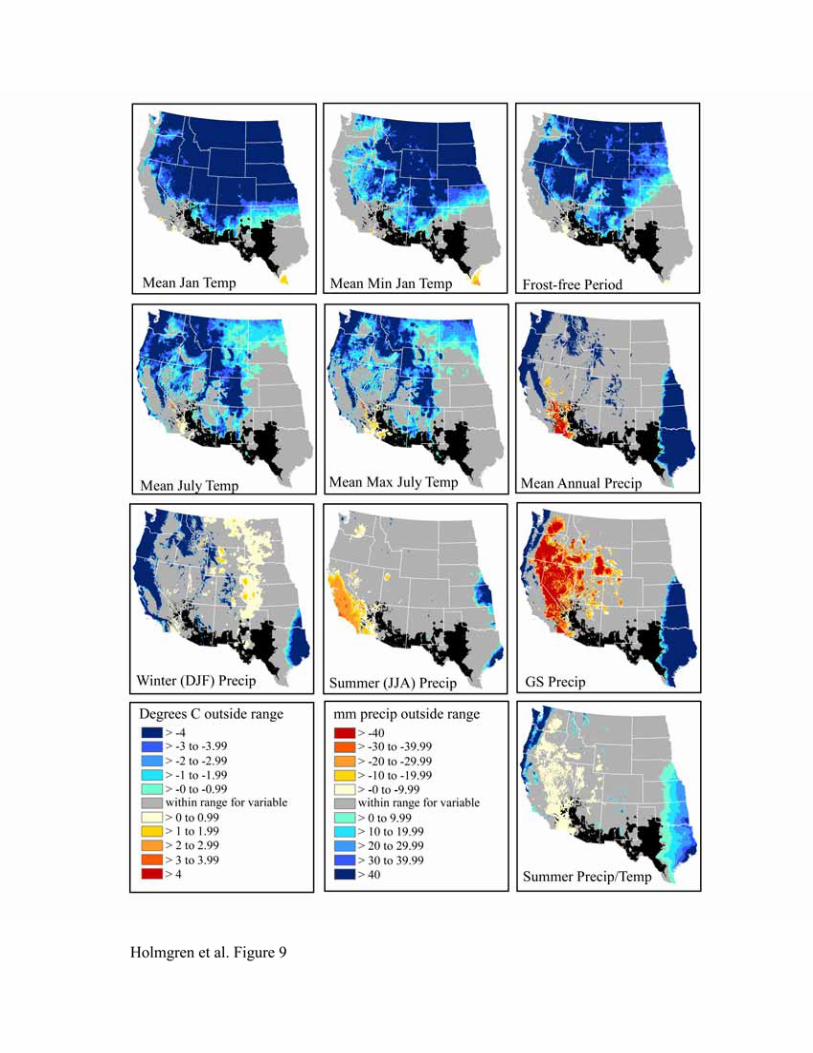
Figure 9. Niche space for Acacia constricta.
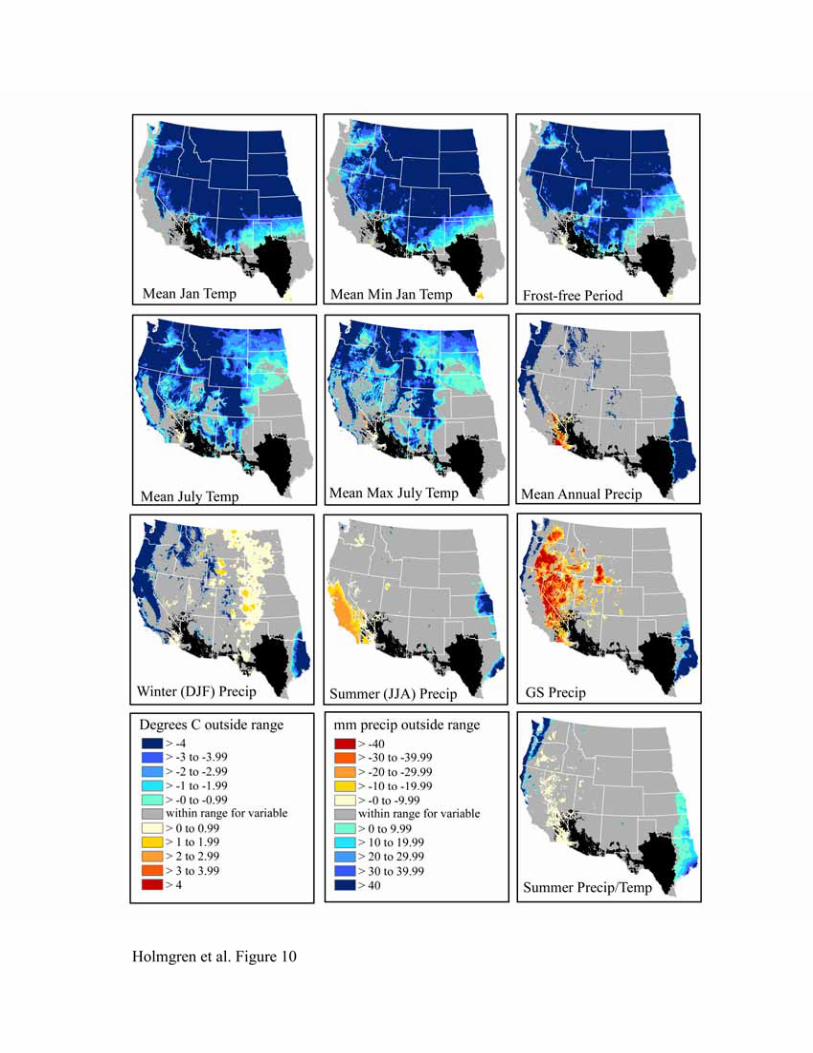
Figure 10. Niche space for Acacia greggii.
Figure 11. Niche space for Flourensia cernua.
Figure 12. Niche space for Fouquieria splendens.
Figure 13. Niche space for Larrea tridentata.
Figure 14. Niche space for Simmondsia chinensis.
Figure 15. Changes in June and December insolation (W/m2) relative to present for 30˚N. Large
arrow denotes step change in vegetation around 5000-4000 yr B.P. and onset of increased ENSO
variability.

InstitutionHerbarium Code
ArizonaArizona State University ASUDesert Botanical Garden DESNorthern Arizona University ASCUniversity of Arizona ARIZSALVIASCaliforniaRancho Santa Ana Botanical Garden RSAUniversity of California at Berkeley UC, JEPSUniversity of California at RiversideColoradoColorado State University CSUniversity of Colorado COLOKansasUniversity of Kansas Natural History Museum KANUMexicoInstituto de Ecologia, A.C. IEBMissouriMissouri Botanical Garden MONebraskaUniversity of Nebraska at Omaha OMAUniversity of Nebraska State Museum NEBNevadaUniversity of Nevada at Las Vegas UNLVUniversity of Nevada at Reno RENONew MexicoNew Mexico State University NMC, NMCRUniversity of New Mexico UNMTexasAngelo State University SATSam Houston State Univeristy SHSTSouthwest Texas State University SWTStephen F. Austin State University ASTCTexas A&M University TAES, TAMUUniversity of Texas at Austin LL, TEXWest Texas A&M University WTSUtahUniversity of Utah UT Utah State University UTC
Holmgren et al. Table 1. List of herbaria contributing species occurrence data.