Embed Size (px)
Citation preview

lable at ScienceDirect
Geotextiles and Geomembranes 27 (2009) 475–487
Contents lists avai
Geotextiles and Geomembranes
journal homepage: www.elsevier .com/locate/geotexmem
Influence of cyclic tensile loading on pullout resistance of geogridsembedded in a compacted granular soil
Nicola Moraci*, Giuseppe CardileMediterranea University of Reggio Calabria, Dep. MECMAT, via Graziella Loc. Feo di Vito, I-89060, Reggio Calabria, Italy
a r t i c l e i n f o
Article history:Received 7 March 2009Received in revised form24 September 2009Accepted 24 September 2009
Keywords:Pullout resistancePost-cyclic pullout behaviourInterface apparent coefficient of frictionGeogrid
* Corresponding author. Tel.: þ390965875263; fax:E-mail addresses: [email protected] (N. Mora
(G. Cardile).
0266-1144/$ – see front matter � 2009 Elsevier Ltd.doi:10.1016/j.geotexmem.2009.09.019
a b s t r a c t
This paper deals with some results of a wide experimental research carried out in order to study factorsaffecting cyclic and post-cyclic pullout behaviour of different geogrids embedded in a granular soil. Thenew test procedure developed (multistage pullout test) and the relative results are described. Inparticular, test results obtained using the constant rate of displacement (CRD) and the multistage pullouttests highlighted the influence of the different factors involved in the research (cyclic load amplitude andfrequency, vertical confining stress, geogrid tensile stiffness and structure) both on the peak pulloutresistance and on the peak apparent coefficient of friction mobilized at the interface.
� 2009 Elsevier Ltd. All rights reserved.
1. Introduction
Geosynthetics are commonly used in many geotechnical workssuch as soil reinforced walls, soft ground improvement, roads andrailway embankments, slope stabilizations and bridge abutmentsconstructed also in seismic areas. In all previous applications themain function of geosynthetics was reported to be the soil rein-forcement and the high tensile resistance, and the long-term efficienttensile behaviour of these materials makes possible this function.
Both in the construction phase and the serviceability life, thegeosynthetic embedded in soil, used as reinforcement inclusion, canundergo different load conditions. The applied tensile loads on thegeosynthetic can be due to permanent loads (dead weight of soiland eventual overloads), repetitive loads (as vehicular traffic loads),accidental loads (as seismic loads) and loads during construction, ascompaction loads.
The geosynthetic reinforced earth structures have severaladvantages in comparison with the traditional structures (reinforcedconcrete walls). In particular, reinforced earth structures, con-structed by alternating compacted soil layers and reinforcementelements, have a high flexibility and ductility behaviour when sub-jected to differential settlements and the dynamic behaviour isimproved (Huang et al., 2002). The better behaviour of the reinforced
þ390965875201.ci), [email protected]
All rights reserved.
earth structures compared to the more rigid traditional structures(i.e. reinforced concrete walls) in seismic load conditions has beenshown in different events such as that verified in Kobe, January 1995(Tatsuoka et al.,1995,1997, 1998), in California, January 1994 (Sandri,1997;White and Holtz, 1994), in Taiwan, 1999 (Ling et al., 2001) andin Turkey, 1999 (Sankey and Segrestin, 2001). However, thesehistorical evidences were not widely supported by systematicexperimental and theoretical studies about the seismic behaviour ofthe geosynthetic reinforced structures. In fact, in order to study theinternal stability of geosynthetic reinforced structures subjected tocyclic loads, it is necessary to evaluate the pullout resistance and theapparent interface coefficient of friction mobilized in the anchoragezone under these load conditions. In particular, the mechanicalbehaviour of the geosynthetic–soil interface must be investigated bya load process beginning from geostatic condition and proceeds toa time dependent tangential tensile load. In these load conditions thestress–strain behaviour is non-linear, not reversible (dissipativeprocess) and dependent on the history of the applied loads.
For this reason, it is important to study the pullout soil–geo-synthetic interaction, starting from the large CRD pullout priorexperience (Moraci and Recalcati, 2006).
This paper deals with some results of a wide experimentalresearch carried out in order to study factors affecting the cyclic andpost-cyclic pullout behaviour of different geogrids embedded ina granular soil. In particular, in this paper, the influence on thepullout resistance and on the interface apparent coefficient of fric-tion of the following factors: tensile cyclic load frequency and

Nomenclature
s0v vertical effective stress (kN/m2)A applied cyclic tensile load amplitude (KN)API application programming interfaceBR node thickness (mm)BT thickness of the bar portion between two nodes (mm)CRD constant rate of displacementCS1 clamping system oneCS2 clamping system twoCTLF applied cyclic tensile load frequency (Hz)CTLA applied cyclic tensile load amplitude (kN/m)DAQ data acquisitiond10 grain size corresponding to 10% in weight of passing
soil (mm)d50 average grain size (mm)d60 grain size corresponding to 60% in weight of passing
soil (mm)DR relative density of the granular soil (%)f applied cyclic tensile load frequency (Hz)GGE1 extruded geogrid oneGGE2 extruded geogrid twoGGW woven geogridHPB pullout box height (mm)J2% tensile stiffness at 2% of strain (kN/m)
J5% tensile stiffness at 5% of strain (kN/m)L reinforcement length in the anchorage zone (m)LPB pullout box length (mm)LR specimen length (m)Pi initial pullout load (kN/m)PR pullout resistance (kN/m)PC
R post-cyclic pullout resistance (kN/m)PC
max maximum applied cyclic tensile load (kN/m)RVDT rotational variable displacement transducerS spacing between geogrid bearing members (mm)TF tensile strength (kN/m)U uniformity coefficient of soil (–)v rate of displacement (m/s)WPB pullout box width (mm)wopt optimum water content (%)WR node width (mm)WT width of the bar portion between two nodes (mm)f0 soil shear strength angle (�)f0cv soil shear strength angle at constant volume (�)f0p peak shear strength angle (�)gdmax maximum dry unit weight (kN/m3)mS=GSY soil–geosynthetic peak interface apparent coefficient
of friction (–)mC
S=GSY post-cyclic soil–geosynthetic peak interface apparentcoefficient of friction (–)
N. Moraci, G. Cardile / Geotextiles and Geomembranes 27 (2009) 475–487476
amplitude, vertical confining stress, geogrid tensile stiffness andstructure, are considered.
The deformation behaviour in CRD and in the multistage (cyclic)pullout tests will be discussed in a following paper.
2. Previous researches
Only a few researches about the soil–geosynthetic interfaceinteraction under pullout cyclic tensile load conditions are availablein literature. These researches are summarized in Table 1.
2.1. Experimental studies
In this paper only the researches carried out on granular soilsare described.
Table 1Summary of experimental research on cyclic pullout tests.
Research centre/references Test apparatus dimensionsLPB�WPB�HPB (mm)and characteristics
Materials
University of BritishColumbia (Fanninand Raju, 1993;Raju, 1995)
1300� 640� 600.Aluminium front and rear walls;side walls glued with glass sheet;measurement of pressures on front wall;clamping system outside the box
UniformA mono-otwo polytwo smoo
Kyushu University(Ochiai et al., 1992,1996; Yasudaet al., 1992)
600� 400� 400. Lubricated insidewalls by means of greasedrubber membranes
Toyouravolcanictwo extru
Min et al. (1995) 600� 200� 300. Lubricated walls Ottawa spolyprop
Technical University ofClausthal. Meyer et al.(2004) Nernheim (2005)
1500� 600� 600. Metal sleevesat the front wall; clampingsystem inside the box
Sand witgdmax¼ 1HDPE extwoven ge
Yasuda et al. (1992), studied the effect of horizontal cyclic tensileloads and of vertical cyclic overburden pressure on the cyclic pulloutbehaviour of extruded (mono-directional and bi-directional)geogrids embedded in different soils (two different volcanic ashesand one uniform sand). The vertical loads were applied using anairbag. The pullout loads were measured by means of a load cell andthe tests were carried out on loose (DR¼ 30%) and on dense soils(DR¼ 80%).
The test results, carried out on the granular soils, showed,generally, a decrease of the pullout resistance evaluated undervertical cyclic load conditions compared to the pullout resistanceevaluated under monotonic load conditions. In particular, theexperimental results showed that the decrease of the pulloutresistance due to the vertical cyclic loads increases on increasingthe vertical cyclic load amplitude.
Soil specimenpreparation
Type of test
silica sand: U¼ 1.5, d50¼ 0.8 mm.riented HDPE extruded geogrid;
ester woven geogrids;thly HDPE geomembranes
Air pluviation Constant rateof displacement;cyclic tests at differentamplitude and frequency(0.1–0.01 Hz)
sand: DR¼ 30 and 80%; twowell-graded granular sands.ded geogrids
Air pluviation Constant rate ofdisplacement; cyclic test
and at a relative density DR¼ 70%ylene biaxial geogrid
Air pluviation Static loads and underrepeated tensile loads(0.1 and 0.5 Hz)
h U¼ 4,23; f0P ¼ 36–43�;.90 g/cm3; gdmin¼ 1.56 g/cm3
ruded geogrid; PETogrid; PE welded geogrid
Air pluviation Constant rateof displacement;fatigue cyclic test
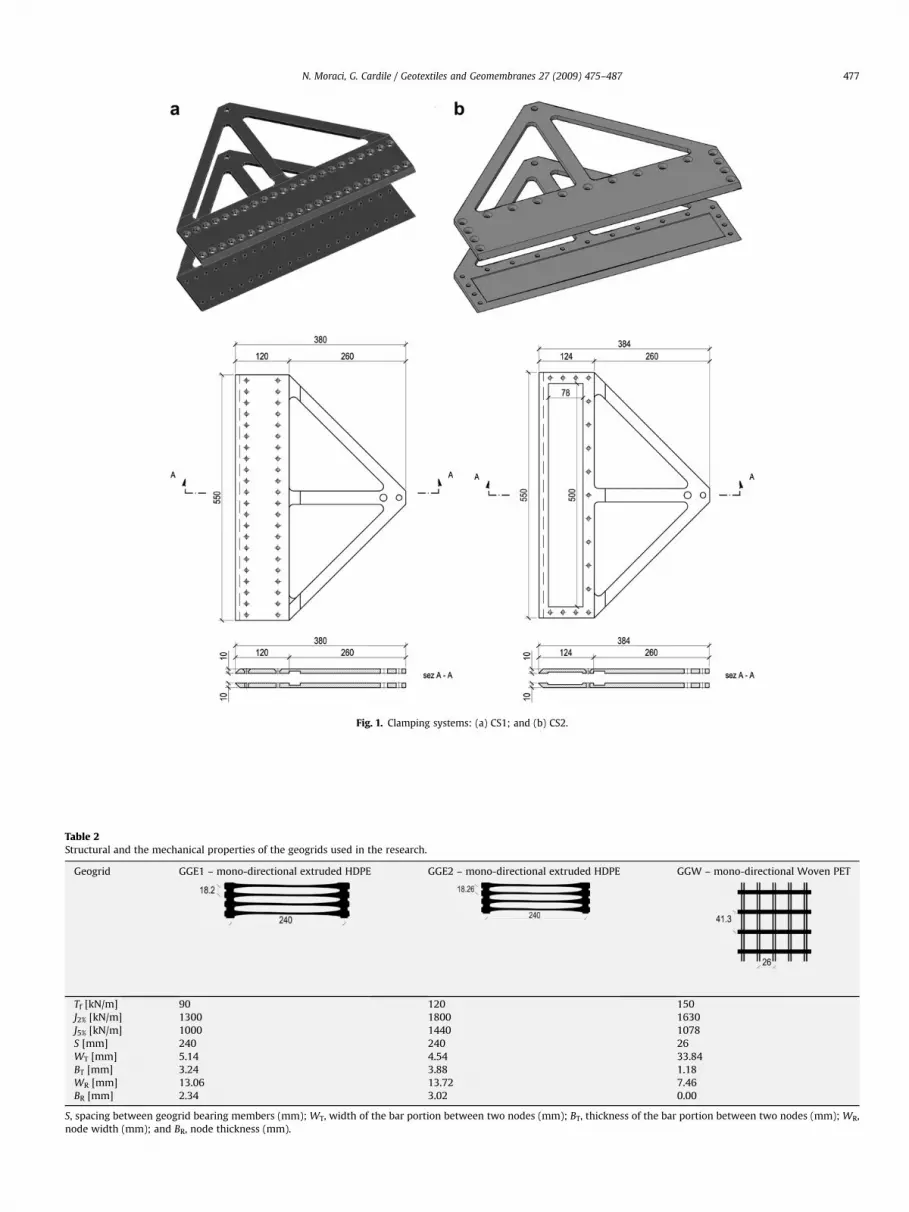
Fig. 1. Clamping systems: (a) CS1; and (b) CS2.
Table 2Structural and the mechanical properties of the geogrids used in the research.
Geogrid GGE1 – mono-directional extruded HDPE GGE2 – mono-directional extruded HDPE GGW – mono-directional Woven PET
Tf [kN/m] 90 120 150J2% [kN/m] 1300 1800 1630J5% [kN/m] 1000 1440 1078S [mm] 240 240 26WT [mm] 5.14 4.54 33.84BT [mm] 3.24 3.88 1.18WR [mm] 13.06 13.72 7.46BR [mm] 2.34 3.02 0.00
S, spacing between geogrid bearing members (mm); WT, width of the bar portion between two nodes (mm); BT, thickness of the bar portion between two nodes (mm); WR,node width (mm); and BR, node thickness (mm).
N. Moraci, G. Cardile / Geotextiles and Geomembranes 27 (2009) 475–487 477

Fig. 2. Schematic representation of CRD and multistage pullout tests (modified from Moraci and Cardile, 2008b).
Table 3Multistage pullout test program.
Investigated factor Geogrid LR (m) s0vðkPaÞ f (Hz) Pi/PR A/PR
Tensile load frequency f GGE1 1.15 10 0.05 0.22 0.33GGE1 1.15 25 0.05 0.28 0.28GGE1 1.15 50 0.05 0.28 0.28GGE1 1.15 10 0.1 0.22 0.31GGE1 1.15 25 0.1 0.28 0.23GGE1 1.15 50 0.1 0.28 0.28
Normalized tensile loadamplitude A/Pi
GGE2 1.15 10 0.1 0.29 0.24GGE2 1.15 10 0.1 0.29 0.42GGE2 1.15 50 0.1 0.33 0.17GGE2 1.15 50 0.1 0.33 0.32
Geogrid tensile stiffness GGE1 1.15 10 0.1 0.22 0.31GGE2 1.15 10 0.1 0.29 0.24GGE1 1.15 25 0.05 0.28 0.28GGE2 1.15 25 0.05 0.38 0.19GGE1 1.15 50 0.1 0.28 0.28GGE2 1.15 50 0.1 0.33 0.17
Geogrid structure GGE2 1.15 10 0.1 0.29 0.24GGW 1.15 10 0.1 0.23 0.28GGE2 1.15 25 0.05 0.38 0.19GGW 1.15 25 0.05 0.26 0.26GGE2 1.15 50 0.1 0.33 0.17GGW 1.15 50 0.1 0.25 0.28
N. Moraci, G. Cardile / Geotextiles and Geomembranes 27 (2009) 475–487478
The study of the effect of the horizontal cyclic tensile loads wasperformed by applying a constant effective vertical stress s0v, aninitial pullout load Pi, and then adding a cyclic tensile pullout loads,for 20 cycles. The amplitude of the cyclic tensile pullout loads wasincreased until geogrid tensile or pullout failure occurred. The testresults carried out on the granular soil showed, generally, anincrease of the pullout resistance evaluated under cyclic pulloutload conditions, compared to the pullout resistance evaluatedunder static vertical load conditions. The increase of the pulloutresistance ranging from 0% to 50% depends on the initial staticpullout load Pi, on the applied confining pressure and on the soilrelative density. In particular, the larger increments were observedfor loose soils.
Min et al. (1995) studied the long-term pullout behaviour ofa polypropylene bi-directional geogrid embedded in Ottawa sandprepared at a relative density DR¼ 70% subject to several confiningpressures and to different tensile loads.
Pullout tests were carried out under static loads and underrepeated tensile loads. The static pullout test was carried outapplying a constant horizontal tensile load for a period of 24 h; afterthis time, the tensile load was increased and maintained constantfor 24 h, until tensile or pullout failure occurred.
The repeated pullout tests were carried out in a similar waycompared to the static pullout tests but, in this case, in a differentseries (everyone of duration equal to 24 h) the incremental pulloutloads were characterized by different values of frequencies andamplitudes.
The pullout test results under repeated tensile loading conditionsshowed that the pullout resistance and, consequently, the apparentinterface coefficient of friction were about 20% less than the valuesobtained from the static pullout tests carried out in the same testconditions. This circumstance suggests that apparent interfacecoefficients of friction smaller than those in static (conventional)tests should be used in structures subjected to cyclic loads.
Raju and Fannin (1997) carried out monotonic and cyclic pullouttests, on three different mono-directional geogrids embedded inuniform silica sand prepared at a fixed relative density (DR¼ 85–90%) by air pluviation. The monotonic pullout tests, carried out atdisplacement rate control, applying three different verticalconfinement pressures, were performed in order to have a basicreference to quantify the effects of the cyclic pullout tensile loads inthe same boundary condition to evaluate the peak pullout resis-tance variation.
The cyclic pullout tests were carried out with load control. Inthese tests a constant load increment was applied until a fixedpullout load was reached. After this phase a different series of 10
cycles of a sinusoidal horizontal tensile load was applied by varyingthe load frequency and amplitude.
The experimental results showed that the pullout resistanceevaluated in cyclic tensile load conditions varies with the type andthe geometry of geosynthetics used in the tests. In particular,a general trend was not observed. In fact, in some cases the cyclicpullout resistance was larger than in the monotonic case, while inother cases the cyclic pullout resistance was lower than that of themonotonic case (Raju and Fannin, 1998). In the absence of moreexperimental data the authors suggested to use interaction factorsin seismic conditions equal to 80% of the static interaction factor.The authors also noticed that the pullout resistance was, never,influenced by the cyclic tensile load frequency.
Therefore, the few studies on the interaction between soil andreinforcement in cyclic pullout conditions are incomplete and theso far obtained results are often contradictory, thus more investi-gations are still needed. In particular, so far no systematic studies,that allow to define the effects of parameters affecting the responseof soil-reinforcement system in cyclic pullout conditions, have been

Fig. 3. Comparison between CRD and multistage pullout tests for geogrid GGE1 under s0v ¼ 10 kPa and 25 kPa: (a) f¼ 0.05 Hz; and (b) f¼ 0.1 Hz (Moraci and Cardile, 2008a).
N. Moraci, G. Cardile / Geotextiles and Geomembranes 27 (2009) 475–487 479
carried out. Moreover, the test methodology for the study ofextensible reinforcements behaviour in cyclic pullout condition isstill not well defined.
3. Experimental research
3.1. Test apparatus
The study of the cyclic pullout behaviour of different geogridsembedded in a compacted granular soil was carried out using thelarge pullout test apparatus of the geotechnical laboratory ofMediterranea University of Reggio Calabria. The test apparatus wasdeveloped on the basis of the results of the different researches onthe soil–geosynthetic interaction in CRD pullout tests (Moraci and
Fig. 4. Comparison between CRD and multistage pullout tests for geogrid GGE1 und
Montanelli, 2000; Moraci et al., 2002, 2004; Juran et al., 1988;Palmeira and Milligan,1989; Farrag et al., 1993; Farrag and Morvant,2000; Chang et al., 2000; Sugimoto et al., 2001). The test apparatus(1700� 600� 680 mm) was used in a previous research in order toevaluate factors affecting the behaviour of different geogridsembedded in compacted granular soils in CRD pullout tests (Moraciet al., 2003; Moraci and Recalcati, 2006; Moraci and Cardile, 2008c).
In order to better perform the cyclic pullout test, the CRD pullouttest apparatus has been modified. In particular, the displacementmeasurement system has been adapted and a new software, tomanage and control the different phases of the test, has beendeveloped.
The test apparatus is composed of a pullout steel box, a verticalload application system, a horizontal force actuator device, a special
er s0v ¼ 50 kPa: (a) f¼ 0.05 Hz; and (b) f¼ 0.1 Hz (Moraci and Cardile, 2008a).

Fig. 5. Peak pullout resistance envelopes obtained by CRD and multistage pullout tests.
N. Moraci, G. Cardile / Geotextiles and Geomembranes 27 (2009) 475–487480
clamp, and all the required instrumentation. A more detaileddescription of the test apparatus can be found in Moraci and Recal-cati (2006).
3.1.1. Clamping systemsIn order to apply the tensile load to different types of geo-
synthetic specimens, two internal special clamping systems wereused: the first one (CS1) was used, in previous researches for theextruded geogrids, Moraci and Recalcati (2006), and the second one(CS2), was appropriately designed for woven and welded geogrids.Both systems were able to prevent the specimen slip into the clamp.
The CS1 clamping system consists of two steel elements charac-terized by the dimensions shown in the Fig.1a. Two rows of holes areplaced on the two flat elements in order to allow the block of thespecimen by using the passing screws. The plan dimensions of thesteel plates and the distance between the holes were designed inorder to prevent the potential damage of the extruded geogridspecimen both during the blocking phase and during the pullout test.The plates have an internal groove necessary to place the firsttransversal rod of the mono-directional extruded geogrids specimen.
Fig. 1b shows the clamping system CS2. This clamp also consistsof two stainless steel plates and is characterized by two cavitiesplaced in the internal side of each element. The geogrid specimen isglued, with a special large resistance made of resin two compo-nents, to the two steel plates placed inside both cavities.
These internal clamping devices have two main advantages: theanchorage length is constant for the whole duration of the test;the displacement measured at the clamping device is exactly thedisplacement of the first confined section of the geogrid (assuming
Fig. 6. Influence of the applied cyclic tensile load frequencies and s0v on the peak in
that no relative movement can occur within the clamp), and it cantherefore be used directly in the test interpretation.
The clamping systems require a series of preliminary evaluationclamping friction tests that have to be performed with the sameboundary conditions, on the clamping systems without any rein-forcement, in order to evaluate the pullout resistance developed bythe clamping system alone.
Moreover, it is important to point out that using the internalclamping system allows to study the geogrids tensile resistanceunder soil confinement.
3.2. Test materials
Tests were performed on three different types of geogrids, twoextruded mono-directional HDPE geogrids of different stiffness(called GGE1 and GGE2) and one woven PET geogrid (called GGW)having a similar peak tensile resistance to the GGE2 extrudedgeogrid.
Table 2 shows the structural and the mechanical properties ofthe different geogrids.
The same granular soil used in previous researches was used alsoin these tests (Moraci and Recalcati, 2006; Moraci and Cardile,2008a,b,c). The soil was uniform medium sand with U¼ d60/d10¼1.5and d50¼ 0.22 mm. Standard Proctor compaction tests have givena gdmax¼ 16.24 kN/m3 at a wopt¼ 13.5%. Direct shear tests, per-formed at 95% of gdmax, yielded values of the peak shear strengthangle f0p, in the range 48� (for s0v ¼ 10 kPa), 42� (for s0v ¼ 100 kPa).The shear strength angle at constant volume f0cv was equal to 34�
(Moraci and Recalcati, 2006; Moraci and Cardile, 2008a,b,c).
3.3. Test procedure
In order to study the geogrids behaviour in constant rate ofdisplacement (CRD) and in cyclic pullout conditions two differenttest procedures were used.
The CRD pullout tests were carried out at 1 mm/min rate,according to the test procedure described by Moraci and Recalcati(2006), in the same test conditions (i.e. specimen length andapplied vertical stress) used in the successive multistage pullouttests (Fig. 2a).
The cyclic and post-cyclic pullout behaviour was analyzed per-forming multistage pullout tests (Moraci and Cardile, 2008a,b). Themultistage pullout tests were performed in different phases ongeogrid specimens of length equal to 1.15 m (Fig. 2b and c). In thefirst phase, the pullout tests were performed under CRD equal to1 mm/min. When a fixed pullout load was achieved (Pi) a sinusoidal
terface apparent coefficient of friction mS/GSY in CRD and post-cyclic conditions.

Fig. 7. Comparison between CRD and multistage pullout tests for geogrid GGE2 under s0v ¼ 50 kPa and f¼ 0.1 Hz: (a) (A/PR)¼ 0.17; (b) (A/PR)¼ 0.32 (Moraci and Cardile, 2008a).
N. Moraci, G. Cardile / Geotextiles and Geomembranes 27 (2009) 475–487 481
cyclic tensile load of fixed frequency (0.1 and 0.05 Hz) and ampli-tude (15–45% of the CRD pullout resistance, PR) was applied, at loadcontrol, for a number of cycles equal to 30. After this phase, the testwas again carried out under CRD conditions at the same displace-ment rate used in the first stage of the test, until the pullout ortensile failure was reached.
The first and the second phase of the multistage pullout testsimulate the conditions of an earth reinforced structure in whichthe reinforced geogrids are subjected to static pullout loads, dueto the thrust of the soil, and the seismic loads produce anincrement of the applied tensile loads. The last phase of the test,and the comparison of the test results with those obtained inconventional CRD pullout tests, was performed in order toinvestigate the degradation of the pullout resistance and of theapparent interface coefficient of friction due to the cyclic tensileloads.
All the tests were performed until a maximum horizontaldisplacement equal to 100 mm (or until geogrid failure) was ach-ieved (this value of displacement corresponds to the limit valueunder soil confinement conditions).
A sustained loading history before the start of cyclic loading maynot only have effects on the pullout behaviour during cyclic loading(Kongkitkul et al., 2004) but also in CRD pullout tests. Nevertheless,the scope of the paper is to investigate the effect of cyclic loading onthe pullout resistance and on the peak interface apparent coeffi-cient of friction generally used in the design of earth reinforcedstructure and actually evaluated by means of CRD pullout tests.Therefore, the multistage pullout test procedure was developed inorder to highlight the effects of cyclic loading on the designparameters actually used in the design of earth reinforcedstructures.
Fig. 8. Influence of the applied cyclic tensile load amplitudes and s0v on peak pullout resist(post-cyclic) pullout tests (geogrid GGE2).
In order to perform the multistage pullout tests a managementand a test control software were developed (Moraci and Cardile,2008a).
The sinusoidal tensile load control has been applied by means ofa closed chain control system with a double ring feedback; the firstring controls the tensile load that follows the sinusoidal signalproduced by the software, according to a fixed resolution (64sample/cycle), in function of the assigned parameters in the testinitial setup; the second ring modulates the displacement rate toadapt the rate to the soil–geosynthetic system response.
The software, during the cyclic phase, generates a referencesignal (ideal sinusoid), according to a fixed resolution (64 sample/cycle). The feedback is obtained by means of the load cell signalusing a PC. The generation of the ‘‘reference’’ signal is temporizedby the PC system timer by means of the Windows API.
The personal computer has a DAQ to take and register thedisplacements readings by RVDT (rotary variable displacementtransducer) placed along the specimen. A motion card to controlthe engine is present too. The angular rate of the brushless engine iscontrolled by means of an encoder.
Therefore, due to the tensile load control system (double ringfeedback), the type of engine used (the angular rate of brushlessengine is controlled by means of an encoder), the non-linearity ofsoil–geosynthetic system response, the type of control of the testadopted (the feedback is obtained by means of the load cell signal)and the large dimensions of the test apparatus (large inertia),another automatic control, developed in the software, thatimproves, cycle by cycle, the tensile load amplitude irregularity isnecessary. These irregularities disappear after a few cycles.
The different phases of the multistage test occur by turnsautomatically. During the test the software memorizes the real
ance and on interface apparent coefficient of friction obtained by CRD and multistage

Fig. 9. Comparison between CRD and multistage pullout tests under s0v ¼ 10 kPa and f¼ 0.1 Hz, ðPCmax=PRÞy0:54 for different geogrid tensile stiffness: (a) GGE1; and (b) GGE2.
N. Moraci, G. Cardile / Geotextiles and Geomembranes 27 (2009) 475–487482
displacement rate. This circumstance permits to perform the samemultistage pullout test on the clamping system in order to evaluatethe pullout resistance developed by the clamping system alone.
In order to setup the test apparatus and the procedure and todevelop the test management and control software several sacri-ficial multistage pullout tests were necessary.
3.4. Experimental research
The experimental program was developed in order to studyfactors affecting the cyclic and post-cyclic pullout behaviour ofdifferent geogrids embedded in granular soils. In particular, theinfluence of cyclic tensile load frequency and amplitude, ofvertical confining pressure and of geogrids tensile stiffness andstructure on cyclic and post-cyclic pullout behaviour werestudied (Table 3).
The reinforcement (specimen) length was equal for all tests(1.15 m). The applied vertical confinement pressures were equal to10, 25 and 50 kPa.
In the first phase of the research 18 pullout tests were carriedout at constant rate of displacement (v¼ 1 mm/min) using thesame boundary conditions of the multistage pullout tests.
All the multistage pullout tests were carried out applying 30horizontal tensile load cycles; every test was characterized bya different tensile load amplitude value, varying from 15% to 45% ofthe static pullout resistance (PR), obtained by the correspondentCRD test, starting from a fixed index tensile load varying from 20%to 40% of PR.
Fig. 10. Comparison between CRD and multistage pullout tests under s0v ¼ 25 kPa and f¼ 0
After the cyclic phase, the multistage pullout test was continuedat constant rate of displacement until a total horizontal displace-ment of 100 mm was achieved.
In order to investigate the effect of the cyclic tensile loadfrequency f (equal to 0.05 Hz and 0.1 Hz), 6 multistage pullout testswere performed varying the vertical effective stress s0v. These testswere carried out on geogrid GGE1 using the same maximum cyclictensile load equal to PC
max=PR ¼ Pi=PR þ A=PRy0:55.In order to evaluate the influence of the applied cyclic tensile
load amplitude A, 4 multistage pullout tests were carried out on thegeogrids GGE2 using a frequency f equal to 0.1 Hz and varying thecyclic tensile load amplitude (A/PR¼ 0.17–0.42).
The influence of the geogrid tensile stiffness was studied bymeans of 6 multistage pullout tests carried out on two extrudedgeogrids of different tensile stiffness (GGE1 and GGE2). The testswere performed under different applied vertical confining stressess0v (10, 25 and 50 kPa) applying, in the cyclic phase, a tensile cyclicload characterized by a frequency equal to 0.1 Hz and usinga maximum tensile cyclic load PC
max=PRy0:55.Finally, the effects of the geogrid structure were analyzed by
means of 6 multistage pullout tests carried out on two differentgeogrids characterized by a similar tensile stiffness, but withdifferent structures (GGE2 extruded and GGW woven). Also in thiscase the tests were performed under different s0v (10, 25 and50 kPa), and the applied cyclic tensile load was characterized bya frequency of 0.1 Hz and by a maximum cyclic tensile load equalabout to PC
max=PSRy0:55.
Each test was repeated on the clamping system alone, in orderto evaluate the friction between the clamp and the soil in the same
.05 Hz, ðPCmax=PRÞy0:57 for different geogrid tensile stiffness: (a) GGE1; and (b) GGE2.

Fig. 11. Comparison between CRD and multistage pullout tests under s0v ¼ 50 kPa and f¼ 0.1 Hz, ðPCmax=PRÞy0:53 for different geogrid tensile stiffness: (a) GGE1; and (b) GGE2.
N. Moraci, G. Cardile / Geotextiles and Geomembranes 27 (2009) 475–487 483
conditions used in the multistage pullout tests; the pullout curvesobtained in these tests were subtracted to the correspondent onesobtained by the pullout tests carried out on the geogrid specimen.
During the pullout tests the following parameters weremeasured:
� applied tensile load;� displacement of the first confined section of the geogrid
specimen;� displacements measured at different points along the geogrid
specimen.
4. Analysis of test results
The pullout test results are analyzed in order to evaluate theinfluence of the different parameters investigated in the research(tensile cyclic load frequency and amplitude, vertical confiningpressure, geogrids tensile stiffness and structure) on the peak pulloutresistance and on the peak interface apparent coefficient of friction.
A preliminary analysis of the multistage pullout test resultsperformed in order to study the influence of the tensile cyclic loadfrequency and amplitude on the pullout resistance was reported ina previous paper (Moraci and Cardile, 2008b).
In this paper the multistage pullout test results performed inorder to study the influence of the tensile cyclic load frequency andamplitude have been studied in a more complete and careful way(in particular, the test results were analyzed also in terms ofinterface apparent coefficient of friction) and the new pullout testscarried out in order to study the other parameters investigated inthe research (geogrids tensile stiffness and structure) are discussed.
Fig. 12. Influence of geogrid tensile stiffness on peak pullout resistance and on interface appfrequencies.
The deformation behaviour in the different phases of themultistage pullout tests will be discussed in a following paper.
4.1. Influence of cyclic tensile load frequency (CTLF)
The experimental results of the multistage pullout tests carriedout in order to investigate the effects of the applied cyclic tensileload frequency and of the vertical confining stress are showed interms of static (PR) and post-cyclic ðPC
RÞ peak pullout resistance inFigs. 3–5.
In Figs. 3 and 4 the comparison between the CRD pullout testresults (dotted curves) and the multistage pullout test results(continuous curve) is shown in the same test conditions (LR, s0v). Inparticular, the different figures (a, b) refer to different values of theapplied cyclic tensile load frequency (0.05 and 0.1 Hz).
It is possible to observe that the applied cyclic tensile loadproduces a decrease of the post-cyclic peak pullout resistance incomparison with the values obtained by the CRD pullout tests(Moraci and Cardile, 2008a). Moreover, it is possible to notice thatthe mechanical response in the post-cyclic conditions was that ofhardening type for vertical confining stresses equal to 25 and50 kPa; on the contrary at lower confining stress (10 kPa) a slightsoftening post-cyclic behaviour was observed.
Moreover, the unload–reload tensile stiffness, at the end of thecyclic phase, is very high (Figs. 3 and 4); after this phase, the tensilestiffness decreases to values obtained in the conventional CRDpullout tests (in terms of tangent modulus).
Fig. 5 shows the experimental results in terms of failure enve-lopes. The different curves refer to the CRD conditions (dottedcurve) and to the post-cyclic conditions under the two different
arent coefficient of friction for different s0v and for different applied cyclic tensile load

Fig. 13. Comparison between CRD and multistage pullout tests under s0v ¼ 10 kPa and f¼ 0.1 Hz for different geogrid structure: (a) extruded geogrid GGE2; and (b) woven geogridGGW.
N. Moraci, G. Cardile / Geotextiles and Geomembranes 27 (2009) 475–487484
frequencies studied (continuous curves). It is possible to observethat the post-cyclic peak pullout resistance PC
R was always lowerthan the one obtained in the correspondent CRD pullout test PR. Thedecrease changes from 13% to 18%, for a frequency equal to 0.05 Hz,and from 10% to 16% for a frequency equal to 0.1 Hz. In particular, thedecrease of the peak pullout resistance increases on increasingthe vertical effective confinement stress. Moreover, the influence ofthe frequency seems to be negligible and it is possible to observeonly a little influence at the lower confinement stresses used (Fig. 5).
The analysis of the test results in terms of peak interfaceapparent coefficient of friction, obtained by CRD and multistagepullout tests, is reported in Fig. 6.
The experimental results show that the post-cyclic peak interfaceapparent coefficient of friction mC
S=GSY decreases on increasing theapplied vertical effective stresses (similarly to the conventional CRDpullout tests) due to the dilatancy of the soil at the interface and thatmC
S=GSY is always lower than the peak interface apparent coefficient offriction mobilized in the correspondent CRD pullout tests mS=GSY(Fig. 6). Moreover, it is interesting to observe that the interfaceapparent coefficients of friction in CRD and in post-cyclic conditionsare almost always lower than the coefficients of friction mobilized inthe sand at constant volume conditions tan f0cv ¼ 0:67 (Fig. 6a).
The post-cyclic peak apparent interface coefficient of frictiondecreases compared to the one obtained in the correspondent CRDtest, varying from 1% to 19%, for a frequency equal to 0.05 Hz, andfrom 11% to 16%, for frequency equal to 0.10 Hz. In particular, it ispossible to observe that, at lower vertical stresses (10 kPa), the ratedecrease of the above mentioned coefficient, increases onincreasing the cyclic tensile load frequency; on the contrary, for
Fig. 14. Comparison between CRD and multistage pullout tests under s0v ¼ 25 kPa and f¼ 0GGW.
higher confinement pressures (25 and 50 kPa), the influence of thecyclic tensile load frequency seems to be negligible (Fig. 6b).
4.2. Influence of cyclic tensile load amplitude (CTLA)
The experimental results of the CRD and multistage pullout testscarried out in order to study the influence of cyclic tensile loadamplitude A on peak pullout resistance are reported in Figs. 7 and8a. The multistage pullout tests refer to cyclic tensile loads char-acterized by a frequency of 0.1 Hz and by amplitude values varyingfrom 17% to 42% of PR.
Fig. 7 shows the different pullout curves obtained, for the geo-grid GGE2, for s0v ¼ 50 kPa, in CRD (dotted curves) and multistage(continuous curves) pullout tests.
Also in these tests it is possible to observe a decrease of the post-cyclic peak pullout resistance compared with the correspondentvalues obtained by the CRD pullout tests. In particular, the decreaseof peak pullout resistance varies from 6% to 33%, where the lowervalues refer to the lower applied effective vertical stresses, whilethe upper values refer to the higher investigated vertical effectiveconfinement stresses and to the higher cyclic tensile load ampli-tude (Fig. 8a).
The multistage pullout test performed under a vertical effectivestress equal to 50 kPa and using a normalized cyclic tensile loadamplitude of ðA=PRÞ ¼ 0:32 (Fig. 7b) shows quite a differentbehaviour with respect to the behaviour observed in the othermultistage pullout tests.
In fact, at the end of the cyclic phase, characterized by very largecumulative displacements (equal about to 50 mm), no pullout
.1 Hz for different geogrid structure: (a) extruded geogrid GGE2; and (b) woven geogrid
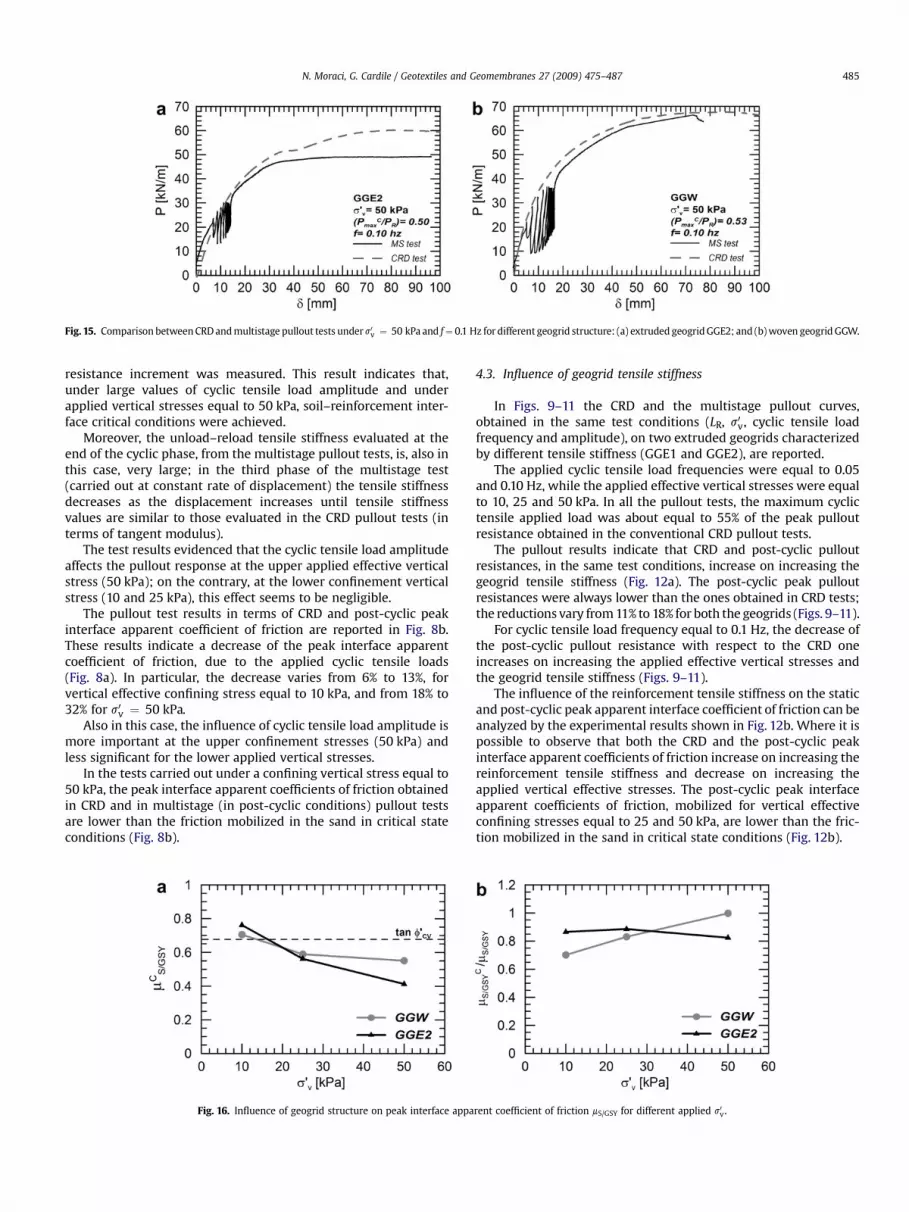
Fig. 15. Comparison between CRD and multistage pullout tests under s0v ¼ 50 kPa and f¼ 0.1 Hz for different geogrid structure: (a) extruded geogrid GGE2; and (b) woven geogrid GGW.
N. Moraci, G. Cardile / Geotextiles and Geomembranes 27 (2009) 475–487 485
resistance increment was measured. This result indicates that,under large values of cyclic tensile load amplitude and underapplied vertical stresses equal to 50 kPa, soil–reinforcement inter-face critical conditions were achieved.
Moreover, the unload–reload tensile stiffness evaluated at theend of the cyclic phase, from the multistage pullout tests, is, also inthis case, very large; in the third phase of the multistage test(carried out at constant rate of displacement) the tensile stiffnessdecreases as the displacement increases until tensile stiffnessvalues are similar to those evaluated in the CRD pullout tests (interms of tangent modulus).
The test results evidenced that the cyclic tensile load amplitudeaffects the pullout response at the upper applied effective verticalstress (50 kPa); on the contrary, at the lower confinement verticalstress (10 and 25 kPa), this effect seems to be negligible.
The pullout test results in terms of CRD and post-cyclic peakinterface apparent coefficient of friction are reported in Fig. 8b.These results indicate a decrease of the peak interface apparentcoefficient of friction, due to the applied cyclic tensile loads(Fig. 8a). In particular, the decrease varies from 6% to 13%, forvertical effective confining stress equal to 10 kPa, and from 18% to32% for s0v ¼ 50 kPa.
Also in this case, the influence of cyclic tensile load amplitude ismore important at the upper confinement stresses (50 kPa) andless significant for the lower applied vertical stresses.
In the tests carried out under a confining vertical stress equal to50 kPa, the peak interface apparent coefficients of friction obtainedin CRD and in multistage (in post-cyclic conditions) pullout testsare lower than the friction mobilized in the sand in critical stateconditions (Fig. 8b).
Fig. 16. Influence of geogrid structure on peak interface appa
4.3. Influence of geogrid tensile stiffness
In Figs. 9–11 the CRD and the multistage pullout curves,obtained in the same test conditions (LR, s0v, cyclic tensile loadfrequency and amplitude), on two extruded geogrids characterizedby different tensile stiffness (GGE1 and GGE2), are reported.
The applied cyclic tensile load frequencies were equal to 0.05and 0.10 Hz, while the applied effective vertical stresses were equalto 10, 25 and 50 kPa. In all the pullout tests, the maximum cyclictensile applied load was about equal to 55% of the peak pulloutresistance obtained in the conventional CRD pullout tests.
The pullout results indicate that CRD and post-cyclic pulloutresistances, in the same test conditions, increase on increasing thegeogrid tensile stiffness (Fig. 12a). The post-cyclic peak pulloutresistances were always lower than the ones obtained in CRD tests;the reductions vary from 11% to 18% for both the geogrids (Figs. 9–11).
For cyclic tensile load frequency equal to 0.1 Hz, the decrease ofthe post-cyclic pullout resistance with respect to the CRD oneincreases on increasing the applied effective vertical stresses andthe geogrid tensile stiffness (Figs. 9–11).
The influence of the reinforcement tensile stiffness on the staticand post-cyclic peak apparent interface coefficient of friction can beanalyzed by the experimental results shown in Fig. 12b. Where it ispossible to observe that both the CRD and the post-cyclic peakinterface apparent coefficients of friction increase on increasing thereinforcement tensile stiffness and decrease on increasing theapplied vertical effective stresses. The post-cyclic peak interfaceapparent coefficients of friction, mobilized for vertical effectiveconfining stresses equal to 25 and 50 kPa, are lower than the fric-tion mobilized in the sand in critical state conditions (Fig. 12b).
rent coefficient of friction mS/GSY for different applied s0v.

N. Moraci, G. Cardile / Geotextiles and Geomembranes 27 (2009) 475–487486
Moreover, the influence of geogrid tensile stiffness on the ratiobetween post-cyclic and CRD coefficient of friction mC
S=GSY=mS=GSYseems to be negligible. In fact, this ratio is about equal to 0.85 in allthe pullout tests used to study the influence of geogrid tensilestiffness.
4.4. Influence of the geogrid structure
The influence of the geogrid structure was investigatedcomparing the multistage pullout test results carried out on twogeogrids characterized by different structure and by similar tensilestiffness (extruded geogrid, GGE2, and woven geogrid, GGW). Thecompared pullout tests were performed in the same cyclic tensileload conditions (equal frequency and equal maximum cyclic tensileload level) and in the same boundary conditions (equal verticaleffective stresses).
The curves in Figs. 13–15 show the test results obtained in theCRD (dotted curves) and in the multistage (continuous curves)pullout tests performed on the GGE2 and GGW geogrids varying theapplied confining effective vertical stress and the cyclic tensile loadfrequency. In all the analyzed multistage pullout tests the maximumcyclic tensile load level was maintained almost constantðPC
max=PR ¼ 0:50� 0:57Þ.On the basis of these results different considerations can be
drawn.Also in this case the post-cyclic pullout resistance was lower than
the one obtained in the correspondent CRD test. In particular,reductions evaluated for the woven geogrid (GGW) vary from 2% to31%, while for the extruded geogrid (GGE2) the reduction rangesfrom 11% to 18%. Nevertheless, the trend observed for the two geo-grids is quite different. In fact, for the GGE2 the peak pullout resis-tance reductions, due to the cyclic tensile loads, seem to beunaffected by the effective vertical confining pressure; on thecontrary for the GGW geogrid the larger reductions were observed atthe lower confining stress (10 kPa) while with on increasing s0vreductions decrease.
Fig. 16a shows the trend of the post-cyclic peak interfaceapparent coefficient of friction related to the vertical effective stressfor both the geogrids. As in the CRD pullout tests (Moraci andRecalcati, 2006), it is possible to evidence a decrease of mS=GSY onincreasing s0v, due to the dilatancy of the soil at the interface.Moreover, also in this case the post-cyclic peak interface apparentcoefficients of friction are lower than that obtained in the corre-spondent CRD test. In particular, the reductions evaluated for thewoven geogrid (GGW) vary from 0% to 30%, while for the extrudedgeogrid (GGE2) the reduction ranges from 11% to 18% (Fig. 16b). Theobserved trend for both geogrids is the same as described for thepeak pullout resistance.
Finally, it is possible to observe that at the lowest vertical stress(10 kPa) the upper value of the peak interface apparent coefficientsof friction was mobilized by the GGE2 geogrid, while for the largervertical stress (50 kPa) the upper value of the peak interfaceapparent coefficient of friction was mobilized by the GGW geogrid.
5. Conclusions
The CRD and the multistage pullout test results clearly show theinfluence of cyclic tensile loads on the pullout resistance and on theinterface apparent coefficient of friction mobilized by differentgeogrids embedded in a compacted granular soil. The mainconclusions are as follows.
� The application of cyclic tensile loads produces a decrease ofthe post-cyclic peak pullout resistance and of the mobilizedpeak interface apparent coefficient of friction compared to the
values that are obtained, in the same test conditions, in CRDpullout tests. In particular, the maximum decrease of thepullout resistance and the mobilized interface apparent coef-ficient of friction measured in this research was about equal to30%.� The test results show that the influence of the cyclic tensile
load frequency, for the values studied in the research, seems tobe negligible.� The test results show that the cyclic tensile load amplitude
affects the pullout response at the upper applied effectivevertical stress (50 kPa); on the contrary, at the lower confine-ment vertical stress (10 and 25 kPa), this effect seems to benegligible. In particular, under large values of cyclic tensile loadamplitude and the upper applied vertical stresses (50 kPa), atsoil–reinforcement interface, critical conditions were achieved.In fact, at the end of the cyclic phase, characterized by verylarge cumulative displacements (about 50 mm), no pulloutresistance increment was measured.� The unload–reload tensile stiffness evaluated, at the end of the
cyclic phase, from the multistage pullout tests, was very large;in the third phase of the multistage test (carried out at constantrate of displacement) the tensile stiffness decreases as thedisplacement increases until the tensile stiffness values aresimilar to the ones evaluated in the CRD pullout tests (in termsof tangent modulus).� The pullout curves show that the post-cyclic pullout resistance
increases on increasing the geogrid tensile stiffness. Moreover,the reduction of the post-cyclic pullout resistance, compared tothe pullout resistance obtained in CRD tests, increases onincreasing the applied effective vertical stresses and the geo-grid tensile stiffness.� The CRD and the post-cyclic peak interface apparent coeffi-
cients of friction increase on increasing the reinforcementtensile stiffness and decrease on increasing the vertical effec-tive applied stresses (due to the dilatancy of soil at theinterface).� For the extruded geogrids the peak pullout resistance reduc-
tions, due to the cyclic tensile loads, seem to be unaffected bythe effective vertical confining pressure; on the contrary for thewoven geogrids the larger reductions were observed at thelowest confining stress (10 kPa) while the reductions decreaseon increasing the s0v.
References
Chang, D.T.T., Chang, F.C., Yang, G.S., Yan, C.Y., 2000. The influence factors studyfor geogrid pullout test. ASTM STP1379-EB. In: Grips, Clamps, ClampingTechniques, and Strain Measurement for Testing of Geosynthetics. ASTM,pp. 129–141.
Farrag, K., Morvant, M., 2000. Effect of clamping mechanism on pullout and confinedextension tests. ASTM STP1379-EB. In: Grips, Clamps, Clamping Techniques, andStrain Measurement for Testing of Geosynthetics. ASTM, pp. 89–96.
Farrag, K., Acar, Y.B., Juran, I., 1993. Pull-out resistance of geogrid reinforcements.Geotextiles and Geomembranes 12 (2), 133–159.
Fannin, J., Raju, D.J., 1993. Large-scale pull-out test results on geosynthetics. In:Geosynthetics ‘93, vol. 2. Vancouver, Canada, pp. 633–643.
Huang, C.C., Kato, N., Tateyama, M., Tatsuoka, F., Koseki, J., 2002. Seismic stability ofseveral types of retaining walls on sand slope. In: Seventh InternationalConference on Geosynthetics, Nizza, France, pp. 237–240.
Juran, I., Knochenmus, G., Acar, Y.B., Arman, A., 1988. Pull-out response of geotextileand geogrids (synthesis of available experimental data). Geosynthetics for SoilImprovement, pp. 92–111.
Kongkitkul, W., Hirakawa, D., Tatsuoka, F., Uchimura, T., 2004. Viscous deformationof geosynthetic reinforcement under cyclic loading conditions and its modelsimulation. Geosynthetics International 11 (2), 73–99.
Ling, H.I., Leshchinsky, D., Chou, N.N.S., 2001. Post-earthquake investigation onseveral geosynthetic-reinforced soil retaining walls and slopes during the Ji-Jiearthquake of Taiwan. Soil Dynamics and Earthquake Engineering 21, 297–313.
Mayer, N., Nernheim, A. and Kohler, U., 2004. Geosynthetic-soil interaction undercyclic loading. In: 3rd European Geosynthetics Conference, pp. 635–639,Munich, Germany, 01-03 March.

N. Moraci, G. Cardile / Geotextiles and Geomembranes 27 (2009) 475–487 487
Min, Y., Leshchinskyb, D., Ling, H.I., Kaliakin, V.N., 1995. Effects of sustained andrepeated tensile loads on geogrids embedded in sand. Geotechnical TestingJournal 18 (2), 204–225.
Moraci, N., Cardile, G., 2008a. Cyclic pullout behaviour of extruded geogrids. In:Eurogeo4-4th European Geosynthetics Conferences, Edinburgh, Scotland, 7–10September.
Moraci, N., Cardile, G., 2008b. Cyclic pullout behaviour of geogrid embedded incompacted granular soils. In: The First Pan American Geosynthetics Conferenceand Exhibition, Cancun, Mexico, 2–5 March 2008, pp. 852–861.
Moraci, N., Cardile, G., 2008c. Pull-out behaviour of different geosyntheticsembedded in granular soils. In: Fourth Asian Regional Conference on Geo-synthetics, Shanghai, China, 17–20 June, pp. 146–150.
Moraci, N., Montanelli, F., 2000. Analisi di prove di sfilamento di geogriglie estruseinstallate in terreno granulare compattato. Rivista italiana di geotecnica 4,5–21.
Moraci, N., Recalcati, P., 2006. Factors affecting the pullout behaviour of extrudedgeogrids embedded in compacted granular soil. Geotextiles and Geo-membranes 24 (4), 220–242.
Moraci, N., Gioffre, D., Romano, G., Montanelli, F., Rimoldi, P., 2002. Pullout behaviourof geogrid embedded in granular soil. In: Seventh International Conference onGeosynthetics, 4, Nizza, France, 22–27 September, pp. 1345–1348.
Moraci, N., Romano, G., Montanelli, F., 2003. Interface pullout behaviour of geogridsembedded in compacted granular soils. In: XIIIth European Conference on SoilMechanics and Geotechnical Engineering. 1, Prague, Czech Republic, 25–28August, pp. 837–841.
Moraci, N., Romano, G., Montanelli, F., 2004. Factors affecting the interface apparentcoefficient of friction mobilised in pullout conditions. In: Third EuropeanGeosynthetics Conference, Munich, Germany, 01–03 March, pp. 313–318.
Nernheim, A., 2005. Interaktionsverhalten von Geokunststoff und Erdstoff bei sta-tischen und zyklishen Beansprungen. Phd thesis, TU Clausthal.
Ochiai, H., Hayashi, S., Otani, J., 1992. Evaluation of pull-out resistance of geogridreinforced soils. In: International Symposium on Earth Reinforcement Practice,Fukuoka, Japan, pp. 141–146.
Ochiai, H., Otani, J., Hayashis, S., Hirai, T., 1996. The pull-out resistance of geogrids inreinforced soil. Geotextiles and Geomembranes 14 (1), 19–42.
Palmeira, E.M., Milligan, G.W.E., 1989. Scale and other factors affecting the results ofpull-out tests of grid buried in sand. Geotechnique 11 (3), 511–524.
Raju, D.J., 1995. Monotonic and cyclic pullout resistance of geosynthetic. Ph.D.thesis, University of British Columbia.
Raju, D.J., Fannin, J., 1997. Monotonic and cyclic pull-out resistance of geogrids.Geotechnique 47 (2), 331–337.
Raju, D.J., Fannin, J., 1998. Load-strain–dispacement response of geosynthetic inmonotonic and cyclic pullout. Canadian Geotechnical Journal 35, 183–193.
Sankey, J.E., Segrestin, P., 2001. Evaluation of seismic performance in MechanicalStabilized Earth structures. In: International Symposium on Earth Reinforce-ment Practice, IS Kyushu’ 01, 15 November.
Sandri, D., 1997. A performance summary of reinforced soil structures in the greaterLos Angeles area after the Northridge Earthquake. Geotextiles and Geo-membranes 15, 235–253.
Sugimoto, M., Alagiyawanna, A.M.N., Kadoguchi, K., 2001. Influence of rigid andflexible face on geogrid pullout tests. Geotextiles and Geomembranes 19 (5),257–277.
Tatsuoka, F., Koseki, J., Tateyama, M., 1995. Performance of geogrid-reinforced soilretaining walls during the Great Hanshin-Awaji Earthquake, January 17, 1995.Earthquake Geotechnical Engineering Journal, 55–62.
Tatsuoka, F., Koseki, J., Tateyama, M., 1997. Performance of reinforced soil structuresduring the 1995 Hyogo-ken Nanbu Earthquake, pp. 973–1008.
Tatsuoka, F., Koseki, J., Tateyama, M., Munaf, Y, Horii, K., 1998. Seismic stabilityagainst high seismic loads of geosynthetic reinforced soil retaining structures.In: Sixth International Conference on Geosynthetics, Atlanta, pp. 103–142.
White, D.M., Holtz, R.D., 1994. Performance of Geosynthetic-Reinforced Slopes andWalls During the Northridge, California Earthquake of January 17, 1994.Department of Civil Engineering, University of Washington, Seattle, WA.
Yasuda, S., Nagase, H, Marui, H., 1992. Cyclic pull-out test of geogrids in soils. In:International Symposium on Earth Reinforcement Practice, Fukuoka, Japan 11–13 November 1992, pp. 185–190.


