Embed Size (px)
Citation preview

Int. J. Product Development, Vol. 18, No. 6, 2013 461
Copyright © 2013 Inderscience Enterprises Ltd.
An inquiry on managers use of decision-making tools in the core front end of the innovation process
Francesco P. Appio Institute of Management, Scuola Superiore Sant’Anna, Piazza Martiri della Libertà, 33, 56127, Pisa, Italy Email: [email protected]
Sofiane Achiche* Departement of Mechanical Engineering, École Polytechnique de Montréal, C.P. 6079, succ. Centre-ville, Montréal (Québec), H3C 3A7, Canada Email: [email protected] *Corresponding author
Tim C. McAloone and Thomas J. Howard Department of Mechanical Engineering, Technical University of Denmark, B 404, Produktionstorvet, Kgs Lyngby 2800, Denmark Email: [email protected] Email: [email protected]
Abstract: This paper focuses on the Core Front End (CFE) activities of the innovation process to say, Opportunity Identification and Opportunity Analysis. In the CFE of innovation, several tools are used to facilitate and optimise decisions. To select them, managers of the product development team have to use several premises to decide which tool is more appropriate to which activity. This paper provides an overview of these mechanisms by looking inside five companies from two different countries. Those mechanisms underline the dimensions influencing the decision process before a specific tool is chosen and how those tools impact specific performance metrics. From the analyses and hypotheses testing performed, it clearly emerges that there is no link between being aware of basic requirements (inputs/outputs) to appropriately use a certain tool and dimensions such as tools’ effectiveness, difficulty in usage, frequency of usage and estimate investment for using them. Also, interesting cross-case patterns emerge.
Keywords: fuzzy front end; new product development; tools; decision making; input; output; awareness.

462 F.P. Appio et al.
Reference to this paper should be made as follows: Appio, F.P., Achiche, S., McAloone, T.C. and Howard, T.J. (2013) ‘An inquiry on managers use of decision-making tools in the core front end of the innovation process’, Int. J. Product Development, Vol. 18, No. 6, pp.461–491.
Biographical notes: Francesco P. Appio is a Doctoral Researcher of Innovation Management in Scuola Superiore Sant’Anna, Pisa, Italy where he studies issues related to radical innovations, new product development and intellectual property analysed both from quantitative and historical perspectives. He received a Master of Science in Industrial Engineering from Politecnico di Bari, Italy. He also researches topics concerning the co-creation and co-development of products and services and the decision making tools used in the fuzzy front end of product innovation.
Sofiane Achiche works as a Professor at the Department of Mechanical Engineering in École Polytechnique de Montréal, Canada. He conducted his PhD in Mechanical Engineering from École Polytechnique de Montréal. He also works in the field of evolutionary computational intelligence for control and decision support applied to engineering problems such as: emotional design, process control, measurements and mechatronic systems. His research interests focus upon understanding and modelling activities of new product development processes for decision support purposes.
Tim C. McAloone is a Professor of Product Development at the Department of Mechanical Engineering in the Technical University of Denmark. He received his PhD from Cranfield University, UK. He works closely with Danish industry, finding new methods and models for a wide range of product development issues, such as environmental issues, mechatronics, product/ service-systems, product innovation and the process of product development itself.
Thomas J. Howard is an Associate Professor of Product Development at the Department of Mechanical Engineering in the Technical University of Denmark. He received his PhD from the University of Bath, UK. His research interests cover design cognition and neurodesign, engineering design research, integrated product development, research readiness levels and robust design.
This paper is a revised and expanded version of a paper entitled ‘Assessment of tools input requirements and output potential in the core front end of new product development’ presented at the ‘2011 International Conference on Engineering Design (ICED11)’, Copenhagen, Denmark, 15–19 August 2011.
1 Introduction
The research in this paper will lead to better characterise how managers adopt and use tools during the Fuzzy Front End (FFE hereafter) of innovation. The consequences of using tools in a certain way are also studied in terms of money needed, people involved and effectiveness/efficiency tradeoffs. In order to provide a comprehensive overview, the tools’ input and the output (macro and micro) parameters influencing the selection and usage of tools should be carefully identified and assessed. Other variables, such as tools’ usage frequency, are analysed to uncover potential interdependencies and the underlying

An inquiry on managers use of decision-making tools 463
decisional flow of managers during the FFE activities. More precisely, this paper aims at understanding the impact of application practices of such tools on the FFE. To do so, we here explore in which way tools, methods, practices and techniques (referred simply as tools hereafter) are used by managers, by mapping their inputs/outputs requirements in the Core Front End (CFE) activities of innovation. Each tool is evaluated in terms of its Perceived Level of Difficulty in usage, Effectiveness, Frequency of Usage and Estimate Investment (resource allocation). A better understanding of the tools selection and use would also help shortening the concept generation time cycle to approach the downstream phases of the New Product Development (NPD) process more effectively and efficiently.
Furthermore, this study contributes to the debate among scholars on the relevance of the CFE of innovation and its impact on NPD, suggesting that adoption of tools to support decision making/creativity (referred to as decision-making tools hereafter) play a critical role (Howard et al., 2010). It is in the authors’ experience that managers do not yet have complete information to enable them to manually apply tools at the CFE. Research and practice in NPD needs to acknowledge that the selection of appropriate tools is only the antecedent of the complex and context-specific process of applying them.
In the following section we will explain what the Fuzzy Front End of Innovation is, how it can be modelled and why it is important to focus our research on the early phases of this phase. Then we will inspect how many – and which kind of – tools can be used in the preliminary phases of the FFE, how they are usually adopted and used according to which key parameters.
1.1 The fuzzy front end of innovation
Innovation is vital for companies to maintain a sustainable competitive advantage in the market. The entire innovation process can be typically broken down into a number of stages that, for parsimoniousness and reasons of disciplinary boundaries, are addressed separately in product optimisation (McAdam and McClelland, 2002). Hence, by sticking to the company level, the innovation process can be reasonably described as comprising the FFE the Product Development (PD) process and commercialisation (Koen et al., 2002).
The focus of this paper is on the FFE. The reason is straightforward: much of the early stage FFE process is not well understood or managed at the organisational level (Reid and de Brentani, 2004); even though the importance of the initial screening activity and its relationship to new product performance is recognised and has been demonstrated (Kurkkio, 2011). The front end of innovation contributes to future business potential by creating an opportunity window for new market entries or NPD activities (Kuhrana and Rosenthal, 1998; Kleinschmidt et al., 2005). The explorative nature of the FFE contributes to achieving superior, validated product concepts (Koen et al., 2001; Kim and Wilemon, 2002). Another relevant issue is that many previous studies, by considering the innovation process as a whole, have implicitly denied the very diversity of phases concerning it, not investigating the front-end phase and the new development project phase separately and generating conflicting results and causing difficulties in the

464 F.P. Appio et al.
interpretation of results. Indeed, some evidence have shown that the nature of the FFE is different from that of the NPD in terms of the characteristics of the tasks and the people involved (Koen et al., 2001) and research should therefore consider different phases of the innovation process separately (Davila, 2000).
The FFE concerns the stages from the Opportunity Identification to the Concept Definition (see Figure 1), under conditions of high market, technological and economic uncertainties and low availability of valuable information. In spite of the continuum between the FFE and the NPD, the activities in the FFE are often chaotic, unpredictable and unstructured.
Figure 1 NCD model
Source: Koen (2004)
1.2 Modelling the fuzzy front end
Two approaches are being used in the literature to depict the FFE process: sequential (Cooper, 2001) and non-sequential (Koen et al., 2002). Some general considerations about those two perspectives are needed. Linear frameworks tend to ignore the factors that govern the ability to innovate (Moenaert et al., 2000). This leads to a mechanistic interpretation and focus on process efficiency, which is inclined to ignore how process factors such as flexibility, informality, feedback and autonomy might influence innovation (Dougherty, 1992; Griffin, 1997a; Griffin, 1997b). Consequently, researchers have responded by developing recursive frameworks to understand better how these factors and resulting process behaviours are associated with different types of innovation (McCarthy et al., 2006; Howard et al., 2008). In this view, the New Concept Development model (NCD) as proposed by Koen et al. (2002), seems to be appropriate for coping with the complexity of the FFE (see Figure 1) and describes well the non-sequential activities in the FFE. In such a context comes the need for tools to help structuring, decision making or in general better handling of the NPD activities. Even though the key elements of the FFE seem to have sequential progression, they are expected to proceed non-sequentially, as shown by the looping arrows between the elements (Koen et al., 2002). In this paper, this model is used for the classification of the tools.

An inquiry on managers use of decision-making tools 465
The front end is often characterised by ad-hoc decision-making and conflicting organisational pressures (Khurana and Rosenthal, 1998). This makes mistakes hard to avoid and the search for better predictive guidelines justifiable (Kurkkio et al., 2011). However, results from the literature are conflicting: some authors suggest that idea evaluation and selection should be more rigorous in the front end of the project than in the development project itself, deploying what can be called ‘a disciplined approach’ (Koen et al., 2002); some other studies reveal a surprising degree of informality that characterises project screening in companies (Calantone et al., 1999). According to Kurkkio et al. (2011), the evaluation of experiments and calculations in the FFE are sometimes based on personal judgments and gut feeling rather than on acquired facts which further increase uncertainty. In a study by Markham et al. (2010) most respondents indicated that their companies had formal NPD processes, yet the majority of these did not include a formal pre-NPD process, where important decisions related to, for example, target markets, value propositions, product costs and product functionalities are all made (Smith and Reinertsen, 1998). Eventually, McKenna (1999) argues that managers are subjected to increasing pressures arising from this complexity. As managers make decisions, this seems to be a critical step to be aware of. Further he argues that to deal with complexity, managers must make sense of it and create ways and means of working within it.
1.3 The core front end of the NCD model
The research presented in this paper tries to explain the logic behind the decision making process used for selecting tools during the early stages (FFE) of NPD process. As the focus on the front end is mainly one of Opportunity Identification and Analysis (Kuhrana and Rosenthal, 1998), the focus of this paper will be on the CFE ‘Activity’ Elements of the NCD model (Koen et al., 2002). At this stage it is appropriate to provide some definitions: Opportunity is a business or technology gap, that a company or individual realises, that exists between the current situation and an envisioned future in order to capture competitive advantage, respond to a threat, solve a problem, or ameliorate a difficulty (Koen et al., 2002). In the context of idea generation, the literature reports that opportunity sensing is the prevalent trigger (Broring et al., 2006). Opportunity Identification is the element in which the organisation identifies opportunities that it might want to pursue; this element is typically driven by the business goals. Opportunity Identification is ongoing and can redirect the strategic plan real-time in order to respond to market forces and new technologies (Nicholas et al., 2011). The company may have a formal opportunity identification process that is aligned with the influencing factors. Alternatively, there may be informal opportunity identification activities, including ad hoc sessions, water cooler or internet discussions, individual insights, or edicts from senior management. Opportunity Analysis concerns the assessment in order to confirm that the opportunity identified is worth pursuing. Additional information is needed for translating opportunity identification into specific business and technology opportunities. Opportunity analysis may be part of a formal process or may occur iteratively (Koen et al., 2002).

466 F.P. Appio et al.
1.4 Tools in the fuzzy front end
Every NPD process has a FFE in which products and projects are defined and, in all firms, this phase involves both formal and informal activities (Kurkkio, 2011); frequently, though, companies approach the FFE without a clear definition and analysis of the process to go from opportunity identification to concepts. Many organisations do not know what information to collect; do not have the skills to capture the information, or simply hurry through the ideation and screening phases into development efforts (Flint, 2002). The current understanding is that the evaluation system for NPD projects should include both qualitative and quantitative criteria as appropriate and use methods that measure and aggregate multiple criteria (Verworn, 2009). Recent empirical, quantitative research in samples from different firms has discovered that companies use different sets of evaluation criteria at different product development gates (Savioz and Blum, 2002; Tzokas et al., 2004) and certain type of products such as mechatronics might use more specific sets (Coatanéa et al., 2007a; Coatanéa et al., 2007 b).
According to Brem and Voigt (2009), there are two ways of gaining ideas: one, collecting them in a sense that they are already present somehow, at least in the mind of a person, group or company information systems (Howard et al., 2011) or two, generating them through a well thought-out process utilising creative methods. Consequently, creative practice methods and techniques are needed to foster a continuous spirit of creative evolution (Kelley and Littman, 2005) and can be used in different fields from manufacturing to enviromental issue (Medyna et al., 2009).
According to Brady (1997), a tool may be used by specific individuals or groups within a company or may be applicable across the entire company. Within the definition suggested above, however, authors can identify a number of dimensions or characteristics by which tools can be differentiated. Clearly, there is no single or best way of classifying them. Categorisations will depend on the task at hand. The tools range from those which aim to increase the general understanding of the process of technological innovation – such as conceptual models of the innovation process – to those intended to help manage specific parts of the process. These latter, which represent the focus of this paper, typically provide assistance in: strategic decision making about in which technologies to invest, R&D project selection, new product selection, capturing customers’ needs, designing new products, promoting creativity and monitoring and controlling development projects. The different tools are often used in combination to aid in the location of problems, identification of solutions and implementation of decisions.
For each stage of the Koen et al. NCD Model (2002) several tools, such as brainstorming, mind-mapping, SWOT analysis, etc, exist and can be used by engineers/designers and managers (managers hereafter) to improve, structure and organise their decision making in the FFE context. Despite the fact that failure rates of new products remain high, there is still resistance to adopt tools and techniques to support NPD, even when these are seen as clear opportunities to improve NPD output (Njissen and Frambach, 2000). Furthermore, Nijssen and Lieshout (1995) have provided initial support for a positive relationship between the use of NPD tools and performance. However, these tools tend to be selected and used in a heuristic manner, while the way that these tools have been adopted has a big influence on the total cost of a NPD project, since 70% of project cost is determined by the decisions made during the FFE (Koen et al., 2002). Furthermore, some tools are preferred and more effective during specific phases of FFE (Commission and Innova, 2008) and according to Schilling and Hill

An inquiry on managers use of decision-making tools 467
(1998), using appropriate tools to improve the efficacy of NPD activities is a strategic imperative. It is exactly this last point that overarches in our explorative research. The use of appropriate tools implies the improvement in the efficacy dimension of the NPD process. Appropriate means that the tools’ input requirements and output potentials (input/output requirements hereafter), match the resources and the goals of the task/project. It is worth noting that inputs and outputs can be categorised as tangibles (products, spreadsheets, documents, etc.) and intangibles (ideas, information, knowledge, services, etc.) and thus the task of selecting the correct tools can be very complex.
Managers will need to consider how their traditional methods and tools will affect future process congruence and performance, bearing in mind that in terms of their size, structure and behaviours, individual NPD processes are not eternally fixed (McCarthy et al., 2006). A wide range of tools have been developed to help manage the innovation process. Many are based on academic empirical research; others have been developed in industry or by consultants working in industry (Brady, 1995).
The numerous approaches and techniques range from extremely simple, informal and intuitive approaches to very complex and formally developed statistical approaches. The former suffer in that they are not likely to handle the fuzziness of the early stages, rather than properly supporting the aim of its diverse constituting phases. The latter are deficient in that they are either too laborious or complex to be readily applied or they require information not available to smaller enterprises (Udell and Baker, 1982). Hence, the complexity of usage will be an investigated dimension as will be seen later in this paper.
Some big technology-based Japanese companies have used methods for evaluation and selection of R&D projects for more than twenty years (Danila, 1989). But, for instance, only 14% of the Japanese companies studied by Herstatt et al. (2006) applied QFD. In a study carried out by Murphy and Kumar (1997), brainstorming was cited by eleven respondents as a routine part of NPD. Respondents asserted that new product ideas frequently emerged from brainstorming sessions. Second, forecasting technological trends was cited by six respondents as being important for generating R&D ideas. Nevertheless, it appears that firms may still not be aware of the range of evaluation methods available as they are often too busy or lack knowledge of state-of-the-art tools (Garvin, 1993), nor the importance of conducting a thorough predevelopment effort. To be successful firms must develop a coherent marketing plan that delivers value to customers and captures value for shareholders. To achieve these goals, marketers must manage an expanded and complex marketing mix – using increasingly sophisticated marketing tools and practices (Institute of Marketing Science, 2010).
Literature is rich on descriptions of measurement techniques and methods, but pays less attention to the actual use of the performance results in operations and decision-making (Godener and Soderquist, 2004). New methods are difficult to learn and implement and often divert effort from other aspects of product development (Repenning, 2001). There is no doubt that for managers to increase the success rate of their new product efforts, they should master techniques for the planning, development, deployment, evaluation and control of necessary competencies throughout the NPD process, i.e. from the generation of the new idea to the launch of the product in the marketplace (Tzokas et al., 2004). A more detailed explanation of the tools reviewing process will be provided in Sections 2.3.1 and 2.3.2.

468 F.P. Appio et al.
1.5 Tools parameters
Although efficiency and effectiveness have been the two prominent parameters evaluated to set up a good market launch and get adequate payback and return on investments (Flint, 2002), new product failure rate is still high (Stockstrom and Herstatt, 2008), as for every 3000 rough ideas only 1 becomes a successful product (Stevens and Burley, 1997). This is more true once the socio-constructive lenses are adopted: if this is the case, any idea is influenced and shaped by both the internal and external contexts, from identification to market. If we consider that the internal and external context have many levels (individual, department, organisation, task environment, external environment), we argue that in the 3000 ideas generated in the FFE, the category of market and technological success (or failure) are inherent.
It is worth noting that in the context of tool usage, effectiveness means that the tool supports managers in achieving the objective of the task/activity at hand, e.g., generating ideas, selecting the best idea, gaining user insight, etc., while efficiency means that managers from different areas must find the tool very easy to use, thus saving time and costs (Baier et al., 2008).
The use of these tools is expected to expand in the future; and the best companies will simultaneously need to continue to investigate new tools while refining and rationalising their use of currently available tools (Barczak et al., 2009). The biggest weakness of these tools is their cost because they are, among other things, really time-consuming (Danila, 1989). The cost in terms of its drain on organisational and managerial resources must always be considered (Souder, 1978). The majority of these methods are completely foreign to business practice. This ought not to be the case because these methods look well beyond surface appearances and offer powerful opportunities for new insights (Flint, 2002).
Whether it is simple or complex, for a tool to work effectively there is a need for understanding, commitment and willingness on the part of users. To be effective, people have to ‘buy-in’ to a new tool. Brady (1995) suggests that basic training in idea generation techniques across the workforce should take place. Between 1995 and 1997, Zhuang et al. (1999) studied how managers perceived, facilitated and managed the idea generation process. The study targeted 300 managers from typically large companies attending management development courses in the UK. The study revealed that these managers had a low knowledge of the more popular creative idea generation techniques. Managers tend to accept only methods which they can basically understand, difficult and sophisticated selection models are hardly considered valuable in R&D project selection (Fahrni and Spatig, 1990).
Whatever system of categorisation one might wish to use, the tool selected must be appropriate to the problem; secondly, the person selecting the tool must know which tools are appropriate; thirdly, the person(s) using the tool must know how to use it and the limitations of the tool in relation to the problem. Many tools require the availability of appropriate data and documentation to support their application, and this must be geared to the level of use. Most importantly, they have to be relevant to the purpose of the business in which the tools are to be applied. Hence, the degree of complexity of use appears to be a major determinant in their application. A similar dimension is used in this paper. Initial research in the Technology Management Initiative supports the idea that the more complex and difficult a tool is to use, the less likely it is to be applied (Brady, 1995). A number of factors were identified which could usefully be developed further as a means of differentiating between types and uses of technology management tools. These included: degree of formality; extent to which the tool is for positioning,

An inquiry on managers use of decision-making tools 469
diagnostic or intervention; degree of hardness; degree of task specificity; source; extent of diffusion; intensity of use (Brady, 1995). A more detailed description of the parameters used for this research will be provided in Sections 2.3.3 and 2.3.4.
2 Research methodology
Both quantitative (Murphy and Kumar, 1997; Verworn, 2009) and qualitative studies (Brem and Voigt, 2009), have demonstrated the critical role of front end activities for product development success, though a mix of the strategies may be most appropriates especially for research of such an explorative nature (Creswell, 2009). The research methodology adopted for this research began with an explorative approach, to classify relevant tools for FFE. Fifty nine tools were assessed and considered. Tools were assessed in terms of:
Inputs: information, knowledge, procedures.
Outputs: products, services, procedures, information, knowledge.
Resources: two macro-parameters have been chosen from the analysis of the literature to describe the resource requirements: Persons and Explicit Costs. Both of them, divided into micro-parameters.
The tools were also classified according to the FFE activities for which they were used, i.e. opportunity identification and opportunity analysis (Koen, 2004), as shown in Figure 1. In order to link theory to practice, the case study methodology was chosen and carried out with two Danish and three Italian companies. The information collection was done by means of a four-step procedure. Once the data was collected, two hypotheses about decision making of managers during the CFE were formulated and tested.
2.1 Case analysis methodology
Five companies agreed to carry out and make data available for this research. These case studies are used as means to abstract the first embryonic part of a theory. The case studies are appropriate because the research question is how or why (Yin, 1989) and according to Yin (1989, p.23) a case study ‘investigates a contemporary phenomenon within its real-life context; when the boundaries between phenomenon and context are not clearly evident; and in which multiple sources of evidence are used’. This approach is legitimised as a scientific methodology with high currency, as it refers to the characteristics of research that affect the contextual relevance of findings across measures, methods, persons, settings and time, pertaining this to the generalisability of results (Bonoma, 1985). The framework by Eisenhardt (1989) also cited by Van de Ven (1989) is followed by authors to structure the use of the case analysis methodology. In order to understand the why of this research (Van de Ven, 1989) and the underlying theory of the FFE, a preliminary screening of the literature was carried out. The research focus was established around the general topic of decision support in the FFE activities. Therefore, using Koen’s NCD model the focus was put on the CFE activities, where one has to identify all tools used in these two activities, assessing them in terms of inputs, what users need to know to use each tool (mINPUT%), outputs, everything that could be obtained from using the tool (mOUPUT%) and resources (the use of monetary and non monetary resources).

470 F.P. Appio et al.
The FFE is dynamic and unstructured, making it both difficult to study and to generalise any findings (Murphy and Kumar, 1997). It follows the necessity to refer to the abstraction rather than to the generalisation. This is the case because of the explorative nature of the FFE, which requires putting emphasis on more immediate and perception-based criteria (Smith-Doerr et al., 2004). By relying on multiple case studies, abstracting is an activity by which we only become aware of similarities and links between concepts (Skemp, 1986), but almost nothing can be concluded on the side of causality. Abstraction can be thought of as the first generalisation of generalisations (Bruner et al. 1956; Vygotskij, 1962; Bruner, 1985).
2.2 Cases studies
Five companies participated in the study. From each company, an experienced manager, representing the company, participated in the four-step methodology. One of the limitations of this research can be found in that only one manager per company was surveyed and interviewed. However, this is offset by the fact that each of them has more than eight years of experience in product development and hence can be considered an expert. While this number might seem low, there is, in fact, no agreement about the sample size and no standards by which a sample size selection could be evaluated for expert participants (Lai et al., 2006). Researchers do not select informants to be representative of the members of a studied organisation in any statistical sense. Rather, they are chosen because they are supposedly knowledgeable about the issues being researched and able and willing to communicate about them (Kumar et al., 1993). Table 1 gives more information about the participants.
Table 1 Details of companies cases
Company # Location Industry Experience Representative’s role
A DK Engineering Consultancy 25 years Senior Engineer & Manager
B IT Engineering Handicraft 8 years Export Manager
C IT Plant Protection 13 years R&D Manager
D IT ICT 8 years Project Engineer Manager
E DK Healthcare 9 years R&D Innovation Manager
2.3 Crafting instruments and protocols
Multiple sources of data were used to increase validity and reduce bias. These sources were in the form of questionnaires, semi-structured interviews and secondary data such as existing literature on the subject. The four-step methodology for data collection used is explained in detail in the following subsections.
2.3.1 Step 1: Tools reviewing
The aim of the step 1 is to map the tools’ usage inside the companies’ practices and processes and to discover other tools that did not emerge from the literature review or special combinations of tools the managers might use. From the literature review many tools used in the CFE emerged. A clustering of these tools was carried out in order to ease their analysis and assessment. Some of the tools utilised in the Opportunity
An inquiry on managers use of decision-making tools 471
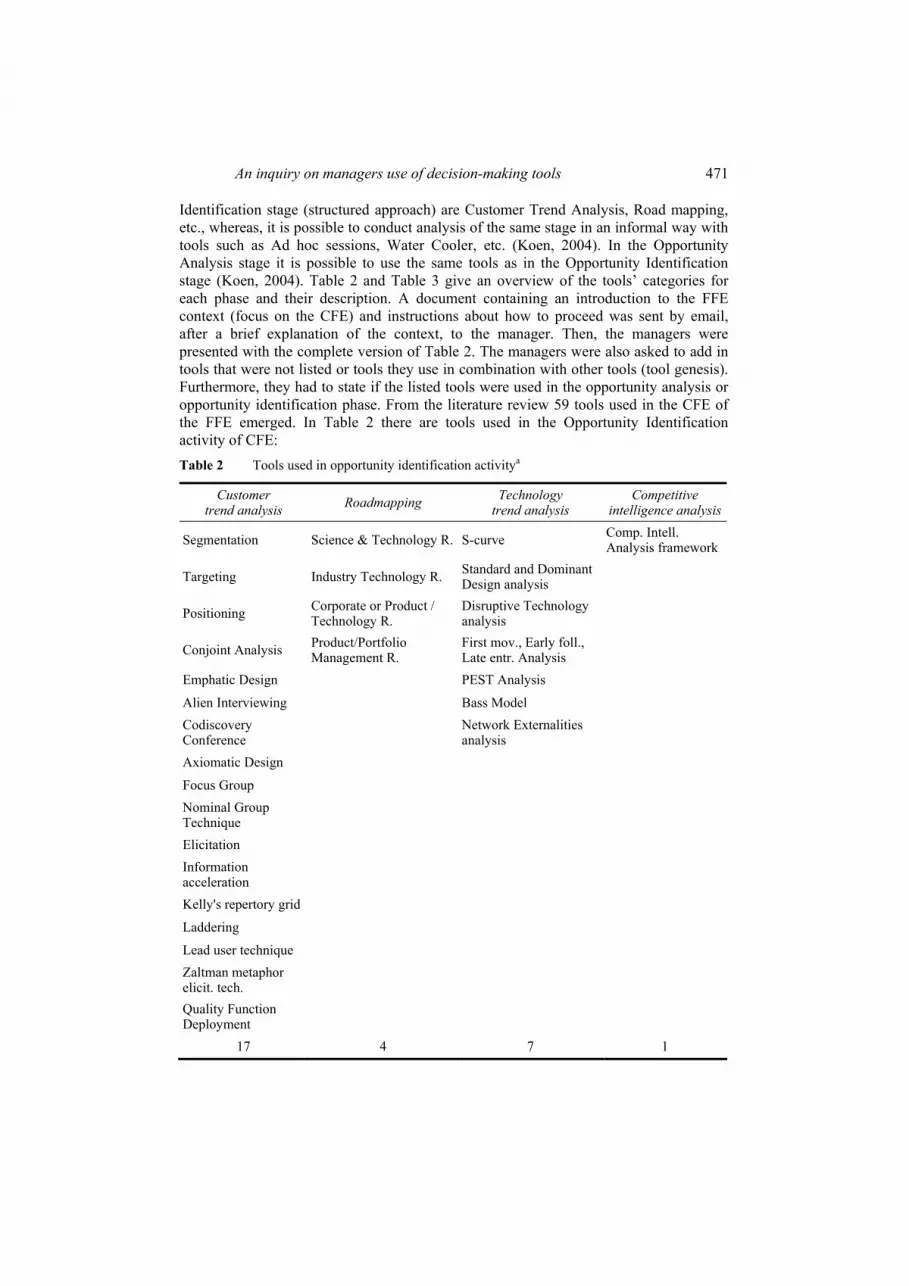
Identification stage (structured approach) are Customer Trend Analysis, Road mapping, etc., whereas, it is possible to conduct analysis of the same stage in an informal way with tools such as Ad hoc sessions, Water Cooler, etc. (Koen, 2004). In the Opportunity Analysis stage it is possible to use the same tools as in the Opportunity Identification stage (Koen, 2004). Table 2 and Table 3 give an overview of the tools’ categories for each phase and their description. A document containing an introduction to the FFE context (focus on the CFE) and instructions about how to proceed was sent by email, after a brief explanation of the context, to the manager. Then, the managers were presented with the complete version of Table 2. The managers were also asked to add in tools that were not listed or tools they use in combination with other tools (tool genesis). Furthermore, they had to state if the listed tools were used in the opportunity analysis or opportunity identification phase. From the literature review 59 tools used in the CFE of the FFE emerged. In Table 2 there are tools used in the Opportunity Identification activity of CFE:
Table 2 Tools used in opportunity identification activitya
Customer trend analysis
Roadmapping Technology trend analysis
Competitive intelligence analysis
Segmentation Science & Technology R. S-curve Comp. Intell. Analysis framework
Targeting Industry Technology R. Standard and Dominant Design analysis
Positioning Corporate or Product / Technology R.
Disruptive Technology analysis
Conjoint Analysis Product/Portfolio Management R.
First mov., Early foll., Late entr. Analysis
Emphatic Design PEST Analysis
Alien Interviewing Bass Model
Codiscovery Conference
Network Externalities analysis
Axiomatic Design
Focus Group
Nominal Group Technique
Elicitation
Information acceleration
Kelly's repertory grid
Laddering
Lead user technique
Zaltman metaphor elicit. tech.
Quality Function Deployment
17 4 7 1

472 F.P. Appio et al.
Table 2 Tools used in opportunity identification activitya (continued)
Market Research
Scenario Planning
Potential Problem/ Opportunity Analysis
Opportunity Balance Matrix
Porter’s five forces Scen. Plann. Framework PPOA Framework OBM framework
SWOT analysis
PEST analysis
Blue Ocean Strategy analysis
Boston Consulting Group matrix
General Electric matrix
Value appropriation
Forecasting and time series analysis
Delphi method
9 1 1 1
Notes: aThe complete list of tools and related references is available on request.
Table 3 Tools used in opportunity analysis activitya
Team building Creative thinking Investment analyses Analytic hierarchy process
Team building strategies
Brainstorming Invest. analyses framework
AHP framework
Brainwriting
Mind Mapping
Six Thinking Hats (STH)
Provocation Operation (PO)
Random Word
Lateral Puzzles
Elementary Pragmatic Model (EPM)
Analogical Thinking
Synectics
Morphological analysis
Hexagons
TRIZ
1 13 1 1
Notes: aThe complete list of tools and related references is available on request.
2.3.2 Step 2: Mapping inputs and outputs
This step is a semi-structured interview that was carried out face-to-face (onsite at the companies), or via Video Conference. The semi-structured interview approach used the

An inquiry on managers use of decision-making tools 473
last incident method as a starting point, followed by more specific questions about key FFE parameters, to finally end with questions about the tools. The aim of this step is to get an in depth description of the environment in which the interviewee operates, to release further comments about step 1, to understand if the process is structured or not and to draw a comprehensive mapping of the inputs and outputs of tools.
After the assessment of the usage of tools by the managers, a qualitative assessment is performed by the authors in terms of inputs and outputs. This step was carried out for all the 59 tools considered in this research. For example, by analysing the literature about the Scenario Planning tool (Wheelwright and Clark, 1992; Ringland, 2006), 31 relevant characteristics on the inputs side (i.e. all characteristics a decision maker must know before selecting and using it) and ten relevant points on the outputs side (i.e. all that the use of this tool can address, its potential outcomes) emerged.
We calculated a matching coefficient index. The coefficient helps to compare the managers’ statements about tools input/output requirements with what has been found in the literature, with the aim to understand if they adopt and use those tools consistently and appropriately. The matching coefficient is calculated by means of the formula shown in equation (1).
# _%
_#_
manager requirementsm
total requirements (1)
The denominator indicates the total number of requirements for either the inputs or outputs, whilst the numerator indicates how many of those requirements have been covered by the statements and descriptions provided by managers regarding each tool.
Five intervals were set up according to the level of matching m%; this will help turning a numerical value into a semantic meaning:
If m% ≤ 0,2 (low matching =1 ).
If 0,2 < m% ≤ 0,4 (low-to-mid matching = 2).
If 0,4 < m% ≤ 0,6 (mid matching = 3).
If 0,6 < m% ≤ 0,8 (mid-to-high matching = 4).
If m% > 0,8 (high matching = 5).
In the following sections the use of the matching index and how it is compared to the investigated dimension of tools’ Difficulty of Usage will be investigated.
2.3.3 Step 3: Usage intensity and parameters assessment
This step was carried out via email. In this part the manager stated the use intensity of each tool using a five-point Likert scale. This was followed by an assessment of the macro-parameters and micro-parameters), with a focus on the rate incidence (%) given by the interviewee during the interview. The aim of this step is to formalise results about the usage of resources implied by adopting a specific tool.
After these three steps, the results were summarised in a matrix called Final Evaluation Card (see Figure 2) this is composed of two axes, the vertical one for indicating the parameters’ weights and the horizontal one to represent the use intensity;

474 F.P. Appio et al.
two grids are constructed to obtain the Estimate Investment (qualitative evaluation) related to a single tool. For each tool selected by the manager an evaluation card was filled in.
Figure 2 Final evaluation card (FEC) (see online version for colours)
The FEC allows for the calculation of the Estimate Investment (EI) per tool according to the following formula:
7
1 1
k
i jk EIi j
w l l
(2)
where:
i = 1…7 (micro-parameters in the FEC).
j = 1…5 (Use Intensity levels).
k = the selected Use Intensity level in the FEC.
wi = micro-parameters’ weights.
ljk = resultant use intensity level with the cumulative function.
lEI = Estimate Investment level.
The cumulative summation was adopted so that the real weight of each level was better represented (instead of linear evolution). On a scale showing the low-level to high level, in reality the value for low-to-mid-cell is 3 and not 2 as shown, the same goes for the mid-cell as it is 6 and not 3, etc. The approach described above was carried out for each company and tool and used to build up the data sets.

An inquiry on managers use of decision-making tools 475
2.3.4 Step 4: Tools’ usage preference and frequency
This last step was implemented after a preliminary analysis of the previous ones were carried out. It was conducted in the form of online survey, by asking managers questions about tools’ Effectiveness, Frequency of Usage and Perceived Level of Difficulty in usage. It is worth noting that Frequency of Usage should not be confused with Use Intensity. The first concerns how many times a certain tool is selected to be used while the second, concerns the intensity to which a certain tool is used by referring to working hours, training, professional background, things to use, utilities, sw/hw and incentives. Each tool was evaluated individually and not relatively to each other. The online survey asked, each respondent, questions concerning tools selection and use in the context of their company. It consisted of the following three statements:
1 For each tool listed below, please assess its effectiveness in carrying out activities during the CFE, where 1 indicates ‘lowest effectiveness’ and 5 indicates ‘highest effectiveness’.
2 For each tool listed below please indicate the Tool's frequency of usage, where 1 indicates ‘lowest frequency of usage’ and 5 indicates ‘highest frequency of usage’.
3 For each tool listed below please indicate the level of difficulty in using the tool, where 1 indicates ‘Very low level of difficulty’ and 5 indicates ‘high level of difficulty’.
3 Analyses, hypothesis testing and results
This section explains in detail the analysis made within the case and the search for cross case patterns. This analysis led to the building of the theoretical model and its hypotheses.
3.1 Within-case data analysis
The recordings of each interview were transcribed and the relevant information to the context of analysis was selected to find out relevant trends. Then the data of Steps 1 and 3 were combined with findings that emerged during the interview (Step 2). This process led to an assessment of the tools in terms of the level of a quantitative investment required to use each tool. After the assessment of the usage of tools by the managers, a qualitative assessment is performed by the authors in terms of input/resources/output, an example is shown in Table 4.
Once all the tools were characterised, the authors carried out a classification of inputs, outputs and resources with the aim to uncover cluster dimensions (macro and micro parameters). The parameters that better depicted the resources consumption for tools usage were defined. The classification carried out by the authors gave the following results:
Persons
o Working hours
o Training
o Professional background

476 F.P. Appio et al.
Explicit costs
o Things to use
o Utilities
o Software/Hardware
o Incentives
Table 4 Tools characterisationa
Tool Inputs Resources Outputs
Customer trend analysis
Category appraisal (Segmentation)
Opportunity Identification
– customer-based approach
– product-based approach
– dependent variables
– independent variables
– questionnaire
– interview
– techniques
– PERSONS
– working hours
– time to decide what data will be collected,
– time to decide how data will be gathered
– …
– training
– professional background
– marketing analysts
– customer service analysts
– EXPLICIT COSTS
– things to use
– audio recorder (for interview)
– utilities
– complete definition of each segment
– profile of each segment
Notes: The complete list of tools and related characterisation is available on request.
In the first macro-parameter (Persons), ‘Working hours’ refers to the hours dedicated from workers e.g., to select participants in workshops, to collect data, to analyse results, etc. ‘Training’ refers to the necessary amount of hours to give adequate instructions, information or knowledge in order to perform a particular role e.g., in the conduction of a brainstorming session, etc. ‘Professional background’ is a qualitative parameter, but it is possible to transform it in a quantitative one by means of simple data manipulations for instance comparing the background of the participant in comparison to what would be needed to use the tool efficiently, for example in order to use tools about category appraisal efficiently, the participant should have marketing analysts background and customer service analysts skills. The second macro-parameter is Explicit Costs, where ‘Things to use’ refers to things such as paper, pens, pencils, audio recorder, etc., that could be needed during the use of a specific tool. ‘Utilities’ refers to room availability,

An inquiry on managers use of decision-making tools 477
internet connection, whiteboards, tables, etc. while ‘Software/hardware’ is related to the use of things such as Office suite, printers, etc., as support to the decisions. Finally, ‘Incentives’ refer to financial incentives to participate and/or adopt a specific tool.
3.1.1 Data analysis per company
Each company analysis was treated as a standalone case. In this section, the analysis of the results obtained for Company A is explained in detail, followed by a summarised analysis of the results obtained for companies 2–5. It is worth noting that only 62% of tools were selected by managers. Of the remaining 38%, up to one third (13%) were not selected because unknown; the rest (25%) were not selected notwithstanding they were known. To the latter category belong tools that were not used as they had just been used by the upstream companies (this is the case of Companies A and D). Just a consideration pertaining the highest number of tools that Company D uses in its CFE activities: it is mainly because its business is quite complex and, as such, it requires much more structure and tools to make decisions and accomplish the objective of recognising and analysing opportunities to stay ahead of competition. That said, Figure 3 illustrates the conjoint effects of the 4 dimensions under study i.e. Effectiveness (Eff), Frequency (Freq), Level of Difficulty (Diff) and Estimate Investment (EI) obtained for Company A.
Figure 3 Company A’s dimensions evaluations (see online version for colours)
Tools that are at the same time highly effective, extremely costly and highly used are Ideal Concepts, Brainstorming and DFX (Design for X) methods: these tools require high investment, but were known to be effective. To be more precise, the Brainstorming and DFX tools require a mid-to-high investment. Also, although someone would expect that Brainstorming is a low investment tool, this is not the case for Company A: our analyses reveal that the estimate investment is high because of the high score on the parameter ‘working hours’ and ‘professional background’. Moreover, they are the least difficult tools to use. Hence, managers might be encouraged to use them frequently in their CFE activities. SWOT analysis, QFD and especially KJ-method, are low in terms of estimate investment required. However, QFD is not perceived to be so effective, which might be due to the fact that it is difficult to use. In fact, SWOT is used as a standalone tool but not

478 F.P. Appio et al.
very frequently, whereas KJ-method is used more frequently but usually in combination with Brainstorming. QFD is used in combination with Product Family Master Plan (PFMP) or Ideal-Concepts. That might be the reason why it is used less frequently than the others. TRIZ is perceived as the most difficult tool to use and this may be the reason why it is less frequently used. Moreover, when used, it has a moderate effectiveness and is generally used in combination with Brainstorming. Even though PFMP is one of the most difficult tools to use, it is also one of the most used and effective while requiring a moderate investment. It is also usually used in combination with QFD. Analogical Thinking, Mind Mapping are the least effective and least used tools. They are however used in combination with Brainstorming and only perform a supporting role which could explain their performance. In order to extract possible patterns in the decision making process, a similar analysis, as presented above, was performed for each of the four remaining companies. Figures 4, 7 and 8, illustrate the evaluations of the 4 dimensions for each of them.
Figure 4 Company B and C’s dimensions evaluations (see online version for colours)
Figure 5 Company D’s dimensions evaluations (see online version for colours)

An inquiry on managers use of decision-making tools 479
Figure 6 Company E’s dimensions evaluations (see online version for colours)
Figure 7 Dimensions aggregate analysis (reported % regarding 4–5 group only) (see online version for colours)
At this stage we calculate how many times (%) the evaluation scale (1, 2, 3, 4, 5) occurs on each level of the four dimensions cited above, and then we cluster them into two groups as follows:
1 the first containing scores 1, 2 and 3 on each dimension: this represents the low to moderate levels of the considered dimension;
2 the second containing scores 4 and 5: this represents high levels of the considered dimension.
This, allows us to get an aggregate view of how managers in Companies A–E gave their evaluations on the four dimensions, which is explained in the following paragraphs.

480 F.P. Appio et al.
Results from Company A show that 64% of tools were evaluated as highly effective; 55% of them are used very often. 73% of tools are judged to be moderately easy to use. Finally, 73% of tools require a low to moderate investment. Results from Company B show that all tools used in the FFE phase (100%) are highly effective; almost all of them (90%) are used frequently. More than a half (60%) of all tools are considered difficult to use. Finally, only 10% of all tools require a low to moderate investment. Company C results highlight that the majority of tools (80%) are not so effective in coping with FFE activities; half of all tools are used very frequently. More than a half of them (60%) are perceived to be difficult when used. Furthermore, all tools require a high investment. Company D results highlight that 78% of tools used in the FFE phase are not effective; many tools (63%) are not frequently used. More than three quarters of the tools (78%) are difficult to use once selected. Finally, approximately two thirds of all tools (63%) require a low to moderate investment. Results obtained for Company E show that 60% of all tools are very effective; but only a 40% is used frequently. About 60% of all tools are perceived as difficult to use. The majority of tools (80%) do not require high investment.
3.2 Searching for cross-case patterns
The comparative analysis between the five companies was only carried out with reference to the use, selection and dimensions of tools. Even though a description of the context in which they operate has been provided, that was not the object of this analysis. However, what has clearly emerged is that there are many common patterns in the use of tools, despite the companies being fundamentally different. Companies tend to use some of the tools only in the Opportunity Identification stage or the Opportunity Analysis stage. To make things concrete, by considering e.g., Company E, it uses 14 out of 27 tools either in Opportunity Identification or in Opportunity Analysis stage. Some tools, instead, are used in both stages, thus validating previous research (Koen, 2004), stating that all tools can be used in both stages of the CFE. For instance, Company A uses 90% of their tools in both of the stages, whereas Company D uses 40% of theirs in both the first and the second stage. From Steps 1–3 some interesting trends emerged. Tools in the Creative Thinking, Market Research and Customer Trend Analysis categories were used most, while 38% of the characterised tools were never selected. From steps 3 and 4, and from the description in the Section 4.1.2, Companies B and D show opposing tendencies. On the one hand, Company D has all the studied dimensions belonging to the group low to moderate. It considers the tools used in the CFE not so effective; hence not using them so frequently which, as a result, impacts moderately on the available budget and thus finds it difficult to apply the tools correctly. On the other hand, Company B has all the dimensions belonging to the group set to high (4 and 5). Companies 1 and 3 behave nearly in a complementary way, by having Company A effectiveness and frequency of usage dimensions set at a high level and Company C, at a low level; et contra for the other two dimensions. In other words, one could say that Company A considers tools used in the CFE activities very effective and it is reasonable to think that this is the reason why it uses them frequently. Another incentive for using them frequently may be the perceived ease of usage. Additionally, from this explorative analysis, it was possible to investigate the genesis of new tools. These occurred in three distinct situations:

An inquiry on managers use of decision-making tools 481
When companies use tools in combination with another one.
When companies customise the tools usage to their specific needs.
Tools directly stated by managers and not reported by authors.
Managers’ choices highlighted some interesting trends about the tools categories. They use more frequently the tools belonging to the following categories:
Creative Thinking.
Market Research.
Customer Trend Analysis.
As one can easily notice from Table 5 the average score reached by each tools category, concerning the awareness on both inputs (minput%) and outputs (moutput%), is rarely greater than 2, meaning that they sway from low to very low. Instead, the Perceived Level of Difficulty, the Effectiveness, Frequency of Usage and Estimated Investment are on average around Level 3, except for Competitive Intelligence Analysis and Analytic Hierarchy Process tools categories that reach Level 4.
Table 5 Tools categories analysis
minput% Effect. Freq. Us. Difficulty Est. Inv. moutput%
Tools category*
Customer trend analysis 2 4 4 3 4 2
Road mapping 2 3 3 3 4 1
Technology trend analysis 1 2 1 3 3 1
Competitive intelligence An. 1 4 4 4 4 3
Market research 2 3 3 3 3 1
Scenario planning 2 3 3 3 4 2
Creative thinking 1 3 3 3 3 1
Investment analyses 1 3 3 3 4 3
AHP process 2 4 4 4 4 2
Average 1,56 3,22 3,11 3,22 3,67 1,78
Notes: *measured by using 5-point Likert scale (1 = Low, 2 = Low to Mid, 3 = Mid, 4 = Mid to High and 5 = High).
A comparison of the tools’ usage based upon the tools that are used by all the 5 companies is carried out. The tools that were selected by all the managers as being used during their CFE activities are the following:
Brainstorming
SWOT Analysis
Mind Mapping
Science & Technology Road mapping
Corporate or Product Technology Road mapping
Category Appraisal

482 F.P. Appio et al.
From Table 5, again one can notice that all these tools are used with a low level of awareness (level 2 is the maximum obtained), both on the input and output sides, with the exception for SWOT Analysis whose awareness is on average around 3 (not considering assessment given by Company D).
By evaluating the inputs/outputs awareness against the perceived difficulty in usage, some contrasting behaviours emerge: there are managers who, despite the low awareness and knowledge about tools’ inputs and outputs, state they are not difficult to use when making decisions; there are others, instead, who state their difficulty in using certain tools in their decision processes, mostly due to their low knowledge. The former situation is more common, then more interesting for this study to investigate.
From Table 6 it is possible to single out some contrasting behaviours: one can easily calculate the distance between the assessments for each pair of companies, on each tool, on each parameter. More formally:
|Vi – Vj|p = the cognitive distance (always ≥ 0) between the values V given to the parameter p by each pair of company i and company j
i,j=1, 2, ..., 5 with i identifying rows and j columns
p=minput%, moutput%, Difficulty, Effect, Freq_Us, Est_Inv with p standing for parameters.
We obtain the following string:
(|Vi – Vj|minput%, |Vi – Vj|moutput%, |Vi – Vj|Difficulty, |Vi – Vj|Effect, |Vi – Vj|Freq_Us, |Vi – Vj|Est_Inv)Ci – Cj
The more 0s we get, the more similar the particular tool use is between the companies. For instance, by considering the tool Brainstorming, managers of Company 1 and Company 2 assessed it against the aforementioned parameters providing us with the following strings (minput% = 2, moutput% = 1, Difficulty = 1, Effect = 5, Freq_Us = 5, Est_Inv = 4)C1 and (minput% = 1, moutput% = 3, Difficulty = 4, Effect = 5, Freq_Us = 4, Est_Inv = 4)C2, respectively, then we can go on calculating the differences |Vi – Vj|p obtaining the resulting string (|2–1|, |1–3|, |1–4|, |5–5|, |5–4|, |4–4|)=(1, 2, 3, 0, 1, 0)C1 – C2; we get two 0s, this meaning that Company 1 and Company 2 uses the Brainstorming tool 2/6≈33% in the same way.
These differences represent the cognitive distance in the assessment of tools’ critical dimensions. This is to highlight how diverse is the assessment made by managers in different companies, once a certain tool is used. A question then arises: how can managers formulate a consideration about the tools difficulty in usage when they do not know much about its characteristics? Let’s focus on the Perceived Level of Difficulty dimension. Of course the moderate to high levels of perceived difficulty stated by managers’ signal that something has to be known before the system is used; but they select tools and use them! The paradox is that even though they are not well-aware of the inputs and outputs, they use them regardless of their peculiar characteristics (inputs, outputs). Due to the low awareness on both inputs and outputs side, we could argue that judgements formulated have little to no foundation. Tools, in different contexts, in the hands of different managers, are often used differently.

An inquiry on managers use of decision-making tools 483
Table 6 Cross-company tools analysis
Brainstorming C1 C2 C3 C4 C5
C1
C2 (1, 2, 3, 0, 1, 0)
C3 (0, 0, 2, 2, 0, 1) (1, 2, 1, 2, 1, 1)
C4 (1, 0, 0, 2, 1, 2) (1, 2, 1, 2, 0, 2) (1, 0, 2, 0, 1, 3)
C5 . . . .
SWOT analysis C1 C2 C3 C4 C5
C1
C2 .
C3 (1, 1, 2, 0, 1, 3) .
C4 (2, 1, 0, 1, 2, 2) . (3, 2, 2, 1, 1, 1)
C5 (0, 1, 1, 1, 3, 2) . (1, 0, 3, 1, 2, 1) (2, 2, 1, 0, 1, 0)
Mind Mapping C1 C2 C3 C4 C5
C1
C2 .
C3 (0, 1, 1, 1, 2, 3) .
C4 (1, 1, 0, 0, 0, 0) . (1, 0, 1, 1, 2, 3)
C5 . . . .
S&T Road Map C1 C2 C3 C4 C5
C1
C2 .
C3 . (0, 0, 1, 1, 0, 2)
C4 . (1, 0, 0, 1, 1, 1) (1, 0, 1, 0, 1, 1)
C5 . . . .
C/PT Road Map C1 C2 C3 C4 C5
C1
C2 .
C3 . (0, 0, 0, 3, 2, 0)
C4 . (1, 0, 2, 1, 1, 1) (1, 0, 2, 1, 1, 1)
C5 . . . .
Cat. Appraisal C1 C2 C3 C4 C5
C1
C2 .
C3 . .
C4 . (1, 0, 2, 0, 0, 1) .
C5 . (0, 1, 2, 0, 1, 1) . (1, 1, 0, 0, 1, 0)
484 F.P. Appio et al.
The results from this study question a vast range of previous work based on tools which have taken for granted both the dynamics of tools adoption and their use (Urban and Hauser, 1993; Schilling and Hill, 1998; Componation and Farrington, 2000; Njissen and Frambach, 2000; Driva et al., 2001; Maylor, 2001; Phelps et al., 2001; González and Palacios, 2002; Thia et al., 2005; Chai and Xin, 2006; Corso et al., 2007; Sheu, 2009) – among many others. The risk is to shape the company’s context of the decision making process for tool selection and usage, based on what could be the management’s arbitrary approximations. The routine could become less effective and the subsequent projects could be negatively influenced by the previous cumulated errors. Appropriate tools become a strategic imperative if and only if they are known and selected not heuristically by managers.
Another interesting thing to highlight is the type and number of tools combinations. For instance, Company 4 uses the PEST analysis by combining its characteristics with those of SWOT and Five Forces or rather, C1 uses the Brainstorming as support for making decisions together with Mind Mapping, Analogical Thinking, TRIZ and KJ Method. It is important to notice that plenty of tools are used in combination and some tools seem to be the input for the others. These can be called tools chains. Making some conjectures, tool combinations could be used to erase a gap in one or more of the tools involved; or, rather, one tool could not be simply used alone because the company’s decision making routine imposed that combination or eventually, managers have been trained in using them together to produce more reliable decisions. Again, combinations seem to be highly context and contingent dependent. Future research might investigate this aspect as well.
3.3 Shaping and testing hypotheses
The building of a theoretical model underpinning the selection and use of the tool, given the input data, output data, consumption of resources and evaluations about tools perceived effectiveness, frequency of usage, perceived level of difficulty and estimate investment, is the long-term objective of this research. At this stage, the aim is not generalising the theoretical model but rather to abstract it. Analyses of subsequent cases to the ones considered could test the model later on. By considering the observations made in sections 3.1 and 3.2, the following two hypotheses emerged:
H1: There is a link between mOUTPUT% and the critical dimensions to say, tools Effectiveness, Perceived Level of Difficulty, Frequency of Usage and Estimate Investment.
H2: There is a link between mINTPUT% and the critical dimensions to say, tools Effectiveness, Perceived Level of Difficulty, Frequency of Usage and Estimate Investment.
By calculating the nonparametric Spearman’s rank-order correlation coefficient (for small samples), and by considering the correction factor related to tied observations (Siegel and Castellan, 1988), the test of hypotheses on Spearman’s coefficients calculated (two tailed) was carried out. The null hypothesis is ‘H0: there is no association between X and Y’ and the alternative being ‘H1: there is association between X and Y’.
Accepting the H0 for the majority of the cases, and by considering the most embryonic qualitative similarities, from Table 7 we can abstract the following tentative

An inquiry on managers use of decision-making tools 485
trend: in the mind of managers there seems to be no link between the tools awareness on both input and output sides and the critical dimensions that the literature discusses being in the background.
Table 7 Testing for the association between inputs/outputs and dimensions
Link C1 C2 C3 C4 C5
Cronbach’s alpha 0.78 0.66 0.68 0.59 0.80
mINPUT% Effectiveness –0.18 0.08 0.74** –0.08 0.17
Frequency of Usage –0.29 0.00 0.28 –0.36* 0.46
Perceived Difficulty –0.20 –0.43 –0.26 0.00 –0.83*
Estimate Investment 0.35 0.04 . –0.20 0.82*
mOUTPUT% Effectiveness –0.04 0.45 0.11 0.37* –0.88**
Frequency of Usage 0.08 0.39 –0.32 0.17 –0.65
Perceived Difficulty 0.00 0.22 0.48 0.23 0.29
Estimate Investment 0.35 –0.15 . 0.20 0.35
Notes: **p < .05, * p < .10.
Elaboration with STATA 10.
However, some interesting insights can be grasped from the few significant associations. We might argue that for Company 5, H1 is supported as on the input side there is a negative association between mINPUT% and the Perceived Level of Difficulty (the Perceived Level of Difficulty tends to significantly decrease when the inputs awareness increases) and a positive association with the Estimate Investment (increasing the awareness on the tools’ inputs, requires an increase in the estimate investments). On the output side, there is a strong negative association between mOUTPUT% and Effectiveness (the tools’ effectiveness decreases when the output awareness increases). The latter, being a quite counterintuitive result: the more the manager in this company increases his/her knowledge about what can be obtained from using certain tools, the more the effectiveness deriving from their usage decreases; this can suggest that in Company 5 a certain degree of freedom in tools’ usage may be of help in achieving the objective of the task/activity at hand.
Company 4 shows a negative association between mINPUT% and the Frequency of Usage (the frequency of usage tends to slightly decrease when the awareness on the input sides increases). This result is counterintuitive as well; a possible explanation is that the more managers at Company 4 acquire knowledge of the tools’ requirements, the more they become aware of their limitations and the more they tend to combine them with other tools; and as the time goes by, the original well known tool, becomes unstructured or absorbed in a hybrid tool stemming from the combination. On the output side the only slightly significant positive association is with the Effectiveness, exactly the contrary of the Company 5. A quite significant positive association is present for Company 3 on the input side only; specifically, between mINPUT% and Effectiveness: the more managers become familiar with tools’ requirements, the higher the probability to exploit their full potential. The clearest association emerging on both input and output is with the tools’ Effectiveness.
However, in order to further validate the model and test other observed hypotheses one needs to survey more managers in order to have more diversified data.

486 F.P. Appio et al.
4 Conclusion and managerial implications
Two hypotheses describing the relationships between four dimensions governing the managers’ tool selection were developed and studied for validity. A four-step methodology was used to gather data from five companies from which interesting conclusions were drawn. The use of tools is not free from cognitive processes as they are not applied automatically and rationally. This aspect has to be taken into account especially when those processes can impact quantitative measures such as cost and time. The obtained results in this research show that tools are used differently in each context. This could be related to the influence of the context in which managers/designers adopt such tools, leading to different decisions and different ways to cope with the CFE activities. As tools are used consistently with the context in which managers/designers operate, tool-oriented analysis across firm/industry are very challenging. It is however possible to study tool adoption and usage within the context of a single company. Of course, researchers can address questions about what kind and how many tools are used in a certain firm/industry (this can be done with a cross-firm/industry perspective), without making reference to the appropriateness of their selection and use. It follows that the use of appropriate tools cannot be considered a strategic imperative with the peculiarity of being generalisable, rather it might be considered as such only within the context of a single company. This, in turn, would make impossible any kind of cross-company study. Since tools cannot be evaluated in objective terms, nothing can be concluded about the process of selection of appropriate tools and the same goes for the downstream implementation stage. The link between the selection of the appropriate tools and the subsequent effectiveness of the NPD process cannot be supported because of the subjectivity level of tools selection, adoption and usage process. It is no longer sufficient to say that tools have to be used to improve NPD activities; rather what has to be investigated is their adoption and usage by managers. Especially when, as highlighted in this study, there is a significant difference between what theory reports as what managers should use and what they usually use in their context.
Future work has to be carried out, by evaluating other critical dimensions and putting them against each other to explore the opportunity of building a theoretical model of the managers’ flow of decision making. To reduce the probability of bias, more managers should be interviewed, ideally investigating the decisional flow by being next to the manager in its daily decision making, to have a closer look at the phenomenon. Finally, other interesting analyses can be undertaken by taking into account the combinations of tools used by mangers and their determinants and affects on the effectiveness of the NPD process, especially in the early stages.
This explorative study highlights the importance for managers to be aware of peculiar characteristics of tools they usually use in their decision making activities. Not taking into account those basic requirements may nullify the assumption upon which is posed the link between tools selection and efficacy of the NPD process as a whole. Using appropriate tools is decisive to make right decisions. Avoiding personalisation in tools usage and standardising/systematising their adoption process (even in combination) may be of help for making the fuzzy front end much less fuzzy.
Findings point to the relevance of the context of use, as we found no support to the idea that understanding and selecting the appropriate tools to assist front end activities streamlines the innovation process. Application is extremely context specific: personalisation and adaptation play an important role, deviating results of adoption from

An inquiry on managers use of decision-making tools 487
expectations. As companies find their own way to navigate the fuzzy front end waters of innovation, the personalised application of standardised tools leads to unexpected and context specific results. Given managers’ contrasting behaviours in selecting decision making tools, what can be done to make them aware of the importance and relevance of the problem? How can researchers undertake tools-oriented studies if those who use them do not know the tools’ fundamentals? A potential solution might be that of using e.g., Decision Support Systems which compensate for managers’ lack of tools knowledge, or difficulty in recalling all the tools’ characteristics when they need them.
Acknowledgements
The authors want to thank all the participants to the cases conducted in this paper.
References
Baier, M., Graefe, G. and Roemer, E. (2008) ‘Selecting promising business ideas for innovative IT services’, European Journal of Innovation Management, Vol. 11, No. 4, pp.560–576.
Barczak, G., Griffin, A. and Kahn, K.B. (2009) ‘PERSPECTIVE: trends and drivers of success in NPD practices: results of the 2003 PDMA best practices study’, Journal of Product Innovation Management, Vol. 26, No. 1, pp.3–23.
Bonoma, T. (1985) ‘Case research in marketing: opportunities, problems, and a process’, Journal of Marketing Research, Vol. 22, No. 2, pp.199–208.
Brady, T. (1995) Tools, Management of Innovation and Complex Product Systems, Working Paper No. 3, CoPS Publication.
Brady, T. (1997) ‘Tools for technology management: an academic perspective’, Technovation, Vol. 17, No. 8, pp.417–426.
Brem, A. and Voigt, K. (2009) ‘Integration of market pull and technology push in corporate front end and innovation management - insights from the German software industry’, Technovation, Vol. 29, No. 5, pp.351–367.
Broring, S., Martin Cloutier, L. and Leker, J. (2006) ‘The front end of innovation in an era of industry convergence: evidence from nutraceuticals and functional foods’, R&D Management, Vol. 36, No. 5, pp.487–498.
Bruner, J. (1985) ‘Vygotsky: a historical and conceptual perspective’, in Wertsch, J. (Ed.): Culture, Communication, and Cognition: Vygotskian Perspectives, Cambridge University Press, New York, USA.
Bruner, J., Goodnow, J. and Austin, G. (1956) A Study of Thinking, Wiley, New York, USA.
Calantone, R., Di Benedetto, A. and Schmidt, J. (1999) ‘Using the analytic hierarchy process in new product screening’, Journal of Product Innovation Management, Vol. 16, No. 1, pp.65–76.
Chai, K. and Xin, Y. (2006) ‘The application of new product development tools in industry: the case of Singapore’, IEEE Transactions on Engineering Management, Vol. 53, No. 4, pp.543–554.
Coatanéa, E., Kuuva, M., Nordlund, H., Makkonen, P. and Saarelainen, T. (2007a) ‘A uniform environmental metric based on exergy for early design evaluation’, International Journal of Environmentally Conscious Design & Manufacturing, Vol. 13, No. 2, pp.1–23.
Coatanéa, E., Kuuva, M. and Makkonen, P. (2007b) ‘Early design evaluation of products artifacts’: an approach based on dimensional analysis for combined analysis of environmental, technical and cost requirements, Proceedings of the 14th CIRP International Conference on Life Cycle Engineering, 11–13 June, Tokyo, Japan, pp.365–370.
488 F.P. Appio et al.
Commission, E. and Innova, E. (2008) Insights on Innovation Management in Europe, Tangible Results From IMP3rove.
Componation, P. and Farrington, P. (2000) ‘Identification of effective problem-solving tools to support continuous process improvement teams’, Engineering Management Journal, Vol. 12, No. 1.
Cooper, R. (2001) Winning at New Products, Perseus Publishing, Cambridge, UK.
Corso, M., Giacobbo, A., Martini, A. and Pellegrini, L. (2007) ‘Tools and abilities for continuous improvement: what are the drivers of performance?’, International Journal of Technology Management, Vol. 37, Nos. 3/4, pp.348–365.
Creswell, J. (2009) Research Design. Qualitative, Quantitative, and Mixed Methods Approaches, SAGE Publications.
Danila, N. (1989) ‘Strategic evaluation and selection of R&D projects’, R&D Management, Vol. 19, No. 1, pp.47–62.
Davila, T. (2000) ‘An empirical study on the drivers of management control systems’ design in new product development’, Accounting, Organizations and Society, Vol. 25, Nos. 4/5, pp.383–409.
Dougherty, D. (1992) ‘Interpretive barriers to successful product innovation in large firms’, Organization Science, Vol. 3, No. 2, pp.179–202.
Driva, H., Pawar, K.S. and Menon, U. (2001) ‘Performance evaluation of new product development from a company perspective’, Integrated Manufacturing Systems, Vol. 12, No. 5, pp.368–378.
Eisenhardt, K. (1989) ‘Building theories from case study research’, Academy of Management Review, Vol. 14, No. 4, pp.532–550.
Fahrni, P. and Spatig, M. (1990) ‘An application-oriented guide to R&D project selection and evaluation methods’, R&D Management, Vol. 20, No. 2, pp.155–171.
Flint, D. (2002) ‘Compressing new product success-to-success cycle time deep customer value understanding and idea generation’, Industrial Marketing Management, Vol. 31, No. 4, pp.305–315.
Garvin, D. (1993) ‘Building a learning organization’, Harvard Business Review, July–August, pp.78–92.
Godener, A. and Soderquist, K. (2004) ‘Use and impact of performance measurement results in R&D and NPD: an exploratory study’, R&D Management, Vol. 34, No. 2, pp.191–219.
González, F.J.M. and Palacios, T.M.B. (2002) ‘The effect of new product development techniques on new product success in Spanish firms’, Industrial Marketing Management, Vol. 31, No. 3, pp.261–271.
Griffin, A. (1997a) ‘PDMA research on new product development practices: updating trends and benchmarking best practices’, Journal of Product Innovation Management, Vol. 14, No. 6, pp.429–458.
Griffin, A. (1997b) ‘The effect of project and process characteristics on product development cycle time’, Journal of Marketing Research, Vol. 34, No. 1, pp.24–35.
Herstatt, C., Verworn, B., Stockstrom, C., Nagahira, A. and Takahashi, O. (2006) ‘“Fuzzy front end” practices in innovating Japanese companies in new product development’, Journal of Product Innovation Management, Vol. 3, No. 1, pp.43–60.
Howard, T.J., Culley, S.J. and Dekoninck, E.A. (2008) ‘Describing the creative design process by the integration of engineering design and cognitive psychology literature’, Design Studies, Vol. 29, No. 2, pp.160–180.
Howard, T.J., Dekoninck, E.A. and Culley, S.J. (2010) ‘The use of creative stimuli at early stages of industrial product innovation’, Research in Engineering Design, Vol. 21, No. 4, pp.263–274.
Howard, T.J., Culley, S.J. and Dekoninck, E.A. (2011) ‘Reuse of ideas and concepts for creative stimuli in engineering design’, Journal of Engineering Design, Vol. 22, No. 8, pp.565–581.

An inquiry on managers use of decision-making tools 489
Institute of Marketing Science (2010) MSI Research Priorities 2010-2012 - A Guide to MSI Research Programs and Procedures. Available online at: http://www.msi.org/
Kelley, T. and Littman, J. (2005) The Ten Faces of Innovation: IDEO’s Strategies for Beating the Devil’s Advocate & Driving Creativity Throughout your Organization, Currency Doubleday, New York, USA.
Khurana, A. and Rosenthal, S.R. (1998) ‘Towards holistic front ends in new product development’, The Journal of Product Innovation Management, Vol. 15, No. 1, pp.57–74.
Kim, J. and Wilemon, D. (2002) ‘Focusing the fuzzy front-end in new product development’, R&D Management, Vol. 32, No. 4, pp.269–279.
Kleinschmidt, E., Koen, P. and Reilly, R. (2005) ‘Front end of innovation: what is different between low and high-risk projects for success?’, Proceedings of the 12th International Product Development Management Conference, 12–14 June, Copenhagen, Denmark.
Koen, P. (2004) ‘The fuzzy front end for incremental, platform and breakthrough products and services’, in Khan, K. (Ed.): The PDMA Handbook of New Product Development, 2nd ed., John Wiley & Sons, Hoboken, NJ, USA.
Koen, P., Ajamian, G.M., Boyce, S., Clamen, A., Fisher, E., Fountlakis, S., Johnson, A., Puri, P. and Seibert, R. (2002) ‘Fuzzy front end: effective methods, tools and techniques’, in Belliveau, P., Griffin, A. and Somermeyer, S. (Eds): PDMA Toolbook fr New Product Development, John Wiley and Sons, New York, USA.
Koen, P., Ajamian, G., Burkart, R., Clamen, A., Davidson, J., D’Amore, R., Elkins, C., Herald, K., Incorvia, M., Johnson, A., Karol, R., Seibert, R., Slavejkov, A. and Wagner, K. (2001) ‘Providing clarity and a common language to the “fuzzy front end”’, Research Technology Management, Vol. 44, No. 2, pp.46–55.
Kumar, N., Stern, L. and Anderson, J. (1993) ‘Conducting interorganizational research using key informants’, Academy of Management Journal, Vol. 36, No. 6, pp.1633–1651.
Kurkkio, M. (2011) ‘Managing the fuzzy front-end: insights from process firms’, European Journal of Innovation Management, Vol. 14, No. 2, pp.252–269.
Kurkkio, M., Frishammar, J. and Lichtenthaler, U. (2011) ‘Where process development begins: a multiple case study of front end activities in process firms’, Technovation, Vol. 31, No. 9, pp.490–504.
Lai, H.H., Lin, Y.C. and Wei, C.H. (2006) ‘User-oriented design for the optimal combination on product design’, International Journal Production Economics, Vol. 100, No. 2, pp.253–267.
Markham, S., Ward, S.J., Smith, L.A. and Kingon, A.I. (2010) ‘The valley of death for role theory in product innovation’, Journal of Product Innovation Management, Vol. 27, No. 3, pp.402–417.
Maylor, H. (2001) ‘Assessing the relationship between practice changes and process improvement in new product development’, Omega, Vol. 29, No. 1, pp.85–96.
McAdam, R. and McClelland, J. (2002) ‘Sources of new product ideas and creativity practices in the UK textile industry’, Technovation, Vol. 22, No. 2, pp.113–121.
McCarthy, I.P., Tsinopoulos, C., Allen, P. and Anderssen, C.R. (2006) ‘New product development as a complex adaptive system of decisions’, Journal of Product Innovation Management, Vol. 23, No. 5, pp.437–456.
McKenna, S. (1999) ‘Learning through complexity’, Management Learning, Vol. 30, No. 3, pp.301–320.
Medyna, G., Nordlund, N. and Coatanea, E. (2009) ‘Study of an exergy method for environmental evaluation assessment in the early design phase using comparative LCA and exergy approach’, International Journal of Design, Vol. 2, No. 3, pp.320–345.
Moenaert, R.K., Caeldries, F., Lievens, A. and Wauters, E. (2000) ‘Communication flows to international product innovation teams’, Journal of Product Innovation Management, Vol. 17, No. 5, pp.360–377.
Murphy, S. and Kumar, V. (1997) ‘The front end of new product development: a Canadian survey’, R&D Management, Vol. 27, No. 1, pp.5–15.
490 F.P. Appio et al.
Nicholas, J., Ledwith, A. and Perks, H. (2011) ‘New product development best practice in SME and large organizations: theory vs practice’, European Journal of Innovation Management, Vol. 14, No. 2, pp.227–251.
Nijssen, E.J. and Frambach, R.T. (2000) ‘Determinants of the adoption of new product development tools by industrial firms’, Industrial Marketing Management, Vol. 29, No. 2, pp.121–131.
Nijssen, E.J. and Lieshout, K. (1995) ‘Awareness, use and effectiveness of models and methods for new product development’, European Journal of Marketing, Vol. 29, No. 10, pp.27–44.
Phelps, R., Chan, C. and Kapsalis, S. (2001) ‘Does scenario planning affect performance? Two exploratory studies’, Journal of Business Reseach, Vol. 51, No. 3, pp.223–232.
Reid, S. and de Brentani, U. (2004) ‘The fuzzy front end of new product development for discontinuous innovations: a theoretical model’, The Journal of Product Innovation Management, Vol. 21, No. 3, pp.170–184.
Repenning, N. (2001) ‘Understanding fire fighting in new product development’, Journal of Product Innovation Management, Vol. 18, No. 5, pp.285–300.
Ringland, G. (2006) ‘Introduction to scenario planning’, in Ringland, G.A. (Ed.): Scenarios in Marketing, John Wiley & Sons.
Savioz, P. and Blum, M. (2002) ‘Strategic forecast tool for SMEs: how the opportunity landscape interacts with business strategy to anticipate technological trends’, Technovation, Vol. 22, No. 2, pp.91–100.
Schilling, M. and Hill, C. (1998) ‘Managing the new product development process: strategic imperatives’, Academy of Management Executive, Vol. 12, No. 3, pp.67–81.
Sheu, D. (2009) ‘A proposed classification and process of systematic innovation’, International Journal of Systematic Innovation, Vol. 1, No. 1, pp.3–22.
Siegel, S. and Castellan, J.J. (1988) Nonparametric Statistics for The Behavioral Sciences, 2nd ed., McGraw-Hill, New York, USA, pp.235–245.
Skemp, R.R. (1986) The Psychology of Learning Mathematics, 2nd ed., Penguin Books, London, UK.
Smith, P. and Reinertsen, D. (1998) Developing Products in Half the Time – New Rules, New Tools, John Wiley & Sons.
Smith-Doerr, L., Manev, I. and Rizova, P. (2004) ‘The meaning of success: network position and the social construction of project outcomes in an R&D lab’, Journal of Engineering and Technology Management, Vol. 21, Nos. 1/2, pp.51–81.
Souder, W. (1978) ‘Effectiveness of product development methods’, Industrial Marketing Management, Vol. 7, No. 5, pp.299–307.
Stevens, G. and Burley, J. (1997) ‘3,000 raw ideas = 1 commercial success!’, Research Technology Management, Vol. 40, No. 3, pp.16–27.
Stockstrom, C. and Herstatt, C. (2008) ‘Planning and uncertainty in new product development’, R&D Management, Vol. 38, No. 5, pp.480–490.
Thia, C., Chai, K., Bauly, J. and Xin, Y. (2005) ‘An exploratory study of the use of quality tools and techniques in product development’, The TQM Magazine, Vol. 17, No. 5, pp.406–424.
Tzokas, N., Hultink, E.J. and Hart, S. (2004) ‘Navigating the new product development process’, Industrial Marketing Management, Vol. 33, No. 7, pp.619–626.
Udell, G.G. and Baker, K.G. (1982) ‘Evaluating new product ideas….systematically’, Technovation, Vol. 1, No. 3, pp.191–202.
Urban, G. and Hauser, J. (1993) Design and Marketing of New Products, Prentice-Hall, Englewood Cliffs, NJ, USA.
Van de Ven, A. (1989) ‘Nothing is quite so practical as a good theory’, Academy of Management Review, Vol. 14, No. 4, pp.486–489.
Verworn, B. (2009) ‘A structural equation model of the impact of the “fuzzy front end” on the success of new product development’, Research Policy, Vol. 38, No. 10, pp.1571–1581.

An inquiry on managers use of decision-making tools 491
Vygotskij, L. (1962) Thought and Language. Moscow-Leningrad, The MIT Press.
Wheelwright, S. and Clark, K. (1992) Revolutionizing Product Development, Free Press, New York, USA.
Yin, R.K. (1989) ‘Case study research: design and methods’, Applied Social Research Series, Vol. 5, Sage, London.
Zhuang, L., Williamson, D. and Carter, M. (1999) ‘Innovate or liquidate: are all organisations convinced?’, Management Decision, Vol. 37, No. 1, pp.57–71.


