Embed Size (px)
Citation preview
INVESTMENT MANAGERS
Unaudited Semi-Annual Report as at 30 June 2008
AXA World Funds
Unaudited Semi-Annual Reparf as at SO June 2008
No subscription can be receiwi on the sole basis of the present repon. Subscriptions are onlyvalid if made on the sole basis of the current full and simplified prospecrus supplementcd by the application fom. the latest annual report arid [he latest scmi-annual report if published thereahel
2
AXA World Funds
Table of contents
General Information
Information to Shareholders
Foreign Distribution
Director’s Report
Financial Statements
Statement of Net Assets
Statistics
AXA World Funds - Aedificandi Schedule of Investments and Other Net Assets Industrial Classification
AXA World Funds - Aedificandi Global a Schedule of Investments and Other Net Assets a Industrial Classification
AXA World Funds - Clean Tech Schedule of Investments and Other Net Assets Industrial Classification
AXA World Funds - Emerging Europe Equities Schedule of Investments and Other Net Assets Industrial Classification
AXA World Funds - Euro Value Equities
= Industrial Classification Schedule of Investments and Other Net Assets
AXA World Funds - European Opportunities Schedule of Investments and Other Net Assets Industrial Classification
AXA World Funds - European Small Cap Equities Schedule of Investments and Other Net Assets Industrial Classification
8
10
11
14
20
32
116 117
118 120
121 123
124 126
127 128
129 130
131 133
3
AXA World Funds
Table of contents
AXA World Funds - Europe Dividend
Io Industrial Classification Schedule of Investments and Other Net Assets
AXA World Funds - Europe MicroCap
a Industrial Classification Schedule of Investments and Other Net Assets
AXA World Funds - Framlington Emerging Markets
@ Industrial Classification Schedule of Investments and Other Net Assets
AXA World Funds - Framlington Global Technology
a Industrial Classification Schedule of Investments and Other Net Assets
AXA World Funds - Framlington Health Schedule of Investments and Other Net Assets Industrial Classification
AXA World Funds - Framlington Japan
a Industrial Classification Schedule of Investments and Other Net Assets
AXA World Funds - Human Capital ' Schedule of Investments and Other Net Assets
Industrial Classification
AXA World Funds - Hybrid Resources so Schedule of Investments and Other Net Assets
Industrial Classification
AXA World Funds - Italian Equities
a Industrial Classification Schedule of Investments and Other Net Assets
AXA World Funds - Junior Energy Schedule of Investments and Other Net Assets Industrial Classification
AXA World Funds - Swiss Equities ia Schedule of Investments and Other Net Assets
Industrial Classification
AXA World Funds - Talents Schedule of Investments and Other Net Assets Industrial Classification
134 135
136 139
140 142
143 144
145 147
148 149
150 152
153 155
156 157
158 160
161 162
163 165
4
AXA World Funds
Table of contents
AXA World Funds - Talents Absolute a Schedule of Investments and Other Net Assets
Industrial Classification
AXA World Funds - Talents Asia Schedule of Investments and Other Net Assets Industrial Classification
AXA World Funds - Talents Brick @Schedule of Investments and Other Net Assets E Industrial Classification
AXA World Funds - Talents Europe Schedule of Investments and Other Net Assets Industrial Classification
AXA World Funds - Alpha Asian Bonds (note 1)
Ip Industrial Classification Schedule of Investments and Other Net Assets
AXA World Funds - Alpha Credit Bonds ’ Schedule of Investments and Other Net Assets Industrial Classification
AXA World Funds - Alpha Sterling Bonds (note 1)
DB Industrial Classification Schedule of Investments and Other Net Assets
AXA World Funds - Responsible Development Bonds (note 1) f f Schedule of Investments and Other Net Assets
Industrial Classification
AXA World Funds - Euro 1-3 @Schedule of Investments and Other Net Assets a Industrial Classification
AXA World Funds - Euro 3-5
= Industrial Classification Schedule of Investments and Other Net Assets
AXA World Funds - Euro 5-7 Schedule of Investments and Other Net Assets Industrial Classification
166 168
169 171
172 174
175 176
177 178
179 181
182 184
185 187
188 191
192 194
195 197
5
A M World Funds
Table of ccintents
AXA World Funds - Euro 7-10 Schedule of Investments and Other Net Assets Industrial Classification
AXA World Funds - Euro IO+LT Schedule of Investments and Other Net Assets industrial Classification
AXA World Funds - Euro Bonds ' Schedule of Investments and Other Net Assets
Industrial Classification
AXA World Funds - Euro Credit Plus Schedule of Investments and Other Net Assets Industrial Classification
AXA World Funds - Euro Inflation Bonds Schedule of Investments and Other Net Assets Industrial Classification
AXA World Funds - European Convergence Bonds a Schedule of Investments and Other Net Assets
Industrial Classification
AXA World Funds - Global Aggregate Bonds a Schedule of Investments and Other Net Assets
Industrial Classification
AXA World Funds - Global Emerging Markets Bonds a Schedule of Investments and Other Net Assets
Industrial Classification
AXA World Funds - Global High Yield Bonds Schedule of Investments and Other Net Assets Industrial Classification
AXA World Funds - Global Inflation Bonds Schedule of Investments and Other Net Assets Industrial Classification
AXA World Funds - US High Yield Bonds iB Schedule of Investments and Other Net Assets
Industrial Classification
198 200
201 203
204 207
208 21 1
21 2 213
214 215
21 6 223
224 226
227 230
231 232
233 236
6
AXA World Funds
Table of contents
AXA World Funds - US Libor Plus Schedule of Investments and Other Net Assets Industrial Classification
AXA World Funds - Force 3 Schedule of Investments and Other Net Assets Industrial Classification
AXA World Funds - Force 5 Schedule of Investments and Other Net Assets Industrial Classification
AXA World Funds - Force 8 Schedule of Investments and Other Net Assets Industrial Classification
AXA World Funds - Optimal Income Schedule of Investments and Other Net Assets
@ Industrial Classification
AXA World Funds - Portable Alpha Absolute Schedule of Investments and Other Net Assets Industrial Classification
AXA World Funds - Euro Liquidity E Schedule of Investments and Other Net Assets = Industrial Classification
Notes to the Financial Statements
Additional unaudited appendix - TER (Total Expense Ratio) and PTR (Portfolio Turnover Ratio)
237 241
242 243
244 245
246 247
248 250
251 252
253 255
256
288
7
AXA World Funds
Registered Office of the SICAV
49, Avenue J.F. Kennedy, L-1855 Luxembourg, Grand Duchy of Luxembourg
Board of Directors
Chairman ME Nathalie Boullefort-Fulconis, Global Head of Sales, Marketing 8 Client Services, AXA Investment Managers Paris, residing in Paris, France
Directors Ms Catherine Adibi, Global Head of funds Range Management, AXA Investment Managers Paris, residing in Paris, France Mr Dominique Forget, Global Head of Marketing, Axa Investment Managers Paris, residing in Paris, France (appointed on 28 March 2008) Mr Martin Hall, Head of AXA Investment Managers UK & Scandinavia, residing in London, United Kingdom (appointed on 19 May 2008), Mr Jean-Pierre LBoni, Global Head of Product Specialist of AXA Investment Managers Paris, residing in Paris, France (appointed on 19 May 2008) Mrs Frederique Moy, Product Engineering, AXA France, residing in Paris, France Mr Jean-Benoit Naudin, Chief Operating Officer, AXA Investment Managers Paris, residing in Paris, France Mr Joseph Pinto, Director South Europe and Middle East, AXA Investment Managers Paris, residing in Paris, France Mr Christian Rabeau, Chief Investment Officer, AXA Investment Managers Paris, residing in Paris, France Mr Xavier Thomin, General Counsel of AXA Investment Managers, residing in Paris, France (appointed on 19 May 2008) Mrs Caroline Boutier, Retail Sales Director, AXA Investment Managers Paris, residing in Paris, France (resigned on 19 May 2008) Mr Alessandro &Andrea di Pescopagano, Country Manager, AXA Investment Managers ltalia SIM SPA, residing in Milan, Italy (resigned on 19 May 2008) Mr Christian Wrede, Chief Executive Officer, AXA Investment Managers Deutschland, residing in Germany (resigned on 31 January 2008) Mr Christophe Tadie, Global Head of Marketing, Axa Investment Managers Paris, residing in Paris, France (resigned on 28 March 2008)
Management Company
AXA Funds Management S.A., 49, Avenue J.F. Kennedy, L-1855 Luxembourg, Grand Duchy of Luxembourg
Board of Directors of the Management Company
Mr Jean-Benoit Naudin (Chairman), Global Head of Operational Support & Service Management, AXA Investment Managers Paris, residing in Paris, France Mr Guy Dauger de Caulaincourt, Oversight & SLA Manager and General Manager, AXA Funds Management S.A., residing in Luxembourg, Grand Duchy of Luxembourg Mr Bruno Durieux, Chief financial Officer, AXA Luxembourg S.A., residing in Luxembourg, Grand Duchy of Luxembourg Mr Kirk Hotte, Retail Senior Sales Manager, AXA Investment Managers Paris, residing in Paris, France Mr Christian Rabeau, Chief Investment Officer, AXA Investment Managers Paris, residing in Paris, France Mr Pierre Goffin, Chief Financial Officer (until 1 February 2008), AXA Luxembourg S.A., residing in Luxembourg, Grand Duchy of Luxembourg Mr Christof Jansen, Oversight & SLA Manager and General Manager, AXA Funds Management S.A., residing in Luxembourg, Grand Duchy of Luxembourg
8
AXA World Funds
General information
Investment Managers
AXA Investment Managers Deutschland GmbH, Bleichstrasse 2-4, D-60313 Frankfurt am Main, Germany AXA Investment Managers Paris, Coeur Defense Tour B, La Defense 4, 100, Esplanade du General de Gaulle, F-92400 Courbevoie, France AXA Investment Managers UK Limited, 7 Newgate Street, London EClA 7NX, United Kingdom AXA Frarnlington Investment Management Limited, 155 Bishopsgate, London EC2MSXJ, United Kingdom AXA Investment Managers Inc., One Fawcett Place, Greenwich, CT 06830, USA AXA Rosenberg Investment Management Asia Pacific Limited, 1 George Street, #14-02/03, 15th Floor, 04 91 45 Singapore
Agent to carry out Stock Lending and Repurchase Agreements Activities
AXA Investment Managers GS Limited, 7 Newgate Street, London EClA 7NX, United Kingdom
Custodian, Paying Agent, Domiciliary and Administrative Agent, Transfer Agent and Registrar Agent
State Street Bank Luxembourg S.A., 49, Avenue J.F. Kennedy, L-1855 Luxembourg, Grand Duchy of Luxembourg
Promotor
AxA Investment Managers, Coeur Defense Tour 6, La Defense 4, 100, Esplanade du General de Gaulle, F-92400 Courbevoie, France
Independent Auditor
PricewaterhouseCoopers S.a r.1.. Reviseur d’entreprises, 400, Route d’Esch, L-1471 Luxembourg, Grand Duchy of Luxembourg
Legal Advisor
Arendt & Medernach,l4, rue Erasme, B.P. 39, L-2010 Luxembourg, Grand Duchy of Luxembourg
9
AXA World Funds
Information to Shareholders
The Full and Simplified Prospectus and the Articles of Association and any other information published are available at the registered office of the SICAV, the Custodian, the Registrar and Transfer Agent. The semi- annual and the annual reports can be obtained at the address of the Custodian. Information on the issue and redemption prices is given by the Custodian.
The net asset value of the SICAV is determined on a daily basis except for AXA World Funds - Responsible Development Bonds whose net asset value is calculated fortnightly. The financial year of the SICAV ends on 31 December each year.
10
AXA World Funds
Foreign Distribution
Regarding the Distribution of the SICAV in Switzerland
The Full and Simplified Prospectus as well as the Articles of Association of the SICAV, the annual and semi- annual reports and the list of changes in the portfolios during the reference year and all information according to the SFA Directive in relation with the transparency of the management fees can be obtained free of charge at the registered office of the Swiss Representative in Zurich which is: First Independent Fund Services, Klausstrasse 33, CH-8008 Zurich, Switzerland.
The Swiss Paying Agent is: Credit Suisse, Paradeplatz 8, CH-8001 Zurich, Switzerland.
In respect of its distribution in Switzerland, the SICAV may grant discounts to the following institutional investors holding units for the account of third-party economic beneficiaries:
life insurance companies, pension funds and other savings institutions, investment foundations, Swiss fund managers, foreign fund managers, investment companies.
In respect of its distribution in Switzerland, the SICAV may also pay trailer fees to the following distributors and distribution partners:
authorised and exempted distributors; distribution partners investing in units of the SlCAV exclusively on behalf of institutional investors ITEmging their cash positions on a professional basis; distribution partners investing in units of the SICAV exclusively on behalf of their clients on the basis of a discretionary mandate.
As at 30 June 2008, the following sub-funds are registered in Switzerland:
Aedificandi Aedificandi Global (except I Cap EUR share class) Clean Tech Emerging Europe Equities Euro Value Equities European Opportunities European Small Cap Equities Framlington Global Technology (except I Cap EUR share class) Framlington Health (except I Cap EUR share class) Framlington Japan (except I Cap EUR share class) Human Capital Italian Equities (except I Cap EUR share class) Junior Energy (except E Cap EUR and I Cap EUR share classes) Swiss Equities Talents Asia Talents Brick Talents Europe Responsible Development Bonds Euro 1-3 Euro 3-5 Euro 5-7 Euro 7-1 0 Euro 10 + LT
*
11
A M World Funds
Foreign Distribution
Euro Bonds Euro Credit Plus Euro Inflation Bonds European Convergence Bonds Global Emerging Markets Bonds (except I Cap EUR share class) Global High Yield Bonds Global Inflation Bonds Force 3 Force 5 Force 8 Portable Alpha Absolute (except A Cap EUR and E Cap EUR share classes) Euro Liquidity
Regarding the Distribution of the SICAV in Hong-Kong
Sub-funds other than AXA World Funds - European Opportunities, AXA World Funds - Framlington Global Technology and AXA World Funds - Framlington Health are unauthorized by the Securities and Futures Commission in Hong Kong and not available to Hong Kong Residents. The Hong Kong Representative is AXA Rosenberg Investment Management Asia Pacific Limited, 22/F One Pacific Place, 88 Queensway, Hong Kong.
Regarding the Distribution of the SICAV in Belgium
The representative in Belgium is AXA Bank Belgium SA., Grotesteenweg 214, B-2600 Antwerpen.
Regarding the Distribution of the SICAV in France
The representative in France is BNP Paribas Securities Services, 3 Rue d’Antin, F-75002 Paris.
Regarding the Distribution of the SICAV in Spain
The representative in Spain is AXA lbercapital Agencia de Valores AV SAU, Paseo de la Castellana 79 - Primera planta, 28046 Madrid.
Regarding the Distribution of the SICAV in The Netherlands
The representative in The Netherlands is AXA IM Benelux - Netherlands Branch S.A./N.V., WTC Schiphol, Schiphol Boulevard 21 5, 11 18 BH Schiphol Airport, The Netherlands.
Regarding the Distribution of the SICAV in The United Kingdom
The legal representative, facilities, marketing and sales agent is AXA Investment Maangers UK Ltd., 7, Newgate Street, London EClA 7NX. I
12
AXA World Funds
Foreign Disfrib u"Cm
Regarding the Distribution of the SICAV in Germany
Investors residing in Germany may obtain the Full and Simplified Prospectus, the SICAV's Articles of Association, the latest annual report or latest semi-annual report, if published thereafter, free of charge from the information agent in Germany, AXA Asset Managers Deutschland GmbH, Frankfurt branch, BleichstraOe 2- 4, 0-60313 Frankfurt am Main. They may also request the net asset value per share, the latest issue, conversion and redemption prices as well as any other financial information relating to the SICAV available to shareholders at the registered office of the SICAV.
Bank Sal. Oppenheim Jr. & Cie., Unter Sachsenhausen 4, D-50667 Koln, assumes the role of paying agent for the Federal Republic of Germany.
Regarding the Distribution of the SICAV in Austria
The representative in Austria is Bank Austria Creditanstalt AG, Am Hof 2, A-1010 Vienna, assumes the role of paying and information agent for the Republic of Austria.
Regarding the Distribution of the SlCAV in Italy
The representative in Italy is AXA Investment Managers ltalia SIM S.p.A, Corso di Porta Romana, 68, 1-20122 Milan.
The correspondent banks in Italy are the following: - BNP Paribas Securities Services, 5, Via Ansperto, 1-20123 Milan - BIPOP CARIRE S.p.A, 74, Via Leonard0 da Vinci, 1-25122 Brescia
Regarding the Distribution of the SICAV in Chile
All of the information provided by the Company for the purpose of registering the Shares on the Chilean Foreign Securities Registry, is available to the public at the offices of South Cone Investment Partners at the following address: South Cone Investment Partners, Av. Providencia 1760, 23rd Floor, Providencia, Santiago de Chile, Chile.
Regarding the Distribution of the SICAV in Singapore
The representative in Singapore is AXA Rosenberg Investment Management Asia Pacific Limited, 1 George Street, #I 4-02/03, 049145 Singapore.
13
AXA World Funds
Directors' Repart
Dear Shareholders,
Your Board of Directors is pleased to report on the progress of your SICAV for the period from 1 January 2008 to 30 June 2008.
The financial markets through 30 June 2008
Nearly one year after the financial crisis erupted, initiated by the subprime fiasco in the United States, the climate remains uncertain. Three-month inter-bank lending rates are still unusually high, and the riskier asset classes are struggling. While the threat of bank failures has receded with the bailout of Northern Rock and Bear Sterns, in the United Kingdom and the United States, respectively, financial stocks are still feeling the equity market impact.
From a macro-economic perspective, the questions relating to the impact of the financial crisis on the real economy continue to weigh, while in parallel the doubling of the oil price in one year and higher commodity prices have brought that old devil-inflation-back on the scene. But the global economy continues to get support from a positive factor, as emerging economies maintain robust growth trends. The alleged decoupling among economies seems to be playing a role and, in so doing, is blunting the impact of the US slowdown.
Faced with the resurgence of inflation, monetary policies seem to be ready to abandon the accommodating stance maintained since last summer. Rising inflation is among the central preoccupations of the ECB. It did not take part in t h e general move toward relaxed rates initiated by the Fed last summer, but finally announced in June that it was getting ready to raise its rep0 rate. US and UK monetary policies, which have been accommodating, also seem about ready to turn a corner, and the emerging countries have resumed their rate hikes.
At the beginning of the year, bonds offered investors a safe haven in the face of plunging values for risky asset classes-equity and credit-but rising concerns over inflation fuelled in early June by the monetary policy speech of J. C. Trichet, sending the bond markets into a tailspin. In June, the equity markets fell back to March lows.
In the currency market, the dollar has continued to tumble (as low as $1.59), particularly against the euro, reflecting past cuts in US key rates, the weakness of the US economy and, more recently, expectations of higher rates in the Euro Area.
Activity slows as inflation picks up
The economic situation in the developed countries continued to deteriorate during the period, although the tax cuts offered in the United States had a positive impact on household consumption, weakened by higher energy prices and job cuts (the unemployment rate stood at 5.5% in May). The real estate market continued to decline, while the manufacturing sector resisted better than it was expected to (ISM was 50.2 in June, compared with 49.6 in May). A similar diagnosis can be made for the Euro Area, where most surveys continued to deteriorate, in spite of a rebound in activity in the first quarter. Indeed, June PMI surveys for manufacturing and services fell below the threshold of 50, the line separating contraction and expansion. Admittedly, Germany remains relatively robust, but as the fall in the IF0 suggests, the trend is toward a slowdown. The emerging countries remain solid, with growth generally showing few signs of slowdown.
The uptick in inflation since last summer is still attributable to commodity prices, in particular the price per barrel of oil, which rose above $140 at the end of the month of June. Inflation has not stopped its upward movement since last summer, and has reached 4%yoy in both Europe and the United States at present.
I
I
14
AXA World Funds
I
fB i rectors ' Report
The end of accommodative monetary policies ...
In the course of the first six months of the year, the Fed-aware of the risk to growth-continued to reduce its key rates, lowering Fed Funds by a total of 225bps. At the same time, it multiplied unconventional lending measures to ensure that the financial system had adequate liquidity. Inflation, which up to now has been a second order concern for the Fed, seems to be back on the scene. Bernanke's speech in June took a more cautious position on the risk of inflation.
In Continental Europe, while the ECB took part in the move to inject liquidities into the money market, it maintained rates unchanged for a year. But in June, it announced that a hike in its key rate was imminent. In Japan, the BoJ interrupted its bid to normalise key rates.
Despite the pursuit of more restrictive monetary policies in emerging economies, these countries hesitate to really fight overheating. As a result, they continue to post strong growth and this is putting pressure on commodity prices.
SICAV Events
The assets under management of the SICAV amount to 9,192,295,224 EUR as at 30 June 2008.
Implementation of a number of changes to the SICAV
We inform you that the Management of the Company has decided to implement a number of changes to the SICAV, as from the beginning of the year:
AXA World Funds - Alpha Asian Bonds
> Change to the Classes of Shares
1) The first indent of the section "Classes of Shares available in the Sub-Fund" under section 6 entitled "Shares" has been amended as follows:
"There are currently 18 classes of Shares available in the Sub-Fund, denominated in the currencies mentioned hereinafter:
- Class A - Capitalisation: USD; - Class A - Distribution: USD; - Class A - Capitalisation: EUR Hedged; - Class A - Distribution: EUR Hedged; - Class E - Capitalisation: EUR Hedged; - Class F - Capitalisation: USD; - Class F - Distribution: USD; - Class F - Capitalisation: EUR Hedged; - Class F - Distribution: EUR Hedged; - Class F - Capitalisation: GBP Hedged; - Class F - Distribution: GBP Hedged; - Class I - Capitalisation: USD; - Class I - Distribution: USO; - Class I - Capitalisation: EUR Hedged; - Class I - Distribution: EUR Hedged; - Class I - Capitalisation: GBP Hedged; - Class I - Distribution: GBP Hedged; - Class M - Capitalisation: USD.
15
A M World Funds
Directors' Repart
2) The paragraph relating to Class "E" Shares has been deleted and replaced as follows:
"Class "E" Shares are for all investors. Shareholders cannot convert Class "E" Shares into another class of Shares in the same or a different Sub-Fund without the prior approval of the Company. 'I
> Change to the launch date of the Sub-Fund
1) As the launch date of the Sub-Fund has been postponed to 15 February 2008, the section 7 "Subscription" has been amended as follows:
"The initial subscription period in the Sub-Fund will take place on 15 February 2008. Subscriptions will be accepted at the price of EUR 100 or USD 100 or GBP 100 depending on the offering currency in which the relevant Class of Shares is denominated. Payment shall be made to the order of the Custodian on 20 February 2008.
2) Consequently, the section relating to the performance of the Sub-Fund has been amended as follows:
"The Sub-Fund will be launched on 15 February 2008. Its performance will be described in the annual and semi-annual reports of the Company.
Past performance is not indicative of future results."
> Insertion of new fees applicable to Class "E" Shares
A new indent at the end of the section "Management fees payable by the Company to the Management Company" has been added as follows:
"In addition, the Company will pay a maximum distribution fee of 0.25% for the Class E Shares which is calculated on top of the annual management fee, as a percentage of the Net Asset Value of the Sub-Fund.''
AXA World Funds - Alpha Sterling Bonds
r Change to the Investment Policy
The last indent of the "investment Policy" section has been amended as follows:
"The Value-at-Risk (VaR) is the percentage of Net Asset Value that a portfolio may lose on a given time horizon, at a given confidence level. In respect of this Sub-Fund, the Value-at-Risk level of 2 % of the Sub-Fund Net Asset Value will have a five Business Days horizon and 95% confidence level parameters. This means that there is a probability of 5% that a loss experienced by the Sub-fund within the five (5) Business Days horizon may be higher than 2% of the Sub-Fund's Net Asset Value.
The Reference Currency of the Sub-Fund is GBP."
16
AXA World Funds
Direcrors' Report
> Change to the calculation of the performance fees
The benchmark used for the calculation of the performance fees of Classes of Shares denominated in GBP has been modified as follows:
"The benchmark index for comparison is capitalised EONIA CAP. + 200 basis gross for Classes of Shares denominated in Euro, capitalised US Libor 1 week + 200 basis points for Classes of Shares denominated in USD and capitalised GBP Libor 1 week + 200 basis points for Classes of Shares denominated in GBP. For each Share Class this gross hurdle rate is adjusted with the related fixed fees to define the net hurdle rate."
Holding of an Extraordinary General Meeting
Then, we inform you that an Extraordinary General Meeting of the Company was held on 14 February 2008 (i) to amend the Article 1 of the Articles of Incorporation in order to modify the name of the Company by adding "AXA WF" to the current denomination and (ii) to allow the Board of Directors of the Company to set up a compulsory redemption of all the Shares of any Shares classes or Sub-Fund or to allocate the assets of any Sub-Fund to those of another Sub-Fund and to redesignate the Shares of the class(es) concerned as shares of another class. The Company shall serve a notice to the holders of the relevant classes)of Shares prior to the effective date for the compulsory redemption, which will indicate the reasons and the procedure for the redemption operations.
As the quorum requirements for voting the items of the agenda had not been attained on 14 February 2008, a second Extraordinary General Meeting was held on 25 March 2008 with the same agenda.
Dividend distribution process of AXA World Funds - US Libor Plus
We inform you that the dividend distribution process has been adopted by the Board of Directors' meeting held on 31 January 2008.
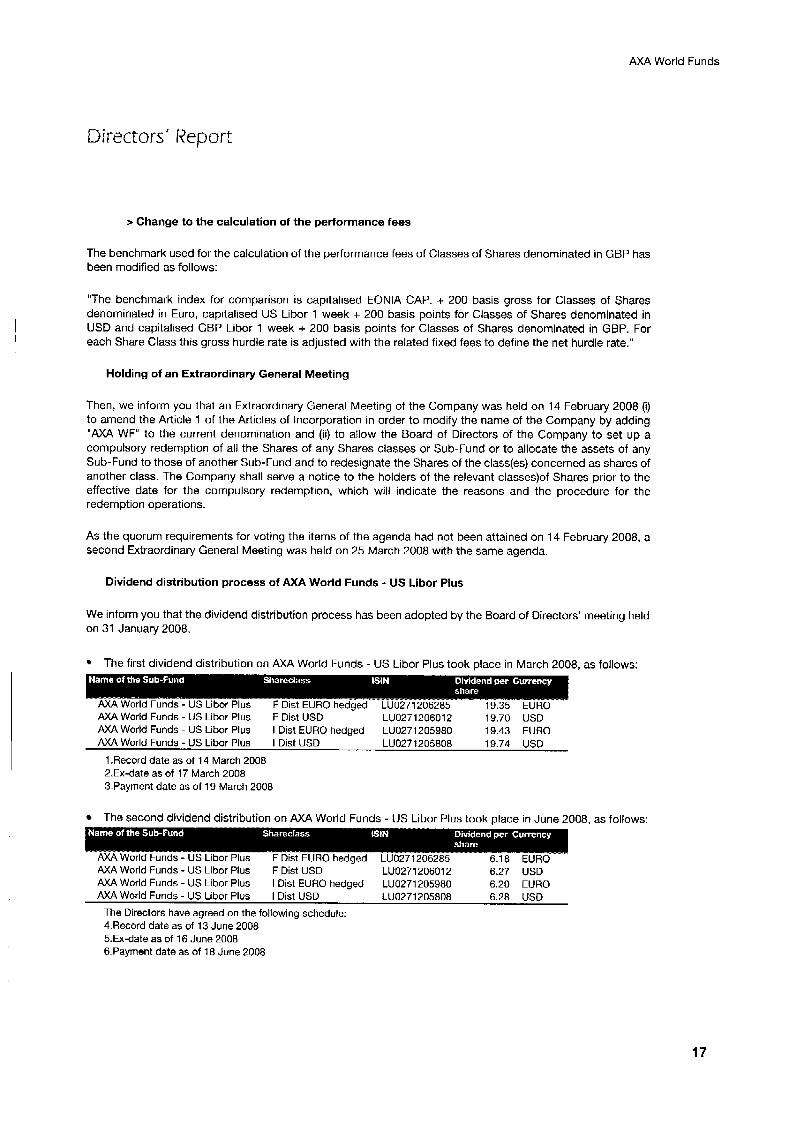
The first dividend distribution on AXA World Funds - US Libor Plus took place in March 2008, as follows:
AXA World Funds - US Libor Plus F Dist USD LU0271206012 19.70 USD AXA World Funds - US Libor Plus I Dist EURO hedged LU0271205980 19.43 EURO M A World Funds - US Libor Plus I Dist US0 LU0271205808 19.74 USD
1 .Record date as of 14 March 2008 2.Ex-date as of 17 March 2008 3.Payment date as of 19 March 2008
The second dividend distribution on AXA World Funds - US Libor Plus took alace in June 2008. as follows:
LU0271206012 6.27 USD AXA World Funds - US Libor Plus AXA World Funds - US Libor Plus AXA World Funds - US Libor Plus I Dist USD LU0271205808 6.28 USD
F Dist USD I Dist EURO hedged LU0271205980 6.20 EURO
The Directors have agreed on the following schedule: 4.Record date as of 13 June 2008 5.Ex-date as of 16 June 2008 6.Payment date as of 18 June 2008
17
AXA World Funds
Directors’ Report
Closing of AXA World Funds - US Bonds Core Plus and AXA World Funds - US Securitized Bonds
Then, the Directors of the Company respectively acknowledged on 11 April 2008 and 16 June 2008:
- the redemption of 250,000 shares by the remaining shareholder of the issued shares of AXA World Funds - US Bonds Core Plus on 4 April 2008. This order has been executed on 7 April 2008, based on the last net asset value of the Sub-Fund as calculated on 4 April 2008.
- the redemption by the remaining shareholder of the issued shares of AXA World Funds - US Securitized Bonds on 13 June 2008, executed on the net asset value calculated on 16 June 2008.
Consequently, further to the absence of assets in these sub-funds, the Directors have resolved to close them.
Board of directors
finally, we inform you that:
Mr Christian Wrede resigned as Director of the Company on 31 January 2008. Mr Dominique Forget has been appointed as new Director of the Company on 28 March 2008 in replacement of Mr Christophe Tadie who has resigned. The term of office of Mr Alessandro d’Andrea di Pescopagano and Mrs Caroline Boutier expired at the end of the Annual General Meeting of Shareholders which was held on 19 May 2008. They were not re-elected as Directors of the Company. Mr Martin Hall, Mr Xavier Thomin and Mr Jean-Pierre Leoni have been appointed as new Directors of the Company at the Annual General Meeting held on 19 May 2008.
Your Board of Directors is now composed as follows:
Nathalie Boullefort-Fulconis Chairman Catherine Adibi Dominique Forget Martin Hall Jean-Pierre Leoni Frederique Moy Jean-Benoit Naudin Joseph Pinto Christian Rabeau Xavier Thomin
The Board of Directors 30 June 2008
I
Note : The figures stated in this report are historical and not necessarily indicative of future performance.
18

AXA World Funds
19
AXA World Funds
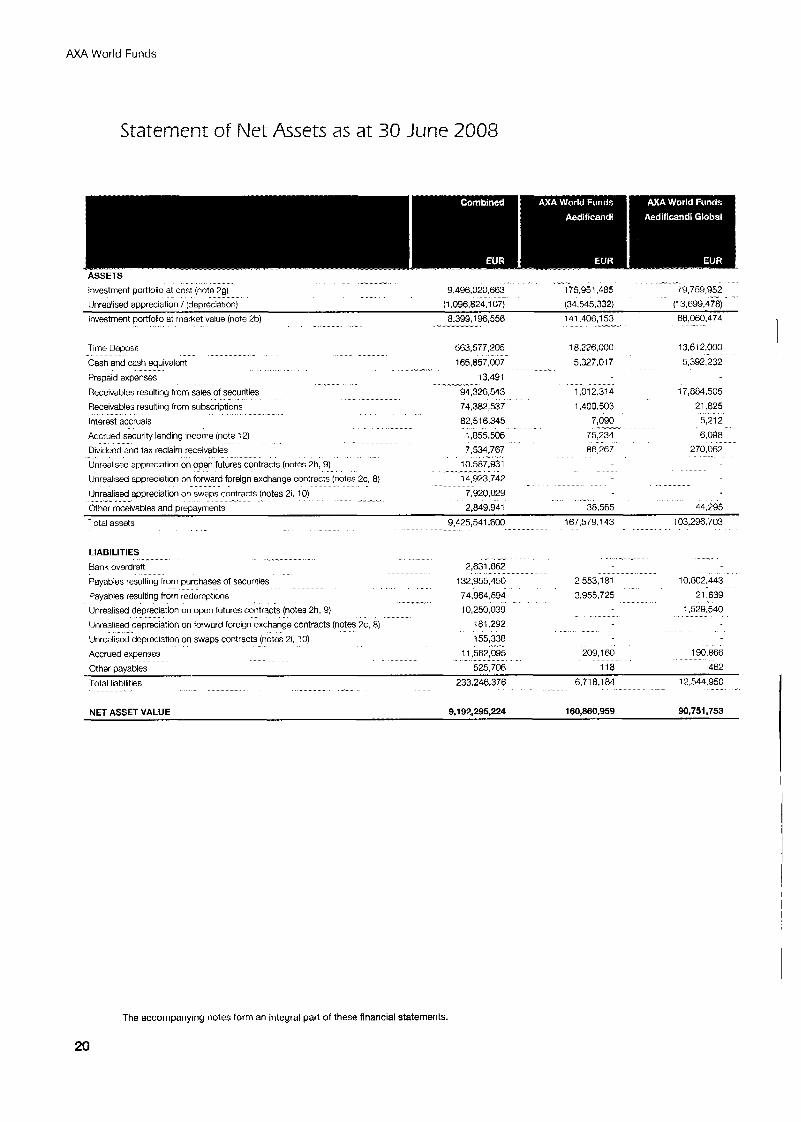
Stalement of Net Assets as at 30 June 2008
ASSETS Investment portfolio at cost (note 29)
Unrealiscd amreciation / fdeoreclatlon)
_ x
9,496,020,663 175,951,485
I1 .G96.824.10< (34,545,332)
-~ 79,759,952
(1 3,699,478) "
Investment portfolio at market value (note 2b)
Time Deoosit
66,060.474 141,406,153 ~ -- -~ 8,399,198,556 - - ~ _ 563,577,205 18,276,000 13,612,030
165,857,007 5,327,017 5,392,232 ^^^ - " Cash and cash equivalent
Prepaid expenses
Receivables resulting from sales of securities 94,326,543 1,012,314 ;7,884.505 Receivables resulting from 5lJbSCriptiOnS ?4.382,537 1,400,503 21,825
Interest accruals 82,516.345 7,090 5,212
Accrued security lending incon'e (note 12) 1,855,506 " "- 75,234 6.098 270,062 Dividend and tax reclaim receivables
Unroalisec appreciation on open futures contracts (notes 2h, 9)
Unrealised appreciation on forward foreign exchange contracts (notes 2c, 8)
Other rweivables and prepayments 2,849.941 38,565 44.295
Total assets 9,425,541.603 167,579,143 103,296.703
- -~ 13,491 -" --x- "
" --
^ " 7,534,767 86,267 ~- ~~
10.58f.931
3,742
7.920,MS ~ _ _ _ ^
ppreciation on swaps contracts (notes 21. 10) -~~ "
- -- I - " -I LIABILITIES Bank overdraft- 2,631.862 Payablos resulting from purchases of securities 132.955.450 2,553,181 10,802,443
21.639 Payables resiilting frorn redemptions 74,964,594 3,955,725 1,529,540 Unrealised depreciation on open futures contracts (notes 2h, 9)
Unrealised depreciation on forward foreign exchange contracts (notes IC. 8) Unrealised depreciation on swaps mntracts (notes 21. 10) Accrued expensos 11,582,095 209,160 190,866 Other payables 525,706 118 462
12544,950
" - 10,250,039
181.292
155,338 ^ x ~
- ̂^ 233.246.376 6,718,184
^^ ~- " ^^ Total liabilities
NET ASSET VALUE 9,192,295,224 160,860,959 90,751,753
The accompanying notes form an integral part of these financial statements.
20
AXA World Funds
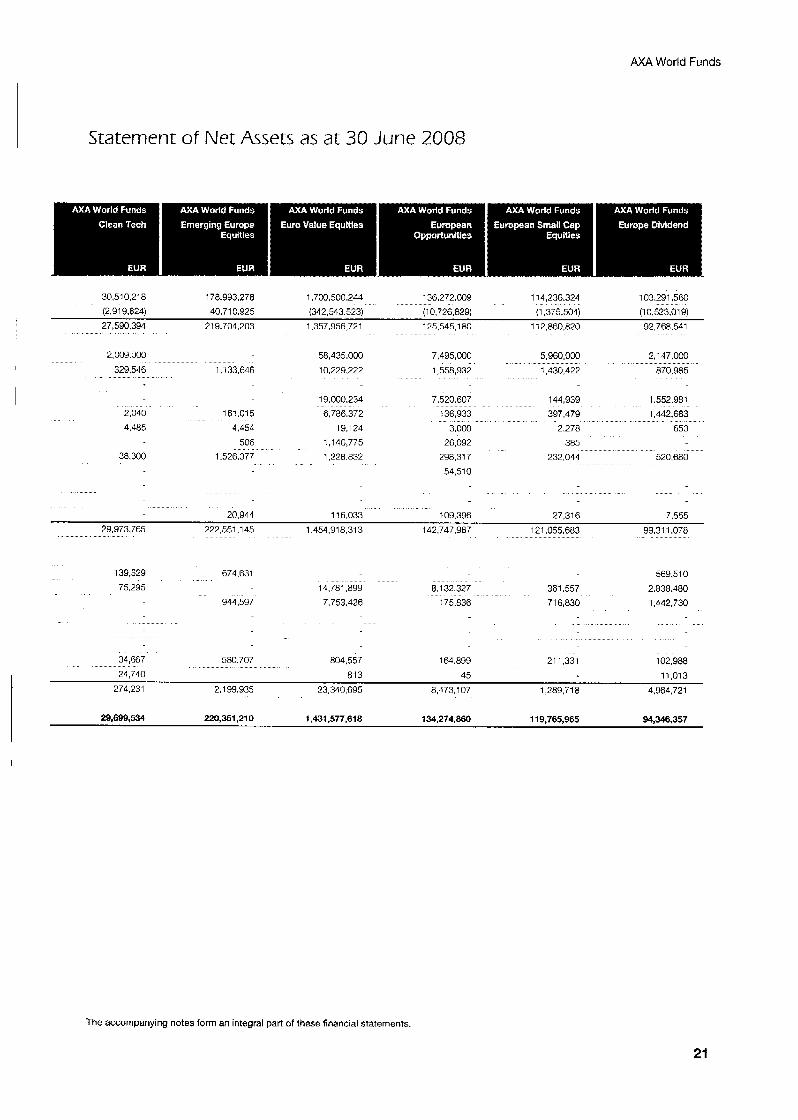
Statement of Net Assets as at 30 June 2008
30.51 0,218 178.993.278 1.7M).500.2L4 136,272,009 114,236.324 103.291,560
(2,919,824) 40.71 0,925 (342,543 523) (1 0,726,829) (1,375,504) (10,523,019)
27,590,394 21 9,704,203 1,357,956,721 125,545,180 1 i2,860.820 92,768,541
2.009.000
329,516
2.340
4,485
38.300
1,133,646
58,435.000
10,229,222
19,000,234
161.015 6,786,372
4,454 19,124 506 1,116,775
1,526,377 1228.832
7,495,000
1,558,932
7,520,607 736,933
3,000 26,092
298.31 7
54,510
5,960,000
1,430,422
2.147.000
870,985
144,939 1.552.981 397,479 1,442,683
2 278 653
385 232,044 520,680
20,944 1 16,033 109 396 27.31 6 7,555 29,973,765 222,551,145 1,454,918,313 142,747,967 121.055.683 99.31 1.078
139.529 674,631 569,510
75,295 14,781,899 8,13?.327 361,557 2,838,480
944,597 7,753.426 175,836 71 6,830 1,442,730
34,667 580,707 804.557 164.899 21 1,331 102,988
24,740 813 45 11,013
274,231 2,199,935 23,340.695 8973.1 07 1,289,718 4,964,721
29,699,534 220,351,210 1.431,577,618 134,274,860 119,765,965 94,346,357
The accompanying notes form a n integral part of these financial statements
21
AXA World Funds
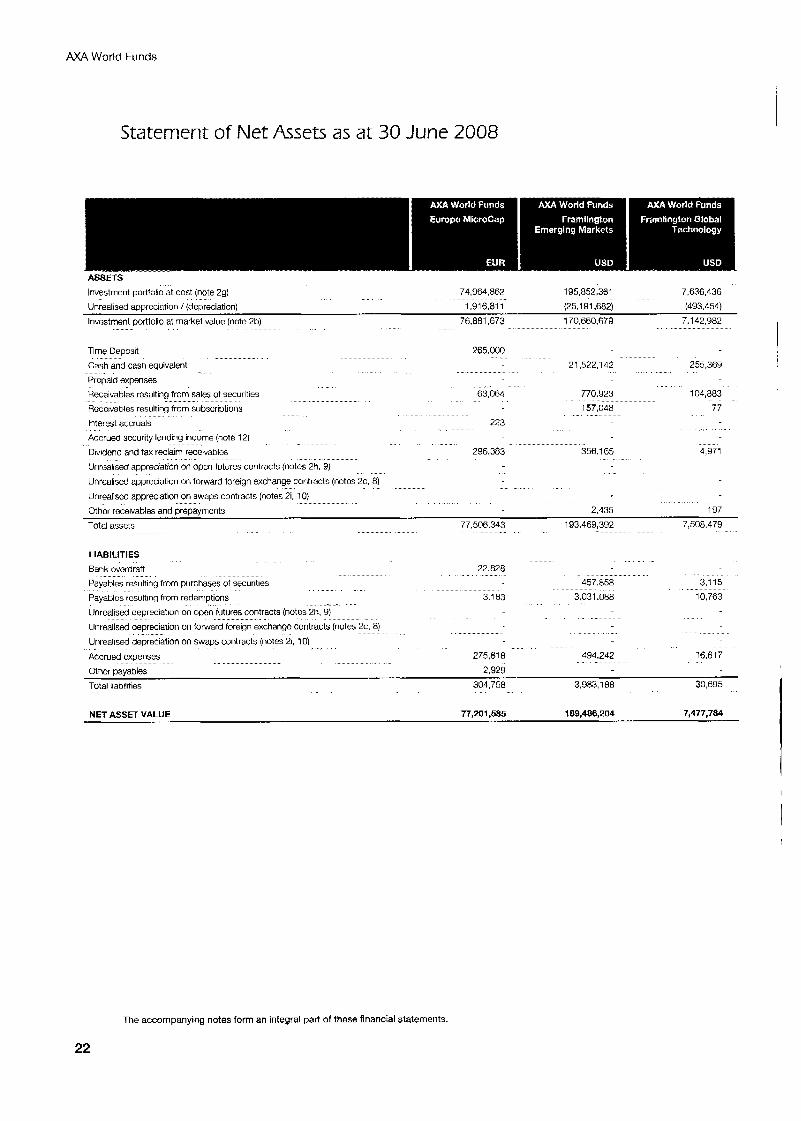
Statement of Net Assets as at 30 June 2008
ASSETS Investment portfolic at cost (note 29) 74,964.862 195,852,361 7.636.436
Unrealised appreciation f (depreciation) 1,916.81 1 (25,191.682) (493.454)
Investment portfolio at market value (note 2b) 76,881,673 170,660,679 7,142,982
Time Deposit
Cash and cash equivalent
Prcpaid expenses Receivables rosulting from sales of securrties
Rcccivables resulting from subscriptions
Interest accruals
Accrued sccurity lending income (note 12)
Dividend and tax reclaim reccivablcs
Unrealism' appreciation on opcn futures contracts (notes 2h. 9)
765,000
63,064
273
296.383
21,572,142 255,369
770.923 157,048
104,883 77
356.165 4,971
Unrcalised appreciation on forward foreign exchange contracts (notcs 2c. 8) Unrealiscd appreciation on swaps contracts (notes 2i, 10) Othor receivables and prepayrricnts 2,435 197
Total assets 77,506,343 193,469,392 7,506 479
LIABILITIES
Bank overdraft
Payables resulting from purchases of securities
_ " Payablcs rcsulting from redemptions
Unrcalised depreciation on open futures contracts (notcs 2h, 9)
Unrealised depreciation on forward foreign exchangc contracts (notes 2c, 8)
Unrealisec denreciation on swam contracts (notes 21, 10)
22.828
3.183
457.858
3.031.088
3,115 10,763
Accruod cxpenses 275,818 494.242 16,817
Othcr payables 2.929 Total liabilities 304.768 3.983.188 30,695
_ "
NET ASSET VALUE 77,201,585 189,486,204 7,477,784
The accompanying notes form an integral part of these financial statements.
22
AXA World Funds
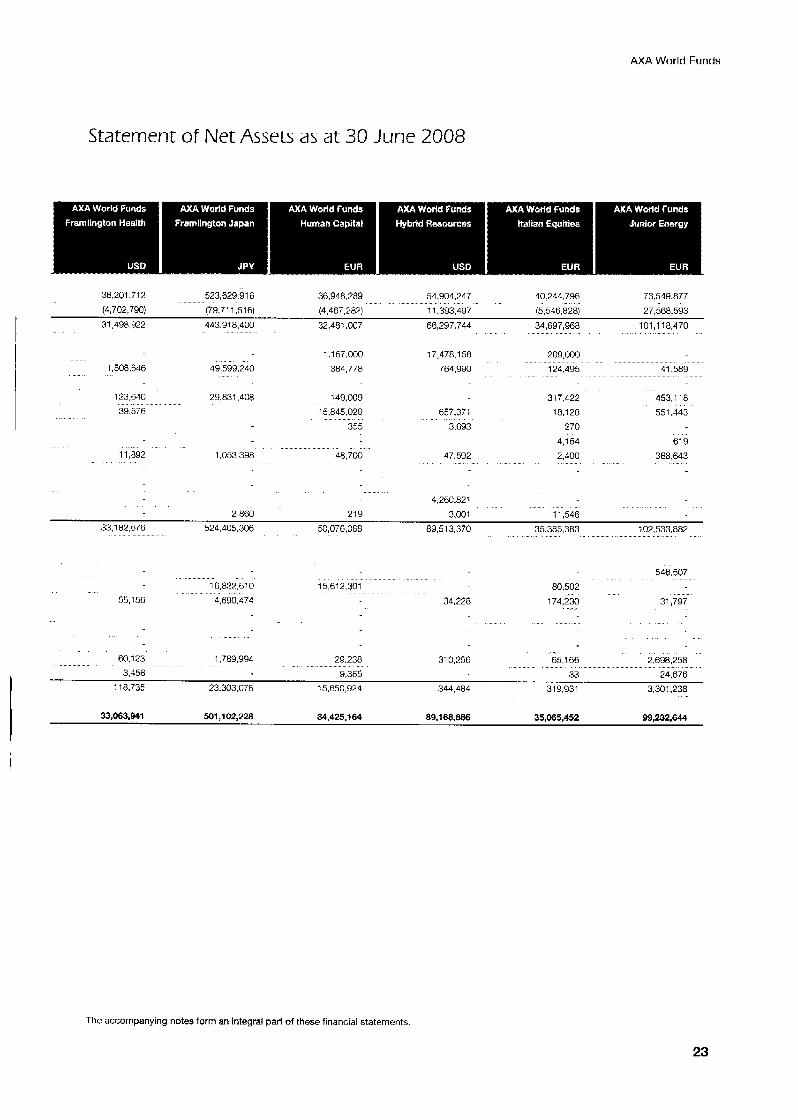
Statement of Net Assets as at 30 June 2008
36,201,717 523,629,916 36,948,289 54,904,247 40 244,796 73549.877 (4,702,790) (79,711,516) (4,467,282) 11,393,497 (5,546,828) 27568.593
I 31,498,922 443.918.400 32.481.007 66.297.744 34.697 968 101 118470
1.167.000
304,778
17,478,158
764.990
209,000 124,495 41,589 1,508,546 49599.240
31 7 422 453,118
18.128 551,443
270
4,154 61 9 2,400 368,643
11.546
123,640 39.576
29,831,408 149,009
15.845.020 657.371 3,693 355
11,892 48,700 1.053.398 47,592
4.260.821
3.001 219
33.1 82.676 524,405,306 50,076,068 89,513,370 102,533,882 35,385,383
16,827,610
4,690,474 34,228
546,507
15,612,301 80,502
174,230 55.156 31,797
60.123 1,789,994 29.238 31 0.256 65.166 I 2,698,258
3,456 9.365 33 24.676 I 11 8.735 23,303.076 15,650,924 344.484 319,931 3,301,238
I 33,063,941 501,102,228 24,425,164 89.1 68.886 35,065,452 99,232,644
The accompanying notes form an integral part of these financial statements.
23
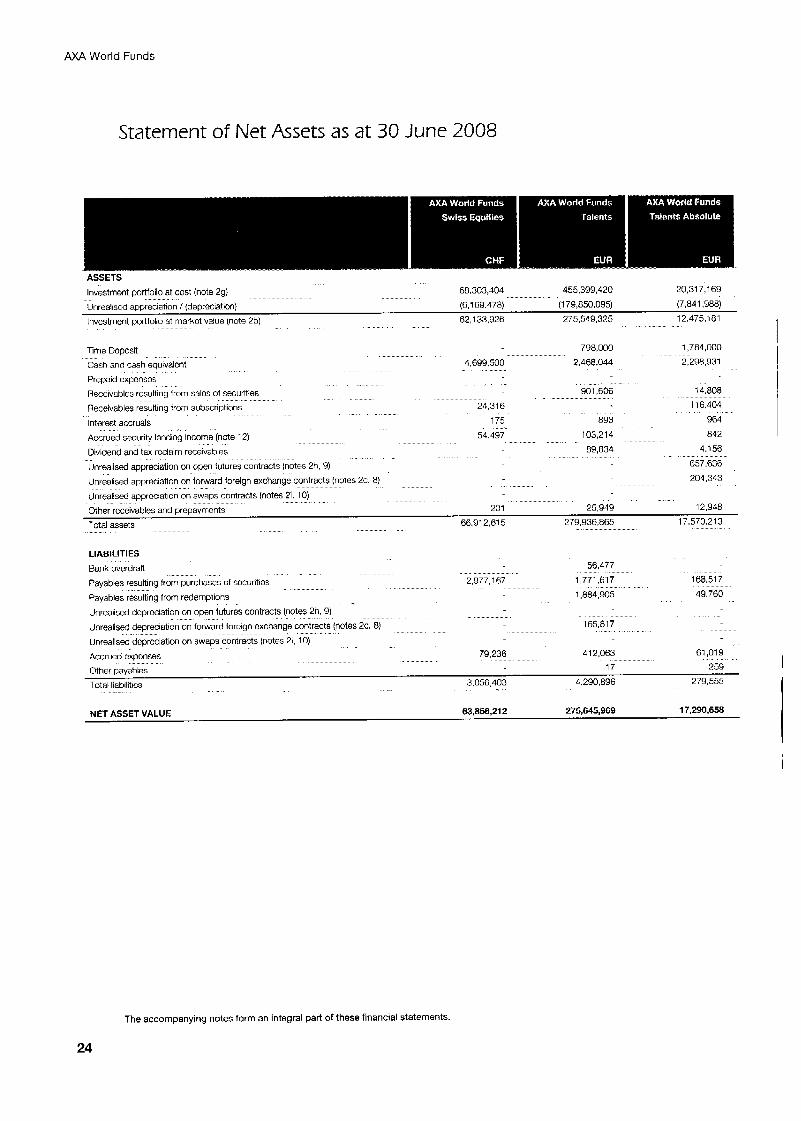
AXA World Funds
Statement of Net Assets as at 30 June 2008
ASSETS Investment portfolio at cost (note 29) 68.303,404 455,399,420
lnvcstment portfolio at marltct value (note 2b) 62.1 33,926 275549.325 12.475.181
20,317,l 69 Unrealiscd appreciation / (deprociation) (6.169.478) (1 79,850.095) (7,841,988)
Time Deposit Cash and cash equivalcnt
798.000 4,699,500 2,468.044
1,784,000
2.298.931
" " Prepaid expenses Receivables resulting from Salcs of secunties goi.606 14.808 Receivables resulting from subscriptions 21,316 116404
175 893 964 Interest accruals Accrued sezurity lending income (note 12) 54.497 103,214 842
89,834 4,156 Dividend and tax rcclaim receivables 657.636 Unrealisec appreciatlon on open futures contracts (notes 2h, 9)
Unrealised appreciation on forward foreign exchange contracts (notes 2c, 8) 204,343
Unrealised apprcciation on swaps contracts (notes 21. 10) 201 25,949 12.948 Other rcceivables and prepayments
Total assets 66.91 2.61 5 279,936,865 17.570.213
LIABILITIES
Bank overdraft
Payables resulting from purchases of securitics
Payables resulting from redemptions
2.977.167
56,477 1,771.61 7
1.884.905
168.517
49,760
Unrealised deprcclatlon on open futures contracts (notes 2h, 9) Unrealised depreciation on forward foreign exchange contracts (notes 2c. 8)
Unrealised dcprcclation on swaps contracts (notes 21, IO)
Accrued expcnses
Other payables Total liabilitics
165,817
I 79,236 412,063 61,019
17 259 3,056,403 4 290,896 279,555
63,856,212 275,645,969 17,290,658 NET ASSET VALUE
The accompanying notes form an integral part of these financial statements.
24
AXA World Funds
Statement of Net Assets as a t 30 June 2008
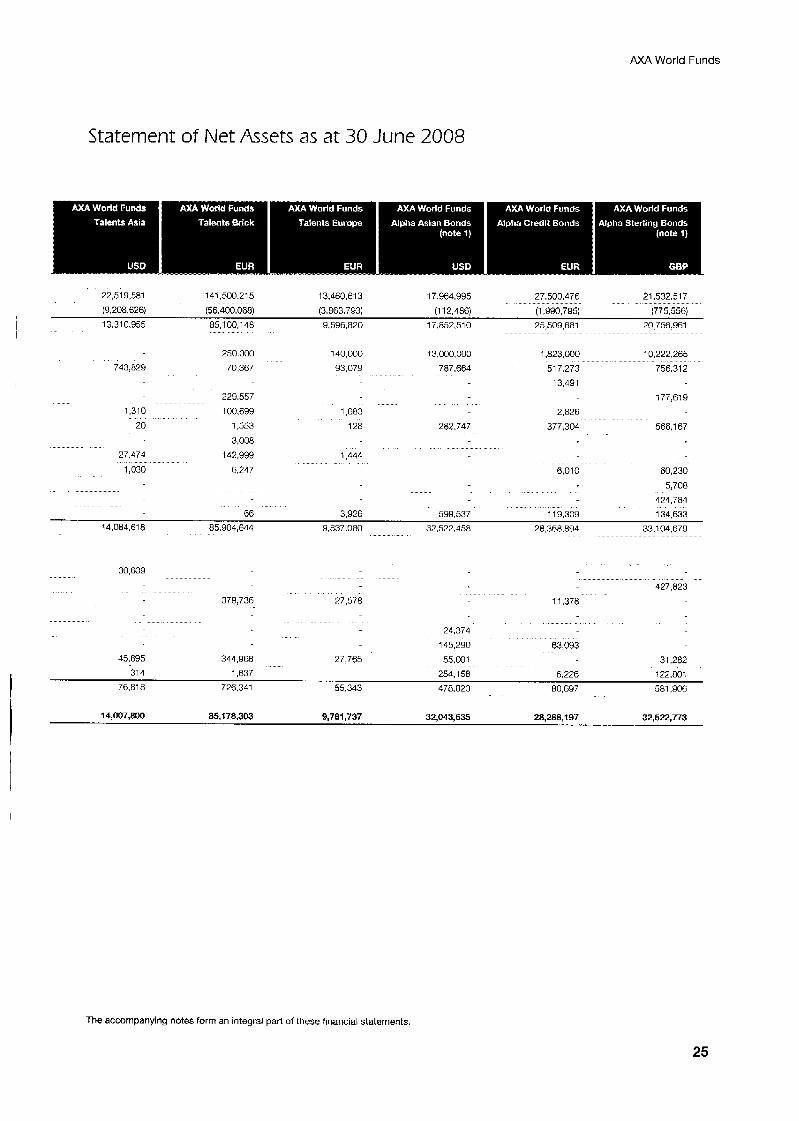
21,532,517 22,519581 141,500,215 13,460,613 17 964,995 27,500,476
(9,208,626) (56.400.068) (3,863,793) (1 12,486) (1,990,795) (775,556)
13.31 0,955 851 00,148 9.596.820 17.852510 25,509.681 20 756.961
10,222,265 250.000 140,000 13,M)O,O~ 1,823,000
743,829 70,367 93,079 787.664 51 7,273 756.31 2
, 13,491
1,310
20
27,474
1,030
229,557
100.699
1.553
3.008
147.999
6.247
1,683
128 282.747
1,441
2,826
377,304
177,619
566,167
6,010 60,230
5,708
424.784
66 3 926 599,537 119,309 134,633
14,084.61 8 85,904,644 9.837.080 32.522.458 28 368.894 33,104,679
30,609
379.736 27.578 11,378
24.374
145,290 63,093 45,895 344,968 27,765 55,Mll 31,282
76.818 726.341 55,343 478.823 80.697 581.906 31 4 1,637 254,158 6,226 122.801
I 14,007,800 65,178,303 9,761,737 32,043,635 26,268,197 32,522,773
The accompanying notes form an integral part of these financial statements.
25
AXA World Funds
Statement of Net Assets as at 30 June 2008
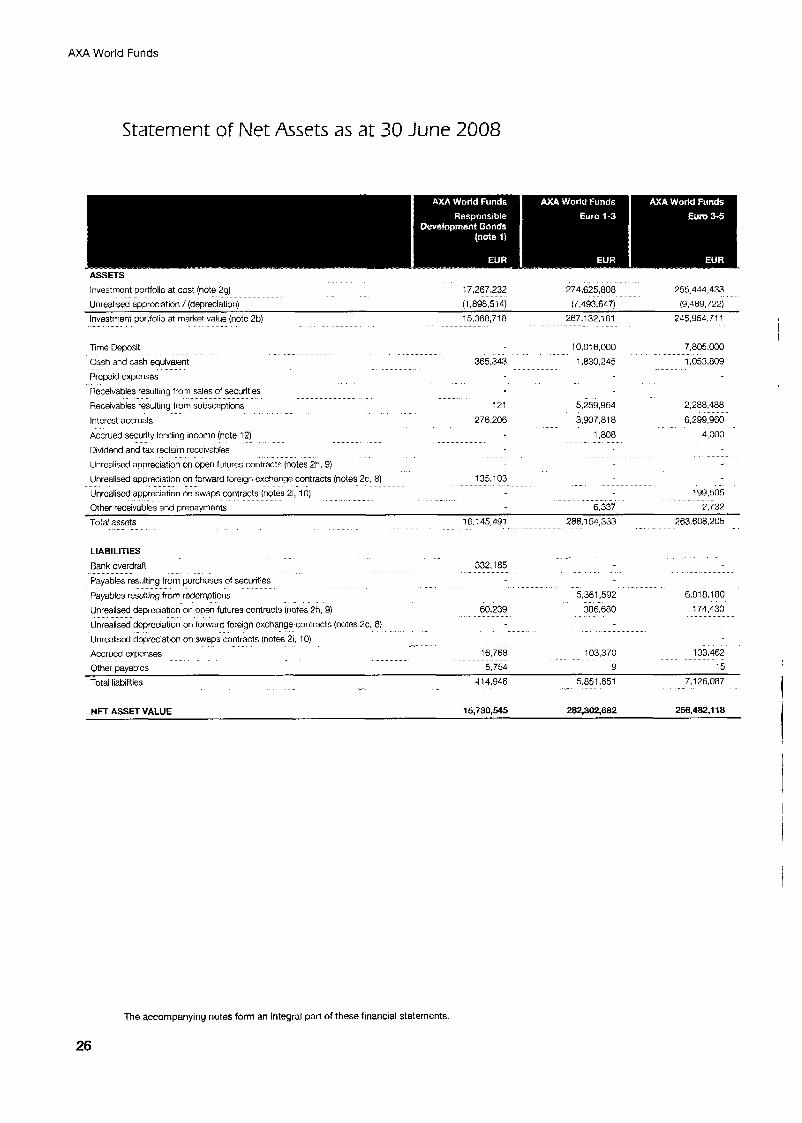
Investment portfolio at cost (note 29) 17,267.232 274,625,808 255,444,433
Unrealisd apprcciation / (depreciation) (1,898,514) (7.493.647) (9.489.722)
245,954,711 Investment portfolio at market value (notc 2b) 267.132.161 15,368,718
7,805,000 Time Doposlt 10.01 6,000
Cash and cash equivalent 365.343 1,830,245 1,053,809
" ^ Prepaid expenses
Heceivables resulting from Sales of securities Receivables resultinq from subscnptions 121 5,259,964 2,288,488
Interest accruals
Accrued security lending income (note 12)
Dividend and tax raclaim rcceivables
Unrealisd appreciation on open futures contracts (notes 2h. 9) llnrealised appreciation on forward foreign cxchange contracts (notes 2c. 8)
Unrcaliscd amreciation on bwaos contracts (notes 21. IO)
6,299,960
1,808 4,000 " "
276,206 3,907,818
'35.103
199,505 Other receivables and prepayments 6,337 7,737
Total assets 16 145 491 288.1 54.333 763.608.205
LIABILITIES Bank overdrafl 332.185
Payables resulting from purchases of securities
Payablcs resulting from rodcmptlons Unrealisd depreciation on open futures contracts (notes 2h, 9) 60,239 386.680 174,430
Unrealised dcprcciation on forward foreign cxchange contracts (notes 2c. 8) Unrealised dcprcciation on swaps contracts (notes 21, IO) Accrucd expenses 16.768 103,370 133.462 Other payablcs 5,754 9 15
Total liabilities 414,946 5,851,651 7,126.087
5 361,592 6,818.1 80 " ^
" "
- 1 NET ASSET VALUE 15,730,545 282,302,6a2 256,482,118
The accompanying nates form an integral part of these financial statements.
26
AXA World Funds
Statement of Net Assets as at 30 June 2008
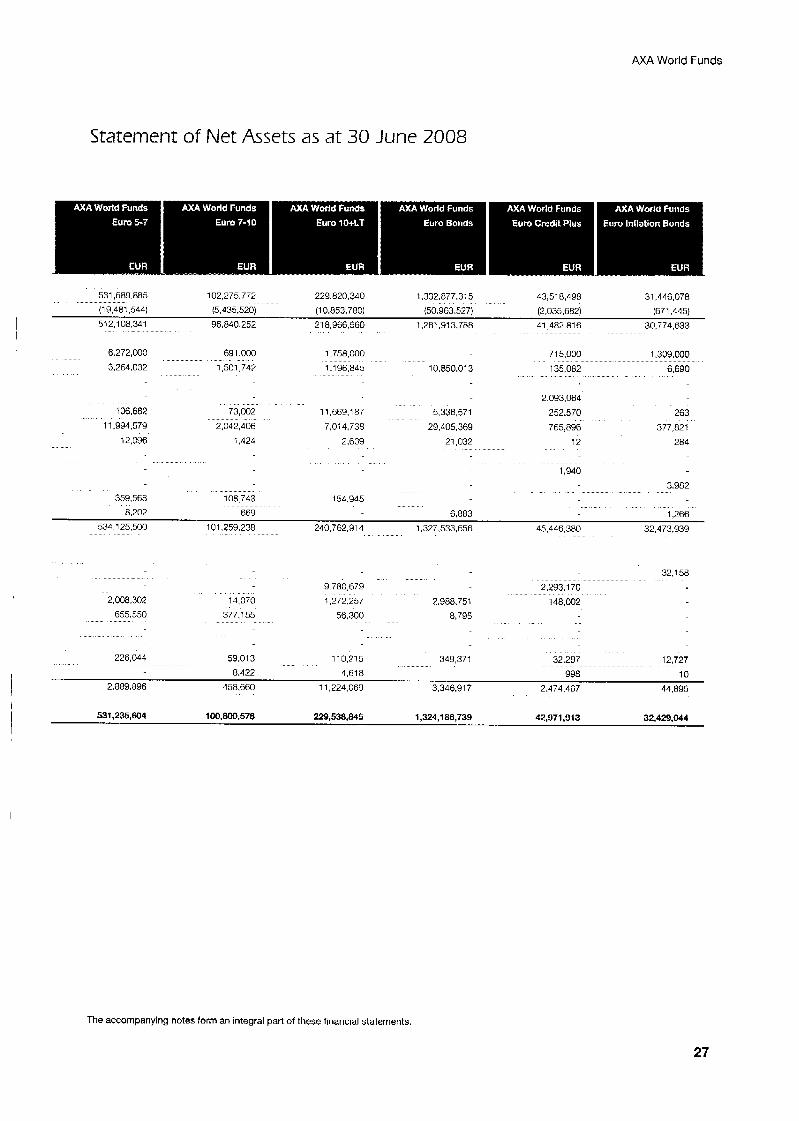
531,589 885 102,275,772 229 820,340 1.332.877.31 5 43,518,498 31,446,078 (19,481,544) (5,435,520) (1 0,853,760) (50.963 527) (1,035,682) (671,445)
I 512.1 08,341 96,840,252 21 8,966,560 1.281.913.788 41,482 816 30,774,633 I
6272,000 3.264.032
106,682 11,994,579
691,000
1,501,74?
73.002
2,042,406
1,758,000 1,196,845
11,669,187 7,014,736
10,850,013
715,000 135,082
1,309,000
6,690
2,093,064
5,336,571 252,570 263 29,405,369 765,896 377,821
12,096 i ,424 2,639 21,032 12 284
1,940 3,982
359.568 108 743 154 945
8.202 669 6,883 1,266
534,125,500 101,259,236 240 762,914 1,327,533,656 45446.380 32,473.939
2.008.302 655,550
226.044
I4 070 377.1 55
59.01 3
9 780,679 1,272,257
56.300
110,715
7.988.751 8,795
32,158 2.293.1 70
148,002
349,371 32.297 12,727
I 8.122 4.618 998 10
2 . m . a 9 6 458,660 11.224.069 3,346.91 7 2.474,467 44,895
531,235,604 i00,800,578 229,538,845 1,324,i 86,739 42,971,913 32,429,044
The accompanying notes form an integral part of these financial statements
27
AXA World Funds
Statement of Net Assets as at 30 June 2008
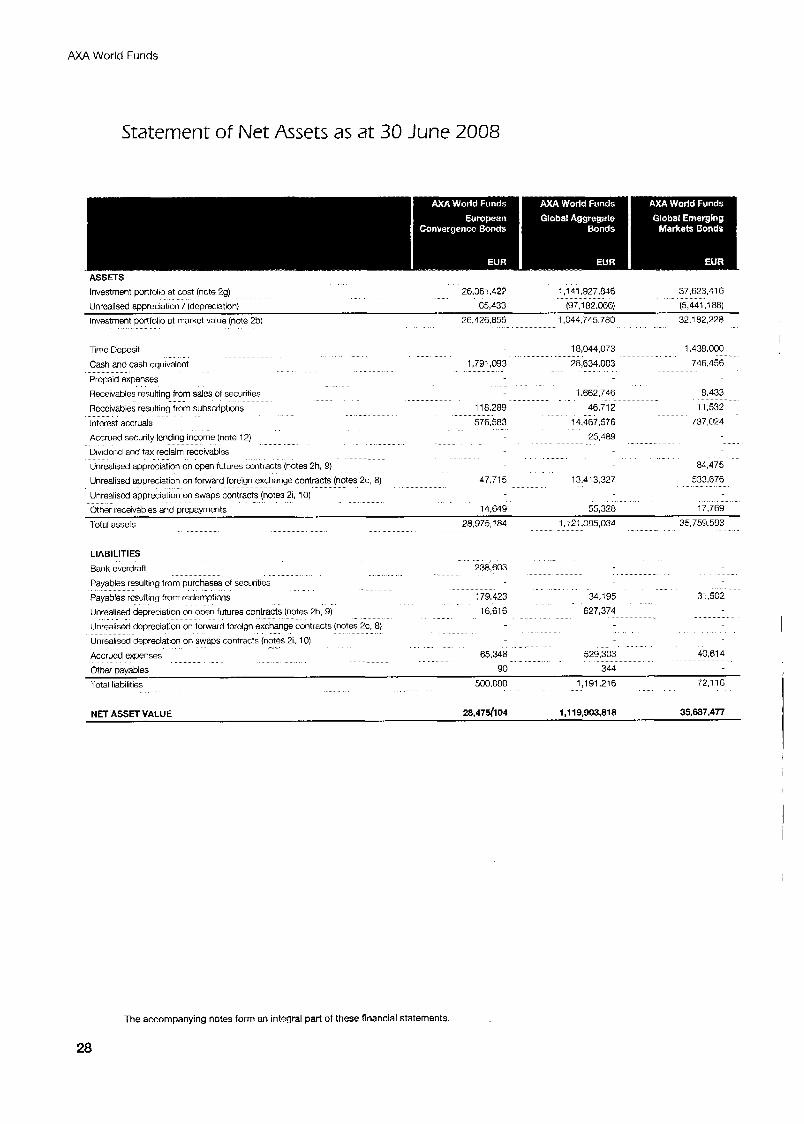
Investment portfolio at cost (note 29) 26,361,427 1,141.927.846 37.623.41 6
Unrealised appreciation / (depreciation) 65,433 (97,182.066) (5,44 1 , 1 88)
Investment poflfolio at market value (note 2b) 26.426.855 1,044.745.780 32.1 82.228
Time Deposit
Cash and cash equivalont
Preoaid CxDenses
1,791,093
18,044.073
28,634,003
1.438.000
746,456
Roccivables resulting from sales of securities 1.662.746 8.433
Rcccivables resulting from subscnptions 1 i m a 9 46.71 2 11,532
737,024 lntcrest accruals 576.583 14,467576
Accrued security lending income (note 12) 25,489
Dividcnd and tax reclaim receivables
Unrealised apprcciation on open futures contracts (notes 2h, 9) 84,475
533.676 13.413.327 Unrealised appreciation on forward foreign exchange contracts (notes 2c, 8)
Unrealiscd appreciation on swaps contracts (notes 21, 10) Other receivables and prepzyments 14,649 55,328 17,769
Total assets 28,975,184 1,121,095,034 35759.593
47,715
LIABILITIES Bank overdraft
Payables resulting from purchases of socurlties
Payables resulting from redemptions Unrcalised depreciation on open futures contracts (notes 2h, 9)
Unrealised dcprcciation on forwdrd forcign exchange contracts (notes 2c, 8)
Unrealiscd depreciation on swaps contracts (notes 21. 10)
Accrucd expenses x x x
" "
238,603
179,423
16,616
65,348
34,195 31,502
627,374
529,303 40.61 4 Other payables 90 344
Total liabilities 500.080 1,191,216 72.1 16 -"
NET ASSET VALUE 28,475/l04 I ,I 19,903,818 35,607,477
The accompanying notes form an integral part of these financial statements.
28
AXA World Funds
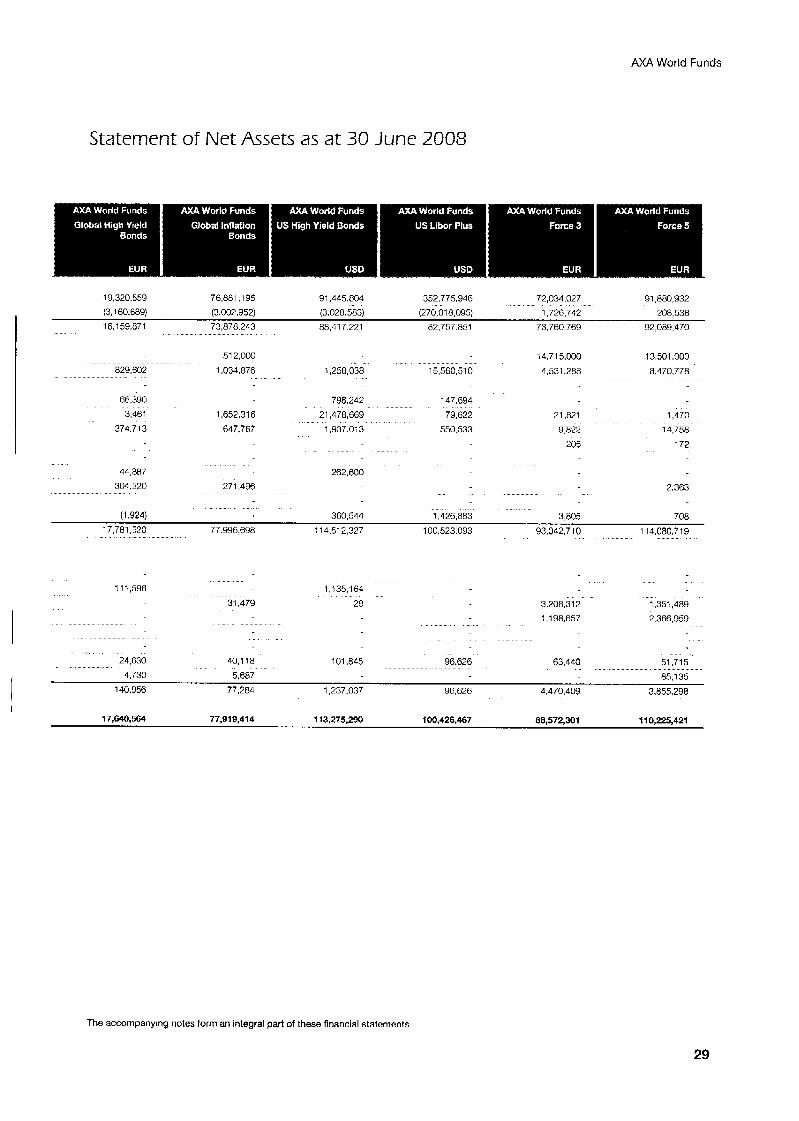
140.956 77.284 1,237,037 96,626 4,470,409 3,855,298
Statement of Net Assets as at 30 June 2008
19,320,559 76,881.1 95 91.445.804 352,775,946 72,034,027 91.880.932 (3,160.689) (3,007,952) (3,028,583) (270,Ol 8,095) 1,726,742 208.538
16.159.871 73.878.243 88.41 7.271 82.757.851 73.760.769 92 089 470
829.902 512,000
1.034.876
66.390
3,461 1.652.31 6 374,713 647,767
44,aa7 304,520 271,496
14,715,000
1,258,038 15,56051 0 4.531.288
13,501,000 8.470.778
798,242 147,694
21,478,669 79,621 1.937 0-83 550 533
262.600
21.821 1,470 9,827 14.750
205 172
2,363
(1,924) 360,544 1,426,883 3,805 708 17,781,520 77 996,698 114,512,327 100,523 093 93,042,710 114.080.719
111,596
24,630
1 ,135,164
31.479 28
40.118 101.8G 96,626
3.208.312 1,198,657
1,351,489
2,366,959
63,440 51,715
17,640,564 77,919,414 113,275,290 100,426,467 88,572,301 I 1 0,225,421
The accompanying notes form an integral part of these financial statements
29
AXA World Funds
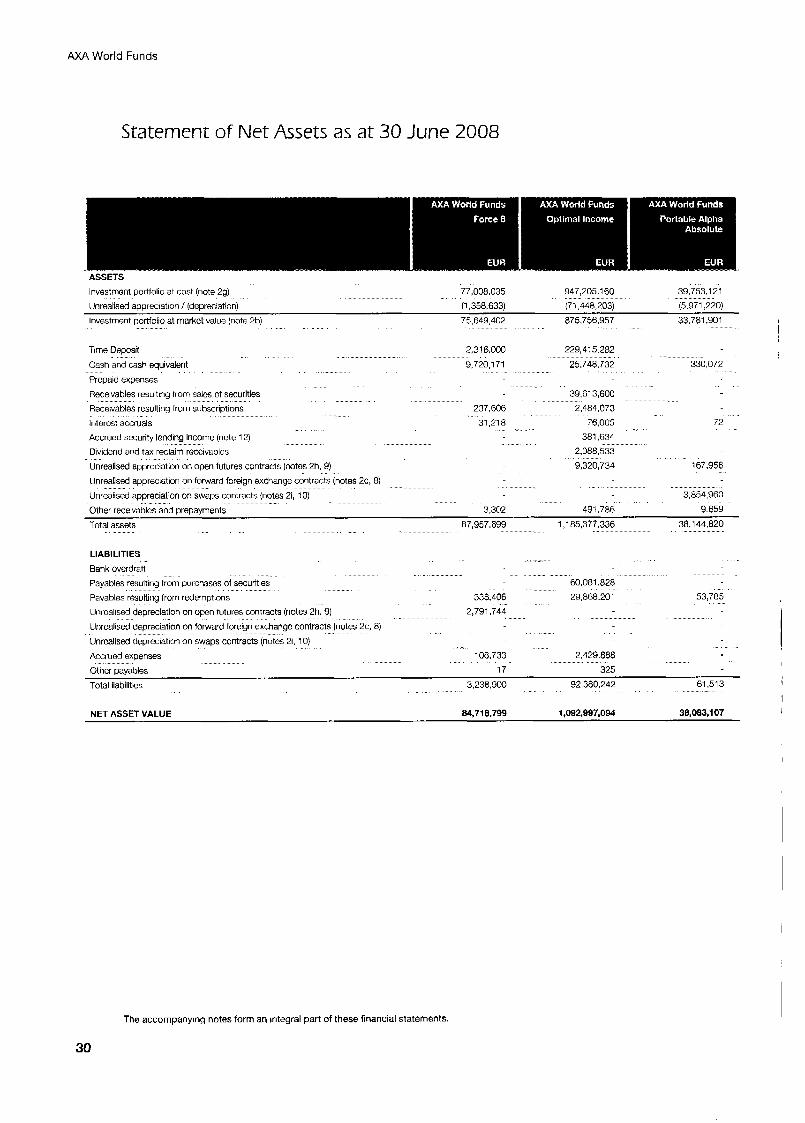
Statement of Net Assets as at 30 June 2008
lnvestmont portfolio at cost (note 29) 77,008.035 947,205.1 60 39,753,121
Unrealised appreciation / (depreciation) (1,358,633) (71,448,203) (5,971,220)
Investment portfolio at market value (note 2h) 75,649,402 a75,756,957 33,781.901
Time Deposit
Cash and cash equivalent
Prcpaid expenses
Receivables resulting from salcs of securities
Receivables resulting from subscriptions
lntercst accruals
Accrued security lcnding income (note 12)
Dividcnd and tax reclaim rocoivables
Unrealised appreciation on open futures contracts (notes 2h. 9)
2,316,000 229,415,282
9,720,171 25.748,732
39.61 3,600
237.606 2.484.073 31.21 8
Unrealised appreciztion on forward foreign exchange contracts (notes 2c 8)
Unrealised amreciation on swam contracts (notes 21. 10)
76.005
381.634 2,088,533
9,320,734
72
167,956
3,854,960 Other receivables and prepayments 3,302 491.786 9 659
Total assets 67,957,699 1 , I 85,377.336 38.144.a20
LIABILITIES Bank ovcrdratl
Payables resulting from purchases of securities
Pavables resultina from redemwtions 338.406
Unrcalised depreciation on open futures contracts (notes 2h. 9)
Unrcalised depreciation on forward foreign exchange contracts (notes 2c, 8)
Unrcalised denreciation on swats contracts (notes 21. 10)
2,791,744
60,081,826
29,868.201 53,785
Accrued expenses 108,733 2.429.wa
Other pzyables 17 325 Total liabilities 3.238.900 92,380,242 61,513
NET ASSET VALUE 84,718,799 1,092,997,094 38,083,107
The accompanying notes form an integral part of these financial statements.
30
AXA World Funds
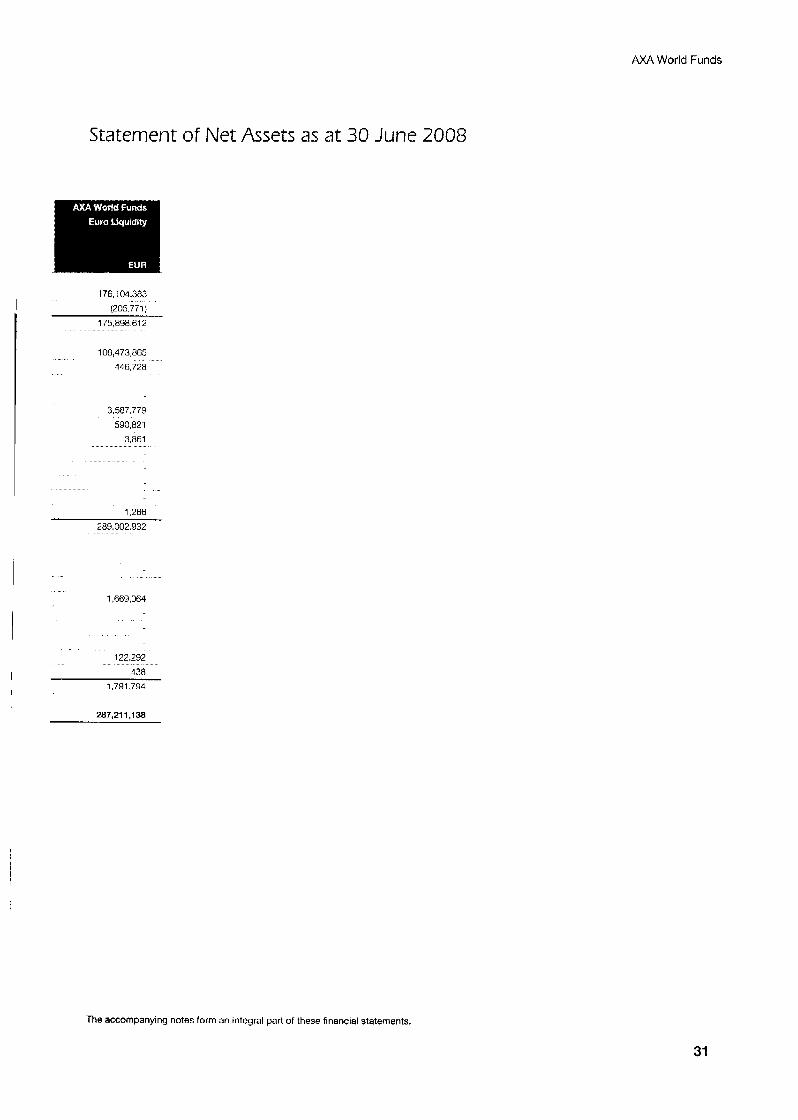
Statement of Net Assets as at 30 June 2008
176,104,363 (205.771)
175,898.61 2 I 108,473,865
446.728
3,587,779 590.821
3.861
1.266
289.002.932
1,669,064
122,292
438 1,791,794
The accompanying notes form an integral part of these financial statements
31
AXA World Funds
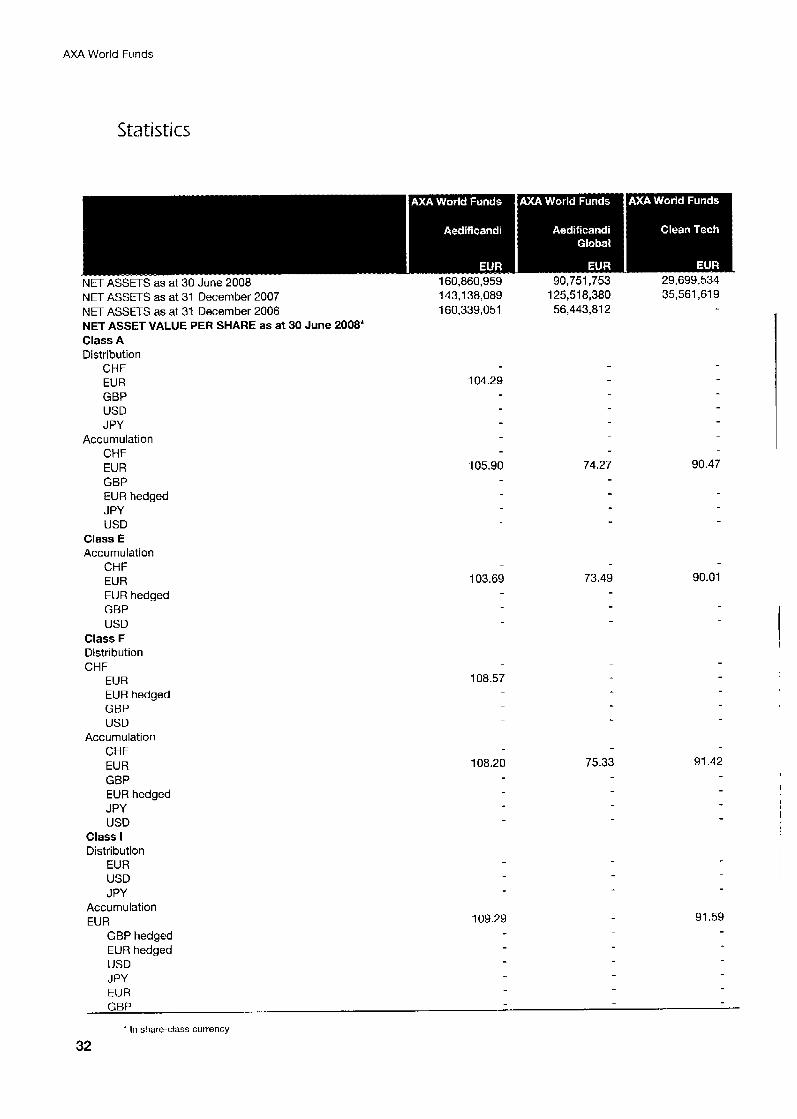
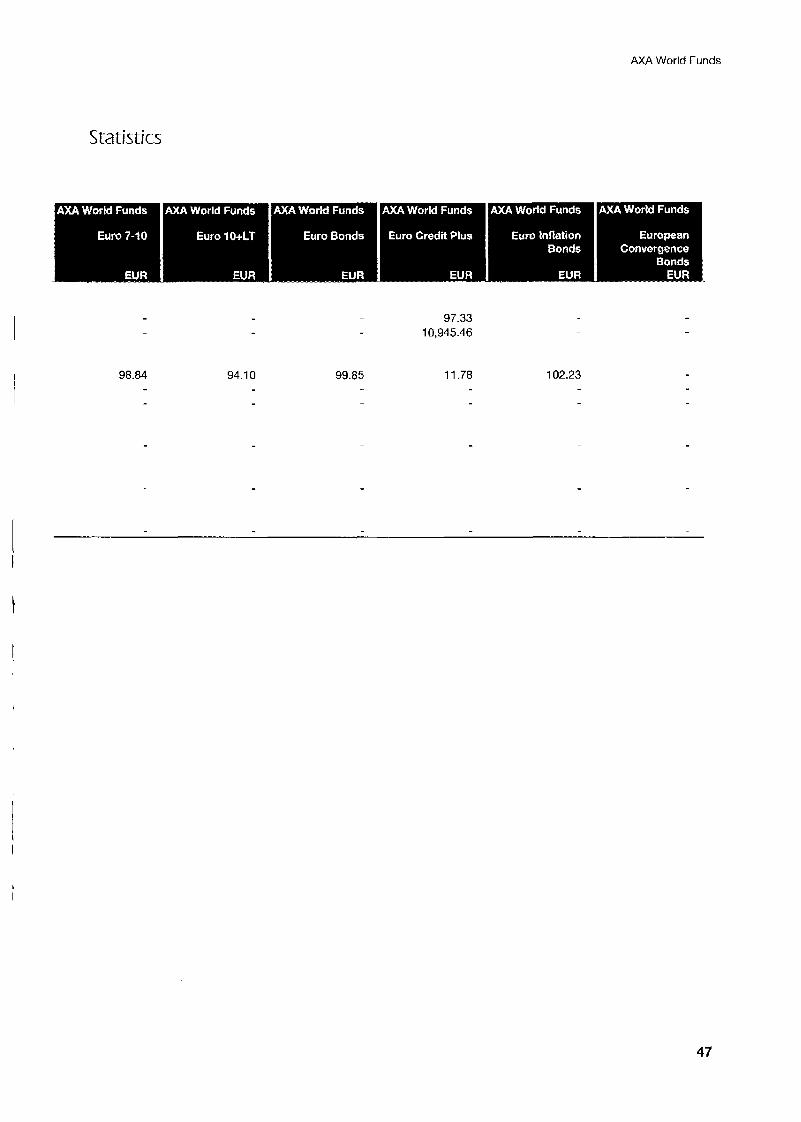
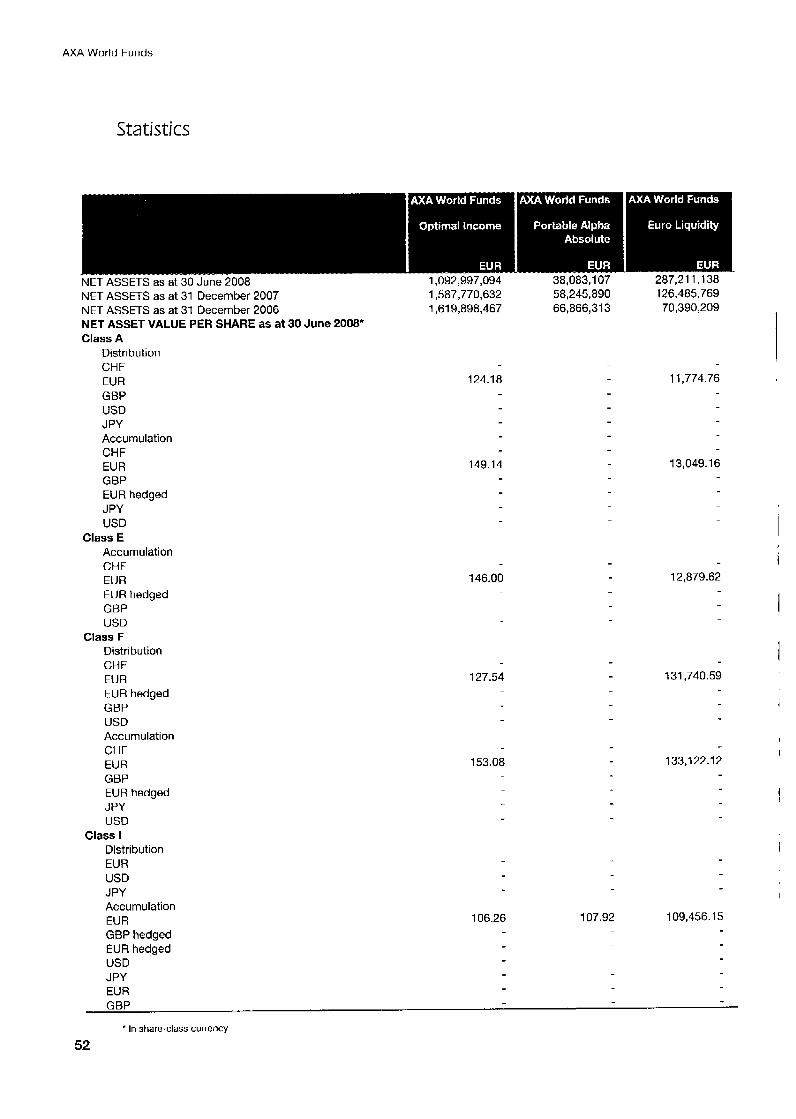
Statistics
NET ASSET3 as at 31 December 2007 NET ASSETS as at 31 December 2006 NET ASSET VALUE PER SHARE as at 30 June 2008* Class A Distribution
CHF EUR GBP USD J PY
Accumulation CHF EUR GBP EUR hedged J PY USD
Class E Accumulation
CHF EUR EUR hedged GBP USD
Class F Distribution CHF
EUR EUR hedged GBP USD
Accumulation CHF EUR GBP EUR hedged JPY USD
Class I Distribution
EUR USD JPY
Accumulation EUR
GBP hedged EUR hedged USD J PY EUR
143,138,089 160,339,051
104.29
105.90
103.69
125,518,380 56,443.81 2
74.27
73.49
108.57
108.20
109.29
75.33
35,561,619
90.47
90.01
91.42
91.59
GBP
* In share-class currency
32
I
I
AXA World Funds
Statistics
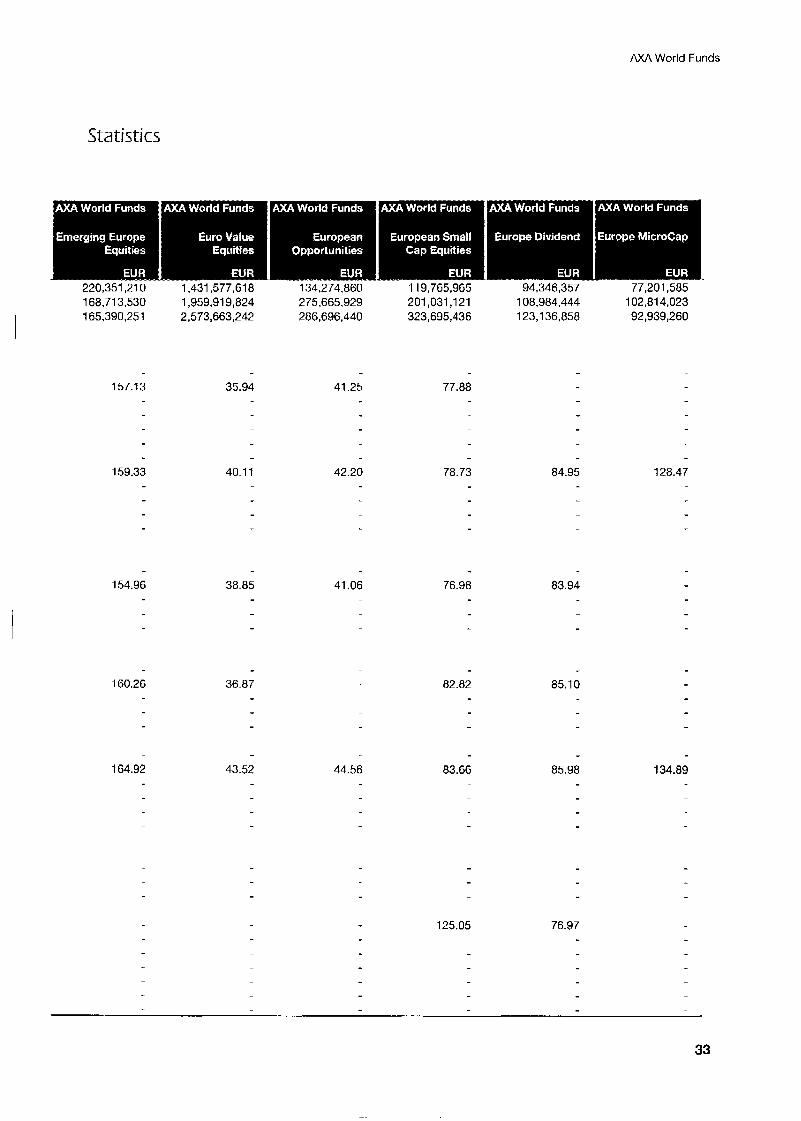
168.71 3,530 1,959,919,824 275,665,929 201,031,121 108,984,444 165,390,251 2,573,663,242 286,696,440 323,695,436 123,136,858
102,814,023 92,939,260
35.94 77.88 157.13 41.25
159.33 78.73 40.1 1 42.20 84.95 128.47
41.06 76.98 83.94 154.96 38.85
160.26 36.87 82.82 85.10
44.56 83.66 85.98 134.89 164.92 43.52
125.05 76.97
33
AXA World Funds
Statistics
.
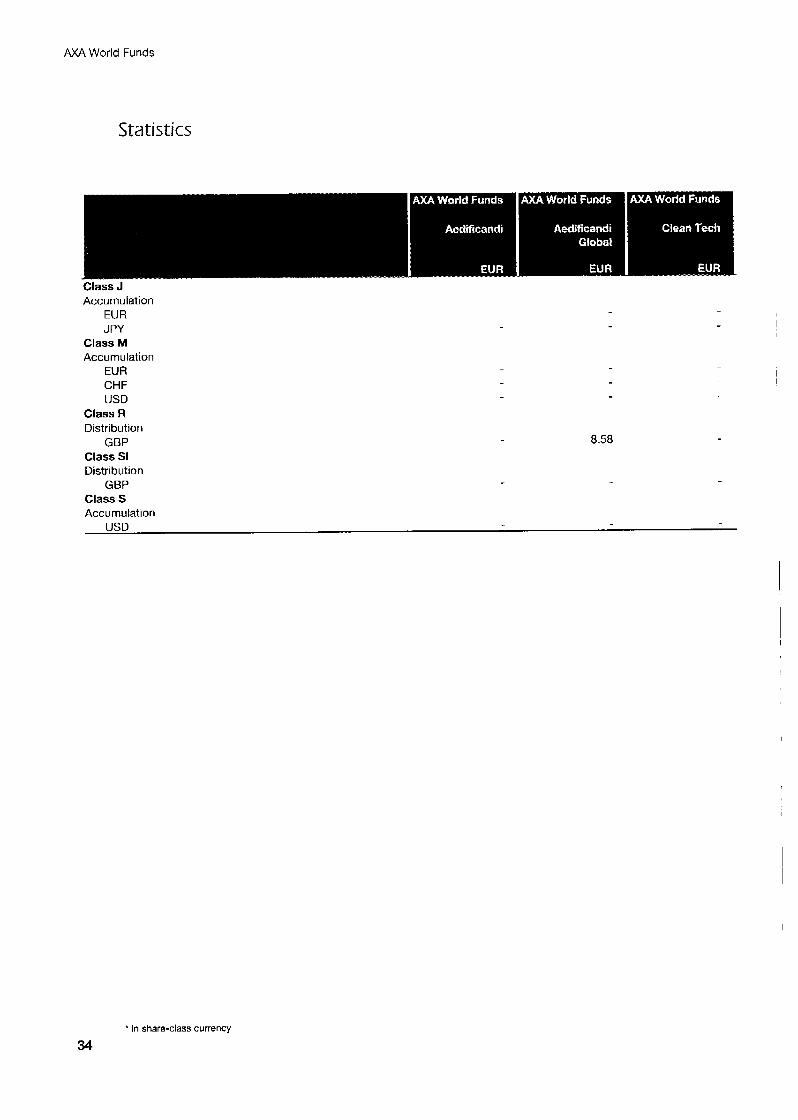
Class J Accumulation
EUR J PY
Class M Accumulation
EUR CHF USD
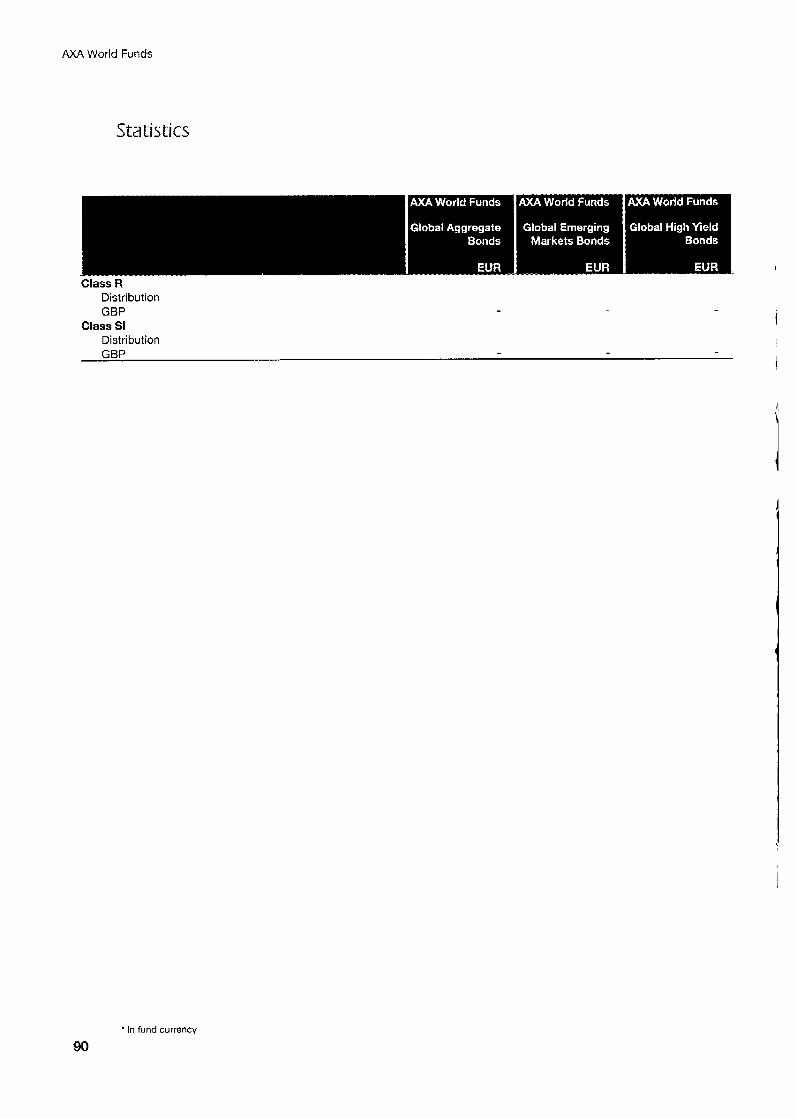
Class R Distribution
GBP Class SI Distribution
GBP Class S Accumulation
USD
8.58
* In share-class currency
34
AXA World Funds
Statistics
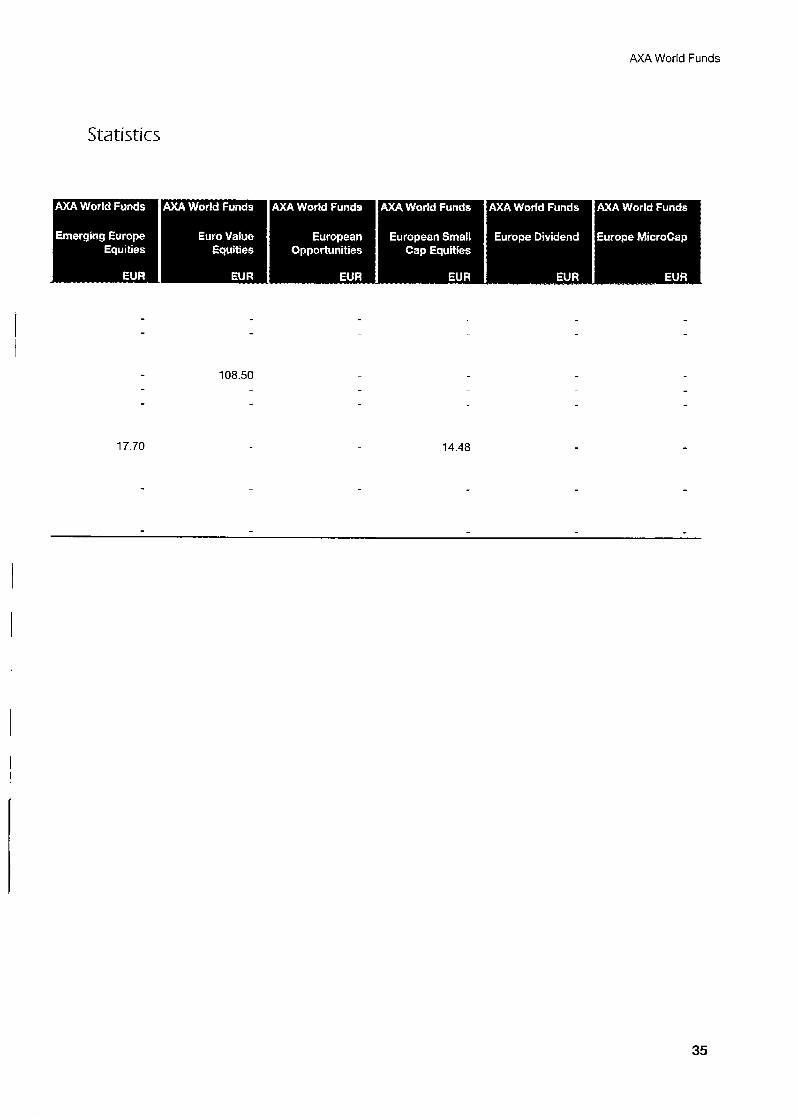
17.70
108.50
14.48
35
AXA World Funds
Statistics
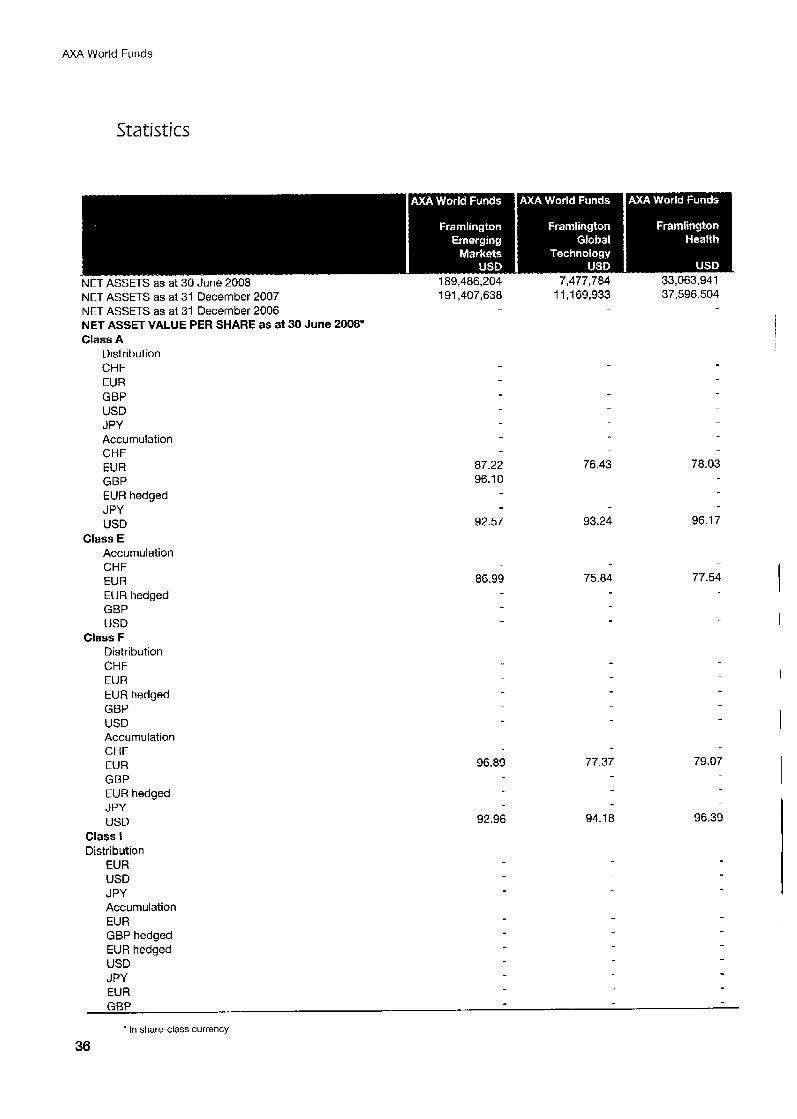
NET ASSETS as at 31 December 2007 NET ASSETS as at 31 December 2006 NET ASSET VALUE PER SHARE as at 30 June 2008* Class A
Distribution CHF EUR GBP USD JPY Accumulation CHF EUR GBP EUR hedged J PY USD
Class E Accumulation CHF EUR EUR hedged GBP USD
Class F Distribution CHF EUR EUR hedged GBP USD Accumulation CHF EUR GBP EUR hedged JPY USD
Class I Distribution
EUR USD J PY Accumulation EUR GBP hedged EUR hedged USD JPY EUR
189,486,204 7,477,784 191,407,638 11,169,933
87.22 96.10
92.57
86.99
96.89
92.96
76.43
93.24
75.84
77.37
94.1 8
37,596,504
78.03
96.1 7
77.54
79.07
96.39
GBP
- In share-class currency
36

AXA World Funds
Statistics
501,102,228 34,425,164 89,168,886 35,065,452 99,232,644 63,856,212 8,i 26,953,448 20,901,652 64,018,822 60,780,702 96,645,981 190,547,706 6,671,549,875 68,198,350 74,456,963 69,936,189
67.71
7,594.52
66.85
68.62
7,697.34
79.60
93.48
80.00
120.79
120.76
122.68
143.74
144.22
148.67
156.59
151 -97
159.71
168.79
71.06
141.73
174.1 1
121.27
144.27
174.94
35.63 22.48
36.12 22.52
38.96
38.93
37

AXA World Funds
Statistics
Class J Accumulation EUR J PY
Class M Accumulation EUR CHF USD
Class R Distribution GBP
Class SI Distribution GBP
Class S Accumulation USD
’ In share-class currency
38
AXA World Funds
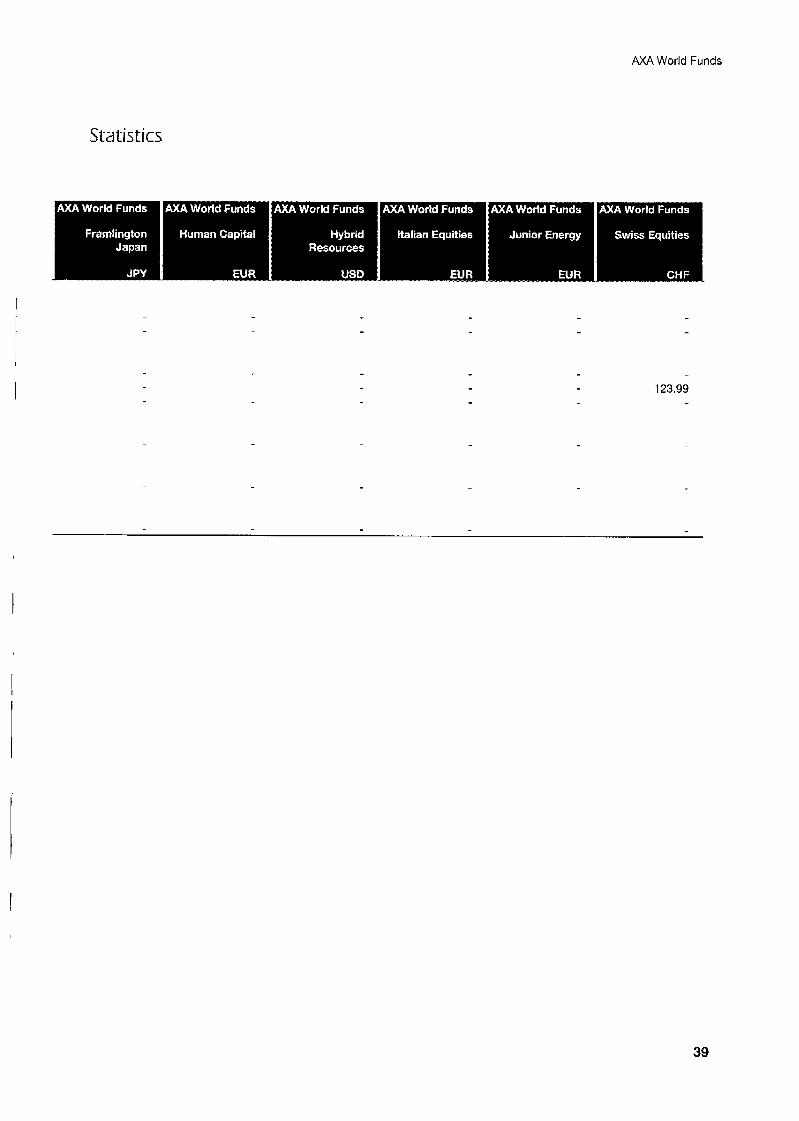
Statistics
123.99
39
AXA World Funds
Statistics
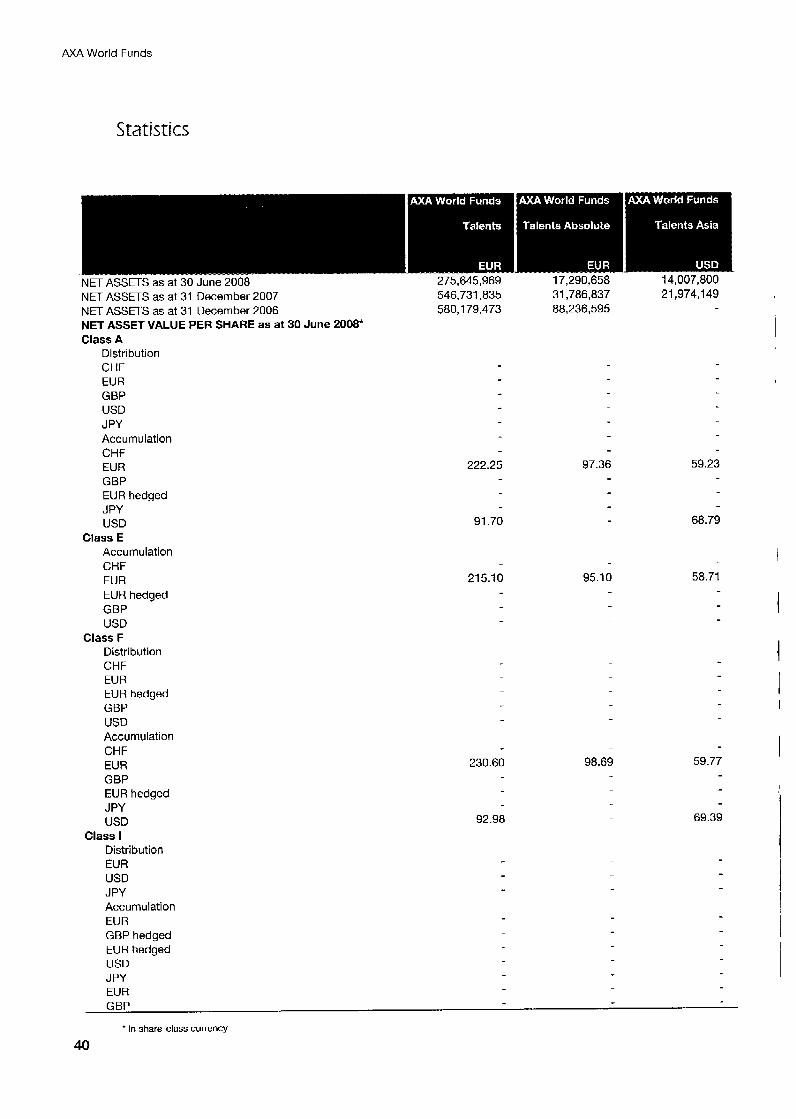
NET ASSETS as at 31 December 2007 546,731,835 31,786,837 21,974,149 NET ASSETS as at 31 December 2006 580,179,473 88,236,595 NET ASSET VALUE PER SHARE as at 30 June 2008* Class A
Distribution CHF EUR GBP USD J PY Accumulation CHF EUR GBP EUR hedged JPY USD
Class E Accumulation CHF EUR
222.25
91.70
21 5.1 0
97.36
95.10
59.23
68.79
58.71 EUR hedged GBP USD
Class F Distribution CHF EUR EUR hedged GBP USD Accumulation CHF EUR GBP EUR hedged J PY USD 92.98
Distribution EUR USD J PY Accumulation EUR GBP hedged EUR hedged USD J PY EUR GBP
230.60 98.69 59.77
69.39 Class I
* In share-class currency
40
I
AXA World Funds
Statistics
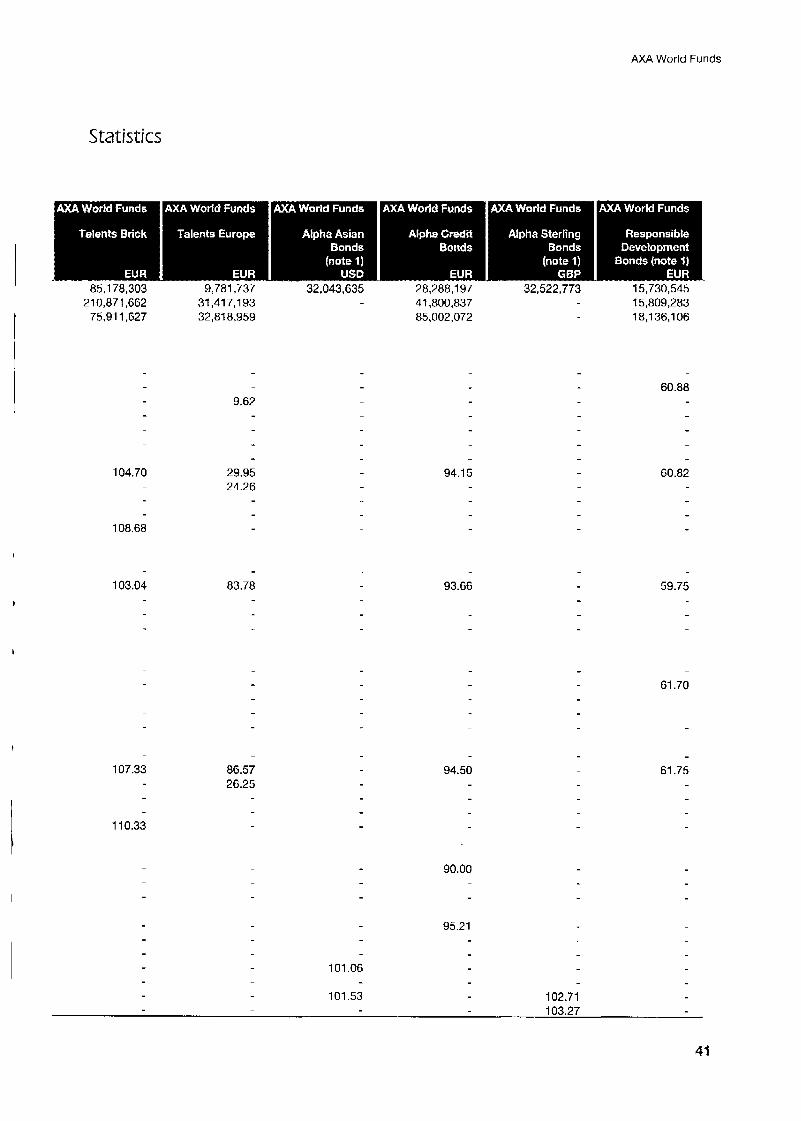
210,871,662 31,417,193 75,911,627 32,818,959
104.70
108.68
103.04
107.33
1 10.33
9.62
29.95 24.26
83.78
86.57 26.25
101.06
101.53
41,800,837 85,002,072
94.15
93.66
94.50
90.00
95.21
15,809,283 18,136,106
102.71
60.88
60.82
59.75
61.70
61.75
AXA World Funds
Statistics
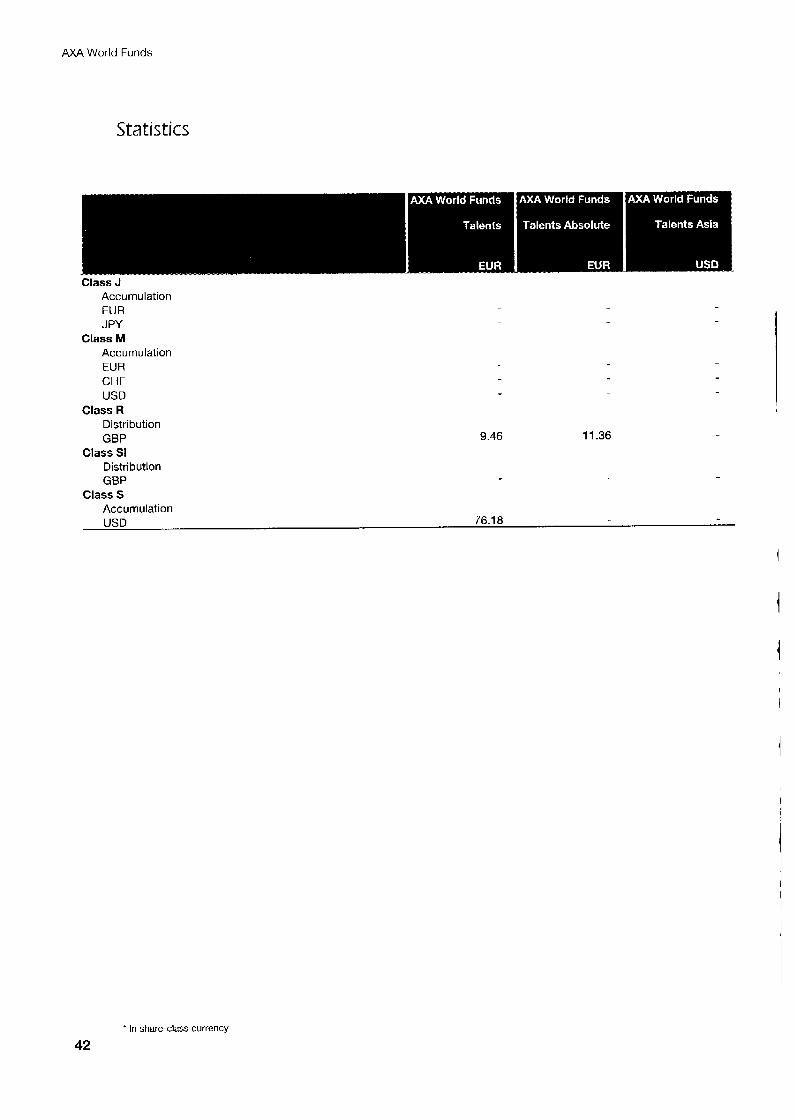
Class J Accumulation EUR J PY
Class M Accumulation EUR CHF USD
Class R Distribution GBP 9.46 11.36
Class SI Distribution GBP
Class S Accumulation USD 76.1 8
* In share-class currency
42
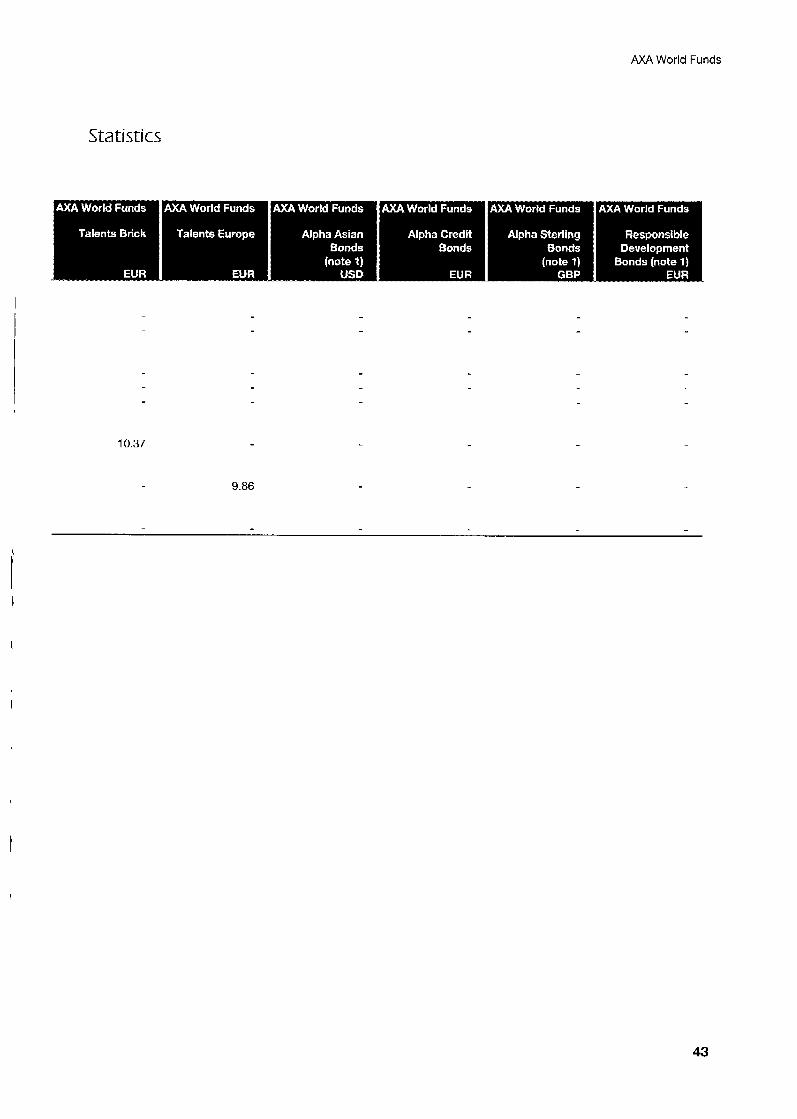
AXA World Funds
Statistics
10.37
9.86
I
43
AXA World Funds
Statistics
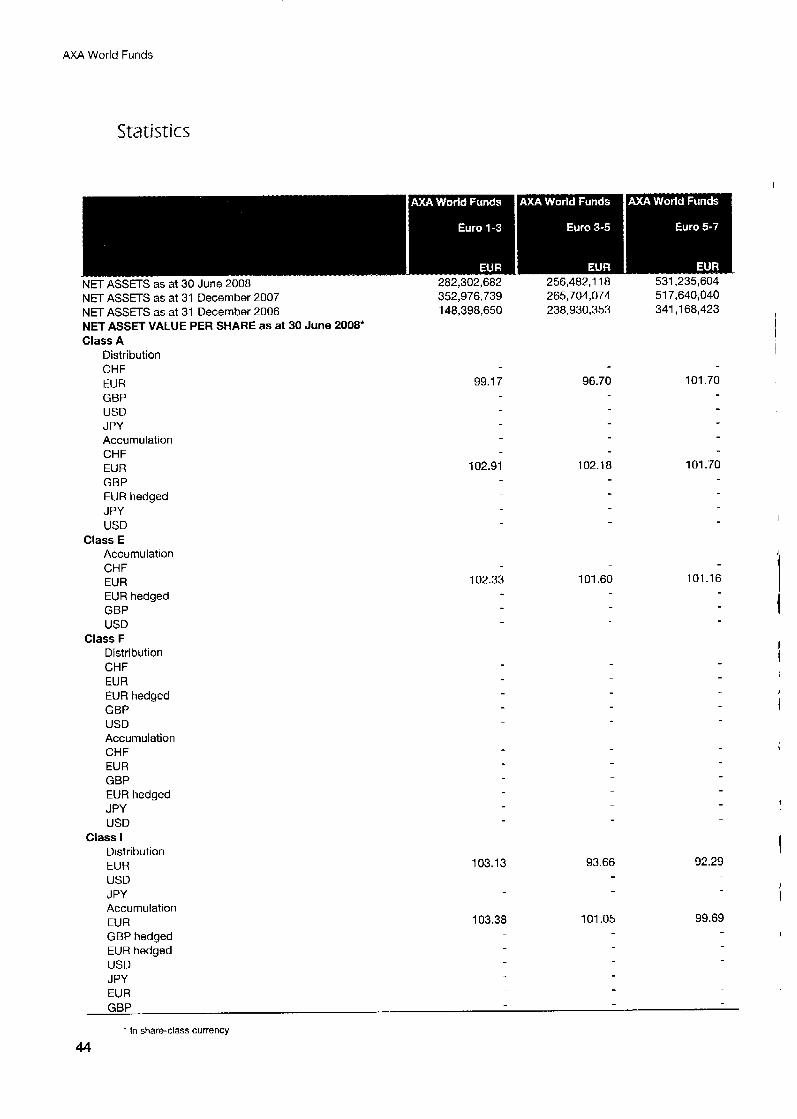
NET ASSETS as at 30 June 2008 NET ASSETS as at 31 December 2007
282,302,682 352,976,739
NET ASSETS as at 31 December 2006 NET ASSET VALUE PER SHARE as at 30 June 2008* Class A
Distribution CHF EUR GBP USD J PY Accumulation CHF EUR GBP EUR hedged J PY USD
Class E Accumulation CHF EUR EUR hedged GBP USD
Class F Distribution CHF EUR EUR hedged GBP USD Accumulation CHF EUR GBP EUR hedged J PY USD
Class I Distribution EUR USD J PY Accumulation EUR GBP hedged EUR hedged USD J PY EUR
148,398,650
99.1 7
102.91
102.33
103.13
103.38
256,482,118 265,704,074 238,930,353
96.70
102.1 8
101.60
93.66
101.05
531,235,604 51 7,640,040 341,168,423
101.70
101.70
101.16
92.29
99.69
GBP
- In share-class currency
44
AXA World Funds
5 ta tistics
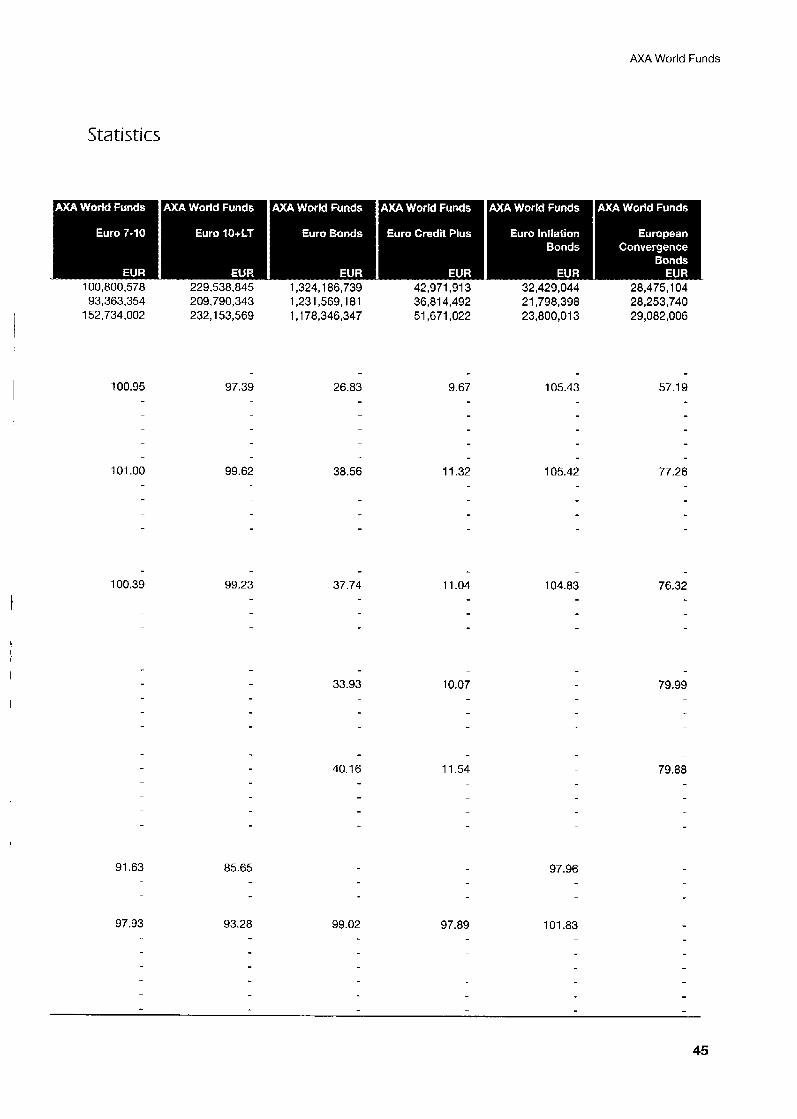
. . . . . . .
93,363,354 209,790,343 1,231,569,181 36,814,492 21,798,398 28,253,740 152,734,002 232,153,569 1,178,346,347 51,671,022 23,800,013 29,082,006
97.39 9.67 105.43 57.19 100.95 26.83
105.42 77.26 99.62 11.32 101 .oo 38.56
100.39 37.74 11.04 76.32 99.23 104.83
33.93 79.99 10.07
40.16 11.54 79.88
91.63 85.65 97.96
97.93 93.28 99.02 97.89 101.83
45
AXA World Funds
Statistics
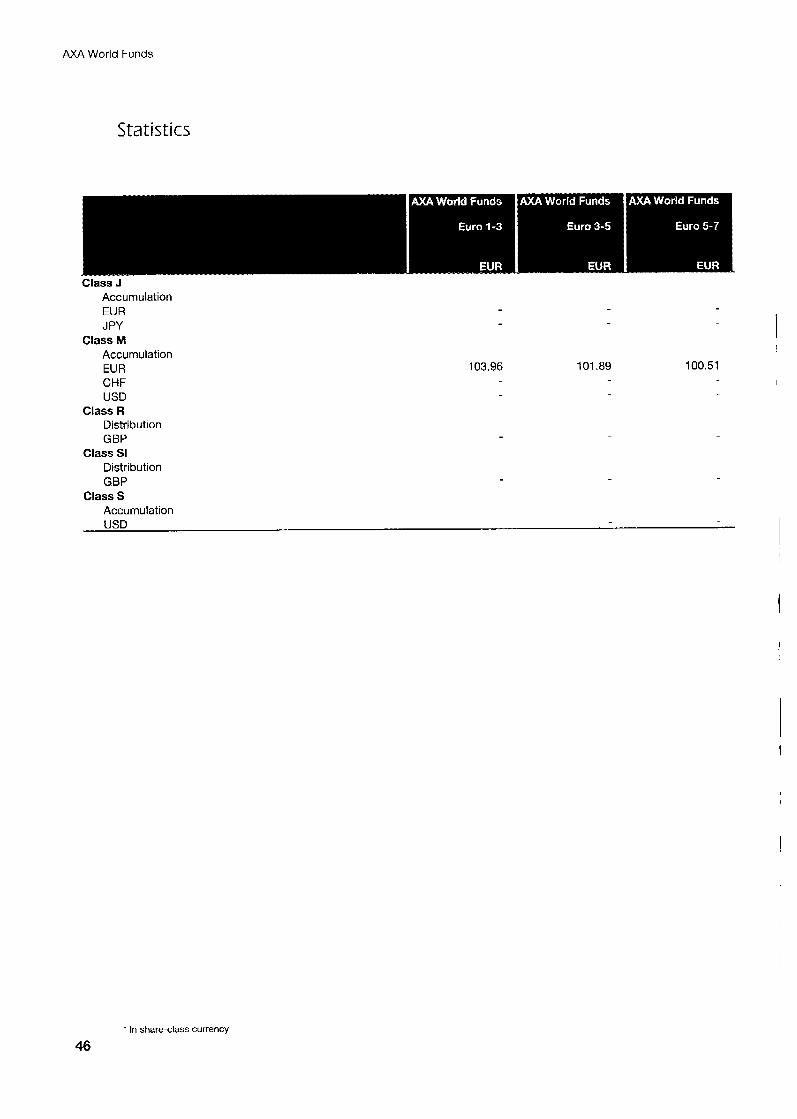
Class J Accumulation EUR J PY
Class M Accumulation EUR CHF USD
Class R Distribution GBP
Class SI Dtstri bution GBP
Class S Accumulation
103.96 101.89 100.51 I
USD
* In share-class currency
46
AXA World Funds
Statistics
98.84 94.10
97.33 10,945.46
99.85 11.78 102.23
t
I
47
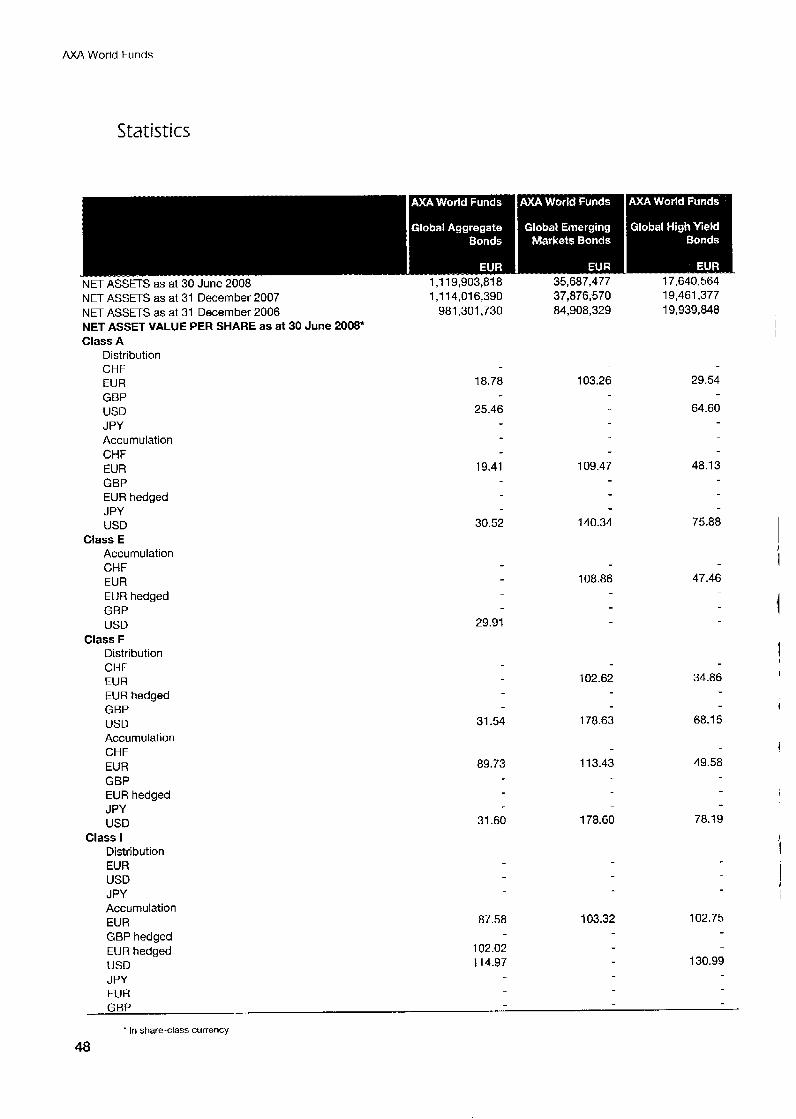
AXA World Funds
. . - . . . - - .
NET ASSETS as at 31 December 2007 NET ASSETS as at 31 December 2006 NET ASSET VALUE PER SHARE as at 30 June 2008* Class A
Distribution CHF EUR GBP USD J PY Accumulation CHF EUR GBP EUR hedged J PY USD
Class E Accumulation CHF EUR EUR hedged GBP USD
Class F Distribution CHF EUR EUR hedged GBP USD Accumulation CHF EUR GBP EUR hedged JPY USD
Class I Distribution EUR USD J PY Accumulation EUR GBP hedged EUR hedged USD JPY EUR
1.1 14,016,390 981,301,730
18.78
25.46
19.41
30.52
29.91
31.54
89.73
31.60
87.58
102.02 114.97
35,687,477 37,876,570 84,908,329
103.26
109.47
140.34
108.86
102.62
178.63
1 1 3.43
178.60
103.32
17,640,564 19,461,377 19,939,848
I
29.54
64.60
48.13
75.88
47.46
34.86
68.1 5
I
I
49.58
I
78.19
102.75
130.99
GBP
In share-class currency
48

AXA World Funds
Statistics
77,919,414 1 13,275,290 100,426,467 88,572,301 11 0,225,421 84,718,799 37,259,824 82,892,220 296,559,265 90.1 70,865 154,667,410 102,383,144 18,997,308 30,206,873 397,777,753 107,020,759 131,726.91 7 126,504,127
108.59
133.56
43.66
52.95
48.22 51.41
53.36 51.38
44.44
100.69
108.1 4 103.1 7
52.22 51.47 50.33
56.26 56.86 54.94 21.51
21.79
56.05 54.77 56.62
104.77
106.06
45.12
45.50
108.99 21.84
108.95
105.28 106.40
96.72
99.40 21.58
49
AXA World Funds
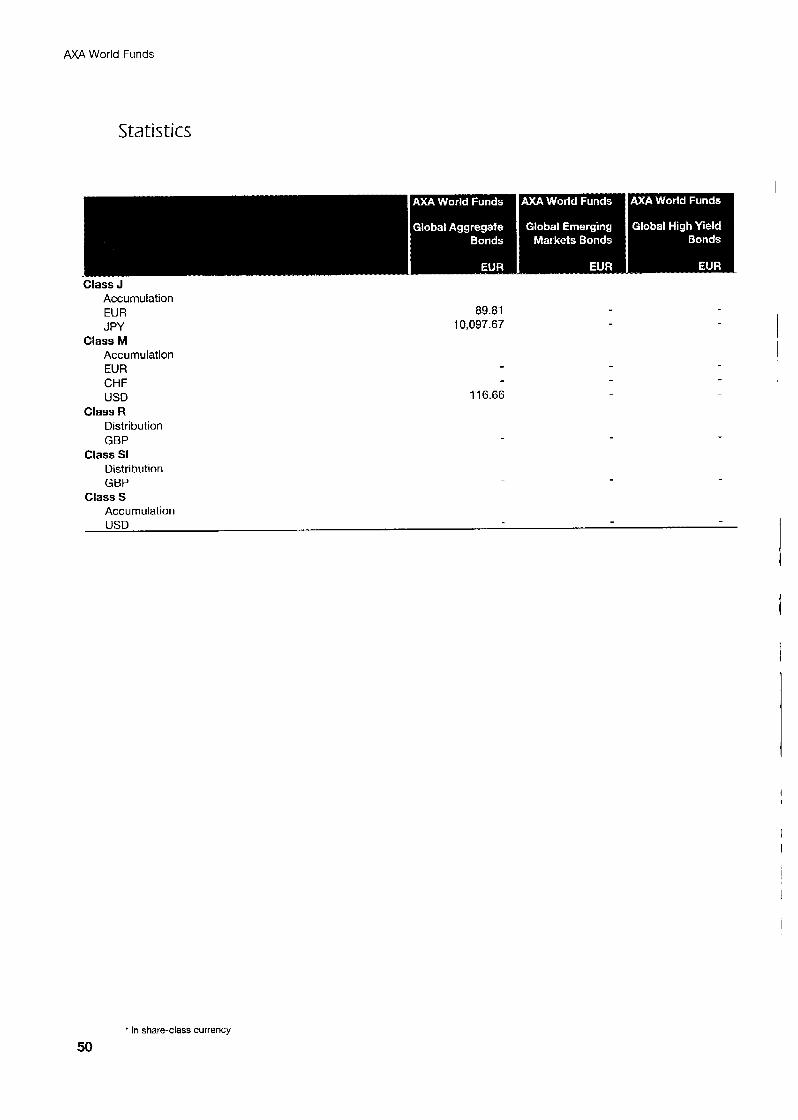
Statistics
Class J Accumulation EUR JPY
Class M Accumulation EUR CHF USD
Class R Distribution GBP
Class SI Distribution GBP
Class S Accumulation
89.81 10.097.67
11 6.66
USD
' In share-class currency
50
AXA World Funds
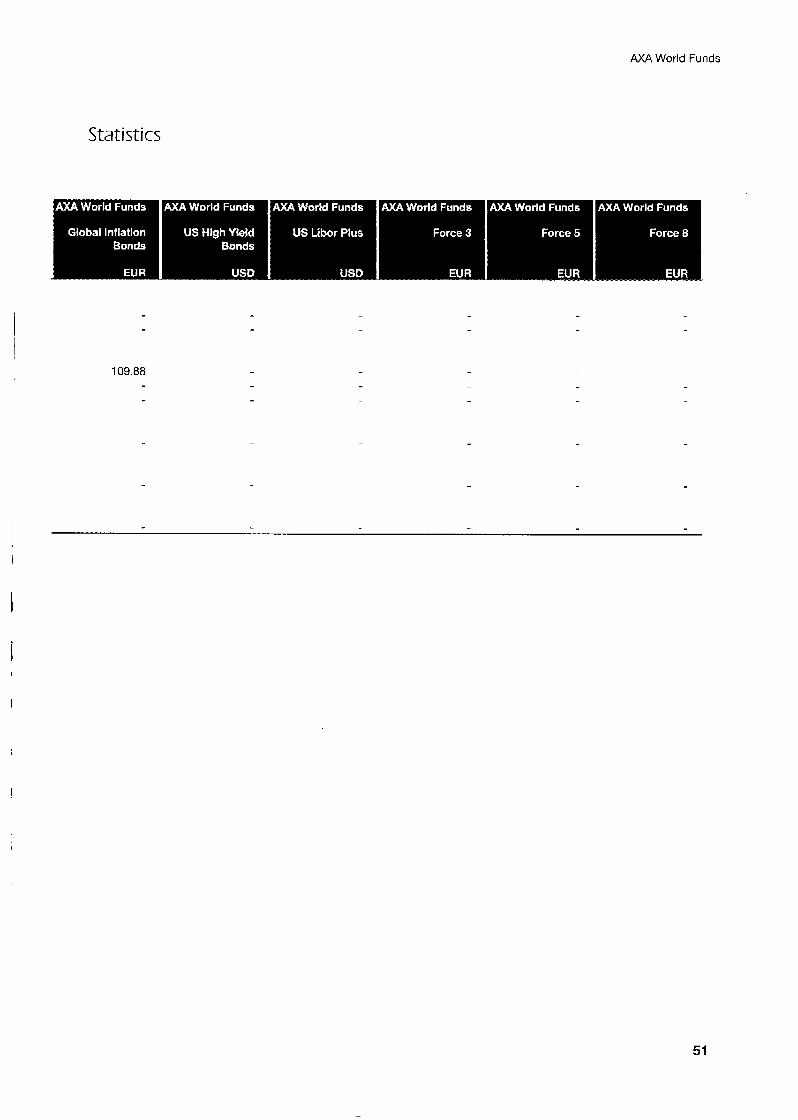
Statistics
109.88
51
AXA World Funds
Statistics
NET ASSEFS as at 31 December 2007 NET ASSETS as at 31 December 2006 NET ASSET VALUE PER SHARE as at 30 June 2008* Class A
Distribution CHF EUR GBP USD J PY Accumulation CHF EUR GBP EUR hedged J PY USD
Class E Accumulation CHF EUR EUR hedged GBP USD
Class F Distribution CH F EUR EUR hedged GBP USD Accumulation CHF EUR GBP EUR hedged J PY USD
Distribution EUR USD J PY Accumulation EUR GBP hedged EUR hedged USD JPY EUR
Class I
58,245,890 66,866,313
124.1 8
149.14
146.00
127.54
153.08
106.26 107.92
287,2i 1,138 126,485,769 70,390,209
11,774.76
1 3,049.16
12,879.62 i
131,740.59
1 33,122.1 2
I
109,456.1 5
GBP
* In share-class currency
52
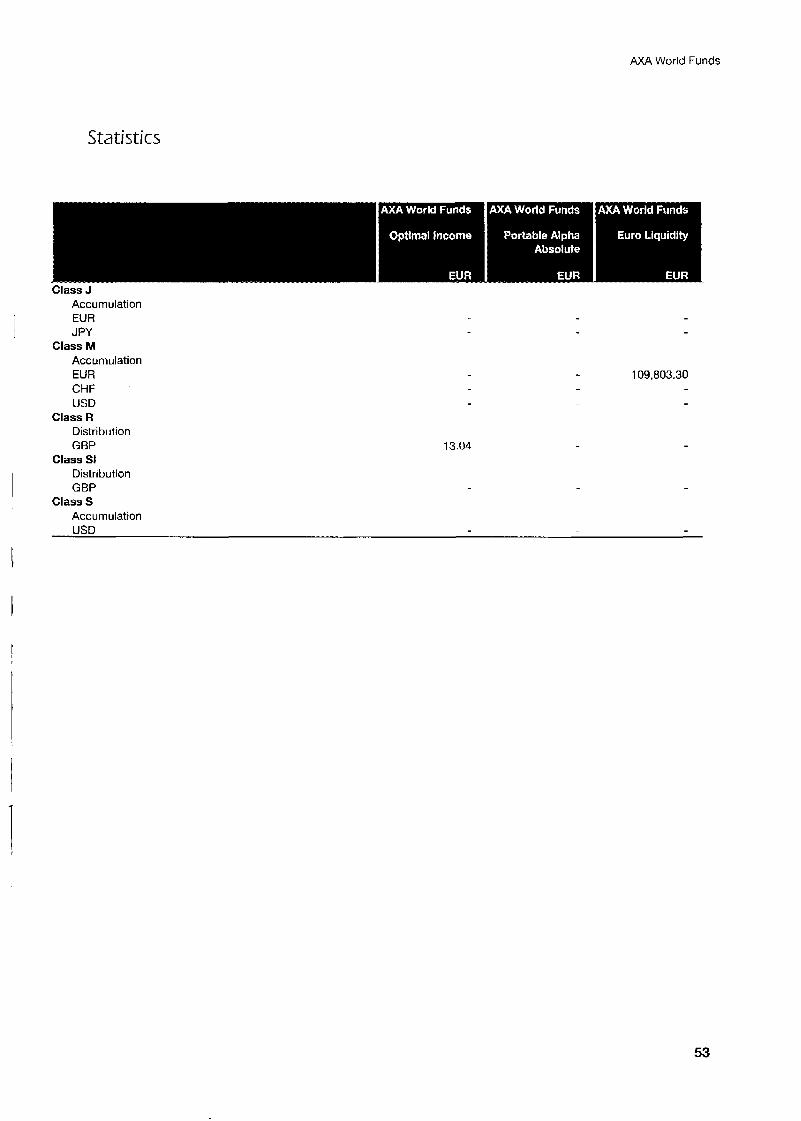
AXA World Funds
Statistics
13.04
Class J Accumulation EUR JPY
Class M Accumulation EUR CHF USD
Class R Distribution GBP
Class SI Distribution GBP
Class S Accumulation USD
109,803.30
53
AXA World Funds
Statistics
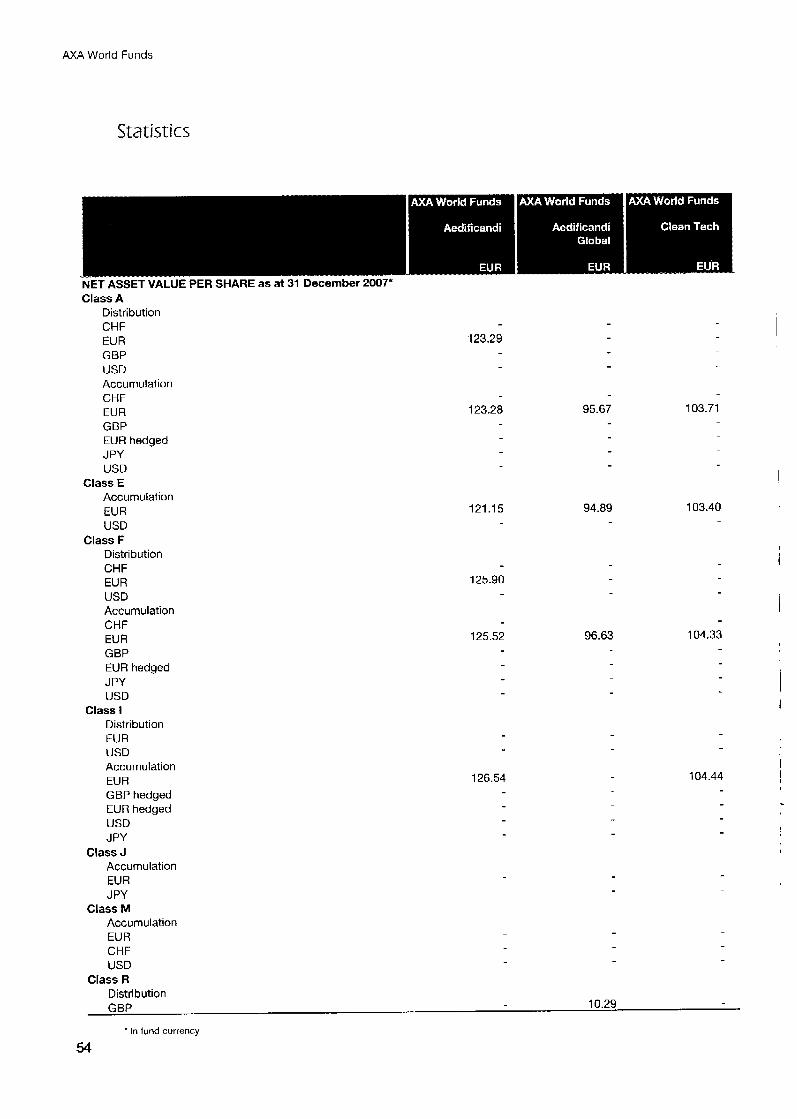
NET ASSET VALUE PER SHARE as at 31 December 2007* Class A
Distribution CHF EUR 123.29 GBP USD Accumulation CHF EUR 123.28 103.71
GBP EUR hedged J PY USD
Class E Accumulation EUR USD
Class F Distribution CHF EUR 125.90 USD Accumulation CHF EUR GBP EUR hedged JPY USD
Distribution EUR USD Accumulation EUR GBP hedged EUR hedged USD J PY
Class J Accumulation EUR J PY
Class M Accumulation EUR CHF USD
Class R Distribution GBP
121.15 103.40
125.52 104.33
Class I
126.54 104.44
10.29
* In fund currency
54
95.67
94.89
96.63
1
I
AXA World Funds
Statistics
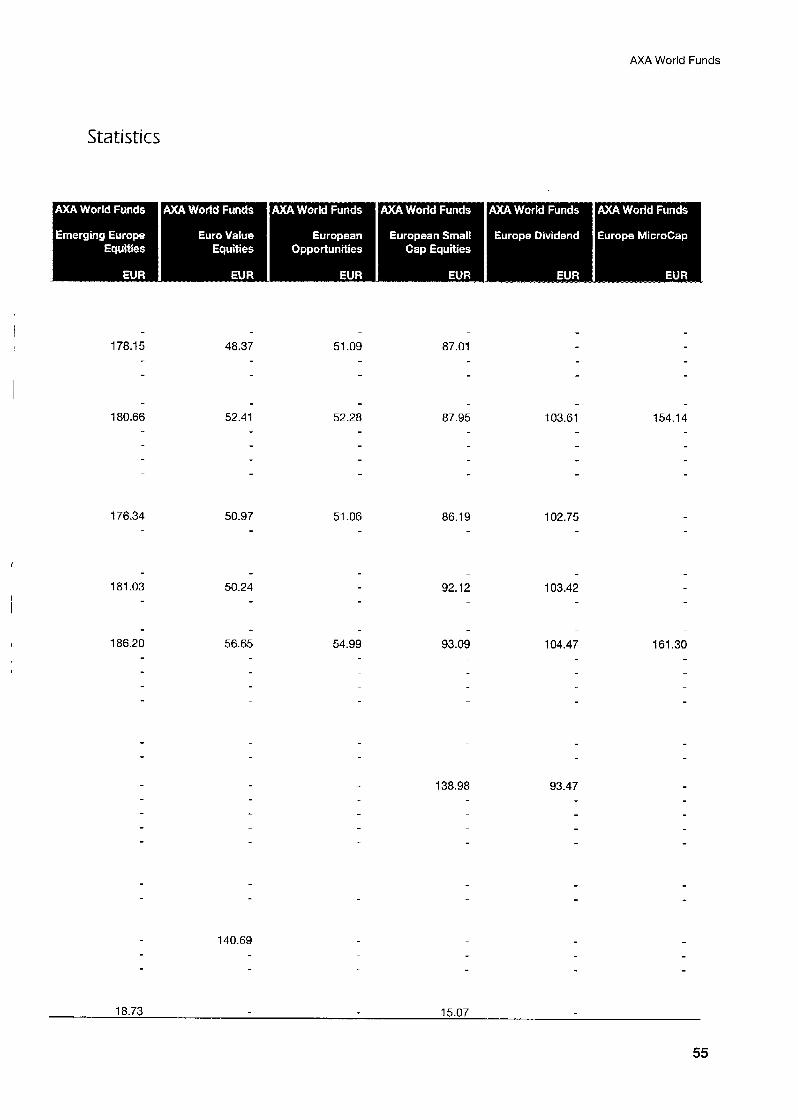
178.15 48.37 51.09 87.01
180.66 52.41 52.28 87.95 103.61 154.14
176.34 50.97 51.06 86.19 102.75
I
181.03 50.24 92.12 103.42
186.20 54.99 93.09 56.65 104.47 161.30
138.98 93.47
140.69
18.73 15.07
55
AXA World Funds
Statistics
Class SI Distribution GBP
Class S Accumulation I
USD
\
* In fund currency
56

AXA World Funds
Statistics
I
57
AXA World Funds
Statistics
Class A Distribution CHF EUR GBP USD Accumulation CHF EUR GBP EUR hedged J PY USD
Class E Accumulation EUR USD
Class F Distribution CHF EUR USD Accumulation CHF EUR GBP EUR hedged J PY USD
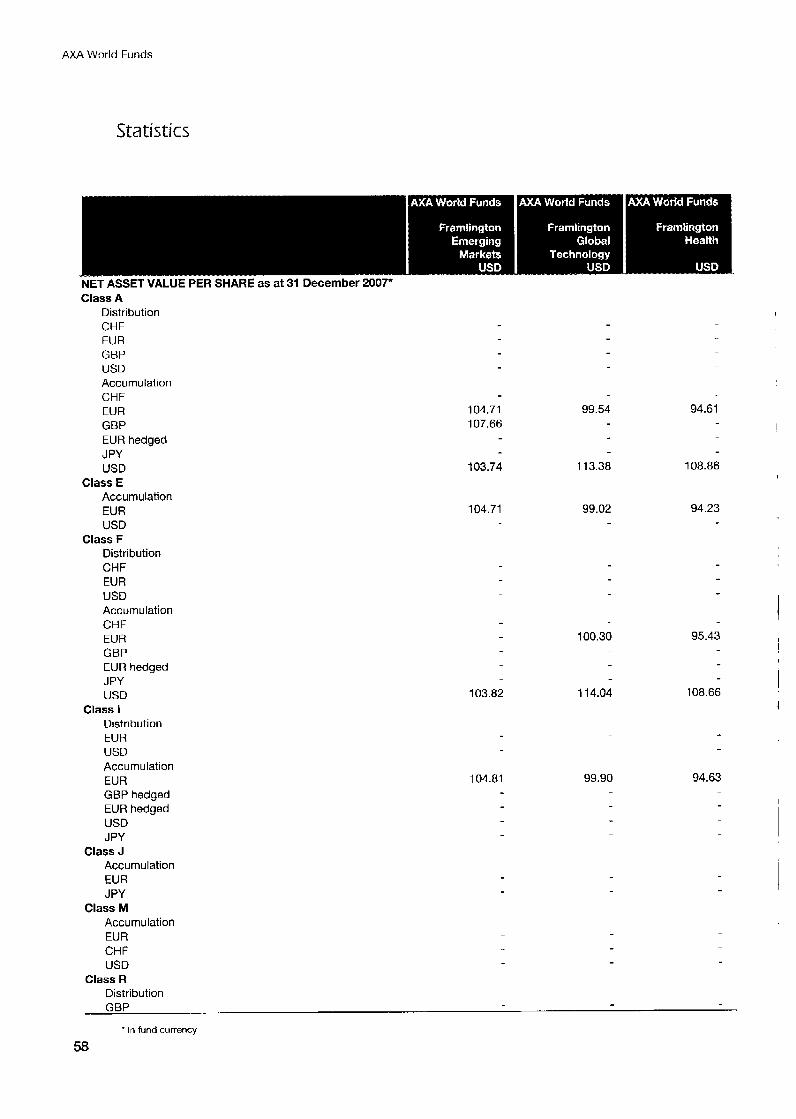
Distribution EUR USD Accumulation EUR 104.81 99.90 94.63
GBP hedged EUR hedged USD J PY
Class J Accumulation EUR J PY
Class M Accumulation EUR CH F USD
Class R Distribution GBP
Class I
* In fund currency
58
104.71 107.66
99.54 94.61
103.74
104.71
103.82
113.38
99.02
100.30
1 14.04
108.86
94.23
95.43
108.66
AXA World Funds
Statistics
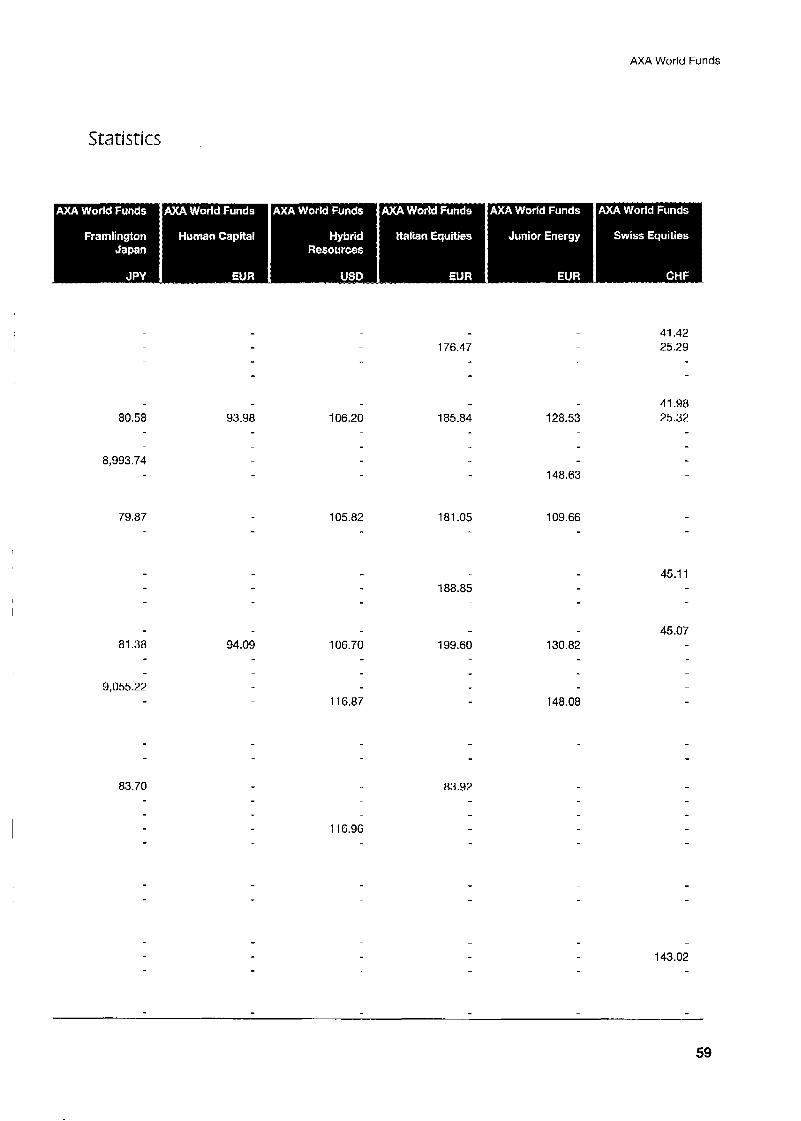
176.47 41.42 25.29
80.58
8,993.74
106.20 185.84 128.53 41.98 25.32 93.98
148.63
79.87 105.82 181.05 109.66
188.85 45.1 1
81.38 94.09 106.70
1 16.87
199.60 130.82
148.08
45.07
9,055.22
83.70 83.92
11 6.96
143.02
59
AXA World Funds
Statistics
Class SI Distribution GBP
Class S Accumulation USD
I
' In fund currency
60

AXA World Funds
Statistics
I
61
AXA World Funds
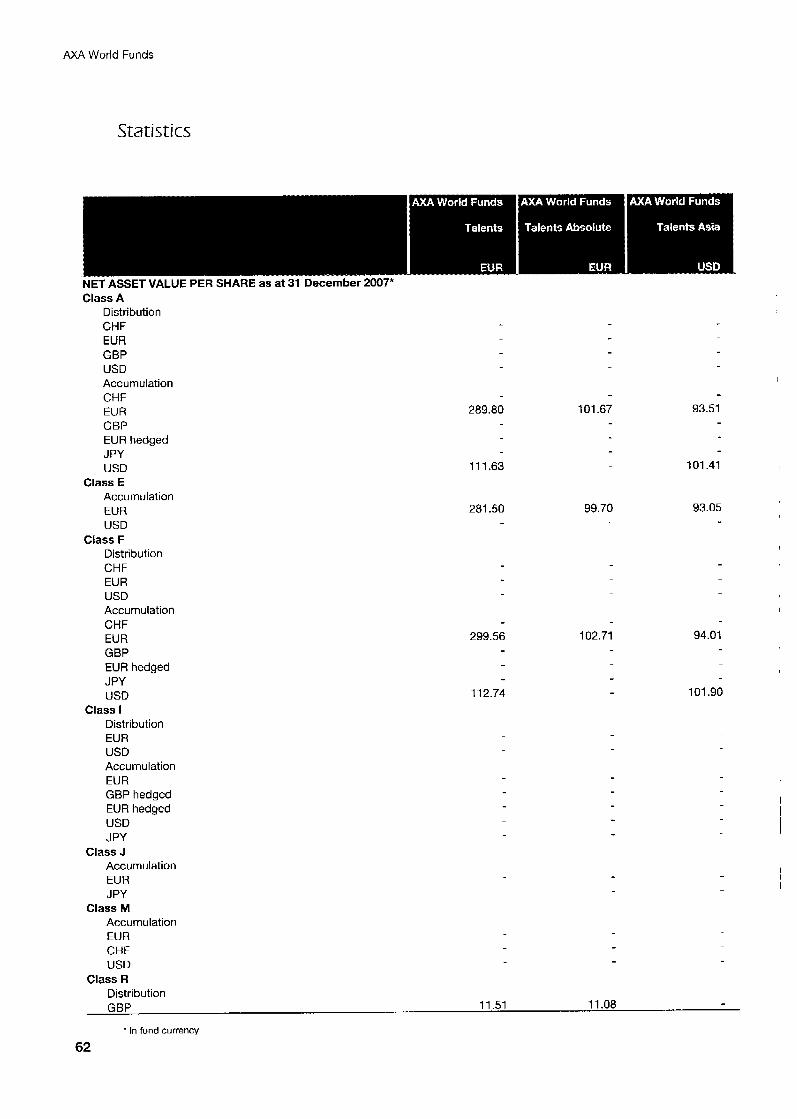
Statistics
NET ASSET VALUE PER SHARE as at 31 December 2007* Class A
Distribution CHF EUR GBP USD Accumulation CHF EUR 289.80 GBP EUR hedged JPY USD 111.63
Class E Accumulation EUR 281 50 USD
Class F Distribution CHF EUR USD Accumulation CHF EUR 299.56 GBP EUR hedged JPY USD 11 2.74
Distribution EUR USD Accumulation EUR GBP hedged ElJR hedged USD J PY
Class J Accumulation EUR J PY
Class M Accumulation EUR CHF USD
Class R Distribution GBP 11 5 1 11.08
Class I
' In fund currency
62
101.67
99.70
102.71
I
93.51
101.41
93.05
94.01
101.90
I
I
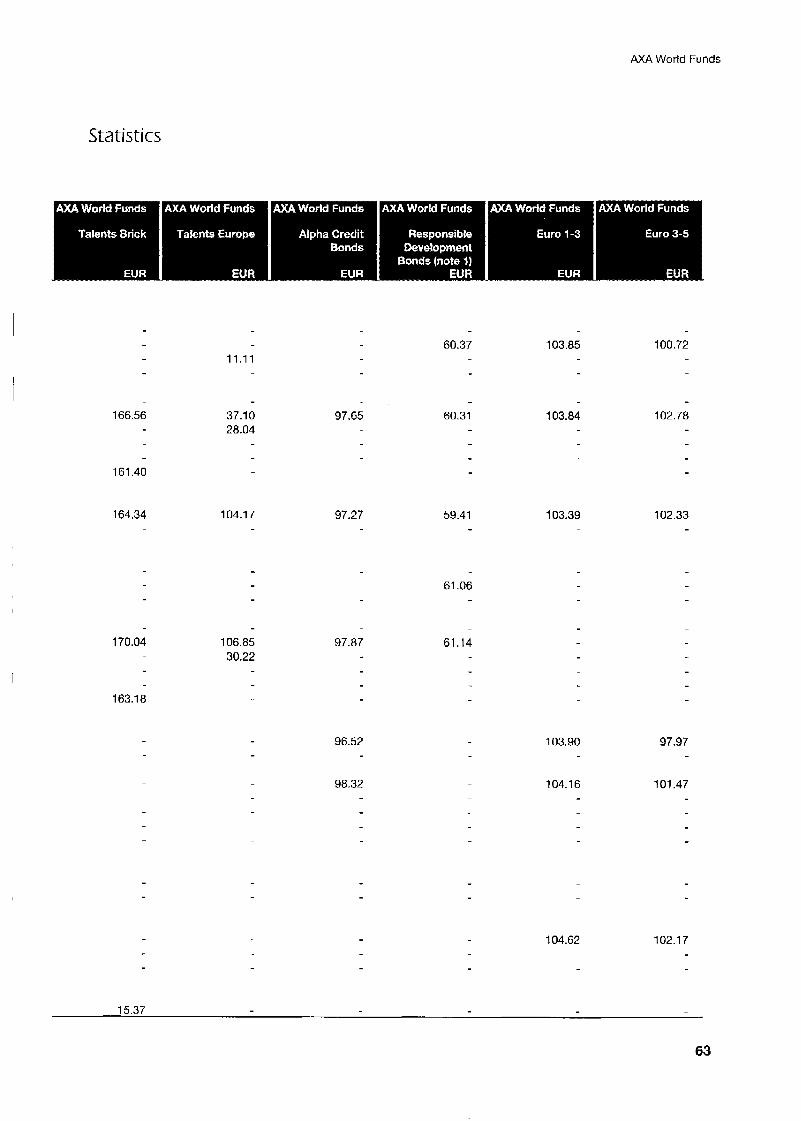
AXA World Funds
Statistics
11.11 60.37 103.85 100.72
166.56
161.40
37.10 28.04
97.65 60.31 103.84 102.78
164.34 104.1 7 97.27 59.41 103.39 102.33
61.06
170.04
163.1 8
97.87 106.85 30.22
61 .I4
96.52 103.90 97.97
98.32 104.16 101.47
104.62 102.17
15.37
63
AXA World Funds
Statistics
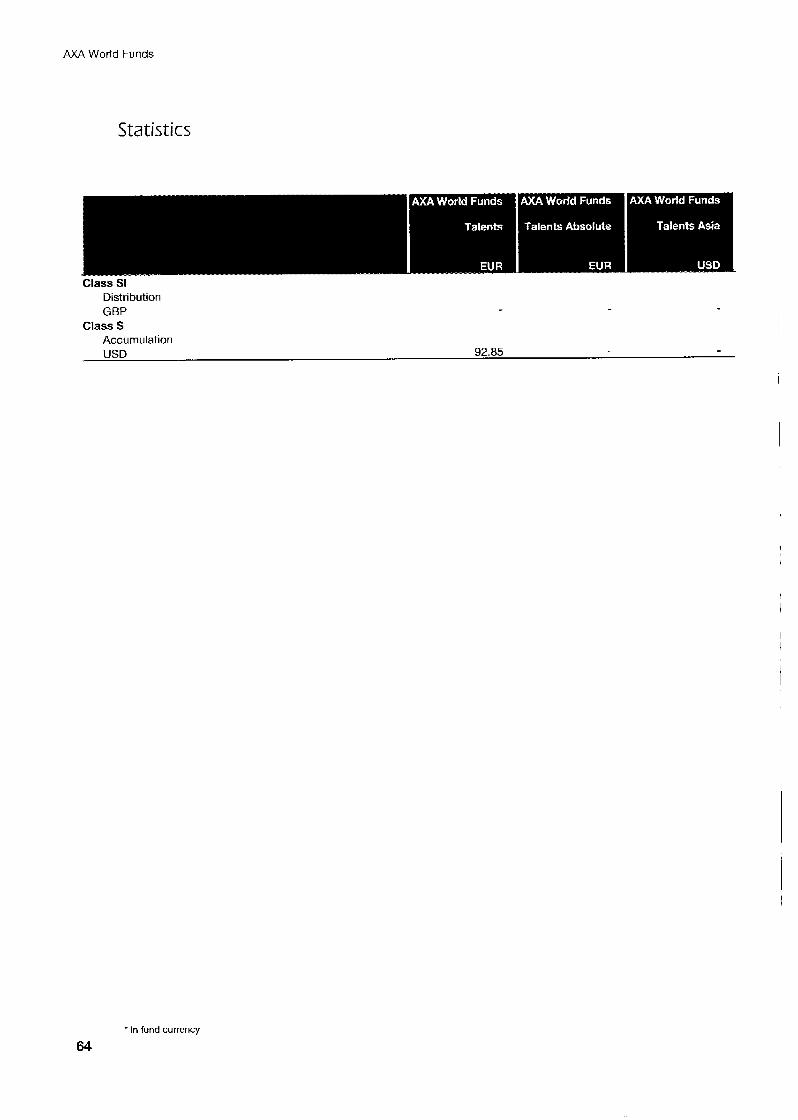
- - Class SI
Distribution GBP
Class S Accumulation USD 92.85
1
* In fund currency
64

AXA World Funds
Statistics
11.36
I
65
AXA World Funds
Statistics
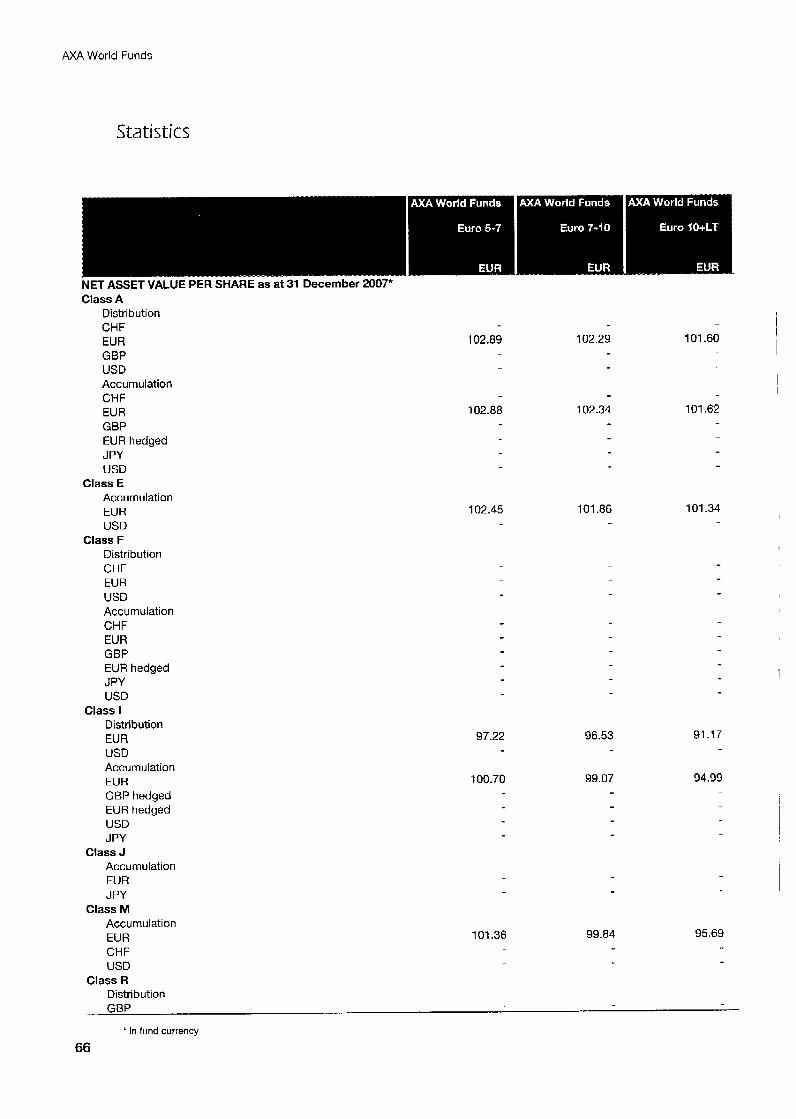
NET ASSET VALUE PER SHARE as at 31 December 2007* Class A
Distribution CHF EUR 102.89 102.29 101.60
GBP USD Accumulation CHF EUR 102.88 102.34 101.62
GBP EUR hedged J PY USD
Class E Accumulation
USD Class F
Distribution CHF EUR USD Accumulation CHF EUR GBP EUR hedged JPY USD
Distribution EUR USD Accumulation
GBP hedged EUR hedged USD J PY
Class J Accumulation EUR JPY
Class M Accumulation EUR CHF USD
Class R Distribution GBP
EUR 102.45 101.86 101.34
Class I
97.22 96.53 91.1 7
EUR 100.70 99.07 94.99
101.36 99.84 95.69
In fund currency
66
I
I

AXA World Funds
Statistics
10.29 102.84 19.50
25.56
109.48 28.07 58.26
38.88 102.85 20.1 6 109.49 11 5 9 75.42
29.56 131.07
38.1 5 1 1.33 102.38 74.69 109.01 29.03
34.18 30.54
10.77 78.04 105.54 166.31
40.44 11.78 77.92 93.00 113.11
I
30.58 166.28
99.1 3
99.60 99.90 99.15 90.65
101.55 111.12
102.92
99.43 11,123.80
93.04 10,407.47
100.29 12.01 99.43
1 12.53

AXA World Funds
Statistics
. - . .
Class SI Distribution GBP
Class S Accumulation USD
* In fund currency
68
AXA World Funds
Stat is t i cs
I
69
AXA World Funds
Statistics
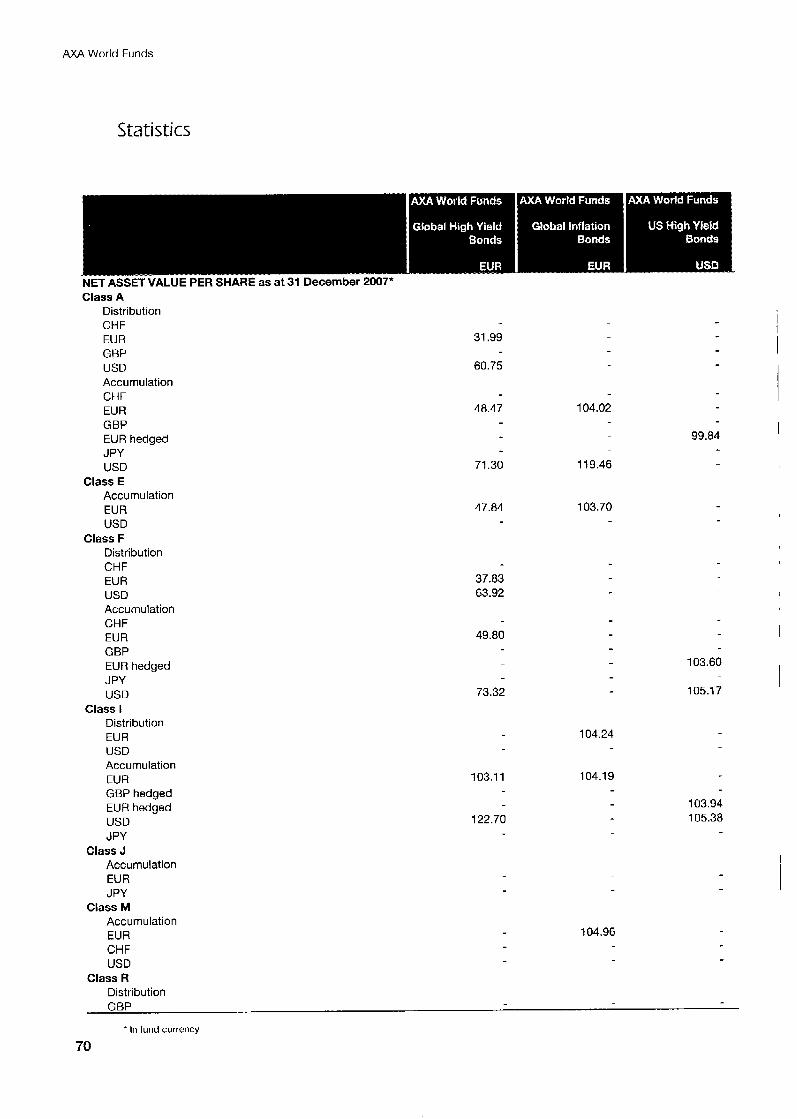
Class A Distribution CHF EUR GBP USD Accumulation CHF EUR 104.02
GBP EUR hedged JPY USD 119.46
Class E Accumulation EUR 103.70
USD Class F
Distribution CHF EUR USD Accumulation CHF EUR GBP EUR hedged J PY USD
Distribution EUR 104.24
USD Accumulation EUR 103.1 1 104.1 9 GBP hedged EUR hedged USD 122.70
JPY Class J
Accumulation EUR JPY
Class M Accumulation EUR 104.96
CHF USD
Class R Distribution GBP
99.84
103.60
105.17
Class I
103.94 105.38
+ In fund currency
70
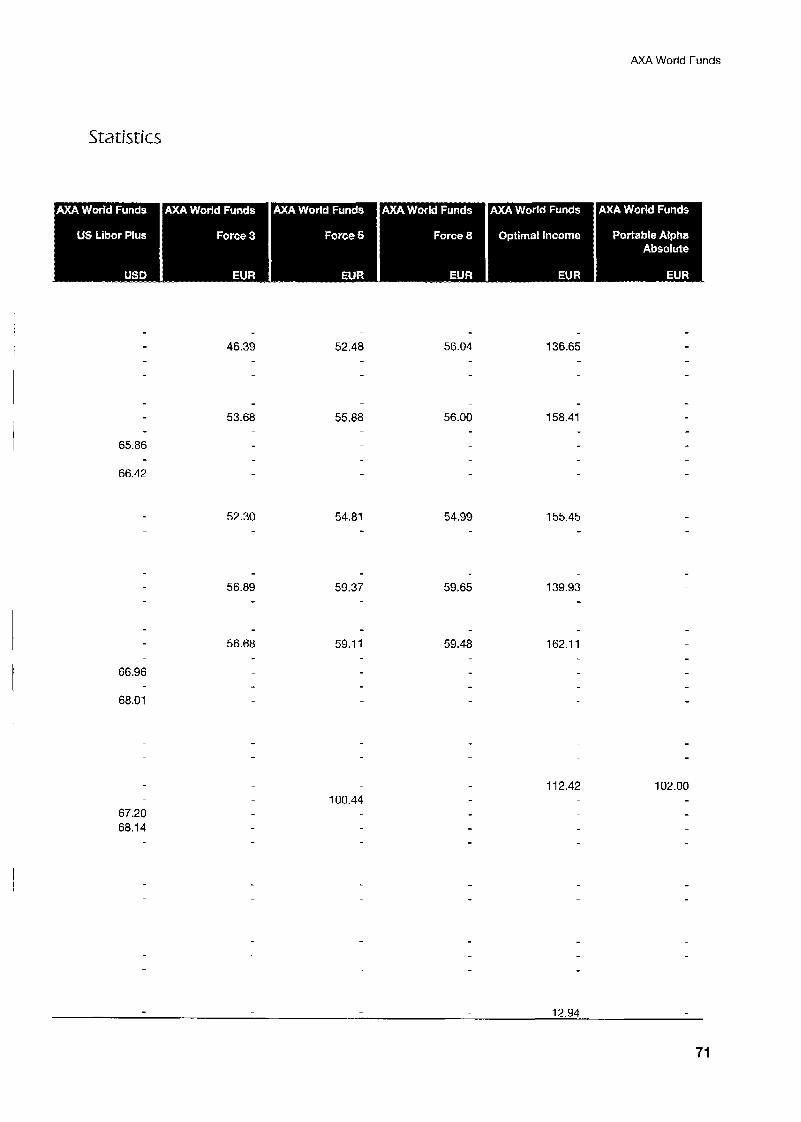
49.80
73.32
31.99
60.75
48.47
71.30
47.84
37.83 63.92
AXA World Funds
Statistics
46.39 52.48 56.04 136.65
65.86
66.42
53.68 158.41 55.88 56.00
52.30 54.81 54.99 155.45
56.89 59.37 59.65 139.93
56.68 59.1 1 59.48 162.11
66.96
68.01
1 12.42 102.00
67.20 68.14
100.44
12.94
71
AXA World Funds
Statistics
Class SI Distribution GBP
Class S Accumulation USD
* In fund currency
72
AXA World Funds
Statistics
73
AXA World Funds
Statistics
NET ASSET VALUE PER SHARE as at 31 December 2007* Class A
Distribution CHF EUR GBP USD Accumulation CHF EUR GBP EUR hedged J PY USD
Class E Accumulation EUR USD
Class F Distribution CHF EUR USD Accumulation CHF EUR GBP EUR hedged JPY USD
Class I Distribution
EUR USD Accumulation EUR GBP hedged EUR hedged USD J PY
Class J Accumulation EUR J PY
Class M Accumulation EUR CHF USD
Class R Distribution GBP
' In fund currency
74
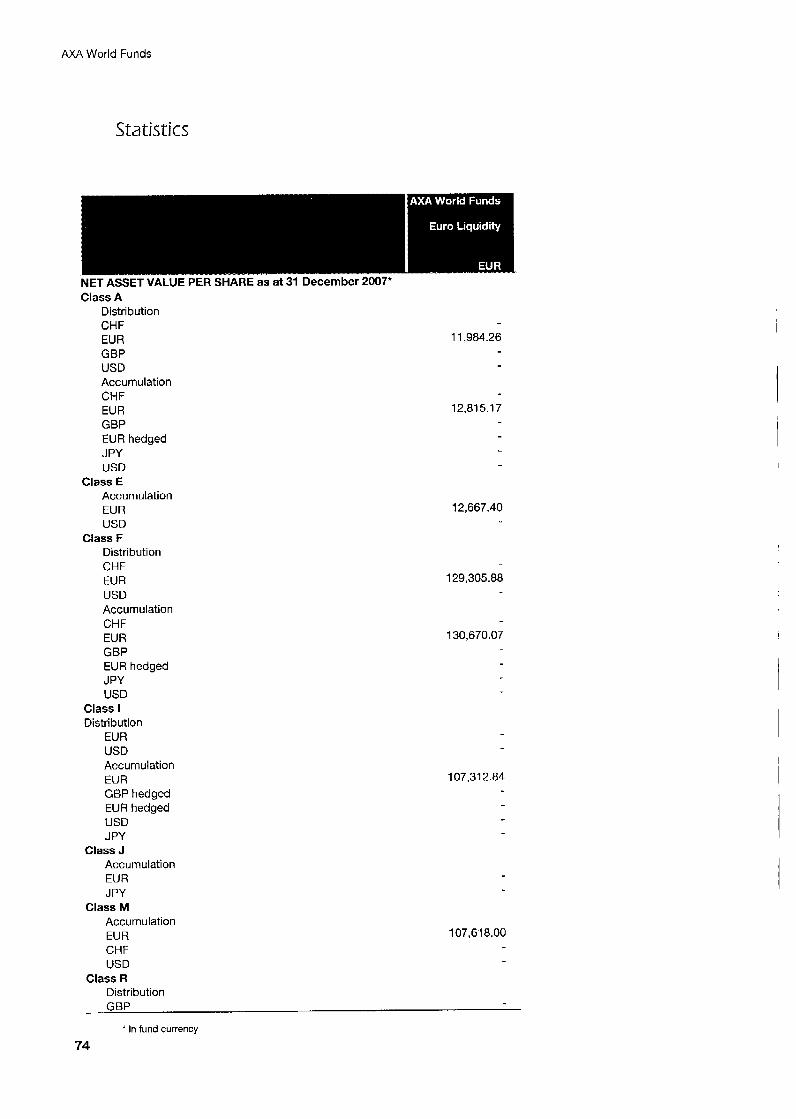
11,984.26
12,815.17
12,667.40
129,305.88
130,670.07
107.31 2.84
107.61 8.00
I
I
AXA World funds
Statistics
Distribution GBP
Class S Accumulation USD
75
A M World Funds
5 t a tis tics
Class A Distribution CHF EUR GBP USD Accumulation CHF EUR GBP JPY USD
Class E Accumulation CHF EUR EUR hedged GBP USD
Class F Distribution CHF EUR EUR hedged GBP USD Accumulation CHF EUR GBP EUR hedged J PY USD
Class I Distribution EUR USD Accumulation EUR GBP hedged EUR hedged USD
Class J Accumulation EUR J PY
Class M Accumulation EUR CHF USD
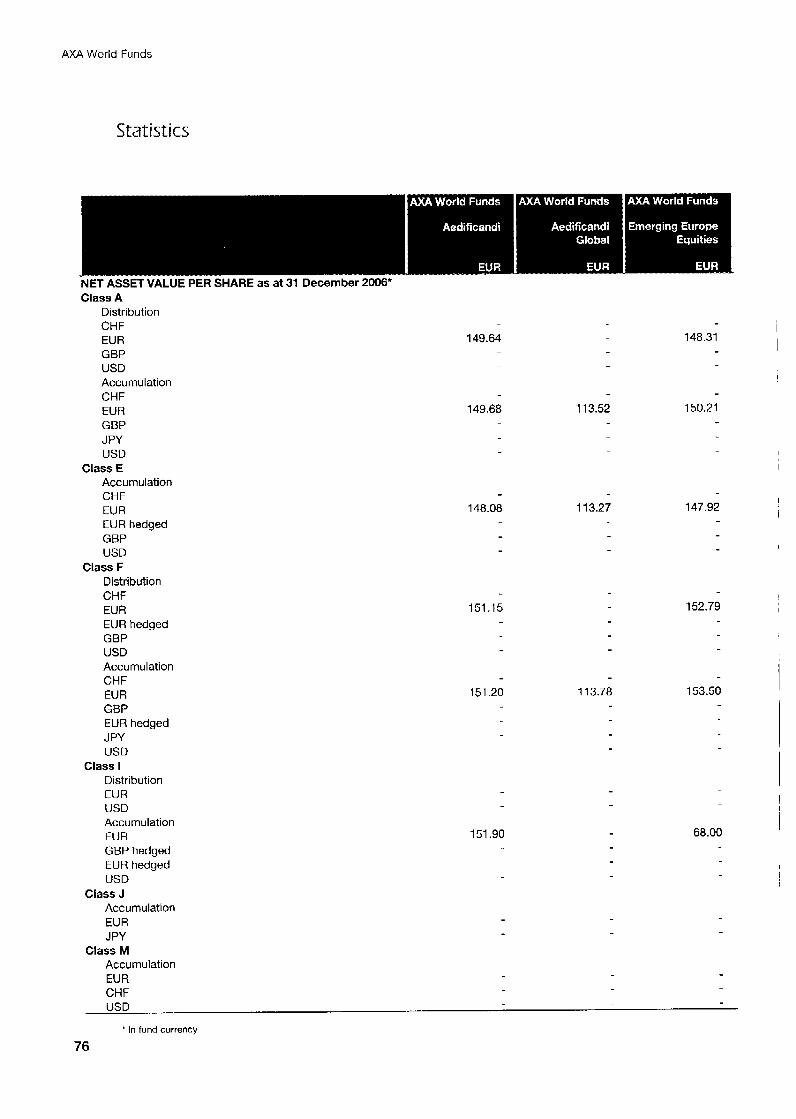
149.64
149.68
148.08
151.15
151.20
151.90
148.31
11 3.52 150.21
1 13.27
1 13.78
147.92
152.79
153.50
68.00
I
' In fund currency
76
AXA World Funds
Statistics
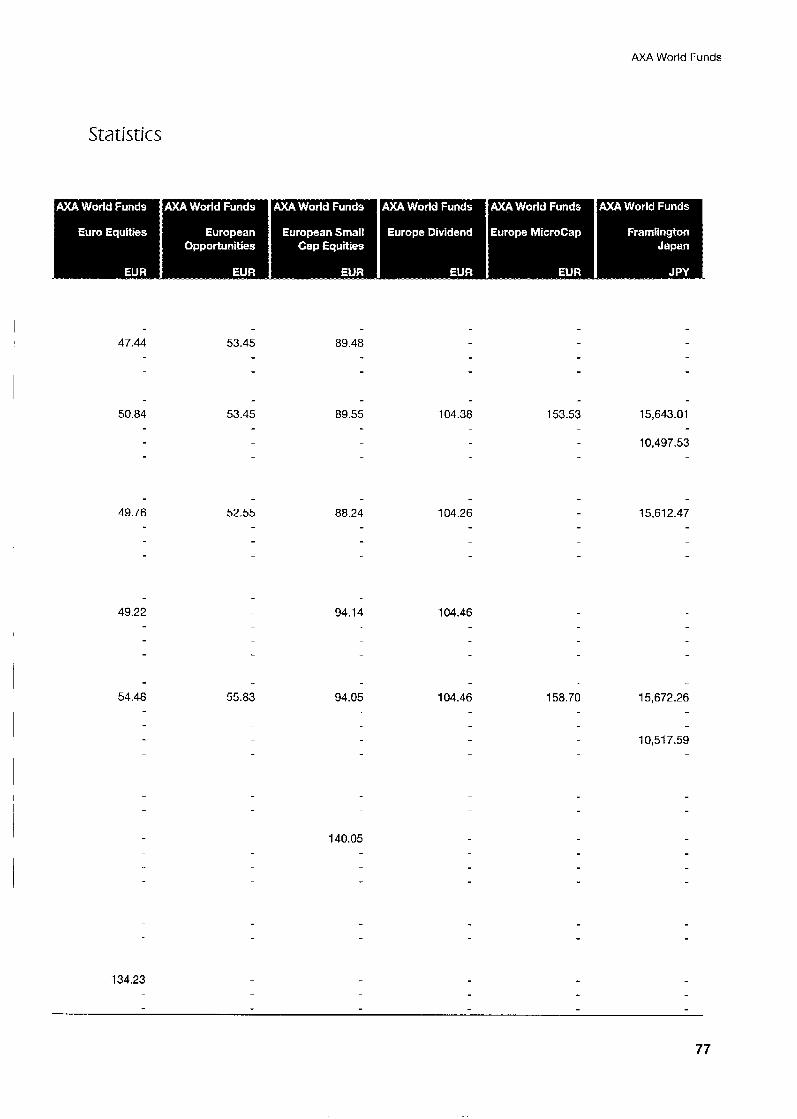
47.44 89.48 53.45
53.45 89.55 104.38 153.53 15,643.01
10,497.53
50.84
49.76 88.24 52.55 104.26 15,612.47
94.14 49.22 104.46
54.48 55.83 94.05 104.46 158.70 15,672.26
10,517.59
140.05
134.23
77
AXA World Funds
Statistics
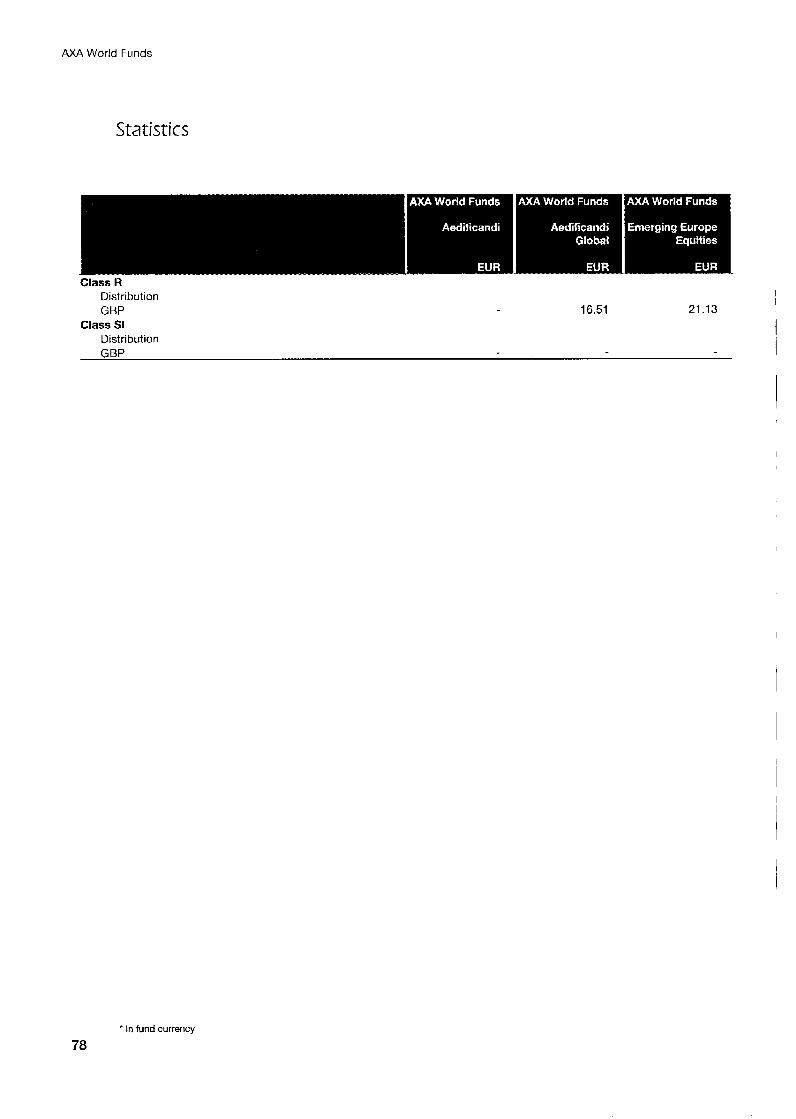
Class R Distribution GBP 16.51 21.13
Class SI Distribution GBP
I
* In fund currency
78
AXA World Funds
Statistics
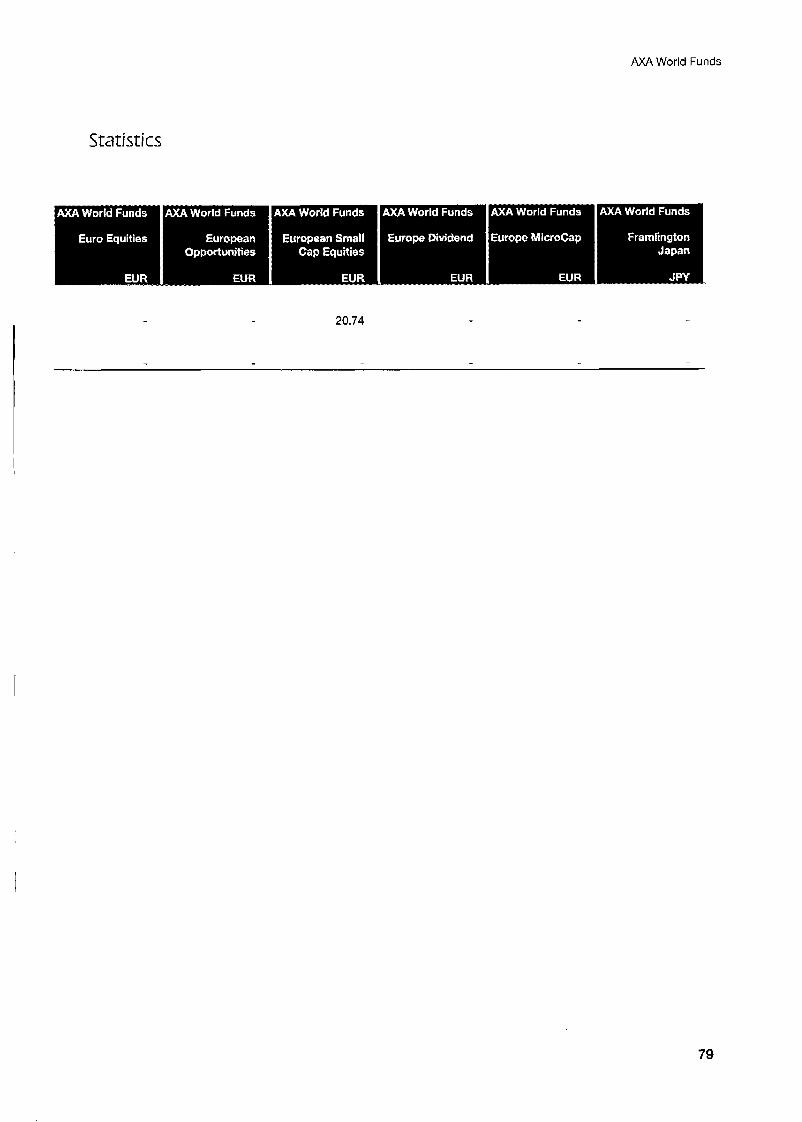
20.74
I
I
79
AXA World Funds
Statistics
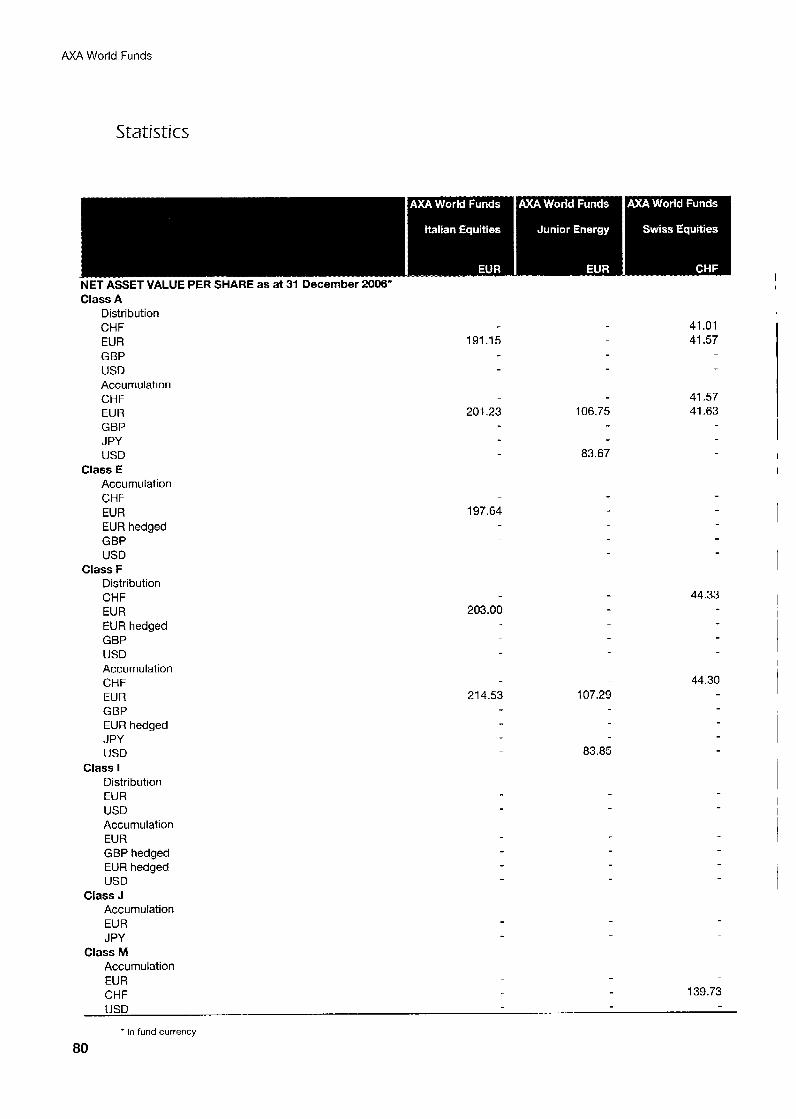
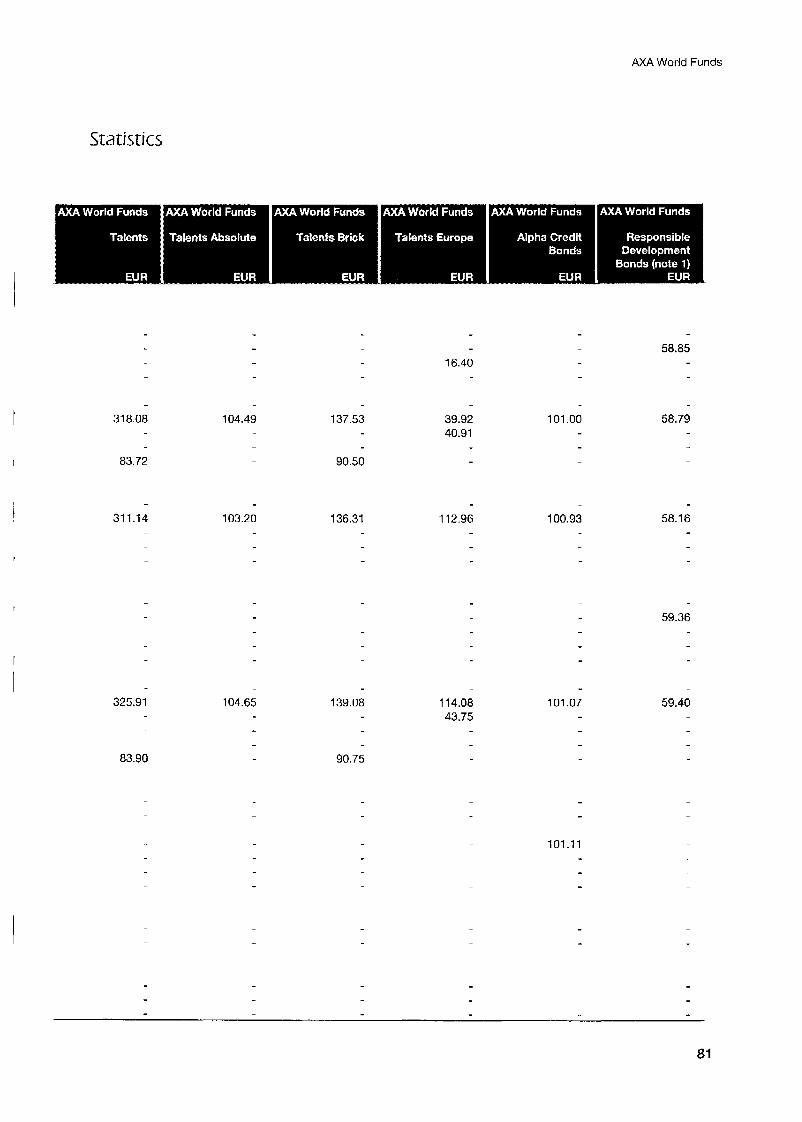
- NET ASSET VALUE PER SHARE as at 31 December 2006* Class A
Distribution CHF 41.01 EUR 191.15 41.57 GBP USD Accumulation CHF 41.57 EUR 201.23 106.75 41.63 GBP J PY USD 83.67
Class E Accumulation CHF EUR EUR hedged GBP USD
Class F Distribution CHF EUR EUR hedged GBP USD Accumulation CHF EUR GBP EUR hedged J PY USD
Distribution EUR USD Accumulation EUR GBP hedged EUR hedged USD
Class J Accumulation EUR J PY
Class M Accumulation EU R CHF 139.73 USD
Class I
’ In fund currency
80
197.64
203.00
21 4.53 107.29
83.85
44.33
44.30 I
AXA World Funds
Statistics
58.85 16.40
31 8.08 104.49 137.53
90.50
39.92 40.91
101 .oo 58.79
83.72
311.14 103.20 112.96 100.93 58.16 136.31
I 59.36
325.91 104.65 139.08 114.08 43.75
101.07 59.40
90.75 83.90
101.11
81

AXA World Funds
Statistics
Class R Distribution GBP
Class SI Distribution GBP
* In fund currency
82
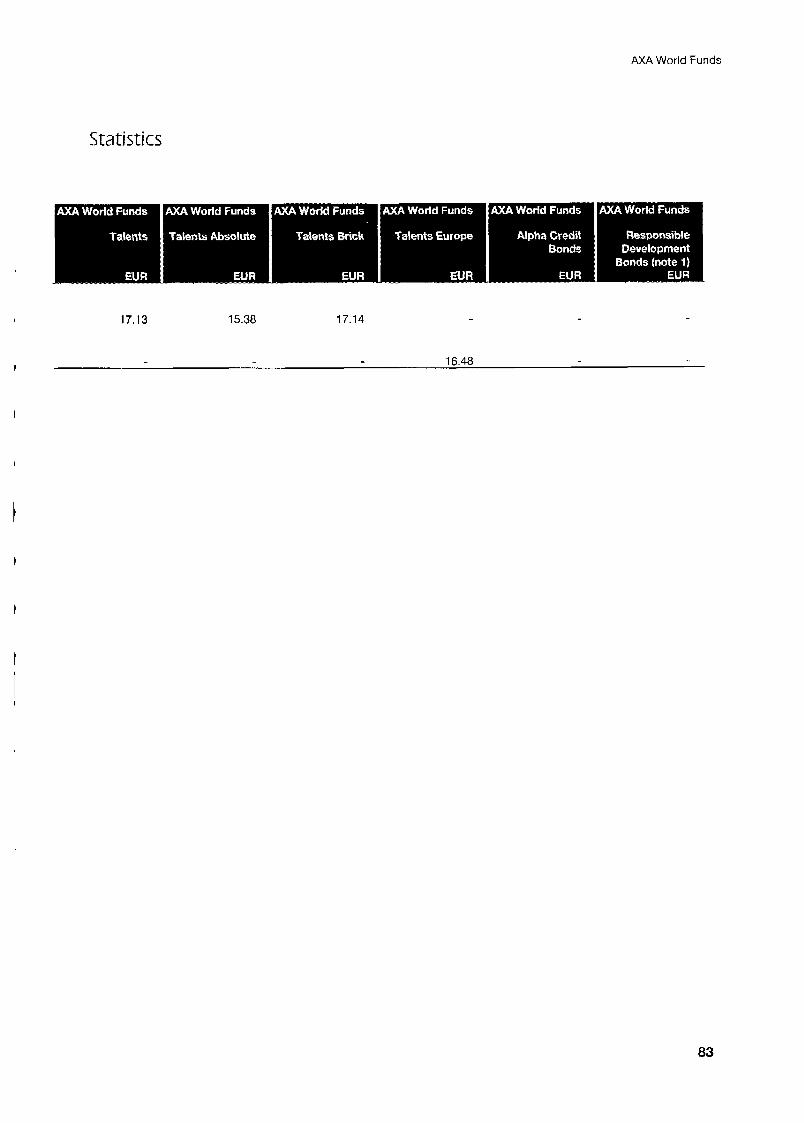
AXA World Funds
Statistics
I 17.13 15.38 17.14
I 16.48
I
t
83
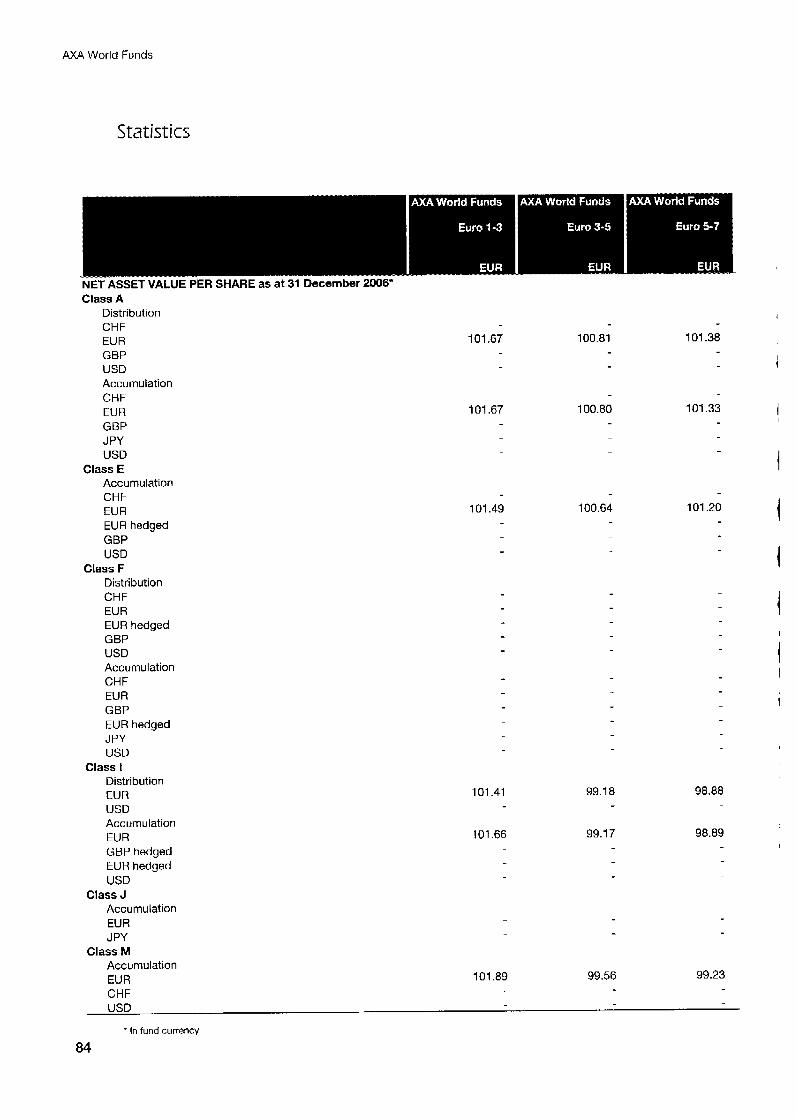
AXA World Funds
Statistics
NET ASSET VALUE PER SHARE as at 31 December 2006* Class A
Distribution CHF EUR 101 6 7 GBP USD Accumulation CHF EUR 101.67
GBP J PY USD
Class E Accumulation CHF EUR EUR hedged GBP USD
Class F Distribution CHF EUR EUR hedged GBP USD Accumulation CHF EUR GBP EUR hedged J PY USD
Distribution EUR USD Accumulation EUR GBP hedged EUR hedged USD
Class J Accumulation EUR J PY
Class M Accumulation EUR CHF USD
Class I
101.89 99.56 99.23
’ In fund currency
84
101.49
101.41
101.66
100.81 101.38
100.80 101.33
100.64
99.18
99.1 7
101.20
98.88
98.89
I
I
AXA World Funds
Statistics
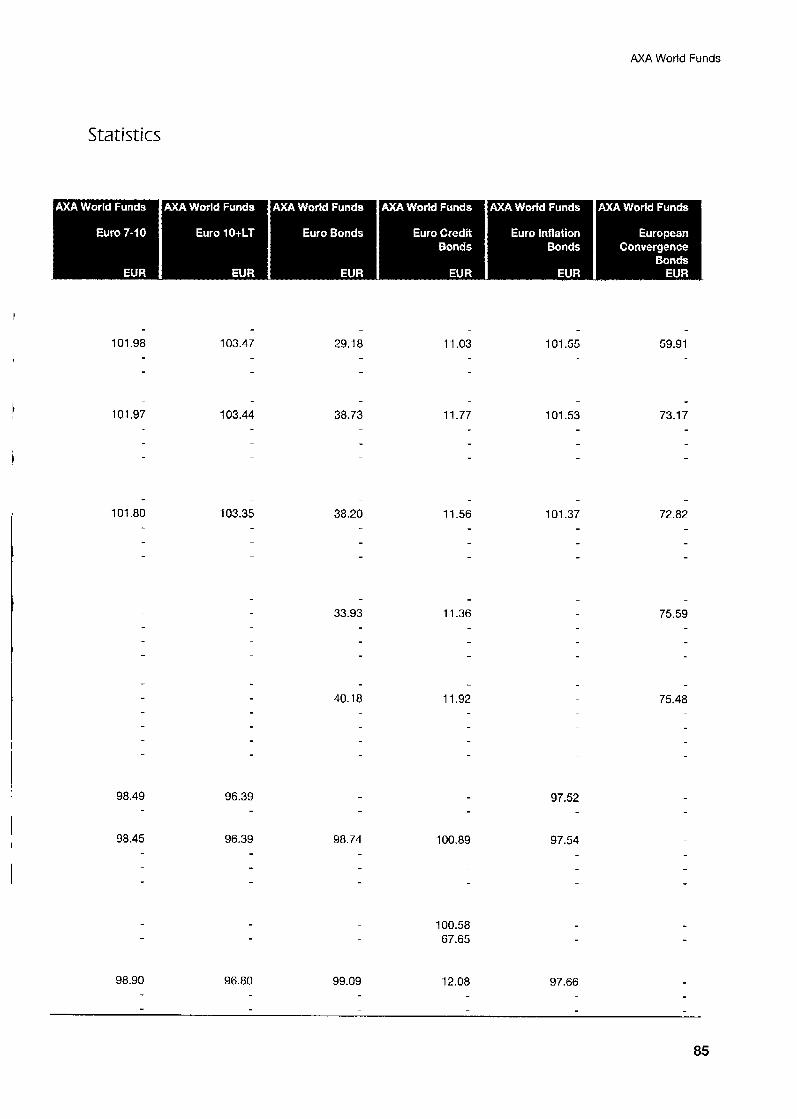
101.98
101.97
103.47 29.1 8 11.03 101.55 59.91
103.44 38.73 1.77
11.56
7 01.53 73.
101.80 103.35 72.82 38.20 101.37
11.36 75.59 33.93
40.18 11.92 75.48
98.49 96.39 97.52
98.45 96.39 98.74 100.89 97.54
100.58 67.65
98.90 96.80 99.09 12.08 97.66
85
AXA World Funds
Statistics
Class R Distribution GBP
Class SI Distribution GBP
I
' In fund currency
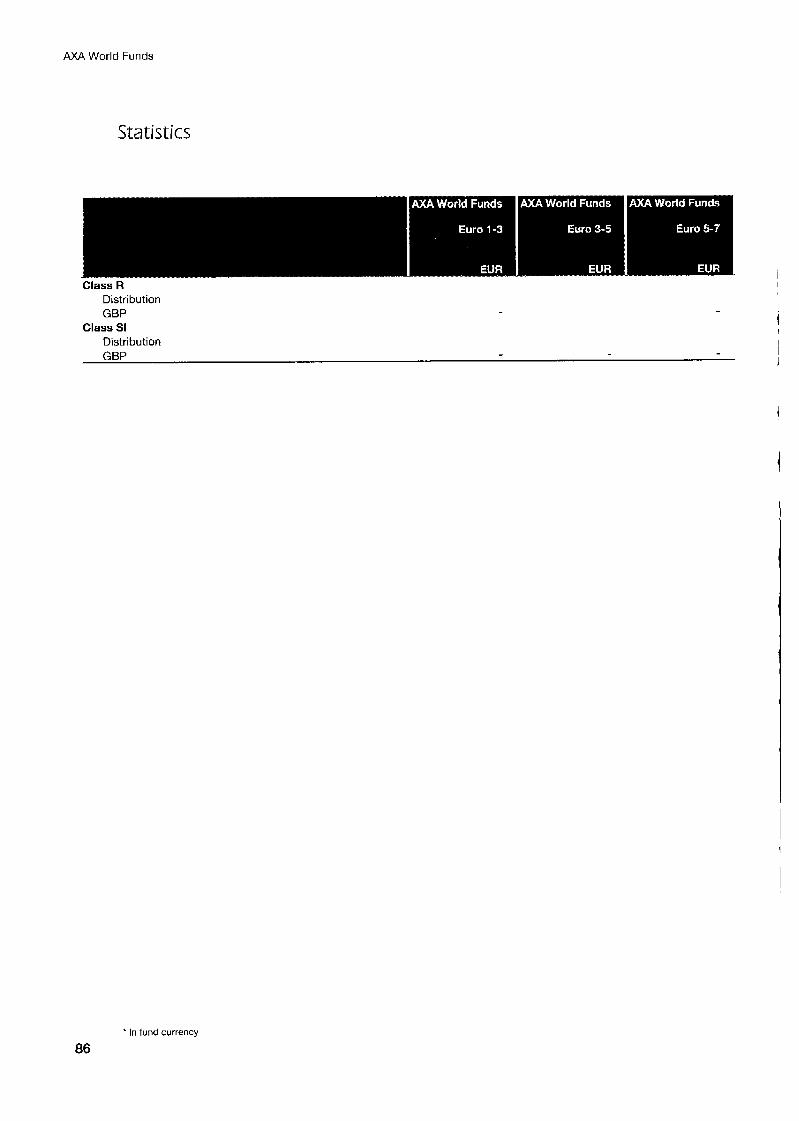
86
AXA World Funds
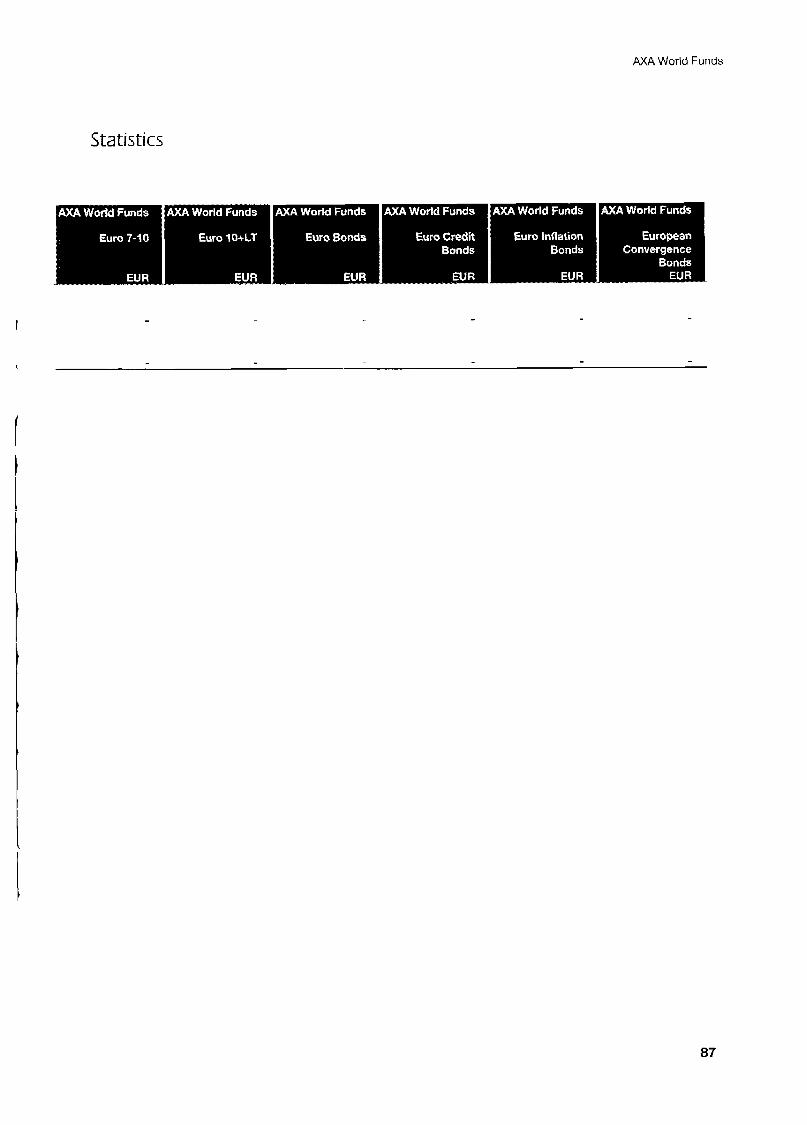
Statistics
I
87
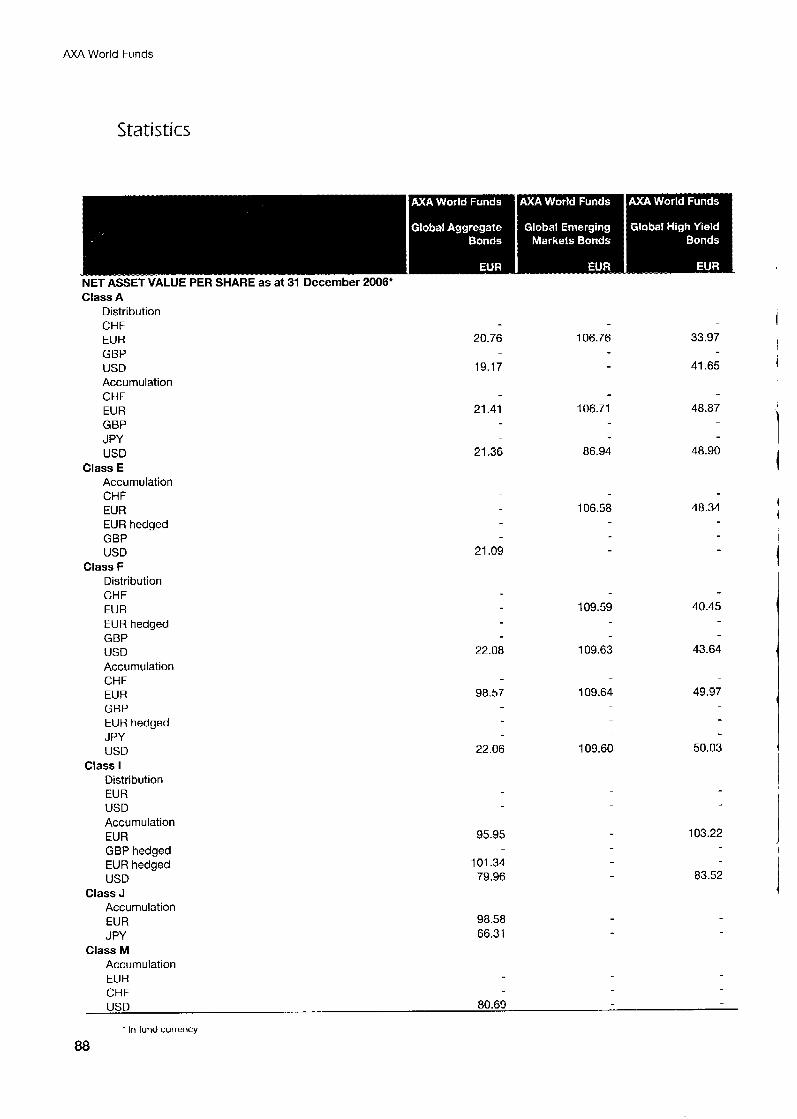
AXA World Funds
Statistics
20.76
19.17
21.41
21.36
106.76
106.71
86.94
33.97
41.65
48.87
48.90
Class A Distribution CHF EUR GBP USD Accumulation CHF EUR GBP JPY USD
Class E Accumulation CHF EUR EUR hedged GBP USD 21.09
Class F Distribution CHF EUR EUR hedged GBP USD 22.08 Accumulation CHF EUR 98.57 GBP EUR hedged J PY USD 22.06
Distribution EUR USD Accumulation
GBP hedged
USD 79.96
Accumulation
J PY 66.31 Class M
Accumulation EUR CHF USD 80.69
Class I
EUR 95.95
EUR hedged 101.34
Class J
EUR 98.58
+ In fund currency
88
106.58
109.59
109.63
109.64
109.60
48.34
40.45
43.64
49.97
50.03
103.22
83.52
I
I
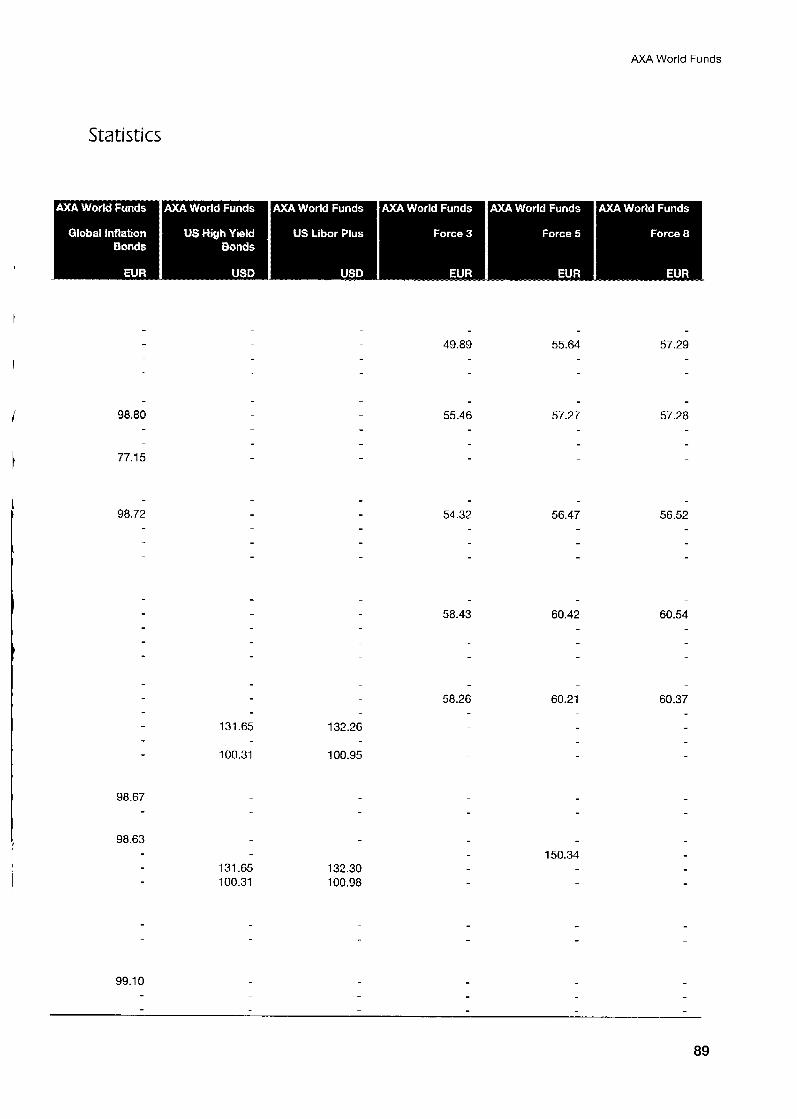
AXA World Funds
Statistics
49.89 55.64 57.29
98.80 55.46 57.27 57.28
77.15
98.72 54.32 56.47 56.52
58.43 60.42 60.54
58.26 60.37 60.21
131.65 132.26
100.95 100.31
98.67
98.63 150.34
131.65 100.31
132.30 100.98
99.10
89
AXA World Funds
Statistics
_ x . . . . .. - .
Class R Distribution GBP
Class SI Distribution GBP
* In fund currency
90
AXA World Funds
Statistics
i
I
91
AXA World Funds
Stat is t i cs
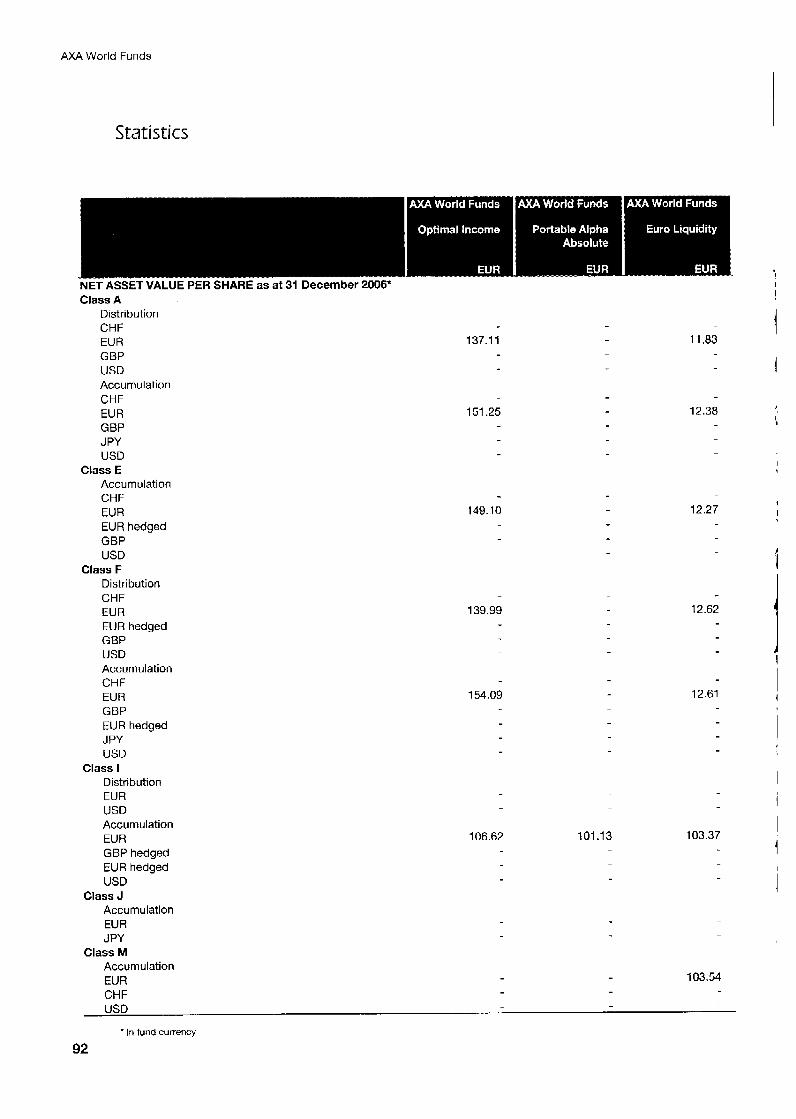
Class A Distribution CHF EUR 137.11 11 -83 GBP USD Accumulation CHF EUR 151.25 12.38 GBP J PY USD
Class E Accumulation CHF EUR EUR hedged GBP USD
Class F Distribution CHF EUR EUR hedged GBP USD Accumulation CHF EUR GBP EUR hedged J PY USD
Distribution EUR USD Accumulation EUR GBP hedged EUR hedged USD
Class J Accumulation EUR JPY
Class M Accumulation EUR 103.54
CHF USD
Class I
- In fund currency
92
149.10
139.99
154.09
106.62
12.27
101.13
12.62
12.61
103.37
i
I
i
I
I
AXA World Funds
Statistics
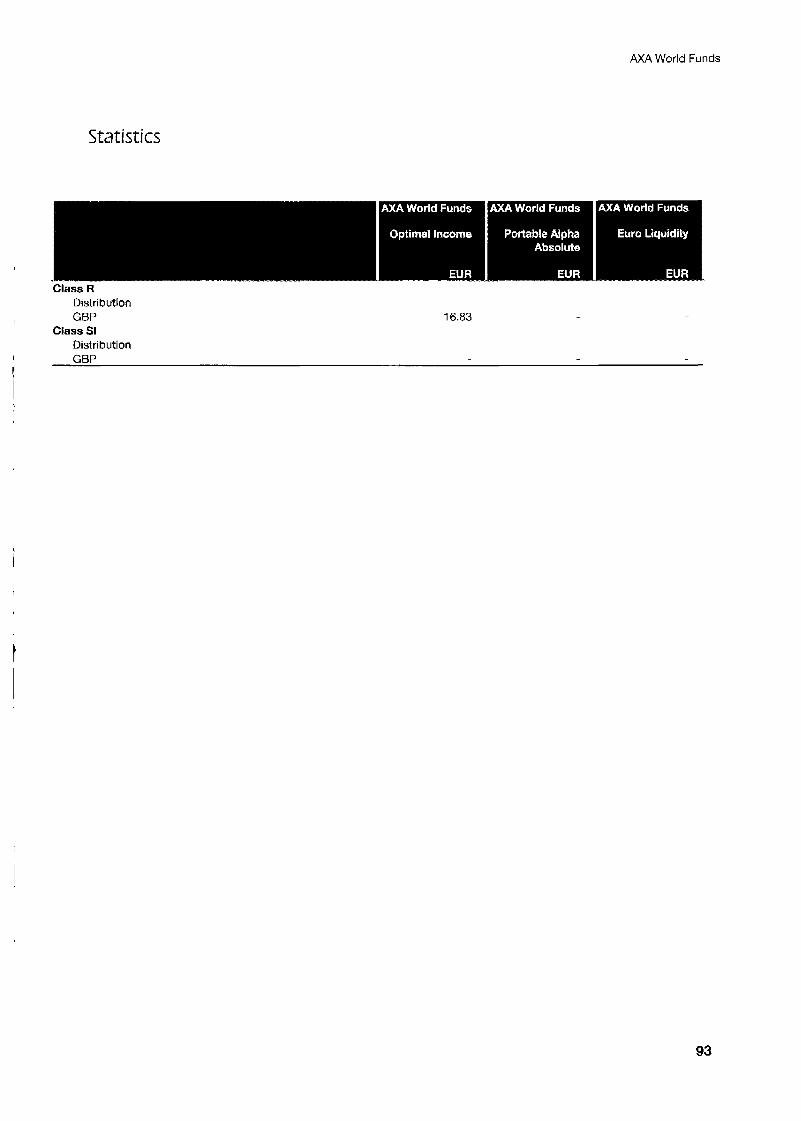
Class R Distribution
I GBP 16.83 Class SI
Distribution GBP
t
93
AXA World Funds
I
Statistics
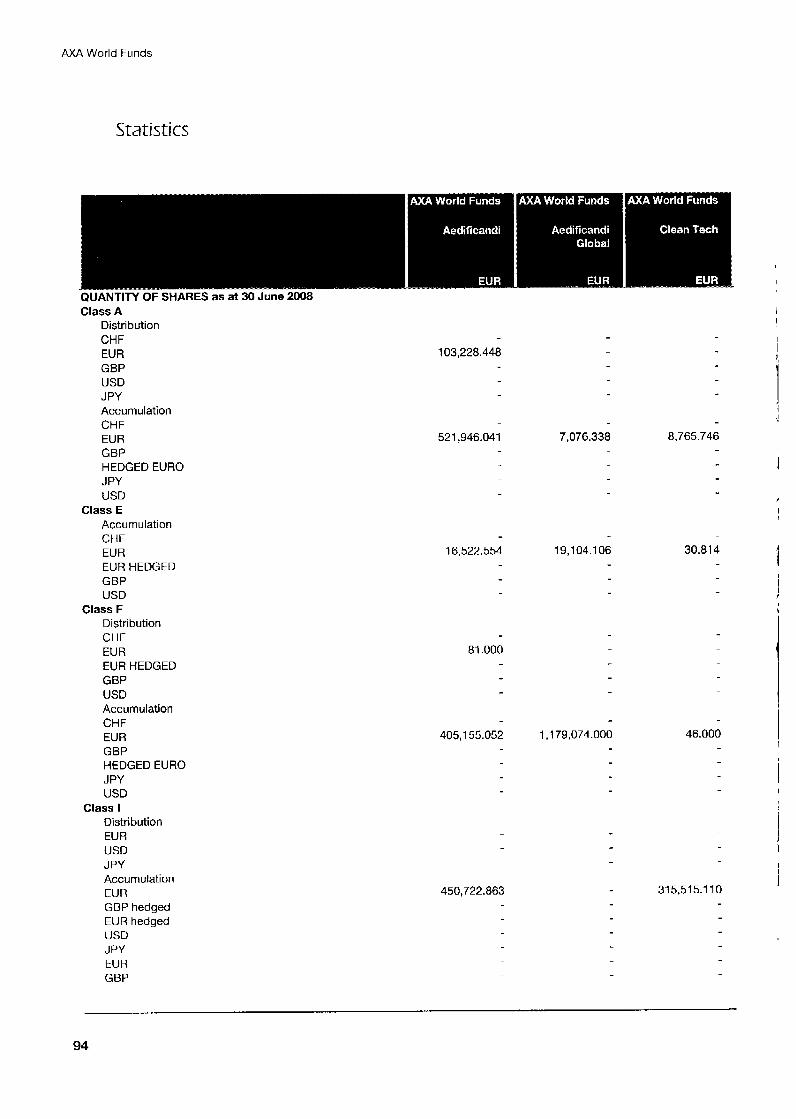
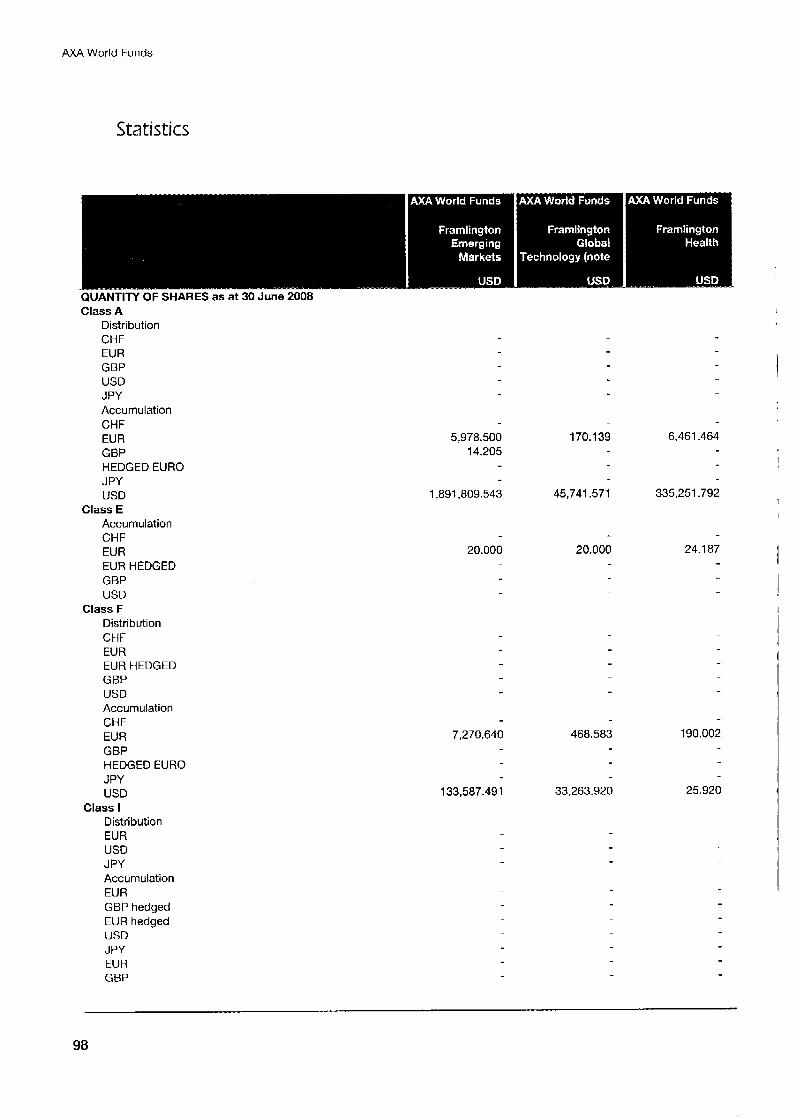
QUANTITY OF SHARES as at 30 June 2008 Class A
Distribution CHF EUR GBP USD J PY Accumulation CHF EUR GBP HEDGED EURO J PY USD
Class E Accumulation CHF EUR EUR HEDGED GBP USD
Class F Distribution CHF EUR EUR HEDGED GBP USD Accumulation CHF EUR GBP HEDGED EURO J PY USD
Distribution EUR USD JPY Accumulation EUR GBP hedged EUR hedged USD JPY EUR GBP
Class I
103,228.448
521,946.041
16,522.554
81 .OOO
405,155.052
450,722.863
7,076.338
19,104.1 06
1,179,074.000
8,765.746
30.81 4
46.000
31 5,515.1 10
94
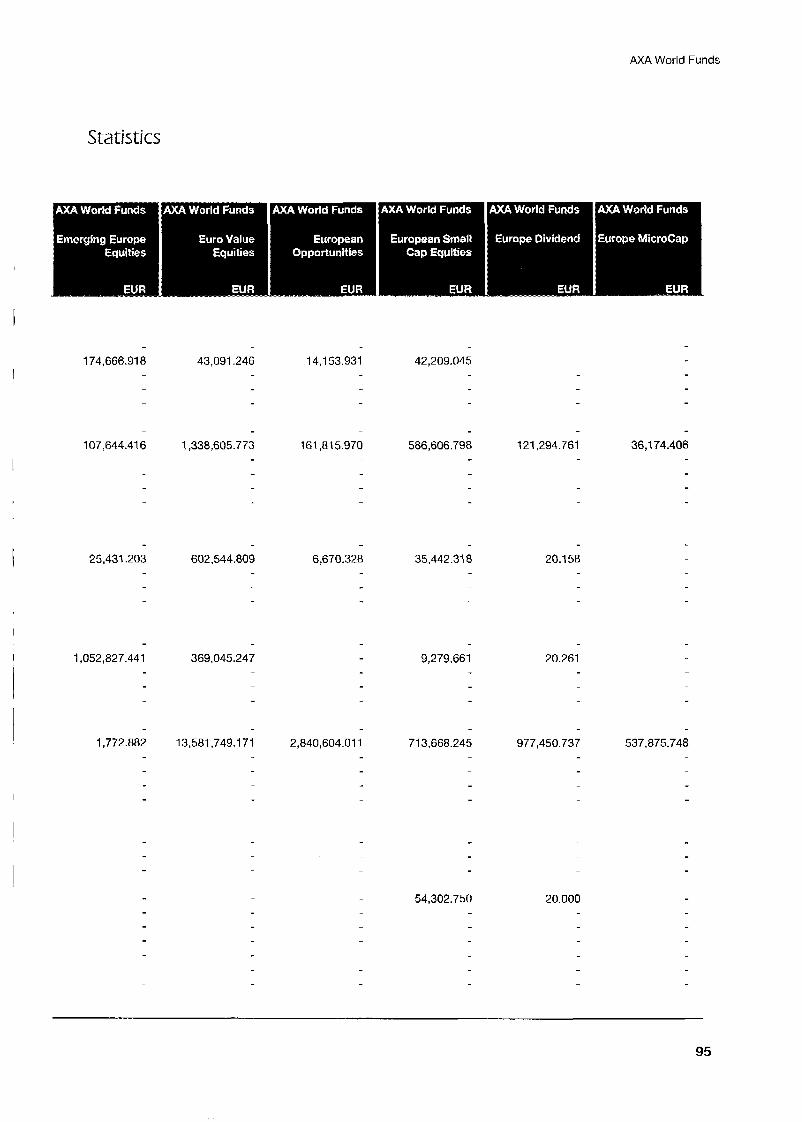
AXA World Funds
Statistics
14,153.931 43,091.246 42,209.045
1,338,605.773 586,606.798 121,294.761 36,174.406 107,644.416 161,815.970
25,431.203 602,544.809 35,442.31 8 20.158
1,052,827.441 369,045.247 9,279.661 I 20.261
1,772.882 13,581,749.1 71 2,840,604.01 1 977,450.737 537,875.748
54,302.750 20.000
95
AXA World Funds
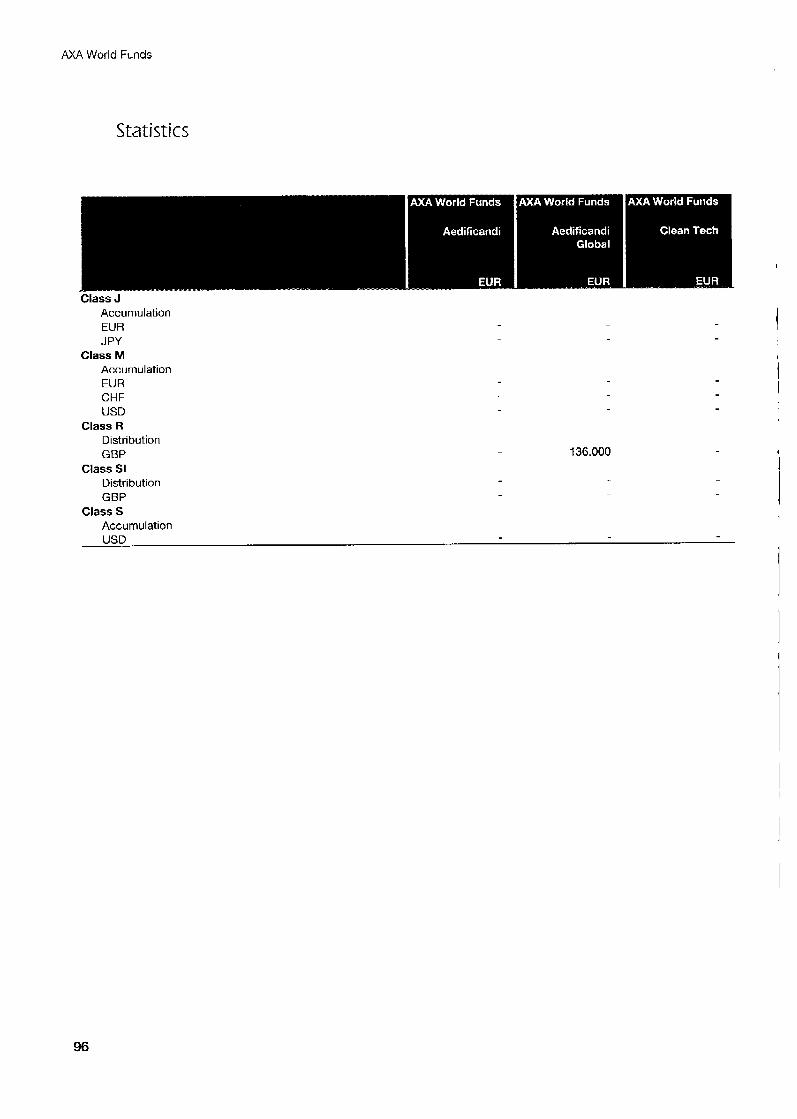
Statistics
Class J Accumulation EUR J PY
Class M Accumulation EUR CHF USD
Class R Distribution GBP
Class SI Distribution GBP
Class S Accumulation
136.000
USD
96
AXA World Funds
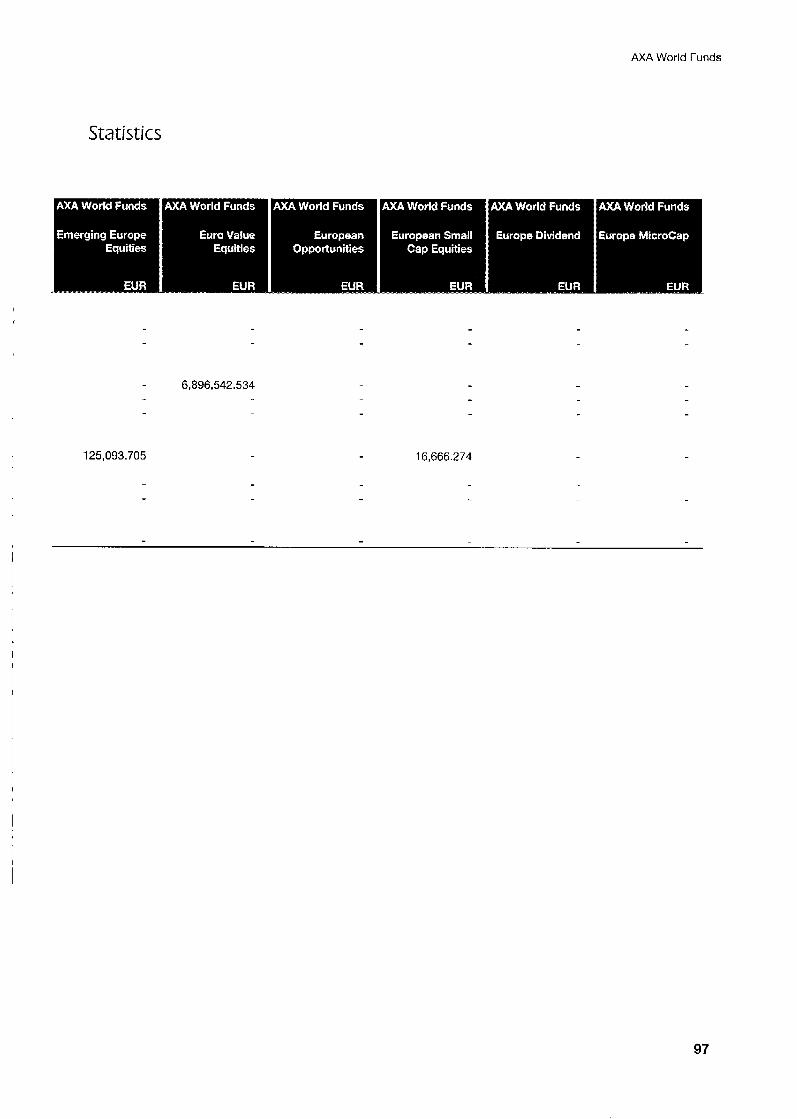
Statistics
6,896,542.534
125,093.705 16,666.274
97
AXA World Funds
Statistics
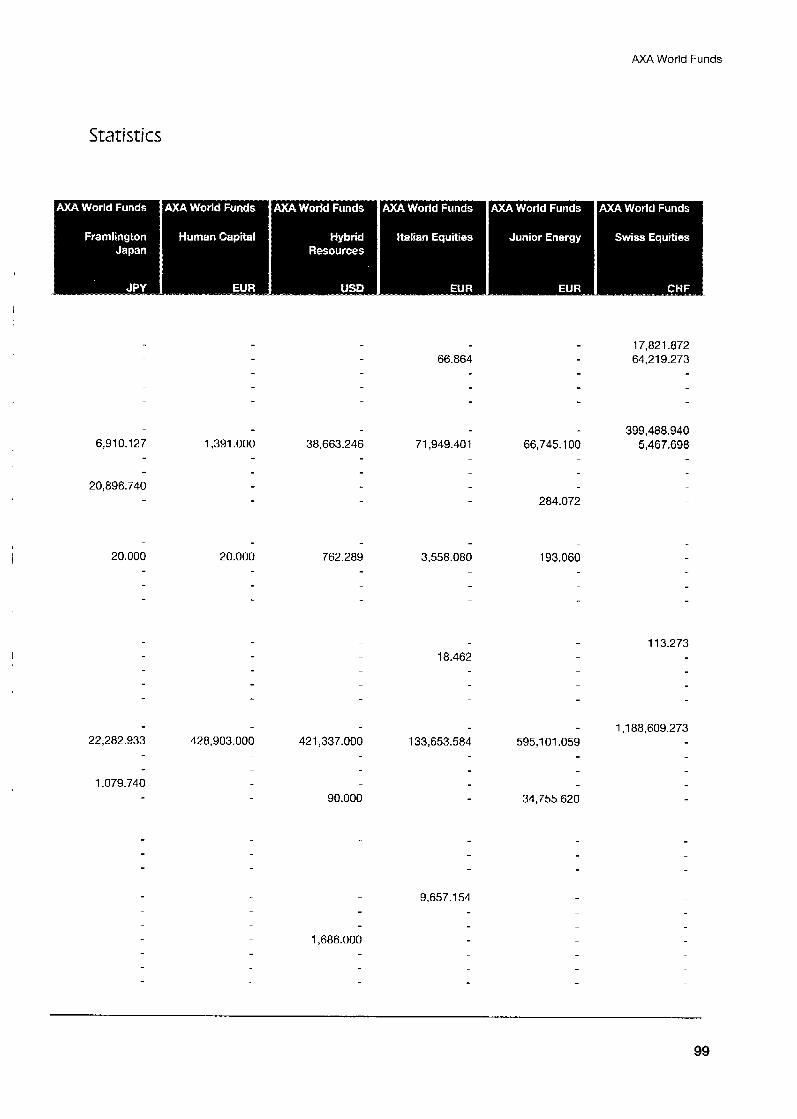
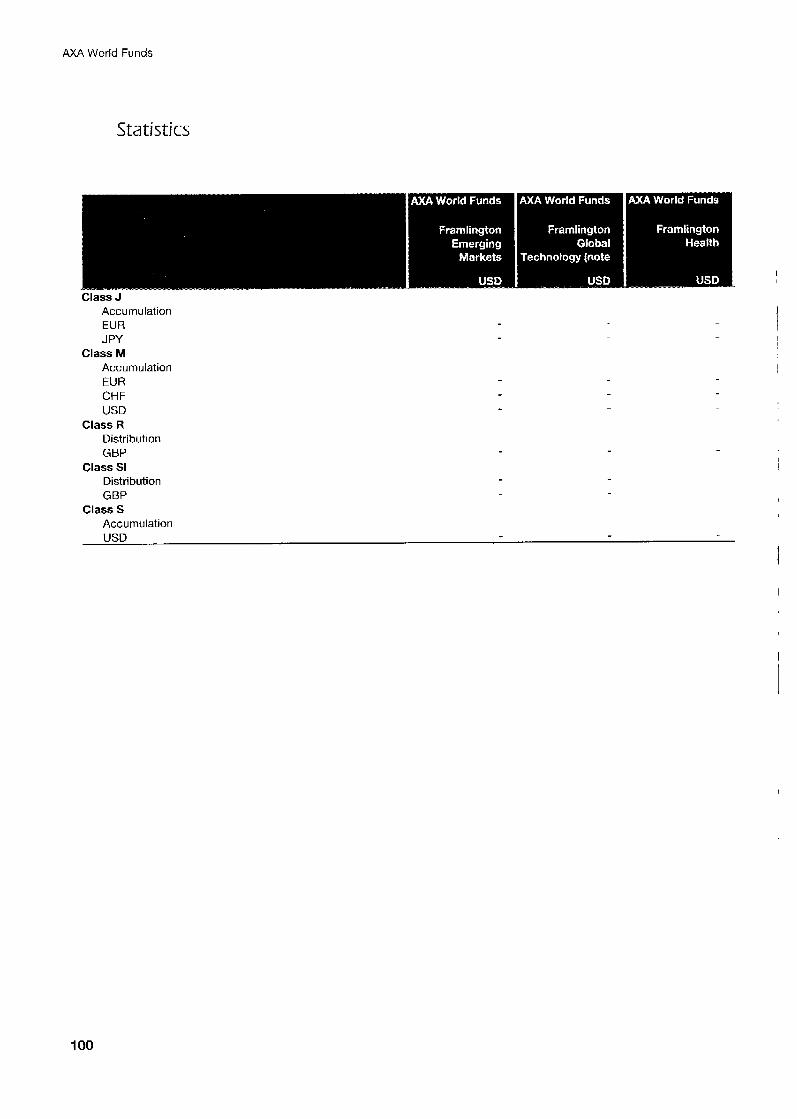
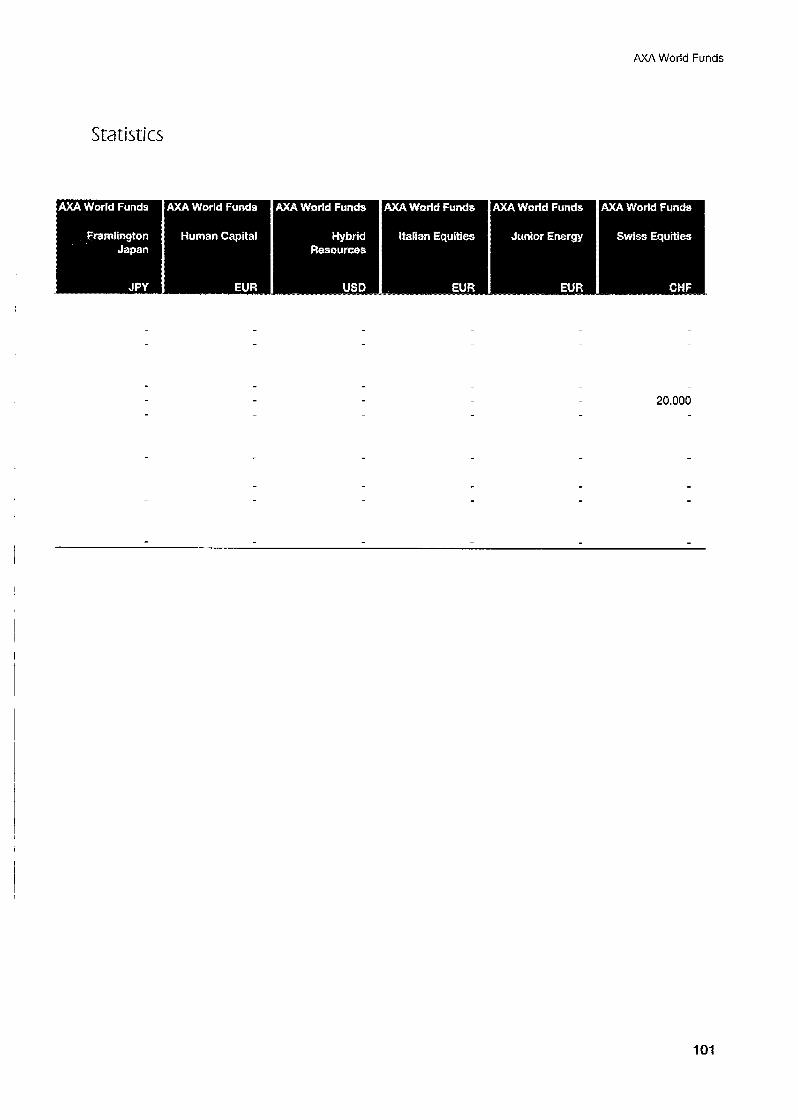
QUANTIN OF SHARES as at 30 June 2008 Class A
Distribution CHF EUR GBP USD J PY Accumulation CHF EUR GBP HEDGED EURO J PY USD
Class E Accumulation CHF EUR EUR HEDGED GBP USD
Class F Distribution CHF EUR EUR HEDGED GBP USD Accumulation CHF EUR GBP HEDGED EURO JPY USD
Distribution EUR USD J PY Accumulation EUR GBP hedged EUR hedged USD J PY EUR GBP
Class I
I
170.139
45,741.571
6,461.464 5,978.500 14.205
1,891,809.543 335,251.792
20.000 20.000 24.1 87
I
7,270.640 468.583 190.002
25.920 133.587.491 33,263.920
98
AXA World Funds
Statistics
66.864 17,821.872 64,219.273
399,488.940 5,467.698 1,391.000 71,949.401 66,745.1 00 6,910.127
20,896.740
38,663.246
284.072
20.000 3,558.080 20.000 762.289 193.060
18.462 113.273
I
1,188,609.273 22,282.933 428,903.000 421,337.000 133,653.5a4 595,101.059
1,079.740 34,755.620 90.000
9,657.154
1,686.000
99
AXA World Funds
Statistics
I
Class J Accumulation EUR J PY
Class M Accumulation EUR CHF USD
Class R Distribution GBP
Class SI Distribution GBP
Class S Accumulation USD
I
100
AXA World Funds
Statistics
20.000
101

A M World Funds
Statistics
QUANTITY OF SHARES as at 30 June 2008 Class A
Distribution CHF EUR GBP USD J PY Accumulation CHF EUR GBP HEDGED EURO J PY USD
Class E Accumulation CHF EUR EUR HEDGED GBP USD
Class F Distribution CHF EUR EUR HEDGED GBP USD Accumulation CHF EUR GBP HEDGED EURO J PY USD
Distribution EUR USD J PY Accumulation EUR GBP hedged EUR hedged USD J PY EUR GBP
Class I
76,570.614 3,660.700 274,705.61 6
20.000 12,673.606
20.000 719.81 9 41,547.440
I
I
833,955.888 53,220.000 145,120.000
20.000 25.630
i
102
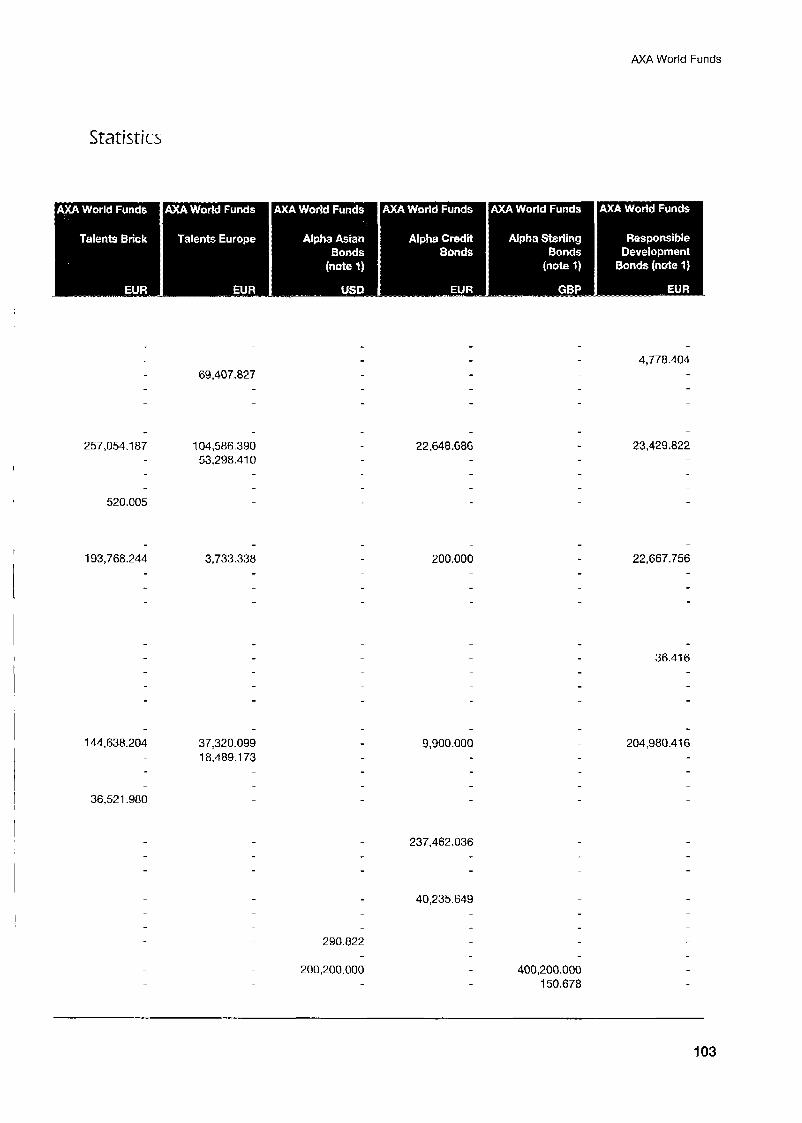
AXA World Funds
Statistics
4,778.404 69,407.827
257,054.187 104,586.390 53,298.41 0
23,429.822
520.005
193,768.244 3,733.338 200.000 22,667.756
36.41 6
144,638.204 37,320.099 18,489.1 73
36,521.980
9,900.000 204,980.41 6
237,462.036
40,235.649
290.822
200,200.000 400,200.000 150.678
103
AXA World Funds
Statistics
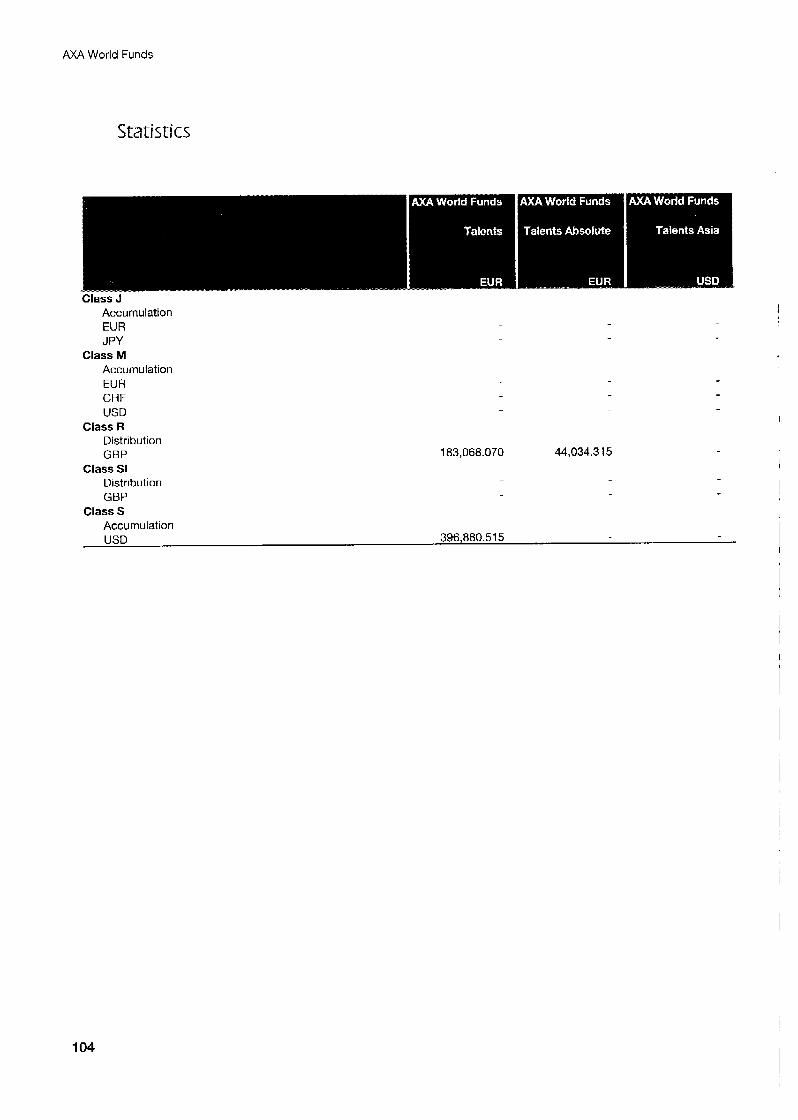
Class J Accumulation EUR J PY
Class M Accumulation EUR CHF USD
Class R Distribution GBP
Class SI Distribution GBP
Class S
183,068.070 44,034.31 5
Accumulation USD 396,880.51 5
104
I
AXA World Funds
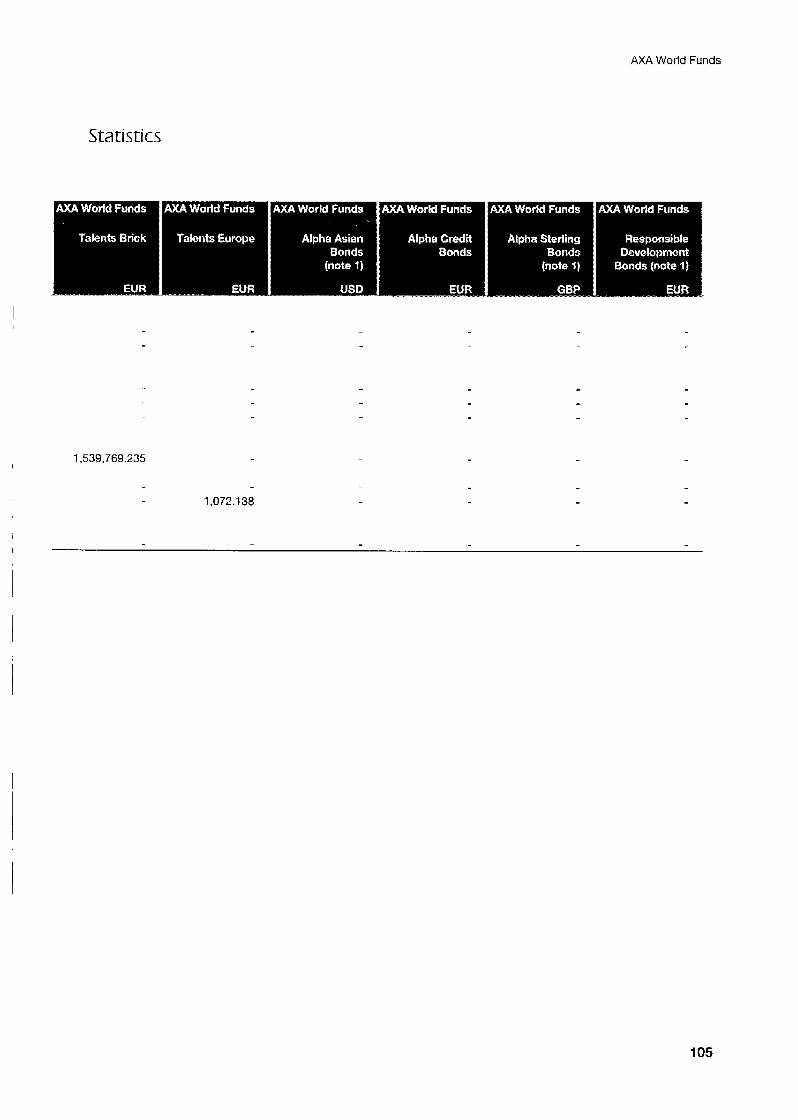
Statistics
1,539,769.235 I
1,072.138
105
AXA World Funds
Statistics
Class A Distribution CHF EUR GBP USD J PY Accumulation CHF EUR GBP HEDGED EURO J PY USD
Class E Accumulation CHF EUR EUR HEDGED GBP USD
Class F Distribution CHF EUR EUR HEDGED GBP USD Accumulation CHF EUR GBP HEDGED EURO J PY USD
Distribution EUR USD J PY Accumulation EUR GBP hedged EUR hedged USD J PY EUR GBP
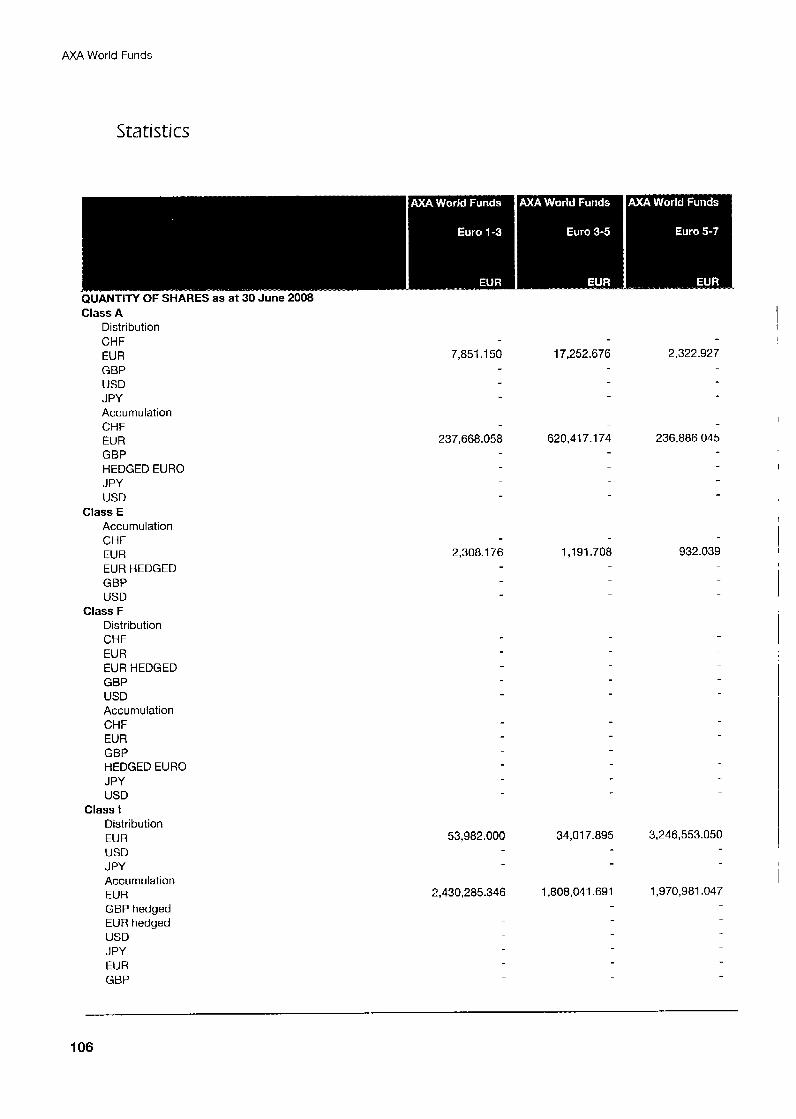
Class I
7,851.1 50 17,252.676 2,322.927
I
237,668.058 620,417.1 74 236,886.045
I
932.039 2,308.176 1,191.708 i
53,982.000 34,017.895 3,246,553.050
2,430,285.346 1,808,041.691 1,970,981.047
1 06
AXA World Funds
Statistics
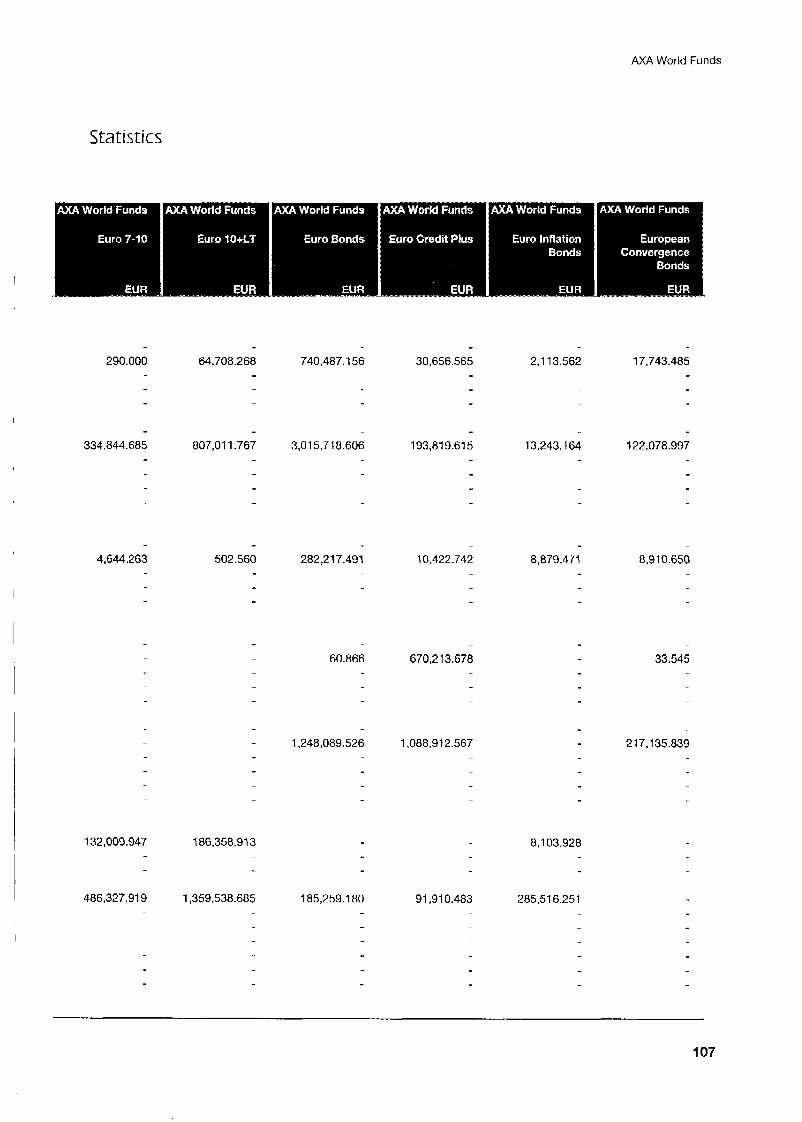
290.000 64,708.268 740,487.1 56 30,656565 2.1 13.562 17,743.485
I
334,844.685 807,011.767 193.81 9.61 5 122,078.997 3.01 5,718.606 13,243.164
4,644.263 502.560 10.422.742 8,879.471 8,910.650 282,2 17.491
60.866 670,213.678 33.545
21 7,135.839
132,009.947 I 86,358.913 8,103.928
486,327.91 9 1,359,538.685 185,259.1 80 285,516.251
107
AXA World Funds
Statistics
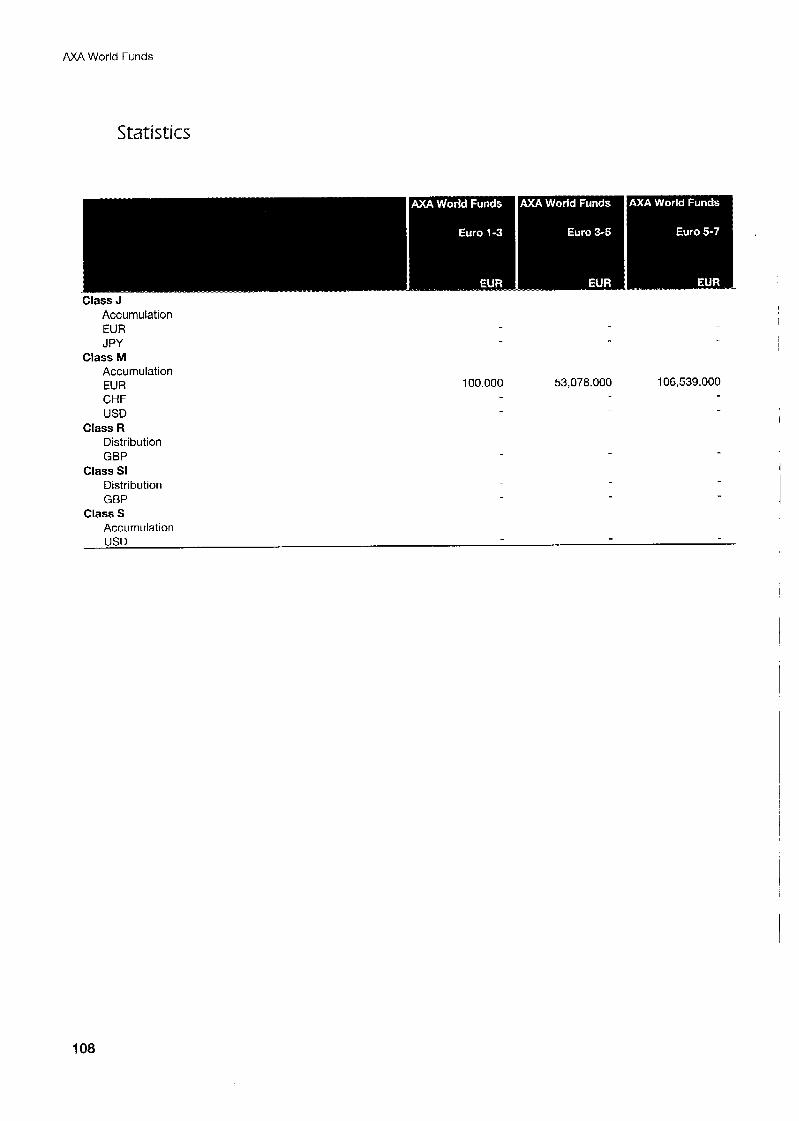
Class J Accumulation EUR J PY
Class M Accumulation EUR 100.000 53,078.000 106,539.000 CHF USD
Class R Distribution GBP
Class SI Distribution GBP
Class S Accumulation USD
108
AXA World Funds
Statistics
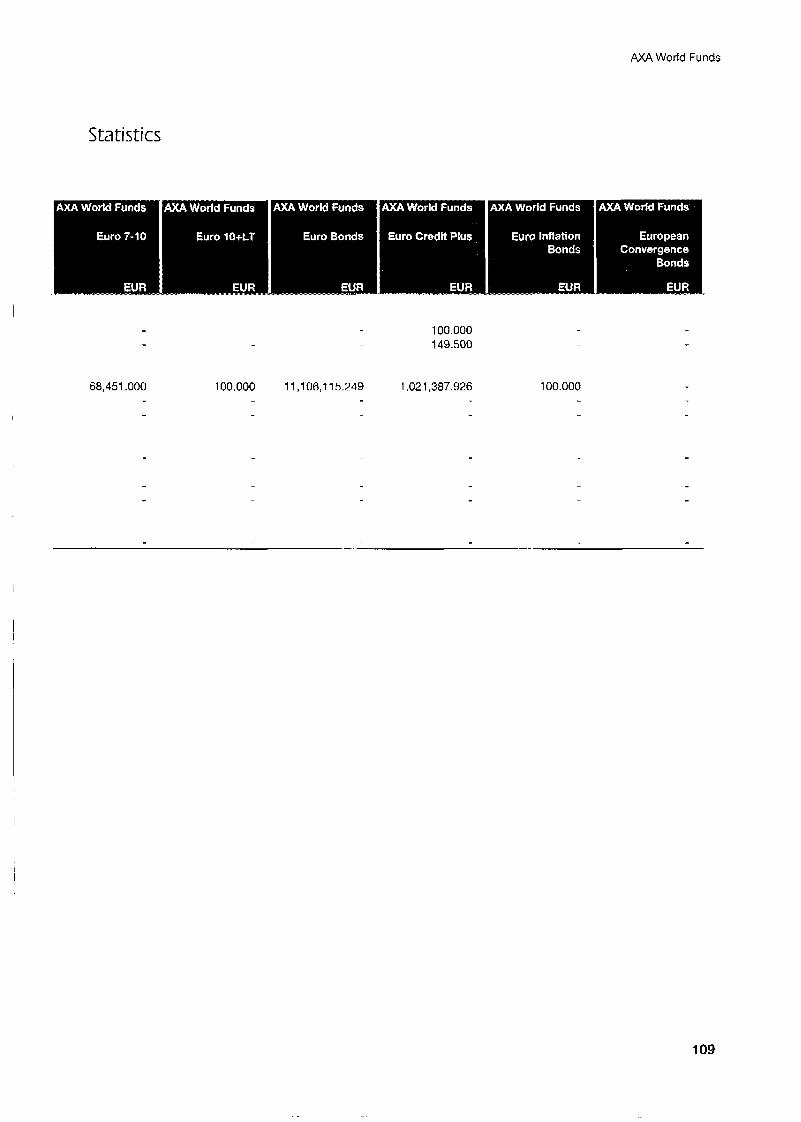
68,45
I
,000 100.000 11,106. 15.249 ,02
100.000 149.500
,387.926 00.000
109
AXA World Funds
Statistics
QUANTITY OF SHARES as at 30 June 2008 Class A Distribution CHF EUR GBP USD JPY Accumulation CHF EUR GBP HEDGED EURO J PY USD
Class E Accumulation CHF EUR EUR HEDGED GBP USD
Class F Distribution CHF EUR EUR HEDGED GBP USD Accumulation CHF EUR GBP HEDGED EURO J PY USD
Distribution EUR USD JPY Accumulation EUR GBP hedged EUR hedged USD J PY EUR GBP
Class I
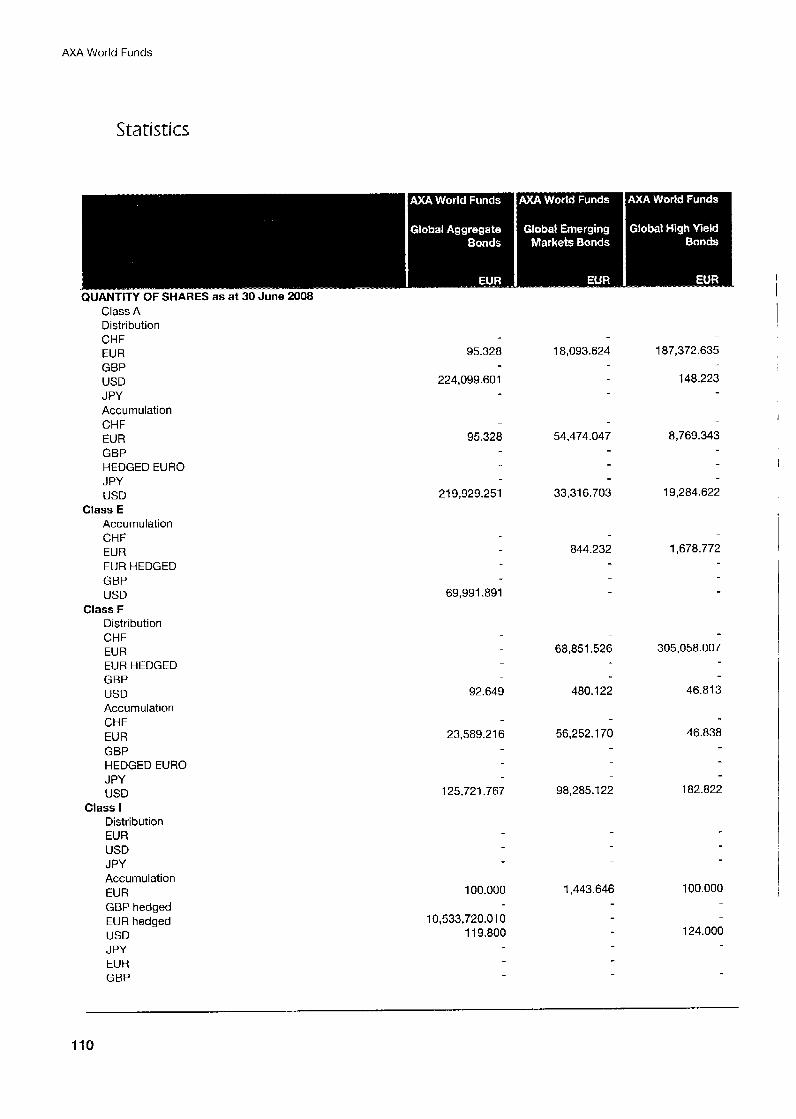
95.328
224,099.601
95.328
219,929.251
69,991.891
92.649
23,589.21 6
125.721.767
100.000
10,533,720.01 0 11 9.800
18,093.624
54,474.047
33,316.703
844.232
68,851.526
480.1 22
56,252.1 70
98,285.122
1,443.646
187,372.635
148.223
8,769.343
19,284.622
1,678.772
305,058.007
46.81 3
46.838
182.822
100.000
124.000
I
110
AXA World Funds
Statistics
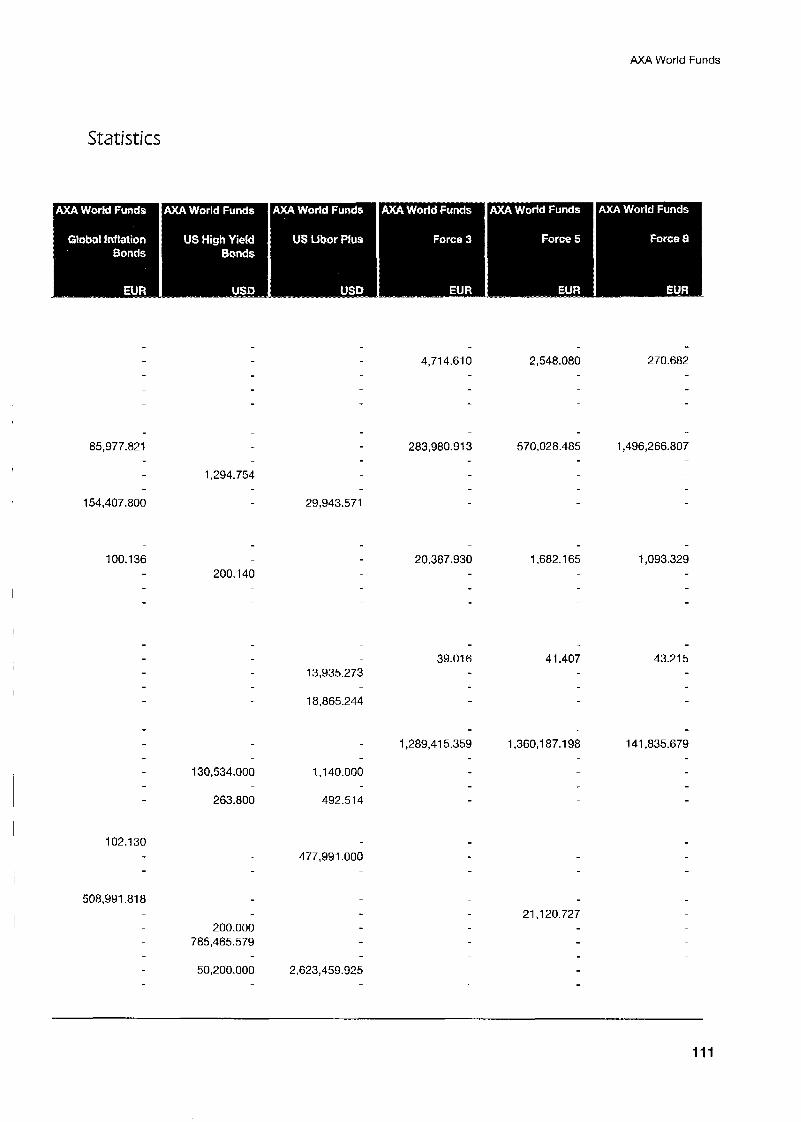
2,548.080 270.682 4,714.61 0
85,977.821
29,943.571
283,980.913 570,028.485 1,496,266.807
1,294.754
154.407.800
1,093.329 100.136 1,682.1 65 20,387.930 200.140
I
13,935.273
18,865.244
39.01 6 41.407 43.21 5
1,140.000
492.514
1,289,415,359 1,360,187.1 98 141,835679
130,534.000
263.800
I
102.1 30 477,991.000
508,991.81 8 21,120.727
200.000 785,465.579
2,623,459.925 50,200.000
111
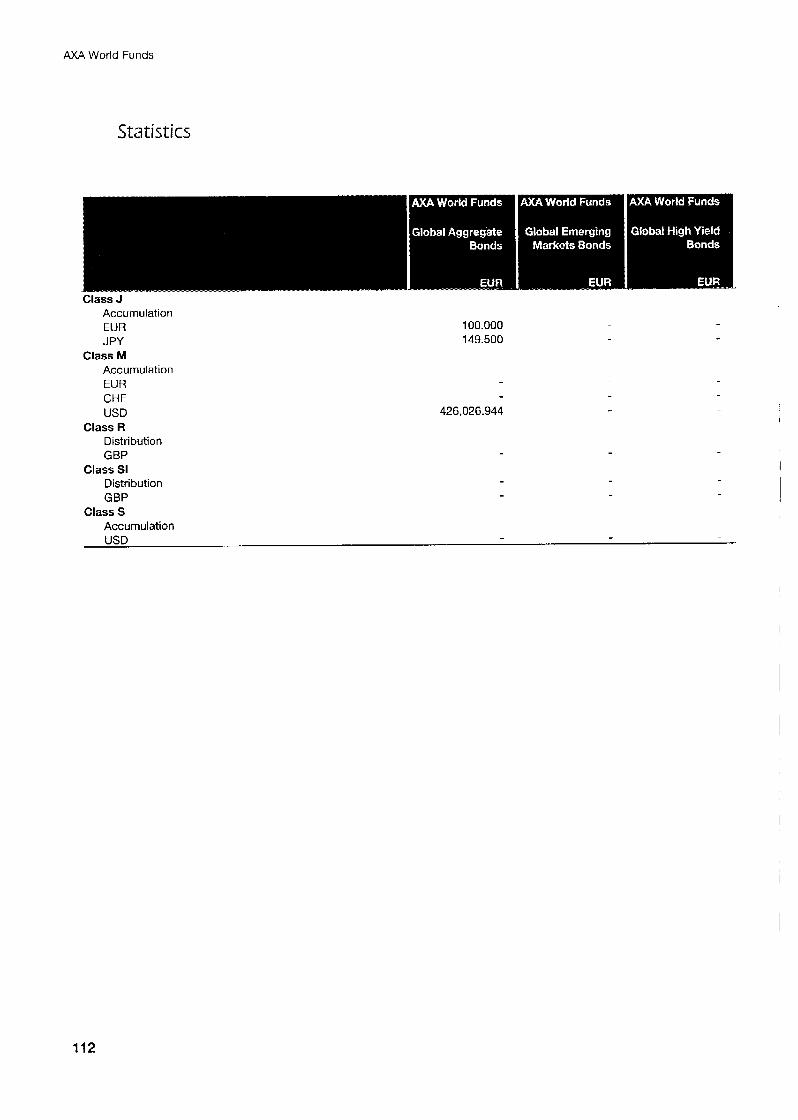
AXA World Funds
Statistics
Class J Accumulation EUR J PY
Class M Accumulation EUR CHF USD
Class R Distribution GBP
Class SI Distribution GBP
Class S Accumulation
100.000 149.500
426,026.944 I
USD
112
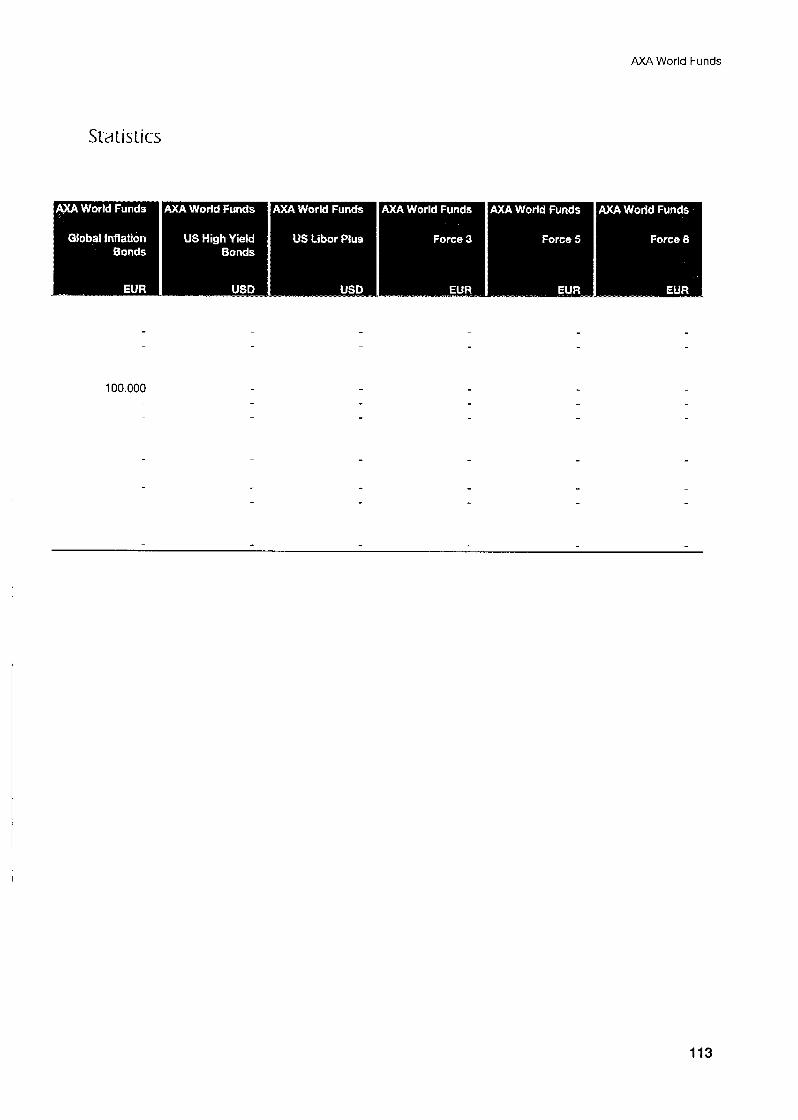
AXA World Funds
Statistics
100.000
113
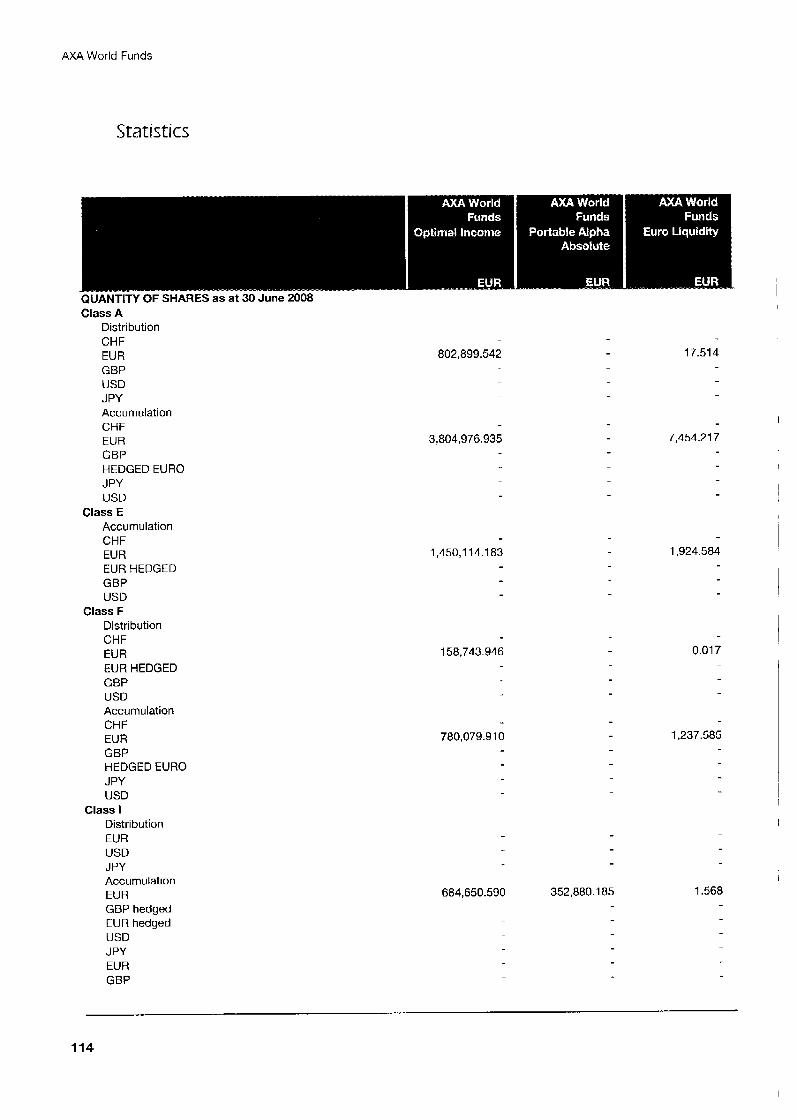
AXA World Funds
Statistics
Class A Distribution CHF EUR GBP USD J PY Accumulation CHF EUR GBP HEDGED EURO J PY USD
Class E Accumulation CHF EUR EUR HEDGED GBP USD
Class F Distribution CHF EUR EUR HEDGED GBP USD Accumulation CHF EUR GBP HEDGED EURO J PY USD
Distribution EUR USD J PY Accumulation EUR GBP hedged EUR hedged USD JPY EUR GBP
Class I
802,899.542 17.514
I
3,804,976.935 7,454.217
I
1,924.584 1,450,114.183
0.01 7 158,743.946
1,237.585 780,079.910
684,650.590 1.568 352,880.185
114

AXA World Funds
Statistics
. ... . .... .. . . .. .. . . . "..." - .. .... . , ~" x_l__.,_,__ __-. ...- .-
Class J Accumulation EUR JPY
Class M Accumulation EUR CHF USD
Class R Distribution GBP
Class SI Distribution GBP
Class S
101.432.630
0.200
Accumulation USD
115
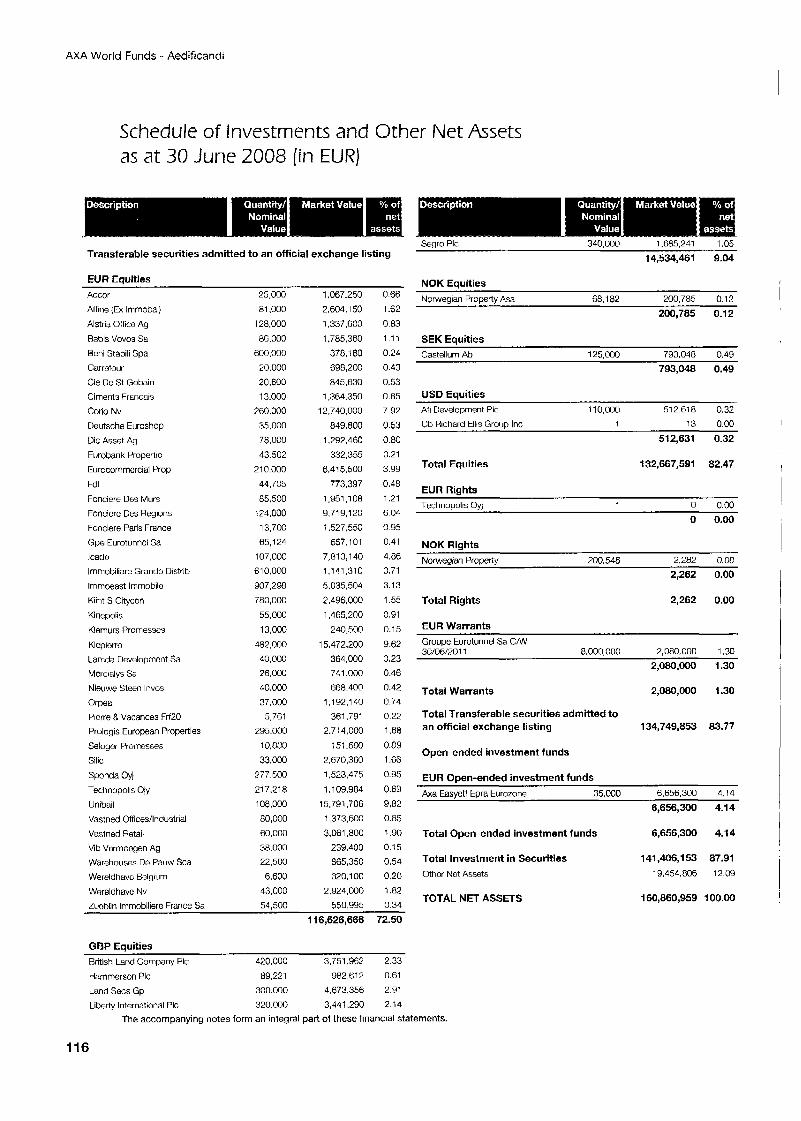
AXA World Funds - Aedificandi
as at 30 June 2008 (in EUR)
Transferable securities admitted to an official exchange listing
EUR Eauities Accor
Aftine (Ex Inimobai)
Alstria Office Ag
Rabis Vovos Sa
Beni Stabili Spa
Carrefour
Cie De St Gobain
Ciments Francais
Corio Nv
Deutsche Euroshop
Dic Asset Ag
Eurobank Proportic
Eurocommcrcial Prop
Fdl
Fonciere Dtis Murs
Foncicre Des Regions
Fonciere Paris France
Gpe Eurotunncl Sa
lcade
lmmobiliare Grandc Distrib
lmmoeast Immobilc
Kiint S Citycon
Kinepolis
Klemurs Promesses
Klcpicrrc larnda Developrncnt Sa
Mcrcialys Sa Nieuwe Steen lnvcs
Orpea
Picrre 8 Vacances Frf20 Prologis European Properties
Selogor Promesses
Silic
Sponds Oyj
Technopolis Ojy
Unibail
Vastnec Offices/lndustrial
Vastned Retail
Vib Vermoqen Ag
Warehouses De Pauw Sca
Wereldhdvc Belgium
Wereldhave Nv
~
25,000 81,000
128,000 86,000
600,000
20.000 20,600 13,000
760,000
35,000 78,000
43.502 210.000
44,705 65,500
124,000 13,700 65,124
107,000 610.000
907,298 780,000
55,000 13,000
482,000 40,000 26,000
40,000 37,000
5,761 295,000
10,000 33,000
277,500
21 7.21 8 108,000
80,000 60,000
38.000 22,500
6,600 43.000
Zucblin lmmobiliera France Sa ~ .~~~ . ,
116,626,666 72.50 54.500
1,067,250
2,604,150 1.337603
1.785.360 378.1 80 698,200 845.630
1.364.350 12,740,000
849.800
1,292,460 332,355
6,415,500 773.397
1,951,108 9,719,120 1,527,550
657.1 C1 7,813,l 40 1,141.310
5,035,504
2,496,000 1,465,200
240,500
15,472,200 364,000 741,000 668,400
1 ,I 92.1 LO
361,791 2.71 4,000
151.6M)
2,670,360 1,523,475 1.1 09,984
15,791,706 1,373,600 3,061,800
239,400 865,350 320.1 00
2,924,000 550.995
0.66- 1.62
0.83 1.11 0.24
0.43 0.53 0.85 7.92
0.53
0.80 0.21
3.99 0.48
1.21 6.04
0.95 0.41 4.86 0.71 3.13
1.55 0.91
0.15
9.62 0.23 0.46 0.42 0.74 0.22
1,68 0.09 1.66 0.95
0.69 9,82 0.85 1.90 0.15
0.54 0.20
1.82 0.34
GBP Equities British Land Company PIC 420,000 3,751,961 2.33 Hammorson PIC 89.221 982.612 0.61 Land Secs Gp 300,000 4,673.356 2.91 Liberty International f’lc 320.000 3,441,290 2.14
14,534,461 9.04
NOK Equities Norwegian Property Asa 68,182 200,785 0.12
200,785 0.12
SEK Equities 793.048 0.49
793,048 0.49 Castellum Ab 125,000
USD Equities 1 10,000 512.618 0.32 Afi Development PIC
Cb Richard Ellis Grow Inc 1 13 0.00
Total Equities
EUR Rights
Schedule of investments and Other Net Assets
The accompanying notes form an integral part of these financial statements.
512,631 0.32
132,667,591 82.47
0 0.00
0 0.00 Technopolis Oyj 1
NOK Rights Norweoian Prooertv 200.546 2.262 0.00
2,262 0.00
Total Rights 2,262 0.00
EUR Warrants Groupe Eurotunnd Sa C N 3W06/2011 8.000,000 2,080.000 1.30
2,080,000 1.30
Total Warrants 2,080,000 1.30
Total Transferable securities admitted to an official exchange listing 134,749,853 83.77
Open-ended investment funds
EUR Open-ended investment funds Axa Easyetl Epra Eurczone 35,000 6,656,300 4.14
6,656,300 4.1 4
Total Open-ended investment funds 6,656,300 4.14
Total Investment in Securities Othcr Net Assets
141,406,153 87.91 19.454.806 12.09
TOTAL NET ASSETS 160,860,959 100.00
116
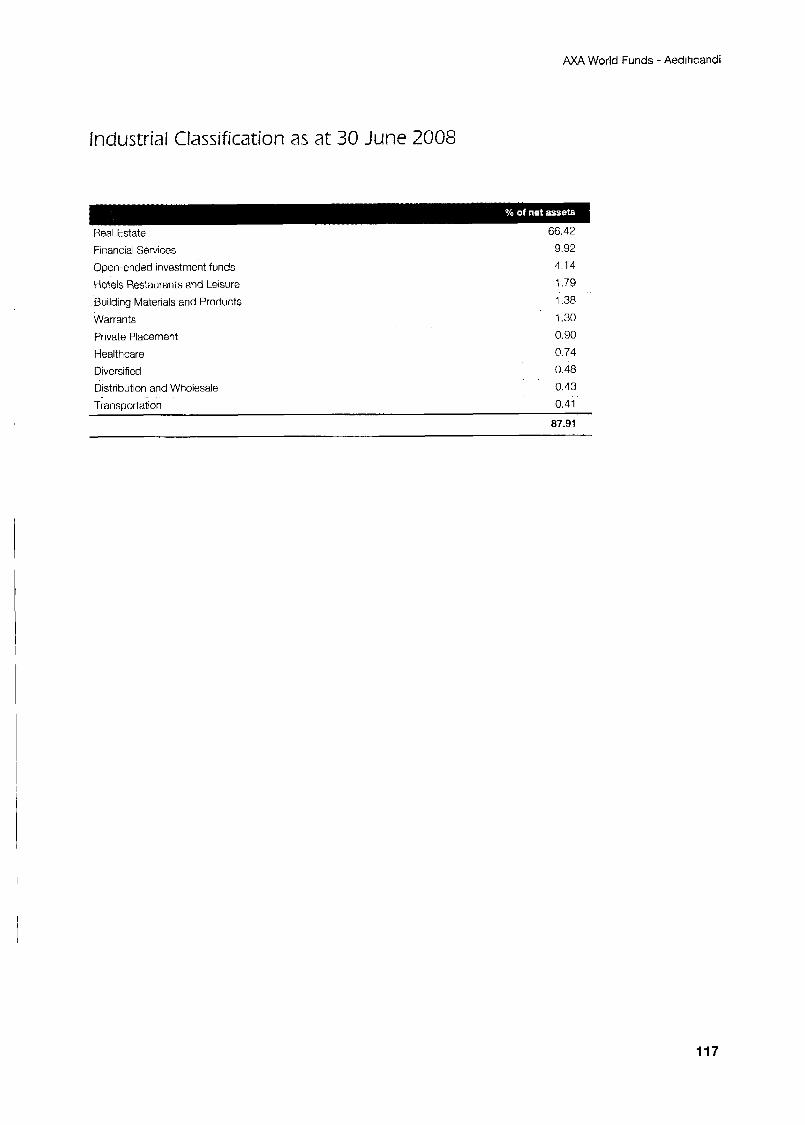
AXA World Funds - Aedificandi
Industrial Classification as at 30 June 2008
- .
Real Estate Financial Services
Open-ended investment funds
Hotels Restaurants and Leisure Building Materials 2nd Products
Warrants
Private Placement
Healthcare
Diversified
Distribution and Wholesale
66.42
9.92
4.14
1.79
1.38
1.30
0.90
0.74
0.48
0.43
Transportation 0.41
87.91
117
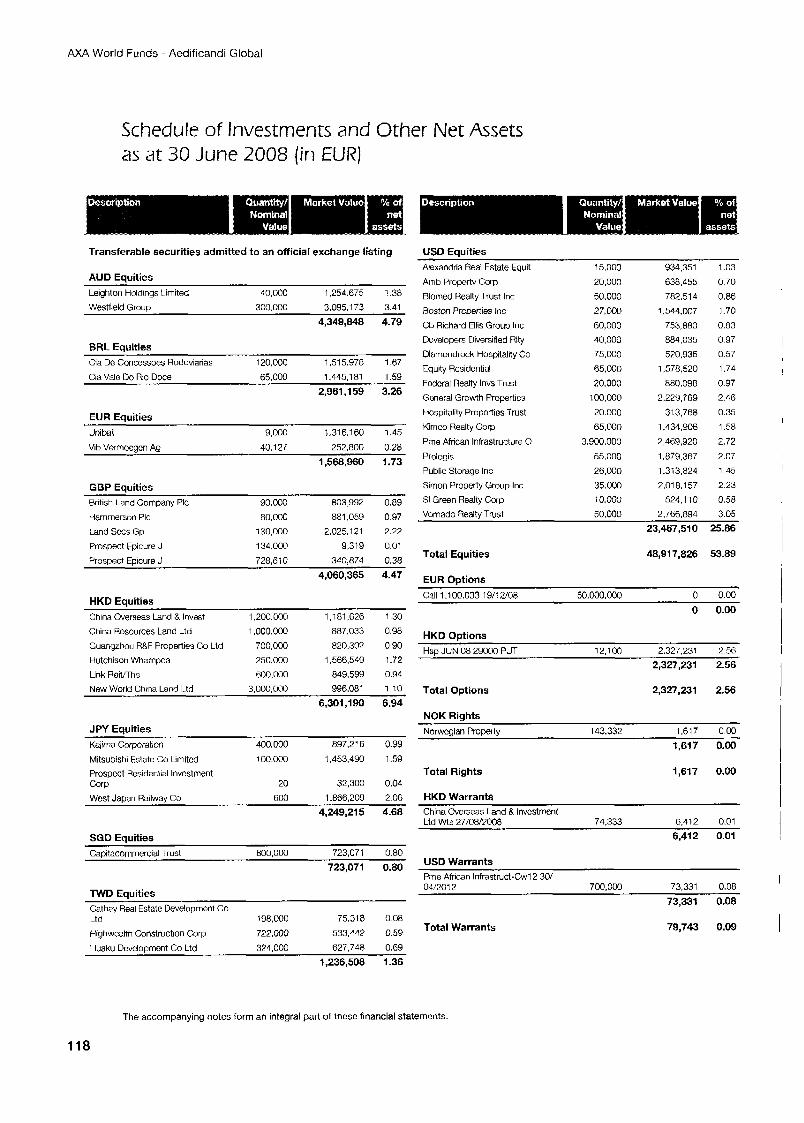
AXA World Funds - Aedificandi Global
Schedule of Investments and Other Net Assets as at 30 June 2008 (in EUR)
Transferable securities admitted to an official exchange listing
AUD Equities Leighton Holdings Limited
Westfield Grouo
40,000 I ,254.675 1.38 300.000 3.095.173 3.41
4,349,848 4.79
BRL Eauities Cia Da Concessoes Rodoviarias 120,000 1,515.978 1.67 Cia Vale Do Rio Doce 65,000 1.445.1 81 1.59
2,961,159 3.26
EUR Equities Unibail 9,000 1,316,160 1.45
Vib Vermocaen Aa 40.1 27 252.800 0.28 1,568,960 1.73
GBP Equities British Land Company PIC
Hammerson PIC
Land Sccs Gp
Prospect Fpicure J
90,000 803.992 0.89 80,000 881,059 0.97
130,000 2.025.121 2.22 134,000 9,319 0.01
Prospect Epicure J 728,610 340,874 0.38 4,060,365 4.47
HKD Equities China Overseas Land B Invest 1.200.0M) 1,181,626 1.30
China Rcsources Land Ltd 1,000,000 887.033 0.98
Guangzhou R&F Properties Co Ltd 700,000 820.302 0.90 Hutchison Whampoa 250,000 1,566,549 1.72 Link Reinhe 600,000 849.599 0.94 New World China Land I.td 3,000,000 996.081 1.10
6,301,190 6.94
JPY Equities Kajima Corporation 400,OCO 897.2’6 0.99
Mitsubishi Estate Co hmttcd 100,000 1,453,490 1.59 Prospcct Residential lnvcstinent Corp 20 32,300 0.04
Wcst Japan Railway Co 600 1,866,209 2.06 4,249,215 4.68
SGD Eauities ~
Capitacommercial Trust 800,000 723,071 0.80 723,071 0.80
TWD Eauities
USD Equities Alexandria Real Estate Equit 15,000 934,351 1.03 Amb Property Cow 20,000 638,455 0.70
Biomed Realty Trust Inc 50,000 782.514 0.86 Boston Properties Inc 27,003 1.544.007 1.70 Cb Richard Ellis Group Inc 60,000 753,880 0.83
40,000 884.035 0.97 Developers Diversified Rlty
Diamondrock Hospitality Co 75,000 570,935 0.57 Equity Residential 65,000 1,578.520 1.74
20,000 880.098 0.97 Fcdcral Realty lnvs Trust
General Growth Propartics 100,000 2,229,769 2.46
Hospitality Propertias Trust 20.000 313,768 0.35 Kimco Realty Corp 65,000 1,434,906 1.58 Pme African Infrastructure 0 3.900.000 2,469,920 2.72
Prologis 55,000 1,879,367 2.07 Public Storage Inc 26,000 1.313,824 1.45 Simon Property Group Inc 35,000 2.018.157 2.23 SI Green Realty Corp 1o.ow 524,110 0.58
Vornado Realty Trust 50.000 2.766.894 3.05 23,467,510 25-86
Total Equities 48,917,826 53.89
EUR Ontions Call lI10O.033 19/12/08 50.000.000 0 0.00
0 0.00
HKD Options Hsp JUN 08 29000 PJT 12.100 2,327,231 2.56
2,327,231 2.56
Total Options 2,327,231 2.56
NOK Rights Norwcgian Property 143,332 1,617 0.M)
1,617 0.00
Total Rights 1,617 0.00
HKD Warrants China Overseas Land 8 Invcstmcnt
6,412 0.01
6,412 0.01 Ltd Wts 27/08/5008 74.333
USD Warrants Pme African Infmsttuct-Cw12 30/ 04/2012 700.0CQ 73.331 0.08
Cathay Real Estate Development Co Ltd 198,000 75.318 0.08 Highwealth Construction Corp 722,000 533,447 0.59
Huaku Develooment Co LLtd 374.000 627.748 0.69
Total Warrants
73,331 0.08
79,743 0.09
I
I
I
I
i i I
I
I I
I 1,236,508 1.36
The accompanying notes form an integral part of these financial statements.
118
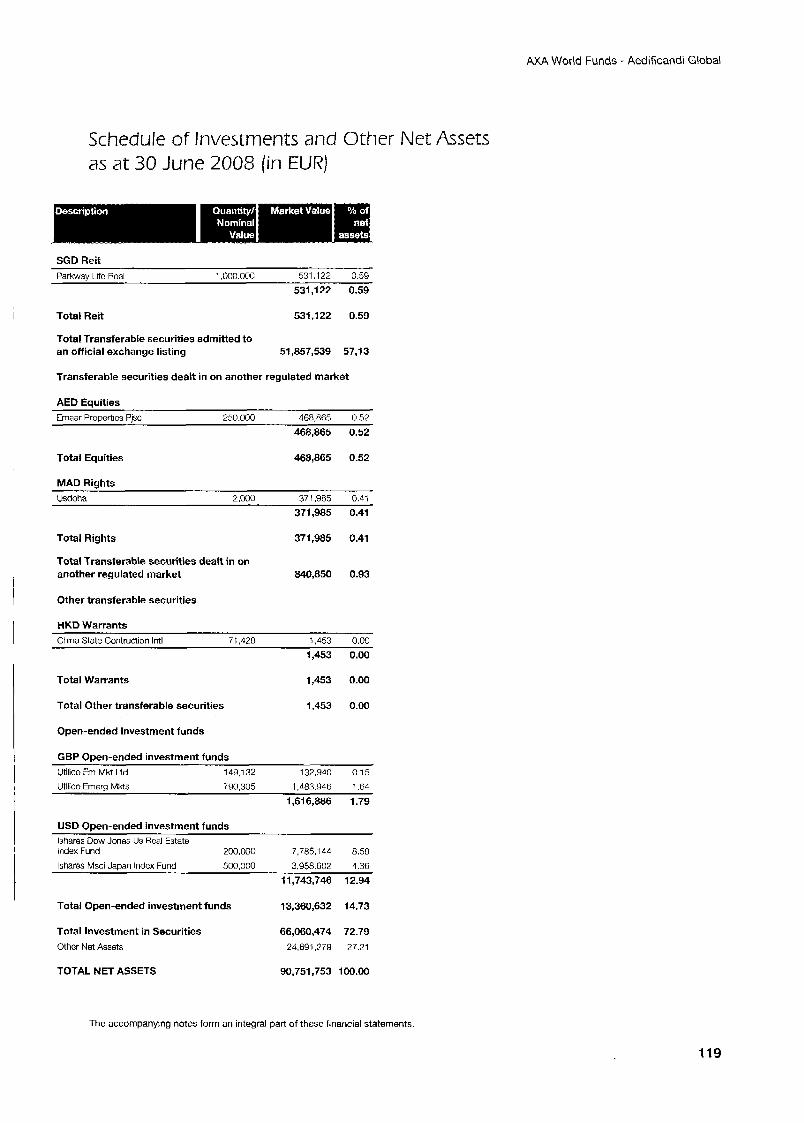
AXA World Funds - Aedificandi Global
Schedule of Investments and Other Net Assets as at 30 June 2008 (in EUR)
SGD Reit Parkway Life Rcal 1,000.000 531,122 0.59
531,122 0.59
Total Reit 531,122 0.59
Total Transferable securities admitted to an official exchange listing 51,857,539 57,13
Transferable securities dealt in on another regulated market
AED Equities frnaar Properties Pjsc 250.000 468,865 0.5?
468,865 0.52
Total Equities 468,865 0.52
MAD Rights Usdoha 2.000 371.985 0.41
371,985 0.41
Total Rights 371,985 0.41
Total Transferable securities dealt in on another regulated market 840,850 0.93
Other transferable securities
HKD Warrants China State Contruction lntl 71,428 !.453 0.00
1,453 0.00
Total Warrants 1,453 0.00
Total Other transferable securities 1,453 0.00
Open-ended investment funds
GBP Open-ended investment funds Utilico Em Mkt Ltd 149,132 132,940 0.15
Utilico Ernerq MMs 790,305 1.483.946 1.64
1,616,886 1.79
USD Open-ended investment funds ISharQS Dow Jones Us Rcal Estate Index Fund 200.000 7.785.1 44 8.58
Ishares Msci Jaaan Index Fund 500.000 3.958.602 4.36
11,743,746 12.94
Total Open-ended investment funds 13,360,632 14.73
Total Investment in Securities Othcr Net Assets
66,060,474 72.79 24,691,779 27.21
TOTAL NET ASSETS 90,751,753 100.00
The accompanying notes form an integral part of these financial statements.
119
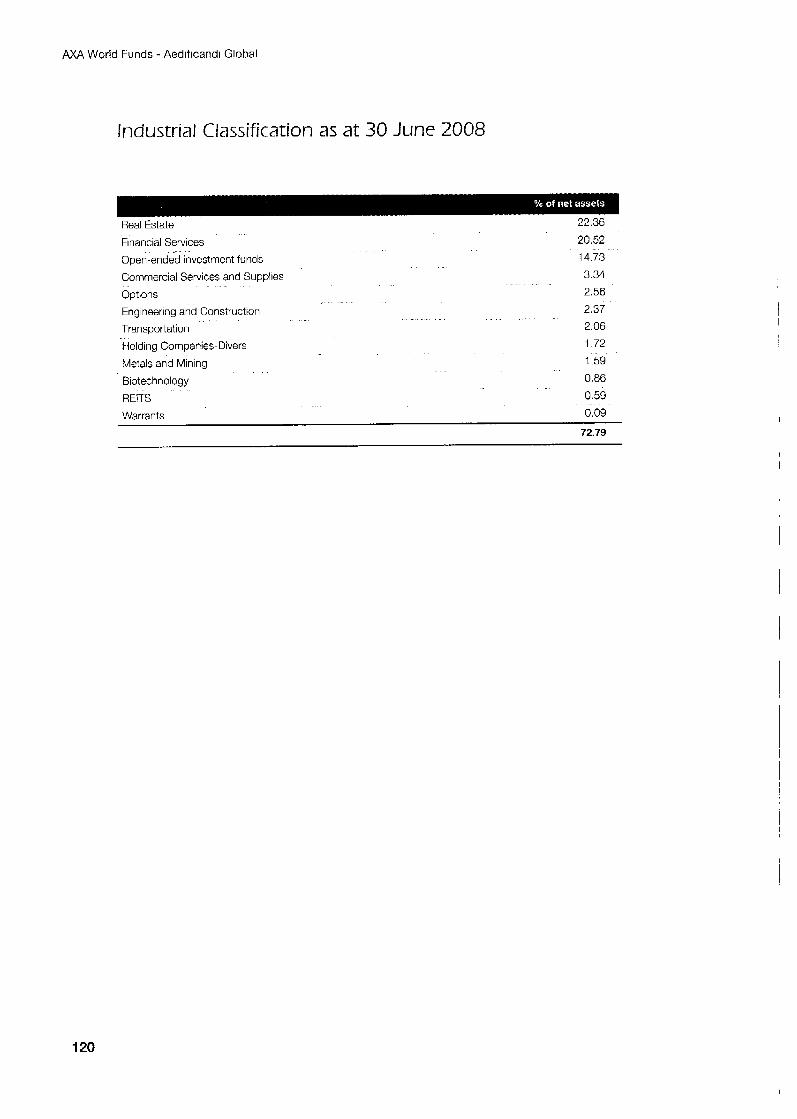
AXA World Funds - Aedificandi Global
Industrial Classification as at 30 June 2008
Real Estate 22.36
Financial Services
Open-ended investment funds
Commercial Services and Supplies
Options
Engineering and Construction
Transportation
Holding Companies-Divers
Metals and Mining
Biotechnology REITS
20.52 14.73
3.34
2.56
2.37
2.06
1 72
1 59
0.86
0 59
~-
Warrants 0.09
72.79 I
120
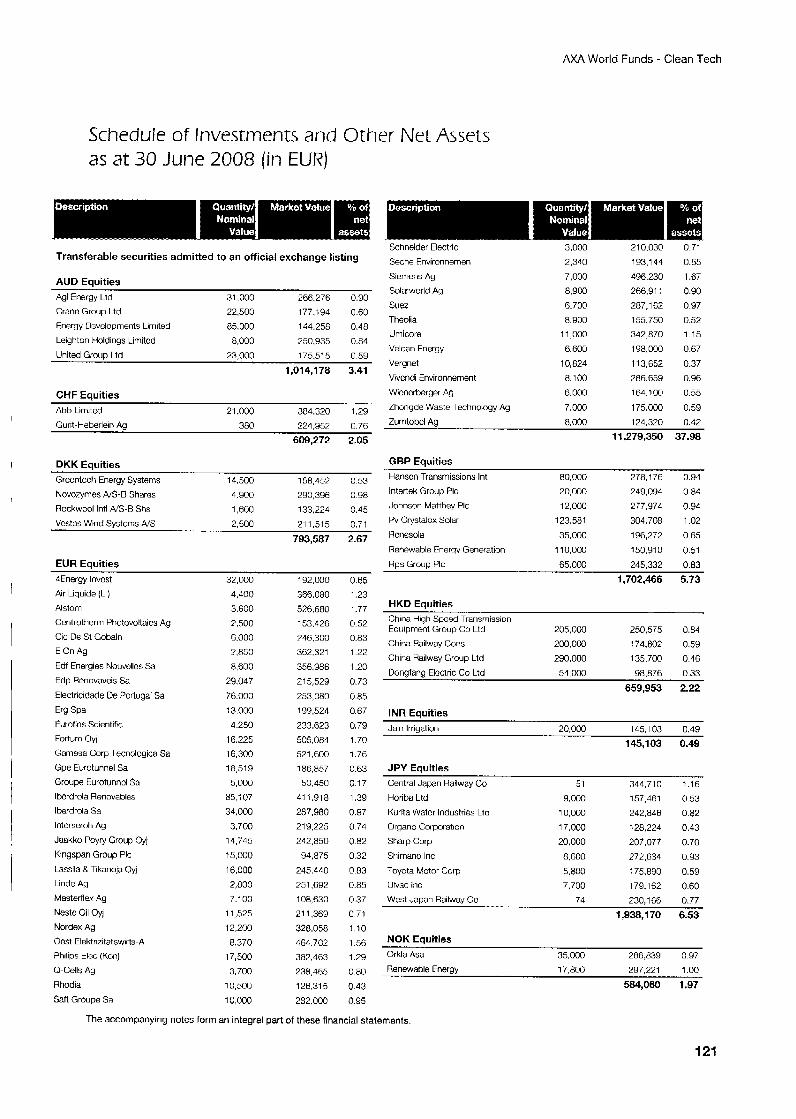
AXA World Funds - Clean Tech
Schedule of Investments and Other Net Assets as at 30 June 2008 (in EUR)
Transferable securities admi t ted to an official exchange listing
AUD Equities
Agl Energy Ltd 31.000 266,276 0.90
Crane Group Ltd 22,500 177,194 C.60 Energy Devclopments Limited 65,000 144.258 0.48
Leighton Holdings Limitcd 8,000 750,935 0.84
United Groua Ltd 23.000 175.515 C.59
1,014,178 3.41
CHF Equities
Abb Limitec 21 -000 384.320 1.29
Gunt-Heberlein Ag 380 224.957 C.76
609,272 2.05
DKK Eauities Grecntcch Energy Systems
Novozymes N S - B Shares
Rockwool lntl NS-8 Shs
Vcstas Wind Svstems NS
14.500 158,457 0.53
4.9m 290,396 0.98
1,600 133,224 0.45
2.500 211.515 0.71
793,587 2.67
EUR Equit ies
4Energy lnvcst
Air Liquide (L )
Alstom Centrotherm Photovoltaics Ay
Cic De St Gobain E On Ag
Edf Energies Nouvcllcs Sa
Edp Renovaveis Sa
Electricidade De Portugal Sa Erg Spa
Eurofins Scientific
Fortum Oyj
Gamma Corp Tecnologica Sa
Gpe Eurotunnel Sa
Groupe Eurotunncl Sa
lbcrdrola Renovables
lberdrola Sa lnterseroh Ag
Jaakko Poyry Group Oyj Kingspan Group PIC
Lassila & Tikanoja Oyj
Linde Ag
Mastertlex Ag
Neste Oil Oyj
Nordex Ag
Oast Elektrizitatswirts-A
Philips tlcc (Kon) Q-Cells Ag
Rhodia
Saft Groupe Sa
32,000
4,400 3.600
7.500 6.000
7,850
8,600 29.047
76.000
13.000 4.250
16.225
16,300 18,519
5,000 85,i07
34.000
3,700 14,745
15,000
16,000 2,800
7.100 11,525
12,200
8.370 17,500
3,700
10,500
10,000
192,000
366,080
526,660 153,426
746.300 362.321
356.986
215,529
253,080
199,524
233,623
505.064 521.600
186.857 50.450
411.918
287,980 219,225
242,850
94,875
245.410
251,692 108,630
21 1,369
326,058 464.702
382,463
238,465 126,315
282.000
0.65 1.23 1.77
0.52
0.83 1.22
1.20
0.73
0.85 0.67
0.79 1.70
1.76
0.63 0.1 7
1.39
0 97 0.74
0.82
0 32
0 83
0.85
0.37 0 71
1.10
1.56 1.29
0.80
0.43 0.95
Schneider Electric
Seche Fnvironnemen
Siemens Ag
Solarworld Ag
Suez Thoolia
Umicore Velcan Energy
Vergnet
Vivcndi Environnenient
Wicnorberger Ag
Zhonyde Waste Technology Ag
Zumtobcl Aa
3,000
2,340
7,000 8,900
6.700
8,900 11,000
6,600
10,824
6.100
6,000
7,000
6.000
21 0,030
193,144
496.230 266,911
287,162
155,750 342,870
198,000
113,652
266,659
164,100
175,000
124,320
0.71
0.65
1.67
0.90 0.97
0.52 1.15
0.67
0.37
0.96
0.55
0.59
0.42
11,279,350 37.98
GBP Equities Hanscn Transrnissions Int 60,000 278.176 0.94 Intertek Group Pic 20,000 249.094 084
Johnson Matthey PIC 12,000 277.974 0 9 4 Fv Crystalox Solar 123.581 304,708 102 Rcncsola 35,000 196,272 0 65
Renewable Fnergy Generation 110,000 150,910 051 Rps Group PIC 65,000 245.332 0 8 3
1,702,466 5.73
HKD Equit ies
China Hiah Sucod Transmission Equipmeh &oup Co Ltd
China Railway Cons
China Railway Group Ltd
205.000 250,575 0.84
200,000 774,802 0.59
290,000 135,700 0.46
Uongfang Eloctric Co Ltd 54,000 98.876 0.33
659,953 2.22
INR Equities Jain lrriaztion 20.000 145.103 0.49
145,103 0.49
JPY Equit ies
Central Jawn Railway Co Horiba Ltd
Kurita Watcr Industries Ltd
Organo Corporation
Sharp Corp
Shimano Inc
Toyota Motor Cow Ulvac Inc
West Jaaan Railwav Co
51 9,000
10,000
17,000 20,000
8,600
5,800 7,700
74
344,710 157,461
242.846
128,224
207,077
272,634
175.890 179,162 7110.1 RR
1.16
0.53 0.82
0.43
0.70
0.93
0.59
0.60 n 77 .. - -
1,938,170 6.53
NOK Equities Orltla Asa 35,oCO 286,839 0.97 Renewable Energy 17,800 297,221 1.00
584,060 1.97
The accompanying notes form an integral part of these financial statements
121
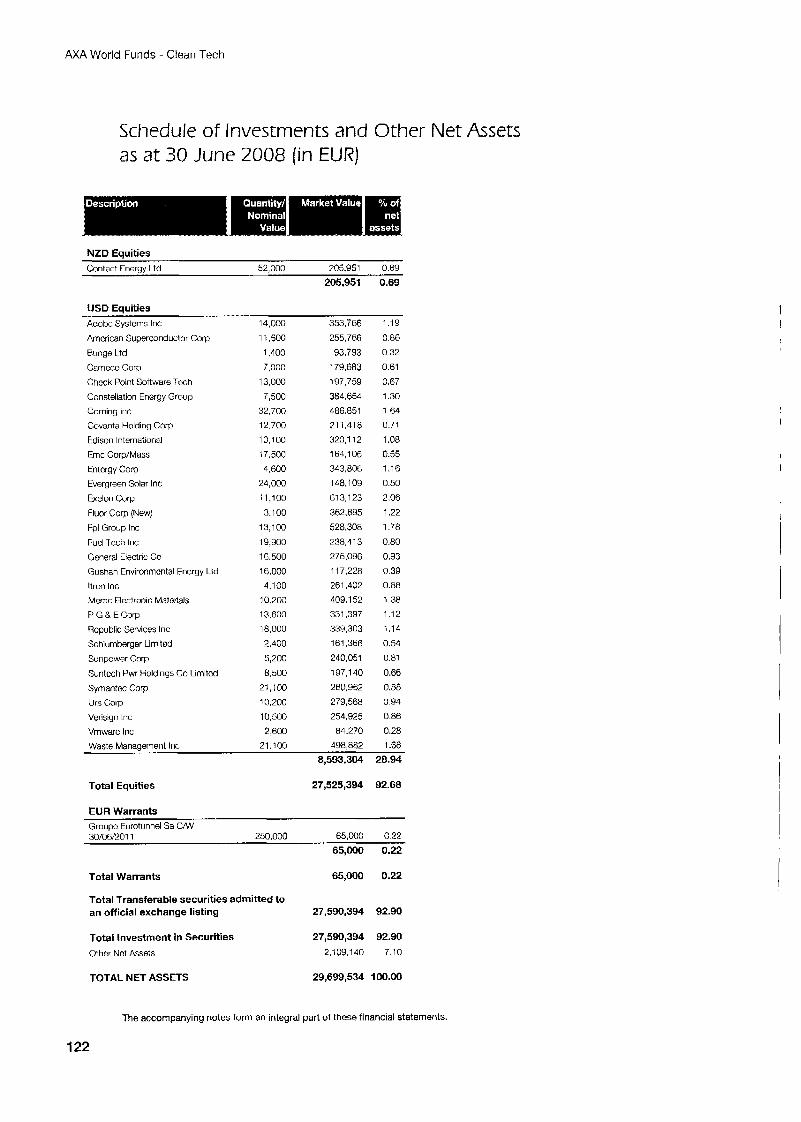
AXA World Funds - Clean Tech
Schedule of Investments and Other Net Assets as at 30 June 2008 (in EUR)
NZD Eauities Contact Energy Ltd 52,000 205.951 0.69
205,951 0.69
USD Equities Adobe Systems Inc
Amcncan Superconductor Corp
Bunge Ltd
Cameco Corp
Chcck Point Software Tcch
Constellation Eriorgy Group
Corning lric
Covanta Holding Corp
Edison lnternatiunal
Ernc Corp/Mass
Erilcrgy Corp Evergreen Solar Inc
Exelon Corp
fluor Corp (New)
Fpl Group Inc
Fucl Tech Inc
General Electric Go
Gushan Environmcntal Energy Ltd
Itron Inc Memc Electronic Materials P G B ECorp
Rcpublic Services Inc Schlumberger Linritod
Sunpower Corp
Suntcch Pwr holdings Co Limitcd
Symantec Corp
Urs Corp Verisign Inc
Vmwarc Inc
Waste Manaaernent Inc
14.000 11,500
1,400 7,OOG
13,000 7,500
32,700 12.700 10,100
:7.500 4.600
24,000 11,100
3,100 13,100 19,900
16.500 16,000 4,100
10.2017
13,600 18,000
2.400 5,200 8,500
21,100 10.200
10,500 2,600
21,100
353,766 255,766
93,793 179.683
197,759 384,654 486.851 21 1,418 320,l 12 164,106 343.806 148,109 613,123
362.895 528,308
238,413 275,096
117,228 261,402 409,152
331,397 339.3c3 161,366 240,051
197,140
260,962 279,568 254.925
84.270
1 .I9 0.86 0.32
0.61 0.67
1.30 1 64 0.71 1.08 0.55 1.16 0.50
2.06 1.22
1.78 0.80 0.93
0.39 0.88
1.38 1.12
i.14 0.54
0.81 0.66 0.88
0.94 0.86
0.28 ACIR RR7 , _ -,-_- 1.68
8,593,304 28.94
Total Equities 27,525,394 92.68
EUR Warrants Groupe Eurotunnel Sa CAN 30/06/2011 250,000 65,000 C.22
65,000 0.22
Total Warrants 65,000 0.22
Total Transferable securities admitted to an official exchange listing 27,590,394 92.90
Total Investment in Securities Other Not Assets
27,590,394 92.90 2,109,140 7.10
1
1
TOTAL NET ASSETS 29,699,534 100.00
The accompanying notes form an integral part of these financial statements.
122
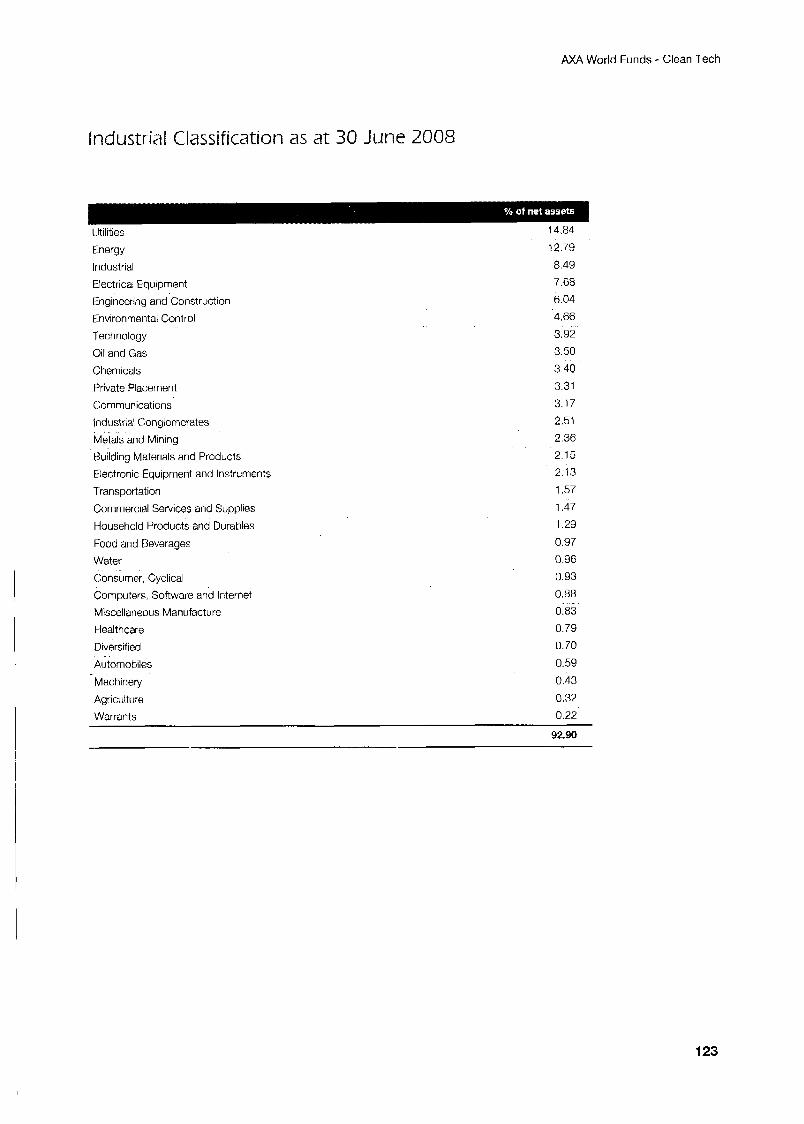
A M World Funds - Clean Tech
Industrial Classification as at 30 June 2008
Energy
Industrial
Electrica, Equipment
Engineering and Construction
Environmental Control
Tech no1 og y
Oil and Gas Chemicals
Utilities 14 84
12 79 8 49 7 68 6 04 4.66 3.92 3.50 3 40
Private Placement 3.31 Communications 3.17 Industria' Conglomerates 2.51 Metals and Mining 2.36 Building Materials and Products 2.15
Electronic Equipment and instruments
Transportation
Commercial Services and Supplies
Household Products and Durables
Food and Beverages
Water
Consumer, Cyclical
Computers, Software and Internet
2 13 1.57 1.47 1.29
0.97 0.96 0.93 0.88
Miscellaneous Manufacture 0.83 Healthcae 0.79 Diversified 0.70
Automobiles
Machinery
0.59 0.43
Agriculture 0.32 Warrants 0.22
92.90
123
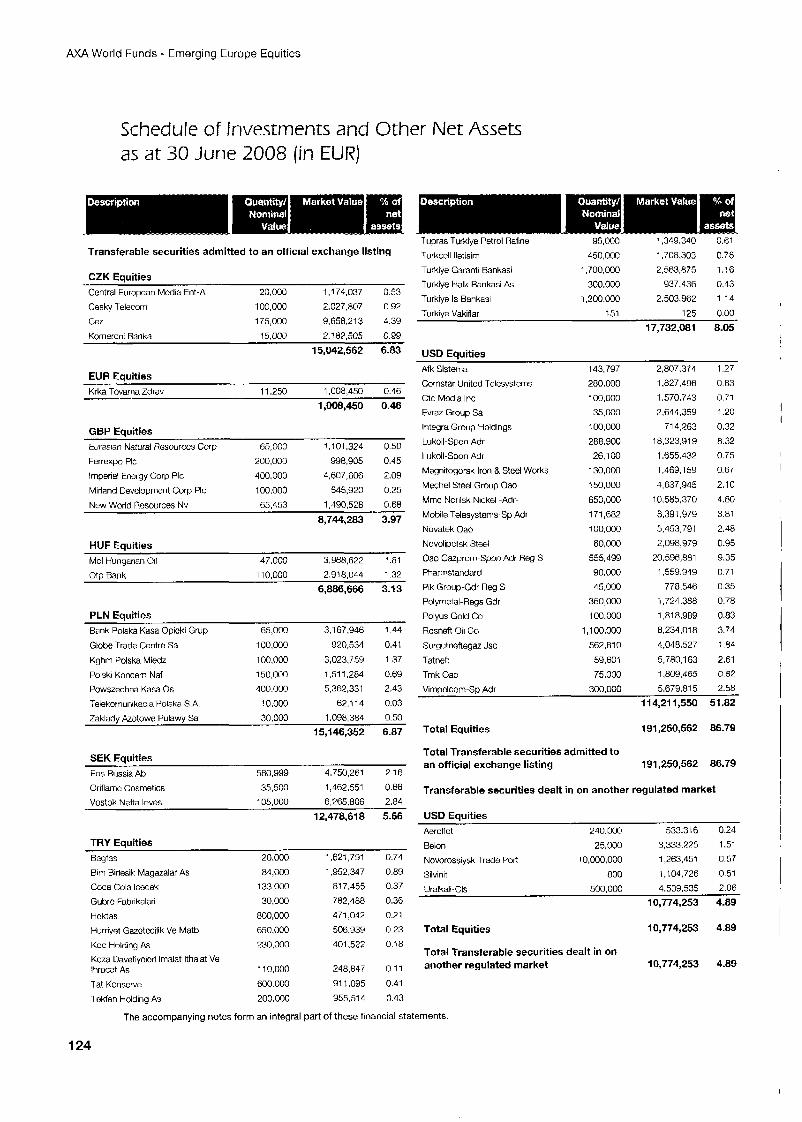
M A World Funds - Emerging Europe Equities
Schedule of Investments and Other Net Assets as at 30 June 2008 (in EUR)
Transferable securities admitted to an official exchange listing
CZK Equities Central European Media Ent-A 20,000 1 ,I 74,037 0.53 Cesky Telecom 100,000 2,027,807 0.92
Cez 175,000 9.658.213 4.39 Komercni Bank3 15,000 2,187,505 0.99
15,042,562 6.83
EUR Eauities Krka Tovarna Zdrav 11.250 1,008.450 0.46
1,008,450 0.46
GBP Eauities turasian Natural Rcsourccs Gorp 65,000 1, 101,324 0.50
Fenexpo PIC 200,000 998,905 0.45 Imperial Energy Corp PIC 400,000 4,6C7,606 2.09
Mirland Devcloprnent Corp PIC 100,000 545,920 0.25
New World Resources Nv 65,453 1,490,528 0.68
8,744,283 3.97
HUF Equities Mol Hungarian Oil 47,000 3,968,622 1.81
Oto Bank 110.000 2.918.0L4 1.32 6,086,666 3.13
PLN Equities Bank Polska Kasa Opicki Gnip 65,000 3,167,946 1.44
Globe Trade Centre Sa 100,000 920.534 0.41
Kghm Polska Miedz 100,000 3,023,759 1.37 Polski Koncem Naf 150,000 1.51 1.284 0.69 Powszechna Kasz Os 400.000 5,362,331 2.43 Telekornunikacja Polska S.A. ! 0,000 62,114 0.03 Zaklady batowe Pulawy Sa 30,000 1.098.384 0.50
I 5,146,352 6.87
SEK Equities Eos Russia Ab 580.Y99 4.750.261 2.16 Oriflame Cosmetics 35,500 1,462,551 0.66 Vostok Nzfta lnves 105,000 6,265,806 2.84
12,478,618 5.66
TRY Equities Bagfas 20,000 1,621,791 0.74
Bim Birlesik Magazalar As
Coca Cola Icecek
Gubrc Fabflkalari
Hcktas
Hurriyet Gazctccilik Ve Matb
Koc Holding As Koza Davetiyclcn lrnalat lthalat Ve lhracat As
Tat Konserve
.I ekfen Holding As
84,000 133.000 30,000
800,000
650,000 ~30.000
11 0,000 600.000
200.000
1,952,347 81 7.455 782.488 471,042
506,939 401,522
248,847 91 1,095 955,514
0.89 0.37 0.36 0.21 0.23 0.18
0.1 1 0.41
0.43
Tupras Turktye Petrol Rafine 95.000 1,349.340 0 61
Turkcell lletisim 450,002 1.708.303 0 78 1,700,000 2,563,875 1 16 Turkiye Garanti Bankasi
Turkiye Halk Rankasi As 300,000 937.436 0 4 3 2,503,962 1 14
Turkiye Vakiflar 151 125 000
17,732,081 8.05
Turkiye Is Bankasi 1,200 000
USD Equities Afk Sistema 143,797 2.807.374 1.27 Cornstar United Telesystems 280.000 1,827.496 0.83 Ctc Media Inc 100,000 1,570,743 0.71 Fvraz Group Sa 35,000 2,644,359 1.20
Integra Group Holdings 100,oM) 714,263 0.32 Lukoil-Spon Adr 288.900 18,323.91 9 8.32 Lukoil-Spon Adr 26,100 1,655,432 0.75 Magnitogorsk Iron B Steel Works 130,003 1.469.159 0.67
150,OM) 4,637,945 2.10 Mechel Steel Group Oao Mrnc Norilsk Nickel -Adr- 650,000 10,585,370 4.80
Mobile Telesystems- Sp Adr 171,682 8.391979 3.81
Novatek Oao 100,000 5,453,791 2.40 Nvvolipctsk Steel 60,000 2,098,979 0.95 Oao Gazprom-Spon Adr Reg S 555,499 20,596,881 9.35 Pharrristandard 90,000 1,559,949 0.71
778.546 0.35 Pik Group-Gdr Reg S 45,000 Polyrnetal-Regs Gdr 350,000 1,724,388 0.78 Polyus Gold Co 100,000 1.81 8,989 0.83
Rosneft Oil Co 1,100,000 8,234,018 3.74
SurgutneRegaz Jsc 562,810 4.048.527 1.84 59,601 5,760,163 2.61
Tmk Oao 75.000 1,809,485 0.82
Tatneft
Vimpclcom-Sp Adr 300,000 5.679.81 5 2.58
11 4,211,550 51.82
Total Equities 191,250,562 86.79
Total Transferable securities admitted to an official exchange listing 191,250,562 86.79
Transferable securities dealt in on another regulated market
USD Equities Aeroflot 240.000 533,316 0.24 Belon 25,000 3.333225 1.51 Novorossiysk Trade Port '0,000,000 1,263.451 0.5'7 Silvinit 800 1,104,726 0.51
UralkaliGls 500,000 4,539,535 2.06 I 0,774,253 4-89
10,774,253 4.89
another regulated market 10,774,253 4.89
Total Equities
Total Transferable securities dealt in on
I I
I
I
!
1 !
i I I
1 I
The accompanying notes form an integral part of these financial statements.
124
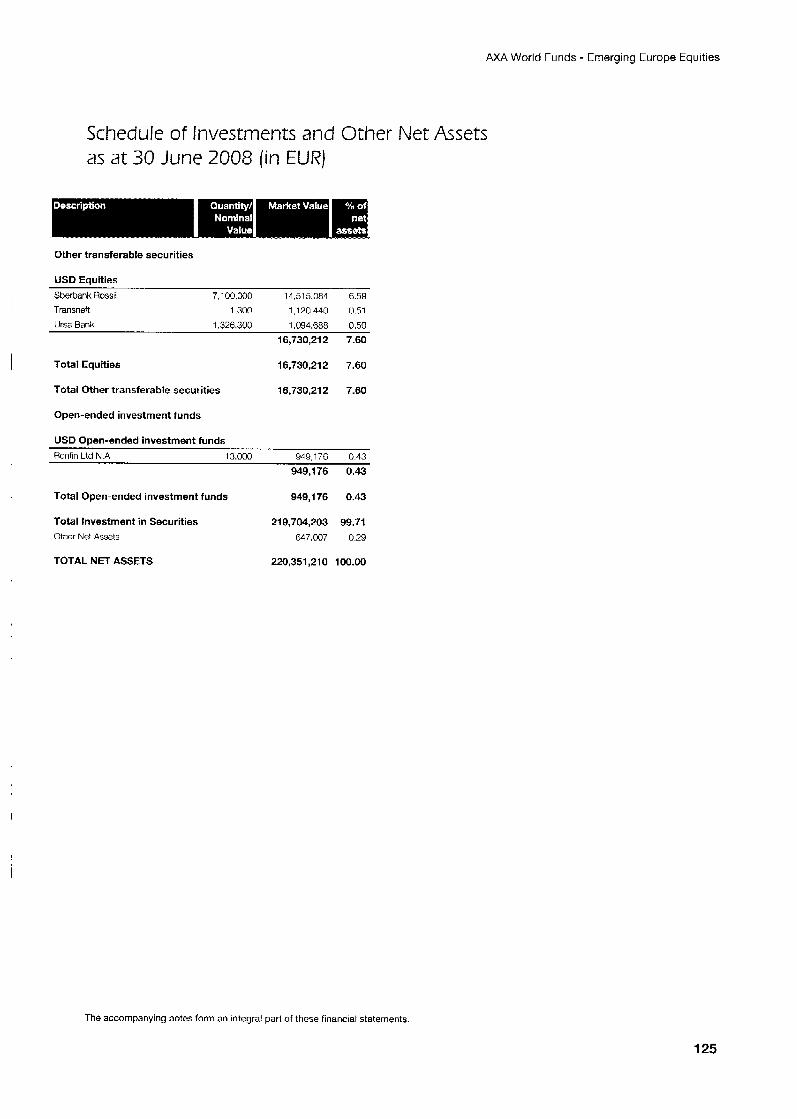
AXA World Funds - Emerging Europe Equities
Schedule of Investments and Other Net Assets as at 30 June 2008 (in EUR)
Other transferable securities
USD Equities Sberbank Rossti 7,100,000 14,515,084 6.59 Transnefl 1,300 1,120,440 0.51
Ursa Bank 1,326.300 1,094,688 0.50
16,730,212 7.60
I
I Total Equities 16,730,212 7.60
Total Other transferable securities 16,730,212 7.60
Open-ended investment funds
USD Open-ended investment funds
Renfin Ltd N.A 13,000 949,176 0.43
949,176 0.43
Total Open-ended investment funds 949,176 0.43
Total Investment in Securities 219,704,203 99.71 Other Net Assets 647,007 0.29
TOTAL NET ASSETS 220,351,210 100.00
The accompanying notes form an integral pari of these financial statements
125
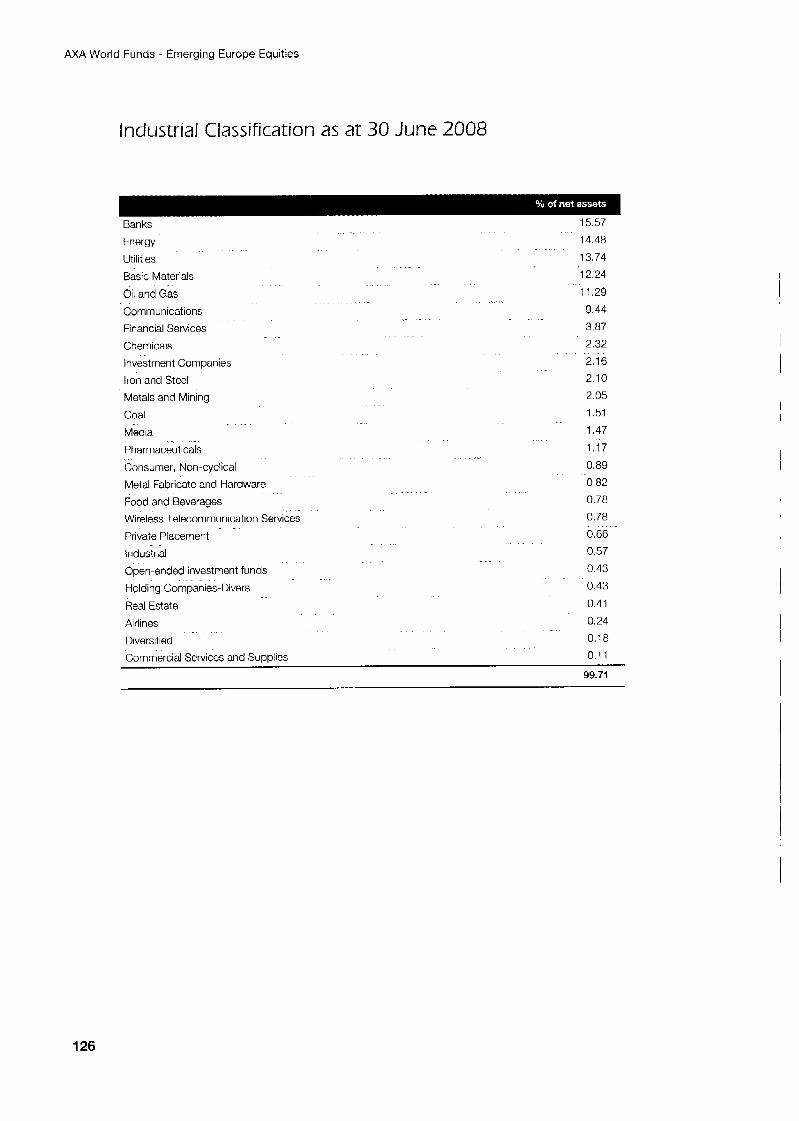
AXA World Funds - Emerging Europe Equities
Industrial Classification as at 30 June 2008
Banks 15.57
Energy 14.48
Utilities 13 74
Basic Materials 12 24
Oil and Gas 11.29
Communications 9 44 Financial Services 3 87
Chemicals 2.32
Investment Companies 2.16
Iron and Steel 2 10
Metals and Mining 2.05
Coal 1.51
Pharmaceuticals 1.17 Consumer, Non-cyclical 0.89
Metal Fabricate and Hardware 0 82 Food and Beverages 0.78
Wireless Telecommunication Services 0.78
Private Placement 0 66
Industrial 0.57
Open-ended investment funds 0.43
Holding Companies-Divers 0.43
Real Estate 0.41
Airlines 0.24
Diversified 0.18
Commercial Services and Supplies 0.1 1
99.71
Media 1.47
126
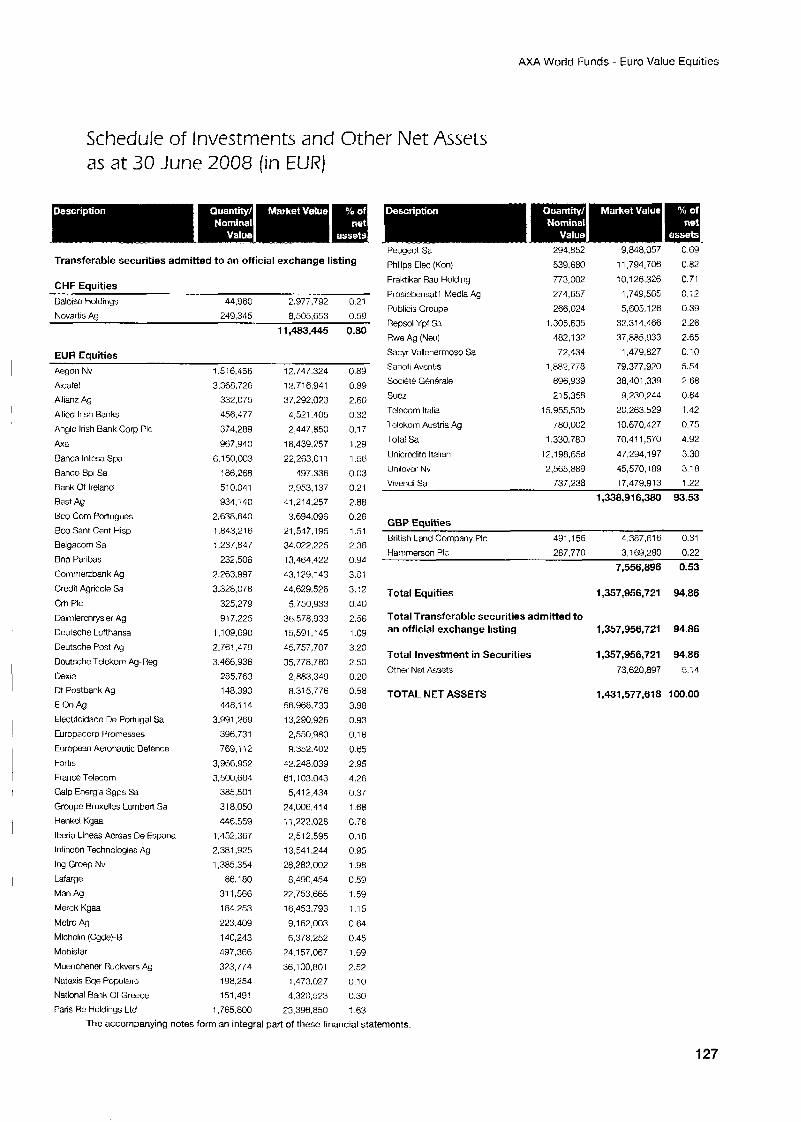
A M World Funds - Euro Value Equities
as at 30 June 2008 (in EUR)
Transferable securities admitted to an official exchange listing
CHF Equities Baloiso Holdings
Novartis Aa 44,960 2,977,792 0.21
249.305 8.505.6.53 0.59
EUR Eauities
~
11,433,445 0.80
Aegori Nv
Alcatel
Alliarrz Ag
Allicd Irish Banks
Anglo Irish Bank Corp PIC
&a Eanca lntesa Spa Banco Bpi Sa
Bank of Ireland
Bast Ay
Bco Corn Portugues Bco Sant Cent Hisp
Belgacom Sa Bnp Pdribas
Commerzbank Ag
Credit Agricole Sa
Crh PIC
Daimlerchtysler Ag Deutsche Luftharisa
Deutsche Post Ag
Dcutsche Tdekom Ag -Reg
llexia M Posthank Ag
E On Ag
Electricidado De Portiigal Sa
[Iuropacorp Promesses
European Aeronautic Defence
Fortis
Franc0 Tolecorn
Gdlp Energia Sgps Sa
Groupe Bruxelles tamhcrt Sa
Henkccl Kgaa
Iberia Lineas Acroas De Espana lnfincon Technologies Ag
Ing Groep Nv
Man Ag
Merck Kgad
Metro Ag
Michclin (Cgde)-R Mobistar
Muenchener Huckvers Ag
Natoxis Bqe Populairc National Hank of Greece
Paris Re Holdings Ltd
LdfXge
1.516,456
3.368.726 332,075
456,477 374.289 967.940
6,150,003 : 86,268
510.041 934.140
2,638.640 1,843.2 16 : ,237,847
232,506
7,263,997 3.328.078
325,279
917.225 1,109,690 2,767,479 3,466,936
285.763 148,390
448.1 14 3.991 269
396,731 769,172
3,966.952
3,500,604 385,501
31 8.050
446.559 1,452,367 2,381,925
1,385,354 86,180
31 1,566 1 84.253 223,409
140,243 497.366
373,774 198,254 151.49!
1.765.800
12.747.324 12,716,941 37,292,073
4,521.405 2 447,850
18.439257 22,263,011
497.336 7,953,137
41,214,257 3.694.096
21,547,195 34,022,225
13,464,422 43,179,143 44 629.526
5,750,933 363.578.933 15,591,145 45,757,707
35,778,780 2,883.349 8.315.776
56,968.733 13 290,976 2,550,980 9.352.402
42,248,039 61.103.043 5,112,434
24,006,414
11,772,028 2,512,595
13,541,244
28,282,002 8 490,454
22.753,665 16,453,793
9,162,003 6.378.252
24,157.067 36,100.801
1,473,027 4,320.573
23.396.850
0.89 0.89
2.60 0.32 0.1 7
1.29 1.56 0.03 0.21
7.88 0.26
1.51 2.38
0.96 3.01 3.?2
0.40 2.56
1 .OY 3.20 2.50 0.20 0.58
3.98 0.93
0.18
0.65 2.95 4.26
0.37 1.68
0.78
0.18
0.95 1.98 0.59
1.59 1.15
0.64 0.45 1.69 2.52 0.10 0.30 1 .I53
Pe.rgeot Sz 294.652 9,848,057 0 69
Philips Elec (Kon) 539.680 11,794,706 0.82
Praktiker Rau Holding 773,002 10,126326 0.71
Prosiebensatl Media Ag
Publicis Groupe
Repsol Ypf Sa
Rwe Ag (Neu) Sacyr Vallehermoso Sa
Sanofi Avcntis Societe GBnBrzle
sucr
.rclecorn ltalie
274,657 1,749,565 0.i2
266.024 5,605.126 0.39 1,305,635 32,314,466 2.26
482,132 37,865,933 2.65 72,434 1,479,827 0.10
1,882.778 79,377,920 5.51 696,939 38,401,339 2.68 215,358 9,230,244 0.64
15,955,535 20,263.529 1.42 780,002 10,670,427 0.75 1 clckorn Austria Ag
Total Sa Unicrcdito Italian
llnilcvcr Nv
Schedule of Investments and Other Net Assets
The accompanying notes form an integral part of these financial statements.
1,330,780 70.41 1,570 4.92 12.198.658 47,294,197 3.30 2.565.889 45,570,189 3.18
Vivendi Sa 737,238 17.479.913 1.22
1,338,916,360 93.53
GBP Equities British Land Company PIC 491,156 4,387,616 0.31
Harnrnerson PIC 287.770 3.169.280 0.22 7,556,896 0.53
Total Equities 1,357,956,721 94.86
Total Transferable securities admitted to an official exchange listing 1,357,956,721 94.86
Total Investment in Securities 1,357,956,721 94.86 Other Net &sots 73,620,897 5.14
TOTAL NET ASSITS 1,431,577,618 100.00
127
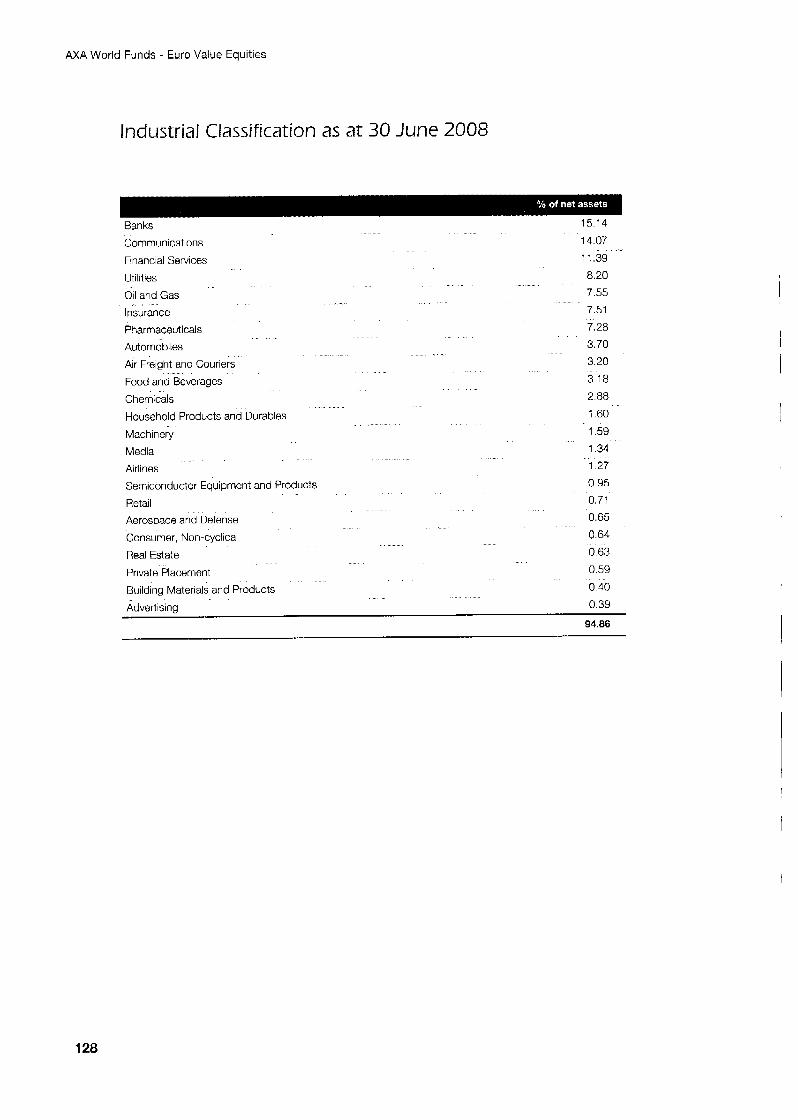
M A World Funds - Euro Value Equities
Industrial Classification as at 30 June 2008
Banks
Communications
Financial Services
Utilities
Oil and Gas
Insurance
Pharmaceuticals
Automobiles
Air Freight and Couriers
Food and Beverages
Chemicals
Household Products and Durables
Machinery
Media
Airlines
Semiconductor Equipment and Products Retail
Aerospace and Defense
Consumer, Non-cyclical
Real Estate
Private Placement
Building Materials and Products
Advortisinq
15 14
14 07 11.39
8.20
7.55
7 51
7 28
3.70
3 20
3 18 2 88 1 60
1 59 1 31 1 27
0 95
0 71 0.65
0 64
0 63 0.59
0 40 0 39
~ ""
- 94.86
I
128
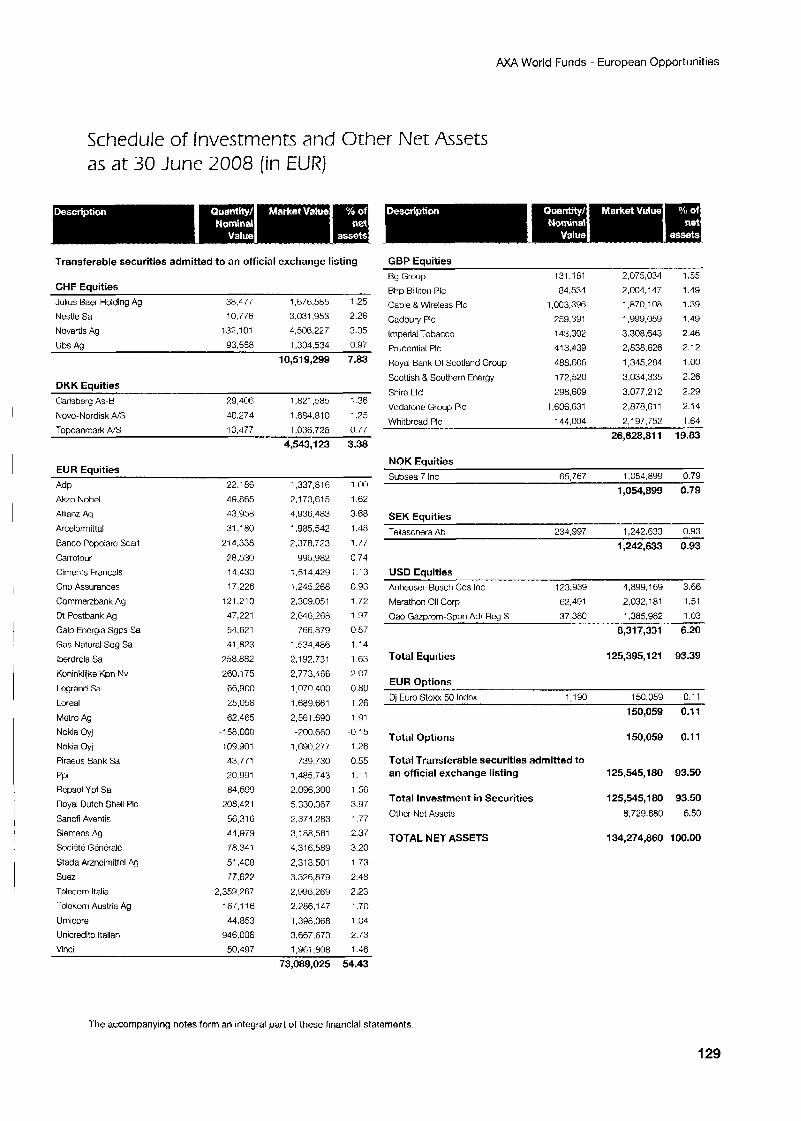
AXA World Funds - European Opportunities
Schedule of Investments and Other Net Assets as at 30 June 2008 (in EUR)
Transferable securities admitted to an official exchange listing
CHF Eauities Julius Baer Holding Ag 38.477 1,676,585 1.25
Nestle Sa 10,776 3,031,953 2.26
Novartis Ag i32.101 4.506227 3.35
Ubs Ag 93,558 1.304.534 0.97
10,519,299 7.83
DKK Equities Carlsb~rg As-B
Novo-Nordisk N S
TowkinmarR N S
29.406 1.821.585 1 3 6
40.274 1.684.81 0 1 2 5
10.477 1,036,726 0.77 4,543,123 3.38
EUR Equities
Adp Akzo Nobel
Allianz Ag
Arcelomittal
Banco Popolarc Scar1
Cat rcfour Cirnents Francais
Cnp Assurances
Commerzbank Ag Dt Postbank Ag
Galp Encrgia SgpS Sa
Gas Natural Sdg Sa
lberdrola Sa Koninklijke Kpn Nv
Logrand Sa
Loreal
Mctro Ag
Nokia Gyl Nokia Gyj
Piraeus Bank Sa
PPr Repsol Ypf Sa
Royal Dutch Shell PIC
Sanofi Aventis
Siemens Ag
Societe GBncralc
Stada Arzncimittel Ag
Suez Telecom ltalia
Iclckoni Austria Ag
Umicorc Unicredito Italian Unci
22.186
49.865
43,958
3i,lR0
21 6.338 P8.530 14,430
17,226
121.210
47,221
54.621 41,823
258,882
260,175
66,900
25,056
62.465
-I~R,OO(I 109.901
43,771 20,991
64.699 208.491
56,316
A4.979
78.341
51.408
77.6Z
2,359.267
167.116
44.853
946,006 5n .4~7
1,337,ni R
2,173,615
4.936.483
1.985.542
2.378.723
995.982 7 3 1 4,429
1.245.268
2.309.051 2,646,268
766.879
1.534.486
2.1 92,731 2,773.&66
1,070.CO0
I,fi89.661
2,561,690
-200.660 1,690,277
739,730 1,485,743
2,096,300
5,330.367
2.374283 3,188,561
4,316589
2,318.501
3,326,879
2.996269
2,186.1 47
1,396,068 3,667,673
1 .00
1.62
3.68
1.48
1.77
0 74 i .13
0.93
1.72 1 9 7
0.57
1.14
1 63
2 07
0 80
1 76 1.91
-0.15 1.26
0.55 1.11
1 56
3.97
1.77 2.37
3.20
1.73
2.18
2.23
1.70 1.04
2.73
. 1,9Ri ,808 1.46
73,089,025 54.43
GBP Eauities Bg Group
Bhp Billiton PIC Cable 8 Wireless PIC
Cadbury PIC
Imperial Tobacco
Prudential PIC
Royal Bank Of Scotland Group
Scottish 8 Southern Energy
Shire Ltd
Vodafone Group PIC
131.161
84.534
1,003,396
259,391
143,302
413.439
488.606
172,520
298,609
1,606,631
2,075,034
2,004,147 1,870,108
1,999,059
3.308.643 2,838,626
1,345,284
3,034,335
3,077,212
2,878.61 1
1.55
1.49 1.39
1.49
2 46 2.12
1 .oo 2.26
2.29
2.14
Whitbrcad PIC 144,004 2,197,752 1.64
26,628.81 1 19.83
NOK Equities Subsea 7 Inc 65.767 1.054.899 0.79
I ,054,899 0.79
SEK Eauities Teliasonera Ab 234,997 1,242,633 0.93
1,242,633 0.93
USD Equities Anheuser-Busch Cos Inc 123,939 4.899.169 3.66
Marathon Oil Corp 62.401 2,032,181 1.51
Oao Garprom-Spon Adr Reg S 37.380 1,385.982 1.03
8,317,331 6.20
Total Equities 125,395,121 93.39
EUR Options Dj Euro Stoxx 50 Index 1,190 150,059 0.11
150,059 0.11
Total Options 150,059 0.11
Total Transferable securities admitted to an official exchange listing 125,545,180 93.50
Total Investment in Securities 125,545,180 93.50 Othcr Nct Asscts 8,729,680 6.50
TOTAL NET ASSETS I 34,274,860 I 00.00
The accompanying notes form an integral part of these financial statements
129
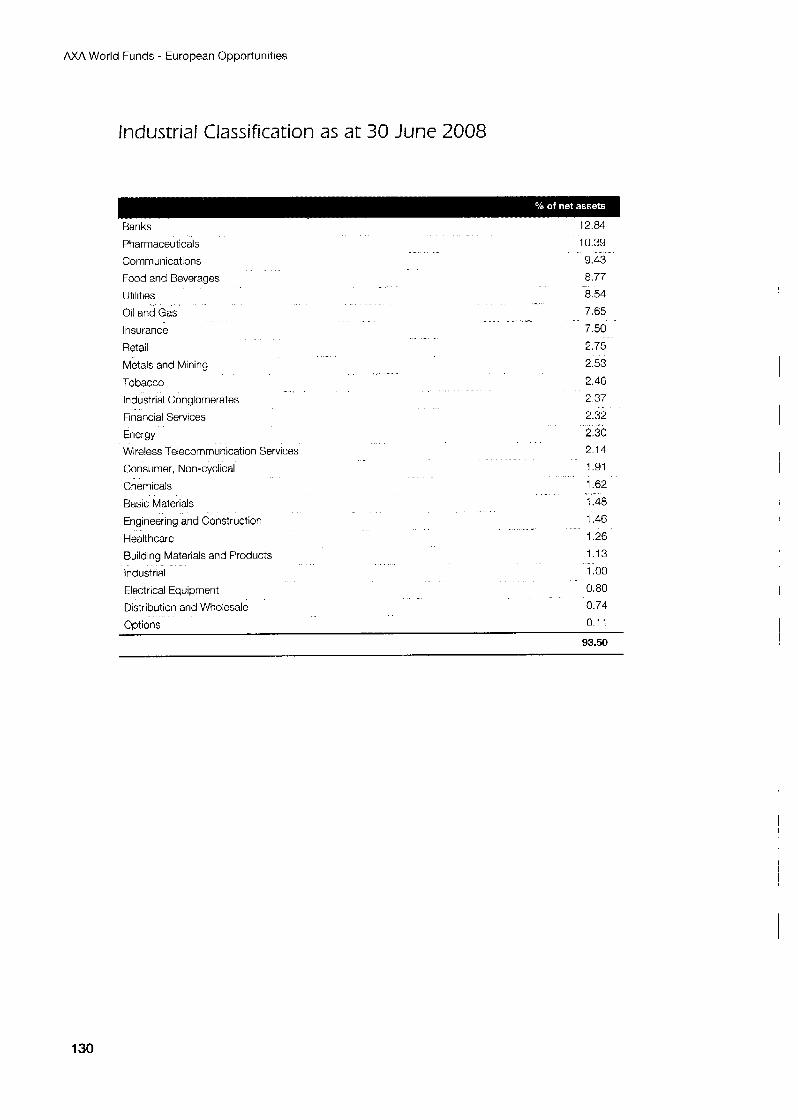
AXA World Funds - European Opportunities
Industrial Classification as at 30 June 2008
Banks 12.84
Pharmaceuticals 10.39
Communications 9.43
Food and Beverages 8.77
Utilities 8 54
7 65 Oil and Gas Insurance 7 50 Retail 2.75 Metals and Mining 2.53
Tobacco 2 46
-
-
Industrial Conglomerates 2 37 Financial Services 2.32 Energy 2 30 Wireless Telecommunication Services 2 14
Consumer, Non-cyclical 1.91
Chemicals 1 62
Basic Materials 1.48
Engineering and Construction 1.46
Healthcare 1 26 Building Materials and Products 1.13
Industrial 1 00
Electrical Equipment 0 80
Distribution and Wholesale 0.74
Options 0 11
93.50
130
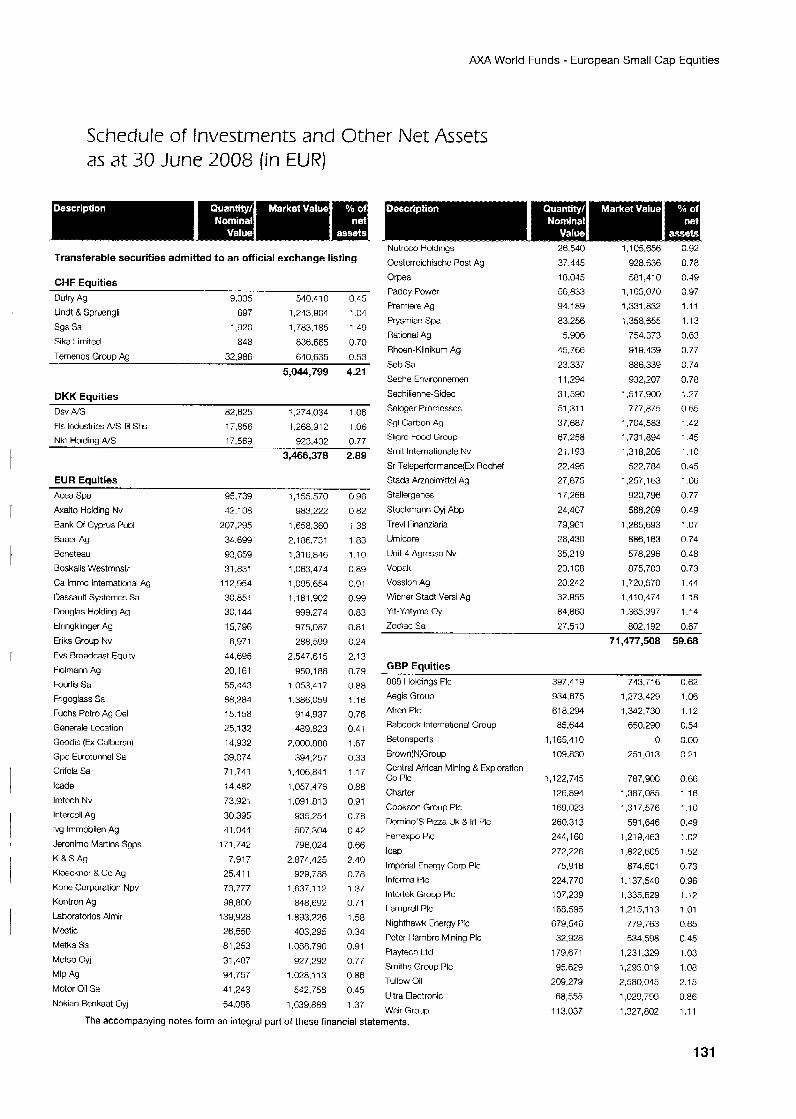
AXA World Funds - European Small Cap Equities
Schedule of Investments and Other Net Assets as at 30 June 2008 (in EUR)
Transferable securities admitted to an official exchange listing
CHF Equities Dufry Ag
Lindt & Spruengli
sgs Sa Sika Limited
9.335 540.410 0 4 5 697 1,243,904 1.04
1,920 1.783.1 85 1 49 848 836.665 0 7 0
Temmos Group Ag 32.986 640,635 0.53
5,044,799 4.21
DKK Equities DSV N S 82.625 1.274.034 1.06 Fls Industries NS-B Shs 17.856 1,268,912 1.06 Nkt Holding AIS 17,569 923,432 0.77
3,466,378 2.89
EUR Eauities
i.i55.570 0 9 6 Acea Spa Axalto Holding Nv
Bank of Cyprus Pub1
Bauer Ag
Bcncteau
Boskalis Westmnslr
Cd lmrnc International Ag
Uassault Systemes Sa Douglas Holding Ag
Elringklingw Ag
Eriks Group Nv
Evs Broadcast Equity
Ficlmann Ag
Fourlis Sa Friyoglass Sa
Fuchs Pctro Ag Oel Gonerale Location
Gmdis (Ex Calbersn)
Gpe furotunnal Sa
Grifola Sa
lcade
lmtcch Nv
lnterccll Ag Ivg lmrnobiien Ag
Jeronimo Martins Saps
K B S A g
Kloeckncr B Co Ag
Kone Corporation Npv
Kontron Ag
Laboratorios Almir
Mwtic
Metka Sa
Metso Oyj
MlP As Motor Oil Sa Nokian Renkaat Oyj
95,739 42.108
207295 3G.699
93,659 31,831
11 2,954 30.85i 30,144
15,796 6,971
44,695 20,161
55.443 88,284
15.158 25.1 32 14,932 39,074 71,741 14,482 73,921
30.395 41.044
171,742
7,917 25.41 1
73,777 98,800
139.928 26,550 81,253 3: ,487
94,757 41.243
54,086
983,222
1.658.360 2.186.731 1.31 6.846 1,063,474 1,095,654
1,181,902 999,274
975.087 288,599
2,547,615 950.1 88
1,053,417 1.386.059
Y14,937 489.823
7.000.888
394,757 ! ,406,841
1,057,476 1,091.813
935,254 507.304
796,024 2,874,425
929.788 1,637.112
848.692
1,893,776 403,295
1.088.790 927,292
1,028,113 542,758
1,639,888
0.82
i .38
1.83
1.10 0.89 0.91
0.99 0.83
0.8;
0.21
2.13 0.79 0.88 :.I6 0.76 0.41 1.67
0.33 1.17
0.88
0.91
0.78 0.47
0.66 2.40 0.78 1.37 0.71
1.58 0.34
0.91 0.77
0.86 0.45 1.37
Nutroco boldings
Ocstcrrcichischc Post Ag
Orpea Paddy Powcr Premiere Ag
Ptysmian Spa Rational Ag
Rhoen-Kiinikum Ag
Seb Sa Seche Environnernen
Sechilienne-Sidec
Seloger Pronicsscs
Sgl Carbon Ag
Sligro Food Group
Smit lnternationale Nv
Sr Toleperforrnance(Ex Rochef
Stada Afzncimittcl Ag
Stallergenes
Stockmann Oyj Abp
Trevi Finanziaria
Umicore
Unit 4 Agresso Nv
vopak
Vossloh Ag
Wicrier Stddt Versi Ag
Yit-Yhtyma Oy
Zodiac Sa
26,540 37.445 18,045 56,833 94.189
83.256 5,906
45,766 23.337 1 1,204
31,590 51,311
37,687 67,258 2i.193 22,495 27,875 17,266
24,407
79.96; 28,430
35,219 20.108 20.242 32.955
84.860 27.510
1,105,656
928.636 581,4iO
1,165,070 1,331,832
1,358,655 754,373
91 9.439 886,339 932,207
1,517,300 777.875
1,704,583 1,731.894 1,318,205
522.784
1.257.163 920,796 588.209
1,285,693 886.163
578,296 875,703
1,720570 1.4:0,474
1.365.397 802.192
0.92
0.78 0.49
0.97 1.11
1.13 0.63
0.77 0.74 0.78
1.27 0.65 1.42 1.45
1.10 0.45
1.06 0.77
0.49
1.07 0.74
0.48 0.73 1.44 1.:8
1.14 0.67
71,477,508 59.68
GEP Eauities 886 Holdings PIC
Aegis Group Afrcn PIC
Bahcock International Group Betonsports
Brown(N)Group Ccntral African Mining R Fxploration co PIC
Charter
Cookson Group Pic
Domino's Pizza Uk & lrl PIC Ferrexpo Pic
lcap Imperial Energy Cop PIC
informa PIC lntcrtck Group Plc
I arnprell PIC
Nighthawk Fnergy PIC
I'ctcr Hambro Mining PIC
Playtech Ltd
Smiths Group PIC
Tullow Oil
Ultra Electronic
Weir Group The accompanying notes form an integral part of these financial statements.
397,419 934,675
618.294 85,644
1,165,410 109,830
1,122,745
126.894 169,023
260,313 244,l 60 272,226
75,918 224,770 107,239 168.595
679.546 32.928
179,671 95,629
209,279 68,555
11 3.037
743,716 1.273.429 1,342,730
650,290 0
251,013
787,900 1,387,085 1,317,576
591,646 1.21 9,463 1,822.605
874.501 1,137,540
1,335,629 1,215,113
779,763 534.598
1.231,329 1,295,019
2,580,045 1,029,799 1.327.802
0.62 1.06 1.12 0.54 0.00
0.21
0.66 1.16 1.10
0.49 1.02 1.52
0.73 0.96 1.12 1.01
0.65 0.45
1 .c3 1.08
2.15 0.86 1.11
131
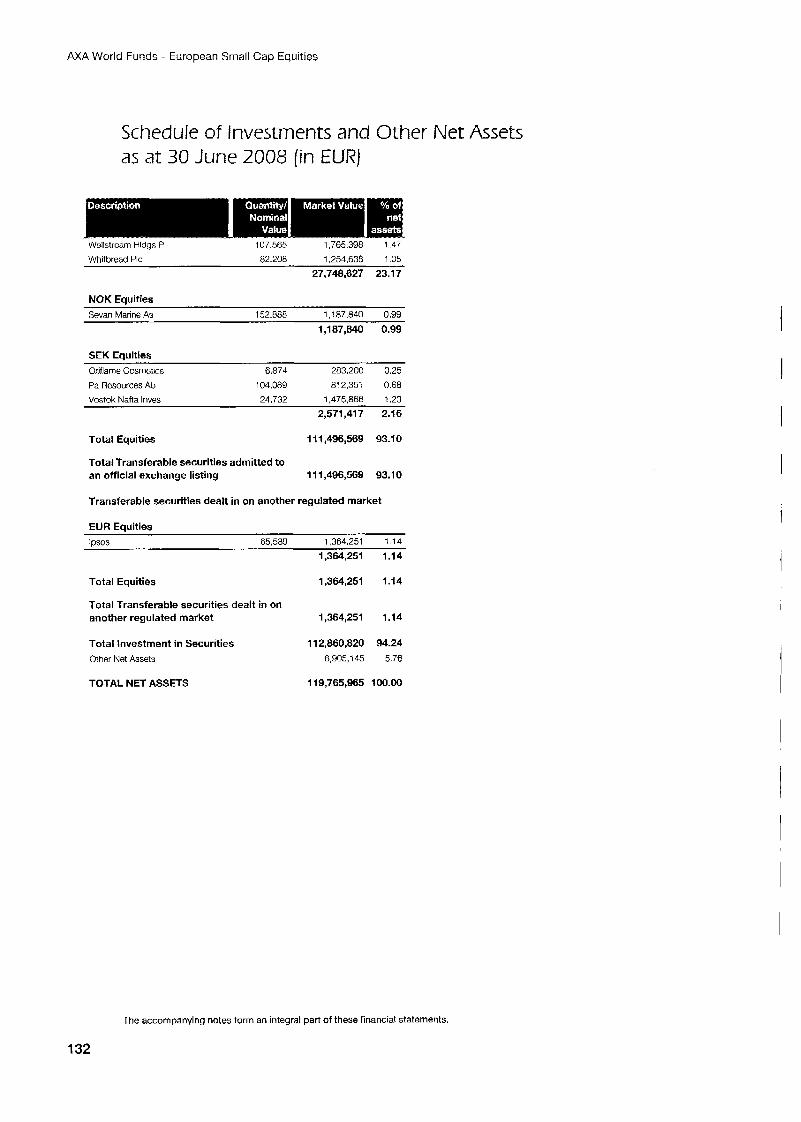
AXA World Funds - European Small Cap Equities
Schedule of Investments and Other Net Assets as at 30 June 2008 (in EUR)
WQlktrCam Hldgs P 107,565 1,765,398 1.47
Whitbread PIC 82.208 1.254.638 1.05
27,748,627 23.17
NOK Eauities Sevan Marine As 152.888 1,187,840 0.99
1,187,840 0.99
SEK Equities Oriflarile Cosmctics 6,874 283,200 0.25
Pa Rcsources Ab 104,089 812.351 0.68 Vostok Nafta lrives 24,732 1,475,866 1.23
2,571,417 2.16
Total Equities 111,496,569 93.10
Total Transferable securities admitted to an official exchange listing 111,496,569 93.10
Transferable securities dealt in on another regulated market
EUR Eauities Ipso5 65.589 1.364.251 1.14
1,364,251 1.14
Total Equities 1,364,251 1.14
Total Transferable securities dealt in on another regulated market 1,364,251 1.14
Total Investment in Securities 11 2,860,820 94.24 Other Net Assets 6,905,145 5.76
TOTAL NET ASSETS 119,765,965 100.00
1
i
The accompanying notes form an integral part of these financial statements.
132
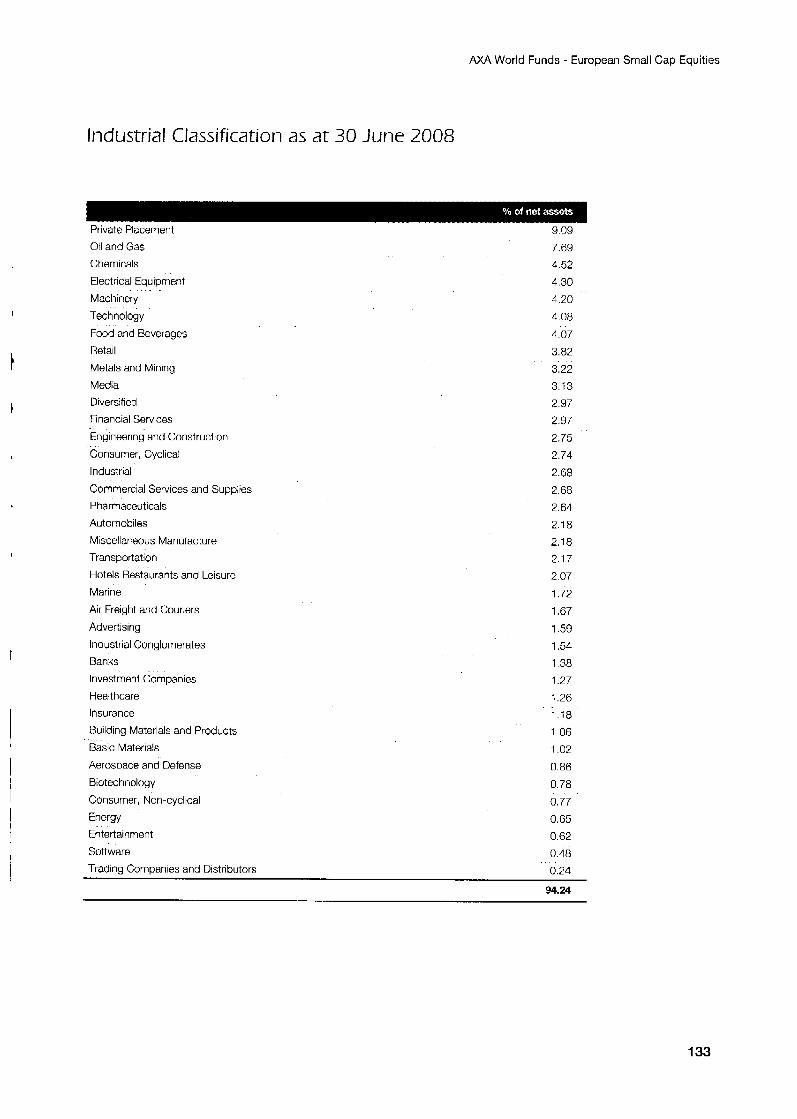
A M World Funds - European Small Cap Equities
,
I
Industrial Classification as at 30 June 2008
Private Placement
Oil and Gas Chemicals
9.09
7.69
4.52
Electrical Equipment 4.30
Machinery 4.20 Technology
Food and Beverages
Retail
Metals and Mining
Media
Diversified
Financial Services
Engineering and Construction
4.08
4.07
3.82
3.22
3.13
2.97
2.97
2.75
Consumer, Cyclical 2.74 Industrial
Commercial Services and Supplies
Pharmaceuticals
Automobiles
2.68 2.68
2.64
2.18
Miscellareous Manufacture 2.18 Transportation
Hotels Restaurants and Leisure
Marine
Air Freight and Couriers
2.17
2.07
1.72
1.67
Advertising 1.59 Industrial Conglomerates
Banks
Investment Companies
1.54
1.38
1.27
Healthcare 1.26 Insurance
Building Materials and Products
Basic Materials
Aerospace and Defense
Biotechnology
Consumer, Non-cyclical
Energy
Entertainment
1.18
1.06 1.02
0.86
0.70 0.77
0.65
0.62
Software 0.48
Trading Companies and Distributors 0.24
94.24
133
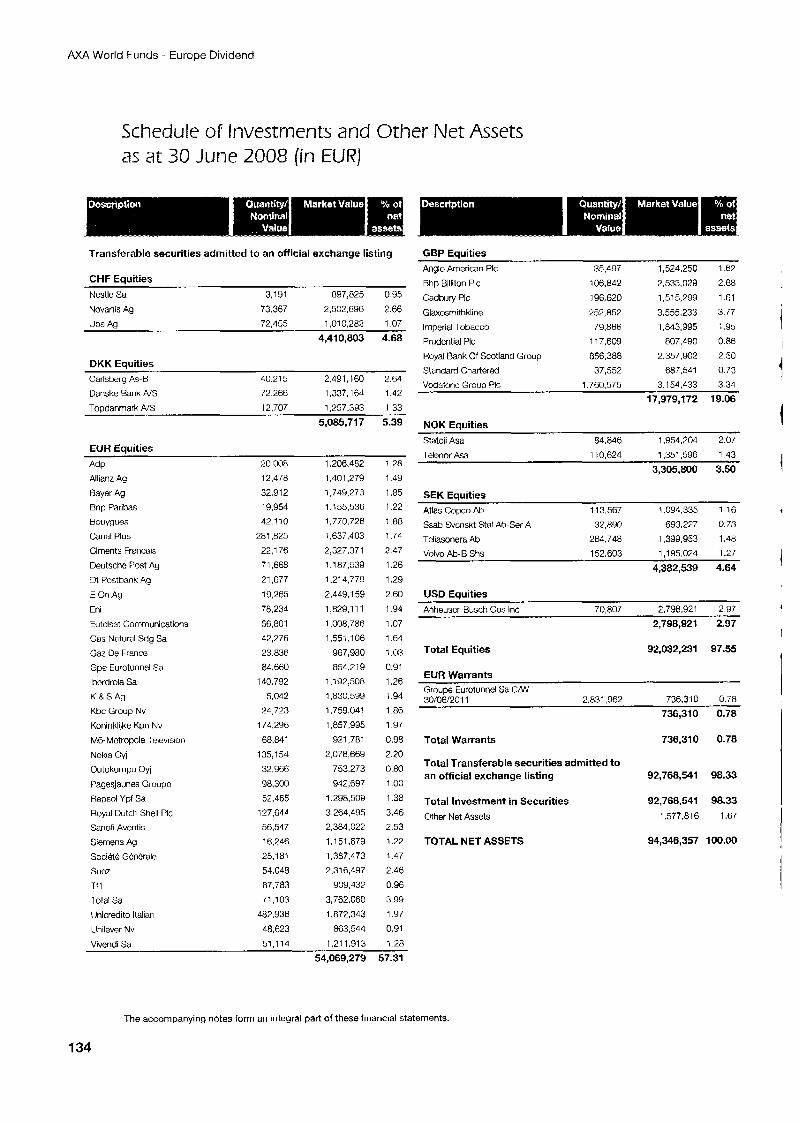
AXA World Funds - Europe Dividend
Schedule of Investments and Other Net Assets as at 30 June 2008 [in EURJ
Transferable securities admitted to an official exchange listing
CHF Eauities Ncstle Sa
Novartis Ag
3,191 897,825 0.95 73.367 2.502.696 2.66
Ubs Ag 72.465 1.01 0.282 1.07 4,410,803 4.68
DKK Eauities ~~
Carlsbery A& 40,215 2,491,160- ~ 2.64
Uanske Bank N S 72.265 1,337,164 1.42
Topdanrnark N S 12,707 1,257,393 1.33
5,085,717 5.39
EUR Equities AdP %0.008 1.206.482 i -28
Allianz Ag
Bayer Ag Bnp Paribas
Bouygues Canal Plus
Cirnents Frzncais
Deutsche Post Ag
Dt Postbank Ag
E On Ag
Eni
Eutolsat Communications
Gas Natural Sdg Sa Gaz De Frwco
Gpo Eurotunnel Sa
lbcrdrola Sa
K R S A g
Khc Group Nv
Koninklijke Kpn Nv
M6-Metropcle Television
Nokia Oyj
Outokurnpu Oyj
Pagesjaunes Groupe Hepsol Ypf Sa
Royal Dutch Shell PIC Sanofi Aventis
Siemens Ag Socibttc GCncrale
sucz
T i l 1 otal Sa Unicredito Italian
Unilever Nv
12,478 32,912 19.954 42,110
281.825 22.1 76 71,668 21,677
19,265
78.234 56,801 42,276 23.836 84,660
140.792 5.042
24,723 171.296
68.811 135,154
32.966 98.300 52.465
127,644 56.547 16.246 25,181
54.048 87.783
71,103 487.936
48,623 Vivendi Sa 51.114
1,401,279 1,749,273 1,155,536 1,770,726 1,637,403
2,327,371 1.187.539 1.21 4.779
2,449,159 1,829.1 11
1.008.786 1,551,106
967,980 854.219
1,192,508 1,830,599 1.759.041 1,857,995
921,781
2,078,669 753.273
912,697 1,288,509 3264,495 2,384,022 1.1 51.679
1,387,473 2,316,497
909,432 3,762.060
1 B72.343 863,544
1.21 1.913
1.49 1.85 1.22 1 .E8
1.74 2.47
1.26 1.29 2 60
1.94 1.07
1.64 1.03 0.91 1.26 1.94 1.86 1.97
0.98
2.70
0.80 1 .oo 1.38 3.46 2.53 1.22 1.47
2.46 0.96
3.99 1.97
0.91 1.28
GBP Eauities Anglo American PIC 35.497 Bhp Billiton PIC 106,842
Cadbury PIC 196,620 Glaxosmithkline 252,852
Imperial Tobacco 79,866 Prudontial PIC 1 17.609 Royal Bank Of Scotland Group 856,388 Standard Chartered 37,552 Vodalonc Group PIC 1.760.575
NOK Eauities
1,524,250
2.533.029 1.51 5,299
3,555,233 1,843,995
807,490 2,357,902
687,541 3,154,433
17,979,172
1.62 2.68
1 .GI 3.77
: .95 0.86 2.50
0.73 3.34
19.06
~ _ _ _ _ ~
Statoil Asa 84.846 1.954.204 2 07 Telcnor Asa 110,624 1,351,596 1.43
3,305,800 3.50
SEK Equities Atlas Copco Ab 113.567 1.091,335 1.16
Ssab Svcnskt Stal Ab-Ser A 32,890 693.277 0.73
Tcliasonera Ab 264,748 1,399,953 1.48 Volvo Ah-B Shs 152.603 1,195,024 1.27
4,382,539 4.64
USD Equities Anheuser-Busch Cos Inc 70,807 2,798,921 2.97
2,798,921 2.97
Total Equities
EUR Warrants
92,032,231 97.55
Groupo Eurotunnel Sa CAN 30/06/2011 2,831,962 736.310 0.78
736,310 0.78
Total Warrants 736,310 0.78
Total Transferable securities admitted to an official exchange listing 92,768,541 98.33
Total Investment in Securities Other Net Assets
92,768,541 98.33 1,577,816 1.67
TOTAL NET ASSETS 94,346,357 100.00
54,069,279 57.31
The accompanying notes form an integral part of these financial statements
134
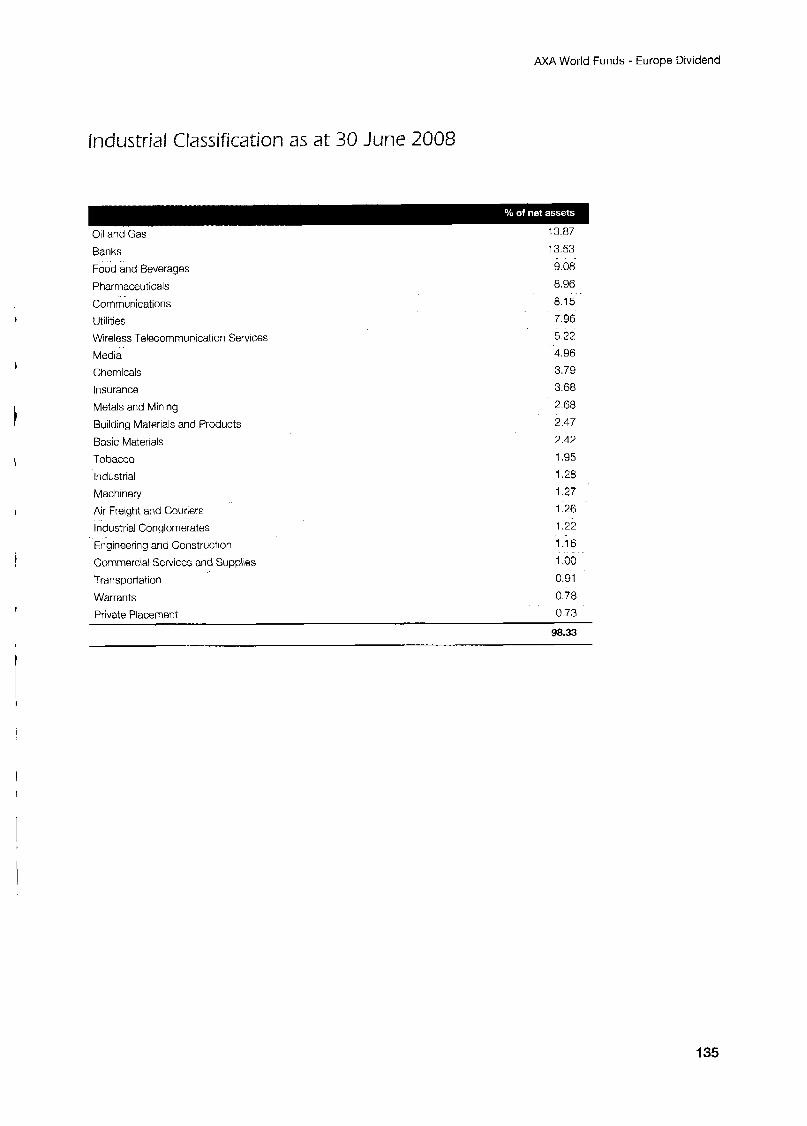
AXA World Funds - Europe Dividend
I
t
I
Industrial Classification as at 30 June 2008
Oil and Gas 13.87
Banks
Food and Beverages
Pharmaceuticals
Communications
Utilities
Wireless Telecommunication Services
Media
Chemicals
Insurance
Metals and Mining
Building Materials and Products
Basic Materials
Tobacco
Industrial
Machinery
Air Freight and Couriers
Industrial Conglomerates
Engineering and Construction
Commercial Services and Supplies
Transportation
Warrants
13.53
9.08 8.96
6 15
7 96 5.22 4.96
3.79
3.68
2 68
2.47 2.42
1.95
1.28
127 1.26
1.22
116
1 00 0.91
0 78
Private Placement 0.73
98.33
1 35
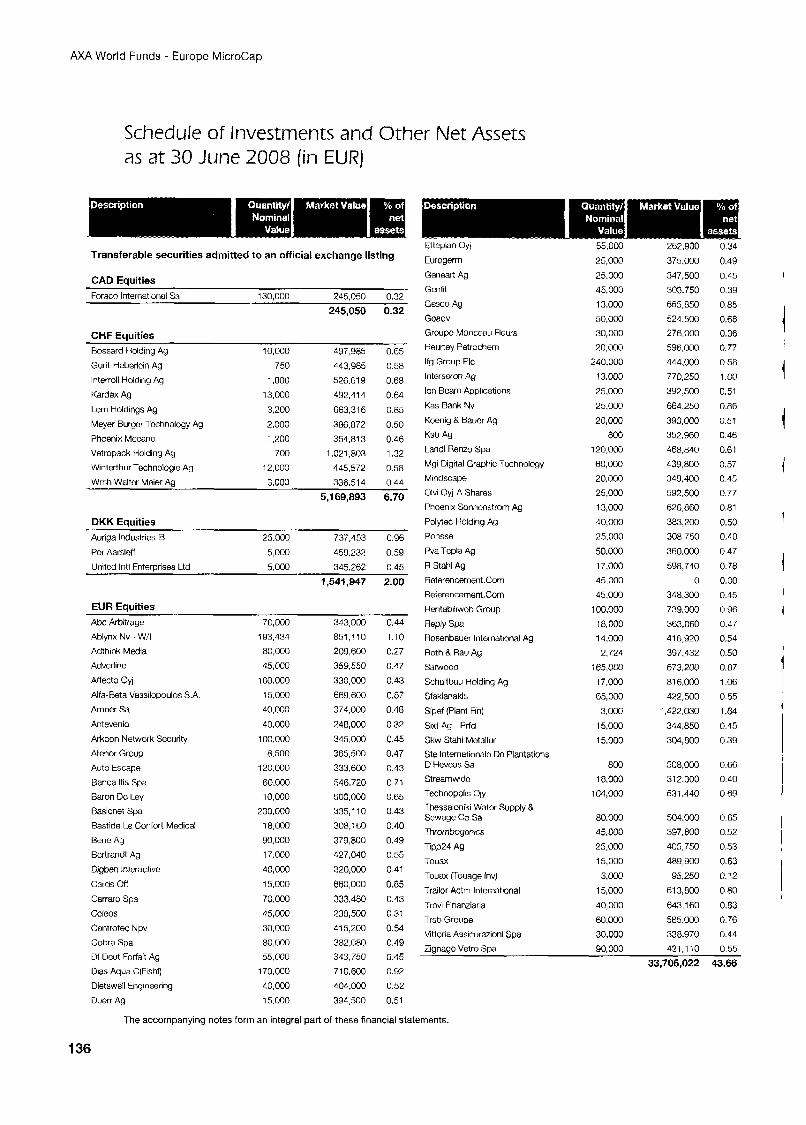
AXA World Funds - Europe MicroCap
Schedule of Investments and Other Net Assets as at 30 June 2008 (in EUR)
Transferable securities admitted to an official exchange listing
CAD Equities
Foraco International Sa 130,000 245.050 0.32
245,050 0.32
CHF Eauities Rossard Holding Ag
Gunt-Heberlcin Ag
lnterroll Holding Ag
Kardex Ag
I em Holdings Ag
Meyer Burger Technology Ag
Phoenix Mccano
Vetropack Holding Ag Winterthur Tochnologle Ag
Wmh Walter Mew Aa
10,000
750
1,800
13,000
3,200
2,000
1,200 700
12,000 3.000
497,985 443,985
526.619
492.414
663,316
386,872
354,813
1,0?1.803 445,572 396 51 4
0.65
0.58
0.68
0 64
0.85
0.50
0 46 1.32
0.58 0 44
~
5,169,893 6.70
DKK Eauities Auriga Industries-B
Per Aarskff
~
25.000 737,453 0.96
5,000 459.232 0 5 9
United lntl Enterprises Ltd 5,000 345.262 0.45
1,541,947 2.00
EUR Equities Abc Ahitrage 70,000 343,000 0.44 Ablynx Nv . W/I
Adthink Media
Advertine
Atfecto Oyj
Alfa-Beta Vassilopoulos S.A
Amper Sa
Antevenio
Arkoon Network Security
Atenor Group
Auto tscape
Banca lfis Spa
Baron Do I ky
Basicnet Spa
Bastide Le Contort Medical
Bene Ag
BcrtranM Ag
Bigben Interactive
Cards Off Carraro Spa Ccleos
Ccntrotec Npv
Cobra Spa
Df Deut Fotfait Ag
Uias Aqua C(Fishf)
Dietswell Engineering
Duerr Ag
193,434 80,000
4 5 , m
100.000
15,000
40,000
40.000
100,000
8.500 120,000
60,000
10,000
230,000
18,000 90,000
17,000
40,000
15,000
70,000
15,000
30,000
80,000
55,000
170.000
r0,000 15.000
851,110
209,600
359,550
330,000
669.600
374,000
248,000
345,000
365,500 333,600
546.720
500,000
335,110
308.1 ti0 379,800 427,040
320,000
660,000
333.480 238,500
415,200
382.080 313,750
710,600 404,000
394,500
1.10
0.27
0.47
0.43
0.87 0.48
0.32 0.45
0.47
0.43 0.71
0.65 0.43
0.40
0.49
0.55 0.41
0.85
0.43
0.31
0.54 0.49
0.45 0.92
0.52
0.51
Etteplan Oyl
Eurogem
Geiiearl Ag Genfit
G ~ s c o Ag
Gmdv Groupc Monceau Fleurs
Heurtey Petrochern
Ifg Group PIC
lnterscroh Ag
Ion Bcam Applicztions
Koenig 8 Baucr Ag
Ksb Ag
Landi Reno Spa
Mgi Digital Graphic Tcchnology
Mindscape
Olvi Oyj-A Shares
Phoenix Sonncnstrom Ag
Polytec Holding Ag
Ponsse
h a Tcpla Ag
R Stahl Ag
Referencement.Com
Referencement.Com
Rentabiliwcb Group
Reply Spa Hosenbauer International Ag
Roth 8 Raw Ag
Safwood
Schaltbau Holding Ag
Sfakianakis
Sipef (Plant Fin)
Sixt Ag - Ptfd
Skw Stahl Mctallur Ste lnterndtionalc Dc Plantations D Heveas Sa Streamwidc
Tcchnopolis Ojy I-hessalonlki Water Supply & Sewage Co Sa Thrombogentcs
Tipp24 Ag
Touax
Touax Vouage Inv)
Trailor Actm International
Trcvi Finanziaria
Trsb Groupe
Vittoria Assicurazioni Spa
Zianaao Vetro Sm
KdS Bank NV
55,000 262,900
25,000 375,000
25.0Ms 347,500
45.000 303,750 13.000 655,850
50,000 524,500 30,000 276,000
20,000 596,000
240,000 444.000 13.000 770,250
25,000 392,500
25.000 664,250
20,000 390,000
800 352,960
120,ow 468.840 60,000 439,800
20,000 349.400
25,000 592.500
13,000 626,860
40,000 383,200
25.000 308.750
50,000 360.000
17,000 598,740
45.000 0 45,000 348,300
100,000 739.000
1 8,000 363,060 14,000 416,920
2,724 397,432
165,OW 673.200
17,000 81 6,000
65,000 422,500
1,422,030
15,000 344,850
15,000 304,800
3,000
800 508,000
18,000 312,300 104,000 531.140
80,000 504.000
45,000 397,800 25,000 405,750
15,000 489,900
3 , m 95.250
15,000 61 3,800
40,000 643,160
60,000 585,000
30,000 3 3 8.9 7 0 90,000 421.110
0.34
0.49
0.45 0.39
0.85
0.68 0.36 0.77
0.58
1 .oo 0.51
0.86
0.51 0.46
0.61
0.57 0.45
0.77
0.81
0.50 0.40
0.47
0.78 0.00
0.45
0.96 0.47
0.54 0.50 0.87
1.06
0.55
1.84
0.45 0.39
0.66 0.40
0.69
0.65
0.52
0.53
0.63 0.12
0.80
0.83 0.76
0.44
0.55 - .,
33,706,022 43.66
The accompanying notes form an integral part of these financial statements.
136
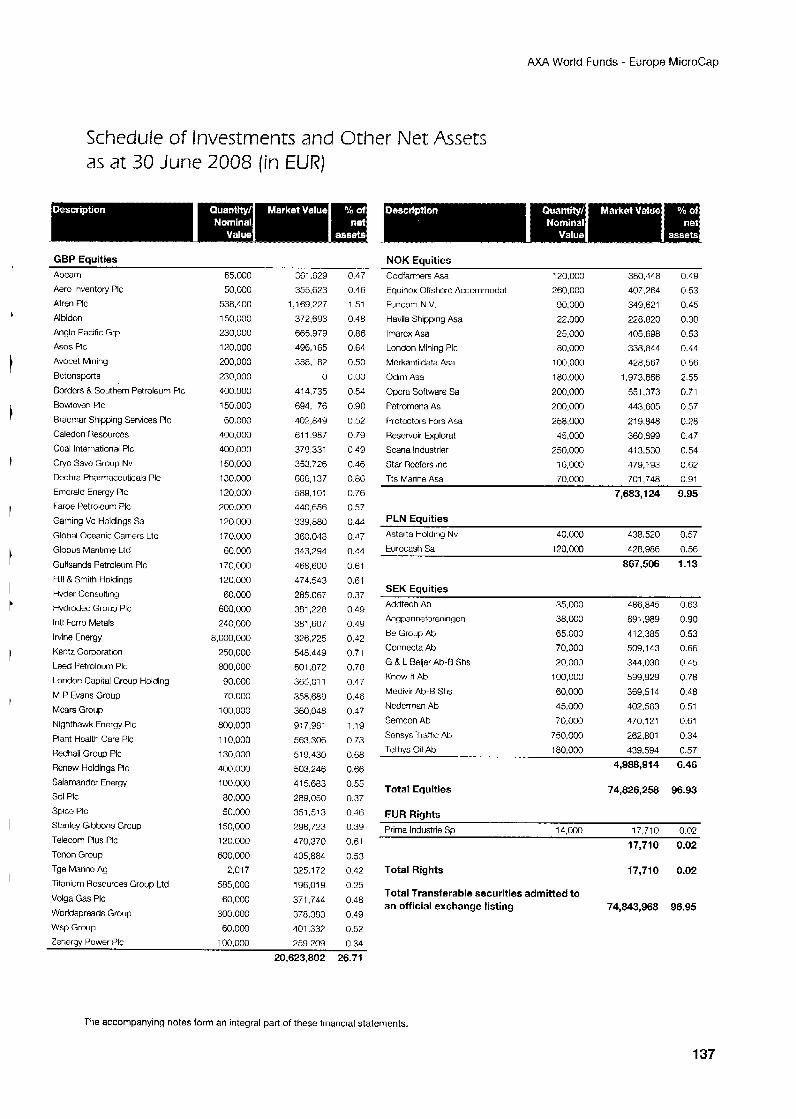
AXA World Funds - Europe MicroCap
Schedule of Investments and Other Net Assets as at 30 June 2008 {in EUR)
GBP Enuities NOK Eauities Abcam Aero Inventory PIC
Afren PIC
Albidon
Anglo Pacific Grp
Asos PIC
Avocet Mining
Bctonsports
Borders & Southern Petroleum PIC
Bowleven PIC
Rraemar Shipping Ssrvices PIC
Caledon Hesourccs
Coal International PIC
Cry0 Save Group Nv Dechrz Pharrnaccuticals PIC
Emcrald Energy PIC
Faroe Petrolcum PIC
Gaming Vc Holdings Sa
Global Oceanic Carrers Ltd
Globus Maritime Ltd
Gulfsands Petroleum PIC
Hlll & Smth Holdings
Hyder Consulting
Hydrodec Group PIC
lntl Fcrrn Metals
ltvine Energy Kcntz Corporation
k e d Petrolcum PIC
London Capital Group Holding
M P Fvans Group
Mwrs Group
Nighthawk Energy Pc
Plant Health Care PIC
Redhall Group PIC
Renew Holdings PIC
Salamander Energy Sdl PIC
splcc PIC
Stanley Gibbons Grcup
Tolecom Plus PIC
Tcnon Group
Tge Marine Ag
Titanium Hcsources Group Ltd Volga Gas PIC
Worldspreads Group
Wsp Group
65,000 50,000
538.400
150,000 230,000
120,000 200,000
230,000
400.000
150,000
60.0M)
400,000 400,000
150,000
130.000 120,000
200.000
120,000
170.000 60.0M:
170,000 120,000
60,000
6OOSWO 240.000
8,000,000
250.000 800,000
90,000
70.000
100,000
800.000
11 0,000 130,000
400,000
100,000 80,000
50,000 150,000
120.000
600,000 2,017
585,000
60,000 300.000
60,OM)
100.000
361,629
355,623 1,169,227
372.693
665,979 496,165
388.1 82
0
414,735
694,176
402,849 61 1.987
379,331 353.726
666,137
589.101 440,6563
339,880
360.048
343.294
466.600
474.543
285.067 381,228
381,607
326.725 548.449
601.872
365.01 1
358.68Y 360,048
91 7,981
563.306
519,430 503,246
415.683
289.050 351.513
298.723
470,370 405,884
325.172
196.01 9
371,744
378.383
401,337 259.209
0.L7
0.46 1.51
0.48
0.86 0.64
0.50
0.00
0.54
0.90
0.52 0.79
0.49
0.46 0.86
0.76 0.57
0.4C
0.C7
0.44
0.61
0.61
0.37 0.49
0.49
0.32 0.71
0.78
0.47
0.46 0.47
1.19
0.73
0.68
0.66 0.55
0.37 0.46
0.39
0.6 1
0.53 0.42
0.25
0.48 0.49
0.52
(1.34 Zenergy Power PIC
Codfarmers Asa 120,000 380.448 0.49
Equinox Offshore Accornmodat 260,000 407,264 0.53 Funcom N.V. 90,000 319.621 0.45
Havila Shipping Asa 22,000 228.820 0.30 lrnarcx Asa 25,000 405,698 0.53 London Mining PIC 80,000 338.8L4 0.44 Mcrkantildata Asa 100,000 428.567 0.56 Odim Asa 180,000 1.973.666 2.55
Opcra Software Sa 200,000 551,373 0.71 Pctromena As 200,000 443,605 0.57
I’rotcctnrs Fors Asa 258,000 219.848 0.28 Reservoir Explorat 45,000 360,899 0.47 Scana Industrier 250,000 413,530 0.54 Star Rcclcrs Inc 16,003 479.193 0.62 Tts Marine Asa 70.000 701,748 0.91
7,683,124 9.95
PLN Eauities Astarta Holding Nv
Eurocash Sa 40.000 438.520 0.57
120,000 428.986 0.56
867,506 1.13
SEK Equities Addtech Ab Angpannetoreningcn
Be Group Ab
Connecta Ab
G & L Reijer Ab& Shs
Know It Ab
Medivir Ab-R Shs
Ncdcrman Ab
Semcon Ab
Sensys Trafk Ab
Tethys Oil Ab
Total Equities
EUR Rights
35.000
38.000 65,000
70,000 20,000
100,000
60,000
45,000
70.000
750.000
180,000
486.045
691.989 412,385
509,143
344,030 599.929
369,514
402,563
470,121
262 8 0 1
439,594
4,988,914
0.63
0.90 0.53 0.66
0.45
0.78
0.48 0.51
0.61
0.34
0.57
6.46 -
74,826,258 96.93
Prima lndustrie SD 14.000 17.710 0.02
17,710 0.02
Total Rights 17,710 0.02
Total Transferable securities admitted to an official exchange listing 74,843,968 96.95
20,623,802 26.71
The accompanying notes form an integral part of these financial statements.
137
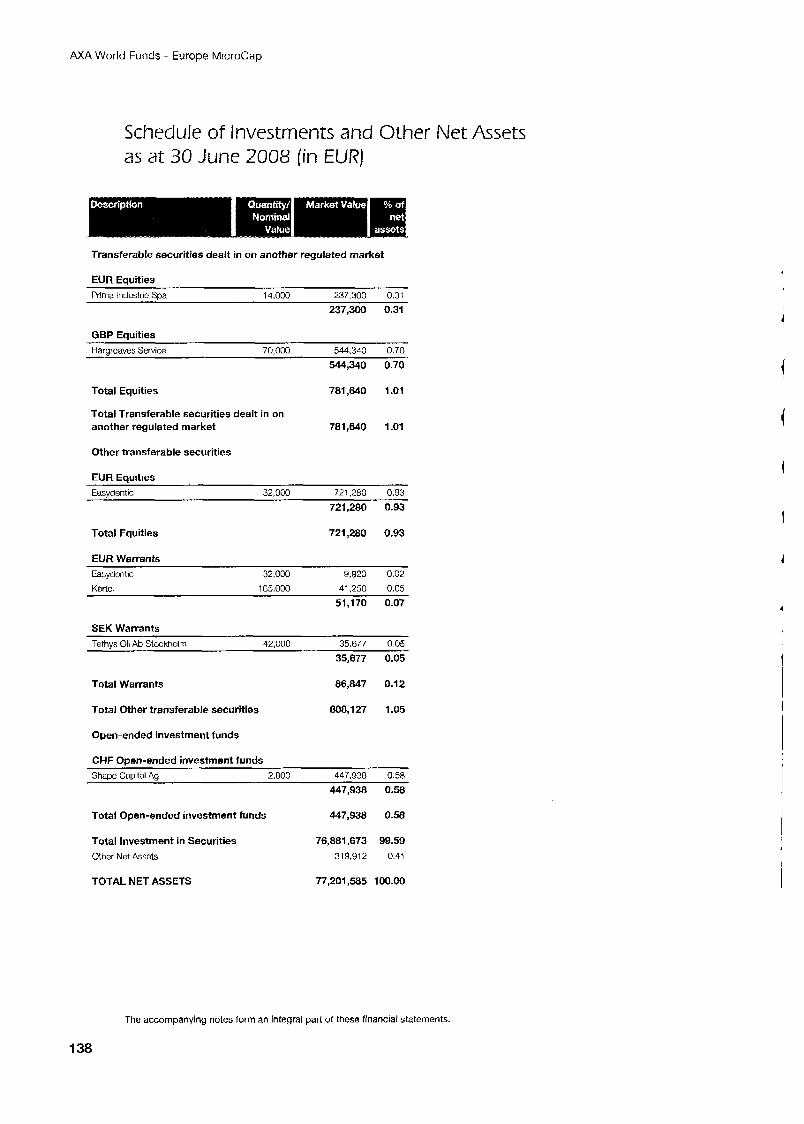
AXA World Funds - Europe MicroCap
Schedule of Investments and Other Net Assets as at 30 June 2008 (in EUR)
Transferable securities dealt in on another regulated market
EUR Equities Prima lndustrie Spa 14,000 237,300 0.31
237,300 0.31
GBP Equities Harareaves Service 70.000 544.3LO 0.70
544,340 0.70
Total Equities 7a1,mo 1.01
another regulated market 781,640 1.01 Total Transferable securities dealt in on
Other transferable securities
EUR Eauities Easvdentic 32,000 721,280 0.93
Total Equities
EUR Warrants
I
1
721,280 0.93
721,280 0.93
Easydcntic 32,000 9,920 0.02
Kortnl 165.000 41.250 0.05
51,170 0.07
SEK Warrants
I
1-ethvs Oil Ab Stockholm 42.000 35.677 0.05
35,677 0.05
Total Warrants 86.847 0.12
Total Other transferable securities 808.127 1.05
Open-ended investment funds
CHF ODen-ended investment funds Shapc Capital Ag 2.800 447.938 0.58
447,938 0.58
Total Open-ended investment funds 447,938 0.58
Total Investment in Securities Other Net Assets
76,a81,673 99.59 319,912 0.41
TOTAL NET ASSETS 77,201,585 100.00
I
The accompanying notes form an integral part of these financial statements.
1 38
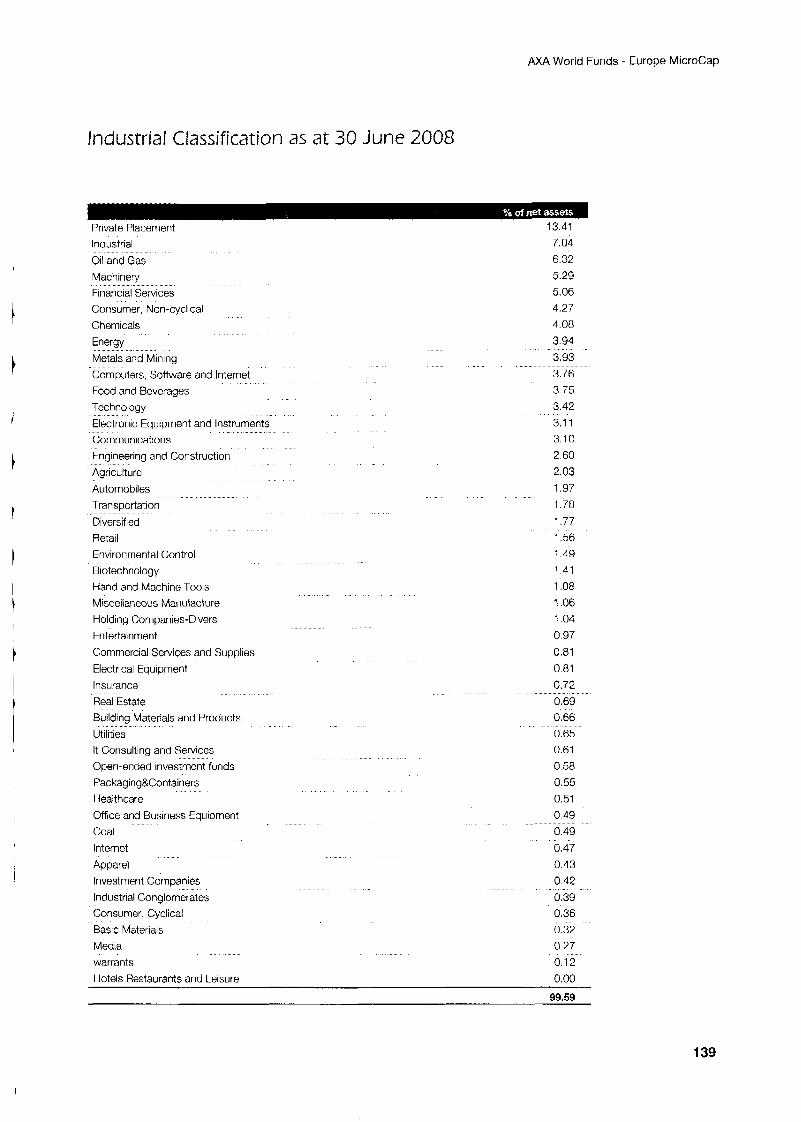
AXA World Funds - Europe MicroCap
Industrial Classification as at 30 June 2008
Private Placement Industrial
Oil and Gas Machiney Financial Services Consumer. Non-cyclical Chemicals Energy Metals and Mining Computers, Software and Internet Food and Beverages Technology Electronic Equipment and Instruments Communications Engineering and Construction Agriculture Automobiles Transportation Diversified Retail Environmental Control Biotechnology Hand and Machine Tools Miscellaneous Manufacture Holding Cornpanies-Divers Entertainment
Commercial Services and Supplies Electrical Equipment Insurance Real Estate Building Materials and Products Utilities It Consulting and Services Open-ended investment funds Packaging&Containers I iealthcare Office and Business Equipment Coal Internet Apparel Investment Companies Industrial Conglomerates Consumer, Cyclical Basic Materials Media warrants
7.04 6.32 5 29 5 06 4 27 4 08 3 94 3 93 3 76 3 75 3 42 3.1 1 3 10 2 60 2 03 1 97 1.78 177 1 56 1 49 141 1.08 1 06 1 04 0 97 0 81 o a i 0.72 0 69 0 66 0.65 0.61 0 58 0 55 0.51 0 49 0 49 0.47 0.43 0 42 0 39 0.36 0.32 0 27 0.12
Hotels Restaurants and Leisure 0.00
99.59
1 39
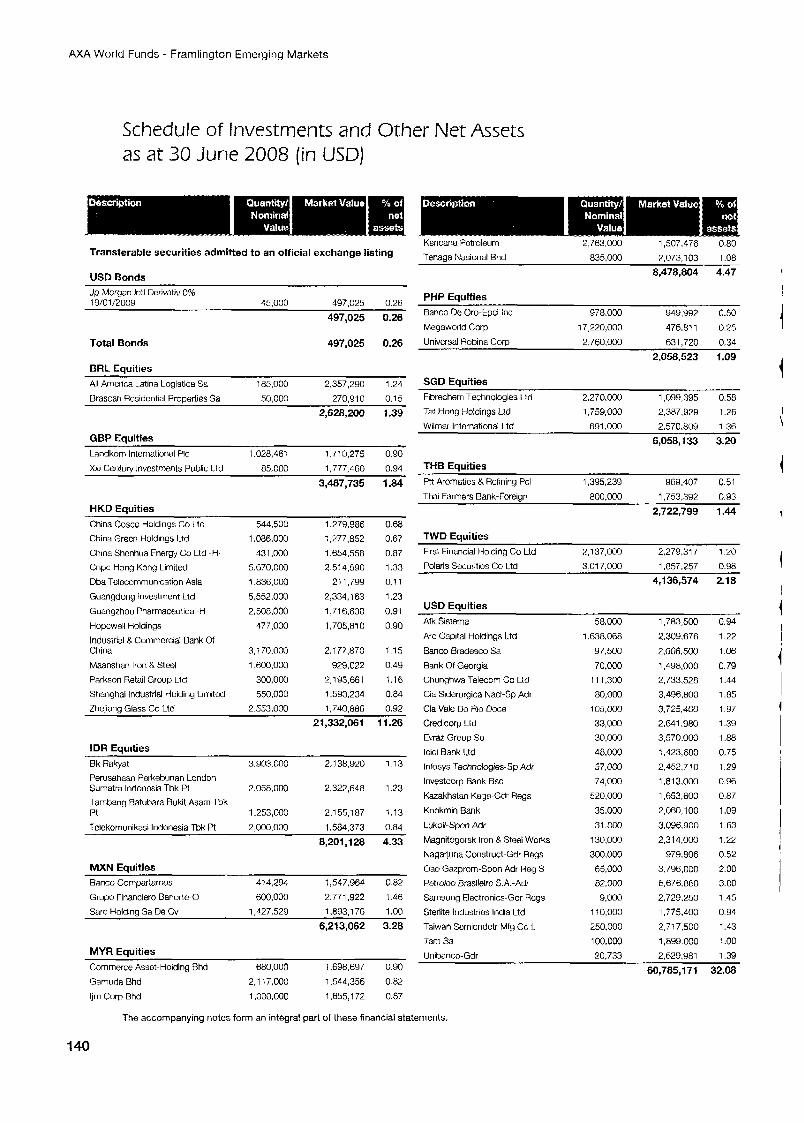
AXA World Funds - Framlington Emerging Markets
Schedule of Investments and Other Net Assets as at 30 June 2008 (in USD)
Transferable securities admitted to an official exchange listing
USD Bonds Jp Morgan lntl Derivativ 0% 19/01/200Y 45.000 497,025 0.26
497,025 0.26
Total Bonds 497,025 0.26
BRL Equities All America 1.atina Logistica Sz 185.000 2,357,290 1.24 Brascan Residential Prooerties Sa 50.000 270.910 0.15
2,628,200 1.39
GBP Equities Landkuni Ir,tcrnational PIC 1.028,461 1.710.275 0.90
Xxi Century lnvcstments Public L.td 85.000 1,777,460 0.94
3,487,735 1.84
HKD Equities China Cosco Holdings Co Ltd 544.500 1.279.986 0.68 China Green Holdings Lid 1.086.000 : ,277,852 0.67 China Shcnhua Fnergy Co Lid -H. 431,000 1,654558 0.87 Cnpc Hung Kong Limited 5.670,000 2.51 4,590 1.33 Dba Talccommunication Asia 1.836.000 211,799 0.11
Guangdong Investment Ltd 5,552,000 2,334,163 1.23 Guangzhou Pharmaceutical-H 2.508.000 1,716,630 0.91 Hopcwell Holdings 477,000 1,705,810 0.90 Industrial &Commercial Bank of China 3 , i 70,OCO 2,177,870 1.15
Maanshar Iron 8 Steel 1 ,600.000 929.022 0.49 Parkson Retail Group Ltd 300,000 2,195,661 1.16 Shanghai Industrial Holding Limited 550,000 1593,234 0.84 Zhejiang Glass Co Ltd 2,553,000 1,740,686 0.92
21,332,061 11.26
IDR Eauities ~
Bk Rakyat 3 903,000 2,138,920 1 1 3 Perusahaan Perkehunan London Sumatra Indonesia Tbk R 2.058.000 2,322,648 1 23 Tambang Batubara Bukit Asam Tbk FI 1253,M)O 2.155.187 1 13 Iclckomunikasi Indonesia Tbk R 2 000 000 1.584.373 0.84
8,201,128 4.33
MXN Eauities Banco Cornpartarnos 4 14.294 1,547,964 0 82 Grupo Financier0 Banorte-0 600,000 2,771,972 1.46 Sare Holding Sa De Cv 1,427529 1,893,176 1 .OO
6,213,062 3.28
MYR Eauities
Kencana Petroleum 2,763.000 1,507.476 0.80 'Tenaga Nasional Bhd 835.000 7,073,103 1.08
8,478,804 4.47
PHP Equities
Banco De Oro-Epci Inc 978.000 949.992 0.50 Mcgaworld Corp
Universal Robina Cow 17.220,OOO 476.811 0.25 2,760,000 631.720 0.34
2,058,523 1.09
SGD Equities Fibrechem Technologies Ltd 2,270,000 1,099,395 0.58 Tat Hong Holdings Lid 1,759,000 2.387.929 1.26
691 .OM) 2.570.809 1.36 Wilmar International Ltd
6,058,133 3.20
THE Equities
ptt Aromdics & Refining Pcl 1,395,239 969,407 0.51
Thai Farmers Bank-Foreign 800,000 1.753.392 0.93 2,722,799 1.44
TWD Equities First Financial Holding Co Ltd 2,137,000 2.279.317 1.20 Polaris Sccuritics Co Ltd 3 01 7,000 1,857,257 0.98
4,i 36,574 2.1 a
USD Equities Afk Sistema 58.000 1,783,500 0.94 Arc Capital Holdings Lid
Banco Bradesco Sa Bank Of Georgia
Chunghwa Telecom Co Ltd
Cia Siderurgica Nacl-Sp Adr
Cia Vale Do Rio Doce
Credicorp Lid Evraz Group Sa lcici Bank I f d
lnfosys Technologies-Sp Adr
lnvestcorp Bank Bsc
Kazakhstan Kaga-Gdr Regs
Kookmin Bank
Lukoil-Spon Adr
Magnitogorsk Iron 8 Steel Works
Nagarluna Construct-Gdr Regs
Oao Gazprom-Spon Adr Rog S Petrolco Brasileiro SA.-Adr
Samsung Electronics-Gdr Rcgs Sterlite Industries India Ltd
Taiwan Somicndctr Mfg Co 1. Tam Sa Unibanco-Gdr
1.638.068
S7,500 70.0M3
11 1,300 80,000
105,000
33,000 30,000
48,000 5 7 . m 74,000
520,000
35.000 31.000
130,000
300.000 65,000 82.000 9,000
11 0,000
250,000
100,000 20.733
2,309,676
2.008.500
1.4Y8.000 2,733528
3.496.800 3.725.400 2.641.980 3,570.000 1,423,680 2,452,710 1.813.000 1,653,600
2,060,100
3,096,900 2,314,000
979.806 3,796,000 5676,860 2.729.250 1,775,400 2,717,500
1,899.000 2.62Y.I)Rl
1.22
1.06
0.79 1.44 1.85 1.97 1-39 1 .88
0.75 1.29
0.96 0.87
1.09 1.m 1.22
0.52 2.00
3.00 1.45
0.94 1.43 1.00 1.39
Commerce Assot- Holding Bhd 680,000 1,698,697 0.90
Gamuda Bhd 2,117,000 1,544,356 0.82 ljm Corp Bhd 1,000,000 1,655,l 72 0.87
The accompanying notes form an integral part of these financial statements.
60,785,171 32.08
1
I
i i I \
1
I 1 I I
i I
i
I
! !
140
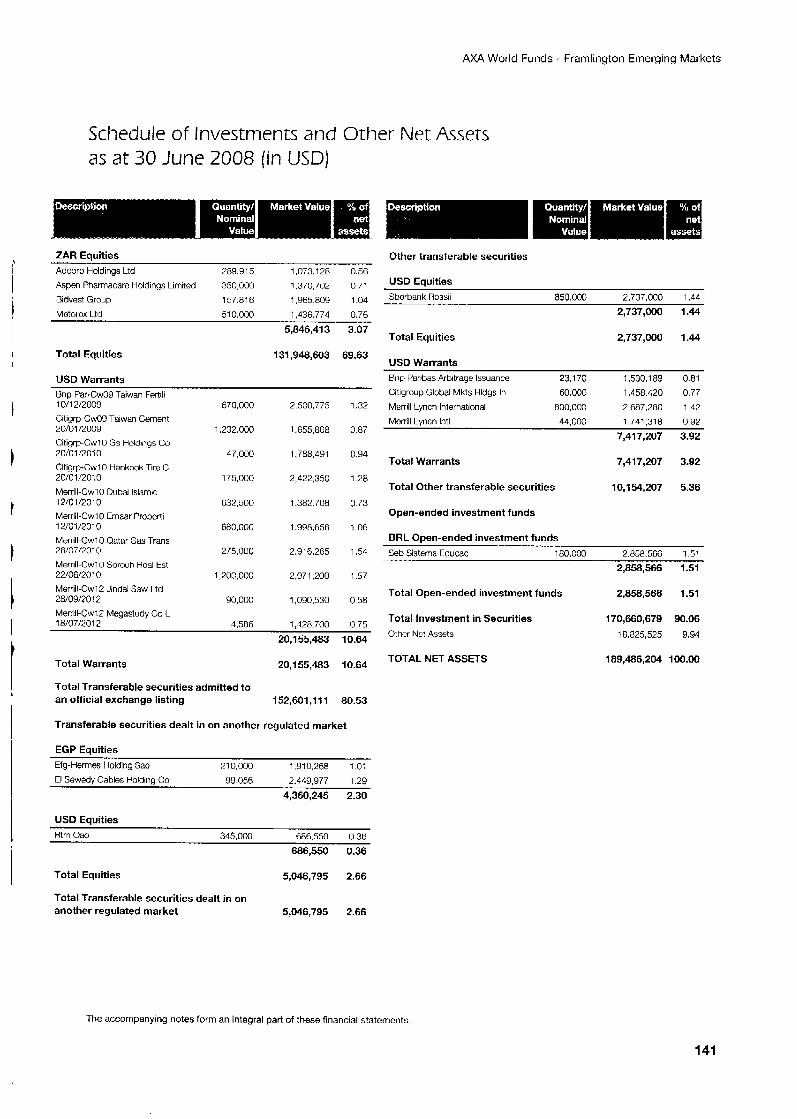
AXA World Funds - Framlington Emerging Markets
1
I
I
I
I
t
I
I I
I
Schedule of Investments and Other Net Assets as at 30 June 2008 (in USD)
ZAR Eauities -
Adcorp Holdings Ltd 39.91 5 i ,073.i 28 --o 56 Aspen Phamacarc Holdings hmited 350,000 1,370,702 0 71 Bidvest Group 157.81 6 1,965,809 104
Metorcx Ltd 510.000 1.436.774 0.76
Total Equities
USD Warrants
5,846,413 3.07
131,948,603 69.63
Bnp Par.CwO9 Taiwan Fertili 1 O/l2/2009 Citigrp-CwO9 Tawan Cement 20/01/2009 Citigrp-CwlO Gs Holdings Co 20/01/2010 Cttigrp-CwlO Hankook Tire C 20/01/2010 Merrill-CwlU Dubai Islamic 12/01/2010 Merrill-CwlO Emaar Propcrti 12/01/~010 Merrill-CwlO Qatar Gas Trans 26/07/2010 Merrill-CwlO Sorouh Rcal Est 22/06/2010 Merrill-Cw12 Jindal Saw Ltd 28/09/?012 Merrill-Cwl2 Megastudy Co L 18/07/?012
670,000
1.232.000
47,000
175,000
632.500
680,000
275,000
1,20G.000
90,000
4.586
2500,775
1,655,808
1,788,491
2,422,350
1,382.708
1.998.656
2.916.265
2971,200
1,090,530
I 47~17nn
1.32
0.87
0.94
1.28
0.73
1.06
1.54
I J 7
0 5.8
* r
,. . . , ._ 075
20,155,483 10.64
Total Warrants 20,155,483 10.64
Total Transferable securities admitted to an official exchange listing 152,601 ,I 11 80.53
Transferable securities dealt in on another regulated market
EGP Equities Efg-Hermes HoldinG Saa 210,000 1,910,268 1.01
El Sewedy Cables Folding Co 99.056 2,449,977 1.29
4,360,245 2.30
USD Equities Rtm Oao 345,000 686,550 0.36
686,550 0.36
Total Equities 5,046,795 2.66
Total Transferable securities dealt in on another regulated market 5,046,795 2.66
Other transferable securities
USD Equities Sborbank Rossii 8.50 O M 7 737 noo 144
Total Equities
USD Warrants
2,737,000 1.44
2,737,000 1 .44
Bnp Paribas Arbitrage Issuance 23.1 70 1.530.189 0.81 Citigroup Global Mkts Hldgs In 60,000 1,458.420 0.77
Murrill Lynch International 800,000 2.687.280 1.42
Mcrrill Lviich lritl 44.000 1.741.318 U92
7,417,207 3.92
Total Warrants 7,417,207 3.92
Total Other transferable securities 10,1544,207 5.36
Open-ended investment funds
BRL Open-ended investment funds Seb Sistema Fducac 180,000 2,858,566 1.51
2,858,566 1.51
Total Open-ended investment funds 2,858,566 1.51
Total Investment in Securities 170,660,679 90.06 Othcr Net Assets 18,825,525 9.91
TOTAL NET ASSETS 189,486,204 100.00
The accompanying notes form an integral part of these financial statements
141
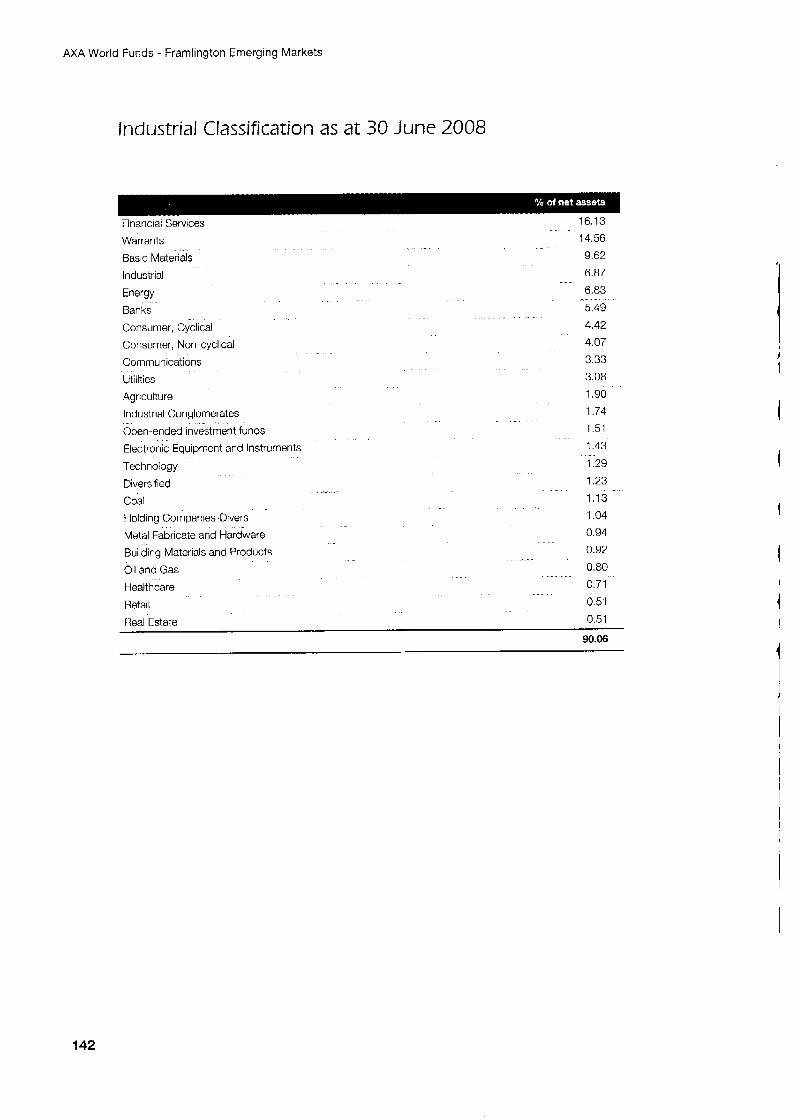
AXA World Funds - Framlington Emerging Markets
Industrial Classification as at 30 June 2008
Financial Services 16.13 Warrants i 4.56 Basic Materials 9.62 Industrial 6.87
Energy
Banks
Consumer, Cy"clical Consumer, Non-cyclical
Communications
Utilities
Agriculture
Industrial Conglomerates
Onen-ended investment funds
Electronic Equipment and Instruments
Technology
Diversified
Coal Holding Companies-Divers
Metal Fabricate and Hardware
Building Materials and Products
Oil and Gas Healthcare
Retail
6.83
5 49 4.42 4.07 3 33 3.08 1.90 1.74 1.51 1.43 1 29 1.23 1.13 1.04 0.94 0.92 0.80 0.71
0 51
- "
Heal Estate 0.51
90.06
I 1
142
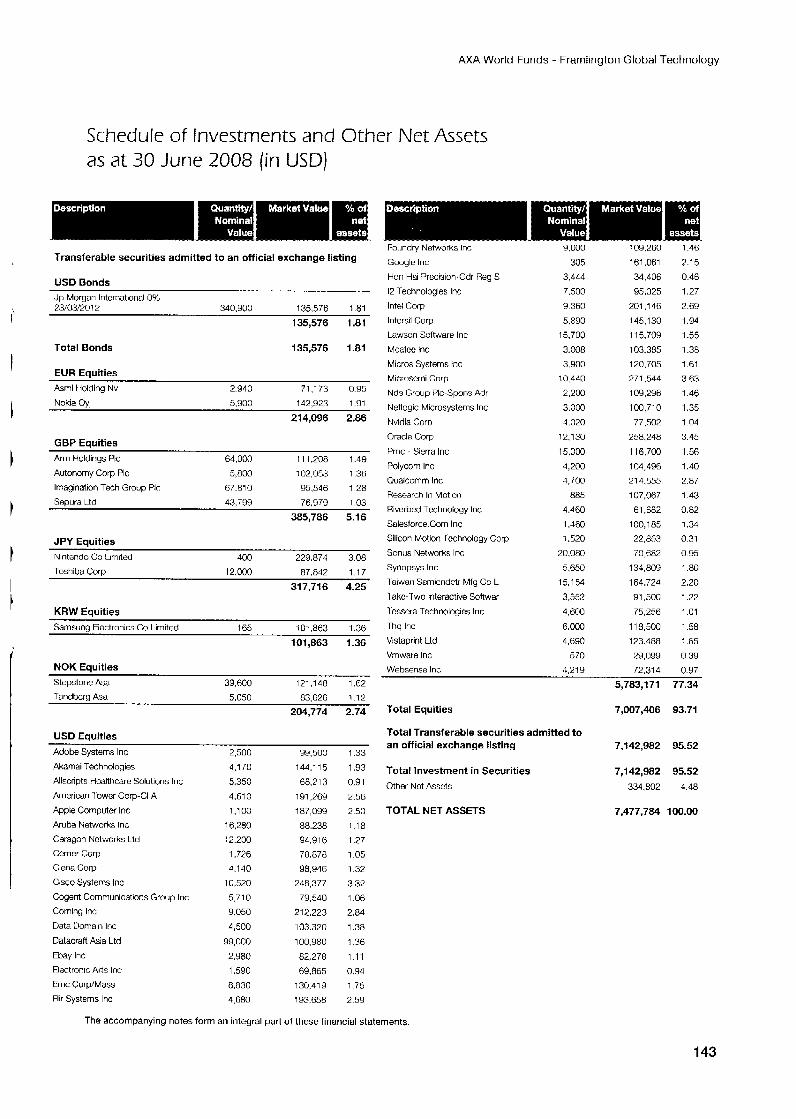
AXA World Funds - Framlington Global Technology
Schedule of Investments and Other Net Assets as at 30 June 2008 (in USD)
Transferable securities admitted to an official exchange listing
USD Bonds Jp Morgan International 0% 23/03/2012 340,900 135,576 181
135,576 1.81
Total Bonds
EUR Eauities
135,576 1.81
Asml Holding Nv 2.940 71.173 0.95 Nokia Oyj 5,900 142,923 1.91
214,096 2.86
GBP Equities
Arm Holdings PIC 64,000 111,208 1.49 Autonomy Cow PIC 5,800 102.053 1 36 Imagination Tech Group PIC 67.810 95.546 1 2 8
Sepura Ltd 43,799 76.979 1.03
385,786 5.16
JPY Equities
Nintendo Co Limited 400 229.874 3.08
Toshiba Corp 12.000 87.842 1.17 317,716 4.25
KRW Equities
Samsung Electronics Co t.imited 165 :01.883 1.36
101,863 1.36
NOK Equities Stepstone Asa 39,600 121,148 1.62 Tandberg Asa 5,050 83.626 1-12
204,774 2.74
USD Equities Adobe Systems Inc
Akaniai Technologies
Allscripts Hcalthcare Solutions Inc
American ToWQr Cop-CI A
Apple Computer Inc
Aruba Networks Inc
Ceragon Nctworks Ltd Cerner C o p
Ciena Cow Cisco Systems Inc Cogent Communications Group Inc
Corning Inc
Data Domain Inc
Datacraft Asia Ltd
Ebay Inc
Electronic Arts Inc
Cmc Corp/Mass
Flir Systems Inc
2,500 4,170 5,350
4.61 0
1,100
16.280 :2.200
1,776 4,140
10,520 5,710 9,050 4,500
99,000
2,9a0 1,590
8.830 4.680
Y9.500 144,115
68.113
191,269 187,099
88.238 94,916
78.878 ~ a . 9 4 6
248.377 79,540
212,223
103,320 100,980
82,278 69.865
130,419 193.658
1.33
1.93
0.91
2.56 2.50
1.18 1 2 7
1.05 1.32 3.32 1.06 2.84
1.38
7.36
1.11 0.94 1.75 2.59
Foundry Networks Inc
Gmgle Inc
Hon Hai Pracision'Gdr Reg S
12 Technologies Inc
Intel Corp
lntersil Cow Lawson Software Inc
Mczfce Inc
Micros Systems Inc
Micrvscrrri Cvrp
Nds Group Plc-Spons Adr
Netlogic Microsysterns Inc
Nvidia Corp
Oracle Corp
Pmc - Sierra Inc
Polycom Inc Qualconrm Inc
Research In Motion Riverbed Technology Inc
Salesforce.Com Inc
Silicon Motion Iechnology Corp
Sonus Networks Inc
Syrwpsys Inc
Taiwan Scmicndctr Mfy Co L
1 akc- Two Interactive Softwar
lcsscra Technologies Inc
Thq Inc
Vistaprint Ltd
Vmware Inc Websense Inc
9,000 305
3,444 7,500 9.360
5.890 15,700 3.008 3.900
10.440 2,2m
3,OM)
1.020 12,130
15.0M1 4,200
4,700 865
4.460 1.460 1,520
20,080 5,650
15,154 3.552 6.600 6,000 4,690
5 70 4.219
109,260 161,061 34,406 95,325
201 , I 4B 145,l 30 11 5.709
103.385 120,705 771.544 109,296
100,710 77,502
258,248
116,700 104,496
214.555 107.067 61,682
100,185 22.853 70,682
134,809
164,724 91.50C
75,256 11 8,500 123.488
29,099 72.314
1.46 7.15 0.46 1.27 2.69
1.94 1.55 1.38 1.61
3.63 1.46
1.35 1.04 3.45
1.56 1.40
2.87 1.43
0.82 1.34 0.31
0.95 1.80
2.20 1.22
1.01 1.58 1.65
0.39 0.97
5,783,171 77.34
Total Equities 7,007,406 93.71
Total Transferable securities admitted to an official exchange listing 7,142,982 95.52
Total Investment in Securities Other Net Assets
7,142,982 95.52 334.802 4.48
TOTAL NET ASSETS 7,477,784 100.00
The accompanying notes form an integral part of these financial statements
1 43
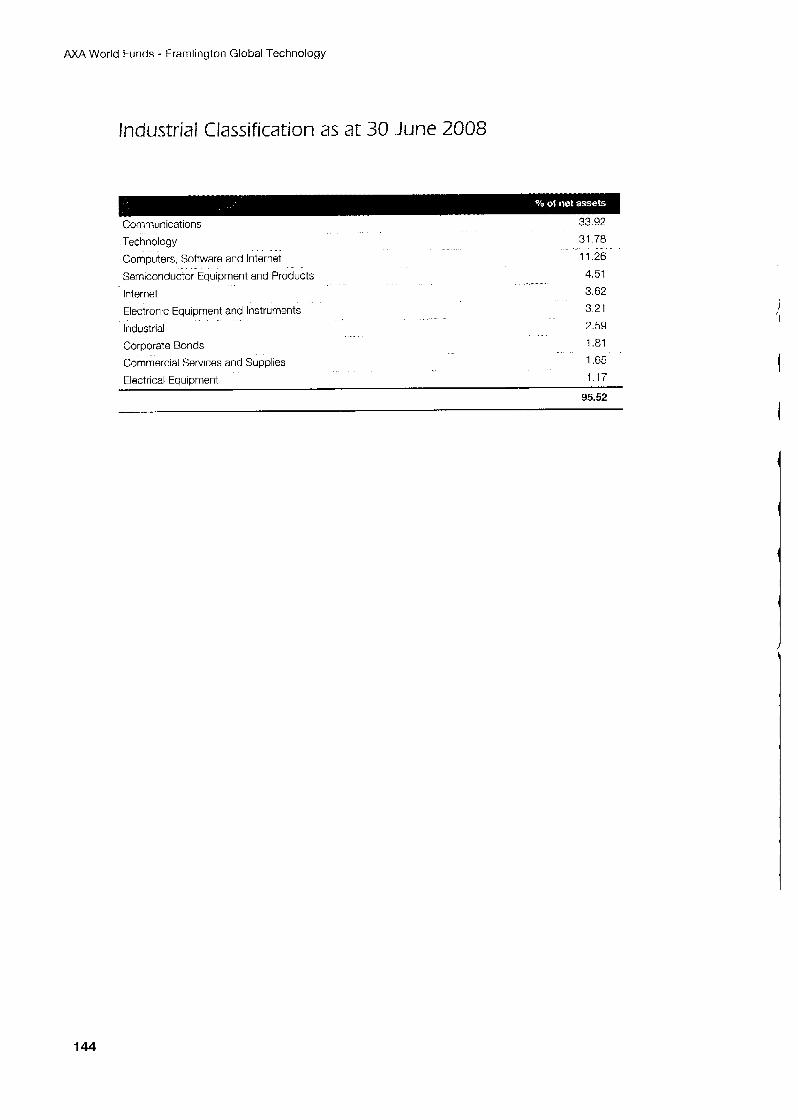
AXA World Funds - Frarnlington Global Technology
Industrial Classification as at 30 June 2008
Communications 33.92
Technology
Computers, Software and Internet
Semiconductor Equipment and Products
lnlernet
Electronic Equipment and Instruments
Industrial
Corporate Bonds
31 78 11.26 4.51 3.62 3.21 2.59 1.81
Commercial Services and Supplies 1.65 Electrical Equipment 1.17
95.52
I ‘I
144
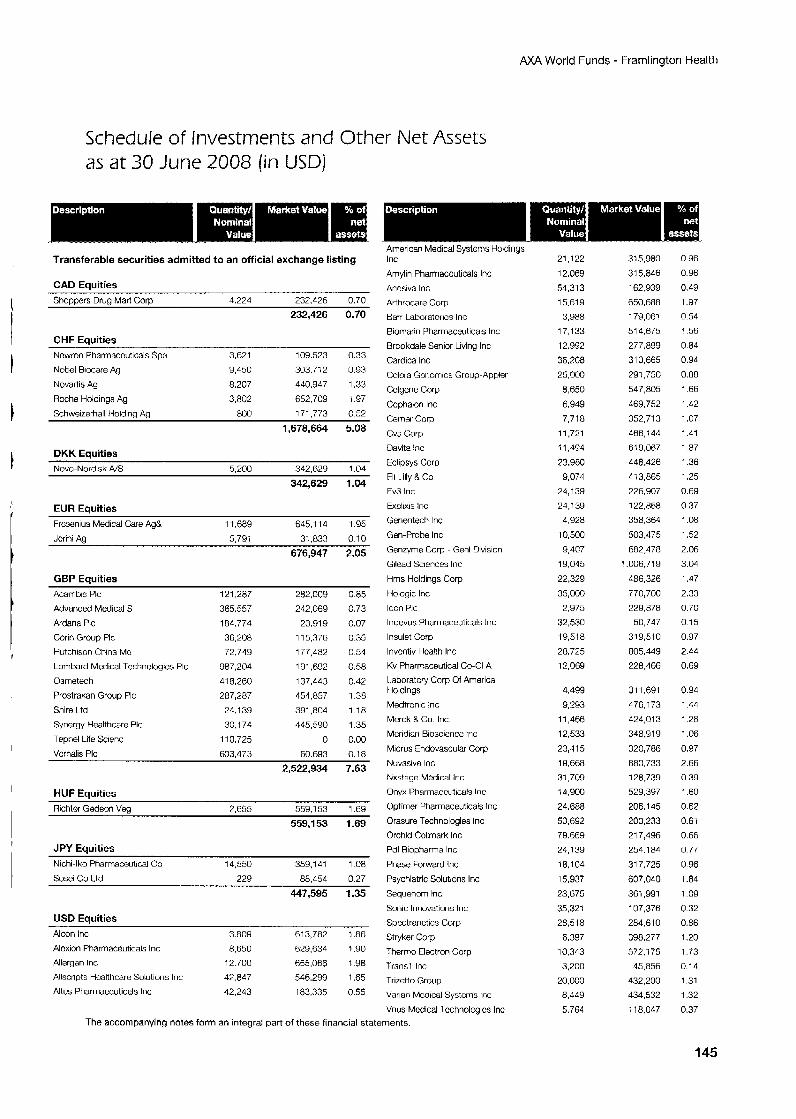
AXA World Funds - Framlington Health
Schedule of Investments and Other Net Assets as at 30 June 2008 (in USD)
Transferable securities admitted to an official exchange listing
CAD Equities Shoppers Drug Mart Ccrp 4.224 232.426 0.70
232,426 0.70
CHF Equities Ncwron Pharmaccu:icals Spa 3,621 109.523 0.33
Nobel Biccare Ag 9.45c 303.712 0.Y3
Novartis Ag 8,207 440.947 1.33 Roche Holdings Ag 3,802 652,709 1.97
Schweizehall Holding Ag 800 171,773 0.52
I ,678,664 5.08
DKK Equities Novo-Nordisk N S 5,200 342,629 1.04
342,629 1.04
EUR Eauities Frcsonius Medical Care Ag& 11,689 645,114 1.95
Jcrini Ag 5,79i 31,833 0.10
676,947 2.05
GBP Equities Acambts PIC
Advanced Mcdical S Ardana PIC
Corin Group PIC
Hutchison China Mc
Lombard Medical Technologies PIC
Osmetech
Prostmkan Group PIC
Shire Ctd
Synergy Healthcare PIC
Tepnel Life Scienc
Vcrnalis PIC
121,287
365.557
184.774
36,208 72.749
987.204
41 8,260 287,287
24.139
30.1 74
110,725
w3.473
282,OOY 242,069
23.919 1 15,376
177,482
191,692
137.443 454,857
391,804
145,590
0
60.693
0.85 0.73
0.07 u.35 0.54
0.58
0.42
1.38
1.18
1.35
0.00
0.18
2,522,934 7.63
HUF Equities Richtor Gedeon Veg 7,655 559,153 1.69
559,153 1.69
JPY Equities Nichi-lko Pharmaceutical Cc 14,550 359,141 1.08
Scsei Co 1.td 229 88.454 0.27
447,595 1.35
USD Equities Alcon Inc 3.809 613,782 1.86 Alcxion Pharmaceuticals Inc 8.650 629.634 1.90 Allergan Inc 12.700 655,066 1.98 Allscripts Hcalthcaro Solutions Inc 47.847 546.299 1.65
Altus Pharmaceuticels Inc 42,243 183,335 0.55
The accompanying notes form an integral part of these financial statements.
Arnericw Medical Systems Holdings Inc
Amylin Phmiaceuticals Inc
Ancsiva Inc
Arthrocare Cow Barr Laboratcrics Inc Biomarin Pharmaceuticals Inc
Brookdale Senior Living Inc
Cardica Inc
Cclcra Gcncmics Group-Appler
Cclgene Corp
Ccphalon Inc
Cemer Ccrp
Cvs Corp Daita Inc
Eclipsys Ccrp Fli ILilly & Co Ev3 Inc
Exclixis Inc
Genentech Inc
Gen-Probe Inc
Genzyme Gorp - Genl Division
Gilead Sciences Inc Hms Holdings Corp
Hologic Inc
lccn PIC lndevus Pharmaceuticals Inc
lnsulet Corp
lnvcntiv Hcalth Inc Kv Pharmaceutical Co-CI A
Lhboratory Corp Of America Holdings Medtronic Inc
Merck 8 Co. Inc.
Mcridim Bioscicncc Inc
Micrus Endovascular Cvrp
Nuvzsive Inc kxstage Medical Inc
Onyx Pharmaceuticals Inc Optimer Pharmaceuticals Inc
Orasure Technologies Inc
Orchid Ccllmsh Inc Pdl Riopharma Inc
Phase Forwzrd Inc
Psychiatric Solutions Inc
Sequenoni Inc
Sonic Innovations Inc
Spcctranctics Corp
Stryker C o p Therriio Electron Corp
Trans1 Inc Trizetto Group
Varian Mcdical Systcrns Inc
Vnus MCdical lcchnolqics Inc
21,122
12.069
54,313 15.619
3.988 17,133
12.992
36.2C8
25,000
8,650
6,949
7,718 11,721
i 1,494
23.980 9,074
24,139
24,139 4,928
10,500
9,4c7
19,045
22,329
35,000
2,975
32,530 19,518
28,725 12,069
4,499
9,293
1 i ,466 12,533
23,415
19,668
31,709 14,900
24.688
50,692 79.689
24,139
18.1G4
15.937
23,675
35,321 28,518
6.397
10,343 3,200
20,000 8,449
5.764
315,980
315,846
162,939
650.688
179.061 51 4,675
277.899
31 0,665 291.750
547,805
469,752
352,713
466,144
619.067 448.426
413,865
226,907
122.868 358,364
503,475
682,478
1.006,718
486,326
770,700
229.878 50,747
319,510
805.449 228,466
31 1,691
476.1 73 424,013
348,919
320,786
880.733
128,739 529,397
206,145
200,233 217,496
254.1 84
317,725
607,040
361,991
107.376 284,610
398.277 572,175
45,856
432,200 434,532
11 8.047
0.96
0.96
0.49
1.97 0.54
1.56
0.84 0.94
0.88
1.66
1.42
1.07
1.41
1 .a7 1.36
1.25
0.69
0.37 1.08
1.52
2.06
3.04
1.47
2.33
0.70 0.15
0.97 2.44
0.69
0.94
1.44
1.28
1.06
0.97
2.66 0.39
1.60
0.62
0.61
0.66 0.77
u 96 1.84
1.09 0.32
0.86
1.20 1.73
0.14
1.31 1.32
0.37
145
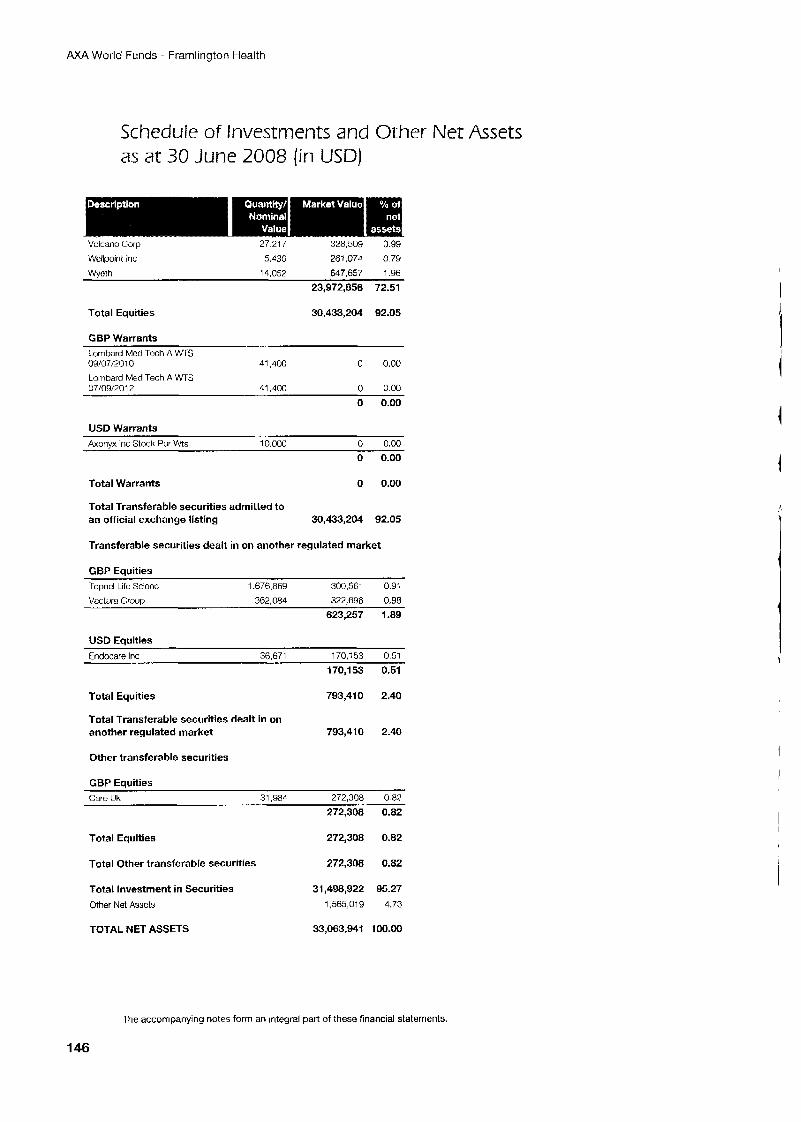
AXA World Funds - Frarnlington Health
Schedule of Investments and Other Net Assets as at 30 June 2008 (in USD)
Volcano Gorp 27.217 328.509 0.99
Wcllpoint Inc 5.430 261.074 0.79
Wyeth 14.05% 647,657 1.96
23,972,856 72.51
Total Equities 30,433,204 92.05
GBP Warrants Lombard Med Tech A WiS 09/07/2010 41,400 0 0.00
Lombard Med Tech A WTS 07/09/20 1 2 41.400 0 0.00
0 0.00
USD Warrants Axonyx Inc Stock Pur Wts 10,000 0 0.00
0 0.00
Total Warrants 0 0.00
Total Transferable securities admitted to an official exchange listing 30,433,204 92.05
Transferable securities dealt in on another regulated market
GBP Equities Tepnel Life Scicnc 1.676,869 300.561 0.91
Vcctura Groun 362.084 322.696 0.98
623,257 1.89
USD Eauities Endocare Inc 36,671 170,153 0.51
170,153 0.51
Total Equities 793,410 2.40
Total Transferable securities dealt in on another regulated market 793,410 2.40
Other transferable securities
GBP Equities Care Uk 31.984 272,308 0.8?
272.308 0.82
Total Equities 272,308 0.82
Total Other transferable securities 272,308 0.82
Total Investment in Securities Other Net Assets
TOTAL NET ASSETS
31,498,922 95.27 1,565,OI 9 4.73
33,063,941 1M1.00
I
I
i
The accompanying notes form an integral part of these financial statements.
1 46

AXA World Funds - Framlington Health
Industrial Classification as at 30 June 2008
Consumer, Non-cyclical 53.51
Pharmaceuticals
Healthcze
Technology Blotechnology
Communications
Electronic Equipment and Instruments
Consumer, Cyclical
Computers, Software and Internet
Retail
investment Companies
Warrants
15.67
8.97
5.04 3.97
2.44
1.73 1 4 1
1.31 0.70
0.52 0.00
95.27
t
1 47
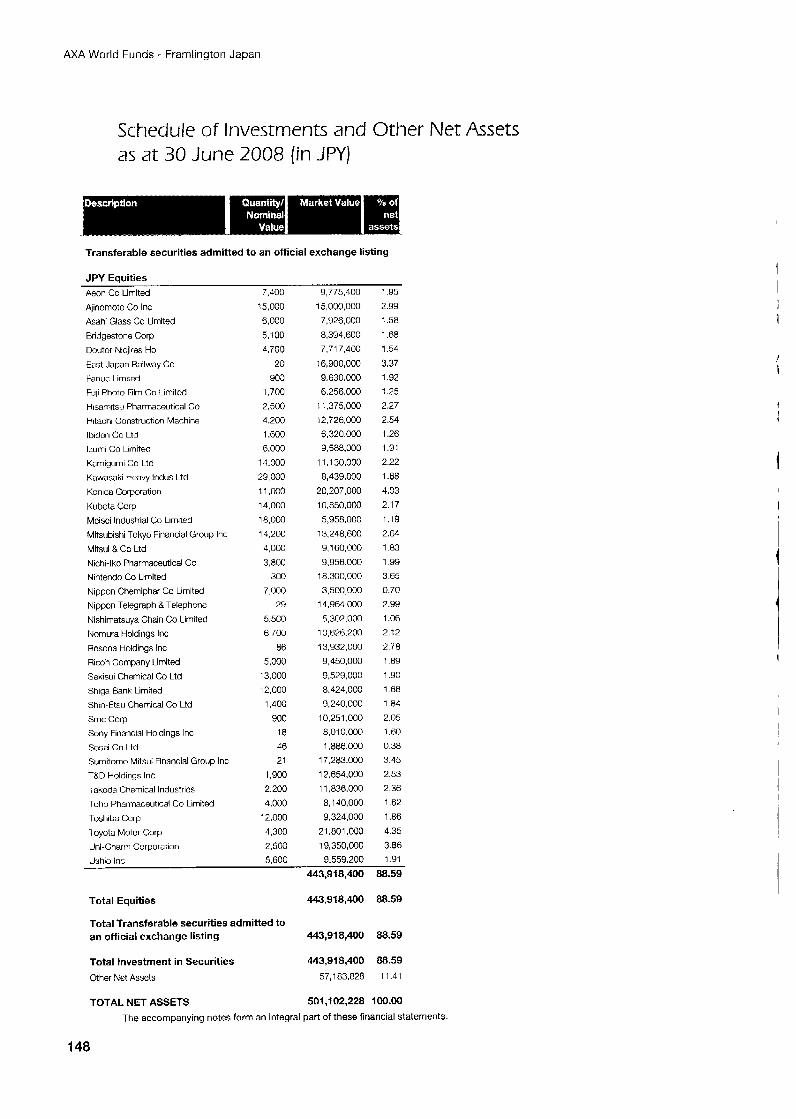
M A World Funds - Framlington Japan
Schedule of Investments and Other Net Assets as at 30 June 2008 (in JPY)
Transferable securities admitted to an official exchange listing
JPY Equities 1.95 7,400 9,775,400 Aeon Cc Limited
Ajinomoto Co Inc Asahi Glass Co ILimited
Bridgestone Corp
Doutor Nicjires Ho East Japan Railway Co Fanuc Limited Fuji Photo Film Co Limited
Hisarnitsu Pharmaceutical Co Hitachi Construction Machine lbidon Co Ltd lzurni Go Limited Kamigurni Co Ltd
Kawasaki beavy lndus Ltd
Konica Corporation
Kuhota Corp Mcisci Industrial Co Limited Mitsubishi Tokyo Financial Group Inc
Mitsui 8. Co Ltd
Nichi-lko Pharmaceutical Co Nintendo Co Limited
Nippon Chemiphar Co Limited Nlppon .Telegraph 8 Telephone
Nishimdtsuya Chain Co Limited Nomura Holdings Inc
Rcsona Holdings Inc Ricoh Company I-imited
Sekisui Chemical Co Ltd Shiga Hank Limited
Shln-Etsu Chemical Co Ltd Srnc Corp Sony Financial Holdings Inc Sosei Co Ltd Sumitomo Mitsui Financial Group Inc T&D Holdings lric
Takeda Chemical lndustrics Toho Pharmaceutical Co Limited Toshiha Corp
1 oyota Motor Corp Uni-Charm Corporation
1 5,000 6,000 5,100 6,700
20
YO3 1,700 2,500 4.200 1,600 6.000
14.000 29,000 11 .M)o
18.000 14,200 4,000 3.800
300 7,000
29 5 ,5CO 6.700
86 5,000
13,000 12,000 1,400
900 18 L6 21
1,900 2.200
4.000 12,000 4,300 2.500
14,000
15,000,000 7.926.0CO 8,394.600 7,717,400
16,900,000 9,630,000 6.256.003
11,375,000 12,726,000 6,320,000 9,588,000
11,130,000 8,439,000
20,207,000 10,850,000 5,958.000
13248,600 9,160,000 9.956.000
18.300.000 3,500,000
14,964,000 5,302,000
10,626.200 13,932,000 9,450,000
9.5?9.000 8.424.000 9,240.000
10,251,000 8,010,000 1,886,000
17.283.000
12,654,000 11.836.000 8, l 40,000
9,324,000 21,801,000 19,350,000
2.99 1.58 1.68 1.54 3.37 1.92 : .75 2.27 2.54 1.26 1.91 2.22 1.68 4.03 2.17 1.19 2.61 1.83
1.99 3.65 0.70 7.99 1.06 2.12
2.78 1.09 1.90 1.68 1.84 2.05 1.60 0.38 3.45 2.53 2.36 1.62 1.86 4.35 3.86 1.91 Ushio Inc 5,600 9.559.200
443,918,400 88.59
Total Equities 443,918,400 88.59
Total Transferable securities admitted to an official exchange listing 443,918,400 88.59
Total Investment in Securities Other Net Assets
443,918,400 88.59 57,183.828 11.41
TOTAL NET ASSETS 501,102,228 100.00 The accompanying notes form an integral part of these financial statements.
1 48
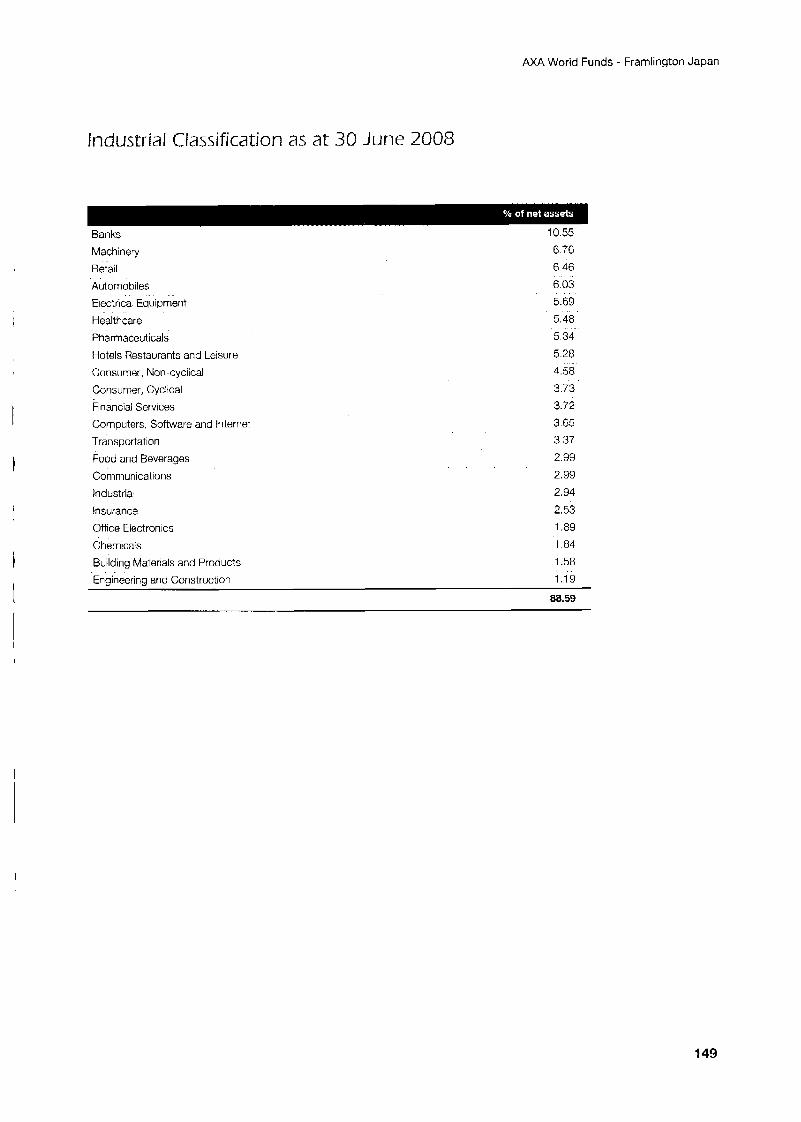
AXA World Funds - Framlington Japan
t
I
Industrial Classification as at 30 June 2008
Banks
Machiney
Retail
Automobiles
Electrica Equipment
Healthcare
Pharmaceuticals
Hotels Restaurants and Leisure
Consumer, Non-cyclical
Consumer, Cyclical
Financial Services
Computers, Software and Internet
Transportation
Food and Beverages
Communications
Industria
Insurance
Office Electronics
Chemicals
Building Materials and Products
10 55 6 76 6 46
6 03 5 69 5 48
5 34
5 28
4.58
3 73 3.72
3 65 3.37 2.99 2.99
2.94
2.53 1.89
1.84
1.58
Engineering and Construction 1.19
88.59
149
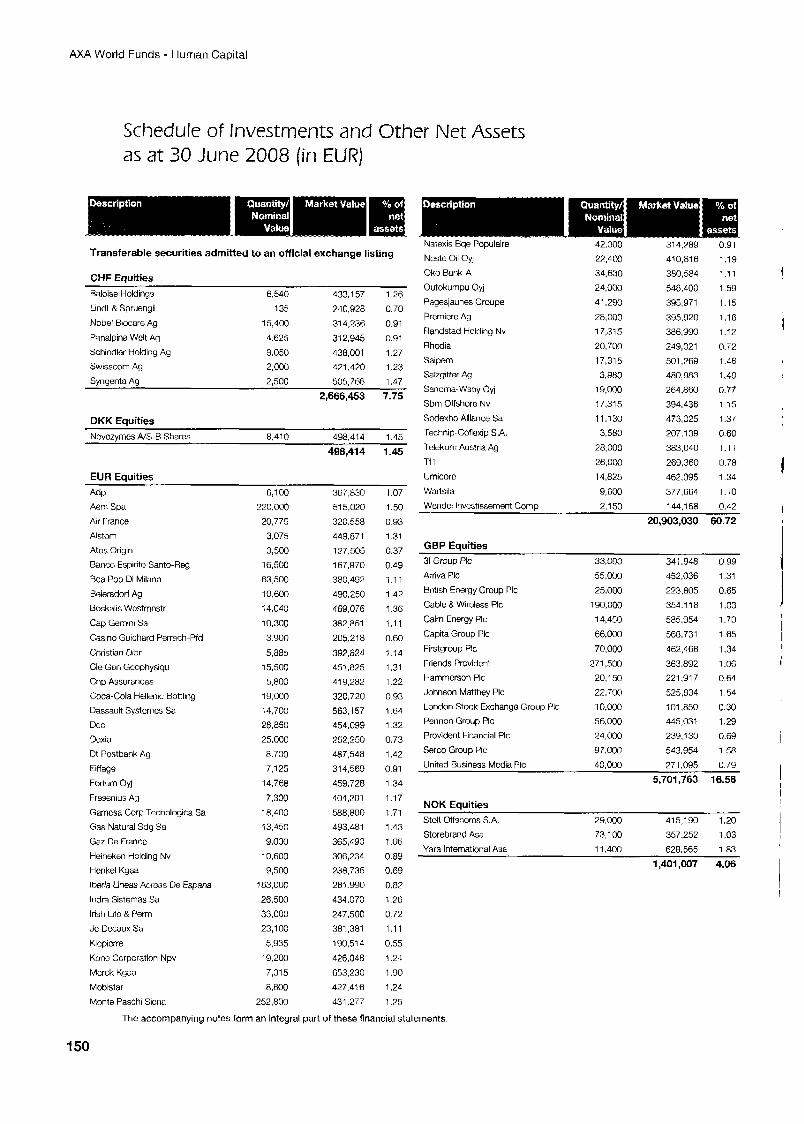
AXA World Funds - Human Capital
as at 30 June 2008 (in EUR)
Transferable securities admitted to an official exchange listing
CHF Equities
Baloise Holdings 6,540 433,157 1.26 Lindt & Spruengii : 35 740.928 0.70 Nobel Biocare Ag 15,400 314,236 0.91 Panalpina Welt Ag 4.625 312.945 0.91 Schindler Holding Ag 9.050 438,001 1.27
Swisscorn Ag 2,000 421,420 1.23 Svnuenta Aa 2.500 5057% 1 47
DKK Eauities
~~ ... 2,666,453 7.75
~
Novozvmes NS-R Shares 8.410 498.414 1.45
498,414 1.45
EUR Equities AOP Asm Spa
Air France
Alstorn
Atos Origin
Banco Espirito Santo-Reg
Bca Pop Di Milano
Eeiersdorl Ag Doskdlis Wcstmnstr
Cap Gemini Sa
Casino Guichard Perrach-Pfd
Christian Dior
Cie Gen Gcophysiqu
Cnp Assurances
Coca-Cola Hellenic Bottling
Dassauit Systcmcs Sa Dcc
Dexia Dt Postbdnk Ag
Eiffage
Fortum Oyj
Frescnius Ag
Gamcsa Corp Tecnologica Sa
Gas Natural Sdg Sa
Gw De rrancc
Heineksn Holding Nv
Henkel Kgaa
Iberia Lineas Acreas De Espana
lndra Sistemas Sa
Irish Lifc & Perm
Jc Uecaux Sa
Klcpicrre
Konc Corporation Npv
Mcrck Kgaa
Mobistar
Monte Pasch Sicna
6,100 220.000 20,775
3,075 3,500
16.500 63,500 10,600 14,040
10,300 3.900
5,885 15,500 5,800
19,000 14,700 28,850 25,000
8.700
7.125 14.768
7.300 18,400 i3,450
9,000 10,600 9,500
163,000 26,500 33.000 23,100
5,935 19.200
7,315 8,800
252,800
367.830 51 5,020 320.558
449.871 127,505 167.970 380.497
490,750 469,076
382.851 205,218
392,824 451,825 41 9,282
320,720 563,l 57
454.099 252.250 487,548 314,569 459.728
404,201 588.800 493,481 365,490
308,234 238,735
281.990 434.070 247,500
381,381 190,514
426.048 653,230 427.416 431.277
1.07 1.50
0.93 1.31
0.37 0 . 4 ~
1.11 1.42
1.36 1.11 0.60
1.14 1.31
1.22 0.93
1.64 1.32
0.73 1.42 0.91 1.34 1.17
1.71 1.43
1.06 0.89 0.69 0.87
1.26 0.72 1.11
0.55 1.21
1.90 1.24 1.75
Schedule of Investments and Other Net Assets
The accompanying notes form an integral part of these financial statements.
Natexis Bqe Populaire
Neste Oil Oyj
Oko Bank-A
Outokurnpu Oyj
Pagesjaunes Groupe
Premiere Ag
Randstad Holding Nv
Rhodia
Saipem Salzgitter Ag
Sanorna-Wsoy Oyj
Sbm Offshore NV
Sodexho Alliance Sa Technip-Coflaxip S.A.
Teiekon; Austria Ag
Tfl
Umicorc
Wartsila
Wcndci lnvestissernent Conu
42.300 29,400 34,630
24,000 41.290 28.000 17,315 20,700
17,315 3.980
19,000 17.315 11,130 3,580
28,000 26,000
14,825
9,600 2.150
31 4,289 410,816
380,584 548,400 395,971
395,920 386,990
249,021 501.269 480.983 264,860
394.436 473.025
207,139 383,040 269.360
462,095 377.664 144.158
0.91
1.19 1.11
1.59 1.15 1.16
1.12 0.72 1.46 1.40
0.77 1.15
1.37 0.60 1.11
0.78 1.34
1.10 0.42
20,903,030 -60.72
GBP Equities 33.000 341.948 0.99 31 Group PIC
Arriva PIC 55.000 452,036 1.31 British Energy Group PIC 25.000 223.805 0.65
Cable & Wireless PIC 190.000 354.118 1.03 Cairn Energy PIC 14.450 585,954 1-70
Capita Group PIC 66.000 568,731 1.65 Firstgroup PIC 70.000 462,468 1.34 Friends Provident 271.500 363.892 1.06 Hammcrson PIC 20,150 221.917 0.64 Johnson Matthey PIC 22.700 525,834 1.54
London Stock Exchange Group PIC 10,oM: iO1.850 0.30 Pennon Group PIC 56.0OU 445,031 1.29
239,130 0.69 Provident Financial PIC 24.000 Serco Group PIC 97,000 543,954 1.58 United Business Mcdia PIC 40,000 271,095 0.79
5,701,763 16.56
NOK Equities Stolt Offshorcs S A . 29.000 415,190 1.20 Storebrand Asa 73.1 00 357,252 1.03
11,400 628,565 1.83
1,401,007 4.06 Yara International Ass
150
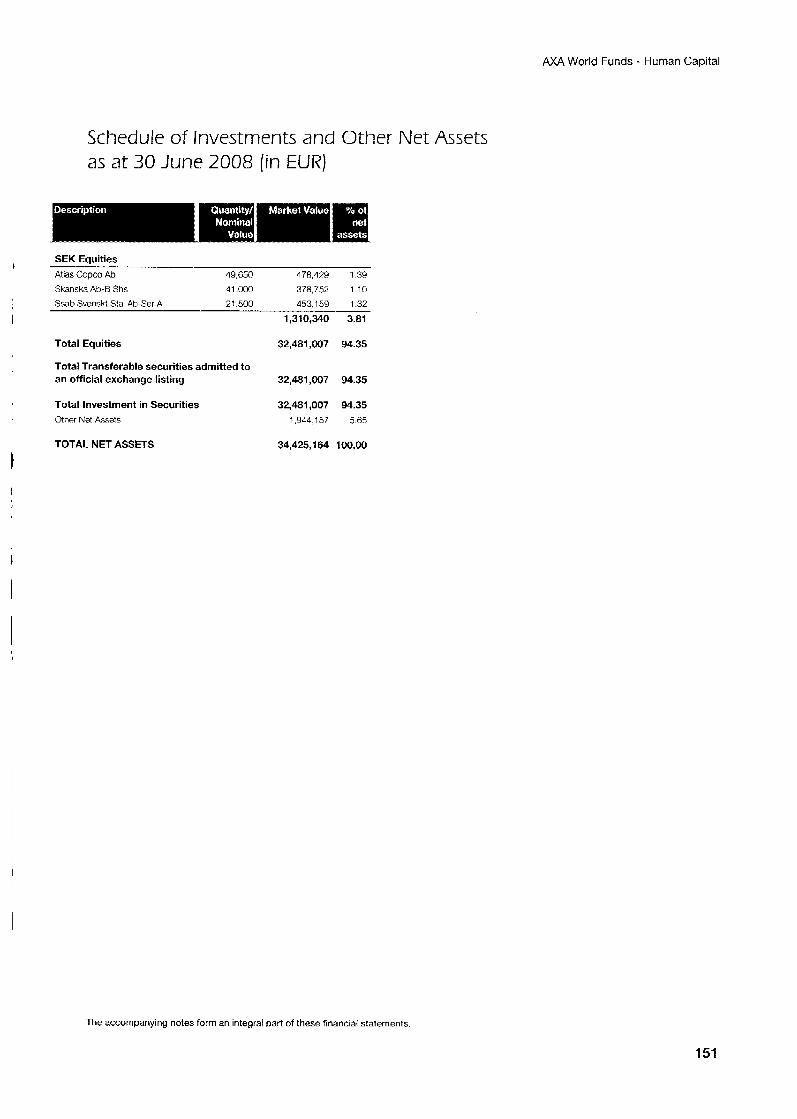
AXA World Funds - Human Capital
Schedule of Investments and Other Net Asets as a t 30 June 2008 (in EUR)
SEK Equities
Atlas Copco Ab 49,650 478.429 1 3 9 Skanska Ab-8 Shs 41 .COO 378.752 110
Ssab SvensM Stal Ab-Ser A 21,500 453.159 1.32
1,310,340 3.81
Total Equities 32,481,007 94.35
Total Transferable securities admitted to an official exchange listing 32,481 ,MI7 94.35
Total Investment in Securities 32,481,007 94.35 Other Net Assets 1,944.1 57 5 65
TOTAL NET ASSETS 34,425,164 100.00
The accompanying notes form an integral part of these financial statements.
151
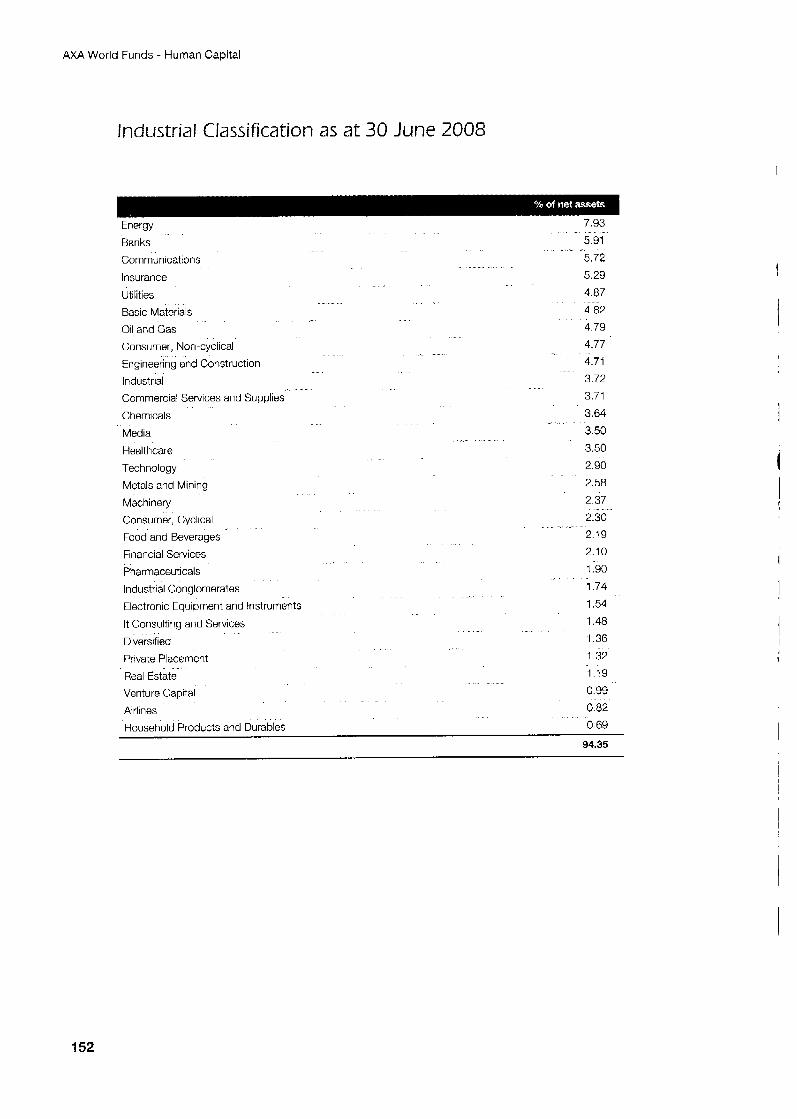
AXA World Funds - Human Capital
Industrial Classification as at 30 June 2008
Energy
Banks
Communications
Insurance
Utilities
Basic Materials
Oil and Gas
Consumer, Non-cyclical
Engineering and Construction
Industrial
Commercial Services and Supplies
Chemicals
Media
Healt hcare
7 93 5 91
5 72 5.29
4.07
4 82 4 79
4.77
4.71
3.72
3.71
3 64
3 50 3.50
_ "
Technology 2 90
Machinery 2 37
Metals and Mining 2.58
" " Consumer, Cyclical
Food and Beverages
2.30
2.19
Financial Services 2.10
Pharmaceuticals 1.90
Industrial Conglomerates 1 74
Electronic Equipment and Instruments 1 54
It Consulting and Services 1.48
Diversified 1.36
Private Placement 1 32
Real Estate 119
Venture Capital 0 99 Airlines 0 82
Household Products and Durables 0 69
94.35
I 1
152
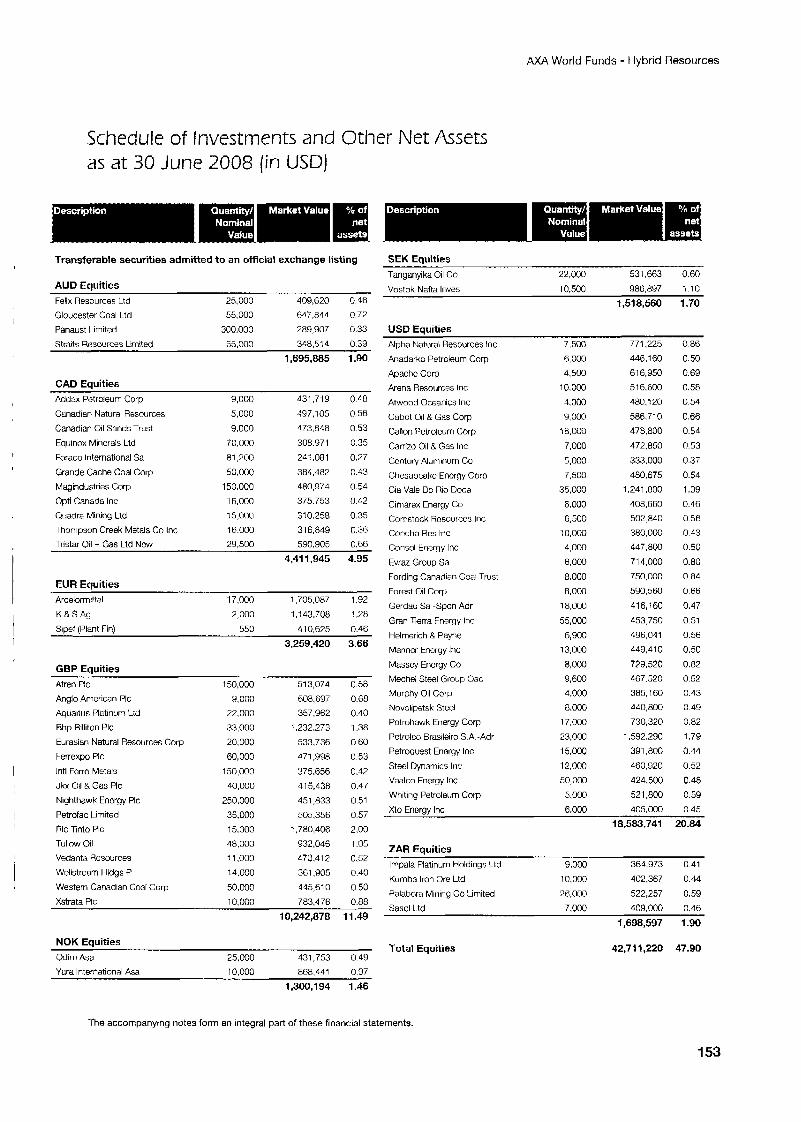
AXA World Funds - Hybrid Resources
I
Schedule of Investments and Other Net Assets as at 30 June 2008 (in USD)
Transferable securities admitted to an official exchange listing
AUD Equities Felix Resources Ltd
Gloucester Coal Ltd
Panaust Limited
25,000 409,620 0.46 55.000 647,844 0.7:’
300,000 289,907 0.33
Straits Resources Limited 55.000 348.514 0 3 9
1,695,885 1.90
CAD Equities Addax Petroleum Corp
Canadian Natural Resources
Canadian Oil Sands Trust
Equinox Mincrals Ltd
Foraco International Sa
Grande Cache Coal Corp
Magindustries Corp
Opti Canada Inc Quadra Mining Ltd
Thompson Creek Mdals Co Inc Tristar Oil + Gas Ltd NCW
9,000
5,000
9.000
70.000
81,200 50,00G
150,OCO
16,000 15,CK)O
16.000 29.500
/131,719
497,105
a73.848
308.971
2d1.081
384.482
480.974 375.753
310.258 316,849
590.905
- 0 48 0 56
0 53
0 35
0.27
0.43
0 54 0 42
0.35
0 36 0.66
4,411,945 4.95
EUR Eauities Arcelormittal
K & S A y
Sioef (Plant Fin)
17,000 1.705.087 1.92 2,000 1.:43.708 ! .2B
55G 410.625 0.C6
3,259,420 3.66
GBP Euuities Atren PIC
Anglo American PIC
Aquanus Platinum Lx Bhp Billiton PIC
Eurasian Natural Resources Corp Ferrexpo PIC
lntl FOKO Metals
Jkx Oil & Gas PIC
Nighthawk Energy PIC
Petrofac Limited
Rio Tinto PIC Tullow Oil
Vedanta Rcsources
Wellstream Hldgs P
Western Canadian Coal Corp
Xstrata PIC
150,000
9,000
22,000
33.000 20,000
60,000
150,000
40,000
250,000
35,000 15,300
48.000 11,000
14.000
50.000
10.000
513,074
608.697 357,962
1,232,273
533,736
a71,998
375,656 41 5,438
451,833
505.356 1,780,406
932,046 473.412
361.905
445,610
783.476
0.58
0.68 0.40
1.38
0.60
0.53
0.42 0.47
0.51
0.57
2.00 1.05
0.52
0.40
0.50 0.88
10,242,878 1 1.49
SEK Equities 531,663 060
Vostok Nafta lnves 10,500 986.897 i .10
Tanyanyika Oil Co 22,000
1,518,560 1.70
USD Equities Alpha Natural Resources Inc 7,500 771.225 0.86
Anadarko Petroleum Corp
Apache Corp Arena Resources Inc
Atwood Oceanics Inc
Cabut Oil 8 GTS C o p
Callon I’ctrolourn Corp
Carrizo Oil 8 Gas Inc
Century Aluminum Co
Chesapcakc Encrgy Corp Cia Vale Do Rio Doce
Ciniarux Energy Co
Comstock Hcsourccs Inc Concho Res Inc
Consol Energy Inc
6,000 446,160 0.50 4,500 616,950 0.69
10,000 516,600 0.58
4,000 480.120 0.54
9,000 586,710 U.66 7 8.000 478,800 0.54
7,000 472,850 0.53
5,000 333,000 0.37 7,500 480,675 0.54
35,000 1,241,800 1.39
6,OUO 408.660 0.46 6,5Go 502.840 0.56
10,oGo 380.000 0.43
4,000 447.800 0.50 Evraz Group Sa 6,000 714,000 0.80 Fording Canadian Coal Trust 8,000 750,000 0.84
Forest Oil Corp 8,000 590.560 0.66
Gerddu Sa -Spon Adr 18,000 416,160 0.47
Gran Terra Fnergy Inc 55,000 453,750 0.51
Helrrierich 8 Payne
Marincr Encryy Inc
Masscy Encrgy Co Mechel Steel Group Oao Murphy Oil Corp
Novolipetsk Steel
Pctruhawk Energy Corp
Pctrolco Brasileiro S.A.-Adr
Petroquest Enerqy Inc Steel Dynamics lnc Vaalco Energy Inc
Whiting Petroleum Corp
6,900 496,041 0.56
449,410 0.50
8,000 779,570 0.82 9,600 467.520 0.52
4,000 385.160 0.43 8,000 440.800 0.49
17.0’33 730,320 0.82
23.000 1.592.290 1.79
15.000 391,800 0.44
12.000 460.920 0.52
50,000 424,500 0.48
5,000 521,800 0.59
13,000
Xto Enorgy Inc 6,000 405.000 0.45
18,583,741 20.M
ZAR Equities Impala Platinum Holdings ILtd 9,000 360.973 0.41
Kumba Iron Ore Ltd 10,000 402,367 0 4 4
Palabora Mintny Co Lirriited 76,000 522,257 0.59
Sasol I id 7,000 409,000 0.46
1,698,597 1.90
NOK Equities Total Equities
Odim Asa 25.000 431,753 0 4 9
Yara Intornational Asa 10,000 868.441 0.97
1,300,194 1.46
42,711,220 47.90
The accompanying notes form an integral part of these financial statements
153
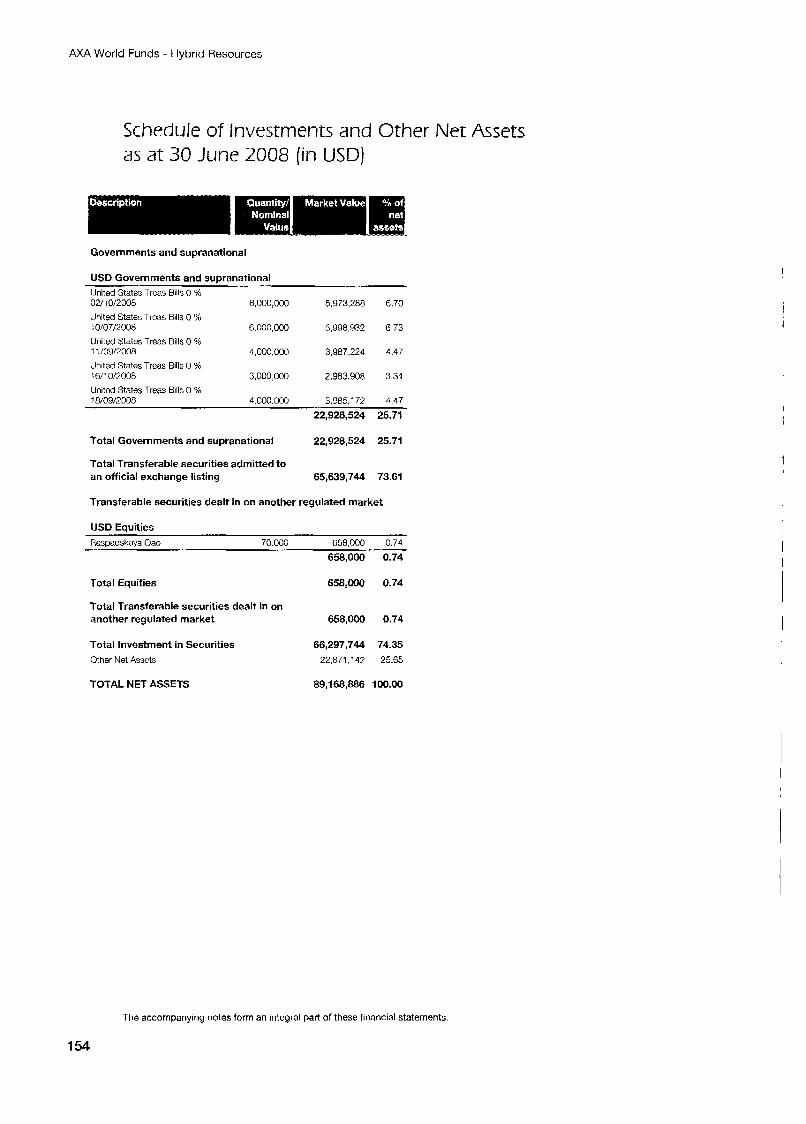
AX4 World Funds - Hybrid Resources
Schedule of Investments and Other Net Assets as at 30 June 2008 (in USD)
Governments and supranational
USD Governments and supranational United States Trcas Bills 0 % 02/10/2008 6,000,000 5,973,288 6.70 United States Trczs Bills 0 "/o 10/07/2008 6.000,000 5998.932 6 73 United States Treas Bills 0 % 1 1 /09/2008 4,000,000 3,987,224 4.47 United States Treas Bills 0 YO 1611 0/2008 3,000,000 7,983,908 3.34 Unitcd States Treas Bills 0 % 18/09/2008 4.000. 000 3.985.1 72 4 47
I
22,928,524 25.71
Total Governments and supranational 22,928,524 25.71
Total Transferable securities admitted to an official exchange listing 65,639,744 73.61
Transferable securities dealt in on another regulated market
USD Equities
1
Raspadskaya Oao 70.000 658,OCO 0.74
658,000 0.74
Total Equities 658,000 0.74
Total Transferable securities dealt in on another regulated market 658,000 0.74
Total Investment in Securities 66,297,744 74.35 Other Net Assets 22871,147 25.65
TOTAL NET ASSETS 89,168,886 100.00
The accompanying notes form an integral part of these financial statements.
1 54
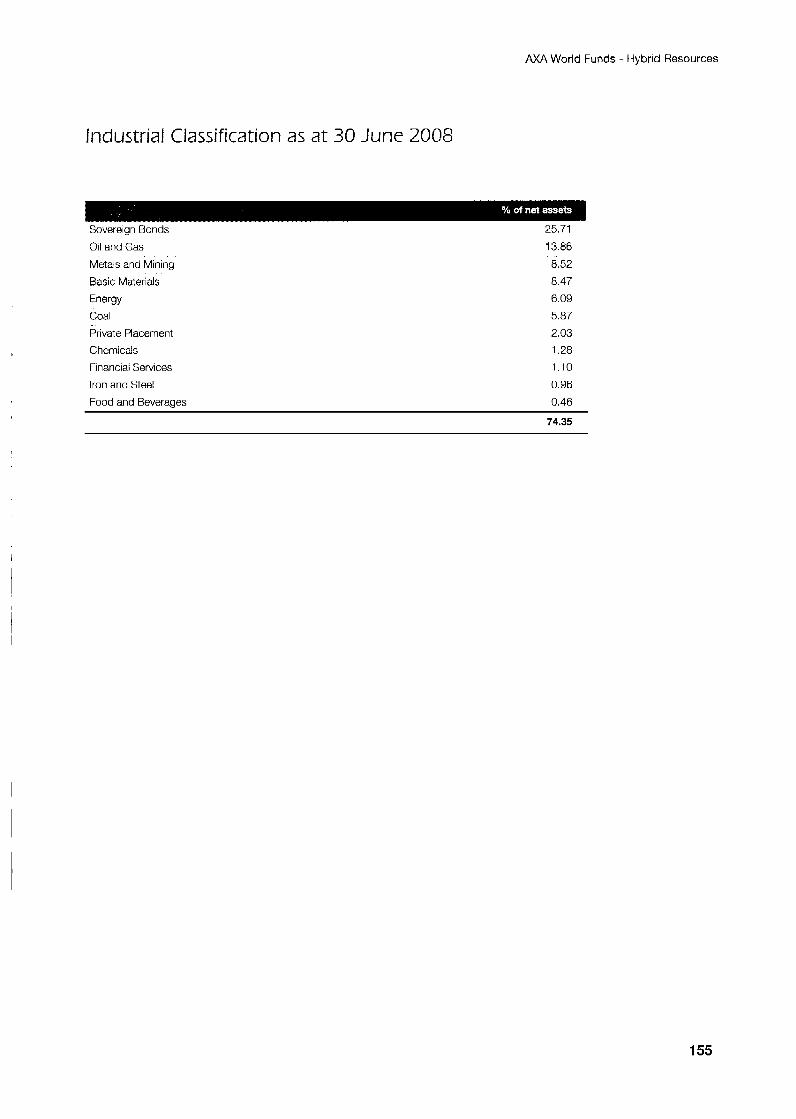
AXA World Funds - Hybrid Resources
Industrial Classification as a t 30 June 2008
.- ... ...... .. . - . - - - . Sovereign Bonds
Oil and Gas
Metals and Mining
25.71
13.86 8.52
Basic Materials 8.47
Energy 6.09
Coal 5.87
Private Placement
Chemicals
Financial Services
Iron and Steel
Food and Beverages
2.03
1.28
1.10
0.96
0.46
74.35
155
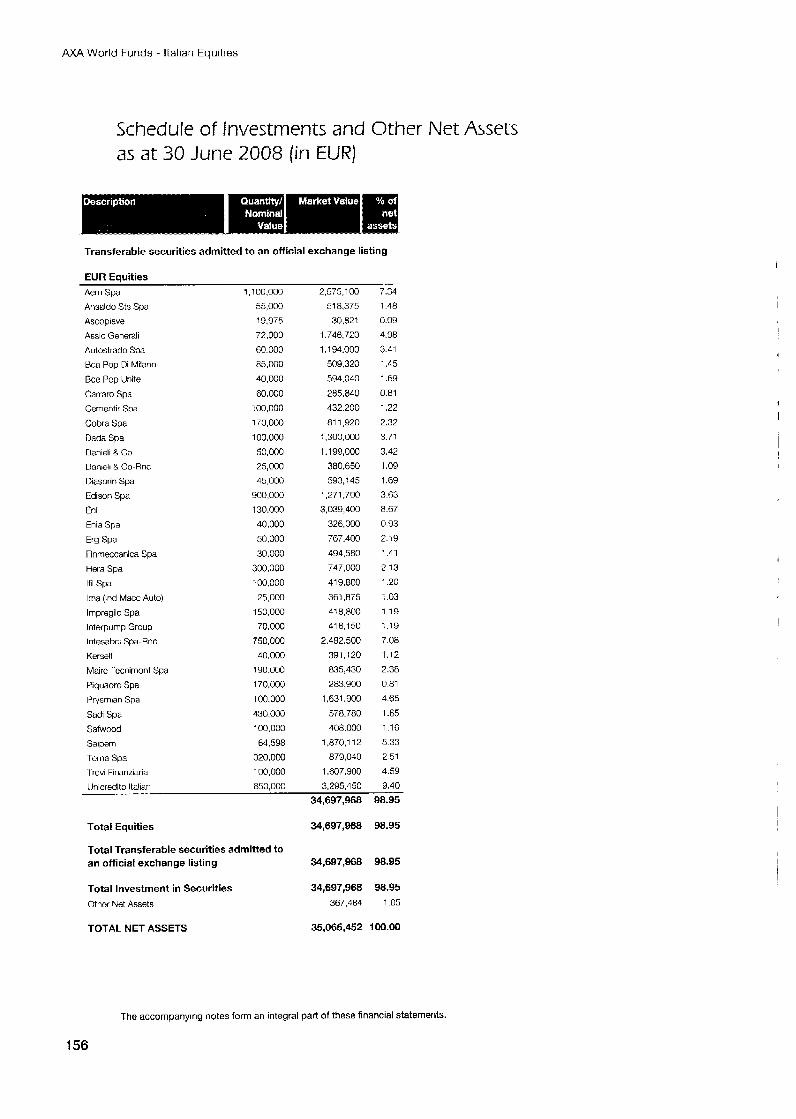
AXA World Funds - Italian Equities
Schedule of fnvestments and Other Net Assets as at 30 June 2008 (in EUR)
Transferable securities admitted to an official exchange listing
EUR Equities Aem Spa Arisaldc Sts Spa
Ascoplave Assic Generali
Autostradc Spa
Bca Pop Di Milano
Ecc Pop Unite
Carraro Spz Cementir Spa
Cobra Spa
Dada Spa Danieli 8 Co
Danieli 8 Co-Rnc Diasorin Spa
Cdison Spa fni
Enia Spa
Erg Spa
Finmeccanica Spa
Hera Spa lfil Spa
Irna (Ind Macc Auto)
lmpreyilo Spa
lnterpump Group lntesahci Spd-RnC
Kerself
Mairc Vccnimont Spa
Piquadro Spa
I’rysrnian Spa Sad1 Spa
Safwood
Saipem Tcrna Spa
.I rev1 Finanziaria
1,100,000 55,000
!9.975 77,000 60.000 85.000
AO.000
60,000
100,000
170,000 100,000
50,000 25,000
45.000 900,000
130.000 40,000 50,000
30,000 3C0,OOO 100,000 25,000
150,000 70.000
750,000 40,000
190.000
170S100 100,003
430,000 100,000
64,598 320,000 100,000
2,575,100 51 8.375
30,821 1,746,720
1,194,000 509,320
594,040 285.843 432.200 81 1,920
1,300,000
1 .I 99,000 380.650 593,145
1,271,700 3,039,400
326,000
767.400 494,580 74 7,000
419,800 361 -875
418.800 41 6,150
2.482.500 391.120 835,430 283,900
1,631,900
578.780 408.000
1,870,112 879.040
1.607.900
- 7.31 1.48 0.09 4.98 3.41 1.45
1.69 0.81
1.22 2.32 3.71
3.42 1.09
1.69 3.63
8.67 0.93
2.19 1.41 2.13 1.20 1.03
1.19 1.19 7.08 1.12
2.38 0.81 4.65
1.65 1.16
5.33
2.51 4.59
Llnicredito Italian 850,000 3,295,450 9.40 34,697,968 98.95
Total Equities 34,697,968 98.95
Total Transferable securities admitted to an official exchange listing 34,697,968 98.95
Total Investment in Securities 34,697,968 98.95 Othcr Net Assets 367,484 1.05
TOTAL NET ASSETS 35,065,452 100.00
The accompanying notes form an integral part of these financial statements.
156
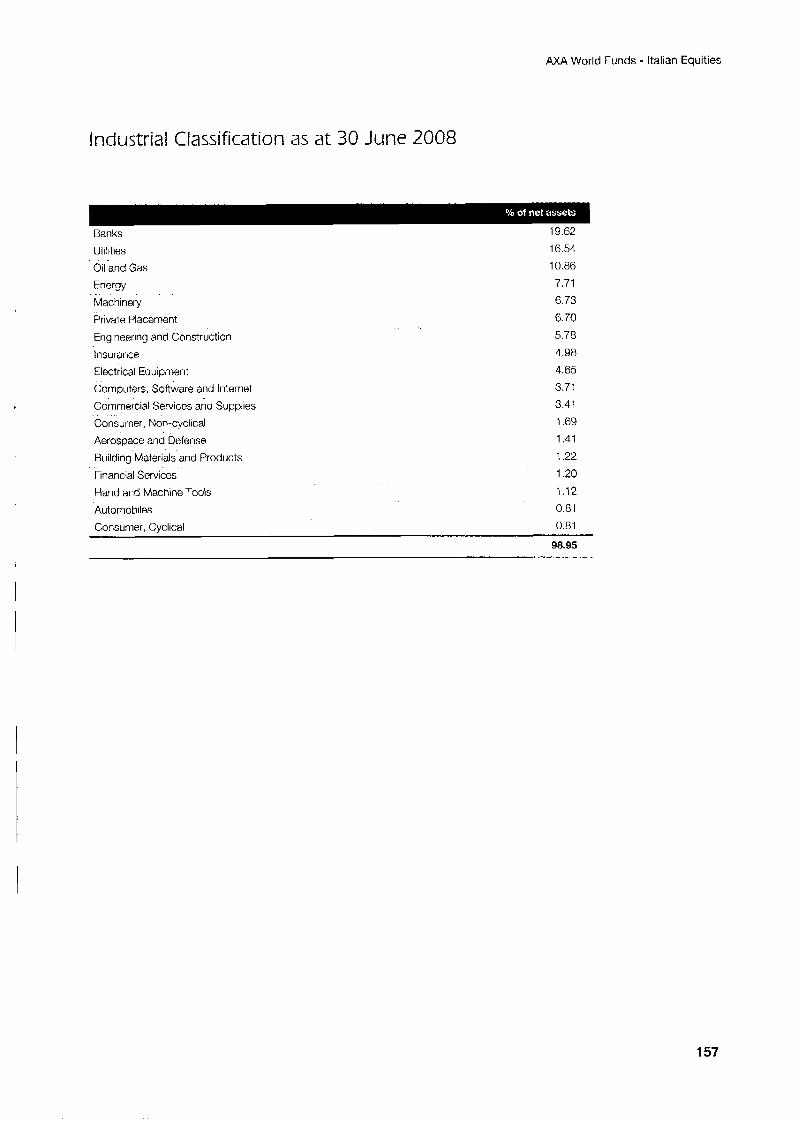
AXA World Funds - Italian Equities
Industrial Classification as a t 30 June 2008
Banks 19.62
Utilities
Oil and Gas
Energy
Machinery
Private Placement
Engineering and Construction
Insurance
Electrical Equipment
Computers. Software and Internet
Commercial Services and Supplies
Consumer, Non-cyclical
Aerospace and Defense Building Materials and Products
Financial Services
Hand ard Machine Tools
Automobiles
16.54 10.86 7.71 6.73 6.70 5.78 4.98 4.65 3.71 3.41 1.69 1.41 1.22 1.20 1.12 0.81
Consumer, Cyclical 0.81
98.95
1 57
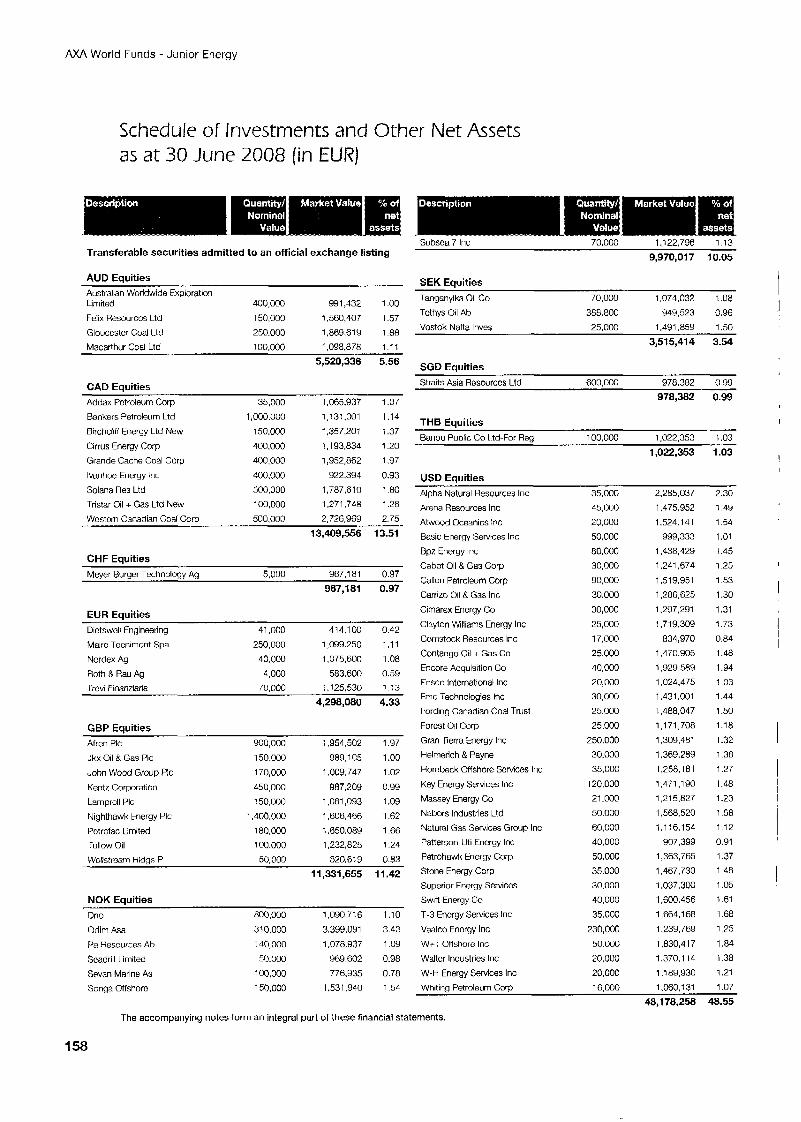
AXA World Funds - Junior Energy
as at 30 June 2008 (in EUR)
1,122,796 1.13 Subsca 7 Inc 70,000 Transferable securities admitted to an official exchange listing
AUD Eauities Australian Worldwide Fxploration Limited 400,000 991,432 1.00
Felix Resourccs Ltd 150,000 1,560,407 1.57 Glouccster Coal ILtd 250.000 1,869,618 1.88 Macarthur Coal Ltd 100,000 1,098,878 1 .I 1
5,520,336 5.56
CAD Equities Addax Pctroleum Corp 35,000 1,065,937 1.07 Bankers Petroleum Ltd 1,000.000 1,131,001 1.14 Birchcliff Energy Ltd New 150,000 1,357,201 1.37
Cirrus Energy Corp 400,000 1,193,830 7.20 Grande Cache Coal Corp 400.000 1,952,862 1.97
Ivanhoe Energy Inc 4UG.000 922.394 0.93 Solana Res Ltd 500,000 1,787.610 1.80 Tristar Oil + Gas Ltd New 100,000 1,271,748 1.28
Wcstcm Canadian Coal Corn 500.000 2.726.969 2.75 13,409,556 13.51
CHF Eauities Meyer Burger Technology Ag 5.000 967,181 0.97
967,181 0.97
EUR Equities Dietswell Engineering 4 1,000 414,100 0.42
Marc Tccnimont Spa
Nordex Ag Roth 8 Rau Ag Trcvi Finan71aria
250,000 1,099.250 1.1 1
40,000 1,075,600 1.08 4,000 583.600 0.59
70.000 1.125.530 1.:3
4,298,080 4.33
GBP Eauities Afren PIC
Jkx Oil 8 Gas PIC
John Wood Group f'lc Kent7 Corporation
Lamprcll PIC
Nighthawk Energy PIC Pctrofac Limited
Tullow Oil
900,000
150.000 170,000
450,000 7 50,000
1,400,000 iao,ooo 100,000
1,954,502
9a9.105 1,009,747
987.209 1,081,093
1,606.466 1.650.089 1,232,825
1.97 1 .oo 1.02 0.99
1.09 1.62
1.66 1.24
Wcllstream Hldgs P 50,000 820,619 0.83 1 1,331,655 11.42
NOK Equities Dno 800,000 1,090,716 1.10
Odim Asa 310,000 3,399,091 3.43
Pa Hesources Ab 140,000 1,078.937 1.09
Seadrill I imitec 50.000 969,602 0.98
Swan Marine As 100,000 776,935 0.78
Songa Offshore 150.000 1,531,940 1.54
9,970,017 10.05
SEK Equities Tanganyika Oil Co 'Tethys Oil Ab
Vostok Nafta lnves
Schedule of Investments and Other Net Assets
The accompanying notes form an integral part of these financial statements.
70,000 1,074,032 1.08
388.800 949.523 0.96 25.000 1.491.859 1.50
3,515,414 3.54
SGD Equities Straits Asia RQSOurCCS Ltd 600,000 978.382 0.99
978,382 0.99
THB Equities Eanpu Public Co Ltd-For Reg 100,000 1,022,353 1.03
1,022,353 1.03
USD Eauities ~~ ~~ ~
Alpha Natural Resources Inc 35,000 Arena Resources Inc
Atwood Oceanics Inc
Basic Energy Services Inc
Bpz Energy Inc
Cabot Oil & Gas Corp
Callon Petroleum Corp
Carrizo Oil 8 Gas Inc
Cimarox Energy Co
Clayton Williams Energy Inc
Cornstock Resources Inc Contango Oil + Gas Co
Encore Acquisition Co
Cnsco lntcrnational Inc
Frnc Technologies Inc
Fording Canadian Coal Trust
Forest Oil Corp
Gran T'ierra Energy Inc Helrnerich 8 Payne
Hombeck Offshore Scrvices Inc
Key Energy Services Inc
Massey Energy Co
Nabors Industries Ltd
Natural Gas Services Group Inc
Patterson-Uti Eneryy Inc
Petrohawk Energy Corp
Stone Energy Corp
Superior Energy Servicos
Swift Energy Co T-3 Encrgy Services Inc
Vaalco Encrgy Inc
W+T OffshorQ Inc
Walter Industries Inc
W-H Energy Services InC
45.000 20,000
50,000
80,000 3C,OOO
90,000 30.000
30,000 25,000
17,000 25.000 40,000 20,000 30,000 25.000 25.000
250,000 30,000 35,000
120,000 21,000 50,000 60.000 40,000 50.000
35.000 30,000
40,000 35.000
230,000 50.002 20,000 20,000
2,285,037 1,475,952
1.524.141 999,333
1,438,429 1,241,674 1,519,951 1,286,625 1,297,291
1.719.309 834,970
1,470,905 1,929,589 1,024.475 1,431.001 1,488,047 1 , I 71,708 1,309,481
1,369,289 1 .75a.181
1,471,190 1,215,827
1,568,520 1 .I 16,154
907,399 1,363,765 1,467,730
1.037.300 1,600,456
1.664.168 1,239,769
1,830,417 1,370,114 1,189,930
~~
2.30 1.49 1.54
1.01 1.45
1.25 1.53 1.30
1.31 1.73
0.84 1.48
1.91 1.03 1.44 1.50 1.18 1.32 1.38
1.27 1.48
1.23 1.58 1.12 0.91 1.37 1.48 1.05 1.61 1.68
1.25
1.84 1.38
1.21
Whiting Petroleum Corp 16,000 1,060,131 1.07 48,178,258 48.55
1 i
I
! I
1
1
1 1 !
1 58
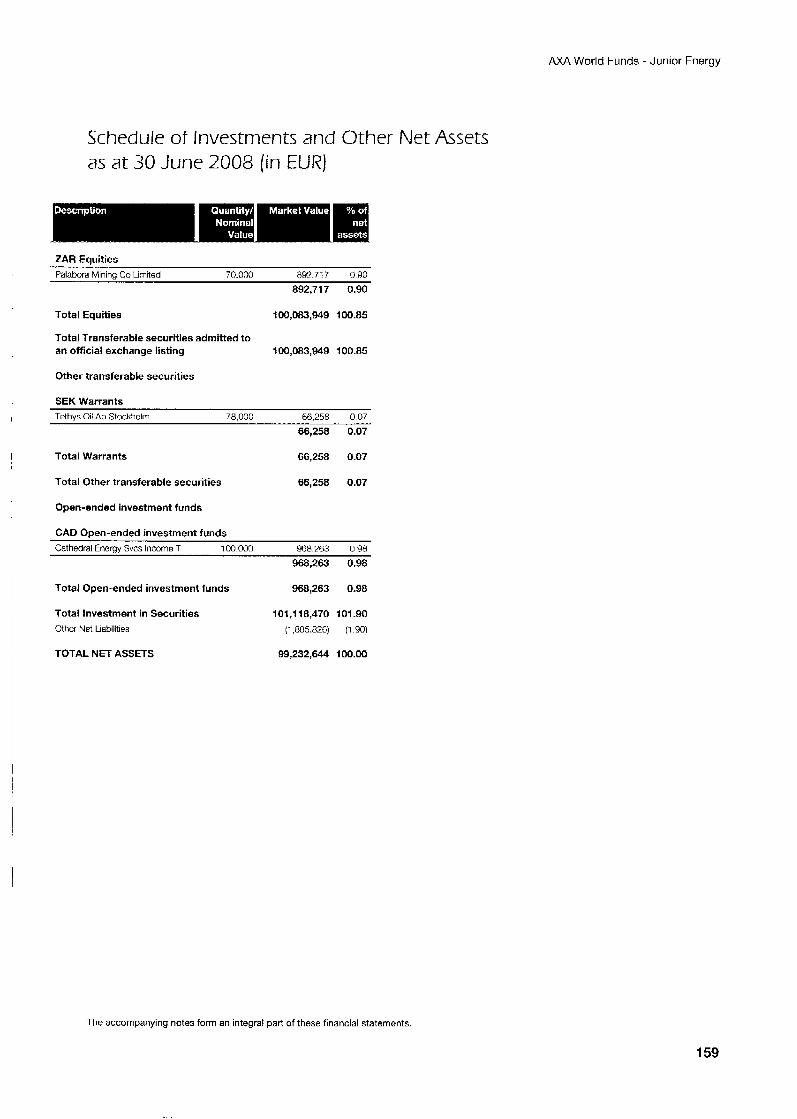
AXA World Funds -Junior Energy
Schedule of Investments and Other Net Assets as at 30 June 2008 (in EUR)
ZAR Equities Palabvra Mining Co Limited 70.000 892.7’7 090
892,717 0.90
Total Equities 100,083,949 100.85
Total Transferable securities admitted to an official exchange listing 100,083,949 100.85
Other transferable securities
SEK Warrants Tethvs Oil Ab Stock7oIm 78.000 66.258 0.07
Total Warrants
Total Other transferable securities
Open-ended investment funds
CAD Open-ended investment funds
66,258 0.07
66,258 0.07
66,258 0.07
Cathedral Energy Svcs liicome T 100.000 968,763 098 968,263 0.98
Total Open-ended investment funds 968,263 0.98
Total Investment in Securities i o i , i 18,470 101 .go Othcr Net Liabilities (1,885.826) (1.90)
TOTAL NET ASSETS 99,232,644 100.00
The accompanying notes form an integral part of these financial statements.
159
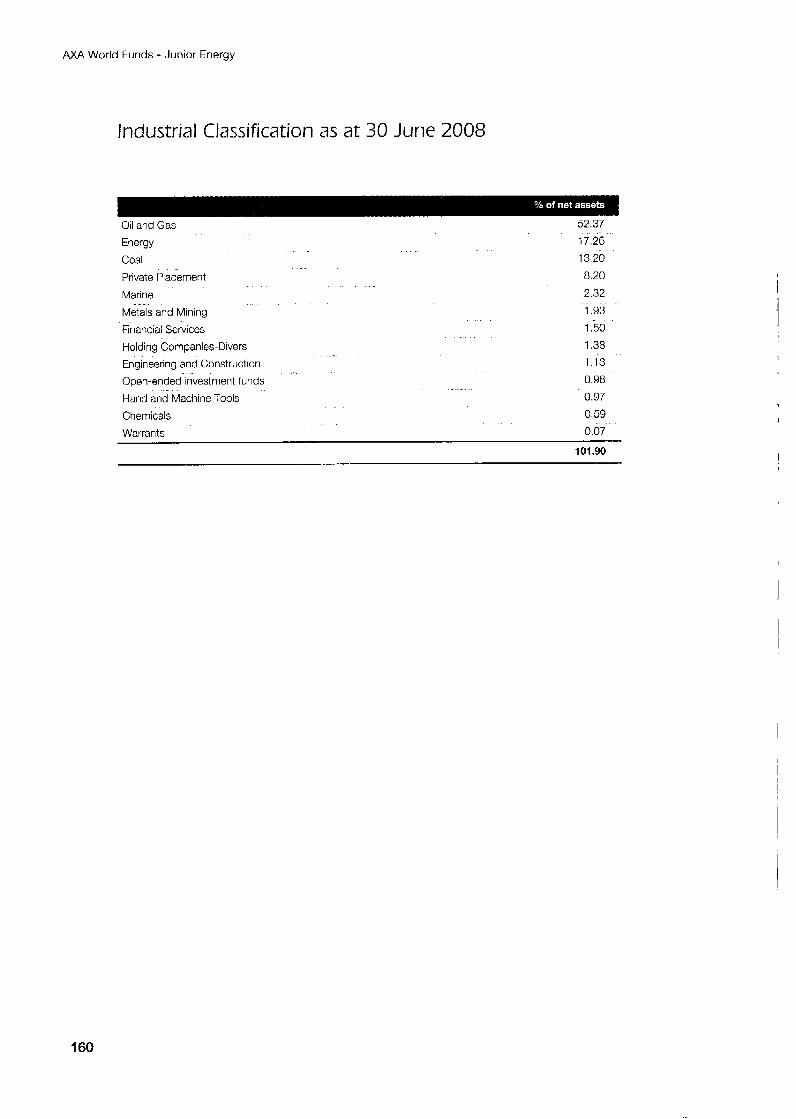
AXA World Funds - Junior Energy
Industrial Classification as at 30 June 2008
Oil and Gas
Energy
Coal
Private Placement
Marine
Metals and Minlng
Financial Services
Holding Companies-Divers
Engineering and Construction
Open-ended investment funds
Hand and Machine Tools
Chemicals Wnrrmk
52.37
17.26
13.20
8.20
2.32 1.93
1.50
1.38
1.13
0.98
0.97 0.59
0.07 . . -. , -. . .- 101.90
I
I
160
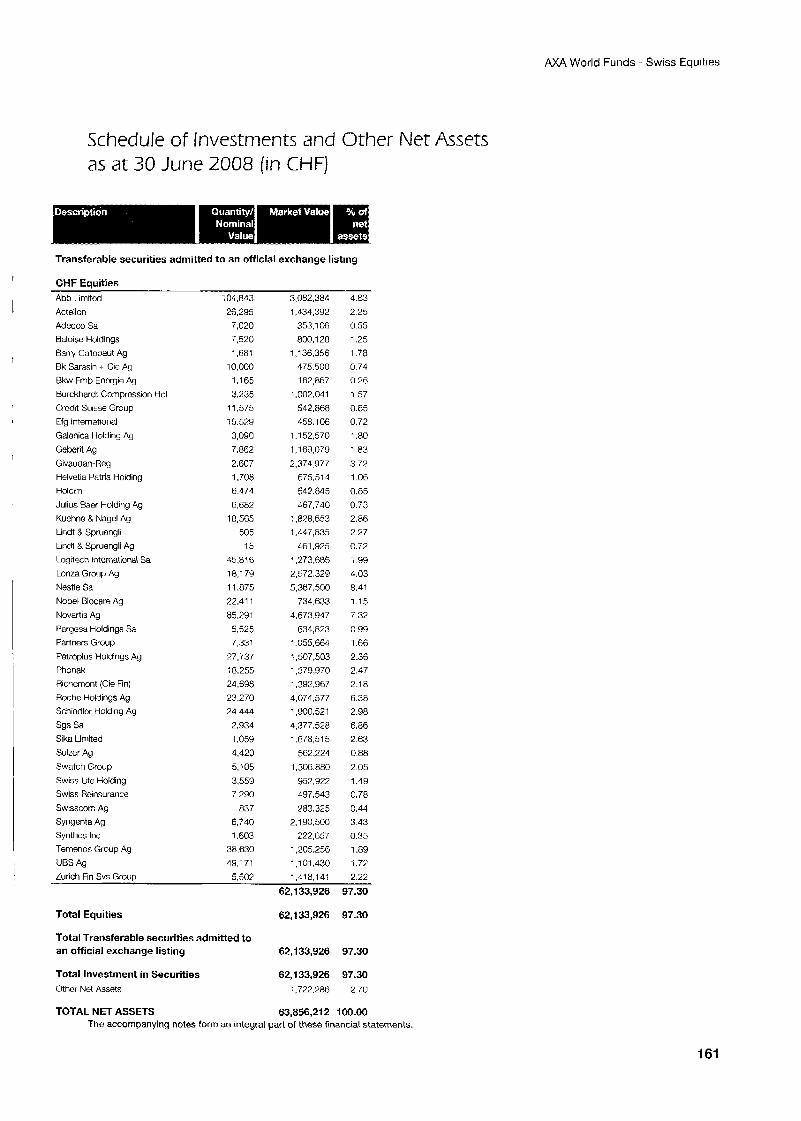
AXA World Funds - Swiss Equities
Schedule of Investments and Other Net Assets as at 30 June 2008 (in CHF)
Transferable securities admitted to an official exchange listing
CHF Equities Abb Limltcd Actelion Adecco Sa Baloise Holdings Earv Callobaut Ag Bk Sarasin + Cie Ag Bkw Fmb Encrgio Ay Burckhardt Compression Hol Crcdit Suisse GrouF Cfg International Galonica Holding Ag Geberit Ag Givaudan-Reg Helvetia Patria Holding Holcim Julius Baer Holding 49 Kuchnc & Nagel Ag Lindt 8 Spruengli Lindt B Spruengli Ag Logitech international Sa Lonta Group Ag Nestle Sa Nobel Riocare Ag
Novartis Ag Pargesa Holdings Sa Partners Group PQtrOplUS Holdings Ag Phonak Hichcmont (Cie Fin) Roche Holdings Ag Schindlcr Holding Ag Sgs Sa Sika Limited Sulzer Ag Swatch Group Swiss Cite Holding Swiss Hcinsurance
Swisscom Ag Syngcnta Ag Synthes Inc Ternenos Group Ag UBS Ag Zunch Fin Svs Grow
: 04.843 26,295
7,C20 7.520 1.681
10,000 1,165 3,235
11,575 15.529 3,090 7,862 2.607 1.708 6.171 6.682
18,565 505
15 45.816 18,179 11.875 22.41 1
85,291 5.525 7,331
27.737 i8.255 24,698 23.270 24.444
2,934 1.059 4,420 5,105 3.559 7.290
837 6,740 1.603
38.630 49,171 5.507
3.082.384 1.434.392
353,l OFj
800.1 28 1,136,356
475.500 162,867
1.002.04 1 542,868 458.106
1,152,570 1,169.079 2,374 977
549.845
: .a78.653
675.51 4
467,740
,447,835 461,925
1,273 685 2,572 329 5,367.500
734.633 4.673.947
634,823 1 055,664 1,507,503 1,579,970 1,392,967 4,074.577 1,900,521 4,377.528 1,678,515
562,224 1.306.880
Y57,922 497.543 783.325
2.1 90.500 222,657
1.205.256 1,101,430 1418.141
4.83 2.25 0.55 1.25 1 78 0.74 0 26 1 5 7 0 85 0 72 1.80 1.83 3.7% 1.06 0.85 0 73 2.86 2 27 0.72 1 99
4.03 8.41 1.15 7.32 0.99 1.66 2.36 2.47 2.1 8 6.38 2.98 6.86 2.63 0.88 2.05 1.49 0.78 0.44 3.43 0.35 1.89 1.7> 2.22
62,133,926 97.30
Total Equities 62,133,926 97.30
Total Transferable securities admitted to an official exchange listing 62,133,926 97.30
Total Investment in Securities 62,133,926 97.30 Othcr Net Assets i,722.286 2.7U
TOTAL NET ASSETS 63,856,212 1OO.OO The accompanying notes form an integral part of these financial statements.
161
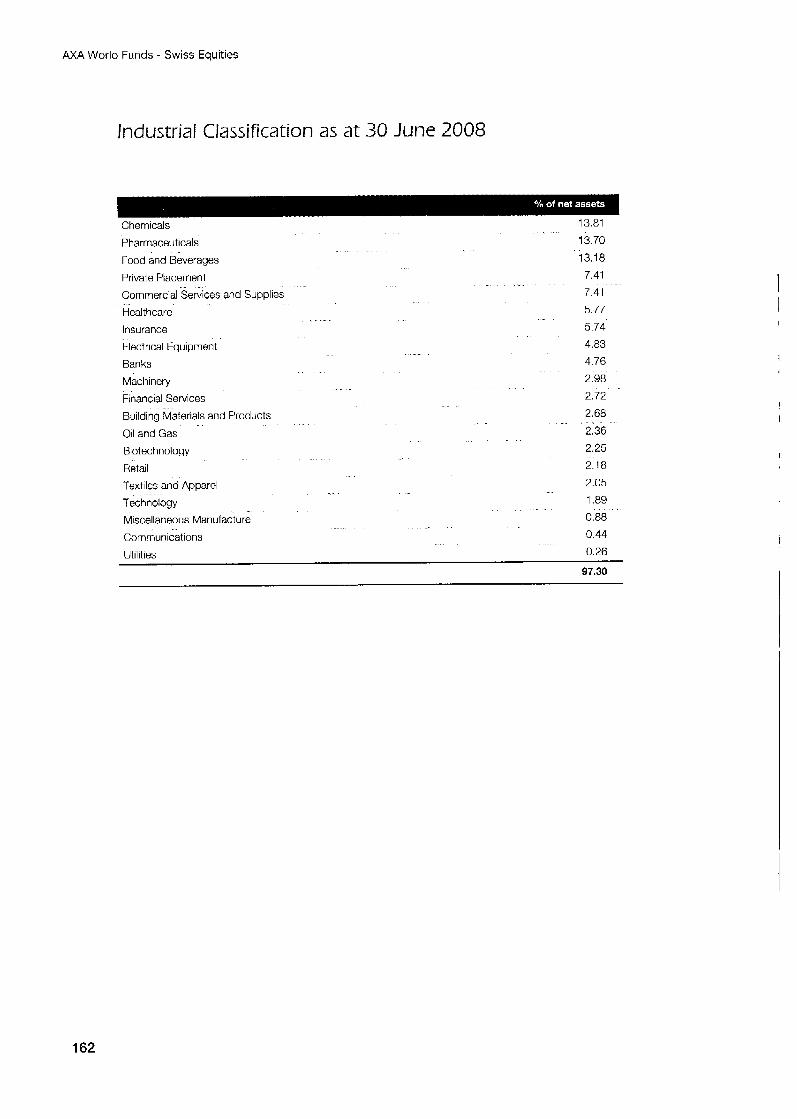
AXA World Funds - Swiss Equities
Industrial Classification as at 30 June 2008
Chemicals 13.81
Pharmaceuticals
Food and Beverages
Private Placement
Commercial Services and Supplies
Healthcare
Insurance
Electrical Equipment
Banks
Machinery
Financial Services
13 70
13.18 7.41
7.41
5.77
5.74
4.83
4.76
2.98
2.72
Building Materials and Products 2 68
Oil and Gas 2"36 Biotechnology 2.25
Retail 2.18
Textiles and Apparel 2.05
Technology 1 89
Miscellaneous Manufacture 0 88
Communications 0.44
Utilities 0.26
97.30
I
I
162
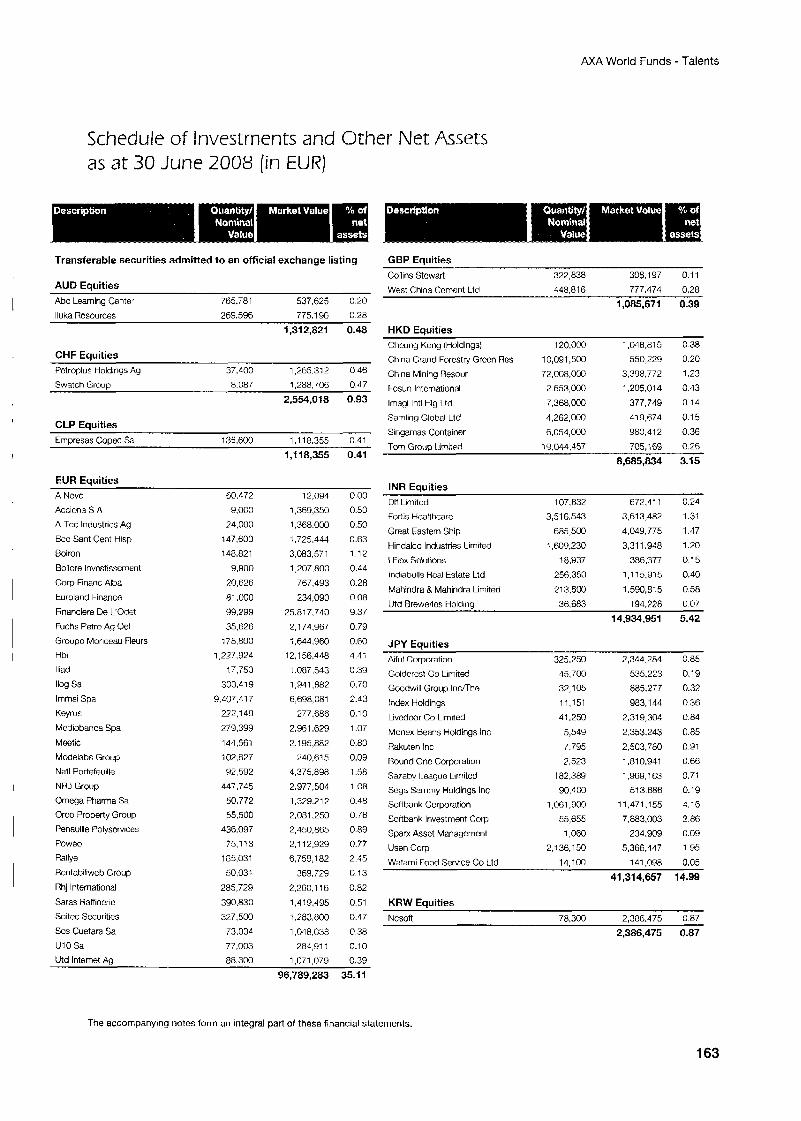
AXA World Funds - Talents
Schedule of Investments and Other Net Assets as at 30 June 2008 (in EUR)
Transferable securities admitted to an official exchange listing
AUD Equities Abc Learning Cente 765.781 537,625 0.20
lluka Rcsources 269.596 775.196 0.28
GBP Equities Collins Stcwart 322,838 308,197 0.11
West China Cement Ltd 448.816 777.474 0.28
1,085,671 0.39
1,312,821 0.48
CHF Eauities Pctroplus Holdings Ag Swatch Crmm
37.400 1,265.312 0 46 H OH7 1788 706 047
2,554,018 0.93
CLP Eouities ~~~
Emaresas Coo% Sa 135.600 1.118.355 041
I ,I 18,355 0.41
EUR Eauities A Novo
Acciona S A
A-Tec Industries Ag Bco Sant Cent Hisp
Boiron
Bollore Invcstisscmerit
Corp Financ Alba Euroland Finance
Financiere De IL'Odet
Fuchs Petro Ag Oel
Groupc Monceau Fleurs Hbi Iliad
llog Sa lmmsi Spa
Keyrus
Mediobanca Spa
Meetic
Mcdelabs Group Natl Portefeuille
NRJ Group
Omega Pharma Sa Orco Property Group
Penauille Polyscrvices
Poweo
Rallye
Rentabiltwcb Group
Rhj International
Saras Haffinerie
Soitec Securities
Sos Cuetara Sa U10 Sa
60,472
9,000
24,000 147,600
148,821
9,900
20,626
81.000
99,2YY 35,626
176,800
1,227,924
17,750
303.41 9 9,407.41 7
222,149
279,399
144,561 102,827
92,592
447.7t5
50,772
55,500 436,097
75.113 185,031
50,03:
285,729
390.830
327,500
73,034
77,003
12,094
i ,369,350
1.368.000
1,725,444
3,083.571 1,207.800
767,493
234,090
25.817.740
2,174,967
i ,644,960 12,156,448
1,087,543 1,941,882
6,698,081
277,686
2,961,629
2.1 95,882
240,615 4,375.898
2,977,504
1,379.21 2 2,081,250
2,450,865 2,112,929
6,759,182
369,729
2.260.1 16
1,419,495
1,183,800
1,048.C38 284,911
1,071,079
0.00 0.50
0.50
0.83
1.12
0.c4
C.28 0.08
9.37
0.79
0.60 4.4;
0.39
0.70 7.43 0.10
1.07
0.80
0.09
1.58
1.08
0.48 0.76
0.89 0.77 2.45
0.13
0.82
0.51
0.47
0.38 0.1 0
Utd Internet Ap 88.300 0.39
96,789,283 35.1 1
HKD Eauities Ctrcuny Kong (Holdings) 120,000 1,048.81 5 0.38 China Grand Forcstry Grccn nos 10,091,500 550,229 0.20
China Mining Resour 72.008.000 3,398,772 1.23 Fosun lntcrnational 2.553.000 1,205.01 4 0.43
lmagi lntl Hlg Ltd 7,368,000 377,749 0 14
Samlinp Global Ltd 4,262,000 419.674 0.15
Singamas Container 6,054,000 960,412 0.36
Tom Group Limited 13,044,457 705,169 0.26
8,685,834 3.15
INR Equities Dlf hmitod
Fortis Healthcarc
Great Fastem Ship Hindalco Industries Limited
I Flcx Solutions
lndiabulls Rcal Estate Ltd
Mahindra 8 Mahindra Lirriited
l l td Breweries Holdina
107.832
3.516.543
685,500
1,609,230
18.937
256,350
P13.6CO 36.683
672,411 0.24 3,613,482 1.31
4,049.775 1.47
3,311 ,968 1.20
386,377 0.15 1,115,915 0.40
1,590,815 0.58
194228 0.07 14,934,951 5.42
JPY Eauities Aiful Corporation
Goldcrcst Co Limited
Goodwill Group Incnhe
325,250 2,344.284 0.85
45.700 535,223 0.19
32,105 885.277 0.32 11,151 983,144 0.36 Index Holdings
Livcdcor Co Limited 41,250 2,319,304 0.84
Monex Beans Holdings Inc 5,549 2,353,243 0.85 Rakuten Inc 7.795 2,503,780 0.91
Hound One Corporation
Suaby Ikague Lirnitcd Sega Sammy Holdings Inc
7.523 1,810,941 0.66
182,389 1.969.163 0.71 90.400 513.686 0.19
Sottbank Corporation 1,061 ,YO0 11,471,155 4.16 Softbank Investment Corp 55,655 7,883,003 2.86
Sparx Asset Management 1,060 234,909 0.09 Usen Corp 2,136,150 5,366,447 1.95
Watami Food Service Co Ltd 14,100 141,098 0.05
41,314,657 14.99
KRW Equities Ncsofl 7R.300 2.386.475 0.87
2,386,475 0.87
The accompanying notes form an integral part of these financial statements.
1 63
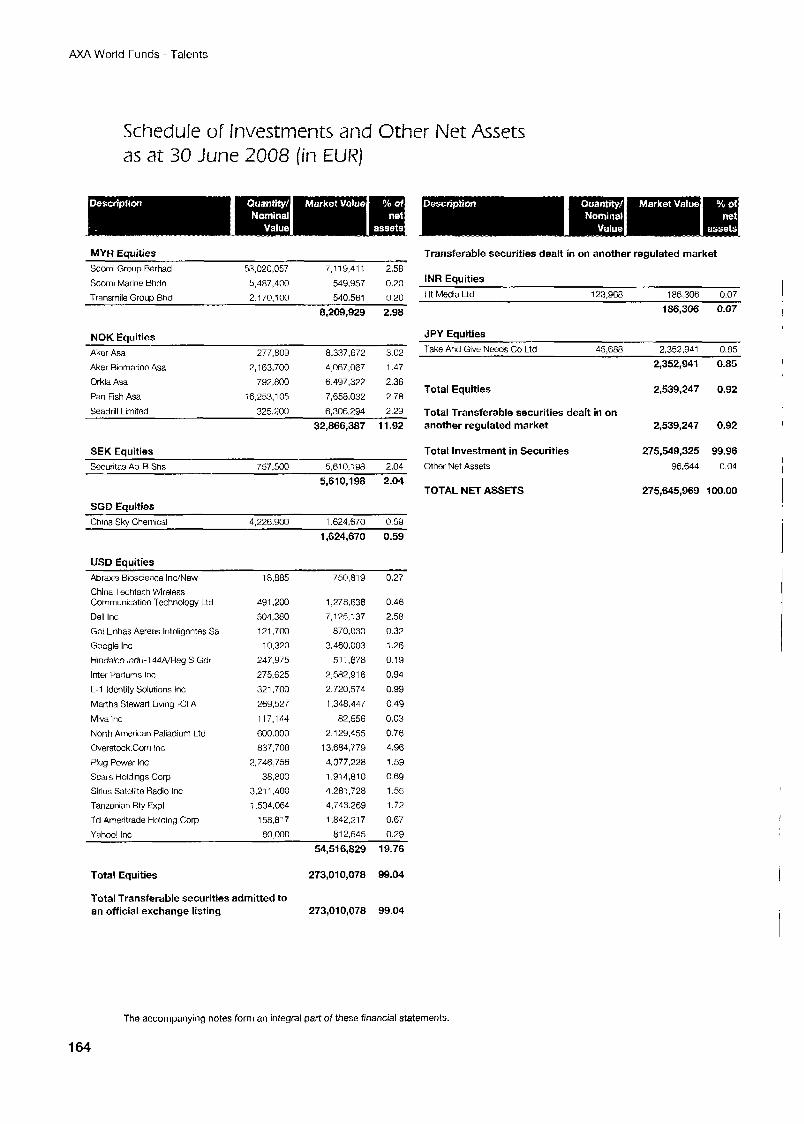
AXA World Funds - Talents
Schedule of Investments and Other Net Assets as at 30 June 2008 [in EUR)
MYR Eauities Transferable securities dealt in on another regulated market ~
Scomi Group Berhad 53 0207057 7,119,411 2.58
Scomi Marine Bhdn 5,487,400 549,957 0 2 0
Transrnilo Group Bhd 2.1 70,100 540.561 0.20
8,209,929 2.98
NOK Eauities Aker Asa
Aker Biomarinc Asa
Orkla Asa
Pan Fish Asa
Seadrill hmited
~ ~~
277,809 8.337.672 3 02
2,163.700 4,067,0E7 1 47
792.800 6,497,322 2 36 i6.253.105 7,658.032 2 78
325.200 6,306,294 2 29
32,866,387 11.92
SEK Equities Socuritas Ah-R Shs 757,500 5,610,198 2.04
5,610,198 2.04
SGD Equities China Sky Chemical 4,226.900 1.624,670 0.59
1,624,670 0.59
USD Equities Abraxis Bioscience IncMew 18.885 750,819 0.27 China Techfaith Wirdess Communication Technology Ltd
Dell Inc Go1 hnhas Aereas lritcligcntes Sa
Google Inc
Hindalco Indu-144NReg S Gdr
Inter Parfuns Inc L - l ldcntity Solutions Inc Martha Stewart Living -CI A
Miva lric
North American Palladium Ltd
Overstock Corn Inc
Plug Power Inc Scars Holdings Corp
Sirius Satellite Radio Inc Tanzanian Rty h p l
Td Amentrade Holding C o p
d91.200 504,380
121,700
10,320 247,975
275 625
321.700
269,527
117,lr4
600.000
837,708
2.746 756
38.800 3,211,400
i ,534,064
158.8'7
1,278.638 7.1 25,137
870,030
3.460.003
51 1.678
2,582,916
2,720,574
1,348.447
~2,556
i3.6a4.779
2.1 29,455
4,377,228
1,914,810
4,281.728
4,743.269
1.842.21 7
0.46
2.58
0.37 1.26
0.19
0.94
0.99
0.49
0.03
0.76 4.96
1.59 C.69
1.55 1.72
0.67
Yahoo! Inc 60.000 812.545 0.29
54,516,829 19.76
Total Equities 273,010,078 99.04
Total Transferable securities admitted to an official exchange listing 273,oio,o7a 99.04
INR Equities Ht Media Ltd 123.968 186.306 0.07
186,306 0.07
JPY Equities 1-ake And Give Neods Co Ltd 45,688 2,352,941 0.85
2,352,941 0.85 I
Total Equities 2,539,247 0.92
Total Transferable securities dealt in on another regulated market 2,539,247 0.92
Total investment in Securities 275,549,325 99.96 Other Net Assets 96,644 G.04
TOTAL NET ASSETS 275,645,969 100.00
The accompanying notes form an integral part of these financial statements.
1 64
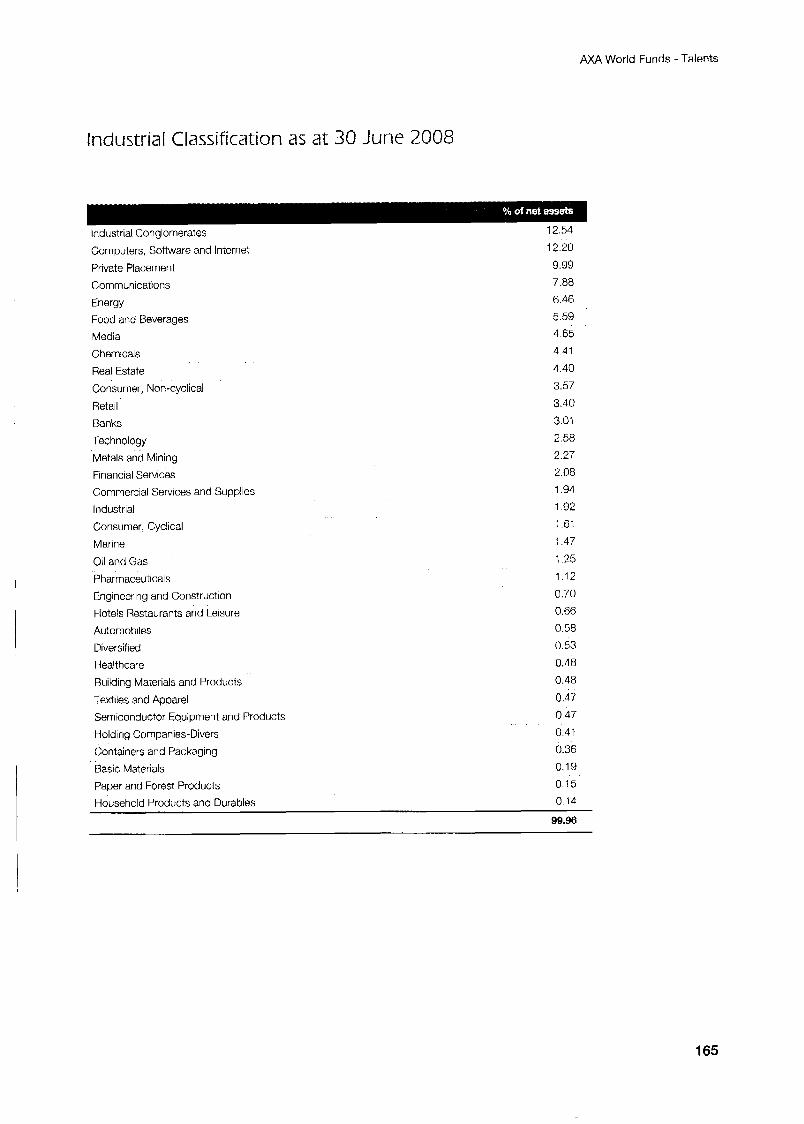
AXA World Funds - Talents
Industrial Classification as at 30 June 2008
Industrial Conglomerates
Computers, Software and Internet
Private Placement
Communications
Energy
Food and Beverages
Media
Chemlcals
Real Estate
Consumer, Non-cyclical
Retail
Banks
Technology
Metals and Mining
Financial Services
Commerzial Services and Supplies
Industrial
Consumer, Cyclical
Marine
Oil and Gas Pharmaceuticals
Engineer ng and Construction
Hotels Restaurants and Leisure
Automobiles
Diversified
Healthcare
Building Materials and Products
Textiles and Apparel
Semiconductor Equipment and Products
Holding Companies-Divers
Containers and Packaging
Basic Materials
Paper and Forest Products
12.54
12.20 9.99 7.88
6.46
5.59
4.65 4.41
4.40
3.57
3.40
3.01 2.58 2.27
2.08 1.94
1.92
1.61
1.47
1.25 1.12
0.70 0.66
0.58
0.53 0.48
0.48
0.47 0.47
0.41
0.36 0.19
0.15
Household Products and Durables 0.14
99.96
165
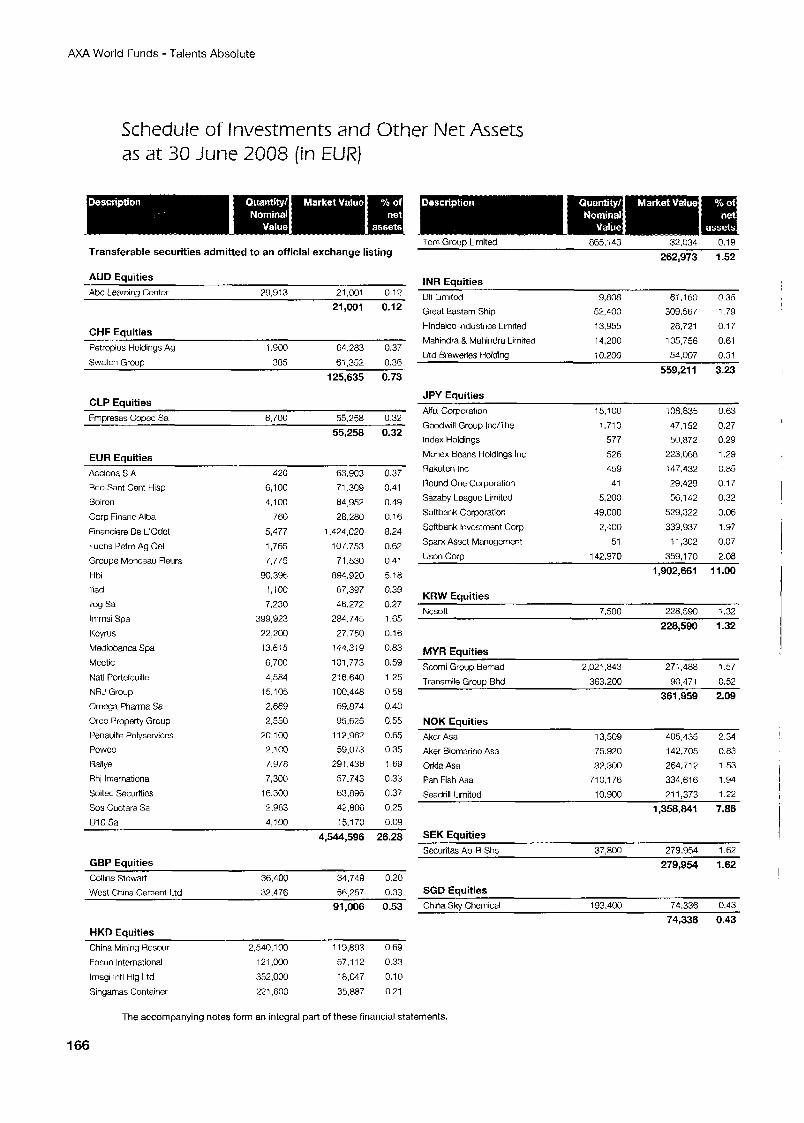
AXA World Funds - Talents Absolute
Schedule of Investments and Other Net Assets as at 30 June 2008 (in EUR)
Tom Grow Limited 865,143 32,034 0.19 Transferable secur i t ies admitted to an off ic ia l exchange listing
AUD Equit ies
Abc I earning Center PY.913 21,001 0.12 21,001 0.12
CHF Equit ies
Petroplus Holdings Ag 1.900 64.283 0.37 Swatch Grouo 385 61.352 0.36
125,635 0.73
CLP Eauities Fmpresas Copoc Sa 6,700 55,258 0.32
55,258 0.32
EUR Equit ies
Acciona S A 420 63,903 0.37 Rco Sant Cent Hisp
Boiron
Corp Financ Alba
Financiere De L‘Odct
Fuchs Petro Ag Oel
Grvupo Moiceau Fleurs
Hbi Iliad
lloy Sa
lmmsi Spa
Kcyrus
Meetic
Natl Portefeuille NRJ Group
Orriega Phanna Sa
Orco Property Group
I’enauille Polysetviccs
POWCO
Hallye
Rhj Internztiunal
Soitec Securitics
Sos Cuctara Sa U10 Sa
Mediobanca Spa
6,100 4,100
760 5,477 1
1,765
7.775 90.396
1,100 7,230
399,923 22,200
13.615
6,700 4,584
15,105
2.669 2,550
20,100 2,lCO
7.978 7,3Go
16,300 2,983
4.100
71.3C9 84,952
28,280 ,424,020 107,753
71,530 894.920 67.397 46,272
284.745 27.750
144,319 101,773
2:6.640 100.4L8 69.874
95.625 112,962
59,073 291,436
57.743 63.896 42.806
15.170
0.41 0.49
0.16 8.24 0.62 0.41
5.18 0.39
0.27 1.65
0.16
0.83
0.59 1.25
0.58 0.40 0.55 0.65 0.35 1.69
0.33 0.37 0.25 0.09
4,544,596 26.28
GBP Eauit ies
Collins Stowart 36.400 34.749 0.20 Wcst China Cement Ltd 32,476 56.257 0.33
91,006 0.53
HKD Equit ies
China Mining Resour 2,540,100 119.893 0.69 Fosun International 12i,OOO 57,112 0.33
lrnagi lntl Hlg Ltd 352,000 18.047 0.10
Sinyarnas Container 221,600 35,887 0.21
262,973 1.52
INR Equities Olf Limitod 9,808 61,160 0.35 Great Eastern Ship 52,400 309,567 1.79
13,955 28.721 0.17 Hindalco lndustrtcs Limited
Mzhindra B Mahindra Limited 14.200 105,756 0.61 Utd Breweries Holdina 10.200 54007 0.31
559,211 3.23
JPY Equit ies
Aful Corporatron
Goodwill Group Inc/The Index Holdings
Monex Bcans Holdings Inc
Rakutcn Inc
Round One Corporation
Sazaby Loaguc Limited
Softbank Corporation
Softbank lnvcstment Corp
Sparx Assct Management
15,100 1.71 0
577 526
459 41
5,200 49,000
2,400
51
108,835 47,152 50.872
223,068
147.432 29.429 56,142
529,322
339,937 11,302
0.63 0.27 0.29 1.29
0.05 0.17
0.32 3.06 1.97
0.07
Usen Coru 142.370 359,170 2.08
1,902,661 11.00
KRW Equities Ncsoft 7,500 228.590 1.32
228,590 1.32
MYR Equities Scomi Group Berhad 2,021,843 271,488 1.57 Transmile Grouu Bhd 363,200 90,471 0.52
361,959 2.09
NOK Equit ies
Akcr Asa 13:509 405,435 2.34 Aker Biomarinc Asa
Orkla Asa
Pan Fish h a
Seadrill Limited
75.920 142,705 0.83 32,300 264,712 1.53
710,176 334,618 1.94 211.373 1.22 10.900
1,358,841 7.86
SEK Eauities ~~ ~
Sccuritas Ab-R Shs 37.800 279,954 1.62 279,954 1.62
SGD Equities China Sky Chemical 193,400 74,336 0.43
74,336 0.43
The accompanying notes form an integral part of these financial statements.
1 66
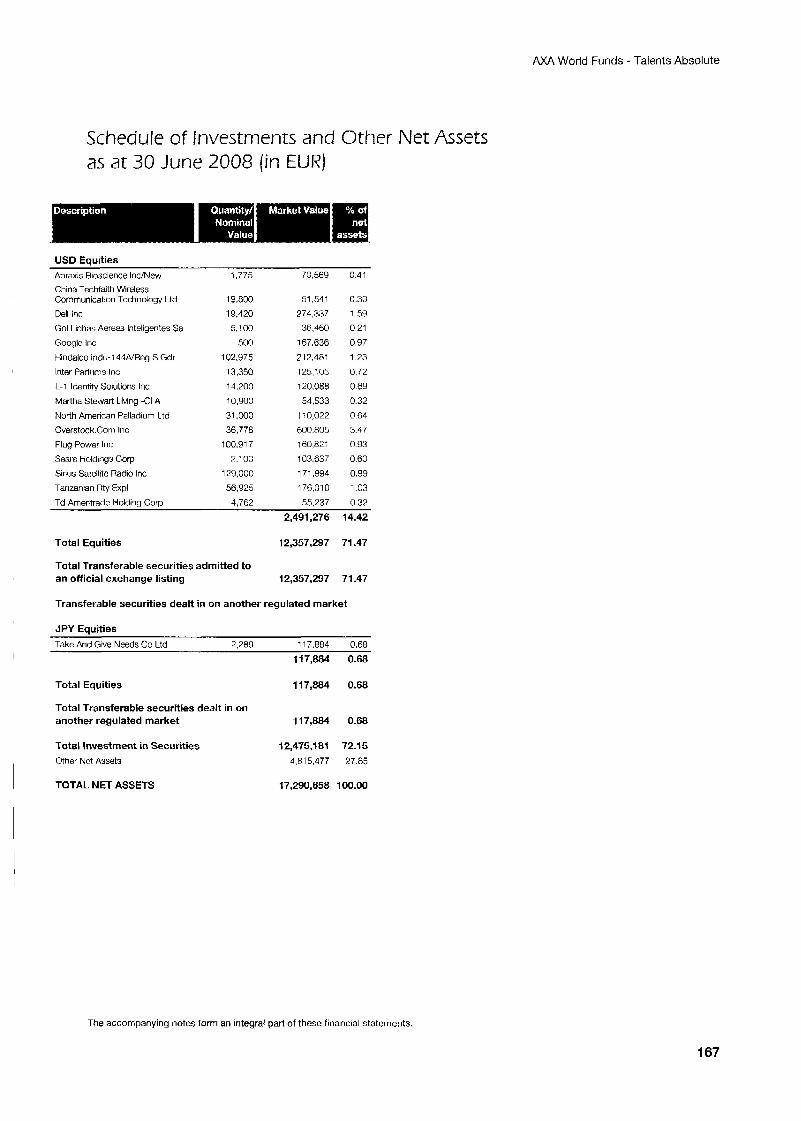
AXA World Funds - Talents Absolute
Schedule of Investments and Other Net Assets as at 30 June 2008 (in EUR)
USB Equities Ahraxis Bioscience Inc/New China Techfaith Wireless Communication Technology Ltd Dell Inc
Go1 Linhas Aerwas lnteligentes Sa
Googlc Inc
Hindalco Indu-144A’R’nEg S Gdr
Inter Partums Inc L-l Identity Solutions Inc
Martha Stewart Livirg -CI A
North American Palladium Ltd Overstock.Com Inc
Plug Power Inc Sears tioldings C o p
Sinus Satellite Radio Inc Tarrzdnian Rty Expl
1,775 70,569 0.41
19.800 19.420 5,100
500 102,975
13,350 11.200
10,900 31.000 36,778
100,917 2.10G
129,000 56,925
51,541 0.30 274.337 1 5 9
36.460 0.21 167.636 0.97
212.481 1.23 125,105 0.72
120.088 069 54,533 032
1-0,022 C64 800.805 3.47 160,82: 0 9 3 103,637 060
171,994 0.99
176,010 1 0 3 Td Arneritrade Holdiig Cow 4,762 55,237 0.32
2,491,276 14.42
Total Equities 12,357,297 71.47
Total Transferable securities admitted to an official exchange listing 12,357,297 71.47
Transferable securities dealt in on another regulated market
JPY Equities Take And Give Needs Co Ltd 2.289 117.884 0.68
I 117,884 0.68
Total Equities 117,884 0.68
Total Transferable securities dealt in on another regulated market 117,884 0.68
Total Investment in Securities Gther Net ASS&
I TOTAL NET ASSETS
12,475,181 72.15 4,815.477 97.85
17,290,658 100.00
The accompanying notes form an integral part of these financial statements.
167
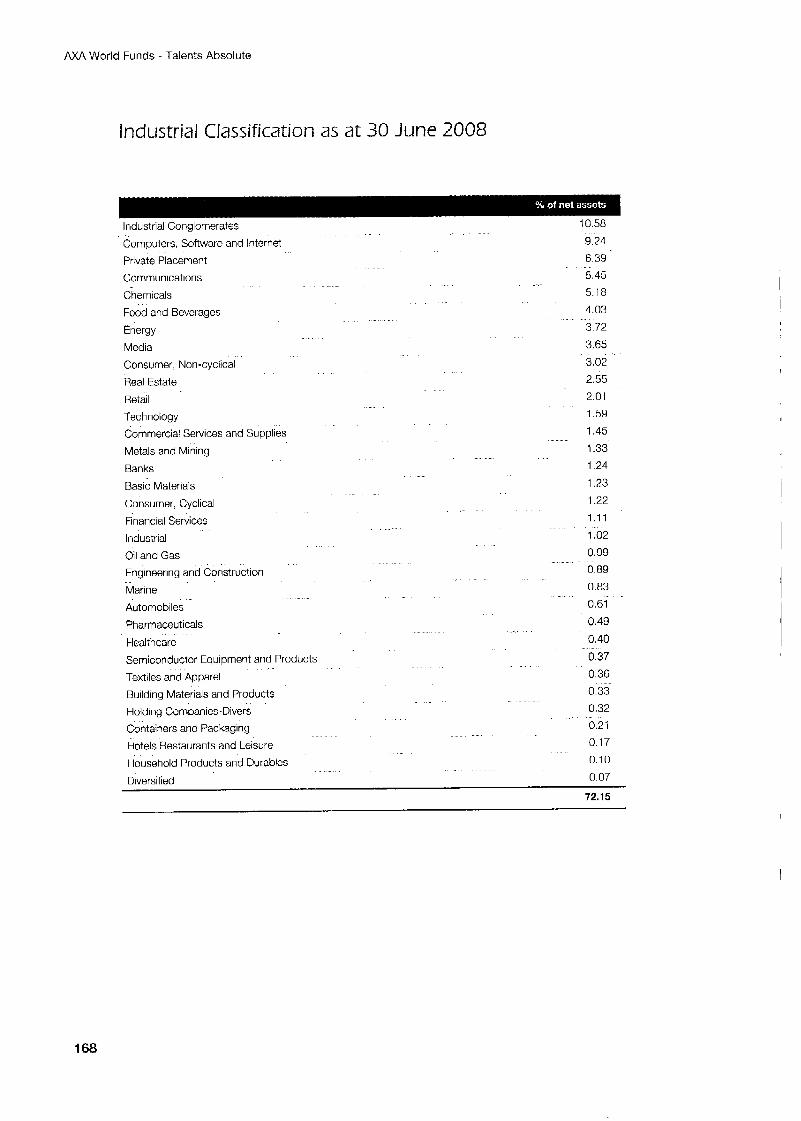
AXA World Funds - Talents Absolute
Industrial Classification as at 30 June 2008
Industrial Conalomerates 10.58 - Computers, Software and Internet 9 21 Private Placement 6 39
5 45 Communications Chemicals 5.18
Food and Beverages 4.03
Energy 3 72
Media 3.65
""_
Consumer, Non-cyclical 3 02
Retail 2.01
Commercial Services and Supplies 1.45
Metals and Mining 1.33
Real Estate 2.55
Technology 1.59
Banks 1 24
Basic Materials 1 23 Consumer, Cyclical 1 22
Financial Services 1.11
Industrial 1.02
Oil and Gas 0.99
Engineering and Construction 0 89
Marine 0.83
Automobiles 0.61
Pharmaceuticals 0.49
Healthcare 0.40
Semiconductor Equipment and Products 0 37 Textiles and Apparel 0 36
Building Materials and Products 0 33 Holding Companies-Divers 0 32 Containers and Packaging 0.21
Hotels Restaurants and Leisure 0.17
Household Products and Durables 0 10 Diversified 0 07
72.15
I
168
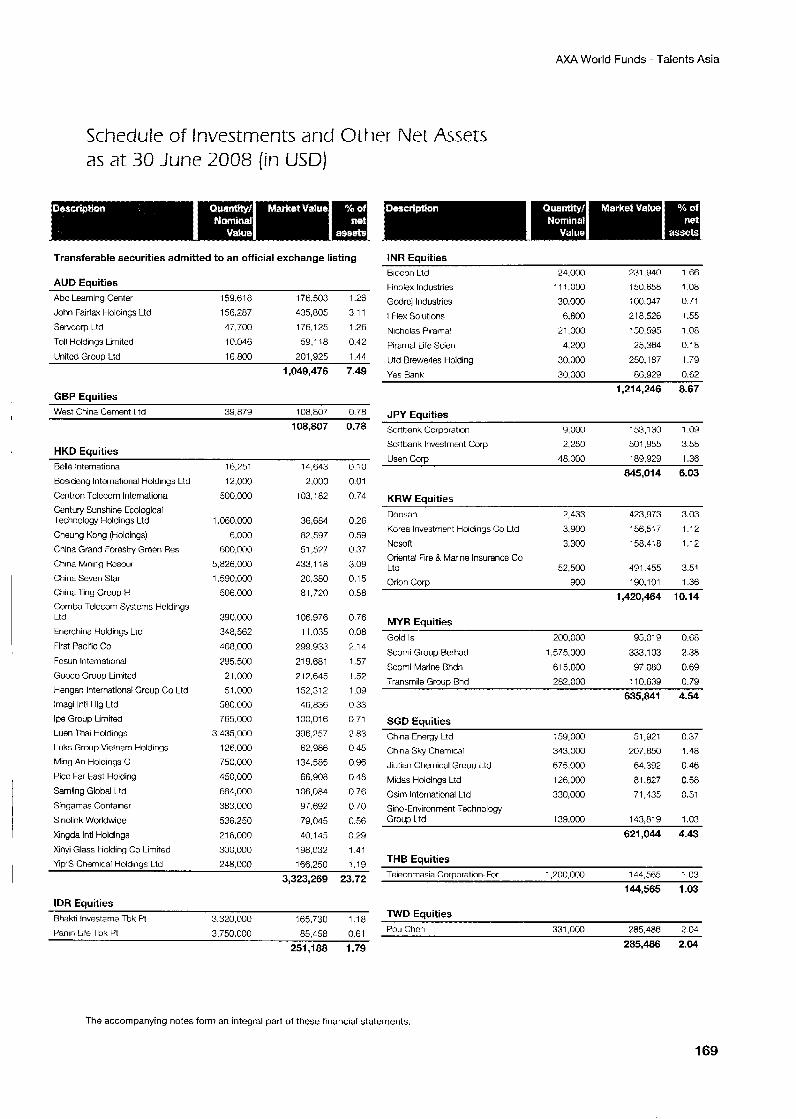
AXA World Funds - Talents Asia
Schedule of Investments and Other Net Assets as at 30 June 2008 (in USD)
Transferable securities admitted to an official exchange listing
AUD Equities Abc Learning Center 159.61 8 176.5U3 1.26 John Fairfax Holdinss Ltd 156,287 435,805 3 1 1
Servcorp Ltd 47,700 176.125 1.26
Toll Holdings Limitcd 10 .04 59,1i8 0.12 Unitcd Group Ltd 16 800 201,925 1.44
1,049,476 7.49
GBP Eouities
INR Eauities Biocon Lid Finolex Industries
Godrcj Industrics
I Flex Solutions
Nicholas Piramal
Piramal Life Scien
Utd Breweries Holding
24,000 231.Y40 1.66 111.ocQ 150,658 1.08 30,000 100,047 0.71 6,800 218,526 1.55
21,000 150,595 1-08 4,200 25,364 0.18
30.000 250.187 1.79 Yes Rank 30,000 86,929 0.62
1,214,246 8.67
'O85o7 0 78 JPY Equities West China Cement L td 39,879
108,807 0.78 L 9,000 153,130 1 0 9 Softbank Investment Corp 2,250 501,955 3.58 I ken Cnrn nnn 189979 136
HKD Equities Bclle lriternationa
Bosidcng Intorriationdl Holdings Ltd
Centron Tclccom lntcrnationa Century Sunshine Ecological Technology Holdings Ltd
Cheung Kong (Holdings)
China Grand Forostry GrQQri Res
China Mining Rcsour
China Seven Star China l.ing Group t4 Cornba Telecom Systems Holdings Ltd Enerchina Holdings Ltd
First Pacific Co Fosun International
Guoco Group Limitcd Hengan International Group Co ILtd
lmagi Inti Hlg Ltd Ipe Group Limited
Luen f ha1 Holdings
Luks Group Vietnam Holdings
Ming An Holdings C
Pic0 Far East Holding
Samling Global I.td
Singamas Container
Sinolink Worldwide
Xingda lntl Holdings
Xinyi Glass tiolding Co ILimited
Yia'S Chemical Holdinas Ltd
16.751 12,000
500 000
1.060.000
6,000 600.000
5,826.000
1.590.000 506 000
390,000 348.562
A68.000
P95.500 21.000 51,000
580.000
765,000 3.435,OOO
126,000 750,000 450,000 681,000
383,000 536.250
21 6,000
300,000 248 000
14,643 2,ouo
103.182
36,684
82.597 51 3 7
433.118 20.3EO 81,720
106,976 11.035
299.933 219.681 717,645 152,312 46,836
100,016
396,757 62.986
134.585
66.908 106.084
97,692 79,045 40.1 G5
198,032 I R R . ~ ~
_.. _. n * n u IU
0 01 O 74
0 26
0 59 0 37
3 09 0 15 0 58
0 76 0 08 7 14
1 5 7 1 5 7 1 0 9 0 33 0 71 7 83 0 45 0 96
0 48 0 76
0 70 0 56 0 29 1 A I
aai,oi4 6.03
KRW Equities Doosan 2,433 423,973 3.03
Korea Investment Holdings Co Ltd 3.900 156,5;7 1.12 NCSOR 3.300 158.4:8 1.12 Onental Fire B Marine hSUranCQ Co Ltd 52,500 491.455 3.51 Orion C o p 900 190,101 1 3 6
1,420,464 10.14
MYR Equities Gold Is 200,000 95.019 0.68
Scomi Group Berhad 1,575,000 333,103 2.38 Scomi Marine Rhdn 61 5 . m 97,080 0.69 Yransrnile Group Bhd 282.000 110.639 0.79
635,841 4.54
SGD Equities China Energy Ltd i59,OoO 51,921 0.37 China Sky Chemical 343,000 207,650 1.48 Jiutian Chemical Group l.td 675.000 64,392 0.46
Midds Holdings Ltd 126,000 81.827 0.58 Osiin Intcrnational Ltd 330,OcQ 71,435 0.51 Sino-Environment Technology Group I t d 139,000 143,819 1.03
621,044 4.43 , . , ,
. THE Eouities .-- - - - - 1 . 1 Y - - - - Telecomasia Corporation-For 1,20c,000 144,565 1 0 3
144,565 1.03 IDR Equities
;65.730 1 1 8 TWD Equities BhdMi lnvestarna Tbk R 3,320,000 331,000 285.486 2.04
285,486 2.04 Panin Life Tbk Pt 3,750,000 85,458 0.61
251,188 1.79
The accompanying notes form an integral part of these financial statements.
169
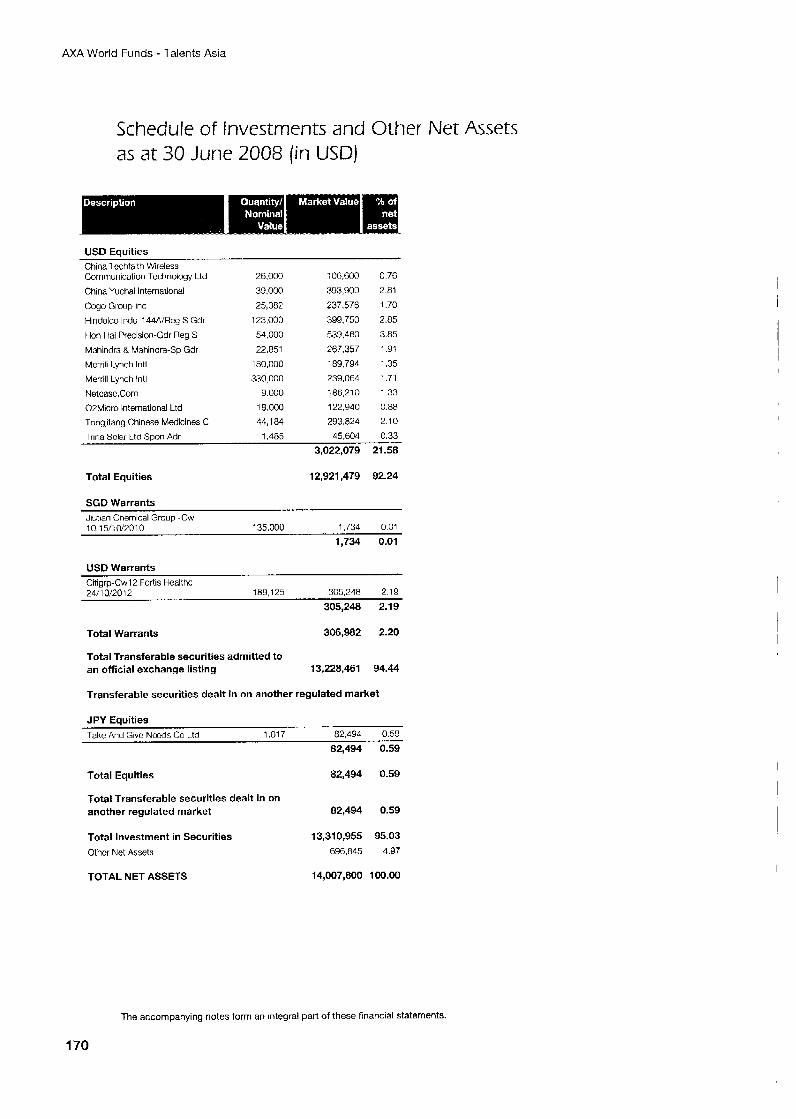
AXA World Funds - Talents Asia
Schedule of Investments and Other Net Asets as at 30 June 2008 {in USD)
USD Equities Chtna 1 echtaith Wireless Communication Technology Ltd
China Yuchai International
Cog0 Group Inc
Hindalco Indu-144NReg S Gdr
Hon Hai Precision-Gdr Reg S
Mahindra rl Mahindm-Sp Gdr
Merrill l.ynch Inti Merrill Lynch Inti
Noteasc.Com
02Micro Internztional Ltd
Tvngjitang Chinese Medicines C
26,000
39,000
25,382
123,000
54,000
22,851
iao.ooo 330.000
9.000
18,000 44,184
:06.600 393,900
237,576
399.760
539.460
267,357 189,794
239,064 186,210
122,940
293,824
0.76
2.81
1.70
2.85
3.85
1.91
1.35 1.71
1.33
0.88
2.10
Trina Solar Ltd Spon Adr I ,485 45,604 0.33
3,022,079 21 -58
Total Equities 12,921,479 92.24
SGD Warrants
10 15/10/2010 135.000 1,734 0.01
1,734 0.01
Jiutian Chemical Group -Cw
USD Warrants ~. CitiarwCwl2 Fortis Healthc 24; 0/2012 189,125 305.248 2.19
305,248 2.19
Total Warrants 306,982 2.20
Total Transferable securities admitted to an official exchange listing 13,228,461 94.44
Transferable securities dealt in on another regulated market
JPY Equities Take And Give Nccds Co Ltd 1.017 82,494 0.59
82,494 0.59
Total Equities 82,494 0.59
Total Transferable securities dealt in on another regulated market 82,494 0.59
Total Investment in Securities Othcr Net Assets
13,310,955 95.03 696.845 4.97
TOTAL NET ASSETS 14,007,800 100.00
The accompanying notes form an integral part of these financial statements.
170
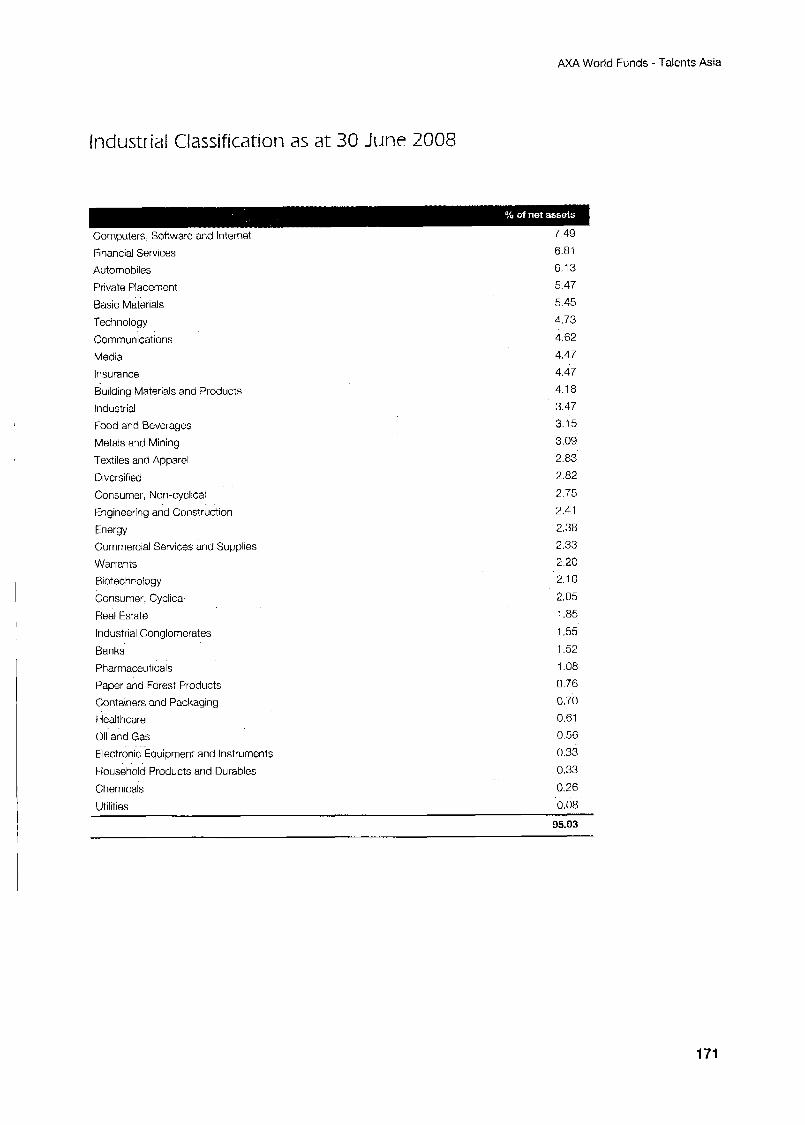
AXA World Funds - Talents Asia
Industrial Classification as at 30 June 2008
Computers, Software and Internet 7 49
Financial Services
Automobiles
6.81
6.13
Private Placement 5 47
Basic Materials 5 45
Technology 4 73
Communications 4 62 Media 4 47
Insurance 4 47
Industrial 3 47
Metals a id Mining 3 09
Building Materials and Products
Food and Beverages 3 15
Textiles and Apparel 2 83
Diversified 2 82
4 18
Consumer, Non-cyclical 2 75
Engineering and Construction 2 41
Energy 2 38
2 33 Commercial Services and Supplies Warrants 2 20 Biotechrology 2 10
Consumer, Cyclical 2 05
Real Estate 1 85
Industrial Conglomerates 1 55 Banks 1 52
Pharmaceuticals 1 08
Paper and Forest Products 0 76 Containers and Packaging 0 70
Healthcare 0 61
Oil and Gas 0 56
Electronic Equipment and Instruments 0 33
I-lousehold Products and Durables 0 33
Chemicals 0 26 Utilities 0 08
95.03
171
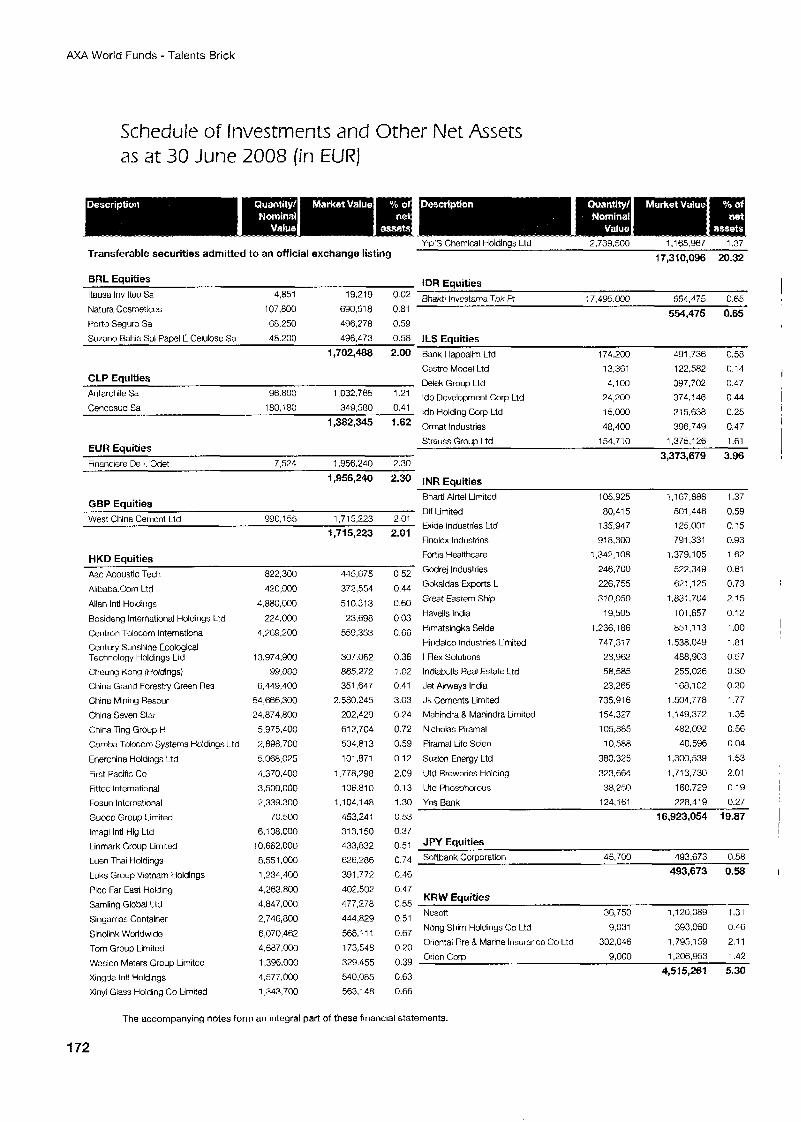
AXA World Funds - Talents Brick
Schedule of Investments and Other Net Assets as at 30 June 2008 (in EURJ
Yip's Chemical Holdings Ltd 2,739,500 1,165,967 1.37
Transferable securities admitted to an official exchange listing 17,310,096 20.32
BRL Equities IDR Equities ltausa Inv ltau Sa 4.851
Natura Cosneticos 107,800 690.518 0.81
Port0 Seguro Sa 68,250 496.278 0.59
Su7ano Bahia SUI Papcl E Celulose Sa 48.200 496,473 0.58 ILS Equities
19*219 '.02 Bhakti lnvcstama Tbk F? 17,495.000 554,475 0.65
554,475 0.65
1,702,488 2.00 Bank Hapoalim Ltd 174,200 491,736 0.58
Castro Model Ltd 13,361 122.582 (1.14
Delek Group Ltd 4,100 397.702 0.47 )032.765 '21 Idb Development Corp Ltd 24,200 374,146 0.44
3497580 0.41 Idh Holding Corp Ltd 15,000 215.638 0.25 ' 93829345 .62 Omat Industries 48,400 396,749 0.47 Strauss Group Ltd 154,710 1,375,126 1.61
3,373,679 3.96
CLP Equities Aiitarchile Sa 96.800
Cencosud Sa 180.1 80
EUR Equities Financiere De I.'Odet 7.524 1.956.240 2.30
1,956,240 2.30 INR Equities
Rharti Airtel Limited 105,925 1,167,888 1.37
Dlf lirnited 80,415 501,446 b i d e Industries Ltd 135,947 125,001
'7157223 2m01 Finolex lndustrlcs 918.3M) 791,331
GBP Equities West China Cerricnt Ltd 990,155 1,715,223 2.01
Fortis Healthcare
445,675 o,52 Godrej Industries HKD Equities Aac Acoustic Tech 822,300
Alibaba.Com Ltd Allan lntl Holdings
Bosideng Intornational Holdings Ltd
Centron Tclccom lnternationa Century Sunshine Ecological Technology Holdings Ltd
Choung Kong (Holdings) China Grand Forestry Green Res
China Mining Resour
China Seven Star
China Ting Group H
Cornba Tolocom Systems Holdings Ltd
Enerchina Holdings Ltd
First Pacific Co Fittec International
Fosun lntcrnational
Gumo Group Limited
lmagi lntl Hly Ltd
Linmark Group Limited
Luen Thai Holdings
Luks Group Vietnam Holdings
Pic0 Far Cast Holding
Samling Global I td
Singamas Container
Sinolink Worldwide
Tom Group LJmited
Wasion Meters Group Limited
Xlngda Intl Holdings
Xinyi Glass Holding Co Limited
420,000
4,880,000
224,000
4.769.200
13.974.900
99,Ooo
6,449,400 54,666,300
21,874,800
5.975.400
2,898,700
5.068.C25
4,370,400
3,500,000 2,339.300
70.500
6,108.000 10,662,000
8,551,000
1234,400
4263.800 4 847,000
2,746,800
6,070,462 4,687.000
1.396.000
4,577,000 1,343,700
372.554
510.313
23,698
559.353
307.062
865.272 351,647
2.580.245
202,429
612,704
50431 3
101.871
1,778,298
106.810
1,104,148
453,241
31 3.1 50 433,832
626.286
391,772
402,502
477,278
444,829
568,111
173,548
329.455
540.085
563.1 48
~ ~~
0.44
0.60
0 03 0.66
0.36 1.02 0.41
3.03
0.14 0.72
0.59
0.12
2.09
0.13
Gkaldas Exports L
Great Eastern Ship
Haveils India
Hirnatsingka Seide
Hindalco Industries Limited
I Flex Solutions
lndiabulls Heal Estate Ltd
Jet Airways India
Jk Ccmcnts Limited Mahindra 8 Mahindra Limited
Nicholas Piramal
Piramal Life Scien
Suzlon Energy Ltd
Utd Brewenes Holding
Utd Phosphorous
1,379,105
246,700 522.349
1,342,108
226,755
310.050
19.505
1,236,186 747.31 7
23.962 58,585
23,265 735,916
154,327
105,885
10.588
380.325
323,664
38.250
671,125
1,831,704
101,657
851.113
1.538.049 488,903
255.026 1 68.1 02
1.504.778 1,149,372
482.092
40,596
1,300,539
1,713,730
160,729
0.59 0.15
0.93 1.62
0.61
0.73
2.15
0.12
1 .oo 1 .81
0.57 0.30
0.70 - .77
1.35 0.56
0.04
1.53
2.01 0.19
1.30 YosBank 124,161 228.419 0.27
0.53 16,923,054 19.87 0.37 o.51 JPY Equities 0.74 Softbank Corporation 45,700 493.673 0.58
0.46
0.17
0.55 36,750 i ,120,089 1.31 0.51 Ncsott
o,67 Nong Shim Holdings Co Ltd 9,031 393,060 0.46
o . ~ O Oricntal Fire & Marine Insurance Co Ltd 302.006 1,795,159 2.11
9,000 1,206,953 1.42
4,515,261 5.30
493,673 0.58
KRW Equities
0.39 Onon Gorp
0.63
0.66
I
I
I I
i
!
I
!
I !
I
The accompanying notes form an integral part of these financial statements
172
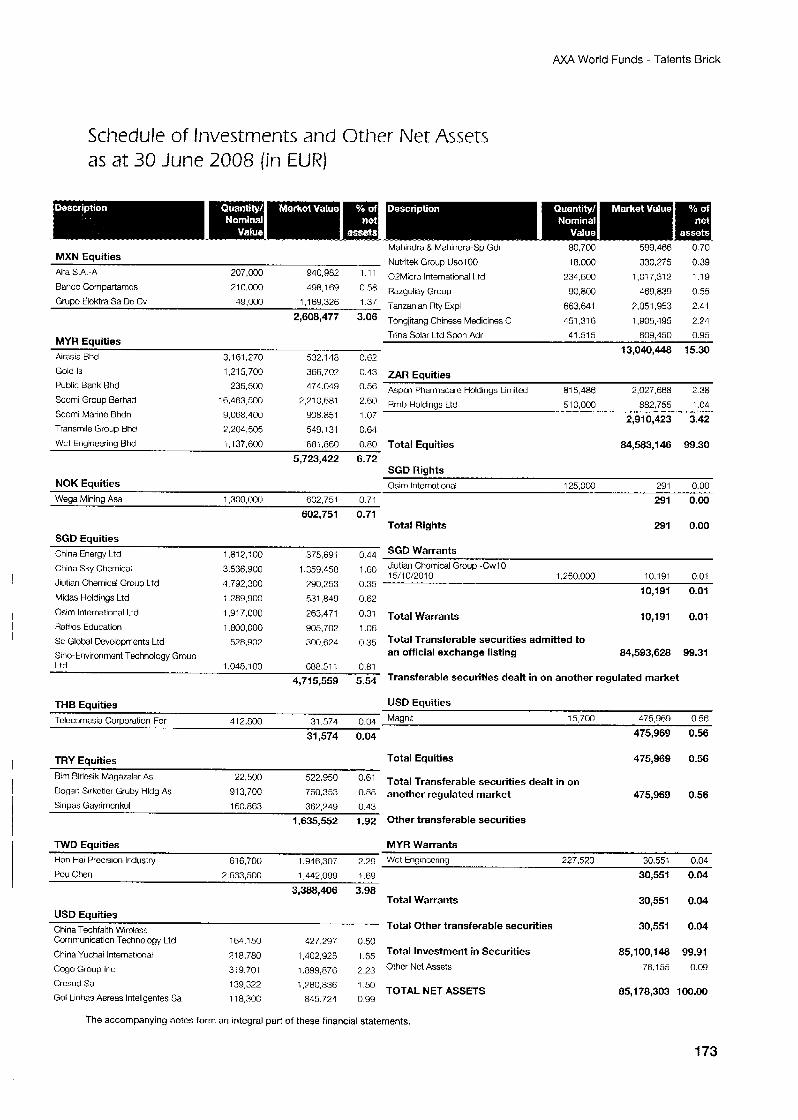
AXA World Funds - Talents Brick
Schedule of Investments and Other Net Assets as at 30 June 2008 (in EUR)
Mahindra & Mahindra-Sp Gdr 80.700 599,466 0.70
Nutritek Group IJsdl 00 18,000 330,275 0.39 MXN Equities
940,982 02Micro International I.td 234.600 1.017.312 1.19
498,1 69 0.58 Razguliay Group 90.800 469,839 0.55 Banco Corripartamos 210.000
Grupo Elcktra Sa Dc Cv 4Y ,000 ' 693326 .37 Tanzarlian Rty Expl 663,641 7,051,953 2.41 216089477 3.06 Tongjitang Chinese Medicines C 451.316 1,905,495 2.24
Alfa SA.-A 207,000
Trina Solar Ltd Spon Adr 41.515 809,450 0.95 MYR Equities 13,040,448 15.30
Airasia Bhd 3,161,270 532.116 0.62 Gold Is
Public Bank Hhd
Scorni Group Berhaj
Scomi Marine Bhdn Transmile Group Bhd
1.21 5,700 366*707 43 ZAR Equities 81 5,486 2,027.668 2 38
27210v681 2fio Rmb Holdlngs Ltd 51 0,000 882.755 1.04 2,910,423 3.42
236,500 474C40 0.56 Aspcn Pharmacare Holdings Lirnited IG.463,500
9.068.400 908851 1 0 7
7.204505 549 131 0.64
Wct Engineering Ehd i.137.600 68i.660 0.80 Total Equities 84,583,146 99.30 5,723,422 6.72
SGD Riahts - NOK Equities Osim International 125,000 291 0.00
Wega Mining Asa 1,300.000 6C2.751 0.7i 291 0.00 602,751 0.71
Total Rights 291 0.00 SGD Equities
China Sky Chemical 3.536,YOO
China Energy Ctd 1 8 2,: 00 375,691 0.44 SGD Warrants ,359,c58 ,60 Jiutian Chcmical Group -CwlO
15/10i2010 1,250,000 10.191 0.01
10,191 0.01 Jiutian Chorriical Group Ltd 4,792,300 790,253 0.35
Midas Holdings Ltd 7,289,900 531.849 0.62
Osim International ILrd 1,917,000 Hafflos Education 1,800,000 905,702 1.06 Sc Glohal Devclopmnts Ltd 528.902 300,624 o.35 Total Transferable securities admitted to Sino-Environmcnt Txhnology Group an official exchange listing 84,593,628 99.31 Ltd 1,048,100 688.51i 0.81
263,471 0.31 Total Warrants 10,191 0.01
4,715,559 5.54 Transferable securities dealt in on another regulated market
THB Equities USD Equities
9 Telecornasia Corporation For 412.800 Magnit 15,700 475,969 0.56
31,574 0.04 475,969 0.56
TRY Equities Total Equities 475,989 0.56 -
522)950 o.61 Total Transferable securities dealt in on Bim Btrlcsik Magazalar As 22,500
91 3,70C 750.353 0.86 another regulated market 475,969 0.56 Dogan Sirkctlor Gruhy Hldg As
Sinpas Gaynmcnkul 160.863 367.749 0.43 1,635,%2 1 .g2 Other transferable securities
TWD Equities MYR Warrants Hon Hal Procision Industry 616,700 I ,946,307 2.29 WCt Englnmring 227.520 30,551 0.04
Pou Chen 2,633,500 1,442.099 1 .E9 30,551 0.04
Total Warrants 30,551 0.04 3,388,406 3.98
USD Equities China Techfaith Wirdess Communication Technology Ltd 164.1 50 427,297 0.50
Total Other transferable securities
,402,925 .65 Total Investment in Securities China Yuchai International ?i8.780 , 2.23 Othcr Net Assets Cog0 Group Inc 379,701
1'780'R36 ' 50 TOTAL NET ASSFTS Cresud Sa 139,322 Go1 Linhas Aareds lnteligentes Sa 118,.70G 845.721 0 9 9
30,551 0.04
85,100,148 99.91 78.155 0.09
85,178,303 100.00
The accompanying notes form an integral part of these financial statements.
173
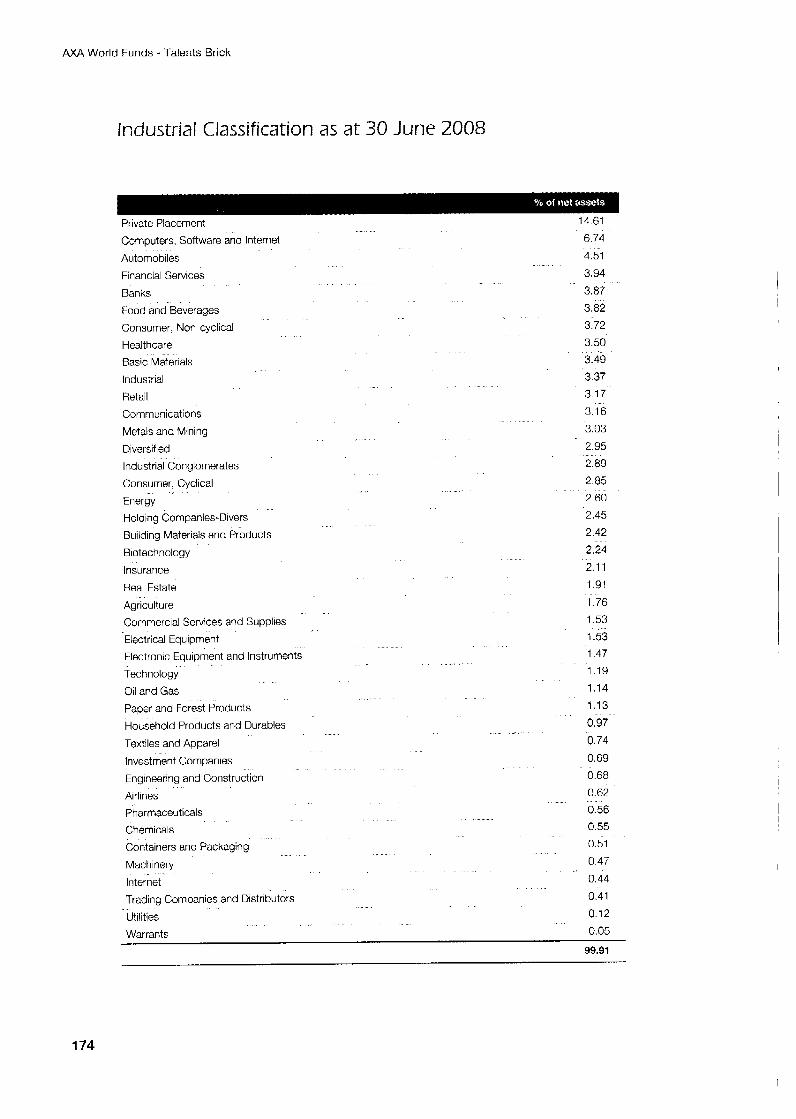
AXA World Funds Talents Brick
Industrial Classification as at 30 June 2008
Private Placement
Computers, Software and Internet
Automobiles
Financial Services
Banks
Food and Beverages
Consumer, Non-cyclical
Healthcare
Basic Materials
Industrial
Retail
Communications
Metals and Mining
Diversified
Industrial Conglomerates
Consumer, Cyclical
Energy
Holding Companies-Divers
Building Materials and Products
Biotechnology
Insurance
Real Estate
Agriculture
Commercial Services and Supplies
Electrical Equipment
Electronic Equipment and Instruments
Technology
Oil and Gas Paper and Forest Products
Household Products and Durables
Textiles and Apparel
Investment Companies
Engineering and Construction
Airlines Pharmaceuticals
Chemicals
Containers and Packaging
Machinery
Internet
Trading Companies and Distributors
Utilities
14 61
6.74
4.51
3 94
3.87 3.82
3.72
3.50
3 49
3 37 3 17
3.16
3.03
2 95
2 89 2 85 2 60
2.45
2 42
2.24 2.1 1
191
i .76
1.53
1 53 1.47
119
1.14
113
0.97 0.74
0.69
0.68
0.62
0 56 0.55
0.51
0 47
0.44
0 41
0 12
Warrants 0.05
99.91
174
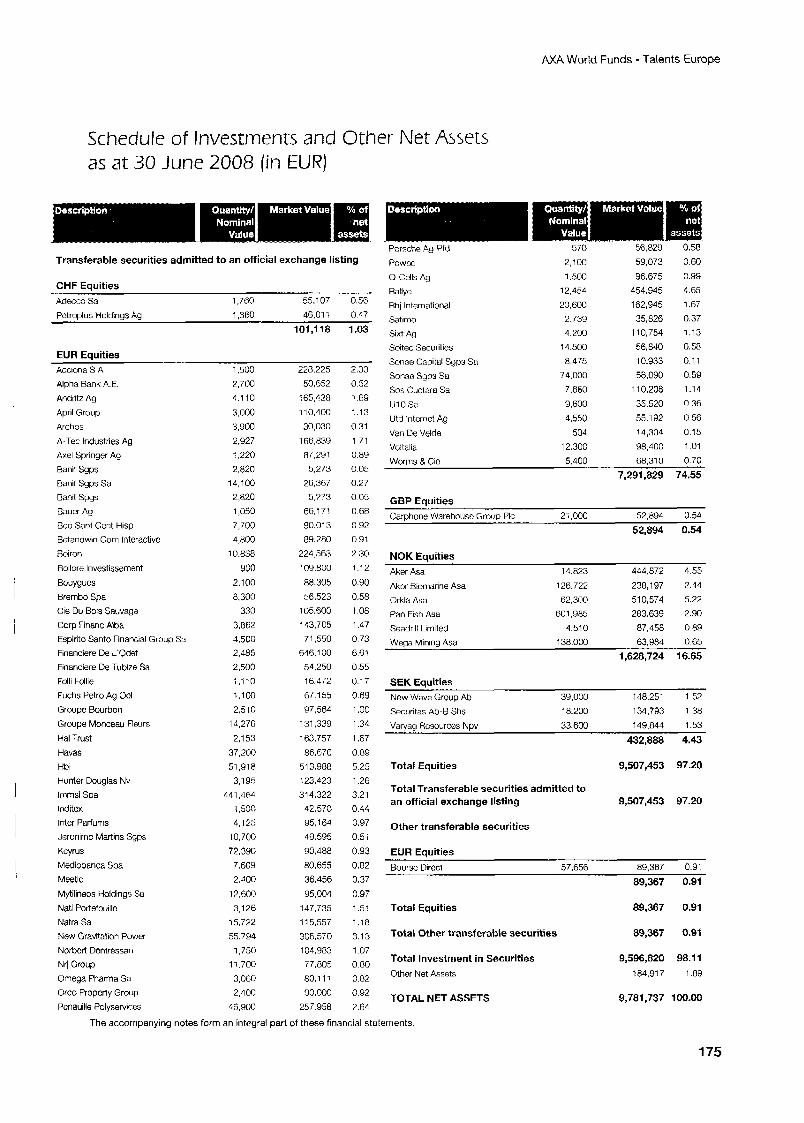
AXA World Funds - Talents Europe
Schedule of Investments and Other Net Assets as a t 30 June 2008 (in EUR)
Transferable securities admitted to an official exchange listing
CHF Equities AdKcO Sa 1,760 55,107 0.56
Petroplus Holdings Ag 1,360 46,011 0 4 7
101,118 1.03
EUR Eauities Acciona S A Alpha Bank A.E. Andritz Ag
April Group
Archos A-Tec Industries Ag Axel Springer Ag
Banif Sgps Banif Sgps Sa Banif Spys
Bauer Ag
Bco Sant Cent Hisp Betandwin.Com Ir'ltcrzctivc
Boiron Eollore lnvestissement
Bouygucs
Brernbo Spa Cie Du Bois Sawage Corp Financ Alba
Espirito Santo Financial Group Sa Financiere De L'Odet Financiere De Tubi7e Sa Folli Folk
Fuchs Petro Ag Ocl Groupc Bourbon
Froupe Monceau Fleurs
Hal Trust
Havas Hbi Hunter Douglas Nv lrnrnsi Spa lnditex Inter Parfurns Jcronimo Martins Sgps
Kcyrus Mediobanca Spa
Meetic Mytilineos Holdings Sa
Natl Portefcuillc Natra Sa New Gravitation Power Norbcrt Dentressan Nrj Group Omega Pharmd Sa
Orco Property Group Pcnauille Polyservices
1.500 7,700 4.1 10
3,000 3,900 2.927 ; ,220
2.820
2,820 1 ,osc
7,700 4,800
10.838
900 2,100
8 300 330
3,862 4,500 2,485 2,500 1,110
1.100
2,510 14,276
2,153
37,200 51,918 3,195
441,464 1.500 4,125
10,700
7.?.390 7.609 2.400
14,100
12,600 3,126
15.722 55,794
1.750 11,700 3,060
2,40C
65,900
228.225 50.652
'65.428
110,400 30,030
166.839 87.291 5,273
26.367 5,773
66.171 90.01 3 89.280
224,563
103,800
88,305 56.523
105.600 143.705 71.550
646.1 00
54,250 16.472
67 155
97,564
131,339
163,757 86.678
513.988 i23.423 314,322 42,570 95.?64 49.595
90.488
80.655 36.456 95.004
147,735 11 5,557 306.570 104.983 77,605
80.111 90,000
257.958
2.33 0 52
1.69 1.13 0.31
1.71 0.89 0 05 0.27 0 05 0.68 0 92 0 91
9 30 t i 2
0.90 0.58 1 0 8 1.47 0 73 6.61 0.55 0.1 7 0 69 1 .00 1.34
1.67 0.89 5.25 1.26 3.21 0.44 0.97 0.5;
0.93 0.82
0.37
0.97 1.5: 1.18 3.13 1.07 0.80
0.82 0.92 7.64
2,100 59,073 0.60 POWMI
96.675 0.99 0-Cells Ag 1.500 Rallye 12.454 454,945 4.65 Rhj International 20.600 162,945 1.67
2.739 35,826 0.37 Satimo Sixt Ag 4,200 110,754 1.13
14,500 56,840 0.58 Soitec Securities Sonae Capital Syps Sa 8.475 10,933 0.1 1
Sonae Sgps Sa 74,000 58.090 0.59 110.208 1.14 Sos Cuctara Sa 7,660
9,600 35,520 0.36 111 0 Sa Utd lntcrnct Ag 4,550 55.192 0.56
14,304 0.15 V m De Velde 504 Vcltalia 12.300 98,400 1.01
Worms 8 CIC 5,400 68.310 0.70
7,291,829 74.55
GBP Eauities Carphone Warehouse Group PIC 2; ,000 52,894 054
52,894 0.54
NOK Eauities Aker Asa
Akcr Biomanne Asa Orkla Asd Pan Fish Asa Seadrill 1-imited
14.823 444,872 4.55
126.722 238,197 2.44 62,300 510,574 5.22
601,965 283.639 2.90 4,510 87,458 0.89
Wega Mining Asa 138.0M1 63,984 0.65
1,628,724 16.65
SEK Eauities New Wave Group Ah Securitas Ah-B Shs
Varvaa Hcsources Nuv
39,OCO 148,251 1.52 18,200 134,793 1.38
33.600 149.844 1.53
432.888 4.43
Total Equities 9,507,453 97.20
Total Transferable securities admitted to an official exchange listing 9,507,453 97.20
Other transferable securities
EUR Equities Boursc Dirccl 57.656 89,367 0.91
89,367 0.91
89,367 0.91 Total Equities
Total Other transferable securities 89,367 0.91
Total Investment in Securities Other Net Assets
9,596,820 98.1 1 184.917 1.89
TOTAL NET ASSETS 9,781,737 100.00
The accompanying notes form an integral part of these financial statements
175
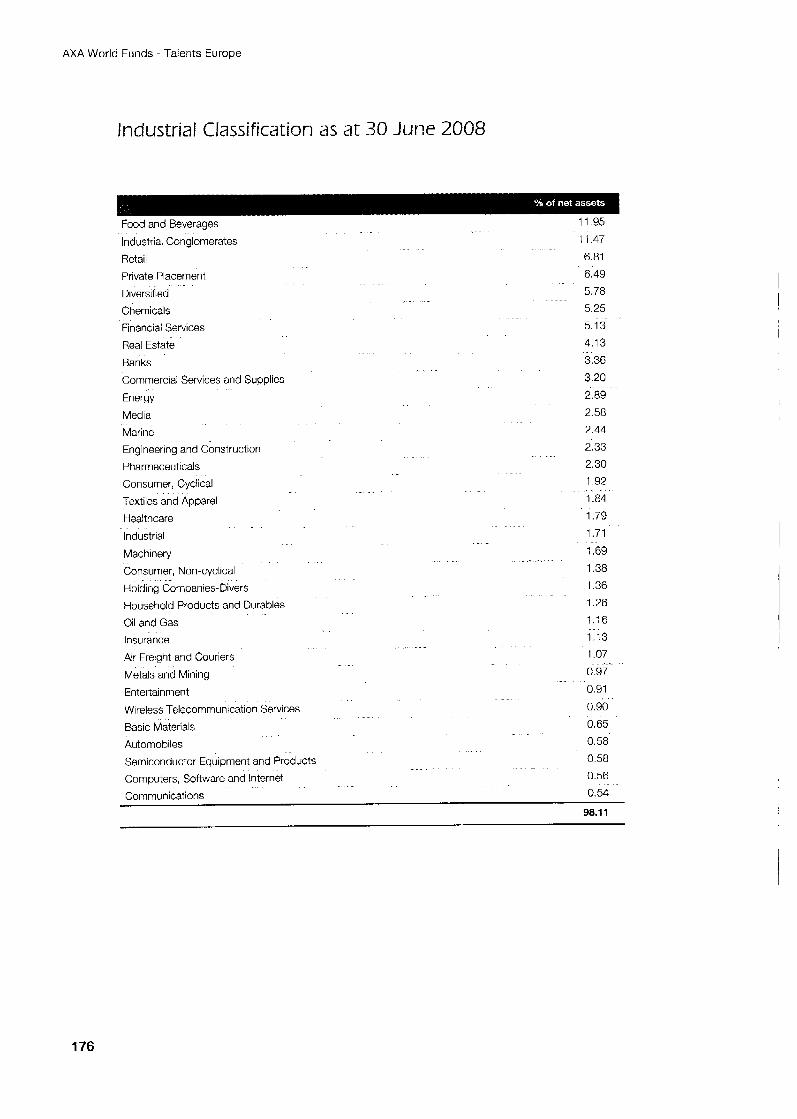
AXA World Funds - Talents Europe
Industrial Classification as at 30 June 2008
Industrial Conglomerates
Retail
Private Placement
Diversified
Chemicals
Financial Services
Real Estate
Banks
Commercial Services and Supplies
Energy
Media
Marine
Engineering and Construction
Pharmaceuticals
11.47 6.81 6.49 5 78 5.25 5.13 4.13 3.36
3 20 2.89 2.58 2.44 2.33 2.30
Consumer, Cyclical 1 92 Textiles and Apparel 1:84 I-iealthcare 1.79 Industrial 1.71 Machinery 1.69 Consumer, Non-cyclical 1.38 Holding Companies-Divers 1 36 Household Products and Durables 1.26 Oil and Gas 1 1 6 Insurance 1 1 3 Ar Freight and Couriers 1.07 Metals and Mining 0.97-
Entertainment 0 91 Wireless Telecommunication Services 0 90 Basic Materials 0.65 Automobiles 0.58
Semiconductor Equipment and Products 0 58 Computers, Software and Internet 0.56 Communications 0 54
98.1 I
176
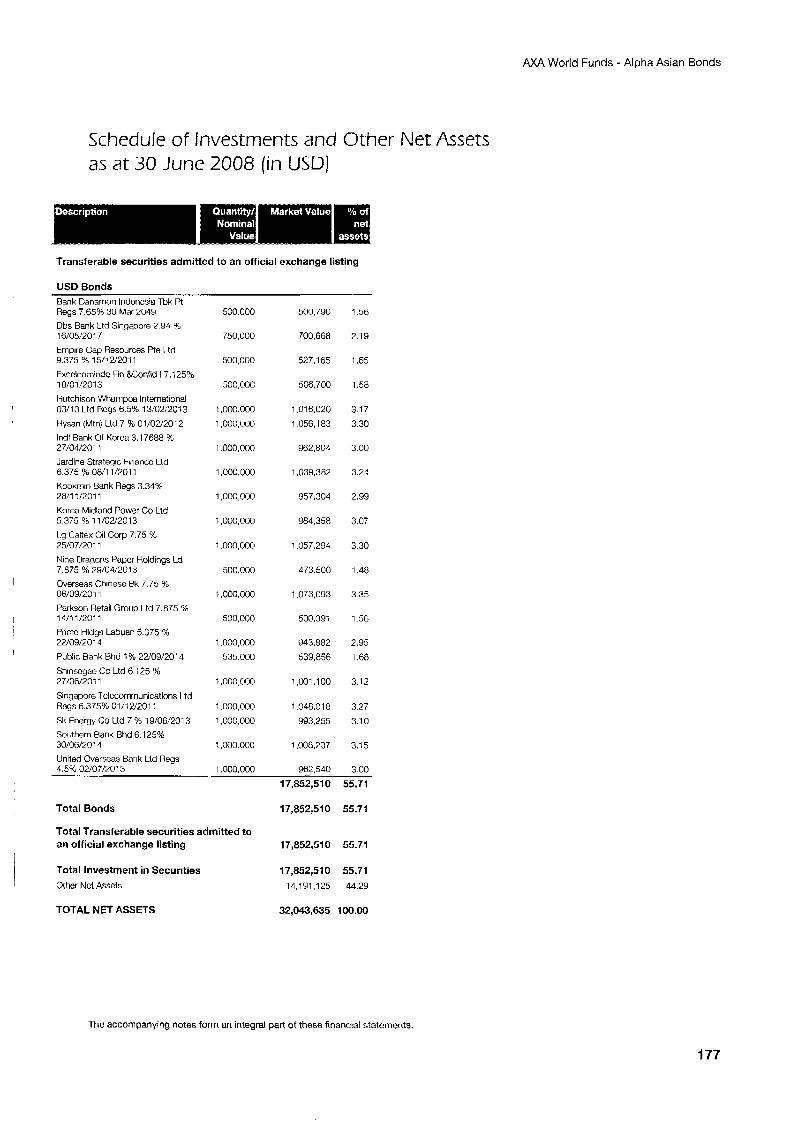
AXA World Funds - Alpha Asian Bonds
Schedule of Investments and Other Net Assets as at 30 June 2008 (in USD)
Transferable securities admitted to an official exchange listing
USD Bonds Bank Danarnon Indonesia Tbk Pt Regs 7.65% 30 Mar 2049 Dbs Bank Ltd Singwore 2.94 4: 16/05:2017 Empire Cap Resources Re Ltd 9.375 % 15/12/2011 Excelcornindo Fin &,Confid I 7.1 25% 18/01/2013 Hutchison Whampca International 03/13 Ltd Regs 6.5% 13/02:2013 Hysan (Mtnj Ltd 7 4: 01/02/2012 lndl Bank Of Korea 3.17688 % 27/04/2011 Jardine Strztegic Financc Ltd 6.375 % 0811 1/7011 Kookmin Bank Regs 3.344: 2811 1/2011 Korea Midland Power Co Ltd 5.375 % 11/02/2013 1.g Caltex Oil Corp 7.75 % 25/07/2011 Nine Rragons Papcr Holdings Ld 7.875 % 79/04/2013 Overseas Chinese Ek 7.75 % 06/09/2011 Parkson Retail Group Ltd 7.875 % 14/11 /2011 Prime Hldgs Labuar 5.375 % 22/09/2014 Public Bank Bhd 1 % 22/09/2014 Shinsogae Co Ltd 6 i25 % 27/06/2011 Singapore Tclccommunications Ltd Regs 6.375% 01/17J2011 Sk Energy Co Ltd 7 % 19/06:2013 Soifihern Bank Bhd 6.1 25% 30/06/7014 United Overseas Bank Ltd Regs
500.000
750,000
500,000
500,001:
1,000.000 1,000,000
1,000,000
1,000,000
1,000,000
1,000,000
1,000,000
500,000
1,000,000
500,000
1,000,000
535,000
1,000,000
1,000,000 1,000,000
1,000.000
500,790
700,668
527.165
506.700
1,016,020 ,056,183
962,804
,039,382
957,304
984,358
,057,234
473.500
,073,093
500.39i
943.882
539,656
.M11.100
,048.01 6
993,155
1,00H.707
1.56
7.lY
1 .G5
1.58
3.17
3.30
3.00
3.24
2.99
3.07
3.30
1.48
3.35
1.56
2.95
1.68
3.12
3.27
3.1 0
3.15
3.00 4.5% 02/07/2013 1,000,000 962,540 17,852,510 55.71
Total Bonds 17,852,510 55.71
Total Transferable securities admitted to an official exchange listing 17,852,510 55.71
Total Investment in Securities 17,852,510 55.71 Other Nct Assets 14,191,125 44.29
TOTAL NET ASSETS 32,043,635 100.00
The accompanying notes form an integral part of these financial statements.
177
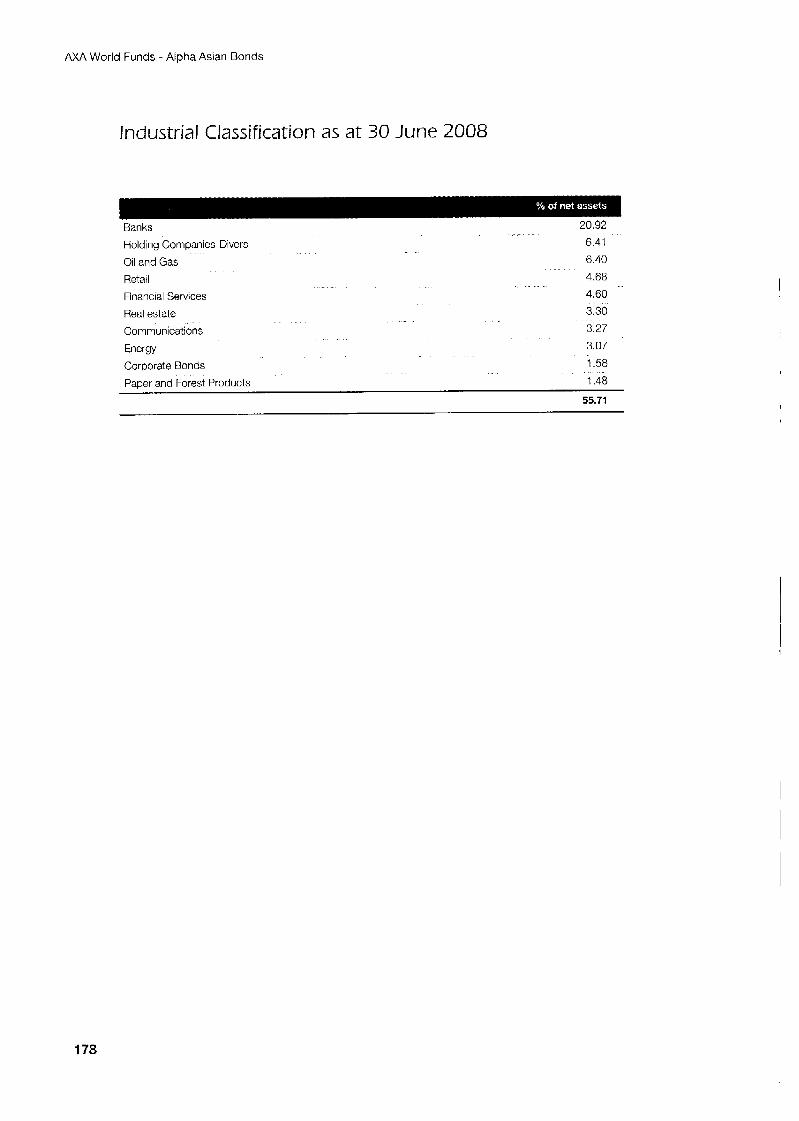
AXA World Funds - Alpha Asian Bonds
Industrial Classification as at 30 June 2008
.. Banks 20.92
Holding Companies-Divers 6.41
Oil and Gas 6.40
Retail
Financial Services Real estate
Communications
Enerqv
4.68
4.60
3.30 3.27
3.07 -- Corporate Bonds 1.58
Paper and Forest Products 1.48
55.71
178
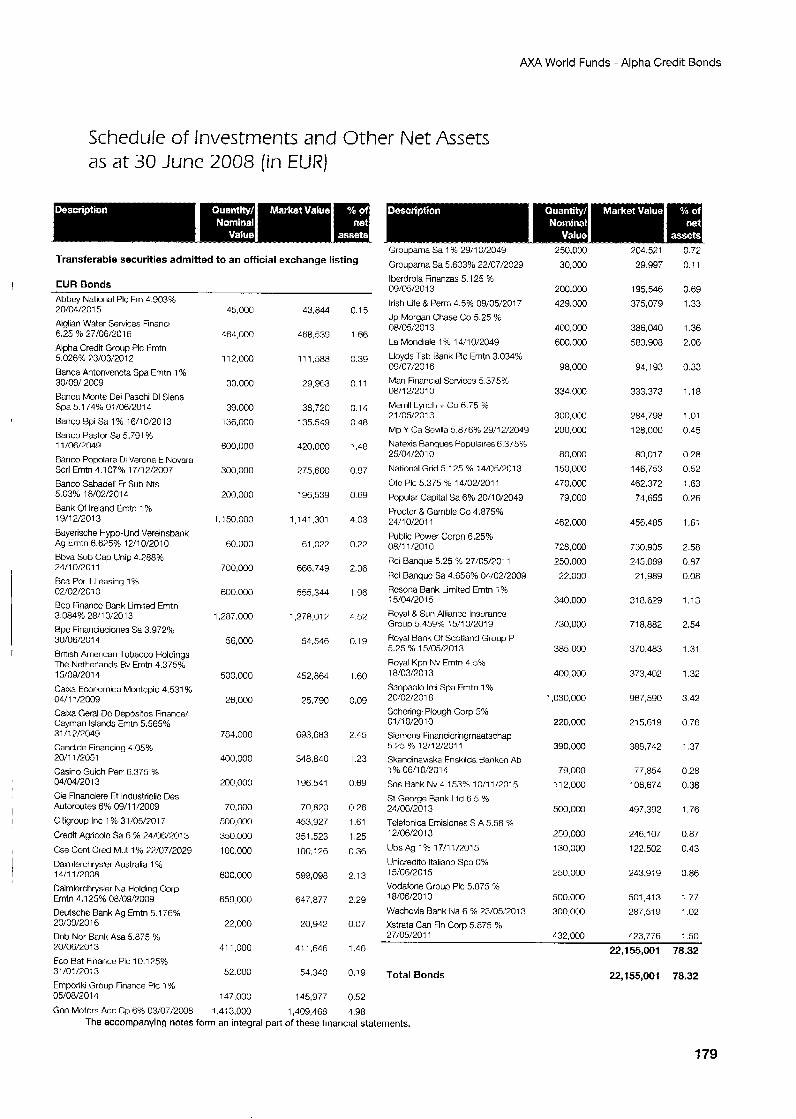
AXA World Funds - Alpha Credit Bonds
Schedule of Investments and Other Net Assets as at 30 June 2008 (in EUR)
Transferable securities admitted to an official exchange listing
EUR Bonds Abbey National Plc Frn 4.903% 20/04/2015 Alglim Water Services Financi
Alpha Credit Group PIC Emtn 5.026% 73/03/2012
Banca Antonvcncta Spa Enrtn 1 76 30/09/ 2009 Banca Montc Dei Paschi Di Siena Spa5.17496 01/06/2014
Banco Bpi Sa 1% 16/10/2013 Banco Pastor Sa 5.791 % 1 1/06/2049 Banco Popolare Di Verona E Novara Scrl Emtn 4.107% 17/12/2007 Banco Sahadell Fr Sub Nts 5.03% 18/02/1014
Bank of Ireland Emtn 1% 19/12/2013
Bayerische Hypo-Und Vereinsbank Ag Emtn 6.675% 12/10/2010 Bbva Sub Cap Unip 6.288% 24/10/2011
6.25 90 27/06/2016
Bca Per II Leasing 1% 02/02/2010 Rcp Financc Bank Limited Erntn 3.084% 28/10/2013 Bpe Financiaciones Sa 3.972% 30/06/2011 Brrtish American Tobacco Holdings The Netherlands 0v Emtn 4.375% 15/09/2014
Caixa Econornica Montepio 4.531 9t C4/11/2009 Caixa Geral Dc Dcpositos Finance/ Cayman Islands Emtn 5.565% 31 11 7/P049 Candide Financing L.05% 20/11/2051 Casino Guich Perr 6.375 % 04/04/2013 Cie Financiere Et lndustricllc Des Autoroutes 6% 09/11 /2009
Citigroup Inc 1% 31 /05/7017
Credit Agricolc Sa 6 76 24/06/2013
Cse Ccnt Crcd Mid 1% 77/07/2029 Dainilerchrysler Australia 1 % 14/11/2008 Daimlcrchrysler Na Holding Corp Emtn 4.125% 08/09/2009 Deutschc Bank Ag Erntn 5 176% 20i09/2016 Dnb Nor Bank Asa 5.875 % 20/06/2013 Eco Bat Finance PIC 10.175% 31 /01/2013
Emporiki Group Finance PIC 1 % 05/08/2014
45,000
164,000
11 2,000
30.000
39,000
136,000
600,000
300,000
200,000
1,150,000
60.000
700,000
600.000
1.287.000
56,000
500,000
26.000
784.000
400,000
200.000
70,000 500,000
350.000
100.000
600,000
659.000
22,000
41 1,000
52.000
147.00l: Gcn Motors Acc Cp 6% 03/07/2008 1,4i3,000
43,844
468,539
11 1.588
29,963
38,720
135.569
420,000
775.600
196.539
1,141,301
61,022
666.749
555,344
1,278,017
54.546
452,864
75,790
693,683
318.840
196.541
70,820
453,927
351,523
1 OC, 126
599,098
647.877
20,942
41 1,646
54,3tO
145,977
1.409.168
0.15
1.66
0.39
0.1 1
0.14
0.48
1.48
0.97
0.69
4.03
0.22
2.36
196
4.57
0.19
1.60
0.09
2.45
1.23
0 69
0.26 1 .El
1.25
0 36
2.13
2.29
0.07
1.46
0.19
0.52
4.98
Groupanla Sa 1% 29/10/2049
Groupama Sa 5.60396 22/07/2029 lbcrdrola Flnanzds 5 125 76 09/05/2013 Irish Life & Perm 4.5% 09/05/2017
Jp Morgan Chase Co 5 25 y% 08/05/2013 La Mondiale 1 Yo 14il0/2049
Lloyds Tsh Rank PIC Erntn 3.034% 09/07/2016 Man Financial Scrviccs 5.37596 08/1 2/2010 Merrill Lynch CG 6.75 % 21:05/2013
Mp Y Ca Scvilla 5.8764: 29;12/2049 Natexis Ranques Populaires 6.375% 25/04/2010
National Grid 5.125 % 14/05/2013
Otc PIC 5.375 96 14/02/2011
Popular Capital Sa 6% 20/10/2049 Proctcr & Gamble Co 1.875% 21/10/2011
Puhlic Power Corpn 6.25% Ofl/11/2010 Rci Banque 5.25 % 27/05/7011
Hci Banquc Sa 4.656% 04/02/2009 Hcsona Bank Limited Emtn 7 % 15/04/2015
Royal 8 Sun Alliancc Insurnrice Group 5.459% 15:10/2019 Royal Bank Of Scolland Group P 5.25 9t 15/05/2013 Royal Kpn Nv Emtn 4.5% 18/03/2013
Sanpaolo Imi Spa Emtn 1 % 20/02/2018 Schcring Plough Corp 5% 01/10/2010 Siemens Financicringmaatschap 5.75 % 1211 2/2011 Skandinaviska Enskildz Bankcn Ab 1 YC 0611 0/%01 4
Sns Bank Nv4.153% 10/11/2015 St George Bank I..td 6.5 % 24/06/2013 Tcleforiica Cnisiones S A 5.58 % 12/06/2013
Ubs Ag 1% 17/11/2015
Unicredrto ltalianc Spa 0% 15/06/2015 Vodafone Group PIC 5.875 % 18/06/2010
Wachovia Rank Na 6 9t 23/05,’2013 Xstrata Can Fin Cora 5.875 4:
250.000 30,000
200.000
429,000
400,000
600.0M3
98,000
334,000
300.000 200.000
80,000
150,000
470,000 79,000
C62,000
728.000
250.000
22,000
340,000
730,000
385.000
400,000
1,030,000
220,000
390,000
79,000
: 12,000
500.000
250,OM)
130,000
250.000
500.000 300.0W
27/05/2011 432.000
Total Bonds
7G4.521
29.997
195,546 375,079
386,040
583.908
94,193
333,373
784.798
128.000
80.01 7
146,753
462,372
74.655
456,485
730.905 245,089
21,989
318,629
718,882
370,483
373.402
967,590
215.619
386,742
77.854 106,674
497.397
246,107
122,502
243,9i 9
501,413
287.519
478.776
0.72 0.1 1
0.69 1.33
1.36
2.06
0.33
1.16
1.01
0.45
0.28
0.52
1.63
0.26
1.6;
2.58 0.87
0.08
1.13
2.54
1.31
1.32
3.42
0.76
1.37
0.28
0.38
1.76
0.87
0.13
0.86
1.77
1.02
22,155,001 78.32
22,155,001 78.32
The accompanying notes form an integral part of these financial statements.
179
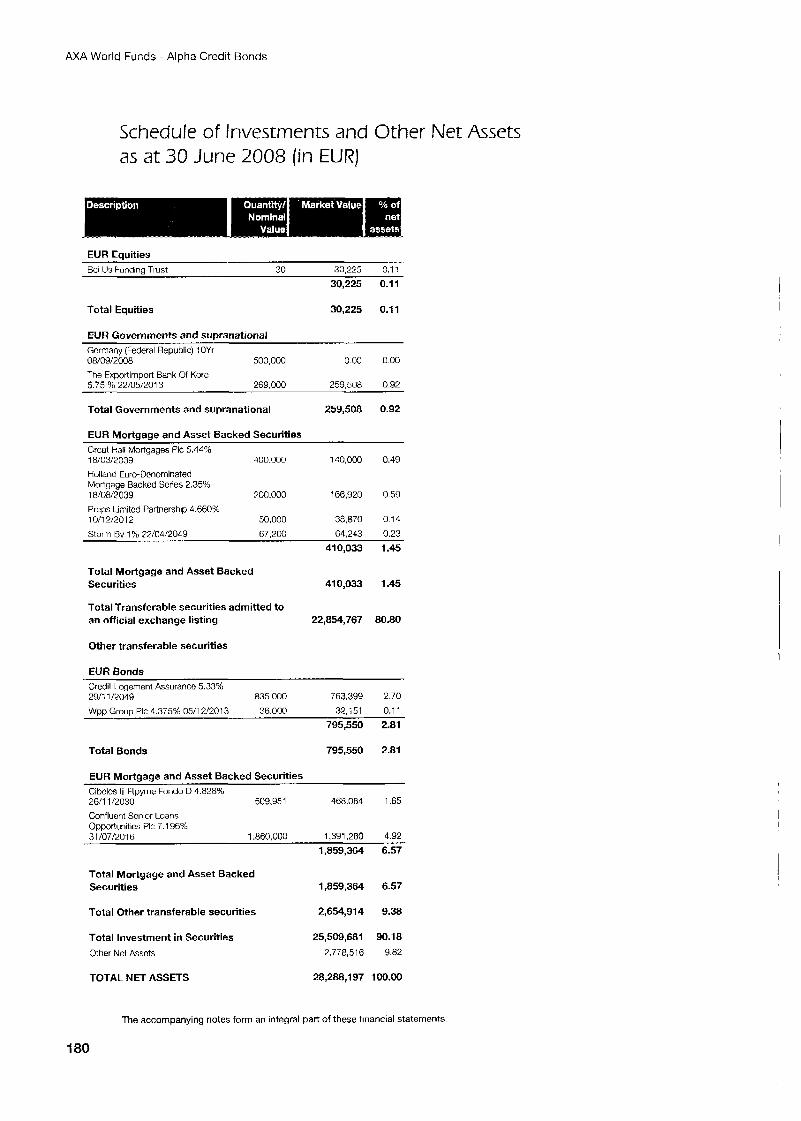
AXA World Funds - Alpha Credit Bonds
Schedule of Investments and Other Net Assets as at 30 June 2008 (in EUR)
EUR Equities Bci Us Ftmclina Trust 30 30.225 0.17
30,225 0.11
Total Equities 30,225 0.11
EUR Governments and suwanational Gcmmany (Federal Republic) !OYr 08/09/2008 500,000 0.03 0.00
The Exportimport Bank Of Korc 5.75 96 22/05/2013 269.000 259.508 0.92
Total Governments and supranational 259,508 0.92
EUR Mortaaae and Asset Backed Securities Grcat kaii Mortgages PIC 5.41% 18/03/2039 400.000 140,000 0.49
Holland Euro-Denominated Mortgage Backcd Scries 2.35% 18/08/2039 700,000 :66.920 0.59 Preps Linitcd Partnership 4 6 0 % 1011 21201 2 50,000 38,870 0.14
Storm Bv 1 % ;)7/04:2049 67.200 64.243 0.23
410,033 1.45
Total Mortgage and Asset Backed Securities 410,033 1.45
Total Transferable securities admitted to an official exchange listing 22,854,767 80.80
Other transferable securities 1
EUR Bonds Credit I cgement Assurancc 5.33% 29/11/2049 835.000 763,399 2.70
Wpp Group PIC 1.375% 0511 2’2013 36.000 32,i51 0.1 1
795,550 2.81
Total Bonds 795,550 2.81
EUR Mortgage and Asset Backed Securities Cibclcs 111 Ftpyme Fondo D 1.828% 26/11 /2030 509.9,51 468.084 1.65
Confluont Senior Loans Opportunities PIC 7.1 96% 31 /07/20.16 1.860.000 1,391.280 4.92
1,859,364 6.57
Total Mortgage and Asset Backed Securities 1,859,364 6.57
Total Other transferable securities 2,654,914 9.38
Total Investment in Securities 25,509,681 90.18 Other Net Asscts 2.778,516 9.82
TOTAL NET ASSETS 28,288,197 100.00
The accompanying notes form an integral part of these financial statements.
1 80
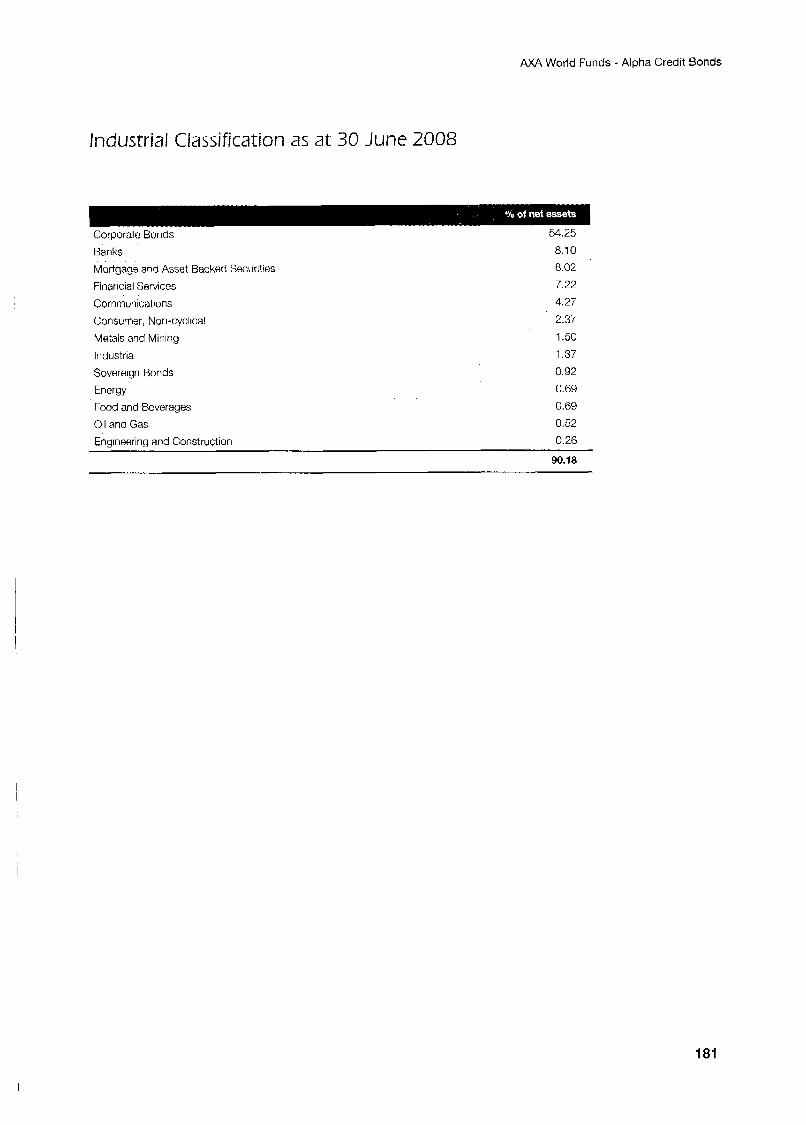
AXA World Funds - Alpha Credit Bonds
Industrial Classification as a t 30 June 2008
Corporate Bonds 54 25
Banks 8 10
Mortgage and Asset Backed Securities 8 02 Financial Services 7 22
Consumer, Non-cyclical 2 37 Metals a id Mining 1 50
Industria 1 37
Sovereign Bonds 0 92
Energy 0 69
Food and Beverages 0 69
Oil and Gas 0 52
Engineering and Construction 0 26
90.18
Communications 4 27
181
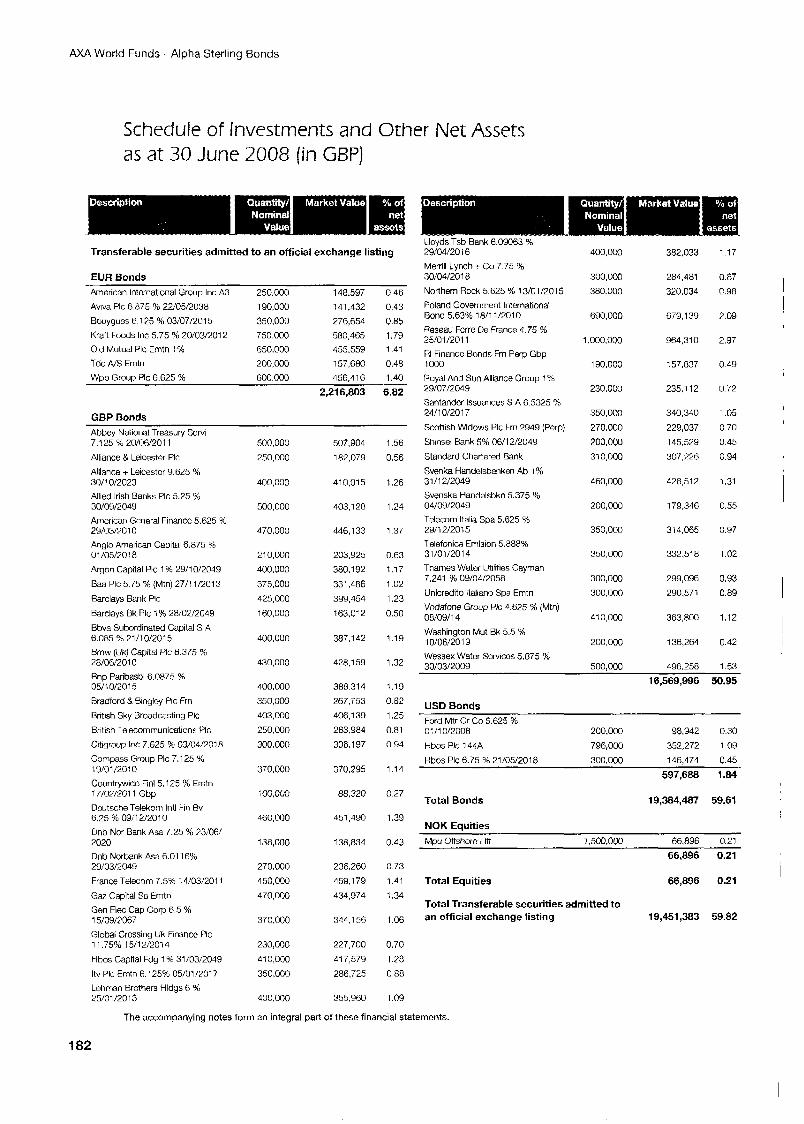
AXA World Funds - Alpha Sterling Bonds
Schedule of Investments and Other Net Assets as at 30 June 2008 (in GBP)
Transferable securities admitted to an official exchange listing
EUR Bonds American International Group Inc A3 250,000 148.597 0.46 Aviva PIC 6.875 % 22/05/2038 190,000 141,432 0.43 BouyguCS E.125 % 03/07/2015 350,000 276,654 0.85 Kraft Foods Inc 5.75 % 20/03/%012 750,000 580,465 1.79 Old Mutual PIC Emtn 1 % 650.000 455.559 1.41 ldc N S Erntn 200,000 157,680 0.48 War, Group PIC 6.625 % 600.000 456.416 1.40
2,216,803 6.82
GBP Bonds Abbey National Treasury Sciv 7.125 Yt 20/06/2011 Alliance & Leicester PIC
Alliance + Leicester 9.625 % 30/! 0/2023 Allied Irish Banks PIC 5.25 % 30/09/2049 Amcrican General Firiancc 5.625 % 29/03/7010 Anglo American Capital 6.875 % 01 /05/7018 Argon Capital PIC 1 % 2911 0/2049 Baa PIC 5.75 0/6 (Mtn) 27/11/2013
Barclays Bank PIC
Barclays Bk PIC 1 % 28/02/2049 Bbva Subordinated Capital S A 6.085 % 21/10/%015 Bmw (Uk) Capital PIC 6.375 % 28/06/2010 Bnp Paribasbl6.0875 % 05/10/2015 Bradford & Eingley PIC Frn
British Sky Broadcasting PIC
British lelecornrnunications I’lc Citigroup Inc 7.625 Yt 03/04/2018 Compass Group PIC 7.125 YG 1 Y/01/2010 Countrywide Fin1 5.125 % Emtn 17/0.?/2011 Gbp Dcutsche Telekorn lntl Fin Bv 6.25 96 09il2/2010 Dnb Nor Bank A w 7.25 % 73;06/ 2020 Dnb Norbmk Asa 6.01 16% 29/03/2049 France Telocom 7.5% 14/03/2011 Ga;. Capital Sa Emtn Gen Elec Cap C o p 6.5 % 15/09/7067 Global Crossing Uk Finance PIC 11 -75% 15/12/2014
Hhos Capital Fdg 1% 31/03/2049 ltv PIC Erntn 6 125% 05/01/2017 Lehman Brothers Hldys 6 % 25/01/2013
500,000 250,000
400,000
500,000
470,000
21 0,000
400SJCO
375,000 425,000 160,OCO
400.0c0
430,000
400,000 350.000 403,000 250,000
300.000
370.000
i W.O(M
460.000
138,000
270.000 450,000 470.000
370.000
230,000
410,000 350.000
400,000
507.904 187,079
410.015
403,128
446,133
203,925 380.192
331.486 399,454 163.0>2
387.142
428,159
3m 31 4 267,753 406,139 263 984
306.197
370.295
88.320
451,490
138,834
236,260
459.1 79 434.974
344.1 56
227,700 41 7,579
286.725
355,960
1.56 0.56
1.26
1.24
1.37
0.63 1.17 1.02
1.23 0.50
1.19
1.32
1.19 0.82 1.25
0.81 0.94
1.14
0.27
1.39
0.43
0.73 1.41
1.34
1.06
0.70
1.78 0 88
1.09
Lloyds Tsb Bank 6.09063 % 29:04/2016 Merrill lynch + Co 7.75 Yo 30/’04/2018 Northern Rock 5.625 YG 13/01/2015 Poland Government International Bond 5.63% 18/li/2010 Reseau Fcrre De France 4.75 % 25!01/2011 RI Finance Bonds Frn Perp Gbp 1000 Royal And Sun Alliance Group 1 % 29/07/2049 Santandcr Issuances S A 6.5325 % 24/10/2017 Scottish Widows PIC Fm 2949 (Porp)
Shinsei Bank 5% 0611 212049
Standard Chartered Bank
Svenka Handelsbanken Ab 1 % 31/12/2049 Svenska Handolsbkn 5.375 % 04/09/2049 Telecorn ltalia Spa 5.625 % 29/12/2015 Telefonica Eniision 5.888% 31/01/2014 Tharries Water Utilities Cayman 7.241 % 09/04/2058 Unicredito Italimo Spa Erntn
Vdafone Group Plc 4.625 % (Mtn) 06/09/14 Washington Mut Bk 5.5 % 10/06/2019 Wessex Water Scrviccs 5.875 YO 30/03/2009
400,000
300.000 380.000
690,000
I .ooo.ooo
190.000
230.000
350.000
270.000 100,000 310,000
460,000
200,000
350,000
350.000
300,000
300.000
410,000
200,000
500,000
382.033
281.481 320.034
679.139
964,310
157.837
235.1 12
340,340 229,037
145.529 307.526
426,512
179.346
314,065
332.518
299,096
290,571
363,800
136,264
496.258
1.17
0.87 G.98
?.09
2.97
0.49
0.72
1.05 0.70 0.45
0.94
1.31
0.55
0.97
1.02
0.93 0.89
1.12
0.42
1.53
16,569,996 50.95
USD Bonds
Ford Mtr Cr Co 5.625 96 0: /I 012008 200,000 98,942 0.30 Hbos PIC 144A 796,000 352,272 1.09 Hbos PIC 6.75 % 21/05/2018 300,OCU 146,474 0.45
597,688 1.84
Total Bonds 19,384,407 59.61
NOK Equities Mpu Offshore Litt 1.500.000 66.896 0.21
66,896 0.21
Total Equities 66,896 0.21
Total Transferable securities admitted to an official exchange listing 19,451,383 59.82
1 !
!
,
1 1 1 1 1
1
The accompanying notes form an integral part of these financial statements.
182
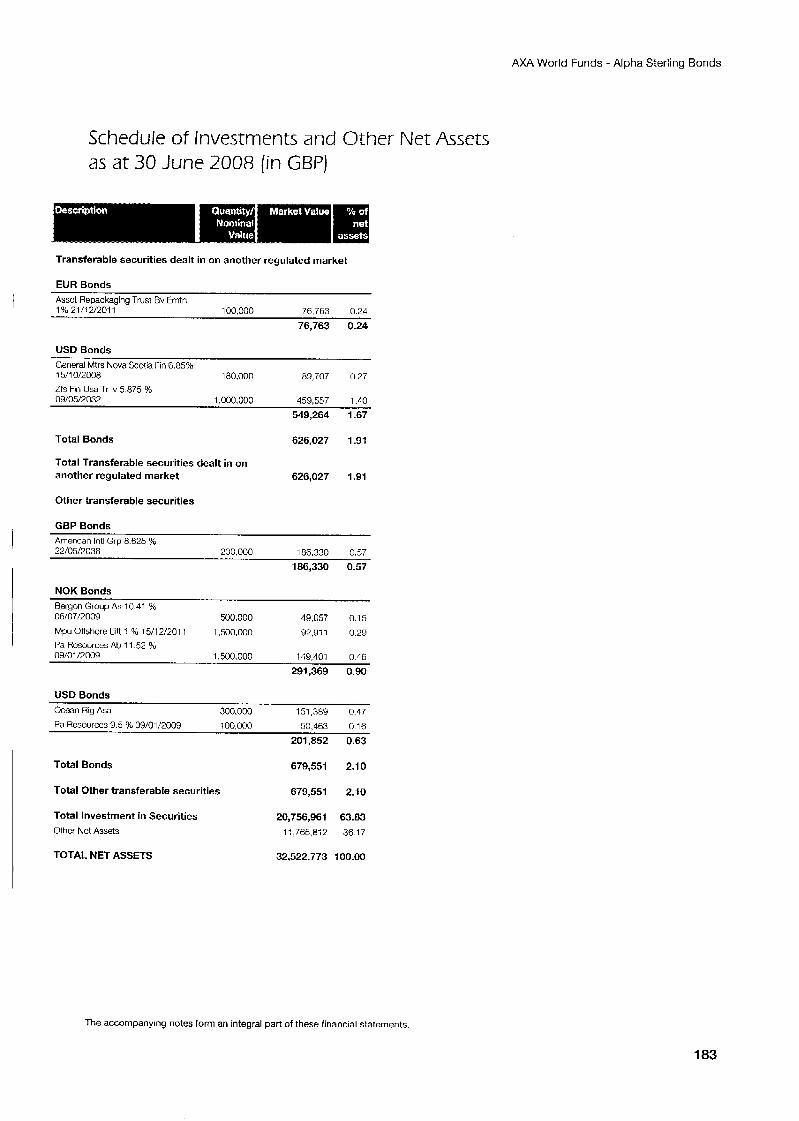
AXA World Funds - Alpha Sterling Bonds
Schedule of Investments and Other Net Assets as at 30 June 2008 (in GBP)
Transferable securities dealt in on another regulated market
EUR Bonds Assct Repackaging Trust Bv tmtn 1% 21/i2/2011 100,000 76,763 0.24
76,763 0.24
USD Bonds General Mtrs Nova Scotia Fin 6.85% 15/10/2008 180.000 89,707 0.27 Zfs Fin Usa Tr Iv 5 875 % 09/05/2032 1,000,000 459,557 1.40
549,264 1.67
Total Bonds 626,027 1.91
Total Transferable securities dealt in on another regulated market 626,027 1.91
Other transferable securities
GBP Bonds American lntl Grp 8.625 % 22/05/2038 200.000 I R R . ~ ~ n s 7
186,330 0.57
NOK Bonds Bergcn Group As 10.41 % 06/07/2009 500.000 49,057 0.15 Mpu Offshore Lift 1 96 15/12/2C11 1,500,000 92,911 0.29 1% Rcsources Ab 11 5 2 % 09/01 /2009 1,500.000 149,401 0.46
291,369 0.90
USD Bonds
Ocean Rig Asa 300,000 151,389 0.47 Pa Resourccs 9.5 % 09/01/2009 100.000 50,463 0.16
201,852 0.63
Total Bonds 679,551 2.10
Total Other transferable securities 679,551 2.10
Total Investment in Securities Other Nct Assets
20,756,961 63.83 1;,765.812 36.17
TOTAL NET ASSETS 32,522,773 100.00
The accompanying notes form an integral part of these financial statements.
183
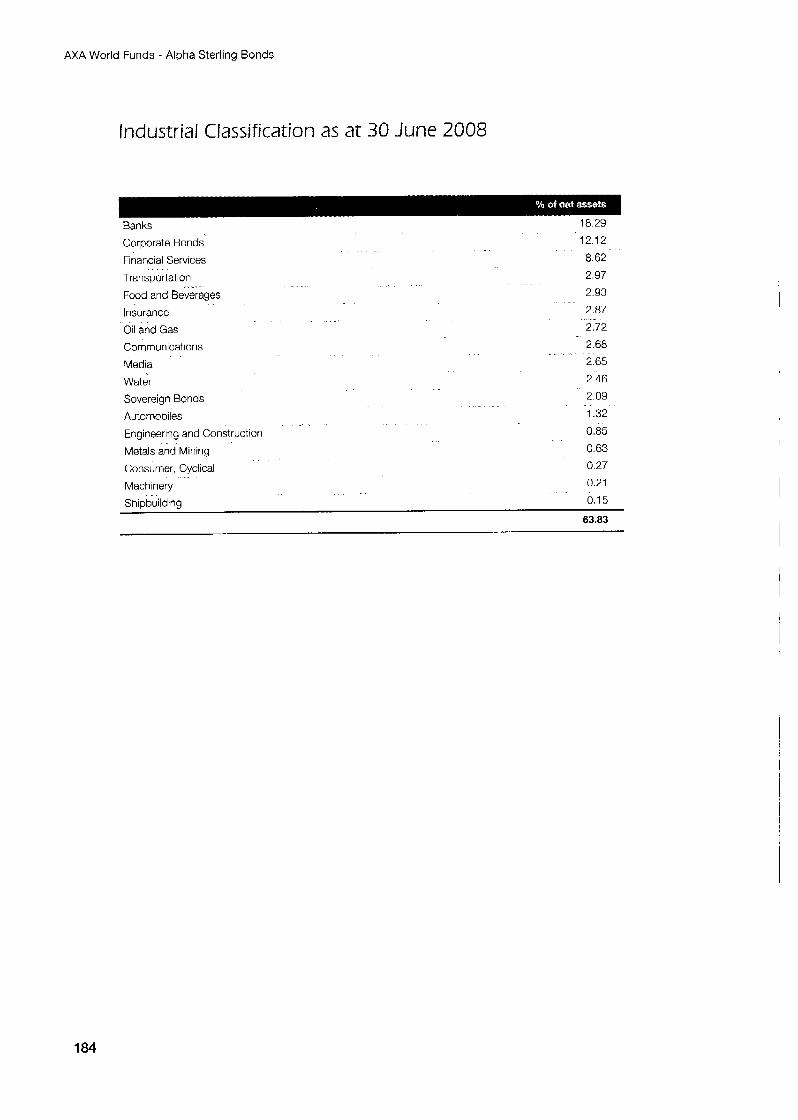
AXA World Funds - Alpha Sterling Bonds
Industrial Classification as at 30 June 2008
Banks 18 29
Corporate Bonds
Financial Services
Transportation
Food and Beverages
12 12
8 62 2.97
2.93 Insurance 2 87
Oil and Gas 2 72
Communications 2 68
Media 2 65
Water 2 46
Sovereign Bonds 2 09 Automobiles 1 32
Engineering and Construction 0.85
Metals and Mining 0 63 Consumer, Cyclical 0 27
Snipbuilding 0.15
63.83
Machinery 0 21
1 84
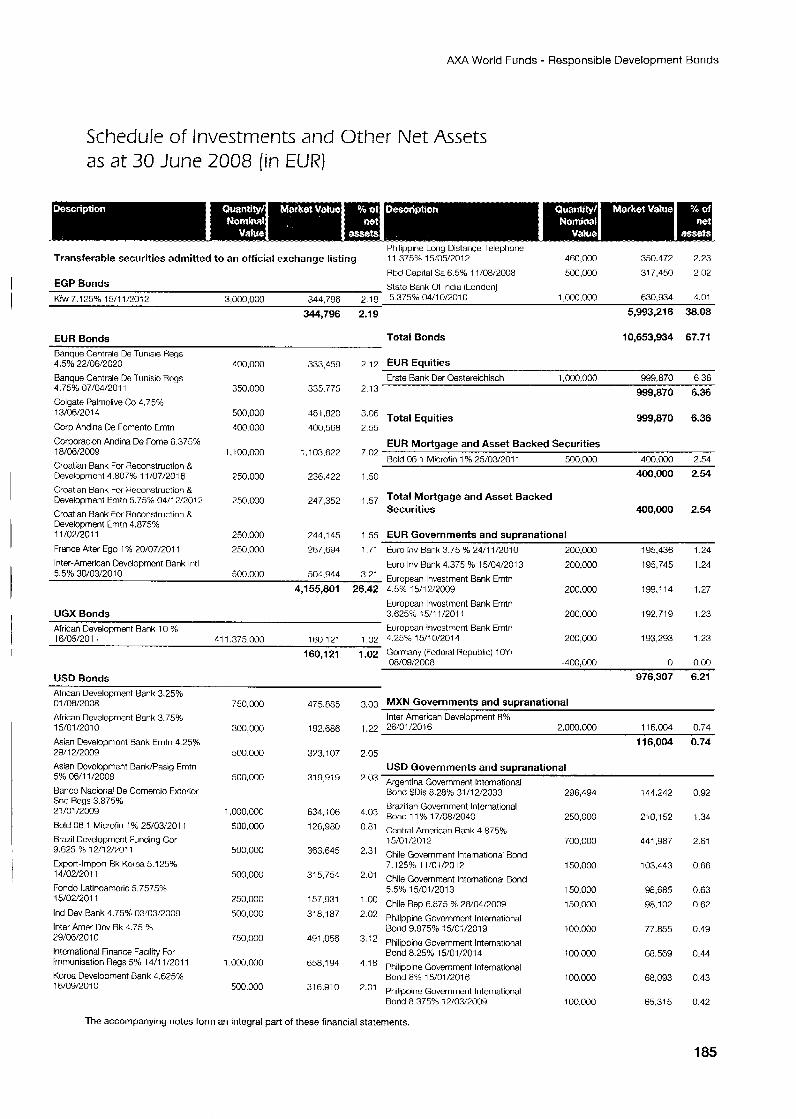
A M World Funds - Responsible Development Bonds
Schedule of Investments and Other Net Assets as at 30 June 2008 (in EUR}
Philippine Long Distance Telephone Transferable securities admitted to an official exchange listing 11.375% 15/05/2012 46C,OOO 350.472 2.23
Rbd Capital Sa 6.5% 11/08/2008 50C.000 317,450 2.02 EGP Bonds
KfW 7.1 25% 15/11/2012 3,000.000 Statc Bank Of India (London)
344,796 2.19 5.375% 04/10/2010 1 ,00c,ooo 630,934 4.01
344,796 2.19 5,993,216 38.08
EUR Bonds Total Bonds 10,653,934 67.71
Banque Centrale De Tunisie Regs 4.5% 22/06/2020 ~00.000 333,459 2.12 EUR Equities Banqve Centrale De lunisic Hcgs [Irste Rank Der Oestereichisch 1,000,000 999,870 6 3 6
999,870 6.36 4.75% 07/04/2011 350,000 335.775 2.13 Colgate Palmolive k 4.75%
Corp Andina De Foment0 Emtn 400.000 400.568 2.55 481B20 3.06 Total Equities 13/06/2014 500.00c 999,870 6.36
Corporacion Andina De Fome 6 375% 18/06/2009 1 ,100,000 : ,103,622 7 02 Croatian Bank Fur Reconstruction &
EUR Mortgage and Asset Backed Securities Bold IX 1 Microfin 1 % 25/03/2011 500,000 400,M)O 2.51
Development 4.807% 11/07/2016 ?50.000 236,422 1 5 0 400,000 2.54
Croatian Rank For Feconstruction 8 Development Emtn 5.75% 0411 212012 750.000 247,352 ,57 Total Mortgage and Asset Backed
Croatian Bznk For ncconstruction 8, Securities 400,000 2.54 Development Emtn 4.875%
France Alter Ego 1 % 20/07/2011
i 1 /WROll 250,000 244,145 1.55 EUR Governments and supranational 250,000 267,694 1.71 turo Inv Bank 3.75 % 24/11/2010 200.000 195,436 1.24
Inter-American Devclopmcnt Bank Intl Euro Inv Bank 4.375 % 15/04/20? 3 200,000 195.745 1.24 5 5% 30/03/20 10 500,000
4,155,801 26.42 4 5% 15/17/2009 200.000 199,114 1.27 50L,944 21 European Investment Bank Emtn
Europcan lnvostmcnt Bank Emtn
European Invcstmcrrt Bank Erntri UGX Bonds 3.625% 15/11/2011 200.000 192.719 1 2 3 African Development Rank 10 % 16/05/2011 11 1.375 000 16[) 171 1 0 7 4 25% 15/10/2014 200,000 193,293 1 2 3 . . , . .-
1 6 0 , ~ 21 1.02 Gcrn:any (Fcdoral Rcpublic) 1 OYr 08/08/2008 -400.000 0 0.00
USD Bonds 976,307 6.21
African Development Bank 3.25% 01 /O8/2008 750,000 475,885 3.03 MXN Governments and supranational
African Development Bank 3.75% 15/01 /20i 0 300,000 192.686 1.22 26/01/2016 2.000.000 116.C04 0.74
Asian Development 3ank Erntri 4.25% 116,004 0.74 29/ 12/2009 500,000 373.107 2.05
Inter American Development 8%
Asian Dcvclopment BanWPasig Emtn USD Governments and supranational 500,000 31 9,9'9 2."3 Argentina Government lntcrnational 5% OW1 1 /2008
Banco Naciorial De Comercio Exterior Snc Regs 3.875% 2: /01/2009 Bold 06 1 Microfin 1% 25/03/2011 Brazil Development Funding Cor 9.625 % 12/12/7011 Export-Import Hk Kotca 5.125% 14/02/2011 Fondo I-atinoamcric 5.7575% 15/02/2011
Ind Dev Rank 4.75% 03/03/2009 Inter Amer Ucv Rk 1.75 % 29/06/2010 International Finance Facility For Inifnunisation Regs 5% 14/1 1/2011 Koroa Development Rank 4.625% 16/09/2010
1,000,000 500,uOO
500,000
500,000
750,000
500,OOC
750,000
1.000,000
500.000
fi3d,i06 126,980
363.645
315,751
157.931 3:8.187
491,056
658.1 91
31 6.9: 0
4.03 0.81
2.31
2 01
1 .OO 2.07
3.:2
4.18
2.01
Bond $Dis 8.28% 31/12/2033 Bruilian Government International Bond 1 1 % 17/08/2040 Central American Rank 4.875% 15/01 /2012 Chile Government International Bond 7.125% 11/01/7012 Chile Government International Bond 5.5% 15/01/2013
Chile Rep 6.875 % 28/04/2009 Philippine Government Inlornational Bond 9.875% !5/0:/2019 Philippine Government International Bond 8.25% 15/01/7014 Philippine Government International Bond 8% 1 YO1 /2016 Philippine Government International Bond 8.375% 12/03/2009
296,494
250,000
700,000
150,000
150,000 150,000
100,000
100,000
100,000
100.000
144,242
2i 0,152
441.987
103,443
98,685
98,102
77.055
68.569
68,093
65.315
0.92
1.34
2.61
0.66
0.63 0.62
0.49
0.44
0.43
0.42
The accompanying notes form an integral part of these financial statements.
1 85
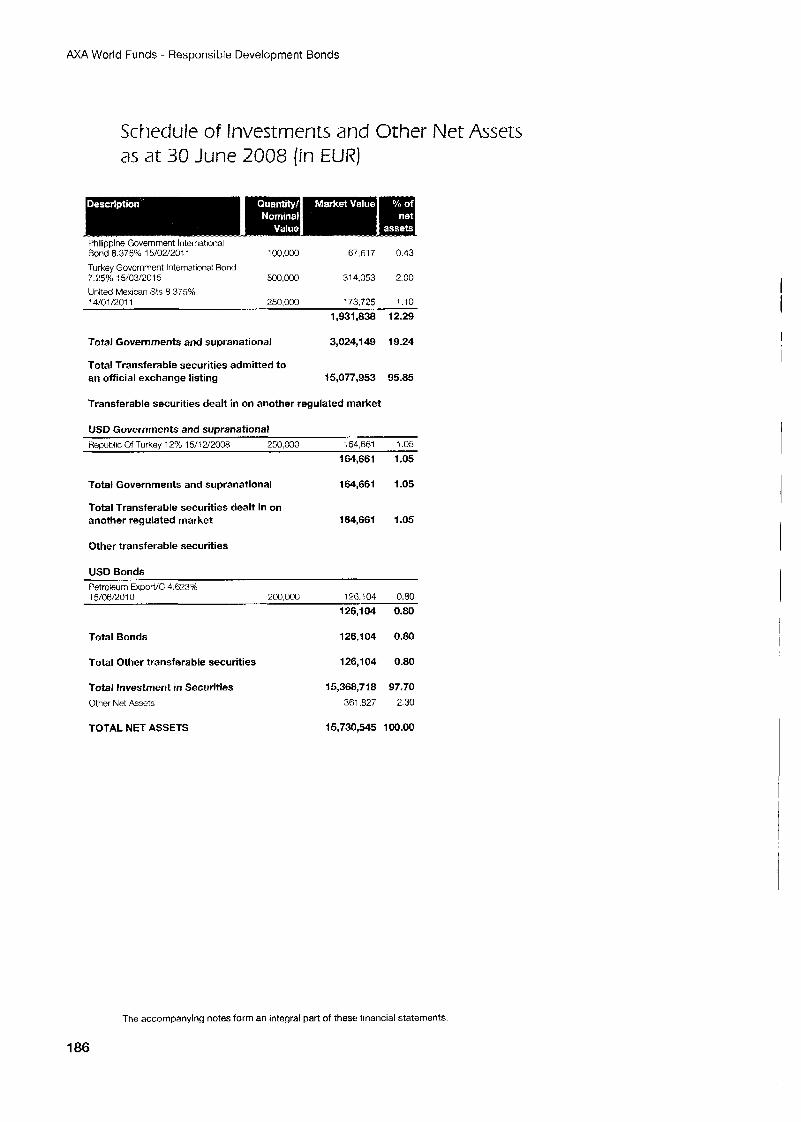
AXA World Funds - Responsible Development Bonds
Schedule of Investments and Other Net Assets as at 30 June 2008 (in EUR)
Bonb'8.37596 15/02/2011 100,000 67,617 0.43 Turkey Government International Bond 7.%5% !5!03/2015 500,000 314,053 2.00
United Mexican Sts 8.375% 14/01 /2011 250.000 173.725 1.10
1,931,838 12.29
Total Governments and supranational 3,0241 49 19.24
Total Transferable securities admitted to an official exchange listing 15,077,953 95.85
Transferable securities dealt in on another regulated market
USD Governments and suoranational ~ ~~
Heoublic Of Turkev 12% 15/12/2008 250.000 164,661 1.05
164,661 1.05
Total Governments and supranational 164,661 1.05
Total Transferable securities dealt in on another regulated market 164,661 1.05
Other transferable securities
USD Bonds Petroleum ExporWC 4.623136 15/06/2010 200.000 126.!04 0.80
126,104 0.80
Total Bonds 126,104 0.80
Total Other transferable securities 126,104 0.80
Total Investment in Securities Other Net Assets
15,368,718 97.70 361.827 2.30
TOTAL NET ASSETS 15,730,545 100.00
The accompanying notes form an integral part of these financial statements.
1 86

AXA World Funds - Responsible Development Bonds
Industrial Classification as at 30 June 2008
Banks Corporate Bonds
22.80
22.62
Sovereign Bonds 20.29 Financial Services
Multi-National
Consumer, Non-cyclical
18.40
5.76
3.06 Mortgage and Asset Backed Securities 2 51 Communications 2.23
97.70
187
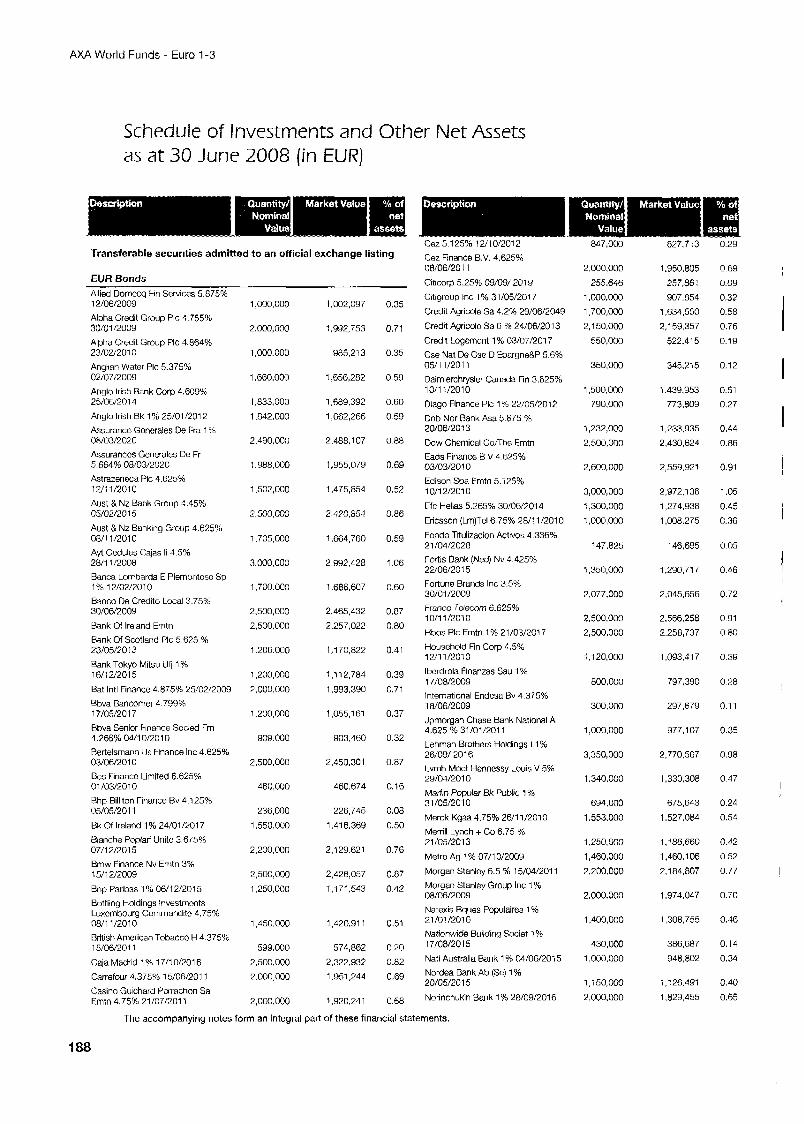
AXA World Funds - Euro 1-3
Schedule of Investments and Other Net Assets as at 30 June 2008 (in EUR)
Transferable securities admitted to an official exchange listing
EUR Bonds Allied Domccq kin Services 5 875% 12/06/2009 Alpha Crodit Group PIC 4 755% 30/01/2004 Alpha Credit Group PIC 4.864% 23/02/201 I: Anylian Water PIC 5.375% 02/07:2009 Anglo Irish Bank Corp 4.609% 25/06/2014 Anglo Irish Bk 1 Cib 25/01/2012 Aysurance Gcnerales De Fra 1 % 08/03/2020 Assurancos Generales De Fr 5.664% 08:03/202C Astrazeneca PIC 4.625% 12/11/?010 Aust & N7 Bank Group 4.45% 05/02/2015 Aust & Nz Banking Group 4.6259: 08/1 1/2010 Ayl Ccdulas Cajas Ii A . 5 % 28/1 i/2008
Bmca Lorrbarda E Piemontcsc Sp 1 % 12/02/201 G Banco De Credito Local 3.75% 30/06/2009 Bank uf Ireland Emtn
Bank Of Scotland PIC 5.625 % 23/05/2013 Bank Tokyo Mitsu Ufl 1 %
Bat lntl Finance 4 875% 25/02/2009 16/i 2/2015
Bbva Bancorner 4.799% 17/05/2017 Rbva Senior Finance Socied rrn 4.766% 04/10/2010 Rertelsmann Us Finance Inc 4.62596 03/06/2010 Res Finaricc Limited 6.625% C1/03/2010 Rhp Billiton Finance Bv 4.125% 05/05/2011 Bk of Ireland 1 % 24/01 /2017 Bleiche Poplari Unite 3.675% 07/1 a201 5 Bmw Finance Nv Erritn 3% 15/12/2009 Bnp Paribas 1% 06/12/2015 Bottling Holdings lnvestmcnts Luxembourg Commandite 4.75% 08/11/2010 British American Tobacco H 4.375% 15/06/2011
Cala Madrid 1 ?A 17/10/2016 Carrefour 4.375% 15/06/2011 Czsino Guichard f'crrachon Sa Emtn 4.75% 21/07/2011
1,000,000
2.000,000
,000.000
,660,000
,833,000 ,842,000
.490.000
1,388,000
1,502,000
2,500,000
1,705,000
3.000,OCO
1,700.000
2.500,000
2,500,000
1,206.000
1,200,000
7,000,000
1.200.000
909.000
2.500.000
460,000
236,0110 1.550.000
2,200,000
2,500,000 1,250,000
1,450,000
599,000 2,500,000 7.000.000
2,000,000
1 ,M32,097
1,992,753
985.213
1,656,282
1,689 392 1,662,266
2,488.107
1,955,079
: ,475,654
2,420,854
1.664.760
2.992.428
1,686.607
2,465,432
2,257,022
1,170,822
1,112.784 1,993,390
1,055.161
903.460
2.450.301
460.674
226,745 1.416.369
2,129.621
2,426,057 1,171,543
1,420.91 1
574,862 2.322.932
1,951,244
1,920,241
0.35
0.71
0.35
0.59
0.60
0.59
0.88
0.69
0.52
0.86
0.59
1.06
0.60
0.87 0.80
0.41
0.39 0.71
0.37
0.32
0.87
0.16
0.08
0.50
0.76
0.87 0.42
0.51
0.20 0.82 0.69
0.68
Cez 5 125% 12 10/2012 647,000 0 29 Cez Finance B.V. 4.625% 08/06/2011
Citicorp 5.25% 09/09/ 20019 Citigroup Inc 1 % 31/05/2017 Credit Agricole Sa 4.2% 29/06/2049 Credit Agricolc Sa 6 % 24/0W2013 Credit Logcinent 1 % 03/07/2017 Cse Nat De Csc D Epargne8P 5.6% 05/11/2011 Daimlerchrysler Canada Fin 3.625% 10/11/2010 Diago Finance PIC 1 % 22/05/2012 Dnb Nor Rank Asa 5.675 % 20/06/2013 Dow Chemical Conhe Erntn Lads Finance B V 4.62596 03/03/2010 Edison Spa Erntn 5.1;15% 10/12/2010 Ffc Hellas 5.265% 30!06/7014
Cricsson (Lm)Tel6.75% 28/11/2010 Fondo Titulizacion Activos 4.336% 21 /04/2028 Fortis Bank (Ned) Nv 4.425% 22/06/2015 rorturro Brands Inc 3.5% 30/01/2009 Francc Tdecom 6.625% 10/11/2010 Hbos PIC Erntn 1 % 21/03/2017 Household Fin Corp L5% 12/11/2010 lberdrola Finanzas Sau 1 % 17/08/2009 International Endcsa Bv 4.375% 18/06/2009 Jpmorgan Chase Bank National A 4.625 % 31/01/2011 Lehman Brothers Holdings I 1 % 26/09/ 201 6 I rmh Moet Hcnnessy Louis V 5% 29/04/2010 Marfin Popular Bk Public 1 % 31/05/2010 Merck Kgaa 4.75% 26/11/2010 Merrill Lynch + Co 6.75 "/o 21/05/2013 Metro Ag 1 % 07/10/2009 Morgan Stanlay 6.5 % 15/04/2011 Morgan Stanley Group Inc 1 ?h 08/06/2009 Natexis Bques Populaires 1 % 21/01 /2016 Nationwide Building Societ 1% 17/08/2015 Natl Australia Bank 1 % 04/06/20i 5 Nordoa Bank Ab (Se) 1 % 20/05/2015 Norinchukin Bank 1 % 28/09/2016
2,000,000
255.646 1,000,000 1700,000 2,150.000
550.000
350,000
1.500.000 790,000
1,232,000
2,500,000
2,600,000
3,000,000 < ,300.000
1 .ooo.ooo
147.825
1.350.000
2,077,000
%.50C,OOO 2,500,000
1.120,000
800.000
300,OCQ
1,000,000
3,350,000
1,340,000
694.000 1,553,000
1,250,000
1,460.000 2.200.000
2.000.000
1.400.000
430,000 1,000,000
1,150,000
1,000,000
827,713
1,950,805 257,86? 907.854
1,634,550 2.1 59,357
522.415
345.215
1.439353
773,809
1,233,935
2,430,624
2,559,921
2,972,136
1,274.938 1,008.275
146,695
1.290.71 7
2,045,656
2.566258 2,258,737
1,093,417
797.390
297,679
977,107
2,770,567
1,330.308
675.643 1,527,084
1,186,660 1,460,106
2,184,807
1,974,047
1,308.755
386.687 948,802
1,126,491 1,829,455
0.69 0.09
0.32 0.58
0.76 0.19
0.12
0.51 0.27
0.44 0.86
0.91
1.05 0.45
C.36
0.05
0.46
0.72
0.91
0.80
0.39
0.28
0.11
0.35
0.98
0.47
0.24
0.54
0.42
0.52 0.77
0.70
0.46
0.14
0.34
0.40 0.65
I
I
I
I 1
1 1
1
1
1
The accompanying notes form an integral part of these financial statements.
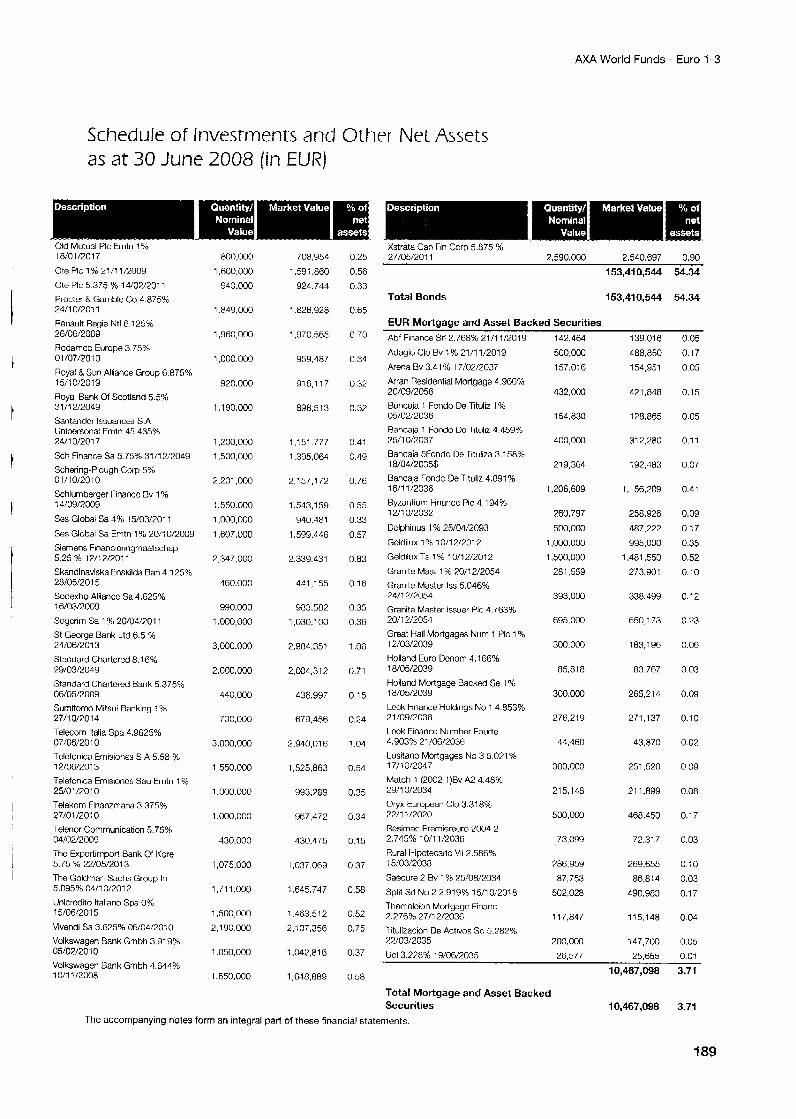
AXA World Funds - Euro 1-3
Schedule of Investments and Other Net Assets as at 30 June 2008 [in EUR)
1 WOl/2017 Ote PIC 1% 21/11/2009 Ote PIC 5.375 % 14/07/7011 Procter 8 Gamble Co 4.875% 24/10/2011 RQmult Regie Ntl 6.125% 26/06/2009 Rodamco Europe 3 75% 01 /070010 Royal &Sun Alliance Group 6.875% 15/: 0/2019 Royal Bank of Scotland 5.5% 31/1 Z2049 Santandcr Issuances S.A llnipersonal Emtn 45.435% 74/10/2017 Sch Finance Sa 5.75% 31/12:20a9 Schering-Plough C ~ r p 5% 01/10/2010 Schlumberger Finance Bv 1 % 14/09/2009 Sos Global Sa 4% !5/03/2011
Ses Global Sa Emtn 1 % 20/i 0/2009 Siemens Financicringmaatschap 5.25 % 12/12/2011 Skandinaviska Enskilda Ban 4.12595 28/05/2015 Sodexho Alliancc Sa 4.625% 16/0:3/2009
Soycrirn Sa 1% 20/04/7011 St George Bank I.td 6.5 % 24/06/2013 Standard Chartered 8.16% 29/03/2049 Standard chartered Bank 5.375% 06/05/2009 Sunitomo Mitsui Banking 1 % 27/10/70 14 Telecom ltalta Spa 4.9625% 07/06/2010 Telefonica Emisiones S A 5.58 YO 12/06/2013 Telefonica Emisioncs Sau Entn 1 % 25/01/2010 Telekom Finanzmana 3.375% 27/01/20: 0 Telenor Communication 5.75% 04/02/2009 The Exportimport Bank of Kore 5.75 % 22/05/2013 The Goldman Sachs Group In 5.095% 04/10/2012 Unicrcdito ltaliano Spa 0% 15/06/2015 Vivendi Sa 3.625% 06/04/2010 Volkswagen Bank Gnbh 3.91 9% 05/0?/2010 Volkswagen Bank Gmbh 4.64A% 10/11/2008
800.000 1,60C.000
940.000
1.849.000
1,960,000
1.000.000
920,000
1,190.00c
1,200,000 1,500,000
2,201,000
: ,550.000 1,000,000
1.607.000
2,347,000
460.000
990,000 1,000,000
3,000.000
2.000.000
440,000
700,000
3.000.000
1,550,000
1,000.000
1,000,000
430,000
1,075 000
1.71 1,000
1,500,000
2.1 90.000
1,050,000
1 650,000
708.954 1.59; ,860
924.744
1.826,928
‘.970.565
959.487
916,117
RSX,~: 3
1.151.777 1,395,064
2.157.1 72
1,543,159 940.481
1599.446
2.339.L31
441,155
983.582 1,030,100
2,984.35 1
2,004,31?
436,997
679.456
2,940.01 6
1,525,863
993,789
967.472
430.475
1,037,069
!.645.747
1,463,512
2,107.356
1.04Y.81 6
1,648,889
0.25 0.56
0.33
0.65
0 70
0.31
0.32
0.37
0.41 0.49
0.76
0 55 0.33
0.57
0.83
0 lti
0 35 0.36
1.06
0.71
0.15
0.74
1.04
0.54
0.35
0.34
0.15
0.37
0.58
0.52 0.75
0.37
0.58
Xstrata Can Fin Corp 5.875 % 27/05/2011 7,590,000 2.540.697 0.90
153,410,544 54.34
To ta l Bonds 153,410,544 54.34
EUR Mortgage and Asse t B a c k e d Securities Abf Finance Slr 2.768% 21/11!2019 142.464 139,016 0.05 Adagio Clo Bv 1% 21/11/2019 Arena Bv 3.41 % 17/02/2037 Arran Residential Moriyage 4.966% 20/09/2056 Bancaja 1 Fondo De Tituliz 1 % 05/02/2036 Bancaja 1 fond0 Dc Tituliz 1.459% 75/10/7037 Bancaja Sfondo De iituliza 3.158% 1 8/0w%035$ Bancaja Fondo De Tituliz 4.891 % 1611 112036 Byzantiuw hnancc PIC 1.1 94% 12/10/2032 Delphinus 1 % 25/04/2093 Goldilux 1 % 10/12/2012 Geldilux 1 s 1 % 1 O/i 2/2012 Granite Mast 1 % 20/12/2054 Granite Master Iss 5.046% 2C/: 2/2054 Granite Master Issuer f’lc 4.763% 20/12/2054 Grezt Hall Mortgages Num 1 I% 1 % 12/03/2039 Holland Euro Dcnom 1.166% 16/05/2039 Holland Mortgage Backed Se 1 %
Lcck Finance holdings h‘o 1 4.853% 21/09/2038 Lcck Finance Number Foiirte 1.903% 21/06/2036 Lusitano Mortgages No 3 5.021 y.6 17/: 012047 Match 1 (2002 1)Bv A2 4.48% 29/10/2034 Oryx European Clo 3.31 8% 22/11/2020 Resirnac Premiereuro 2004 2 2.745% !0!11/2036 Rural liipotecario Vii 2.586% 15/03/2038 Saecure 2 Bv 1 % 75/08/2034
Split Sri No 2 2.91 9% 15/10/2018 l~hemclcion Mortgage Financ 7.276% 27/12/2036 7itulizacion De Activos Sc 5.782% 77/03/2035 Uci 3.228% 19/06/2035
I a /ow039
500,000 157,016
432.000
154.830
400,003
219,364
;.206,609
260.797
500.000 1,000,000
1,500.000 281,559
393,000
695.000
300.000
85,818
300.003
276.219
11.160
300,OCO
21 5,148
500,003
73,099
786.959 87.753
502,028
11 7,847
200,om
26.577
488,850 154,951
421.848
178.865
31 2.280
192.483
1,156,209
258,926
487,222 995,000
1.481.550 273,901
338,499
650,173
183.196
83 767
265,114
271,137
43.870
251,520
21 1,899
468,450
72.31 7
269.655 86.814
490,983
115,148
147.700
25 655
0.17 0.05
0.15
0.05
0.1 1
0.07
0.41
0.09
0.77
0.35 0.52 0.10
0.12
0.73
0.06
0.03
0.09
0.10
0.07
0.09
0.08
0.17
0.03
0.10 0.03 0.17
0.04
0.05 0.01
10,467,098 3.71
Total Mortgage and Asset Backed Securities 10,467,098 3.71
The accompanying notes form an integral part of these financial statements.
189
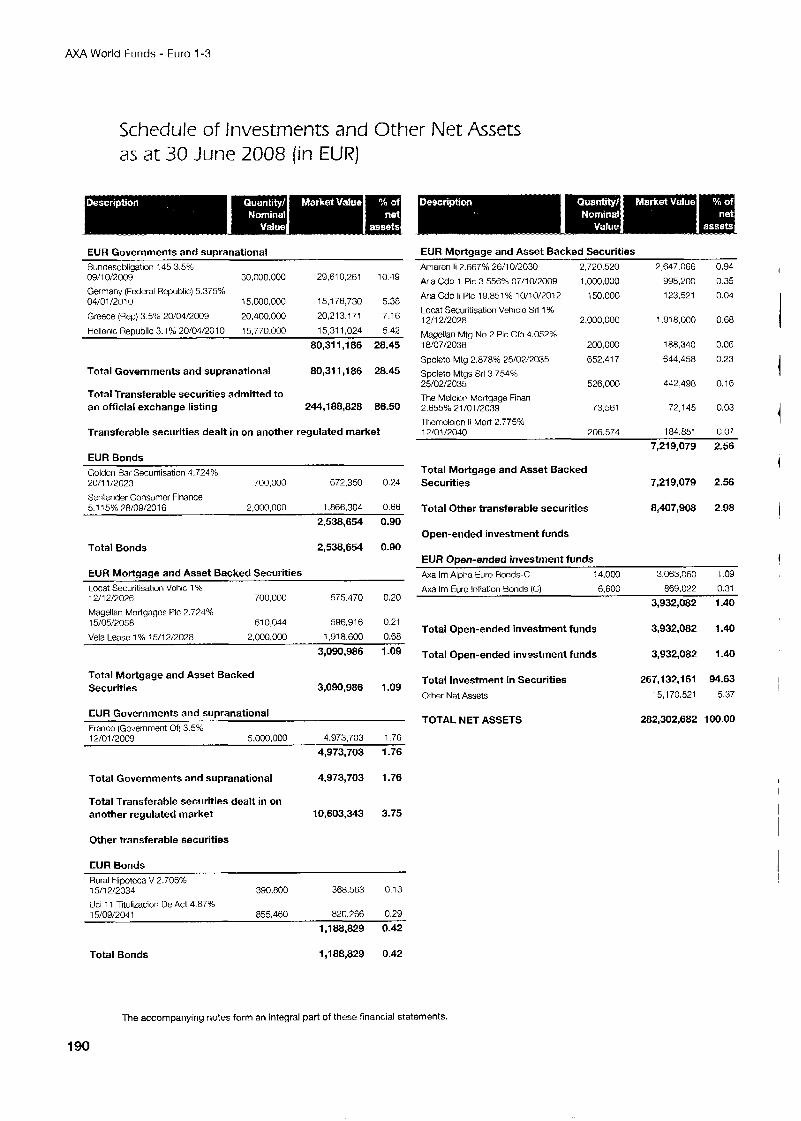
AXA World Funds - Euro 1-3
Schedule of investments and Other Net Assets as at 30 June 2008 (in EUR)
EUR Governments and supranational Bundesohligation 145 3.5% 0911 0/%00Y 3C.000.000 29.610.261 10.49 Germany (Federal Republic) 5.375% 04/01/20!0 15.M)O.OOO 15,176.730 5.38
Greece (Rep) 3.5% 20/04/2009 20,400,000 20,213,171 7.16
Hcllenic Renuhlic 3.1 % 20/04/2010 15.770.000 15.31 1.024 5.42
80,311,186 28.45
Total Governments and supranational 80,311,186 28.45
Total Transferable securities admitted to an official exchange listing 244,188,828 86.50
Transferable securities dealt in on another regulated market
EUR Bonds Goldcn Bar Securitisation 4.724% 20/111'2023 700.000 672,350 0.94
Santander Consumcr Finance 5.1 15% 28/09/2016 2,000,000 1.866.304 0.66
2,538,654 0.90
Total Bonds 2,538,654 0.90
EUR Mortaaae and Asset Backed Securities ILocat Securitisativn Vchic 1 % 12\12/2026 700,000 675.470 0.20
Magellan Mortgagcs PIC 2.724% 15/05/2058 61 0,044 596,916 0.21
Vela Lease 1 : 5/12:2028 2.000.000 1.918.600 0.68
3,090,986 1-09
Total Mortgage and Asset Backed Securities 3,090,986 I .09
EUR Governments and suoranational Frarrcc (Government Of) 3.5% 12/01 /2009 5.000.000 4.973.703 1.76
4,973,703 1.76
Total Governments and supranational 4,973,703 1.76
Total Transferable securities dealt in on another regulated market 10,603,343 3.75
Other transferable securities
EUR Bonds Rural Hipotccs V 2.706% 15/12/2033 390,800 368.563 0.13
Uci 11 Tilulizacion De Act 4.87% 15/09/204 1 855,460 820,266 0.29
1 ,I 88,829 0.42
Total Bonds 1,188,829 0.42
EUR Mortgage and Asset Backed Securities Amarer li 2.667% 26/10/2030 2,720,520 2,647.066 0.94
Aria Cdo 1 PIC 3 556% 07/10/2009 1,000,000 998.200 0.35 Aria Cdo li PIC 19.851% 10/10/2012 150,000 123,521 0.04
Locat Securitisation Vehiclo Sri 1 % 1 2/12/2028 2.000.000 1.918.000 0.68
Magellan Mtg No 2 PIC Clb 4.052% 18!07/2036 200.000 188,340 0.06
Spoloto Mtg 2.878% 25/02/2035 652,417 644,458 0.23
25!02/2035 526,000 442.498 0.16 Spoleto Mtgs Srl 3.754%
The Mclcion Mortgage Finan 2.65596 21/01/2039 73,561 72,145 0.03
Thcmclcion li Mort 2.775% 12'01/2040 206,574 184.851 C.07
7,219,079 2.56
Total Mortgage and Asset Backed Securities 7,219,079 2.56
Total Other transferable securities 8,407,908 2.98
Open-ended investment funds
EUR Own-ended investment funds Axa Im Alpha Euro Bonds-C 14,000 3.063.060 1-09 Ax3 Im Euro Inflation Bonds fC) 6.600 869.022 0.31
3,932,082 I .40
Total Open-ended investment funds 3,932,082 1.40
Total Open-ended invsstment funds 3,932,082 1.40
Total Investment in Securities 267,132,161 94.63 Other Net Assets 25,170.521 5.37
TOTAL NET ASSETS 282,302,682 100.00
The accompanying notes form an integral part of these financial statements.
190
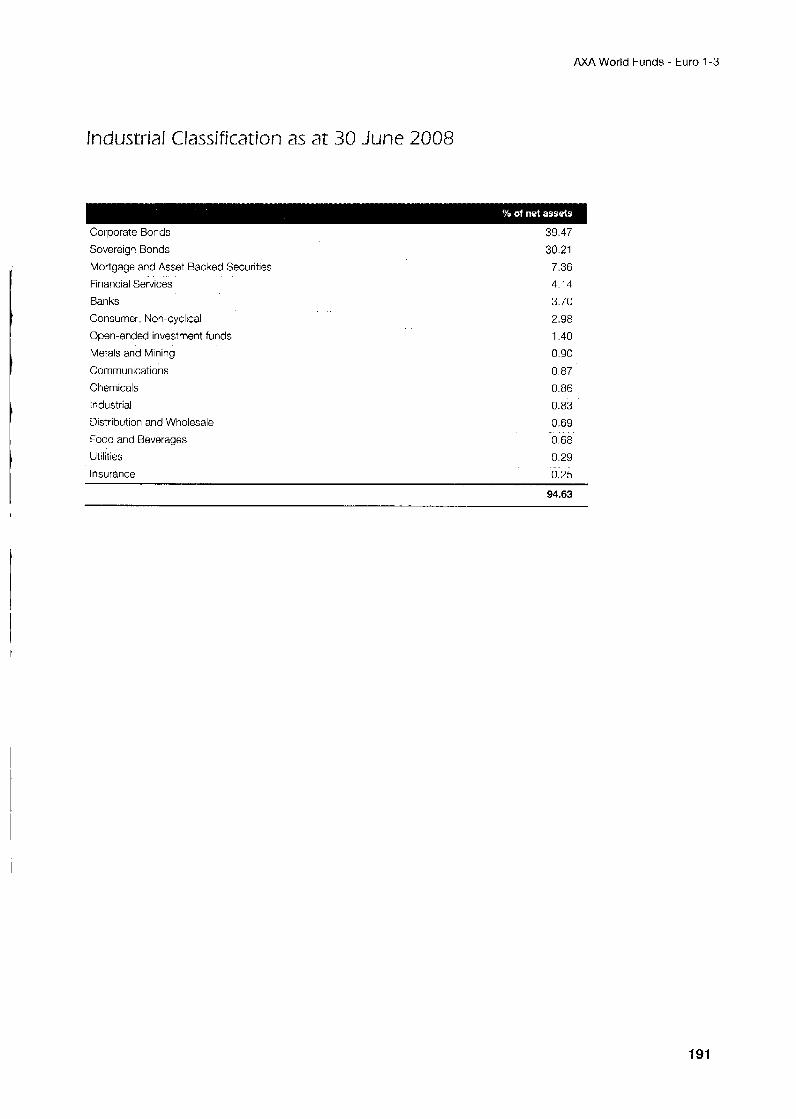
AXA World Funds - Euro 1-3
Industrial Classification as at 30 June 2008
Corporate Bonds 39.47 Sovereig? Bonds
Mortgage and Asset Backed Securities
Financial Services
Banks
Consumer, Non-cyclical
Open-ended investment funds
Metals and Mining
30.21 7.36
4.14
3.70
2.98
1.40 0.90
Communications 0.87 Chemicals
Industrial
Distribution and Wholesale
Food and Beverages
0.86 0.83 0.69
0.68
Utilities 0.29
Insurance 0.25
94.63
191
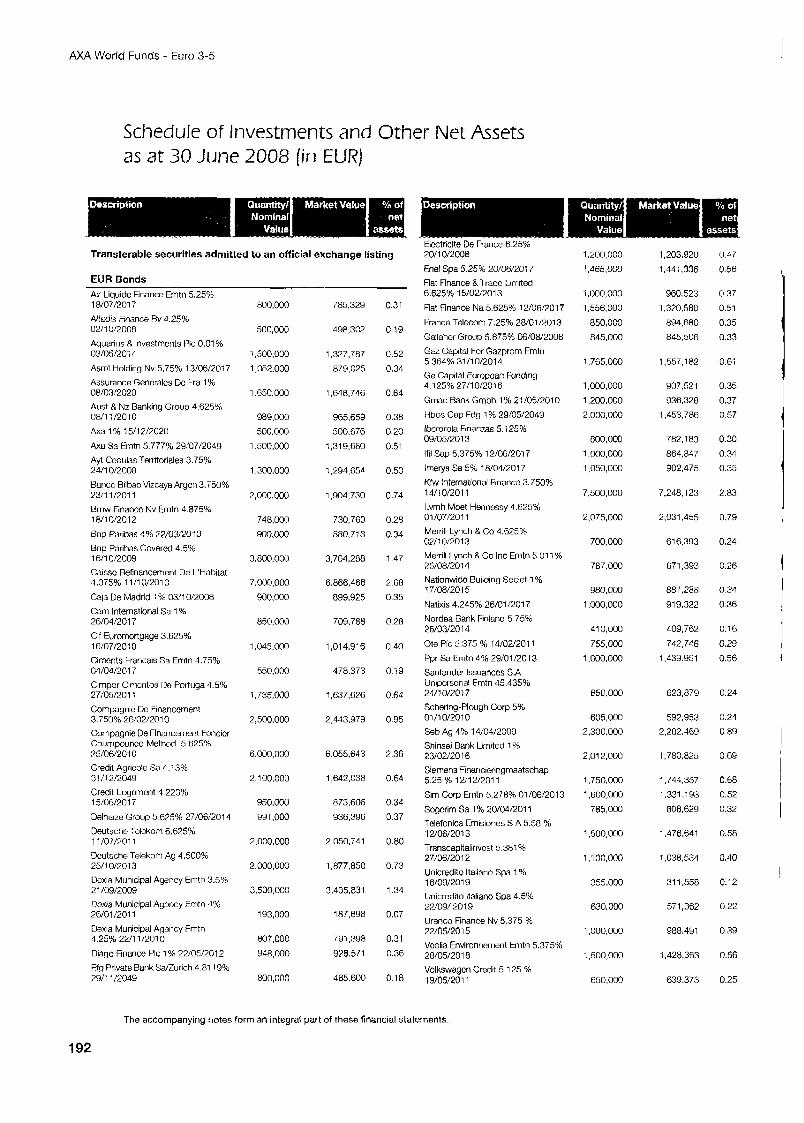
AXA World Funds - Euro 3-5
Schedule of investments and Other Net Assets as at 30 June 2008 (in EUR)
Transferable securities admitted to an official exchange listing
EUR Bonds Air Liquide Finance Emtn 5.254; 18/07/2017 Altsdis hnance Rv 4 25% C2/10/2008
Aquarius 8 lrrvestmcnts t’lc 0.01 % 03/05/%0;4 Asrnl Holding Nv 5.75% 13/06!2017 Assurance Gencralcs Dc fra 1 % 08/03/2020 Aust 8 Nz Bankiny Group 4.625% OH/li/2010 Axa 1 % 15/12/7020
h a Sa Emtn 5.777% 29:07/20Q Ayt Ccdulas Territoriales 3.75%
Banco Bilbao Mzcaya Arycn 3.750% 231 1/2011 Brnw Financc Nv Emtn 4.875% 1811 W2012 Brip Paribas 4% %?/C3/2010
2411 0:2008
Bnp Paribas Covered 4.595 iwi n/2009 Caissc Hefinancement De L‘Habitat 4.375% 1111 0/201C
Cala De Madrid : % 03:l 012008 Cam International Sa 1 ’% 26/04/2017 Cif Euromortyaye 3.625% 16/07/20!0 Cincnts Francais Sa Enitri 4.75% c4/00/2017 Cirnpor Ciricritos Ue Portuga 4.5%
Conpagnie De Financement
Cornpagnie De Financement Foricicr Counipouncd Method. 5.625% 75/06/2010 Credit Agricole Sa 4.13% 31/:2/2049 Credit Lqomcnt 4.223% 15/06/2017
Delhaiza Group 5.675% 27/06/2011 Deutsche Tclckom 6.625% 11/07/2011 Dcutsche Telekom Ag 4.500% 25/10/2013
27:05/2011
3.750% 26/02/2010
Dcxia Municipal Agency Emtn 3.5% 21 /09/2009 Dcxia Municipal Agency Emtn 4% 26/01/2011 Dexia Municipal Agency Fmtn 4.25% 22/11/2010 Diago Finance PIC 1 ?6 22/05/2012 Ffg Privata Bank SdZurich 4.81 19% 29/1 i/%049
ROO.OOO
500,oon
1,500,000 1,062.000
1.650.000
989,000 500.000
1.500.000
1.300.000
2,000.000
748.000 WO.000
3,800,000
7.000.000 900,000
850,000
1.045.000
550.000
1.735.000
2,500,000
6.000.000
2.100.000
950,000 991,000
2.000.000
2.000.000
3,500,000
193,000
807.000 w .000
800,000
785,329
498,302
1.327.787 879,075
1,648,746
965.659 500.676
1,319,680
1.294.65d
1,904,730
730,760 880.713
3,764,288
6,866,466 899.925
709.788
1,014.9’6
478.373
1,637,626
2,443,979
6.055.643
1,642,038
873.606
936,396
2,050,741
1,877,850
3.435.831
187,698
791.3Y8
928,571
465.6CQ
0.31
0.19
0.52
0.34
0.64
0.38
0.20 0.51
0.50
0.74
0.28
0.34
1.47
2.68 0.35
0.28
0.40
0.19
0.64
0.95
2.36
0.64
0.34 0.37
0.80
0.73
1.34
0.07
0.31
0.36
0.18
Emlrlc te DE France 6 25% 20!10/200A Enel Spa 5.25% 20/06/2017 Fiat Finance & Tradc Limrted 6.625% 15/02/2013 Fiat Finance Na 5.625% 12/06/2017
France Telecom 7.25% 28/01/2013 Gallahcr Group 5.875% 06/08/2008 G z Capital For Gazprom Emtn 5.364% 31/10/2014 Ge Caprtal European funding 4. ? 25% 27/10/2016 GmacBankGmbh 1%21/05/2010
Hbos Cap Fdg 1 % 29/05/2049 lbcrdrola Finamas 5.125’16 09/05/2013 Ifil Sap 5.375% 12/06/2017 lmetys Sa 5% 18/04/2017 Kfw International Finance 3.750% 14/10/2017 L.vmh Moet Hennassy 4.625% 01/07/2011 Merrill Lynch 8 Co 4.625% c9/10/2013 Merrill Lynch 8 Co Inc Emtn 5.01 i % 25/08/2014 Nationwide Building Societ 1 % 17/08/2015 Natixis 4.245% 26/01/2017 Nordea Bank Finland 5.7596 26/03/2014
Ote PIC 5.375 % 14/02/2011 Ppr Sa Emtn 4 % 29/01/2013 Santander lssuanccs S.A Unipcrsonal Emtn 45.435% 24/1 0/701? Schenng-Plough Corp 5%
Seb Ag 4% 14/04/2009 Shinsei Bank Ljmited 1 %
Siemens Financiwingmaatschap 5.25 % 12A2/2011
Slrn Gorp Emtn 5.278% 01 /06/2013 Sogcrim Sa 1 % 20/04/2011 Telcfonica Ernlsiones S A 5.58 % 12/06/2013 Transcapitalinvcst 5.381 % 27/06/2012
o:/i wzoi o
23/02/201 6
Unicredito ltaliano Spa 1 % 16/09/2019 Unicredito ltaliano Spa 4.5% 22/09/ 20 1 9
Urenco Finance Nv 5.375 % 22/05/2015 Vcolia Environnernent Enitn 5.375% 28/05/2018 Volkswagcn Credit 5.125 % 19/05/2011
1.200.(100 1,465,000
i .000,000 1,556,000
850,OCQ
845.000
1,765,000
I ,noo,ooo 1.200.000 2,000.000
800,000
1,000,000 1,050,000
7,500,000
2,075,000
700,000
787.000
980,003
1,000,000
41 0,OCO 755,000
1,600,000
650.0(30
605,OCO 2,300,000
2.01 2,000
1,750,000 1,600,000
785,000
i.500,ono
1 .I 00,000
355.000
630.000
1,000,000
1,500,000
650.000
1,203,920 1,441,336
960.523
1,320,580 894,680 845,5063
1,557,182
Y07,521
936.328 1.453.786
782.183 864.847
902,475
7,248,123
2,031,455
616,393
671,393
881.288
919.322
409,762 742,746
1,439.951
623.879
592.953 2,282.469
1,780.825
1,744,357 1.331.19.1
808,629
1,476,641
1,036,534
31 1.558
571,362
988.491
1,428,363
639.373
0.47 0.56
0.37 0.51
0.35 0.33
0 6i
0.35 0.37
0.57
0.30
0.34 0.35
2.83
0.79
0.24
0.26
0.34 0.36
0.16 0.29
0.56
0.24
0.24
0.89
0.69
0.68 0.52 0.32
0.58
0.40
0.12
0.22
0.39
0.56
0.25
The accompanying notes form an integral part of these financial statements
192
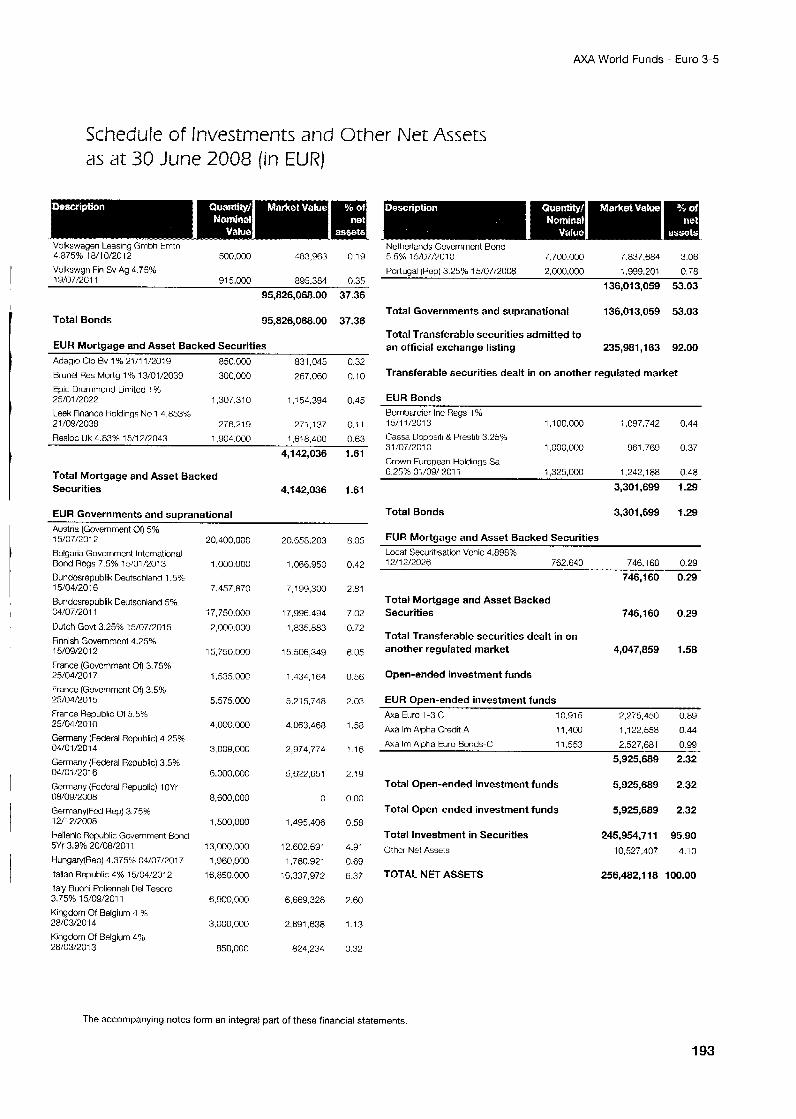
AXA World Funds - Euro 3-5
Schedule of Investments and Other Net Assets as at 30 June 2008 {in EUR)
- - " """ - Volkswagen Leasing Gmbh tintn 4 875% 18/10/2012 500,000 L83,963 0 1 9 Volkswgn Fin Sv Ag 4 75%
Netherlands Govcrnmcnt Bond 5.5% 15/07/7010 7.700.000 7.837.684 3.06
Portuad (ROD) 3.2516 15/07/2008 2.000.000 1.999.201 0.78 19!07/2011 915,000 895.384 0.35
95,826,068.00 37.36
Total Bonds 95,826,068.00 37.36
EUR Mortgage and Asset Backed Securities
Adagio Clo Bv 1% 21/11/2019 850,000 831,045 032
Brunel Res Mottg 1 W 13/01/2039 300,000 267.060 0.10 Epic Drummond Lln-itcd 1 :b
Leek Finance holdings Nn 1 4 853% 21 /09/2038 276.21 9 771,137 0.i 1
Resloc Ilk 4.83% 15/12/2043 1,904.000 1.618.LOO 0 63
4,142,036 1.61
25/01/2022 1,307,310 1,154,394 0.45
Total Mortgage and Asset Backed Securities 4,142.036 1.61
EUR Governments and supranational Austria (Government Ot) 5% 15/07/2012 Bulgaria Government International Bond Regs 7.5% 15/01/2013 Bundcsrepublik Deutschland 1.5% 15/04/2016 Bundcsropublik Deutschland 5% C4/07/2011
Dutch Govt 3.25% :5/07/'2015
Finnish Governmcnt 4.25% 15/09/2012
France (Govcrnment O ~ J 3.75% 25/04/20 17 France (Govcmmcnt Of) 3.5% 25/04/20 1 5 France Republic of 5.5?/, 25/04/7010
Germany (Federal Rcpublic) 4.25% 04/01 /2014
Germany (Federal Rcpublic) 3.5% 04/01Q016
Germany (Fcdaral Republic) 1 OYr 08/09/2008 Germany(Fcd Rep) 3.75% 1211 2/2008 kellenic Rcpublic Gwernment Bond 5Yr 3.9% 20/08/2011 Hungary(Rep) 4.375% 04/07/2017
Italian Republic 4% 15/04/2012 Italy Buoni Poliennali Del 1-esoro 3.75% 15/09/2011 Kingdorn Of Belgium 4 % 28/03/2014 Kingdom Of Belgium 4% 28/03/2073
20,400,000
1,000.000
7.457.870
7 7,750.000
2,000,000
15,750,000
1,535.000
5.575.000
4.000.000
3,009,000
6,000,000
8,600,000
1,500,000
13,000,000 1,960,000
16,850,000
6,900,000
3,000,000
850,000
20.658.203
1,066,950
7.199.300
17.996.494
1,835,883
15.506,349
1.434.164
521 5.748
4,063,468
2,974,774
5,672,651
0
1,495,406
12.602.691
1,780,921
6,337,972
6,669,328
2,891,638
824.234
8.35
0.42
2.51
7.02
0.72
6.05
0.56
2.03
1.58
!.16
2.:9
0.00
0.58
4-91
0.69 6.37
7.60
1.13
0.32
136,Oi 3,059 53.03
Total Governments and supranational 136,013,059 53.03
Total Transferable securities admitted to an official exchange listing 235,981,163 92.00
Transferable securities dealt in on another regulated market
EUR Bonds Bombardcr Inc Regs 1% 15/11/2013 1,100,000 i ,097,742 0.44 Cassa Dcposili 8 Prestiti 3.25% 31/07/2010 1,000,000 961.769 0.37 Crown European Holdings Sa 6.25X Oi:09/ 701 1 1,325,000 1.242.1 88 0.48
3,301,699 1 .29
Total Bonds 3,301,699 1.29
EUR Mortgage and Asset Backed Securities Locat Securittsation Vchic 4.898% 12/12/2026 762.640 746.160 0.29
746,160 0.29
Total Mortgage and Asset Backed Securities 746,160 0.29
Total Transferable securities dealt in on another regulated market 4,047,859 I .58
Open-ended investment funds
EUR Ooen-ended investment funds 2,275450 0.89 h a Euro 1-3 C
h a Im Alpha Credit A 11.400 1,122,558 0 44 &a Im Aloha Euro Bonds-C 11 55.1 75776R1 n W
10.91 5
5,925,689 2.32
Total Open-ended investment funds 5,925,689 2.32
Total Open-ended investment funds 5,925,689 2.32
Total investment in Securities 245,954,711 95.90 Othcr Net Assets 10,527,407 4.10
TOTAL NET ASSETS 256,482.1 18 100.00
The accompanying notes form an integral part of these financial statements.
193
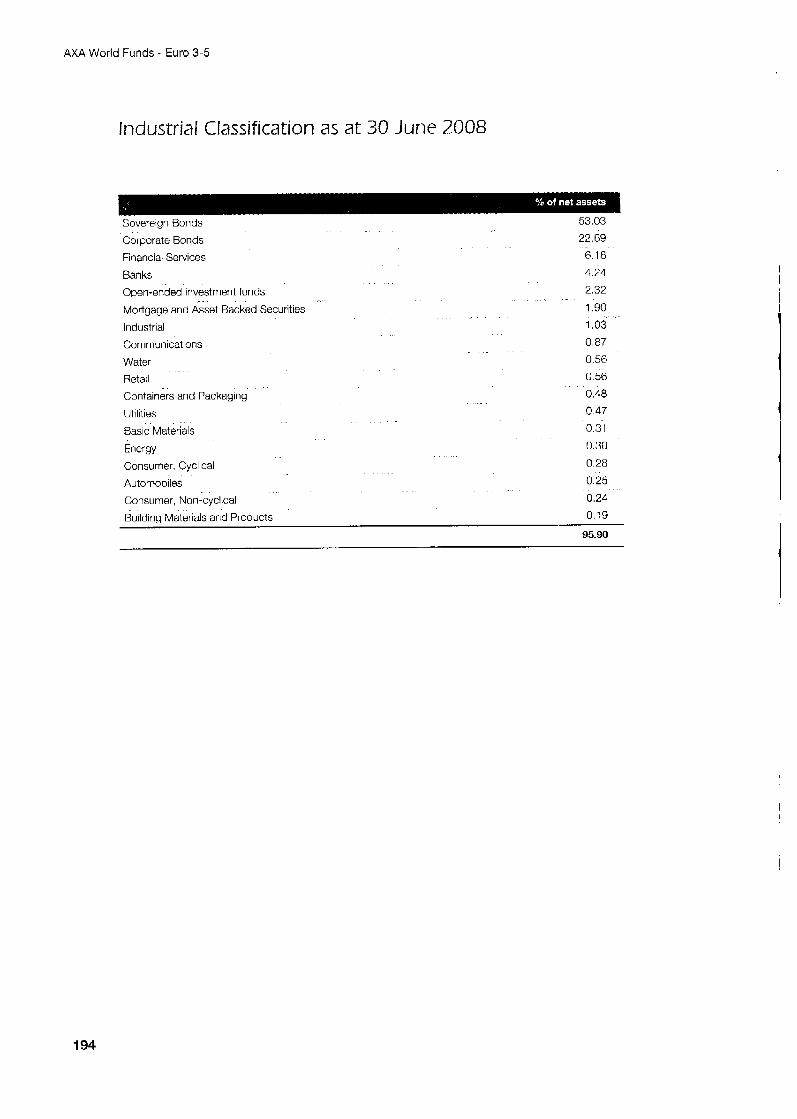
AXA World Funds - Euro 3-5
Industrial Classification as at 30 June 2008
Corporate Bonds
Financial Services
Banks Open-ended investment funds
Mortgage and Asset Backed Securities
Industrial
Communications
Water
Retail
Containers and Packaging
Utilities
Basic Materials
Energy
Consumer, Cyclical
Automobiles
Consumer, Non-cyclical
Sovereign Bonds 53.03
22 69
6.18
4.24
2.32
1 90 1.03 0 87
0.56
0 56
0 48 0 47
0.31
0 30
0 28 0 25 0.24
Building Materials and Products 0.19
95.90
194
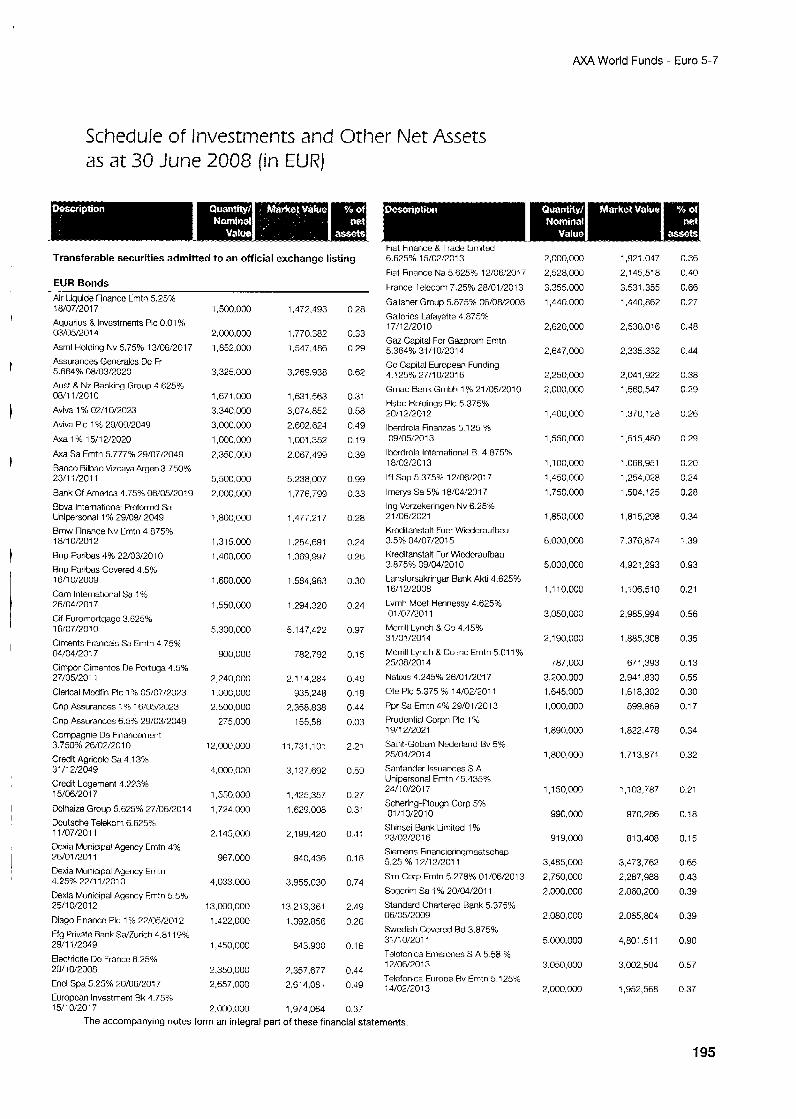
AXA World Funds - Euro 5-7
Schedule of Investments and Other Net Assets as at 30 June 2008 (in EURJ
Transferable securities admitted to an official exchange listing
EUR Bonds Air Liquide Financc tmtn 5.25% 18/07/2017 Aquarius & lnvustrnents PIC 0 01 % 03/05/20 14 Asml Holding Nv 5.75% 13/06/2017 Assurances Generales Dc Fr 5.664% 08/03/2C20 Aust & Nz Banking Group d 625% 08/1 1/2010 Aviva 1 % 02/10/2023 Aviva PIC 1 % 29/09/2049
h a 1 % 15/12/2020
h a Sa Emtn 5.777% 29/07/2049 Banco Bilbao Vizcaya kgen 3.750% 23/1 i/2011
Bank Of America 1.75% 06/05/2079 Bbva International Preferred Sa Unipersonal 1 % 29/09/ 2049 Bmw Finance Nv Emtn 4.875% 18/10/2012 Rnp Paribas 1% 22/33/2010 Rnp Paribas Covered 4.5% 1611 0/2009 Cain International Sa 1 o/c 26/04/2017 Cif Furomortqagc 3.625% 16/07/2010 Ciments Francais Sa Emtn 4.75% 04/04/2017 Cimpor Cimentos De Pottuga 4.5% 27/05/2011 Clencal Mcdfin PIC 1 ?b 05/07/2073 Cnp Assurances 1 % 16/05/7023
Cnp Assuranccs 6.5% 29/03/2049 Compagnie Ue Financemerit 3 750% 26/02/2010 Credit Agricolc Sa 4 13% 31/12/2049 Crcdit Loyement 4 223% 15/06/2017 Dclhaze Group 5 625% 27/06/2014 Dcutsche Telekom 6 625% 1 1 /07/2011 Dexia Municipal Agency Emtn 4% 76/01/2011 Dexia Municipal Agency Emtn 4.25% 22/11/2010 Dexia Municipal Agency Emtn 5 .58 7511 0/2012 Diago Finance PIC 1% 27/05/2012 Efg Private Bank Sd7urich 4.81 19% 29/11/20L9
Electticite Dc France 6.25% 2011 0/2008 Encl Spa 5.25% 70/06/20: 7 Europcan Investment Rk 4.75% 1 5/10:2017
1.500.000
2.000.000 1,852,000
3,325.000
1.E71,OOO
3.340.000 3.000.000 1,000,000 7,350,000
5.500.000
2.000.000
1,800,000
1,315.000 1,400,000
1,600,000
1,550.000
5,300,000
900,000
2,240,000 1 ,000,000
2.500.000 275,000
12.wc.000
4,000,000
1,550.000
1.724.000
2.145,OOO
967,000
4.033.000
13.W0,OOO
1.422,ooc
1,450.000
2,350,000
2,657,000
2.000.000
1.472.493
1.770.382 1.547.486
3,769.938
1,631.563
3,074352 2,602,624 1,001,352
2,067,499
5,238,007
1,776,799
1.477.21 7
1,784,691 1,369,997
1,584.963
1.294.320
5 147,422
782.792
2.1 14.284 935,208
7,358,838 155,581
11.731,10!
3.127.692
1,425,357
1.629.008
2,199,420
940,436
3,955.030
13,213,361
1.392.856
813.900
7357.677 2,611,081
1,974.064
0.28
0.33 0.29
0.62
0.31
0.58 0.49 0.19
0.39
0.99
0.33
0.28
0.24 0.26
0.30
0.24
0.Y7
0.15
0.10 0.18 0.14 0.03
2.2’
0.59
0.27
0.31
0:1:
0.18
0.74
2.49
0.26
0.1 6
0.44 0.49
0.37
Fiat Finance &Trade Lirnitd 6.625% 15/02/2013
Fiat Finance Na 5.625% 12/06:2017 France Telecom 7.25% 28/01/2013
Gallaher Group 5.875% 06/08/2008 Gallcrics Lafayetie 4.875% 17/12/2010 Gm Capital For Gatprvrrl Emtn 5.3649.; 31/10/2014 Gc Capital European Funding 4.125% 27/10/2016 Grnac Bank Gmbh l?h 21/05/2010 Hsbc holdings PIC 5.375% 20/12/2012 lherdrola Finamas 5.125 % 09!05:2013 lbcrdrola International B. 4.875% 18/02/2013
lfil Sap 5.37596 12/06/20: 7 lrnerys Sa 5 8 18/04!2017 Ing Vcrzekeringen Nv 6.25% 21 /06/2021 Krodilanstalt Fuer Wiederaufbau 3.5% 04/07/2015 Kreditanstalt Fur Wicdcraubau 3.875% 09/04/201 G
Lansforsakrinyar Bank Akli 4.625% 16/12/2008 Lvmh Moet Hmnessy 4.825% 01/07/2011 Merrill Lynch 8 Co 4.15% 3 1 /01/2014 Mcrrill Lynch 8 Co Inc Emtn 5.01 1 %
Natixis 4.245% 26/01/2017 Ote Plc 5.375 % 14/02/201 1
Ppr Sri Erritn L% 29/01/2013 F’rudcntial Corprl PIC 1 orb 19/12/2021 Saint-Gobain Nederland Bv 5?4 25/04/20i4 Sarltander Issuances S.A Unipersonal Fmtn 45.435% 2C/l0/2017
25/06/2014
Schering-Plouyh Corp 5% 01/10/2010 Shinsei ‘dank Limitod 1 % 73/0?/?016 Siemens Financicrinqmaatschw 5.25 % 17/12/201 1
Slrn Corp Emtn 5.978% 01/06/2013 Sogcrim Sa i % 20/04/2011 Standard Chartered Bank 5.375% 06/05/2009 Swedish Covered Rd 3.875% 3’/:0/2011 Telcfonica Enrisicnes S A 5.58 % 12/0w2013 Telefonica Europe Rv Emtn 5.125%
4/02/2013
2,000,000
2,528,000 3,355,000
1,440.000
2,620,000
2,647,000
2,250,003 %,000,003
1,400,000
1,550,000
1,100,000
1,450,000 1.750.000
1,850,000
8,000,000
5,000,000
1 , I 10,000
3,050,000
2.1 90,000
787.000 3,200.000 1.645.000 1,000,000
1.890.000
1,800.cQ0
1,150,000
990.000
919,000
3,485,000
2,750,000 7,000,000
2.080.000
5,000,000
3,050,000
2,000,000
1,921.047
2,145.51 8
3,531,355
1,440,862
2,530,016
2,335.332
2,041,922 1,560.547
1.370.128
1,515,480
1.068.951
1.254.028 1.504.125
1.81 5,298
7,376,874
4,921 293
1,106,510
2,985.994
1.885308
671,393 2,941,830
,618,302 899.869
,822,478
,713,871
,103,787
970,286
81 3.408
3,473,762 2.287,988 2,060,200
2,065,804
4.801.51 1
3,002,504
1,952,568
0.36
0.40 0.66
0.27
0.48
0.44
0.38 0.29
0.26
0.29
0.20
0.24 0.28
0.34
1.39
0.93
0.21
0.56
0.35
0.13
0.55 0.30 0.1 7
0.34
0.32
0.21
0.18
0.15
0.65 0.43 0.39
0.39
0.90
0.57
0.37
The accompanying notes form an integral part of these financial statements.
195
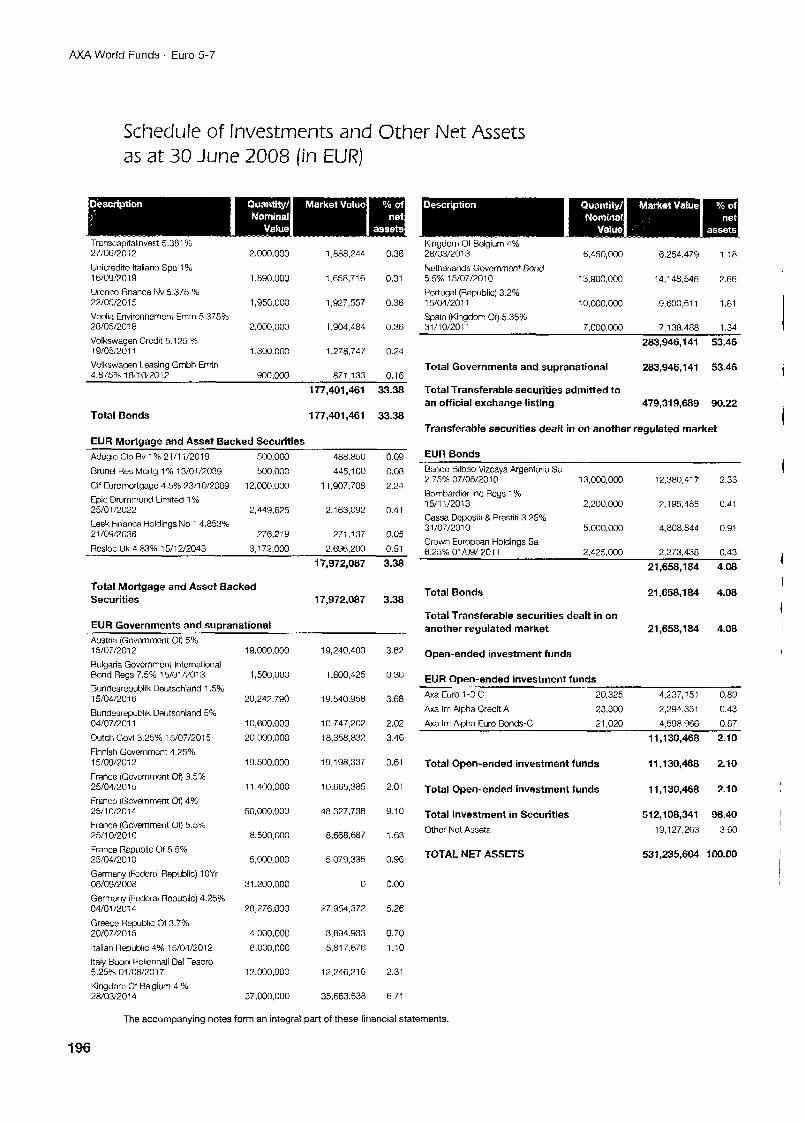
AXA World Funds - Euro 5-7
Schedule of Investments and Other Net Assets as at 30 June 2008 (in EUR)
27:06/20i2 2.000.000 1,888,244 0.36 Unicredito ltalianu Spa 1 % 16/09!2019 1.8YO.000 1,658,716 0.31 Urcnco Finance h;v 5.375 '16 22/05/2015 1,95G.000 1,927,557 0.36 Veulia Envircnnement Emtn 5.375% 28/05/20.:8 2.000.000 1,904,484 0.36 Volkswayon Crcdit 5.1 25 % 19/05:2011 1.300.000 1.278,747 0.24 Volkswagen leasing Gnbh EFtn 4.875% 18:10/2C: 7 900,000 871.133 0.16
177,401,461 33.38
Total Bonds 177,401,461 33.38
EUR Mortgage and Asset Backed Securities Adagio Clo Bv 1 % 21/1 i/2019 500,000 488.850 0.09 Rrunel Res Mortg 1 % 13:0:/703Y 500.000 445,100 0.08
Cif Eurorriortqaqe 4.5% ?3/10/2009 12.000.000 11,907.708 2.24 Epic Drummcnd Imited 1 % 25/01/2022 2.449. 675 2,163,092 0.41 Look Finance Holdings No 1 4.853% 21/09/2038 276.21 9 271,337 0.05 Rcsloc Uk 2.83% 7 5/12/2003 3,172,000 2,696,200 0.51
17,972,087 3.38
Total Mortgage and Asset Backed Securities 17,972,087 3.38
EUR Governments and supranational Austria (Govcnrmcnt 00 5% 15/07/2012 Bulgaria Govcrnment International Bond Regs 7.5% 15/01 0 0 1 3 Bundcsrepublik Deutschland 1.5% 15/04/2016 Rundesrepublik Ueutschland 5% 04/07/2011 Dutch God 3.25% 15/07/2015 Finnish Governmcnt 4.25% 15/09/70: 2
Franca (Government Of) 3.5% 25/041'2C15 Francc (Gcvemment or) 4%
France (Gcvemment Of) 5.5% 25/10/2010
25/10/2014
France Republic Of 5 5% 25/04/20 10
Germany (Fcdcral Republic) 1 OYr 08/09/1008 Germany (Federal Bcpublic) 4.25% 04/01 /20: 4 Greece Republic Of 3.7% 20/07!2015 Italian Republic 4% 15/04/2012 Italy Buoni Pclicnnali Del Tesoro 5.25% 01/08/2017 Kingdoni Of Belgiun 4 % 28/03/2014
19,000,000
1,500,000
20.242.790
10 ,~0 .000
20.000.000
19,500,000
11,400,000
50.000.000
8.500,000
5,000,000
31.200.000
26,276,000
4,000,000
F.OOO.0OC
i2.000.000
37,000,000
19,240,183
1,600,425
19,540.958
10,747,202 18.358.832
19,198,337
10,665,385
48.327.738
8,668,687
5,079,335
0
97,954,372
3,694.933 5,817.676
12,24621 6
35.663.538
3.62
0.30
3.68
2.02 3.46
3.61
2.01
9.10
1.63
0.96
0.00
5.26
0.70 1.10
2.31
6.71
Kingdom Of Belgium 4% 6.254.479 1.18 28/03/2013
Nethcrlatrds Govcmrncnt Bond 5.5% 15/07/2010 13,900,000 14,148,546 2.66 Portugal (Republic) 3.2% 15/04/2011 10,000,000 9,600,511 1 .81 Spain (Kingdom Of) 5.35%
6,150,000
31 /10/2011 7.000.000 7.138.488 1.34
283,946,141 53.46
Total Governments and supranational 283,946,141 53.46
Total Transferable securities admitted to an official exchange listing 479,319,689 90.22
Transferable securities dealt in on another regulated market
EUR Bonds Banco Bilbao Vizcaya Argentaria Sa 2.75% 07/06/2010 13,000,000 12,380,417 2.33 Bombardicr lirc Regs 1 "/o 15/11/2013 2,200.000 7.1Y5.485 0.41
Cassa Depositi 8 Prestiti 3.25% 31/07/2010 5.000.000 4,808,844 0.91
Crown European Holdings Sa 6.25% 01/09/ 201 1 2.425.000 2.273.438 0.43
21,658,184 4.08
Total Bonds 21,658,1a4 4.08
Total Transferable securities dealt in on another regulated market 21,658,l 84 4.08
Open-ended investment funds
EUR Open-ended investment funds Axa Euro 1-3 C 20,325 4,237,151 0.80
Axa Im Alpha Credit A 73,300 2,294,351 (1.43
Axa Im Abha Euro Bonds-C 21.020 4,598,966 0.87
11,130,468 2.10
Total Open-ended investment funds 11,130,468 2.10
Total Open-ended investment funds 11,130,468 2.10
Total Investment in Securities 512,108,341 96.40 Glhar Net Assets 19,127,263 3.60
TOTAL NET ASSETS 531,235,604 100.00
The accompanying notes form an integral part of these financial statements.
196
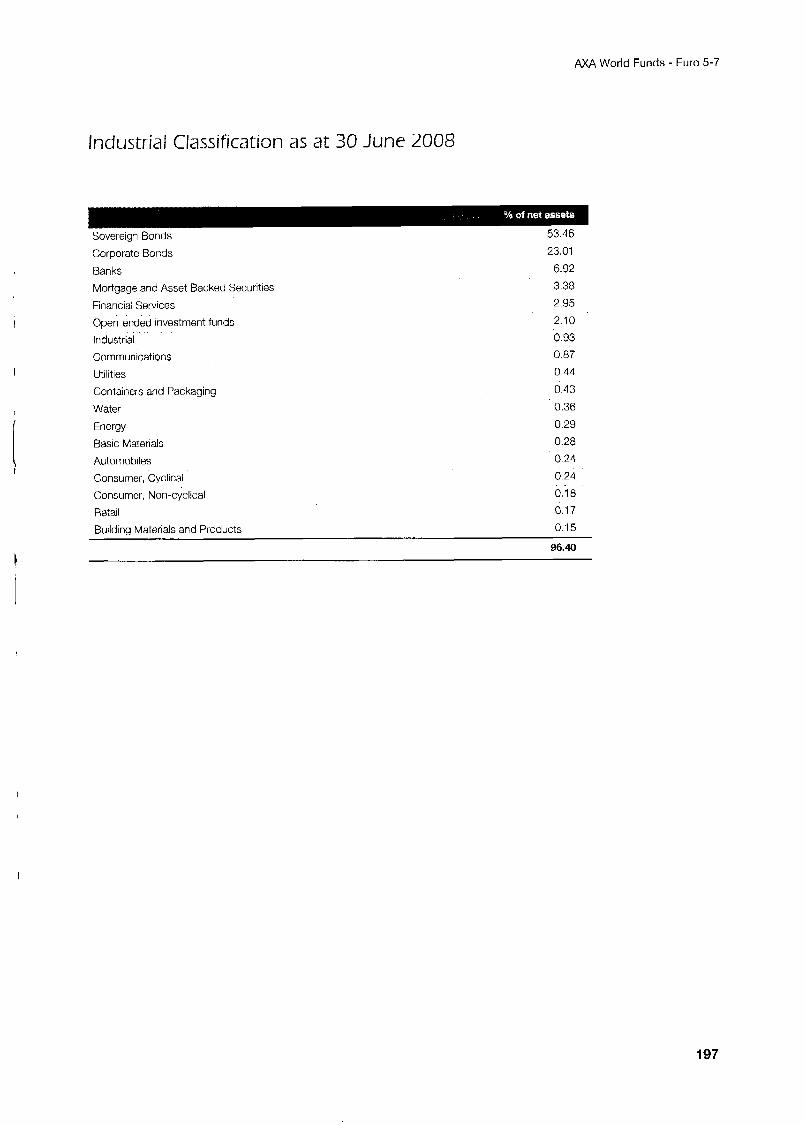
AXA World Funds - Euro 5-7
Industrial Classification as at 30 June 2008
Sovereigi Bonds 53.16
Corporate Bonds
Banks
Mortgage and Asset Backed Securities
Financial Services
Open-ended investment funds
Industrial Communications
Utilities
Containers and Packaging
Water
Energy
Basic Materials
Automobiles
Consumer, Cyclical
Consumer, Non-cyclical
Retail
Buildina Materials and Products
23.01
6.92
3.38
2 95 2 10 0 93 0.87
0 44 0 43 0.36
0.29
0 28
0 24
0 24 0.18
0 17
0.15
96.40
t
197
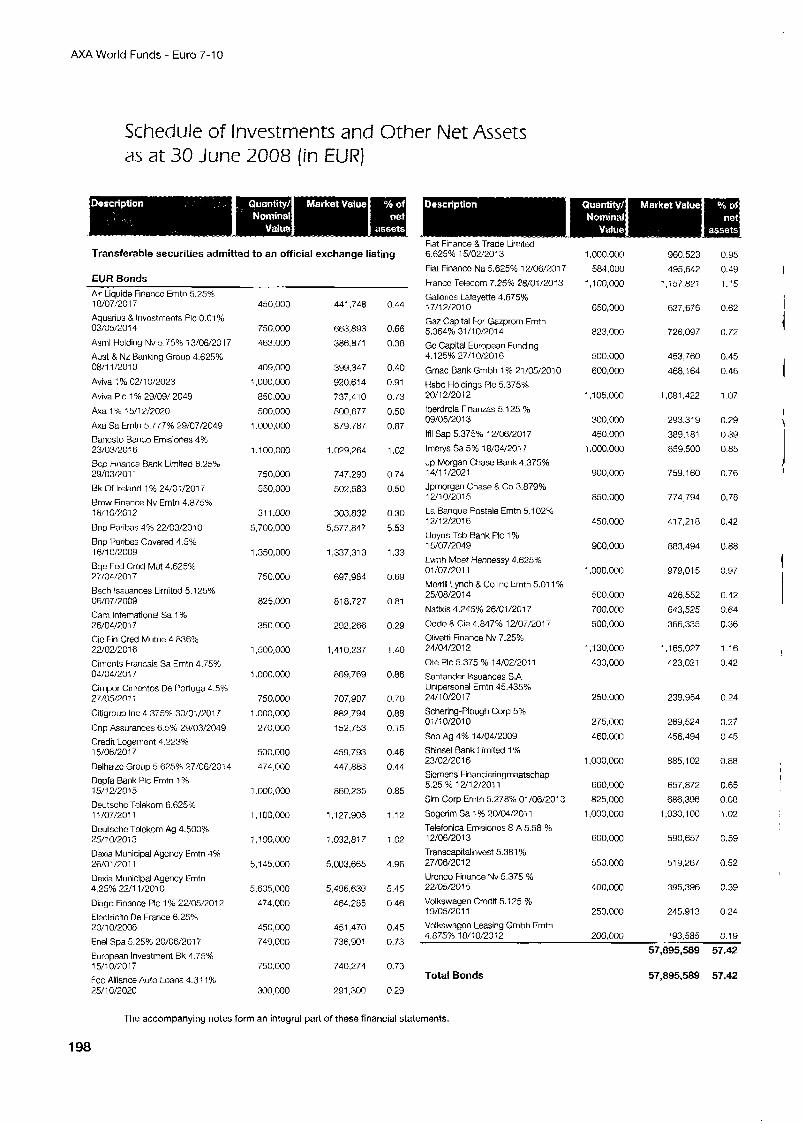
AXA World Funds - Euro 7-1 0
Schedule of Investments and Other Net Assets as at 30 June 2008 (in EUR)
Transferable securities admitted to an official exchange listing
EUR Bonds Air Liquide Financc Emtn 5.25% 18/07!2017 Aquarius & lnvcstments PIC 0.01 % 03/05/2014 Asml Holding Nv 5.75% i3/06/2017 Aust & Nz Banking Group 4.625% 08/11 /2010
Aviva : % 02/ 10/2023 Aviva PIC 1 % 29/09/ 2049
Axa 1 % 15/12/2020 h a Sa tmtn 5.777% 29/07/2049 Bancsto Banco Emisiones 4% 23/03/20<6 Bcp Finance Bank Limited 6.25% 29/03/2011 Rk of Ireland 1 % 24:0:/2017 Brnw Finance Nv Emtn 4.875% 18/100012
Bnp Paribas 4% 22/03/2010 Bnp Paribzs Covered 4.5% 16/10/2009 Rqe red Croci Mut 4.625% ?7/04/2017 Bsch Issuances Limitod 5.125% 06/07/2009 Cam International Sa 1% 26/04/7017 Cic Fin Cred Mutue 4.836% 22/02/2016 Cirncnts Francais Sa Erntn 4.7596 04/04/2017 Cirnpor Cirxntos De f'ortuga 4.5% 27/05/2011
Citigroup Inc 4.375% 30/01/7017
Cnp AssuranCFS 6,574 29/03/2049 Credit Loyemcnt 4.223% 15/06/2017 DeltiaiLc Group 5.625% 27/06/2014 Depfa Bank PIC Erntn 1 % 15/12/2013 Deutschc Telekom 6.625% 11/07/2011 Deutschc Tclckorn Ag 4.500% 25/10/2013 Dexia Municipal Aycncy Emtn 4% 26/01/2011 Dexia Municipal Agency Emtn 4.25% 22/1 1/2010 Diago Finance PIC 1 % 22'05:2012 Electricitc De France 6.25% 20/10/2008 Enel Spa 6.25% 20/06/2017 European Investment Bk 4.75% 15/10/7017 Fcc Alliance Auto Loans 4.31 1 % 25/1C/202C
450,000
750,000
463.000
409,000 ? .ooo.oM)
850.000 500,000
1 .ooo.ooo
1 .I oo,ooc
750,000 550,000
31 1 .OOO
5,700,OCO
1,350,000
750.000
825,000
350 000
1,500,000
1 .ooo.ooo
750.000 1 .ooo,ooo
270,000
500,000 474,000
1 ,000.000
1,100,000
1,100.000
5,145,000
5,605,000 L74,OOO
450,000 749.000
750.000
300.000
441,748
663,893 386,871
399.3.47 920,614 737,410 500.677 879.787
1,029,264
747,290
502.583
303,832 5.577.847
1,337,313
697,984
81 8.727
292.266
1,410,237
869,769
707.907 882,794
152,753
459,793
447,883
860.235
1 ,I 27,908
1,032,817
5,023,665
5,496.639
464,285
451,470
736,901
740,274
291,300
0.44
0.66
0.38
0.40
0.91 0.73 0.50
0.87
1 .G2
0 . 7 A
0.50
0.30
5.53
1.33
0.69
0.81
0.29
1.40
0.86
0.70
0.88
0.15
0.46 0.44
0.85
1.12
1.02
4.96
5.45 0.46
0.45 0.73
0.73
0.29
Fiat Finance &Trade Limited 6.625% 15/02/2013
Fiat Financc Na 5.625% 12/06/2017 Francc Teiecorn 7.2596 28/01/2013 Gallems Lafayetle 4.675% 17/12/2010 Gaz Capital For Gazprorn Erntn 5.364% 31/10/2014 Gc Capital European Funding 4.125% 2711 0/2016
Gmac Bank Grnbh 1% 21/05/2010 Hsbc Holdings PIC 5.375% 20/12/2012 Iberdrola Finanzas 5.125 % 09/05/2013 lfil Sap 5.375% 12/06/2017 lmerys Sa 5% 18/04/2017 Jp Morgan Chase Bank 4.375% 14/11/2021 Jprnorgan Chase & Co 3.879% 12/10/2015 LE Banque Postale Erntn 5.102% 12/12/2016 Lloyds Tsb Bank PIC 1 YU 15/07/2049 Lvmh Moet Hennessy 4.625% 01/07/2011 Mcrrill Lynch & Co Inc Emtn 5.01 1 % 25/08/2014 Natixis 4.245% 26/01/2017 Odd0 & Cie 4.847% 12/07/2017 Olivetti Finance Nv 7.25% 74/04/2012 Ote PIC 5.375 % 14/02/2011 Santander Issuances S.A Unipersonal Erntn 45.435% 24/10/2017 Schering-Plough Gorp 5% 0i/i0/2010 Scb Ag 4% 14/04/2009 Shinsei Bank I .irnited 1 % 23/02/2016 Siemens Financieringrnaatschap 5.25 % 12/12/2011 Slm Corp Emtn 5.278% 01/06/2013 Soycrim Sa 1 % 20/04/2011 Telefonica Emisionos S A 5.58 % 12/06/2013 Transcapitalinvest 5.381 % 27/06/2012 Urcnco Finance Nv 5.375 % 22:05/2015 Volkswayen Cradit 5.i25 % 19/05/2011
1 .000,000 584,000
1,100,000
650,000
823.000
500.000 600,000
1,105,000
3W.OM) 450,000
1.000.000
900.000
850.000
450.000
900,000
1,000.000
500.000
700,000 500.000
1,130,000
430,000
250,000
275,OW
460.000
1,000,000
660.000 825.000
1,000,000
600.000
550.000
400. OM)
250.000
960.523 495.642
1,157,821
627,676
726.097
453,760 468,164
1,081,422
293,319 389.181
859,500
759,l 60
774,794
417.218
883.494
979,Ol 5
426,552 643,525
366.335
1,165,077 423,021
239.954
269,524
456.494
885.102
657,872
686.396 1,030.1 00
590,657
51 9,267
395,396
245.913
0.95 0.49 1.15
0.62
0.72
0.45
0.46
1.07
0.29
0.39 0.85
0.76
0.78
0.42
0.88
0.97
0.42
0.64 0.36
1.16 0.42
0.24
0.27 0.15
0.88
0.65 0.68
1,02
0.59
0.52
0.39
0.24 Volkswagcn Leasing Gmbh Emtn 4 875% 18/ln/7nl7 200.000 193,585 0.19
57,895,589 57.42
Total Bonds 57,895,589 57.42
~ ~~ ~ .-. -
The accompanying notes form an integral part of these financial statements.
198
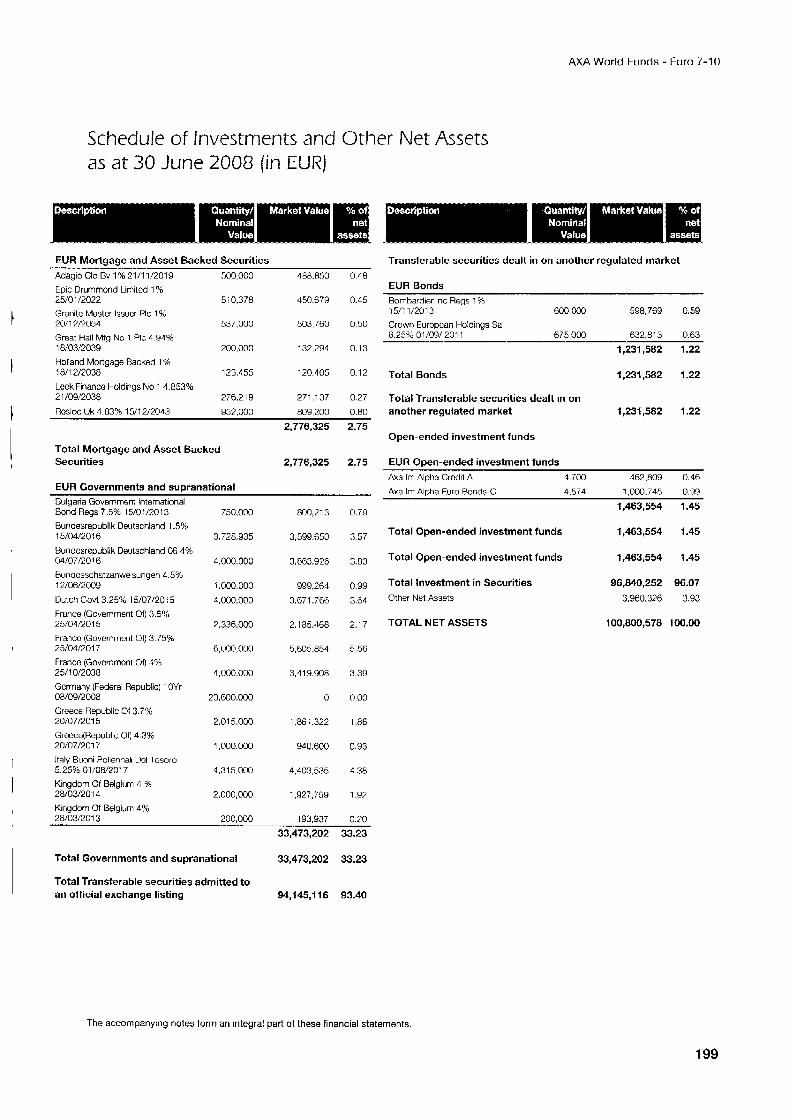
AXA World Funds Euro 7-1 0
Schedule of Investments and Other Net Assets as at 30 June 2008 (in EUR)
EUR Mortnane and Asset Backed Securities AdagioCluBv1%21/11/2019 500 000 433.~50 0.48 Epic Drummond Lirnitcd 1 % 25/01/2022 5 i G.378 450.679 0.45 Granite Mastcr Issuer PIC 1% 20/1 T/%054 557,000 503,760 0.50 Great Hall Mtg No 1 PIC 4.94% 18!03/2039 200,000 132.294 0.13 Holland Mortgage Racked 1 % 1811 32038 123.455 120.405 0.12 Leek Finance Holdings No 1 4.853% 21 /09/2038 276.21 9 27:,137 0.27
Rasloc Uk 4.8376 15:l 2/20a3 Y52.000 809.200 0.80 2,776,325 2.75
Total Mortgage and Asset Backed Securities 2,776,325 2.75
EUR Governments and supranational Bulgaria Government International Bond Regs 7.5% 15/0!/2013 Bundesrepublik Deutschland 1.5% 15/04/20: 6
Bundcsrcpublik Deutschland 06 4% 04/07/20! 6
Bundcsschatranwe,sungen 4.5%
Dutch God 3.2576 15/07/20:5 FralcQ (Government 00 3.5% 25/04/2015 kranco (Government Of) 3.75% 25/04/2017 France (Govcmmont 0 0 4% 25/10/2038 Gcrrnany (Federal Republic) 1 0Yr 08/G9/2008 Greece Republic Of 3.7% 20/07/2015 Greece(Repub1ic Or: 4.3% 20/07/2017
12/06/2009
Italy Buoni Poliennali Del Tcsoro 5.2596 01/08/2017 Kingdom Of Belgium 4 % 28/03/2014 Knydom of Belgium 4% 28/03/2013
Transferable securities dealt in on another regulated market
EUR Bonds Bomhardicr Inc Regs ;YO 15/11/2013 600.000 598,769 0.59
Crown European Holdings Sa 6.259b 01/09/ 201 1 675,000 632,813 0.63
1,231,582 1.22
Total Bonds 1,231,582 1.22
Total Transferable securities dealt in on another regulated market 1,231,582 I .22
Open-ended investment funds
EUR Open-ended investment funds h a Im Alpha Credit A Axa Im Alnhn Fiiro Hnnds-C
4.700 462.809 0.46 4.574 1 .om 745 0.99
75C.000
3.728.935
4,000.000
1 .ooo.ooo 4.000.000
7,336,000
6,000,000
4.000.000
23.600.000
2,015,000
1,000.000
4.31 5,000
2,000,000
800,213
3,599.650
3363.926
999,264
3.671.766
2.1 85.468
5.605.854
3.419.908
0
1.86; .322
9ao.fiou
4,403,535
1,927,759
0.79
3.57
3.83
0.99
3.64
2.1 7
5.56
3.39
0.00
1 .E6
0.93
4.38
1.97
1,463,554 1.45
Total Open-ended investment funds 1,463,554 1.45
Total Open-ended investment funds 1,463,554 1.45
Total Investment in Securities 96,840,252 96.07 Other Net Assets 3.960396 3.93
TOTAL NET ASSETS 100,800,578 100.00
7on.nno - - - , - - - 193,Y37 0.20
33,473,202 33.23
Total Governments and supranational 33,473,202 33.23
Total Transferable securities admitted to an official exchange listing 94,145.1 16 93.40
The accompanying notes form an integral part of these financial statements.
199
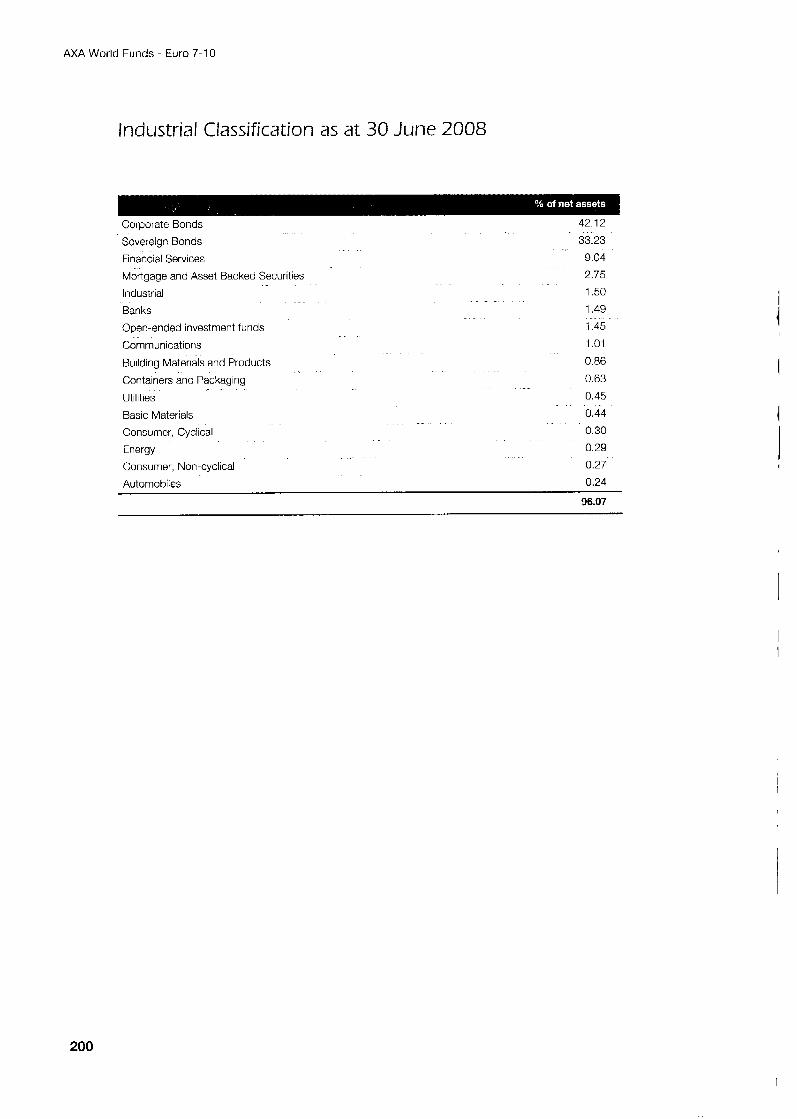
AXA World Funds - Euro 7-1 0
Industrial Classification as at 30 June 2008
Sovereign Bonds
Financial Services
Mortgage and Asset Backed Securities
Industrial
Banks
Open-ended investment funds
33.23
9.04
2.75
1.50
1.49
1.45
Communications 1.01
Buildina Materials and Products 0.86 Y
Containers and Packaging 0.63
Utilities 0.45
Basic Materials 0.44
Consumer, Cyclical 0.30
Energy 0.29
Consumer, Non-cyclical 0.27
Automobiles 0.24
96.07
200
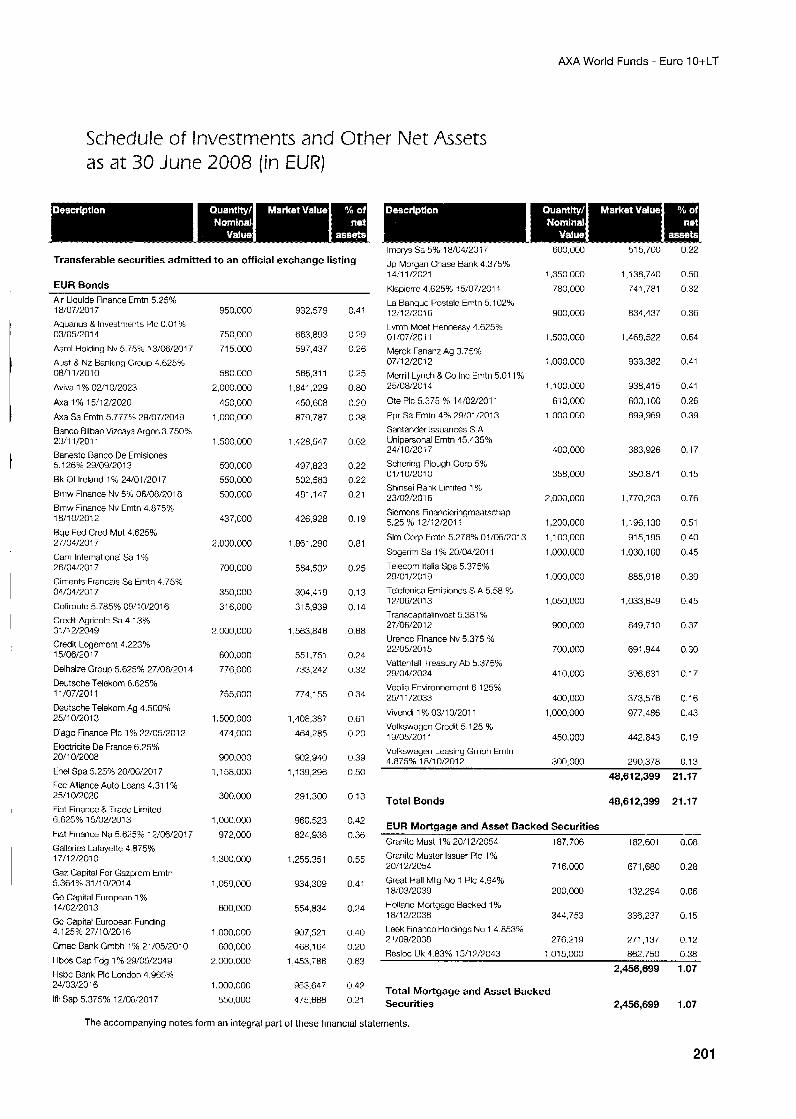
AXA World Funds - Euro 1 O+LT
Schedule of Investments and Other Net Assets as a t 30 June 2008 (in EUR)
Transferable securities admitted to an official exchange listing
EUR Bonds Air Liquide Finance Emtn 5.25% 18/07/2017 Aquarius 8 Investments PIC 0.01 76 03/05/2011
Asml Holding Nv 5.75% 13/06/2017
Aust 8 NZ Banking Group 4.625% 08/11 /20 1 0
Aviva 1 % 02/10/2023
Axa 1% 15/12/2020
h a Sa Emtn 5.777% 28/07/2019 Banco Eilbao Mzcaya Argcn 3.750%
Banesto Banco De Emisiones
Bk Of Ireland 1 S 24/01 /2017
Brriw Finance Nv 5% 06/08/2018 Bmw Finance Nv Emtn 4.875% 18/10/2012
2 3 1 1/7011
5.1 26% 29/09/2013
Rqe Fed Cred Mut 4.6254; 27/04/2017 Cam International Sa 1 % 26/04/2017
Cirnents Francais Se Emtn 4.75% 04/04/2017 Cofiroute 5.785% 09/:0/2016 Credit Agricole Sa 4 13% 31/12/2049 Credit Lcgemcnt 4.223% 15/06/2017
Oelhaiie Group 5.625% 27/06/2014 Oeutsche Telekoin B.62596 11/07/2011
Dcutsche Telekom Xg 4.500% 25/10/2013
Diago Finance PIC 196 77105/2012 Eloctricite De France 6.75% 20/10/2008
Enel Spa 5.25% 20/96/2017 Fcc Alliance Auto Loans 4.31 1 76 2% 0/7020
Fiat Finance R Trade Limitcd 6.625% 15/02/2013
Fia! Finance Na 5.625% 1 ?/06/20! 7 Gallories Lafayette 4 875% 17/12/2010
G u Capital For Gazprom Emtn 5.364% 31/10/2014 Gc Capital European 1 % 14/02/2013 Gc Capital Europear Funding 4.125% 27/10/2016 Gmac Bank Gmhh 1% 21/05/2010
Hbos Cap Fdg 1 76 29/05/2049 Hshc Bank PIC London 4.965% 2Y03/2016
lfil Sao 5.375% 12/06/'2017
950,000
750 000
715.000
580 000
2,000.M)o
450,000
1,000,000
1,500 000
500,000 550,000
500,000
437,000
? ,000,000
700,000
350,000
31 6,000
?.000.000
~ 0 , 0 0 0 776 000
755,000
1,500,000
474,000
900,000
1,158.000
:300.000
1,000.000
972,000
7 300,000
1.059.000
600.000
1,000.0M)
600,000
2.000.000
1,000,000
550,000
932,579
663.893 597,437
566,311
1,841,229
450,608 879.787
1,428,547
197,823
502,583 181.147
426,928
1.861.280
584.537
304,SiY
31 5.939
1,563,846
551,751
733.742
774,155
1,408,387
484,285
902,940
1,139,296
291.300
960,523
824,938
1,255,351
934,309
554,834
907,521
468.164 1,453.786
953,647
175,666
0.41
U.29 0.26
0.25 0.80
0.P0 0.38
0.62
0.22 0.22
0.21
0.1 9
0.81
0.75
0.13 0.14
0.68
0.24
0.32
0.34
0.81
0.70
0.39 0.50
0.13
0.42
0.36
0.55
0.4:
0.74
0.40 0.20 0. iY3
0.47
0 21
lmcrys Sn 5% 18/04/20 17 Jp Morgan Chase Bank 4.37576 1 4/11 /2021
Klcpicrrc 1.6254; 7 5/'07/2011 La Banquc Postalc Eintn 5.1028 12;12/20i6 ILvmh Moet Hennessy 4.625Yo 01 /07/?011 Merck Fanaiiz Ag 3.75% 07/12/2012 Merrill Lynch & Co Inc Emtn 5.01 14: 25/06/2014
Ote Plc 5.375 % 14/02/2011
Ppr Sa Erntri 4% 29!01:2013 Santandor Iswarices S.A Unipersonal Emtn 45.435% 24/10/20i 7 Schcring-Plough Gorp 5% 01/10~2010 Shinsei Rank Limited 1 % 23/07/2016
Siomcns Financioringmaatsctiap 5.25 '% 12/i2/201$
Slm Corp Erntn 5.278% O:/Of3/2013
Sogerirn Sa 1 % 2OiOU2011
Telecom ltalia Spa 5.375% 29/01/9019
Telefonica Emisiones S A 5.58 YO 17/06/2013 Transcapitalinvcst 5.38 1 % 27/06/2012 Urenco Finance Nv 5.375 % 22!05/2015 Vattenfall Treasury Ab 5.37546 29/04/2024 Veolia Environnement 6.1 2596 25/11 /2033
Vivendi 1 % 03/10/2011 Volkswagen Credit 5.125 % 19/05/201~ Volkswdgen Leasing Gmbh Emtn 4.875% 18/10/2012
600,000
1.350.OGO
780,000
900,oM)
1.500.OGO
: .ooo,oco
1 .I 00.000
610,000 1 .ooo.oco
400,000
358,000
2.000.000
1,200,000
1 , I 00,000
1,000,000
1 .ooo.ooo
1,050,000
900,000
700,OW
41 0,OOC
400,000
1,000,000
450,000
300.000
515,700
1,138.7/.0
741.781
834.437
1.468522
933.382
938,415
600.1 00 899,969
383.926
350.871
1,770,203
1 , I 96,13G
915,195
1,030,100
885.918
1,033,649
849.710
691.9L4
396,631
373,576
977,486
442.643
290.378
0.22
0.50
0.32
0.36
0.64
0.41
0.41
0.26 0.39
0.17
0.15
0.76
0.51
0.40
0.45
0.39
0.45
0.37
0.30
0.17
0.16
0.43
0.19
0.13
48,612,399 21.17
Total Bonds 48,612,399 21.17
EUR Mortgage and Asset Backed Securities Cranitc Mast 1 % 20:l 2/2054 187.706 182.601 0.08 Grsnitc Master Issuer PIC 176 20/12/2054 716.000 671,680 0.28 Great Hall Mtg No 7 PIC 4.94% 18/03/2039 200,000 132,294 0.06 Holland Mortgagc Backed 1 % 18/1 a2038 344.753 336,237 0.15 Leck Financc Holdings Eo 1 4.853% ?'/09/2038 276.219 271,137 0.12
Resloc Uk 4.83% 1 5/17/7043 : ,015,000 862.750 0.38
2,456,699 1.07
Total Mortgage and Asset Backed Securities 2,456,699 1.07
The accompanying notes form an integral part of these financial statements.
201
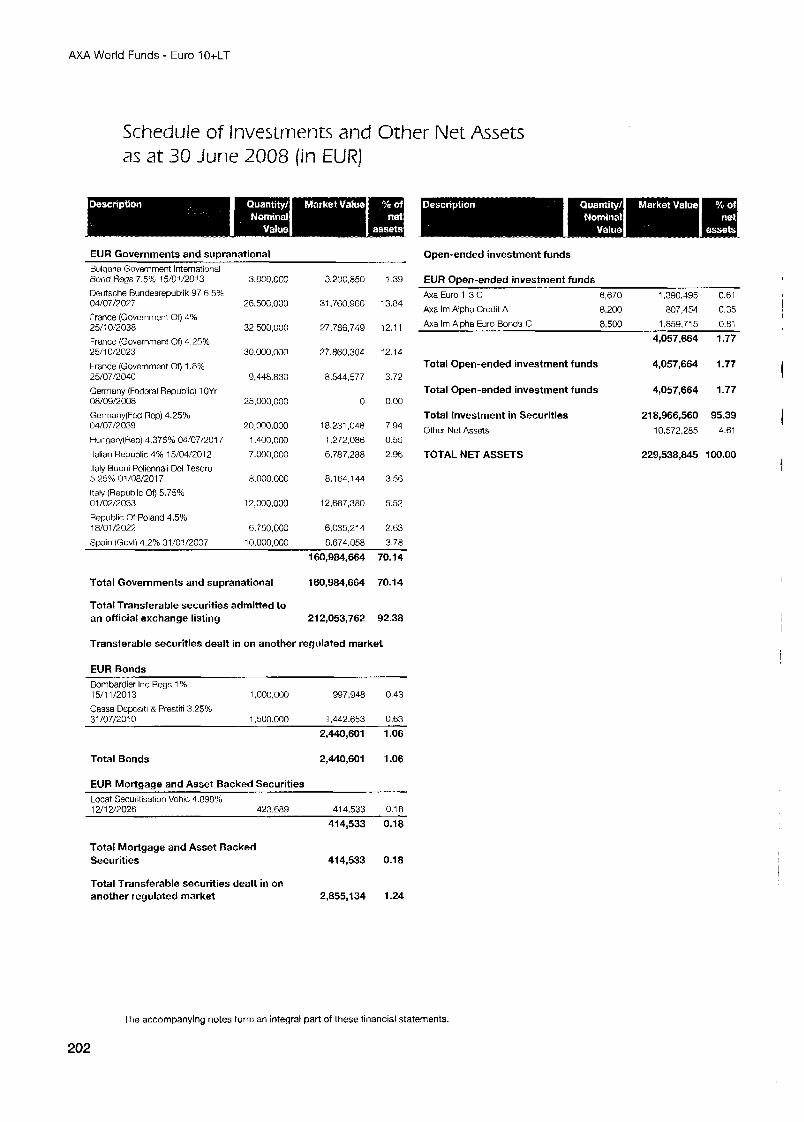
AXA World Funds - Euro 1O+LT
Schedule of Investments and Other Net Assets as at 30 June 2008 (in EUR)
EUR Governments and supranational Bulnaria Government International
Open-ended investment funds
Boid Hegs 7.5% 15/01/2G13 Deutsche Rundesrepublik 97 6.5% 04/07/?0?7 France (Government ot) 4 8 25/: 0/2038 France (Government Of) 4.25% 25/10/2023
France (Government On 1.8% 25/07/20& Gerrrwny (Fcderzl Republic) 1 OYr 08/09/2008 Gerrnany(Fcd Fcp) 4.25% 04/07:2039
Hungzry(Hep) 4.375% OC:07/2017
Italian Republic 4% 15/04/20 12 Italy Buoni Policnnali Dcl Tesoro 5.25% 01/08/2017 Italy (Republic of) 5.75% 01/02/2033
Republic Of Poland 4.5% 18/01 /202;! Soain lGoVti 4.2% 31:0!/2037
3.000.003
26,500,000
32,500.000
30,030,000
9,448.830
25,000,000
20,030,000
1.40G.000 7,000,000
8,000.000
12,000.000
6.750.000
3,200,850
31,760.966
27,786,749
27,860,304
8,544,577
0
18,231,048
1.272.086
6.787.288
8.164.1 44
12,667,380
6,C35,2'4
10.000.000 8.674.058
: .39 EUR Open-ended investment funds Axa Euro 1.3 C 6,670 1.390.495 0.61
3'84 Axa Im Alpha Credit A 8,200 807,454 0.35
12,1 Axa Im Alpha Euro Bonds-C 8,500 1,859,715 0.8; 4
4,057,664 1.77 i
12.14
1 Total Open-ended investment funds 4,057,664 1.77 3.72
Total Open-ended investment funds 4,057,664 1.77 0.00
Total Investment in Securities 218,966,560 95.39 7.94 Other Net Assets 10,572,285 4-61 0.55
2.96 TOTAL NET ASSETS 229,538,845 lW.00
3.56
5.52
2.63 3.78
160,984,664 70.1 4
Total Governments and supranational 160,984,664 70.1 4
Total Transferable securities admitted to an official exchange listing 212,053,762 92.38
Transferable securities dealt in on another regulated market
EUR Bonds Bombardier Inc Regs 1% 15/11/2013 1 .000.000 997,948 0.43
Cassa Dcposlti & Prestiti 3 2 5 2 31/07/2010 1.500.000 1.442.653 0.63
2,440,601 1.06
Total Bonds 2,440,601 1.06
EUR Mortaaae and Asset Backed Securities Locat Securitisation Vchic 4.898% 12/1 W 0 2 6 423.689 414,533 0.18
414,533 0.18
Total Mortgage and Asset Backed Securities 414,533 0.18
Total Transferable securities dealt in on another regulated market 2,855,134 1.24
The accompanying notes form an integral part of these financial statements
202

AXA World Funds - Euro 1 O+LT
I
t
Industrial Classification as at 30 June 2008
Sovereign Bonds 70.14
Corporate Bonds 17.69
Open-ended investment funds
Financial Services
Mortgage and Asset Backed Securities
Industrial
Communications
Basic Materials
Retail
Utilities
Automobiles
Consumer, Cyclical
Consumer, Non-cycl tcal
1.77
1 2 5 1.25
0.73
0 71
0 41
0.39 0.39 0 19 0.19 0.15
Building Materials and Products 0.13
95.39
I
203
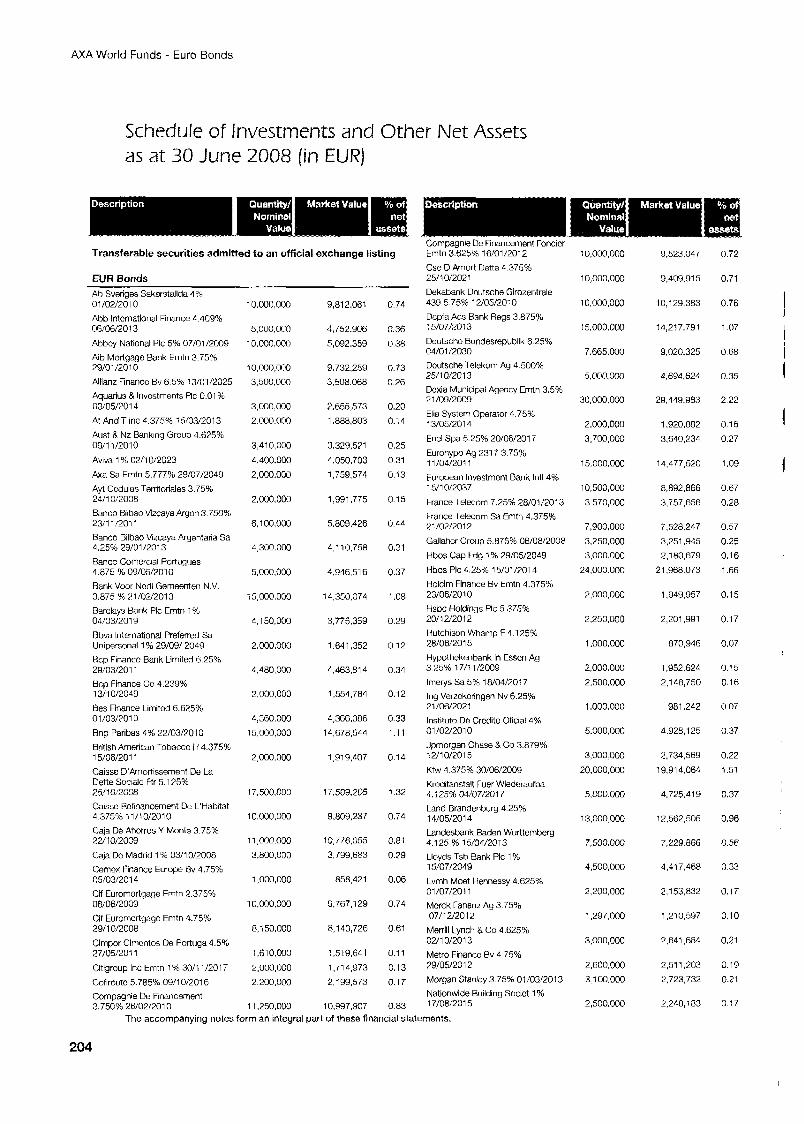
AXA World Funds - Euro Bonds
Schedule of Investments and Other Net Assets as at 30 June 2008 (in EUR)
Transferable securities admitted to an official exchange listing
EUR Bonds Ab Sveriges Sdkorstallda 4% 01 /02/2010 Abb IntcrnEtional Finance 4.469Y0 06:06/2013
Abbcy National PIC 5% 07/01/2009 Aib Mortgaqe Bank Emtn 3.7516 29/01/2010 Allianz ririancc Bv 6.5% 13/01!2025 Aquarius & Investments Pic 0.0146 C3/05/7C14 At And T Inc 4.375% 15/03/2013 Aust 8 Nz Banking Group 4.6?5% O W 1 1/2010 Aviva 1 % OW 012023 &a Sa Fmtn 5.777% 29/07/2049 Ayt Ccdulas Territoriales 3.75% 24/10/2008 Banco Bilbao Mzcaya Aryan 3.750% 234 :/2011 Banco Bilbao VIzcaya Argentaria Sa 4.25% 29/01/2013 Bancc Comerctal Portugues 4.875 % 09/05/2010 Rank Voor Ned1 Gemeenten N.V 3.875 '% 21/02/2013 Barclays Bank PIC h t n 1 % 04/03/2019 Rhva lnterrnational Preferred Sa Unipersonal 1 % 29/09/ 2049 Bcp Financc Bank Limited 6.25% 29/03/2011 Bcp Finance Co 4.239% 13/10/2049 Bes Finance Limitcd 6.625% 0 1 /03/?013 Rnp Paribas 4% 22/03/7010 Britlsh American Tobacco H 4.375% 15/06/2011 Caissc D'Amoriissemerit De La Dette Socidc Fir 5.1 75% %5/10:2008 Caisse Rcimancement De L'Habttat 4.37576 i 1/10/2010 Caja De Ahorros Y Monte 3.75% 22/10/20C9 Caja Dc Madrid i "/b 03/10/2008 Ceniex Ficance Europe Bv 4.75% 05/03/2014 Cif Euromortgage Fmtn 2 375Y0 08/06/2009 Cit Euromortgagc Emtn 4.75?h 29/10/2008 Cimpor Cimcntos De Portuga 4.5% 27/05/2011 Citigroup Inc Emtn 1 % 30/11/2017
Cofiroutc 5 765% 09/10:2016 Compagnfe De Financement 3.750% 26/02/2010
10.00c.000
5.000.000
10.000.000
10,000,000 3.500.000
3,000.000 2.000.000
3,410,000 4.400.000 2,000.000
2.000.000
6.1 00,000
4,300.000
5,000,000
~5,000.000
4,150,000
2.000.000
1,480,000
2,000,000
4,360,000 15,000,000
2,000,000
17,500,000
10,000,000
11,000.000
3,800.030
1,000,000
10,000,000
8,i 5C.000
1,610,000
2,000,000 2 200.000
1 1,250,000
9,812,061
4,752.906 5,092,359
9.732.259 3,508 068
7,655,573 1,885,803
3,329531
4,050,703 1.759.574
1,991,775
5.809.426
4,110,758
4.946516
14,350,074
3,775,359
1,641,352
4,463,814
1,554,764
4,366.386 14,676,544
1,919,407
17.509205
9.809.237
10,776,055 3,799,683
858,421
9.767.129
8,143,726
2,519,641
1.71 4.973 2,199,573
10.997.907
0.74
0.36 0.38
0.73 0.26
0.20 0.14
0.25 0.31
0.13
0.15
0.44
0.31
0.37
1.08
0.29
0.12
0.34
0.12
0.33 1.11
0.14
1.32
0.74
0.8 1
0.79
0.06
0.74
0.61
0.1 1 0.13 0.17
0.83
Compagnie De Financement Foncicr EiTtn 3.625% 16/01/2012 Csc D Amort rktte 4.375% 25/10/2021 Dekabank Ucutsche Girozentrale 439 5.75% 12/0$/20-0 Dcpfa Acs Bank Regs 3.875% 15/07/%013 Deutscho Bundesrepublik 6.25% C4/01/2030 Ucutsche lelekom Ag 4.500% 25/10/2013 Dcxia Municipal Agency Cmtri 3.5% 71/09/2009 Elia System Operator 4.7546 13/05/2014 Enel Spa 5.25% 20/06/2017 Eurohypo Ag 231 7 3.75% 1 1 /04/2011 Furopean Invostmcnt Bank 1314% 15/10/2037
France Telecom 7.2596 28/01/2013 France Telecom Sa Emtn 4.375% T /02/2012 Gallahcr Group 5.875% 06/08/2008
Hbos Cap Fdg 1 % 29/05/2049 Hbos PIC 4.25% 15/01/2014 Holcim Finance Bv Emtn 4.375% 23/06/2010 Hsbc Holdifqs PIC 5.375% 20/12/2012 tiutchison Whamp F 4.175% 28/06/2015 Hypothekenbank In Esscn Ag 3.25% 1711 1/2009
lmerys Sa 5% 18/04/?017 Ing Vorrckcringen Nv 6.25% 21/06/2021 lnstituto De Crcdito Oficial 4% 01 /02/2010 Jpmorgan Chase 8 Co 3.879% 12/1 of201 5
K ~ w 4.375% 30/06/2009 Kroditanstait Fuer Wiederautba 1, .I 25% 04/07/2017 Land Brandenburg 4.25% 14/05/2014 Landesbank Baden Wurttemberg 4.125 46 15/04/2013 Lloyds Tsb Rank PIC 1 % 15/07/2049
Lvmh Moet Hennessy 4.625% 01 /07/2011 Mcrck Fanani Ag 3.75% 0711 21201 2 Merrill Lynch & Co 4.625% c2/10/2013 Metro Finance Bv 4.75% 79/05/2012 Morgan Stanley 3.75% 01/03/2013 Nationwide Building Socict 1 % 17/08/2015
10,000,000
10,000,000
10,000,000
15.000.OoO
7.665.000
5.000.000
30,000,000
2,000,000 3,700,000
15.000.0M1
10,600,000 3.570,OOO
7,900,000 3.250.000 3,000.000
24.000.000
2.000.000
2,250,000
1 .ooo.ooo
2 , 0 0 0 . 0 ~
2.500.000
1,000,000
5.000.000
3,000.000
20,000,000
5,000.000
13.000,0M)
7,500.000
4,500,000
2,200,000
1.297.000
3,000,000
2.600.000 3. i 00,000
2.500.000
0,523,047
9,409,915
10,129.383
14,2: 7.79 1
9,020,325
4,694,624
29,449,983
1.920.882
3.640234
14,477,620
8,892,866
3.757.656
7,528,247 3,251,945 2,180,679
71.968.073
1,949,957
2,201,991
870,916
1,952,624 2,148,750
981,242
A.928,l 25
7,734,569 19.914 064
4,725,419
12,562,505
7,229.866
4,417,468
2,153,832
1,210,597
?.641,684
2,511203 2,723,732
2,248,183
0.72
0.71
0.76
1.07
0.68
0.35
2 22
0.15 0.27
1.09
0.67 0.28
0.57 0.25
0.16 1.66
0.15
0.17
0.07
0.'5 0.16
0.07
0.37
0.22
1.51
0.37
0.96
0.56
0.33
0.17
0.10
021
0.19 0.21
0.17
The accompanying notes form an integral part of these financial statements.
204
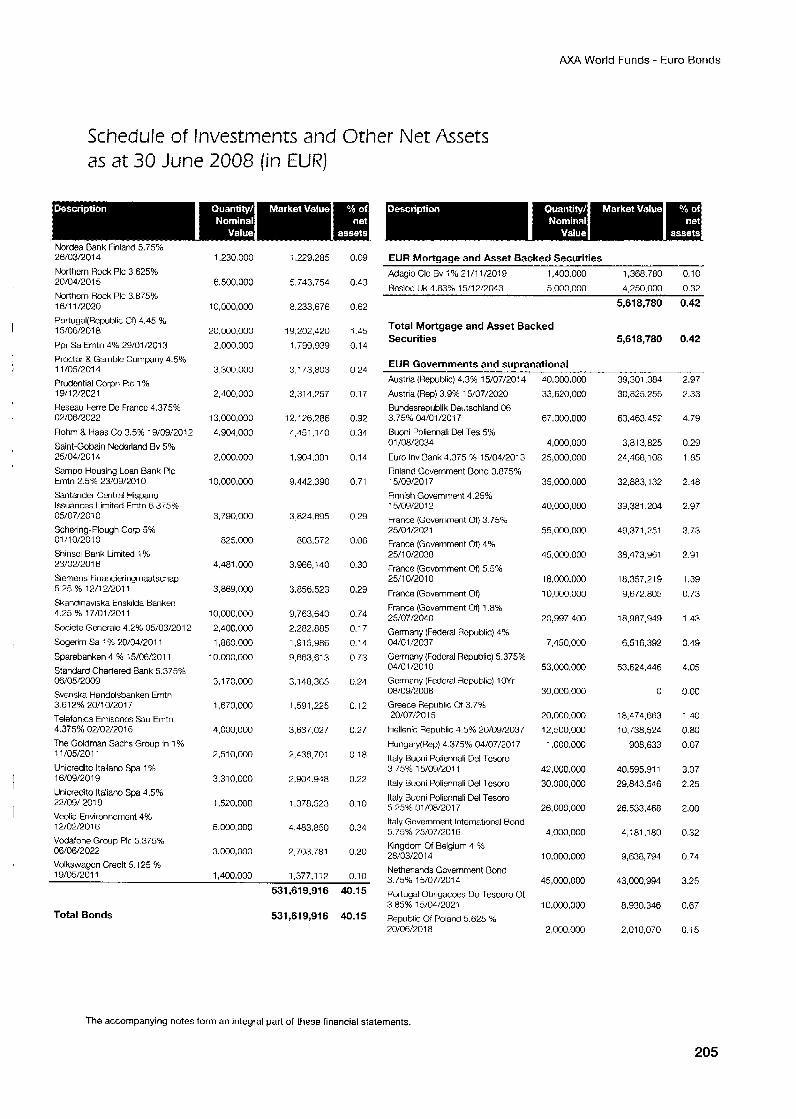
AXA World Funds - Euro Bonds
Schedule of Investments and Other Net Assets as at 30 June 2008 (in EUR)
Nordea Bank Finland 5.7546 26/03/2014 Northern Hock PIC 3.625%
Northcrn Rock PIC 3.875% 20/04/2015
16/11/2020 Portugal(Repub1ic @ 4.45 4: I 15/06/2018 Ppr Sa Emtn 4% 20/01/2013 Proctor 8 Gamble Company 4.5%
I 1 1 /OW201 4
Prudential Corpri PIC 1% 1 Y/17/702 1 Reseau Feme De France 4.375% 02/06/2022 Rohm 8 Haas Co 3.5% 19/09/2012 Saint-Gobain Ncdcrland Bv 5% 25/04/2014 Sampo Housing Loan Bank PIC Emtn 2.5% 23/09/2010 Santander Central Hispano Issuances Limited Emtn 6.375% 05/07/2010 Scharing-Plough C o p 5% 01/10/2010 Shinsci Bank Limited i % 23/02/2016 Siemens Financieringmaatschm 5.25 96 12/12/2011 Skandinaviska EnskiIda Banken 4.25 46 17/01/2011 Societe Generalc 4.2% 05/03/2012 Sogerim Sa 1 % 70/34/2011 Sparebanken 4 % 15/06/2011
I
Standard Chartered Bank 5.375% 06/05/2009 Svenska Handolsbanken Emtn 3.612% 20/10/2017 Telefonica Emisonos Sau Erntn 4.375% 02/02/2016 The Goldman Sachs Group In 1 % 11/05/2011 Unicredito ltaliano Spa 1 % 16/09/2019 Unicredito ltaliano Spa 4.5% 22/09/ 201 9
12/02/2016 Vodafone Group PIC 5.3754: 06/06/2022
I I Veolia Environnemont 4%
1,230,000
6,500,000
10,000,000
20,000,000 2,000,000
3.300.000
2,400,000
13,CQO,OOO 4,904,000
2,000.000
10,000.000
3,790.000
825,000
4.4ai.000
3,869,000
10,000,000 2,400,000 1,860.000 10.M30.000
3.1 70.000
1,670,000
4,000,000
2,510,000
3,310,000
1,520,000
5,000.000
3,000,000
7.229.285
5,743,754
8,233,676
19,202,420 1,739,939
3.173.ao3
2,314,757
i 2.1 26336 4,451,lAO
1,904,301
9.442.390
3.82.4.695
808.572
3,966,140
3.856.523
9,763,640 2.2a2.885 1 3 1 5,986 9,663.613
3.1 48.365
1,591,225
3,637,027
2,438,701
2.904.948
1.378523
4.483.850
2,703.781
1,377.1:2
0.09
0.43
0.62
1.45 0.14
0.24
0.17
0.97
0.34
0.14
0.71
0.29
0.06
0.30
0.29
0.74 0.17 0.14 0.73
0.24
0.12
0.27
0.18
0.22
0 10
0.34
0.20
0.10 Volkswagcn Credit 5.125 % 1 ~ / n w n i I . 1,400,000
531,619,916 40.15
Total Bonds 531,619,916 40.15
EUR Mortaaae and Asset Backed Securities AdagioClo Bv i4: 21/11/2019 1,400,000 1,368,780 0.10 Hcsloc Uk 4.83% 15/12/2043 5,000,000 4,250,000 0.32
5,618,780 0.42
Total Mortgage and Asset Backed Securities 5,618,780 0.42
EUR Governments and supranational Austria (Republic) 4.3% 15/07/2014 4O.OOO.OCO 39,301.384 2.97 Austria (Rep) 3 9?/, 15/07/2020 Bundesrepublik Deutschland 06 3 75% 04/01/2017 Buoni Poliennali Del Tes 5% 01 /08/2034 Euro Inv Bank 4.375 % 15/04/2013 Finland Government Bond 3.875% 15/09/2017 Finnish Government 4 25% 15/09/2012 France (Government or) 3.75% 25/04/2021 France (Government Of) 4% 25/10/2038 France (Govornment Or) 5.5% 25/10/2010 France (Government Of) France (Government Oil 1.8% 25/07/2040 Germany (Federal Hepublic) 4% 04/01/2037 Germany (Fodcral Rcpublic) 5.375% 04/01/2010 Germany (Federal Rcpublic) 1OYi oa/o9/2ooa Greece Republic Ot 3.7% 20/07/?015
hellenic Republic 4.5% 20/09/2037 Hungary(Rep) 4.375% 04/07/2017 Italy Ruoni Poliennali Del Tcsoro 3.75% 15/09/2011 Italy Buoni Poliennali Oel lesoro
Italy Buoni Policnnali Del Tesoro
Italy Government International Bond 5.75% 75/07/2016 Kingdom of Belgium 4 % 28:03/2014
5.25% oi/oa/2oi7
Netherlands Government Bond 3.75% 15/07/2014 Portugal Obrigacoes Do Tesouro Ot 3.85% 15/04/2021 Republic Of Poland 5.625 % 20/06/2018
33,620,000
67,000.0M)
4,000,000 25,000,000
35,000,000
40.000,000
55,000,000
45,000,000
18,000,000 10,000,000
20,997.409
7,450,030
53,000,000
30.000,OOO
20.000.oM) 12,500,000 1.000.0M3
42.000.000 30,000,000
26,000,000
4,000,000
1o.ooo.oM3
45,000,OM)
10,000,000
2.000.000
30,825,755
63.463.457
3,813,825 24,468,108
32,683,132
39,381,204
49,371,251
38,473,961
111,357,219 9,672,805
18,987.949
6.51 6.392
53.624.446
0
16,474,663 10,738,524 908,633
40.595.91 1 29,843,546
26533.468
4,181.180
9,638,791
43,090,994
8,930,346
2.010.070
2.33
4.79
0.29 1.85
2.48
2.97
3.73
2.91
1.39 0.73
1.43
0.49
4.05
!J.OO
1.40 0.80 0.07
3.07 2.25
2.00
0.32
0.74
3.25
0.67
0.15
The accompanying notes form an integral part of these financial statements.
205
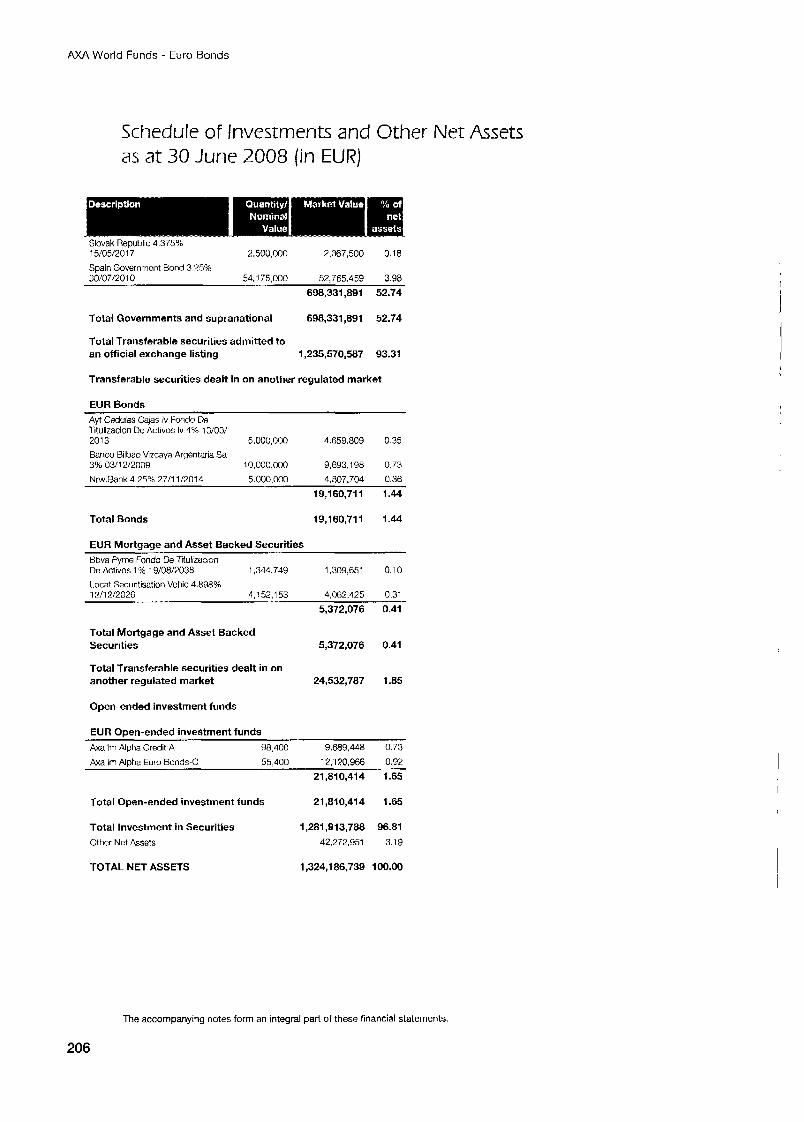
AXA World Funds - Euro Bonds
Schedule of Investments and Other Net Assets as at 30 June 2008 (in EUR)
15/05/2017 %.500.000 2,367,500 0.18
Spain Government Bond 3.?5% 30/07/2010 54,175,000 52,765,459 3.98
698,331,891 52.74
Total Governments and supranational 698,331,891 52.74
Total Transferable securities admitted to an official exchange listing 1,235,570,587 93.31
Transferable securities dealt in on another regulated market
EUR Bonds Ayf Cedulas Cajas Iv Fondo De 1 itulizacion De Activos Iv 4% 13/03/ 2013 5.000.000 4.659.809 0 35 Banco Bilbao Vizcaya Argentaria Sa 3% 03/12/2009 10.000.000 9,693,198 0.73 NrwRank42576 27/11/2014 5 000,000 4,807,704 036
19,160,711 1.44
Total Bonds 19,160,711 1.44
EUR Mortgage and Asset Backed Securities Bbva Fyme Fondo De Titulizacion De Activos 1 Y/u 19/08/7038 1,344.749 1,309,651 0.10
Locat Securitisation Vehic 4.898% 1 7/12/2026 4,152,153 4,062,425 0.31
5,372,076 0.41
Total Mortgage and Asset Backed Securities 5,372,076 0.41
Total Transferable securities dealt in on another regulated market 24,532,787 1.85
Open-ended investment funds
EUR Open-ended investment funds &a Im Alpha Credit A 98,400 9.689.448 0.73 Ax3 Im Aloha Euro Bonds-C 55.400 12.120.966 0.92
21,810,414 1.65
Total Open-ended investment funds 21,a10,414 1.65
Total Investment in Securities 1,281,913,788 96.81 Other Net Assets 42,272,951 3.14
TOTAL NET ASSETS 1,324,186,739 100.00
The accompanying notes form an integral part of these financial statements
206
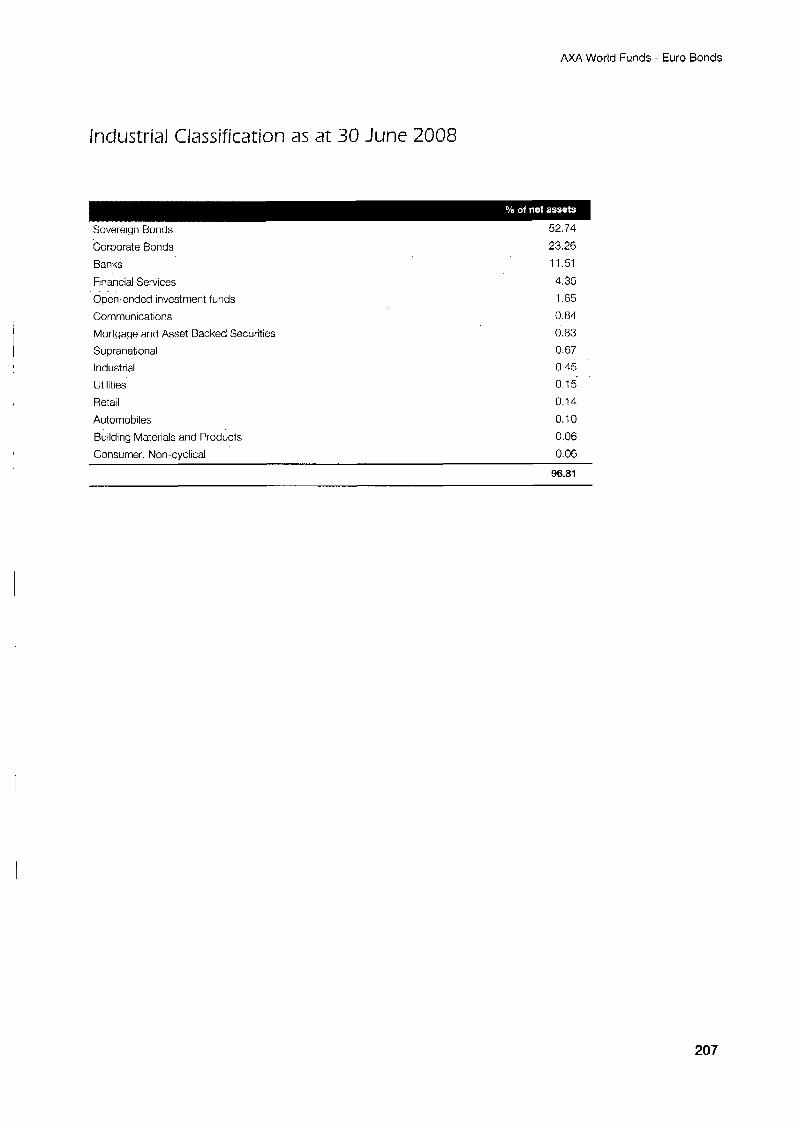
AXA World Funds - Euro Bonds
Industrial Classification as at 30 June 2008
Sovereign Bonds 52.74
Corporate Bonds
Banks
Financial Services
Open-ended investment funds
Communications
Mortgage and Asset Backed Securities
Supranational Industrial
Utilities
Retail
Automobiles
Building Materials and Products Consumer. Non-cvclical
23.26 11.51
4.35
1.65
0.84
0.83
0 67
0 45
0.15 0.14
0.10
0.06 0.06
96.81
207
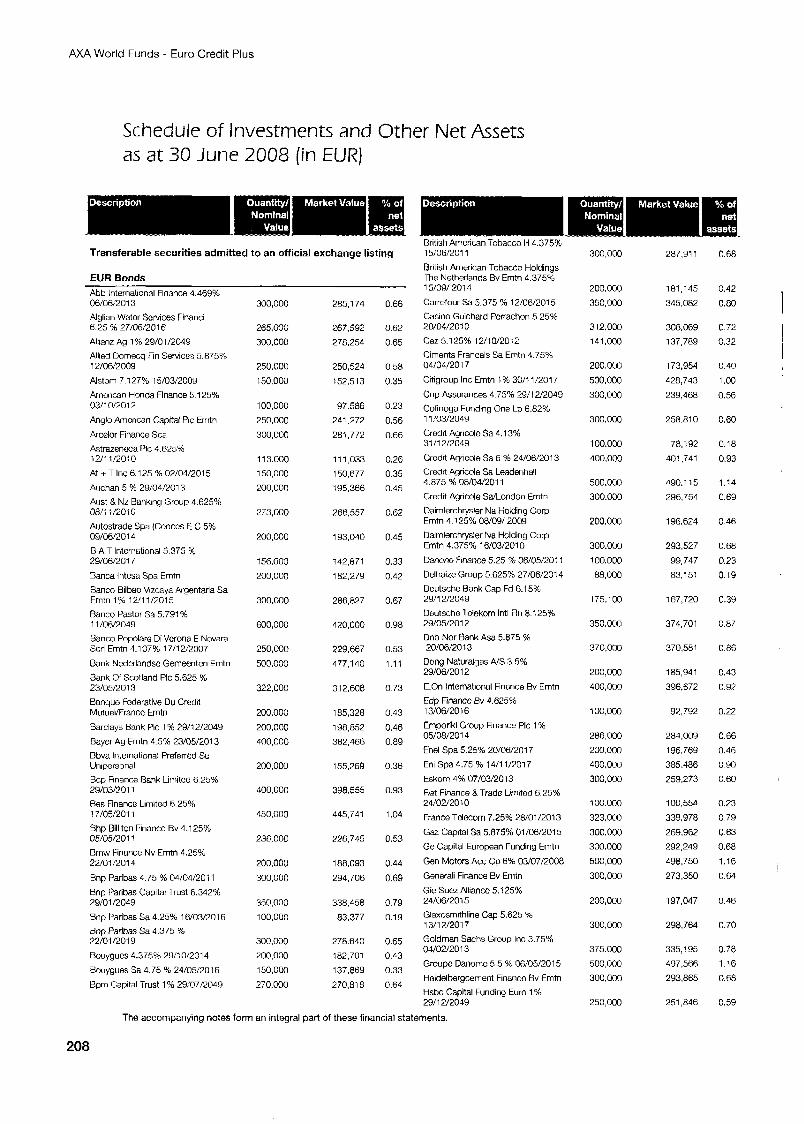
AXA World Funds - Euro Credit Plus
Schedule of Investments and Other Net Assets as at 30 June 2008 (in EUR)
Transferable securities admitted to an official exchange listing
EUR Bonds Abb International Finance 4.469% 06/06/2013 Alglian Water Services Financi 6.25 % 27/06/2016 Allianz Ag 1% 29/01/2049 Allied Dornecq Fin SeWicCS 5.875% 12/06/2009 Alstorn 7.127% 15/03/2009 Arncrican Honda Finance 5.125% 03/10/2012
Anglo Amcncan Capital PIC Erritn
Arcclor Finance Sca Astrazenwa PIC 4,W25% 12/11/2010 At + T Inc 6.125 % 02/04/2015 Auchan 5 % 29/04/2013 Aust 8, NL Banking Group 4.625% ow1 1/201c Autostrade Spa (Conces E C 5% 09/06/2014 B A T Intcrnstional 5.375 % 29/06/2017 Banca lntcsa Spa Erntn Banco Bilbao Vlzcaya Argentaria Sa Frntn 1% 12/11/2015 Banco Pastor Sa 5.791 9t 1 1/06/2049 Banco POpOlarQ Di Verona E Novara Scd Erntn 4.107% 17/12/2007
Bank Nederlandsc Gemeenten Erntn
Bank M Scotland PIC 5.625 % 23/05/2013 Banquc Federative Du Credit Mutuel/Francc Emtn
Barclays Bank PIC 1 Y6 7911 2/2049 Bayer Ag Frntn 4.5% 23/05/2013 Bbva International Preferred Sz Unipersonal Bcp Finance Bank Lirnitcd 6.25% 29/03/?01’ Bes Finance Limited 6.25% 17/05/2011 Bhp Billiton Financa Bv 4.125% 05/05/2011 Bmw Finance Nv Emtn 4.25% 22/01/2014
Rnp Paribas 4.75 % 04/04/2011 Bnp Paribas Capital Trust 6.342% 29/01/2049
Bnp Paribas Sa 4.25% 16/03/2016 Bnp Paribas Sa 4.375 % 72/01 /2019 Bouygucs 4.375% 29/10/2014 Bouygues Sa 4.75 % 24/05/2016 Bprn Capital Trust 1 % 29/07/2049
300,000
265,000
300.000
750,000 150,000
100,000 250.001)
300.000
11 3.000 150,000 200,000
273,000
~00.000
156,000 200.000
300,000
600,000
250,000 500,000
322,000
200.000 200.000 400,OCO
200,000
400,000
450,000
236,000
200,000 300,000
350.000 100,000
300,000 700,000 150,000 270,000
285.1 74
267,592
278.254
250,524 152,513
97.586 241,272
281,772
11 1,033 150,677 195.366
766.557
193,040
142,871 182,279
286.827
420,000
229.667 477,140
31 2,608
185,328 198,852 382.466
155,269
398,555
445,741
226.745
188,093
294,706
338.458 83,377
278.640 182.701 137.869 270.818
0.66
0.62
0.65
0.58
0.35
0.23
0.56 0.66
0.26 0.35 0.45
0.62
0.45
0.33
0.42
0.67
0.98
0.53 1.11
0.73
0.43 0.46 0.89
0.36
0.93
1.04
0.53
0.44
0.69
0.79 0.19
0.65 O.n3 0.33
0.64
Brirtsn American Tobaccc h 4 375% 15/06/2011 Rriiish American Tobacco Holdings The Nethedands Bv Erntn 4.375% 15/09/ 201 4 Carrefour Sa 5.375 % 12/06/2015 Casino Guichard Ferrachon 5.25% 28/04/2010 Cez5.125% 12/10/2012 Cirnents Francais Sa Emtn 4.75% 04/04/2017
Citigroup Inc Erntn 1% 30/11/2017
Cnp Assurances 4.75% 29/12/2049 Cofinoga Funding One Lp 6.82% 1 1 !03/2049 Croclit Agricolc Sa 4.1 3% 31/12/2049 Credit Agricole Sa 6 % 24/06/2013 Credit Agricole Sa Leadenhall 4.875 % 08/04/2011 Credit Agricole Sa/London Erntn
Dairnlerchrysler Na tiolding Corp Erntn 4.125% 08/09/ 2009 Dairnlerchrysler Na Hclding Gorp Erntn 4.375% 16/03/2010 Dancnc Finance 5.25 % 06/05/2011
Delhaize Group 5.625% 27/06/2014 Dcutsche Rank Cap Fd 6.1 5% 29/12/2049 Deutsche Tclekom lntl Fin 8.125% 29/05/2012 Dnb Nor Bank Asa 5.875 % 20/06/2013 Dong Naturalgas NS 3.5% 29/06/2012
E.On International Finance Bv Erntn Mp Financc Bv 4.625% 13/06/2016 Enporiki Group Finance PIC 1 % 05/08/2014 Enel Spa 5.25% 20/06/2017 Eni Spa 4.75 46 14/1 1/201 7 Eskom 4% 07/03/2013 Fiat Finance 8, Trade Lmitcd 6 25% 24/02/2010
France Tdccom 7.25% 28/01/2013 Gar Capital Sa 5.875% 01/06/2015
Ge Capital European Funding Emtn
Fen Motors Acc Cp 6% 03/07/2008 Generali Finance Bv Emtn
Gie Suez Alliancc 5.1 25% 24/06/2015 Glaxosrnithline Cap 5.625 % 13/1 2/2017 Goldman Sachs Group Inc 3.75% 04/02/2013 Groupc Danome 5.5 % 06/05/2015 Heidelbergcernent Financc Bv Erntn
hsbc Capital Funding Euro 1 % 29/12/2049
300.000
200.000 350,000
312.000
141.000
200,000
500.000 300.000
300.000
1 oo.oM3 400.00G
500,OW 300.000
200,000
300.000 100.000
88,000
175.100
350.000
370,000
200,000
400,000
100,000
286.000 200.000 400.000 300,000
100.000 323.000
300.000 300.000 500,000 300,000
200,000
300,OM)
375.0OU 500,000 300,000
250,000
287.91 1
181,145 345.082
308.069 137,789
173,954 428,743
239,468
258.81 0
78.192 401,741
ago.115
296,754
196,624
293,527
99,747 83.151
167,720
374,701
370.581
185,941 396.672
92,792
284.009 196,769 385.486 259.273
100,55A 339.978
269,962 292,249
498.750 273,350
197,047
298,764
335,195 497.566 293,865
251,846
0.68
0.42
0.80 1 0.72
0.32
0.40
1 .oo 0.56
0.60
0.18 0.93
1.14 0.69
0.46
0.68 0.23
0.19
0.39
0.87
0.86
0.43
0.9a
0.22
0.66
0.46 0.90 0.60
0.23 0.79 0.63
0.68
1.16 0.64
!
0.46
0.70
0.78 1.16 0.68
0.59
The accompanying notes form an integral part of these financial statements.
208
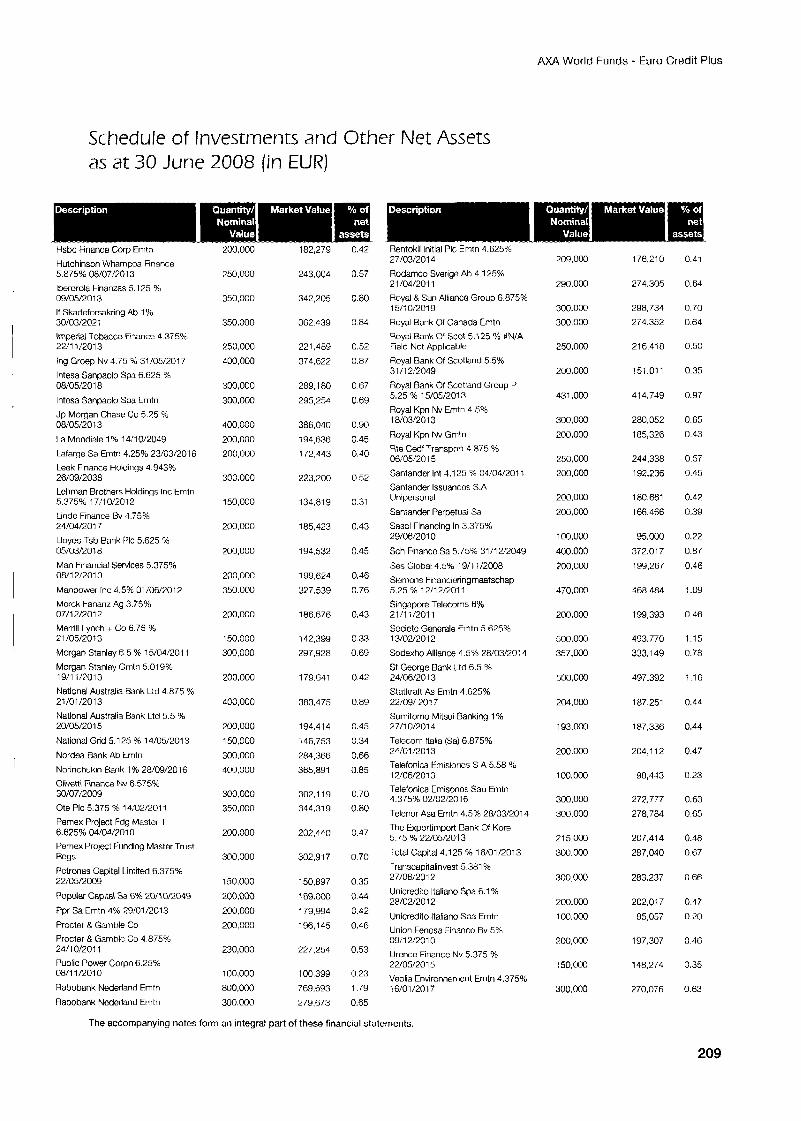
AXA World Funds - Euro Credit Plus
Schedule of Investments and Other Net Assets as at 30 June 2008 {in EUR)
Hsbc Finance Corp Erritn Hutchinson WhamFoa Finance 5.875% 08/07/7013 lberdrola Finanzas 5.125 % 09/05/2013 If Skadeforsakring Ab 1 % 30/03/2021 Imperial TObdCCO Fnance 4.375% 22/11/2013
Ing Groep Nv 4.75 % 31/05/2017 lntesa Sanpaolo Spa 6.625 76 08/05/2018
lntesa Sanpaolo Spa Cmtn Jp Morgan Chase Go 5 75 % 08/05/2013
La Mondiale 1 % 14,’10/2049
Lafarge Sa Emtn 4.25% 23/03/2016 Leek finance Holdtngs 4 943% 26/09/2038 Lchman Brothers Holdings Inc trntn 5.3754: 17/1 0/2012 Lindc Finance Bv 4 75% 24/04/2017
Lloyds Tsb Bank PIC 5.625 ?A 05/03/2018 M a n Financial Services 5.375% 08/12/2010
Manpower Inc 4.5% 01/06/;.’012 Merck Fananz Ag 3.75% 07/12/2012 Merrill Lynch + Go 6.75 % 21 /05/2013 Morgan Stanley 6.5 ?4 15/04/2011
Morgan Stanley Grntn 5.01 9% 19/11 /7U13
National Australia Bank Ltd 4.875 % 21/01/2013 National Australia Bank Ltd 5.5 % 20/05/2015
National Gnd 5.125 % 14/05/2013
Nordea Bank Ab Erntn
Norinchukin Bank 1% 28/09/2016 Olivetti Finance Nv 6.575% 30/07/2009 Ote PIC 5.375 % 14,’02/2011
Pernex ProjKt Fdg Mastcr T 6.625% 04/04/2010 Pemex Project Funding Master Trust Regs Pctronas Capital Limited 6.375% 22/05/2M39
Popular Capital Sa 6% 20/10/2049
Ppr Sa Erntn 4% 29!01/2013
Procter B Gamble Co
Procter 8 Gamble Go 4.875% 24/:0/2011 Public Power Corpn 6.25% 08/11/2010
Rabobank Nederland Erntn
Rabobank Nodorland Emtn
250,000
350,000
350.00G
250,000 400,000
300,000
300,000
100,000
200.000
200,000
300,000
150,000
200.000
200.000
200,OOG
350.000
200.000
150,000
300,000
?00.000
400.000
200,000
150,000
300.00G
400,000
300,000 350.000
200.000
300.000
150,000
200,000
200,000
200,000
230,000
100,000
800,000 300.000
243,004
342,205
362.639
221.489
374.622
289,l 80 295,254
386.040 194,636
i72,443
773.700
134,819
185,423
194,537
199,624
317.539
186.676
142,399 297.928
179.641
383.475
194.41 4
146,753
284.366 365,891
302.1 19 344.319
202.440
302.91 7
150,897
189.000
179,994
196,145
217.254
1 OG 399
769,693
279.673
c.57
G.80
C.84
C.52
0.87
0.67
0.69
0.90
0.45 0.40
0.52
0.31
0.43
0.45
0.46
0.76
0.43
0.33 0.69
0.42
0.89
0.45
0.34
0.66
0 85
0.70
0.80
0.47
0 70
0.35
0.44
0 42
0.46
0.53
0.23
1.79
0.65
Rentokil Initial PIC Emtn 4.625% 27/03!2014 Rodarncu Sverige Ab 4.1 25% 21/04/2011 Hoyal 8 Sun Allimce Group 6.875% 15/: 0/2019
Royal Bank of Canada Erntn Royal Bank Of Scot 5.125 % #N/A Field Not Applicable Royal Bank Of Scotland 5.5% 31 /12/2049
Royal Bank Of Scotland Group P 5.25 % 15/05/2013 Royal Kpn Nv Erntn 4.5% 18/03/2013
Royal Kpn Nv Gmtn Rte Cedf Transport 4.675 % 06:05/2015
Santandcr Int 4.1 25 % 04/04/2011 Santander lssuanccs S.A llnipersonal
Santander Perpetual Sa Sasol Financing In 3 375% 29/06/2010
Sch Financc Sa 5.75% 31/12/2049
Ses Global 4.5% 19/11/2008 Sicrncns Financieringrnaatschap 5.25 % 12/12/2011 Singapore Telworns 6% 21/1 i/2011 Socictc Gencrale Erntn 5.625% 13/02/2012 Sodexho Alliance 4.5% 28/03/2014
St George Bank Ltd 6.5 % 24/06/20 13 Statkratl As Emtn 4.625% 22/09/ 201 7
Sumitorno Mitsui Banking 1 % 27/10/2014
Telecorn ltalia (Sa) 6.875%
Telefoniw. frnisioncs S A 5.58 3b 17/06/20+ 3 Telefonica Ernisoncs Sau Eriitn 1.375% 02/02/2016
Telenor Asa Emtn 4.5% 28/03/2014 The Exportimport Bank of Kore 5.75 96 22/05/2013
Total Capital 4.125 % 16/01 /2013
I-ranscapitalinvest 5.381 % 27/06/2012
Unicredito ltaliano Spa 6.1 % 28/02/20 12
Unicredito ltaliano Spa Erntn Union Fenosa Financc Bv 5% 09i l 2/7010
24/01/2013
Urenco Finance Nv 5.375 4: 22/05/2015 Veolia Cnvironnement h t n 4.375% i 6/01/2017
209,000
290,000
300.000 300.000
250.000
200,000
431 .OM)
300,OM)
200.000
250,000 200.000
200,000
200,000
100,oM)
400.000
700.000
470.000
200.000
500.000 357,000
500.000
204,003
193,000
2 0 0 . m
100.000
300,000
300.000
215.000
300.000
300,000
200.000
100,000
200,000
7 50,000
300.000
176,210
274,305
298.734 274.352
216.418
151.011
414,749
280,052
185,326
244.338
192.236
180,661
168.466
95,000
372.01 7
199,267
468,484
199,393
493,770
333.1 49
497.392
187,251
187,336
200,112
98,443
277.777
278,784
207,414
287,040
283.237
202.0: 7
85,057
197,307
148.274
270.076
0.41
0.64
0.70 0.64
0.50
0.35
0.97
0.65
0.43
0.57
0.45
0.47
0.39
0.22
0.87
0.46
1.09
0.46
1.15
0.78
1.16
0.44
0.44
0.47
0.23
0.63
0.65
0.48 0.67
0.66
0.47
0.20
0.46
0.35
0.63
The accompanying notes form an integral part of these financial statements.
209
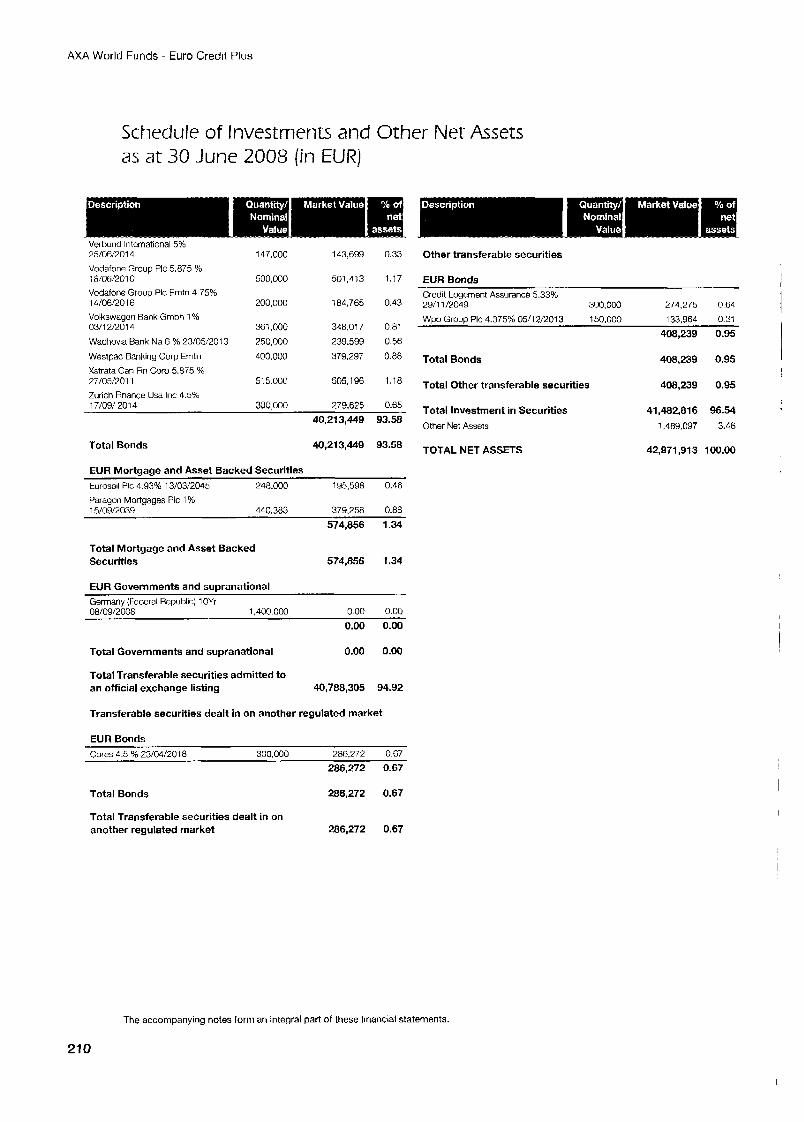
AXA World Funds - Euro Credit Plus
Schedule of Investments and Other Net Assets as at 30 June 2008 (in EUR)
Verhund lntcrnational 5% 25/06/2014 147,000 143,699 0.33 Other transferable securities Vodafone Group PIC 5.875 % 18/06/2010 500.000 501.413 1.17 EUR Bonds - - . . - . . . -_ Vodafone Group PIC Erntn 4 75% 14/06/2016 200.000 184,765 0.43 2g/i v2049 300.000 274,275 064
Credit I-ogernent Assurance 5.33%
Volkswagon Bank Grnbh 1% Wpp Group PIC 4.375% 05/12/2013 i50.000 133,964 0.31 348,017 0.81
408,239 0.95 03/12/2014 361,000 Wachovia Bank Na 6 % 23/05:2013 X0.000 239.599 0.56 I Westpac Banking Corp Erntn 400.000 408,239 0.95 I 379*297 0-88 Total Bonds
505,1 96 Total Other transferable securities 408,239 0.95 Xstrata Car Fin Corp 5.875 % 27/05/7011 51 5.000 Zurich Finance Usa Inc 4.546 17/09/ 201 4 300,000 279,625 0.65
;
Total Investment in Securities 41,~2,ai6 96.54 40’213’449 93.58 Other Net Assets 1,48Y,OY7 3.46
40’213’449 93*58 TOTAL NET ASSETS 42,971,913 100.00 Total Bonds
EUR Mortaaae and Asset Backed Securities ~~~~
Eurosad PIC 4 93% 13/03/2045 248.000 195.598 0.46
Paragon Mortgages PIC 1 % 15/09/2039 440,383 379,258 0.88
574,856 1.34
Total Mortgage and Asset Backed Securities 574,856 1.34
I
EUR Governments and supranational Germany (Federal Republic) 1 OYr 08/09/2008 1.400.000 0.00 0.00
0.00 0.00
Total Governments and supranational 0.00 0.00
Total Transferable securities admitted to an official exchange listing 40,788,305 94.92
Transferable securities dealt in on another regulated market
EUR Bonds Cores 4.5 % 23/04/2018 300,000 286.272 0.67
286,272 0.67
Total Bonds 286,272 0.67
Total Transferable securities dealt in on another regulated market 286,272 0.67
The accompanying notes form an integral part of these financial statements.
21 0
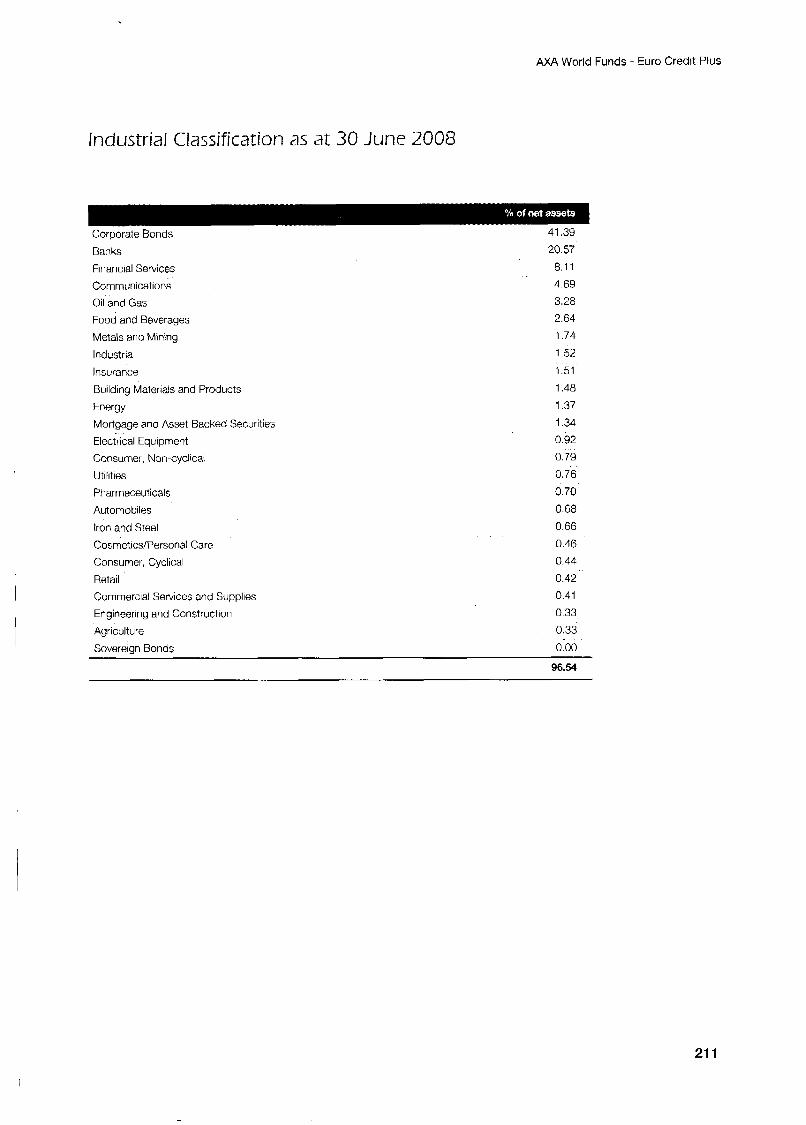
AXA World Funds - Euro Credit Plus
Industrial Classification as at 30 June 2008
Corporate Bonds 41.39
Banks
Financial Services
Communications
Oil and Gas Food and Beverages
Metals and Mining
Industria
Insurance
Building Materials and Products
Energy Mortgage and Asset Backed Securities
Electrical Equipment
Consumer, Nan-cyclical
Utilities
Pharmaceuticals
Automobiles
Iron and Steel
Cosrnetics/Personal Care
Consumer, Cyclical
Retail
Commerzial Services and Supplies
Engineering and Construction
Agriculture
20 57 8.11
169 3.28 2.64 1.74
1 52 1.51 1.48
1 37 1 34 0.92 0.79
0.76
0 70 0 68 0.66
0.46
0.44 0 42 0.41 0.33
0.33 Sovereign Bonds 0.00
~ .-
96.54
21 1
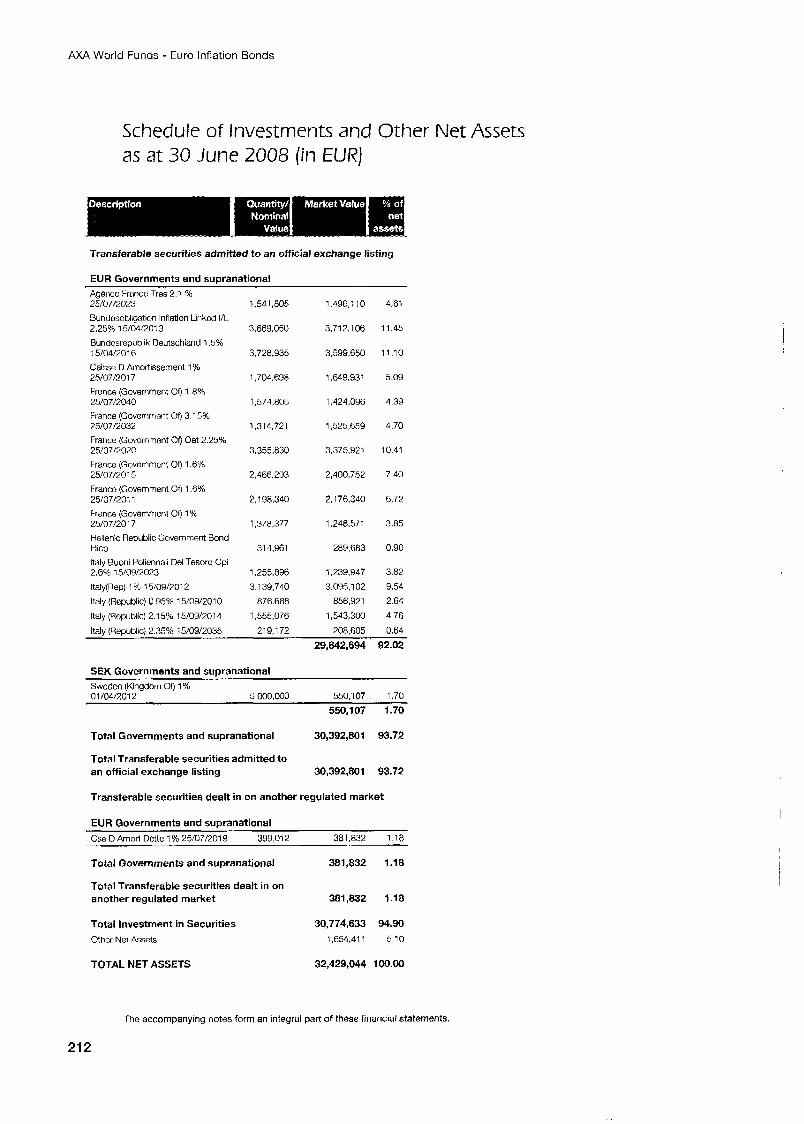
AXA World Funds - Euro Inflation Bonds
Schedule of Investments and Other Net Assets as at 30 June 2008 (in EUR)
Transferable securities admitted to an official exchange listing
EUR Governments and sumanational Agence France Tres 2.1 % 25/07/2023 Bundesobligation Inflation Linkcd I/L 2.25% 15/04/2013 Bundcsrepublik Deutschland 1.5% 15/04/2016 Caisse D Arnortissement 1 % 25/07/2017 France (Governmcnt 00 1 .e% 25/07/?040 France (Govcmment Ot) 3.1 5% 75/07/2032 France (Govcmment 06 Oat 2.25% 25/07/2020 France (Governmcnt OfJ 1.6% 25/07/2015 France (Government Of) 1.6% 25/07/2011 France (Govemmcnt OfJ 1 % 25/07/2017 Hellenic Republic Government Bond Hicp Italy Huoni Poliennali Del Tesoro Cpi 2.6% 15/09/2023 Italy(Rep) 1 % 15:09/7012 Italy (Republic) 0.95% 15/09/2010
ltalv IReoublic) 2.35% 15/09/2035
lhdly (Rcpublic) 2.15% 15/09/2014
1,541,805
3,669,050
3,728,935
1,704,696
1574.805
1,314,721
3,355,830
2,466,293
2,196,340
1.376.377
314,961
1,255,896 3.1 39,740
876.688 1,555,076
219,172
1,496.1 1 0
3.712.106
3,599,650
1 .W9.931
1.424.096
1,525,659
3.375.921
2,400.752
2.1 76,340
1.248571
289.683
1,239,947 3.095.1 02
856,921 1,543,300
208.605
4.61
11.45
11.10
5.09
4.39
4.70
10.41
7.40
6.72
3.85
0.90
3.82
9.54 2.64 4.76
. . . 0.64
29,842,694 92.02
SEK Governments and supranational Swcdcn (Kingdom or) 1 % 01/04/%012 5,000,000 550,107 1.70
550,107 1.70
Total Governments and supranational 30,392,801 93.72
Total Transferable securities admitted to an official exchange listing 30,392,801 93.72
Transferable securities dealt in on another regulated market
EUR Governments and supranational Cse D h o r t Dctte 1 % 25/07/2019 399.01 2 381.832 1.18
Total Governments and supranational 381,832 i . ia
Total Transferable securities dealt in on another regulated market 381,832 1.18
Total Investment in Securities 30,774,633 94.90 Other Net Assets 1,654,411 5.10
TOTAL NET ASSETS 32,429,044 lMl.00
The accompanying notes form an integral part of these financial statements.
21 2
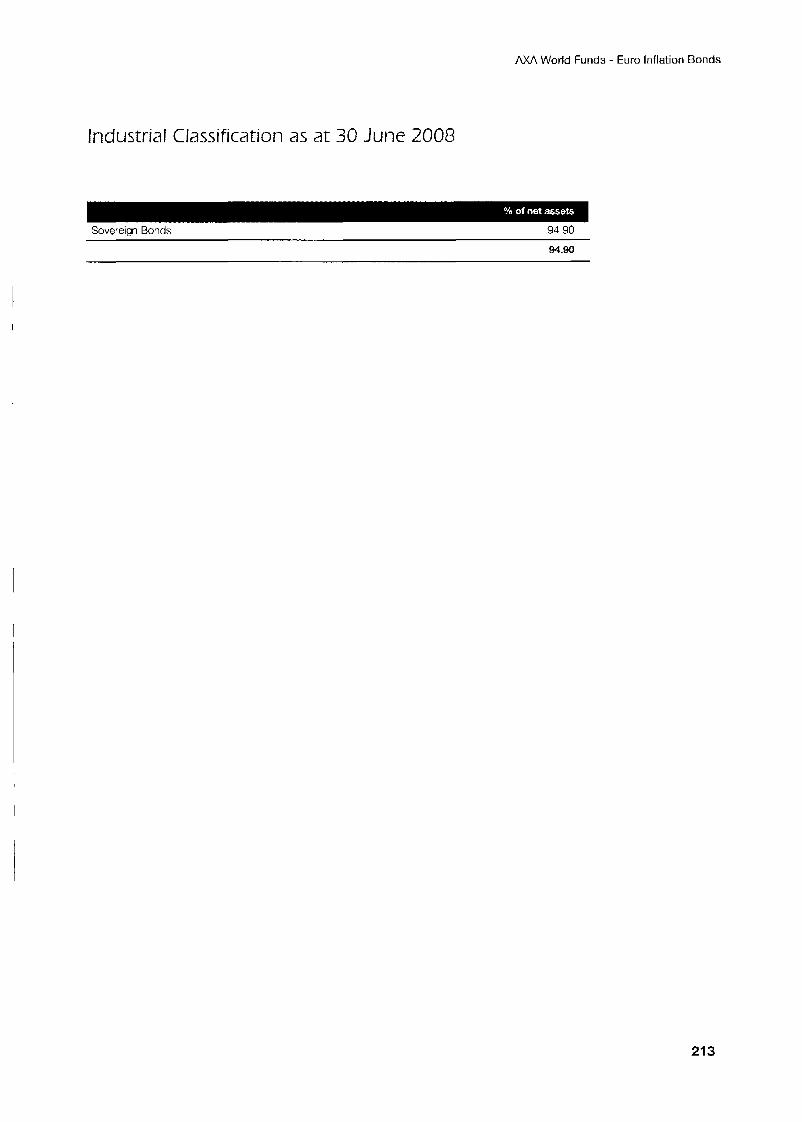
A M World Funds - Euro Inflation Bonds
Industrial Classification as a t 30 June 2008
Sovereign Bonds 94.90
94.90
21 3
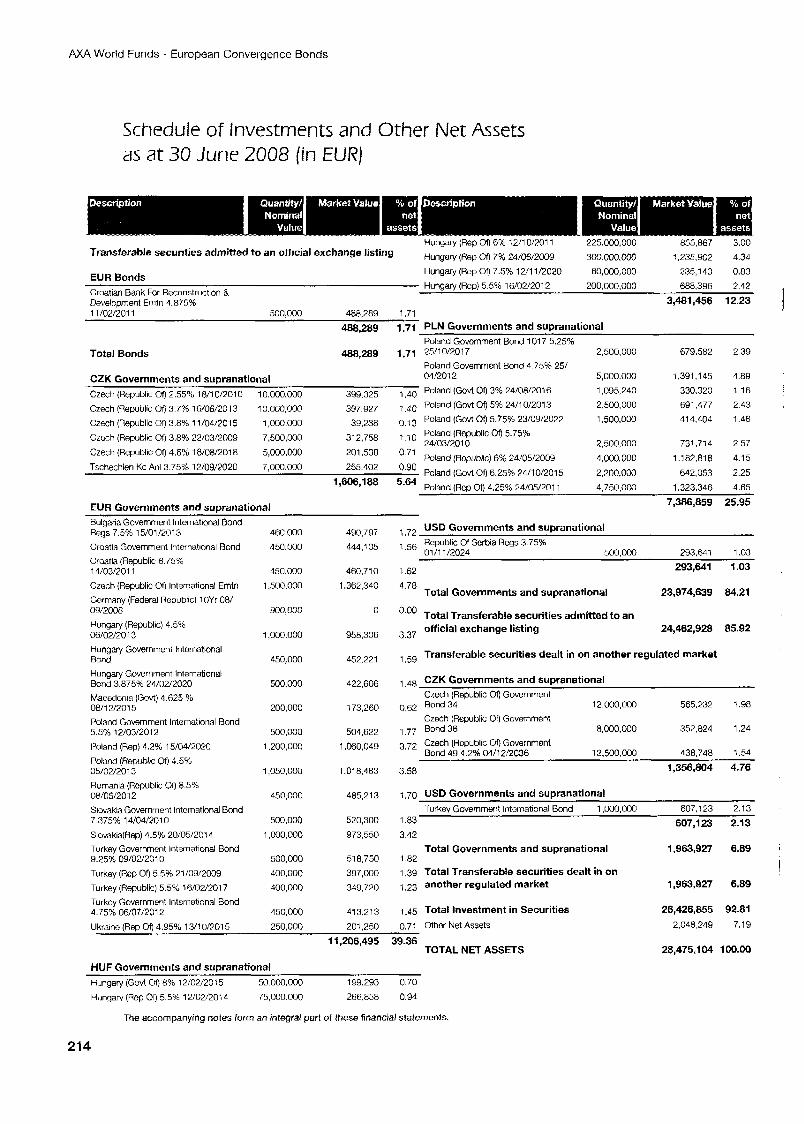
AXA World Funds - European Convergence Bonds
Schedule of Investments and Other Net Assets as at 30 June 2008 (in EUR)
Hungary (Rep Of) 6% 1211 01701 1 225,000,000 855,867 3.00 300.000.000 1,235,902 4.34
Hungay (Rep or) 7.5% l a 1 1/2020 60,000,000 235,140 0.83 Hungary (Rcp) 5.5% 16/02/2012 200,000,000 688.396 2.42
3,481,456 12.23
Transferable securities admitted to an official exchange listing
EUR Bonds Croatian Bank For Reconstructiorr 8 Development Emtn 4.875% 11 /02/2011 500,000 486.289 1.71
Hungary ofj 7% 24,06/2009
488,289 1.71 PLN Governments and supranational Poland Govcrnment Bond 1017 5.25%
Poland Government Bond 4.75% 25/ Total Bonds 488,289 1-71 25!10/2017 2,500,000 679.582 2.39
CZK Governments and supranational 041201 2 5,000.000 1.391,145 4.89 399,325 ,40 Poland (God Of) 3% 24/08/2016 1,095,240 330,320 1.16 Czech (Republic or) 2.554: 18/10/2010
Czech (Republic Gf) 3.7% 16/06/2013 10.000.000 39i,927 .40 Poland (Govt Of) 5% 24/10/2013 2,500,000 691,477 2.43 39,238 o.13 Poland (Govt Of) 5.75% 23/09/2022 1.500.000 414,404 1.46 Czech (Republic or) 3.8% 1 1/04/1015
24/03/2010 ?.500,000 731,714 2.57 Czech (Republic or) 3.8% 22/03/2009
201q538 0.71 Poland (Republic) 6% 24/05/2009 4,000,000 1.182.818 4.15 Czech (Republic Or) 4.6% 18/08/2018
1-schechien Kc A111 3.75% 12/09/2020 7,000.000 255*402 Pcland (God Ofj 6.25% 24/10/2015 2.200.000 642,053 2.25
'606'188 5.64 Poland (Rcp Of) 4.25% 24/05/2011 4,750.000 1,323,346 4.65
7,386,859 25.95
10.000.000
1,000,000 7,500,000
5,000.000
3,2,758 l . lo Pcland (Republic m5.75%
EUR Governments and supranational Bulgaria Government International Bond Regs 7.5% 15/01/2013 Croatia Government lritcrnational Bond Croatia (Republic 6.75% 14:03/2011 Czech (Republic or) International Emtn
Germany (Federal Ropublic) 1 OYr 08: O~I,2:2008 Vungaty (Republic) 4.5% 06/02/2013 Hungary Government lntornatlonal Bond Hungary Government International Bond 3.875% 24/02/2020 Macoclcnia (Govt) 4.625 76 08/12/2015 Poland Government International Bond 5.5% 12/03/2012 Poland (Rep) 4.2% 15/04/2020 Poland (Republic or) 4.5% 05/02/2013 Romania (Republic or) 8.5% 08:05/2012 Slovakia Government lntcrnational Bond 7.375% 14/04/2010 Slovakia(F3ep) 4.5% 20/05/2014 Turkey Government International Bond 9.25% 09/02/2G10 Turkey (Rep Of) 5.5% 21/09/2M)9 Turkey (Republic) 5.5% lG/O2/2017 Turkcy Government lntcrnational Bond 4.75% 06/07/?012
46C.000 450.000
450,000
1,500,000
m,ooo
1,000,000
450,000
500,000
200.000
500.000 1,200,000
1,050,000
450,000
500,000
1 ,000,000
500,000 400,000 AO0,OOO
450,000
490.797 444,105
460,710
1.362.340
0
958,306
452,221
422,606
173,260
504,622 1,060,049
1.01 8.483
485.21 3
520,300
973,550
518,750 397,000 349,720
413.213
,72 USD Governments and supranational .56 Republic Of Serbia Regs 3.75%
01/11/2024 500.000 293.641 1.03
293,641 1.03
Total Governments and supranational 23,974,639 84.21
1.62 4.78
'.O0 Total Transferable securities admitted to an
3.37
, ,59 Transferable securities dealt in on another regulated market
official exchange listing 24,462,928 85.92
,48 CZK Governments and supranational Czech (Republic or) Government
Czech (Rcpublic Of) Government
3,72 Czech (Rcpublic or) Governmant
565,232 1.98
1.77 Bond36 8,000,000 352,824 1.24
Bond 49 4.2% 04/12!2036 12,500,000 438,748 1.54
1,356,804 4.76
12.000.000 0 . ~ 2 Bond34
3.58
1.70 USD Governments and supranational lurkey Government International Bond 1,000,000 607,123 2.13
1.83 607,123 2.13 3.42
Total Governments and supranational 1,963,927 6.89 1.82 1.39 Total Transferable securities dealt in on 1.23 another regulated market 1,963,927 6.89
1.45 Total Investment in Securities 26,426,855 92.81 mi 75n n 71 Other Net Assets 2.048.249 7.19 Ukrainc (Rep Of) 4.95% 13/10/?015 250,000
1 1,206,495 39.36 TOTAL NET ASSETS
HUF Governments and supranational Hungary (Gcvt Gf) 8% 12/02/20 15 50.000.000 199,293 0.70 Hungary (Rep or) 5.5% 12/02/20:4 75,000.000 266.858 0.94
The accompanying notes form an integral part of these financial statements.
28,475,104 100.00
21 4
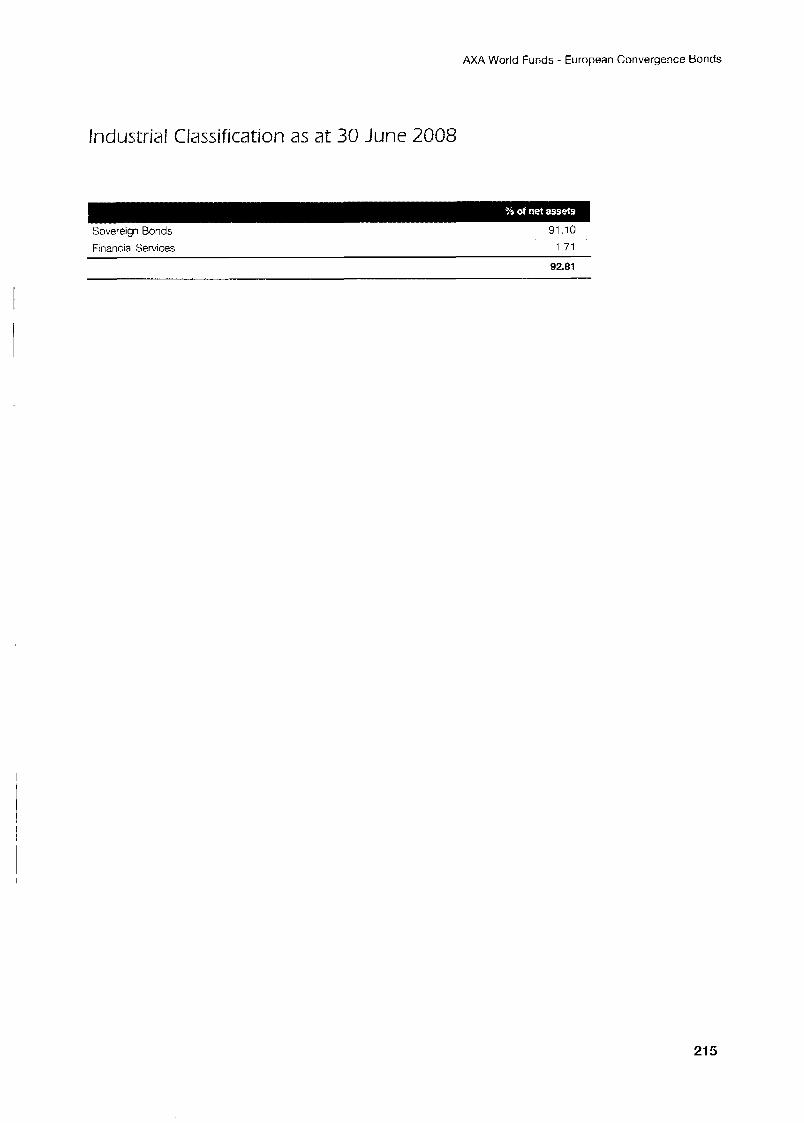
AXA World Funds - European Convergence Bonds
Industrial Classification as at 30 June 2008
Sovereign Bonds
Financial Services
91.10 1.71
92.81
21 5
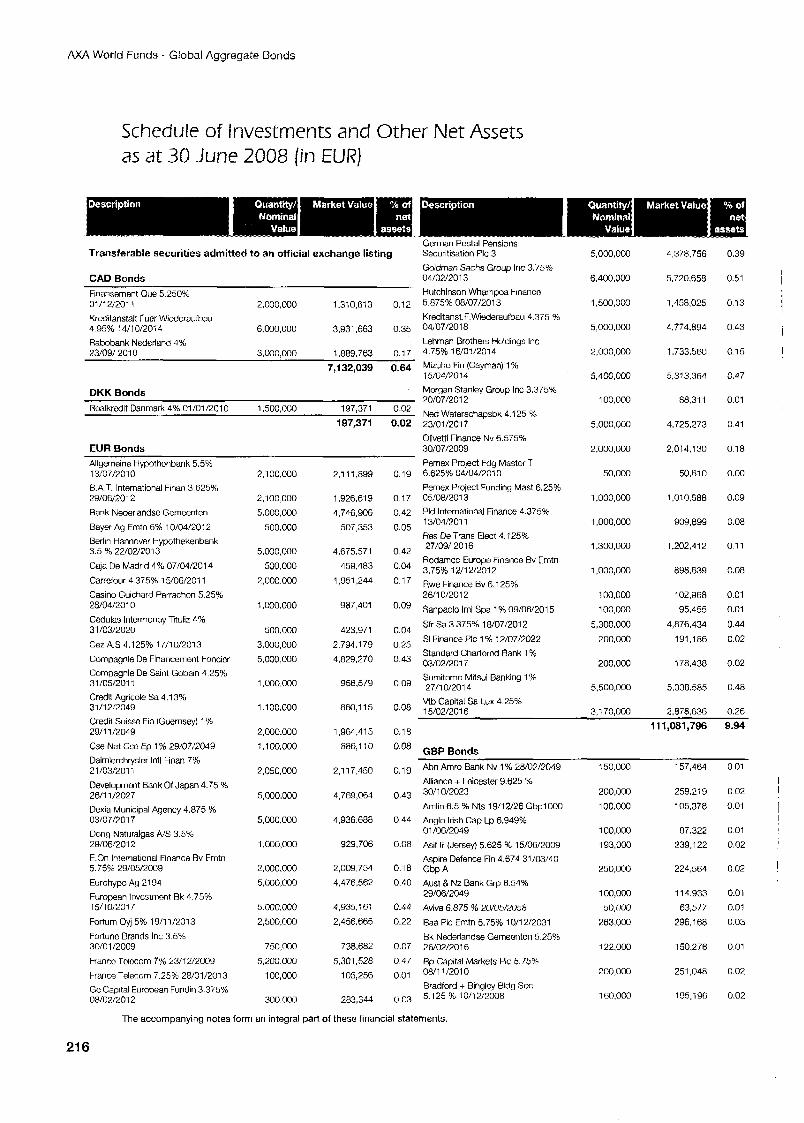
A M World Funds - Global Aggregate Bonds
Schedule of Investments and Other Net Assets as at 30 June 2008 (in EUR)
German Postal Pensions Securitisation PIC 3 Transferable securities admitted to an official exchange listing
CAD Bonds Goldman Sachs Group lnc 3.75% 04/’02/2013
Finansement O w 5.250% 01/12/2011 2.000.000 Kredrtanstalt h e r Wiederaufbau 4.95% 14/1 0/20i 4 6,000,000 3,931,663 0.35 04;07/2018 Rabobank Noderland 4% %3/09/ 201 0 3,000,000 1,889,763 0.17 4.75% 16/01/2014
Hutchinson Whampoa Financc
Kreditanst.f.Wlwleraufbau 4.375 %
Lehrnar Brothers Holdings Inc
1,310,613 0.12 5.875% 08/07/2013
7,132,039 0.64 Mizuho Fin (Cayman) 1% 1 5/04/20 1 4 Morgan Stanley Group Inc 3.375% 20/07/2012
DKK Bonds RcalkrMit Danrnark 4% 01/01/2010 1,500,000 197,371 0.02
197,371 0.02
EUR Bonds Allgemeine Hypothcnbank 5.5% 13!07/2010 B.A T International Finan 3 625% 29/06/2012 Rank Nederlandsc Femeenten
Bayer Ag Emtn 6% 10/04/2012 Berlin Hannover Hypothekenbank 3.5 % 22/02/2013 Cap De Madrid 4% 07/04/2014 Carrefour 4 375% 15/06:2011 Casino Guichard Permchon 5 25% 28/04/2010 Codulas lnterrnoney Tituliz 4% 31/03/2020
CezA.S 1.125% 17/10/2013 Compagnie De Financement Fonclcr Cornpagnie De Saint Gobain 4.25% 31 /05/2011 Credit Agricole Sa 4.13% 31/12/2049 Credit Suisse Fin (Guernsey) 1 % 2911 1/2049 Cse Nat Cso Ep 1 % 29/07/2049 Dairnlerchrysler lntl hnan 7% 21/03/201i Development Bank Of Japan 4.75 96 26/11/2027 Dexia Municipal Agency 4.875 % 03/07/2017 Dong Naturalgas N S 3.5% 29/06/2012 E On International Finance 0v Fmtn 5 75% 29/05/2009 Eurohypo Ag 2194 Furopean Investment Bk 4 75% 15/10/2017 Fortuni 0 ~ ~ 5 % 19/11f013 Fortunc Brands Inc 3.5% 30/01/2009
France Telecorn 7% 23/12/2009 France Telecorn 7.258 28/01/2013 Ge Capital Europan Fundin 3.375% 08/0%/%012
7,100,000
%.100.000
5.000,OOO 500,000
5.000.000
500,000 2,000.000
1 ,M)O.WO
500.000 3.000.000 5,000,000
1,000,000
1 .I 00,000
2,000.000 1,100,000
7,050,000
5,000.000
5,000.000
1 000,000
2.000.000
5.000.000
5.W0.000 2,500,000
750,000 5,200 OOO
100,000
300.000
2.1 11,899
1,926,619 4,746,906
507,353
4,675,571
459,483 1,951,244
987,401
423,971 2,794,179
4.829270
956,579
860,l 15
1,964,415 886,l 10
2.1 17,450
4,769,064
4,936.688
Y29,706
2,003754
4,476,562
4,935.161 2,456,665
738.682 5,301.528
105,256
283,344
0.19
0.17 0.42 0.05
0.42 0.04
0.17
0.09
0.04
0.25 0.43
0.09
0.08
Ned Waterschapsbk 4.125 % 23/01/2017 Olivetti Finance Nv 6.575% 30/07/2009 Pernex Project Fdg Master 1 6.625% 04/04/2010 Pemex Project Funding Mast 6.25% 05!08/2013 Pld International Finance 4.37590 13/04/?011 Res De Trans Elect I. 125% 27/09/ 201 6 Rodamco Europe Finance Ev Fmtn 3.75% 12/12/2012 Rwe Finance Bv 6.1 25% 26/10/2012 Sanpaolo Irni Spa 1 % 09/06/2015
Sfr Sa 3.375% 18/07/2012 SI Finance PIC 1 % 12/07/2022 Standard Charlared Bank 1 % 03/02/2017 Surnitomo Mitsui Banking 1 % 27/10/2014
Vtb Capital Sa Lux 4.25% 1 wn7/701 fi
5,000,000
6,400,000
1,500,000
5,000.000
2,000,000
5,400.0W
100,oM)
5,000,000
2.000.000
50,000
1,000.000
1 ,000,OW
1.300.000
1,000,000
100,000
100,000 5,3GO,OCQ
200.000
200.000
5.500.000
4,378,756
5.720.658
1,458,025
4.774.894
1.733.560
5.313.364
88,311
4.725.273
2,014,130
50,610
1.01 0.588
909,899
1.202,412
898.639
102.968 95.455
4,876.434
191,186
178.438
5.338.585
0.39
0.51
0.13
0.43
0.15
0.47
0.01
0.41
0.18
0.00
0.09
0.08
0.1 1
C.08
0.01
0.01
0.44
0.02
0.02
0.48
. . 3,170,OCO 2,878,636 0.26
11 1,081,796 9.94 0.18
GBPBonds
0.19
0.43
0.44
0.08
0.18
0.40
0.44 0.22
0.07
0.47 0.01
0.03
Abn Amro Bank Nv 1 % 28/02/2049 Alliance + Leicester 9.625 % 30/10/2023
Amlin 6.5 % Nts 19/12/26 GbplOOO Anglo Irish Cap Lp 6.949% 01 /OW2049 Asif lii (Jersey) 5.625 96 15/06/2009 Aspire Defence Fin 4.674 31/03/40 Gbp A Aust & Nz Bank Grp 6.54% 29/06/2049 Aviva 6.875 96 20/05/2058
Baa PIC Emtn 5.75% 10/12/2031 Bk Nederlandse GerncQntCn 5.25% 26/02/2016 Bp Capital Markets PIC 5.75% ow1 1/2010 Bradford + Binglcy Bldg Soc 5.125 76 10/12/2008
150,000
200.000 100,000
1 00.u00 193,000
250,000
100,000 50,000
263,000
122,oCO
200,000
160,000
157,464
259,219
105.378
87.322 239,122
224,564
114.933 63,577
296,168
150,276
251,048
195,196
0.01
0.02
0.01
0.01
0.02
0.02
0.01
0.01
0.03
0.01
0.02
0.02
I I
i i I
I I
I !
I
The accompanying notes form an integral part of these financial statements.
21 6
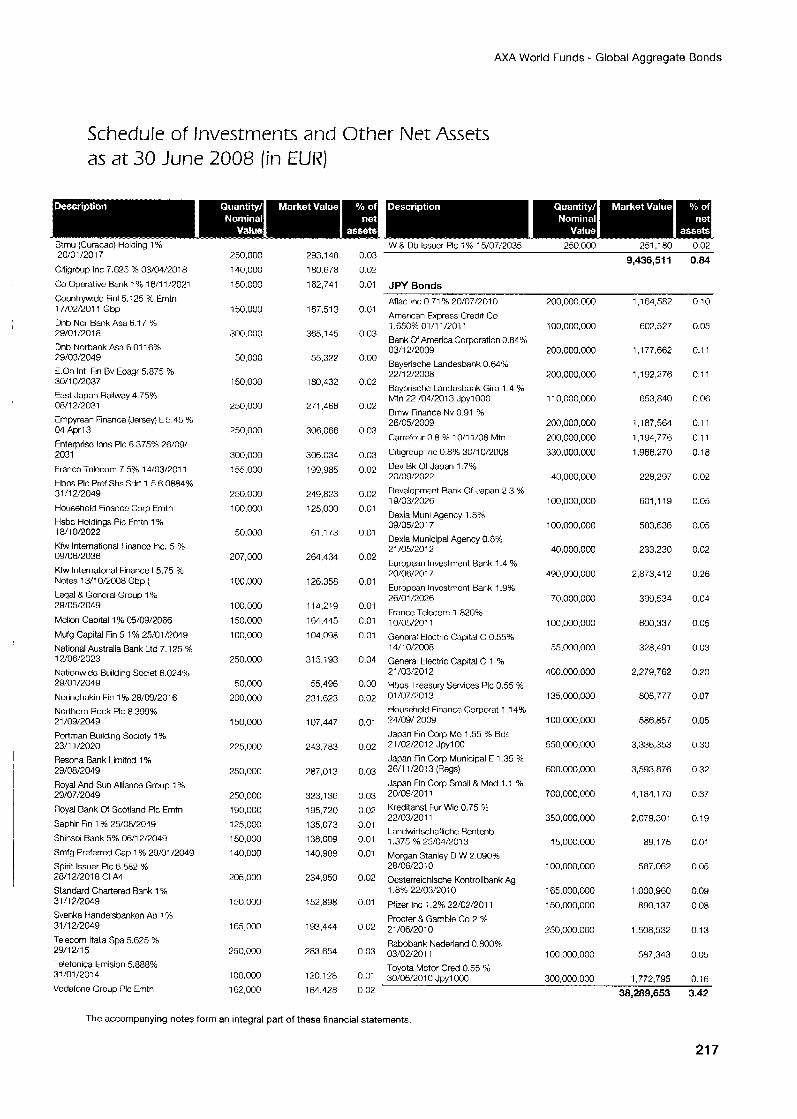
AXA World Funds I Global Aggregate Bonds
Schedule of Investments and Other Net Assets as at 30 June 2008 (in EUR)
Btmu (Curacao) Holding 1 % 20/01/2017
Citigroup Inc 7.625 % 03/04/2018
Co Operative Bank 1% 16/11 PO21
Countrywide Fin1 5.:25 % Emtn 17/02/2011 Gbp Dnb Nor Bank Asa 6.1 7 %
Dnb Norbank Asa 6.01 16% 29/01/2018
79/03/2049 E.On lntl Fin 0 v Eoaqr 5.875 % 30/10/2037 East Japan Railway 4.75% 08/12/2031 Ernpyrean Finance (Jersey) L 5.45 5% 04 Aprl3
Enterprisc Inns PIC 6 375% 26/09/ 2031
France Telecom 7.5% 14/03/2011 Hbos PIC Pref Shs S3rt 1.5 6.OW4% 31/12/2049
Household Finance Corp Enitn Hsbc Holdings PIC Emtn 1% 18/10/2022 Kfw International Finance l r ~ . 5 % 09/06/2036 Kfw lnternatonal Finance 15.75 % Notes 13/10/2008 Gbp (
Legal B Gcncral Grcup 1 % 29/05/2049
Mcllon Capital 1 % 05/09/2066
Mufg Capital Fin 5 1% 25/01/2049 National Australia Bank Ltd 7.125 % 12/06/2023 Nationwido Building Societ R.024Y0 29/01/2049 Norinchukin Fin 1 YO 28/09/2016 Northern Rock PIC F 399% 21/09/2049 Portman Ruilding Socicty 1% 2311 112020 Resona Bank Limitcd 1 % 29/08/2049
Royal And Sun Alliance Group 1% 29/07/2049
Royal Rank 01 Scotland PIC Emtn
Saphir Fin 1 % 25/08/2049 Shinsci Rank 5% OW1 2/2049 Smfg Prefened Cap 1 % 29/01/2049 Spint Issuer PIC 6.582 % 28/12/2018 CI A4
Standard Chartered Bank 1 % 3111 ?/PO49 Svenka Handelsbankon Ab 1 % 31/12/2049
Telecom ltalia Spa 5.G25 % 29/12/15 Telefonica Emision 5.888% 31/01/7014
Vodaforio Group PIC Emtn
250,000
140,000
150.000
150.000
300, 000
50.000
150.000
250,000
250,000
300,000
155,000
250,000
100,000
50,000
207,000
100,000
100,000
150,000
100,000
250,000
50,000
200,000
150,000
225,000
250,000
250,000
19O.OGO
125,000 150,000
140.000
205,000
150,000
165,000
250.000
100,000 162,000
293.148
180.678
162,741
167.513
365.165
55.377
180,432
271,466
306,066
306.034
199,985
219.823
125,000
61.1 73
264,434
126.358
114,219
164,445
104,098
315.i93
55,406
231,623
107,447
243.783
%87.013
323.136 195,710
135,073
138,009 140,989
234.950
152.898
193.444
283.654
120,128
184.428
0.03
0.02
0.01
0.01
0.03
0.00
0.02
0.02
0.03
0.03
0.02
0.02
0.01
0.01
0.01
O.G1
0.01
c.01 0.01
0.04
0.00
0.02
0.01
0.02
0.03
0.03
0.01 0.01
0.01 0.01
0.02
0.01
0.G2
0.03
0.01
W 8 Dh Issuer PIC i "/o 15/07/2035 250.000 251.180 0.0%
9,436,511 0.84
JPY Bonds
Aflac Inc 0.71 % 20/07:2010
American Express Credit Co
Bank of America Corporation 0.84% 0 3 1 2/2009 Bayerische Landeshank 0.6446 22/12/2008 Rayerische Landesbank Giro 1.4 '?A Mtn 22 /04/2013 Jpyl 000
Rrnw Finance Nv 0.91 % 26!05/2009
Carrefour 0.8 96 10/11/08 Mtn
Citigroup Inc 0.8% 30/10/2008 Dev Bk Of Japan 1.7% 20/09/202%
Development Rank Of Japan 2.3 Yi 19/03/2076 Dexia Muni Agency 1 .8% 09/05/2017 Dexia Municipal Agency 0.8% 21/05/2012 European Investment Rank 1.4 % 20/06/7017
European lnvcstmcnt Bank 1.9% 26/01/2026
France Telecom 1 .A?OO/o 10/05/2011
i .65L'Sb 01/11/2011
General Elcctric Capital C 0.55% 14/1 G/2008
General tlectric Capital C 1 % 2 1 /03/20 1 2 Hbos Treasury Services l'lc 0.55 46 01/07/7013 Household Finance Corporat 1.14% 24/09/ 2009 Japan Fin Corp Mc 1.55 % Rds 21/02/2012 J p y l O O
Japan Fin Corp Municipal C 1.35 % 26/11/20!3 (Regs)
Japan Fin Corp Small & Mod 1 .I % 20/09/2011 Kreditanst Fur Wic 0.75 46 22/03/2011 Landwirtschafliche Hentenb 1.375 % 25/04/2013 Morgan Stanley D W 2.090% 28/06/2010 Ocsterreichische Kontrollhank Ag 1 .8% 22/03/2010
Pfizer Inc 1.2% 22/02/2011
Procter & Gamble Co 2 % 21/06/2010 Rabobank Nederland 0.800% 03/02/2011 Toyota Motor Cred 0.55 % 30/'06/2010 Jnvl OOC
200.000.000
100,000,000
200,000,000
200,000,000
11 0,000,000
200,000.000
200,000,000 330.000.000
40,000,000
100,000,000
1G0.000.000
40.000.000
490,000,000
70,000.000
100,000.000
55,000,000
400.000,000
135,000,000
100,000,000
550,000,000
600,000,000
700,000,000
350,000,000
15,00O,OM3
100,000,000
165,000,000
150,000,000
250.000.000
1 oo.ooo,ooo
300.000.300
1,164,582
602,527
1,177,662
1,192,276
653,840
1.1 87,564
1.194.776
1,966,270
228.297
601.1 19
583.636
233,230
2,873,412
399,534
600,337
328.491
2,279,762
805,7 7 7
586,857
3,336,353
3,593.876
4.184.1 70
2,079,301
89,175
587.062
1,000,960
890.1 37
1508,532
587,343
1.772.795
0.10
0.05
0.1 1
0.1 1
0.06
0.1 1
0.1 1
0.18
0.02
0.05
0.05
0.02
0.26
0.04
0.05
0.03
0.20
0.07
0.05
0.30
0.32
0.37
0.19
0.01
0.05
0.09
0.08
0.13
0.05
0.1r
0 02 38,289,653 3.42
The accompanying notes form an integral part of these financial statements.
21 7
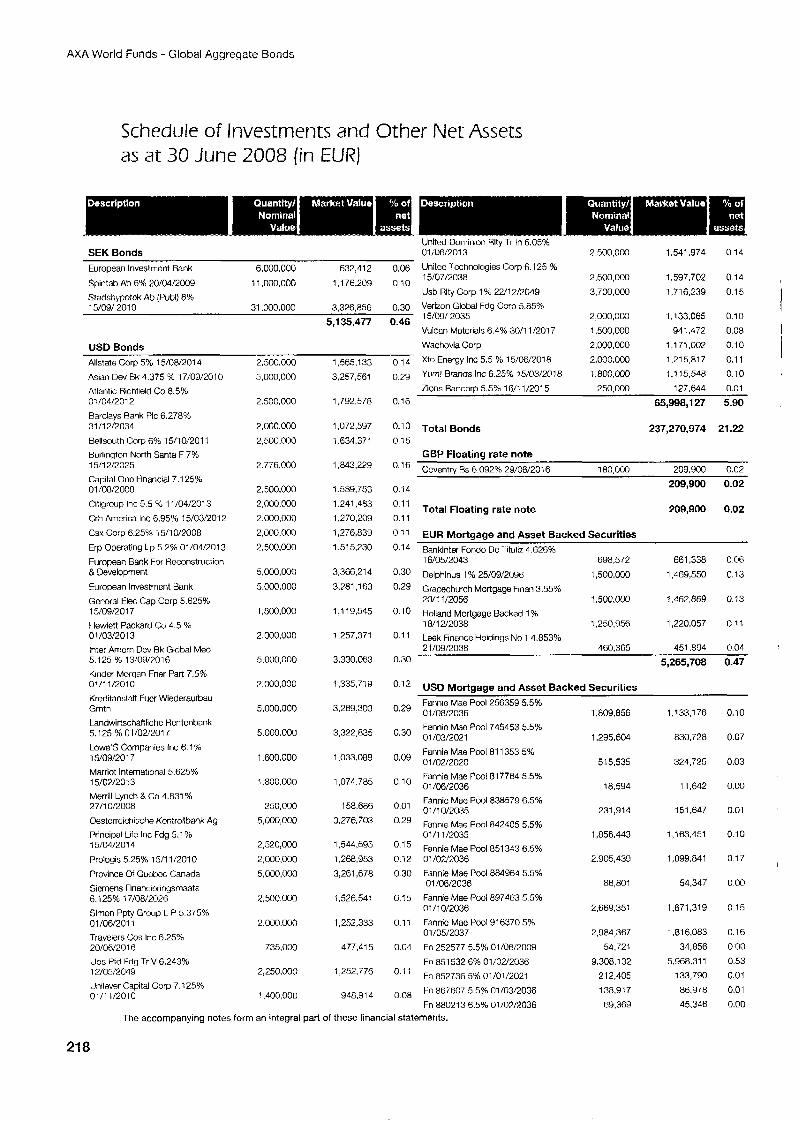
AXA World Funds - Global Aggregate Bonds
Schedule of Investments and Other Net Assets as at 30 June 2008 (in EURJ
United Dominion Rlty Tr In 6.05% SEK Bonds 01,'06/2013 2,500,000 1,541,974 0.14 European Investment Bank 6,000,000 632,412 0.06 United Tcchnologies Corp 6.1 25 % Spintab Ab 6% 20/04/2009 i 1,000,000 1,176,209 0.iO 15/07/2038 2,500,000 1.597.702 0.14
Usb Rlty Corp 1 96 22/12/2049 3,700,003 1,716,239 0.15 Stadshypotck Ab (Publ) 6% 15/09/ 201 0 31,000,000 3,326,856 0.30 Verizon Global Fdg Corp 5.85%
15/09/ 2035 2,000,000 1,133,065 0.10 Vulcan Materials 6.4% 3011 11201 7 1.500.000 941.472 0.08
USD Bonds Wachovia Corp 2.000.000 1,171,002 0.10
O,I< Xto Energy Inc 5.5 % 15/06/2016 2,000.000 1,215,817 0.11
1 1 5,135,477 0.46
Allstate Corp 5% 15/08/2014 Asian Dev 6k 4.375 % 17/09/2010 Atlantic Richfield Co 8.5% 01/04/2012 Barclays Rank PIC 6.278% 31/12/2034 Bellsouth Corp 6% 1511 0/2011 Burlington North Santa F 7% 15/12/2025 Capital Onc Financial 7.1 25% 01/08/2008 Citigroup Inc 6.5 96 11/04/2013 Crh America lhc 6.95% 15/03/2012 Csx Corp 6.25% i 5/1 0/7008
Erp Operating Lp 5.2% 01/04/2013 European Bank For Reconstruction & Development
European lnvestmcnt Bank
GQnCral Hec Cap Corp 5.625% 15/09/201 T Hewlett Packard Co 4.5 % 01/03/2013 Inter Amarn Deb Rk Global Med 5.125 % 13/09/2016 Kinder Morgan Ener Part 7.5% 01/11/2010 Kreditanstalt Fucr Wiederaufbdu Gmtn
Landwirtschaftlichc Hentenbank 5.125 %01/02/2017 Lowe'S Companies Inc 6.1 % 15/09/2017 Marriot lnterndtional 5.625% 15/0P/2013 Merrill Lynch & Co 4.831 % 27/10/2008 Oestcrrcichische Kwtroilbank Ag Principal Life Inc Fdg 5.1 96 15/04/2014 Prologis 5.25% 15/11/2010 Province of Quebec Canada Sicmens Financieringsmaats 6.125% 17/08/2026 Simon Ppty Group L P 5.375% 01/06/2011 Travelers Cos Inc 6.25% 20/06/2016 Ubs pfd Fdg Tr V 6.2439: 12/05/2049 Unilever Capital Corp 7.125% 01/11/2010
2.500.000 5.000.000
2.500.000
2,000,000 2.500.000
2.776.000
2.500.000 2,000,000 2.M)0.000 2,000,000 ?.500.000
5,000,000 5.000.000
1,8U0,000
2.M10.000
5.000.000
7,000,000
5,000,000
5.000.000
1,600,000
1.800.000
250.000 5,000,000
2,520,000 2,000.000 5,000,000
2.500.000
2,000.000
735,000
2,250,000
! .400,00(1
1,565,133 3,257,561
1,792.578
1,072,597 1.634371
1,843,229
1589,753 1,241.483 1,270,209 1,276,839 1,515230
3,366,214 3,261,163
1,119,545
1257,371
3,330,053
1,335,719
3,289.303
3,322,835
1,033,089
1,074.785
158.686 3,276,703
1,544,595 1,26R,953 3,261,678
1,526,541
1,252,333
477,415
1,252,776
948,914
o,zg Yum! Brands lnc 6.25% 15/03/2018 1,800,000 1,115,548 0.10
lions Bancorp 5.5% 16/11/2015 250,000 127,644 0.01 0.16 65,998,127 5.90
o.l Total Bonds 237,270,974 21.22 0.15
0'16 Ccventty Rs 6.092% 29/06/2016 180,000 209,900 0.02 209,900 0.02 0.14
Total Floating rate note 209,900 0.02
EUR Mortaaae and Asset Backed Securities
GBP Floating rate note
0.1 1 0.l
0.14 Bankinter Fondo De l'itiiy4.626% 16/05/2043 698,572 661,338 0.06
0,30 Delphinus 1% 25/09:2096 1,500.CQO 1,469,550 C.13 0.29 Gracechurch Mortgage Finm 3.55%
20/11/2056 1.5oo.ooo 1,462,869 0.13 U-lO Holland Mortgage Backed 1%
1811 2/2038 1,250,956 1,220,057 0.1 1 0.l Leak Finance Holdings No 1 4.853%
21/09/2038 460,365 451.894 0.04 5,265,708 0.47 0.30
0.12 USD Mortaaae and Asset Backed Securities
0.29
0.30
0.09
0.10
0.01 0.29
0.15 0.12 0.30
0.15
0.11
0.04
0.11
0.08
Fannie Mae Pool 256359 5.5% 01/08/2036 Fannio Mac Pool 745453 5.516 01 /03/2021 Fannie Mae Pool 81 1353 5% 01/02/2020 Fannia Mae Pool 817764 5.5% 01/06/2036 Fannic Mae Pool 838579 6.5% 0'/10/2035 Fannie Mae Pool 842405 5.5% 0:/11/2035 Fannie Mae Pool 851 343 6.5% 01/0;1/%036 Fannie Mae Pool 884964 5.5% 01/06/2036 Fannie Mae Pool 897463 5.5% 0111 0/2036 Fannic Mae Pool 916370 5% 01 /05/2037 Fn 252577 5.5% 01/06/2009 Fn 851532 6% 01/02/2036 Fn 852736 5% 01/01/2021 kn 867607 5.5% 01/03/2036 Fn 880213 6.5% 01/07/%036
1,809,856
1,295,604
515,535
18.594
231,914
1,856.443
2,905,439
86,801
2,669,351
2,964,367 54,721
9.308.1 32 212,405 138.91 7 69,369
1.1 33.1 76
830.728
324.725
11,642
151,647
1,163,451
1,899.841
54,347
1,671,319
1,816,083 34,856
5.968.31 1 133,790 86.978 45,346
0.10
0.07
0.03
0.00
0.01
0.10
0.1 7
0.00
0.15
0.16 0.00 0.53 0.01 0.01 0.00
1
The accompanying notes form an integral part of these financial statements.
21 8
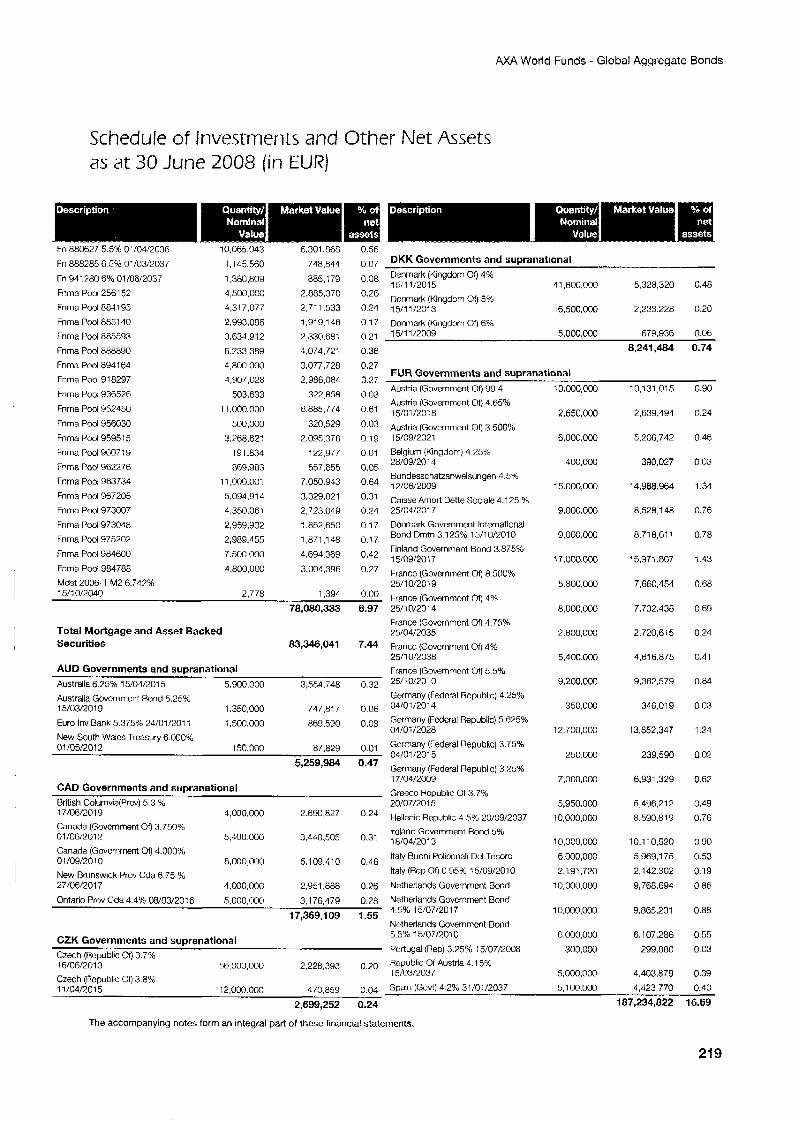
AXA World Funds - Global Aggregate Bonds
Schedule of Investments and Other Net Assets as at 30 June 2008 (in EUR)
Fn 888285 6 5% 0'/03/2037 Fn 941280 6% 01/06/2037 Fnma Pool 256152 Fnma Pool 884195 Fnma Fool 8851 40 Fnma Pool 885593 Fnrna Pool 888890
Fnma Pool 8941 64 Fnma Pool 918297 Fnrna Pool 936526 Fnrria Pool 952450
Fnrria Pool 956030 Fnma Pool 959515 Fnma Pool 9607: Y
Fnma Pool 962276 Fnma Pool 963734 Fnma Pool 967205 Fnma Fool 973007
Fnma Pool 973048 Fnma Pool 975202 rnma Pool 984600
Fnma Pool 984788 Mdst 2006.1 M2 6 742% 15/10/2040
1,145560
1,380,809 4.500,OOO 4.31 7,077 2,993.086 3,634,912 6233,389
4,800.000 4,907,028
503,633 11,000,000
500,000
3.966.62: 191334
869,983
11 ,00O.(Kll 5,094,914 4,350,061
2,959,902 2,989,455
7.500.000 4,800,000
2.778
748.844 885,179
2,885.370 2,711,533 1,919,146 2 330,681 1,074,721 3.077.728
2,986,084 322 8%
6,885.774 320.529
2,095,376
122.977 557.655
7.050.943 3,329,821 2,723,049 : ,852,650
1,871,148 4.694.369 3.004.396
1.194
0.56 o,07 DKK Governments and supranational o.08 Denmark (Kingdorn Of) 4 %
15'1 1/2015 41 .8W.O00 5,328,320 0.48 o'26 Dcnmark (Kingdom Of) 5% 0.94 15/11 /2013 16,500,000 2.233.228 0.20 0.1 7 Dcnmark (Kirrgdoni (3) 6% 0.21 15/11/2009 5.000.000 679.936 0.06 0.36 8,241,434 0.74
0.27 37 EUR Governments and supranational
0.03 0.61
0.03 0.19
0.01
0.05 0.64 0.31
0.24 0.17
0.17 0.42 0.27
Total Mortgage and Asset Backed Securities
AUD Governments and suoranational
78,080,333 6.97
83,346,041 7.44
Australia 6.75% 15/94/2015 5.900.000 3.554.748 0.32 Australia Government Bond 5.25% 15/03/2019 1.350,OOO 747.817 0.06
Euro Inv Bank 5.375% 24/01/201 i i ,500,000 869,5(10 0.08 New South Wales Treasury 6.000% 01 /05/2012 150,000 87.829 0.01
5,259,984 0.47
Austria (Government uf) 99 4 Austria (Government Of) 4.65% 15/01 /20! 8 Austria (Government Of) 3 50096 15/09/2021 Belgium (Kingdom) 4 25% 28/09/2014 Bundesschatzanweisungen 4.5% 12/06/2009 Caisse Amort Dette Sociale 4.125 % 25/04/2017 Dcrrnwk Government International Bond Drritn 3 125% 15/10/2010 Finland Government Bond 3.875% 15/0912017 Frmcc (Govarnrnent or) 8.500% 25/10/2019
France (Governmcnt Or) 4% .?5/10/2014 France (Govcrnmcnt Of) 4 75% 75/04/2035 France (Govcrnmmt (3) 4% 95/10/2038 France (Government Or) 5.5% 25/7 0/2010 Germany (Fcdcral Rcpublic) 4 25% 04/01 E014 Germany (Fcdcral Republic) 5.625% 04/01/2028 Germany (Federal Republic) 3.75% 04/01 001 5 Germany (Federal Repuhlic) 3.25% 17/04/2009 Greecc Hcpublic Of 3.7%
Brttish Colurnvia(Prcv) 5.3 % 20/07/2015 17/06/2019 4,WO,OOO Canada (Govcrnrnent Or) 3.750%
01/06/2017 5.400,OOO 3.440.505 18/04/2013 5,109,410 0.4fi Italy Buoni Policnnali Del Tesoro Canada (Govcrnment Of) 4.000%
01 /09/.?010 8,000,000 Italy (Rep Of) 0.954: 15/09/2010 New Rrunswick Prov Cda 6.75 %
27/06/2017 4,000.00C 2,951,888 0.26 Netherlands Governmcnt Bond
Ontario Prov Cda 4.4% 08/03/2016 5,000,000 3,176,479 0.28 Netherlands Government Bond
Netherlands Governmcnt Bond
Portugal (Rep) 3.75% 15/07/2008
CAD Governments and supranational
2'690,827 0.24 Hellenic Republic 4.5% 20/09/2037 o,31 lroland Government Rond 5%
,7,369,109 ,.55 4.5% 15/07/2017
5.596 15/07/2010 CZK Governments and supranational Czech (Republic uf) 3.7% 16/06/2013 56.000.000 2,228,393 o.70 Hcpublic Of Austria 4.1 5%
+ I n n In"n7
10.000,000
2,650,000
6,000.000
400,000
15.000,OoO
9.ooo.oM)
9,000,000
1 7,ooo.oco
5.800,000
8,000,000
2,800,000
5.400.000
9.100,000
350,000
12,700,000
250.000
7.000.000
5,950,000 10,000,000
10,000,000 6,000,000 2,191,720
10,000,000
10,000,000
6,000,000 300.000
5,000,000
10,131,015
2,633,494
5,206,742
390,027
14,988,964
8,528,148
8,718.61 1
15,371,807
7,660,454
7,732.438
2,720,615
4,616,875
9.382579
346,019
13,852,347
239 590
6,931,329
5,496.21 2 8.590.81 9
10.1 10,520 5,969,l 75 2,142.302
9,768,694
9.865.231
6.107.286
299,880
4,403,879
0.90
0.24
0.46
0.03
1.34
0.76
0.78
1.43
0.68
0.69
0.24
0.41
0.84
0.03
1.24
0.02
0.62
0.49 0.76
0.90 0.53 0.19 0.86
0.88
0.55 0.03
0.39 I 3 l l l i l l C U i l I Czech (Hcpublic or) 3.8% 11/04/2015 12,000.000 470,859 0.04 Spain (Govt) 4.2% 31/01/2037 5.1 00,000 4,423 770 0.40
2,699,252 0.24 187,234,822 16.69
The accompanying notes form an integral part of these financial statements.
21 9
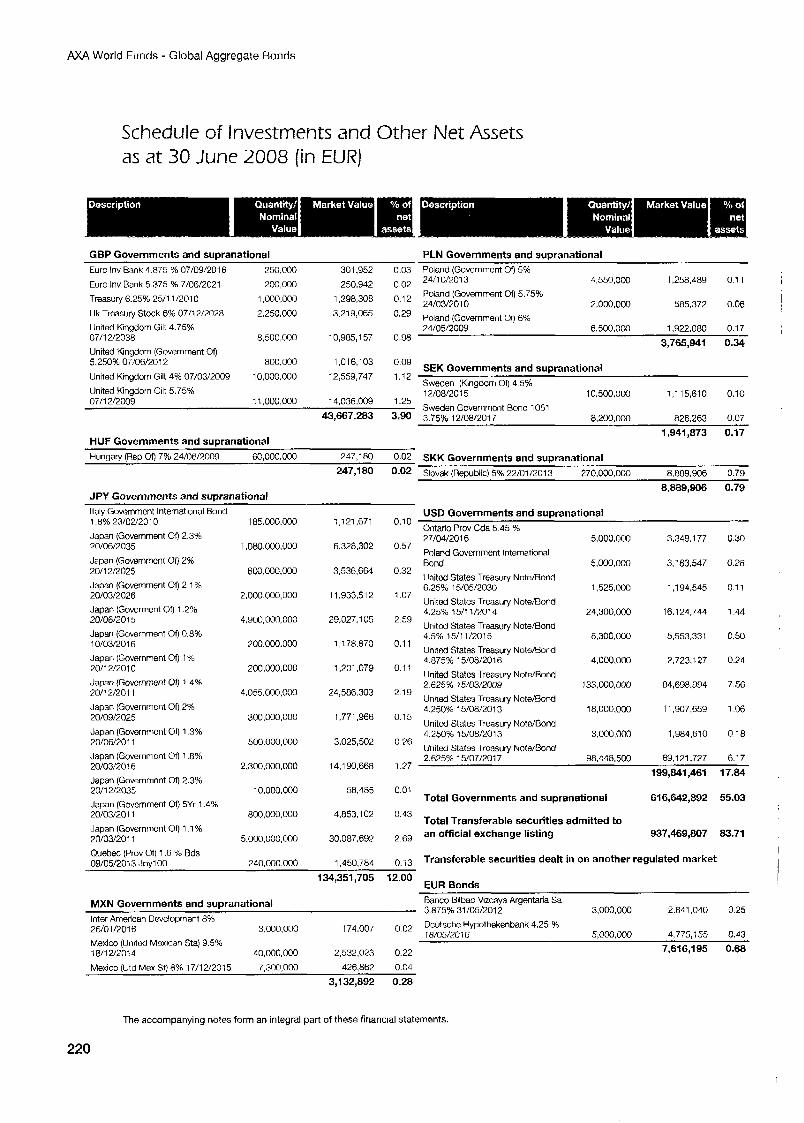
AXA World Funds - Global Aggregate Bonds
Schedule of Investments and Other Net Assets as a t 30 June 2008 (in EUR)
GBP Governments and supranational Euro lrlv Bank 4.875 % 07/09/2016 25G.000 301.952 0.03 Poland (Government or) 5%
Euro Inv Bank 5.375 % 7/06/2021 200,000 250.942 0.02 24/10/'013
PLN Governments and supranational
4.550.000 1,258,489 0.1 1
24/03/2010 2.000.0M) 585.372 0.06 Uk Treasury Stock 6% 07/i2/2028
United Kingdom Gilt 4.75% 24/05/2009 6.500,OW 1.922.080 0.1 7 07/12/2038 8.500.000 10,985,157 0.98 ^-^--*l ^ L .
,298,308 o,12 Poland (Government or) 5.75% Treasury 6.25% 25/11/2010 1,000,000
3.219'065 0'29 Poland (Government or) 6% 2,250,000
J,lbS,Y41 U.34 United Kingdom (Government Of) 5 250% 07/06/2012 800,000 1,016,103 0.09
I f ) 4 5% 10,500,000 1,115.610 0.10
..
Hungary (Rep or) 7% 24/06/2009 GG,ooo.ooo 247,180 0.02
247,180 0.02 SKK Governments and supranational Slovak (ReDublic) 5% 22/01/2013 770.000.000 8.889.906 G.79
JPY Governments and supranational Italy Governrncnt International Bond 1.8% 23/02/2010
Japan (Government 00 2.3% 20/06/2035
Japan (Governmcnt On 2% 20/12/2025 Japan (Government Of) 2.1 % 20/03/2026 Japan (Goverment Of) 1.2% 20/06/2015 Japan (Government Of) 0.8% 10/03/2016 Japan (Government or) 1 % 20/12/2010
Japan (Government Of) 1 4 % 20/12/2011
Japan (Governmant Of) 2% 20/09/2025
Japan (Governmcnt Of) 1.3% 20/06/2011 Japan (Government 00 1.8% 20/03/?016 Japan (Governmont Of) 2.3% 20/12/2035 Jzpan (Govcmment Of) 5Yr 1.4% 20/03/2011
Japan (Government Of) 1.1 % 20/03/2011 Quebec (Prov or) 1.6 YG Bds 09/05/2013 JDvIOO
185,000,000
1.080.000,000
600,000,000
2.000.000,000
4.900.000,OOO
700,000,000
200,000,000
4.055.000.000
300,000,000
500.000.000
2,3CO,OOO,OOO
10,000,000
800,M)0,000
5,000.000.000
240.CO0.000
1.1 21,671
6,328,302
3,536,664
11.933.51 2
29,027,105
1.1 78.870
1,201,079
24,586,303
1,771,966
3,025,502
14,190,668
58.485
4,053,102
30.087.692
1,450,784
0.10
0.57
0.32
1.07
2.59
0.1 1
0.11
2.19
0.15
0.76
1.27
0.01
0.43
2.69
0.13 , .
134,351,705 12.00
MXN Governments and supranational Inter American Dwclopment 8% 2W01/2016 3.M10.000 174,007 0.02
Mexico (Unitod Mexican Sta) 9.5% 1811 21201 4 40,000,000 2,532,023 0.22
8,889,906 0.79
USD Governments and suwanational Ontario Prov Cda 5.45 % 27/04/2016 3.349.1 77 0.30 5.000.000 Poland Govcrnment International
Unitod States Treasury NoteBonU 6.25% 15/05/2030 1.525.000 1 ,I 94,545 0.1 1 Unitod States Treasury NoteIBorrd 4.25% 15/11/%014 24.300.000 16.124.744 1.44
United States Treasury NoteBond 5.553.331 0.50 4.5% 15/11/2015
Bond 5,000.000 3,183,547 0.28
8.300.000 United States Treasury Nota/Bond 4.875% 15/08/2016 4,000,000 2,723,127 0.24
United States Treasury Note/Bond 2.625% 15/03/2099 133,000,000 84,698.994 7.56 United States Treasury Note/Bond 4.250% 15/08/2013 18,000,000 11,907,659 1.06
United States Treasury Notc/Eond 4.250% 15/08/2013 3.000,000 1,984,610 0.18 United States Trcasury Note/Bond 2.625% 15/07/2017 98.44a.500 69,l 21,727 6.1 7
199,841,461 17.84 ,
Total Governments and supranational 616,642,892 55.03
Total Transferable securities admitted to an official exchange listing 937,4m,a07 03.71
I
I Transferable securities dealt in on another regulated market
EUR Bonds Banco Bilbao Vlzcaya Argentaria Sa 3.875% 31 /05/2012 3.000.000 2.841.04U 0.25
Deutsche Hypothekenbank 4.25 % 1 a/05/20 1 6- ' 5,000,000 4,775,155 0.43
7,616,195 0.68
Mexico (Utd Mex St) 8% 17/12/2015 7,300,000 426,862 0.04
3,132,892 0.28
The accompanying notes form an integral part of these financial statements.
220
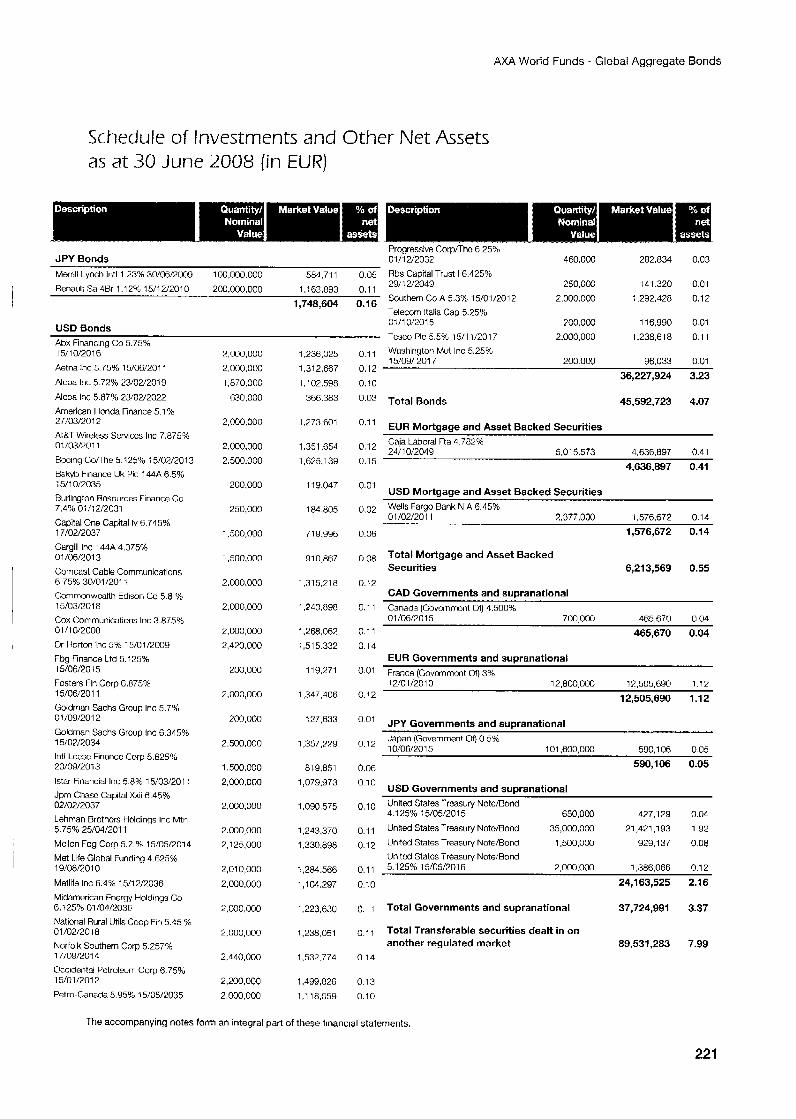
AXA World Funds - Global Aggregate Bonds
Schedule of Investments and Other Net Assets as at 30 June 2008 {in EUR)
Progressive Corpflhc 6.25% JPY Bonds 01/12/2032 460.000 282,834 0.03 Mefrill Lynch Intl 1.23% 30/06/2003 1 03,0M).OOO 581,711 0.05 Rbs Capital Trust I 6.425%
250,000 141.320 0.01 Renault SaSBr 1.12% 15/12/2010 200,000,000 1.163.893
,,748,604 o.16 Southem CoA5.3% 15/01/2012 2.000.003 i ,292,428 0.1 2 Telecom ltalia Cap 5.75% 01/10/2015 700.003 116,990 0.01
TCSCO PIC 5.5% 15/11/2017 2.000,000 1.238,618 0.1 1
o, 29/i 2/2049
USD Bonds Abx Financing Co 5.75% 15/10/2016 Aetna Inc 5.75% 15/06/2011
Alcoa Inc 5.72% 23/02/2019
Alcoa Inc 5.87% 23/02/2022 American Hmda Finance 5.1 Yo 27/03/2012
AtRT Wireless Scrviccs Inc 7.675% 01/03/2011
Bocing CoTThe 5.125% i5/0%/2013 Bskyb Finance Uk PIC 144A 6.54: 1511 0/2035 Rurlington Rasources Finance Co 7.4% Oi/l2/2031 Capital One Capital Iv 8.745% 17/02/2037 Cargill Inc 144A 4.375% 01/06P013
Corncast Cable Communications 6.75% 30/01/2011 Cornmcnwcalth Edison Co 5.8 %
Cox Coinmunications Inc 3.875% 01 11 012008 Or Horton Inc 5% 15/01/2009
Fbg Finance Ctd 5.125% 15/06/2015
Fosters Fin Corp 6.875% 15/06/20 1 1 Goldman Sachs Group Inc 5.7% 01/c9/2012
Goldrnan Sachs Gfcup Inc 6.345% 15/07/Z?034 lntl Lease Financc Corp 5.625% 20/09/2013
lstar Financial Inc 5.8% 15/03/2011 Jprn Chase Capital Xxii 6.45% 02/02/2037 Lehrnan Brothers Holdings Inc Mtn 5.75% 25/04/2011
Mcllon Fdg Corp 5.2 4: 15/05/2014 Met I.ife Global Funding 4.625% 19!08/?010
Metlife Inc 6.4% 15/12/2036 Midarnoncan Energy Holdings Co 6.125% 01 /04/203E National Rural lltils Coop Fin 5.45 % 01/02/2018 Nortclk Southern Ccrp 5.257% 17/09/2014 Occidental Petroleum Corp 6.758 15/01 1201 2
Petro-Canada 5,’35% i 5/05/2035
i5/03/201 a
~.030.000
2.000,000 1,870,000
630,000
2,000,000
2,000.00G 2.500.000
200.000
250,000
1.500,000
1,500,000
2.M)0.000
2,000,000
2,000,000
2.470.000
200,000
2,000,000
200.000
2,500,000
1,500,000
2,000,000
2.000.00c
2.000,ooo
7,125,000
2,010,000
2,000.000
2.000.000
2,000.000
2,440,000
2.200,000 2,000,000
1,236,025
1.312.667
i.io2.59a
366.383
1,273,601
1,351,654
1,675.1 39
119.047
184.805
719,996
910,867
1,315218
1,240,898
1,268,067 1,515.332
119.271
1,347,406
127,633
1,357,779
819,851 1,079.973
1,090,575
1,243,370
1,330,898
1.284.566
1 , l M.297
1,223,630
1,238,051
1.532.774
1,499,826
1.1 18.059
o.l Washington Mut Inc 5.25% 200.000 96,033 0.01
0.12 36,227,924 3.23
0.!0
0.03 Total Bonds 45,592,723 4.07
15!09/ 201 7
EUR Mortaaae and Asset Backed Securities o,12 Caja Laboral Tta 4.782%
0.15
0.01
0,02
24:10/2049 5.015.573 4.636397 0.41
4,636,897 0.41
USD Mortgage and Asset Backed Securities Wells Fargo Bank N A 6.45% 01/02/2011 Y377.000 1 576.677 0.14
0.06 1,576,672 0.14
Total Mortgage and Asset Backed Securities 6,213,569 0.55
CAD Governments and supranational Canada (Govcrnmcnt Of) 4.500%
0.!2
0.1 1
0.1 1 465,670 0.04 01/06/2015 700,000 465.670 0.04
0.14 EUR Governments and supranational
. ..
12,800,000 12.505.690 1.12 0.12 12,505,690 1.12
0-01 JPY Governments and supranational o,l Japan (Government ot) 0.5%
10/06/%015 101.600.000 590.106 0.05
0.06 590,106 0.05
0.10 USD Governments and Supranational
o, United States Tfeasury Notc/Bond 4.1 25% 15/05/2015 650.000 427,129 0.04
0.1 1 United States Treasury Notc/Bond 35,000,003 21,421,193 1.9% 0.12 Unlted States Treasury Note/Bond 1,500,003 929,137 0.08
Unitwl Stntas Treasurv Note/Bond , . . 0.1 1 5.125% 15/05/2016 2,000,000 1,386,066 0.1 2
0.10 24,163,525 2.16
0.1 1 Total Governments and supranational 37,724,991 3.37
0.11 Total Transferable securities dealt in on another regulated market 89,531,283 7.99
0.14
0.13
0.10
The accompanying notes form an integral part of these financial statements.
221
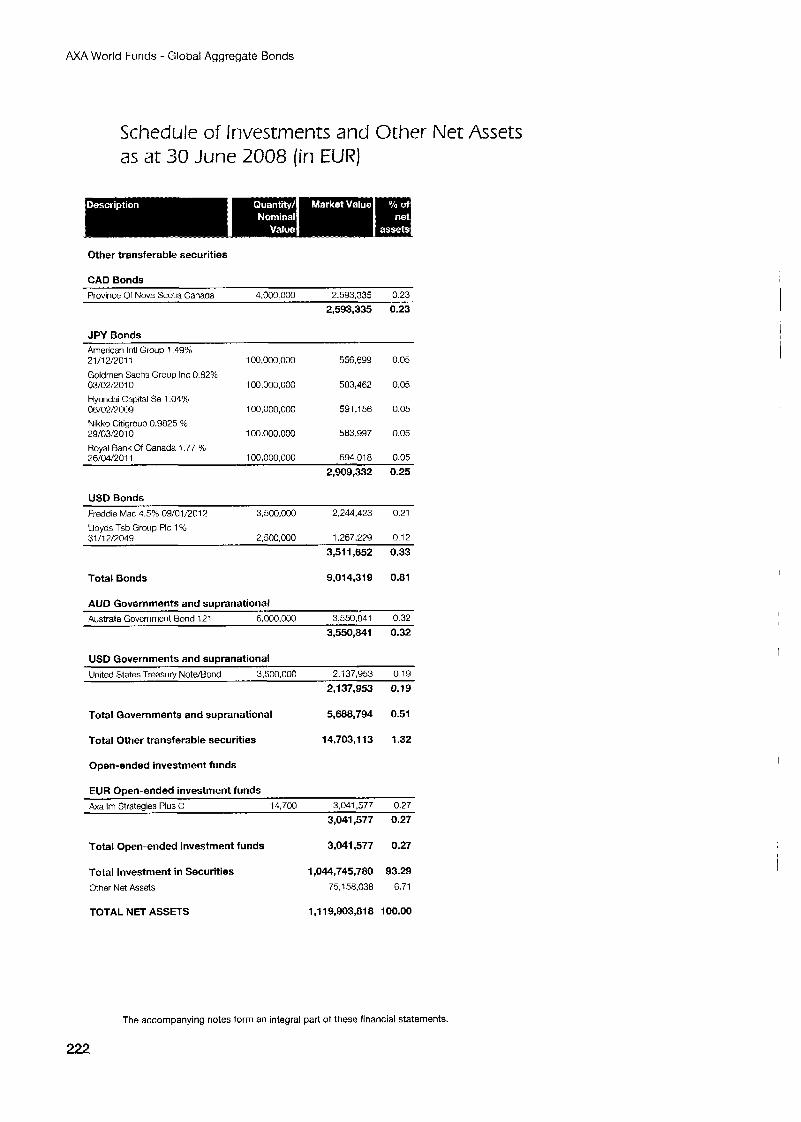
M A World Funds - Global Aggregate Bonds
Schedule of Investments and Other Net Assets as at 30 June 2008 (in EUR)
Other transferable securities
CAD Bonds Province of Nova Scotia Canada 4,000.000 2,593,335 0.23
2,593,335 0.23
JPY Bonds American lntl Group 1.49% 21/12/2011 100,000,000 556,699 0.05
Goldrnan Sachs Group Inc 0.8296 03/02/2010 1 cQ.000.000 583,462 0.05
Hyundai Capital Se 1.04% 06/02/7009 100,000,000 591,156 0.05
Nikko Citigroup 0.8825 % 29/C3/2010 1 cQ.ooo.oMs 583,997 0.05
Royal Rank of Canada 1.77 5% 26/04/2011 1 00.000.000 594.018 0.05
2,909,332 0.25
USD Bonds Freddie Mac 4.5% 09/01/201? 3,500,000 2.244,423 0.21
Lloyds Tsb Group PIC 1% 31/12/2049 2,500,000 1,267,219 0.12
3,511,652 0.33
Total Bonds 9,014,319 0.81
AUD Governments and supranational Australia Government Bond 121 6.000.000 3,550,841 0.32
3,550,841 0.32
USD Governments and suoranational United States Troasury NotdBond 3.500.000 2,137,953 0.19
2,137,953 0.19
Total Governments and supranational 5,ma,794 0.51
Total Other transferable securities 14,703,113 1.32
Open-ended investment funds
EUR Open-ended investment funds h a Im Strategies Plus C 11,700 3,041,577 0.27
3,041,577 0.27
Total Open-ended investment funds 3,041,577 0.27
Total Investment in Securities Gther Net Assets
I ,0~,745,7ao 93.29 75.158.038 6.71
TOTAL NET ASSETS 1,119,903,818 100.M3
I
The accompanying notes form an integral part of these financial statements
222
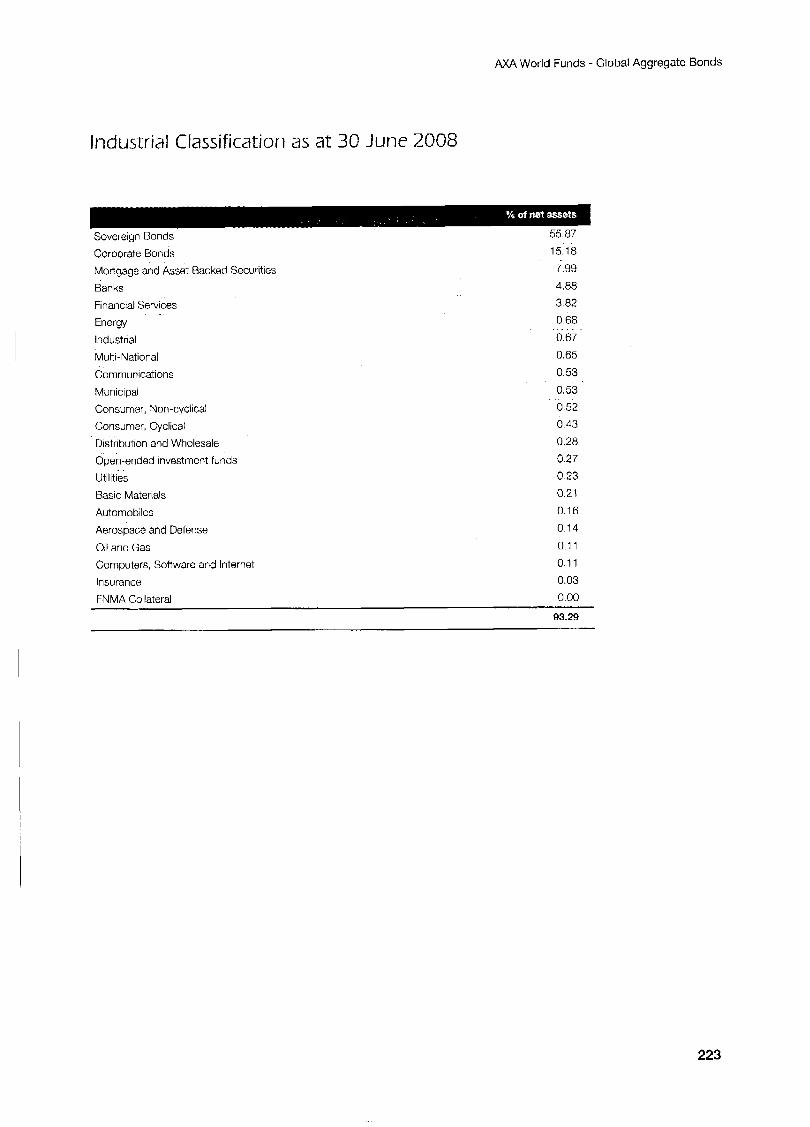
AXA World Funds - Global Aggregate Bonds
Industrial Classification as at 30 June 2008
Sovereign Bonds
Corporate Bonds Mortgagi and Asset Backed Securities
Banks Financial Services
Energy
Industrial
Multi-National
Communications
Municipal
Consumer, Non-cyclical
Consumer, Cycllcal
Distribution and Wholesale
Open-ended investment funds
Utilities
Basic Materials
Automobiles
Aerospace and Defense
Oil and Gas
55.87 15.18 7 99 4.88
3 82
0 68 0.67 0.65
0.53 0.53
0.52
0 43 0 28
0 27
0 23 0.21
0.16
0 14
0.1 1 Computers, Software and Internet 0.1 1 Insurance 0.03
FNMA Collateral 0.00
93.29
223
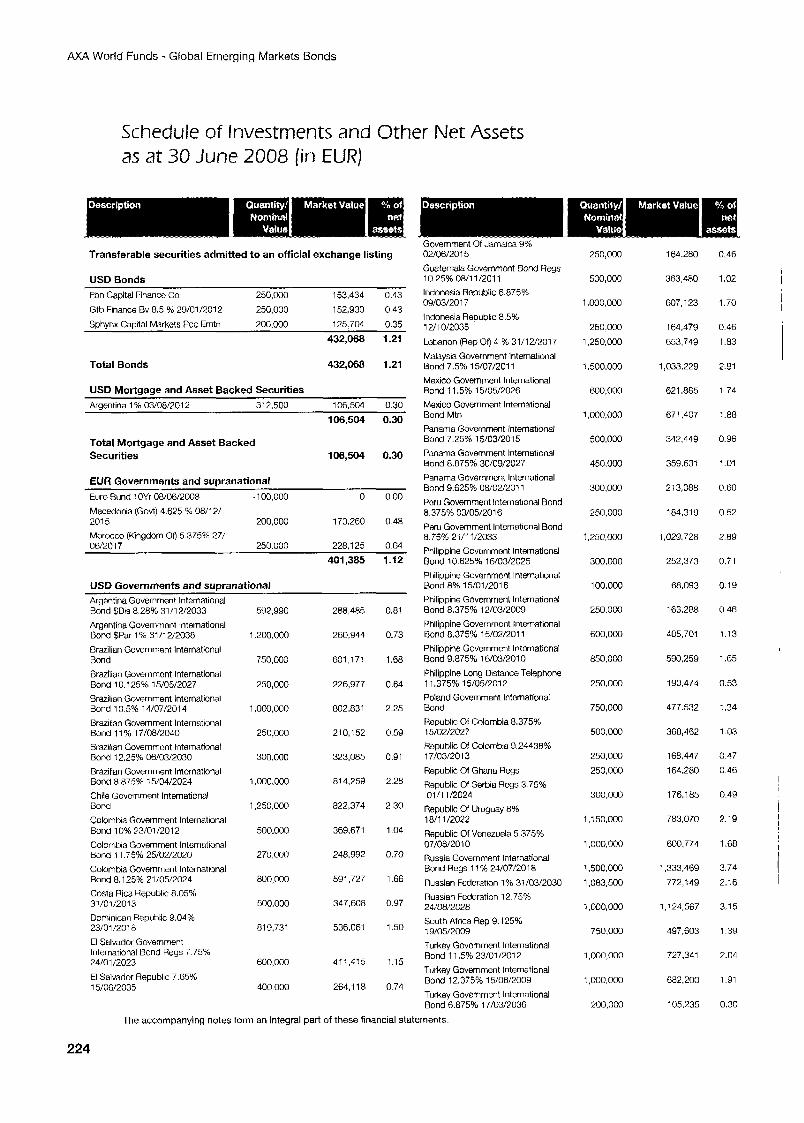
AXA World Funds - Global Emerging Markets Bonds
Schedule of Investments and Other Net Assets as at 30 June 2008 (in EURJ
Transferable securities admitted to an official exchange listing
US0 Bonds Fbn Capital Finance Co 250,000 153,434 0.43 Gth Finance Bv 8.5 5.6 29/01/2012 250,000 152,930 0.43
Sphynx Capital Markets PCC Emtn 200.000 125,704 0.35
432,068 1.21
Total Bonds 432,068 1.21
USD Mortgage and Asset Backed Securities Argentina 1 % 03/08/7012 312.500 106,504 0.30
106,504 0.30
Total Mortgage and Asset Backed Securities 106,504 0.30
EUR Governments and supranational Euro Bund i OYr 08/06/2008 - 100,000 0 0.00 Macedonia (Govtj 4.625 % 08/12/ 201 5 200.000 173,260 0.48 Morocco (Kingdom 00 5.375% 27/ 06/2017 250.000 228.125 0.64
401,385 1.12
USD Governments and suoranational ~~~
Argentina Government International Rond $Dis 8.28% 3111 912033 Argentina Governmcnt International Bond $Par 1 % 31 /I 2/2038 Brazilian Government International Bond Brazilian Governmcnt International Bond 10.125% 15/05/2027 Brazilian Government international Bond 10.5% 14/07/2014 Brazilian Government International Bond 11 % 17/08/2040 Brazilian Government International Bond 12.25% 06/03/2030 Brazilian Government International Bond 8.875% 15/04/2024 Chile Govornment International Bond
Colombia Government International Bond 10% 73/01/2012 Colombia Government intornational Bond 11.75% 25/02/2020 Colombia Government lntcrnational Bond 8.125% 21/05/2024 Costa Rica Republic 8.05% 31 /01:2013 Dominican Republic 9.04% 23/01/2018 El Salvador Government International Bond Regs 7.75% 24/01 /2023 El Salvador Republic 7.65% 15/06/2035
592.990
1.200.0c0
750,000
250,000
1,000,000
250,000
300,000
1 .ooo.ooo
1,250,000
500.000
270,OM)
800,000
600,000
81 9,131
600,000
400.000
280.485
260,944
601,171
226,977
802.831
21 0,152
323.085
814.259
822,374
369,671
248.992
591,727
347.608
536,061
411.415
264,l 1 8
0.81
0.73
1.68
0.64
2.25
0.59
0.91
2.28
2.30
1.04
0.70
1.66
0.97
1.50
1.15
0.74
Government Of Jamaica 9% 02/06/2015 Guatemala Governmcnt Bond Regs 10.25% 08/11/2011 Indonesia Republic 6.875% 09/03/2017 Indonesia Republic 8.5% 12/10/2035 Lebanon (RepOf) 4 % 31/12/2017 Malaysia Government International Bond 7.5% 15/07/2011 Mexico Government International Bond 1 1.5% 15/05/2026 Mexico Government International Bond Mtn Panama Government International Bond 7.25% 15/03/2015 Panama Government international Bond 8.875% 30/09/2027 Panama Governmcnt International Bond 9.625% 08/02/2011 Peru Government International Bond 8.375% 03/05/2016 Peru Government lntcrnational Bond 8.75% 21/11/2033 Philippine Govornment International Bond 10.625% 16/03/2025 Philippine Governmcnt International Bond 8% 15/01/2016 Philippine Government International Bond 8.375% 12/03/2009 Philippine Government lntemetional Bond 8.375% 15/02/2011 Philippine Government International Bond 9.875% 16/03/2010 Philippine Long Distance Telephone 1 1.375% 15/05/2012 Poland Government Intornationat Bond Ropublic Of Colombia 8.375% 15/02/2027 Republic of Colombia 9.24438% 17/03/2013 Republic Of Ghana Regs Repuhlic of Serbia Regs 3.75% 01/11/2024 Republic of Uruguay 8% 16/11 /2022 Republic Of Venezuela 5.375% 07/08/2010 Russia Government International Bond Regs 1 1 % 24/07/2018 Russian Fcdcration 196 31/03/2030 Russian Federation 12.75% 24/06/2028 South Africa Rep 9.1 25% 19/05/2009 Turkey Govcmment international Bond 11 2% 23/01 1201 2 Turkey Govemmcnt International Bond 12.375% 15/06/2009 Turkey Govcrnment International Bond 6.875% 17/03/7036
250,003
500.000
1,000,000
25O:OM)
1,250,000
1.500.000
600.000
1 .000.000
500,000
450.000
300,000
250,000
1,250,000
300.000
100.000
250.0M1
600,OM)
850,000
250,oM)
750,003
500.000
250,003 250,000
300,OMs
1,150,000
1,000,000
1,500,000 1,083,500
1,000,000
750,000
1,000,000
1 ,M30,000
200,000
164.280
363,480
607,123
164.479
653,749
1,038.229
621.885
67 1,407
342,449
359.631
213,088
184.31Y
1,029.728
252,373
68.093
163.2m
405,701
590,259
190,474
477.532
368,462
168.447
164,280
176.185
783,070
600,714
1.333.469 772,149
1,124.567
497,603
727,341
682,200
105.235
0.46
I 1.02 I
I I 1.70
0.46
1.83
2.91
1.74
1.88
0.96
1.01
0.60
0.52
2.8Y
0.71
0.19
0.46
1.13
1.65
0.53
1.34
1.03
0.47
0.49
2.19
1.68
3.74 2.i6
3.15
1.39
2.04
1.91
0.30
The accompanying notes form an integral part of these financial statements
224
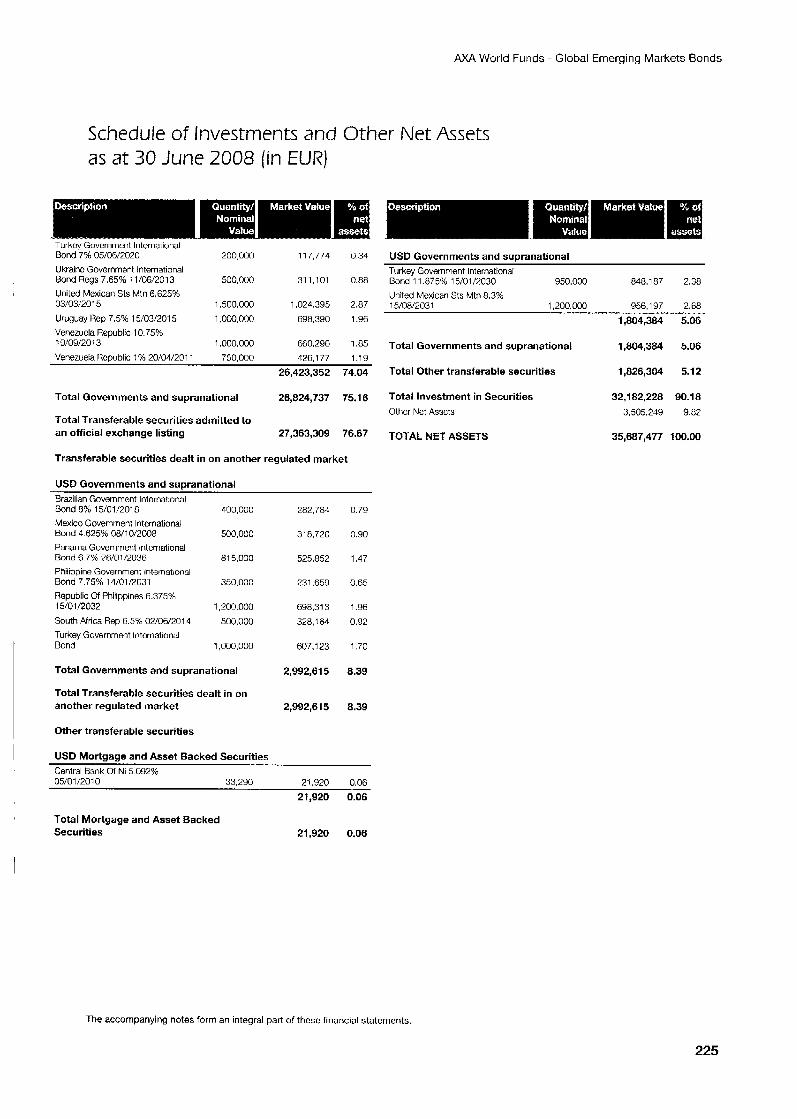
A M World Funds - Global Emerging Markets Bonds
Schedule of Investments and Other Net Assets as at 30 June 2008 (in EUR)
Turkoy Government International Bond 7% 05/06/2020 200,000 117.774 0 3 4 Ukrainc Govcrnrnent International Bond Rcgs 7.65% -8 1/06/2013 500,000 311,101 088 United Mexican Sts Mtn 6.625% 03/03:2015 1.500.000 1.024.395 2.87
Uruguay Rep 7.5% 15/03/2015 1,000,000 698.390 1.96
19/09/2013 1 .ooo.ooo 660.296 1.85
Venezuela Hcaublic 1% 20/04/2011 750.000 426.177 1.19
I
Venezucla Republic 10 75%
26,423,352 74.04
Total Governments and supranational 26,824,737 75.1 6
Total Transferable securities admitted to an official exchange listing 27,363,309 76.67
Transferable securities dealt in on another regulated market
USD Governments and supranational Brazilian Government International Bond 8% 15/01/2018 400.000 Mexico Government International Bond 4.625% 08/10/2008 500.000
Panama Government lntcrnational Bond 6.7% 26/01/2036 81 5,000 Philippine Government lntematlonal Bond 7.75% 14/01/;1031 350,000 Republic of Philippines 6.375% 15/01/2032 1,200,000 South Africa Rep 6.54: 02/06/2014 500,000 Turkey Government International Bond 1,000,000
Total Governments and supranational
Total Transferable securities dealt in on another regulated market
282.784
318.720
525.852
731.659
698.31 3
328.164
607.123
2,992,615
2,992,615
0.79
0.90
1.47
0.65
1.96
0.92
1.70
8.39
8.39
Other transferable securities
I USD Mortgage and Asset Backed Securities Central Bank Of Ni 5.092% I 05/01/2010 33,290 21,920 0.06
21,920 0.06
Total Mortgage and Asset Backed Securities 21,920 0.06
USD Governments and supranational Turkey Government International Bond 11.875% 15/01 PC30 950,000 848.187 2.38 United Mexican Sts Mtn 8.39: 15/08/2031 1,200.000 956,197 2.68
1,804,384 5.06
Total Governments and supranational 1,804,384 5.06
Total Other transferable securities 1,826,304 5.12
Total Investment in Securities 32,182,228 90.18 Othcr Nct Assets 3.505.249 9.82
TOTAL NET ASSETS 35,687,477 100.00
The accompanying notes form an integral pari of these financial statements.
225
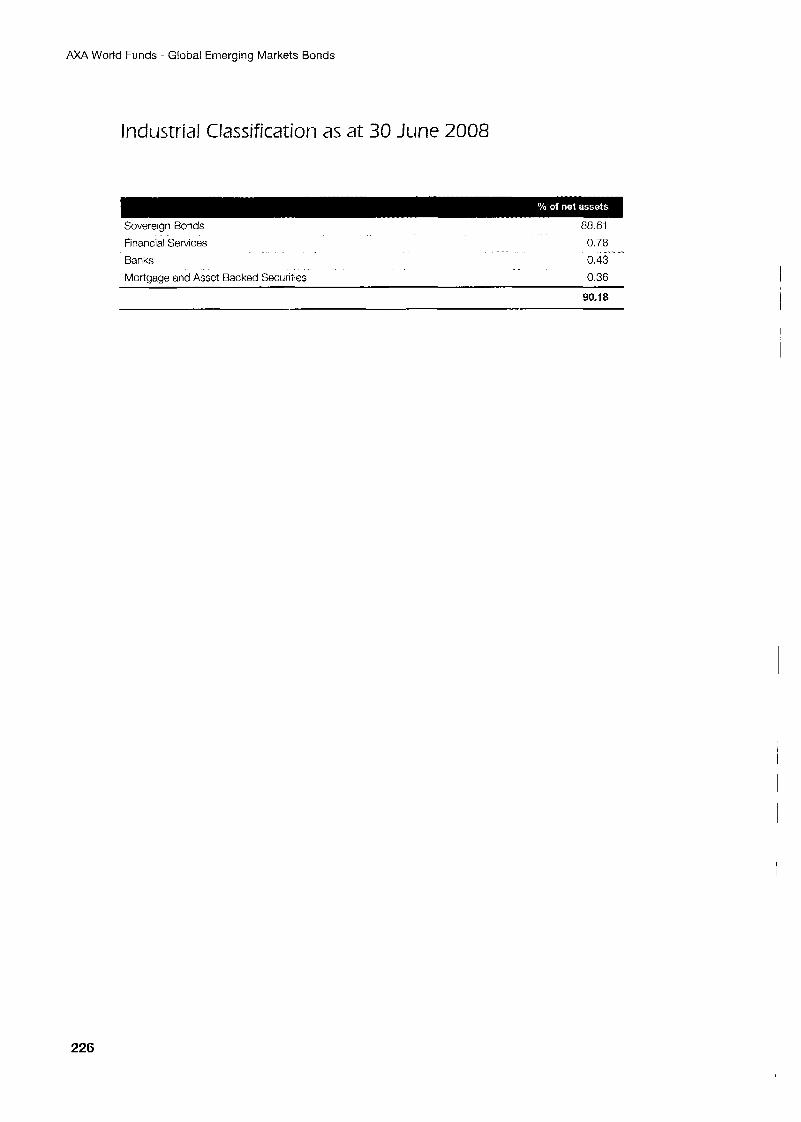
AXA World Funds - Global Emerging Markets Bonds
Industrial Classification as at 30 June 2008
Sovereign Bands
Financial Services
Banks Mortgaqe and Asset Backed Securities
88.61
0.78
0.43
0.36
~-
226
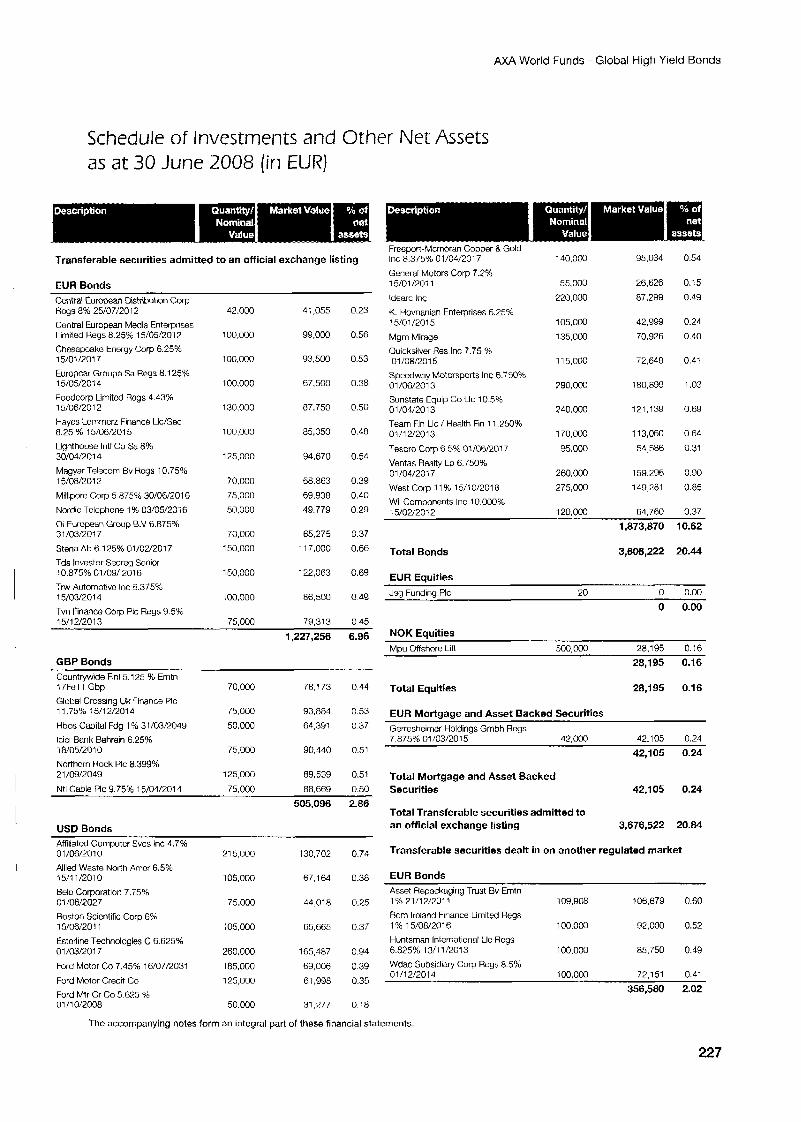
AXA World Funds - Global High Yield Bonds
Schedule of Investments and Orher Ner Assets as at 30 June 2008 (in EUR)
Transferable securities admitted to an official exchange listing
EUA Bonds Central European Oistributim Corp Rcgs 8% 25/07/2012 42.000 4; ,055
Central European Media Enterprises Limited Regs 8.25% 15/05/2012 Chcsapcaka Energy Corp 6.25% 15/01/2017 Europcar Group Sa Regs 8.125% 15/05/2014 Foodcorp Limited Rngs 4.43% 15/06/2012 Hayes LemmcrL Finance Llc/Sec 8.25 % 15/06/2015
Lighthouse lntl Co Sa 8% 30/04/2014
Magyar Telecorn Bv Rcgs 10.75% 15/08/2012
Millipore Corp 5.875% 30/06/2016
Nordic Tclcphone 1 96 03/05/2016 01 European Group B.V 6.875% 31/03/2017
Stena Ah 6.175% 01/02/2017 Tds Investor Secreg Senior 70.875% 01/09/ 2016 Trw Automotivc Inc 5.37576 15/03/2014 Tvn Financo C o p PIC Regs 9.5% 15/12/2013
100,000
10c.000
100,000
130,000
100,000
12',000
70,000 75,000
50,000
70,000 150.000
150,000
100,000
75.000
99,000
93,500
67,500
87.750
85,050
94,670
68.863
69.938 19.779
65,275
11 7,000
122.063
86,500
79.31 3
0.23
0.56
0.53
0.38
0.50
0.48
0 54
0.39
0.40
0 29
0 37
0.66
0.69
0 A 9
0 45
1,227,256 6.96
GBP Bonds Countrywide Fin1 5.125 % Erntn 17Fe11 Gbp 70,000 78.173 0.44 Global Crossing Uk =inance PIC 11.75% 15/12/2014 75,000 93.884 0.53
Hbos Capital Fdg 1 Y, 31 /03/2049 50,000 64,391 0.37 lcici Bank Bahrain 6.25% 18/05/2010 75,000 90,440 0.51 Northcrn Rock PIC 8.399% 21 /09/2049 125,000 89.539 0.51
Ntl Cable PIC 9.75% 15/04/2014 75,000 88,669 0.50
505,096 2.86
USD Bonds Affiliated Computcr Svcs Inc 4.7% 01/06/20!(1 21 5,000 130,702 0.74 Allied Waste North Amof 6.576 15/11 /2010 105,000 67,164 0.38
Belo Corporation 7.75% 01 /06/2027 75.000 44.018 0.25 Boston Scicntific Co-p 6% 15/06/2011 ;05.000 65,665 0.37 Esterline Technologies C 6.625% 01/03/2017 260.000 165,487 0.94
Ford Motor Co 7.45% 16/07/2031 185,000 69,006 0.39 Ford Motor Credit Co Ford Mtr Cr Co 5.625 "/b 01 11 012008
125.000 61,998 0.35
50.000 31.777 0.18
Frwpon-Mcrrioran Copper 8 Gold Inc 8.375% 01/04/2017 140,000 95,034 0.54
General Motors Corp 7.7% 26,626 0.15 15/01 /2Oi 1 55,000 87.299 0.49 ldearc Inc 220.000
K. Hovnanian Enterprises 6.25% 105.000 42,999 0.24 15/01/2015
Mgm Mirage 135.000 70.926 0.40
Ouicksilver Res Inc 7.75 % 72.648 0.41 01 /08/2015 11 5,000
Speedway Motorsports Inc 6.750% 180,899 1.03 01/06/2013 790.000
Sunstate Equip Co Llc 10.546 01/04:2013 240,000 121,139 0.69
Team Fin Llc / Health Fin 11 250% 01/12/2013 170.000 113,060 0.61
Tesoro Cwp 6.5% 01/06/2017 95.000 54,586 0.31
01/04/2017 260.000 159.296 0.90
West Carp 1 1 4" 15/i 0/201 t3 275,000 149,281 0.85
Wii Components Inc 10.000% 64.760 0.37 15/02/2012 120.000
Ventas Realty Lp 6.750%
Total Bonds
EUR Equities
1,873,870 10.62
3,606,222 20.44
Jsg Funding PIC 20 0 0.00
0 0.00
NOK Equities m o nnn 7R195 0 1 8
Total Equities 28,195 0.16
EUR Mortaaae and Asset Backed Securities ~_____
Gerresheimcr Holdings Gmbh Regs 7 875% 01 /03/2015 42.000 42,105 0.21
42,105 0.24
Total Mortgage and Asset Backed Securities 42,105 0.24
Total Transferable securities admitted to an official exchange listing 3,676,522 20.84
Transferable securities dealt in on another regulated market
EUR Bonds Asset Repackaging Trust Bv Emtn 1% 21/12/2011 109,908 106,679 0.60 Bcm lrcland Finance Limited Regs 1 9.0 15/08/2016 100,000 92,000 0.52 Huntsman International Llc Rags
100,000 85,750 0.49 6.825% 1311 1/2C13
Wdac Subsidiary Corp Regs 8.5% 01/12/2011 100.000 72.151 0.41
356,580 2.02
The accompanying notes form an integral part of these financial statements.
227
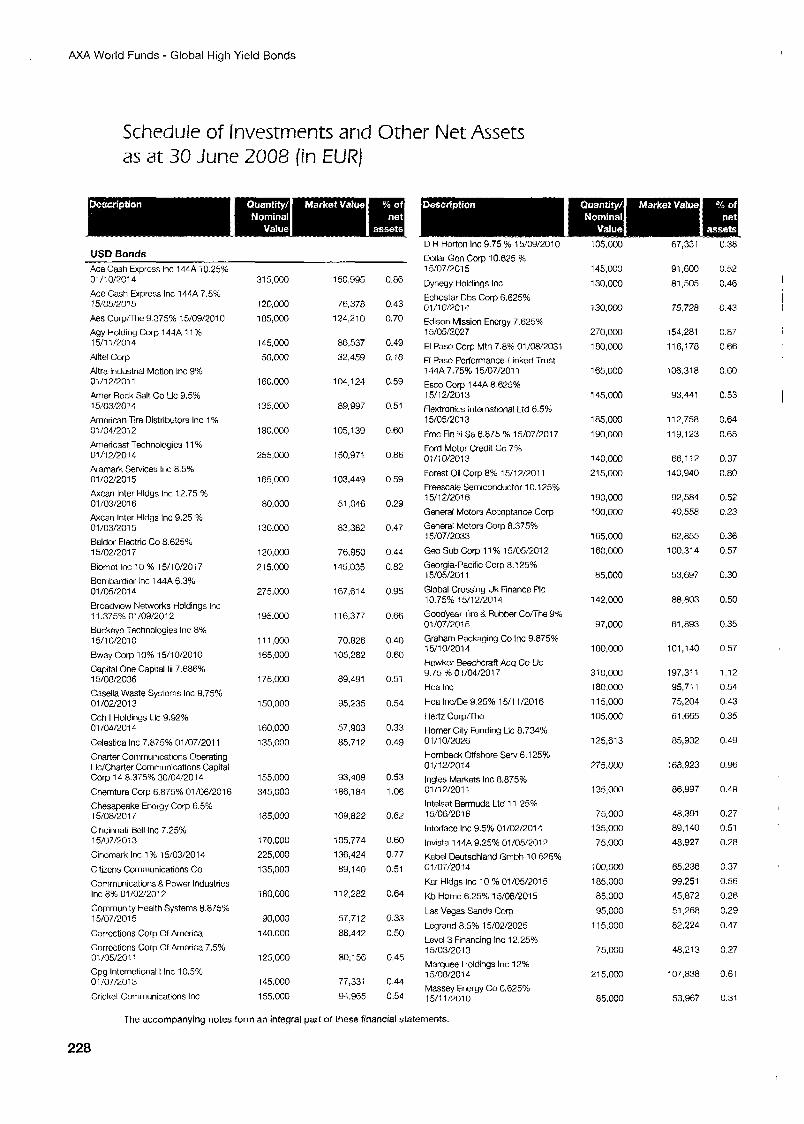
AXA World Funds - Global High Yield Bonds
Schedule of Investments and Other Net Assets as at 30 June 2008 (in EUR)
D R riortoii Inc 9 75 % 15/09/2010 105.000 67,331 0 3 8 USD Bands Ace Cash Eiprcss Inc 144A i 0.25% 01 /l O/PC1 4
Ace Cash Express Inc 144A 7.5% 1 5/05/2015
Aes Corpnhe 9.3754: 15/09/?01U Agy Holding Corp 144A 1 1 % 15/11/2014
Alltel Corp
Altra Industrial Motion Inc 9% 01/12/2011
Amer Rock Salt Co Uc 9.5'36 15/03/2014
American Tire Distrihutors Inc 1 % 0:/04/2012
Amencast Techriologics 11 o/u 01/12/2014 Aramark Services Inc 8.5% 01/02/2015 Axcan Inter Hldgs Inc 12.75 9t 01/03/2016 &can Inter Hldgs Inc 9.25 9'0 01/03/2015 Baldor Electric Co 8.625% 15/02/2017
Biomat Inc 10 % 15/10/20i 7 Bombardier Inc 144A 6.3% 01/05/201 4
Broadview Networks Holdings Inc 11.375% 01/09/2012 Buckayc Technologies Inc 8% 15/10/2010
Bway Corp 10% 15/10/2010
Capital One Capital lii 7.686% 15/08/2036 Casella Waste Systems Inc 9.75% 01/02/2013 Cch I Holdings Llc 9.92%
Celestica Inc 7.875% 01/07/2011
Charter Communications Operating LIcKharler Communications Capital Corp 14 8.37536 30/04/2014
Chemtura Corp 6.875% 01 /06/201 G
01 /04/2014
Chesapeake Encrgy Corp 6.58 15/08/2017 Cincinnati Bell Inc 7.25% 15/07/2013
Cincmatk Inc 1 % 15/03/20 14
Citizcns Communications Co Conimunications & Power lndustnes Inc 8% 01 /02/2012
Community Health Systems 8.875% 15/07/2015
Currcctions Corp of America Corroctions Corp Of America 7.5% 01/05/2011 Cpg lntcrnztional I Inc 10.5% 01!07/2013
Cricket Ccmmunications Inc
31 5,000
120.000 185,000
145,000
50.000
160,000
135,000
180,000
255,000
165,000
80,000
130.000
1 %0.000 P15.000
275.000
195.000
111.000
165,000
175,000
150,000
160,000
135,000
155,000
345,000
185.000
170,000 225,000
135,000
180,000
90,000
140.000
125,000
145,000
155.000
150.995
76.378 124,210
86.537
32,459
104,124
89,997
105,139
150,971
103,449
51,046
83,362
76.950
145.035
167,614
116,377
70.826 105,282
89.491
95,235
57,903
85,712
93,489
186.1 84
109,822
105,774
136,424
89,140
112,282
57.712
88.412
80. I 56
77,331
94.965
0.86
0.43
0.70
0.49
0.18
0.59
0.51
0.60
0.86
0.59
0.29
0.47
0.44
0.82
0.95
0.66
0.40
0.60
0.51
0.54
0.33
0.49
0.53 1.06
0.62
0.60
0.77
0.51
0.64
0.33
0.50
0.45
0.44
0.54
Dollar Gen Cop 10.675 % 15:07/2015
Dynegy Holdings Inc
Echostar Dhs Corp 6.625% 01/10/2014 Edison Mission Encrgy 7.625% 15/05/2027
El Paso Corp Mtn 7.8% 01/08/2031 El Paso Pcrformance-L.inked Trust 144A 7.75% 15/07/2011 Esco Corp 144A 8.625% 15/12/2013 Flextronics lritornational Ltd 6.5% 15/05/2013
Fmc Fin Iii Sa 6.875 96 15/07/2017 Ford Motor Credit Co 7% 01/10/2013
Forest Oil Corp 8% 15/1 a201 1 Freescale Semiconductor 10.1 25% 15/12/2016
General Motors Acceptance Corp General Motors COrp 8.375% 15/07/2033
G w Sub Corp 1 1 % 15/05/2012 Georgia-Pacific Corp 8.125% 15/05/2011
Global Crossing Uk Financo PIC 10.75% 15/12/2014 Goodyear Tire & Rubber Conhe 9% 01/07/2015
Graham Packaging Co Inc 9.875% 15/10/2014 Hawker Beechcraft Acq Co Llc 9.75 'yo 01/04/2017
Hca lhc
Hca Inc/De 9.25% 15/11 /2016
Hertz Corpme Homer City Funding Llc 8.734% 01/10/2026
Hombeck Offshore Serv 6.1 25% 01/12/2014
lngles Markets Inc 8.875% 01/12/2011 lntelsat Bermuda Ltd 11.25% 15/06/2016
Interface Inc 9.5% 01/02/2014
lnvista 144A 9.25% 01/05/2012
Kabel Oeutschland Grnbh 10.625% 01 /07/2014
Kar Hldgs Inc 10 % 01/05/2015
Kb Home 6.25% 15/06/2015
La5 Vegas Sands Corp
Lqrand 8.5% 15/02/2025 Lavcl 3 Financing Inc 12.25% 15/03/2013 Marquee Holdings Inc 12% 15/08/2014 Massey Energy Co 6.625% 15/11/7010
145,000
130,000
130.00
270,000
180,000
165,000
145.000
185,003
190,000
140,OW
215,000
190,003
100,OW
165.000
160.000
85,003
142,000
97,000
180,OcQ
310,000 180.000
115,000
105,003
125,613
275.000
135,000
75,000 135,000
75.000
100,oOO
185,000
85.000 95,000
11 5,000
75.000
215.000
85,000
91,600
81,505
75,728
154,281
116,178
106.31 8
93,441
112,758
119,123
66.112
140.910
92,584
40,558
62.855
100,314
53,697
88,803
61,893
101,140
197.31 1 95,711
75,204
61,665
85,932
168.923
86.997
48,391 89.140
48.927
65,236
99,251
45.872
51.268
82.224
48,213
107.838
53,967
0.52
0.46
0.43
0.67
0.66
0.60
0.53
0.64
0.68
0.37
0.80
0.5P 0.23
0.36
0.57
0.30
I
0.50
0.35
0.57
1.12
0.54
0.43 0.35
0.49
0.96
0.49
0.27
0.51 0.28
0.37
0.56
0.26
0.29
0.47
0.27
0.61
0.31
The accompanying notes form an integral part of these financial statements.
228
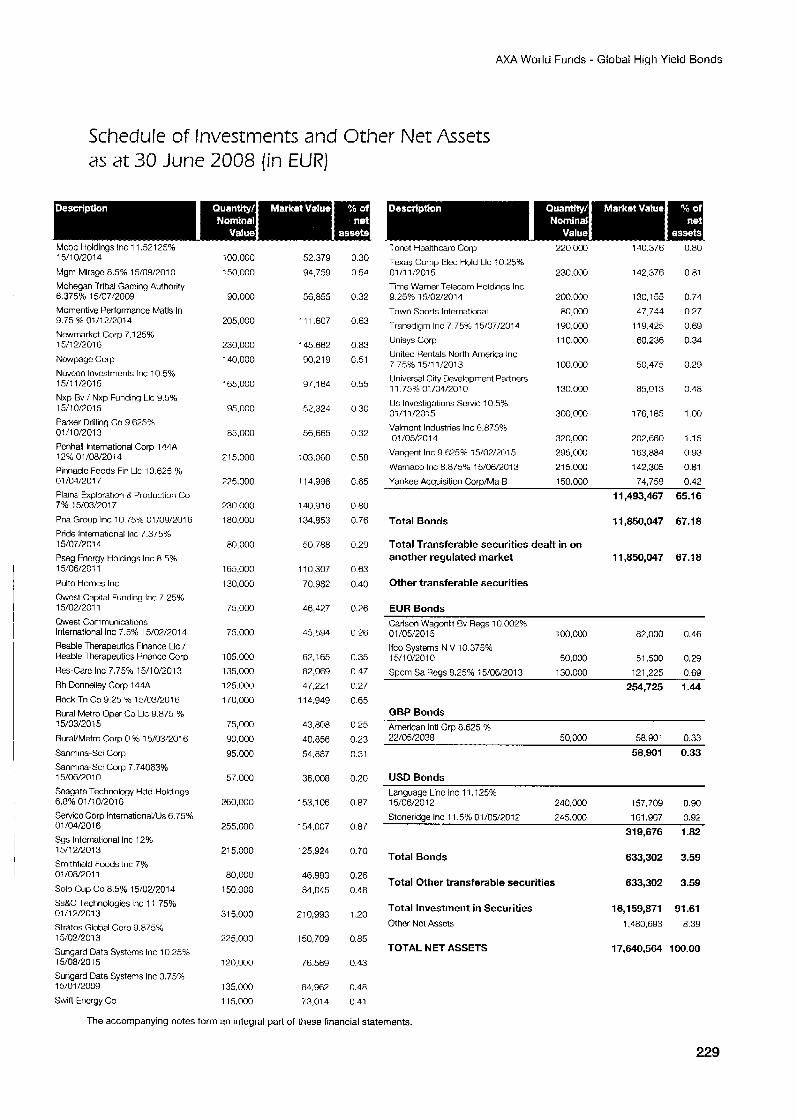
AXA World Funds - Global High Yield Bonds
Schedule of Investments and Other Net Assets as at 30 June 2008 (in EUR)
Mcbc Holdings Inc 1 1.521 25%
Mgm Mirage 8.5% 15/09/2010 Mohegan Tribal Gaming Authority 6.375% 15/07/2009 Momentive Performance Matls In 9.75 % 01/12/2014 Newmarket Corp 7.125% 15/12/2016
Ncwpagc Corp NuveQn Investments Inc 10.5% 15/11/2015
Nxp Bv / Nxp Funding Llc 9.5% 1511 Or201 5 Pafker Drilling Co 9.625% 01/10/2013 FCnhall International Corp 144A 12% 01/08/2014 Pinnaclc Foods Fin Llc 10.625 % 01/04/2017 Plains Exploration 8 Production Co 7% 15/03/2017
PnaGroup Inc 10.75% 01/09/2016 Pride International Inc 7.375% 15/07/2014
Pseg Encrgy Holdings Inc 8.5% 15/06/2011
PUk Homes Inc h e s t Capital Funding Inc 7.25% 15/02/2011
Owest Communications International Inc 7.5% 15/02/2014 Rcdble Therapeutics Finance Llc / Reable Therapeutics Financc Corp
Res-Care Inc 7.75% 15/10/2013
Rh Donnelley Corp 144A
Rock Tn Co 9.25 'yo 15/03/2016
1511 0/2014
Rural Metro Oper Co Llc 9.875 % 15/03/2015
HuraVMetro Corp 0 % 15/03/2016
Sanmina-Sci Corp Sanmina-Sci Corp 7 74063% 15/06/2010 Soagate Technology Hdd Holdings 6.8% 01/10/2016 Servico Corp InternationalNs 6 75% 01 /04/2016
Sgs International Inc 12% 15/12/2013 Smithficld Foods Inc 7% 01/08/2011
Solo Cup Co 8 5% 15/07/2014
S s K Technologies Inc 11 75% 01 /I 2/2013 Stratos Global Corp 9.875% 15/02/2013
Sungard Data Systcms Inc 10 25% 15/08/2015 Sungard Data Systems Inc 3.75% 15/01 /2009
Swift Energy Co
i00.000
150,000
90,000
205,000
230,000
140,000
165,000
95,000
85,000
21 5,000
775,000
230.000
180,000
80,000
165,000
130,000
75,000
75.000
105.000
135,000
125.000 170,000
75,000
90,om
95.000
57.000
260,000
255,000
215,000
80,000
150,000
31 5,000
275.000
120,000
135.000
115,000
52.379
94,759
56,855
11 1.607
145.662
90.21 9
97.164
52.324
56,665
103,060
4 14.996
140,916
134.853
50,788
11 0,307
70,982
46,427
45,594
62.165 82,069
47,221
1 14,949
a.aoa
54.687
40.856
36.006
153.106
154,007
125,924
46.983
84,045
210,993
150,709
76.569
84,962 73,014
0.30
0.54
P.32
0.63
0.83
C.51
0.55
0.30
G.32
C.58
C.65
0.80
C.76
0.29
0.63
0.40
0.76
C.26
c.35 c.47
0.27
0.65
0.25
0.23
0.31
0.20
0.87
0.87
0.70
0.26
0.48
1.20
0.85
0.43
0.48 0.41
lcnet Hcalthcarc Corp 220,000 140,376 0.80
Texas Conp Elec Hold Llc 10.25% 01/11/7015 230.000 142,376 0.81 Time Warner Telecom Holdings Inc 9.25% 15/02/2014 200.000 130,155 0.74
Town Sports International 80,000 47,714 0.27
Transdigm Inc 7.75% 15/07/2014 190,000 119,425 0.69
Unisys Corp 110,000 60.236 0.34 United Rentals North America Inc 7.75% 15/11/2013 100,000 50,475 0.29 Universal City Development Partners 11.75% 0:/04/2010 130,000 85.013 0.48 Us Investigations Servic 10.5% Oi/11/2015 300,000 176.185 1.00 Valmont Industries Inc 6.875% 01/05/2014 320,000 202,660 1.15
Vangent Inc 9.625% 15/02/2015 295.000 163,684 0.93 Warnaco lric 8.875% 15/06/2013 215,003 142,305 0.61
Yankee Acquisition Corp/Ma B 150,000 74,759 0.42
I 1,493,467 65.1 6
Total Bonds 11,850,047 67.18
Total Transferable securities dealt in on another regulated market 1 1,850,047 67.1 8
Other transferable securities
EUR Bonds Carlson Wagonlit Bv Regs 10.002% 01 /05/201 5 100,ooo 82.000 0.46 lfco Systems N V 10.375% 15/10/2010 50,000 51,500 0.29
Sncm Sa Heas 8.25% 15/06/2013 130.000 121.225 0.69
254,725 1.44
GBP Bonds American lntl Grp 8.625 % 22/05/2038 50,000 58,901 0.33
58,901 0.33
USD Bonds Language Linc Inc 1 1.125% 15/06/2012 240,000 157.709 0.90 Stoneridge Inc 11.5% 01/05/.?012 245.000 161,967 0.92
319,676 1.82
Total Bonds 633,302 3.59
Total Other transferable securities 633,302 3.59
Total Investment in Securities 16,159,871 91.61 Other Nct Asscts 1,480,693 8.39
TOTAL NET ASSETS 17,640,564 100.00
The accompanying notes form an integral part of these financial statements.
229
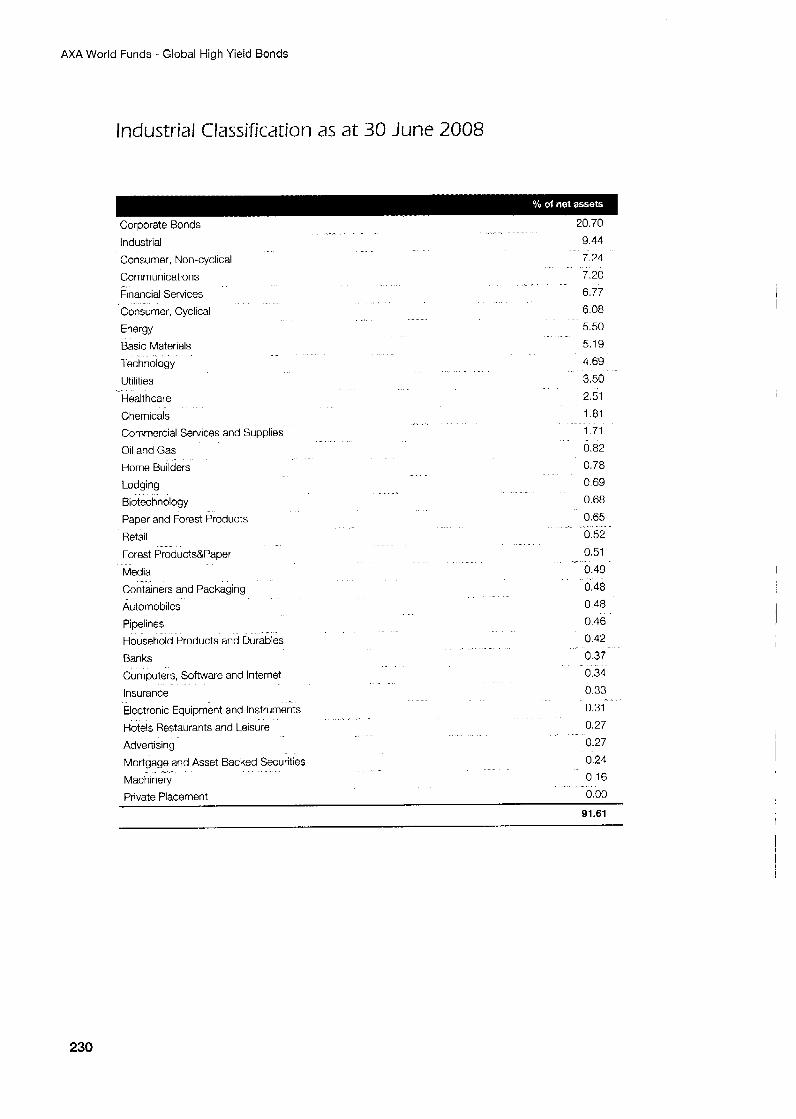
AXA World Funds - Global High Yield Bonds
Industrial Classification as at 30 June 2008
Industrial
Consumer, Non-cyclical
Communications
Financial Services
Consumer, Cyclical
Energy Basic Materials
Technoiogy
Utilities
Healthcare
Chemicals
Commercial Services and Supplies
Oil and Gas Home Builders
Lodging
Biotechnology
Paper and Forest Products
Retail
Forest Products&Paper
Media
Containers and Packaging
Automobiles
Pipelines
Household Products and Durables
Banks Computers, Software and Internet
Insurance
Electronic Equipment and Instruments
Hoteis Restaurants and Leisure
Advertising
9.44
7 24
7 20
6.77
6.08
5.50
5.19
~"
4.69 3.50 2.51
1.81
1.71
0.82
0.78
0 69
0.68
0 65 0 52 0.51
0 49
0 48 0 48 0 46
0 42
0 37 0 34 0 33 0.3f ~
0 27 0.27
I
I
Mortgage and Asset Backed Securities
Private Placement 0.00
0 21 Machineb 0 16
91.61
230
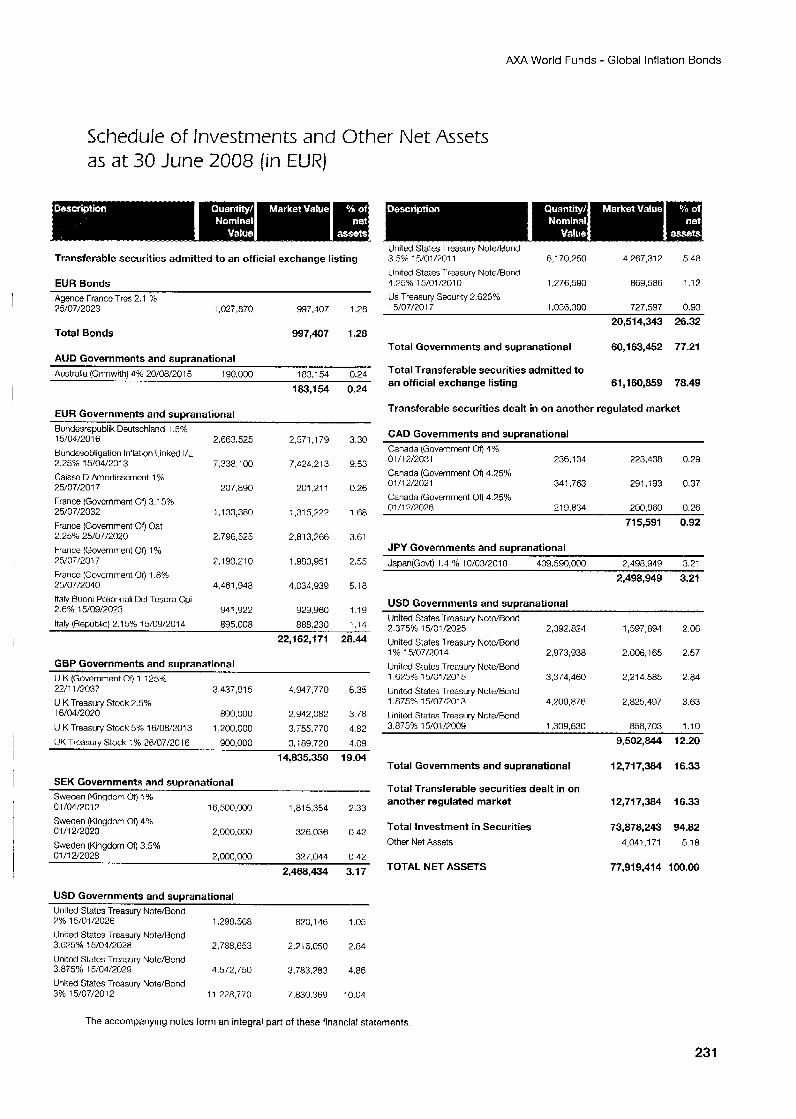
AXA World Funds - Global Inflation Bonds
Schedule of Investments and Other Net Assets as a t 30 June 2008 (in EUR)
Transferable securities admitted to an official exchange listing
EUR Bonds Agence France Tros 2.1 % 75/07/2023 1.027.870 997,407 1.28
Total Bonds 997,407 1.28
AUD Governments and supranational Australia ICmnwlth) 4% 20/08/2015 190.[lnn i m i ~ i 4 n.74
183,154 0.24
EUR Governments and supranational Eundasropublik Deutschland 1.5% 15/04/2016 2,663,525 2,571.179 3.30 Bundosobligation In'lation Linked I/L 2.25% 15/04/2013 7,338,100 7,424.213 9.53 Caissc D Amortissernent 1 % %5/07/2017 207,890 201,211 0.26 France (Govcrnment Of) 3.1 5% 25/07/2032 1,133,380 : ,315,222 1.68 France (Government Of, Oat 2.25% 25/07/2020 2,796,525 2,813,766 3.61 France (Government Of) 1 % P5/07/2017 P. 190.21 0 1,983,951 2.55 France (Govcrnment Of) 1 .R% 25/07/2040 4,461.948 1,034,939 5.18 Italy Euoni Policrinali Del Tesoro Cpi 2.6% 15/09/2023 941,922 929,960 1 19
Italy (Republic) 2.15% i5/09/2014 895.008 888,230 1.14 22,162,171 28.44
GBP Governments and suoranational U K (Government Gi) 1.125% 22/11/2037 3.437.91 5 4,917,770 6.35 U K Treasury Stock 2.5% 16/04/2010 800,000 2.942.082 3 78 U K Treasury Stock 5% 16/08/2013 1,200,000 3.755.770 4 82 UK Treasury Stock -, % 26/07/2016 900,000 3.i89.728 4.03
14,835,350 19.04
SEK Governments and supranational Sweden (Kingdom ofl: % 01/04/%012 16,500,000 1,815,354 2.33 Sweden (Kingdom Of) 4% 01/12/2020 2,000,000 326.036 0 4 2 Sweden (Kjngdom Of) 3.5% 01/12/2026 2.000.000 377.044 0 4 7
2,468,434 3.17
USD Governments and supranational United Statcs Treasury Note/Rond 2% 15/01/2026 1,298568 Ra0.146 1.05 United Statcs Treasury NotdRond 3.625% 15/04/202E 2,788,653 221 6,050 2.84 Unitcd States Treasury Note/Bond 3.875% 15/04/2029 4,572,750 3,7832'83 4.86 United States Trcasury Note/Bond 3% 15/07/2012 11,228,770 7.830.369 10.04
United States Treasury NoteIBond 3.50/6 15/01/2011 6,170,250 4,267,312 5.48 United Stztes 1-reasury Note/Bond 4.75% 15/01/2010 1,276,590 869.586 1.12 Us Treasury Security 2.625% 15/07/2017 1.036.300 727.597 0.93
20,514,343 26.32
Total Governments and supranational 60,163,452 77.21
Total Transferable securities admitted to an official exchange listing 61,160,~sg 78.49
Transferable securities dealt in on another regulated market
CAD Governments and suwanational Canada (Government or) 4%
236,134 223,438 0.29 01 /1?/%031 Canada (Government Of, 4.75% 01 /12/2021 341,763 291,193 0.37 Canada (Government Of, 4.75% 01 /12/2026 219.834 200,960 0.26
715,591 0.92
JPY Governments and supranational Japan(Govt) 1.4 % 10/03/2018 409,590,000 2,498,949 3.21
2,498,949 3.21
USD Governments and su~ranational . . . . . - -. .
United States .Treasury Notc/Bond 2.375% 15/01/2025 2,392,824 1,597,891 2.06 United States Treasury Notc/Bond 1 % 15/07/7014 2,973,938 2,006,165 2.57 lJnited Statcs rrcasury Notc/Bond 1.67596 15/C1/2015 3,374,460 2,214,585 2.84 Unitcd States Treasury Note/Bond 1.875% 15/07/2013 4209.876 2,825,437 3.63 Uriitod States Treasury Note/Rond 3.875% 15/01/7009 1.309.630 858.703 1.10
9,502,844 12.20
Total Governments and supranational 12,717,384 16.33
Total Transferable securities dealt in on another regulated market 12,717,384 16.33
Total Investment in Securities 73,878,243 94.82 Other Net Assets 4,041,171 5.18
TOTAL NET ASSETS 77,919,414 1oo.M)
The accompanying notes form an integral part of these financial statements
23 1
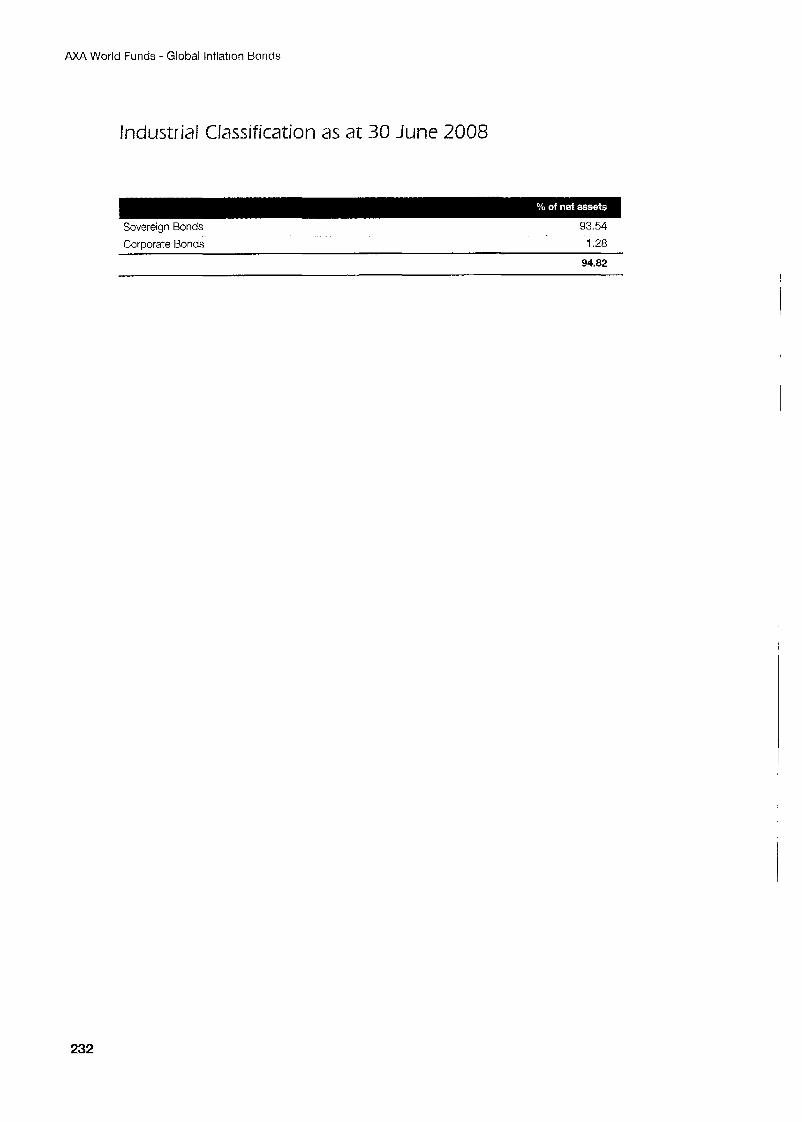
AXA World Funds - Global Inflation Bonds
Industrial Classification as at 30 June 2008
Sovereign Bonds Corporate Bonds
93.54
1.28
94.82
232
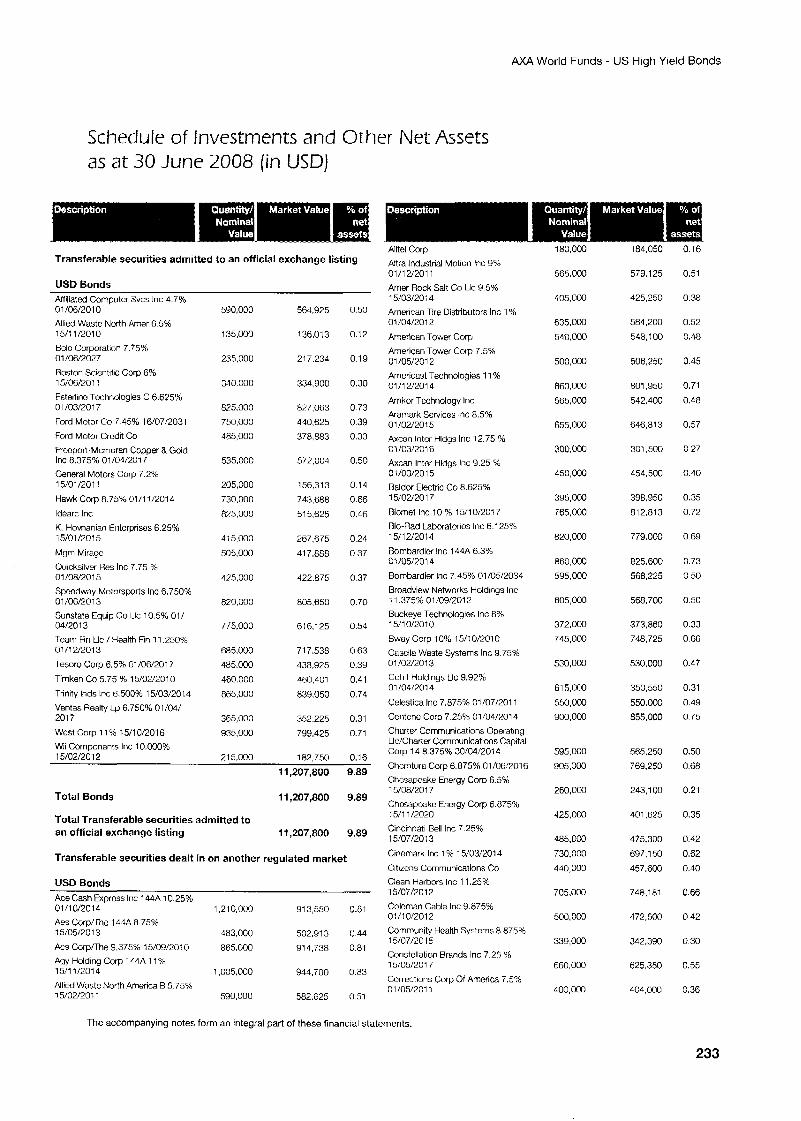
AXA World Funds - US High Yield Bonds
Schedule of Investments and Other Net Assets as at 30 June 2008 [in USDJ
Transferable securities admitted to an official exchange listing
USD Bonds ~ ~ ~ _ _ _ _ _ _
Attiliated Cornouter Svcs Inc 4.7% 01/06/2010 Allied Wastc North kmer 6.5% 15/11 /2010 Bclo Corporation 7.75% O i /06/2027
Bcston Scientific CGrp 6% 15/06/2011 Fsterline Tcchnologies C 6.625% 01/03/2017
Ford Motor Co 7.45% 16/07/2031
Ford Motor Credit Co Frccpoit-Mcmoran Copper & Gold Inc 8.375% 01/04/2017 General Motors Corp 7.2% 15/01/2011
Hawk Cow 8.75% 01/11/2014
ldearc Inc
K. Hovnanian Entcrprisos 6.25% 1 5/01 /20! 5
Mgm Miragc Quicksilver Res Inc 7.75 5% 01/08/2015 I
590,000
135,000
235,000
340.000
825,000
750,000 485,000
535,000
205,000
730,000
R25.000
41 5.000
505,000
425,000
564,975
136.013
217.234
334,900
827,063 440,625
378.883
572.004
156.31 3
743.888 51 5.625
267,675
41 7,888
422.875
0.50
0.12
0 19
0.30
0 73
0 39 0.33
0.50
0.14
0 66
0.46
0 24
0 37
0 37 Spcodway Motorsports Inc 6.750% 01 /06/2013 Sunstate Equip Co ILIc 10.5% 01/ 04/2013 Team Fin Llc / eealth Fin 11.250% 01/12/2013
Tesoro C o p 6.5% C1/06/2017
Tirnken Co 5.75 % 15/02/2010
Trinity lnds Inc 6.500% 15/03:2014 Ventas Realty Lp 6.750% 01/04/ 201 7
West Corp 1 1 % 15/10/2016 wli Components Inc 1 0.000% 15/02/2012
820,000
775,000
685,000
485.000
460.000
865.000
365,000
935,000
715.000
805,650
616.1 25
71 7,538
438.925
460,401
839.050
352.225
799.425
182.750
0.70
0.54
0.63 0.39
0.41
0.74
0.31
0.71
0.16
11,207,800 9.89
Total Bonds 11,207,800 9.89
Total Transferable securities admitted to an official exchange listing 1 1,207,800 9.89
Transferable securities dealt in on another regulated market
USD Bonds Ace Cash Exprcss lric 144A 10.25% 01 11 M 0 1 4 1,210,000 913,550 0.81 Aes Corpllhc 144A 8.75% 1 5/05/70 1 3 483,000 502,913 0.44
Acs CorpTThe 9 ,375X 15/09/2010 865.000 914,738 0.81 Agy Holding Corp 1 L4A 1 19b 15/11/2014 1.005.000 944.700 0.a3 Allied Waste North Anwica R 5.75% 15/C2/2011 590,000 582.625 0.51
180.000 184.050 0 1 6 Alltel Corp Altra lndustnal Motion Inc 9% GI /I 2/2011 Arner Rock Salt Co Llc 9.5% 15/03/20: 4 Arnerican Tire Distributors Inc 1 Yb 01:04/2012
American Tower Cop American Tower Cop 7.5% 01 /OW01 2 Amcricast Technologies 11 % 01/12/2014
Amkor Tcchnology lric Aramark Scrvicos Inc 8.5% 01/02/20!5 Axcan lntcr Hldgs lrlc 12.75 76 01/03/2016 Axcan Inter Hldgs Inc 9.25 % 01 /03/20 1 5 Raldor Electric Co 8.625% 15/’02/2017
Biomet Inc 10 % 15/1 Oi2017 Bio-Rad Laboratories Inc 6.125% 15/12/2014
Bombardicr Inc 144A 6.3% 07 /05/3014 Bombardier Inc 7.45% 01 /05/2034
Broadview Networks Holdings Inc i 1.375% 01 /09/2012 Buckeye Technolwies Inc 8% 15/10/2010
Bway Corp 10% 1511 01201 0 Cas& Waste Systems Inc 9.75% 01 /02/2013 Cch I Holdings IJc 9.92% 01 /04/2014
Celestica Inc 7.875% 01/07/2011
Ccntcnc Corp 7.25% 01/04/2014 Charter Communications Operating LWCharter Communications Capital C o p 14 8.375% 30/04/2014
Chcntura Corp 6.875% 01/06/?016 Chcsapcake Energy Corp 6.546 15/08/2017 Chcsapcake Energy Corp 6.875Yo 15/11/2020 Cincinnati Bell Inc 7.25% 15:07/20: 3
Cincmark Inc 1 % 15/03/2014
CitiLcns Communications Co Clean Harbors Inc 11.25% 15/07/7012
Colcman Cable Inc 9.875% 0!/!0/2012 Community Hoallh Systems 8.875% 15/07/2015 Constellaton Brands Inc 7.25 Sb 15/05/2017
Corrections Corp Of America 7.596 0 1 /05/2011
565.000
405,000
635.000
540,000
500,000
860.000
565,000
655.000
300,000
450,000
395,000
765,000
820,000
860.000 595,000
605,000
372.000
745,OGO
530,000
61 5.000 550,033 900,003
595,000
805.000
260,OCO
425,000
485,000
730,000
4 40,000
705.000
500,000
339,003
660.000
400,000
579.1 25
425,250
584,200
548,100
506,250
801,950
542,400
646.81 3
301,500
454,500
398.950
812.813
779.000
825,600
568.225
568,700
373.860 748,725
530,000
350,550
550.000
855,000
565,250 769,250
243,100
401.625
475,300
697,150
457,600
748.181
472,500
342,390
625.350
404,000
0.51
0.38
0.52
0.48
0.45
0.71
0.48
0.57
0.27
0.40
0.35
0.72
0.69
0.73
0.50
0.50
0.33
0.66
0.47
0.31
0.49
0.75
0.50
0.68
0.21
0.35
0.42
0.62
0.40
0.66
0.42
0.30
0.55
0.36
The accompanying notes form an integral part of these financial statements.
233
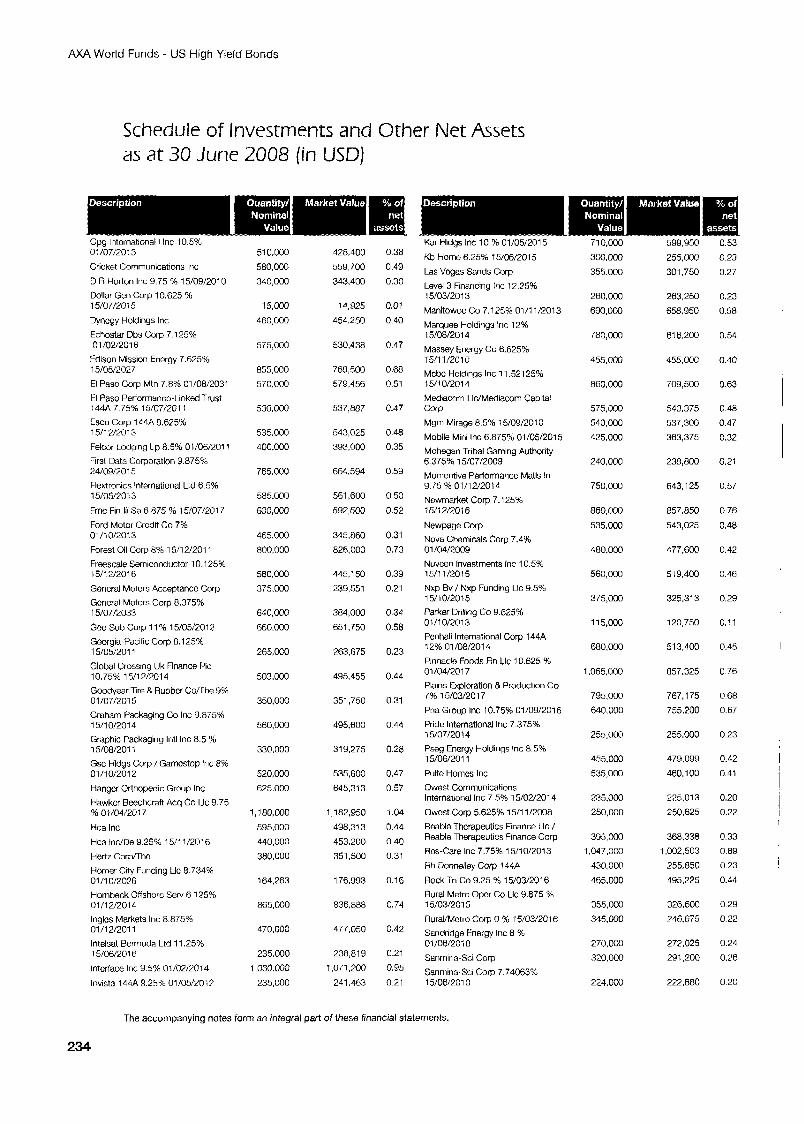
AXA World Funds - US High Yield Bonds
Schedule of Investments and Other Net Assets as at 30 June 2008 (in USD)
Cpg lntcrnational I Inc 10.5% 01/07/2013
Cricket Communications Inc
D R Hotton Inc 9.75 % 15/09/2010 Dollar Gen Corp 10.625 4: 15/07/2015
Uyncgy Holdings Inc Echostar Dbs Corp 7.12596 01 /02/2016
Edison Mission Energy 7.625% 15/05/2027 El Paso Corp Mtn 7.8% 01/08/2031
El Paso Performancu-Linked Trust 144A 7.75% 15/07/2011 Esco Corp 144A 8.625% 1511 2/201 3
Felcor Lodging Lp 8.5% 01/06i2011 First Data Corporation 9.87596 24/09/2015
Flextronics International Ltd 6 5% 15/05/2013
Fmc Fin lii Sa 6 875 96 15:07/2017
Ford Motor Crcdit Co 7% 01 /10/2013
Forest Oil Corp 8% 1511 21201 1
Freescale Semiconductor 10 125% 1511 2/2016
Guncral Motors Acceptancc Corp Gcneral Motors Corp 8.375% 15/07/2033
Gco Sub Corp 1 1% 15/05/2012 Gwrgia-Pacific Corp 8.1 25% 15/05:201~
Global Crossing Uk Finance PIC 10.75% 15/12/2014 Goodyear Tire 8 Rubbcr Conhe 9% 01 /07/2015 Graham Packaging Co Inc 9.875% 15/10/2014 Graphic Packaging lntl Inc 8.5 % 15/08/2011 Gsc Hldgs Corp / Gamcstop Inc 8% 01/10/2012
Hangcr Orthopedic Group Inc Hawkcr Beechcraft Acq Co Llc 9 75 ?& 01/04/2017
Hca Inc
HcaInc/De925% 15/11/2016
Hert7 Corpmhc
Homer City Funding Uc 8.734% 01/10/207R Hornbeck Offshurc Sow 6.1 25% 01 /1 2/2014 lnglcs Metkets Inc 8.875% 01/12/2011 lntolsat Bermuda Ltd 11.25% 15/06/2016
lntcrface Inc 9.5% 01/02/2014
lnvista 144A 9.25% 01/05!20~7
510.000 580,000
340,000
15.wO
460,000
575,000
855,000
570,000
530.000
535.000 400.000
765.000
585.000
600,000
465,000
800,000
580,000 375,000
640,000
fj60.000
265,CCO
503,000
350,000
560,000
330,000
520,000
625.000
1,180,000
595.000
440,000
380.000
164,763
865.000
470.000
235.000
1.030.000
235,000
428.400
559.700
343,400
14.925
454.250
530,438
769,500
579.456
537,887
5 4 3.0 2 5
393.000
664,594
561,600
592.500
345.860
826.000
445,150
239,551
384,000
651,750
263,675
495.455
351,750
495.600
319,275
535,600
645,313
1,182,950
498,313
453.200
351,500
176.993
836.888
477.050
238,819
1,071200
241.463
0.38
0.49
0.30
0.01
0.40
0.47
0.68
0.51
0.47
0.48 0.35
0.59
0.50
0.52
0.31 0.73
0.39
0.21
0.34
0.58
0.23
0.44
0.31
0.44
0.28
0.47
0.57
1.04
0.44
0.40
0.31
0.16
0.74
0.42
0.21
0.95
0.21
Kar Hldgs Inc 10 % 01/05/2015
Kb Home 6.25% 15/06/2015
Las Vogas Sands Corp Level 3 Financing Inc !2.75% 15/03/2013
Manitowc Co 7.125% 01/11/2013
Marquee Holdings Inc 12% 15/08/2014
Massey Energy Co 6.625% 15/11/2010 Mcbc Holdings Inc 11.52125% 15/10/2014
Mdiacom LWMediacom Capital Corp
Mgm Mirage 8.5% 15/09/2010
Mobile Mini lm 6.875% 01/05/2015 Mohegan Tribal Gaming Authority 6.375% 15/07/2009 Momentive Performancc Matls In 9.75 % 01/12/2014 Nowmarket Corp 7.125% 15/12/2016
Newpage Corp Nova Chemicals Corp 7.4% 01/04/2009
Nuveen Investments Inc 10.5% 15/11/2015
Nxp Bv / Nxp Funding Llc 9.5% 15/10/2015 Parker Drilling Co 9.625% 0 1/1 Or201 3 Penhall International Corp 144A 12% 01/08/2014 Pinnacle Foods Fin Llc 10.625 % 01/04/2017 Plains Exploration 8 Production Co 7% 15/03/2017
Pna Group Inc 10.75% 01/09/2016 Pride International Inc 7.375% 15/07/2014
Pseg Energy Holdings Inc 8.5% 15/06/2011
PuRo Homes Inc Owes! Communications International Inc 7.5% 15/02/2014
Owcst Corp 5.625% 15/11/2008 Reable Thcrapeutics Finance Uc / Reable Therapeutics Finance Gorp
Rcs-Care Inc 7.75% 15/10/2013
Hh Donnelley Gorp 144A
Rock Tn Co 9.25 % 15/03/2016 Rural Metro Opcr Co Llc 9.875 % 15/03/2015
RuralIMotro Cop 0 96 15/03/2016 Sandndge Energy Inc 8 % 01/06/2Oi 8
Sanmina-Sci Carp
Sanmina-Sci Corp 7.7406376 15/06/2010
710,000
300.000
355.000
260.000
690.000
780,000
455.000
860.000
575.000 540,000
425.000
240,000
750,000
860.000
535.000
480.000
560,000
3 7 5 , m
115,000
680,000
1.065.000
795.000
640.000
255,000
455.000
535,OCQ
235,000
250,000
3 9 5 . m 1,047.000
430,000
465.000
355.000 345.000
270,000 320.000
224.000
599,950
255.000 301,750
263,250 658.950
616,200
455,000
709,500
543.375
537.300 363,375
238,800
643,125
857.850
543,025
477,600
519,400
325.31 3
120,750
513,400
857.325
767,175
755.200
255,000
479,099
460.1 00
225.01 3
250,625
368.338 1,002503
255.850
495.225
326,600
?46.675
272.025 291,200
222.880
0.53
0.23
0.27
0.23
0.58
0.54
0.40
0.63
0.48
0.47
0.32
0.21
0.57
0.76
0.48
0.42
0.46
0.29
0.11
0.45
0.76
0.68 0.67
0.23
0.42
0.41
0.20
0.22
0.33
0.89 0.23
0.44
0.29
0.22
0.24
0.76
0.20
The accompanying notes form an integral part of these financial statements.
234
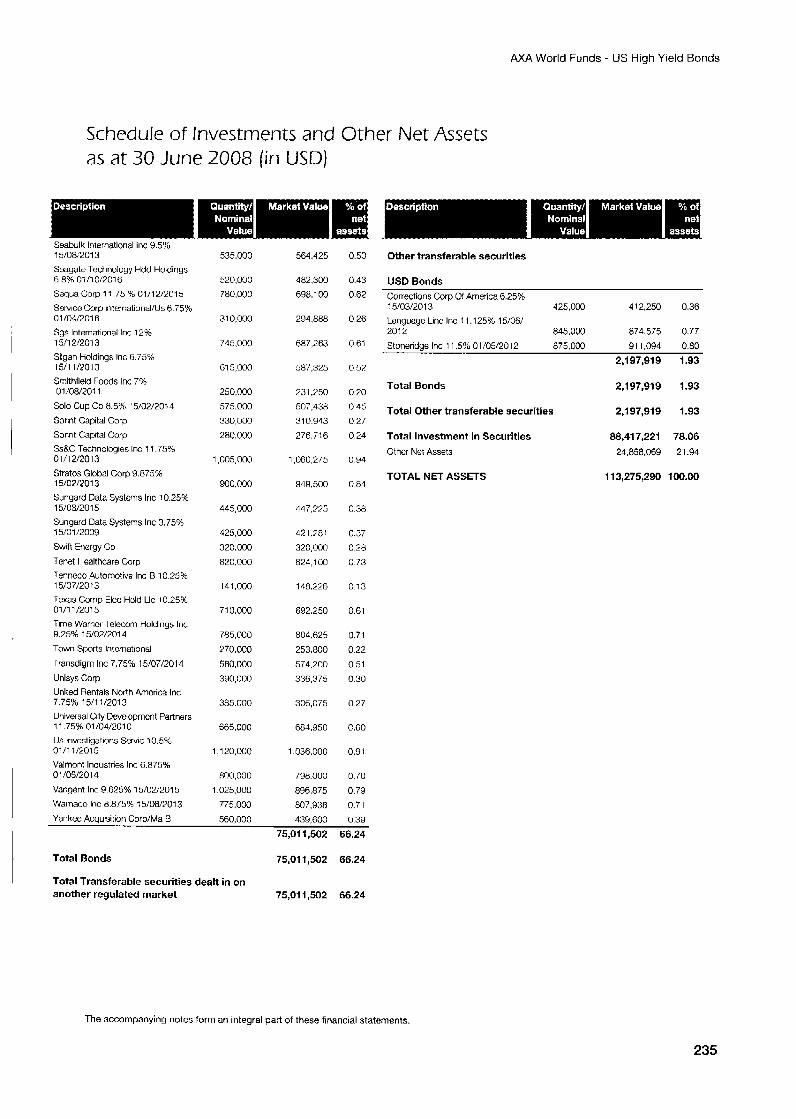
AXA World Funds - US High Yield Bonds
Schedule of Investments and Other Net Assets as at 30 June 2008 [in USD)
Seabulk International Inc 9.5% 15/08/2013
Seagate Technology Hdd Holdings 6.8% 01/10/2016
Sequa Corp 11.75 3 01/12/2015 Servtca Corp International/Us 6.75% 01/04/2016 Sgs International Inc 12% 15/12/2013
Silgan Holdings Inc 6.75% 15/11/2013
Smithfield Foods Inc 7% 01/08/2011
Solo Cup Co 8.5% + 5/02/2014
Sprint Capital Corp
Sprint Capital Corp Ss8C Technologies Inc 11.75% 01 /12/2013 Stratos Global Corp 9.875% 15/07/2013
Sungard Data System Inc 10.25% 15/08/2015
Sungard Data Systems Inc 3.75% 15/01/2009
Swift Encrgy Go
Tenet Haalthcare Corp Tenneco Automotive Inc B 10.25% 15/07/2013 Texas Comp Elcc Hold Llc 10.25% 01/11/2015
Time Warncr Telecom Holdings Inc 9.25% 15/02/2014
Town Sports lntcrnational
Transdigm Inc 7.75% 15/07/2014
Unisys Carp United Rentals North Arncrica Inc 7.75% 15/11/2013 Univetsal City Developmcnt Partners 11.75% 01/04/201C Us Investigations Servic 10.5% 01/11/2015 Valmont Industries Inc 6.875%
Vangent Inc 9.625% 15/02/2015
Wamaco Inc 8.875% i5/06/.?013
01/05/2014
535,000
520,000 ~RO,OOG
31 0,000
74 5,000
61 5,000
250,000
575,000
330,000
2~0.000
1,005,000
900.000
445,000
425,000
320,000
820.000
141,000
71 0,000
785.000
270.0M3
580.000 390,000
385.000
665,000
1,120,000
Ro0.000 1,025.000
775,000
564,425
482,300
698.1 00
294.888
687,263
587.325
731.?50
507.438
310.943
2767; 6
1.060275
949,500
447.2?5
421 283
320,000
824,100
118.226
892.250
804.625
253.800
574.200
336,375
306,075
684.950
1.036.000
798.000
896,875
807.938
439,600
0.50
0.43
0.67
0.26
0 61
0.52
0.70
0 45 0.27
0.24
0.94
0.84
0.38
0.37
0.28 0.73
0.13
0.61
0.71
0.22
0.51 0.30
0.27
C.60
0.91
0.70
0.79
0.71
0.39 Yankee Acquisition Corp/Ma B 560,000 I
75,011,502 66.24
Total Bonds 75,01 1,502 66.24
Total Transferable securities dealt in on another regulated market 75,011,502 66.24
Other transferable securities
USD Bonds Corrections Corp of Amenca 6.25% 15/03/2013 425,000 412,250 0.36 Languagc Linc Inc 1 1.125% 15/06/ 201 2 845.000 874,575 0.77 Stoneridue Inc 11.576 01/05/2012 ~75.000 911.094 0.80
2,197,919 1.93
Total Bonds 2,197,919 1.93
Total Other transferable securities 2,197,919 1.93
Total Investment in Securities aa,417,221 78.06 Other Net Assets 24,858,069 21 -94
TOTAL NET ASSETS 113,275,290 100.00
The accompanying notes form an integral part of these financial statements.
235
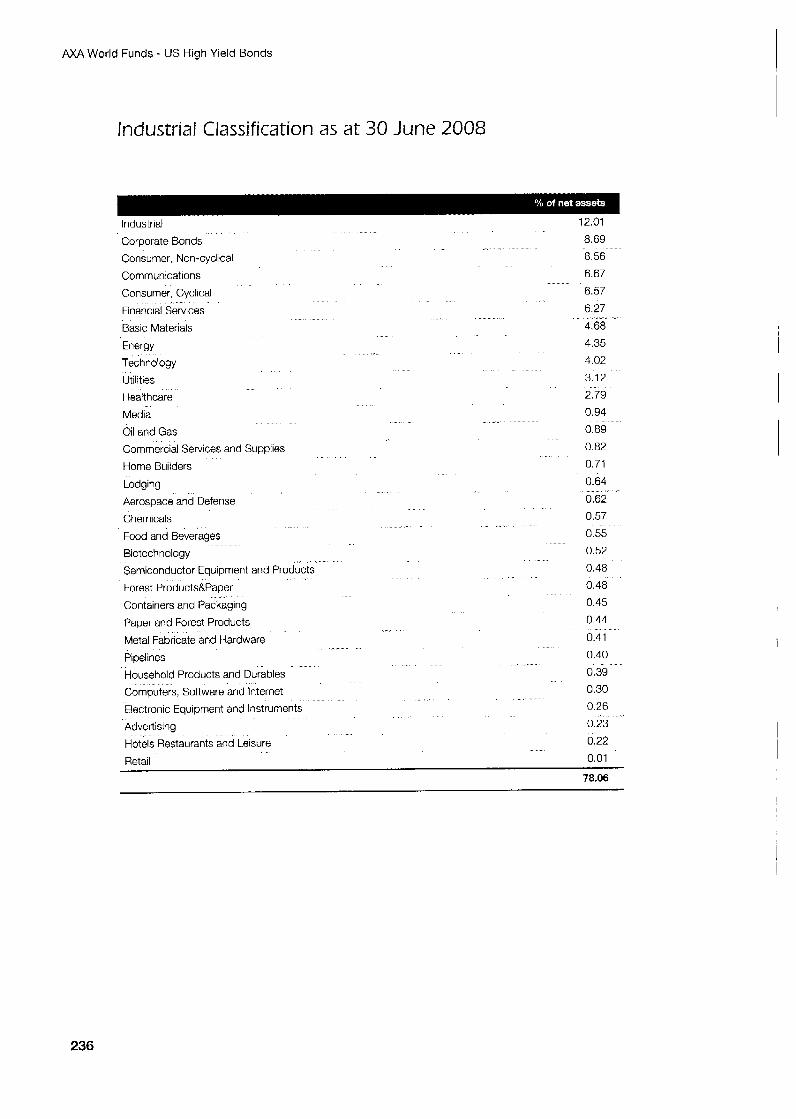
AXA World Funds - US High Yield Bonds
Industrial Classification as at 30 June 2008
Industrial
Corporate Bonds
Consumer, Non-cyclical
Communications
Consumer, Cyclical
Financial Services
Basic Materials
Energy
Technology
UtllltleS
Healthcare
Media
Oil and Gas Commercial Services and Supplies
Home Builders
Lodging
Aerospace and Defense
Chemicals
Food and Beverages
Biotechnology
Semiconductor Equipment and Products
Forest ProductsBPaper
Containers and Packaging
Paper and Forest Products
Metal Fabricate and Hardware
Pipelines
Household Products and Durables
Computers, Software and Internet
Electronic Equipment and Instruments
Advertising
Hotels Restaurants and Leisure
Retail
12.01
8.69
8.56
6.67
6.57
6 27 4 68 4.35
4.02
3.12
2.79
0.94
0.89
0.82
0.71
0.64
0.62
0.57
0.55
0.52
0.48
0 48
0.45
0 44
0.41
0.40
0.39
0.30
0.26
0 23
0.22
0.01
~-~
" "
I
78.06
236
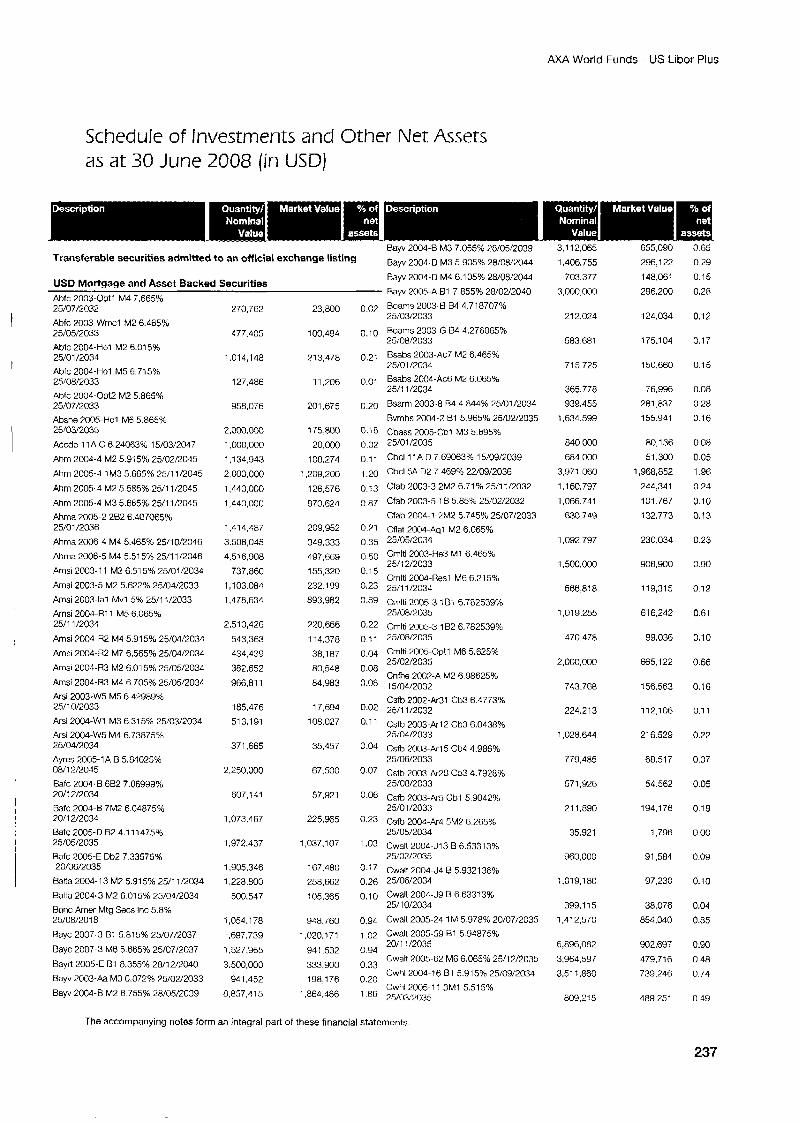
AXA World Funds - US Libor Plus
Schedule of Investments and Other Net Assets as at 30 June 2008 (in USD)
Bay 2004-6 M3 7 055% 78/05/2039 Transferable securities admitted to an official exchange listing Bay 2o04 M3 90596 28/ow2044
Bayv 2004-0 M4 6.1 05% 28/08/2044 USD Mortgage and Asset Backed Securities
B a y 7005-A 61 7 855% 28/02/2040 Abfc 2003-Opt1 M4 7.665% 25/07/2032 Abfc 2003-Wmcl M2 6.b65% 25/05/2033 Abic 2004-He1 M2 6.01 5% 25/01/2034 Abfc 2004-HOl M5 6.715% 25/08/2033 Abfc 2004-Opt2 M2 5.865% 25/07/2033 Abshe 7005-Hcl M6 5.865% 25/03/2035
Accdo 11A C 6.24063% 15/03/2047
Ahm 2004-4 M2 5.9:5% 25/02/2045
Ahm 2005-0 1M3 5665% 25/11/2045
Ahm 2005-4 M2 5.585% 25/11/2045
Ahrn 2005-4 M3 5.665% 75/11/2045 Ahrna 2005-2 282 6 407065% 25/01 /2036
Ahma 2006-4 M4 5.465% 25/10/2046
Ahnia 2006-5 M4 5.51 5% 25/11/2046
Amsi 2003-1 1 M2 6.515% 25/01/2034
Arnsi 2003-5 M2 5.622% 25/04/2033
Amsi 2003-la1 Mvl 5% 25/11/2033 Amsi 2004-R11 M5 6.065% 25/11 /2034
Amsi ?004-R2 M4 5.915% 25/04/2034
Amsi 2004-R2 M7 6.565% 25/04/2034
Amsi 2001-R3 M2 6.015% 25/05/2034
Amsi 2004-R3 M4 6.705% 25/05/2031 Arsi 2003.W5 M5 6.42989% 2 3 1 0/2033 Arsi 2004-W1 M3 6.31 5% 25/03/2034
Arsi 2004-W5 M4 6.73875% 25/04/2034 Ayres 2005-1A B 5.84625% ow1 ~12045 Bafc 2004-8 682 7.06999% 20/12/2034 BafC 2004-8 7M2 6.04875% 7011 2/2034 Bafc 2005-D 82 4.1 11475% 25/05/2035 Bafc 2005-E Db2 7.23575% 20/06/7035
Balta2004-13 M:, 5.915% 25/11/2034
BaRa 2004.3 M2 6.01 5% 25/0A/2034 Ranc Amer Mtg Secs Inc 5.8% 25/08/2018
Rayc 2007-3 B1 5.815% 25/07/2037
Bayc 2007-3 M6 5.665% 25/G7/2037
Bayrt 2006-E R1 8.355% 28/12/2040
Bayv 7003-Aa M3 6.072% 75/02/2033
Bayv 2004-8 M2 6.755% 28/05/2039
270.762
477.405
1,014,148
127,486
958,076
2.OOO.OOO 1,000,000
1,134,943
2 000,000
1.440,OCO
1,440.000
1,414,407
3508,045
4.516.908
737.860 1,103.084
1.478.634
2,510,426
543,363
434,439
382.652
966,811
185.476 513,191
371,665
2.250.000
607,141
1.073.467
1,972,437
1,905,346 1.228.800
500,547
1,054.1 78
1.6’17.739
1,527,965
3.500,OOO 941,452
8,857.41 5
23,800
100,494
213.478
11,206
201,675
175,Roo
20 000 108.274
1.209.200
126,576
870,624
209,952
349,333
497,669 155,320
232.199
893.982
790.666
114.378
38,187
80.548 84,983
17,694
108,027
35,457
67,500
57,921
225365
1,037.107
167,480 258,fX2
105.365
968,760
I.020.171
941,532
333,900 190,176
1,864,486
O.C?
0.10
0.2:
0.01
c.20
0.18
0.02 0.1 1
1.20
0.:3
0.87
0.7i
0.35
0.50 0.15
0.23
0.89
0.22
0.; 1
0.04
0.08
0.08
0.07 0.1 1
0.04
0.07
0.06
0.23
1.03
0.17
0.26
0.10
0.94
1.02
0.94
0.33 0.20
1.86
BOWW 2003.8 64 4.718707% 25/03/2033
Boams 2003-G 84 4.276065% 25/06/2033 Bsabs 2003-Ac7 M2 6.465% ?5/01/203L Bsabs 2004-Ac6 M2 6.065% 25/11 /2034
Bsarni 2003 8 B4 4 844% 75/01/2034
Bvmbs 2004-2 81 5 965% 25/02/2035
Cbass 2005-Cbl M3 5 695% 25/0 1 /2035
Cbcl 11A D 7.69063”. 15/09/2039
Cbcl5A D2 7 469% 22/09/2036
Cfah 2003-3 2M2 6.71% 25/1-/2032
Cfah 2003-5 1 B 5.85% 25;02/2032
Cfab 2004-1 2M2 5 745% 25/07/2033
Cflat 2004-Aql M2 6.065% 25/05/2034 Cmlti 2003-He3 M1 6.465% 2% 2/2033 Cmlti 2004-Res1 M6 6 215% 25/1 i/2034 Crnlti 2005-3 1 B1 6.782539% 25/08/7035
Crnlti 2005-3 182 6.782539% 25/08;2035
Cmlti 7005-Opt1 M6 5.625% 25/02/2035
Cnfhe 20C7-A M2 6.98625% 15/04/2032 Csfb 2007-Ar31 Cb3 6.4773% 25/11/2032
Csfb 7003-Ar12 Cb3 6.0438?h 25/04/2033
Csfh 2003-Ar 15 Cb4 1.986% 25/06/2033 Cstb 2003 Ar20 CL? 4.7928% 25/08/2033
Csfh 2003-Ar5 Cbl 5 9042% 25/01 /2033 Csfb 2006-Ar4 5M2 6.26556 25/05/2034 Cwalt 2OOA-J13 B 6.53313% 25/02/2035 Cwalt 2004-J4 B 5.93213646 25/06/2034 Cwalt 2004-J9 B 6.633134: 25/10/2034
Cwalt 2005-24 1 M 5.978% 20/07/2035 Cwalt 2005.59 R i 5.94875% 20/11/2035
Cwak ?005-62 MG 6.065% 25/l ?E035
CWII 2004-16 E1 5.915% 25/09/2034
Cwhl7005-11 3M1 5.515% 25/03/2035
3.112.065
1.406.755
703,377
3,000,000
212,024
583,681
715,725
365.778 939.455
1.634.599
840.000
684.000
3,971.060
1,160,797
1.066.741
630.749
1,092,797
1,500,000
566,8ia
1.01 9,255
470.478
2.000.000
743.768
224,213
1.028.644
779.485
571,926
21 1,890
35,921
960,000
1,019,180
399,115
1.41 2,570
6,896,082
3,964,597
3.51 1,860
809,215
655,090
296,l 22
148,061
286.200
124,034
175,104
150,660
76.996 281,837
155.941
80, I 36 51,300
1,968,852
244,341
101.767
132.773
230,034
906,900
11 9,315
61 6,242
99,036
665.1 22
156.563
112,106
21 6.529
68.51 7
54.562
194,176
1,796
91,584
97,230
38.076 854,040
902,697
479,716
739,246
489,251
0.65 0.29
0.15
0.28
0.1 2
0.17
0.15
0.08
0.28 0.16
0.0u 0.05 1.96
0.24
0.10 0.13
0.23
0.90
0.12
0.61
0.10
0.66
0.16
0.1 1
0.22
0.07
0.05
0.19
0.00
0.09
0.10
0.04
0.85
0.90
0.48
0.74
0.49
The accompanying notes form an integral part of these financial statements
237
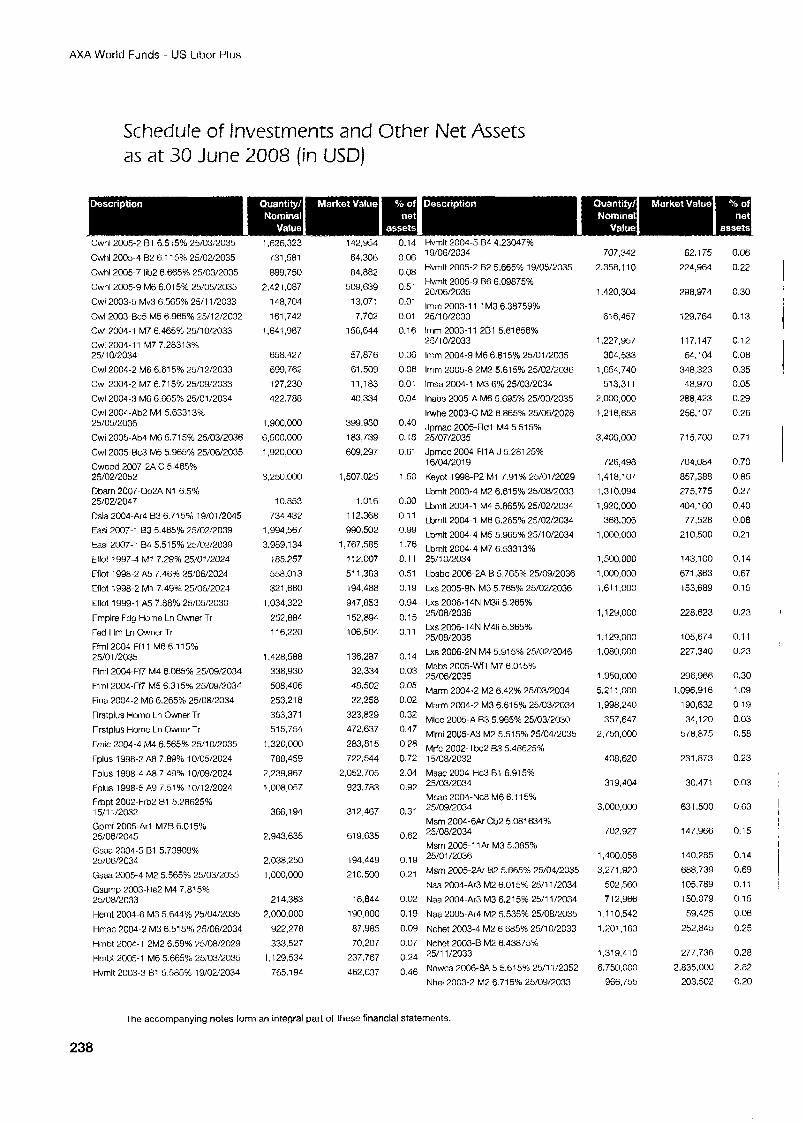
AXA World Funds - US Libor Plus
Schedule of Investments and Other Net Assets as at 30 June 2008 (in USD)
Cwhl 2005-2 E l 6.515% 25/03:2035
Cwhl 2005-4 82 6.1 15% 25/02/2035
Cwhl 2005-7 lib2 6.665% 25/C3/2035
Cwhl 2005-9 M6 6.015% 25/05/2035
Cwl2003-5 Mv3 6.565% 25/11/2033
Cwl 2003-Bc5 M5 6.965% 25/12/2032
Cwl7004-1 M7 6.465% 25/10/2033 Cwl2004-11 M7 7.2831 3% 25/10/2034 Cwl2004-2 ME 6.61 5% 25/12/2033
Cwl2004-2 M7 6.71 5% 25/09/2033
Cwl2004-3 M6 6.665% 25/01/2034 Cwl2004-Ab2 M4 5.63313% 25/05/2036
Cwl2005-Ab4 M6 5.715% 25/03/2036
Cwl2005-Bc3 M5 5.965% 25/06/2035
25/02/2052 Dbarn 2007-0o2A N1 6.5% 25/02/2047
Dsla 2004-Ar4 83 6.715% 19/01/2045
Easi 2007-1 A3 5.465% 25/02/2039
Easi 2007-1 84 5.515% 25/02/2039
Eflot 1997-4 M I 7.29% 25/01/2024
Eflot 1998-2 A5 7.46% 25/06/2024
Eflot 1998-2 M1 7.49% 25/06/2024
C w o d 2007-2A C 5.465%
Eflot 1999-1 A5 7.88% 25/05/2030
Frnpire Fdg Home Ln Owner Tr
Fed Hm Ln Owner Tr Ffrnl2004-Ffll M66.1159; 25/01/2035 Ffrril 2004-Ff7 M4 6.065% 25/09/2034
Ffml2004-Ff7 M5 6.315% 25/09/2034
Fina 2004-2 M6 6.265% 25/08/2034
Firstplus Home Ln Owner Tr
Firstplus Home I n Owner Tr
rrriic 2004-4 M4 6.565% 25/10/2035
Fplus 1998-2 A8 7.89% 10/05/2024
Fplus 1998-4 A8 7.49% 10/09/2074
Fplus 1998-5A9 7.51% 10/12/2024 Frbpt 2002-Frb2 B1 5.78625% 15/11/2032 Gprnf 1005-Arl M7B 6.01 5% 25/06/2045 Gsaa 2004-5 B1 5.73909% 25/06/2034
Gsaa 2005-4 M2 5.565% 25/03/2035
Gsarnp 2003-He2 M4 7.815% 25/08/2033
Hemt 2004-6 M3 5.644% 75/04/2035
Hmac 2004-2 M3 6.5154: 25/06/2034
Hmbt 2004-1 2M2 6.59% 75/08/2029
Hnht 2005-1 M6 5.665% 25:03/2035
Iivmlt 20033 H1 5.585% 19/02/2034
1,626,323
731.581
889.750
2.421.087
148,704 161,742
1,641,967
658.427
699,762 127,230
422.788
1,900,000 6,50C,OOO
1,920,000
3.250.000
10,853
734.432 1,994,567
3,989,134
185.257
558,013 321,680
1,034,322
252,884 116,220
1,428.588 338,930
508.406
253.21 8 353,371 515,754
1,320,000
788,459
2,239,967
1,008,057
3W,194
2,943,635
2,038,250 1,000,000
214,383
2,000,000
922.278
333,527 1,129,534
765.194
142,954
64,306
84.882
509,639
13,071
7,702 156,644
57,876
61,509
11,183
40,334
399,950
183,739
609,297
1,507,025
1,016
112.368 990,502
1,767,585
1 12.007
51 1.363 194,488
947.853
152,894
106,504
136.287
32.334
48.502
22.258
323.829
472,637
283,815
722.544
2,052.705
923,783
312,467
619,635
194,449
210.500
18,844
87,985
190:800
70,207
237.767
462.637
0.14 Hvmlt 2004-5 84 4.23047% o.06 19/06/2034
0.08 Hvnllt 2005-2 82 5.665% 19/05/2035
o,51 Hvmlt 2005-9 B6 6.09875% 20/06/2035
0'01 lrnrn 2003-1 1 1 M3 6.38759% 0.01 25/10/2033
0.16 Irnrn 2003-11 281 5.61656% 231 0/2033
0.06 Imm 2004-9 M6 6.815% 25/01/2035
0.06 Imm 2005-8 2M2 5.61 5% 25/02/2036 0.01 lmSd 2004-1 M3 6% 25/03/2034
0.04 lnabs 2005-A M6 5.695% 25/03/2035
lwhe 2003-C M2 6.865% 25/06/2028
0'40 Jpmac 2005-Fldl M4 5.515% 0.18 25/07/2035 0.61 Jprncc 2004-F11A J 5.28125%
16/04/2019
1.50 Keyot 1998-P2 M I 7.91 % 25/01/2029
Lbrnlt 2003-4 M2 6.61 5% 25/08/2033
Lbmlt 2004-1 M4 5.865% 25/02/2034
Lbrnlt 2004-1 M6 6.265% 25/02/2034
Lbrnlt 2004-4 M5 5.965% 2511 012034 0'9g
.76 LbmA 2004-4 M7 6.53313% 0.11 25/10/2034
0.51
0.19
LbSbC 2006-2A B 5.765% 25/09/2036
LXS 2005-9N M3 5.765% 25/02/2036 0.94 Ixs 2006..141\1 M31i 5.265%
,5 25/08/2036 -. . - o.l Lxs 2006-14N M41i 5.365%
25/08/2036
o,14 o,03 Mabs 2005-M1 M7 6.015%
0.05 0'02
0'32
0.47
o.28 Mrfc 2002-Thc2 83 5.48625% 0.72 15/08/2032 2.04 Msac 2004 Hc3 E l 6.915% o,92 25/03/2034
Msac 2004-Nc8 M6 6.1 15% o,31 25/09/2034
Msm 2004-6Ar Ch2 5.081634% o,62 25/08/2034
Msm 2005-1 1Ar M3 5.385% o,19 25/01/2036
o.21 Msm 2005-2Ar B2 5.665% 25/04/2035
Naa 2004-Ar3 M2 6.015% 25/11/2034 0.02 Naa 2004-Ar3 M3 6.215% 2511 112034
0.19 Naa 2005-Ar4 M2 5.535% 25/08/2035
0.09 Nchet 2003-4 M2 6.685% 25/10/2033
0.07 Nchct 2003-8 M2 6.43875% 0.24 25/11/2033
o.46
Lxs 2006-2N M4 5.915% 25/02/2046
25/06/2035 Mam 2004.2 M2 6.42% 25/03/2034
Mam 2M34-2 M3 6.615% 25/03/2034
Mlcc 2005-A R3 5.965% 25/03/2030
Mlmi 2005-A3 M2 5.515% 25/04/2035
Ncwca 2006-8A 5 5.615% 25/11/2052
Nhel2003-2 M2 6.715% 25/09/2033
707,342
2,358,110
1,420,304
616.457
1.227.957
304,533 1,654,740
513.31 1 2,000,000
1,216,658
3 .400 .m
726,498
1,418.1 07
1,310,094
1,920,000
368.306
1 .000.000
1.500.000 1,000,000
1.61 1,000
1,129,000
1,129,000
1 .oao.ooo
1.950.000
5.21 1,000
1,998,240
357,647
2.750.000
408,620
319,aon
3,000,000
702,927
1,100,056
3,271,970
502,560 712.966
1,110,542
1.201.163
1.319.410
6.750.000 966,755
62.1 75
224,964
298,974
129,764
11 7.1 47
64,104
348,323 48.970
288,423
256,107
715,700
704.084
857,388
275.775
404,160 77.528
21 0,500
143,100 671,363
153.689
228,623
105,674
227,340
296,966
1,096,916
190,632
31,120
570.875
231.873
30.471
631,500
147.966
140,285
688.739
105,789 150.079
59,425
252,845
277,736
2,835,000 203,507
0.06
0.22
0.30
0.1 3
0.12
0.06
0.35 0.05
0.29
0.26
0.71
0.70
0.85 0.27
0.40
0.08 0.21
0.1 4
0.67
0.15
0.23
0.1 1
0.23
0.30
1.09
0.19
0.03
0.58
0.23
0.03
0.63
0.1 5
0.1 4
0.69
0.1 1
0.15 0.06
0.25
0.28
2.82 0.20
I
I 1 ,
I
I I I
I
i
The accompanying notes form an integral part of these financial statements.
238
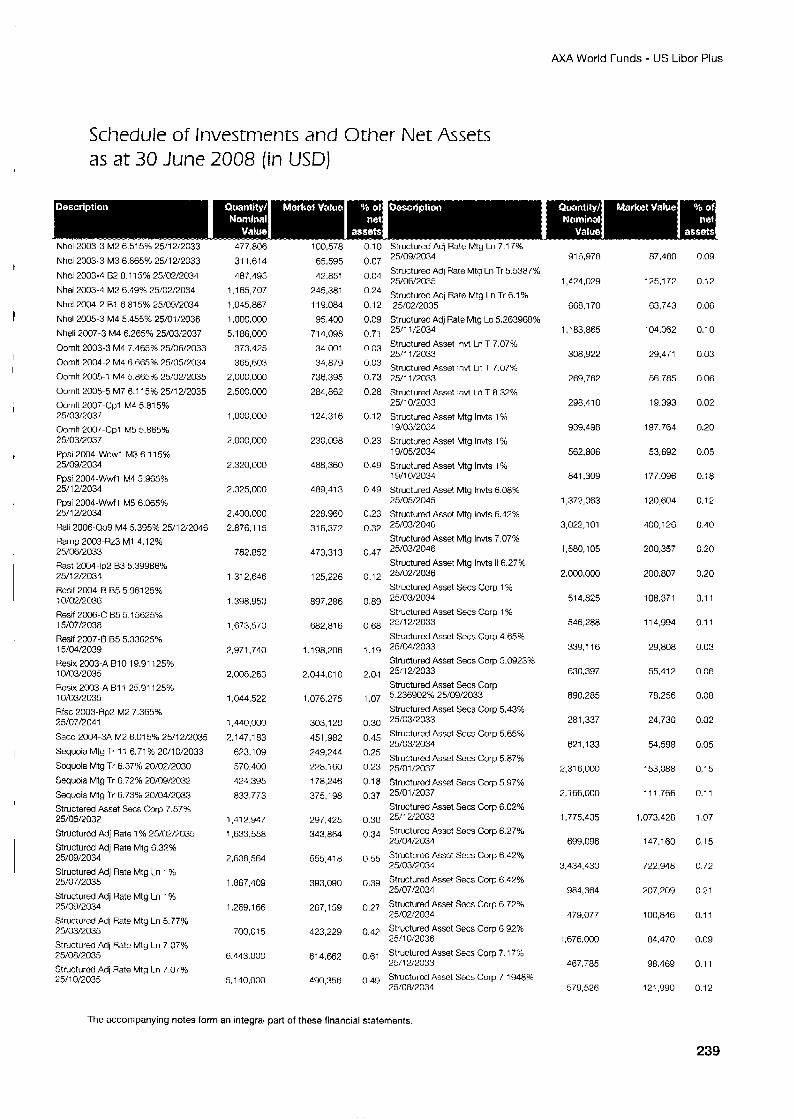
AXA World Funds - U S Libor Plus
Schedule of Investments and Other Net Assets as at 30 June 2008 (in USD)
Nhcl2003-3 M2 6 515% 25/12/2033 477,806 0.1 0 Structured Adi Rate Mto Ln 7.1 7%
NhCl2003.3 M3 6.865% 25/12/2033
NhCl2003-4 82 8.1 15% 25/02/2034
Nhel2003-4 M2 6.49% 25/02/2034 Nhel2004-2 E1 6.815% 25/09/2034
NhQl2005-3 M4 5.455% 25/01/2036
Nheli 2007-3 M4 6.265% 25/03/2037
Oomlt 2003-3 M4 7.465% 25/06/2033
OomR 2004-2 M4 6.665% 25/05/2034
Oomk 2005-1 M4 5.865% 25/02/2035
Oomlt 2005-5 M7 6.1 15% 25/12/2035 Oomlt 2007-Cpl M4 5.81 5% 25/03/2037 OomA 2007-Cpl M5 5.865% 25/03/2037 Ppsi 2004-Wcwl M3 6.115% 25/09/2034 Ppsi 2004-Wwfl M4 5.965% 25/12/2034 Ppsi 2004-Wwfl M5 6.065% 25/12/2034
Rali 7006-009 M4 5.395% 25/12/2046 Ramp 2003-Hz3 M1 4.12% 25/06/2033 Rast 2004-lp2 83 5.39986% 25/12/2034 Resif 2004-E3 B5 5.961 25% 10/02/?036 Resif 2006-C I35 5.15625% 15/07/2038 Resif 2007-8 B5 5.33625% 15/04/2039 Resix 2003-A BIO 19.91 125% 10/03/2035 Resix 2003-A B11 25.91 125% 10/03/2035
25/07/2041 RfSC 2003-Hp2 M2 7.365%
Sac0 2004-3A M2 6.01 5% 25/12/2035
Sequoia Mtg Tr 11 6.71 % 20/10/2033
Soquoia Mtg Tr 6.37% 20/02/2030
Sequoia Mtg Tr 6.72% 20/09/2032
Sequoia Mtg f r 6.7396 20/04/2033 Structered Asset Secs Corp 7.57% 25/05/2032 Structurcd Ad; Rate 1% 25/02/7035 Structurcd Ad] Rate Mtg 6.32% 25/09/2034 Structured Adj Rate Mtg Ln 1% 25/07/2035
Structured Adj Rate Mtg Ln 1% 25/09/2034 Structured Ad] Rate Mty Ln 5.77% 75/03/2035 Structurcd Ad; Rate Mty Ln 7.07% 25/08/2035 Structurocl Adj Rate Mtg Ln 7.07% 25/10/2035
31 1.61 4
487.495 1,165,707
1,045.867
1,000,000 5,186,000
373,425
365.603 2,000,000
2,5GU,OOO
1,000,000
2,000.0M)
2.320,OOO
2,325,000
2,400,000
2,876,115
782.852
1.31 2,646
1,398,950
1,673,570
7,971,740
2.008.263
1.044.522
1,440,000
7.147.1 83
623,109 570.400
424,395
833.773
1,412,967
1.633558
2,638,564
1,867.409
1.269.1 66
700.0?5
6,843 000
5,140,000
65.595
42.851
245.381
119.084
95,400
71 4.W8 34.001
34.879
736,395 284,862
124.31 6
230.098
488,360
489,413
228.960
31 6.372
473,313
125,226
897.286
682.816
1,198,206
2.044.010
1.076.275
303,120
451,982
249,244
278.160
i 78,246
375.198
297.425 343,864
555,418
393.090
267.159
423,229
61 4,662
440,356
0.07
0.04 0.24
0.12
0.09 0.71
0.03
0.03 0.73
0.28
0.19
0.23
0.49
0.49
0.23
0.32
0.47
0.12
0.89
0.68
1.19
2.04
1.07
0.30
0.45
0.25
0.23
0.18 0.37
0.30
0.34
0.55
0.39
0.27
0.47
0.61
0.49
25/09/2034
25/06/2035 Structured Ad] Rzte Mtg Ln Tr 5.5387%
Structured Ad; Ratc Mtg Ln Tr 6.1 % 25/02/2035
Structurod Ad; Rata Mtg Lo 5.263988% 2511 1/2034 Structured Asset lnvt Lr T 7.07% 25/11/2033 Structured Asset lnvt Ln T 7.07% 25/11 /2033 Structured Asset lnvt Ln T 8.32% 25/10/2033
Structured Asset Mtg lnvts 1% 19/03/2034 Structured Asset Mtg lnvts 1% 19/05/2034 Structured Asset Mtg lnvts 1 % 19/10/2034 Structured Asset Mtg lnvts 6.08% 25/05/2045 StructurMl Assct Mtg lnvts 6.42% 25/03/2016 Structurod Assat Mty lnvts 7.07% 25/03/2046 Structured Asset Mtg Invts li 6.27% 25/02/2036 Structured Asset Secs Corp 1% 25/03/2034 Structured Asset Secs Corp 1 % 25/12/2033 Structured Asset Secs Cocp 4.65% 25/04/2033 Structurd Asset Secs C o p 5.0923% 2 3 1 2/2033 Structured Asset Secs Corp 5.236902% 25/09/2033 Structured Asset Secs Corp 5.43% 25/03/2033 Structured Asset Secs Corp 5.65% 25/03/2034 Structured Asset Secs Corp 5.87% 25/01/2037 Structurod Asset Secs Corp 5.97% 25/01 /2037 Structured Asset Secs Corp 6.02% 25/12/2033 Structurcd Assct Socs Corp 6.27% 75/04/2034 Structurcd Assot Secs Corp 6.42% 25/03:2034 Structured Asset Secs Cop 6.42% 25/07/2034
Structured Asset Secs Corp 6.72% 75/02/2034 Structured Asset Sacs Corp 6 92% 75/10/2036 Structured Asset Secs Cocp 7.1 7% 25/12/2033 Structurcd Asset Secs Corp 7 1948% 75/08/2034
91 6,978
1,424,029
668,170
1.183.865
308,922
269,762
298,410
939.498
562.806
841,309
1,372,063
3,022,101
1,580,105
2.000.000
514.825
546.288
339.116
630.397
890.285
281,337
621,133
2.316.000
2.166.000
1.775.435
699.096
3,434,430
984,364
479.077
1.676.000
467,785
579.526
87,480
125,172
63,743
104,062
29.471
66.785
19,393
197,764
53,692
177,096
120,604
400,126
200,357
200.807
108.371
11 4,994
29,808
55,412
78.256
24,730
54.598
153,088
11 1.766
1.073.428
147.160
722,948
207,209
100,846
84.470
98.469
121,990
0.09
0.12
0.06
0.10
0.03
0.06
0.02
0.20
0.05
0.18
0.12
0.40
0.20
0.20
0.1 1
0.1 1
0.03
0.06
0.08
0.02
0.05
0.15
0.1 1
1.07
0.15
0.72
0.?1
0.1 1
0.09
0.1 1
0.1 2
The accompanying notes form an integral part of these financial statements.
239
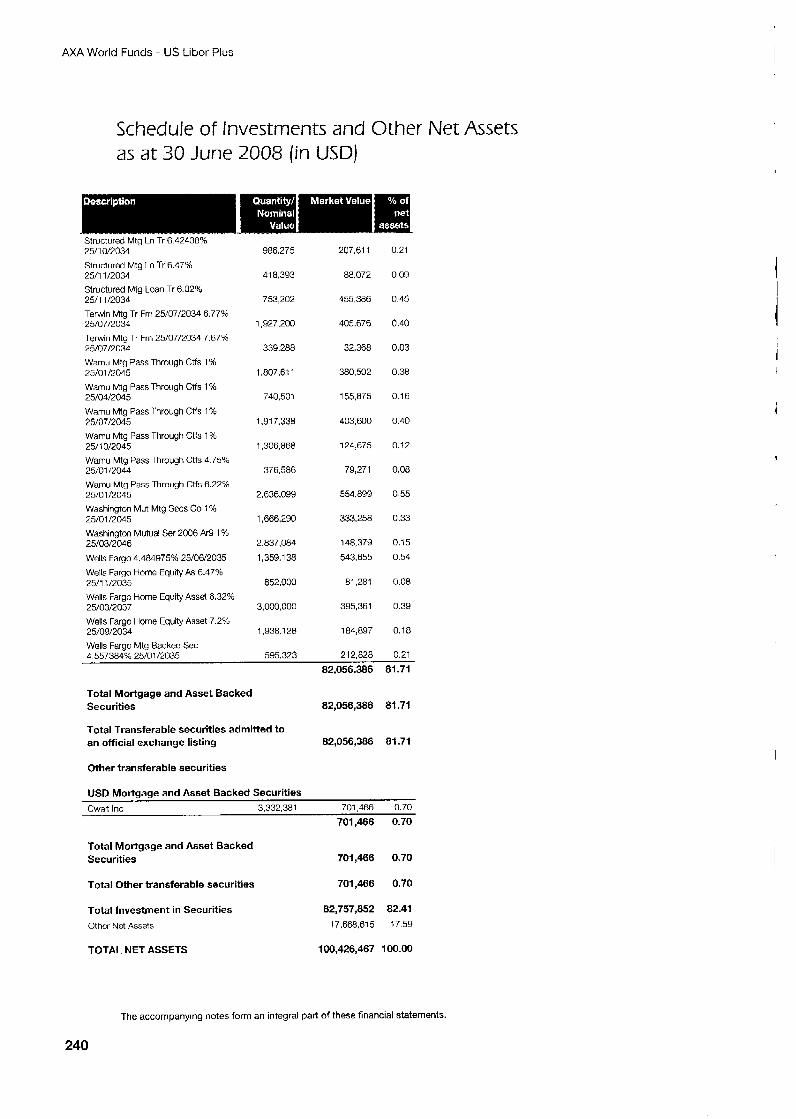
AXA World Funds - US Libor Plus
Schedule of Investments and Other Net Assets as at 30 June 2008 (in USD)
Structured Mtg Ln Tr 6.42438% 25/10/2034 Structured Mtg Ln ‘Tr 6.47% 25/11/2031 Structured Mtg Loan Tr 6.02% 25/11 /2034 Terwin Mtg Tr Frn 25/07/2034 6.77% 25/07/2034 Terwin Mtg Tr Frn 25/07/2034 7.67% 25/07/2034 Wamu Mtg Pass Through Ctfs 1 % 25/01/’2045 Wamu Mtg Pass Through Ctfs 1% 25/04/2045 Waniu Mtg Pass Through Ctfs 1% 25/07/2045 Wamu Mtg Pass Through Ctfs 1% 25/10/2045 Wamu Mtg Pass Through Ctfs 4 75% 25/01/2044 Wamu Mtg Pass Through Ctfs 6.22% 25/01/2045 Washington Mut Mtg Sccs Co 1 % 25/01/2045 Washington Mutual Ser 2006 Ar9 1 % 25/08/2046 Wells Fargo 4.484975% 2VOW2035 Wells Fargo Home Equity As 6.47% 25/11/2035 Wells Fargo Home Equity Asset 6.32% 25/03/2037 Wells Fargo Home Fqurty Asset 7 2% 25/09/2034 Wells Farqo Mtg Racked Sec 4 55738eA 25/01/2035 . . . , . - .
82,056,386 81.71
986.275
418,393
753,202
1,927,200
339,288
1.807.61 1
740.501
1.91 7.338
1.306.868
376,586
2.636.099
1,666,290
2.837.084
1,359.138
852.000
3,000,000
1.938.128
5c15.973
207.61 1
88.072
455.386
405.676
32,368
380.502
155,875
403.600
124.675
79,271
554.899
333.258
148,379
543.655
81.281
395,36 1
184,897
21 2.828
0.21
0.09
0.45
0.40
0.03
0.38
0.16
0.40
0.12
0.08
0.55
0.33
0.15
0.54
0.08
0.39
0.18
0.21
Total Mortgage and Asset Backed Securities 82,056,388 81.71
Total Transferable securities admitted to an official exchange listing 82,0~,3a6 81.71
Other transferable securities
USD Mortgage and Asset Backed Securities Cwaii Inr 3.332.381 701.466 0.70
Total Mortgage and Asset Backed Securities
Total Other transferable securities
Total Investment in Securities Other Net Assets
TOTAL NET ASSETS
701.466 0.70
701,466 0.70
701,466 0.70
82,757,852 82.41 17,668,615 17.59
1 oO,426,467 100.00
The accompanying notes form an integral part of these financial statements.
240
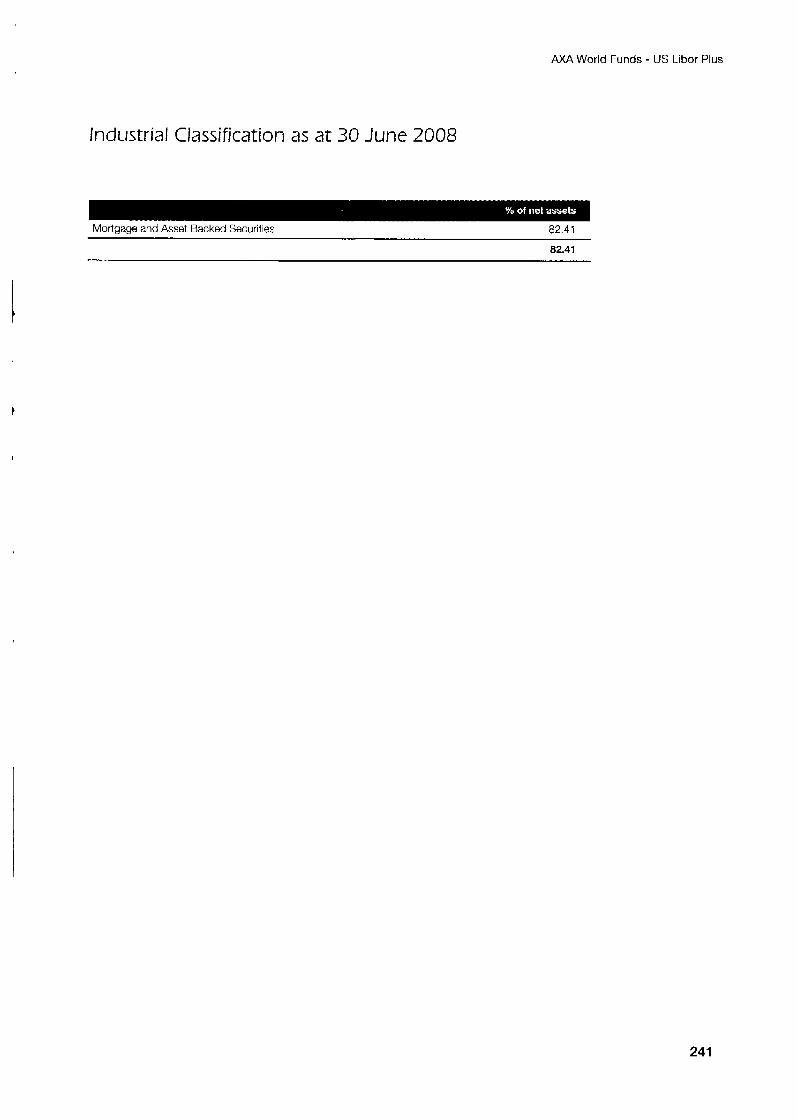
Mortgage and Asset Backed Securities 82.41
82.41
A M World Funds - U S Libor Plus
Industrial Classification as at 30 June 2008
241
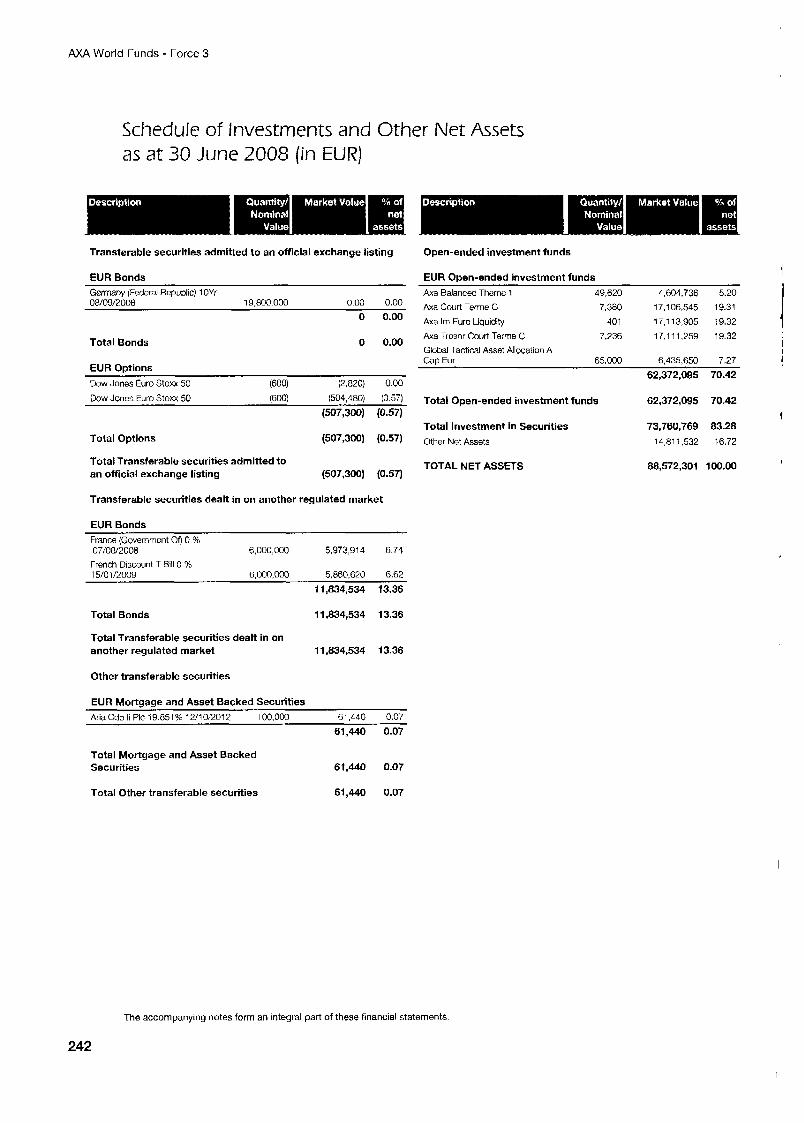
AXA World Funds - Force 3
Schedule of Investments and Other Net Assets as at 30 June 2008 (in EUR)
Transferable securities admitted to an official exchange listing
EUR Bonds Gcrmarty (Federal Republic) 1 OYr 08/09/7008 19,800 000 000 0.00
0 0.00
Total Bonds 0 0.00
EUR Options Dow Jones Euro Stoxx 50 (600) (2,820) 0.00
(507,300) (0.57)
Total Options (507,300) (0.57)
Total Transferable securities admitted to an official exchange listing (507,300) (0.57)
Transferable securities dealt in on another regulated market
EUR Bonds
Dow Jones Euro Stoxx 50 (600) (504,480) (0.57)
France (Government Of) 0 % 07/08/2008 6,000,000 5,973,914 6.74
French Discount T Bill 0 % 15/01/2M39 6.000.000 5.860.620 6.62
11,834,534 13.36
Total Bonds 1 1 ,834,534 13.36
Total Transferable securities dealt in on another regulated market 11,834,534 13.36
Other transferable securities
EUR Mortaaae and Asset Backed Securities AriaCdo li PIC 19.851% 12/10;2Oi2 100,000 61,440 0.07
61,440 0.07
Total Mortgage and Asset Backed Securities 61,440 0.07
Open-ended investment funds
EUR Open-ended investment funds h a Balanced Thomc 1 49,620 4,604,736 5.20 Axa Court Terme C 7,380 17,106,545 19.31
h a Im Euro Liquidity 401 17,113,905 19.32
h a Tresor Court Terrne C 7.236 17,111,259 19.32 Global Tactical Asset Allocation A Cao Eur 65.000 6.435.650 7.27
62,372,095 70.42
Total Open-ended investment funds 62,372,095 70.42
73,760,769 83.28 Total Investment in Securities Other Net Assets 14,811,532 16.72
TOTAL NET ASSETS 88,572,301 100.00
Total Other transferable securities 61,440 0.07
The accompanying notes form an integral part of these financial statements
242
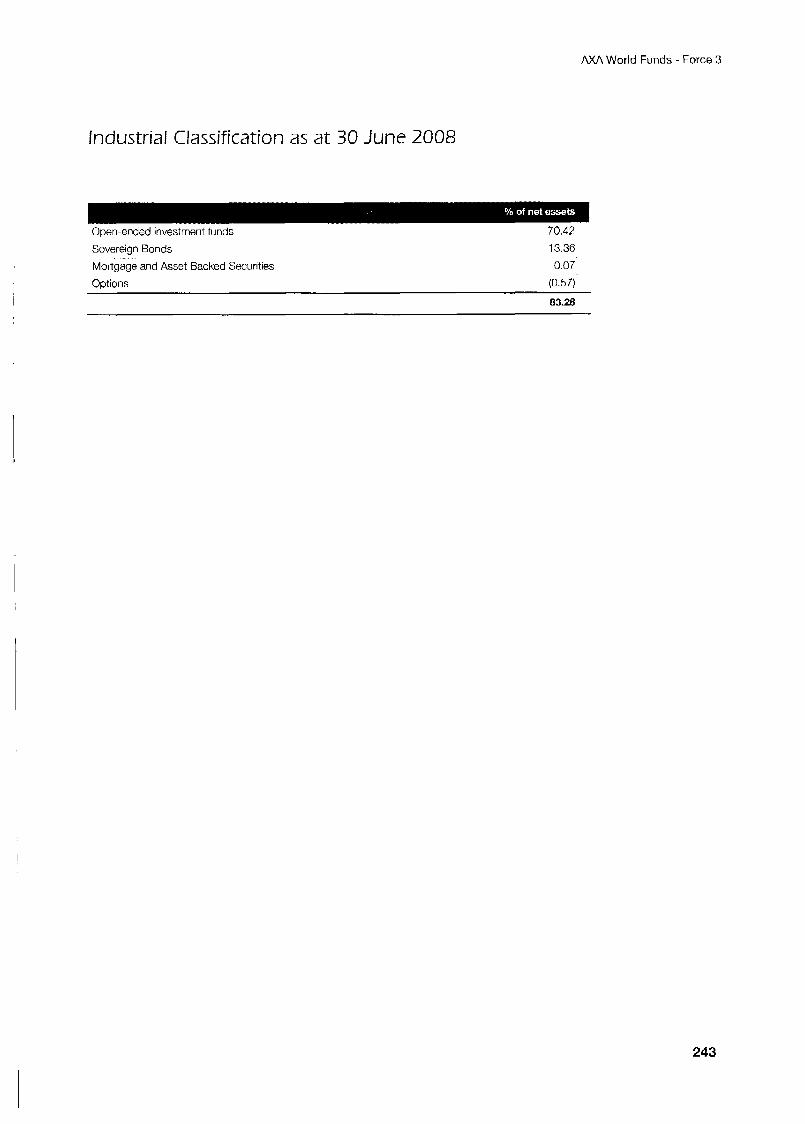
A M World Funds - Force 3
Industrial Classification as at 30 June 2008
Open-ended investment funds 70.42 Sovereign Bonds 13.36
Mortgage and Asset Backed Securities 0.07 Optlons (0.57)
83.28
243
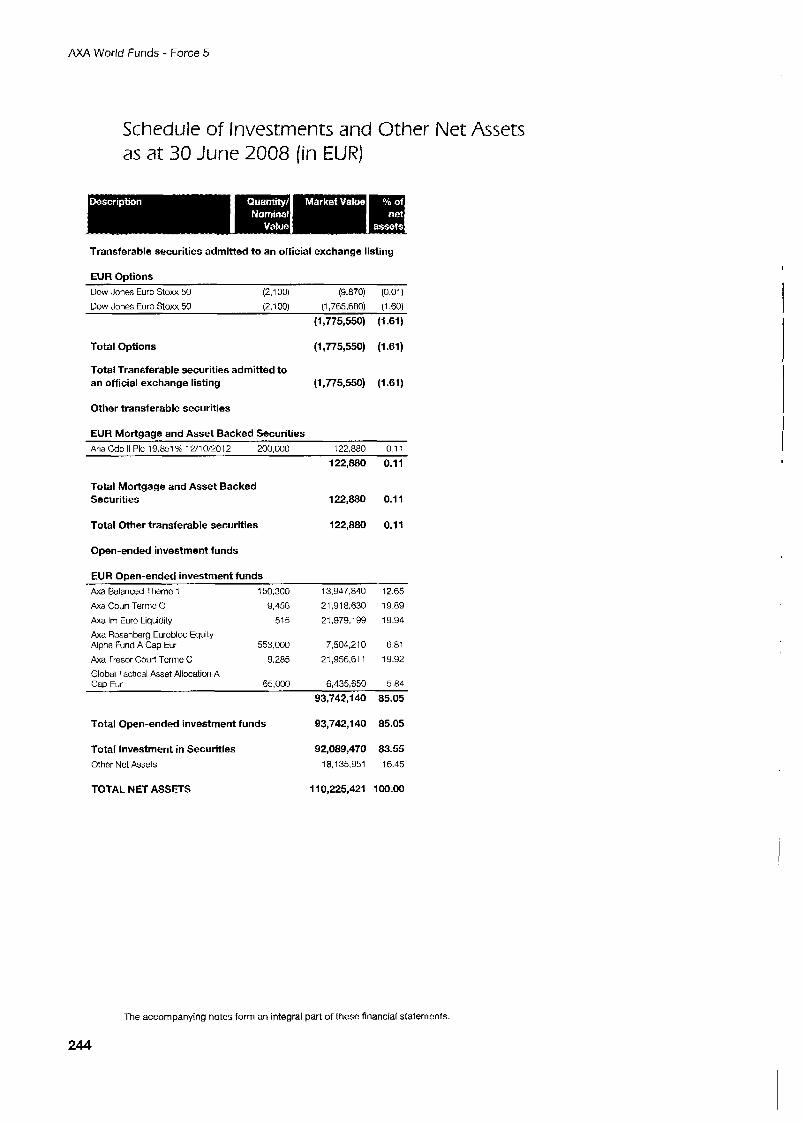
AXA World Funds - Force 5
Schedule of Investments and Other Net Assets as at 30 June 2008 (in EUR)
Transferable securities admitted to an official exchange listing
EUR Options Dow Jones Euro Stoxx 50 (2,100) (9,870) (0.01)
Dow Jones Euro Stoxx 50 (2.1 00) (1,765,680) (1.60)
(1,775,550) (1.61)
Total Options (1,775,550) (I .el)
Total Transferable securities admitted to an official exchange listing (1,775,550) (I .el)
Other transferable securities
EUR Mortgage and Asset Backed Securities Aria Cdo Ii PIC 19.651% 12/10/2012 200,000 122.880 0.11
122,880 0.11
Total Mortgage and Asset Backed Securities 122,880 0.11
Total Other transferable securities 122,880 0.11
Open-ended investment funds
EUR Open-ended investment funds Axa Balanced T h e m 1 150,300 13,947,640 12.65
Axa Court Termc C 9,456 21.918.630 19.89
Axa Im Euro Liquidity 515 21.979.199 19.94
Axa Rosenberg Eurobloc Equity Alpha Fund A Cap Eur 553,000 7,504,210 6.81
Axa Tresor Court Tcme C 9,285 21,956,611 19.92 Global Tactical Asset Allocation A Cap Eur 65,CQO 6,435,650 5.84
93,742,140 85.05
Total Open-ended investment funds 93,742,140 85.05
Total Investment in Securities Other Nct Assets
92,089,470 83.55 18.1 35.851 16.45
TOTAL NET ASSETS 110,225,421 100.00
The accompanying notes form an integral part of these financial statements.
244

M A World Funds - Force 5
Industrial Classification as at 30 June 2008
Open-ended investrnent funds 85.05
0.1 1
Options (I .61)
83.55
Mortgage and Asset Backed Securities
245
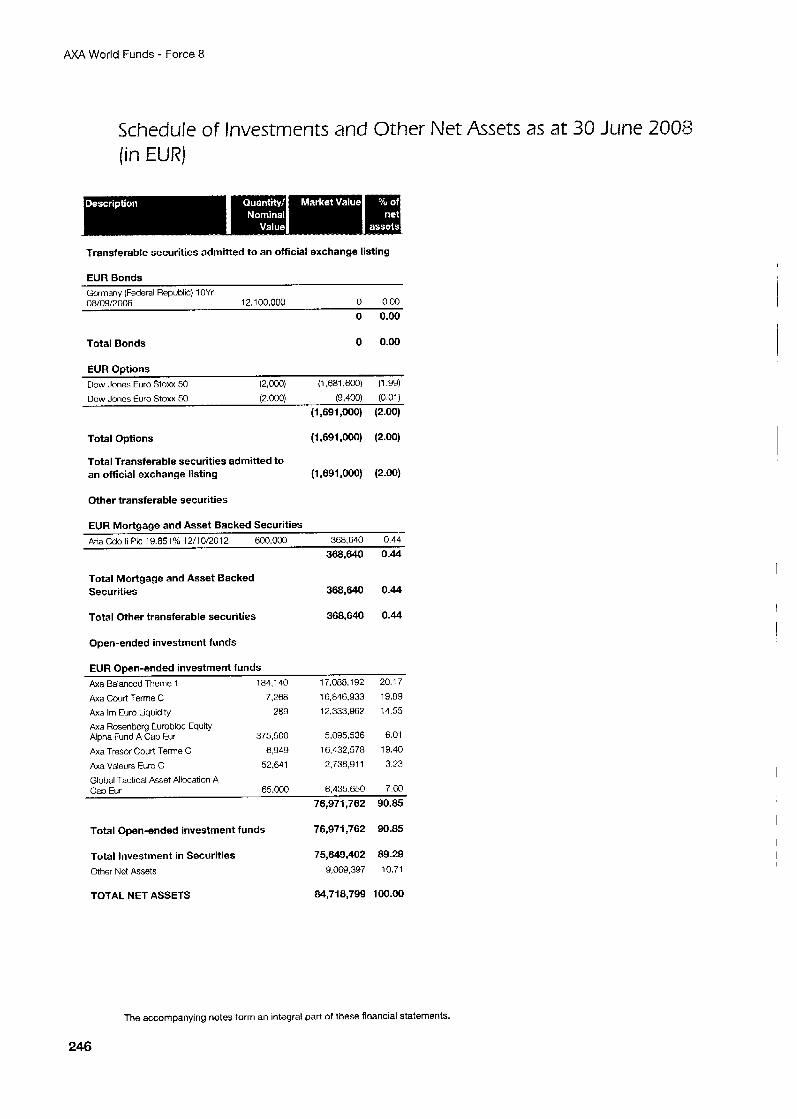
AXA World Funds - Force 8
Schedule of Investments and Other Net Assets as at 30 June 2008 (in EUR)
Transferable securities admitted to an official exchange listing
EUR Bonds
08/09/2006 12.1 00,000 0 0.00 0 0.00
Germany (Federal Republic) 1 OYr
Total Bonds 0 0.00
EUR Options Dow Jones Euro Stoxx 50 (2,000) (1,681,600) (1.99)
Dow Joncs Euro Stoxx 50 (2.000) (9,400) (0.01)
(I ,691,000) (2.00)
Total Options (1,691 ,OOO) (2.00)
Total Transferable securities admitted to an official exchange listing (1,691,000) (2.00)
Other transferable securities
EUR Mortgage and Asset Backed Securities AriaCdo li PIC 19.851% 12/10/2012 600,000 368.640 0.44
368,640 0.44
Total Mortgage and Asset Backed Securities 368,640 0.44
Total Other transferable securities 368,640 0.44
Open-ended investment funds
EUR Open-ended investment funds h a Balanced Theme 1 184,140 17,068,192 20.17
Axa Court Terrne C Axa Im Euro Liquidlty
7,268 16,846,933 19.89
289 12,333,967 14.55
Axa Rosenbcrg Eurobloc Equity Alpha Fund A Cap Eur 375.500 5,095,536 6.01
Axa Tresor Court Terne C 6,949 16,432,578 19.40
Axa Valeurs Euro C 52.641 2,738,911 3.23
Global Tactical Asset Allocation A Cap Eur 65,000 6,435,650 7.60
76,971,762 90.85
Total Open-ended investment funds 76,971,762 90.85
Total Investment in Securities 75,649,402 89.29 Other Net Assets 9,069,397 10.71
TOTAL NET ASSETS 84,718,799 100.00
The accompanying notes form an integral part of these financial statements.
246
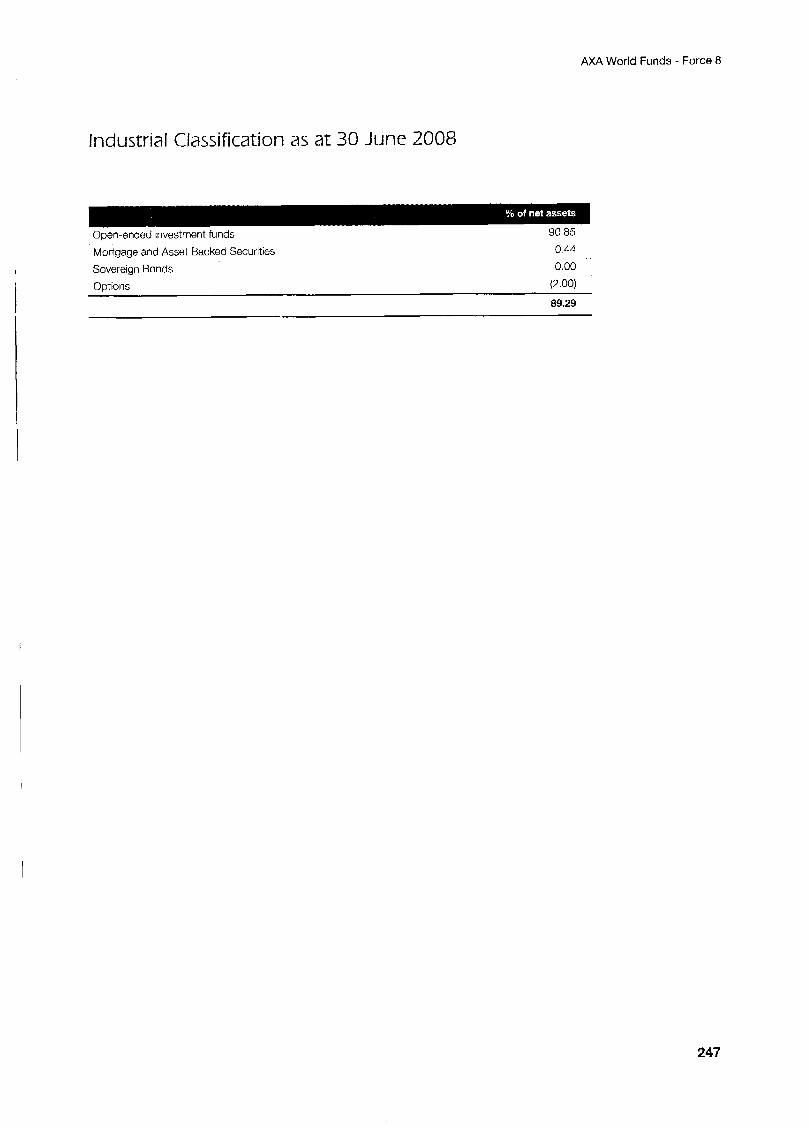
AXA World Funds - Force 8
Industrial Classification as at 30 June 2008
Open-ended investment funds 90 85
Mortgage and Asset Backed Securities Sovereign Bonds
0.44 0.00
Options (2.00)
89.29
I
247
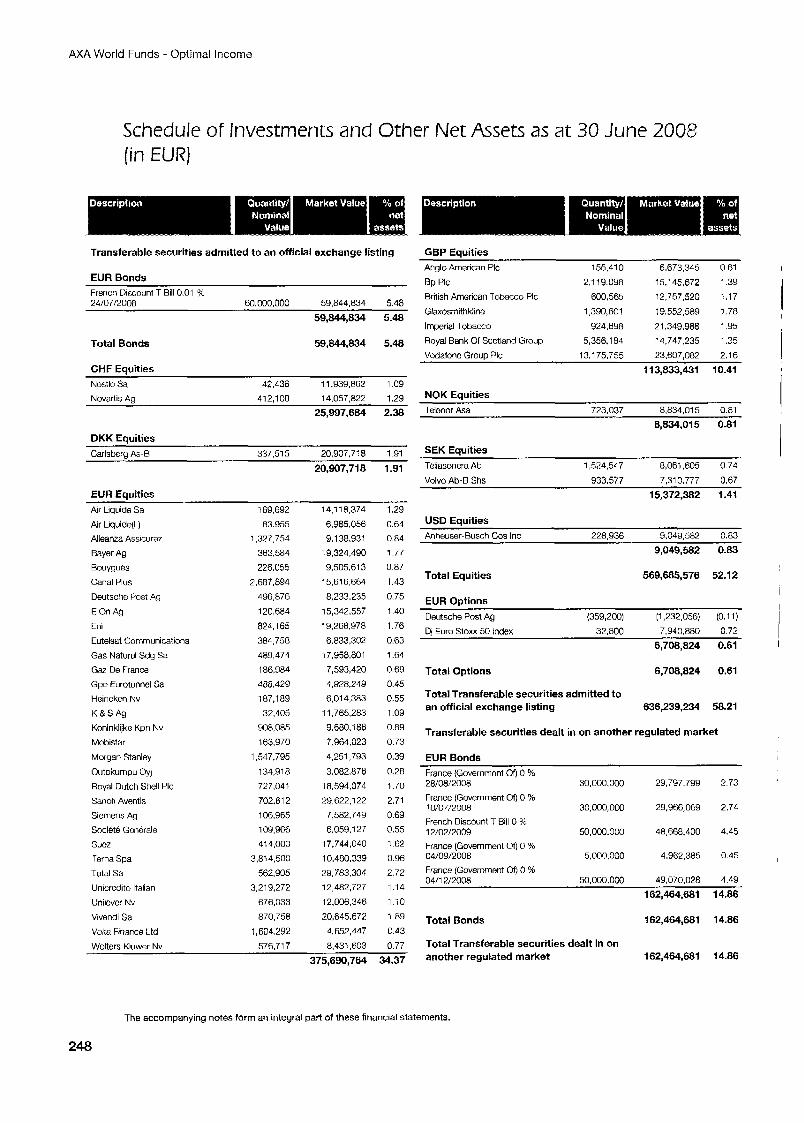
AXA World Funds - Optimal income
Schedule of Investments and Other Net Assets as a t 30 June 2008 (in EUR)
Transferable securities admitted to an official exchange listing
EUR Bonds French Discount T Bill 0.01 % 24/07/2008 60.000.000 59,844,834 5.48
59,844,834 5.48
Total Bonds 59,844,834 5.48
CHF Equities NQStlC Sa 42,436 11,939,862 1.09
Novartis A! 412,108 14,057.822 1.29
25,997,684 2.38
DKK Equities 20.907.7:8 1.91
20,907,718 1.91 Carlsbcrg As-B 337.515
EUR Equities Air Liquide Sa Air Liquide(L) Alleanza Assicuraz
Bayer Ag
Rouyyues Canal Plus
Deutschc Post Ag
E On Ag Cni
Cutelsat Communicztions
Gas Natural Sdg Sa
Gaz De France
Gpe Eurotunnel Sa
Hcinckm Nv
K & S A g Koninklijkc Kpn Nv
Mobistar
Morgan Stanley
Outokumpu Oyj Royal Dutch Shell PIC
Sanofi Aventis
Siemens Ay Societb Gcnerale
sucz
Terna Spa
Total Sa
Unicrcdito Italian
Unilcvcr Nv
Vivendi Sa Volta Finance Ltd
169,692
83.955
1,327,754 363,584
226.055
2,687,894
496,876
120,684
824.165
384,758 489,474
186.984
488,429 187,189
32,405
908,085
163,970
1,547.795
i34.9ia 727,041
702.61 2
106,965
109,966 414,000
3,814,500
562,905 3,219,272
676,033
870,758
1,604292
14.1 18,374
6.985056 9.1 38,931
19,324,490
9,505.61 3 15.616.664
8,233,235
15,342,557
19,268,978
6.833.302
17,958,801
7,593,420
4,928249
6,014,383 11,765,283
9.680.186
7,964,023
4,251,793
3,082,876
18594,074
29,622,122
7,582.749
6.059.1 27 17,744,040
10,480,339
29,783,304 12,482,727
12,006,346
20,645.E7%
4,652,447
1.29
0.64 0.84
1.77 0.87
1.43
0.75
1.40
1.76
0.63
1.64
0.69 0.45
0.55 1.09
0.89
0.73
0.39
0.28
1.70
2.71
0.69 0.55 1.62
0.96
2.72 1.14
l . i O 1 .89
0.43
0.77 8.431.603 Wolters Kliiwer Nv 576.71 7 ~. ~ .~~~
375,690,764 34.37
GBP Equities Anglo American PIC 155.41 0 6.673.345 0.61
Rp PIC 2,119.098 15.145.672 1.39
British Amorican Tobacco PIC 600,565 12,757,520 1.17
19,552,589 1.78 Glaxosmithklino
Imperial Tobacco 924,698 21.349.988 1.95
Royal Bank Of Scotland Group 5,356.1 84 '4,747,235 1.35
Vodafone Grouo PIC 13.175.755 23.607.082 2.16
1,390,601
113,833,431 10.41
NOK Equities Talenor Asa 723,037 8.834.015 0.81
8,834,015 0.81
SEK Equities Tollasonera Ab 1,524,547 8,061,605 0.74
VOIVO Ab-E ShS 933,577 7.310.777 0.67
15,372,382 1 A1
USD Equities Anheuser-Busch Cos Inc 228,936 9,049,582 0.83
9,049,582 0.83
Total Equities 569,685,576 52.12
EUR Options Deutsche Post Ay (359,200) (1,232,056) (0.1 1)
7.940.880 0.72 Di Euro Stoxx 50 Index 32.800
6,708,824 0.61
Total Options 6,708,824 0.61
Total Transferable securities admitted to an official exchange listing 636,239,234 58.21
Transferable securities dealt in on another regulated market
EUR Bonds France (Governmant Gf) 0 %
30,000,000 29,797,799 2.73 28/08/2008 France (Government or) 0 % 10/07/2008 30,0W,OOO 29,966,069 2.74 French Discount T Bill 0 96
48,668,400 4.45 12/02/2009 50,000,000
France (Government Or) 0 % 04/09/2008 5,000,000 4.962.385 0.45 France (Government of) 0 96 0411 2/2008 50.W0.000 49,070,028 4.49
162,464,681 14.86
Total Bonds 1 62,464,681 I 4.86
Total Transferable securities dealt in on another regulated market 162,464,681 14.86
The accompanying notes form an integral part of these financial statements.
24.8
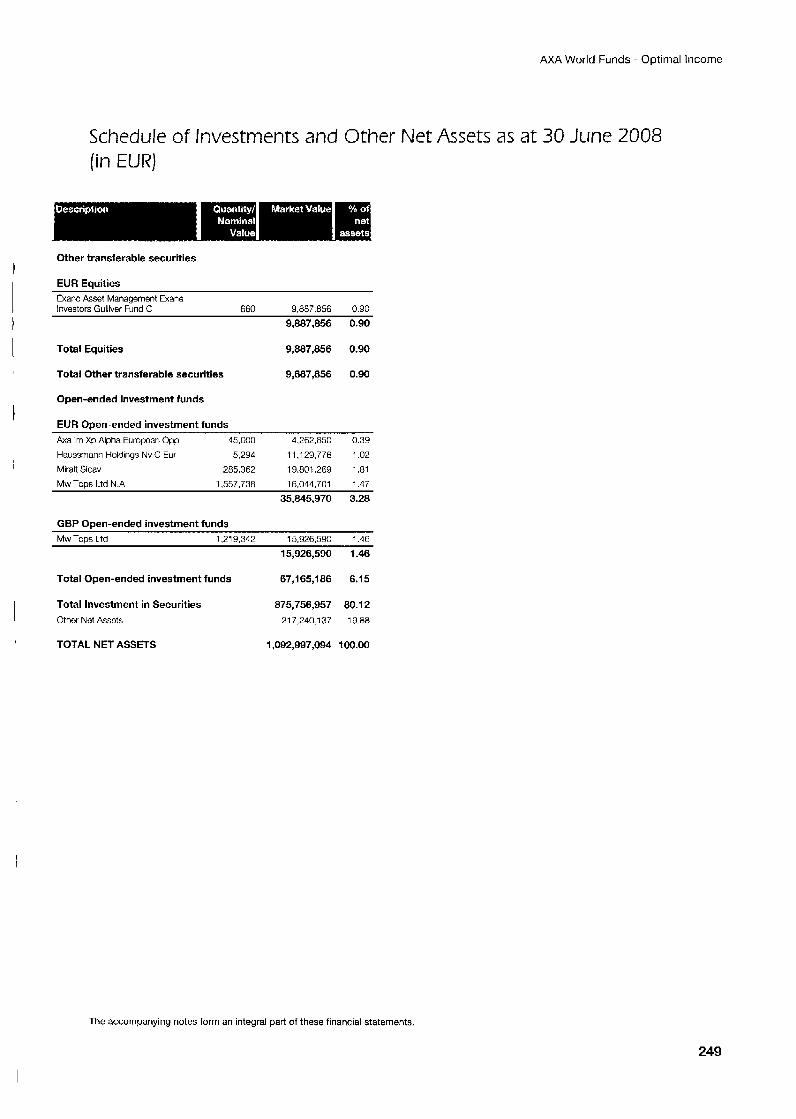
AXA World Funds - Optimal Income
Exanc Asset Management bane Investors Gulliver Fund C 660 9,887,856 0.90
Schedule of Investments and Other Net Assets as at 30 June 2008 (in EUR)
Other transferable securities 1 I EUR Eauities
Open-ended investment funds
EUR Open-ended investment funds Axa Im Xp Alpha Europcan Opp 45,000 4.262.850 0.39
Haussmann Holdings Nv C Eur 5,294 11,129,776 '.02 Miralt Sicav 285,362
Mw Tops I.td N.A 1557.738 16,044,701 '.47 35,845,970 3.28
I 19.801.26~ ~ .81
GBP Ooen-ended investment funds Mw Tops Ltd 1,219,342 15,926,590 : .4B
15,926,590 1.46
Total Open-ended investment funds 67,165,186 6.15
Total Investment in Securities 875,756,957 80.1 2 I Other Net Asscts 217,240.137 19.88
TOTAL NET ASSETS 1,092,997,094 100.00
The accompanying notes form an integral part of these financial statements.
249
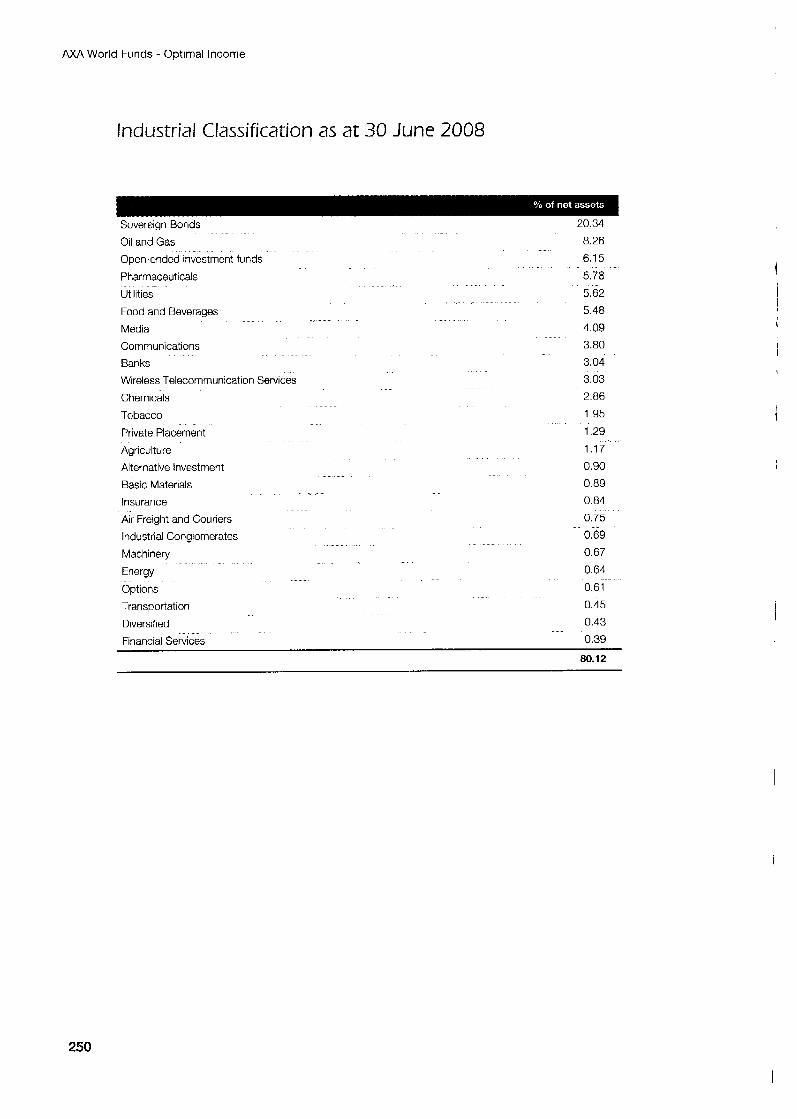
AXA World Funds - Optimal Income
Industrial Classification as at 30 June 2008
Sovereign Bonds
Oil and Gas Open-ended investment funds Pharmaceuticals Utilities-
Food and Beverages
Media
Communications
Banks
Wireless Telecommunication Services
Chemicals
Tobacco
Private Placement
Agriculture
Alternative Investment
Basic Materials
Insurance
Air Freight and Couriers
Industrial Conglomerates
Machinery
Energy
Options
Transportation
Diversified
20.34
8.26
6.15
5.78 5.62
5.48
4.09 3.80
3.04
3.03
2.86
1.95
1.29 1.17
0.90
1
0.89
0.84
0.75
0.69 0.67
0.64
0.61
0.45
0.43
Financial Services 0.39
80.12
250
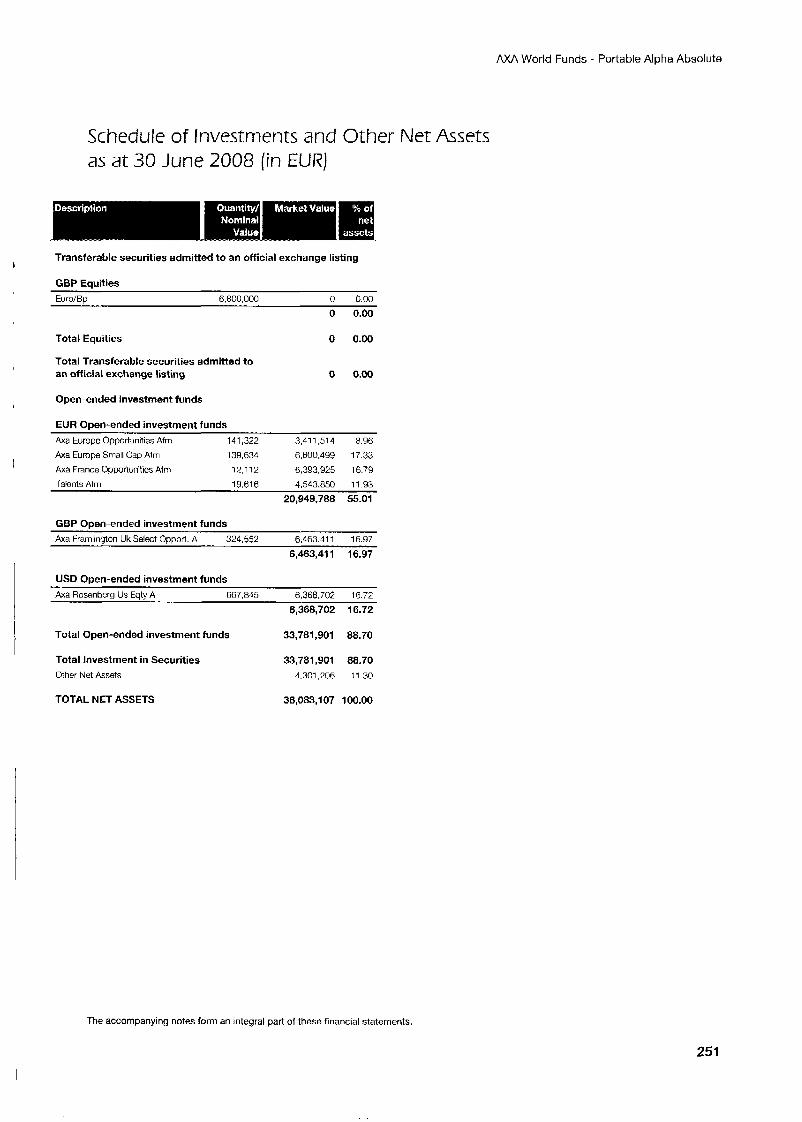
AXA World Funds - Portable Alpha Absolute
Schedule of Investments and Other Net Assets as at 30 June 2008 (in EUR)
Transferable securities admitted to an official exchange listing
GBP Equities
L
I Euro/Bp 6,800,000 0 0.00 0 0.00
Total Equities 0 0.00
Total Transferable securities admitted to an official exchange listing I 0 0.00
Open-ended investment funds
EUR Open-ended investment funds Axa Europe Opportunities Afrn 141,322 3.41 1,514 8.96
Axa Europe Small Cap Afm 139,634 6,600.499 17 33 h a France Opportunitics Afm 17,112 6,393,925 16 79
Talonts Afm 19.616 4.543.850 11 93
I
20,949,788 55.01
GBP Open-ended investment funds h a Framlington Uk Select Opport. A 324,552 6.463.41 1 16.97
6,463,411 16.97
USD Open-ended investment funds Axa Rosnnhera L I S F f h A 667 845
Total Open-ended investment funds 33,781,901 88.70
Total Investment in Securities Other Net Assets
33,781,901 88.70 4,301,706 11.30
TOTAL NET ASSETS 38,083,107 100.00
The accompanying notes form an integral part of these financial statements.
251
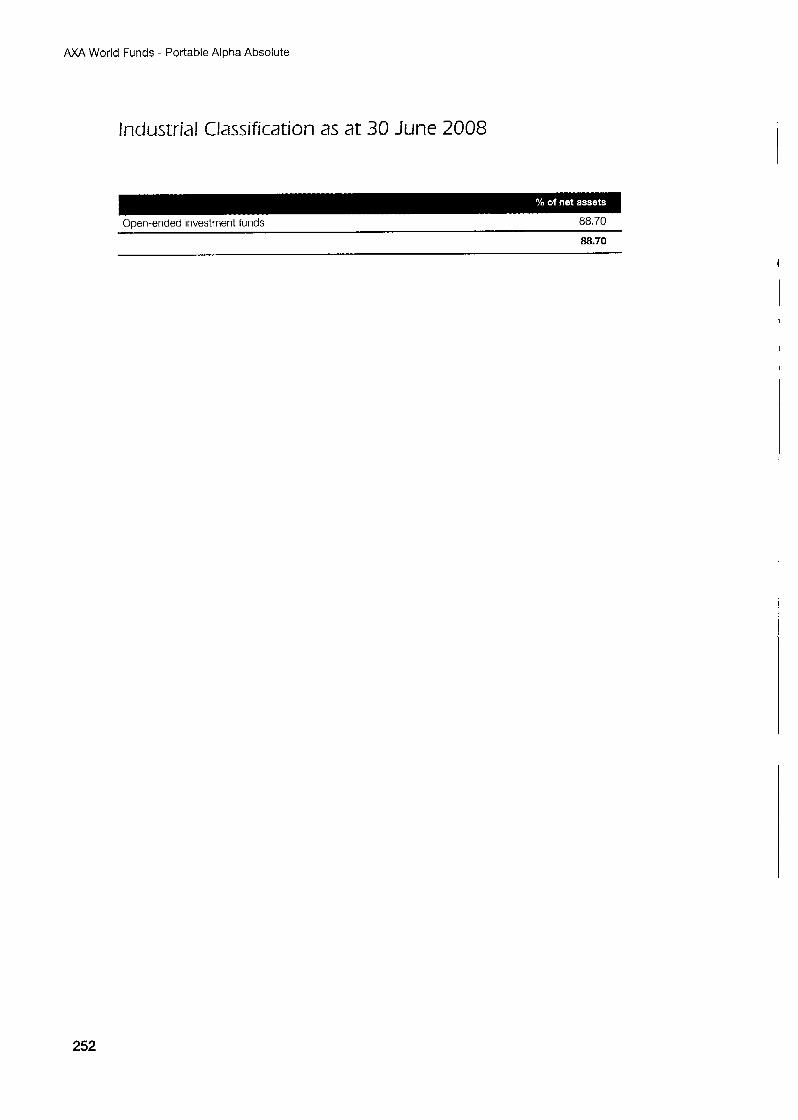
AXA World Funds - Portable Alpha Absolute
Industrial Classification as at 30 June 2008
. Open-ended investment funds 88.70
88.70
I
I
252
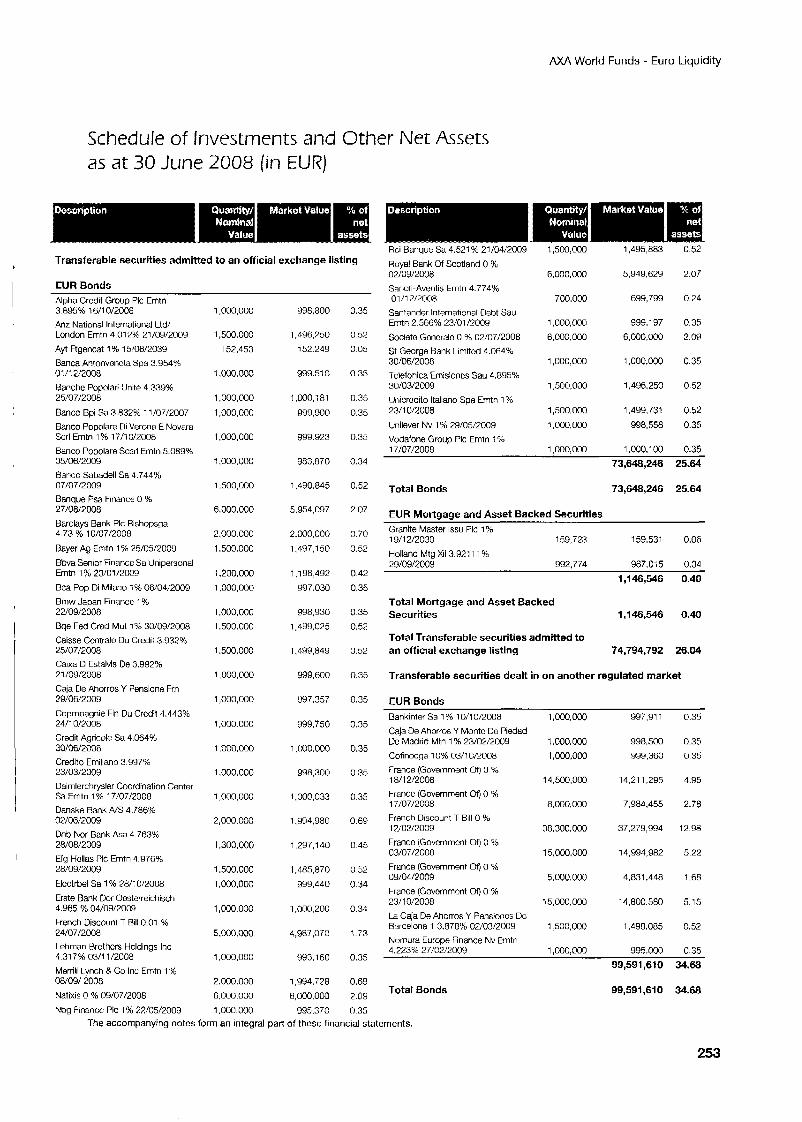
AXA World Funds - Euro Liquidity
Schedule of Investments and Other Net Assets as at 30 June 2008 (in EUR)
Transferable securities admitted to an official exchange listing
EUR Bonds Alpha Credit Group PIC Emtn 3.895% 16/10/2006 Anz National International Ltd/ London Emtn 4.012% 21/09/2009 Ayt Ftgencat 1 % 15/06/2039 Banca Antonvcncta Spa 3.954% 0111 212008 Ranche Popolari Unite 4.339% 25/07/2008
Banco Bpi Sa 3.832% 11/07/2007 Banco Popolare Di Verona E Novara Scrl Emtn 1 % 17/1 W2008
Banco Popolare Scad Emtn 5.089% 05/06/2009 Banco Sabadell Sa 4.744% 07/07/2009 Banque Psa Finance 0 % 27/08/7008 Barclays Bank PIC Bishopsga 4.73 % 10/07/2008
Rayer Ag Emtn 1 % 25/05/2009 Bbva Senior Finance Sa Uniporsonal Erntn 1% 23/01/2009 Bca Pop Di Milano 1 % OW04/2009 Brriw Japan Financc 1 % 22/09/2008 Bqe Fed Cred Mut 1% 30/09/2008 Caisse Ccntrale Du Credit 3.y3296 25/07/2008 Caixa 0 Cstalvis De 3.992% 21/09/2008 Caja De Ahorros Y Pensione Frn 29/06/2009 Coprnpagnie Fin Du Credit 4.443% 24/10/2008 Credit Agricole Sa 4.064% 30/06/2008 Credito Ernilkno 3.997% 23/03/2009 Daimlerchrysler CAordinatiorr Center Sa Emtn 1 % 17/07/2008 Danske Bank N S 4.786% CP/06/2009 Dnb Nor Bank Asa 4.763% 28/08/2009 Efg Hcllas PIC Erntn 4.976% 28/09/2009 Elccthel Sa 1% 28/’0/2008 Erste Bank Dcr Oosterreichisch 4.965 5% 04/09/2009 French Discount T Bill 0.01 % 24/07/2008 Lehrnan Hrothcrs Hcldings Inc 4.31 7% 03/11/2008 Merrill Lynch & Co Inc Emtn 1 % 08/09/ 2008 Natixis 0 96 09/07/2008
kbg Finance PIC 1 % 22/05/2009
1 ,oCQ.000
1,500,000
152,453
1 .ooo.o0o
1,000,000
1,000,000
1,000,000
7 .000,000
1,500,000
6,000,000
2.000.000 1.500.000
1.200.000
1,000,000
1,000,000 1.500.000
1,500,000
1,000,000
1,000,000
1,000.000
1 .m.m
1 ,ooo,coo
1,000,000
2,000,000
1,300,000
1,500,000 1,000,000
1,000,000
5,0Oo.(x10
1,000,000
2.000,ooo ~.O00,OOO 1 .000.000
998,800
1,496,750 152.249
939.510
l,D00.:81 999,900
999.923
983.870
1,490.845
5,954,097
2.000,000 1,497,150
1,198,492 ’397.030
998,930 1,499,075
1,499,849
S9.600
997,357
999,750
1 ,CUo.ooo
998,300
1,000,033
1.994.980
1,297,140
1,485,870 999,440
1.000.200
4,987,070
993,160
1,994,778 6,000,000
995,370
0.35
0.52 0.05
0.35
0.35
0.35
0.35
0.34
C.52
7.07
0.70 0.52
0.42
0.35
0.35
0.52
0.52
0.35
0.35
0.35
0.35
0.35
0.35
0.69
0.45
0 52
0.34
0.31
1 .73
0.35
0.69
2.09 0.35
Royal Bank Of Scotland 0 % 02/09/2008 6.000.000 5,949,629 2.07 Sanofi-Aventis Erntn 4.774% 01 11 212008 700.000 699,799 0.28 Santander International Debt Sau Emtn 2.566% 23/01/2009 1,000,000 999,197 0.35
Societe Gcncralc 0 % 02/07/2008 6,000,000 6,000,000 2.09 St George Bank Limitcd 4.064% 30/06/2008 1,000,000 1,000,000 0.35 Telefonica Emisioncs Sau 4.895%
1,500,000 1,496,250 0.52 30/03/2009 Unicrcdito ltallano Spa Erntn 1% 2311 0/2008 1,500.000 1,499,731 0.52
Unilever Nv 1 “/o 29/05/2009 1,000,000 998,558 0.35 Vodafone Group PIC Emtn 1 % 17/07/2008 1,000,000 1,000,100 0.35
73,648,246 25.64
Total Bonds 73,648,246 25.64
EUR Mortclacle and Asset Backed Securities Granite Master lssu PIC 1 % 19/12/2030 Hnlland Mtu Xii 3 921 11 %
159,723 159,531 0.06
_. - 29/09/200< 992,774 987.0:5 0.34
1,146,546 0.40
Total Mortgage and Asset Backed Securities 1,146,546 0.40
Total Transferable securities admitted to an official exchange listing 74,794,792 26.04
Transferable securities dealt in on another regulated market
EUR Bonds Bankinter Sa 1 % 10/10/2008 1,000,000 997,911 0.35 Caja ne Ahorros Y Montc De Piedad Uc Madrid Mtn 1 % 23/02/2009 1,000,000 998.500 0.35
Cofinocga 10% 03/1 W2008 1,000,000 999,360 0.35 Fi-ance (Government or) 0 % 18/12/2008 14,500,000 14,211,295 4.95 Francc (Government 0 % 17/07/2008 8,000,000 7,984,455 2.78 French Discount T Bill 0 % 12;02/2009 38.300.000 37,279,994 12.98 Francc (Government G ~ J 0 %
14,994,982 5.22 03/07/2008 15.000.000 France (Government Of) 0 % 09/04/2009 5,000,000 4.831 -440 1.68 France (Govcmmcnt or) 0 ”/. 23/ 1 0/2008 15,000,003 14.800.580 5.15 La Caja De Ahorros Y Pensioncs Dc Barcelona 1 3.878% C2/03/2009 1.500,000 1.498.085 0.52 Nurnura Europe Finance NV Emtn 4.223% 27/G2/200Y 1,000,000 995,000 0.35
99,591,610 34.68
Total Bonds 99,591,610 34.68
The accompanying notes form an integral part of these financial statements.
253
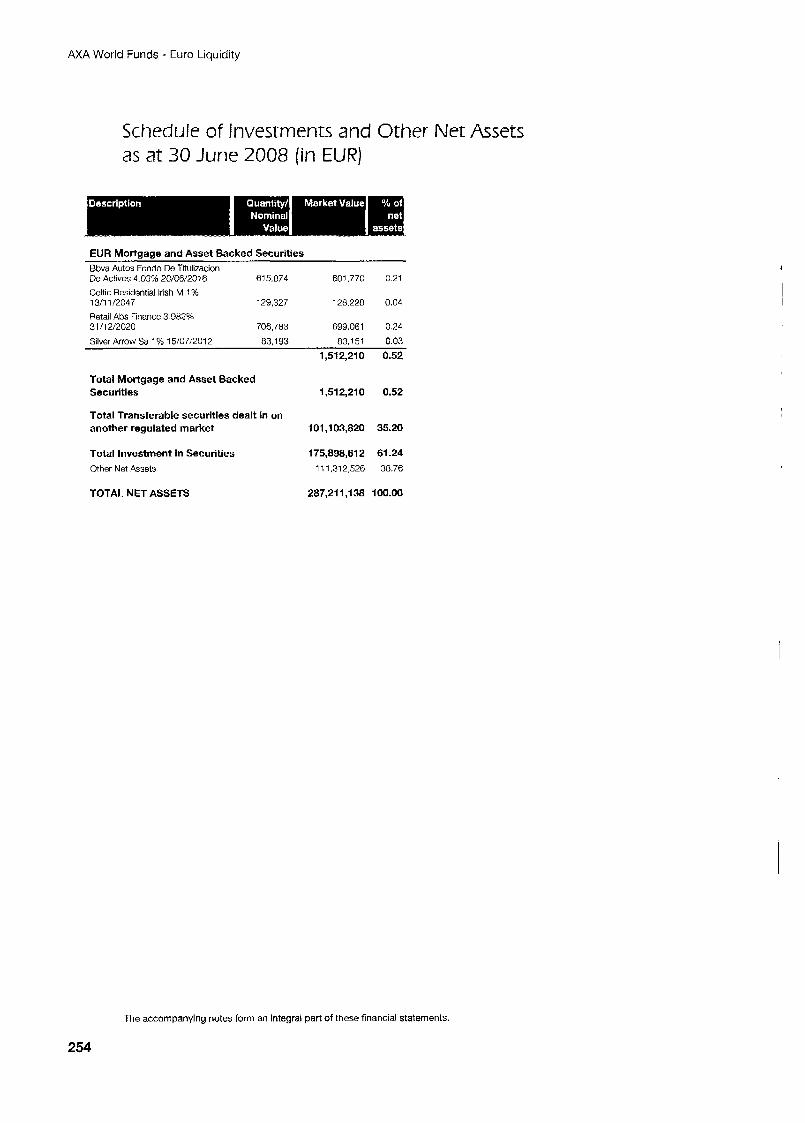
AXA World Funds - Euro Liquidity
Schedule of Investments and Other Net Assets as at 30 June 2008 (in EUR)
EUR Mortaaae and Asset Backed Securities BbvaAkrtos Fondo Dc Titulizacion
De Actfvos 4 03% 20/06/2016 615,874 601,770 0.21 Celtic Residsntial lnsh M 1 % 13/11/2047 129,327 128.228 0.04 Retail Abs Finance 3 9112% 31 /12/2020 706.783 699,061 024
Silver Arrow Sa 1 % 15/07/2012 83.193 83,151 0.03 1,512,210 0.52
Total Mortgage and Asset Backed Securities 1,512,210 0.52
Total Transferable securities dealt in on another regulated market 101 ,I 03,820 35.20
Total Investment in Securities 175,898,612 61.24 Other Net Assets 111,312,526 38.76
TOTAL NET ASSETS 287,211,138 100.00
I
The accompanying notes form an integral part of these financial statements.

t
AXA World Funds - Euro Liquidity
Industrial Classification as a t 30 June 2008
- . . Sovereign Bonds 34 49
Banks Corporate Bonds
Financial Services
Mortgage and Asset Backed Securities
Communications Basic Materials
Consumer, Cyclical
Consumer. Non-cvclical
1 10.13
7 02 6.70 0.92
0 87 0.52
0.35 0.24
61.24
255
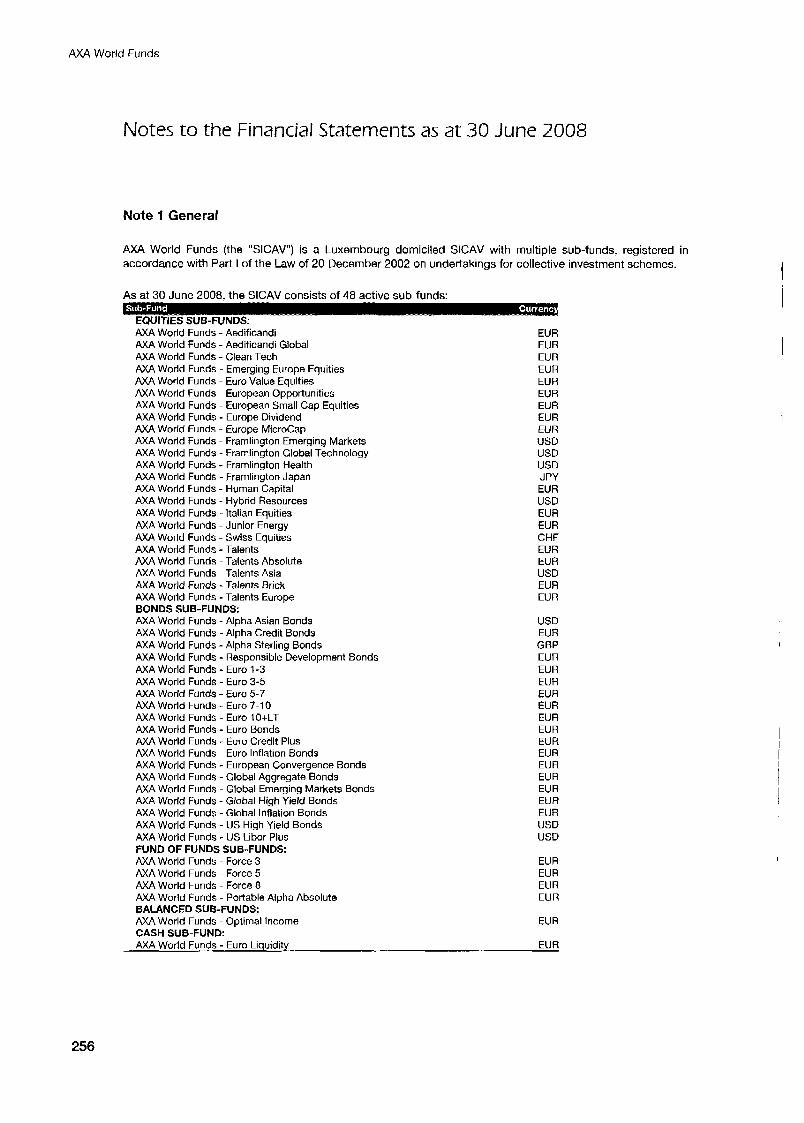
AXA World Funds
Notes to the Financial Statements as at 30 June 2008
Note 1 General
AXA World Funds (the “SICAV”) is a Luxembourg domiciled SICAV with multiple sub-funds, registered in accordance with Part I of the Law of 20 December 2002 on undertakings for collective investment schemes.
As at 30 June 2008, the SICAV consists of 48 active sub-funds:
EQUITIES SUB-FUNDS: AXA World Funds - Aedificandi AXA World Funds - Aedificandi Global AXA World Funds - Clean Tech AXA World Funds - Emerging Europe Equities AXA World Funds - Euro Value Equities AXA World Funds - European Opportunities AXA World Funds - European Small Cap Equities AXA World Funds - Europe Dividend AXA World Funds - Europe MicroCap AXA World Funds - Framlington Emerging Markets AXA World Funds - Framlington Global Technology AXA World Funds - Framlington Health AXA World Funds - Framlington Japan AXA World Funds - Human Capital AXA World Funds - Hybrid Resources AXA World Funds Italian Equities AXA World Funds - Junior Energy AXA World Funds - Swiss Equities AXA World Funds - Talents AXA World Funds -Talents Absolute AXA World Funds -Talents Asia AXA World Funds - Talents Brick AXA World Funds - Talents Europe
AXA World Funds - Alpha Asian Bonds M A World Funds - Alpha Credit Bonds AXA World Funds - Alpha Sterling Bonds AXA World Funds - Responsible Development Bonds AXA World Funds - Euro 1-3 AXA World Funds - Euro 3-5 AXA World Funds - Euro 5-7 AXA World Funds - Euro 7-1 0 AXA World Funds - Euro 1O+LT AXA World Funds - Euro Bonds AX4 World Funds - Euro Credit Plus AXA World Funds - Euro Inflation Bonds AXA World Funds - European Convergence Bonds AXA World Funds - Global Aggregate Bonds AXA World Funds - Global Emerging Markets Bonds AXA World Funds - Global High Yield Bonds AXA World Funds - Global Inflation Bonds AXA World Funds - US High Yield Bonds AXA World Funds - US Libor Plus
AXA World Funds - Force 3 AXA World Funds - Force 5 AXA World Funds - Force 8 AXA World Funds - Portable Alpha Absolute
AXA World Funds - Optimal Income
AXA World Funds - Euro Liquidity
BONDS SUB-FUNDS:
FUND OF FUNDS SUB-FUNDS:
BALANCED SUB-FUNDS
CASH SUB-FUND:
EUR EUR EU R EUR EUR EUR EUR EUR EUR USD USD USD JPY EUR USD EUR EUR CHF EUR EUR USD EUR EU R
USD EUR GBP EUR EUR EUR EUR EUR EUR EUR EUR EUR EUR EUR EUR EUR EUR USD USD
EUR EUR EUR EUR
EUR
EUR
256
AXA World Funds
Notes to the Financial Statements as a t 30 June 2008
The Management Company (AXA Funds Management SA.) was incorporated on 21 November 1989 for an undetermined period of time. Its articles of association were published in the “Memorial” of 26 January 1990. Consolidated Articles were deposited with the register of commerce and companies of Luxembourg on 17 January 2002. The Company is registered in the “Registre de Commerce” (trade register) in Luxembourg under the number B 32.223. AXA Funds Management S.A. has obtained CSSF approval to be considered as a management company managing UCITS in compliance with UCITS 111.
Class “A” and Class “F” Shares
Each sub-fund offers several different classes of shares. Class “A” shares are for all investors. There is no minimum initial subscription in Class “A” shares. There is no minimum subsequent investment in Class “A” shares. Class “F” shares have been more specifically designed for institutional investors and benefit from reduced fee levels. The minimum initial subscription in Class “F” shares is EUR 500,000, the minimum subsequent investment is the equivalent of EUR 50,000. The holders of Class “ A shares can apply for a conversion into Class “F” shares if as a result of a subsequent subscription the shareholder reaches the minimum level of holding required for Class “F” shares, which is EUR 500,000. If as a result of a redemption, a shareholder holding Class “F” shares falls below the minimum level of holding required, such shareholder will be deemed to have requested the conversion into Class “A” shares. NO charge will be levied for conversions between Class “ A shares and Class “F” shares. An initial fee of up to 5.50% of the Dealing Price of the Class “A” shares purchased will normally be charged to the shareholder. An initial fee of up to 2.00% of the Dealing Price of the Class “F” shares purchased will normally be charged to the shareholder.
Distribution and Capitalisation Shares
The Class “A” and Class “F” shares are further divided in capitalisation shares and distribution shares. These shares differ by their distribution policies, the first by accumulating income, and the other by distributing dividends. The assets of these two categories are gathered together.
Class “E” Shares
Class “E” shares are for all investors. No initial fee will be charged to the Class “E” shares. An annual distribution fee of up to 0.75% calculated on top of the annual management fee as a percentage of the Net Asset Value of Class “E” shares will be charged.
Class “ I “ Shares
The Directors reserve the right to issue Class “ 1 ” shares at their sole discretion. Class “I” shares are only offered to institutional investors. No initial fee will be charged to the Class “I“ shares.
Class “M” Shares
Class “M” shares are only subscribed and held by A M Investment Managers or its subsidiaries for use in institutional mandates or investment management agreements for a dedicated fund contracted with the AXA Group. No initial fee will be charged to the Class “M” shares. There is no initial minimum amount for which a shareholder has to subscribe and no minimum for subsequent subscriptions.
257
AXA World Funds
Notes to the Financial Statements as a t 30 June 2808
Class "R" Shares
Class "R" shares will only be offered to investors, other than institutional investors, who are resident in the UK, the Channel Islands or the Isle of Man.
Class "SI" Shares
Class "SI" shares will only be offered to institutional investors who are resident in the UK, the Channel Islands or the Isle of Man.
Class "S" Shares
Class "S" Shares are only offered by the distributor "HSBC Private Bank (Suisse) SA branch offices in Hong- Kong and in Singapore" to investors who are resident in Asia.
Class "J" Shares
The Directors reserve the right to issue Class "J" shares at their sole discretion. Class "J" shares are only offered to institutional investors who are resident in Japan.
The description of the different types of shares is detailed in the current Prospectus.
Some sub-funds are available in currencies other than the sub-fund's reference currency. AXA Funds Management S.A. has obtained CSSF approval to be considered as a management company managing UClTS in compliance with UClTS 111.
During the period ended 30 June 2008, the following new Sub-Funds have been launched:
AXA World Funds - Alpha Asian Bonds (launched on 15 February 2008) AXA World Funds - Alpha Sterling Bonds (launched on 15 January 2008)
The Board of Directors resolved to put the Sub-Fund AXA World Funds - US Bonds Core Plus into liquidation with effect on 11 th April 2008.
The Board of Directors resolved to put the Sub-Fund AXA World Funds - US Securitized Bonds into liquidation with effect on 16th June 2008.
The General Meeting decides to amend Article 1 to be read as follows : "There exists among the appearing persons and all those who may become holders of shares, a company in the form of a limited liability company ("societe anonyme") qualifying as a "societe d'investissements a capital variable" ("SICAV") under the name of "AXA World Funds", in short "AXA WF" (the "Company")."
On 7 January 2008, the Sub-Fund h a World Funds - Development Debt has been renamed in Responsible Development Bonds.
I
Change to the launch date of the Sub-Fund Alpha Asian Bonds : The initial subscription period in the Sub-Fund will take place on 15 February 2008. Subscriptions will be accepted at the price of EUR 100 or USD 100 or GBP 100 depending on the offering currency in which the relevant Class of Shares is denominated. Payment shall be made to the order of the Custodian on 20 February 2008.
25%
A M World Funds
Notes to the Finantjaf Statements a5 at 30 June 2008
Note 2 Significant Accounting Policies
a) Presentation of the Financial Statements
The financial statements are prepared in accordance with Luxembourg regulations relating to undertakings for collective investment. The combined financial statements are expressed in EUR and are presented for information purposes only. For this purpose the corresponding statements have been translated into EUR using the latest exchange rates known as at the time of calculation of the year-end NAV.
b) Valuation of Securities
The assets of the SICAV are valued as follows:
a) Liquid assets are valued at their face value with interest accrued; in the case of short-term instruments (especially discount instruments) with maturities of less than 90 days, the value of the instrument based on the net acquisition cost, is gradually adjusted to the repurchase price thereof while the investment return calculated on the net acquisition cost is kept constant. In the event of material changes in the market conditions, the valuation basis of the investment is adjusted to the new market yields.
b) Securities listed or traded on any Regulated Market, stock exchange in an Other State or Other Regulated Market, are valued at the closing price on such markets. If the securities are listed or traded on several markets, the closing price at the market, which constitutes the main market for such securities, will be determining;
c) Securities not listed or traded on any Regulated Market, stock exchange in an Other State or Other Regulated Market are valued at their last available market price;
d) Securities for which no price quotation is available or for which the price referred to in (a) and/or (b) is not representative of the fair market value, are valued prudently and in good faith by the Board of Directors of the SICAV on the basis of their reasonably foreseeable sales prices.
e) As far as Collateralised Debt Obligations (CDO) are concerned and insofar the price quotation is not representative of the fair market value, CDO are valued at their Net Asset Value as transmitted to the Investment Manager by the arranging bank of each CDO in which the SICAV has invested;
c) Valuation of the Forward Foreign Exchange Contracts
Outstanding forward foreign exchange contracts are valued at the closing date using the forward rates of exchange applicable to the outstanding life of the contract. All unrealised appreciation and depreciation are included in the Statement of Net Assets.
d) Realised Gains/(Losses) on Sales of Securities
Realised gains/(losses) on sales of securities are determined on the basis of the average cost of the securities sold.
259
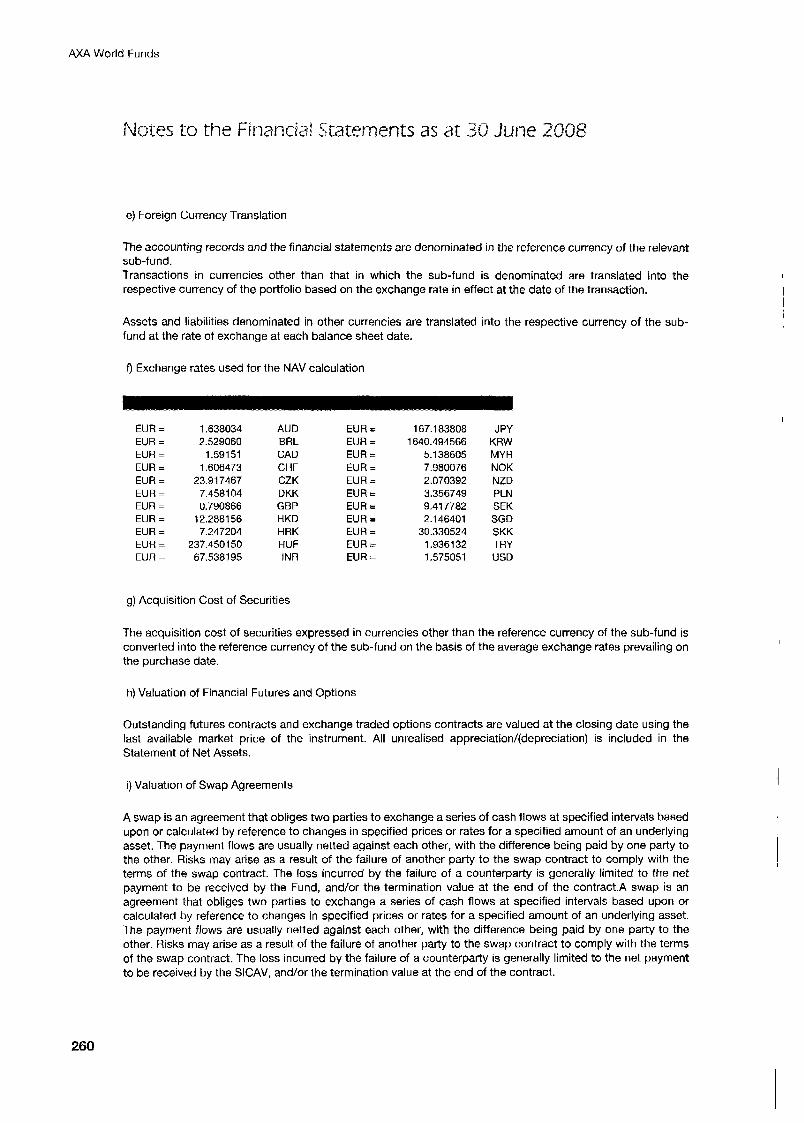
AXA World Funds
Notes to the Financial Statements as ax 30 June 2008
e) Foreign Currency Translation
The accounting records and the financial statements are denominated in the reference currency of the relevant sub-fund. Transactions in currencies other than that in which the sub-fund is denominated are translated into the respective currency of the portfolio based on the exchange rate in effect at the date of the transaction.
Assets and liabilities denominated in other currencies are translated into the respective currency of the sub- fund at the rate of exchange at each balance sheet date.
9 Exchange rates used for the NAV calculation
EUR = EUR = EUR = EUR = EUR = EUR = EUR = EUR = EUR = EUR = EUR =
1.638034 2.529060
1.59151 1.606473
23.91 7467 7.458104 0.790866
12.288156 7.247204
237.4501 50 67.538195
AU 0 BRL CAD CHF CZK DKK GB P HKD HRK HUF INR
g) Acquisition Cost of Securities
EUR = EUR = EUR = EUR = EUR = EUR = EUR = EUR = EUR = EUR = EUR =
167.1 83808 1640.494566
5.1 38605 7.980076 2.070392 3.356749 9.41 7782 2.146401
30.330524 1.9361 32 1.575051
JPY KRW MYR N O K NZD PLN SEK SGD SKK TRY USD
The acquisition cost of securities expressed in currencies other than the reference currency of the sub-fund is converted into the reference currency of the sub-fund on the basis of the average exchange rates prevailing on the purchase date.
h) Valuation of Financial Futures and Options
Outstanding futures contracts and exchange traded options contracts are valued at the closing date using the last available market price of the instrument. All unrealised appreciation/(depreciation) is included in the Statement of Net Assets.
i) Valuation of Swap Agreements
A swap is an agreement that obliges two parties to exchange a series of cash flows at specified intervals based upon or calculated by reference to changes in specified prices or rates for a specified amount of an underlying asset. The payment flows are usually netted against each other, with the difference being paid by one party to the other. Risks may arise as a result of the failure of another party to the swap contract to comply with the terms of the swap contract. The loss incurred by the failure of a counterparty is generally limited to the net payment to be received by the Fund, and/or the termination value at the end of the c0ntract.A swap is an agreement that obliges two parties to exchange a series of cash flows at specified intervals based upon or calculated by reference to changes in specified prices or rates for a specified amount of an underlying asset. The payment flows are usually netted against each other, with the difference being paid by one party to the other. Risks may arise as a result of the failure of another party to the swap contract to comply with the terms of the swap contract. The loss incurred by the failure of a counterparty is generally limited to the net payment to be received by the SICAV, and/or the termination value at the end of the contract.
I
260
AXA World Funds
Notes to the Financial Statements as at 30 June 2008
Therefore, the SICAV considers the creditworthiness of each counterparty to a swap contract in evaluating potential credit risk. Additionally, risks may arise from unanticipated movements in interest rates or in the value of the underlying securities or indices.
I Credit Default Swap
A Credit Default Swap ("CDS") is a credit derivative transaction in which two parties enter into an agreement, whereby one party pays the other a fixed periodic coupon for the specified life of the agreement. The other party makes no payments unless a credit event, relating to a predetermined reference asset, occurs. If such an event occurs, the party will then make a payment to the first party, and the swap will terminate. The unrealised appreciation/(depreciation) on CDS is included in the Statement of Net Assets under the headings "Unrealised appreciation/(depreciation) on swaps".
- Constant Maturity Swap
A Constant Maturity Swap ("CMS") is a variation of the fixed-to-floating interest rate swap. The interest rate on one leg is reset each year relative to a regularly available fixed maturity market rate and the interest rate of the other leg of the swap is either fixed or reset periodically at or relative to LlBOR (or another floating rate index).The unrealised appreciation/(depreciation) on CMS is included in the Statement of Net Assets under the headings "Unrealised appreciation/(depreciation) on swaps".
- Performance Swap Agreementrrotal Return Swap
The SICAV entered into performance swap agreements pursuant to which the SICAV pays interest on a notional amount and receives or pays the performance of the underlying index based on the same notional amount. The interest is accrued and the performance of the index is valued both on a daily basis. The net receivable or payable amount is recorded in the Statement of Net Assets under the headings "Unrealised appreciation/(depreciation) on swaps".
j) Repurchase Agreement Transactions
The SICAV may, on an ancillary basis, enter into repurchase agreement transactions which consist of the purchase and sale of securities with a clause reserving the seller the right or the obligation to repurchase from the acquirer the securities sold at a price and term specified by the two parties in their contractual arrangement. As at 30 June 2008, no such contracts are open.
k) Interest income
Interest income is recognised on a daily accrual basis, net of any irrecoverable withholding tax (interest on investment portfolio, interest on deposits and interest on call accounts and security lending income).
I) Dividend income
Dividends are accounted for on an ex-dividend basis, net of any irrecoverable withholding tax.
261
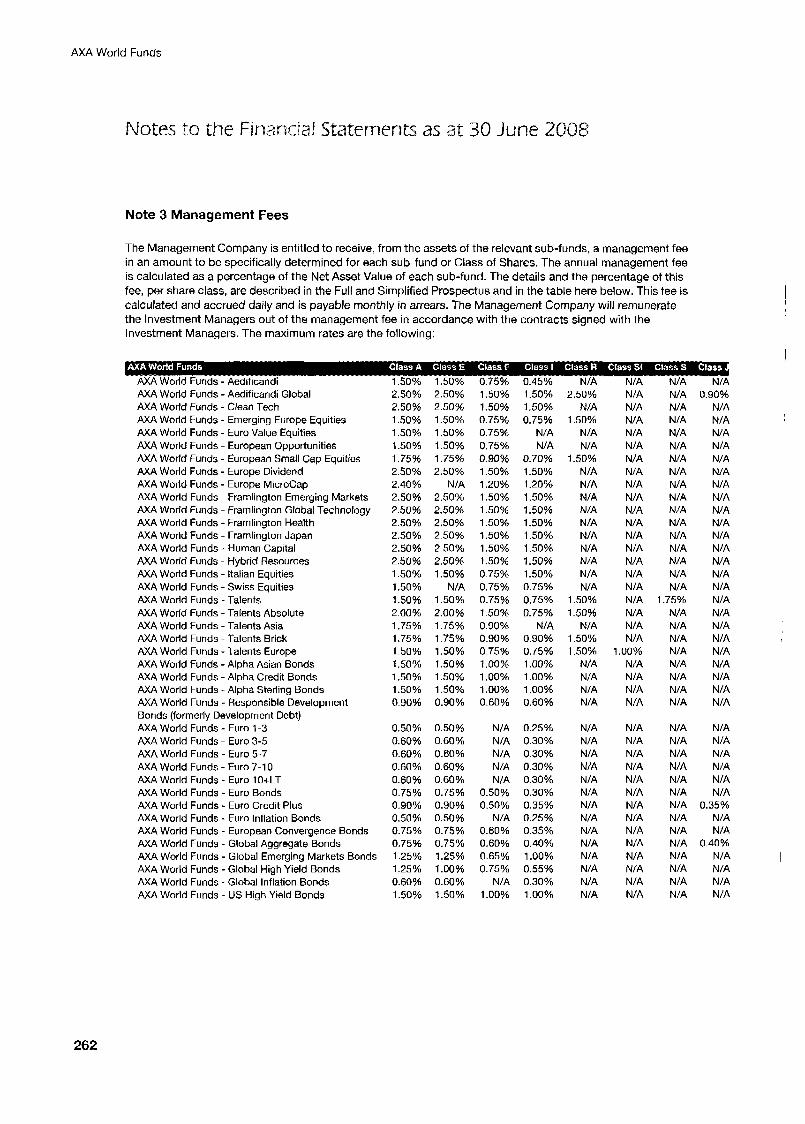
AXA World Funds
Notes ts the Financial Statements as at 30 h n e 2UQ8
Note 3 Management Fees
The Management Company is entitled to receive, from the assets of the relevant sub-funds, a management fee in an amount to be specifically determined for each sub-fund or Class of Shares. The annual management fee is calculated as a percentage of the Net Asset Value of each sub-fund. The details and the percentage of this fee, per share class, are described in the Full and Simplified Prospectus and in the table here below. This fee is calculated and accrued daily and is payable monthly in arrears. The Management Company will remunerate the Investment Managers out of the management fee in accordance with the contracts signed with the Investment Managers. The maximum rates are the following:
AXA World Funds - Aedificandi Global AXA World Funds - Clean Tech AXA World Funds - Emerging Europe Equities AXA World Funds - Euro Value Equities AXA World Funds - European Opportunities AXA World Funds - European Small Cap Equities AXA World Funds - Europe Dividend AXA World Funds - Europe MicroCap AXA World Funds - Framlington Emerging Markets AXA World Funds - Framlington Global Technology AXA World Funds - Framlington Health AXA World Funds - Framlington Japan AXA World Funds - Human Capital AXA World Funds - Hybrid Resources AXA World Funds - Italian Equities AXA World Funds - Swiss Equities AXA World Funds - Talents AXA World Funds - Talents Absolute AXA World Funds - Talents Asia AXA World Funds - Talents Brick AXA World Funds - Talents Europe AXA World Funds - Alpha Asian Bonds AXA World Funds - Alpha Credit Bonds AXA World Funds - Alpha Sterling Bonds AXA World Funds - Responsible Development Bonds (formerly Development Debt) AXA World Funds - Euro 1-3 AXA World Funds - Euro 3-5 AXA World Funds - Euro 5-7 AXA World Funds - Euro 7-10 AXA World Funds - Euro 1O+LT AXA World Funds - Euro Bonds AXA World Funds - Euro Credit Plus AXA World Funds - Euro Inflation Bonds AXA World Funds - European Convergence Bonds AXA World Funds - Global Aggregate Bonds AXA World Funds - Global Emerging Markets Bonds AXA World Funds - Global High Yield Bonds AXA World Funds - Global Inflation Bonds
2.50% 2.50% 1 S O % 1.50% 1.50% 1.75% 2.50% 2.40% 2.50% 2.50% 2.50% 2.50% 2.50% 2.50% 1.50% 1.50% 1 S O % 2.00% 1.75% 1.75% 1.50% 1.50% 1.50% 1.50% 0.90%
0.50% 0.60% 0.60% 0.60% 0.60% 0.75% 0.90% 0.50% 0.75% 0.75% 1.25% 1.25% 0.60%
2.50% 2.50% 1.50% 1.50% 1 SO% 1.75% 2.50%
NIA 2.50% 2.50% 2.50% 2.50% 2.50% 2.50% 1.50%
NIA 1.50% 2.00% 1.75% 1.75% 1.50% 1.50% 1.50% 1.50% 0.90%
0.50% 0.60% 0.60% 0.60% 0.60% 0.75% 0.90% 0.50% 0.75% 0.75% 1.25% 1 .OO% 0.60%
1.50% 1 SO% 0.75% 0.75% 0.75% 0.90% 1.50% 1.20% 1.50% 1.50% 1.50% 1.50% 1.50% 1.50% 0.75% 0.75% 0.75% 1.50% 0.90% 0.90% 0.75% 1 .OO% 1 .OO% 1 .OO% 0.60%
NIA NIA NIA NIA NIA
0.50% 0.50%
N/A 0.60% 0.60% 0.65% 0.75%
N/A
1.50% 2.50% 1.50% NIA 0.75% 1.50%
NIA NIA NIA NIA
0.70% 1.50% 1.50% NIA 1.20% NIA 1.50% NIA 1.50% NIA 1.50% NIA 1.50% NIA 1.50% NIA 1.50% NIA 1.50% N/A 0.75% NIA 0.75% 1.50% 0.75% 1.50%
NIA NIA 0.90% 1.50% 0.75% 1.50% 1.00% N/A 1.00% NIA 1.00% NIA 0.60% NIA
0.25% NIA 0.30% NIA 0.30% NIA 0.30% NIA 0.30% NJA 0.30% NIA 0.35% NIA 0.25% NIA 0.35% NIA 0.40% NIA 1.00% NIA 0.55% NIA 0.30% N/A
AXA World Funds - US High Yield Bonds 1.50% 1.50% 1.00% 1.00% N/A
NIA NIA NIA NIA NIA N/A NIA NIA NIA NIA NIA NIA NIA N/A NIA NIA N/A NIA NIA NIA
1 .OO% NIA NIA NIA NIA
NIA NIA NIA NIA NIA N/A NIA NIA NIA NIA NIA N/A NIA NIA
NIA NIA NIA N/A NIA NIA NIA NIA NIA NIA NIA NIA NIA NIA NIA NIA
1.75% N/A NIA NIA NIA N/A NIA NIA NIA
NIA NIA NIA NIA N/A NIA NIA NIA NIA NIA NIA NIA NIA NIA
0.9OYo NIA NIA NIA NIA NIA NIA NIA NIA NIA NIA NIA NIA N/A NIA NIA N/A N/A NIA NIA NIA NIA NIA NIA NIA
NIA N/A NIA NIA NIA NIA
0.35% NIA NIA
0.40% NIA NIA NIA NIA
262
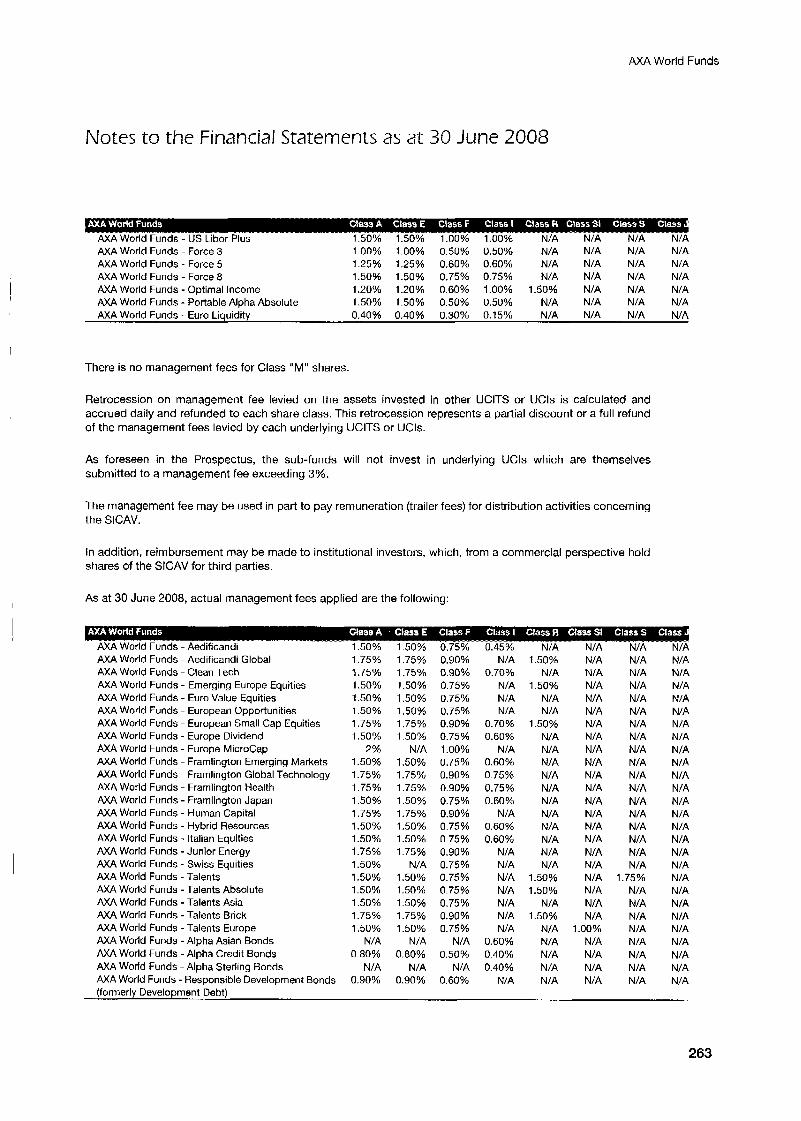
AXA World Funds
Notes to the Financial Statements as at 30 June 2008
AXA World Funds - US Libor Plus 1.50% 1.50% 1.00% 1.00% NIA N/A N/A NIA AXA World Funds - Force 3 1.00% 1.00% 0.50% 0.50% NIA N/A N/A N/A AXA World Funds - Force 5 1.25% 1.25% 0.60% 0.60% NIA N/A N/A N/A AXA World Funds - Force 8 1.50% 1.50% 0.75% 0.75% NIA N/A N/A N/A AXA World Funds - Optimal Income 1.20% 1.20% 0.60% 1.00% 1.50% NIA N/A N/A AXA World Funds - Portable Alpha Absolute 1.50% 1.50% 0.50% 0.50% N/A NIA N/A N/A AXA World Funds - Euro Liquidity 0.40% 0.40% 0.30% 0.15% N/A N/A N/A NIA
There is no management fees for Class "M" shares.
Retrocession on management fee levied on the assets invested in other UClTS or UCls is calculated and accrued daily and refunded to each share class. This retrocession represents a partial discount or a full refund of the management fees levied by each underlying K I T S or UCls.
As foreseen in the Prospectus, the sub-funds will not invest in underlying UCls which are themselves submitted to a management fee exceeding 3%.
The management fee may be used in part to pay remuneration (trailer fees) for distribution activities concerning the SICAV.
In addition, reimbursement may be made to institutional investors, which, from a commercial perspective hold shares of the SICAV for third parties.
As at 30 June 2008, actual management fees applied are the following:
AXA World Funds - Aedificandi Global M A World Funds - Clean Tech AXA World Funds - Emerging Europe Equities AXA World Funds - Euro Value Equities AXA World Funds - European Opportunities AXA World Funds - European Small Cap Equities AXA World Funds - Europe Dividend M A World Funds - Europe MicroCap AXA World Funds - Frarnlington Emerging Markets AXA World Funds - Framlington Global Technology AXA World Funds - Framlington Health AXA World Funds - Framlington Japan AXA World Funds - Human Capital AXA World Funds - Hybrid Resources AXA World Funds - Italian Equities AXA World Funds - Junior Energy AXA World Funds - Swiss Equities AXA World Funds - Talents AXA World funds - Talents Absolute AXA World Funds - Talents Asia AXA World Funds - Talents Brick AXA World Funds - Talents Europe AXA World Funds - Alpha Asian Bonds AXA World Funds - Alpha Credit Bonds AXA World Funds -Alpha Sterling Bonds AXA World Funds - Responsible Development Bonds (formerly Development Debt)
1.75% 1.75% 1.50% 1.50% 1.50% 1.75% 1.50%
2 % 1.50% 1.75% 1.75% 1 SO% 1.75% 1.50% 1.50% 1.75% 1 .So% 1.50% 1 .SO% 1 S O % 1.75% 1 .So%
NIA
NIA 0.90%
0.80%
1.75% 1.75% 1.50% 1.50% 1 SO% 1.75% 1.50%
N/A 1.50% 1.75% 1.75% 1 .So% 1.75% 1.50% 1.50% 1.75%
NIA 1.50% 1.50% 1.50% 1.75% 1.50%
N/A 0.80%
N/A 0.90%
0.90% 0.90% 0.75% 0.75% 0.75% 0.90% 0.75% 1 .OO% 0.75% 0.90% 0.90% 0.75% 0.90% 0.75% 0.75% 0.90% 0.75% 0.75% 0.75% 0.75% 0.90% 0.75%
N/A 0.50%
NIA 0.60%
NIA 0.70%
N/A NIA N/A
0.70% 0.60%
N/A 0.60% 0.75% 0.75% 0.60%
N/A 0.60% 0.60%
NIA N/A N/A N/A N/A N/A N/A
0.60% 0.40% 0.40%
N/A
1.50% N/A
1.50% N/A N/A
1 .So% NIA N/A N/A NIA NIA N/A N/A N/A N/A N /A NIA
1.50% 1 .So%
NIA 1.50%
N/A N/A N/A N/A NIA
N/A N/A N/A N/A N/A NIA NIA NIA NIA N/A N/A N/A NIA N/A N/A N/A N/A N/A N/A NIA N/A
1 .OO% NIA NIA N/A NIA
N/A N/A N/A N/A NIA NIA NIA N/A N/A NIA NIA N/A N/A N/A N/A NIA NIA
1.75% NIA N/A NIA N/A N/A NIA NIA NIA
NIA N/A N/A N/A N/A N/A N/A N/A N/A N/A N/A N/A NIA N/A N/A N/A N/A N/A N/A NIA N/A N/A NIA N/A N/A NIA
263
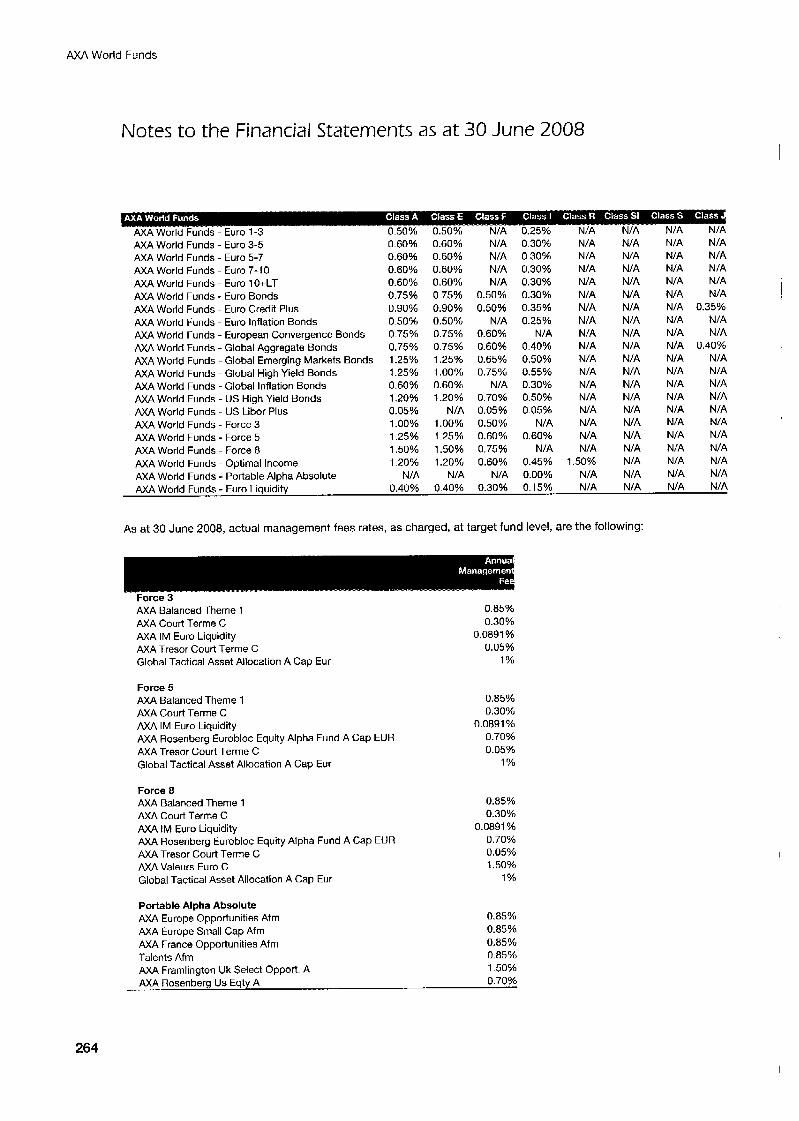
AXA World Funds
Notes to the Financial Statements as at 30 June 2008
.. . -. .. .
AXA World Funds - Euro 1-3 AXA World Funds - Euro 3-5 AXA World Funds - Euro 5-7 AXA World Funds - Euro 7-10 AXA World Funds - Euro 1 O+LT AXA World Funds - Euro Bonds AXA World Funds - Euro Credit Plus AXA World Funds - Euro Inflation Bonds AXA World Funds - European Convergence Bonds AXA World Funds - Global Aggregate Bonds AXA World Funds - Global Emerging Markets Bonds AXA World Funds - Global High Yield Bonds AXA World Funds - Global Inflation Bonds AXA World Funds - US High Yield Bonds AXA World Funds - US Libor Plus AXA World Funds - Force 3 AXA World Funds - Force 5 AXA World Funds - Force 8 AXA World Funds - Optimal Income AXA World Funds - Portable Alpha Absolute AXA World Funds - Euro Liquidity
0.50% 0.50% 0.60% 0.60% 0.60% 0.60% 0.60% 0.60% 0.60% 0.60% 0.75% 0.75% 0.90% 0.90% 0.50% 0.50% 0.75% 0.75% 0.75% 0.75% 1.25% 1.25% 1.25% 1.00% 0.60% 0.60% 1.20% 1.20% 0.05% NIA 1.00% 1.00% 1.25% 1.25% 1.50% 1.50% 1.20% 1.20%
NIA N/A 0.40% 0.40%
N/A 0.25% NIA 0.30% NIA 0.30% NIA 0.30% N/A 0.30%
0.50% 0.30% 0.50% 0.35%
NIA 0.25% 0.60% N/A 0.60% 0.40% 0.65% 0.50% 0.75% 0.55%
N/A 0.30% 0.70% 0.50% 0.05% 0.05% 0.50% N/A 0.60% 0.60% 0.75% N/A 0.60% 0.45%
NIA 0.00% 0.30% 0.15%
NIA N/A NIA NIA NIA NIA NIA NIA NIA NIA NIA NIA N/A N/A N/A NIA NIA NIA
1.50% NIA NIA
NIA NIA NIA NIA N/A NIA NIA N/A N/A N/A N/A NIA NIA NIA NIA N/A N/A NIA NIA N/A 0.35% NIA NIA N/A N/A N/A N/A NIA NIA 0.40% NIA N/A NIA NIA NIA N/A NIA NIA N/A NIA NIA NIA NIA NIA NIA NIA NIA N/A NIA NIA NIA NIA NIA NIA NJA NIA NIA N/A N/A N/A NIA NJA NIA
As at 30 June 2008, actual management fees rates, as charged, at target fund level, are the following:
__I - .. . Force 3 AXA Balanced Theme 1 AXA Court Terme C AXA IM Euro Liquidity AXA Tresor Court Terme c Global Tactical Asset Allocation A Cap Eur
0.85% 0.30%
0.0891 % 0.05%
1%
Force 5 AXA Balanced Theme 1 0.85% AXA Court Terme C 0.30% AXA IM Euro Liquidity 0.0891 % AXA Rosenberg Eurobloc Equity Alpha Fund A Cap EUR 0.70% AXA Tresor Court Terrne C 0.05%
1 % Global Tactical Asset Allocation A Cap Eur
Force 8 AXA Balanced Theme 1 0.85% AXA Court Terme C 0.30% AXA IM Euro Liquidity 0.0891 % AXA Rosenberg Eurobloc Equity Alpha Fund A Cap EUR 0.70%
AXA Tresor Court Terme C 0.05% AXA Valeurs Euro C 1.50%
1 Yo Global Tactical Asset Allocation A Cap Eur
I
Portable Alpha Absolute
AXA Europe Small Cap Afrn 0.85% AXA France Opportunities Afm 0.85% Talents Afm 0.85%
AXA Framlington Uk Select Opport. A 1.50%
AXA Rosenberg Us Eqty A 0.70%
AXA Europe Opportunities Afm 0.85%
264
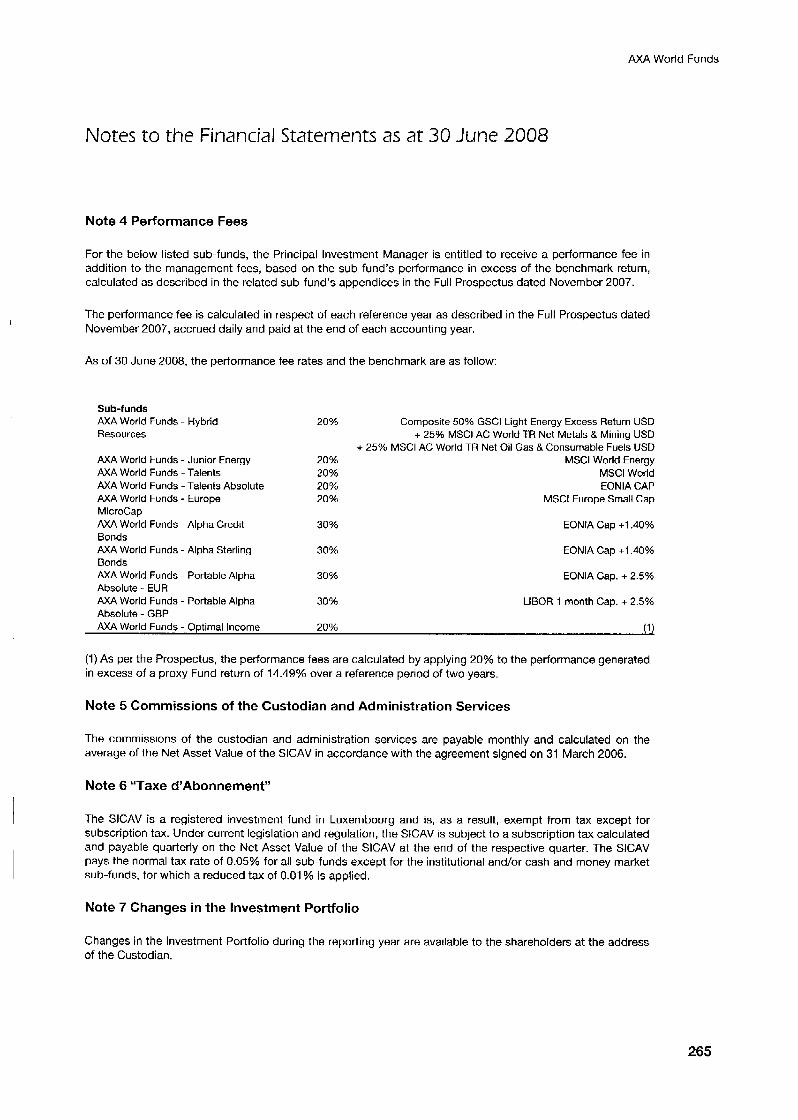
AXA World Funds
Notes to the Financial Statements as at 30 June 2008
Note 4 Performance Fees
For the below listed sub-funds, the Principal Investment Manager is entitled to receive a performance fee in addition to the management fees, based on the sub-fund’s performance in excess of the benchmark return, calculated as described in the related sub-fund’s appendices in the Full Prospectus dated November 2007.
The performance fee is calculated in respect of each reference year as described in the Full Prospectus dated November 2007, accrued daily and paid at the end of each accounting year.
As of 30 June 2008, the performance fee rates and the benchmark are as follow:
Sub-funds AXA World Funds - Hybrid Composite 50% GSCl Light Energy Excess Return USD Resources + 25% MSCl AC World TR Net Metals & Mining USD
+ 25% MSCl AC World TR Net Oil Gas & Consumable Fuels USD AXA World Funds - Junior Energy 20Yn MSCl World Energy AXA World Funds -Talents 20% MSCl World M A World Funds -Talents Absolute 20% EONIA CAP AXA World Funds - Europe 20% MSCl Europe Small Cap MicroCap AXA World Funds - Alpha Credit 30% EONIA Cap +1.40% Bonds AXA World Funds - Alpha Sterling 30% EONIA Cap +1.40% Bonds AXA World Funds - Portable Alpha EONIA Cap. + 2.5% Absolute - EUR AXA World Funds - Portable Alpha LlBOR I month Cap. + 2.5% Absolute - GBP
20%
30%
30%
AXA World Funds - Optimal Income 20% (1)
(1) As per the Prospectus, the performance fees are calculated by applying 20% to the performance generated in excess of a proxy Fund return of 14.49% over a reference period of two years.
Note 5 Commissions of the Custodian and Administration Services
The commissions of the custodian and administration services are payable monthly and calculated on the average of the Net Asset Value of the SICAV in accordance with the agreement signed on 31 March 2006.
Note 6 “Taxe d’Abonnement”
The SICAV is a registered investment fund in Luxembourg and is, as a result, exempt from tax except for subscription tax. Under current legislation and regulation, the SICAV is subject to a subscription tax calculated and payable quarterly on the Net Asset Value of the SICAV at the end of the respective quarter. The SICAV pays the normal tax rate of 0.05% for all sub-funds except for the institutional and/or cash and money market sub-funds, for which a reduced tax of 0.01 YO is applied.
Note 7 Changes in the Investment Portfolio
Changes in the Investment Portfolio during the reporting year are available to the shareholders at the address of the Custodian.
265
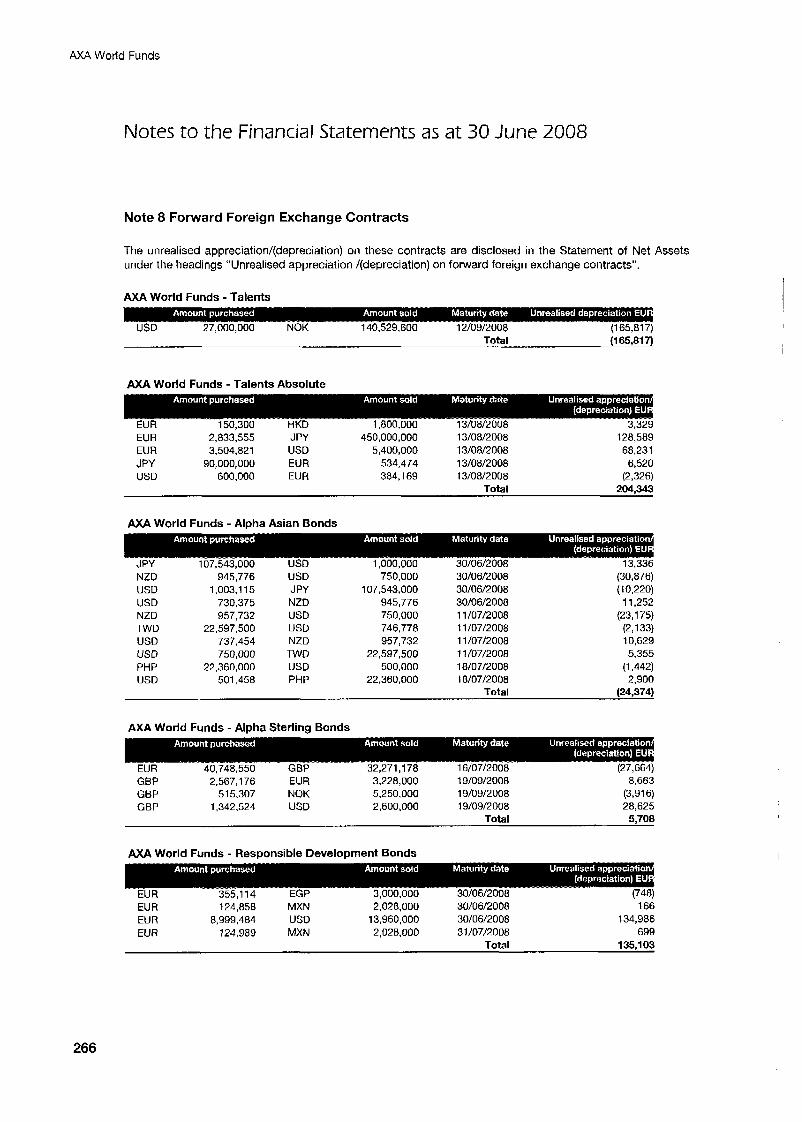
AXA World Funds
Notes to the Financial Statements as at 30 June 2008
Note 8 Forward Foreign Exchange Contracts
The unrealised appreciation/(depreciation) on these contracts are disclosed in the Statement of Net Assets under the headings “Unrealised appreciation /(depreciation) on forward foreign exchange contracts”.
AXA World Funds - Talents
USD 27,000,000 NOK 140,529,600 12/09/2008 (1 65,817) Total (1 65,817)
AXA World Funds - Talents Absolute
EUR 150,300 HKD 1,800,000 13/08/2008 3,329 EUR 2,833,555 J PY 450,000,000 13/08/2008 128,589 EUR 3,504,821 USD 5,400,000 13/08/2008 68,231 JPY 90,000,000 EUR 534,474 13/08/2008 6,520 USD 600,000 EUR 384,169 13/08/2008 (2,326)
Total 204,343
AXA World Funds - Alpha Asian Bonds
JPY NZD USD USD NZD TWD USD USD PHP USD
107,543,000 945,776
1,003,115 730,375 957,732
22,597,500
750,000 22.360,OOO
501,458
737,454
USD USD J PY NZD USD USD NZD TWD USD PHP
1,000,000 750,000
107,543,000 945,776 750,000 746,778 957,732
22,597,500 500,000
22,360,000
AXA World Funds - Alpha Sterling Bonds
30/06/2008 30/06/2008 30/06/2008 30/06/2008 11/07/2008 1 1 /07/2008
11/07/2008 18/07/2008 la/07/2008
Total
1 i1071zooa
13,336 (30,876)
11,252 (23,175)
(2,133) 10,629 5,355
(1.442) 2,900
(24,374)
(10,220)
GBP 2,567,176 EUR 3,228,000 19/09/2008 GBP 515,307 NOK 5,250,000 19/09/2008 GBP 1.342,524 USD 2,600,000 19/09/2008
Total
8,663 (331 6) 28,625 5.708
AXA World Funds - Resaonsible Development Bonds
EUR 124,858 MXN 2,02a,ooo 30/06/2008 166 EUR 8,999,484 USD 13,960,000 30/06/2008 134,986 EUR 124,989 MXN 2,028,000 31 /07/2008 699
1 35,103 Total
266
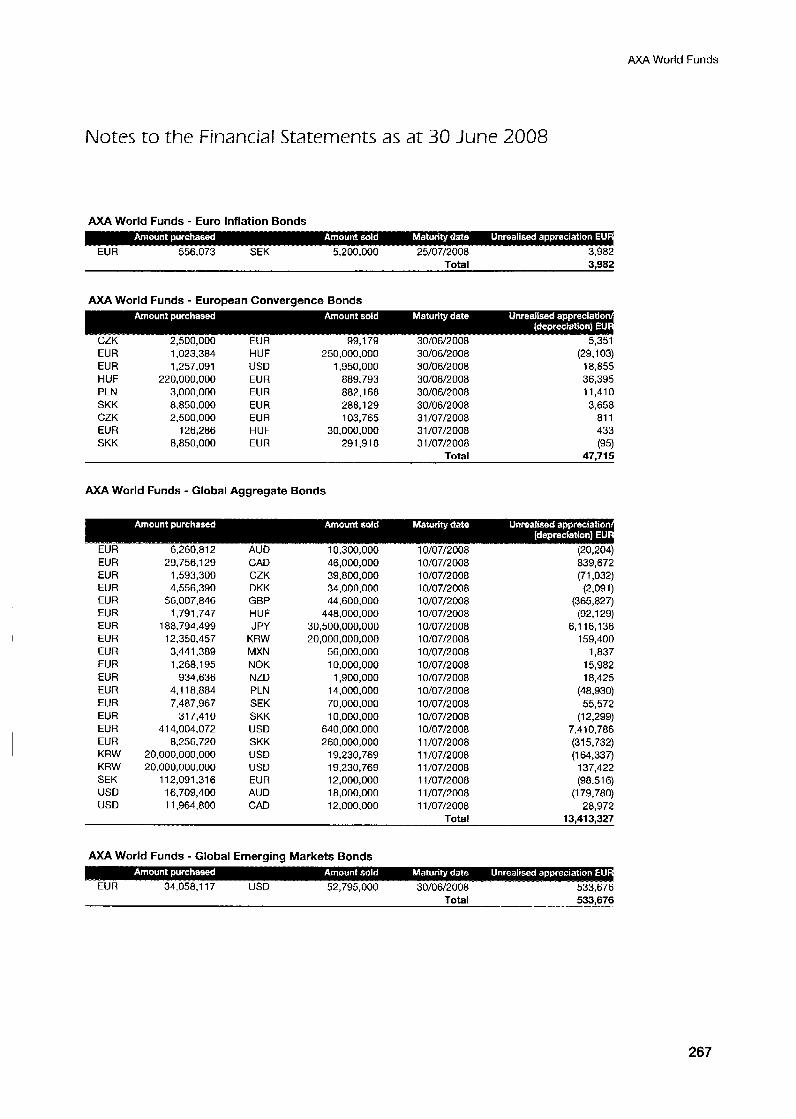
AXA World Funds
Notes to the Financial Statements as a t 30 June 2008
AXA World Funds - Euro Inflation Bonds
Total 3,982
AXA World Funds - European Convergence Bonds
EUR EUR HUF PLN SKK CZK EUR SKK
1,023,384 1,257,091
220,000,000 3,000,000 8.850.000 2,500,000
126,286 8,850,000
HUF USD EUR EUR EUR EUR HUF EUR
250,000,000 1,950,000
882,168 288,129 103,765
30.000,OOO 291,918
a89,793
30/06/2008 30/06/2008 30/06/2008 30/06/2008 30/06/2008 31 /07/2008 3 1 /07/2 008 31 /07/2008
Tntnl
(29,103) 18,855 36,395 11,410 3,658
81 1 433
47.715 (95)
AXA World Funds - Global Aggregate Bonds
EUR 6,260,812 AUD 10,300,000 10/07/2008 (20,204) EUR EUR EUR EUR EUR EUR EUR EUR EUR EUR EUR EUR EUR EUR EUR KRW KRW SEK USD USD
29,756,129 1,593,300 4,556,390
56,007,846 1,791,747
188.794,499 12.350,457 3,441,389 1,268,195
934,636 4,118,884 7,487,967
317,410 41 4,004,072
8,256,720 20,000,000,000 20,000,000,000
1 1 2,091.3 1 6 16,709,400 11,964,800
CAD CZK DKK GBP HUF J PY
KRW MXN NOK NZD PLN SEK SKK U S 0 SKK USD USD EUR AUD CAD
46,000,000 39,800,000 34,000,000 44,600,000
448,000,000 30,500,000,000 20,000,000,000
56,000,000 10,000,000
1,900,000 14,000,000 70,000,000 10,000.000
640,000,000 260,000,000
19,230,769 19,230,769 12,000,000 18,000,000 12,000,000
10/07/2008 10/07/2008 10/07/2008 10/07/2008 10/07/2008 10/07/2008 10/07/2008 10/07/2008 10/07/2008 10/07/2008 10/07/2008 10/07/2008 10/07/2008 10/07/2008 11/07/2008 11/07/2008 11/07/2008 11/07/2008 11/07/2008 11/07/2008
Tntnl
839,672 (71,032)
(2,091 (365,827)
(92,129) 6,116,136
159,400
15,982 18,425
(48,930) 55,572
(1 2,299) 7,410,786 (315,732) (164,337)
137,422 (98.51 6)
(1 79.780) 28,972
13.413.327
1 ,a37
AXA World Funds - Global Emerging Markets Bonds
EUR 34,058,117 USD 52,795,000 30/06/2008 533,676 Total 533,676
267
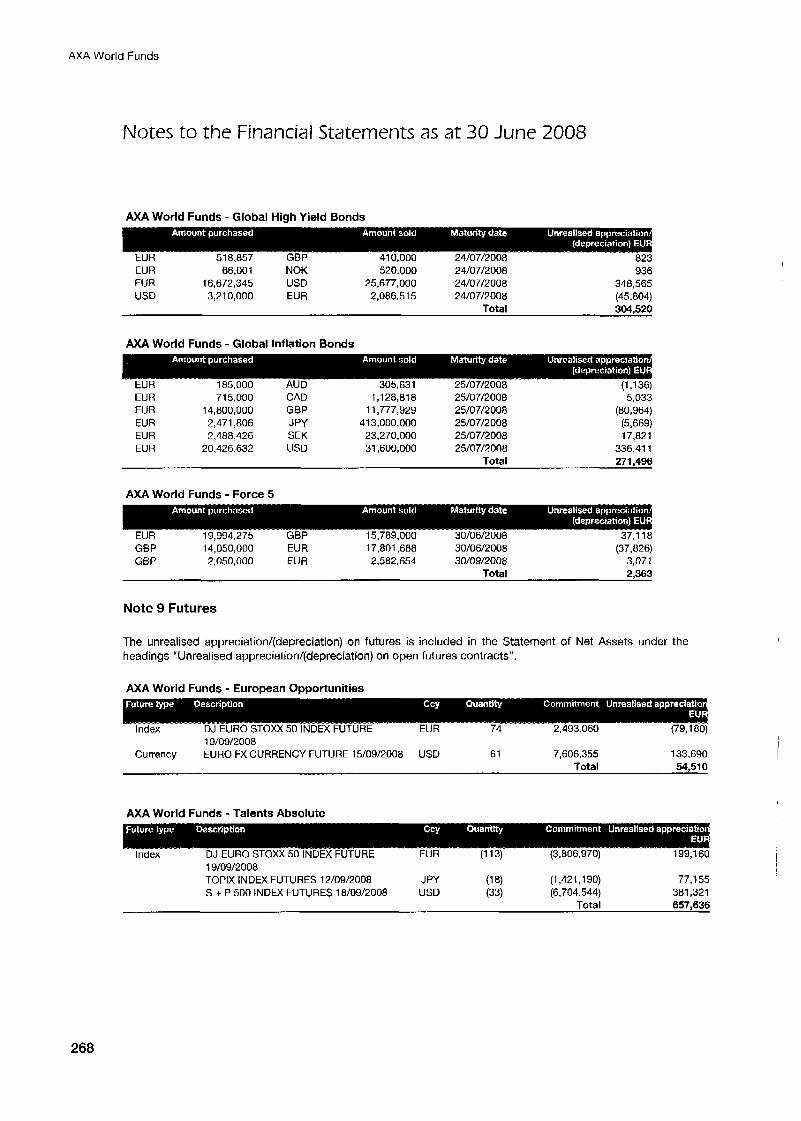
AXA World funds
Notes to the Financial Statements as at 30 June 2008
AXA World Funds - Global High Yield Bonds
EUR 51 8,857 GBP 41 0.000 2410712008 823 EUR 66,001 NOK 520,000 2410712008 936
USD 3,210,000 EUR 2,086,515 2410712008 (45,804) Total 304,520
-
EUR 1 6,672,345 USD 25,677,000 24/07/2008 348,565
AXA World Funds - Global Inflation Bonds
EUR 715,000 CAD 1,128,818 251071200a 5,033 EUR 14,800,000 GBP 11,777,929 2510712008 (80,964) EUR 2,471,806 JPY 413,000,000 251071200a (5,669) EUR 2,488,426 SEK 23,270,000 2510712008 17,821 EUR 20,426,632 USD 31,600,000 2510712008 336,411
Total 271,496
AXA World Funds - Force 5
GBP 14,050,000 EUR 17,801,688 3010612 008 (37,826) GBP 2,050,000 EUR 2,582,654 30/09/200a 3,071
Total 2,363
Note 9 Futures
The unrealised appreciation/(depreciation) on futures is included in the Statement of Net Assets under the headings “Unrealised appreciation/(depreciation) on open futures contracts”.
AXA World Funds - European Opportunities
Index DJ EURO STOXX 50 INDEX FUTURE EUR 74 2,493,060 (79,l 80)
Currency EURO FX CURRENCY FUTURE 15/0912008 USD 61 7,606,355 133,690 Total 54.510
19/09/2008
AXA World Funds - Talents Absolute
199,160 Index DJ EURO STOXX 50 INDEX FUTURE EUR (3,806,970) 19/09/2008
S + P 500 INDEX FUTURES 1810912008 USD (33) (6,704,544) 381,321 Total 657.636
TOPIX INDEX FUTURES 1210912008 J PY (1 8) (1,421 ,I 90) 77,155
I
268
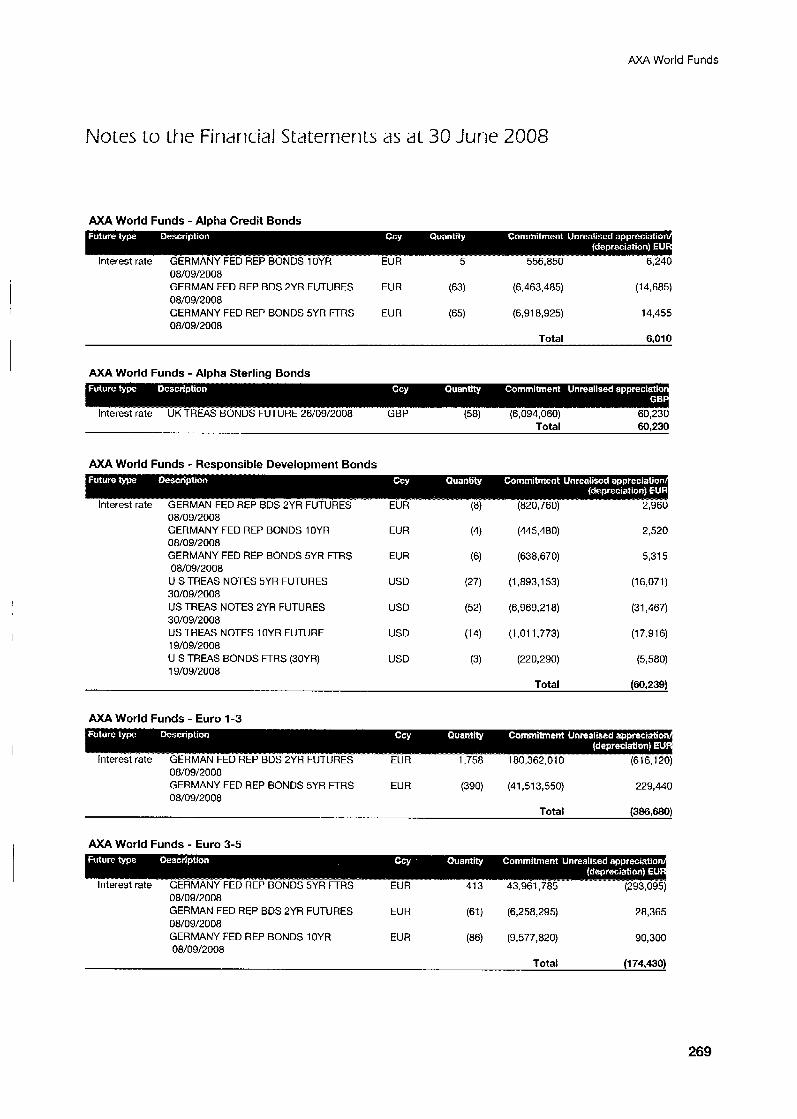
AXA World Funds
Notes to the Financial Statements as at 30 June 2008
AXA World Funds - Alpha Credit Bonds
08/09/2008 GERMAN FED REP BDS 2YR FUTURES EUR (63) (6,463,485) (14,685) 08/03/2008 GERMANY FED REP BONDS 5YR FrRS EUR (65) (6,918,925) 14,455 08/09/2008
Total 6,010
AXA World Funds - Alpha Sterling Bonds
. - __ . - . - . ___ ___ . __ ___ Interest rate UK TREAS BONDS FUTURE 26/09/2008 GBP (58) (6,094,060) 60,230
AXA World Funds - Responsible Development Bonds
08/09/2008 GERMANY FED REP BONDS IOYR EUR (4) (445,480) 2,520 08/09/2008 GERMANY FED REP BONDS 5YR FTRS EUR (6) (638,670) 5,315 08/09/2008 U S TREAS NOTES 5YR FUTURES USD (27) (1,893,153) (1 6,071)
US TREAS NOTES 2YR FUTURES USD (52) (6,969,218) (31,467)
US TREAS NOTES lOYR FUTURE USD (14) (1,011,773) (17,916) 19/09/2008
U S TREAS BONDS FTRS (30YR) USD (3) (220,290) (5,580) 19/09/2008
30/09/2ooa
30/09/200a
AXA World Funds - Euro 1-3
. . . 08/09/2008 GERMANY FED REP BONDS 5YR FTRS EUR (390) (41,513,550) 229,440 08/09/2008
Total (386,680)
AXA World Funds - Euro 3-5
413 - . ....- EUR 43.961,785 Interest rate GERMANY FED REP BONDS 5YR FTRS
08/09/2008 GERMAN FED REP BDS 2YR FUTURES EUR (61) (6,258,295) 28,365 08/09/2008 GERMANY FED REP BONDS IOYR EUR (86) (9,577,820) 90,300 Qa/09/2008
Total (1 74,430)
269
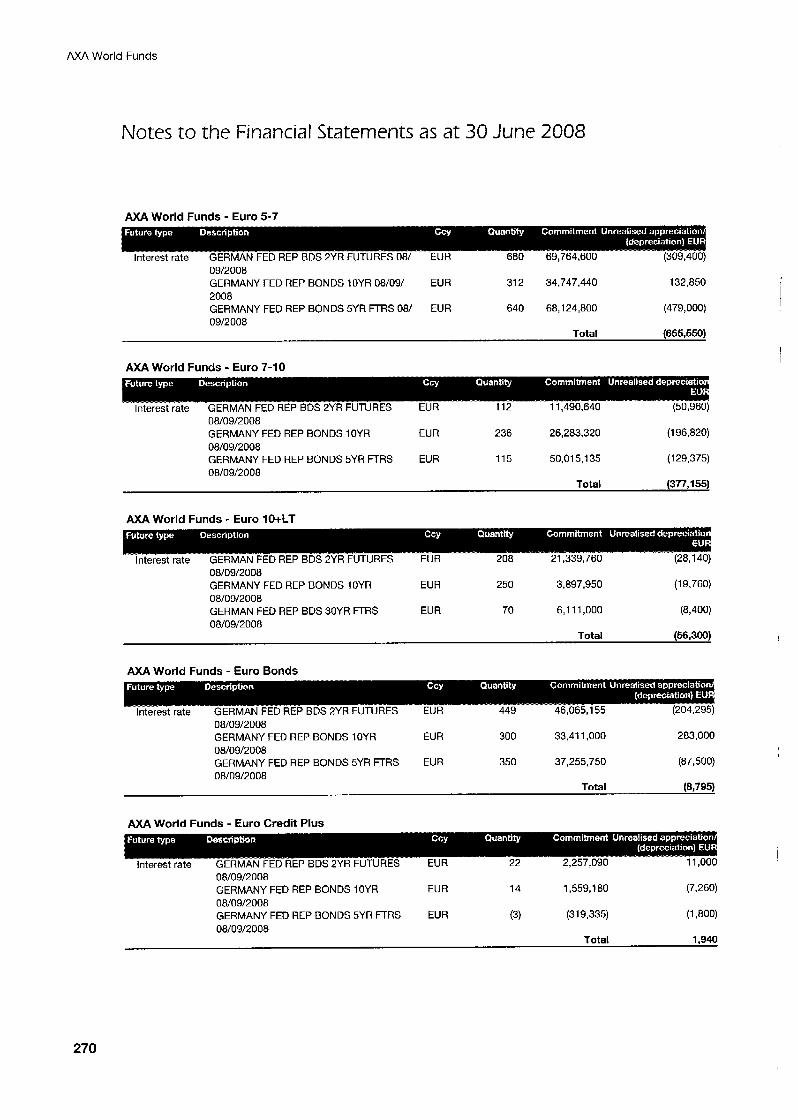
AXA World Funds
Notes to the Financial Statements as at 30 June 2008
AXA World Funds - Euro 5-7
Interest rate GERMAN FED REP BDS 2YR FUTURES 08/ EUR 680 69,764,600 (309,400)
09/2008 GERMANY FED REP BONDS lOYR 08/09/ EUR 312 34,747,440 132,850 2008 GERMANY FED REP BONDS 5YR FTRS 08/ EUR 640 68,124,800 (479,000) 09/2008
Total (655,550) I
AXA World Funds - Euro 7-1 0
Interest rate GERMAN FED REP BDS 2YR FUTURES EUR 112 1 1,490,640 (50,960)
08/09/2008 GERMANY FED REP BONDS lOYR EUR 236 26,283,320 (196,820)
GERMANY FED REP BONDS 5YR FTRS EUR 115 50,015,135 (1 29,375) 08/09/2008
Total 1377.1 551
oa/09/2008
AXA World Funds - Euro 1O+LT
08/09/2008 GERMANY FED REP BONDS lOYR EUR 250 3,897,950 (19,760)
08/09/2008 GERMAN FED REP BDS 30YR FTRS EUR 70 6,111,000 (8,400) 08/09/2008
Total (56,300)
AXA World Funds - Euro Bonds
Interest rate GERMAN FED REP BDS 2YR FUTURES EUR 449 46,065,155 (204,2Y5)
08/09/2008 GERMANY FED REP BONDS lOYR EUR 300 33,411,000 283,000
08/09/2008 GERMANY FED REP BONDS 5YR FTRS EUR 350 37,255,750 (87,500)
08/09/2008
AXA World Funds - Euro Credit Plus
interest rate GERMAN FED REP BDS-2jRFUrU-RES EUR 22 2,257,090 11,000
08/09/2008 GERMANY FED REP BONDS lOYR EUR 14 1,559,180 (7.260) 08/09/2008 GERMANY FED REP BONDS 5YR FTRS EUR (3) (31 9,335) (1,800) 08/09/2008
Total 1,940
270
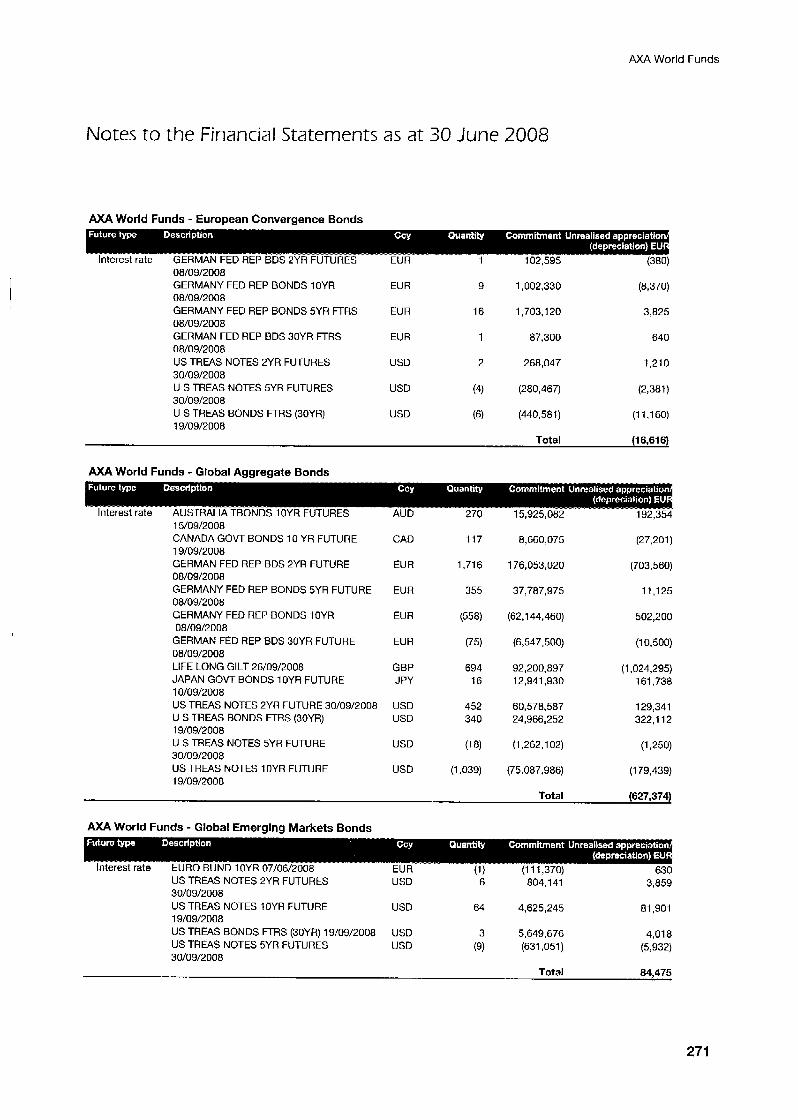
AXA World Funds
Notes to the Financial Statements as at 30 June 2008
I
AXA World Funds - European Convergence Bonds
Interest rate GERMAN FED REP BDS 2YR FUTURES EUR 1 102,595 08/09/2008
GERMANY FED REP BONDS 10YR EUR 9 1,002,330 (8,370) 08/09/2008 GERMANY FED REP BONDS 5YR FTRS EUR 16 1,703,120 3,825
GERMAN FED REP BDS 30YR FTRS EUR 1 87,300 640 08/09/200a
08/09/2008 US TREAS NOTES 2YR FUTURES USD 2 268,047 1,210 30/09/2008
USTREASNOTES5YRFUTURES USD (4) (280,467) (2,381) 30/09/2008 U S TREAS BONDS FTRS (30YR) USD (6) (440,581) (1 1,160) 19/09/2008
AXA World Funds - Global Aggregate Bonds
15/09/2008 CANADA GOVT BONDS 10 YA FUTURE 19/09/2008 GERMAN FED REP BDS 2YR FUTURE 08/09/2008 GERMANY FED REP BONDS 5YR FUTURE 08/09/2008 GERMANY FED REP BONDS lOYR 08/09/2008
GERMAN FED REP BDS 30YR FUTURE 08/09/2008 LIFE LONG GILT 26/09/2008 JAPAN GOVT BONDS lOYR FUTURE 10/09/2008 US TREAS NOTES 2YR FUTURE 30/09/2008 U S TREAS BONDS FTRS (30YR) 19/09/2008 U S TREAS NOTES 5YR FUTURE
US TREAS NOTES lOYR FUTURE 19/09/2008
30109/20oa
CAD 117
EUR 1,716
EUR 355
EUR (558)
EUR (75)
GBP 694 JPY 16
USD 452 USD 340
USD (1 8)
USD (1.039)
8,660,075
176,053,020
37,787,975
(62,144,460)
(6,547,500)
92,200,897 12,941,930
60,578,587 24,966,252
(1,262,102)
(75,087,986)
(27.201)
(703.560)
11.125
502,200
(1 0,500)
(1,024,295) 161,738
129,341 322,112
(1,250)
(1 79,439)
AXA World Funds - Global Emerging Markets Bonds
US TREAS NOTES 2YR FUTURES USD 6 804,141 3,859 30/09/2008 US TREAS NOTES lOYR FUTURE 19/09/2008
USD 64 4,625,245
us TREAS BONDS FTRS ( 3 0 ~ ~ ) 19/09/2008 USD 3 5,649,676 4,018 USD (9) (631,051) (5,932) US TREAS NOTES 5YR FUTURES
30/09/2008
27 1
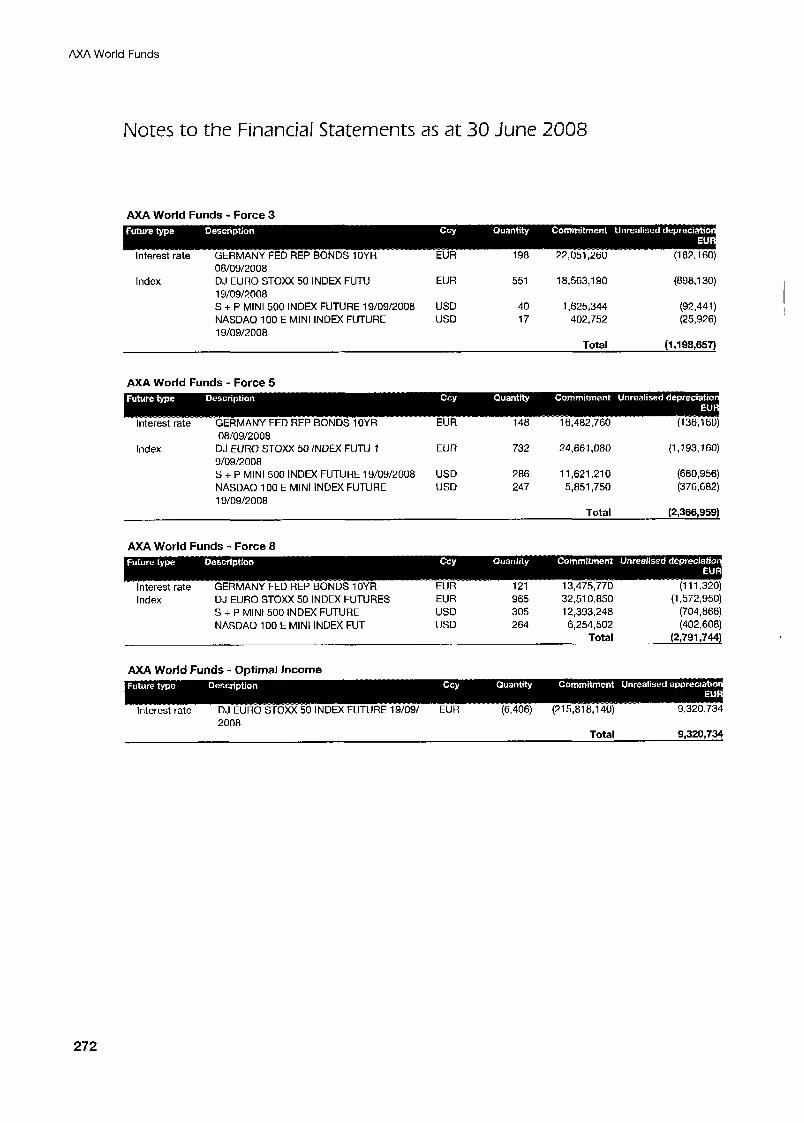
AXA World Funds
Notes to the Financial Statements as at 30 June 2008
AXA World Funds - force 3
08/09/2008 Index DJ EURO STOXX 50 INDEX FUTU EUR 551 18,563,190 (898.130)
19/09/2008 S + P MINI 500 INDEX FUTURE 19/09/2008 USD 40 1,625,344 (92,441) NASDAQ 100 E MINI INDEX FUTURE USD 17 402,752 (25,926) 19/09/2008
Total (1,198,657)
AXA World Funds - Force 5
148 16,482,760 (1 36,160) Interest rate GERMANY FED REP BONDS lOYR EUR 08/09/2008
Index DJ EURO STOXX 50 INDEX FUTU 1 EUR 732 24,661,080 (1,193,160) 9/09/2008 S + P MINI 500 INDEX FUTURE 19/09/2008 USD 286 11,621,210 (660,956) NASDAQ 100 E MINI INDEX FUTURE USD 247 5,851,750 (376,682) 19/09/2008
Total (2,366,959)
AXA World Funds - Force 8
Interest rate GERMANY FED REP BONDS 10YR EUR 121 13,475,770 (1 11,320) Index DJ EURO STOXX 50 INDEX FUTURES EUR 965 32.51 0,850 (1,572,950)
S + P MINI 500 INDEX FUTURE USD 305 12,393,248 (704,866) NASDAO 100 E MINI INDEX FUT USD 2 64 6,254,502 (402,608)
Total (2,791,744)
AXA World Funds - Optimal Income
Interest rate DJ EURO STOXX 50 INDEX FUTURE 19/09/ EUR (6,406) (215,818,140) 9,320,734
Total 9.320.734 2008
272
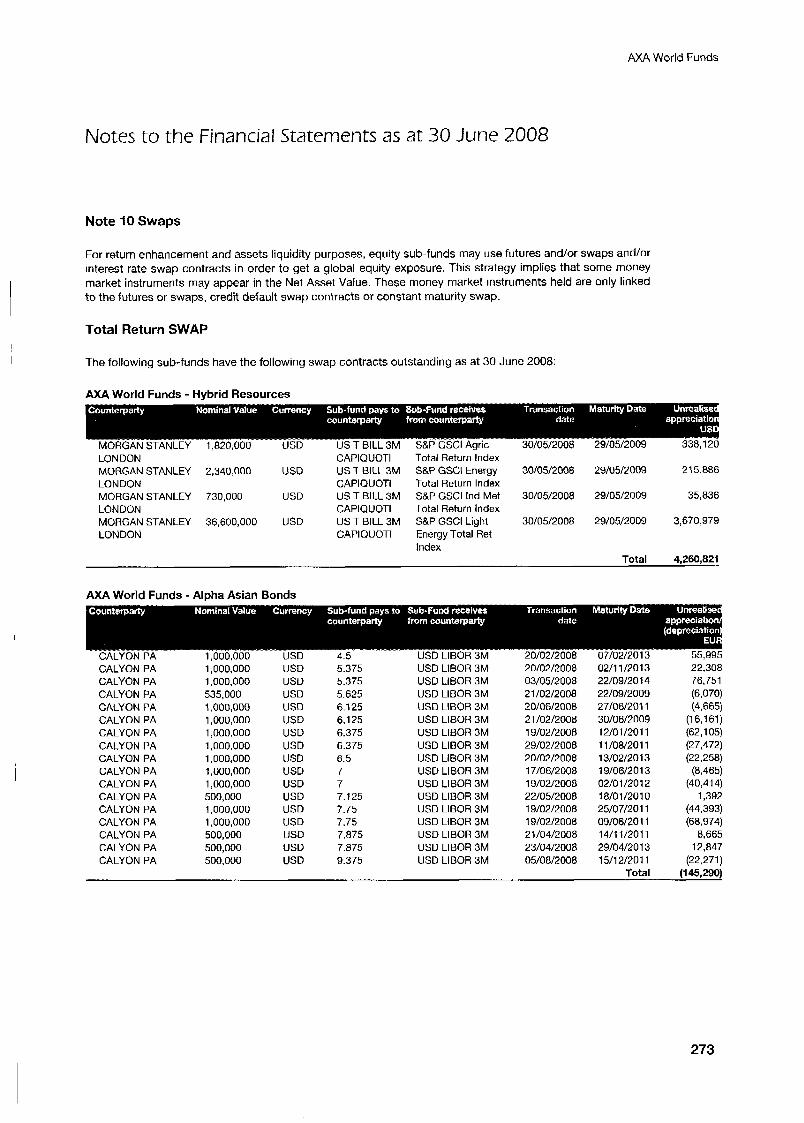
AXA World Funds
Notes to the Financial Statements as at 30 June 2008
Note 10 Swaps
For return enhancement and assets liquidity purposes, equity sub-funds may use futures and/or swaps and/or interest rate swap contracts in order to get a global equity exposure. This strategy implies that some money market instruments may appear in the Net Asset Value. These money market instruments held are only linked to the futures or swaps, credit default swap contracts or constant maturity swap.
Total Return SWAP
The following sub-funds have the following swap contracts outstanding as at 30 June 2008:
AXA World Funds - Hybrid Resources
LONDON MORGAN STANLEY 2,340,000 LONDON MORGAN STANLEY 730,000 LONDON MORGAN STANLEY 36,600,000 LONDON
CAPIOUOTI
CAPIOUOTI
CAPlQUOTl
CAP1 QU OTI
USD US T BILL 3M
USD US T BILL 3M
USD US T BILL 3M
Total Return Index S W GSCl Energy 30/05/2008 29/05/2009 215,886 Total Return Index S&P GSCl Ind Met 30/05/2008 29/05/2009 35,836 Total Return Index S&P GSCl Light 30/05/2008 29/05/2009 3,670,979 Energy Total Ret Index
Total 4.260.821
AXA World Funds - Alpha Asian Bonds
CALYON PA CALYON PA CALYON PA CALYON PA CALYON PA CALYON PA CALYON PA CALYON PA CALYON PA CALYON PA CALYON PA CALYON PA CALYON PA CALYON PA CALYON PA CALYON PA
1:ooo;ooo 1,000,000 535,000 1,000,000 1,000,000 1,000,000 1,000.000 1,000,000 1,000,000 1,000,000 500,000 1,000,000 1,000,000 500,000 500,000 500,000
USD USD USD US0 USD USD USD USD USD USD USD USD USD USD USD USD
5.375 5.375 5.625 6.125 6.125 6.375 6.375 6.5 7 7 7.125 7.75 7.75
7.875 9.375
7.875
USD LlBOR 3M USD LIBOR 3M USD LlBOR 3M USD LIBOR 3M USD LIBOR 3M USD LlBOR 3M USD LlBOR 3M USD LlBOR 3M USD LIBOR 3M USD LIBOR 3M USD LlBOR 3M USD LIBOR 3M USD LIBOR 3M USD LIBOR 3M USD LIBOR 3M USD LlBOR 3M
20/02/2008 03/05/2008 2 1 /02/2008 20/06/2008 21/02/2008 19/02/2008 29/02/2008 20/02/2008 17/06/2008 19/02/2008 22/05/2008 19/02/2008 19/02/2008 2 1 /04/2008 23/04/2008 05/08/2008
0211 112013 22/09/2014 22/09/2009 27/06/2011 30/06/2009 12/01/2011 1 1 /08/2011 13/02/2013 19/06/2013 0210 1 120 1 2 1 810 1 120 1 0 25/07/2011 09/06/2011 14/11/2011 29/04/2013 15/12/2011
Total
22,308 76,751 (6,070) (4,665)
(16,161) (62,105) (27,472) (22,258) (8,465)
(40,414) 1,392
(68,974) 8,665
12,847 (22,271)
(44,393)
(145,2901
273
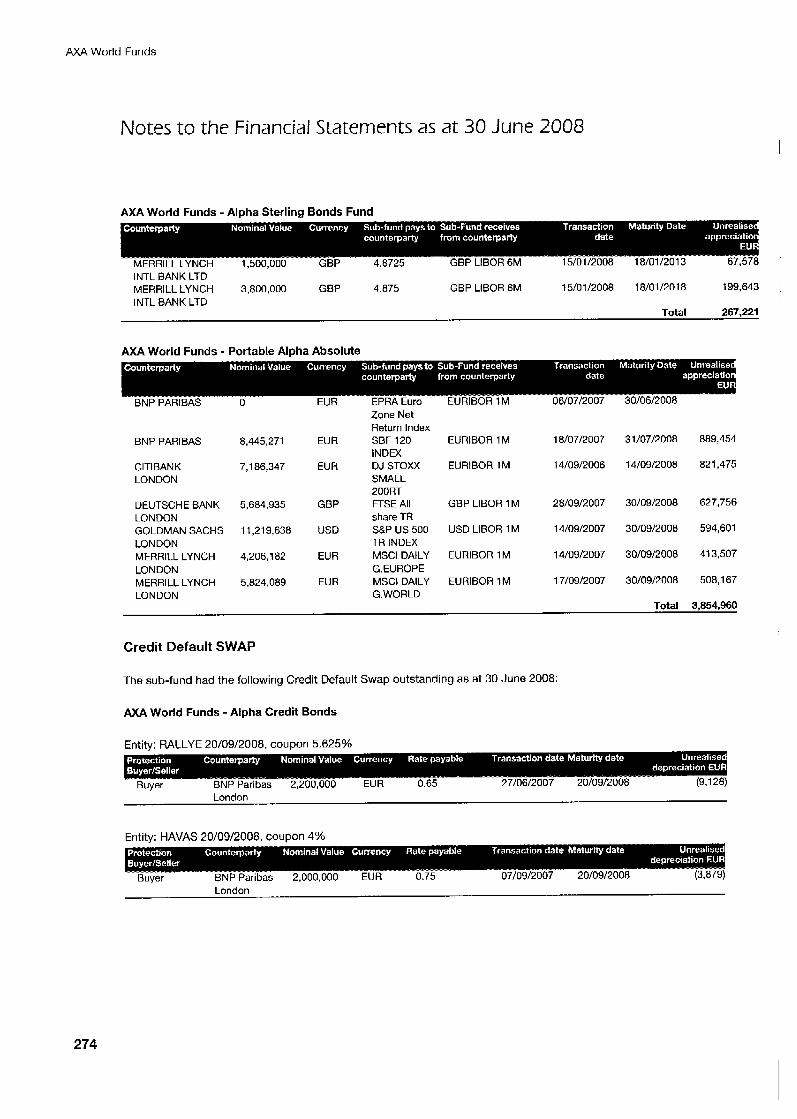
AXA World Funds
Notes to the Financial Statements as at 30 June 2008
AXA World Funds - Alpha Sterling Bonds Fund
INTL BANK LTD
INTL BANK LTD MERRILL LYNCH 3,800,000 GBP 4.875 GBP LlBOR 6M 15/01/2008 18/01/2018 199,643 I
Total 267.221
AXA World Funds - Portable Alpha Absolute
BNP PARI BAS 8,445,271
ClTlBANK 7,186,347 LONDON
DEUTSCHE BANK 5,684,935 LONDON GOLDMAN SACHS 11,219,638 LONDON MERRILL LYNCH 4,206,182 LONDON MERRILL LYNCH 5,824,089 LONDON
Zone Net Return Index
INDEX
SMALL 200RT
EU R SBF 120 EURIBOR 1 M 18/07/2007 31/07/2008 889,454
EUR DJ STOXX EURIBOR 1 M 14/09/2006 14/09/2008 821,475
GBP FTSE All GBP LlBOR 1 M 28/09/2007 30/09/2008 627,756
USD S&P US 500 USD LlBOR 1 M 14/09/2007 30/09/2008 594,601
EUR MSCl DAILY EURIBOR 1 M 14/09/2007 30/09/2008 41 3,507
EU R MSCl DAILY EURIBOR 1M 17/09/2007 30/09/2008 508.1 67
Total 3.854.960
share TR
TR INDEX
G.EUROPE
G.WORLD
Credit Default SWAP
The sub-fund had the following Credit Default Swap outstanding as at 30 June 2008:
AXA World Funds - Alpha Credit Bonds
Entitv: RALLYE 20/09/2008, coupon 5.625%
Entitv: HAVAS 20/09/2008, coupon 4%
Buyer BNP Paribas 2,000,000 EUR 0.75 07/09/2007 20109/2UOU London
274
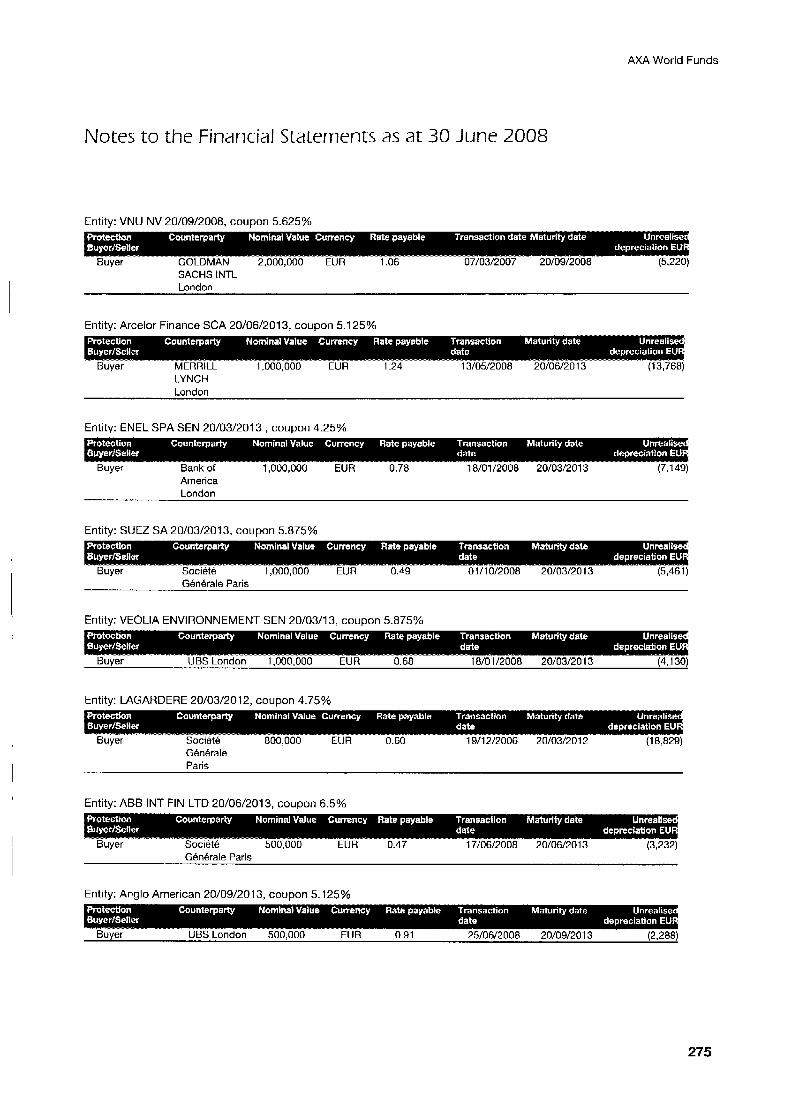
AXA World Funds
Notes to the Financial Statements as at 30 June 2008
Entity: VNU NV 20/09/2008, coupon 5.625%
SACHS INTL London
Entity: Arcelor Finance SCA 20/06/2013, coupon 5.1 25%
LYNCH London
Entity: ENEL SPA SEN 20/03/2013 , coupon 4.25%
America London
Entity: SUEZ SA 20/03/2013, coupon 5.875%
Generale Paris
Entity: VEOLIA ENVIRONNEMENT SEN 20/03/13, coupon 5.875%
Entity: LAGARDERE 20/03/2012, coupon 4.75%
Generale Paris
Entity: ABB INT FIN LTD 20/06/2013, coupon 6.5%
. . . Gbnbrale Paris
Entity: Anglo American 20/09/2013, coupon 5.1 25%
Buyer UBS London 500,000 EUR 0.91 25/06/2008 20/09/2013
275
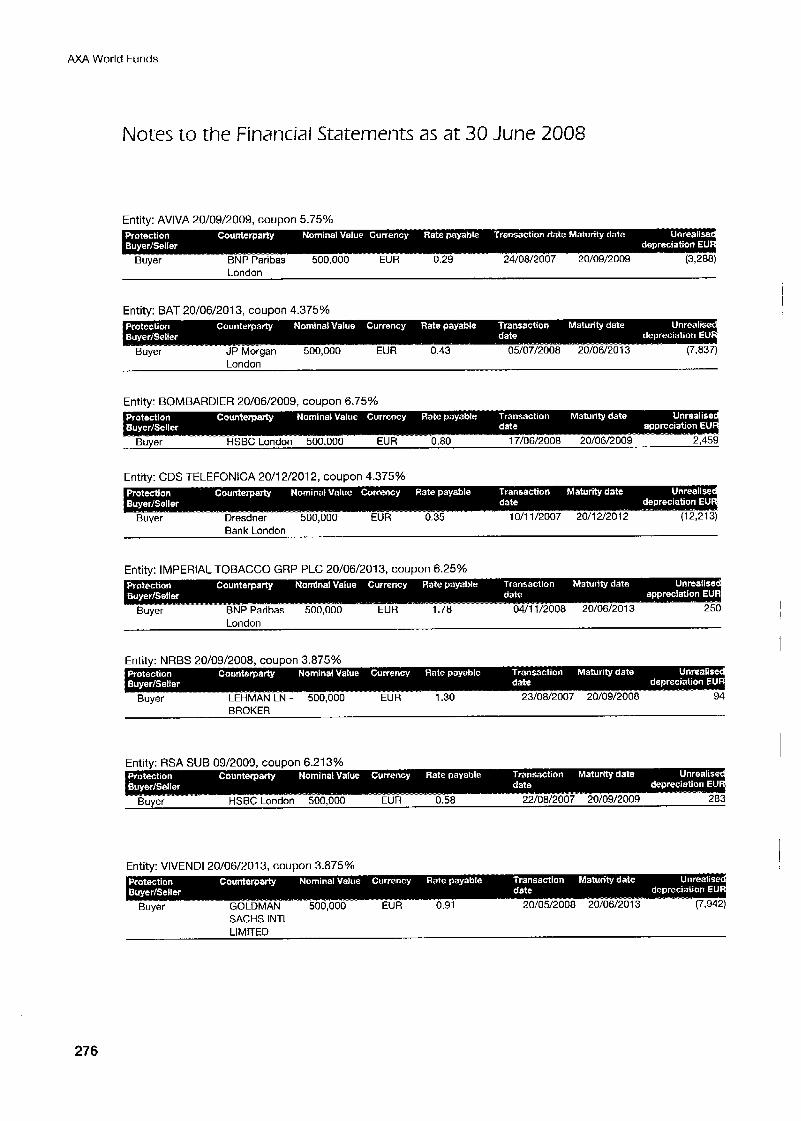
AXA World Funds
Notes to the Financial Statements as at 30 June 2008
Entity: AVIVA 20/09/2009, coupon 5.75%
London
Entitv: BAT 20/06/2013. couDon 4.375%
London
Entitv: BOMBARDIER 20/06/2009, coupon 6.75%
Buyer HSBC London 500,000 EUR o ao 17/06/2008 20/06/2009 2,459
Entity: CDS TELEFONICA 20/12/2012, coupon 4.375%
.- . . Buyer Dresdner 500,000 EUR 0:35 10/11/2007 20/12/2012 (12,213)
BankLondon
Entiw: IMPERIAL TOBACCO GRP PLC 20/06/2013, coupon 6.25%
London
BROKER
Entity: VIVENDI 20/06/2013, coupon 3.875%
Buyer GOLDMAN 500,000 EUR 0.91 SACHS INTL
276
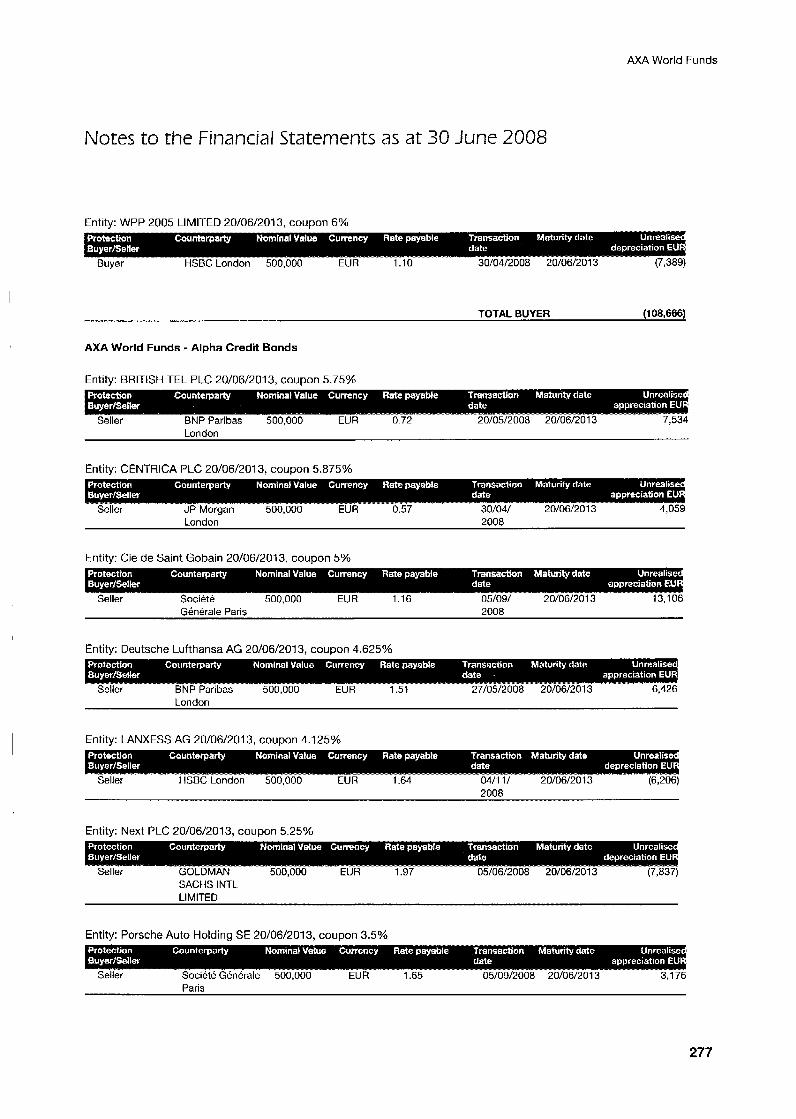
AXA World Funds
Notes to the Financial Statements as at 30 June 2008
Entity: WPP 2005 LIMITED 20/06/2013, coupon 6%
TOTAL BUYER (I 08,686)
AXA World Funds - Alpha Credit Bonds
Entitv: BRITISH TEL PLC 20/06/2013, coupon 5.75%
Entitv: CENTRICA PLC 20/06/2013, coupon 5.875%
Lnndnn 2008
Entity: Cie de Saint Gobain 20/06/2013, coupon 5%
Generale Paris 2008
Entity: Deutsche Lufthansa AG 20/06/2013, coupon 4.625%
Entity: LANXESS AG 20/06/2013, coupon 4.125%
Entity: Next PLC 20/06/2013, coupon 5.25%
SACHS INTL I IMITFO
Entity: Porsche Auto Holding SE 20/06/2013, coupon 3.5%
Paris
277
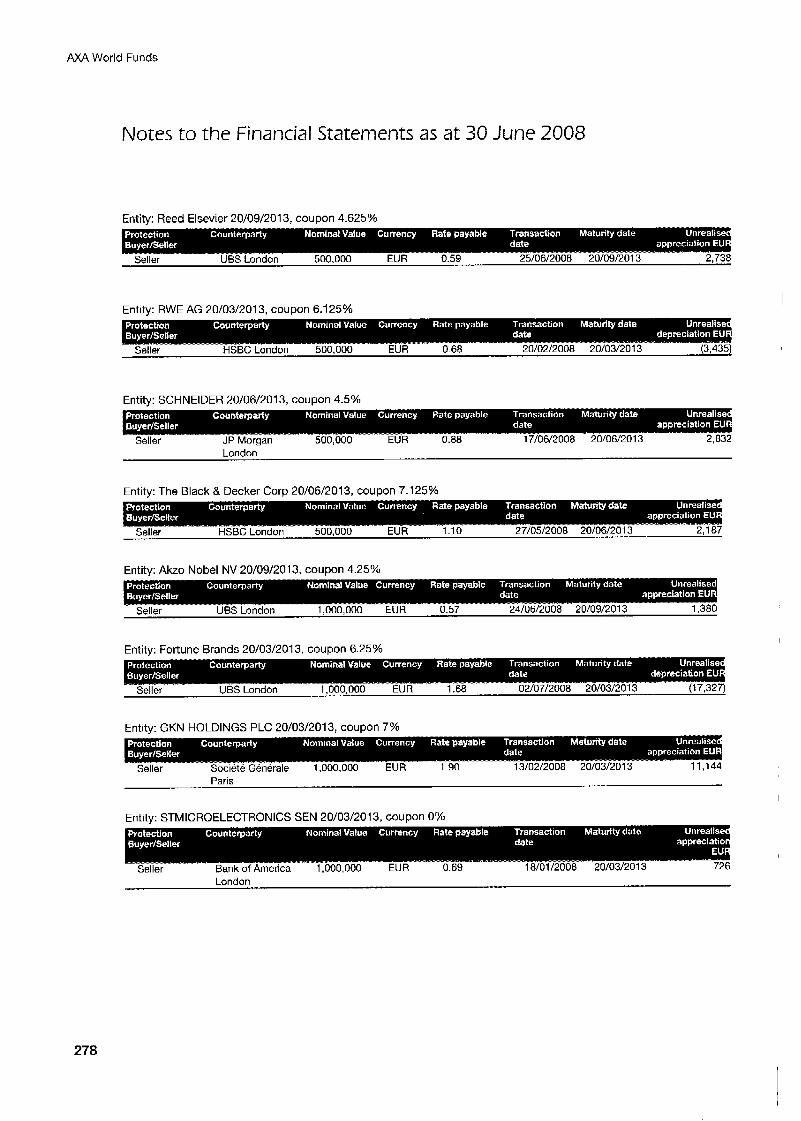
AXA World Funds
Notes to the Financial Statements as at 30 June 2008
Entitv: Reed Elsevier 20/09/2013. couDon 4.625%
Entity: RWE AG 20/03/2013, coupon 6.125%
Entitv: SCHNEIDER 20/06/2013. CouDon 4.5%
JP Morgan 500,000 EUR 0.88 2,832
London
Entitv: The Black 8 Decker Corp 20/06/2013, coupon 7.125%
Entitv: Akzo Nobel NV 20/09/2013, coupon 4.25%
Entitv: Fortune Brands 20/03/2013, coupon 6.25%
Seller UBS London
Entity: GKN HOLDINGS PLC 20/03/2013, coupon 7%
11,144 -
Societe Generale 1 .OOo~OOO --- EUR 1 90 13/02/2008 20/03/2013 Paris
Seller
Entitv: STMICROELECTRONICS SEN 20/03/2013, coupon 0%
0.69 18/01/2008 201UJ~201Y Seller Bank of America 1,000,000 EUR London
278
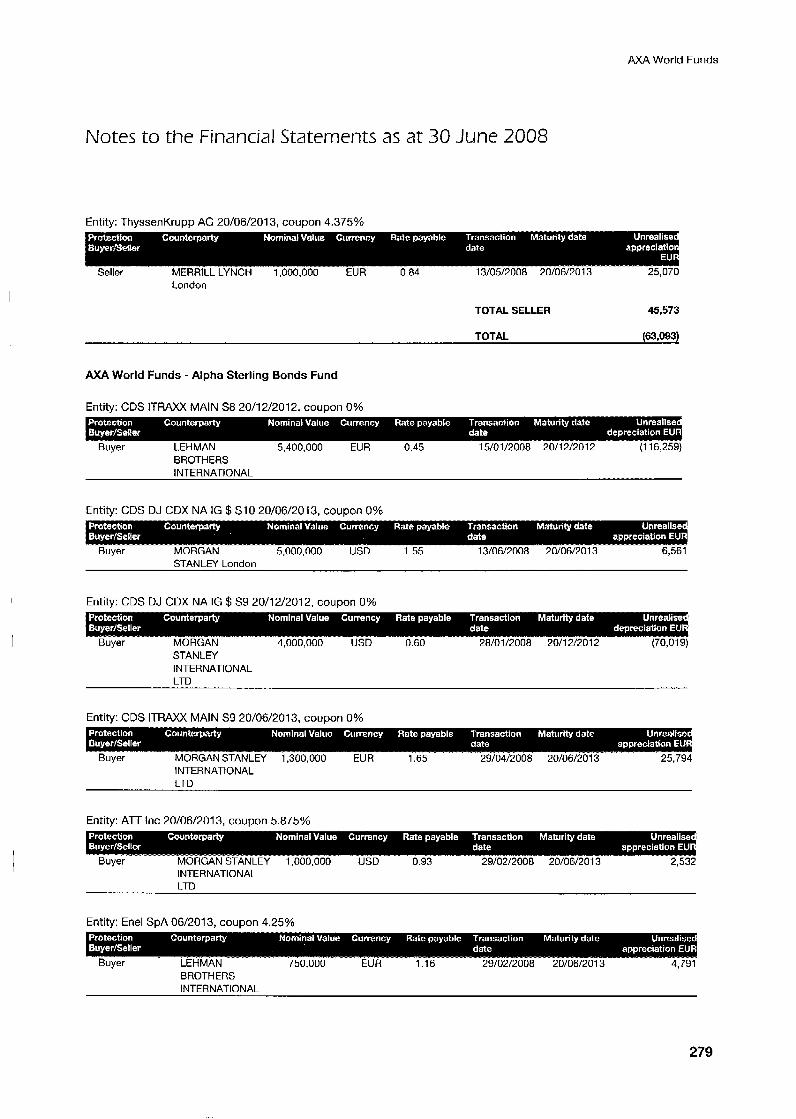
AXA World Funds
Notes to the Financial Statements as at 30 June 2008
Entity: ThyssenKrupp AG 20/06/2013, coupon 4.375%
London
TOTAL SELLER 45,573
TOTAL (63,093)
AXA World Funds - Alpha Sterling Bonds Fund
Entity: CDS ITRAXX MAIN S8 20/12/2012, coupon 0%
BROTHERS INTERNATIONAL
Entity: CDS DJ CDX NA IG $ S10 20/06/2013, coupon 0%
STANLEY London . - -
Entity: CDS DJ CDX NA IG $ S9 20/12/2012, coupon 0%
STANLEY INTERNATIONAL
Entity: CDS ITRAXX MAIN S9 20/06/2013, coupon 0%
INTERNATIONAL
Entity: A n Inc 20/06/2013, coupon 5.875%
INTERNATIONAL I Tr.
Entity: Enel SpA 06/2013, coupon 4.25%
Buyer LEHMAN 750,000 EUR 1.16 29/02/2008 20/06/2013 4,791 BROTHERS INTERNATIONAL
279
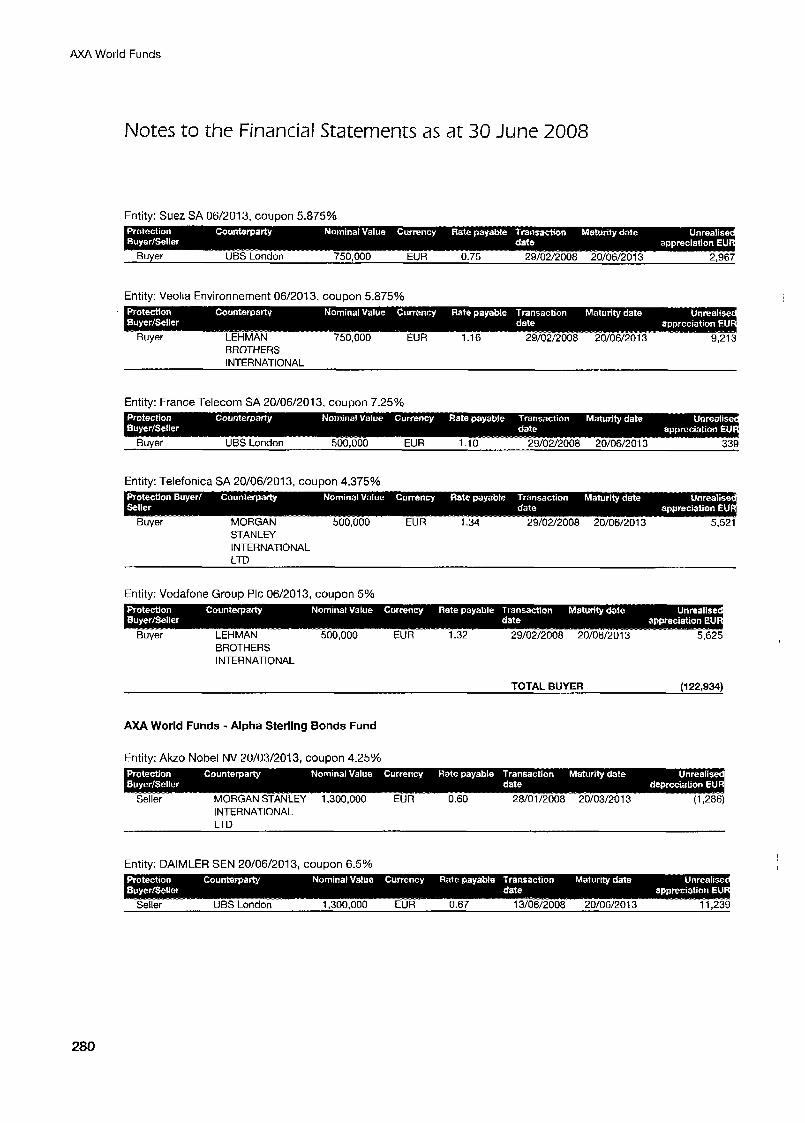
AXA World Funds
Notes to the Financial Statements as at 30 June 2008
Entity: Suez SA 06/2013, coupon 5.875%
Buyer UBS London 750,000 EU R 0.75 29fO2l2008 20/06/2013 2,967
Entity: Veolia Environnernent 06/2013, coupon 5.875%
BROTHERS INTERNATIONAL
Entity: France Telecom SA 20/06/2013, coupon 7.25%
Buyer UBS London 500,000 EUR 1.10 29/02/2008 20l06f2013 339
Entity: Telefonica SA 20/06/2013, coupon 4.375%
STAN LEY INTERNATIONAL LTD
Entity: Vodafone Group PIC 06/2013, coupon 5%
BROTHERS INTERNATIONAL
TOTAL BUYER (1 22,934)
AXA World Funds - Alpha Sterling Bonds Fund
Entity: Akzo Nobel NV 20/03/2013, coupon 4.25%
INTERNATIONAL
Entity: DAIMLER SEN 20/06/2013, coupon 6.5%
280
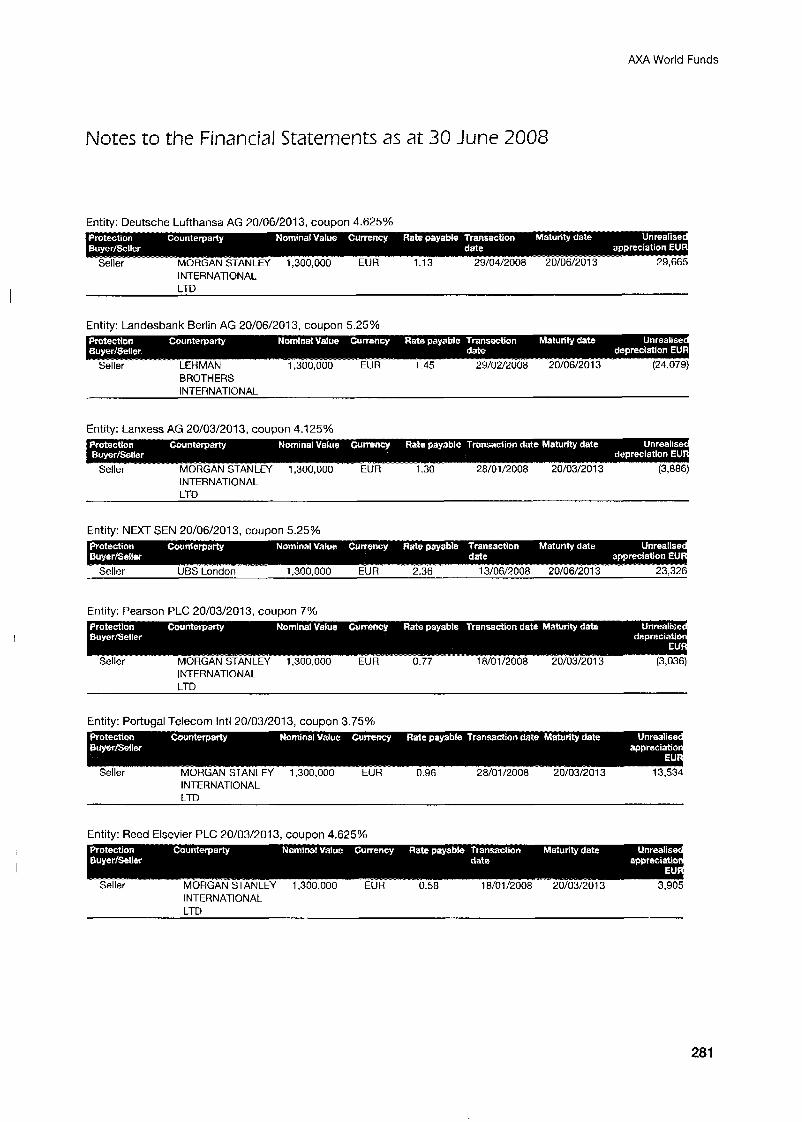
AXA World Funds
I
Notes to the Financial Statements as at 30 June 2008
Entin/: Deutsche Lufthansa AG 20/06/2013, cowon 4.625%
Seller MORGAN STANLEY 1,300,000 EUR 1.13 29/04/2008 20/06/2013 29,665
INTERNATIONAL
Entity: Landesbank Berlin AG 20/06/2013, coupon 5.25%
Seller LEHMAN 1,300,000 EUR 1.45 29/02/2008 20/06/2013 (24,079) BROTHERS INTERNATIONAL
Entitv: Lanxess AG 20/03/2013. cowon 4.125% . .
Seller MORGAN STANLEY 1,300,000 EUR 1.30 28/01/2008 20/03/2013 INTERNATIONAL LTD
Entity: NEXT SEN 20/06/2013, coupon 5.25%
Seller UBS London 1,300,000 EUR 2.36 13/06/2008 20/06/2013 23,326
Entity: Pearson PLC 20/03/2013, coupon 7%
Seller MORGAN STANLEY 1,300,000 EUR 0 77 18/01/2008 20/03/2013 INTERNATIONAL LTD
Entity: Portugal T e l e c o m lntl 20/03/2013, coupon 3.75%
INTERNATIONAL
Entity: Reed Elsevier PLC 20/03/2013, coupon 4.625%
Seller MORGAN STANLEY 1,300,000 EUR 0.58 18/01/2008 20/03/2013 3,905 INTERNATIONAL LTD
281
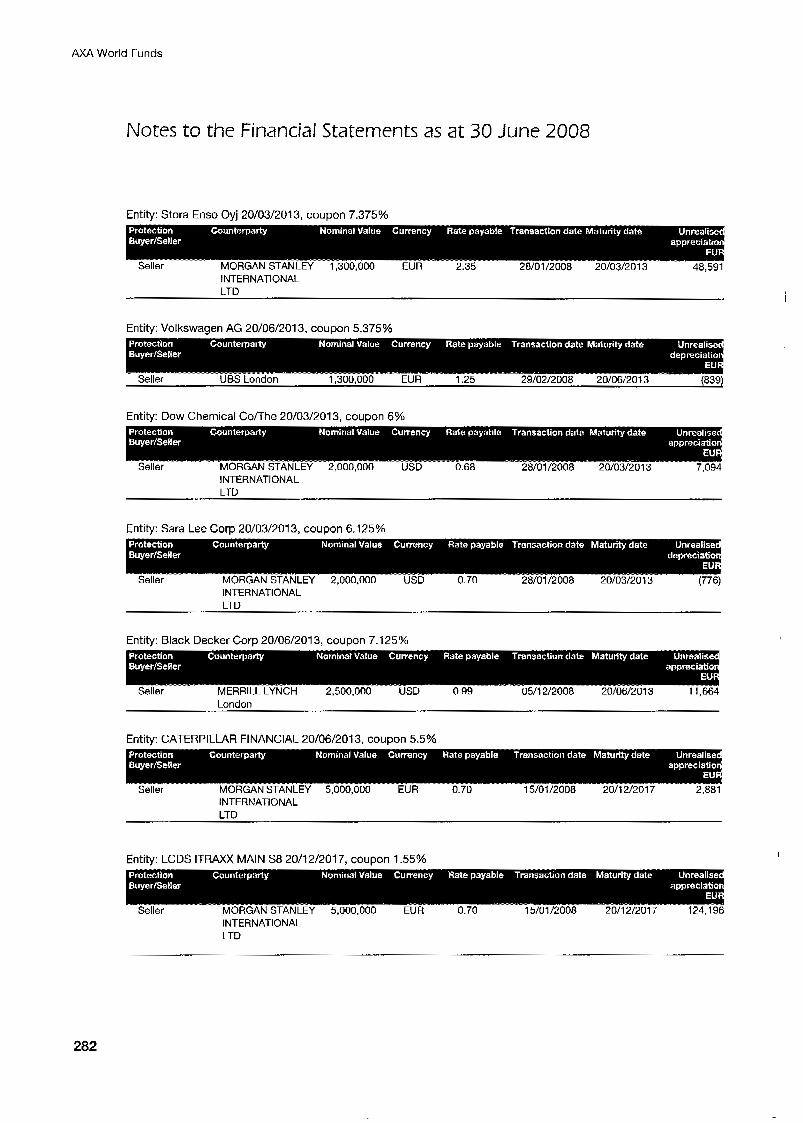
AXA World Funds
Notes to the Financial Statements as at 30 June 2008
Entitv: Sora Enso Ovi 20/03/2013, coupon 7.375%
INTERNATIONAL LTD
Entity: Volkswagen AG 20/06/2013, coupon 5.375%
Entitv: Dow Chemical CoAhe 20/03/2013, coupon 6%
INTERNATIONAL LTD
Entitv: Sara Lee CorD 20/03/2013, coupon 6.125%
Seller MORGAN STANLEY 2,000.000 USD 0.70 INTERNATIONAL
Entity: Black Decker Corp 20/06/2013, coupon 7.125%
Seller MERRILL LYNCH 2,500,000 USD 0 99 05/12/2008 20/06/2013 11,664
London
Fntitv: CATERPILLAR FINANCIAL 20/06/2013. CoUDon 5.5%
MORGAN STANLEY 5,000,000 EUR 0 70 15/01/2008 20/1212017 2.1181
INTERNATIONAL LTD
Fntitv: I CDS ITRAXX MAIN S8 20/12/2017. couDon 1.55%
Seller MORGAN STANLEY 5,000,000 tUK 0. I U 1 S / U l I Z U U ~ zu/ I ztzu I I IL4, IYO
INTERNATIONAL LTD
282
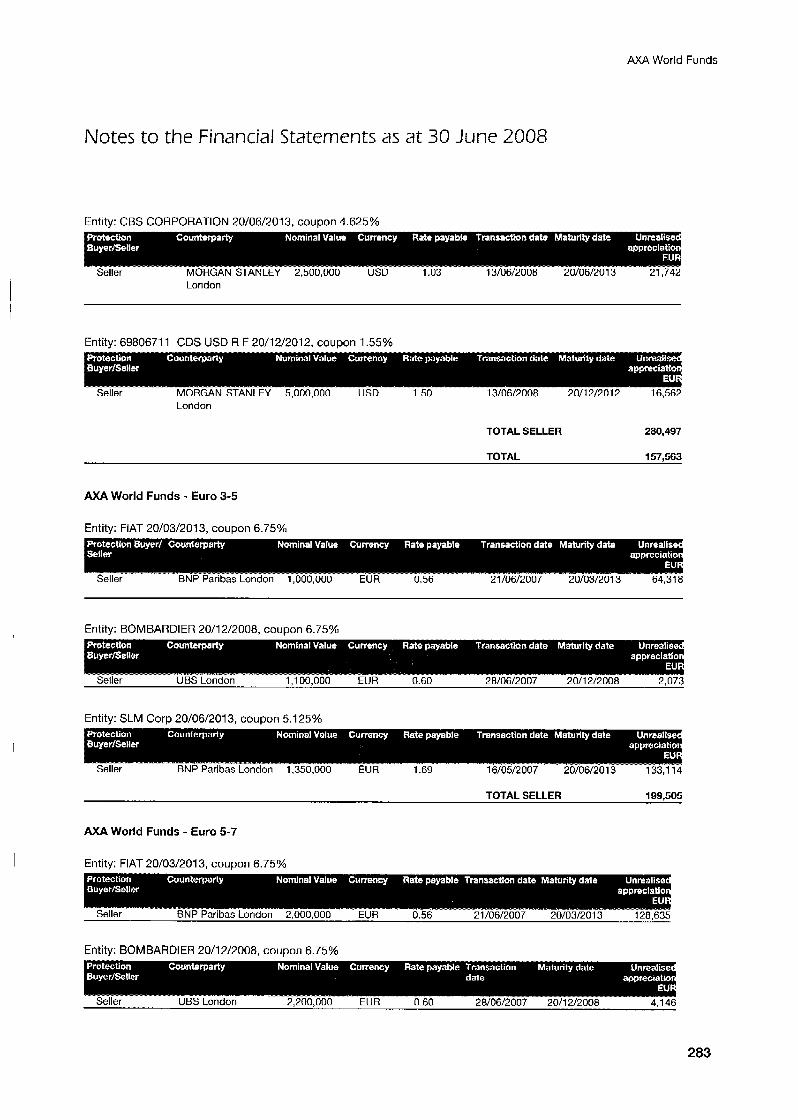
AXA World Funds
Notes to the Financial Statements as at 30 June 2008
Entity: CBS CORPORATION 20/06/2013, coupon 4.625%
Seller MORGAN STANLEY 2,500,000 USD 1 0 3 13/06/2008 20/06/2013 21,742 London
Entity: 6980671 1 CDS USD R F 20/12/2012, coupon 1.55%
Seller MORGAN STANLEY 5,000,000 USD 1 5 0 13/06/2008 2011 21201 2 16,562 London
TOTAL SELLER 280,497
TOTAL 157,563
AXA World Funds - Euro 3-5
Entity: FIAT 20/03/2013, coupon 6.75%
Seller BNP Paribas London 1,000,000 EUR 0.56 21/06/2007 20/03/2013 6 4 3 1 a
Entity: BOMBARDIER 20/12/2008, coupon 6.75%
Entity: SLM Corp 20/06/2013, coupon 5.1 25%
TOTAL SELLER 199,505
AXA World Funds - Euro 5-7
Entity: FIAT 20/03/2013, coupon 6.75%
Seller BNP Paribas London 2,000,000 EUR 0.56 21/06/2007 20/03/2013 128,635
Entity: BOMBARDIER 20/12/2008, coupon 6.75%
283
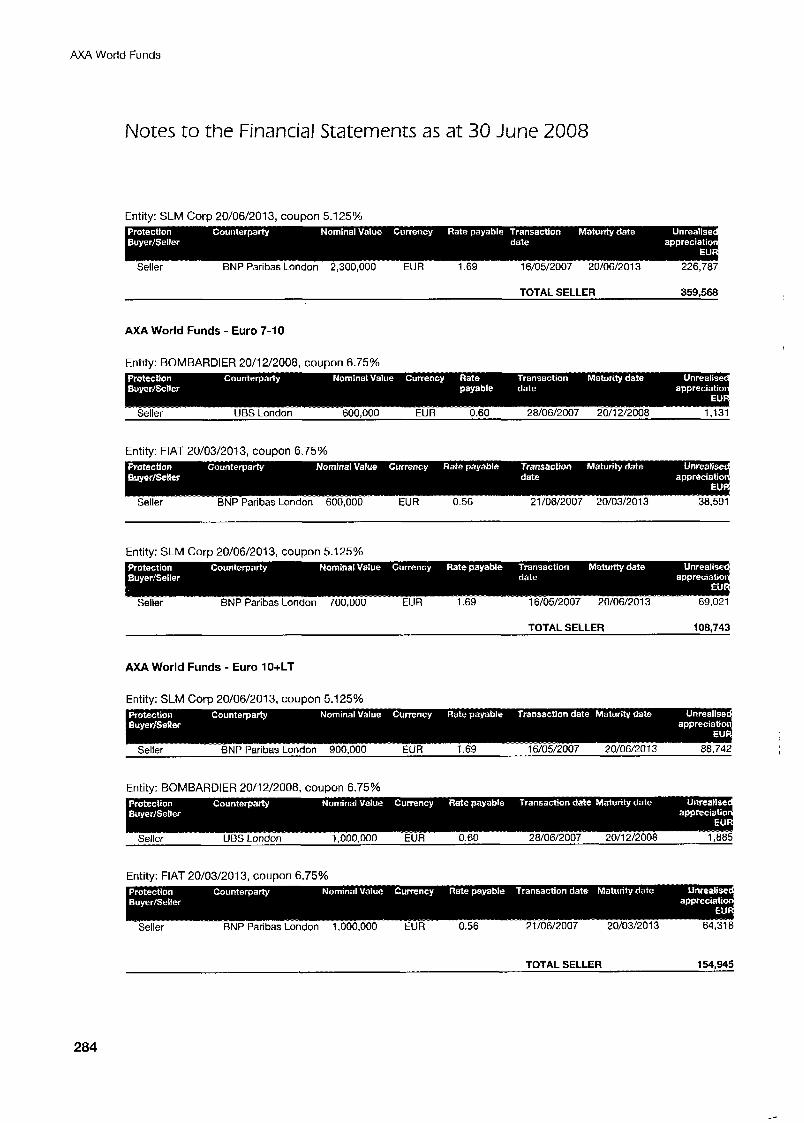
AX4 World Funds
Notes to the Financial Statements as at 30 June 2008
Entity: SLM Corp 20/06/2013, coupon 5.1 25%
Seller BNP Paribas London 2,300,000 EUR 1.69 16/05/2007 20/06/2013 226,787
TOTAL SELLER 359,568
AXA World Funds - Euro 7-10
Entity: BOMBARDIER 20/12/2008, coupon 6.75%
Seller UBS London 600,000 EUR 0.60 28/06/2007 2011 212008 1,131
Entity: FIAT 20/03/2013, coupon 6.75%
Entity: SLM Corp 20/06/2013, coupon 5.125%
Seller BNP Paribas London 1UU,UUU tun 1 .bY 1 bjlusrzuu~ 20/06/2013 69,021
TOTAL SELLER 108,743
AXA World Funds - Euro 10+LT
Entity: SLM Corp 20/06/2013, coupon 5.1 25%
Seller ENP Paribas London 900,000 EUR 1.69 16/05/2007 20/06/2013
Entity: BOMBARDIER 20/12/2008, coupon 6.75%
Entitv: FIAT 20/03/2013. comon 6.75%
Seller BNP Paribas London 1,000,000 EUR 0.56 21/06/2007 20/03/2013 64,318
TOTAL SELLER 154,945
284
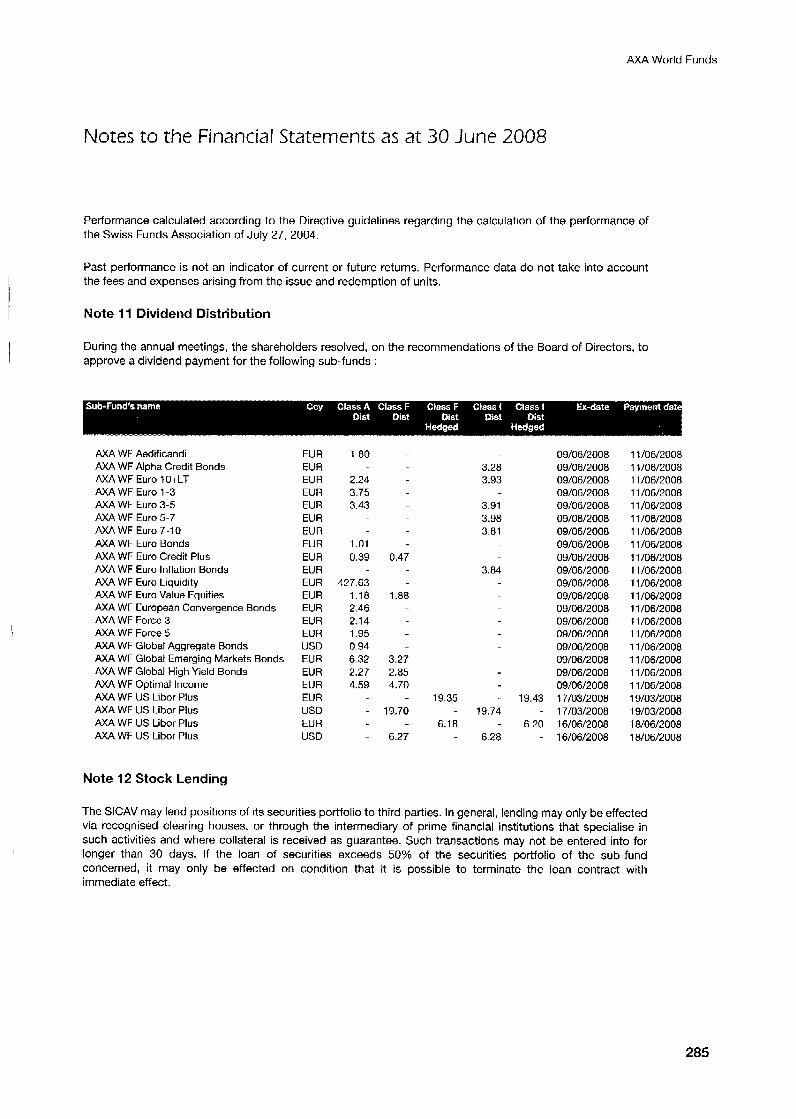
AXA World Funds
I
Notes to the Financial Statements as a t 30 June 2008
Performance calculated according to the Directive guidelines regarding the calculation of the performance of the Swiss Funds Association of July 27, 2004.
Past performance is not an indicator of current or future returns. Performance data do not take into account the fees and expenses arising from the issue and redemption of units.
Note 11 Dividend Distribution
During the annual meetings, the shareholders resolved, on the recommendations of the Board of Directors, to approve a dividend payment for the following sub-funds :
AXA WF Aedificandi AXA WF Alpha Credit Bonds AXA WF Euro 1 O+LT AXA WF Euro 1-3 AXA WF Euro 3-5 AXA WF Euro 5-7 AXA WF Euro 7-10 AXA WF Euro Bonds AXA WF Euro Credit Plus AXA WF Euro Inflation Bonds AXA WF Euro Liquidity AXA WF Euro Value Equities AXA WF European Convergence Bonds AXA WF Force 3 AXA WF Force 5 AXA WF Global Aggregate Bonds AXA WF Global Emerging Markets Bonds AXA WF Global High Yield Bonds AXA WF Optimal Income AXA WF US Libor Plus AXA WF US Libor Plus AXA WF US Libor Plus AXA WF US Libor Plus
Note 12 Stock Lending
EUR EUR EUR EUR EUR EUR EUR EUR EUR EUR EUR EUR EUR EUR EUR USD EUR EUR EUR EUR USD EUR USD
1.80
2.24 3.75 3.43
1.01 0.39
427.63 1.18 2.46 2.14 1.95 0.94 6.32 2.27 4.59
3.28 3.93
3.91 3.98 3.81
0.47 3.84
1.88
3.27 2.85 4.70
- 19.35 - 19.43 19.70 - 19.74
- 6.18 - 6.20 6.27 - 6.28
09/06/2008 09/06/2008 09/06/2008 09/06/2008 09/06/2008 09/06/2008 09/06/2008 09/06/2008 09/06/2008 09/06/2008 09/06/2008 09/06/2008 09/06/2008 09/06/2008
09/06/2008 09/06/2008 09/06/2008 09/06/2008 17/03/2008 17/03/2008 16/06/2008 16/06/2008
09/06/200a
11/06/2008 11/06/2008 11/06/2008 11/06/2008 11/06/2008 11/06/2008 11/06/2008 11/06/2008 11/06/2008 11/06/2008 11/06/2008 11/06/2008 1 1 /06/2008 11/06/2008 11/06/2008 11/06/2008 11/06/2008 11/06/2008 11/06/2008 19/03/2008 19/03/2008 18/06/2008 18/06/2008
The SICAV may lend positions of its securities portfolio to third parties. In general, lending may only be effected via recognised clearing houses, or through the intermediary of prime financial institutions that specialise in such activities and where collateral is received as guarantee. Such transactions may not be entered into for longer than 30 days. If the loan of securities exceeds 50% of the securities portfolio of the sub-fund concerned, it may only be effected on condition that it is possible to terminate the loan contract with immediate effect.
285
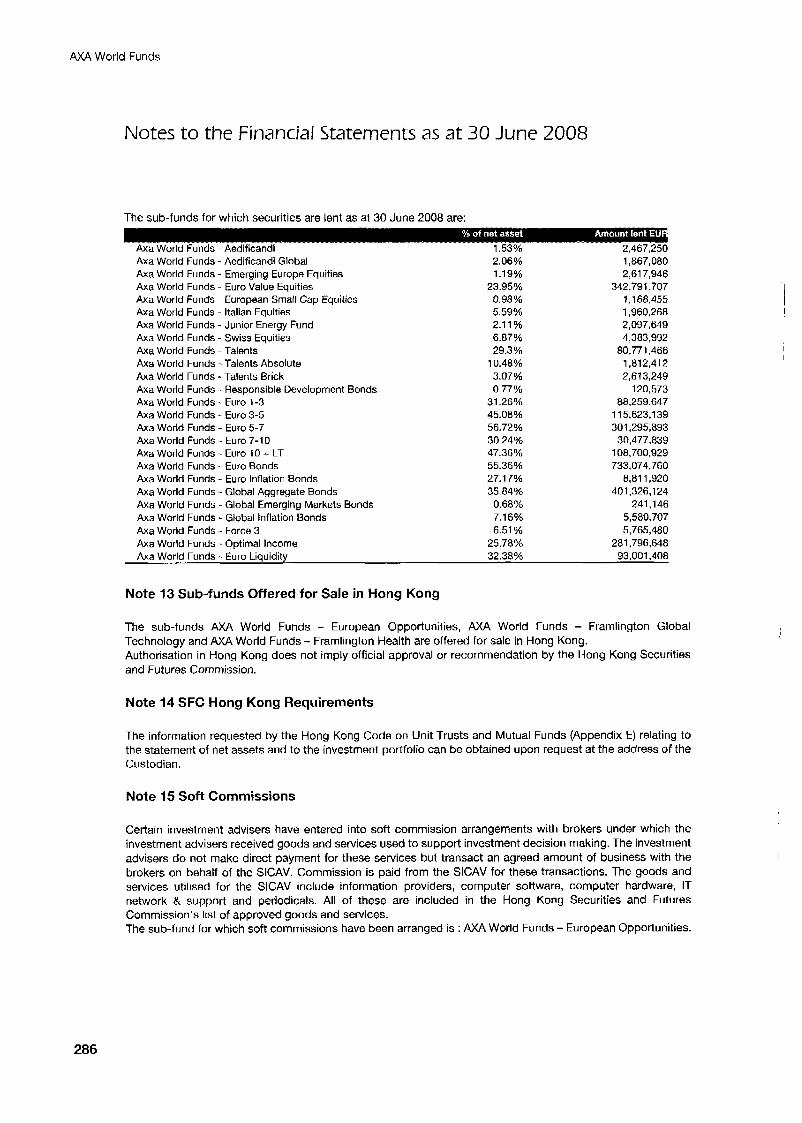
AXA World Funds
Notes to the Financial Statements as at 30 June 2008
The sub-funds for which securities are lent as at 30 June 2008 are:
Axa World Funds - Aedificandi Global Axa World Funds - Emerging Europe Equities Axa World Funds - Euro Value Equities Axa World Funds - European Small Cap Equities Axa World Funds - Italian Equities Axa World Funds - Junior Energy Fund Axa World Funds - Swiss Equities Axa World Funds - Talents Axa World Funds - Talents Absolute Axa World Funds - Talents Brick Axa World Funds - Responsible Development Bonds Axa World Funds - Euro 1-3 Axa World Funds - Euro 3-5 Axa World Funds - Euro 5-7 Axa World Funds - Euro 7-10 Axa World Funds - Euro 10 + LT Axa World Funds - Euro Bonds Axa World Funds - Euro Inflation Bonds Axa World Funds - Global Aggregate Bonds Axa World Funds - Global Emerging Markets Bonds Axa World Funds - Global Inflation Bonds Axa World Funds - Force 3 Axa World Funds - Optimal Income Axa World Funds - Euro Liquidity
2.06% 1.19%
23.95% 0.98% 5.59% 2.1 1 %
29.3% 10.48% 3.07% 0.77%
31.26% 45.08% 56.72% 30.24% 47.36% 55.36% 27.17%
6.87%
35.84% 0.68%
25.78%
7.16% 6.51 %
32.38%
Note 13 Sub-funds Offered for Sale in Hong Kong
1,867,080 2,617,946
342,791,707 1,168.455 1,960,268 2,097,649
80,771,466 1,812,412 2,613,249
120,573 88,259,647
1 15,623.1 39 301,295,893
30,477,839 108,700,929 733,074,760
8,811,920 401,326,124
241,146 5,580,707 5,765,480
281,796,648 93,001,408
4,383,992
The sub-funds AXA World Funds - European Opportunities, AXA World Funds - Framlington Global Technology and AXA World Funds - Framlington Health are offered for sale in Hong Kong. Authorisation in Hong Kong does not imply official approval or recommendation by the Hong Kong Securities and Futures Commission.
Note 14 SFC Hong Kong Requirements
The information requested by the Hong Kong Code on Unit Trusts and Mutual Funds (Appendix E) relating to the statement of net assets and to the investment portfolio can be obtained upon request at the address of the Custodian.
Note 15 Soft Commissions
Certain investment advisers have entered into soft commission arrangements with brokers under which the investment advisers received goods and services used to support investment decision making. The investment advisers do not make direct payment for these services but transact an agreed amount of business with the brokers on behalf of the SICAV. Commission is paid from the SICAV for these transactions. The goods and services utilised for the SICAV include information providers, computer software, computer hardware, IT network & support and periodicals. All of these are included in the Hong Kong Securities and Futures Commission’s list of approved goods and services. The sub-fund for which soft commissions have been arranged is : AXA World Funds - European Opportunities.
I
286
AXA World Funds
Notes to the Financial Statements as at 30 June 2008
Note 16 Connected Party Transactions
Other than investment management functions and as defined for Hong Kong purposes, the SICAV did not enter into connected party transactions.
Note 17 SlCAV Events
Modification of fees
Changes in thc administrative fees in Alpha Asian Bonds as follows :
Insertion of new fees applicable to “E” Shares of Alpha Asian Bonds In addition, the Company will pay a maximum distribution fee of 0.25% for the class “E” Shares which is calculated on top of the annual management fee, as a percentage of the Net Asset Value of the Sub-Fund.
Change to thc calculation of the performance fccs in Alpha Sttrling Bunds :
The benchmark used for the calculation of the performance fees of Classes of Shares denominated in GBP shall be modified as follows : The benchmark index for comparison is capitalised EONIA CAP + 200 basis gross for Classes of Shares denominated in Euro, capitalised US Libor 1 week + 200 basis points for Classes of Shares denominated in USD and capitalised GBP Libor 1 week + 200 basis points for Classes of Shares denominated in GBP. For each Share Class this gross hurdle rate is adjusted with the related fixed fees to define the net hurdle rate.
Modification of Investment Policies
The last indent of the “Investment Policy” section of Alpha Sterling Bonds shall be amended as follows : “The Value-at-Risk (VaR) is the percentage of Net Asset Value that a portfolio may lose on a given time horizon, at a given confidence level. In respect of theis Sub-Fund, the Value-at-Risk level of 2% of the Sub-Fund Net Asset Value will have a five Business Days horizon and 95% confidence level parameters. This means that there is a probability of 5% that a loss experienced by the Sub-Fund within the five (5) Business Days horizon may be higher than 2% of the Sub-Fund’s Net Asset Value. The Reference Currency of the Sub-Fund is GBP.
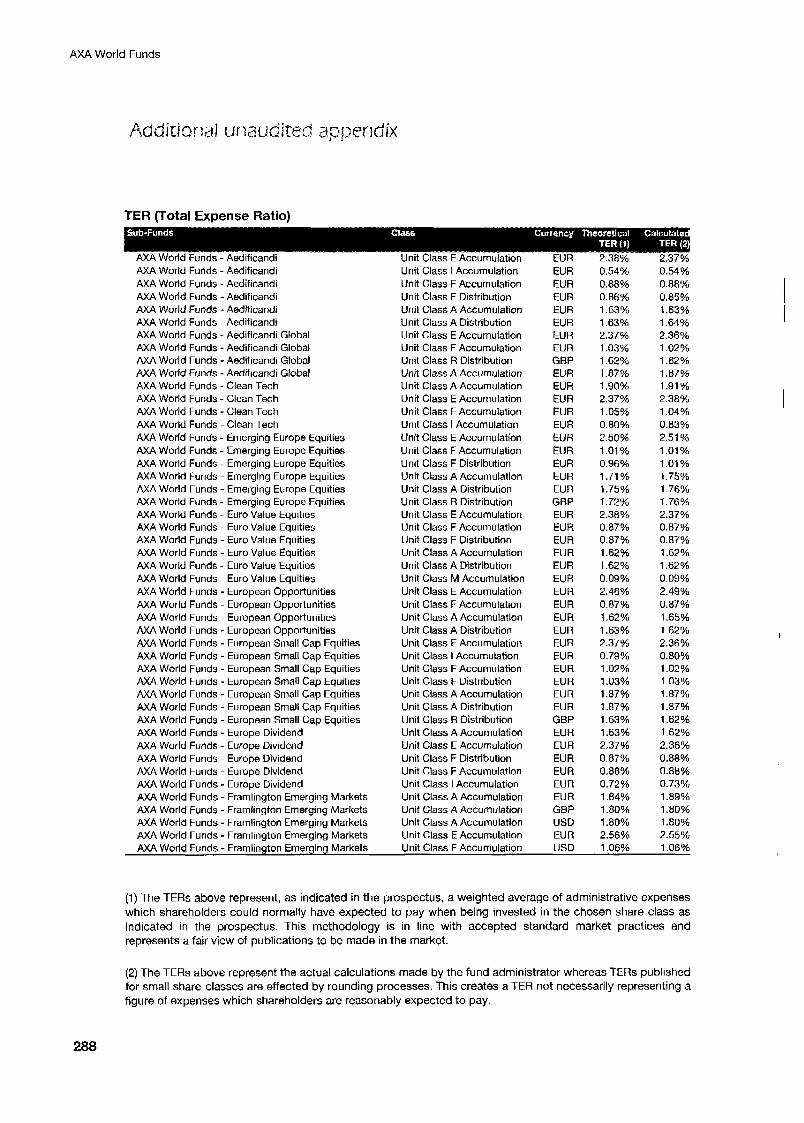
AXA World Funds
Additional unaudited appendix
TER (Total Expense Ratio)
AXA World Funds - Aedificandi Unit Class E Accumulation EUR 2.38% 2.37% AXA World Funds - Aedificandi AXA World Funds - Aedificandi AXA World Funds - Aedificandi AXA World Funds - Aedificandi AXA World Funds - Aedificandi AXA World Funds - Aedificandi Global AXA World Funds - Aedificandi Global AXA World Funds - Aedificandi Global AXA World Funds - Aedificandi Global AXA World Funds - Clean Tech AXA World Funds - Clean Tech AXA World Funds - Clean Tech AXA World Funds - Clean Tech AXA World Funds - Emerging Europe Equities AXA World Funds - Emerging Europe Equities AXA World Funds - Emerging Europe Equities AXA World Funds - Emerging Europe Equities AXA World Funds - Emerging Europe Equities AXA World Funds - Emerging Europe Equities AXA World Funds - Euro Value Equities AXA World Funds - Euro Value Equities AXA World Funds - Euro Value Equities M A World Funds - Euro Value Equities AXA World Funds - Euro Value Equities AXA World Funds - Euro Value Equities AXA World Funds - European Opportunities AXA World Funds - European Opportunities AXA World Funds - European Opportunities AXA World Funds - European Opportunities AXA World Funds - European Small Cap Equities AXA World Funds - European Small Cap Equities AXA World Funds - European Small Cap Equities AXA World Funds - European Small Cap Equities AXA World Funds - European Small Cap Equities AXA World Funds - European Small Cap Equities AXA World Funds - European Small Cap Equities AXA World Funds - Europe Dividend AXA World Funds - Europe Dividend AXA World Funds - Europe Dividend AXA World Funds - Europe Dividend AXA World Funds - Europe Dividend AXA World Funds - Frarnlington Emerging Markets AXA World Funds - Frarnlington Emerging Markets AXA World Funds - Frarnlington Emerging Markets AXA World Funds - Frarnlington Emerging Markets
Unit Class I Accumulation Unit Class F Accumulation Unit Class F Distribution Unit Class A Accumulation Unit Class A Distribution Unit Class E Accumulation Unit Class F Accumulation Unit Class R Distribution Unit Class A Accumulation Unit Class A Accumulation Unit Class E Accumulation Unit Class F Accumulation Unit Class I Accumulation Unit Class E Accumulation Unit Class F Accumulation Unit Class F Distribution Unit Class A Accumulation Unit Class A Distribution Unit Class R Distribution Unit Class E Accumulation Unit Class F Accumulation Unit Class F Distribution Unit Class A Accumulation Unit Class A Distribution Unit Class M Accumulation Unit Class E Accumulation Unit Class F Accumulation Unit Class A Accumulation Unit Class A Distribution Unit Class E Accumulation Unit Class I Accumulation Unit Class F Accumulation Unit Class F Distribution Unit Class A Accumulation Unit Class A Distribution Unit Class R Distribution Unit Class A Accumulation Unit Class E Accumulation Unit Class F Distribution Unit Class F Accumulation Unit Class I Accumulation Unit Class A Accumulation Unit Class A Accumulation Unit Class A Accumulation Unit Class E Accumulation
EU R EUR EUR EUR EUR EUR EU R GBP EUR EUR EUR EUR EUR EUR EUR EU R EUR EUR GEP EUR EUR EUR EUR EU R EUR EUR EU R EUR EUR EUR EUR EUR EUR EU R EUR GBP EUR EUR EUR EUR EUR EUR GBP USD EU R
0.54% 0.88% 0.86% 1.63% 1.63% 2.37% 1.03% 1.62% 1.87% 1.90% 2.37% 1.05% 0.80% 2.50% 1.01 % 0.96% 1.71 % 1.75% 1.72% 2.38% 0.87% 0.87% 1.62% 1.62% 0.09% 2.46% 0.87% 1.62% 1.63% 2.37% 0 . 7 9 O 1 6 1.02% 1.03% 1.87% 1.87% 1.63% 1.63% 2.37% 0.87% 0.88% 0.72% 1.84% 1 .SO% 1.80% 2.56%
0.54% 0.88% 0.85% 1.63% 1.64% 2.36% 1.02% 1.62O% 1 .87Oh 1.91 % 2.38% 1.04% 0.83% 2.51% 1.01 % 1-01 % 1.75% 1.76% 1.76% 2.37% 0.87% 0.87% 1.62% 1.62% 0.09% 2.49% 0.87% 1.65% 1.62% 2.36% 0.80% 1.02% 1.03Yo 1.87% 1.87% 1.62% 1.62% 2.36% 0.88% 0.88% 0.73% 1.89% 1.80% 1 .SO% 2.55%
AXA World Funds - Framlington Emerging Markets Unit Class F Accumulation USD 1.06% 1.06%
(1) The TERs above represent, as indicated in the prospectus, a weighted average of administrative expenses which shareholders could normally have expected to pay when being invested in the chosen share class as indicated in the prospectus. This methodology is in line with accepted standard market practices and represents a fair view of publications to be made in the market.
(2) The TERs above represent the actual calculations made by the fund administrator whereas TERs published for small share-classes are effected by rounding processes. This creates a TER not necessarily representing a figure of expenses which shareholders are reasonably expected to pay.
288
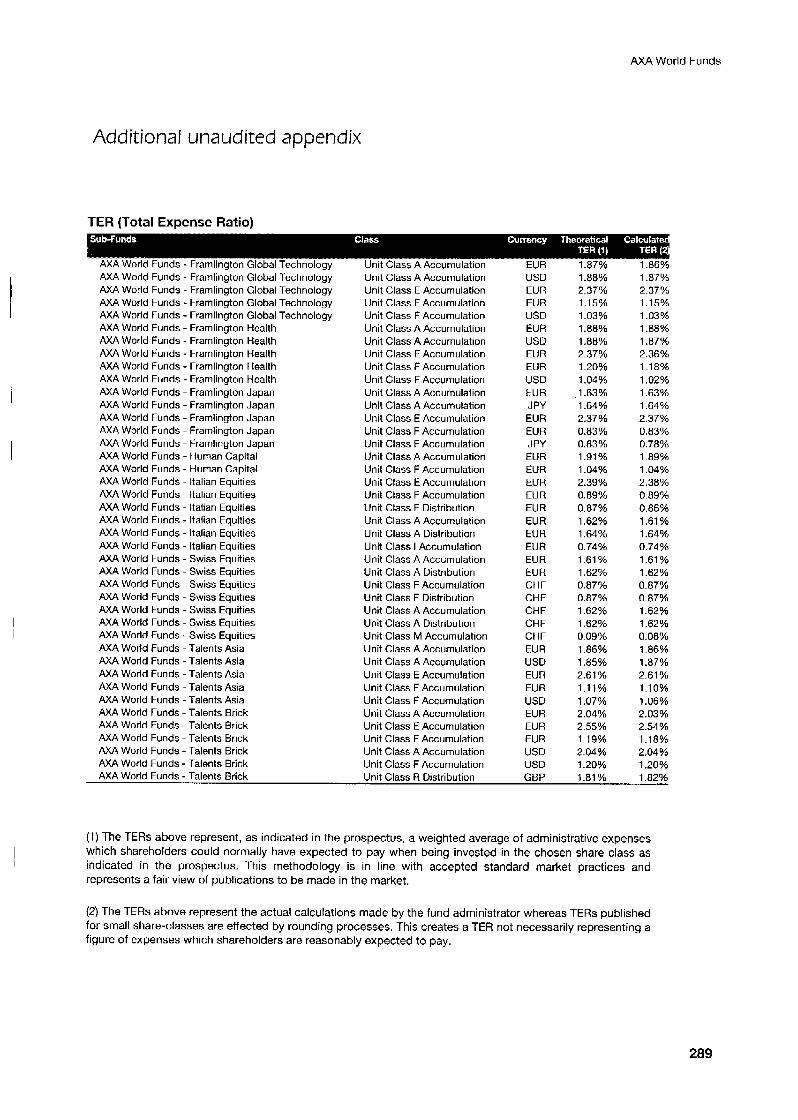
AXA World Funds
Add i t i o na I una ud i ted appendix
TER (Total Expense Ratio)
AXA World Funds - Framlington Global Technology AXA World Funds - Framlington Global Technology AXA World Funds - Framlington Global Technology AXA World Funds - Framlington Global Technology AXA World Funds - Framlington Health AXA World Funds - Framlington Health AXA World Funds - Framlington Health AXA World Funds - Framlington Health AXA World Funds - Framlington Health AXA World Funds - Framlington Japan AXA World Funds - Framlington Japan AXA World Funds - Framlington Japan AXA World Funds - Framlington Japan AXA World Funds - Framlington Japan AXA World Funds - Human Capital AXA World Funds - Human Capital AXA World Funds - Italian Equities AXA World Funds - Italian Equities AXA World Funds - Italian Equities AXA World Funds - Italian Equities AXA World Funds - Italian Equities AXA World Funds - Italian Equities AXA World Funds - Swiss Equities AXA World Funds - Swiss Equities AXA World Funds - Swiss Equities AXA World Funds - Swiss Equities AXA World Funds - Swiss Equities AXA World Funds - Swiss Equities AXA World Funds - Swiss Equities AXA World Funds - Talents Asia AXA World Funds - Talents Asia AXA World Funds - Talents Asia AXA World Funds - Talents Asia AXA World Funds - Talents Asia AXA World Funds - Talents Brick AXA World Funds - Talents Brick AXA World Funds - Talents Brick AXA World Funds - Talents Brick AXA World Funds - Talents Brick
Unit Class A Accumulation EUR 1.87% Unit Class A Accumulation Unit Class E Accumulation Unit Class F Accumulation Unit Class F Accumulation Unit Class A Accumulation Unit Class A Accumulation Unit Class E Accumulation Unit Class F Accumulation Unit Class F Accumulation Unit Class A Accumulation Unit Class A Accumulation Unit Class E Accumulation Unit Class F Accumulation Unit Class F Accumulation Unit Class A Accumulation Unit Class F Accumulation Unit Class E Accumulation Unit Class F Accumulation Unit Class F Distribution Unit Class A Accumulation Unit Class A Distribution Unit Class I Accumulation Unit Class A Accumulation Unit Class A Distribution Unit Class F Accumulation Unit Class F Distribution Unit Class A Accumulation Unit Class A Distribution Unit Class M Accumulation Unit Class A Accumulation Unit Class A Accumulation Unit Class E Accumulation Unit Class F Accumulation Unit Class F Accumulation Unit Class A Accumulation Unit Class E Accumulation Unit Class F Accumulation Unit Class A Accumulation Unit Class F Accumulation Unit Class R Distribution
USD EUR EUR USD EUR USD EUR EUR USD EUR J PY EUR EUR J PY EUR EUR EUR EUR EUR EUR EU R EUR EUR EUR CHF CHF CHF CHF CHF EUR USD EUR EUR USD EUR EUR EUR USD US0 GBP
1.88% 2.37% 1.15% 1.03% 1.88Oh 1.88% 2.37% 1.20% 1.04% 1.63% 1.64% 2.37% 0.83% 0.83% 1.91 Yo 1.04% 2.39% 0.89% 0.87% 1.62% 1.64% 0.74% 1.61 % 1.62% 0.87% 0.87% 1.62% 1.62% 0.09% 1.86% 1.85% 2.61 % 1.11% 1.07% 2.04% 2.55% 1.19% 2.04% 1.20% 1 .81 %
1.86% 1.87% 2.37% 1.15% 1.03% 1.88% 1.87% 2.36% 1.18% 1.02% 1.63% 1.64% 2.37% 0.83% 0.78% 1.89% 1.04% 2.38% 0.89% 0.86% 1.61 % 1.64% 0.74Yo 1.61% 1.62% 0.87%
1.62% 1.62% 0.08% 1.86% 1.87% 2.61 Yo 1.10% 1.06% 2.03% 2.54% 1.18% 2.04% 1.20%
0.87%
1.82% AXA World Funds - Talents Brick . . .
(1) The TERs above represent, as indicated in the prospectus, a weighted average of administrative expenses which shareholders could normally have expected to pay when being invested in the chosen share class as indicated in the prospectus. This methodology is in line with accepted standard market practices and represents a fair view of publications to be made in the market.
(2) The TERs above represent the actual calculations made by the fund administrator whereas TERs published for small share-classes are effected by rounding processes. This creates a TER not necessarily representing a figure of expenses which shareholders are reasonably expected to pay.
289
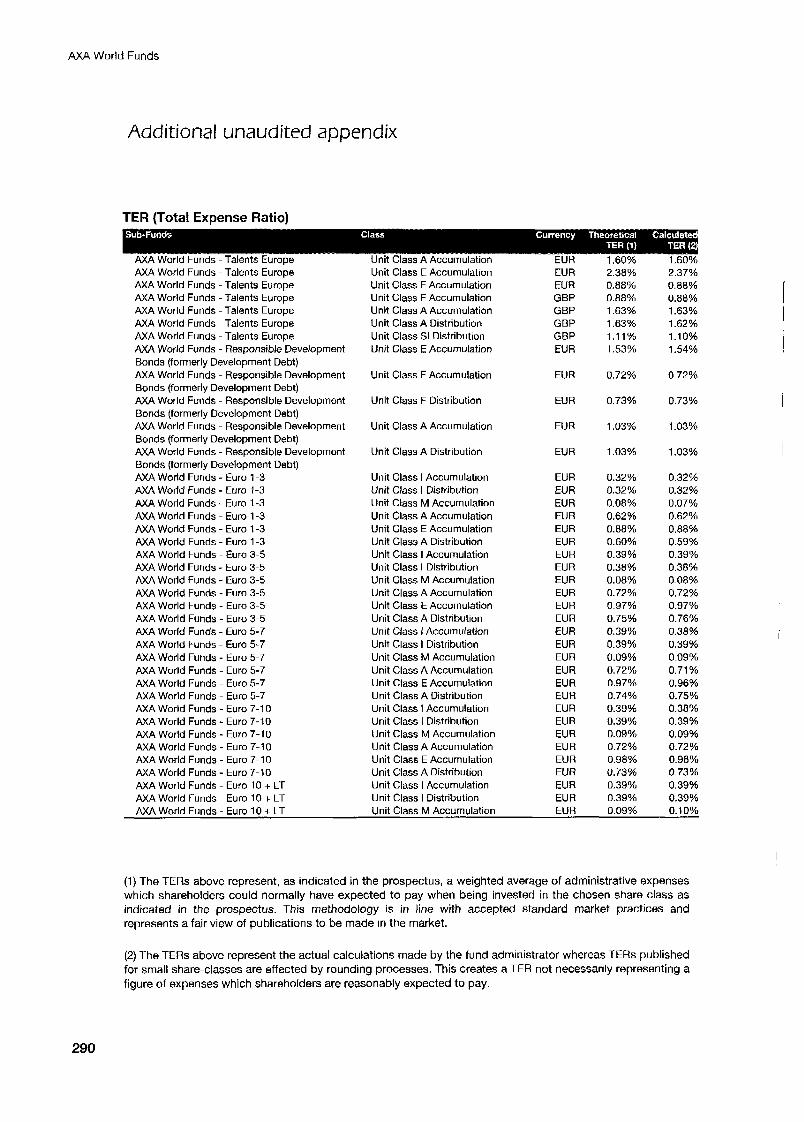
AXA World Funds
Additional unaudited appendix
TER (Total Expense Ratio)
AXA World Funds -Talents Europe Unit Class A Accumulation EUR 1.60% 1.60% AXA World Funds - Talents Europe AXA World Funds - Talents Europe AXA World Funds -Talents Europe AXA World Funds -Talents Europe AXA World Funds -Talents Europe AXA World Funds - Talents Europe AXA World Funds - Responsible Development Bonds (formerly Development Debt) AXA World Funds - Responsible Development Bonds (formerly Development Debt) AXA World Funds - Responsible Development Bonds (formerly Development Debt) AXA World Funds - Responsible Development Bonds (formerly Development Debt) AXA World Funds - Responsible Development Bonds (formerly Development Debt) AXA World Funds - Euro 1-3 AXA World Funds - Euro 1-3 AXA World Funds - Euro 1-3 AXA World Funds - Euro 1-3 AXA World Funds - Euro 1-3 AXA World Funds - Euro 1-3 AXA World Funds - Euro 3-5 M A World Funds I Euro 3-5 AXA World Funds - Euro 3-5 AXA World Funds - Euro 3-5 AXA World Funds - Euro 3-5 AXA World Funds - Euro 3-5 AXA World Funds - Euro 5-7 AXA World Funds - Euro 5-7 M A World Funds - Euro 5-7 AXA World Funds - Euro 5-7 M A World Funds - Euro 5-7 M A World Funds - Euro 5-7 AXA World Funds - Euro 7-1 0 AXA World Funds - Euro 7-10 AXA World Funds - Euro 7-10 AXA World Funds - Euro 7-10 AXA World Funds - Euro 7-10 AXA World Funds - Euro 7-10 AXA World Funds - Euro 10 + LT AXA World Funds - Euro 10 + LT
Unit Class E Accumulation Unit Class F Accumulation Unit Class F Accumulation Unit Class A Accumulation Unit Class A Distribution Unit Class SI Distribution Unit Class E Accumulation
Unit Class F Accumulation
Unit Class F Distribution
Unit Class A Accumulation
Unit Class A Distribution
Unit Class I Accumulation Unit Class I Distribution Unit Class M Accumulation Unit Class A Accumulation Unit Class E Accumulation Unit Class A Distribution Unit Class I Accumulation Unit Class I Distribution Unit Class M Accumulation Unit Class A Accumulation Unit Class E Accumulation Unit Class A Distribution Unit Class I Accumulation Unit Class I Distribution Unit Class M Accumulation Unit Class A Accumulation Unit Class E Accumulation Unit Class A Distribution Unit Class I Accumulation Unit Class I Distribution Unit Class M Accumulation Unit Class A Accumulation Unit Class E Accumulation Unit Class A Distribution Unit Class I Accumulation Unit Class I Distribution
EUR EUA GBP GBP GBP GBP EUR
EUR
EUR
EUR
EUR
EUR EUR EUR EUR EUR EUR EUR EUR EUR EUR EUR EUR EUR EUR EUR EUR EUR EUR EUR EUR EUR EUR EUR EUR EUR EUR
2.38% 0.08% 0.88% 1.63% 1.63% 1.11% 1.53%
0.72%
0.73%
1.03%
1.03%
0.32% 0.320/0 0.08% 0.62% 0.88% 0.60% 0.39% 0.38% 0.08% 0.72% 0.97% 0.75% 0.39% 0.39% 0.09% 0.72% 0.97% 0.74% 0.39% 0.39% 0.09% 0.72% 0.98% 0.73% 0.39% 0.39% 0.09% Unit Class M Accumulation EUR AXA World Funds - Euro 10 + LT - _. - -~ _.
2.37% 0.80% 0.88% 1.63% 1.62% 1.10% 1.54%
0.72%
0.73%
1.03%
1.03%
0.32% 0.32% 0.07% 0.62% 0.88% 0.59% 0.39% 0.38% 0.08% 0.72% 0.97% 0.76% 0.38% 0.39% 0.09% 0.71 % 0.96% 0.75% 0.38% 0.39% 0.09% 0.72% 0.98% 0.73 46 0.39% 0.39% 0.1 OYO
(1) The TERs above represent, as indicated in the prospectus, a weighted average of administrative expenses which shareholders could normally have expected to pay when being invested in the chosen share class as indicated in the prospectus. This methodology is in line with accepted standard market practices and represents a fair view of publications to be made in the market.
(2) The TERs above represent the actual calculations made by the fund administrator whereas TERs published for small share-classes are effected by rounding processes. This creates a TER not necessarily representing a figure of expenses which shareholders are reasonably expected to pay.
290
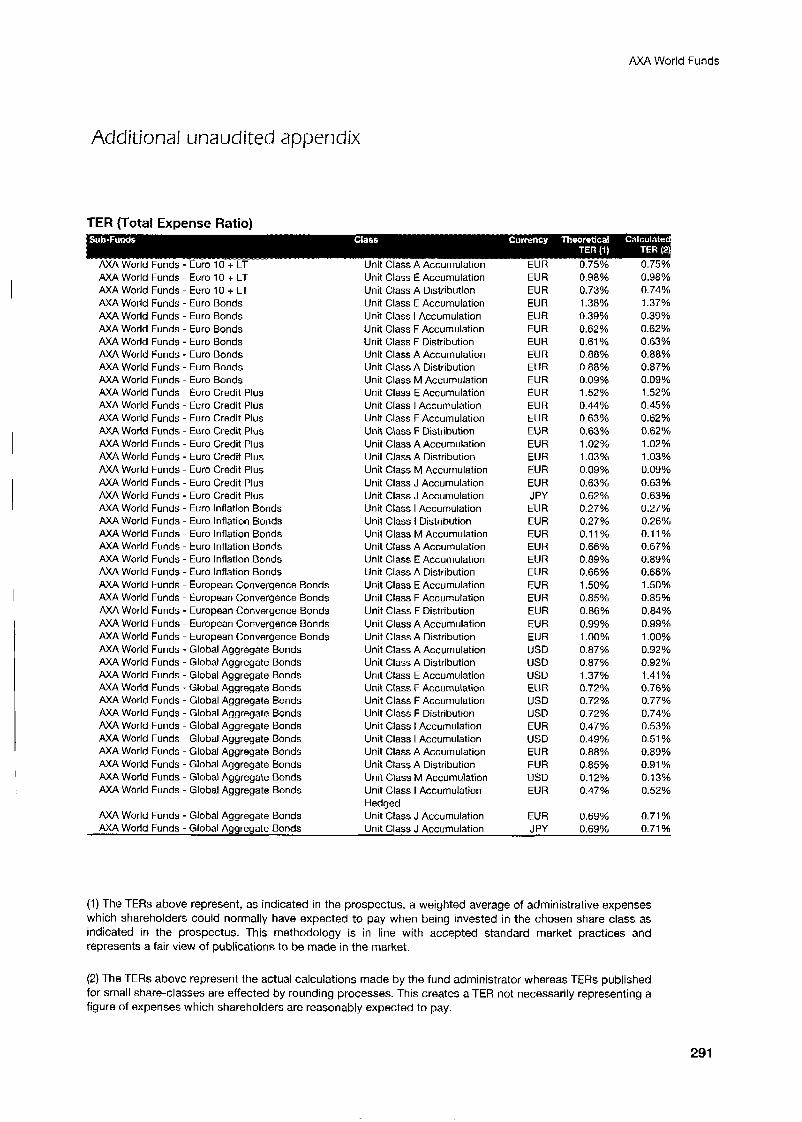
AXA World Funds
Addition a I una u d it ed appendix
TER (Total Expense Ratio)
Unit Class A Accumulation EUR AXA World Funds - Euro 10 + LT AXA World Funds - Euro 10 + LT AXA World Funds - Euro Bonds AXA World Funds - Euro Bonds AXA World Funds - Euro Bonds AXA World Funds - Euro Bonds AXA World Funds - Euro Bonds AXA World Funds - Euro Bonds AXA World Funds - Euro Bonds AXA World Funds - Euro Credit Plus AXA World Funds - Euro Credit Plus AXA World Funds - Euro Credit Plus AXA World Funds - Euro Credit Plus AXA World Funds - Euro Credit Plus AXA World Funds - Euro Credit Plus AXA World Funds - Euro Credit Plus AXA World Funds - Euro Credit Plus AXA World Funds - Euro Credit Plus AXA World Funds - Euro Inflation Bonds AXA World Funds - Euro Inflation Bonds AXA World Funds - Euro Inflation Bonds AXA World Funds - Euro Inflation Bonds AXA World Funds - Euro Inflation Bonds AXA World Funds - Euro Inflation Bonds AXA World Funds - European Convergence Bonds AXA World Funds - European Convergence Bonds AXA World Funds - European Convergence Bonds AXA World Funds - European Convergence Bonds AXA World Funds - European Convergence Bonds AXA World Funds - Global Aggregate Bonds AXA World Funds - Global Aggregate Bonds AXA World Funds - Global Aggregate Bonds AXA World Funds - Global Aggregate Bonds AXA World Funds - Global Aggregate Bonds AXA World Funds - Global Aggregate Bonds AXA World Funds - Global Aggregate Bonds AXA World Funds - Global Aggregate Bonds AXA World Funds - Global Aggregate Bonds AXA World Funds - Global Aggregate Bonds AXA World Funds - Global Aggregate Bonds AXA World Funds - Global Aggregate Bonds
AXA World Funds - Global Aggregate Bonds
Unit Class E Accumulation Unit Class A Distribution Unit Class E Accumulation Unit Class I Accumulation Unit Class F Accumulation Unit Class F Distribution Unit Class A Accumulation Unit Class A Distribution Unit Class M Accumulation Unit Class E Accumulation Unit Class I Accumulation Unit Class F Accumulation Unit Class F Distribution Unit Class A Accumulation Unit Class A Distribution Unit Class M Accumulation Unit Class J Accumulation Unit Class J Accumulation Unit Class I Accumulation Unit Class I Distribution Unit Class M Accumulation Unit Class A Accumulation Unit Class E Accumulation Unit Class A Distribution Unit Class E Accumulation Unit Class F Accumulation Unit Class F Distribution Unit Class A Accumulation Unit Class A Distribution Unit Class A Accumulation Unit Class A Distribution Unit Class E Accumulation Unit Class F Accumulation Unit Class F Accumulation Unit Class F Distribution Unit Class I Accumulation Unit Class I Accumulation Unit Class A Accumulation Unit Class A Distribution Unit Class M Accumulation Unit Class I Accumulation Hedged Unit Class J Accumulation Unit Class J Acciimulation
EUR EUR EUR EUR EUR EUR EU R EUR EUR EUR EUR EUR EUR EUR EUR EUR EUR JPY EUR EUR EUR EUR EUR EUR EUR EUR EUR EUR EUR USD USD USD EUR USD USD EUR USD EUR EUR USD EUR
EUR J PY
0.98% 0.73% 1.38% 0.39% 0.62% 0.61 % 0.88% 0.88% 0.09% 1.52% 0.44% 0.63% 0.63% 1.02% 1.03% 0.09% 0.63% 0.62% 0.27% 0.27% 0.11% 0.66% 0.89% 0.66% 1.50% 0.85% 0.86% 0.99% 1 .OOO% 0.87% 0.87% 1.37% 0.729'0 0.72% 0.72% 0.47% 0.49Oh 0.88% 0.85% 0.12% 0.47%
0.69%
0.98% 0.74% 1.37% 0.39% 0.62% 0.63%
0.87% 0.09% 1.52% 0.45% 0.62% 0.62% 1.02% 1.03% 0.09% 0.63% 0.63% 0.27% 0.26% 0.11% 0.67% 0.89% 0.66% 1.50% 0.85% 0.84% 0.99% 1.00% 0.92% 0.92% 1.41% 0.76%
o.aa%
0.77% 0.74% 0.53% 0.51 % 0.89% 0.91 % 0.13% 0.52%
0.71 % AXA World Funds - Global Aggregate Bonds . . .._ 0.69% 0.71 Yo
(1) The TERs above represent, as indicated in the prospectus, a weighted average of administrative expenses which shareholders could normally have expected to pay when being invested in the chosen share class as indicated in the prospectus. This methodology is in line with accepted standard market practices and represents a fair view of publications to be made in the market.
(2) The TERs above represent the actual calculations made by the fund administrator whereas TERs published for small share-classes are effected by rounding processes. This creates a TER not necessarily representing a figure of expenses which shareholders are reasonably expected to pay.
29 1
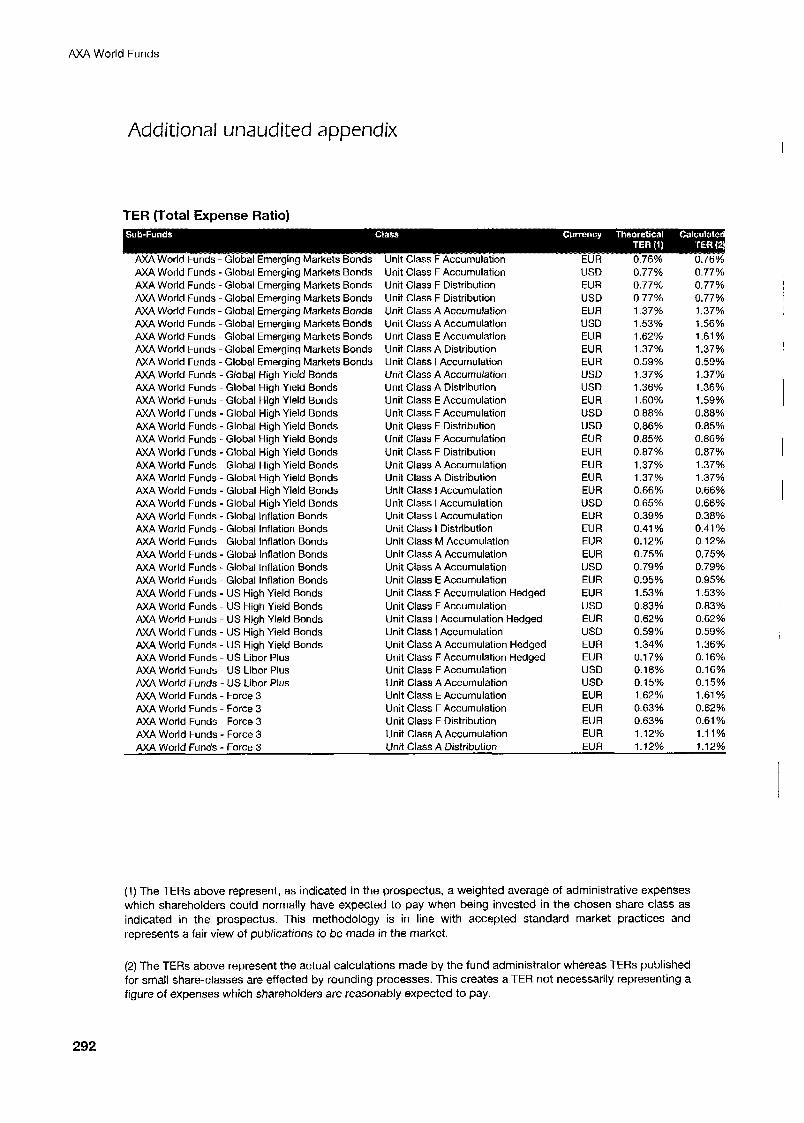
AXA World Funds
Ad d it i o n a I u n a u d it ed a p p end ix
TER (Total Expense Ratio)
AXA World Funds - Global Emerging Markets Bonds Unit Class F Accumulation EUR AXA World Funds - Global Emerging Markets Bonds AXA World Funds Global Emerging Markets Bonds AXA World Funds - Global Emerging Markets Bonds AXA World Funds - Global Emerging Markets Bonds AXA World Funds - Global Emerging Markets Bonds AXA World Funds - Global Emerging Markets Bonds AXA World Funds - Global Emerging Markets Bonds AXA World Funds - Global Emerging Markets Bonds AXA World Funds - Global High Yield Bonds AXA World Funds - Global High Yield Bonds AXA World Funds - Global High Yield Bonds AXA World Funds - Global High Yield Bonds AXA World Funds - Global High Yield Bonds AXA World Funds - Global High Yield Bonds AXA World Funds - Global High Yield Bonds AXA World Funds - Global High Yield Bonds AXA World Funds - Global High Yield Bonds AXA World Funds - Global High Yield Bonds AXA World Funds - Global High Yield Bonds AXA World Funds - Global Inflation Bonds AXA World Funds - Global Inflation Bonds AXA World Funds - Global Inflation Bonds AXA World Funds - Global Inflation Bonds AXA World Funds - Global Inflation Bonds AXA World Funds - Global Inflation Bonds AXA World Funds - US High Yield Bonds AXA World Funds - US High Yield Bonds AXA World Funds - US High Yield Bonds AXA World Funds - US High Yield Bonds AXA World Funds - US High Yield Bonds AXA World Funds - US Libor Plus AXA World Funds - US Libor Plus AXA World Funds - US Libor Plus AXA World Funds - Force 3 AXA World Funds - Force 3 AXA World Funds - Force 3 AXA World Funds - Force 3
Unit Class F Accumulation Unit Class F Distribution Unit Class F Distribution Unit Class A Accumulation Unit Class A Accumulation Unit Class E Accumulation Unit Class A Distribution Unit Class I Accumulation Unit Class A Accumulation Unit Class A Distribution Unit Class E Accumulation Unit Class F Accumulation Unit Class F Distribution Unit Class F Accumulation Unit Class F Distribution Unit Class A Accumulation Unit Class A Distribution Unit Class I Accumulation Unit Class I Accumulation Unit Class I Accumulation Unit Class I Distribution Unit Class M Accumulation Unit Class A Accumulation Unit Class A Accumulation Unit Class E Accumulation Unit Class F Accumulation Hedged Unit Class F Accumulation Unit Class I Accumulation Hedged Unit Class I Accumulation Unit Class A Accumulation Hedged Unit Class F Accumulation Hedged Unit Class F Accumulation Unit Class A Accumulation Unit Class E Accumulation Unit Class F Accumulation Unit Class F Distribution Unit Class A Accumulation
USD EUR USD EUR USD EU R EUR EUR USD USD EUR USD USD EUR EUR EUR EU R EUR USD EUR EU R EUR EU R USD EUR EUR USD EU R USD EUR EU R USD USD EUR EUR EUR EUR
0.76% 0.76%
1.12% 1.12%
0.77% 0.77% 0.77% 1.37% 1.53% 1.62% 1.37% 0.59% 1.37% 1.36% 1.60% 0.88% 0.86% 0.85% 0.87% 1.37% 1.37% 0.66% 0.65% 0.39% 0.41 % 0.12% 0.75% 0.79% 0.95% 1.53% 0.83% 0.62% 0.59% 1.34% 0.17% 0.16% 0.15% 1.62% 0.63% 0.63% 1.12%
0.77% 0.77% 0.77% 1.37% 1.56% 1.61 % 1.37% 0.59% 1.37% 1.36% 1.59% 0.88% 0.85% 0.86% 0.87% 1.37% 1.37% 0.66% 0.66% 0.38% 0.41 % 0.12% 0.75% 0.79% 0.95% 1.53% 0.83% 0.62% 0.59% 1.36% 0.16% 0.16% 0.15% 1.61 % 0.62% 0.61 Yo 1.11%
I hi t Class A Distribution EUR
(1) The TERs above represent, as indicated in the prospectus, a weighted average of administrative expenses which shareholders could normally have expected to pay when being invested in the chosen share class as indicated in the prospectus. This methodology is in line with accepted standard market practices and represents a fair view of publications to be made in the market.
I
(2) The TERs above represent the actual calculations made by the fund administrator whereas TERs published for small share-classes are effected by rounding processes. This creates a TER not necessarily representing a figure of expenses which shareholders are reasonably expected to pay.
292
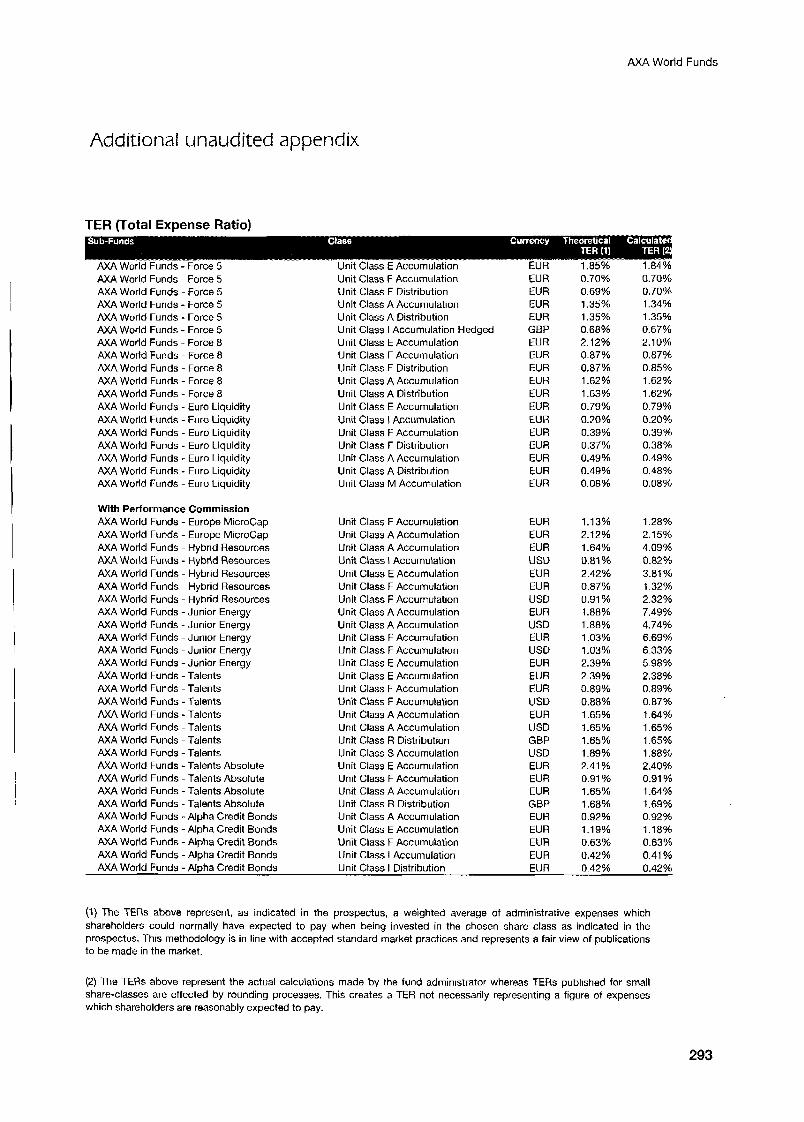
AXA World Funds
Add it i o n a I una u d i ted a p p e n d ix
TER (Total Expense Ratio)
AXA World Funds - Force 5 Unit Class E Accumulation EUR 1.85% 1.84% AXA World Funds - Force 5 AXA World Funds - Force 5 AXA World Funds - Force 5 AXA World Funds - Force 5 AXA World Funds - Force 5 AXA World Funds - Force 8 AXA World Funds - Force 8 AXA World Funds - Force 8 AXA World Funds - Force 8 AXA World Funds - Force 8 AXA World Funds - Euro Liquidity AXA World Funds - Euro Liquidity AXA World Funds - Euro Liquidity AXA World Funds - Euro Liquidity AXA World Funds - Euro Liquidity AXA World Funds - Euro Liquidity AXA World Funds - Euro Liquidity
With Performance Commission AXA World Funds - Europe MicroCap AXA World Funds - Europe MicroCap AXA World Funds - Hybrid Resources AXA World Funds - Hybrid Resources AXA World Funds - Hybrid Resources AXA World Funds - Hybrid Resources AXA World Funds - Hybrid Resources AXA World Funds -Junior Energy AXA World Funds -Junior Energy AXA World Funds -Junior Energy AXA World Funds -Junior Energy AXA World Funds -Junior Energy AXA World Funds - Talents AXA World Funds - Talents AXA World Funds - Talents AXA World Funds -Talents AXA World Funds -Talents M A World Funds - Talents AXA World Funds - Talents AXA World Funds - Talents Absolute AXA World Funds -Talents Absolute AXA World Funds - Talents Absolute AXA World Funds - Talents Absolute AXA World Funds - Alpha Credit Bonds AXA World Funds - Alpha Credit Bonds AXA World Funds - Alpha Credit Bonds AXA World Funds - Alpha Credit Bonds
Unit Class F Accumulation Unit Class F Distribution Unit Class A Accumulation Unit Class A Distribution Unit Class I Accumulation Hedged Unit Class E Accumulation Unit Class F Accumulation Unit Class F Distribution Unit Class A Accumulation Unit Class A Distribution Unit Class E Accumulation Unit Class I Accumulation Unit Class F Accumulation Unit Class F Distribution Unit Class A Accumulation Unit Class A Distribution Unit Class M Accumulation
Unit Class F Accumulation Unit Class A Accumulation Unit Class A Accumulation Unit Class I Accumulation Unit Class E Accumulation Unit Class F Accumulation Unit Class F Accumulation Unit Class A Accumulation Unit Class A Accumulation Unit Class F Accumulation Unit Class F Accumulation Unit Class E Accumulation Unit Class E Accumulation Unit Class F Accumulation Unit Class F Accumulation Unit Class A Accumulation Unit Class A Accumulation Unit Class R Distribution Unit Class S Accumulation Unit Class E Accumulation Unit Class F Accumulation Unit Class A Accumulation Unit Class R Distribution Unit Class A Accumulation Unit Class E Accumulation Unit Class F Accumulation Unit Class I Accumulation
EUR EUR EUR EUR GBP EUR EUR EUR EUR EUR EUR EUR EUR EUR EUR EUR EUR
EUR EUR EUR USD EUR EUR USD EUR USD EUR USD EUR EUR EUR USD EUR USD GBP USD EUR EUR EUR GBP EUR EUR EUR EUR
0.70% 0.69% 1.35% 1.35% 0.68% 2.12% 0.87% 0.87% 1.62% 1.63% 0.79% 0.20% 0.39% 0.37% 0.49% 0.49% 0.08%
1.13% 2.12% 1.64% 0.81 % 2.42% 0.87% 0.91 % 1.88% 1.88% 1.03% 1.03% 2.39% 2.39% 0.89% 0.88% 1.65% 1.65% 1.65% 1.89% 2.41 % 0.91 % 1.65% 1.68% 0.92% 1.19% 0.63% 0.42%
0.70% 0.70% 1.34% 1.35% 0.67% 2.10% 0.87% 0.85% 1.62% 1.62% 0.79% 0.20% 0.39% 0.38% 0.49% 0.48% 0.08%
1.28% 2.15% 4.09% 0.82% 3.81 % 1.32% 2.32% 7.49% 4.74% 6.69% 6.33% 5.98% 2.38% 0.89%
1.64% 1.65% 1.65% 1.88% 2.40% 0.91 % 1.64% 1.69% 0.92% 1.18% 0.63% 0.41 %
0.87%
AXA World Funds - Alpha Credit Bonds Unit Class I Distribution EUR 0.42% 0.42%
(1) The TERs above represent, as indicated in the prospectus, a weighted average of administrative expenses which shareholders could normally have expected to pay when being invested in the chosen share class as indicated in the prospectus. This methodology is in line with accepted standard market practices and represents a fair view of publications to be made in the market.
(2) The TERs above represent the actual calculations made by the fund administrator whereas TERs published for small share-classes are effected by rounding processes. This creates a TER not necessarily representing a figure of expenses which shareholders are reasonably expected to pay.
293
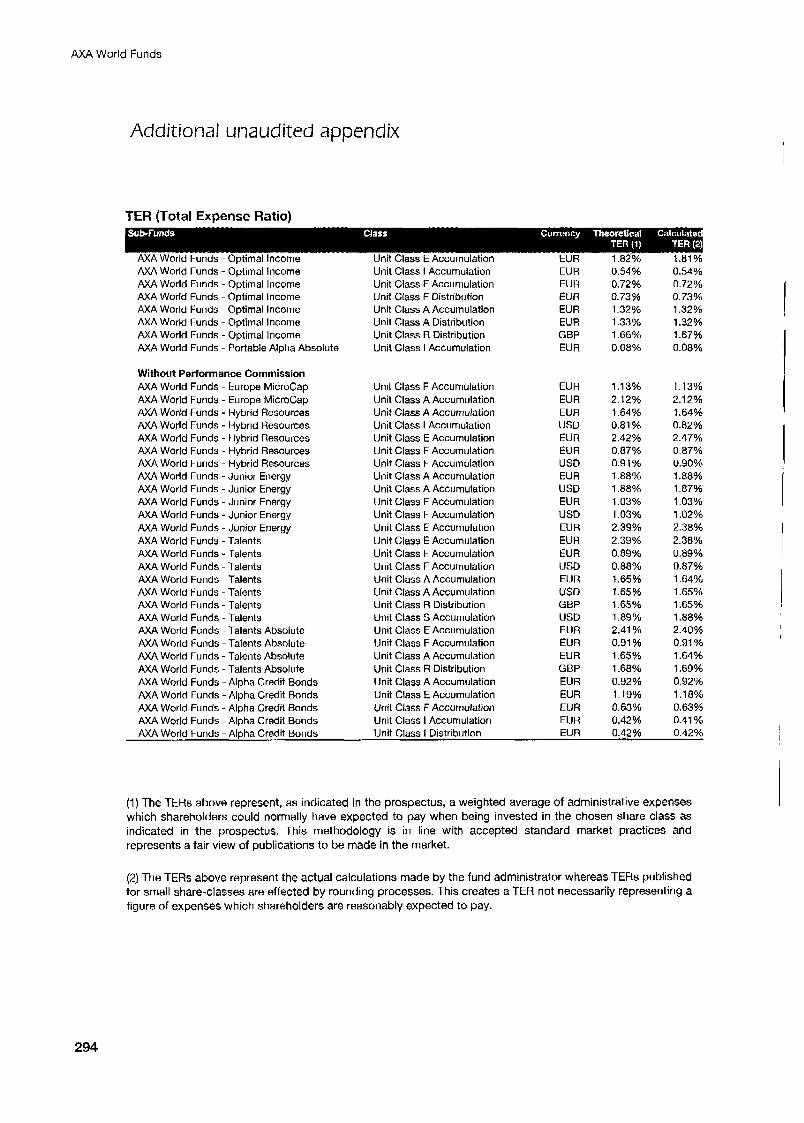
AXA World Funds
Add it i o na I una ud it ed append ix
TER (Total Expense Ratio)
AXA World Funds - Optimal Income Unit Class E Accumulation EUR 1.82% 1 .81 % AXA World Funds - Optimal Income AXA World Funds - Optimal Income AXA World Funds - Optimal Income AXA World Funds - Optimal Income AXA World Funds - Optimal Income M A World Funds - Optimal Income AXA World Funds - Portable Alpha Absolute
Without Performance Commission AXA World Funds - Europe MicroCap AXA World Funds - Europe MicroCap AXA World Funds - Hybrid Resources AXA World Funds - Hybrid Resources AXA World Funds - Hybrid Resources AXA World Funds - Hybrid Resources AXA World Funds - Hybrid Resources AXA World Funds - Junior Energy AXA World Funds - Junior Energy AXA World Funds - Junior Energy AXA World Funds - Junior Energy AXA World Funds -Junior Energy AXA World Funds - Talents AXA World Funds Talents AXA World Funds -Talents AXA World Funds - Talents M A World Funds -Talents AXA World Funds - Talents AXA World Funds - Talents AXA World Funds -Talents Absolute AXA World Funds -Talents Absolute AXA World Funds - Talents Absolute AXA World Funds - Talents Absolute AXA World Funds - Alpha Credit Bonds AXA World Funds - Alpha Credit Bonds AXA World Funds - Alpha Credit Bonds AXA World Funds -Alpha Credit Bonds
Unit Class I Accumulation Unit Class F Accumulation Unit Class F Distribution Unit Class A Accumulation Unit Class A Distribution Unit Class R Distribution Unit Class I Accumulation
Unit Class F Accumulation Unit Class A Accumulation Unit Class A Accumulation Unit Class I Accumulation Unit Class E Accumulation Unit Class F Accumulation Unit Class F Accumulation Unit Class A Accumulation Unit Class A Accumulation Unit Class F Accumulation Unit Class F Accumulation Unit Class E Accumulation Unit Class E Accumulation Unit Class F Accumulation Unit Class F Accumulation Unit Class A Accumulation Unit Class A Accumulation Unit Class R Distribution Unit Class S Accumulation Unit Class E Accumulation Unit Class F Accumulation Unit Class A Accumulation Unit Class R Distribution Unit Class A Accumulation Unit Class E Accumulation Unit Class F Accumulation Unit Class I Accumulation
EUR EU R EUR EUR EUR GBP EUR
EUR EUR EUR USD EUR EUR USD EUR USD EUR USD EU R EUR EUR USD EUR US0 GBP USD EUR EUR EUR GBP EUR EU R EUR EUR
0.54% 0.72% 0.73% 1.32% 1.33% 1.66% 0.08%
1.13% 2.12% 1.64% 0.81 % 2.42% 0.87% 0.91 % 1.88% 1.88% 1.03% 1.03% 2.39% 2.39% 0.89% 0.88% 1.65% 1.65% 1.65% 1.89% 2.41 % 0.91 % 1.65% 1.68% 0.92% 1.19% 0.63% 0.42%
0.54% 0.72% 0.73 % 1.32% 1.32% 1.67% 0.08%
1.13% 2.12% 1.64% 0.82% 2.47% 0.87% 0.90% 1.88% 1.87% 1.03% 1.02% 2.38% 2.38% 0.89% 0.87% 1.64% 1.65% 1.65%
2.40% 0.91 % 1.64% 1.69% 0.92% 1.18% 0.63% 0.41 %
1 .myo
AXA World Funds - Alpha Credit Bonds ~~~ ~ 0.42% Unit Class I Distribution EU R 0.42%
(1) The TERs above represent, as indicated in the prospectus, a weighted average of administrative expenses which shareholders could normally have expected to pay when being invested in the chosen share class as indicated in the prospectus. This methodology is in line with accepted standard market practices and represents a fair view of publications to be made in the market.
(2) The TERs above represent the actual calculations made by the fund administrator whereas TERs published for small share-classes are effected by rounding processes. This creates a TER not necessarily representing a figure of expenses which shareholders are reasonably expected to pay.
294
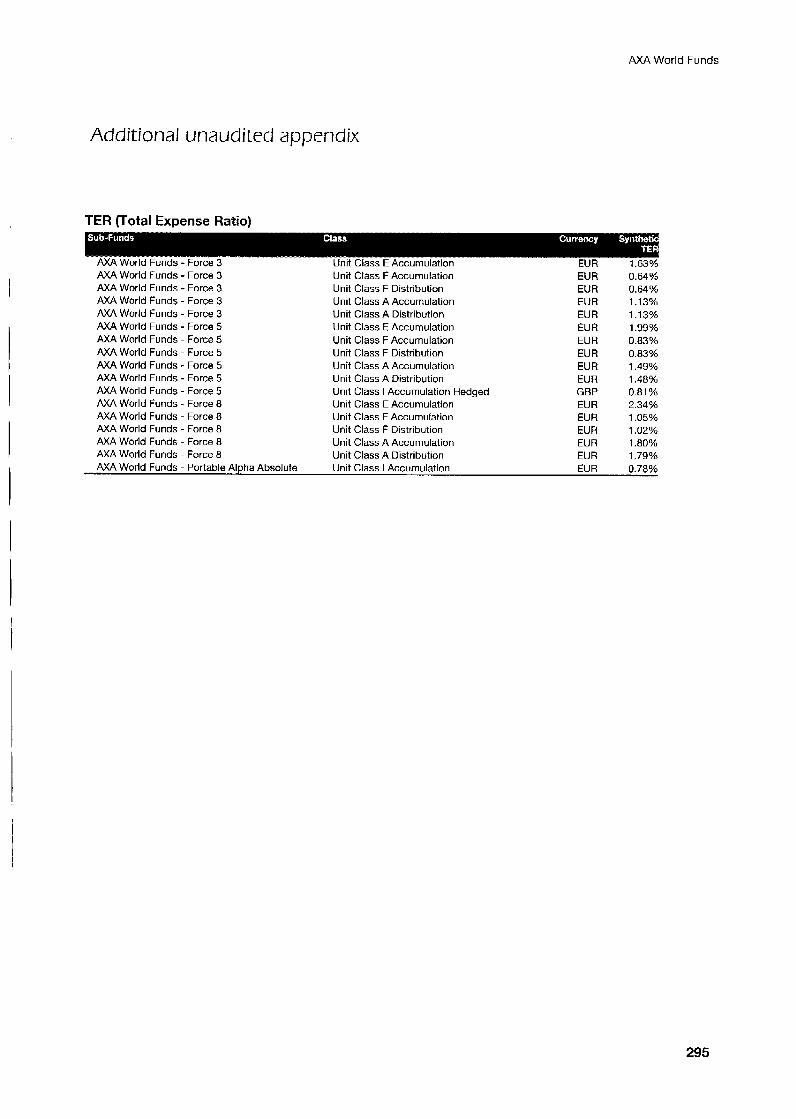
AXA World Funds
Addition a I una u d it ed append ix
TER (Total Expense Ratio)
. -. .. .- ._ - AXA World Funds - Force 3 Unit Class E Accumulation EUR 1.63% AXA World Funds - Force 3 Unit Class F Accumulation EUR 0.64% AXA World Funds - Force 3 Unit Class F Distribution EUR 0.64% AXA World Funds - Force 3 Unit Class A Accumulation EUR 1.13% AXA World Funds - Force 3 Unit Class A Distribution EUR 1.13% AXA World Funds - Force 5 Unit Class E Accumulation EUR 1.99% AXA World Funds - Force 5 Unit Class F Accumulation EUR 0.83% AXA World Funds - Force 5 Unit Class F Distribution EUR 0.83% AXA World Funds - Force 5 Unit Class A Accumulation EUR 1.49%
EUR 1.48% AXA World Funds - Force 5 AXA World Funds - Force 5 Unit Class I Accumulation Hedged GBP 0.81% AXA World Funds - Force 8 Unit Class E Accumulation EUR 2.34% AXA World Funds - Force 8 Unit Class F Accumulation EUR 1 .05% AXA World Funds - Force 8 Unit Class F Distribution EUR 1.02% AXA World Funds - Force 8 Unit Class A Accumulation EUR 1.80% AXA World Funds - Force 8 Unit Class A Distribution EUR 1.79% AXA World Funds - Portable Alpha Absolute Unit Class I Accumulation EUR 078%
Unit Class A Distribution
295
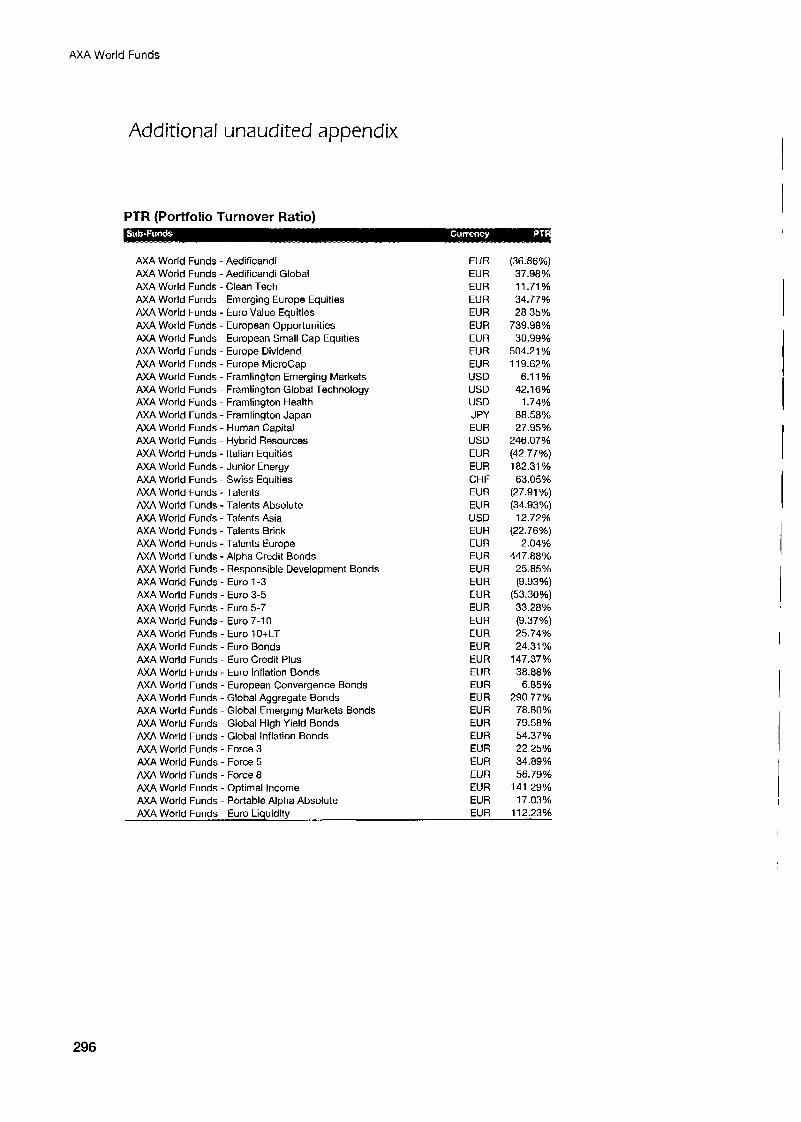
AXA World Funds
Add it i o n a I una ud i t ed append ix
PTR (Portfolio Turnover Ratio)
AXA World Funds - Aedificandi AXA World Funds - Aedificandi Global AXA World Funds - Clean Tech AXA World Funds - Emerging Europe Equities AXA World Funds - Euro Value Equities AXA World Funds - European Opportunities AXA World Funds - European Small Cap Equities AXA World Funds - Europe Dividend AXA World Funds - Europe MicroCap AXA World Funds - Framlington Emerging Markets AXA World Funds - Framlington Global Technology AXA World Funds - Framlington Health AXA World Funds - Framlington Japan AXA World Funds - Human Capital AXA World Funds - Hybrid Resources AXA World Funds - Italian Equities AXA World Funds - Junior Energy AXA World Funds - Swiss Equities AXA World Funds - Talents AXA World Funds - Talents Absolute AXA World Funds - Talents Asia AXA World Funds - Talents Brick AXA World Funds - Talents Europe AXA World Funds - Alpha Credit Bonds AXA World Funds - Responsible Development Bonds M A World Funds - Euro 1-3 AXA World Funds - Euro 3-5 AXA World Funds - Euro 5-7 M A World Funds - Euro 7-10 AXA World Funds - Euro 1O+LT AXA World Funds - Euro Bonds AXA World Funds - Euro Credit Plus AXA World Funds - Euro Inflation Bonds AXA World Funds - European Convergence Bonds AXA World Funds - Global Aggregate Bonds AXA World Funds - Global Emerging Markets Bonds AXA World Funds - Global High Yield Bonds AXA World Funds - Global Inflation Bonds AXA World Funds - Force 3 AXA World Funds - Force 5 AXA World Funds - Force 8 AXA World Funds - Optimal Income AXA World Funds - Portable Alpha Absolute
EUR EUR EUR EU R EUR EU R EUR EUR EUR USD USD USD JPY EUR USD EUR EUR CHF EUR EUR USD EUR EUR EUR EUR EUR EUR EUR EUR EUR EUR EUR EUR EU R EUR EUR EUR EUR EUA EUR EUR EUR EUR
(36.86 %) 37.98% 11.71% 34.77% 28.35%
739.98% 30.99%
504.21 % 119.62O%
6.1 1 % 42.16%
1.74% 88.58% 27.95%
246.07% (42.77 %) 182.31 % 63.05%
(27.91 %)
12.72% (22.76%)
2.04% 447.88%
25.85%
(53.30%)
(34.93%)
(9.93%)
33.28% (9.37%) 25.74% 24.31 %
147.37% 38.88% 6.85%
290.77% 78.80% 79.58% 54.37% 22.25% 34.89% 56.79%
141.29% 17.03%
AXA World Funds - Euro Liquidity EUR ~~ ~ 112.23%
296
INVESTMENT MANAGERS AXA World Funds
www.axa-im.com
Societe d'lnvestissement a Capital Variable 49, Avenue J.F. Kennedy L-1855 Luxembourg
Luxemburg 8-63.1 16


