Embed Size (px)
Citation preview
NEWSLETTERJanuary 2020
N AT I O N A L R E M O T E S E N S I N G C E N T R E
inform inspire engageeducate innovate Volume 9 Issue 1
I am extremely happy that National Remote Sensing Centre (NRSC) has been chosen as the venue to host the National Conference for ISRO Women to celebrate the International Women’s Day on March 8, 2018. I extend a warm welcome to women delegation from different Centre’s of ISRO to NRSC on this occasion.
The theme of the 107th International Women’s Day is “Press for Progress”. At NRSC, women are part of all activities like Mission Planning, Data Reception, Processing and Dissemination, Aerial Remote Sensing, Outreach and Geospatial applications. I am also proud to say that women employees are volunteering for long term Antarctica expeditions, and taking up challenging tasks and performing them with ease, against all odds in the harsh environments with equal competence and enthusiasm.
I complement all the members of the Women’s committee for providing opportunity to all the sections of the women employees including permanent and staff on contract for attending various awareness programmers on topics like works life balance, health and hygiene arranged in-house.
On this occasion, I congratulate women for their great contributions and leadership roles in achieving ISRO’s mission and goals.
On behalf of NRSC, I wish all the women delegates have a pleasant stay at NRSC and wish the conference a grand success. I am extremely happy that National Remote Sensing Centre (NRSC) has been chosen as the venue to host the National Conference for ISRO Women to celebrate the International Women’s Day on March 8, 2018. I extend a warm welcome to women delegation from different Centre’s of ISRO to NRSC on this occasion.
On behalf of NRSC, I wish all the women delegates have a pleasant stay at NRSC and wish the conference a grand success. I am extremely happy that National Remote Sensing Centre (NRSC) has been chosen as the venue to host the National Conference for ISRO Women to celebrate the International Women’s Day on March 8, 2018. I extend a warm welcome to women delegation from different Centre’s of ISRO to NRSC on this occasion.
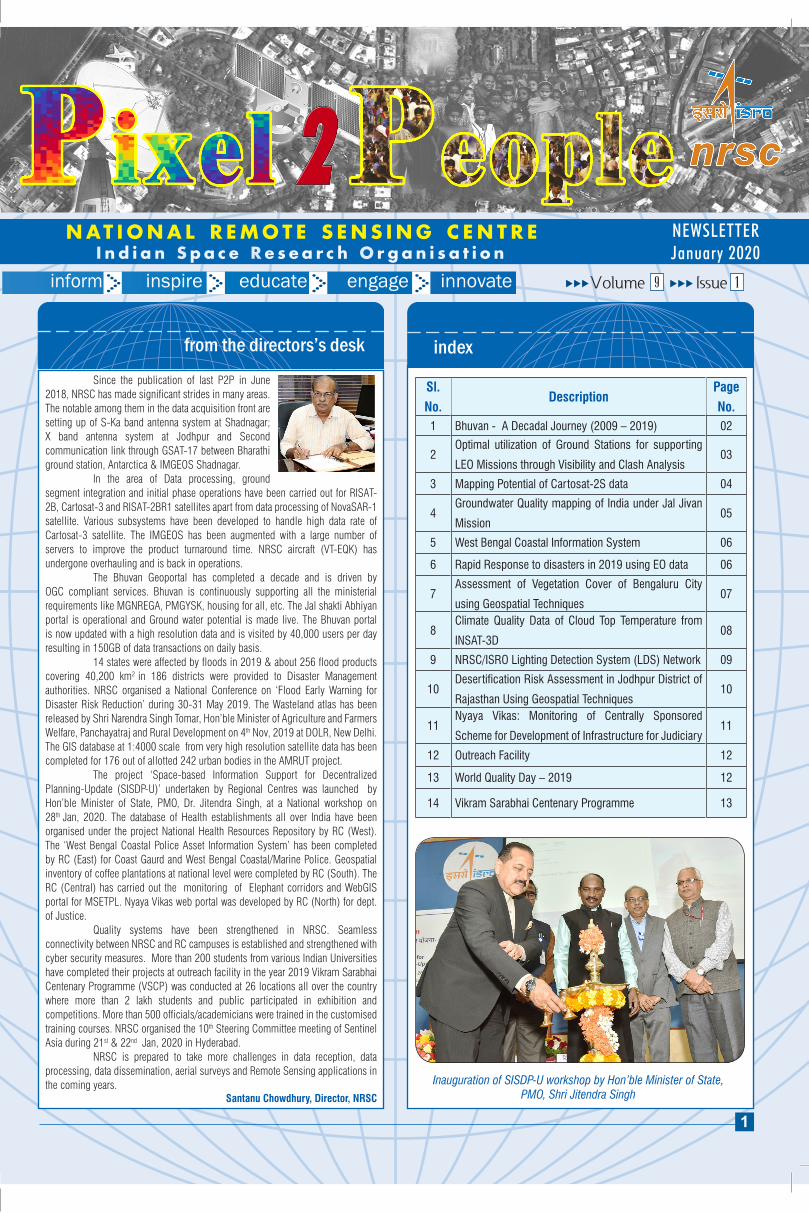
Inauguration of SISDP-U workshop by Hon’ble Minister of State,PMO, Shri Jitendra Singh
1
I n d i a n S p a c e R e s e a r c h O r g a n i s a t i o n
index
Sl. No.
Description Page No.
1 Bhuvan - A Decadal Journey (2009 – 2019) 02
2Optimal utilization of Ground Stations for supporting
LEO Missions through Visibility and Clash Analysis03
3 Mapping Potential of Cartosat-2S data 04
4Groundwater Quality mapping of India under Jal Jivan
Mission05
5 West Bengal Coastal Information System 06
6 Rapid Response to disasters in 2019 using EO data 06
7Assessment of Vegetation Cover of Bengaluru City
using Geospatial Techniques07
8Climate Quality Data of Cloud Top Temperature from
INSAT-3D08
9 NRSC/ISRO Lighting Detection System (LDS) Network 09
10Desertification Risk Assessment in Jodhpur District of
Rajasthan Using Geospatial Techniques10
11Nyaya Vikas: Monitoring of Centrally Sponsored
Scheme for Development of Infrastructure for Judiciary11
12 Outreach Facility 12
13 World Quality Day – 2019 12
14 Vikram Sarabhai Centenary Programme 13
from the directors’s deskI am extremely happy that National Remote Sensing Centre (NRSC) has been chosen as the venue to host the National Conference for ISRO Women to celebrate the International Women’s Day on March 8, 2018. I extend a warm welcome to women delegation from different Centre’s of ISRO to NRSC on this occasion.
The theme of the 107th International Women’s Day is “Press for Progress”. At NRSC, women are part of all activities like Mission Planning, Data Reception, Processing and Dissemination, Aerial Remote Sensing, Outreach and Geospatial applications. I am also proud to say that women employees are volunteering for long term Antarctica expeditions, and taking up challenging tasks and performing them with ease, against all odds in the harsh environments with equal competence and enthusiasm.
I complement all the members of the Women’s committee for providing opportunity to all the sections of the women employees including permanent and staff on contract for attending various awareness programmers on topics like works life balance, health and hygiene arranged in-house.
On this occasion, I congratulate women for their great contributions and leadership roles in achieving ISRO’s mission and goals.
On behalf of NRSC, I wish all the women delegates have a pleasant stay at NRSC and wish the conference a grand success. I am extremely happy that National Remote Sensing Centre (NRSC) has been chosen as the venue to host the National Conference for ISRO Women to celebrate the International Women’s Day on March 8, 2018. I extend a warm welcome to women delegation from different Centre’s of ISRO to NRSC on this occasion.
On behalf of NRSC, I wish all the women delegates have a pleasant stay at NRSC and wish the conference a grand success. I am extremely happy that National Remote Sensing Centre (NRSC) has been chosen as the venue to host the National Conference for ISRO Women to celebrate the International Women’s Day on March 8, 2018. I extend a warm welcome to women delegation from different Centre’s of ISRO to NRSC on this occasion.
Santanu Chowdhury, Director, NRSC
Since the publication of last P2P in June 2018, NRSC has made significant strides in many areas. The notable among them in the data acquisition front are setting up of S-Ka band antenna system at Shadnagar; X band antenna system at Jodhpur and Second communication link through GSAT-17 between Bharathi ground station, Antarctica & IMGEOS Shadnagar. In the area of Data processing, ground segment integration and initial phase operations have been carried out for RISAT-2B, Cartosat-3 and RISAT-2BR1 satellites apart from data processing of NovaSAR-1 satellite. Various subsystems have been developed to handle high data rate of Cartosat-3 satellite. The IMGEOS has been augmented with a large number of servers to improve the product turnaround time. NRSC aircraft (VT-EQK) has undergone overhauling and is back in operations. The Bhuvan Geoportal has completed a decade and is driven by OGC compliant services. Bhuvan is continuously supporting all the ministerial requirements like MGNREGA, PMGYSK, housing for all, etc. The Jal shakti Abhiyan portal is operational and Ground water potential is made live. The Bhuvan portal is now updated with a high resolution data and is visited by 40,000 users per day resulting in 150GB of data transactions on daily basis. 14 states were affected by floods in 2019 & about 256 flood products covering 40,200 km2 in 186 districts were provided to Disaster Management authorities. NRSC organised a National Conference on ‘Flood Early Warning for Disaster Risk Reduction’ during 30-31 May 2019. The Wasteland atlas has been released by Shri Narendra Singh Tomar, Hon’ble Minister of Agriculture and Farmers Welfare, Panchayatraj and Rural Development on 4th Nov, 2019 at DOLR, New Delhi. The GIS database at 1:4000 scale from very high resolution satellite data has been completed for 176 out of allotted 242 urban bodies in the AMRUT project. The project ‘Space-based Information Support for Decentralized Planning-Update (SISDP-U)’ undertaken by Regional Centres was launched by Hon’ble Minister of State, PMO, Dr. Jitendra Singh, at a National workshop on 28th Jan, 2020. The database of Health establishments all over India have been organised under the project National Health Resources Repository by RC (West). The ‘West Bengal Coastal Police Asset Information System’ has been completed by RC (East) for Coast Gaurd and West Bengal Coastal/Marine Police. Geospatial inventory of coffee plantations at national level were completed by RC (South). The RC (Central) has carried out the monitoring of Elephant corridors and WebGIS portal for MSETPL. Nyaya Vikas web portal was developed by RC (North) for dept. of Justice. Quality systems have been strengthened in NRSC. Seamless connectivity between NRSC and RC campuses is established and strengthened with cyber security measures. More than 200 students from various Indian Universities have completed their projects at outreach facility in the year 2019 Vikram Sarabhai Centenary Programme (VSCP) was conducted at 26 locations all over the country where more than 2 lakh students and public participated in exhibition and competitions. More than 500 officials/academicians were trained in the customised training courses. NRSC organised the 10th Steering Committee meeting of Sentinel Asia during 21st & 22nd Jan, 2020 in Hyderabad. NRSC is prepared to take more challenges in data reception, data processing, data dissemination, aerial surveys and Remote Sensing applications in the coming years.
P i x e l 2 P e o p l e
2
Bhuvan (https://bhuvan.nrs.gov.in) had a humble beginning in 2009 as a visualization web portal with commercial backend. Bhuvan completely transformed itself to Open source model and OGC compliant services.
Bhuvan revolutionalized NRSC’s interface with users by changing the way to look and understand map data. From the traditional map, users have been served with digital copy of the same with interactive tools to explore and enhance its use on ground. It helped users to build and expand the information base of their own resources. Bhuvan Crowd Sourcing initiative, opened the vista of Creating the inventory of government assets in various departments and encouraged them to value add the same with key information attributes. All using customized mobile apps.
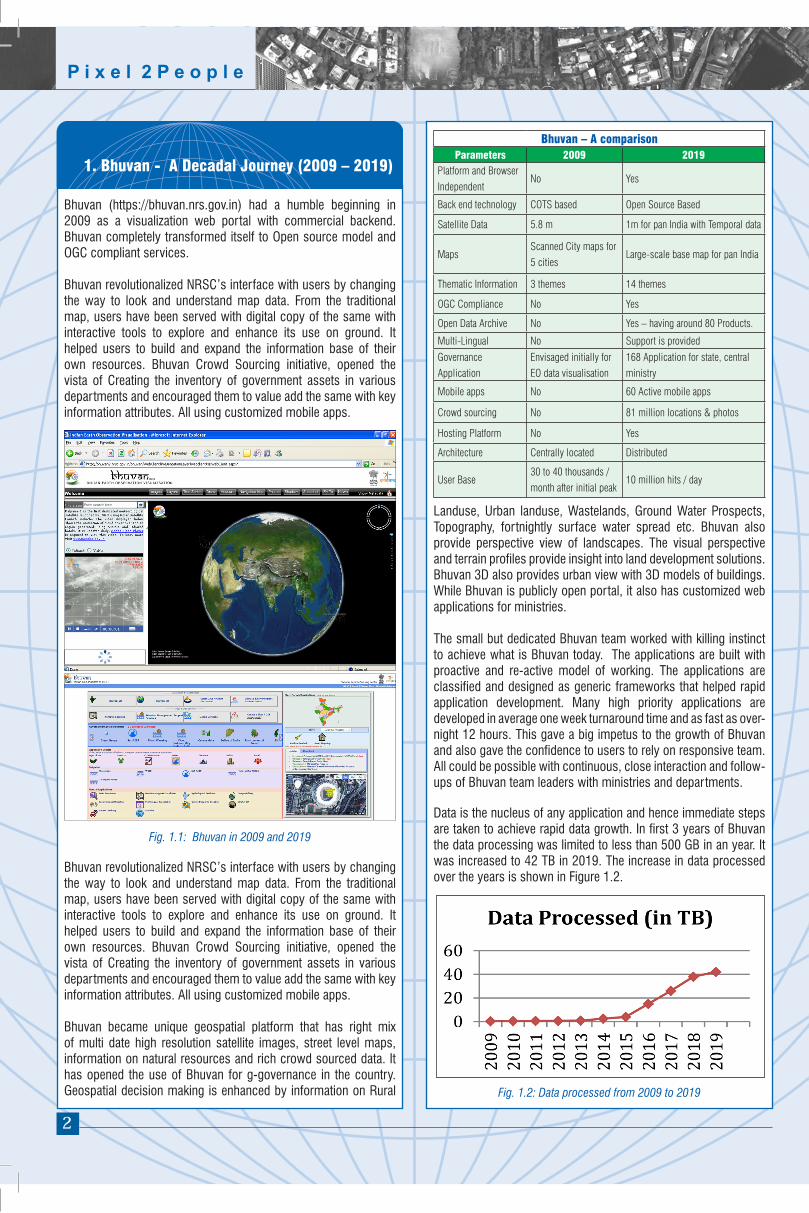
Fig. 1.1: Bhuvan in 2009 and 2019
Bhuvan revolutionalized NRSC’s interface with users by changing the way to look and understand map data. From the traditional map, users have been served with digital copy of the same with interactive tools to explore and enhance its use on ground. It helped users to build and expand the information base of their own resources. Bhuvan Crowd Sourcing initiative, opened the vista of Creating the inventory of government assets in various departments and encouraged them to value add the same with key information attributes. All using customized mobile apps.
Bhuvan became unique geospatial platform that has right mix of multi date high resolution satellite images, street level maps, information on natural resources and rich crowd sourced data. It has opened the use of Bhuvan for g-governance in the country. Geospatial decision making is enhanced by information on Rural
Landuse, Urban landuse, Wastelands, Ground Water Prospects, Topography, fortnightly surface water spread etc. Bhuvan also provide perspective view of landscapes. The visual perspective and terrain profiles provide insight into land development solutions. Bhuvan 3D also provides urban view with 3D models of buildings. While Bhuvan is publicly open portal, it also has customized web applications for ministries.
The small but dedicated Bhuvan team worked with killing instinct to achieve what is Bhuvan today. The applications are built with proactive and re-active model of working. The applications are classified and designed as generic frameworks that helped rapid application development. Many high priority applications are developed in average one week turnaround time and as fast as over-night 12 hours. This gave a big impetus to the growth of Bhuvan and also gave the confidence to users to rely on responsive team. All could be possible with continuous, close interaction and follow-ups of Bhuvan team leaders with ministries and departments.
Data is the nucleus of any application and hence immediate steps are taken to achieve rapid data growth. In first 3 years of Bhuvan the data processing was limited to less than 500 GB in an year. It was increased to 42 TB in 2019. The increase in data processed over the years is shown in Figure 1.2.
Fig. 1.2: Data processed from 2009 to 2019
Bhuvan – A comparisonParameters 2009 2019
Platform and Browser
IndependentNo Yes
Back end technology COTS based Open Source Based
Satellite Data 5.8 m 1m for pan India with Temporal data
MapsScanned City maps for
5 citiesLarge-scale base map for pan India
Thematic Information 3 themes 14 themes
OGC Compliance No Yes
Open Data Archive No Yes – having around 80 Products.
Multi-Lingual No Support is provided
Governance
Application
Envisaged initially for
EO data visualisation
168 Application for state, central
ministry
Mobile apps No 60 Active mobile apps
Crowd sourcing No 81 million locations & photos
Hosting Platform No Yes
Architecture Centrally located Distributed
User Base30 to 40 thousands /
month after initial peak10 million hits / day
1. Bhuvan - A Decadal Journey (2009 – 2019)
168 applications are built with just 9 application frameworks, providing the fast application request to software delivery scenario. In addition to rapid application development, Bhuvan also kept chasing new development trends and used them aptly in appropriate applications like migration from Openlayers 2 to Openlayers 5 for map view applications; using Leaflet, vueJS, Framework 7, DJango, NodeJS and Apache for web applications; using Mapnik from Mapserver for improved map rendering performance and quality & Tuning of PostGIS for optimum performance.
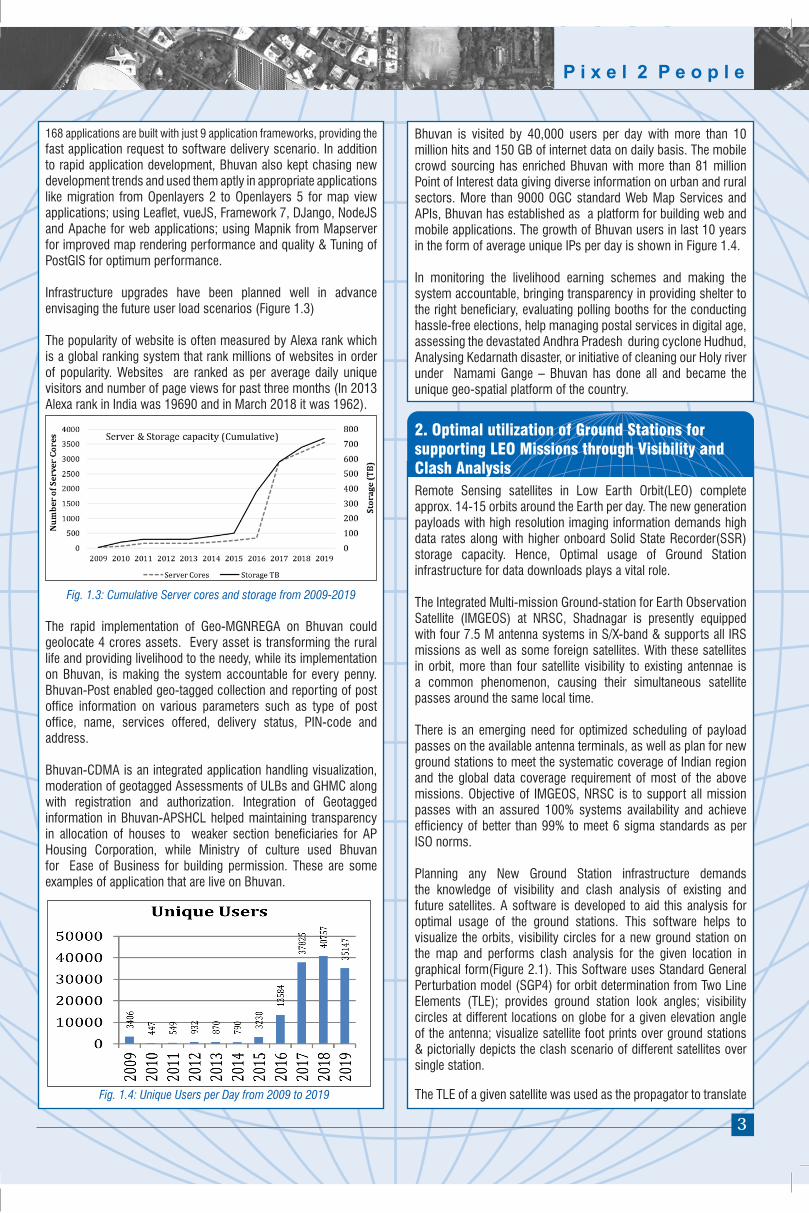
Infrastructure upgrades have been planned well in advance envisaging the future user load scenarios (Figure 1.3) The popularity of website is often measured by Alexa rank which is a global ranking system that rank millions of websites in order of popularity. Websites are ranked as per average daily unique visitors and number of page views for past three months (In 2013 Alexa rank in India was 19690 and in March 2018 it was 1962).
Fig. 1.3: Cumulative Server cores and storage from 2009-2019
The rapid implementation of Geo-MGNREGA on Bhuvan could geolocate 4 crores assets. Every asset is transforming the rural life and providing livelihood to the needy, while its implementation on Bhuvan, is making the system accountable for every penny. Bhuvan-Post enabled geo-tagged collection and reporting of post office information on various parameters such as type of post office, name, services offered, delivery status, PIN-code and address.
Bhuvan-CDMA is an integrated application handling visualization, moderation of geotagged Assessments of ULBs and GHMC along with registration and authorization. Integration of Geotagged information in Bhuvan-APSHCL helped maintaining transparency in allocation of houses to weaker section beneficiaries for AP Housing Corporation, while Ministry of culture used Bhuvan for Ease of Business for building permission. These are some examples of application that are live on Bhuvan.
P i x e l 2 P e o p l e
Fig. 1.4: Unique Users per Day from 2009 to 2019
Bhuvan is visited by 40,000 users per day with more than 10 million hits and 150 GB of internet data on daily basis. The mobile crowd sourcing has enriched Bhuvan with more than 81 million Point of Interest data giving diverse information on urban and rural sectors. More than 9000 OGC standard Web Map Services and APIs, Bhuvan has established as a platform for building web and mobile applications. The growth of Bhuvan users in last 10 years in the form of average unique IPs per day is shown in Figure 1.4.
In monitoring the livelihood earning schemes and making the system accountable, bringing transparency in providing shelter to the right beneficiary, evaluating polling booths for the conducting hassle-free elections, help managing postal services in digital age, assessing the devastated Andhra Pradesh during cyclone Hudhud, Analysing Kedarnath disaster, or initiative of cleaning our Holy river under Namami Gange – Bhuvan has done all and became the unique geo-spatial platform of the country.
Remote Sensing satellites in Low Earth Orbit(LEO) complete approx. 14-15 orbits around the Earth per day. The new generation payloads with high resolution imaging information demands high data rates along with higher onboard Solid State Recorder(SSR) storage capacity. Hence, Optimal usage of Ground Station infrastructure for data downloads plays a vital role.
The Integrated Multi-mission Ground-station for Earth Observation Satellite (IMGEOS) at NRSC, Shadnagar is presently equipped with four 7.5 M antenna systems in S/X-band & supports all IRS missions as well as some foreign satellites. With these satellites in orbit, more than four satellite visibility to existing antennae is a common phenomenon, causing their simultaneous satellite passes around the same local time.
There is an emerging need for optimized scheduling of payload passes on the available antenna terminals, as well as plan for new ground stations to meet the systematic coverage of Indian region and the global data coverage requirement of most of the above missions. Objective of IMGEOS, NRSC is to support all mission passes with an assured 100% systems availability and achieve efficiency of better than 99% to meet 6 sigma standards as per ISO norms.
Planning any New Ground Station infrastructure demands the knowledge of visibility and clash analysis of existing and future satellites. A software is developed to aid this analysis for optimal usage of the ground stations. This software helps to visualize the orbits, visibility circles for a new ground station on the map and performs clash analysis for the given location in graphical form(Figure 2.1). This Software uses Standard General Perturbation model (SGP4) for orbit determination from Two Line Elements (TLE); provides ground station look angles; visibility circles at different locations on globe for a given elevation angle of the antenna; visualize satellite foot prints over ground stations & pictorially depicts the clash scenario of different satellites over single station.
The TLE of a given satellite was used as the propagator to translate
2. Optimal utilization of Ground Stations for supporting LEO Missions through Visibility and Clash Analysis
3
P i x e l 2 P e o p l e
the orbital parameters of the satellite to the pre-define ground station look angles (azimuth and elevation). The reference frame for these coordinates is Earth Centered Inertial, True Mean Equinox of the epoch (ECI TEME frame).
This software enables • Antenna lookanglesgenerationw.r.t timeandvariable time
step sizes, • Satellites orbital parameters with its ground trace on the
globe and visible passes for a given ground station• Satellitepasslistoveraspecifiedtimeinterval.• Projectionofthesatellitepathfootprintonatwodimensional
earth map.This software facilitates drawing of the visibility circles of a satellite for any given Ground Station location on the globe for different elevation angles of the antenna (Figure 2.2).
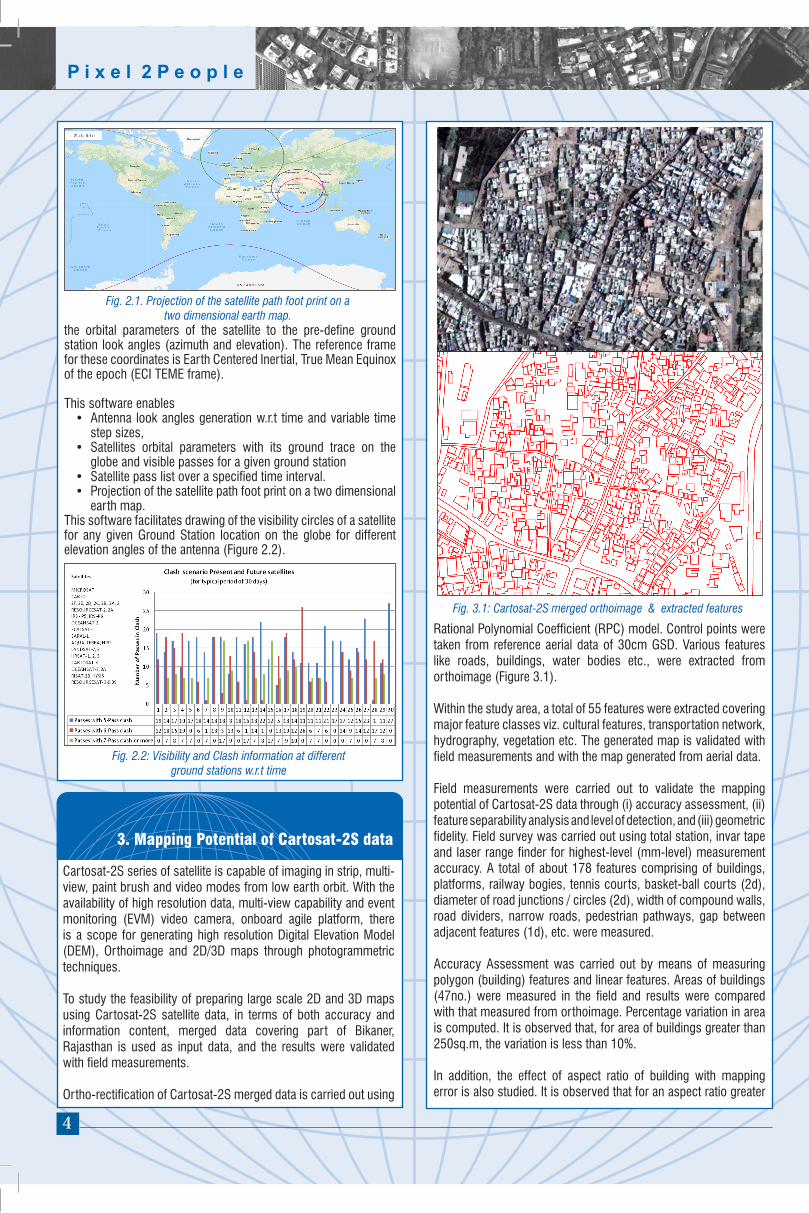
Rational Polynomial Coefficient (RPC) model. Control points were taken from reference aerial data of 30cm GSD. Various features like roads, buildings, water bodies etc., were extracted from orthoimage (Figure 3.1).
Within the study area, a total of 55 features were extracted covering major feature classes viz. cultural features, transportation network, hydrography, vegetation etc. The generated map is validated with field measurements and with the map generated from aerial data.
Field measurements were carried out to validate the mapping potential of Cartosat-2S data through (i) accuracy assessment, (ii) feature separability analysis and level of detection, and (iii) geometric fidelity. Field survey was carried out using total station, invar tape and laser range finder for highest-level (mm-level) measurement accuracy. A total of about 178 features comprising of buildings, platforms, railway bogies, tennis courts, basket-ball courts (2d), diameter of road junctions / circles (2d), width of compound walls, road dividers, narrow roads, pedestrian pathways, gap between adjacent features (1d), etc. were measured.
Accuracy Assessment was carried out by means of measuring polygon (building) features and linear features. Areas of buildings (47no.) were measured in the field and results were compared with that measured from orthoimage. Percentage variation in area is computed. It is observed that, for area of buildings greater than 250sq.m, the variation is less than 10%.
In addition, the effect of aspect ratio of building with mapping error is also studied. It is observed that for an aspect ratio greater
Fig. 3.1: Cartosat-2S merged orthoimage & extracted features
3. Mapping Potential of Cartosat-2S data
Cartosat-2S series of satellite is capable of imaging in strip, multi-view, paint brush and video modes from low earth orbit. With the availability of high resolution data, multi-view capability and event monitoring (EVM) video camera, onboard agile platform, there is a scope for generating high resolution Digital Elevation Model (DEM), Orthoimage and 2D/3D maps through photogrammetric techniques. To study the feasibility of preparing large scale 2D and 3D maps using Cartosat-2S satellite data, in terms of both accuracy and information content, merged data covering part of Bikaner, Rajasthan is used as input data, and the results were validated with field measurements.
Ortho-rectification of Cartosat-2S merged data is carried out using
Fig. 2.2: Visibility and Clash information at differentground stations w.r.t time
4
Fig. 2.1. Projection of the satellite path foot print on atwo dimensional earth map.
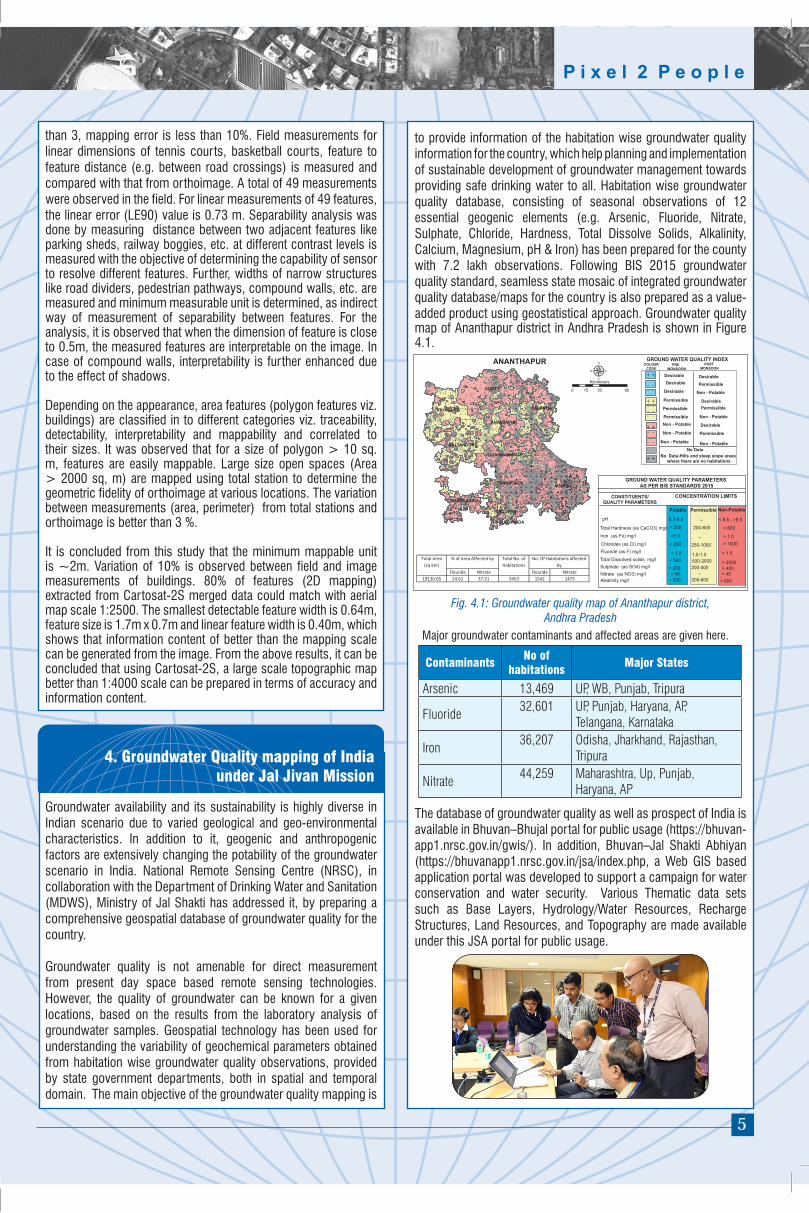
to provide information of the habitation wise groundwater quality information for the country, which help planning and implementation of sustainable development of groundwater management towards providing safe drinking water to all. Habitation wise groundwater quality database, consisting of seasonal observations of 12 essential geogenic elements (e.g. Arsenic, Fluoride, Nitrate, Sulphate, Chloride, Hardness, Total Dissolve Solids, Alkalinity, Calcium, Magnesium, pH & Iron) has been prepared for the county with 7.2 lakh observations. Following BIS 2015 groundwater quality standard, seamless state mosaic of integrated groundwater quality database/maps for the country is also prepared as a value-added product using geostatistical approach. Groundwater quality map of Ananthapur district in Andhra Pradesh is shown in Figure 4.1.
The database of groundwater quality as well as prospect of India is available in Bhuvan–Bhujal portal for public usage (https://bhuvan-app1.nrsc.gov.in/gwis/). In addition, Bhuvan–Jal Shakti Abhiyan (https://bhuvanapp1.nrsc.gov.in/jsa/index.php, a Web GIS based application portal was developed to support a campaign for water conservation and water security. Various Thematic data sets such as Base Layers, Hydrology/Water Resources, Recharge Structures, Land Resources, and Topography are made available under this JSA portal for public usage.
P i x e l 2 P e o p l e
than 3, mapping error is less than 10%. Field measurements for linear dimensions of tennis courts, basketball courts, feature to feature distance (e.g. between road crossings) is measured and compared with that from orthoimage. A total of 49 measurements were observed in the field. For linear measurements of 49 features, the linear error (LE90) value is 0.73 m. Separability analysis was done by measuring distance between two adjacent features like parking sheds, railway boggies, etc. at different contrast levels is measured with the objective of determining the capability of sensor to resolve different features. Further, widths of narrow structures like road dividers, pedestrian pathways, compound walls, etc. are measured and minimum measurable unit is determined, as indirect way of measurement of separability between features. For the analysis, it is observed that when the dimension of feature is close to 0.5m, the measured features are interpretable on the image. In case of compound walls, interpretability is further enhanced due to the effect of shadows. Depending on the appearance, area features (polygon features viz. buildings) are classified in to different categories viz. traceability, detectability, interpretability and mappability and correlated to their sizes. It was observed that for a size of polygon > 10 sq. m, features are easily mappable. Large size open spaces (Area > 2000 sq, m) are mapped using total station to determine the geometric fidelity of orthoimage at various locations. The variation between measurements (area, perimeter) from total stations and orthoimage is better than 3 %.
It is concluded from this study that the minimum mappable unit is ~2m. Variation of 10% is observed between field and image measurements of buildings. 80% of features (2D mapping) extracted from Cartosat-2S merged data could match with aerial map scale 1:2500. The smallest detectable feature width is 0.64m, feature size is 1.7m x 0.7m and linear feature width is 0.40m, which shows that information content of better than the mapping scale can be generated from the image. From the above results, it can be concluded that using Cartosat-2S, a large scale topographic map better than 1:4000 scale can be prepared in terms of accuracy and information content.
4. Groundwater Quality mapping of Indiaunder Jal Jivan Mission
Groundwater availability and its sustainability is highly diverse in Indian scenario due to varied geological and geo-environmental characteristics. In addition to it, geogenic and anthropogenic factors are extensively changing the potability of the groundwater scenario in India. National Remote Sensing Centre (NRSC), in collaboration with the Department of Drinking Water and Sanitation (MDWS), Ministry of Jal Shakti has addressed it, by preparing a comprehensive geospatial database of groundwater quality for the country. Groundwater quality is not amenable for direct measurement from present day space based remote sensing technologies. However, the quality of groundwater can be known for a given locations, based on the results from the laboratory analysis of groundwater samples. Geospatial technology has been used for understanding the variability of geochemical parameters obtained from habitation wise groundwater quality observations, provided by state government departments, both in spatial and temporal domain. The main objective of the groundwater quality mapping is
Major groundwater contaminants and affected areas are given here.
ContaminantsNo of
habitationsMajor States
Arsenic 13,469 UP, WB, Punjab, Tripura
Fluoride32,601 UP, Punjab, Haryana, AP,
Telangana, Karnataka
Iron36,207 Odisha, Jharkhand, Rajasthan,
Tripura
Nitrate44,259 Maharashtra, Up, Punjab,
Haryana, AP
Fig. 4.1: Groundwater quality map of Ananthapur district,Andhra Pradesh
5
! ! !
! ! !
N
N
N N
N N
N N
N N N N N N N N
N N N N N N N N
N N N N N N N N
N N N N N N N N
N N N N N N N N
N N N N N N N N
N N N N N N N N
N N N N N N N N
N N N N N N N N
N N N N N N N N
N N N N N N N N
N N N N N N N N
N N N N N N N N
! !
! !
!
N N N N N
N N N N N
N N N N
N N N
N N N
N N N
N N N
!
!
!!
!
!
!
!
!
!
!
!
N
N N N
N N N
N N N
N N N
N N N
N N N N
N N N N
N N N N
N N N N
N N N N
!
!
N N N
N N N
N N N
N N N
N N N
N N
N N
N
N
N N
N NN
N
!! !! !
! !
! !
! !
!
N
N
!
!
! !
! !
! !
! !
N
!
! !
! !
! ! ! ! ! !
! ! ! ! ! !
! ! ! ! ! !
! ! ! ! ! !
! ! ! ! ! !
!
! !
! !
! ! !
!
!
! !
!!
!
! !
!
N N
N N
!
!
!
! ! ! ! !
! ! ! ! !
!
N N
!
!N
N
!
N
! ! ! ! ! !
! ! ! ! ! !
! ! ! ! ! !
! ! ! ! ! !
! ! ! ! ! !
N
! ! ! !
! ! ! !
! ! ! !
!
! !
! !
N NN N N
N N N !
!
N N
N N
N N
! !
!
!
!
!
!
!
!
!
!
!
!
! !N
!
!
N N N
N N
N N
N N
N N
N N
N NE
N N
N
N N
N N
N N
N
N N
!!
! !N
!
!
N
NN N
NN
N N
N N
N N
NN
N
N N
N
N
N
N
N
N N N N N N N N N N N N N N N N N N N N N N N
N N N N N N N N N N N N N N N N N N N N N N N
N N N N N N N N N N N N N N N N N N N N N N N
N N N N N N N N N N N N N N N N N N N N N N N
N N N N N N N N N N N N N N N N N N N N N N N
N N N N N N N N N N N N N N N N N N N N N N N
N N N N N N N N N N N N N N N N N N N N N N N
N N N N N N N N N N N N N N N N N N N N N N N
N N N N N N N N N N N N N N N N N N N N N N N
N N N N N N N N N N N N N N N N N N N N N N N
N N N N N N N N N N N N N N N N N N N N N N N
N N N N N N N N N N N N N N N N N N N N N N N
N N N N N N N N N N N N N N N N N N N N N N N
N N N N N N N N N N N N N N N N N N N N N N N
N N N N N N N N N N N N N N N N N N N N N N N
N N N N N N N N N N N N N N N N N N N N N N N
N N N N N N N N N N N N N N N N N N N N N N N
N N N N N N N N N N N N N N N N N N N N N N N
N N N N N N N N N N N N N N N N N N N N N N N
N N N N N N N N N N N N N N N N N N N N N N N
N N N N N N N N N N
N N N N N N N N N N
N N N N N N N N N N
N N N N N N N N N N
N N N N N N N N N N
N N N N N N N N N N
N N N
N N N
N
N
N
N N N
N N N
N N N
N N N
N N N
N
N
!
! ! ! ! ! ! ! ! ! ! ! ! ! ! ! ! !
! ! ! ! ! ! ! ! ! ! ! ! ! ! ! ! !
! ! ! ! ! ! ! ! ! ! ! ! ! ! ! ! !
! ! ! ! ! ! ! ! ! ! ! ! ! ! ! ! !
! ! ! ! ! ! ! ! ! ! ! ! ! ! ! ! !
! ! ! ! ! ! ! ! ! ! ! ! ! ! ! ! !
! ! ! ! ! ! ! ! ! ! ! ! ! ! ! ! !
! ! ! ! ! ! ! ! ! ! ! ! ! ! ! ! !
! ! ! ! ! ! ! ! ! ! ! ! ! ! ! ! !
! ! ! ! ! ! ! ! ! ! ! ! ! ! ! ! !
! ! ! ! ! ! ! ! ! ! ! ! ! ! ! ! !
! ! ! ! ! ! ! ! ! ! ! ! ! ! ! ! !
! ! ! ! ! ! ! ! ! ! ! ! ! ! ! ! !
! ! ! ! ! ! ! ! ! ! ! ! ! ! ! ! !
! ! ! ! ! ! ! ! ! ! ! ! ! ! ! ! !
! ! ! ! ! ! ! ! ! ! ! ! ! ! ! ! !
N
N N
N
!!
NN
!
! !
! !
! !
! ! ! ! ! ! ! ! ! ! !
! ! ! ! ! ! ! ! ! ! !
! ! ! ! ! ! ! ! ! ! !
! ! ! ! ! ! ! ! ! ! !
! ! ! ! ! ! ! ! ! ! !
! ! ! ! ! ! ! ! ! ! !
! ! ! ! ! ! ! ! ! ! !
! ! ! ! ! ! ! ! ! ! !
! ! ! ! ! ! ! ! ! ! !
! ! ! ! ! ! ! ! ! ! !
! ! ! ! ! ! ! ! ! ! !
! ! ! ! ! ! ! ! ! ! !
N N N N N N
N N N N N N
N N N N N N
N N N N N N
N N N N N N
N N N N N N N N N N N N N N N N N N N N N
N N N N N N N N N N N N N N N N N N N N N
N N N N N N N N N N N N N N N N N N N N N
N N N N N N N N N N N N N N N N N N N N N
N N N N N N N N N N N N N N N N N N N N N
N N N N N N N N N N N N N N N N N N N N N
N N N N N N N N N N N N N N N N N N N N N
N N N N N N N N N N N N N N N N N N N N N
N N N N N N N N N N N N N N N N N N N N N
N N N N N N N N N N N N N N N N N N N N N
N N N N N N N N N N N N N N N N N N N N N
N N N N N N N N N N N N N N N N N N N N N
N N N N N N N N N N N N N N N N N N N N N
N N N N N N N N N N N N N N N N N N N N N
N N N
N
N N
N N
N N N N
N N N N
N N N N
N
! ! ! ! ! ! ! ! ! ! !
! ! ! ! ! ! ! ! ! ! !
! ! ! ! ! ! ! ! ! ! !
! ! ! ! ! ! ! ! ! ! !
! ! ! ! ! ! ! ! ! ! !
! ! ! ! ! ! ! ! ! ! !
! ! ! ! ! ! ! ! ! ! !
! ! ! ! ! ! ! ! ! ! !
! ! ! ! ! ! ! ! ! ! !
! ! ! ! ! ! ! ! ! ! !
! ! ! ! ! ! ! ! ! ! !
! ! ! ! ! ! ! ! ! ! !
! ! ! ! ! ! ! ! ! ! !
! ! ! ! ! ! ! ! ! ! !
! ! ! ! ! ! ! ! ! ! !
! ! ! ! ! ! ! ! ! ! !
! ! ! ! ! ! ! ! ! ! !
! ! ! ! ! ! ! ! ! ! !
! ! ! ! ! ! ! ! ! ! !
! ! ! ! ! ! ! ! ! ! !
! ! ! ! ! ! ! ! ! ! !
! ! ! ! ! ! ! ! ! ! !
! ! ! ! ! ! ! ! ! ! !
! ! ! ! ! ! ! ! ! ! !
! ! ! ! ! ! ! ! ! ! !
! ! ! ! ! ! ! ! ! ! !
! ! ! ! ! ! ! ! ! ! !
! ! ! ! ! ! ! ! ! ! !
E
EEEE
E EE EEEE
E
E
EEEEE E EEE E E
E E
E EE
E E
E E
E
E
E E EEEE
E E
E
E
E
EE
E
EE
EE
E
E E
E E
EE
E E
E
EE
E
EEE
E EEEE E
E
E E E E
E E E E
E E E E
E E E E
E E E E
E E E E
E E E E
E
EE
E
EEE
EE
E
E
E
E
E E
E E
E
EE
E E EEE
E EEEE
E
E EE
E E
E E
E E
E EE
E E
E EE E
E
E
EE
EE E
E
E E
E EE EE
E
E
E EEE
E
E
E
EE
E
EE
E
E E
E E
E E
E
E
EE EEEE
E
E E E E
E E E E
EE EEE E
E
E
E
E E EE
E
EE E
EEE EE
E
E
E E
E E
E
E
E EE
EE
E
EE EE EE
E
E
EE
E E
E E
E E
E
E
E EEE E E
E E E
E E
E E
E E E
E E E
E E E
E E E EE EE
EE E
E
E
E E E E
E E E E
E E E E
E E E E
E E E E
EE EE
E E E EEEE EEE
E
E
E EEE
E
E E
E E
E
E
E E
E EE
EEEE E E E
E EEE EEE
E E
E EEE
E EE E
E
E E
E
E
E
EE
E EEEEE
E E E E E
E E E E E
E E E E E
E E E E E
E E
E E
E E
E EE E
E E
E EE
E
E
E
E
E E E
E
E E
EE
EE
EEE E EE EE
E E
E E
EE E
E E
E E
E E
E EE E E E
EE
E E E
E E E
E E E
E E E
E E
E E
E E
E
E EE
E E
E
EE
E
E E
E E
E
EE E
E E
E
EEE
E
E EEE
E EEEE
E EEE
EE
E
E E
EE
EEE EEE
E
E
E
EE EE E
EEEE EE
EEE
E E
EEE
E E EE
EE
E EE
EEEEE
E
E
E
E
EEE
EE
E
E
E
E
E
E
E E
E E
E
E E EEE E
EE
E
E
E
E
EE
EEE
E
E
EE E
EEE
EEEE
E E
E
E
EE
E EEEE
EE EE
E
E E
E E
E E
E E
E
EE EEE
E
EE E
E
E
E
E
E
EEE
EE
EE
E E E EE
E
EE
EEE EE
E
E E
E
E
E E
E
E
E
E
E
E E
E E E
EEEE
E E E
E E E
E E EEE E E
E
E
E
EE
E
E
EE
EE E
E
EE E
E
E E EE
E E
E EEE E
E E
E
E E E
E
E
EE
E
E
E E
E
EEE
E
E
E
E
E
E E
E
E
E
E
E E
E EE E EEEE
E
E EE
E E
E
E
E
E
E E
E
EE
EE
E
EE
E
E E
E E
E E
E
E
E
E E E
E E E
E E E
E
E
E
EE
E
E E
E
E
E
E
E
E
E
E E
E
E
E E E E E
E E E E E
E E E E E
E E E E E
E E E E E
E E E E
E E E E
E E
E E
##
###
#
#
#
#
#
#
###
####
### # ### # ## ## #### ## ## # # #### ### ## # ### ## ### # ## ## # ### # #### # ## # ## ##### ## ## ## ### ## ### ## #### ## # ## # ### ### ## ## ## ## ## # # ## ##### # ### ### # ## # ### ##### # ## # #### # # ### ### ## ## # ### # ### # # ## # ## ## ### #### # ### ### # ## ### # ## ## #### # ### ## ### # ### ## # ## ### ## # ## # #### # ##### # ##### #### # ## ## #### ## ## ## #### # ## ### # ## ## ### # ### ## ## ## #### # ### # ## ## ## # ## ## # ## ### # ### #### ## ## # ## ### # ## ## ### # # ### # ## ## ### ## # ## ## ### ### ## ### ## ### ## ## ## ### # ### #### ## # ## # ## # ## ## # ## # # #### ## ## # ## ### ## ## # #### ### #### ## ### # # ## # ## # # ## # ### ### ### #### # ### ## ### ## #### # # ## # # # ## ## ## # ## ### ## ##### # # ## ### ## ### # #### ## #### # ## #### ### # # # # ### # # ## ## # ### ## ### ## ## # # ## # ## ### # ## ### ### # ## ### ### ## # ## ## # ### # ## # ## ## #### ## ## ### ### # ## ### ## # ### # ### # #### ## ### # # ### ## # ## ## ## # #### ### ## ### ### # ### # #### ## # ## # ## # ## #### # #### # ### ## # ## ### ## ## # # #### ## # # ### # ##### ## ##### # # ## ## ## # ## # ### ### # ## ### ### # # ## ## ## ## # # ## # ## # # # ## # ## # # # ## ### ## ### # ## # ## ## ## ## ### #### ## ## ## ### # # ## ## ## ### ### # ## # ### ### # ## ## ## # ### ##### # # ### ## # ### ### ## ## # ### #### # #### #### ## ## ### # ## ## # ## ## # # # ## ## ## # # ## # ## ### # ## ## ## ## ## ## # ## # ### # #### ## ### # ## ### # ## ## # # ## ## ## # ### # ## #### ## # ### ### ### ## ### ### ## # ### ### ## # ### ### ### ### ### # ### ### ### ### ## ### ## ### # ## ## # # ## # # # ## ### ## ## ### ## # ### #### # ## # ## # # ### # ## ## # ## #### ## ## ## ## ### ### ## #### ### ## # #### #### # ##### # ## ## ## ## ### # ### ### # ## # ## ## ## ### # # ## # ## # ## ### # # ## ## ## ##### ### # ## # ## # # ## ## ## # ## ## ## # ## ## ## ### # ### # ### # # ## ## ## ### # ## ## ### # # ## #### ## # ### ## ##### ## ### ## ### # ## # ## ## # ### ## #### #### ## # ### ## # # ####### # # ### ### ### ## ### ### # # ## ## ## #### ## ## ### ## ### # ## ## ## ## # ## # ## # # # ## ### ### ### # ### ## ## ## ## ### ## #### ## ### # ## ## ## # ## # ## ### ## # # ## #### # # ## ## #### ## ### # ### # # ### # #### ### ## # #### ## # ## #### ## ## ## ### ## # ## ## # ## # # ## #### ### # ### ## ### ### # ### # ## ## ## ## ## # ## ## # # ##### ## # ## ## ## # ## ##### ### # # ## ## # # ### ## # ## # ## # ## ## # # ### ### ## ## ## # # ## ## ##### # # ## # ## #### # ### ## ## # ## ## ## # ### # ### ## # #### #### ## ## # # # ## # ## ### ### ### ### # ## # ## ##### # ### ## ### ## ## ### ## ## #### ### # #### ## # ## ## # ### ## ### # ## ## # ## # # ## ### ## # ## # ## ## ## ## # # ### ## ## # # ###### # ### # ### ## # ## # ##### # # #### ## ## ## # ## ### ### ## ### # ### # ## # ## ## #### ## ## # ##### ### ## ## ### ## # # ### # # ## ## ### ### ## ## ## ## ### #### # # ## ### ## # ## ## ## ## ## #### # ## # # # ### # ## # ##### ## ### # ### # ### # ##### # # ## # ## ## ## # ## ## ## ## #### ## # ## ## ### ## # ## ### ## # ### # ### ## ## ## ## ## # ### # ## # ## ### # ## # ### ## # ## # # ## # ## # #### # # ## ## ### ## # #### # ## ## ### # ### #### ## # ## ## ## ## ## ### ##### ## ## # ## ## # ## # ## ## # #### # ## #### ## # #### ### # ## #### ### # ## ## ##### # # # # ## # ## # #### # ## ## ## # ### # ## # ## ### #### # # ## ## ## ### ## ### ## ## ### ### ## ## ## ## ## # ### #### # # ## ## ## # ## # # # ### # ## ### # ### ### ## #### ### #### ## # ## # # ## ## ## # ## # ## # #### ## ## ## # ## # # ## ### ### ### # ## #### # # ## # ### ## # ## ## ## # ## ## ## ## ### ### ## ## ## ## ## ### # ## ### #### ### ## ## # #### ### ## ### # ## # ### ### ## ## # ### ## ### # ### ## # ## # #### # #### ## # ## ## # ## # # ## ## ## ### ### ### # ## # ## ### # # # ### ### ## # ### ### ## #### ## ## ## ## # ## # ### # ## ### ### #### # # #### ## ## ## # ### # ## ## # ## ## #### ## ## ## # ## ### ### ## ### ## ### ## #### #### ## ## ## ## ## ### # ### #### # ## #### # # ### #### # # #### ## ### ## # ### ## ## ##### ## # #### # ## ### # ### ## ## ### ## # ## # # ## ### ## ### ## ### #### ## ### # # ### ## ### ## # # ## # ## ### #### # ## #### # #### ## ### ## ## # ## # #### ## ## # ## # # #### ## ### # ## ## ## ### ## ##### ## # # ## ## ## ## ## # ## #### # ## ### ## # # ## ### ### ### # ## # ## ### ## # ## ## ### ##### ## ### #
KADIRI
GOOTY
ANANTAPUR
TADPATRIRAYADURG
KALYANDURG
PENUKONDA
DHARMAVARAM
HINDUPUR
MADAKASIRA
GUDIBANDA
ANANTHAPUR
µ0 30 6015
Kilometers
GROUND WATER QUALITY PARAMETERS AS PER BIS STANDARDS 2015
CONSTITUENTS/QUALITY PARAMETERS
CONCENTRATION LIMITS
Potable Non-PotablePermissible
pH
Total Hardness (as CaCO3) mg/lIron (as Fe) mg/l
Chlorides (as Cl) mg/lFluoride (as F) mg/lTotal Dissolved solids mg/l
Nitrate (as NO3) mg/lAlkalinity mg/l
6.5-8.5 -- < 6.5 ; >8.5< 200 200-600 > 600
<1.0 -- > 1.0< 250 250-1000 > 1000
< 1.0 1.0-1.5 > 1.5< 500 500-2000 > 2000
< 45 -- > 45< 200 200-600 > 600
GROUND WATER QUALITY INDEX
Flouride Nitrate Flouride Nitrate19130.65 24.61 37.51 3453 1542 1473
% of Area Affected by No. Of Habitations affected by
Total Area (sq.km)
Total No. of Habitations Sulphate (as SO4) mg/l < 200 200-400 > 400
COLOUR CODE
PRE MONSOON
POST MONSOON
Desirable
Non - Potable
DesirableDesirable
Desirable
Permissible
Permissible
Permissible
Non - Potable
Non - Potable
Non - Potable
PermissiblePermissible
Permissible
Desirable
Non - Potable
Non - Potable
Desirable
No DataNo Data-Hills and steep slope areas
where there are no habitations
Z ZZ Z
+ +
+ +
N N
N N
Z Z
! !
! !
N N
Z ZZ Z
! !
! !
N N
Z ZZ Z
P i x e l 2 P e o p l e
5. West Bengal Coastal Information System
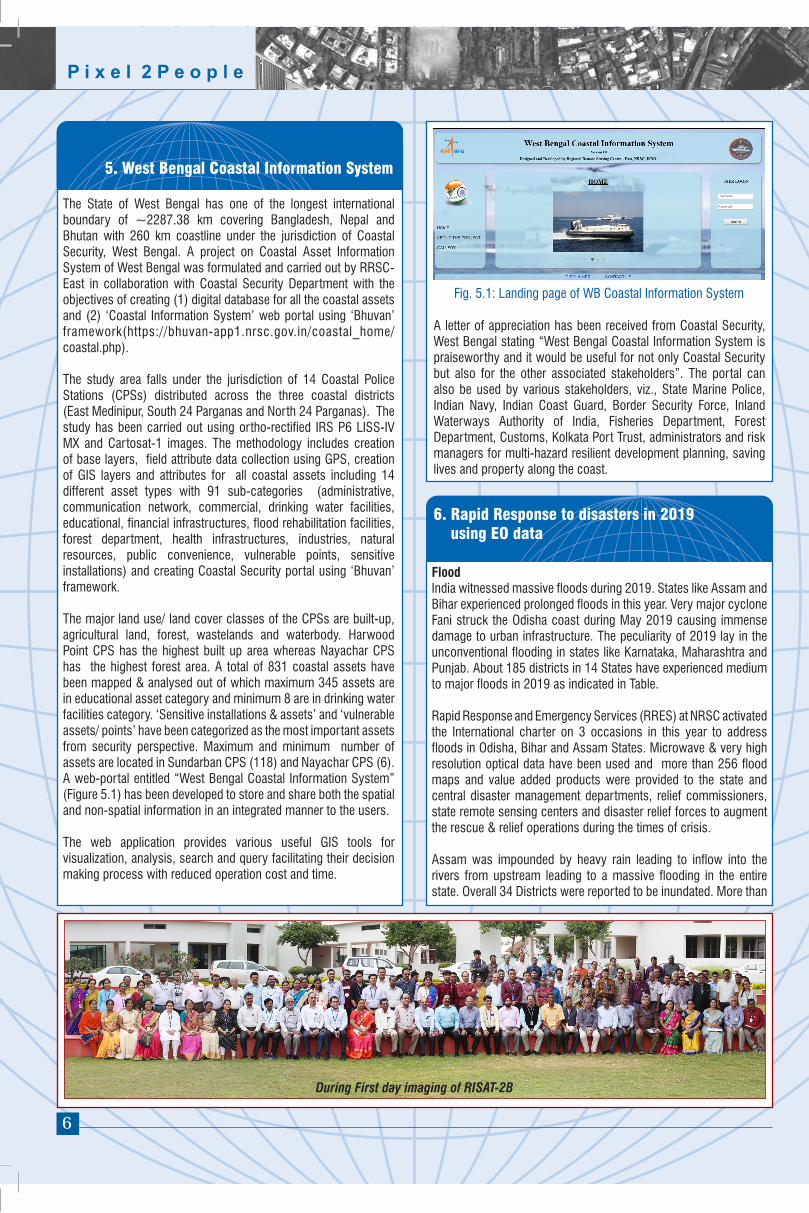
The State of West Bengal has one of the longest international boundary of ~2287.38 km covering Bangladesh, Nepal and Bhutan with 260 km coastline under the jurisdiction of Coastal Security, West Bengal. A project on Coastal Asset Information System of West Bengal was formulated and carried out by RRSC-East in collaboration with Coastal Security Department with the objectives of creating (1) digital database for all the coastal assets and (2) ‘Coastal Information System’ web portal using ‘Bhuvan’ framework(https://bhuvan-app1.nrsc.gov.in/coastal_home/ coastal.php).
The study area falls under the jurisdiction of 14 Coastal Police Stations (CPSs) distributed across the three coastal districts (East Medinipur, South 24 Parganas and North 24 Parganas). The study has been carried out using ortho-rectified IRS P6 LISS-IV MX and Cartosat-1 images. The methodology includes creation of base layers, field attribute data collection using GPS, creation of GIS layers and attributes for all coastal assets including 14 different asset types with 91 sub-categories (administrative, communication network, commercial, drinking water facilities, educational, financial infrastructures, flood rehabilitation facilities, forest department, health infrastructures, industries, natural resources, public convenience, vulnerable points, sensitive installations) and creating Coastal Security portal using ‘Bhuvan’ framework.
The major land use/ land cover classes of the CPSs are built-up, agricultural land, forest, wastelands and waterbody. Harwood Point CPS has the highest built up area whereas Nayachar CPS has the highest forest area. A total of 831 coastal assets have been mapped & analysed out of which maximum 345 assets are in educational asset category and minimum 8 are in drinking water facilities category. ‘Sensitive installations & assets’ and ‘vulnerable assets/ points’ have been categorized as the most important assets from security perspective. Maximum and minimum number of assets are located in Sundarban CPS (118) and Nayachar CPS (6). A web-portal entitled “West Bengal Coastal Information System” (Figure 5.1) has been developed to store and share both the spatial and non-spatial information in an integrated manner to the users. The web application provides various useful GIS tools for visualization, analysis, search and query facilitating their decision making process with reduced operation cost and time.
A letter of appreciation has been received from Coastal Security, West Bengal stating “West Bengal Coastal Information System is praiseworthy and it would be useful for not only Coastal Security but also for the other associated stakeholders”. The portal can also be used by various stakeholders, viz., State Marine Police, Indian Navy, Indian Coast Guard, Border Security Force, Inland Waterways Authority of India, Fisheries Department, Forest Department, Customs, Kolkata Port Trust, administrators and risk managers for multi-hazard resilient development planning, saving lives and property along the coast.
Fig. 5.1: Landing page of WB Coastal Information System
6. Rapid Response to disasters in 2019 using EO data
FloodIndia witnessed massive floods during 2019. States like Assam and Bihar experienced prolonged floods in this year. Very major cyclone Fani struck the Odisha coast during May 2019 causing immense damage to urban infrastructure. The peculiarity of 2019 lay in the unconventional flooding in states like Karnataka, Maharashtra and Punjab. About 185 districts in 14 States have experienced medium to major floods in 2019 as indicated in Table.
Rapid Response and Emergency Services (RRES) at NRSC activated the International charter on 3 occasions in this year to address floods in Odisha, Bihar and Assam States. Microwave & very high resolution optical data have been used and more than 256 flood maps and value added products were provided to the state and central disaster management departments, relief commissioners, state remote sensing centers and disaster relief forces to augment the rescue & relief operations during the times of crisis.
Assam was impounded by heavy rain leading to inflow into the rivers from upstream leading to a massive flooding in the entire state. Overall 34 Districts were reported to be inundated. More than
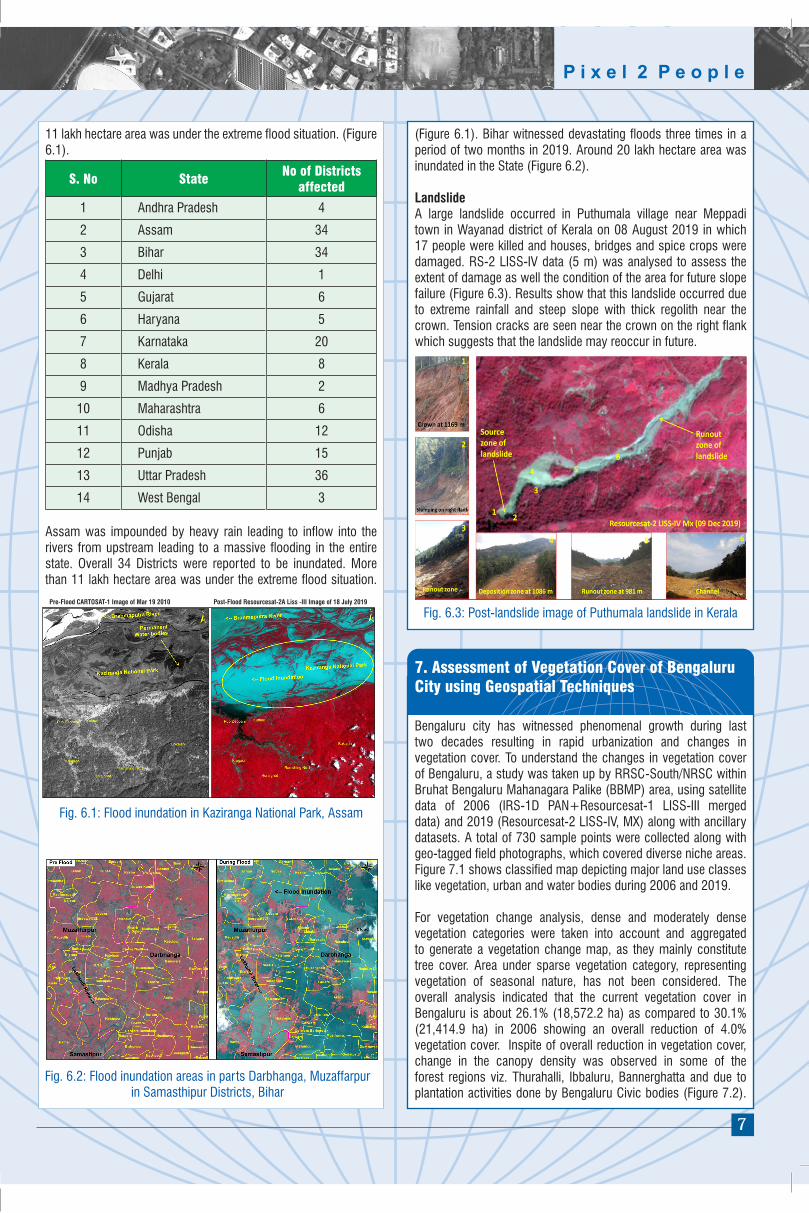
During First day imaging of RISAT-2B
6
P i x e l 2 P e o p l e
11 lakh hectare area was under the extreme flood situation. (Figure 6.1).
S. No StateNo of Districts
affected
1 Andhra Pradesh 4
2 Assam 34
3 Bihar 34
4 Delhi 1
5 Gujarat 6
6 Haryana 5
7 Karnataka 20
8 Kerala 8
9 Madhya Pradesh 2
10 Maharashtra 6
11 Odisha 12
12 Punjab 15
13 Uttar Pradesh 36
14 West Bengal 3
Assam was impounded by heavy rain leading to inflow into the rivers from upstream leading to a massive flooding in the entire state. Overall 34 Districts were reported to be inundated. More than 11 lakh hectare area was under the extreme flood situation.
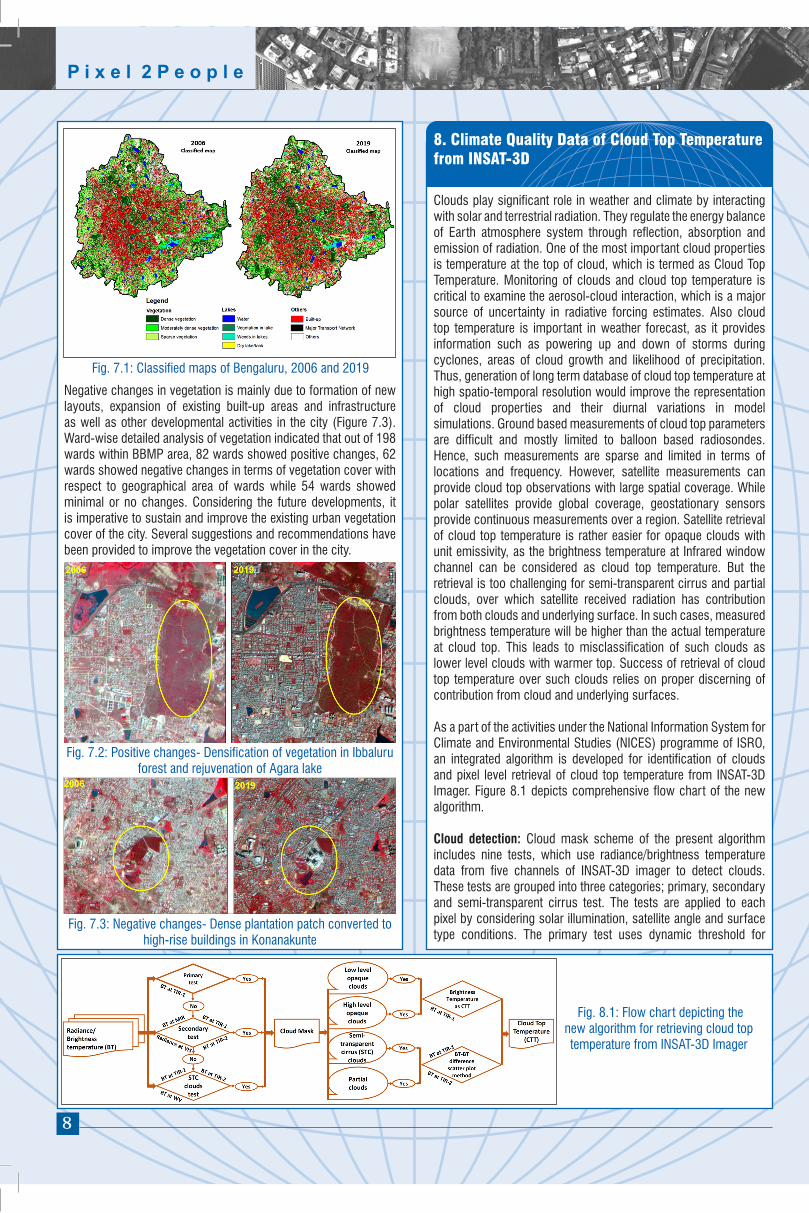
Fig. 6.3: Post-landslide image of Puthumala landslide in Kerala
(Figure 6.1). Bihar witnessed devastating floods three times in a period of two months in 2019. Around 20 lakh hectare area was inundated in the State (Figure 6.2).
LandslideA large landslide occurred in Puthumala village near Meppadi town in Wayanad district of Kerala on 08 August 2019 in which 17 people were killed and houses, bridges and spice crops were damaged. RS-2 LISS-IV data (5 m) was analysed to assess the extent of damage as well the condition of the area for future slope failure (Figure 6.3). Results show that this landslide occurred due to extreme rainfall and steep slope with thick regolith near the crown. Tension cracks are seen near the crown on the right flank which suggests that the landslide may reoccur in future.
7. Assessment of Vegetation Cover of Bengaluru City using Geospatial Techniques
Bengaluru city has witnessed phenomenal growth during last two decades resulting in rapid urbanization and changes in vegetation cover. To understand the changes in vegetation cover of Bengaluru, a study was taken up by RRSC-South/NRSC within Bruhat Bengaluru Mahanagara Palike (BBMP) area, using satellite data of 2006 (IRS-1D PAN+Resourcesat-1 LISS-III merged data) and 2019 (Resourcesat-2 LISS-IV, MX) along with ancillary datasets. A total of 730 sample points were collected along with geo-tagged field photographs, which covered diverse niche areas. Figure 7.1 shows classified map depicting major land use classes like vegetation, urban and water bodies during 2006 and 2019. For vegetation change analysis, dense and moderately dense vegetation categories were taken into account and aggregated to generate a vegetation change map, as they mainly constitute tree cover. Area under sparse vegetation category, representing vegetation of seasonal nature, has not been considered. The overall analysis indicated that the current vegetation cover in Bengaluru is about 26.1% (18,572.2 ha) as compared to 30.1% (21,414.9 ha) in 2006 showing an overall reduction of 4.0% vegetation cover. Inspite of overall reduction in vegetation cover, change in the canopy density was observed in some of the forest regions viz. Thurahalli, Ibbaluru, Bannerghatta and due to plantation activities done by Bengaluru Civic bodies (Figure 7.2).
Fig. 6.1: Flood inundation in Kaziranga National Park, Assam
Fig. 6.2: Flood inundation areas in parts Darbhanga, Muzaffarpur in Samasthipur Districts, Bihar
Pre-Flood CARTOSAT-1 Image of Mar 19 2010 Post-Flood Resourcesat-2A Liss -III Image of 18 July 2019
7
P i x e l 2 P e o p l e
Negative changes in vegetation is mainly due to formation of new layouts, expansion of existing built-up areas and infrastructure as well as other developmental activities in the city (Figure 7.3). Ward-wise detailed analysis of vegetation indicated that out of 198 wards within BBMP area, 82 wards showed positive changes, 62 wards showed negative changes in terms of vegetation cover with respect to geographical area of wards while 54 wards showed minimal or no changes. Considering the future developments, it is imperative to sustain and improve the existing urban vegetation cover of the city. Several suggestions and recommendations have been provided to improve the vegetation cover in the city.
Fig. 7.1: Classified maps of Bengaluru, 2006 and 2019
Fig. 7.2: Positive changes- Densification of vegetation in Ibbaluru forest and rejuvenation of Agara lake
Fig. 7.3: Negative changes- Dense plantation patch converted to high-rise buildings in Konanakunte
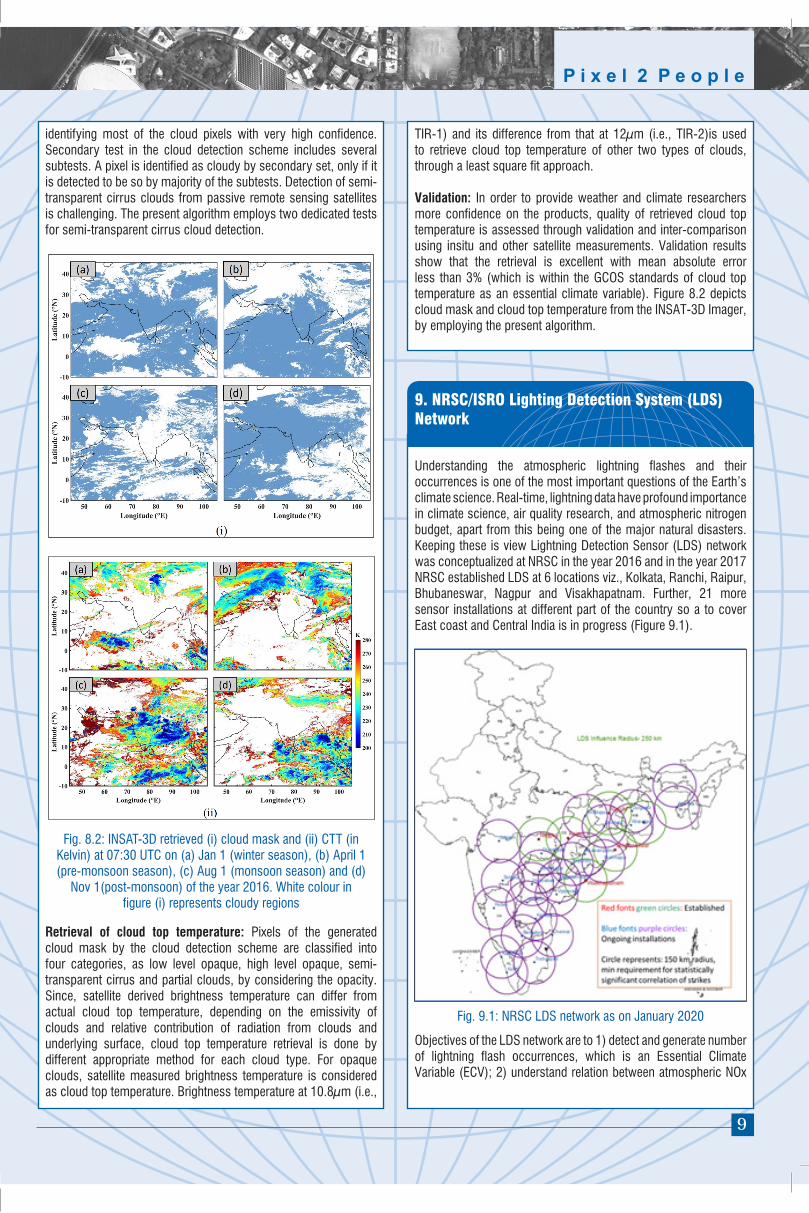
Clouds play significant role in weather and climate by interacting with solar and terrestrial radiation. They regulate the energy balance of Earth atmosphere system through reflection, absorption and emission of radiation. One of the most important cloud properties is temperature at the top of cloud, which is termed as Cloud Top Temperature. Monitoring of clouds and cloud top temperature is critical to examine the aerosol-cloud interaction, which is a major source of uncertainty in radiative forcing estimates. Also cloud top temperature is important in weather forecast, as it provides information such as powering up and down of storms during cyclones, areas of cloud growth and likelihood of precipitation. Thus, generation of long term database of cloud top temperature at high spatio-temporal resolution would improve the representation of cloud properties and their diurnal variations in model simulations. Ground based measurements of cloud top parameters are difficult and mostly limited to balloon based radiosondes. Hence, such measurements are sparse and limited in terms of locations and frequency. However, satellite measurements can provide cloud top observations with large spatial coverage. While polar satellites provide global coverage, geostationary sensors provide continuous measurements over a region. Satellite retrieval of cloud top temperature is rather easier for opaque clouds with unit emissivity, as the brightness temperature at Infrared window channel can be considered as cloud top temperature. But the retrieval is too challenging for semi-transparent cirrus and partial clouds, over which satellite received radiation has contribution from both clouds and underlying surface. In such cases, measured brightness temperature will be higher than the actual temperature at cloud top. This leads to misclassification of such clouds as lower level clouds with warmer top. Success of retrieval of cloud top temperature over such clouds relies on proper discerning of contribution from cloud and underlying surfaces.
As a part of the activities under the National Information System for Climate and Environmental Studies (NICES) programme of ISRO, an integrated algorithm is developed for identification of clouds and pixel level retrieval of cloud top temperature from INSAT-3D Imager. Figure 8.1 depicts comprehensive flow chart of the new algorithm. Cloud detection: Cloud mask scheme of the present algorithm includes nine tests, which use radiance/brightness temperature data from five channels of INSAT-3D imager to detect clouds. These tests are grouped into three categories; primary, secondary and semi-transparent cirrus test. The tests are applied to each pixel by considering solar illumination, satellite angle and surface type conditions. The primary test uses dynamic threshold for
8. Climate Quality Data of Cloud Top Temperature from INSAT-3D
Fig. 8.1: Flow chart depicting the new algorithm for retrieving cloud top temperature from INSAT-3D Imager
8
P i x e l 2 P e o p l e
identifying most of the cloud pixels with very high confidence. Secondary test in the cloud detection scheme includes several subtests. A pixel is identified as cloudy by secondary set, only if it is detected to be so by majority of the subtests. Detection of semi-transparent cirrus clouds from passive remote sensing satellites is challenging. The present algorithm employs two dedicated tests for semi-transparent cirrus cloud detection.
Retrieval of cloud top temperature: Pixels of the generated cloud mask by the cloud detection scheme are classified into four categories, as low level opaque, high level opaque, semi-transparent cirrus and partial clouds, by considering the opacity. Since, satellite derived brightness temperature can differ from actual cloud top temperature, depending on the emissivity of clouds and relative contribution of radiation from clouds and underlying surface, cloud top temperature retrieval is done by different appropriate method for each cloud type. For opaque clouds, satellite measured brightness temperature is considered as cloud top temperature. Brightness temperature at 10.8µm (i.e.,
Fig. 8.2: INSAT-3D retrieved (i) cloud mask and (ii) CTT (in Kelvin) at 07:30 UTC on (a) Jan 1 (winter season), (b) April 1 (pre-monsoon season), (c) Aug 1 (monsoon season) and (d)
Nov 1(post-monsoon) of the year 2016. White colour in figure (i) represents cloudy regions
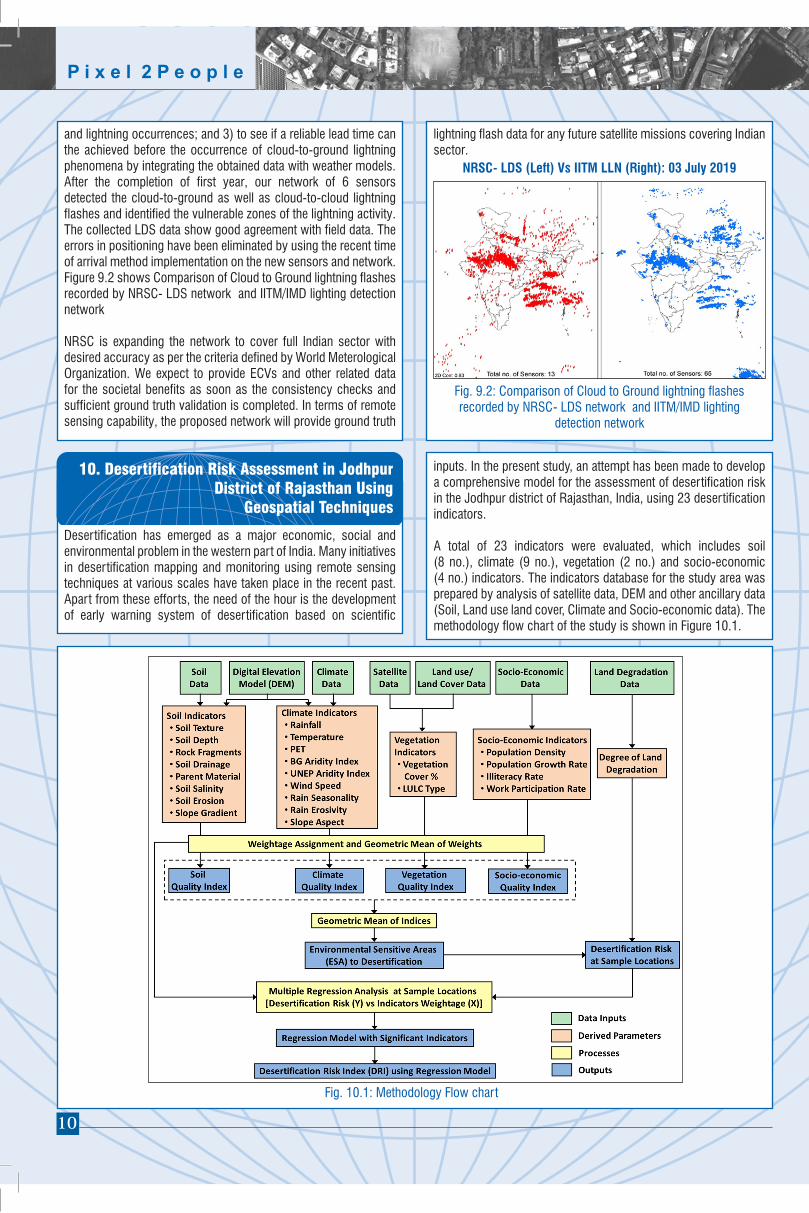
Understanding the atmospheric lightning flashes and their occurrences is one of the most important questions of the Earth’s climate science. Real-time, lightning data have profound importance in climate science, air quality research, and atmospheric nitrogen budget, apart from this being one of the major natural disasters. Keeping these is view Lightning Detection Sensor (LDS) network was conceptualized at NRSC in the year 2016 and in the year 2017 NRSC established LDS at 6 locations viz., Kolkata, Ranchi, Raipur, Bhubaneswar, Nagpur and Visakhapatnam. Further, 21 more sensor installations at different part of the country so a to cover East coast and Central India is in progress (Figure 9.1).
Objectives of the LDS network are to 1) detect and generate number of lightning flash occurrences, which is an Essential Climate Variable (ECV); 2) understand relation between atmospheric NOx
9. NRSC/ISRO Lighting Detection System (LDS) Network
TIR-1) and its difference from that at 12µm (i.e., TIR-2)is used to retrieve cloud top temperature of other two types of clouds, through a least square fit approach.
Validation: In order to provide weather and climate researchers more confidence on the products, quality of retrieved cloud top temperature is assessed through validation and inter-comparison using insitu and other satellite measurements. Validation results show that the retrieval is excellent with mean absolute error less than 3% (which is within the GCOS standards of cloud top temperature as an essential climate variable). Figure 8.2 depicts cloud mask and cloud top temperature from the INSAT-3D Imager, by employing the present algorithm.
Fig. 9.1: NRSC LDS network as on January 2020
9
P i x e l 2 P e o p l e
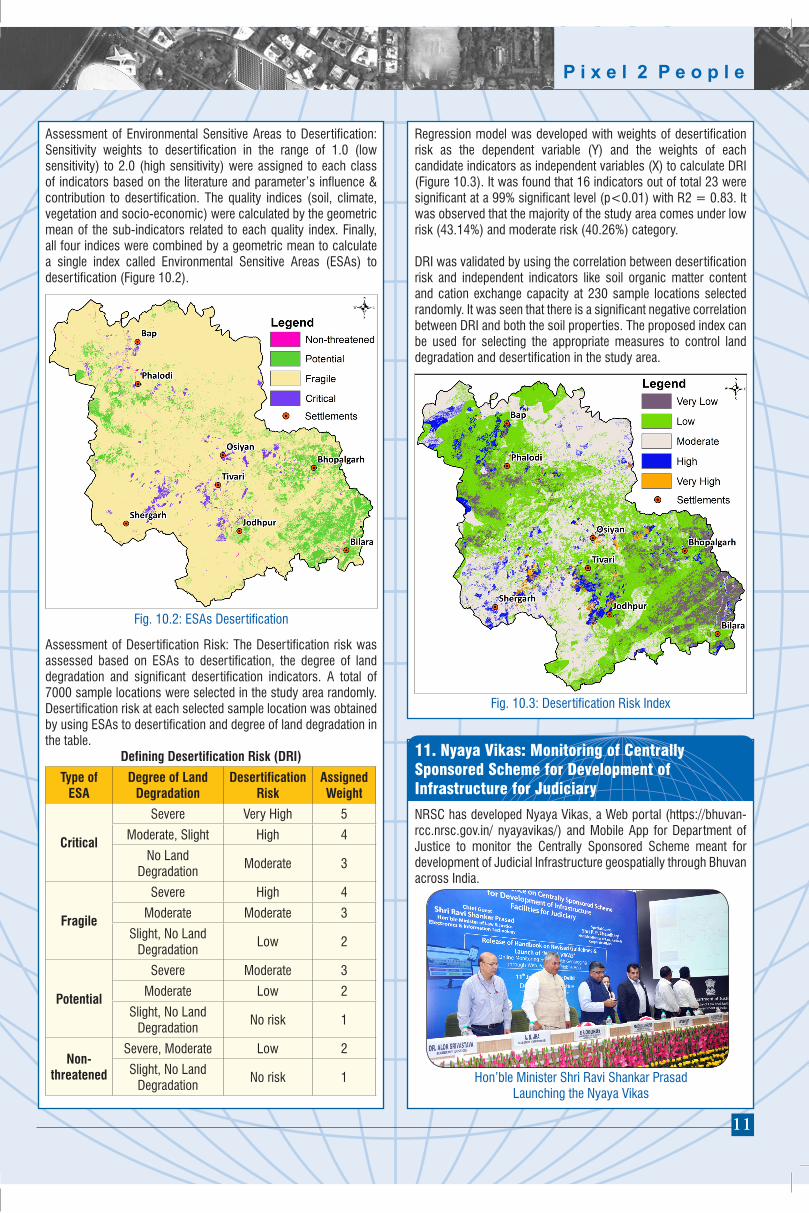
Fig. 9.2: Comparison of Cloud to Ground lightning flashes recorded by NRSC- LDS network and IITM/IMD lighting
detection network
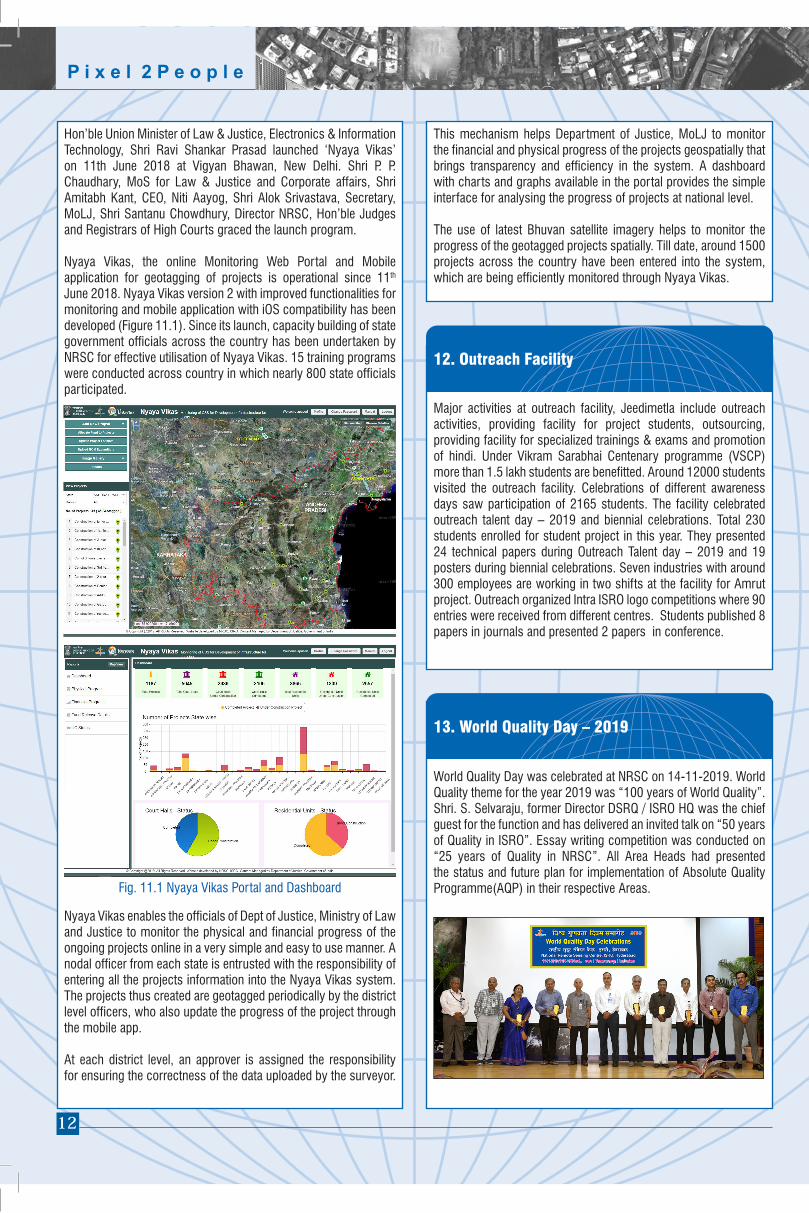
Fig. 10.1: Methodology Flow chart
NRSC- LDS (Left) Vs IITM LLN (Right): 03 July 2019
10. Desertification Risk Assessment in Jodhpur District of Rajasthan Using
Geospatial Techniques
Desertification has emerged as a major economic, social and environmental problem in the western part of India. Many initiatives in desertification mapping and monitoring using remote sensing techniques at various scales have taken place in the recent past. Apart from these efforts, the need of the hour is the development of early warning system of desertification based on scientific
and lightning occurrences; and 3) to see if a reliable lead time can the achieved before the occurrence of cloud-to-ground lightning phenomena by integrating the obtained data with weather models.After the completion of first year, our network of 6 sensors detected the cloud-to-ground as well as cloud-to-cloud lightning flashes and identified the vulnerable zones of the lightning activity. The collected LDS data show good agreement with field data. The errors in positioning have been eliminated by using the recent time of arrival method implementation on the new sensors and network. Figure 9.2 shows Comparison of Cloud to Ground lightning flashes recorded by NRSC- LDS network and IITM/IMD lighting detection network
NRSC is expanding the network to cover full Indian sector with desired accuracy as per the criteria defined by World Meterological Organization. We expect to provide ECVs and other related data for the societal benefits as soon as the consistency checks and sufficient ground truth validation is completed. In terms of remote sensing capability, the proposed network will provide ground truth
lightning flash data for any future satellite missions covering Indian sector.
inputs. In the present study, an attempt has been made to develop a comprehensive model for the assessment of desertification risk in the Jodhpur district of Rajasthan, India, using 23 desertification indicators.
A total of 23 indicators were evaluated, which includes soil (8 no.), climate (9 no.), vegetation (2 no.) and socio-economic (4 no.) indicators. The indicators database for the study area was prepared by analysis of satellite data, DEM and other ancillary data (Soil, Land use land cover, Climate and Socio-economic data). The methodology flow chart of the study is shown in Figure 10.1.
10
Assessment of Environmental Sensitive Areas to Desertification: Sensitivity weights to desertification in the range of 1.0 (low sensitivity) to 2.0 (high sensitivity) were assigned to each class of indicators based on the literature and parameter’s influence & contribution to desertification. The quality indices (soil, climate, vegetation and socio-economic) were calculated by the geometric mean of the sub-indicators related to each quality index. Finally, all four indices were combined by a geometric mean to calculate a single index called Environmental Sensitive Areas (ESAs) to desertification (Figure 10.2).
Assessment of Desertification Risk: The Desertification risk was assessed based on ESAs to desertification, the degree of land degradation and significant desertification indicators. A total of 7000 sample locations were selected in the study area randomly. Desertification risk at each selected sample location was obtained by using ESAs to desertification and degree of land degradation in the table.
Defining Desertification Risk (DRI)
Type of ESA
Degree of Land Degradation
Desertification Risk
Assigned Weight
Critical
Severe Very High 5
Moderate, Slight High 4
No Land Degradation
Moderate 3
Fragile
Severe High 4
Moderate Moderate 3
Slight, No Land Degradation
Low 2
Potential
Severe Moderate 3
Moderate Low 2
Slight, No Land Degradation
No risk 1
Non-threatened
Severe, Moderate Low 2
Slight, No Land Degradation
No risk 1
P i x e l 2 P e o p l e
Regression model was developed with weights of desertification risk as the dependent variable (Y) and the weights of each candidate indicators as independent variables (X) to calculate DRI (Figure 10.3). It was found that 16 indicators out of total 23 were significant at a 99% significant level (p<0.01) with R2 = 0.83. It was observed that the majority of the study area comes under low risk (43.14%) and moderate risk (40.26%) category.
DRI was validated by using the correlation between desertification risk and independent indicators like soil organic matter content and cation exchange capacity at 230 sample locations selected randomly. It was seen that there is a significant negative correlation between DRI and both the soil properties. The proposed index can be used for selecting the appropriate measures to control land degradation and desertification in the study area.
NRSC has developed Nyaya Vikas, a Web portal (https://bhuvan-rcc.nrsc.gov.in/ nyayavikas/) and Mobile App for Department of Justice to monitor the Centrally Sponsored Scheme meant for development of Judicial Infrastructure geospatially through Bhuvan across India.
Fig. 10.2: ESAs Desertification
Fig. 10.3: Desertification Risk Index
11. Nyaya Vikas: Monitoring of Centrally Sponsored Scheme for Development of Infrastructure for Judiciary
Hon’ble Minister Shri Ravi Shankar PrasadLaunching the Nyaya Vikas
11
P i x e l 2 P e o p l e
Hon’ble Union Minister of Law & Justice, Electronics & Information Technology, Shri Ravi Shankar Prasad launched ‘Nyaya Vikas’ on 11th June 2018 at Vigyan Bhawan, New Delhi. Shri P. P. Chaudhary, MoS for Law & Justice and Corporate affairs, Shri Amitabh Kant, CEO, Niti Aayog, Shri Alok Srivastava, Secretary, MoLJ, Shri Santanu Chowdhury, Director NRSC, Hon’ble Judges and Registrars of High Courts graced the launch program.
Nyaya Vikas, the online Monitoring Web Portal and Mobile application for geotagging of projects is operational since 11th
June 2018. Nyaya Vikas version 2 with improved functionalities for monitoring and mobile application with iOS compatibility has been developed (Figure 11.1). Since its launch, capacity building of state government officials across the country has been undertaken by NRSC for effective utilisation of Nyaya Vikas. 15 training programs were conducted across country in which nearly 800 state officials participated.
Nyaya Vikas enables the officials of Dept of Justice, Ministry of Law and Justice to monitor the physical and financial progress of the ongoing projects online in a very simple and easy to use manner. A nodal officer from each state is entrusted with the responsibility of entering all the projects information into the Nyaya Vikas system. The projects thus created are geotagged periodically by the district level officers, who also update the progress of the project through the mobile app.
At each district level, an approver is assigned the responsibility for ensuring the correctness of the data uploaded by the surveyor.
Fig. 11.1 Nyaya Vikas Portal and Dashboard
This mechanism helps Department of Justice, MoLJ to monitor the financial and physical progress of the projects geospatially that brings transparency and efficiency in the system. A dashboard with charts and graphs available in the portal provides the simple interface for analysing the progress of projects at national level.
The use of latest Bhuvan satellite imagery helps to monitor the progress of the geotagged projects spatially. Till date, around 1500 projects across the country have been entered into the system, which are being efficiently monitored through Nyaya Vikas.
Major activities at outreach facility, Jeedimetla include outreach activities, providing facility for project students, outsourcing, providing facility for specialized trainings & exams and promotion of hindi. Under Vikram Sarabhai Centenary programme (VSCP) more than 1.5 lakh students are benefitted. Around 12000 students visited the outreach facility. Celebrations of different awareness days saw participation of 2165 students. The facility celebrated outreach talent day – 2019 and biennial celebrations. Total 230 students enrolled for student project in this year. They presented 24 technical papers during Outreach Talent day – 2019 and 19 posters during biennial celebrations. Seven industries with around 300 employees are working in two shifts at the facility for Amrut project. Outreach organized Intra ISRO logo competitions where 90 entries were received from different centres. Students published 8 papers in journals and presented 2 papers in conference.
12. Outreach Facility
13. World Quality Day – 2019
World Quality Day was celebrated at NRSC on 14-11-2019. World Quality theme for the year 2019 was “100 years of World Quality”. Shri. S. Selvaraju, former Director DSRQ / ISRO HQ was the chief guest for the function and has delivered an invited talk on “50 years of Quality in ISRO”. Essay writing competition was conducted on “25 years of Quality in NRSC”. All Area Heads had presented the status and future plan for implementation of Absolute Quality Programme(AQP) in their respective Areas.
12
P i x e l 2 P e o p l e
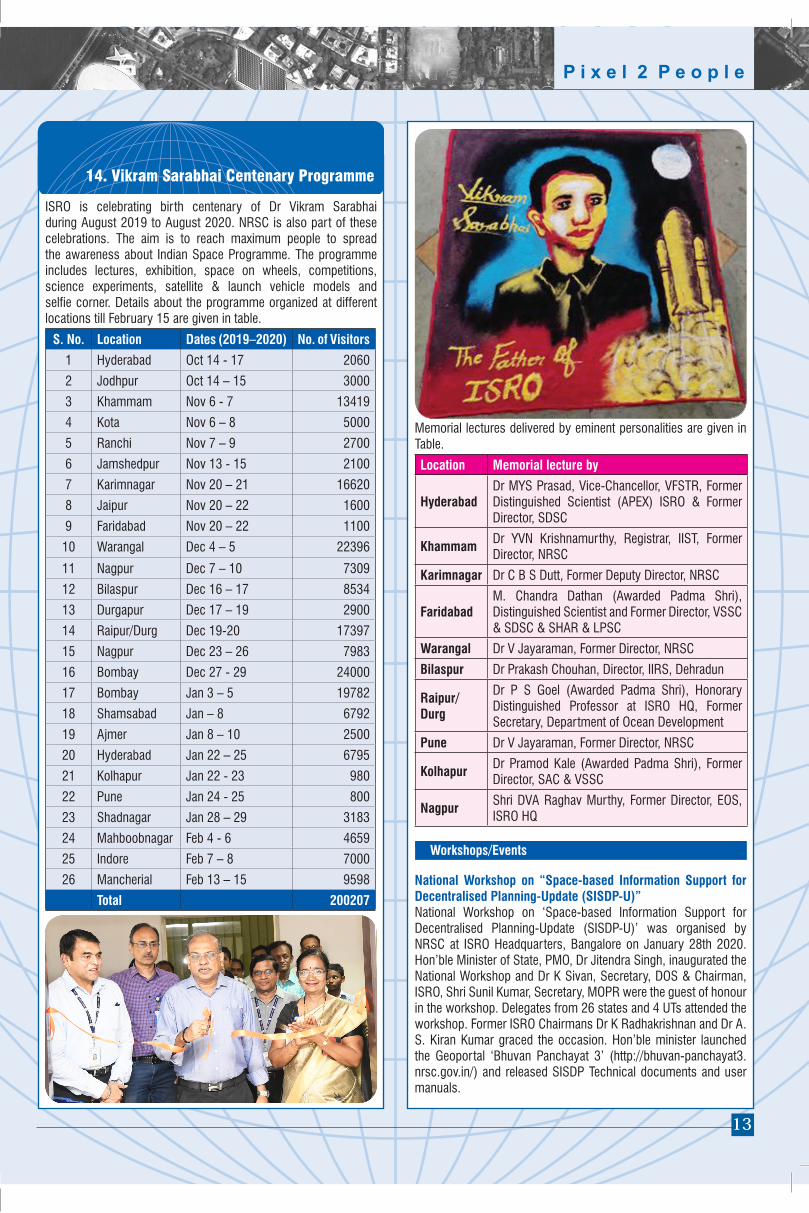
14. Vikram Sarabhai Centenary Programme
ISRO is celebrating birth centenary of Dr Vikram Sarabhai during August 2019 to August 2020. NRSC is also part of these celebrations. The aim is to reach maximum people to spread the awareness about Indian Space Programme. The programme includes lectures, exhibition, space on wheels, competitions, science experiments, satellite & launch vehicle models and selfie corner. Details about the programme organized at different locations till February 15 are given in table.
S. No. Location Dates (2019–2020) No. of Visitors
1 Hyderabad Oct 14 - 17 2060
2 Jodhpur Oct 14 – 15 3000
3 Khammam Nov 6 - 7 13419
4 Kota Nov 6 – 8 5000
5 Ranchi Nov 7 – 9 2700
6 Jamshedpur Nov 13 - 15 2100
7 Karimnagar Nov 20 – 21 16620
8 Jaipur Nov 20 – 22 1600
9 Faridabad Nov 20 – 22 1100
10 Warangal Dec 4 – 5 22396
11 Nagpur Dec 7 – 10 7309
12 Bilaspur Dec 16 – 17 8534
13 Durgapur Dec 17 – 19 2900
14 Raipur/Durg Dec 19-20 17397
15 Nagpur Dec 23 – 26 7983
16 Bombay Dec 27 - 29 24000
17 Bombay Jan 3 – 5 19782
18 Shamsabad Jan – 8 6792
19 Ajmer Jan 8 – 10 2500
20 Hyderabad Jan 22 – 25 6795
21 Kolhapur Jan 22 - 23 980
22 Pune Jan 24 - 25 800
23 Shadnagar Jan 28 – 29 3183
24 Mahboobnagar Feb 4 - 6 4659
25 Indore Feb 7 – 8 7000
26 Mancherial Feb 13 – 15 9598
Total 200207
Memorial lectures delivered by eminent personalities are given in Table.
Location Memorial lecture by
HyderabadDr MYS Prasad, Vice-Chancellor, VFSTR, Former Distinguished Scientist (APEX) ISRO & Former Director, SDSC
Khammam Dr YVN Krishnamurthy, Registrar, IIST, Former Director, NRSC
Karimnagar Dr C B S Dutt, Former Deputy Director, NRSC
FaridabadM. Chandra Dathan (Awarded Padma Shri), Distinguished Scientist and Former Director, VSSC & SDSC & SHAR & LPSC
Warangal Dr V Jayaraman, Former Director, NRSC
Bilaspur Dr Prakash Chouhan, Director, IIRS, Dehradun
Raipur/Durg
Dr P S Goel (Awarded Padma Shri), Honorary Distinguished Professor at ISRO HQ, Former Secretary, Department of Ocean Development
Pune Dr V Jayaraman, Former Director, NRSC
Kolhapur Dr Pramod Kale (Awarded Padma Shri), Former Director, SAC & VSSC
Nagpur Shri DVA Raghav Murthy, Former Director, EOS, ISRO HQ
Workshops/Events
National Workshop on “Space-based Information Support for Decentralised Planning-Update (SISDP-U)” National Workshop on ‘Space-based Information Support for Decentralised Planning-Update (SISDP-U)’ was organised by NRSC at ISRO Headquarters, Bangalore on January 28th 2020. Hon’ble Minister of State, PMO, Dr Jitendra Singh, inaugurated the National Workshop and Dr K Sivan, Secretary, DOS & Chairman, ISRO, Shri Sunil Kumar, Secretary, MOPR were the guest of honour in the workshop. Delegates from 26 states and 4 UTs attended the workshop. Former ISRO Chairmans Dr K Radhakrishnan and Dr A. S. Kiran Kumar graced the occasion. Hon’ble minister launched the Geoportal ‘Bhuvan Panchayat 3’ (http://bhuvan-panchayat3.nrsc.gov.in/) and released SISDP Technical documents and user manuals.
Workshops/Events
13
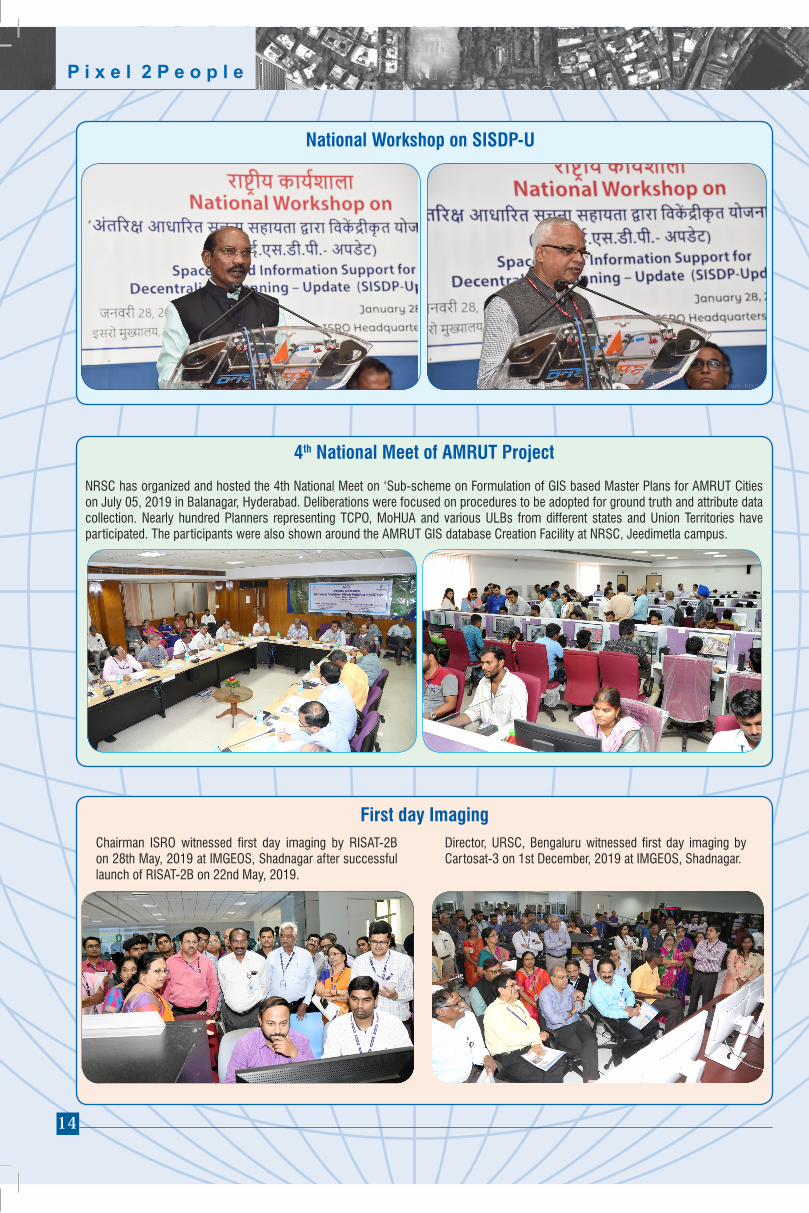
National Workshop on SISDP-U
P i x e l 2 P e o p l e
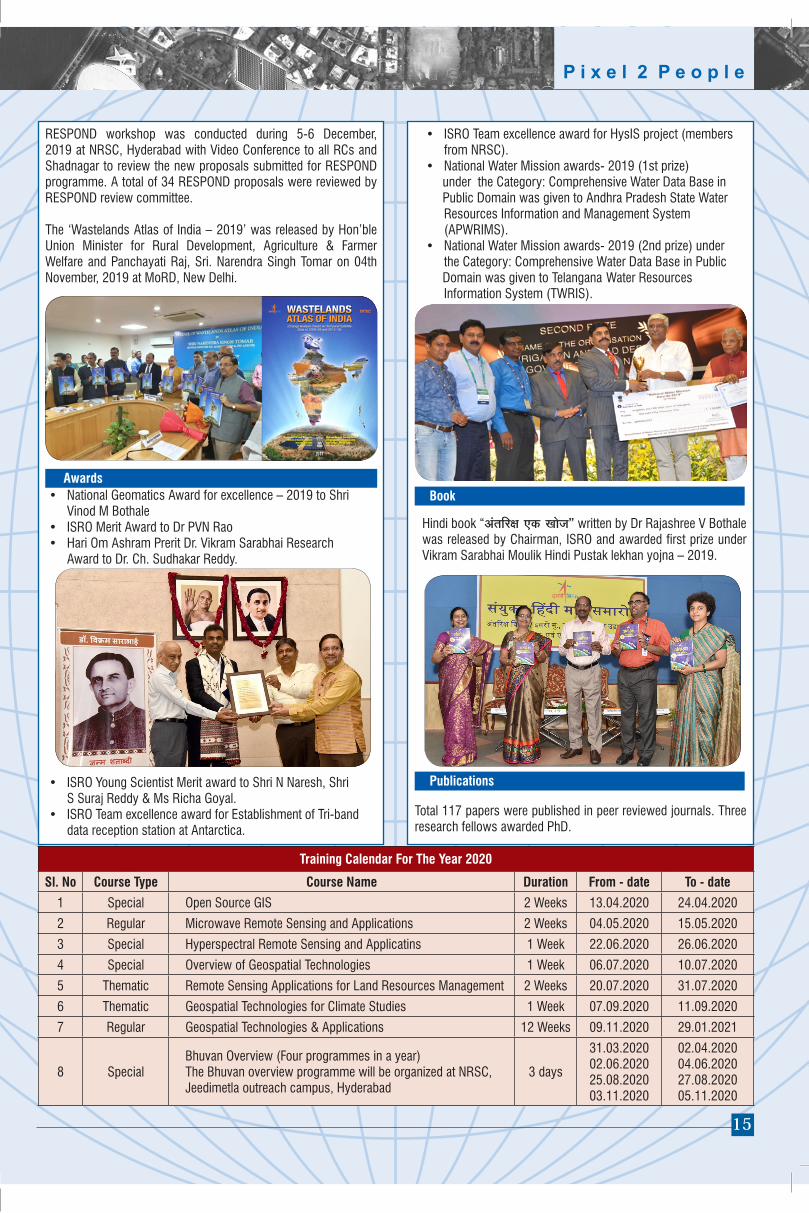
4th National Meet of AMRUT Project
NRSC has organized and hosted the 4th National Meet on ‘Sub-scheme on Formulation of GIS based Master Plans for AMRUT Cities on July 05, 2019 in Balanagar, Hyderabad. Deliberations were focused on procedures to be adopted for ground truth and attribute data collection. Nearly hundred Planners representing TCPO, MoHUA and various ULBs from different states and Union Territories have participated. The participants were also shown around the AMRUT GIS database Creation Facility at NRSC, Jeedimetla campus.
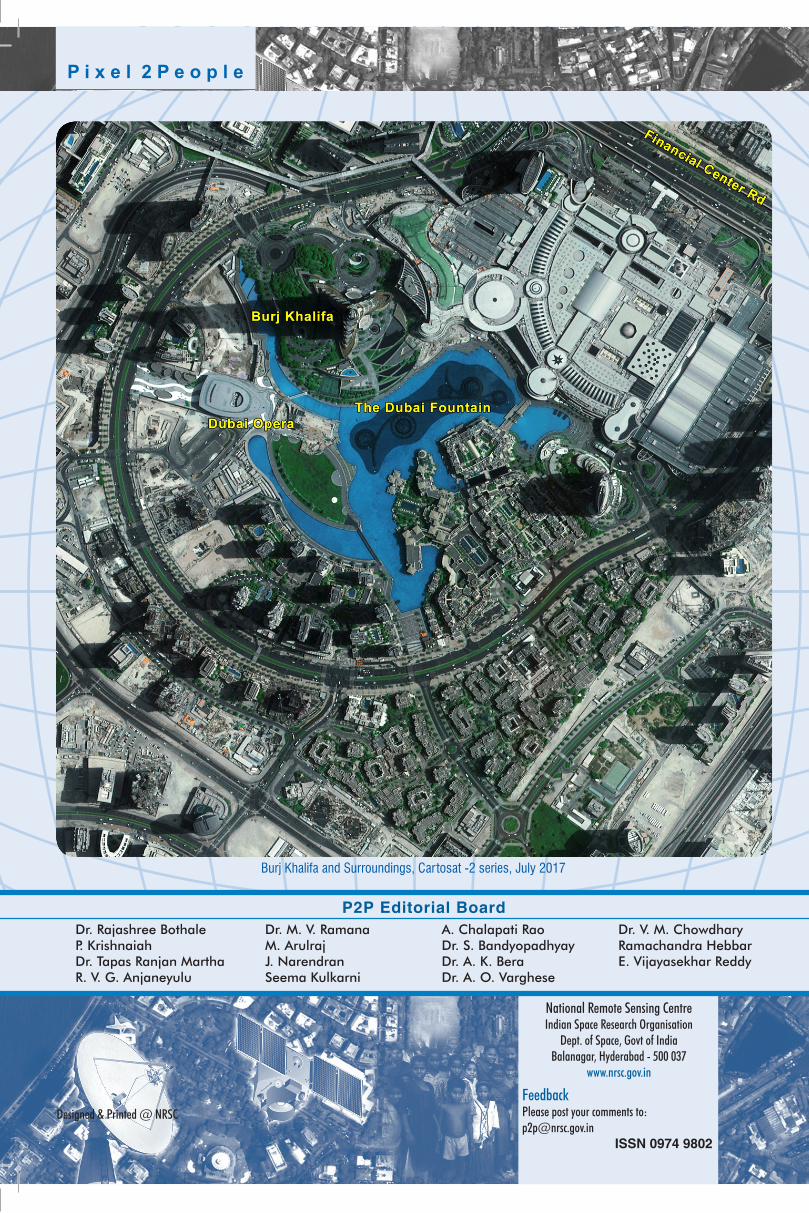
Chairman ISRO witnessed first day imaging by RISAT-2B on 28th May, 2019 at IMGEOS, Shadnagar after successful launch of RISAT-2B on 22nd May, 2019.
Director, URSC, Bengaluru witnessed first day imaging by Cartosat-3 on 1st December, 2019 at IMGEOS, Shadnagar.
First day Imaging
14
• ISROTeamexcellenceawardforHysISproject(members from NRSC).• NationalWaterMissionawards-2019(1stprize) under the Category: Comprehensive Water Data Base in Public Domain was given to Andhra Pradesh State Water Resources Information and Management System (APWRIMS).• NationalWaterMissionawards-2019(2ndprize)under the Category: Comprehensive Water Data Base in Public Domain was given to Telangana Water Resources Information System (TWRIS).
Hindi book “+ÆiÉÊ®IÉ BEò JÉÉäVÉ” written by Dr Rajashree V Bothale was released by Chairman, ISRO and awarded first prize under Vikram Sarabhai Moulik Hindi Pustak lekhan yojna – 2019.
Total 117 papers were published in peer reviewed journals. Three research fellows awarded PhD.
P i x e l 2 P e o p l e
RESPOND workshop was conducted during 5-6 December, 2019 at NRSC, Hyderabad with Video Conference to all RCs and Shadnagar to review the new proposals submitted for RESPOND programme. A total of 34 RESPOND proposals were reviewed by RESPOND review committee.
The ‘Wastelands Atlas of India – 2019’ was released by Hon’ble Union Minister for Rural Development, Agriculture & Farmer Welfare and Panchayati Raj, Sri. Narendra Singh Tomar on 04th November, 2019 at MoRD, New Delhi.
Awards
Training Calendar For The Year 2020
Sl. No Course Type Course Name Duration From - date To - date
1 Special Open Source GIS 2 Weeks 13.04.2020 24.04.2020
2 Regular Microwave Remote Sensing and Applications 2 Weeks 04.05.2020 15.05.2020
3 Special Hyperspectral Remote Sensing and Applicatins 1 Week 22.06.2020 26.06.2020
4 Special Overview of Geospatial Technologies 1 Week 06.07.2020 10.07.2020
5 Thematic Remote Sensing Applications for Land Resources Management 2 Weeks 20.07.2020 31.07.2020
6 Thematic Geospatial Technologies for Climate Studies 1 Week 07.09.2020 11.09.2020
7 Regular Geospatial Technologies & Applications 12 Weeks 09.11.2020 29.01.2021
8 SpecialBhuvan Overview (Four programmes in a year)The Bhuvan overview programme will be organized at NRSC, Jeedimetla outreach campus, Hyderabad
3 days
31.03.2020 02.06.202025.08.202003.11.2020
02.04.2020 04.06.202027.08.202005.11.2020
• NationalGeomaticsAwardforexcellence–2019toShri Vinod M Bothale• ISROMeritAwardtoDrPVNRao• HariOmAshramPreritDr.VikramSarabhaiResearch Award to Dr. Ch. Sudhakar Reddy.
• ISROYoungScientistMeritawardtoShriNNaresh,Shri S Suraj Reddy & Ms Richa Goyal.• ISROTeamexcellenceawardforEstablishmentofTri-band data reception station at Antarctica.
Publications
Book
15
FeedbackPlease post your comments to: [email protected]
ISSN 0974 9802
Dr. Rajashree Bothale P. KrishnaiahDr. Tapas Ranjan Martha R. V. G. Anjaneyulu
Dr. M. V. RamanaM. ArulrajJ. NarendranSeema Kulkarni
National Remote Sensing CentreIndian Space Research Organisation
Dept. of Space, Govt of IndiaBalanagar, Hyderabad - 500 037
www.nrsc.gov.in
A. Chalapati RaoDr. S. BandyopadhyayDr. A. K. BeraDr. A. O. Varghese
Dr. V. M. ChowdharyRamachandra HebbarE. Vijayasekhar Reddy
P2P Editorial Board
Burj Khalifa and Surroundings, Cartosat -2 series, July 2017
P i x e l 2 P e o p l e
Designed & Printed @ NRSC