Embed Size (px)
Citation preview

RESEARCH REPORT
U.S. Department of the Interior, U.S. Geological Survey
INFORMAL TRAIL MONITORING PROTOCOLS:
DENALI NATIONAL PARK AND PRESERVE
Final Report, October 2011
Distributed by:
Virginia Tech, College of Natural Resources & Environment Department of Forest Resources & Environmental Conservation

INFORMAL TRAIL MONITORING PROTOCOLS:
DENALI NATIONAL PARK AND PRESERVE
October 2011
Jeffrey L. Marion Unit Leader/Adjunct Professor
Virginia Tech Field Unit USGS Patuxent Wildlife Research Center
Virginia Tech/FREC (0324) Blacksburg, VA 24061
Jeremy Wimpey Postdoctoral Research Associate
Virginia Tech/Department of Forest Resources & Environmental Conservation
Virginia Tech/FREC (0324) Blacksburg, VA 24061
Final Report for the National Park Service, U.S. Department of the Interior
Denali National Park P.O. Box 9
Denali Park, AK 99755
U.S. Geological Survey, Virginia Tech Field Unit
College of Natural Resources & Environment
Department of Forest Resources & Environmental Conservation
& Environmental Conservation Management

Page i
TABLE OF CONTENTS
TABLE OF CONTENTS ............................................................................................................................................ I
FIGURES .................................................................................................................................................................. III
TABLES .................................................................................................................................................................... III
ACKNOWLEDGEMENTS ..................................................................................................................................... IV
INTRODUCTION ....................................................................................................................................................... 5
JUSTIFICATION FOR MONITORING .................................................................................................................. 7
LEGISLATIVE MANDATES .......................................................................................................................................... 7 Agency Organic Act ............................................................................................................................................. 7 Management Policies and Guidelines .................................................................................................................. 8
CARRYING CAPACITY DECISION-MAKING ............................................................................................................... 11 VISITOR PERCEPTIONS OF RESOURCE CONDITIONS ................................................................................................. 12 MONITORING PROGRAM CAPABILITIES ................................................................................................................... 13
LITERATURE REVIEW ......................................................................................................................................... 14
VISITATION-RELATED RESOURCE IMPACTS: TRAILS ............................................................................................... 14 Informal Trail Impacts ....................................................................................................................................... 16 Trail Management .............................................................................................................................................. 17
INDICATORS AND SELECTION CRITERIA................................................................................................................... 18 Preferred Indicators ........................................................................................................................................... 19
TRAIL IMPACT ASSESSMENT SURVEYS .................................................................................................................... 21 Assessing Informal Trail Networks .................................................................................................................... 22
STUDY AREA ........................................................................................................................................................... 24
METHODS ................................................................................................................................................................. 25
RESULTS ................................................................................................................................................................... 27
MONITORING OBJECTIVES ....................................................................................................................................... 27 PREVIOUS VISITOR IMPACT MONITORING INVESTIGATIONS .................................................................................... 28 DEVELOPMENT OF MONITORING PROTOCOLS .......................................................................................................... 29 DESCRIPTION OF MONITORING PROTOCOLS ............................................................................................................ 42
Access Survey ..................................................................................................................................................... 43 Line Transect Survey .......................................................................................................................................... 44 Census Mapping Survey ..................................................................................................................................... 46 Point Sampling Survey ....................................................................................................................................... 47
ESTABLISHING MONITORING ZONES ............................................................................................................ 50 Levels of Monitoring Effort ................................................................................................................................ 51 Monitoring Zones ............................................................................................................................................... 51
CONDUCTING MONITORING ............................................................................................................................. 53
DISCUSSION ............................................................................................................................................................. 54
RESEARCH CHALLENGES AND SOLUTIONS .............................................................................................................. 54 MONITORING PROTOCOLS ....................................................................................................................................... 56 INFORMAL TRAIL MANAGEMENT STRATEGIES ........................................................................................................ 56 VISITOR MANAGEMENT OPTIONS ............................................................................................................................ 58 SITE MANAGEMENT OPTIONS .................................................................................................................................. 61
LITERATURE CITED ............................................................................................................................................. 64

Page ii
APPENDIX 1: MONITORING PROTOCOLS FOR ASSESSING FORMAL AND INFORMAL TRAILS .. 72
ESTABLISHING MONITORING ZONES ............................................................................................................ 72
LEVELS OF MONITORING EFFORT ............................................................................................................................ 72 Monitoring Zones ............................................................................................................................................... 73 Zone Establishment with a Roundtable Process ................................................................................................ 73
ACCESS SURVEY .................................................................................................................................................... 76
OBJECTIVES ........................................................................................................................................................... 76 GUIDANCE .............................................................................................................................................................. 76 METHODS ............................................................................................................................................................... 76
LINE TRANSECT SURVEY ................................................................................................................................... 82
OBJECTIVES ........................................................................................................................................................... 82 GUIDANCE .............................................................................................................................................................. 82 METHODS ............................................................................................................................................................... 82
CENSUS MAPPING SURVEY ................................................................................................................................ 85
OBJECTIVES ........................................................................................................................................................... 85 GUIDANCE .............................................................................................................................................................. 85 METHODS ............................................................................................................................................................... 85
POINT SAMPLING SURVEY ................................................................................................................................. 88
OBJECTIVES ........................................................................................................................................................... 88 GUIDANCE .............................................................................................................................................................. 88 METHODS ............................................................................................................................................................... 88
ROUTE FINDING EXPERIENCE SURVEY ........................................................................................................ 90
OBJECTIVES ........................................................................................................................................................... 90 GUIDANCE .............................................................................................................................................................. 90 METHODS ............................................................................................................................................................... 90
APPENDIX 2: TRAIL MONITORING WORK FLOW ...................................................................................... 91
DATA DICTIONARIES ............................................................................................................................................... 91 PRE-FIELDWORK SETUP TASKS ................................................................................................................................ 91 FIELD TASKS ........................................................................................................................................................... 91 DATA POST-PROCESSING TASKS ............................................................................................................................. 91
Suggested Protocols ........................................................................................................................................... 92 MONITORING TASKS ................................................................................................................................................ 92 ROUTE FINDING EXPERIENCE (RFE) TASKS ............................................................................................................ 92

Page iii
FIGURES FIGURE 1. THE NPS VISITOR EXPERIENCE AND RESOURCE PROTECTION FRAMEWORK USED TO ADDRESS CARRYING
CAPACITY DECISION MAKING. ............................................................................................................................. 11 FIGURE 2. CAPABILITIES OF VISITOR IMPACT MONITORING PROGRAMS. ....................................................................... 13 FIGURE 3. A ―SPAGHETTI‖ MAP SHOWING THE COMPLEX NETWORK OF INFORMAL TRAILS BRANCHING OFF THE
POTOMAC GORGE’S BILLY GOAT TRAIL, C&O CANAL NATIONAL HISTORICAL PARK. ..................................... 22 FIGURE 4. COMPARISON OF DATA FOR TWO EXPERIENCED STAFF WITH A 4-CLASS CC SYSTEM. NOTE LACK OF
AGREEMENT IN CC CLASSES AND SEGMENTING. ................................................................................................. 37 FIGURE 5. VARIATION AMONG SEVEN FIELD STAFF IN TOTAL LENGTHS OF IT’S BY CONDITION CLASS IN THE SAVAGE
BOX STUDY AREA; DATA FOR EACH FIELD STAFF ARE INDICATED BY DIFFERENT COLORED BARS. ...................... 38 FIGURE 6. COMPARISON OF DATA FOR TWO EXPERIENCED STAFF WITH A 2-CLASS TRAIL DEPTH ESTIMATION. NOTE
LACK OF AGREEMENT IN DEPTH CLASSES AND SEGMENTING. .............................................................................. 39 FIGURE 7. COMPARISON OF DATA FROM GPS TRAIL MAPPING AND FOUR IDENTICAL LINE TRANSECTS PLACED
PERPENDICULAR TO THE PREVAILING DIRECTION OF VISITOR TRAFFIC FOR THE SAVAGE BOX AREA.. ................ 40 FIGURE 8. ACCESS SURVEY DATA FROM APPLICATION ALONG THE DENALI ROAD, SHOWING AN OVERVIEW FOR A ROAD
SEGMENT WITH AN ENLARGED INSET VIEW FOR ONE TRAILHEAD LOCATION. ...................................................... 44 FIGURE 9. LINE TRANSECTS APPLIED TO THE IGLOO CANYON LAKES TRAVEL CORRIDOR WITH CENSUS MAPPING OF
IT’S ALSO SHOWN TO ILLUSTRATE THE FULL DISTRIBUTION OF TRAILS. NOTE PRESENCE OF A WELL-USED
FORMAL TRAIL AND NUMEROUS DISCONTINUOUS ―TRACE‖ TRAILS OF HUMAN USE OR WILDLIFE ORIGIN. .......... 45 FIGURE 10. CENSUS MAPPING OF THE PREDOMINANTLY DISCONTINUOUS IT’S PARALLELING THE TATTLER CREEK
DRAINAGE WITH THE OPTIONAL 50-METER GRID SUPERIMPOSED FOR POINT SAMPLING DATA COLLECTION. THESE
TRAILS ARE RECEIVING GREATER USE SINCE THE DISCOVERY OF DINOSAUR FOSSILS. ......................................... 47 FIGURE 11. AN INFORMAL TRAIL WITH A MOSTLY CONTINUOUS TREAD HAS FORMED IN THE PRIMROSE RIDGE AREA.
THE ACCESS, LINE TRANSECT, CENSUS MAPPING, AND POINT SAMPLING SURVEYS WERE APPLIED. ................. 48 FIGURE 12. ROUTE FINDING EXPERIENCE SURVEY APPLIED TO A BACKCOUNTRY HIKE FROM SAVAGE BOX TO MOUNT
MARGARET AND BACK TO THE DENALI ROAD AT PRIMROSE RIDGE. .................................................................. 50 FIGURE 13. SUGGESTED INFORMAL TRAIL MONITORING DECISION TREE. INITIAL MONITORING STRATEGIES ARE TO BE
SELECTED BY ROUNDTABLE DISCUSSION AND ZONING OF THE PARK BY MANAGERS AND STAFF. ........................ 52 FIGURE 14. A SUGGESTED ―FIRST DRAFT‖ OF REVISED LEAVE NO TRACE PRACTICES FOR AVOIDING THE CREATION OF
ITS BASED ON A DISPERSAL STRATEGY. .............................................................................................................. 60 FIGURE 15. EXAMPLE OF A RECOMMENDED 3X4 INCH PROMPTER SIGN TO DETER IT USE, AND ILLUSTRATION OF
EFFECTIVE BRUSHING WORK FROM LITTLE MOOSE ISLAND, ACADIA NP. .......................................................... 63
TABLES TABLE 1. DIRECT AND INDIRECT EFFECTS OF RECREATIONAL TRAMPLING ON SOILS AND VEGETATION. ...................... 16 TABLE 2. CRITERIA FOR SELECTING INDICATORS OF RESOURCE CONDITION. ................................................................ 19 TABLE 3. POTENTIAL INDICATORS OF TRAIL CONDITIONS AND MEASUREMENT UNITS. ................................................. 20 TABLE 4. MEASUREMENT SCALES RELEVANT TO THE SELECTION OF INDICATOR ASSESSMENT PROTOCOLS. ................ 25 TABLE 5. EVOLUTION IN THE DEVELOPMENT OF TRAIL CONDITION CLASSES, FROM THE 1ST VERSION, THIS PAGE, TO
ITS EVENTUAL REPLACEMENT WITH SEPARATE QUANTITATIVE INDICATORS FOR VEGETATION AND EXPOSED SOIL
COVER. ................................................................................................................................................................ 31 TABLE 6. SUMMARY TABLE COMPARING CC DATA FROM TWO EXPERIENCED STAFF, INCLUDING SEGMENT COUNTS AND
AGGREGATE LENGTH BY CC CLASS. .................................................................................................................... 37 TABLE 7. SUMMARY DATA FOR CC ASSESSMENTS OF IT SEGMENTS IN THE SAVAGE BOX STUDY AREA (PRESENTED IN
FIGURE 5) INDEPENDENTLY MADE BY SEVEN FIELD STAFF. MEAN VALUES ARE IN LINEAL FEET, WITH STANDARD
DEVIATION AND MIN/MAX VALUES TO ILLUSTRATE DIFFERENCES AMONG FIELD STAFF. ................................... 38 TABLE 8. SUMMARY TABLE COMPARING TRAIL DEPTH FROM TWO EXPERIENCED STAFF, INCLUDING SEGMENT COUNTS
AND AGGREGATE LENGTH BY TRAIL DEPTH CLASS. ............................................................................................. 39 TABLE 9. SUMMARY TABLE COMPARING MEAN VALUES FROM INDEPENDENT ASSESSMENTS BY FOUR FIELD STAFF OF
CONDITION CLASS, TRAIL DEPTH, AND TRAIL VEGETATION COVER AT THE SAME 35 MARKED TRANSECTS ALONG
AN INFORMAL TRAIL IN SAVAGE BOX. ................................................................................................................ 40 TABLE 10. SUMMARY OF CENSUS MAPPING DATA FROM TATTLER CREEK. .................................................................. 46 TABLE 11. POINT SAMPLING SURVEY DATA PROVIDE DESCRIPTIVE QUANTITATIVE DATA FOR A NUMBER OF TRAIL
CONDITION INDICATORS.1 ................................................................................................................................... 49

Page iv
TABLE 12. IMPACT MANAGEMENT STRATEGY BY USE LEVEL AND ZONE, WITH CHARACTERIZATIONS OF THE
ACCEPTABILITY TO MANAGEMENT OF DIFFERENT INFORMAL TRAIL (IT) TYPES. ................................................. 57 TABLE 13. ACCESS MANAGEMENT TOOLS INCLUDED IN THE 2006 DENA BMP........................................................... 62
ACKNOWLEDGEMENTS
We wish to thank and acknowledge the National Park Service for sponsoring this study and the
staff at Denali National Park and Preserve and Arctic National Wildlife Refuge for their
assistance. We also thank the following individuals for their contributions to field work and
protocol development: Logan Park, Chris Carr, Chris Monz, Dusty Vaughn, and Jennifer Reed.

Page 5
INTRODUCTION
The National Park Service (NPS) accommodates nearly 300 million visitors per year, visitation
that presents managers with substantial challenges at some 394 park units across some 83.6
million acres of protected lands. An increasing number of visitors inevitably contribute negative
effects to fragile natural and cultural resources. Such visitation-related resource impacts can
degrade natural conditions and processes and the quality of recreation experiences. According to
the NPS Management Policies: ―The fundamental purpose of the national park system,
established by the Organic Act and reaffirmed by the General Authorities Act, as amended,
begins with a mandate to conserve park resources and values…The fundamental purpose of all
parks also includes providing for the enjoyment of park resources and values by the people of the
United States.‖ (NPS 2006b, Section 1.4.3). However, what might appear to be dual mandates,
visitation and resource protection, are clarified to reveal the primacy of resource protection. The
Management Policies acknowledge that some resource degradation is an inevitable consequence
of visitation, but directs managers to ―ensure that any adverse impacts are the minimum
necessary, unavoidable, cannot be further mitigated, and do not constitute impairment or
derogation of park resources and values‖ (NPS 2006b).
Managers of protected natural areas must achieve a careful balance between accommodating
sustainable types and amounts of visitation and the protection of natural and cultural resources
that may be harmed by visitor use. In high use areas, managers commonly apply a containment
or concentration strategy to accommodate visitation by providing roads and developments such
as parking areas, restroom facilities, and developed vista sites. These facilities focus visitor
traffic on durable surfaces to contain trampling impacts and protect surrounding areas. Similarly,
formal trail systems are generally regarded as an essential facility to provide access within
moderate to high use portions of protected areas, accommodating recreational opportunities and
protecting resources by concentrating visitor traffic on resistant tread surfaces (Marion & Leung
2001). Unfortunately, many older formal trails were not properly located, constructed, or
maintained to sustain their intended uses. Preventing their degradation from recreational uses and
natural processes such as rainfall and water runoff is often a substantial management challenge.
Furthermore, it is generally recognized that formal trails cannot possibly access all locations
within protected areas that visitors seek to visit.
In low use areas, managers commonly promote a dispersal strategy to accommodate visitation
without formal site developments, facilities, or trails. A common objective is to preserve the
area’s pristine natural conditions and processes, uninfluenced by human use and impact. The
limited occurrence of visitor-created trails and recreation sites may be tolerated in transitional
areas or near popular attraction features but more commonly these features are actively
discouraged. This is generally accomplished by asking visitors to disperse their activities and
restrict traffic to the most durable natural surfaces available. These are common low impact
practices advocated by the national Leave No Trace program (www.LNT.org). Unfortunately,
visitor traffic along common travel corridors, on sensitive vegetation or soils, or near popular
destinations can result in the creation and proliferation of visitor-created informal trails.
The proliferation in number and expansion in length of informal trails (ITs) are perennial
management concerns. Furthermore, because ITs are not professionally designed, constructed, or
maintained, they have the potential to contribute substantially greater impacts to protected area
resources than formal trails. Such impacts may be related to: 1) their poor design, including
routes with steep grades or that directly ascend slopes, 2) multiple routes accessing the same

INTRODUCTION
Page 6
destinations, and 3) routes through fragile vegetation, soils, habitats and rare flora, fauna, or
archaeological sites. These attributes also make ITs more susceptible to tread impacts, including
expansion in width, soil erosion, and muddiness.
Protected area managers seeking to apply dispersal strategies for avoiding or minimizing visitor
resource impacts must have the means to evaluate the success of their policies and actions.
Visitor resource impact monitoring programs offer an important tool for evaluating the efficacy
of alternative educational, regulatory, and site management actions implemented to promote
visitor dispersal. Impact monitoring programs and protocols periodically access resource
conditions so that managers can determine the need for action, select effective actions, and
evaluate their effectiveness over time. With respect to IT networks, monitoring protocols could
be developed to evaluate their spatial distribution, aggregate lineal extent, and tread conditions.
Responding to these concerns and challenges, NPS managers at Alaska’s Denali National Park
and Preserve (DENA) sponsored this research to assess and monitor ITs. DENA is located in
south-central Alaska and managed as a six million acre wilderness park. Developments,
including structures, roads, and formal trails, are limited primarily to the park headquarters area,
the Kantishna Mining District, and infrequently along the interconnecting park road. This 87-
mile long park road is the primary means of visitor access within the park.
This program of research was guided by the following objectives:
1) Investigate alternative methods for monitoring the spatial distribution, aggregate lineal
extent, and tread conditions of informal (visitor-created) trails within the park.
2) In consultation with park staff, develop, pilot test, and refine cost-effective and
scientifically defensible trail monitoring procedures that are fully integrated with the
park’s Geographic Information System.
3) Prepare a technical report that compiles and presents research results and their
management implications.
This report presents the protocol development and field testing process, illustrates the types of
data produced by their application, and provides guidance for their application and use. The
protocols described provide managers with an efficient means to document and monitor IT
conditions in settings ranging from pristine to intensively visited. They were developed and
field-tested at DENA, which receives a wide range of visitation, with subsequent development
work through a companion study at the Arctic National Wildlife Refuge. The majority of land
within both protected areas is managed as ―trail-less‖ wilderness, where formal trails are not
provided and managers seek to prevent the creation and proliferation of IT networks.

Page 7
JUSTIFICATION FOR MONITORING
Sustaining any type of long-term natural resource monitoring program over time can be
exceptionally challenging for agencies due to changing personnel, management priorities, and
budgets. This section reviews legislative mandates, management policies and guidelines,
carrying capacity, visitor perceptions of recreation resource conditions, and monitoring program
capabilities. The purpose of this review is to describe legislative and management intent
regarding visitor impact monitoring and its role in balancing visitor use and resource protection
objectives. This section is included to assist in justifying implementation of a trail monitoring
program and to describe its utility to enlist organizational support for sustaining such a program
over time.
Legislative mandates challenge managers to develop and implement management policies,
strategies, and actions that permit recreation without compromising ecological and aesthetic
integrity. Furthermore, managers are frequently forced to engage in this balancing act under the
close scrutiny of the public, competing interest groups, and the courts. Managers can no longer
afford a wait-and-see attitude or rely on subjective impressions of deterioration in resource
conditions. Professional land management increasingly requires the collection and use of
scientifically valid research and monitoring data. Such data should describe the nature and
severity of visitor impacts and the relationships between controlling visitor use and biophysical
factors. These relationships are complex and not always intuitive. A reliable information base is
therefore essential to managers seeking to develop, implement, and gauge the success of visitor
and resource management programs.
Although numerous reasons for implementing a visitor impact monitoring program are described
in the following sections, the actual value of these programs is entirely dependent upon the park
staff who manage them. Programs developed with little regard to data quality assurance or
operated in isolation from resource protection decision-making will be short-lived. In contrast,
programs that provide managers with relevant and reliable information necessary for developing
and evaluating resource protection actions can be of significant value. Only through the
development and implementation of professionally managed and scientifically defensible
monitoring programs can we hope to provide legitimate answers to the question, "Are we loving
our parks to death?"
Legislative Mandates
Current legislation and agency documents establish mandates for monitoring (Marion 1991).
Recent legislative mandates allow managers more latitude to make proactive decisions that can
be defended in court if necessary. Managers who make proactive decisions should be prepared to
prove the viability of their strategies, or risk public disapproval or even legal action against the
agency. Survey and monitoring programs provide the means for such demonstrations.
Agency Organic Act
The National Park Service Organic Act of 1916 (16 United States Code (USC) 1) established the
Service, directing it to:

JUSTIFICATION FOR MONITORING
Page 8
"promote and regulate the use…[of parks]…to conserve the scenery and the natural and
historic objects and the wildlife therein and to provide for the enjoyment of the same in
such manner and by such means as will leave them unimpaired for the enjoyment of
future generations."
These provisions were supplemented and clarified by the Congress through enactment of the
General Authorities Act in 1970, and through a 1978 amendment expanding Redwood National
Park (16 USC 1a-1):
―the protection, management, and administration of these areas shall be conducted in
light of the high public value and integrity of the National Park System and shall not be
exercised in derogation of the values and purposes for which these various areas have
been established…‖
Congress intended park visitation to be contingent upon the National Park Service's ability to
preserve park environments in an unimpaired condition. However, unimpaired does not mean
unaltered or unchanged. Any recreational activity, no matter how infrequent, will cause changes
or impacts lasting for some period of time. What constitutes an impaired resource is ultimately a
management decision, a judgment. The Organic Act's mandate presents the agency with a
management challenge since research demonstrates that resources are inevitably changed by
recreational activities, even with infrequent recreation by conscientious visitors (Cole 1982
1995a,b, Leung & Marion 2000). If interpreted overly strictly, the legal mandate of unimpaired
preservation may not be achievable, yet it provides a useful goal for managers in balancing these
two competing objectives.
More recently, the National Parks Omnibus Management Act of 1998 established a framework
for fully integrating natural resource monitoring and other science activities into the management
processes of the National Park System. The Act charges the Secretary of the Interior to:
"develop a program of inventory and monitoring of National Park System resources to
establish baseline information and to provide information on the long-term trends in the
condition of National Park System resources."
Congress reinforced the message of the National Parks Omnibus Management Act of 1998 in its
text of the FY 2000 Appropriations bill:
"A major part of protecting [park] resources is knowing what they are, where they are,
how they interact with their environment and what condition they are in. This involves a
serious commitment from the leadership of the National Park Service to insist that the
superintendents carry out a systematic, consistent, professional inventory and
monitoring program, along with other scientific activities, that is regularly updated to
ensure that the Service makes sound resource decisions based on sound scientific data."
Management Policies and Guidelines
Authority to implement congressional legislation is delegated to agencies, which identify and
interpret all relevant laws and formulate administrative policies to guide their implementation. A
document titled Management Policies (NPS 2006b) describes these policies to provide more

JUSTIFICATION FOR MONITORING
Page 9
specific direction to management decision-making. For example, relative to the need for
balancing visitor use and resource impacts, the NPS Management Policies state that:
―The ―fundamental purpose‖ of the national park system, established by the Organic
Act and reaffirmed by the General Authorities Act, as amended, begins with a mandate
to conserve park resources and values. This mandate is independent of the separate
prohibition on impairment, and so applies all the time, with respect to all park resources
and values, even when there is no risk that any park resources or values may be
impaired. NPS managers must always seek ways to avoid, or to minimize to the greatest
degree practicable, adverse impacts on park resources and values.
Congress, recognizing that the enjoyment by future generations of the national parks
can be ensured only if the superb quality of park resources and values is left
unimpaired, has provided that when there is a conflict between conserving resources
and values and providing for enjoyment of them, conservation is to be predominant.
This is how courts have consistently interpreted the Organic Act, in decisions that
variously describe it as making ―resource protection the primary goal‖ or ―resource
protection the overarching concern‖… (Section 1.4.3)
The impairment that is prohibited by the Organic Act and the General Authorities Act is
an impact that, in the professional judgment of the responsible NPS manager, would
harm the integrity of park resources or values, including the opportunities that otherwise
would be present for the enjoyment of those resources or values. Whether an impact
meets this definition depends on the particular resources and values that would be
affected; the severity, duration, and timing of the impact; the direct and indirect effects
of the impact; and the cumulative effects of the impact in question and other impacts.
(Section 1.4.5)
Impacts may affect park resources or values and still be within the limits of the
discretionary authority conferred by the Organic Act. In these situations, the Service
will ensure that the impacts are unavoidable and cannot be further mitigated. Even when
they fall far short of impairment, unacceptable impacts can rapidly lead to impairment
and must be avoided. When a use is mandated by law but causes unacceptable impacts
on park resources or values, the Service will take appropriate management actions to
avoid or mitigate the adverse effects.‖ (Section 8.1.1)
Thus, relative to visitor use, park managers must evaluate the types and extents of resource
impacts associated with recreational activities, and determine to what extent they are
unacceptable and constitute impairment. Further, managers must seek to avoid or limit any form
of resource impact, including those judged to fall short of impairment. Visitor impact monitoring
programs can assist managers in making objective evaluations of impact acceptability and
impairment and in selecting effective impact management practices by providing quantitative
documentation of the types and extent of recreation-related impacts to natural resources.
Monitoring programs are also explicitly authorized in Section 4.1 of the Management Policies:
"Natural systems in the national park system, and the human influences upon them, will
be monitored to detect change. The Service will use the results of monitoring and
research to understand the detected change and to develop appropriate management
actions". (Section 4.1)

JUSTIFICATION FOR MONITORING
Page 10
―Further, The Service will:
Identify, acquire, and interpret needed inventory, monitoring, and research, including
applicable traditional knowledge, to obtain information and data that will help park
managers accomplish park management objectives provided for in law and planning
documents.
Define, assemble, and synthesize comprehensive baseline inventory data describing
the natural resources under its stewardship, and identify the processes that influence
those resources.
Use qualitative and quantitative techniques to monitor key aspects of resources and
processes at regular intervals.
Analyze the resulting information to detect or predict changes, including
interrelationships with visitor carrying capacities, that may require management
intervention, and to provide reference points for comparison with other environments
and time frames.
Use the resulting information to maintain-and, where necessary, restore-the integrity
of natural systems" (Section 4.2.1).
The National Park Service has implemented a strategy designed to institutionalize natural
resource inventory and monitoring on a programmatic basis throughout the agency. A service-
wide Inventory & Monitoring Program has been implemented to ensure that park units with
significant natural resources possess the resource information needed for effective, science-based
managerial decision-making and resource protection. A key component of this effort, known as
the NPS Inventory & Monitoring Program, is the organization of park units into 32 ecoregional
networks to conduct long-term monitoring for key indicators of change, or ―vital signs.‖ Vital
signs are measurable, early warning signals that indicate changes that could impair the long-term
health of natural systems. Early detection of potential problems allows park managers to take
steps to restore ecological health of park resources before serious damage can happen.
Park Planning Guidance
The Denali National Park General Management Plan (GMP) (NPS 2006a) states that formal
trails near the park entrance and along the park road corridor can be developed on non-
wilderness lands. Park formal trails are to be ―designed and maintained to discourage social
(informal, user-created) trail development.‖ However, the GMP established a ―no formal trails‖
policy for Denali wilderness areas, noting that ―Denali offers superlative opportunities for
primitive wilderness recreation. Outstanding cross country hiking, backcountry camping, and
winter touring possibilities are available for those willing to approach the area in its natural
condition. This huge park contains large areas with almost no trails and where evidence of
human use is minimal to nonexistent.‖
As part of the park’s Visitor Experience and Resource Protection carrying capacity program
(described below), the number of unofficial (social) trails, was selected as one of three
environmental indicators. The park’s Backcountry Management Plan (NPS 2006a) provides
guidance indicating that the majority of the park’s backcountry ―will be managed for dispersed,
self-reliant travel, and will include opportunities for extended expeditions in very remote
locations.‖ Further, that ―visitor use will remain dispersed so that no areas become overused,‖
specifically citing and noting that this objective includes the absence of all human trails.

JUSTIFICATION FOR MONITORING
Page 11
Carrying Capacity Decision-Making
Decisions regarding impact acceptability and the selection of actions needed to prevent resource
impairment frequently fall into the domain of carrying capacity decision-making. The 1978
National Parks and Recreation Act (P.L. 95-625) requires the NPS to determine carrying
capacities for each park as part of the process of developing a general management plan.
Specifically, amendments to Public Law 91-383 (84 Stat. 824, 1970) require general
management plans developed for national park units to include ―identification of and
implementation commitments for visitor carrying capacities for all areas of the unit‖ and
determination of whether park visitation patterns are consistent with social and ecological
carrying capacities. Regulations implementing the National Forest Management Act of 1976
(P.L. 94-588) dictate that, in wilderness management planning, provision be made ―for limiting
and distributing visitor use of specific areas in accord with periodic estimates of the maximum
levels of use that allow natural processes to operate freely and that do not impair the values for
which wilderness areas were created.‖
The NPS employs the Visitor Experience and Resource Protection (VERP) planning and
decision-making framework for formal evaluations of the acceptability of visitor impacts and for
establishing carrying capacity limits on visitation (NPS 1997, NPS 2006b) (Figure 1). Visitor
impact monitoring programs provide an essential component of such efforts. VERP and other
similar frameworks (e.g., Limits of Acceptable Change, LAC), evolved from, and have largely
replaced, management approaches based on the more traditional carrying capacity model
(Stankey et al. 1985). Under these newer frameworks, numerical standards are set for individual
biophysical or social condition indicators. These limits define the critical boundary between
acceptable and unacceptable change in resource or social conditions, and against which future
Figure 1. The NPS Visitor Experience and Resource Protection framework used to address
carrying capacity decision making.

JUSTIFICATION FOR MONITORING
Page 12
conditions can be compared through periodic monitoring. VERP is an adaptive management
process wherein periodic monitoring is conducted to compare actual conditions to quantitatively
defined standards of quality. If standards are exceeded, an evaluation is conducted to identify
those factors that managers can effectively manipulate to improve conditions for the indicators
with sub-standard (unacceptable) conditions. For example, if a standard for the individual or
aggregate size of recreation sites was exceeded, managers might consider implementing one or
more site management or educational actions. If the next cycle of monitoring also found sub-
standard conditions, more restrictive actions like fencing or area closures would be considered.
Additional guidance on visitor carrying capacity decision-making is provided in the NPS
Management Policies (2006):
―Visitor carrying capacity is the type and level of visitor use that can be accommodated
while sustaining the desired resource and visitor experience conditions in the park. By
identifying and staying within carrying capacities, superintendents can prevent park
uses that may unacceptably impact the resources and values for which the parks were
established. For all zones, districts, or other logical management divisions within a park,
superintendents will identify visitor carrying capacities for managing public use.
Superintendents will also identify ways to monitor for, and address, unacceptable
impacts to park resources and visitor experiences.
When making decisions about carrying capacity, superintendents must utilize the best
available natural and social science and other information, and maintain a
comprehensive administrative record relating to their decisions. The decision-making
process should be based on desired resource conditions and visitor experiences for the
area; quality indicators and standards that define the desired resource conditions and
visitor experiences; and other factors that will lead to logical conclusions and the
protection of park resources and values…
The general management planning process will determine the desired resource and
visitor experience conditions that are the foundation for carrying capacity analysis and
decision-making. If a general management plan is not current or complete, or if more
detailed decision-making is required, a carrying capacity planning process, such as the
Visitor Experience and Resource Protection (VERP) framework, should be applied in
an implementation plan or an amendment to an existing plan.
As use changes over time, superintendents must continue to decide if management
actions are needed to keep use at acceptable and sustainable levels. If indicators and
standards have been prescribed for an impact, the acceptable level is the prescribed
standard. If indicators and standards do not exist, the superintendent must determine
how much impact can be tolerated before management intervention is required.‖
(Section 8.2.1)
Visitor Perceptions of Resource Conditions
Visitors to wildland environments are aware of resource conditions along trails and at recreation
sites, just as are managers (Lucas 1979, Marion & Lime 1986, Vaske et al. 1982). Legislative
mandates set high standards when they direct managers to keep protected natural areas

JUSTIFICATION FOR MONITORING
Page 13
―unimpaired‖ and human impacts ―substantially unnoticeable.‖ Seeing trails and recreation sites,
particularly those in degraded condition, reminds visitors that others have preceded them. In
remote areas even the presence of trails and recreation sites reduce perceived naturalness and can
diminish opportunities for solitude. In accessible and popular areas the proliferation and
deterioration of trails and recreation sites present a ―soiled‖ or ―used‖ appearance, in contrast to
the ideal of a pristine natural environment (Leung & Marion 2000).
Visitor perceptions of an area and its naturalness are strongly influenced by encountering or
seeing trail or recreation site impacts. Visitors are sensitive to overt effects of other visitors (such
as the occurrence of litter, horse manure, malicious damage to vegetation) and to visually
obtrusive examples of impacts such as tree root exposure, tree felling, and soil erosion. A survey
of visitors to four wilderness areas, three in southeastern states and another in Montana, found
that littering and human damage to recreation site trees were among the most highly rated
indicators affecting the quality of recreational experiences (Roggenbuck et al. 1993). Amount of
vegetation loss and exposed soil around a recreation site were rated as more important than many
social indicators, including number of people seen while hiking and encounters with other groups
at recreation sites. Hollenhorst and Gardner (1994) also found vegetation loss and bare ground
on recreation sites to be important determinants of satisfaction by wilderness visitors.
Monitoring Program Capabilities
Visitor impact monitoring programs can be of significant value when providing managers with
reliable information necessary for establishing and evaluating resource protection policies,
strategies, and actions. When implemented with periodic reassessments, these programs produce
a database with substantial benefits (Figure 2). Data from the first application of impact
assessment methods can objectively document the types and extent of visitor impacts. Such work
also provides information needed to select appropriate biophysical indicators and formulate
realistic standards, as required in VERP or LAC planning and decision-making frameworks.
Reapplication of impact assessment protocols as part of a monitoring program provides an
essential mechanism for periodically evaluating resource conditions in relation to standards.
Visitor impact monitoring programs provide an objective record of impacts, even though
individual managers come and go. A monitoring program can identify and evaluate trends when
data are compared between present and past assessments. It may detect the appearance of
impacts or deteriorating conditions before severe or irreversible changes occur, allowing time to
implement corrective actions. Analysis of monitoring data can reveal insights into relationships
with causal or non-causal yet influential factors. For example, the trampling and loss of
vegetation or soils may be greatly reduced by shifting traffic to more resistant and resilient
vegetation types or better trail alignments, instead of limiting use. Following the implementation
of corrective actions, monitoring programs can evaluate their efficacy.
Identify and quantify site-specific resource impacts.
Summarize impacts by environmental or use-related factors to evaluate relationships.
Aid in setting and monitoring resource conditions standards of quality.
Evaluate deterioration to suggest potential causes and effective management actions.
Evaluate the effectiveness of resource protection measures.
Identify and assign priorities to maintenance needs.
Figure 2. Capabilities of visitor impact monitoring programs.

Page 14
LITERATURE REVIEW
This section begins with a review of the resource impacts associated with visitor trampling and
the development and use of trails. Two primary issues associated with the development of a
visitor impact monitoring program are the selection of indicators that will be monitored and their
assessment procedures. Criteria for selecting indicators of change related to trails are reviewed,
and prospective indicators and measurement units are presented. Common trail impact
assessment procedures are also reviewed.
Visitation-Related Resource Impacts: Trails
Visitors participating in a diverse array of recreation activities, including hiking, camping,
climbing, and wildlife viewing, contribute to an equally diverse array of effects on park
resources, including vegetation, soils, water, and wildlife. The term impact is commonly used to
denote any undesirable visitor-related change in these resources. This study was restricted to
assessments of trampling-related impacts to vegetation and soil along ITs.
Resource impacts associated with trampling on trails include an array of direct and indirect
effects (Table 1). Even light traffic can remove protective layers of vegetation cover and organic
litter (Cole 2004, Leung & Marion 1996). Trampling disturbance can alter the appearance and
composition of trailside vegetation by reducing vegetation height and favoring trampling
resistant species. The loss of tree and shrub cover can increase sunlight exposure, which
promotes further changes in composition by favoring shade-intolerant plant species (Hammitt &
Cole 1998, Leung & Marion 2000).
When a trail is constructed or created from visitor use, the surface vegetation and organic litter
are lost, exposing underlying mineral soil that is shaped and compacted into a durable tread to
support visitor traffic. However, exposure of soil on natural surfaced trails can lead to several
resource impacts, including soil compaction, muddiness, erosion, and trail widening (Hammitt &
Cole 1998, Leung & Marion 1996, Tyser & Worley 1992). The compaction of soils decreases
soil pore space and water infiltration, which in turn increases muddiness, water runoff and soil
erosion. The erosion of soils along trails exposes rocks and plant roots, creating a rutted, uneven
tread surface. Eroded soils may smother vegetation or find their way into water bodies,
increasing water turbidity and sedimentation impacts to aquatic organisms (Fritz 1993). Visitors
seeking to circumvent muddy or badly eroded sections contribute to tread widening and creation
of parallel secondary treads, which expand vegetation loss and the aggregate area of trampling
disturbance (Marion 1994, Liddle & Greig-Smith 1975).
A fairly small number of studies have examined trail impacts to arctic vegetation. Abele (1976)
and Abele et al. (1984) conducted some early studies examining off-road vehicle impacts to
Alaskan tundra, finding that moist tundra resists disturbance better than wet tundra, but it is less
resilient once disturbed. Furthermore, that above-ground tundra disturbance can recover in less
than 10 years, while disturbance of substrates and root systems lengthens recovery. This is
particularly true in when the removal of substrates causes permafrost melting and subsidence.
Also studying ORV impacts, Wooding and Sparrow (1979) note that the thick tundra normally
insulates substrates from changes in temperature, when removed by recreational traffic the
underlying soils absorbs greater radiation, warms, and thaws faster and deeper during the
summer months, often developing a soggy quagmire that subsequent traffic seeks to avoid.

LITERATURE REVIEW
Page 15
Happe et al. (1998) found considerable variability in ATV impacts between vegetation types in
Wrangle-St. Elias National Park and Preserve, Alaska. Most highly impacted were the wet and
mesic herbaceous and low shrub communities on permafrost soils, open forests with well-
drained soils had greater resistance, and the fewest impacts occurred in Dryas and tall willow
communities on coarse well-drained cobble, gravel and sand substrates. ORV use has steadily
expanded over time and a 2002 assessment documented ORV use in 13 Alaska parks, including
65 routes and 700 miles of trails, with additional dispersed traffic in many areas (NPS 2003).
Reid and Schreiner (1985) conducted experimental human trampling research at DENA within
three vegetation types to examine impact and recovery rates. A plant community’s ability to
tolerate recreational traffic with minimal impact is determined by its initial resistance to the
effects of trampling disturbance, and its resilience, or ability to recover following disturbance. A
tundra community dominated by Dryas octopetala was found to be the most trampling resistant
and resilient community, with the boreal forest community the least resistant and resilient – the
shrub tundra was intermediate. However, even in the resistant tundra plant community, a 25%
reduction in plant cover was achieved with only two passes one week followed by four passes
the next week, repeated over the course of the summer (40 passes/season). Total plant cover in
the boreal forest was reduced by 75% under that same treatment level. The recovery rate of the
graminoid alpine tundra plants (grasses and sedges) was more rapid than the woody vegetation in
either the boreal forest or shrub tundra.
A more recent and comprehensive experimental trampling study of Alaskan arctic tundra was
conducted by Monz (2002). This study investigated trampling within dryas and tussock tundra
communities, both of which lost approximately 50% vegetative cover after 200 passes. At 500
passes the majority of cover was lost, with regeneration to approximately 80% vegetative cover
after four years. Indices of resistance and resilience found the dryas tundra to be slightly more
trampling resistant than the tussock tundra; both communities have substantial resilience,
particularly the tussock community. Findings suggest that if the number of passes is kept below
about 200 per year that regeneration of plant cover can occur in one or two growing seasons.
The creation and use of trails can also directly degrade and fragment wildlife habitats, and the
presence of trail users may disrupt essential wildlife activities such as feeding, reproduction and
the raising of young (Knight & Cole 1995). For example, Miller and others (1998) found
decreased presence of nesting birds near trails in grassland ecosystems. Trails can alter
hydrology by intercepting and channeling surface water (Sutherland et al. 2001), and fragment
the landscape with potential barriers to flora and some small fauna (Leung et al. 2002, 2011,
Leung & Louie 2008). Finally, visitors and livestock can also introduce and transport non-native
plant species along trails, some of which may out-compete undisturbed native vegetation and
migrate away from trails (Benninger-Truax et al. 1992, Adkison & Jackson 1996, Bhuju &
Ohsawa 1998, Potito & Beatty 2005, Hill & Pickering 2006)
In summary, most trail-related resource impacts are limited to a linear corridor of disturbance,
though impacts like altered surface water flow, invasive plants, and wildlife disturbance, can
extend considerably further into natural landscapes (Kasworm & Monley 1990, Tyser & Worley
1992). However, even localized disturbance within trail corridors can harm rare or endangered
species or damage sensitive plant communities, particularly in environments with slow recovery
rates.

LITERATURE REVIEW
Page 16
Table 1. Direct and indirect effects of recreational trampling on soils and vegetation.
Effects Vegetation Soil
Direct Reduced height/vigor Loss of organic litter
Loss of ground vegetation, shrubs and
trees
Soil exposure and compaction
Introduction of non-native vegetation Soil erosion
Indirect Altered composition – shift to trampling
resistant or non-native species
Reduced soil pore space and moisture,
increased soil temperature
Altered microclimate Increased water runoff
Reduced soil fauna
Informal Trail Impacts
When formal trail networks fail to provide visitors the access and experiences they desire,
visitors frequently venture ―off-trail‖ to reach locations not accessible by formal trails. Some
protected areas encourage off-trail hiking, asking visitors to disperse their activity to avoid
development of trails. However, even relatively low levels of IT traffic can wear down
vegetation and organic litter to create visible informal (visitor-created) trail networks (Weaver &
Dale 1978, Thurston & Reader 2001). The establishment of ITs is commonplace in national
parks and other protected areas, especially heavily visited areas. Often referred to as social trails,
their proliferation in number and expansion in length over time are perennial management
concerns. Furthermore, because ITs are not professionally designed, constructed or maintained
they can contribute substantially greater impacts to protected area resources than formal trails.
Many of these impacts are related to their poor design, including alignments parallel to slopes or
along shorelines, multiple trails accessing the same destinations, routes through fragile
vegetation, soils, or sensitive wildlife habitats, and disturbance to rare flora, fauna, or
archaeological sites. These design attributes also make ITs far more susceptible to tread impacts,
including expansion in width, soil erosion, and muddiness.
Areas previously untrampled by human footprints can become severely degraded when repeated
visitation results in the creation of ITs. A study by Thurston and Reader (2001) found an 81%
mean loss of vegetation density in the center zone of new ITs, and a 71% decline in the species
present. Mean soil exposure also increased by 23% in these areas. Understanding and
minimizing the ecological disturbance caused by off-trail hiking is important to maintaining both
the environmental and social aspects of the recreation experience. Research demonstrates that the
quality of a visitor’s experience is likely to decrease if degradation to a trail is present (Lynn &
Brown 2003).
IT proliferation is common in high visitation settings and in some parks is responsible for
extensive areas of impact. A study in Mount Rainier National Park on the impacts of IT use
identified 913 degraded sites and attributed 89% of them to the presence of ITs (Rochefort &
Gibbons 1992). Other studies show that certain landscapes and visitor motivations might make
some areas more susceptible to IT proliferation. In areas such as open moorland in the UK, ITs
and consequent degradation of the landscape are widely visible (Pearce-Higgins & Yalden
1997). Other areas appear to be more prone to off-trail hiking because most visitors who wander

LITERATURE REVIEW
Page 17
off the official trail are taking a shorter route to a site of interest (Keirle & Stephens 2004).
Conversely, ITs are less common in areas that have more dense vegetation or topographical
obstructions that impede visitor access (Lehvavirta 1999). In areas where off-trail hiking is
activity discouraged, such activity is viewed as a form of depreciative behavior and causes
hundreds of thousands of dollars in damage each year (Christensen & Clark 1983). In an effort to
reduce IT degradation, educational and site management techniques area available for managers
to deter off-trail travel (Park et al. 2008).
Trail Management
Several studies show that proper trail design and construction principles minimize adverse
impacts to natural resources and reduce the need for trail maintenance (Leung & Marion 1996,
Marion & Leung 2004, Marion & Olive 2006, Olive & Marion 2009). The source of many forms
of degradation along formal trails can be related to poor design attributes such as steep grades,
alignments close to the fall line (parallel to landform aspect), or to locations on perennially wet
soils. Some formal trails were originally created by visitors or individuals who lacked trail
design expertise or were directed by objectives in conflict with resource protection goals (Marion
& Leung 2004). Well-designed trails require periodic maintenance, which can be challenging to
sustain under conditions of declining agency budgets. Even well-designed and managed trails are
susceptible to the several forms of degradation when subjected to high use or to high-impact
behaviors or types of use (e.g., horse riding and motorized uses) (Aust et al. 2004).
Common knowledge and research (Wimpey & Marion 2011a, 2011b) suggest that ITs are less
―sustainable‖ than their formal trail counterparts, because of the lack of professional design and
construction associated with their creation, and subsequent lack of maintenance. Visual
observation and research also suggests that visitors traveling off-trail often take the shortest path,
cutting switchbacks or directly ascending slopes (Cole 1993), or the path of least resistance,
avoiding dense vegetation or challenging terrain (Bayfield 1973). Finally, common knowledge
assumes that off-trail hikers do not generally recognize or attempt to avoid sensitive resources
(e.g., rare fauna/flora habitats), or select routes that reflect the principles of sustainable trail
design (e.g., side-hill alignments) (Marion & Leung 2004).
The development, deterioration and proliferation of ITs in protected areas can be a vexing
management issue for land managers. Traveling off-trail is necessary to engage in activities such
as nature study, photography or exploration. Unfortunately, management experience reveals that
IT systems are frequently poorly designed, including ―shortest distance‖ routing with steep
grades and fall-line alignments. Such routes are rarely sustainable under heavy traffic and
subsequent resource degradation is often severe. Creation of multiple routes to common
destinations is another frequent problem, resulting in ―avoidable‖ impacts such as unnecessary
vegetation/soil loss and fragmentation of flora/fauna habitats.
Once created, managers have found it difficult to deter their use and even when successful, their
recovery requires long periods of time (Grabherr 1982, Cole 1990, Boucher et al. 1991, Roovers
et al. 2005). Restoration work can hasten recovery but is expensive and generally requires
archeological assessment and compliance work. ITs are particularly problematic because they
become more visually obvious as they form, acting as a ―releasor cue‖ that draws even more
visitors off formal trails (Roggenbuck 1992, Brooks 2003). ITs are often indistinguishable from
formal trails, except for the lack of formal trail blazes or markings.

LITERATURE REVIEW
Page 18
Previous research has investigated the deterrence of off-trail hiking through educational
messages (Johnson & Swearingen 1992) and site management (Matheny 1979, Johnson et al.
1987, Sutter et al. 1993, Park et al. 2008). IT proliferation and resource impact is a problem
across all types of protected natural areas as shown by research and monitoring studies
conducted around the globe (Grabherr 1982, Cole 1990, Ferris et al. 1993, Marion & Cahill
2006, Manning et al. 2006, Marion & Hockett 2008a, Wimpey & Marion 2011a, 2011b, Wood et
al. 2006). However, few studies have extensively mapped or investigated the resource impacts of
IT networks within protected natural areas (Cole et al. 1997, Leung et al. 2002, 2011, Marion &
Hockett 2008b, Leung & Louie 2008, Wimpey & Marion 2011a), although several have
collected IT counts in conjunction with campsite, recreation site, or formal trail inventories
(Marion 1994, Leung & Marion 1999b, Dixon et al. 2004, Marion & Cahill 2006, Wimpey &
Marion 2011b, Wood et al. 2006).
Indicators and Selection Criteria
Indicators are measurable physical, ecological, or social variables used to track trends in
conditions caused by human activity so that progress toward goals and desired conditions can be
assessed. An indicator is any setting element that changes in response to a process or activity of
interest (Merigliano 1990). An indicator's condition provides a gauge of how recreation has
changed a setting. Comparison to management objectives or indicator standards reveals the
acceptability of any resource changes. Indicators provide a means for restricting information
collection and analysis to the most essential elements needed to answer management questions.
Examples of questions related to trails include:
Are visitors experiencing an environment where the evidence of human activity is substantially
unnoticeable?
Are trail numbers and conditions acceptable given each management zone’s objectives and
desired conditions?
Are visitor and trail management practices effective in minimizing the establishment of ITs or
degradation in formal and ITs?
Before a monitoring program can be developed, appropriate resource indicators must be selected.
A single, direct measurement of a trail’s condition is inappropriate because the overall condition
is an aggregate of many components. Typically, then, monitoring evaluates various soil,
vegetation, or aesthetic elements of a trail that serve as indicators of that facility’s condition.
Cole (1989), Marion (1991) and Merigliano (1990) review criteria for the selection of indicators
(Table 2), which are summarized here. Management information needs, reflected by the
management questions such as the examples above, guide the initial selection of indicators.
Preferred indicators should reflect attributes that have ecological and/or aesthetic significance.
Indicator measures should primarily reflect changes caused by the recreational activity of
interest. For example, measures of soil loss related to trail construction would be inappropriate.
Indicators should be measurable, preferably at an interval or ratio scale where the distances
between numeric values are meaningful, i.e. a 36-inch wide trail is twice the width of an 18-inch
wide trail. In comparison, a categorical ratings system based on subjective assessments rather
than quantitative measures provides data at an ordinal scale. Distance between numeric values
are not meaningful so computing an average or using them in statistical analyses or testing is not
appropriate.

LITERATURE REVIEW
Page 19
Table 2. Criteria for selecting indicators of resource condition.
Criteria Rationale
Quantitative Can the indicator be measured?
Relevant Does the indicator change as a result of the process or activity of interest?
Efficient Can the measurements be taken by available personnel within existing time
and funding constraints?
Reliable How precise are the measurements? Will different individuals obtain similar
data of the same indicator?
Responsive Will management actions affect the indicator?
Sensitive Does the indicator act as an early warning, alerting you to deteriorating
conditions before unacceptable change occurs?
Integrative Does the indicator reflect only its condition or is its condition related to that
of other, perhaps less feasibly measured, elements?
Significant Does the indicator reveal relevant environmental or social conditions?
Accurate Will the measurements be close to the indicator's true condition?
Understandable Is the indicator understandable to non-professionals?
Low Impact Can the indicator be measured with minimal impact to the resource or the
visitor’s experience?
Adapted from Cole (1989), Marion (1991), Merigliano (1990), O'Connor & Dewling (1986).
Potential indicators of resource condition are numerous and there is great variation in our ability
to measure them with accuracy, precision, and efficiency. All assessments are approximations of
an indicator's true value; a measurement method is accurate if it closely approximates the true
value. Efficiency refers to the time, expertise, and equipment needed to measure the indicator's
condition. Unfortunately, efficient methods often yield inconsistent results when applied by
different individuals. A measurement method is precise if it consistently approximates a
common value when applied independently by many individuals (i.e., repeatability). Accurate
measurements correctly describe how much change has occurred; precise measurements permit
objective comparisons of change over time (Cole 1989, Marion 1991). Indicator assessment
methods should also be considered when selecting indicators. When choosing a method
managers must balance accuracy and precision, for each places constraints upon efficiency and
cost-effectiveness. For example, recreation site condition assessments range from highly efficient
but subjective evaluations (e.g. photographs or condition class ratings), to rapid assessments
(ratings based on numeric categories of damaged trees), to time-consuming research-level
measurements (quadrat-based vegetation loss assessments). Regardless of the method selected,
comprehensive procedural manuals, staff training, and program supervision stressing quality
control can improve both accuracy and precision. However, poorly managed monitoring efforts
can result in measurement error that confounds data interpretation or even exceeds the magnitude
of impact caused by recreational activities.
Preferred Indicators
From these indicator criteria and knowledge of how recreation affects soil, vegetation, and
aesthetics, managers select preferred indicators. Table 3 includes a listing of commonly
employed indicators for assessing resource conditions on trails using measurement-based
approaches. Generally a small number of indicators are selected for use in LAC or VERP

LITERATURE REVIEW
Page 20
frameworks. However, that does not preclude monitoring of additional resource condition
indicators or from also assessing various inventory indicators. Travel time to the sampling
locations is often the most substantial portion of the time budget so assessing a few additional
indicators can be negligible. A final consideration is the measurement units employed for
reporting results and/or setting standards. Measurement-based approaches permit the most
flexibility in this respect.
Trail condition indicators frequently vary by trail type. For example, trail soil loss is most
prevalent for higher use formal trails but can also be a problem on some ITs that are poorly
aligned or heavily used. For formal trails, preferred indicators commonly include trail widening,
soil loss, and muddiness (Cole, 1991; Marion & Leung, 2001; Olive & Marion, 2009). For ITs,
the total lineal extent, aggregate area of disturbance, trail width, and landscape fragmentation are
possible indicators (Leung, 2008; Marion et al., 2006).
Table 3. Potential indicators of trail conditions and measurement units.
Trail Indicators Measurement Units
Informal Trails Length/unit area, number/unit area, % of formal trail length, #/unit
length on formal trails
Tread Width Max. value, value/unit length, running avg./unit length
Maximum Incision Max. value, value/unit length, running avg./unit length
Cross Sectional Area Max. value, value/unit length, running avg./unit length
Muddiness Max. % of tread width, avg. %/unit length, running avg. %/unit
length
Depending on the assessment protocols employed, managers must also consider measurement
units and the unit for which standards are applied. For example soil loss can be assessed at
sample points by measuring maximum incision or cross sectional area, with standards specifying
maximum allowable values (Cole, 1983; Marion et al., 2006). Standards could also be expressed
as a value per unit length or as a running average per unit length. Alternatively, if soil loss was
evaluated with the problem assessment method, the standard could be set at the level of soil loss
established as unacceptable and field staff would only assess soil loss occurrences at or above
this level. Alternate standard measures include a length per unit area, percent of trail length, or
length per unit length along a subset of trails.
In summary, managers must consider and integrate a diverse array of issues and criteria in
selecting indicators for monitoring impacts on trails. Indicators will rarely score high on all
criteria requiring good judgment as well as area-specific field trials and direct experience.
Indicators that score high on some criteria but low on others may be retained in some instances
or omitted in others. Tradeoffs are also required, such as a necessary reduction in accuracy so
that precision and efficiency may be increased.

LITERATURE REVIEW
Page 21
Trail Impact Assessment Surveys
This section considers assessment methods for trail surveys that could be applied to either formal
or ITs. The trail information collected can be used to inform the public about trail resources,
justify staffing and funding, evaluate the acceptability of existing resource conditions, analyze
relationships between trail impacts and contributing factors, identify and select appropriate
management actions, and evaluate changes in trail conditions and the effectiveness of
implemented actions. A variety of efficient methods for evaluating trails and their resource
conditions have been developed and described in the literature, as reviewed and compared by
Cole (1983), Leung and Marion (2000), and Marion et al. (2006). Multiple trail survey protocols
can also be integrated in a combined survey (Bayfield & Lloyd 1973, Olive & Marion 2009).
At the most basic level, trails can be inventoried and mapped with the use of Global Positioning
System (GPS) devices, using either recreational grade (about 3-8m accuracy), or survey grade
(<3m accuracy with post-processing) units. Such inventory/mapping surveys provide data that
are input to Geographic Information System (GIS) software to provide maps of trail networks
and for further analysis of trail impact attributes (Wolper et al. 1994, Wing & Shelby 1999).
Increasing availability of high-resolution spatial data, such as LIDAR, may enable accurate trail
inventory and mapping by trail feature extraction from spatial data in a GIS environment instead
of field surveys (Kincey & Challis 2010). Aggregate lineal extent, area of disturbance, and
landscape fragmentation indices are some examples of IT impact indicators that GPS/GIS-based
trail mapping can provide. Inventory information (type of use, segment lengths, hiking
difficulty), and trail maintenance information (number or location of tread drainage features), are
also often assessed during basic trail surveys.
Sectional evaluations can be applied to segments of formal or ITs to characterize attributes such
as hiking difficulty or resource condition. For example, condition class ratings that characterize
increasing levels of resource impact can be applied to trail segments to characterize a trail
network’s overall condition. Alternatively, trail segments can be characterized in terms of their
width, soil loss, or muddiness (Bratton et al. 1979). The trail segments can be defined and
assessed by a fixed distance (e.g., at 100 m intervals) or by pronounced changes in the attribute
being assessed.
Point sampling is a trail condition assessment method commonly applied to formal trails.
Assessments are made at transects, generally spaced a fixed interval with a random start (Cole
1983, 1991), or in accordance with various strata such as level of use or vegetation type (Hall &
Kuss 1989). Trail condition variables, including trail width, depth, muddiness, or substrate type,
are assessed at transects and used to characterize the surveyed trail.
Problem assessment or census surveys are another common method, where continuous
assessments record every occurrence of pre-defined impact problems (Cole 1983, Leung &
Marion, 1999). Generally applied to formal trails, field staff record the starting and ending points
for trail sections that are excessively eroded, wide, or muddy (Marion 1994). An evaluation by
Marion and Leung (2001) concluded that the point sampling method provides more accurate and
precise measures of trail characteristics that are continuous or frequent (e.g., tread width or
exposed soil). The problem assessment method is a preferred approach for monitoring trail
characteristics that are easily defined or infrequent (e.g., excessive width or secondary treads),
particularly when information on the location of specific trail impact problems is needed.

LITERATURE REVIEW
Page 22
Assessing Informal Trail Networks
A comprehensive review of the literature found
very few reported examples of research or
monitoring efforts focused on assessing IT
networks (Marion et al. 2006). While ITs likely
occur in nearly every protected area, managers
have frequently ignored their presence, limiting
monitoring efforts to formal trail systems.
Furthermore, conventional trail condition
assessment protocols are often difficult to apply to
ITs due to their unique spatial characteristics
(Marion & Leung 2001). IT segments are often
comparatively numerous, short, and often braided
in complex patterns (see Figure 3), creating
sampling and assessment difficulties for point
sampling or problem assessment methods (Leung
& Marion 1999a).
However, scientists and managers have recently
been focusing greater attention to the impacts of
IT networks and to developing methods for
assessing and monitoring their impacts on
protected area resources. Managers seeking to assess ITs must first consider two categories of
attributes: spatial and resource condition. Spatial attributes include the location, arrangement,
and lineal extent of ITs. Resource condition attributes include assessed degradation of
vegetation, organic litter, and soils along ITs.
It is possible to assess most spatial attributes using scale-appropriate airborne remote sensing
techniques if trails are not under concealing vegetation or when they are readily visible in leaf-
off photography (Witztum & Stow 2004). Kaiser and others (2004) applied the best available
techniques, including high spatial resolution (0.6m/pixel) digital multi-spectral imagery, digital
image processing, and visual image analysis techniques, to detect and delineate new illegal
immigrant trails in shrublands along the US-Mexico border. They found that an automated linear
feature extraction routine (Feature Analyst in ArcView GIS), followed by manual interpretation,
delineation, and editing using false color infrared imagery, yielded the most accurate results.
However, this method only resulted in 56% of the GPS surveyed trail locations matching by
length, in part due to shielding overhead vegetation.
Extending this work, Cao and others (2007) evaluated three trail monitoring approaches and two
types of spectral transformation to aid in locating trails in imagery, procedures designed to
evaluate temporal changes in US-Mexico cross-border trail networks. They found that a map-to-
image differencing approach was the most sensitive and reliable in detecting new trails, though
no ground-based GPS surveys were conducted for comparison. For disturbed areas where the
trail networks were extensive, Principal Component Analysis (PCA) of the image was more
effective at enhancing new trails. For densely vegetated areas, a Normalized Difference
Vegetation Index (NDVI) image yielded more interpreted trails. The authors stress that high
quality, well registered, and radiometrically matched multi-temporal image datasets are needed
for efficient and reliable trail map updating procedures. Imagery from different years must also
Figure 3. A ―spaghetti‖ map showing
the complex network of informal trails
branching off the Potomac Gorge’s
Billy Goat Trail, C&O Canal National
Historical Park.

LITERATURE REVIEW
Page 23
be collected at the same phenological time and time of day to minimize errors due to vegetation
seasonality and sun angles.
We conclude that these techniques are impractical for most protected area managers due to the
substantial expense associated with image acquisition, technician expertise and time, and
substantial inaccuracies associated with the methodologies used and concealing vegetation cover.
Ground-based Global Positioning System (GPS) surveys are more accurate, use existing staffing
and resources, and provide more immediate results. Point-based assessment methods include
access (trailhead) and transect surveys. A highly efficient method is to inventory IT junctions
with protected area roads, trails, or recreation sites, documenting junction locations with a
recreation or professional grade GPS, odometer, or measuring wheel (Bacon et al. 2006, Marion
& Cahill 2006). Alternately, an approach applying transects at fixed intervals within travel zones
was developed for Zion National Park to document the number and location of intersecting ITs
(Marion & Hockett 2008a).
Line feature assessment methods provide more comprehensive information on the spatial
distribution and lineal extent of IT networks. This method requires a GPS set to collect line
features (tracks) as field staff walk all ITs within a management unit. Trail information from the
GPS is then input to a Geographic Information System (GIS) for display and analysis of trail
attributes (Wolper et al. 1994). This commonly applied protocol has been reported in several
publications (Bacon et al. 2006, Cole et al. 1997, Leung et al. 2002, 2011, Leung & Louie 2008,
Manning et al. 2006, Marion et al. 2006, Marion & Hockett 2008b). Advantages of census
surveys include the ability to produce maps showing the location and spatial arrangements of IT
networks, document the number of trail segments and aggregate lineal extent, perform GIS
analyses to investigate proximity to rare flora or fauna or sensitive environments, evaluate
landscape fragmentation, and perform other relational analyses.
Resource conditions along ITs can also be assessed to document effects on vegetation and
substrates. A common method is to assign a condition class rating, generally five categories
describing increasing levels of trampling impact from a faint trace to a barren and eroded tread
(see examples in Manning et al. 2006 and Marion et al. 2006). ITs are broken into separate
segments whenever condition classes change categories. Other tread condition indicators such as
width and depth, and inventory indicators such as trail grade and vegetation type, can also be
assessed using ratings and input as attributes of these segments (Rochefort & Swinney 2000).
Resource condition assessments recorded for trail segments generally employ ―typical‖ or
categorical range data representative of the entire segment, resulting in some inaccuracies
because these assessments are generally not measured. Measurements that are more accurate can
be taken using a point sampling approach, generally employing a fixed interval between points
with a random start. This method was employed by Wood and others (2006) to characterize
informal tread width, depth, cross sectional area soil loss, and estimated total area of disturbance.
Page 24
STUDY AREA
Denali National Park and Preserve is primarily a wilderness park, including over six million
acres of land. The park’s ―frontcountry‖ consists of developments limited primarily to the park
headquarters area, the Kantishna Mining District, and an interconnecting park road providing the
primary means of visitor access to the park. This 92-mi park road has a 300 ft wide corridor with
several wider development nodes. The initial 13 miles of the road is paved, while the remainder
is graveled. A limited number of formal trails (N=19, 28 miles total) are provided within the
frontcountry portions of the park. A ―no formal trails‖ policy discourages formal and ITs in the
backcountry and wilderness portions of the park ―to preserve the unique wilderness character and
wilderness experience‖ (NPS 2006b). Exceptions have been made to provide visitor
opportunities at major visitor nodes or to address resource damage. Thus, most visitors leaving
the frontcountry do so on foot, traveling on either ITs that have developed from repeated use, or
along more dispersed non-discernable cross-country routes.
Park visitation doubled to 88,165 following opening of the George Parks Highway in 1972, and
has increased to 378,855 in 2010, with backcountry overnight stays of 38,625
(http://www2.nature.nps.gov/stats). DENA, like many national parks, will continue to face
increasing pressures to maintain and expand opportunities for visitors to experience the park and
its unique biological, physical, and scenic resources. Therefore, the NPS has supported
monitoring and research to provide accurate data on the associated effects of visitor use on park
resources.
The primary visitor activity in Denali is a shuttle or tour bus ride along the park road. Busses
stop at developed rest areas and the shuttle busses also stop at Eielson Visitor Center, road
corridor campgrounds, and at other locations requested by day and overnight hikers. Visitor
trampling impacts to vegetation and soils occur at places along the park road wherever visitor
use is concentrated, primarily at these developed rest areas, campgrounds and visitor center.
However, visitors also venture away from these developments to hike and experience Denali’s
scenic resources, flora, and fauna. ITs have developed along the more popular hiking routes and
the effects of visitor trampling have worn away vegetation cover, and in some places, eroded
soils. Some day-use and all overnight visitors venture quite far from the park road.
Current Management
Along the park road visitor facilities attract and contain visitor use on hardened surfaces in most
places. Formal and ITs have become established around rest areas, campgrounds, and the visitor
center. Vegetation loss and soil erosion are evident on these trails and the proliferation of ITs is
extensive in some areas. Some efforts to limit traffic to a few selected trails use signs and rope
borders to limit the areal extent of impacts. However, these practices are not employed in other
areas where well-developed ITs are present. Elsewhere along the road corridor, formal park trails
have not been developed. Dispersed day hiking is possible at nearly any location along the park
road as visitors are permitted to exit shuttle buses at places of their choosing, though area
closures are created where needed to protect sensitive wildlife areas like wolf den sites. A
number of locations along the park road are popular drop-off points for day hikers and ITs have
developed at these locations.

Page 25
METHODS
The project called for working collaboratively with park staff to clarify trail-related impact
monitoring objectives and develop supporting trail monitoring protocols suitable for long-term
application by park staff. The principal collaborator, who also provided extensive logistical and
personal assistance, was Joe Van Horn, the park’s Wilderness Program Coordinator. Project staff
visited different park environments to become familiar with the distribution, extent, and
condition of IT networks. Monitoring challenges and opportunities were discussed extensively
with park staff. For example, challenges include the widely dispersed and sometimes
discontinuous spatial patterns of DENA ITs and the time-consuming nature of ground-based
surveys. Opportunities to employ the increased accuracy of GPS devices and resolution of
satellite and aerial photography, multi-spectral data, LIDAR imaging, and analytical techniques
were examined. For example, Witztum and Stow (2004) used high resolution aerial imagery to
map the location of recreation trails in the open area of southern California with 74% accuracy.
They were also able to map the fraction of bare ground associated with the trails. This
technology is in its infancy but is rapidly improving, driven by border security concerns.
Project staff obtained relevant GIS datasets and satellite/aerial images from park staff and
explored a number of prospective aerial and ground-based methods for obtaining the information
required by park staff. Potential products were developed to illustrate resulting data related to
trail monitoring and the advantages/disadvantages of alternative methods. One issue that guided
the selection of monitoring indicators and assessment methods was measurement scale (Table 4).
Where possible, strong preference was given to developing indicator protocols at ratio
measurement scales as these permit the greatest accuracy in characterizing indicator conditions
and flexibility in statistical techniques for describing conditions or analyzing the influence of
influential factors.
Table 4. Measurement scales relevant to the selection of indicator assessment protocols.
Measurement
Scale Description (example)
Nominal Indicator attributes are categories, which cannot be ordered (e.g., a trail is either
a formal or informal trail)
Ordinal Indicator attributes can be rank-ordered but distances between categories are not
equivalent or meaningful (e.g., a condition class rating for trails)
Ratio Indicator values have uniform, equivalent intervals and an absolute zero value
(e.g., a measurement of trail width or depth).
Through this exploratory work and collaboration with park staff, project team members selected
and refined procedures for a preferred IT monitoring program that meets the needs of park staff
and is sustainable given anticipated agency staffing/funding constraints. Off-road vehicle
monitoring efforts within the region and park were also examined through collaboration with

METHODS
Page 26
Kevin Meyer, Environmental Specialist/Soil Scientist, with the Regional Office’s Rivers, Trails
and Conservation Assistance Program.
Procedures were experimentally developed, extensively field tested in different park
environments, revised, and reapplied. Park staff fully participated in this process, including both
Resources Management staff involved in some formal trials and Rangers involved in the
experimental application of procedures in selected park areas.
Use of trade, product, or firm names does not imply endorsement by the U.S. Government.

Page 27
RESULTS
This section begins by reviewing the development of park monitoring objectives related to ITs.
This is followed by a review of previous IT monitoring efforts at DENA, and by the sequence of
monitoring protocols considered and refined over the course of the study. This documentation
includes discussion of the relative merits and limitations of alternative monitoring methods,
which can aid DENA and other protected area managers in future monitoring decision-making.
The final set of monitoring protocols are included in Appendix 1, with discussion in this section
and presentation of selected monitoring results to illustrate their application within the park and
the resulting types of data they provide.
Monitoring Objectives
Protected area managers who need to make decisions regarding the selection, implementation,
and evaluation of actions to address IT impacts can benefit from monitoring data that
characterize the location, lineal extent, and tread conditions of IT networks. The protocols
described in this document provide managers with the means to document and monitor IT
conditions in settings ranging from pristine to intensively visited. These data can be used to
evaluate the acceptability of existing resource conditions, analyze relationships between trail
impacts and influential factors, identify and select appropriate management actions, and evaluate
the effectiveness of implemented actions.
Through collaboration with park managers the following monitoring program objectives were
developed, with refinements made throughout the study period.
1. Documents the number, distribution, aggregate lineal extent, and general condition of ITs
within the following areas of interest: a) the Denali Road corridor, b) formal trail
corridors, and c) within permanently defined travel zones away from road and formal trail
corridors.
2. Provide accurate quantitative assessments for a variety of trail condition indicators on
selected ITs whose alignments are relatively static and formal trails.
3. Document the hiker’s Route Finding Experience as they move through backcountry
travel corridors.
Park staff desired a monitoring program with the following attributes: comprehensive, flexible,
efficient, accurate (approximation of ―true‖ values), and precise (assessment consistency or
repeatability between field staff). Most monitoring programs focus on the provision of a single
protocol that includes multiple inventory and condition assessment indicators. DENA staff
required greater flexibility to address information needs that varied between frontcountry and
backcountry zones and from general to very specific. Our work therefore focused on developing
an interrelated set of protocols that managers could select from to address their changing
information needs. The protocols also needed to be comprehensive, providing data on an array of
different indicators for discontinuous and continuous ITs, formal trails, and even visitor route
finding experiences. Efficiency was required so that managers could sustain implementation of
the monitoring program, applying the most efficient protocols as a census assessment, others
within sampled areas, and by optionally adding some indicators when information needs required
their use. Finally, accuracy and precision were addressed by preference for indicator assessments
with ratio measurement scales, careful development of detailed and illustrated assessment

RESULTS
Page 28
protocols, extensive revisions based on field testing in a variety of park environments, and
several precision trials involving protocol application by different individuals to the same sample
areas.
Previous Visitor Impact Monitoring Investigations
DENA park staff have conducted several previous visitor impact monitoring efforts, which we
reviewed and considered. The earliest began in the mid-1970s and employed periodic
photographic images of formal and ITs taken at permanent photopoints. Park records include
many sets of photos taken through 1997. Photographs were reorganized and renamed in 1996/97
and new photopoint data collection procedures were developed though it appears that this work
was never completed (Baxter 1997) Photographic monitoring of ITs can be quite useful in
providing a visual record of changing conditions at the photopoints selected, however, there are
numerous limitations if this is the only method applied. For example, photo-based methods
provide no data on the distribution, proliferation, or aggregate lineal extent of IT development
over time. They also provide limited quantitative data on IT conditions, though it is possible to
make direct comparisons of attributes like tread width or soil exposure between photographs if
they are taken from the same photopoints using the same camera focal lengths.
A more comprehensive park-wide effort initiated in 1995 by Resource Manager Elaine Furbish.
Known as the Trail and Nodes Monitoring Program, Furbish (1996) applied trail condition
measurements in a three-tiered monitoring system designed to:
1. Detect the creation of new impacted areas, including trails and various other sites impacted by
foot traffic within the road corridor,
2. Evaluate the condition of all impacted areas through application of standardized monitoring
procedures, and
3. Monitor changes in conditions at selected locations, particularly those with substantial impact
or having historical significance.
Assessment procedures were developed and applied to all trails within the park road corridor.
Trail procedures were designed to identify and obtain basic inventory and trail condition
information on all park trails during each monitoring cycle. Trails were broken into segments
200 meters long, or shorter when traversing different vegetation types. Predominant vegetation
type and ten condition assessments were made for each segment. Condition indicators include:
loss of vegetation cover, increase in soil exposure, trail width, trail depth, continuity, organic
litter disturbance, soil erosion, number of collateral (parallel) trails, portion of trail with collateral
trails, and litter (trash). Assessments were estimated (no measurements) for the entire segment by
selecting from among five quantitatively described indicator ratings. Following each segment
field staff determine if more intensive monitoring is needed based on the degree of deterioration.
Intensive monitoring may consist of a photopoint, tread depth measurements for computing soil
loss (cross sectional area method), and groundcover estimates in adjacent and off-trail plots. The
tread depth and groundcover plots provide more quantitative measurements of changes in trail
condition taken at permanently referenced points.
This trail monitoring program may be classified as a multiple parameter rating-based rapid
survey with added measurements at locations that exhibit more severe problems or an apparent
threat of future problems. Results from each monitoring cycle can provide data to evaluate

RESULTS
Page 29
problems with trail proliferation and condition. In addition, because all trails are evaluated (a
census), this approach permits computation of aggregate measures of degradation.
While this trail monitoring program is relatively efficient it does have several limitations. The
precision (rater consistency) and accuracy associated with estimating measures and assigning
indicator ratings for 200 meter trail segments is not likely to be high unless trail conditions are
homogeneous. Differences in starting points and variability in measuring wheel readings (that
increase with distance covered) will prevent future workers from referencing the same 200 meter
trail segments without permanently established reference points. Comparability of measurements
is thus suspect for individual segment comparisons and measurement scale problems could
hinder trail-wide analyses.
Indicator ratings, though quantitatively defined, are assessed using an ordinal scale (Table 4)
with rating classes that lack consistently uniform intervals (e.g. trail depth: 0-3, 3-8, 8-15, 15-30,
>30 cm). It is statistically inappropriate to average such ratings (Marion 1991, p. 15) as have
been done in computing the impact indices used to report monitoring results. Another concern is
the need to calibrate the impact rating categories to the distribution of values for the area in
which they are applied (Marion 1991, p. 21). Failure to calibrate may lead to a disproportionate
clustering of values in only one or two broadly defined categories. This reduces the sensitivity of
monitoring to detect changes, potentially allowing substantial change without causing a shift
from one rating category to another. A final problem relates to ordinal ratings where the highest
category is open-ended (e.g. >30 cm in the example above), so that continued change above this
value is not reflected in indicator measures and managers are unable to monitor excessive
change.
An improved alternative approach using a ratio scale was also employed where closed rating
categories are numerically defined but midpoint values are used in analysis and reporting. For
example, 0-5 (2.5)%, 6-25 (15.5)%, 26-50 (38)%, 51-75 (63)%, 76-100 (88)% is used to assess
vegetation cover on- and off-trail, with the mid-point values in parentheses used in subsequent
analyses as a ratio scale indicator. While this approach is statistically acceptable, it infers greater
precision than is justified when applied to 200 meter trail segments. It would be more appropriate
if assessed at a large number of representative sample points.
Development of Monitoring Protocols
Initial discussions with park staff and a review of the literature revealed a trail condition
assessment program developed by Kevin Myers of the NPS Alaska Regional Office for All
Terrain Vehicle (ATV) tracks (Meyer 2002). Meyer (2011) also describes manual and GPS field
mapping methods for assessing OHV trails. These protocols include basic trail inventory and
condition assessment indicators similar to the DENA program developed by Furbish. Trail
condition indicators are assessed for trail segments mapped by GPS devices. Indicators are based
on ordinal categorical ratings with the same limitations previously described. These assessments
are primarily oriented toward providing an inventory of physical trail characteristics and
development of management options, such as trail hardening prescriptions or visitor use
restrictions. Their use for long-term monitoring appears to be a secondary objective. However,
condition assessments can be combined with ranking weights to produce useful condition indices
(Meyer 2011). This system has been applied to some DENA trails, including those in the
Cantwell, Windy Creek area.

RESULTS
Page 30
As we began investigating monitoring options we initially considered what types of IT
information could be gathered from aerial and satellite photography, or from LIDAR imaging.
However, our examination and consideration of available datasets indicated the following
problems:
1) faint ITs do not always show up in aerial imagery, particularly in areas of moderate to
high shrub or tree cover,
2) where trails do appear it is impossible to distinguish trails created or used primarily by
park visitors from those used by wildlife.
3) quantitative measures of trail condition, including tread width, depth, and vegetation
cover are not possible.
4) LIDAR imagery is unavailable for the park.
Considerations regarding the use of highly accurate GPS devices were more promising, as park
staff have and routinely use these devices, which could obtain sub-meter accuracy in nearly all
park settings. A decision was made to fully incorporate their use in mapping ITs and recording
all indicator data assessed for trail segments and at sampling points. Advantages include the
efficient collection, storage, and transfer of field data to office computers, collection of highly
accurate spatial data on the distribution and lineal extent of IT networks, and the ability to
conduct spatial analyses using the full complement of GIS capabilities. Accurate GPS mapping
also allows a return during future assessments to previously mapped trails, transects, or sample
points to repeat assessments, and the ability to differentiate new ITs from pre-existing trails.
These attributes substantially strengthen the capability of IT monitoring protocols, enhancing
assessment efficiency and measurement accuracy and precision.
Initial work focused on the development of efficient condition class assessments for IT surveys
using GPS mapping to find and document all ITs within specified search areas. A data dictionary
was developed for Trimble GPS units that incorporated condition class (CC) ratings assessed for
homogeneous portions of mapped ITs. This was to be paired with point sampling data to assess
trail condition indicators such as tread width, depth, muddiness, secondary treads, and tread
vegetation cover. The efficiency and management value of including a general CC assessment of
the visibility and condition of ITs during GPS mapping caused us to expend considerable effort
at developing an optimal set of CC descriptors.
Subsequent field testing in a variety of park environments led to a cycle of edits, testing, and
refinement of the CC descriptions to improve their applicability to a wide range of environmental
settings and their ability to differentiate different trail condition levels. For example, travel
through the DENA backcountry frequently occurs in a variety of landscape types including: open
tundra, patches of low or high shrubs, and riparian or montane settings with substantial rock or
gravel substrates with limited vegetation groundcover. The CC descriptors must be able to
effectively and consistently differentiate IT visibility and condition classes in each landscape
type. This turned out to be an exceptionally challenging process, as illustrated by our inclusion of
four of about six versions of CC descriptors (Table 5) that we developed and field tested.

RESULTS
Page 31
Table 5. Evolution in the development of Trail Condition Classes, from the 1st version, this
page, to its eventual replacement with separate quantitative indicators for vegetation and exposed
soil cover (see following pages).
Faint: Regular choices have to be made when it joins a side trail or animal trail as to which one should be followed.
Often not sure you are on something that is really going to last. Frequently questioning whether you are on a trail at
all. This category is on the edge of where you would actually stop mapping a trail segment and say that you are not
on a trail. The visibility of the trail changes frequently in response to very minor changes in vegetation, substrate, or
topography. Sometimes the only clue you have that you are on a trail that is used by people are footprints or the
location. The trail tread still looks like the natural ground surface or vegetation for the most part with only minor
evidence of wear or alteration. You may not be able to see the trail even 10 -15 feet ahead of you, especially in non-
vegetated areas.
Vegetated areas: The trail is visible primarily because of seasonal wear, minor compositional changes, or only very
minor cover loss (0-5%). If there is a trail depression it is slight and formed by compression only rather than
elimination of the vegetation mat. Depth of depression is generally less than in 1‖-2‖ range even in compressible
vegetation types.
Unvegetated areas: There is a slight compression of soils or gravels that defines the travel path. There is no real
sorting of particle size. On talus, the trail is still outsloped and requires attention to balance. There is no real
development of a distinct outside edge. Trail width and footing is narrow, one right in front of the other like an
animal trail rather than a distinct, secure bench.
Continuous: This class of trail can generally be followed without loss. It now feels more like you are walking at
continuous trail then something that will end around the next willow bush. You are no longer decision making or
just jumping from one piece to another. Impact is fairly consistent along it, not constantly fading in and out.
Choices at intersections about how to proceed are clear. In unvegetated areas the only place that it is typically lost is
for short stretches in cobbles or coarse gravels. While the wear that is present is obvious and permanent from season
to season, human use has still not completely altered the natural ground surface characteristics or vegetation in the
area of the trail tread.
Vegetated areas. The overall impression is a trail where some damage and cover loss of vegetation due to use has
definitely taken place occurred relative to the surrounding area, but that some vegetation is still surviving in the trail
despite use. For example, in areas with 100% vegetative cover, the live vegetative cover on the trail still is between
5% to 95%. A definite trail depression is usually present, but it may be more rounded in form rather than sheared or
sharp sided, and formed more by compression of the vegetation rather than completely cutting through the
vegetative mat.
Unvegetated areas: In unvegetated substrates some sorting of gravels, stones has started to place, but the primary
reason for the visibility of the trail is the compression of the material, not sorting. On scree slopes the trail is still
strongly outsloped, but footing is good. There is a trail platform. The trail can generally be followed across silts,
sands, and small gravel substrates, but may be harder to spot in coarse gravels where the compression/depression is
minor.
Well-Developed: No question about following this type of trail, decision points are rare. You feel like you are
almost on a typical hiking trail. You don’t have to pay attention to stay on it, even in unvegetated areas such as a
creek bottom, gravel bars or talus hillsides. You can see this trail well ahead of you. Wear is obvious and
permanent from season to season.
Vegetated areas: The overall impression one has of the trail is that there is now much more bare ground and detritus
than live vegetation and/or that substantial cover loss relative to the surrounding vegetation has taken place. For
example, in areas with 100% vegetative cover, there would be less than 5% live vegetative cover on the trail. There
is usually a distinct trail depression cut down into the vegetative mat and some incision into the soil layer present.
Unvegetated areas: In unvegetated substrates the sorting of gravels, stones has taken place to a degree that there is a
noticeable compositional difference in particle size from the trail tread to the surrounding area. Larger particles have
been moved to the outside edge of trail by use and/or compressed down into the substrate. A trail depression is
definitely present. On scree slopes a distinct trail bench created by regular and repeated use has moved material to
outside edge and is wide enough for comfortable walking, possibly even side to side foot placement. The trail is
easy to follow across all but cobble sized substrates.

RESULTS
Page 32
Trail Condition Classes (2nd
version)
Class 1: Trail barely distinguishable; no or minimal disturbance of vegetation and/or organic
litter.
Vegetation is irregularly trampled down creating a route that is generally visible, though
following this class of trail requires careful attention to remain on it. Gaps longer than 15 feet
should not be mapped.
Class 2: Trail distinguishable; some loss of vegetation cover and/or minimal disturbance of
organic litter.
Vegetation is consistently trampled down and compressed; the route is rarely discontinuous.
Small changes in vegetation composition may be evident, e.g., fragile broad-leafed plants may be
reduced in cover compared to adjacent untrampled vegetation.
For barren substrates: Trail is faint but distinguishable and may have some discontinuous areas.
Trail is visible due to limited depression of surface stones into substrates, sorting of gravel, or
overturned stones. On talus, trail width and footing is narrow, like an animal trail.
Class 3: Trail obvious; vegetation cover lost and/or organic litter pulverized in some areas.
Vegetation cover is thoroughly trampled down and up to half the off-trail vegetation cover is
lost. Organic litter is partially pulverized and soil exposure is slightly more than in off-trail
areas. Trail is continuous and easy to follow.
For barren substrates: Trail is obvious and easily followed. Trail is visible due to a distinctive
flattening of substrates or from overturned stones. On talus, the tread is often widened and
cupped.
Class 4: Vegetation cover lost and/or organic litter pulverized within the center of the tread,
some bare soil exposed.
More than half of the off-trail vegetation cover is lost and soil exposure is common. Only
resistant vegetation (e.g., grasses, sedges, or low mosses) survive within the tread (ignore
overhanging vegetation rooted outside the tread). Pulverized organic litter may be present and
some compaction of the soil is evident.
Class 5: Nearly complete or total loss of vegetation cover and organic litter within the tread,
bare soil is widespread.
Nearly all of the vegetation cover and organic litter have been lost, leaving more than 90% of the
substrate as bare soil, rock, or gravel.

RESULTS
Page 33
Trail Condition Classes (3rd
version)
Apply the first four categories to trails that cross areas with at least 75% vegetation or organic
litter cover; apply the last two categories to trails that cross more barren areas. Apply a
minimum mapping distance of 30 ft to avoid rapid changes in condition class, i.e., mentally
average tread conditions as you hike to avoid assessing changes in condition of less than 30 feet.
Class 0: Trail barely distinguishable; no or minimal disturbance of vegetation and/or organic
litter.
Vegetation is irregularly trampled down creating a route that is generally visible, though there
may be some discontinuous gaps (gaps longer than 15 feet should not be mapped).
Class 1: Trail distinguishable; some loss of vegetation cover and/or minimal disturbance of
organic litter.
Vegetation is consistently trampled down and compressed and up to one-quarter of the off-trail
vegetation cover is lost. Organic litter is partially pulverized but soil exposure is the same or
only slightly more than in off-trail areas. The trail is continuous and some changes in vegetation
composition are evident, e.g., fragile broad-leafed plants may be reduced in cover compared to
off-trail vegetation.
Class 2: Vegetation cover lost and/or organic litter pulverized within the center of the tread,
some bare soil exposed.
Approximately 25-75% of the off-trail vegetation cover is lost with only resistant vegetation
(e.g., grasses, sedges, or low mosses) surviving within the tread (ignore overhanging vegetation).
Class 3: Nearly complete or total loss of vegetation cover and organic litter within the tread,
bare soil is widespread.
More than 75% of the off-trail vegetation cover has been lost, leaving the underlying substrates
substantially exposed. Some patchy pulverized organic litter may be present.
Barren Substrate Classes
Class B1: Trail is faint but distinguishable. Trail is visible due to limited depression of surface
stones into substrates, sorting of stones, or overturned stones. On talus, trail width and footing is
narrow, like an animal trail; side-hill trails are outsloped.
Class B2: Trail is obvious and easily followed. Trail is visible due to a pronounced flattening of
substrates, sorting of stones, or overturned stones. On talus, the tread is often widened and
cupped.

RESULTS
Page 34
Trail Condition Classes (4th
version)
Apply the first four categories to trails in areas that have at least 75% ground vegetation or organic litter
cover; apply the last two categories to trails that cross more barren areas. Apply a minimum mapping
distance of 30 ft to avoid rapid changes in condition class, i.e., mentally average tread conditions as you
hike to avoid assessing changes in condition of less than 30 feet.
Vegetated Substrates Classes
Class 0 Trail barely distinguishable or discontinuous; no or minimal disturbance of ground
vegetation and/or organic litter.
Ground vegetation rooted within the tread is irregularly trampled down, though there may
be some small discontinuous gaps (gaps longer than 15 ft should not be mapped).
Class 1 Trail distinguishable and continuous; some loss of tread vegetation cover and/or minimal
disturbance of organic litter. Lightly impacted compared to adjacent areas.
Vegetation rooted within the tread is consistently trampled down and compressed and up
to one-quarter of the off-trail ground vegetation cover is lost. Organic litter is partially
pulverized but soil exposure is the same or only slightly more than in off-trail areas. Some
changes in vegetation composition are evident, e.g., fragile broad-leafed plants rooted in
the tread are somewhat reduced in cover compared to off-trail vegetation.
Class 2 Vegetation cover lost and/or organic litter pulverized within the center of the tread, some
bare soil exposed. Moderately impacted compared to adjacent areas.
Approximately 25-75% of the off-trail vegetation cover is lost with only resistant
vegetation (e.g., grasses, sedges, or low mosses) surviving within the tread (ignore
overhanging vegetation).
Class 3 Nearly complete or total loss of vegetation cover and organic litter within the tread, bare
soil is the predominant tread surface. Heavily impacted compared to adjacent areas.
More than 75% of the off-trail ground vegetation cover has been lost, leaving the
underlying substrates substantially exposed. Some patchy pulverized organic litter may be
present.
Barren Substrates Classes
Class B1 Trail is faint but distinguishable. Trail is visible due to limited depression of surface stones
into substrates, sorting of stones, or overturned stones. On talus, trail width and footing is
narrow, like an animal trail; side-hill trails are outsloped.
Class B2 Trail is obvious and easily followed. Trail is visible due to a pronounced flattening of
substrates, sorting of stones, or overturned stones. On talus, the tread is often widened and
cupped.

RESULTS
Page 35
Trail Condition Assessment (CC option abandoned, final version)
Applied at sample point locations.
Vegetation Cover On-Trail (VO): Imagine a 1 ft wide belt transect centered on the pole
extending between the trail boundaries perpendicular to the trail. Within this band estimate
the percentage of live vegetative ground cover < 1 ft tall (including herbs, grasses, low
shrubs, live mosses, lichens (all colors), and any largely intact cryptogrammic crusts) rooted
within the band using the coded categories listed below. For this and the following indicator,
it is helpful to narrow your decision to two categories and concentrate on the boundary value
that separates them. For example, if the vegetation cover is either category 6-25% or 26-
50%, you can simplify your decision by focusing on whether vegetative cover is greater than
25%. Alternately, consider that analyses will use the midpoint values for these categories so
it may be helpful to base your decision on which midpoint value is most representative of the
trail tread cover. Cover categories:
0-5% (1=2.5), 6-25% (2=15.5), 26-50% (3=38), 51-75% (4=63), 76-95% (5=85.5),
96-100% (6=98)
Vegetation Ground Cover Off-Trail (VF): Assess vegetation cover in an adjacent, untrampled
off-trail location several feet beyond trail boundaries. The intent is to locate a ―control‖ area
that depicts what the vegetation cover on the trail tread would resemble had it never been
trampled. Select a control that has the same proportion and size of rocks as the tread quadrat.
In instances where you cannot decide between two categories, select the category with less
vegetative cover. The rationale for this is simply that the first visitors would tend to select a
trail route with the least amount of vegetation. Note that if some of the trail substrates would
likely be barren due to exposed rock, then the control substrates or control vegetation
estimates must reflect that.
Bare Soil On-Trail (BO): As in vegetation cover assessments above, but estimate bare/exposed
soil cover, defined as rocks, gravel, roots, and exposed soil of all types, including organic
soils with finely pulverized organic litter. Total cover for each band transect should
approximately equal the sum of your mid-point estimates for VO, BO), and organic litter
cover.
Bare Soil Off-Trail (BF): As above, with the cover estimate of bare soil made in the same off-
trail location used for the vegetation assessment.

RESULTS
Page 36
As evidenced in the modifications shown, field staff sought to make the descriptors more
quantitative to improve assessment consistency but efforts to perfect them retained what were
considered to be unacceptable limitations, particularly precision problems when CC classes were
assessed by different staff on the same set of ITs and compared. Inter-rater reliability (precision)
trials were conducted to explore these problems further. During these we applied a variety of IT
assessment protocols to the same IT network located in a sloping meadow at Savage Box, near
the DENA road entrance station. Field staff included Jeff Marion, Joe Van Horn, three doctoral
students, and two seasonal park staff. From census mapping data, Figure 4 and Table 6 illustrates
a comparison performed by two experienced staff, and Figure 5 and Table 8 report data for all
seven field staff. We also assessed the ability of field staff to evaluate two quantitatively defined
trail depth (incision) categories while performing trail mapping work (Figure 6, Table 8). A
careful review of all these results reveals what we considered to be unacceptable levels of
variation across field staff. Even data from assessing just two quantitatively defined trail depth
categories, while better, retains unacceptably low levels of precision.
Our interpretation of these data are that CC class assessments made by moving staff are
inherently problematic. While the data yielded are similar from different field staff, the poor
level of precision is likely to confound management efforts to detect real changes in resource
conditions over time.
There are several possible explanations for these findings. Searching for and carefully mapping a
dense IT network with Trimble GPS units can be a sufficiently challenging task; adding tasks
that require staff to constantly monitor attributes like CC class and tread depth add to the
complexity. Furthermore, CC classes and tread depths change along a trail so attempts to
categorize constantly changing trail conditions presents staff with a difficult and frustrating
decision process. Finally, trail conditions sometimes change for short trail segments, requiring
staff to stop, enter data, and start again. We sought to address this problem by establishing a
minimum segment length (30 ft) over which a tread condition change must manifest itself before
requiring staff to stop and register the change. This distance is generally entirely visible to the
field staff, yet sufficiently long to improve the efficiency of data collection. Such a decision rule
is clearly necessary but it also adds complexity to the field assessment process.
Given the large standard deviation values and wide range (Table 7) we decided to evaluate CC
and trail condition assessments at specific points, such as along a line transect and with point
sampling. However, results from line transects, illustrated from two experienced staff in Figure
7, reveal similar problems with low precision. Several factors could explain the variations here.
Variation in the number of trails located by different field staff were related to differences in how
far out they walked the transects; at the upper end of the study area some staff failed to walk the
entire transect lines. Some staff omitted trails they felt were too faint or were created by wildlife,
while others included them as mixed wildlife/human use trails (specific guidance for
differentiating wildlife trails had not been developed at this time). Differences in condition class
ratings, both between surveyors and between their own assessments when mapping the ITs and
when assessing the transects (done on different days), are also apparent. Given the accuracy of
the GPS units and variation in cross-country hiking along the transect lines (which were
downloaded into and appeared on their GPS screens), the field staff could have been assessing
slightly different locations along the trails that were bisected by the transects. Given the accuracy
of the GPS devices and hiking variation we would expect the trail locations could have been up
to about 12 ft from each other.

RESULTS
Page 37
Figure 4. Comparison of data for two experienced staff with a 4-class CC system. Note lack of
agreement in CC classes and segmenting.
Table 6. Summary table comparing CC data from two experienced staff, including segment
counts and aggregate length by CC class.
Condition
Class
Segment
Count
Aggregate
Length
(m)
Staff
0 8 193 JW
1 28 573 JW
2 25 510 JW
3 30 722 JW
0 3 133 LP
1 14 446 LP
2 14 779 LP
3 11 623 LP

RESULTS
Page 38
Figure 5. Variation among seven field staff in total lengths of IT’s by condition class in the
Savage Box study area; data for each field staff are indicated by different colored bars.
Table 7. Summary data for CC assessments of IT segments in the Savage Box study area
(presented in Figure 5) independently made by seven field staff. Mean values are in lineal feet,
with Standard Deviation and Min/Max values to illustrate differences among field staff.
Condition
Class
Overall Range
Mean Std Dev Min Max
0 240 124 82 433
1 621 156 448 816
2 853 279 511 1263
3 706 403 43 1431
Totals 2419 510 1922 3306
0
500
1000
1500
2000
2500
3000
3500
0 1 2 3 total
Tota
l Le
ngt
h (
ft)
Condition Class:
Overall
JM
JVH
JW
CC
LP
DS1
DS2

RESULTS
Page 39
Figure 6. Comparison of data for two experienced staff with a 2-class trail depth estimation. Note
lack of agreement in depth classes and segmenting.
Table 8. Summary table comparing trail depth from two experienced staff, including segment
counts and aggregate length by trail depth class.
Trail
Depth (in)
Segment
Count
Aggregate
Length
(m)
Staff
3 – 6 23 552 JW
< 3 68 1446 JW
3 – 6 7 564 LP
< 3 27 1255 LP
Unassigned 8 16 LP

RESULTS
Page 40
Figure 7. Comparison of data from GPS trail mapping and four identical line transects placed
perpendicular to the prevailing direction of visitor traffic for the Savage Box area. Note
comparisons between staff can be made by comparing line or point data from left and right
figures. Comparison of an individual’s assessment of CC during the line transect (point data) can
be made to that individuals CC assessment during trail mapping (line data). Assessments were
conducted independently over a time span of two days.
As a final precision trial we set out 35 flags along an IT segment in Savage Box and had four
field staff assess CC, trail depth, and vegetation cover along transects at each location. Mean data
from this trial are presented in Table 9. These results indicate that field staff are far more
consistent in assessing CC at fixed points along trails. Given the broader range in possible
values, staff assessments of trail depth and vegetation cover for the transects were similarly very
consistent, and considered acceptable.
Table 9. Summary table comparing mean values from independent assessments by four field
staff of Condition Class, trail depth, and trail vegetation cover at the same 35 marked transects
along an informal trail in Savage Box.
Trail Indicator Field Staff
Range LP JVH JM CC
Condition Class 2.1 2.2 2.2 2.2 1-3
Trail Depth (in) 1.1 0.9 0.9 - 0-5
Vegetation Cover (%) 41 44 48 49 3-98
RESULTS
Page 41
After evaluating results from our field work and precision trials, a decision was made to abandon
the CC option entirely and substitute separate quantitatively defined indicators for vegetation
cover and exposed soil, made on- and off-trail at specific sample points, with mid-point values
for percent cover categories used in subsequent calculations to obtain ratio scale absolute
difference measures (i.e., subtracting mid-point tread cover values from off-trail ―control‖ mid-
point cover values). These are presented on the final page of Table 5 and used in our
recommended protocols (Appendix 1).
Several additional complications added to the challenge of developing IT monitoring protocols.
First, IT’s are frequently discontinuous due to their low use and the effects of topography or
woody vegetation on route selection. For example, in open flat terrain ITs frequently disappear
due to traffic dispersion, reappearing when topography refocuses traffic on a common route such
as through a low swale or along flat narrow river bench. Similarly, traffic is also refocused by the
presence of woody shrubs or trees, with trails forming only when traffic passes through woody
vegetation. Discontinuous ITs present two notable survey difficulties. First, field staff must be
adept at searching out discontinuous segments when mapping. Careful attention to the local
topography and vegetation types will generally guide staff to the locations where they can expect
ITs to develop. However, field staff must be very conscientious in keeping track of IT segments
that have and have not been mapped. For example, a comparison of mapping data from two
experienced staff of the same trail network in Figure 7 reveals omissions for several trail
segments.
Secondly, any protocol that requires point sampling at a specified interval cannot easily be
applied to sample discontinuous trail segments. In several high use DENA areas, field staff were
confronted by a network of discontinuous trails which defied traditional trail survey
methodologies. In response, final protocols emphasize census mapping and transect surveys.
Census mapping may still fail to locate and include all ITs, or staff may accidentally omit some
segments (as depicted in Figure 7). A far more reliable method, which we incorporated into the
protocols, is to establish a series of permanent transects that cross the prevailing direction of
visitor traffic. Staff use GPS units to walk each transect, stopping to assess the presence and
condition of all ITs crossing the transect. This protocol is illustrated in Figure 7, where four
transects were established across the Savage Box study area to intersect with the network of
trails trending up and down the sloping meadow. A principle advantage of this method, or any
method that involves trail assessments at sample points along a trail, is that more careful
assessments or measurements can be made at sample point and transects, in comparison to
assessments assigned for trail segments.
A final significant challenge in developing IT assessment protocols for DENA is a substantial
population of large fauna, including caribou and moose which create trails, some of which
visitors may use. This latter challenge created substantial concern and discussion, with two
options considered: 1) assess all trails (wildlife and visitor-created), and 2) omit trails created
and predominantly used by wildlife when certainty is high. Following considerable discussion,
field investigation, and protocol refinements, we recommend the second option and have
developed criteria for increasing the precision of such determinations.
Trails developed and or used primarily by wildlife are indeed different to those who are trained
to observe these subtle differences. First and foremost, wildlife trails generally don’t start at
visitor developments or roads and lead into the backcountry, often splitting and eventually

RESULTS
Page 42
disappearing. Visitor trails also access certain attraction features like vistas, popular destinations
like waterfalls, or follow known routes of visitor use. Such spatial attributes are generally a good
indicator of visitor-created trails. Exceptions that demand caution include wildlife trails that
cross roads or trails, so field staff are cautioned to search the opposite side of the road or trail for
a ―mirror‖ trail of the same general width and condition. Knowledge about the ecology and
natural history of the wildlife can also assist decision-making. For example, sheep trails
frequently descend steeply to cross the road at narrow mountain gaps, while caribou trails
frequently appear as numerous roughly parallel routes through flat to gently sloped terrain.
Moose trails favor areas with willow thickets and evidence of their browsing along the trail is
common. Animal trails often meander while human trails are generally more directionally
consistent over longer distances. Human trails actively seek out and remain within the easiest
topography and vegetation for travel, wildlife trails are generally more haphazard. In areas of
woody vegetation, narrow trails created by smaller mammals can be discounted because they go
directly under branches that would obstruct human passage.
Close inspection of the trail tread can also offer distinguishing criteria. Animal feces/pellets and
hoof or boot prints in or near the trail tread are common and fairly reliable indicators. Hoofs
generally shear off the trail edges, which are often nearly vertical, where the sides of human
trails are more rounded. The width of trails can be an important indicator, wildlife trails are
narrower than human trails (often less than 8 inches). In damp or wet soils wildlife generally
make no effort to detour around wet areas or to step on clumps of higher ground or vegetation,
humans do, leaving trampled and flattened clumps of grasses as evidence of their passing.
Clearly some trails used by wildlife are used by visitors and vice-versa. Their common use on
some portions of ITs could lessen assessment precision and accuracy. However, the concern that
changes in wildlife populations or patterns of movement will confound trail monitoring results
are substantially less when field staff are instructed to omit ITs for which there is relatively high
certainty that wildlife is the predominant use. Assessing all trails could substantially increase
assessment time. Greater accuracy in comparisons over time are permitted by including a Use
Type indicator with categories for: a) human, and b) mostly human/some wildlife. The accuracy
of GPS surveys also allows field staff to return to the same trail and determine, in the field, the
use type assessment from a previously mapped trail segment.
Description of Monitoring Protocols
In this section we introduce and describe each of the following formal and informal trail survey
methodologies included in Appendix 1: 1) Access, 2) Line Transect, 3) Census Mapping, 4)
Point Sampling, and 5) Route Finding Experience. These were experimentally applied at the end
of the survey development process and we include representative data for some to illustrate
possible products from these survey methods. Full datasets from this work are contained in Excel
spreadsheets and ArcGIS databases and will be transferred to DENA staff as baseline data. At
the end of this section guidance on the establishment of monitoring zones and a decision process
for selecting levels of monitoring effort using a decision tree and roundtable process are also
included.

RESULTS
Page 43
Access Survey
Objectives: This survey documents the number and distribution of all ITs that intersect a road or
formal trail corridor. This is an efficient survey method that can be conducted quickly but
doesn’t provide information on trail alignments or destinations. Optional procedures are included
for assessing trail conditions at sample points near the trailhead.
Guidance: This survey could be conducted early in the monitoring process to inform the
roundtable zoning process. Staff training should focus on developing consistent judgment on
when to assess or not assess trace trails, those that are faint or discontinuous – a set of reference
photographs are included to assist in the consistency of these judgments.
The Access Survey is conducted by staff who are familiar with the distribution of
hiking/backpacking use along the Denali Park Road. Likely candidates include Rangers who
routinely patrol the road and/or staff from the Backcountry desk involved with backcountry
permits. Consultations with bus operators to discover popular day-hiking locations are also
helpful. The Denali Road can be assessed by driving to and searching on foot all locations where
human use trails might be expected to occur. Note that trails may depart from locations not
visible from a vehicle, such as 100 ft out along a stream corridor. Ground searches on foot are
focused along the interface boundary between disturbed road corridor vegetation/substrates and
more pristine natural vegetation/substrates.
Detailed procedures are included in Appendix 1 and summarized here. Trails judged to be
predominantly created and used by wildlife are included but omitted from resource assessments
(see special guidance, pg 75, in the protocols). Note that some wildlife trails may occur in areas
that receive regular human use (e.g., near bus stopping or common drop-off locations) – these
should be assessed and labeled as ―mixed human/wildlife use‖). A Trimble GPS with sub-meter
accuracy is used for this survey to obtain accurate spatial data on IT trailheads and to efficiently
enter and transfer optional IT condition assessment data. Data dictionaries for each survey
method were developed and are provided as a product of this research. A ―search log‖ lineal
feature is recorded to document the spatial extent of all ground searches from each monitoring
cycle and point features and oblique digital photographs are collected to document each IT
trailhead. Figure 8 illustrates spatial data from an Access Survey of the initial section of Denali
Rd provided by this procedure. Note the documentation of the searched areas with the search log
feature within the enlarged inset.
A variety of optional condition assessment indicators are included and described. These
indicators include trail width, vegetation and soil maximum incision, vegetation cover on- and
off-trail, bare soil on- and off-trail, and the presence of tread problems like muddiness or active
soil erosion. Soil incision is a traditional measure of soil loss, to which was added a total incision
indicator for assessing the degree to which trampling has also flattened tundra vegetation.
Ground vegetation cover and bare soil cover are assessed on- and off-trail in six numerically
defined categories. Data should be recorded as coverage class midpoint values for analyses, with
subsequent computation of absolute difference values by subtracting trail from trail-side
measures.

RESULTS
Page 44
Figure 8. Access survey data from application along the Denali Road, showing an overview for a
road segment with an enlarged inset view for one trailhead location.
Line Transect Survey
Objectives: This survey finds and documents the number, location, and condition of ITs in areas
near roads and formal trails.
Guidance: Line transect survey (LTS) areas are identified by the roundtable procedure. One or
more line transects are established within these areas roughly perpendicular to the anticipated
direction of travel. All well-defined ITs that intersect with each transect are inventoried as point
features, with assessments of use type, trail width, maximum incision, vegetation cover, and bare
soil (described in the Access Survey section) recorded for each trail. LTS is less labor intensive
than census trail mapping, yet provides accurate and meaningful sample data on trail locations
and conditions for decision-making. A possible exception is when the area to be surveyed has a
higher density of tall brush – consider the Census grid method, described next, for these areas.
Generally, LTS transects are placed close to roads to pick up the start of ITs, at locations where
topography or vegetation constricts traffic, or at more distant points to see if ITs are continuing
into the backcountry. When possible, place an adequate number of transects to generate a
sufficiently large ―N‖ of sample points to characterize IT conditions.

RESULTS
Page 45
LTS areas are defined by polygon layers and transects that are downloaded to the Trimble GPS
units so that field staff can navigate to the start of each line transect and walk along each one as
they look for bisecting ITs. As ITs are found, field staff record location and condition assessment
data for the eight quantitative indicators included as ―optional‖ indicators under the Access
Survey. Figure 9 illustrates the application of the Line Transect protocol to the Igloo Canyon
Lakes area. Data yielded by this procedure includes the number of IT’s that intersect each
transect and how they change over time. For example, assessments for Igloo Canyon depicted in
Figure 9 found a total of 19 IT’s along 10 transects. Data for the IT condition assessment
indicators would reveal improving or deteriorating IT conditions when periodically reapplied.
Figure 9. Line transects applied to the Igloo Canyon Lakes travel corridor with census mapping
of IT’s also shown to illustrate the full distribution of trails. Note presence of a well-used formal
trail and numerous discontinuous ―trace‖ trails of human use or wildlife origin.

RESULTS
Page 46
Census Mapping Survey
Objectives: This survey documents the location, spatial distribution, and lineal extent of all
visually obvious ITs judged to be predominantly human use within selected search polygons
defined by the roundtable review process. Optional procedures are included for assessing trail
conditions if needed. When reapplied over time, census mapping survey procedures allow
managers to accurately track and characterize changes in the number, spatial distribution, and
length of ITs, and optionally, changes in their condition. Data can also be used to help decide
which ITs should be closed and to evaluate the success of management efforts to close selected
trails or prevent the creation of new trails.
Guidance: Census mapping areas (CMA) are identified by the roundtable procedure. All ITs
within each CMA, except those that are extremely faint/discontinuous and those that are ―mostly
wildlife in origin and use, are inventoried as line features, with point features recorded at all
trail/road intersections to aid GIS editing. Discontinuous trails are mapped, provided their
sections qualify under the criteria for assessing IT’s, as described in the Access Survey section
(with ―mostly wildlife‖ trails omitted). Optional assessments of use type, trail width, maximum
incision, vegetation cover, and bare soil (described in the Access Survey section) can be made at
locations where ITs intersect a GIS grid (e.g., 25 or 50-meter grid) superimposed over the CMA
and downloaded for viewing during survey work on a GPS unit.
As previously discussed, our extensive experimentation and refinements of the condition class
rating descriptors did not yield a sufficiently precise assessment option whereby condition
classes could be assigned to IT segments. The alternative recommended in these protocols is to
either apply the line transects to obtain quantitatively assessed tread condition data at each
intersection with an IT, or to apply a grid as an optional procedure in this survey method. Field
staff would glance at their GPS screen during the census mapping and stop whenever the IT they
are following intersected a grid line. Point assessments using the eight quantitative indicators
included as ―optional‖ indicators under the Access Survey would be assessed at each point.
Figure 10 illustrates the Census Mapping protocol as applied in the Tattler Creek drainage (Line
Transects and a 50-meter grid are also shown).
Table 10 reports summary data from the census mapping conducted in Tattler Creek. The
statistics reported can be reassessed over time to evaluate changes in IT networks and the extent
to which trails become continuous across the travel zone.
Table 10. Summary of census mapping data from Tattler Creek.
Informal Trails (#): 184
Aggregate Length: 19,361 ft
Zone Length: 10,535 ft
Longest Continuous Trail: 1,759 ft (17% of zone length)
Breaks to Cross Zone (#): 19
Continuous Trails Crossing the Zone (#): 0

RESULTS
Page 47
Figure 10. Census mapping of the predominantly discontinuous IT’s paralleling the Tattler Creek
drainage with the optional 50-meter grid superimposed for point sampling data collection. These
trails are receiving greater use since the discovery of dinosaur fossils.
Point Sampling Survey
Objectives: This survey provides more accurate quantitative assessments for a variety of trail
condition indicators on selected formal or informal trails whose alignments are relatively static.
Guidance: Managers in the round-table process can identify selected informal or formal trails
for which more accurate data are required, perhaps to evaluate their condition in relation to
standards of quality or evaluate the efficacy of management actions. Prior to fieldwork,
managers must define the beginning and endpoints of each trail segment to be assessed and the
point sampling interval (e.g., 200 or 300 ft). Sample points can be generated with a VB script
(Points on Poly) with a GIS, incorporating a random start. The selected sample points are then
downloaded to a GPS device with sub-meter accuracy and field staff can navigate to these same
sample points during each monitoring assessment to assess tread conditions.
Figure 11 shows a well-used and eroded fall-aligned trail ascending Primrose Ridge, with data
yielded by the Point Sampling survey presented in Table 11.
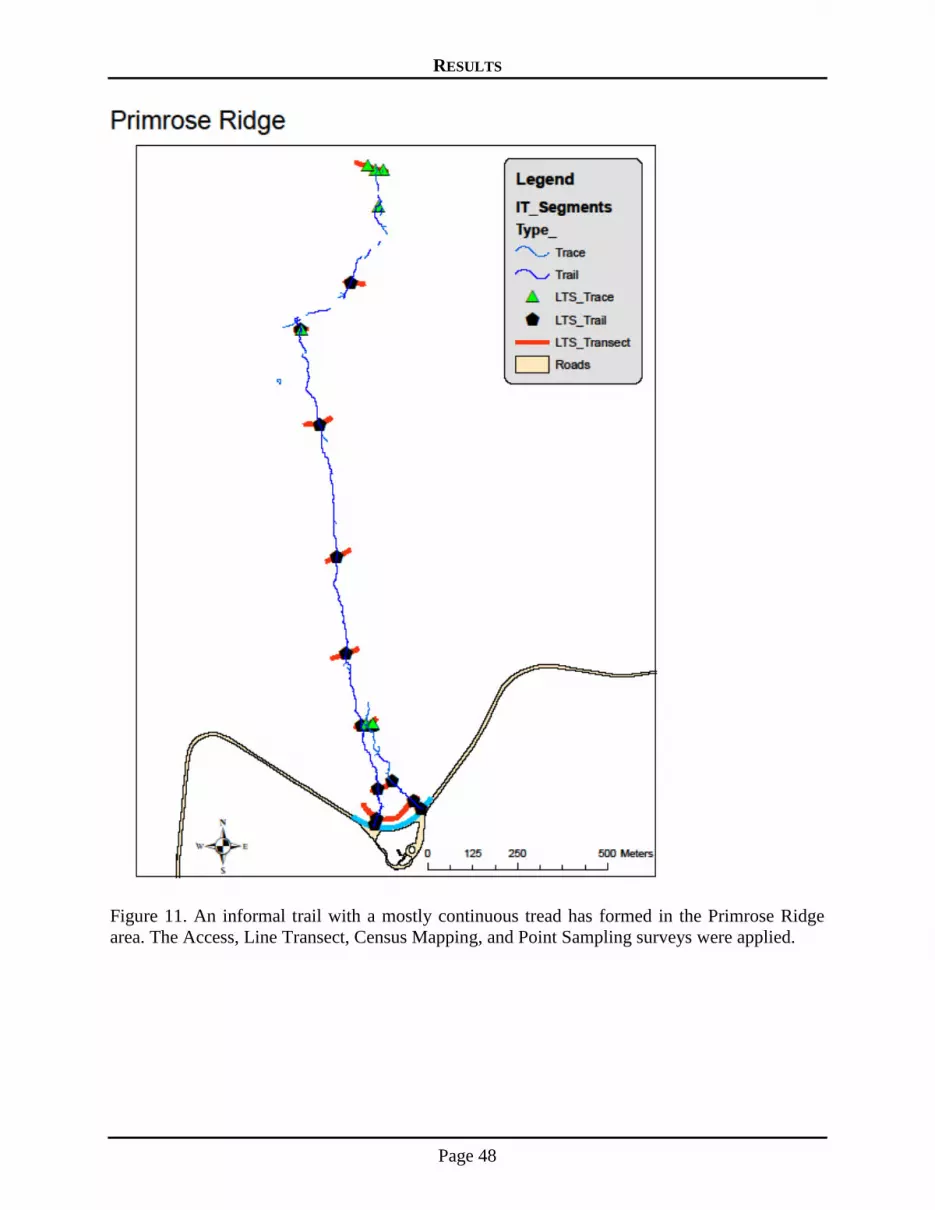
RESULTS
Page 48
Figure 11. An informal trail with a mostly continuous tread has formed in the Primrose Ridge
area. The Access, Line Transect, Census Mapping, and Point Sampling surveys were applied.

RESULTS
Page 49
Table 11. Point Sampling survey data provide descriptive quantitative data for a number of trail
condition indicators.1
Measures Trail
Width (in) Total
Incision (in) Soil
Incision (in) Vegetation
Loss (%) Soil Exposure
Gain (%)
Mean 15.6 4.8 2.7 67.3 75.2
Max 21 11 6.7 83 95.5
Min 11 0.7 0 13 12.5
1 - These data are based on 25 sample points. Absolute difference (AD) values are present for vegetation loss and
soil exposure gain, computed by subtracting trail transect mid-point cover class values from off-trail ―control‖ mid-
point cover values. AD values provide an estimate of change from pre-trail conditions.
Route Finding Experience Survey
Objectives: This survey is used to inventory the hiker’s Route Finding Experience (RFE) as they
move through backcountry travel corridors identified by the roundtable. Data is used to inform
and direct future monitoring decisions (e.g., data showing that it is easy to travel through an area
on trails might suggest the need for LTS or CMA mapping). These data inform managers about
the degree to which visitors engage in active route finding decision-making while hiking, as
opposed to traveling along a visually obvious trail for long distances.
Guidance: Survey is to be performed by backcountry staff and/or visitors who are given Garmin
GPS units. A timer will signal data collection every 15 minutes. The data collector may also
collect a data point whenever they feel their RFE has changed from one ―level‖ to another.
RTE Class Descriptions
Class R1 - I am spending more time off trails than on trails. It is difficult to piece together trails
or routes that take me in the direction I want to travel and bushwhacking is often required.
Class R2 - I am walking on a trail most of the time, but I have to remain alert and make frequent
choices about which trails to follow. Occasional short trail gaps may exist and periodic
backtracking and/or bushwhacking are required.
Class R3 - I am generally always on a trail, and can easily navigate along trails in the direction I
want to travel.
Figure 12 illustrates the application of the Route Finding Experience survey to a backcountry
hike from Savage Box to Mount Margaret and back to the Denali Road at Primrose Ridge.

RESULTS
Page 50
Figure 12. Route Finding Experience survey applied to a backcountry hike from Savage Box to
Mount Margaret and back to the Denali Road at Primrose Ridge.
Legend: Red – R3, trailed experience, trail(s) clearly visible, no difficulty following route
Blue – R2, mixed experience, trail becoming discontinuous
Gray – R1, trail-less experience, route finding skills needed
ESTABLISHING MONITORING ZONES
The spatial distribution of visitation can vary substantially within protected natural areas, ranging
from very high near popular attraction features to very low in remote inaccessible areas. The
establishment of monitoring zones can help designate the priorities and intensities of trail
monitoring efforts. The most remote areas require no monitoring effort if there is good reason to
believe that no visitor-created trails exist. In contrast, areas near roads, campgrounds, or other
facilities may have or could develop dense networks of human trails that require more intensive
monitoring. Therefore, an initial step in the trail monitoring effort is to establish zones to
prescribe trail monitoring effort, from none to intensive. The following section describes a
process for accomplishing this objective, though it is expected that over time, and as data is
collected, that such monitoring guidance will be updated and revised.

RESULTS
Page 51
Levels of Monitoring Effort
The type of trail monitoring employed will depend on the existing and expected number, extent,
and condition of trails. Higher levels of monitoring effort will generally be applied to areas and
trails that receive more intensive use and impact. Several types of trail monitoring protocols are
recommended, which are listed here and fully described in later sections.
No trail monitoring within remote/inaccessible areas.
Access survey – This method provides an efficient census of all ITs leaving a road or
formal trail corridor, documented by point data. The condition of IT segments can also be
optionally assessed.
Line transect survey – This method provides IT condition data assessed along one or
more transects arranged perpendicular to the prevailing direction of travel within travel
corridors. IT locations are depicted by point data for each transect/trail intersection.
Census mapping survey – This method provides comprehensive mapping data for all ITs
within a defined monitoring area, or an intelligent search through a travel corridor. The
condition of IT segments can also be optionally assessed.
Point sampling survey – This intensive survey method provides more comprehensive
quantitative condition data taken at regularly spaced points along well-established formal
or ITs.
Route finding experience survey – This method is an opportunistic assessment of the
trail-less experience applied by visitors or backcountry staff during backcountry hikes.
Regardless of the protocol used, they should be replicated periodically (e.g., every 3-10 yrs) to
document change over time. Furthermore, surveys should only be conducted in the last half of
the summer use season when evidence of human use on trails is most pronounced.
Monitoring Zones
The geography and probable use patterns of the protected area are used to define trail zones.
These can be organized by distance from roads and expected impacts.
1. Infrastructure areas (roads, parking areas, visitor centers, remote airstrips, buildings, etc.)
2. Frontcountry nodes (dense networks of trails leading from infrastructure areas to
attraction features)
3. Road corridor areas with trails expected
4. Road corridor areas with no trails expected
5. Closed areas (e.g., wildlife closures)
6. Well-used formal or informal trails with static alignments
7. Backcountry travel corridors with likely trail formation to attraction features
8. Backcountry travel corridors with no trail formation expected
9. Remote/inaccessible areas

RESULTS
Page 52
Figure 13. Suggested informal trail monitoring decision tree. Initial monitoring strategies are to
be selected by roundtable discussion and zoning of the park by managers and staff.
Zone Establishment with a Roundtable Process
The key to establishing the zones is to collect data on known and suspected areas of trail
establishment. Gathering a group of the most relevant and experienced staff to have a roundtable
discussion and draw lines on maps is a useful method. Other data sources are hiker contact
locations from backcountry patrols; interviews of visitors, local guides, hike leaders; a survey of
access points along roads; previous trail monitoring data, a plot of the hikes listed in guidebooks;
trip reports on the web; and special destination or attraction feature points.
Data from the roundtable effort could be assembled into GIS layers to show discrete areas of
probable human trail development defined by mapped polygons. Each polygon is assigned an
initial level of trail monitoring (type, intensity, and priority). Additional layers include known
and suspected trails and access points, formal trails, developed sites (roads, parking areas,
administration areas, campgrounds, ranger stations, etc.) and closures.
In monitoring zones 1, 4, 5, 8, and 9, trail monitoring will generally not be conducted, except as
captured through the roadside access survey. For the remaining zones, roundtable staff will need
to decide between four types of monitoring (Figure 13). Generally, the route finding assessments
are applied only to zone 7, backcountry travel corridors with likely trail formation. Similarly,
point sampling is applied only to zone 6, well-used formal or informal trails with static
alignments. For the remaining zones, 2, 3, and 7, line transect surveys are generally
recommended as the most appropriate and efficient first step for areas that require some level of
monitoring beyond the roadside trail survey. This survey requires about 25-35% of the time
required to conduct the more comprehensive trail census mapping, which is generally more
appropriate for high-use areas with dense networks of ITs. However, where time permits,
managers may also find that trail mapping provides useful information for documenting longer
ITs that do not occur in areas of dense trail networks.

RESULTS
Page 53
In considering whether to monitor an area or the type of monitoring to apply, consider both
existing conditions and expected changes in use or management actions. For example, areas with
few trails that are in acceptable condition may be less important to monitor, though documenting
baseline conditions even for such trails remains an important management objective. However,
areas with few trails in poor condition or areas expected to see increased use or where
management actions are likely will generally be areas of higher priority monitoring. The
monitoring process should be a key component of adaptive management decision making.
As trail monitoring data is collected, the boundaries between the zones can be adjusted. For
example, increased use in an area may lengthen trails that then allow day hikers to move further
away from roads over time. This would extend the outer boundary of monitoring zones—with an
accompanying change in monitoring prescription.
CONDUCTING MONITORING
The full set of monitoring protocols are included in Appendix 1 for easy extraction and use.
Paper copies of the field protocols should be photocopied onto waterproof paper and carried by
field staff to consult. A listing of field equipment needed for each protocol is included for
reference and should be checked by field staff prior to departure. Appendix 2 contains an
overview of the monitoring workflow process, including a section on pre-fieldwork setup tasks.
For example, most protocols require that the GPS units contain data dictionaries or background
datasets such as search areas or line transects.
Following the completion of fieldwork, Appendix 2 also includes recommended data post-
processing tasks and protocols for file naming and long-term storage. Monitoring data analysis
tasks are also listed.

Page 54
DISCUSSION
Research Challenges and Solutions
Denali National Park and Preserve has a ―unique status as a park that offers an undeveloped
Alaskan wilderness park experience distinct from the wilderness and park experience in the other
states‖ (NPS 2006a). The DENA Backcountry Management Plan (BMP) (NPS 2006a) highlights
the park’s ability to provide:
―…superlative opportunities for primitive wilderness recreation. Outstanding cross-
country hiking, backcountry camping, and winter touring possibilities are available
for those willing to approach the area in its natural condition. This huge park
contains large areas with almost no trails and where evidence of human use is
minimal to nonexistent. These conditions are in contrast to most wilderness areas in
the contiguous 48 states where maintained trails, designated campsites, footbridges,
and signs are standard. These conditions also contrast with much of Alaska, where
similar opportunities abound, but are very difficult to reach. A large portion of
Denali’s backcountry is readily accessible to visitors who can reach the park by
either highway or railroad from either Anchorage or Fairbanks—Alaska’s two cities
and major connection points for out-of-state visitors.‖
This report presents Denali National Park staff with a flexible array of trail survey protocols for
assessing and monitoring resource and experiential conditions on informal and formal trails.
Given that the park is predominantly managed as ―trail-less‖ wilderness, the management vision
for backcountry and wilderness visitation promotes self-reliant route-finding, as opposed to
travel along a continuous trail from a departure point to destination. According to the
Backcountry Management Plan: ―backcountry access and travel in Denali will continue without
designated routes or constructed trails to allow for freedom to explore and to minimize signs of
human presence.‖ However, heavier visitation in some areas, particularly by day users, continues
to create IT networks that appear to be expanding over time. Managers require the ability to
document the extent to which visitor-created trails are appearing and expanding and of changes
in their tread conditions. Periodic application of monitoring protocols can inform management
decision-making by providing quantitative data for a variety of indicators. Managers could
evaluate these changes, compare them to management objectives or numerical standards, and
implement visitor or resource management actions to avoid or minimize them.
This research faced a number challenges: 1) protocols had to be flexible and highly efficient due
to limited staffing and budgets, 2) traditional trail survey methods have been developed for
single, well-used/discerned, continuous trails, rather than lightly used, discontinuous, braided
trail networks, and 3) some wildlife create trails that can be confused with visitor-created trails.
To address these challenges we developed a ―toolbox‖ of IT monitoring protocols, allowing
managers to select from these only those trail survey options and indicators that address their
information needs, which may additionally vary by management zone. A roundtable decision
tree process (Figure 13) was developed to assist managers in selecting the most appropriate
protocol(s). The most efficient of these, the Access Survey (Figure 8), documents the number
and distribution of IT’s that intersect the Denali Road, or a formal trail. All protocols incorporate

DISCUSSION
Page 55
GPS technologies to increase their efficiencies and accuracy and facilitate quick computer input
of spatial data for storage, analysis, and mapping.
For assessing IT conditions our work sought originally to incorporate highly efficient condition
class ratings, based on qualitative descriptive ratings of progressively greater levels of trampling-
related groundcover impact. We developed, applied, evaluated, and revised several iterations of
IT condition class descriptors, incorporating more quantitative criteria in an effort to perfect a
rating system applicable to a variety of DENA environments. Our results primarily pointed out
the inherent difficulties associated with any effort to apply such ratings when staff are moving
and/or to assess segments of trails. Experimental trials documented unacceptable levels of
precision (consistency) between field staff. Precision was also poor when assessing only two
levels of a quantitatively defined trail incision indicator, reinforcing our conclusion that
condition assessments should be made only at specific points or transects, rather than while
conducting walking surveys and assessing segments of trails.
We achieved higher, acceptable, levels of precision when field staff were directed to make
condition class and quantitatively defined indicator assessments at specific points along trails.
However, we conclude that quantitatively defined indicators of trail tread and undisturbed
trailside conditions provide more informative, accurate, and precise information with a very
limited increase in assessment times. Experience has shown that the most substantial amount of
field time is devoted to traveling rather than assessment time, so we judge the additional time as
acceptable. As an example, we replaced condition class ratings with quantitatively defined
conditions for vegetation and exposed soil cover on- and off-trails and computation of absolute
difference values. This approach has the advantage of providing more flexible ratio scale data
that is less limiting when conducting relational analyses, statistical testing, or quantitative
comparisons to formal indicator standards, if developed.
The challenge of monitoring IT networks with discontinuous trails is best overcome through
reliance on survey options that focus on their trailheads, where use is generally highest and most
concentrated, and on permanent line transects perpendicular to the prevailing direction of travel.
Census mapping of IT’s can also be helpful, particularly if staff are well-trained and thorough.
Traditional point sampling trail survey protocols are more problematic, particularly given the
time required to search out if or where a surveyed trail might reappear, or deciding which braid
to continue surveying if multiple trails are present.
This research also had to adequately address the challenge of monitoring IT networks in areas
with large fauna, which also create and use ITs. When assessing visitor-associated trampling
impacts an objective is to minimize assessment protocols that would be affected by changes in
wildlife populations or their geographic patterns of use. As previously noted we considered two
options: 1) assess all trails (wildlife and visitor-created), and 2) omit trails created and
predominantly used by wildlife when certainty is high. Following considerable discussion, field
investigation, and protocol refinements, we opted for the second option and developed criteria
for increasing the precision of such determinations. A Use Type indicator was incorporated
within the protocols, with categories for: a) human, and b) mostly human/some wildlife. The
accuracy of GPS surveys also allows field staff to return to the same trail and determine, in the
field, the use type assessment from a previously mapped trail segment.

DISCUSSION
Page 56
This decision was a difficult one and early in the fieldwork, staff clearly had difficulty
distinguishing the predominant use of trails receiving mixed human and wildlife use. As a
general practice we opted to instruct field staff to include and assess trails for which they could
not determine a ―predominant‖ use. As fieldwork progressed we continually refined our
guidance and discovered an array of reasonably reliable criteria for differentiating wildlife trails
from those used predominantly by humans. Any procedure that permits such judgments will
inevitably introduce some measurement error into the monitoring assessments and temporal
comparisons. However, some areas do have large numbers of wildlife trails and their
assessments would substantially slow field staff in the collection of unnecessary data that could
also confound subsequent analyses.
Monitoring Protocols
A flexible array of monitoring protocols were developed, field tested, and refined. As
recommended in the current DENA BMP (NPS 2006a), a ―social trails working group‖ should
be created to develop coordinated actions that address IT creation and proliferation. This group
can also evaluate IT monitoring needs, identify management zones and monitoring protocols to
be implemented within each zone, and guide the application of the monitoring program and
subsequent reporting and use of data.
While the five types of monitoring protocols can be flexibly applied on an ―as needed‖ basis,
there is some benefit to obtaining sufficient funding to more comprehensively apply an array of
protocols when initiating the program to establish baseline conditions for future comparisons.
For example, there would be substantial benefit to a comprehensive application of the Access
survey along the entire 92 miles of the Denali Road, with subsequent data summaries and GIS
mapping to examine the current number and distribution of ITs throughout the park. This might
also be combined with Line Transect surveys at selected distances (e.g., 100, 1000, and 2500 ft
from the Denali Road) for perhaps 15-25 of the major travel corridors leading away from the
road.
Following this initial survey, Census Mapping might be applied to a selection of travel corridors
containing the most developed IT networks. Based on Line Transect data, Point Sampling could
be applied to a selection of formal trails or ITs found to be particularly wide, eroded, or muddy.
The outermost band of Line Transect data might also be evaluated to identify which travel
corridors retain one or more ITs leading into the Wilderness. These corridors might then be
targeted for the Route Finding Experience surveys. Other topics for consideration are the need
for quantitative indicators and data required by future decision-making, or planning related to
VERP carrying capacity processes.
Informal Trail Management Strategies
A range of management strategies and actions to avoid or minimize visitation-related resource
impacts are available to protected area managers, including the development of formal trail
systems allowing visitor access within road-less natural areas. In moderate to high use zones
managers generally provide formal trails as part of a ―containment‖ strategy that minimizes the
aggregate areal extent of visitor impacts by concentrating traffic on durable tread surfaces
(Hammitt & Cole 1998, Leung & Marion 1999c). Formal trails are generally designed,
constructed, and maintained to accommodate intensive recreation traffic while minimizing

DISCUSSION
Page 57
trampling-related impacts. This strategy is based on a well-documented asymptotic use-impact
relationship, whereby a majority of trampling impact occurs with moderate levels of traffic, and
diminishing additional impact as traffic levels increase further (Cole 1992, Leung & Marion
2000, Newsome et al. 2002). Thus, confining trampling impacts to a limited network of formal
trails avoids more widespread degradation caused by less structured patterns of visitor activity
and traffic.
In higher use areas managers are frequently challenged by the development of informal (visitor-
created) trails, and whether their use should be discouraged, prohibited, or tolerated. ITs that
develop as shortcuts or duplicative and alternate routings, or traverse areas of sensitive habitat,
rare species, or archaeological sites, are generally considered to be unacceptable (Table 12).
However, ITs created to access attraction features or points of interest, like climbing and fishing
spots not accessed by formal trails, or through areas of constricting topography, like a narrow
mountain pass, are often acceptable. In keeping with a containment strategy, use of these ITs
prevents the occurrence of more widespread impacts. However, sometimes ITs can proliferate
into dense networks of duplicative routes with substantial amounts of trampling damage and
―avoidable‖ impact. For example, an IT study at Potomac Gorge near Washington D.C. mapped
9.9 mi of ITs (46,663 ft2 of trampling disturbance) on the highly visited Bear Island (Figure 3),
which also has 2.0 mi of formal trails (Wimpey & Marion 2011b).
In low use zones, managers frequently implement ―dispersal‖ strategies designed to prevent the
occurrence of visitor impacts (Hammitt & Cole 1998, Leung & Marion 1999c). Land managers
seek to avoid the occurrence of ITs by promoting low impact outdoor practices such as those
developed by the national Leave No Trace (LNT) program (www.LNT.org). Visitors are asked
to disperse all activities on the most durable natural surfaces available to avoid or minimize
trampling-related impacts. A common management objective in these zones is to keep them trail-
less, preserving a natural landscape with no visible human impact.
Table 12. Impact management strategy by use level and zone, with characterizations of the
acceptability to management of different informal trail (IT) types.
Impact Management
Strategy
Containment
Mod-High Use Zones
Mixed
Transition Zone
Dispersal
Low Use Zone
Formal Trails Acceptable Often Acceptable Unacceptable
Shortcut/duplicative IT’s Unacceptable Unacceptable Unacceptable
IT’s in sensitive/rare spp. habitat Unacceptable Unacceptable Unacceptable
IT’s to points of interest Acceptable Often Acceptable Sometimes Acceptable
IT’s in constrictive topography Acceptable Often Acceptable Sometimes Acceptable
Unfortunately, management experience with the dispersal strategy has revealed a number of
challenges that limit its effectiveness, including: 1) visitation levels that are too high to support
effective dispersal, 2) limited availability of highly durable surfaces, 3) topography or vegetation

DISCUSSION
Page 58
that constricts traffic to common routes, and 4) inadequate educational programs that fail to
communicate when and how activities should be dispersed, what durable surfaces are, and a
compelling rationale for practicing dispersal. Educational programs rarely reach all visitors and
communicating when they should use formal trails, informal trails, or disperse their traffic can be
difficult. Encouraging visitors to forgo an IT for more challenging dispersed travel can be
equally difficult, particularly when topography or woody vegetation conspires to constrain route
selection to a river-side bench or mountain pass. Even the presence of a faint or discontinuous IT
leading toward a destination or point of interest will attract visitors and act to reduce dispersal
compliance.
Recreation ecology research has demonstrated that trails can develop at relatively low levels of
traffic on less resistant and resilient vegetation and soil types (Cole 1987, 1995a,b, Marion &
Cole 1996). ITs that develop in low use zones managed under a dispersal strategy are generally
unacceptable (Table 12). Exceptions could include IT development to or near attraction features
or in areas where topography or vegetation constricts traffic. In these areas, trails are created
when visitor traffic is unavoidably concentrated to a level that exceeds the tolerance of native
substrates to sustain it. Potential management responses include: 1) discourage or limit use of the
area, 2) enhance education efforts to promote greater dispersal, 3) implement site management to
close and restore ITs, 4) tolerate and/or encourage IT use to avoid development of additional
trails, or 5) design and construct resistant formal trails (generally inappropriate). A principal
management challenge with options 4 and 5 is providing visitors with a consistent educational
message regarding when to disperse activity or use a formal or informal trail. Historically,
DENA staff have relied principally on use limitations, and to a lesser extent on education, to
limit IT development. These topics are addressed further in a following section.
Transition zones between accessible high use areas and remote low use areas frequently present
the greatest challenges to protected area managers, as neither a containment or dispersal strategy
is entirely appropriate or effective in managing visitor impacts. Formal trails could be developed
to sustain traffic to points of interest or through areas of constricted topography, but these may
be viewed as inappropriate developments in some backcountry or wilderness settings. Managers
are often willing to accept the creation and use of some ITs, provided they don’t proliferate into
duplicative routings, impact sensitive areas, or include particularly impact-susceptible
alignments (Table 12). Recent research reveals that visitors often choose less sustainable trail
alignments and can create unnecessarily duplicative networks of trails that entail a substantial
amount of avoidable impact (Leung et al. 2011, Wimpey & Marion 2011a). Furthermore, visitors
may have difficulties distinguishing formal trails from ITs, and in deciding when to use trails or
to disperse their traffic. A preferred strategy for transition areas might be to tell visitors to use
well-established trails (formal or informal) when available (avoid faint trails to promote their
recovery), and to disperse traffic when off-trail. Managers could then perform site management
actions to close and restore inappropriate or duplicative ITs and faint trails.
Visitor Management Options
Denali National Park managers can influence backcountry visitation-related resource impacts by
regulating or educating visitors. Backcountry overnight visitation at DENA experienced
substantial expansion in the 1970’s, from 5,491 in 1971 to 30,334 in 1980 (NPS, 2011). Since
then visitation has stabilized, ranging from 32,579 in 2000 to 38,625 in 2010. Approximately
half of this visitation occurs on Mount McKinley and half is comprised of

DISCUSSION
Page 59
backcountry/wilderness backpackers. Data on visitors who day-hike in the park is not collected,
though a park study provided an estimate of 48,000 day-hikers in 1978 (Womble 1979).
To regulate backcountry visitation, the 1976 Backcountry Management Plan (BMP) established a
system of backcountry units and assigned use limits ranging from 2 to 12 overnight visitors/night
to each one. The extremely low use limits were developed based on considerations related to
preserving outstanding opportunities for solitude and the prevention of IT and campsite
development. We suspect that this regulation has been the single most effective management tool
acting to limit the formation and proliferation of ITs. However, day-hiking visitation, which may
be rising over time, is likely responsible for some IT formation in frontcountry areas near the
Denali Road and possibly in transition areas leading to the backcountry. Other relevant
regulations include a group size limit of 12 (6 in two areas) and a mandatory but free permit
system for backpackers, primarily for the educational opportunities it affords. The plan also
states that ―Commercial and non-commercial groups will be required to have a group leader who
is trained in Leave No Trace principles for tundra environments generally and Denali National
Park and Preserve in particular.‖
DENA managers have adopted Leave No Trace (LNT) educational messages to educate
backcountry visitors, using the following media: websites, visitor centers, printed media,
personal contacts, and a Backcountry Information Center (BIC) where permits are provided. All
backcountry visitors are required to watch an informative 30-minute video program presented at
the BIC, where staff also provide additional LNT information and provide printed guidance.
However, a review of educational messaging available at the website, in the BIC, and in the
Backcountry Orientation Video (required viewing by backcountry overnight visitors), reveals
that very little information specifically addresses low impact practices related to avoiding the
creation of ITs. The main thrust of the current educational program is visitor safety, primarily
related to bears, weather and navigational preparedness, and stream crossings.
The 2006 BMP (NPS 2006a) directs park staff to ―Develop Leave No Trace guidelines that are
specific for Denali National Park and Preserve…‖ a task which we support and provide
additional suggestions for in this section. We also note that the national LNT program has
developed an Alaskan Tundra Skills & Ethics booklet (not referenced in the BMP), and during
this study and collaborations with ANWR staff we have concluded that there is a need for
revising the current booklet with improved guidance based on the results of this study and recent
management experience. A suggested ―first draft‖ of LNT practices for avoiding the creation of
ITs based on a dispersal strategy is included in Figure 14.
In addition to improving the guidance and specificity of LNT educational practices related to
avoiding IT creation and use, another salient management challenge is the effective
communication of LNT messages to day-hikers, who do not require use permits and rarely visit
the BIC. A suggested option is preparation of a ―Day-hikers Brochure‖ which could be available
at visitor centers and distributed by bus drivers to passengers who plan to hike away from the
Denali Road and formal trails. We suspect that an effective educational program could be
established directing backcountry campers and serious day hikers to use formal and ITs when in
high traffic Denali Road corridor areas and to disperse their use in most situations outside such
areas. Less serious day hikers, primarily sightseeing bus riders, should likely simply be asked to
use available trails. We doubt that it would be effective to direct these hikers to disperse their
hiking activities.

DISCUSSION
Page 60
Figure 14. A suggested ―first draft‖ of revised Leave No Trace practices for avoiding the creation
of ITs based on a dispersal strategy.
LEAVING NO TRACE OF YOUR VISIT IN DENALI NATIONAL PARK
Denali National Park is managed as a six million acre trail-less wilderness, where formal trails are not
provided and managers actively seek to prevent the creation and proliferation of informal (visitor-created)
trails. The management objective is to preserve opportunities for visitors to experience a remote and
pristine Alaskan landscape influenced only by natural processes. When traveling through the Denali
wilderness you will need to develop and apply navigational and route-finding skills and much of your
cross-country hiking will be ―off-trail.‖ While wildlife trails may occasionally be found and used, an
important management goal is to not ―link them up‖ as a continuous trail network. That would
compromise the unique Denali wilderness experience that few U.S. parks are capable of providing. Be
aware that cross-country navigation will substantially slow your hiking speed and is physically
challenging, so allow ample time to reach your destination. The information and guidance below is
provided to help you ―Leave No Trace‖ of your Denali National Park visit. Accept the personal
responsibility to help us achieve our stewardship objectives so your grandchildren can experience a
pristine Denali wilderness when they visit.
DISPERSE YOUR ACTIVITY IN PRISTINE AREAS
Will your recreational visit require off-trail travel? If not, then stick to formal marked trails and recreation
sites in developed park areas. Recognize that the resource impacts of your visit on formal trails and sites
are quite low; when you venture away from these resistant trails and sites your potential for harming
natural resources is substantially higher. Accept the personal responsibility to ―Leave No Trace‖ of your
visit if you must venture away from formal trails and recreation sites.
You may encounter informal (visitor-created) trails and sites, often only distinguishable from their formal
counterparts by their lack of blazes, markings, or signs. Understand that off-trail traffic frequently leads to
the proliferation of these informal networks of trails and sites. Furthermore, studies show that visitor-
created trails and sites are more susceptible to resource impacts because they lack professional design,
construction, and maintenance.
If your visit includes travel into low-use pristine areas, or far from formal trails and recreation sites in
popular areas, disperse your footsteps and activities to avoid repeat traffic and visible impact. If each
person takes a slightly different route, a distinct trail won’t form because no single plant receives multiple
footfalls. Your objective in these areas is to avoid concentrated hiking or recreational activity that leaves
visible impact to plants and soils. Do not use informal trails or recreation sites, including those that are
lightly impacted, to promote their recovery. Research shows that even a few passes by hikers or more
than one night of camping can substantially delay their recovery to natural conditions.
The degree of dispersal needed depends on the substrates your group encounters. Rock surfaces that lack
plant or lichen cover can tolerate concentrated traffic, as can barren gravel shorelines or dry washes, and
snow or ice. Walking single file is acceptable only where there is little chance of trampling plants. If you
must travel or camp on vegetation, look for dry grassy meadows and tundra – grasses have flexible stems
and leaves that resist damage and recover quickly. In contrast, low woody shrubs and broad-leafed herbs

DISCUSSION
Page 61
are highly susceptible to trampling damage – avoid these. When in doubt, periodically examine the effects
of your group’s passage and minimize visible impact by increasing dispersal or use of durable surfaces.
Even low or inconsistent traffic along the same routes can lead to the development of trails. Cross-country
hikers will discover that topography and vegetation often acts to concentrate their traffic to common
routes with fewer obstacles. Resist this tendency if you see any evidence of trail formation and keep your
group broadly dispersed, with single file traffic only on durable rock, gravel, or snow surfaces. Recognize
that dispersed off-trail travel requires constant route-finding vigilance and is considerably slower and
more difficult than hiking on trails. Plan your schedule to allow plenty of time for off-trail hiking! Failure
to disperse your group’s traffic will accelerate the formation of continuous trails that will attract further
use and impact.
Dispersed Camping. In pristine areas, minimize camping impacts by selecting the most resistant site
available and staying only one night. Avoid any pre-existing camping spots to promote natural recovery.
When possible, also avoid areas highly visible to others, vegetated shorelines, and areas with bird nesting
activity or recent signs of wildlife. Locate your cooking area on the most durable site available, like a
large rock slab, gravel, or barren area. Unless durable surfaces are available, prevent trail creation by
limiting the number of trips and varying your routes to water, sleeping, and cooking areas. Monitor the
effects of your activities, concentrating use on the most durable surfaces or dispersing your activities—
whatever’s necessary to avoid creating lasting impact.
Before departing, naturalize and disguise the site—your objective is for no one to see or use the site again.
Fluff up flattened vegetation and organic material and replace any rocks or sticks you may have moved.
Add leaf litter or pine needles to any scuffed up areas. If available, place a small log or large branch
across your tenting and cooking areas to deter future use. Almost any forested setting can accommodate a
single night of use each year without showing permanent effects; grassy areas can handle several nights.
If you need to stay in one area longer, for example to conduct a wildlife study, plan on moving your
campsite when lasting vegetation or soil impacts begin to show.
Also included in the 2006 BMP is guidance directing park staff to form a ―social trails working
group…to address specific problem areas through coordinated action‖ (NPS 2006a). An Access
Management tools table was included to provide more specific guidance for addressing
anticipated situations (Table 13). The development of improved LNT practices related to
discouraging IT creation and the targeting of day-hikers should substantially aid management
efforts selected for implementation by the working group.
Site Management Options
Research suggests that the efficacy of IT management efforts is enhanced by integrating visitor
education and site management actions For example, a well-used informal trail provides a strong
visual ―releaser-cue‖ to visitors, inviting its use even though educational efforts may have
effectively communicated to visitors that they should disperse their traffic (Hockett et al. 2010).
Research has found that visitors are more likely to engage in inappropriate behavior if they see
others engage in similar behavior (Gramann & Vander Stoep 1987, Reiter & Samuel 1980), or in
this case see evidence that others have used in IT. It follows that management efforts designed to
make ITs less visible to visitors would be expected to further reduce their use and enhance
natural recovery.

DISCUSSION
Page 62
Table 13. Access management tools included in the 2006 DENA BMP.
Research at Potomac Gorge near Washington, D.C., investigated and documented the efficacy of
educational and site management options (Hockett et al. 2010). In an experimentally designed
study, one treatment posted educational signs asking visitors to remain on a formal trail, along
with small symbolic prompter signs attached to logs placed across all ITs branching off of the
formal trail. A second treatment brushed up the initial visible portions of ITs in an effort to
disguise them, or at least make them appear as low use trails. The educational sign treatment
reduced observed off-trail traffic from 30% to 6.5% and adding the brushing treatment further
reduced the off-trail rate to 2.0%. The brushing work in this study consisted of adding organic
leaf litter to the trail treads, along with a few sticks and rocks. The intent was to naturalize the
ITs appearance, rather than physically obstruct traffic. This was done because the objective was
to protect native vegetation and rare plants – previous studies that used substantial brushing to
obstruct IT use found that many visitors simply went around the obstructions, creating new trails.
This was particularly true when the intent of the brushing treatments was not explained through
educational signs (Johnson et al. 1987). Some visitors actively removed the brush.
The implications of these studies for DENA staff are that they could enhance the effectiveness of
educational actions by adding or expanding efforts to conduct physical trail closure work.
However, in many DENA environmental settings there is little organic litter or brush available to
place on ITs and in some settings this action could make ITs intended for closure more visually
obvious. This is likely acceptable as long as the work clearly communicates that the actions are
intended to close the trails to use. For example, at Acadia NP managers have had success
concentrating traffic on preferred sustainable ITs by clipping woody shrubs to keep them open
and placing the clipped materials on adjacent duplicative ITs to discourage their use (Figure 15).

DISCUSSION
Page 63
This could be an effective practice in higher traffic areas where duplicative trails have
developed. Further development and experimentation with alternate site management treatments
is needed at DENA to identify effective practices. In non-wilderness areas we suggest such
experimentation might include educational signs and/or symbolic prompter signs (Figure 15).
Finally, as noted in previous discussions and recognized by DENA staff in Table 13 guidance,
managers will need to make determinations of when traffic should be focused on ITs, with
closure of near-by duplicative ITs, and when visitors should be directed to disperse all traffic.
Making these decisions and communicating appropriate site specific guidance to visitors will be
a significant ongoing challenge. We suspect that in the Denali Road corridor, site management
actions and signs may both be necessary for the effective closure of ITs.
Figure 15. Example of a recommended 3x4 inch prompter sign to deter IT use, and illustration of
effective brushing work from Little Moose Island, Acadia NP.

Page 64
LITERATURE CITED
Abele, G. 1976. Effects of Hovercraft, wheeled and tracked vehicle traffic on tundra. In: Nat Res
Counc Can Assoc Comm Geotch Res., Tech Memo 116: 186-215.
Abele, G., Brown, J. & Brewer, M.C. 1984. Long-term effects of off-road vehicle traffic on
tundra terrain. J. Terrain Mechanics 21(3): 13-27.
Adkison, G.P. & Jackson, M.T. 1996. Changes in ground-layer vegetation near trails in
Midwestern U.S. forests. Natural Areas Journal 16: 14-23.
Aust, M.W., Marion, J.L. & Kyle, K. 2004. Research for the development of Best Management
Practices for minimizing horse trail impacts on the Hoosier National Forest. Virginia
Tech, Dept. of Forestry, Final Research Report. Blacksburg, VA. 77 p.
Bacon, J., Roche, J., Elliot, C. & Nicholas, N. 2006. VERP: Putting principles into practice in
Yosemite National Park. The George Wright Forum 23(2): 73-83.
Baxter, V.A. 1997. Trails Monitoring and Assessment Manual. USDI Denali National Park,
Research and Resource Management Division, Denali Park, AK.
Bayfield, N.G. & Lloyd, R.J. 1973. An approach to assessing the impact of use on a long
distance footpath - the Pennine Way. Recreation News Supplement 8: 11–17.
Benninger-Truax, M., Vankat, J.L. & Schaefer, R.L. 1992. Trail corridors as habitat and conduits
for movement of plant species in Rocky Mountain National Park, Colorado, USA.
Landscape Ecology 6(4): 269-278.
Bhuju, D.R. & Ohsawa, M. 1998. Effects of nature trails on ground vegetation and understory
colonization of a patchy remnant forest in an urban domain. Biological Conservation 85:
123-135.
Boucher, D., Aviles, J., Chepote, R., Domínguez Gil, O. & Vilchez, B. 1991. Recovery of
trailside vegetation from trampling in a tropical rain forest. Environmental Management
15: 257-262.
Bratton, S.P., Hickler, M.G. & Graves, J.H. 1979. Trail erosion patterns in Great Smoky
Mountains National Park. Environmental Management 3: 431–445.
Cao, L., Stow, D., Kaiser, J. & Coulter, L. 2007. Monitoring cross-border trails using airborne
digital multispectral imagery and interactive image analysis techniques. Geocarto
International 22(2): 107-125.
Christensen, H.H. & Clark, R.N. 1983. Increasing public involvement to reduce depreciative
behavior in recreation settings. Leisure Sciences 5(4): 359-379.
Cole, D.N. 1982. Wilderness recreation site impacts: effect of amount of use. USDA Forest
Service Research Paper INT-284. Ogden, UT. 34 p.

LITERATURE CITED
Page 65
Cole, D.N. 1983. Assessing and monitoring backcountry trail conditions. Research Paper INT-
303, USDA Forest Service, Intermountain Research Station. Ogden, UT. 10 p.
Cole, D.N. 1987. Research on soil and vegetation in wilderness: A state-of-knowledge review.
In: Lucas, R.C. comp. Proceedings – National Wilderness Research Conference: Issues,
State-of-Knowledge, Future Directions; Fort Collins, CO. General Technical Report INT-
220. USDA Forest Service, Intermountain Research Station, Ogden, UT, pp. 135-177.
Cole, D.N. 1989. Wilderness campsite monitoring methods: A sourcebook. General Technical
Report INT-259. USDA Forest Service, Intermountain Research Station, Ogden, UT.
57p.
Cole, D.N. 1990. Trampling disturbance and recovery of cryptogamic soil crusts in Grand
Canyon National Park. Great Basin Naturalist 50: 321-325
Cole, D.N. 1991. Changes on trails in the Selway-Bitterroot Wilderness, Montana, 1978-89. Res.
Pap. INT-450. USDA Forest Service, Intermountain Research Station, Ogden, UT. 5 p.
Cole, D.N. 1992. Modeling wilderness campsites: Factors that influence amount of use.
Environmental Management 16: 255–264.
Cole, D.N. 1993. Minimizing Conflict between Recreation and Nature Conservation, In Ecology
of Greenways Design and function of linear conservation areas. eds D.S. Smith, P.C.
Hellmund, p. 222. University of Minnesota Press, Minneapolis, MN.
Cole, D.N. 1995a. Disturbance of natural vegetation by camping: Experimental applications of
low-level stress. Environmental Management 193: 405-416.
Cole, D.N. 1995b. Experimental trampling of vegetation. I. Relationship between trampling
intensity and vegetation response. Journal of Applied Ecology 32: 203-214.
Cole, D.N. 2004. Impacts of hiking and camping on soils and vegetation: A review. In:
Environmental Impacts of Ecotourism. R. Buckley (editor). CABI Publishing,
Cambridge, MA.
Cole, D.N., Watson, A.E., Hall, T.E. & Spildie, D.R. 1997. High-use destinations in wilderness:
Social and biophysical impacts, visitor responses, and management options. Research
Paper INT-RP-496. Rocky Mountain Research Station, Ogden, UT.
Dixon, G., Hawes, M. & McPherson, G. 2004. Monitoring and modeling walking track impacts
in the Tasmanian Wilderness World Heritage Area, Australia. Journal of Environmental
Management 71(4): 305-320.
Ferris, T.M.C., Lowther, K.A. & Smith, B.J. 1993. Changes in footpath degradation 1983–1992:
A study of the Brandy Pad, Mourne Mountains. Irish Geography 26: 133-140.

LITERATURE CITED
Page 66
Fritz, J.D. 1993. Effects of trail-induced sediment loads on Great Smoky Mountains National
Park high gradient trout streams. M.S. Thesis. Tennessee Technological University,
Cookville, TN.
Furbish, C.E. 1996. Trails and Nodes Monitoring Program: Annual Progress Report. USDI
National Park Service, Denali National Park, Research and Resource Management
Division.
Grabherr, G. 1982. The impact of trampling by tourists on a high altitudinal grassland in the
Tyrolean Alps, Austria. Plant Ecology 48: 209-217.
Gramann, J.H. & Vander Stoep, G.A. 1987. Prosocial behavior theory and natural resource
protection: a conceptual synthesis. Journal of Environmental Management 24: 247-257.
Hall, C.N. & Kuss, F.R. 1989. Vegetation alteration along trails in Shenandoah National Park,
Virginia. Biological Conservation 48: 211–227.
Hammitt, W.E. & Cole, D.N. 1998. Wildland Recreation: Ecology and Management (2nd Ed.).
John Wiley and Sons, New York, NY.
Happe, P.J., Shea, K.E. & Loya, W.M. 1998. Assessment of All-Terrain Vehicle (ATV) Impacts
within Wrangell-St. Elias National Park and Preserve, Alaska. 1997. WRST Research
and Resource Management Report, No. 98-1. Wrangell-St. Elias National Park and
Preserve, Copper Center, AK.
Hill, W. & Pickering, C.M. 2006. Vegetation associated with different walking track types in the
Kosciuszko alpine area, Australia. Journal of Environmental Management 78: 24-34.
Hockett, K., Clark, A., Leung, Y.F., Marion, J.L. & Park, L. 2010. Deterring Off-trail Hiking in
Protected Natural Areas: Evaluating Options with Surveys and Unobtrusive Observation.
Final Research Report. Virginia Tech College of Natural Resources & Environment,
Blacksburg, VA.
Hollenhorst, S. & Gardner, L. 1994. The indicator performance estimate approach to determining
acceptable wilderness conditions. Environmental Management. 18(6): 901-906.
Johnson, B.R., Bratton, S.P., & Firth, I. 1987. The Feasibility of Using Brushing to Deter Visitor
Use of Unofficial Trails at Craggy Gardens, Blue Ridge Parkway, North Carolina (CPSU
Report No. 43). National Park Service Cooperative Studies Unit, Institute of Ecology,
University of Georgia, Athens, GA.
Kaiser, J.V., Stow, D.A. & Cao, L. 2004. Evaluation of remote sensing techniques for mapping
transborder trails. Photogrammetric Engineering & Remote Sensing 70(12): 1441–1447.
Kasworm, W.F. & Monley, T.L. 1990. Road and trail influences on grizzly bears and black bears
in northwest Montana. In: L.M. Darling & W.R. Archibald (Eds.), Bears: Their Biology
and Management: Proceedings of the 8th International Conference (pp. 79-84).
International Association for Bear Research and Management, Victoria, BC.

LITERATURE CITED
Page 67
Keirle, I. & Stephens, M. 2004. Do walkers stay on footpaths? An observational study of Cwm
Idwal in the Snowdonia National Park. Countryside Recreation 12(2): 7-9.
Kincey, M. & Challis, K. 2010. Monitoring fragile upland landscapes: The application of
airborne lidar. Journal of Nature Conservation 18(2): 126-134.
Knight, R.L. & Cole, D.N. 1995. Wildlife responses to recreationists. In: Knight, R.L. & K.J.
Gutzwiller., eds. Wildlife and Recreationists: Coexistence through Management and
Research. Island Press, Washington, DC. pg. 51-70.
Lehvavirta, S. 1999. Structural elements as barriers against wear in urban woodlands. Urban
Ecosystems 4(1): 45-56.
Leung, Y.F. & Louie. 2008. Visitor Experience and Resource Protection, Data Analysis
Protocol: Social Trails. Final Technical Report submitted to USDI National Park Service,
Yosemite National Park. North Carolina State University, Dept of Parks, Recreation, and
Tourism Management, Raleigh, NC. 17 p.
Leung, Y.F. & Marion, J.L. 1996. Trail degradation as influenced by environmental factors: A
state-of-knowledge review. Journal of Soil and Water Conservation 51: 130-136.
Leung, Y.F. & Marion, J.L. 1999a. Assessing trail conditions in protected areas: An application
of a problem-assessment method in Great Smoky Mountains National Park, USA.
Environmental Conservation 264: 270-279.
Leung, Y.F. & Marion, J.L. 1999b. Characterizing backcountry camping impacts in Great
Smoky Mountains National Park, USA. Journal of Environmental Management 57, 193-
203.
Leung, Y.F. & Marion, J.L. 1999c. Spatial strategies for managing visitor impacts in National
Parks. Journal of Park and Recreation Administration 17(4): 20-38.
Leung, Y.F. & Marion J.L. 2000. Recreation impacts and management in wilderness: A state-of-
knowledge review. In: Cole, D.N., McCool, S.F., Borrie, W.T., O’Loughlin, J. (comps)
Wilderness science in a time of change conference, Vol 5. Wilderness ecosystems, threats
and management. Proceedings RMRS-P-15-Vol-5. USDA Forest Rocky Mountain
Research Station, pp 23–48.
Leung, Y.F., Newburger, T., Jones, M., Kuhn, B. & Woiderski, B. 2011. Developing a
monitoring protocol for visitor-created informal trails in Yosemite National Park, USA.
Environmental Management 47: 93-106.
Leung, Y.F., Shaw, N. Johnson, K. & Duhaime, R. 2002. More than a database: Integrating GIS
data with the Boston Harbor Islands visitor carrying capacity study. George Wright
Forum 19(1): 69–78.
Liddle, M.J. & Greig-Smith, P. 1975. A survey of tracks and paths in a sand dune ecosystem, I.
Soils. Journal of Applied Ecology 12: 893-908.

LITERATURE CITED
Page 68
Lucas, R.C. 1979. Perceptions of non-motorized recreational impacts: A review of research
findings. In: Ittner, R.; Potter, D.R.; Agee, J.K.; Anschell, S., eds. Recreational Impact on
Wildlands: Conference Proceedings; Seattle, WA. R-6-001-1979.: USDA Forest Service,
Pacific Northwest Forest and Range Experiment Station and USDI National Park
Service: 24-31.
Lynn, N.A. & Brown, R.D. 2003. Effects of recreational use impacts on hiking experiences in
natural areas. Landscape and Urban Planning 64(1/2): 77-87.
Manning, R., Jacobi, C. & Marion, J.L. 2006. Recreation monitoring at Acadia National Park.
The George Wright Forum 23(2):59-72.
Marion, J.L. 1991. Developing a natural resource inventory and monitoring program for visitor
impacts on recreation sites: A procedural manual. Natural Resources Report
NPS/NRVT/NRR-91/06. Denver, CO: USDI National Park Service, Natural Resources
Publication Office. 59p.
Marion, J.L. 1994. An assessment of trail conditions in Great Smoky Mountains National Park.
Research and Resources Management Report. USDI National Park Service, Southeast
Region, Atlanta, GA. 155p.
Marion, J.L. & Olive, N. 2006. Assessing and understanding trail degradation: results from Big
South Fork National River and Recreational Area. USDI, U.S. Geological Survey, Final
Research Rpt., Virginia Tech Field Station, Blacksburg, VA. 82p.
Marion, J.L. & Cahill, K. 2006. Monitoring the resource Impacts of visitor use: A protocol for
the long-term Coastal Ecosystem Monitoring Program at Cape Cod National Seashore.
USDI, U.S. Geological Survey, Final Research Rpt., Virginia Tech Field Station,
Blacksburg, VA.
Marion, J.L. & Cole, D.N. 1996. Spatial and temporal variation in soil and vegetation impacts on
recreation sites. Ecological Applications 62: 520-530.
Marion, J.L. & Hockett, K. 2008a. Trail and campsite monitoring protocols: Zion National Park.
USDI, U.S. Geological Survey, Final Research Rpt., Virginia Tech Field Station,
Blacksburg, VA. 65p.
Marion, J.L. & Hockett, K. 2008b. Frontcountry recreation site and trail conditions: Haleakalä
National Park. USDI, U.S. Geological Survey, Final Research Rpt., Virginia Tech Field
Station, Blacksburg, VA. 88p.
Marion, J.L. & Leung, Y.-F. 2001. Trail resource impacts and an examination of alternative
assessment techniques. Journal of Park & Recreation Administration 191: 17–37.
Marion, J.L. & Leung, Y.F. 2004. Environmentally sustainable trail management. In: Buckley,
R. (ed.), Environmental Impact of Tourism, Cambridge, MA: CABI Publishing. pp. 229-
244.
LITERATURE CITED
Page 69
Marion, J.L., Leung, Y.F. & Nepal, S. 2006. Monitoring trail conditions: New methodological
considerations. George Wright Forum 232: 36–49.
Marion, J.L. & Lime, D.W. 1986. Recreational resource impacts: Visitor perceptions and
management responses. In: Kulhavy, D.L.; Conner, R.N., eds. Wilderness and Natural
Areas in the Eastern United States: A Management Challenge Nacogdoches, TX: Stephen
F. Austin State University, School of Forestry: 229-235.
Matheny, S.J. 1979. A successful campaign to reduce trail switchback shortcutting. In:
Recreational impacts on wildlands. USDA Forest Service, Portland, OR. pp. 217-221.
Merigliano, L.L. 1990. Indicators to monitor wilderness conditions. In: D.W. Lime Ed.,
Managing America's Enduring Wilderness Resource. University of Minnesota,
Agricultural Experiment Station and Extension Service, St. Paul, MN. pp. 205–209.
Meyer, K. 2002. Proposed Best Management Practices (BMPs) for OHV/ATV Trail
Management in Alaska, Draft. USDI, National Park Service, Alaska Regional Office,
Trails and Conservation Assistance Program.
Meyer, K. 2011. A Comprehensive Framework for Off-Highway Vehicle Trail Management.
USDA Forest Service, Missoula Technology & Development Program, 1123-2804-
MTDC.
Miller, S.G., Knight, R.L. & Miller, C.K. 1998. Influence of recreational trails on breeding bird
communities. Ecological Applications 8: 162-169.
Monz, C.A. 2002. The response of two arctic tundra plant communities to human trampling
disturbance. J. of Environmental Mgmt. 64: 207-217.
NPS. 1997. The Visitor Experience and Resource Protection (VERP) framework: A handbook
for planners and managers (Publication No. NPS D-1215). USDI National Park Service,
Denver Service Center, Denver, CO.
NPS. 2003. Off-Road Vehicle (ORV) Use in Alaska National Park System Units. USDI National
Park Service, Alaska Region, Alaska Support Office, Anchorage, AK.
NPS. 2006a. Denali National Park and Preserve Final Backcountry Management Plan, General
Management Plan Amendment and Environmental Impact Statement. USDI National
Park Service, Denali National Park and Preserve, Denali Park, AK.
NPS. 2006b. Management Policies. USDI National Park Service, Washington, D.C.
NPS. 2011. National Park Service Visitor Use Statistics. USDI, NPS Public Use Statistics
Office. http://www.nature.nps.gov/stats/viewReport.cfm
Newsome, D., Moore, A.A. & Dowling, R.K. 2002. Natural Area Tourism: Ecology, Impacts
and Management. Channel View Publications, Cleveden, UK.
LITERATURE CITED
Page 70
O'Connor, J.S. & Dewling, R.T. 1986. Indices of marine degradation, their utility. Environmental
Management 10: 335-343.
Olive, N.D. & Marion, J.L. 2009. The influence of use-related, environmental, and managerial
factors on soil loss from recreational trails. Journal of Environmental Management 90:
1483–1493.
Park, L.O., Marion, J.L., Manning, R.E., Lawson, S.R. & Jacobi, C. 2008. Managing visitor
impacts in parks: A multi-method study of the effectiveness of alternative management
practices. Journal of Parks and Recreation Administration 26(1): 97-121.
Pearce-Higgins, J.W. & Yalden, D.W. 1997. The effect of resurfacing the Pennine Way on
recreational use of blanket bog in the Peak District National Park, England. Biological
Conservation 82(3): 337-343.
Potito, A.P. & Beatty, S.W. 2005. Impacts of recreation trails on exotic and ruderal Species
distribution in grassland areas Along the Colorado Front Range. Environmental
Management 36, 36(2): 230-236.
Reid, R.S. & Schreiner, E.S. 1985. Long-term experimental trampling on plant communities in
Denali National Park, Alaska, USA. Resource Management Office, Denali National Park,
Alaska. Unpublished report. 94 pp.
Reiter, S.M. & Samuel, W. 1980. Littering as a Function of Prior Litter and the Presence or
Absence of Prohibitive Signs. Journal of Applied Social Psychology 10: 45-55.
Rochefort, R.M. & S.T. Gibbons. 1992. Mending the meadow: High-altitude meadow restoration
in Mount Rainier National Park. Restoration and Management Notes 10: 120-126.
Roggenbuck, J.W., Williams, D.R. & Watson, A.E. 1993. Defining acceptable conditions in
wilderness. Environmental Management. 17(2): 187-197.
Roovers, P., Bossuyt, B., Gulnick, H. & Hermy, M. 2005. Vegetation recovery on closed paths in
temperate deciduous forests. Journal of Environmental Management 74(3): 273-281.
Stankey, G.H., Cole, D.N., Lucas, R.C., Peterson, M.E., Frissell, S.S. & Washburne, R.F. 1985.
The Limits of Acceptable Change (LAC) System for wilderness planning. USDA Forest
Service General Technical Report INT-176.
Sutherland, R.A., Bussen, J.O., Plondke, D.L., Evans, B.M. & Ziegler, A.D. 2001.
Hydrophysical degradation associated with hiking-trail use: a case study of Hawai'iloa
Ridge Trail, O'ahu, Hawai'i. Land Degradation & Development 12: 71-86.
Sutter, R.D., Benjamin, S.E., Murdock, N. & Teague, B. 1993. Monitoring the effectiveness of a
boardwalk at protecting a low heath bald in the southern Appalachians. Natural Areas
Journal 13(44): 250-255.

LITERATURE CITED
Page 71
Thurston, E. & Reader, R.J. 2001. Impacts of experimentally applied mountain biking and hiking
on vegetation and soil of a deciduous forest. Environmental Management 27: 397-409.
Tyser, R.W. & Worley, C.A. 1992. Alien flora in grasslands adjacent to road and trail corridors
in Glacier National Park, Montana (U.S.A.). Conservation Biology 6(2): 253-262.
Vaske, J.J., Graefe, A.R. & Dempster, A. 1982. Social and environmental influences on
perceived crowding. In: Boteler, F.E., ed. Proceedings: Third Annual Conference of the
Wilderness Psychology Group; Morgantown, WV. Morgantown, WV: West Virginia
University, Division of Forestry: 211-227.
Weaver, T. & Dale, D. 1978. Trampling effects of hikers, motorcycles and horses in meadows
and forests. The Journal of Applied Ecology 15: 451-457.
Wimpey, J. & Marion, J.L. 2011a. A spatial exploration of informal trail networks within Great
Falls Park, VA. Journal of Environmental Management 92: 1012-1022.
Wimpey, J. & Marion, J.L. 2011b. Formal and informal trail monitoring protocols and baseline
conditions: Great Falls Park and Potomac Gorge. Final Research Report. U.S.
Geological Survey, Distributed by the Virginia Tech College of Natural Resources &
Environment, Blacksburg, VA.
Wing, M. & Shelby, B. 1999. Using GIS to integrate information on forest recreation. Journal of
Forestry 97: 12–16.
Witztum, E.R. & Stow, D.A. 2004. Analyzing direct impacts of recreation activity on coastal
sage scrub habitat with very high resolution multi-spectral imagery. International Journal
of Remote Sensing 25(17): 3477-3496.
Wolper, J., Mohamed, S., Burt, S. & Young, R. 1994. Multisensor GPS-based recreational trail
mapping. In: Proceedings of ION GPS 1994. Vol 7/6, pp. 237–244. Alexandria, VA:
Institute of Navigation.
Womble, P. 1979. Survey of backcountry users in Mount McKinley National Park, Alaska: A
report for management. Cooperative Park Studies Unit, University of Washington,
Seattle, WA.
Wood, K.T., Lawson, S.R. & Marion, J.L. 2006. Assessing recreation impacts to cliffs in
Shenandoah National Park: Integrating visitor observation with trail and recreation site
measurements. Journal of Park & Recreation Administration 24(4): 86-110.
Wooding, F.J. & Sparrow, S.D. 1979. An assessment of damage caused by off-road vehicle
traffic on subarctic tundra in the Denali Highway area of Alaska. In: Ittner, R.; Potter,
D.R.; Agee, J.K.; Anschell, S., eds. Recreational Impact on Wildlands: Conference
Proceedings; Seattle, WA. R-6-001-1979. USDA Forest Service, Pacific Northwest
Forest and Range Experiment Station and USDI National Park Service. pp. 89-93.

Page 72
APPENDIX 1: MONITORING PROTOCOLS FOR ASSESSING FORMAL AND INFORMAL TRAILS
Denali National Park
ESTABLISHING MONITORING ZONES
The spatial distribution of visitation can vary substantially within protected natural areas, ranging
from very high near popular attraction features to very low in remote inaccessible areas. The
establishment of monitoring zones can help designate the priorities and intensities of trail
monitoring efforts. The most remote areas require no monitoring effort if there is good reason to
believe that no visitor-created trails exist. In contrast, areas near roads, campgrounds, or other
facilities may have or could develop dense networks of human trails that require more intensive
monitoring. Therefore, an initial step in the trail monitoring effort is to establish zones to
prescribe trail monitoring effort, from none to intensive. The following section describes a
process for accomplishing this objective, though it is expected that over time, and as data is
collected, that such monitoring guidance will be updated and revised.
Levels of Monitoring Effort
The type of trail monitoring employed will depend on the existing and expected number, extent,
and condition of trails. Higher levels of monitoring effort will generally be applied to areas and
trails that receive more intensive use and impact. Several types of trail monitoring protocols are
recommended, which are listed here and fully described in later sections.
No trail monitoring within remote/inaccessible areas.
Access survey – This method provides an efficient census of all informal trails leaving a
road or formal trail corridor, documented by point data. The condition of informal trail
segments can also be optionally assessed.
Line transect survey – This method provides informal trail condition data assessed along
one or more transects arranged perpendicular to the prevailing direction of travel within
travel corridors. Informal trail locations are depicted by point data for each transect/trail
intersection.
Census mapping survey – This method provides comprehensive mapping data for all
informal trails within a defined monitoring area, or an intelligent search through a travel
corridor. The condition of informal trail segments can also be optionally assessed.
Point sampling survey – This intensive survey method provides more comprehensive
quantitative condition data taken at regularly spaced points along well-established formal
or informal trails.
Route finding experience survey – This method is an opportunistic assessment of the trail-
less experience applied by visitors or backcountry staff during backcountry hikes.

APPENDIX 2: TRAIL MONITORING WORK FLOW
Page 73
Regardless of the protocol used, they should be replicated periodically (e.g., every 3-10 yrs) to
document change over time. Furthermore, surveys should only be conducted in the last half of
the summer use season when evidence of human use on trails is most pronounced.
Monitoring Zones
The geography and probable use patterns of the protected area are used to define trail zones.
These can be organized by distance from roads and expected impacts.
1. Infrastructure areas (roads, parking areas, visitor centers, remote airstrips, buildings, etc.)
2. Frontcountry nodes (dense networks of trails leading from infrastructure areas to attraction
features)
3. Road corridor areas with trails expected
4. Road corridor areas with no trails expected
5. Closed areas (e.g., wildlife closures)
6. Well-used formal or informal trails with static alignments
7. Backcountry travel corridors with likely trail formation to attraction features
8. Backcountry travel corridors with no trail formation expected
9. Remote/inaccessible areas
Suggested informal trail monitoring decision tree. Initial monitoring strategies are to be selected
by roundtable discussion and zoning of the park by managers and staff.
Zone Establishment with a Roundtable Process
The key to establishing the zones is to collect data on known and suspected areas of trail
establishment. Gathering a group of the most relevant and experienced protected area staff to
have a roundtable discussion, while drawing lines on maps, is a useful method. Other data
sources are hiker contact locations from backcountry patrols; interviews of visitors, local guides,
hike leaders, and bus drivers; a survey of access points along roads; previous trail monitoring
data, a plot of the hikes listed in guidebooks; trip reports on the web; and special destination or
attraction feature points.
Data from the roundtable effort could be assembled into GIS layers to show discrete areas of
probable human trail development defined by mapped polygons. Each polygon is assigned an

APPENDIX 2: TRAIL MONITORING WORK FLOW
Page 74
initial level of trail monitoring (type, intensity, and priority). Additional layers include known
and suspected trails and access points, formal trails, developed sites (roads, parking areas,
administration areas, campgrounds, ranger stations, etc.) and closures.
In monitoring zones 1, 4, 5, 8, and 9 trail monitoring will generally not be conducted, except as
captured through the roadside access survey. For the remaining zones roundtable staff will need
to decide between four types of monitoring. Generally, the route finding assessments are applied
only to zone 7, backcountry travel corridors with likely trail formation. Similarly, point
sampling is applied only to zone 6, well-used formal or informal trails with static alignments. For
the remaining zones, 2, 3, and 7, line transect surveys are generally recommended as the most
appropriate and efficient first step for areas that require some level of monitoring beyond the
roadside trail survey. This survey requires about 25-35% of the time required to conduct the
more comprehensive trail census mapping, which is generally more appropriate for high-use
areas with dense networks of informal trails. However, where time permits, managers may also
find that trail mapping provides useful information for documenting longer informal trails that do
not occur in areas of dense trail networks.
In considering whether to monitor an area or the type of monitoring to apply, consider both
existing conditions and expected changes in use or management actions. For example, areas with
few trails that are in acceptable condition may be less important to monitor, though documenting
baseline conditions even for such trails remains an important management objective. However,
areas with few trails in poor condition or areas expected to see increased use or where
management actions are likely will generally be areas of higher priority monitoring. The
monitoring process should be a key component of adaptive management decision making.
As trail monitoring data is collected, the boundaries between the zones can be adjusted. For
example, increased use in an area may lengthen trails that then allow day hikers to move further
away from roads over time. This would extend the outer boundary of monitoring zones—with an
accompanying change in monitoring prescription.
One issue of concern is training field staff to distinguish between trails that are primarily created
and used by wildlife from those that are created and primarily used by visitors. The following
text box contains information to guide that decision-making, but field experience and training are
also needed to improve the precision (consistency) of these judgments. This guidance can be
revised as other indicators are noticed and refined to improve these determinations.

APPENDIX 2: TRAIL MONITORING WORK FLOW
Page 75
Distinguishing Visitor & Wildlife Trails
Field staff will need to distinguish between informal trails that are primarily created and used by park
visitors from those that are primarily created and used by “wildlife.” Trails that are “mostly wildlife”
are omitted from the Census Survey and are recorded but not assessed for resource condition in the
Access and Line Transect Surveys. These criteria are included to help distinguish between these “type
of use” determinations.
Spatial Criteria: Visitor trails frequently start at the Denali Road near a high-use location and lead
into the backcountry, often splitting into parallel routes but eventually becoming discontinuous and
disappearing. These trails also lead to attraction features like vistas or follow traditional routes of
visitor use. These spatial attributes can be a good indicator of visitor-created trails. Wildlife trails that
intersect the road generally have a “mirror” image trail directly across the road – look for these.
Visitor trails are generally “directionally consistent” over longer distances – consistently heading
towards some destination. Visitor trails actively seek out and remain within the easiest topography
and vegetation for human travel. Wildlife trails are generally more haphazard, they meander and
often don’t purposefully avoid wet areas.
Wildlife Sign Criteria: Knowledge about the ecology and natural history of the wildlife can assist
decision-making. For example, sheep trails frequently descend steeply to cross the road at narrow
mountain gaps, while caribou trails frequently appear as numerous roughly parallel routes through
flat to gently sloped terrain. Moose trails favor areas with willow thickets and evidence of their
browsing along the trail is common. In areas of woody vegetation, trails created by smaller mammals
can be discounted because they are very narrow (<8 in) and go directly under branches that would
obstruct human passage. These types of trails are the easiest to discount/omit.
Close inspection of the trail tread also offer distinguishing criteria. Animal feces/pellets and hoof or
boot prints in or near the trail tread are common and fairly reliable indicators. Hoofs generally shear
off the trail edges, which are often nearly vertical, where the sides of human trails are more rounded.
The width of trails can be an important indicator; wildlife trails are narrower than human trails (often
less than 8 inches). Wildlife generally make no effort to detour around wet areas or to step on clumps
of higher ground or vegetation, humans do, leaving visually obvious trampled and flattened clumps of
grasses as evidence of their passing.

APPENDIX 2: TRAIL MONITORING WORK FLOW
Page 76
ACCESS SURVEY
Objectives
This survey documents the number and distribution of ITs that intersect a road or formal trail
corridor. This is an efficient survey method that can be conducted quickly but doesn’t provide
information on trail alignments or destinations. Optional procedures are included for assessing
trail conditions at sample points near the trailhead.
Guidance
This survey could be conducted early in the monitoring process to inform the roundtable zoning
process. Staff training should focus on developing consistent judgment on when to assess or not
assess faint or discontinuous informal trails – a set of reference photographs are included to
assist in the consistency of these judgments. Trails judged to be predominantly created and used
by wildlife are recorded with a GPS point but are excluded from further resource condition
assessments (see guidance: Distinguishing Visitor and Wildlife Trails, page 75). Note that some
wildlife trails may occur in areas that receive frequent human use (e.g., near bus stopping or
common drop-off locations) – these should be assessed and generally labeled as ―mixed
human/wildlife use‖). A Trimble GPS is used for this survey to obtain accurate spatial data on IT
trailheads and to efficiently enter and transfer optional IT condition assessment data.
The Access Survey is conducted by staff who are familiar with the distribution of
hiking/backpacking use along the Denali Park Road. Likely candidates include Rangers who
routinely patrol the road and/or staff from the Backcountry desk involved with backcountry
permits. Consultations with bus operators to discover popular day-hiking locations are also
helpful. The Denali Road can be assessed by driving to and searching on foot all locations where
human use trails might be expected to occur. Note that trails may depart from locations not
visible from a vehicle, such as 100 ft out along a stream corridor. Ground searches on foot are
focused along the interface boundary between disturbed road corridor vegetation/substrates and
more pristine natural vegetation/substrates.
Methods
Materials
Field manual, data/photos from prior surveys, paper data forms and pencil for backup.
Trimble GPS w/submeter accuracy, charged battery(s), antenna, stylus, appropriate data
dictionary.
Tape measure, 6 ft.
Geotag-enabled digital camera that links with Trimble GPS position data (preferred).
Option: use a standard digital camera, set it’s time date/time to match the Trimble unit, and
use a software program that matches date/time stamps to record location data to the photo
file (geotagging).
Telescopic antenna or presentation pointer (extending to 4 ft).
Logbook
Field Procedures: Survey staff should be familiar with the amount and distribution of
hiking/backpacking use along the road or trail corridor to be assessed, particularly the locations
where visitors are most likely to depart the road or formal trail corridor. Consultations with
experienced public or private staff may yield important guidance and advice on locations where
visitors commonly begin or end their off-road/off-trail hikes.

APPENDIX 2: TRAIL MONITORING WORK FLOW
Page 77
Open TerraSync on the GPS and select the Data screen to create a new rover file. Select
the Access Survey data dictionary from the pick list. Select the Map screen and open the
Layers dialog. Select the Setup screen, and open the Logging Settings dialog.
Ensure logging intervals for all features in the data dictionary are set to 1 second and are
based on time, not distance. Logging velocity is unnecessary, set H-Star logging to Auto,
and set Allow Position Update to Confirm.
Drive or bike the road or hike the formal trail and use prior information and personal
knowledge to stop and carefully check locations where ITs are expected. When driving
roads, always get out and walk roadsides to locate trails in areas near pullouts, parking lots,
and areas where visitor-created trails are expected. Record a ―Search Log‖ lineal feature
that documents the extent of your search. Away from pullouts, roadsides may be able to be
surveyed by a non-driving vehicle passenger.
Focus your assessment on ITs at the outer boundary of human-caused disturbance
associated with road/trail construction or maintenance work, e.g., look at the leading edge
of undisturbed native vegetation, even if it is located some distance from the road or trail.
Include all ITs that have the following attributes: 1) visitor- or wildlife-created trails that
show clear signs of trampling disturbance created by this year’s traffic, 2) segments that
extend at least 20 feet in length, and 3) trails that remain clearly visible if you cover one
eye (this eliminates faint trails that are indistinct without depth perception). Note that
ordered gravel in gravelly substrates can qualify as a trail if visually obvious. Figure 1
provides reference photos of relatively faint ITs to illustrate different types of resource
changes that provide visual clues for discerning these trails. Do not include formal trails or
extremely faint, discontinuous IT’s. Assign Use Type determination as: a) human, b)
mostly human/some wildlife, or c) mostly wildlife. See guidance: Distinguishing Visitor
and Wildlife Trails, page 75.
At the outer boundary of road or trail-related disturbance where you locate an IT, collect an
―Access Trail Photo Point.‖ Walk back toward the road or formal trail about 10-15 ft from
the trailhead location and take a vertical photograph showing the trail in relation to the
leading edge of vegetation and including the horizon near the top of the photo. Be sure to
orient the camera in a downward angle to clearly document the trail’s tread conditions – refer
to Figure 1 for examples. Record a GPS point at this location. Tread condition assessments
may be assessed using these photos.
At the outer boundary of road or trail-related disturbance where you locate an IT, walk out
the IT 20 feet and collect a GPS point using the ―Access‖ point type in the data dictionary.
Take a photo of this location from a height of 4.5 feet with a 50mm lens and clearly showing
the tread condition and barely including the horizon with a distinctive feature. Record the
azimuth from the camera to the waypoint location. At this point, assess the trail’s use type
and any of the optional condition assessment indicators described below. If the trail splits
before this point, collect the GPS point and assess these indicators for the last section of trail
immediately prior to the split.

APPENDIX 2: TRAIL MONITORING WORK FLOW
Page 78
Optional Condition Assessment Protocols – Not assessed for mostly wildlife use IT’s.
1) Trail Width (TW): Measure the trail width between the outer trail boundaries. These
boundaries are defined as visually obvious trampling-related changes in ground vegetation
height (trampled vs. untrampled), cover, composition (e.g., grass, forb, lichen), or, when
vegetation cover is reduced or absent, changes in organic litter (intact vs. pulverized) (see
photo illustrations in Figure 2). The objective is to define the trail tread that receives about
95% of the traffic, selecting the most visually obvious outer boundary that can be
consistently identified by you and future trail surveyors. Measure and record the tread width
to the nearest inch.
2) Total Incision (TI): Extend a telescoping antenna or shock-corded tent pole section across the
trail and beyond trail boundaries so that it rests on what you consider to be the pre-trail
surface of the lowermost ground vegetation layer (i.e., on top of the moss/lichen mat and/or
at the base of grass clumps and forbs). Use a tape measure to obtain a maximum value
(nearest ¼ inch: 0, .25, .5, .75) from the bottom of the pole to the lowermost point on the trail
tread beneath the pole (support it in the middle if it bends downward on wider trails).
Subtract soil incision (next indicator) from this measure to yield a measure reflecting
trampling-related compaction or loss of the vegetation mat.
3) Soil Incision (SI): Same procedures as above, but now align the extension pointer at the trail
boundary with the interface between the upper soil surface and lower vegetation mat. Note
that this interface may be below the tread, in which case record a value of 0 for this indicator.
If soil loss has occurred, use a tape measure to obtain a maximum value (nearest ¼ inch)
from the bottom of the pointer to the lowermost point on the trail tread. This measure
primarily reflects the trampling-related compaction or loss of the soil. Arctic Refuge:
substitute a Yes/No response for this measure based on whether soil loss has occurred.
4) Vegetation Cover On-Trail (VO): Imagine a 1 ft wide belt transect centered on the pole
extending between the trail boundaries perpendicular to the trail. Within this band estimate
the percentage of live vegetative ground cover < 1 ft tall (including herbs, grasses, low
shrubs, live mosses, lichens (all colors), and any largely intact cryptogrammic crusts) rooted
within the band using the coded categories listed below (see Figure 2). For this and the
following indicator, it is helpful to narrow your decision to two categories and concentrate on
the boundary value that separates them. For example, if the vegetation cover is either
category 6-25% or 26-50%, you can simplify your decision by focusing on whether
vegetative cover is greater than 25%. Alternately, consider that analyses will use the
midpoint values for these categories so it may be helpful to base your decision on which
midpoint value is most representative of the trail tread cover. Cover categories:
0-5% (1=2.5), 6-25% (2=15.5), 26-50% (3=38), 51-75% (4=63), 76-95% (5=85.5),
96-100% (6=98)
5) Vegetative Ground Cover Off-Trail (VF): Assess vegetation cover in an adjacent, untrampled
off-trail location several feet beyond trail boundaries. The intent is to locate a ―control‖ area
that depicts what the vegetation cover on the trail tread would resemble had it never been
trampled. Select a control that has the same proportion and size of rocks as the tread quadrat.
In instances where you cannot decide between two categories, select the category with less
vegetative cover. The rationale for this is simply that the first visitors would tend to select a
trail route with the least amount of vegetation. Note that if some of the trail substrates would

APPENDIX 2: TRAIL MONITORING WORK FLOW
Page 79
likely be barren due to exposed rock, then the control substrates or control vegetation
estimates must reflect that.
6) Bare Soil On-Trail (BO): As in #5 above, but estimate bare/exposed soil cover, defined as
rocks, gravel, roots, and exposed soil of all types, including organic soils with pulverized
organic litter (see Figure 2). Total cover for each band transect should approximately equal
the sum of your mid-point estimates for #5, #7, and organic litter cover.
7) Bare Soil Off-Trail (BF): As above, with the cover estimate of bare soil (not organic litter)
made in the same off-trail location used for the vegetation assessment.
8) Tread Problems (TP): Record as 1) None, 2) Mud <1‖, 3) Mud 1-3‖, 4) Mud >4‖, 5) Active
Erosion Occurring.

APPENDIX 2: TRAIL MONITORING WORK FLOW
Page 80
Figure 1. Reference photos illustrating faint and/or discontinuous ITs defined by the effects of
trampling disturbance, including: 1) reduction in woody vegetation, 2) flattening, abrasion, or
reduction in herb and grass cover, 3) compressed or reduced moss and lichen cover, and/or 4)
sorting or disturbance of rocks.

APPENDIX 2: TRAIL MONITORING WORK FLOW
Page 81
Figure 2. Representative photos illustrating the placement of telescopic antenna or
shock-corded tent pole extending beyond trail borders and from which is measured
veg/soil maximum incision to deepest spot along the tread. Trail width is assessed
along the antenna between the blue lines. Vegetation and bare soil (see definitions and
cover categories above) are assessed for the trail in a band 1 ft wide centered on the
pointer. See reference assessments included in yellow on the photos. Off-site
vegetation and bare soil values are assessed in representative undisturbed areas several
feet beyond the ends of the pointer.

APPENDIX 2: TRAIL MONITORING WORK FLOW
Page 82
LINE TRANSECT SURVEY
Objectives
This survey finds and documents the number, location, and condition of ITs in areas near roads
and formal trails.
Guidance
Line transect survey (LTS) areas are identified by the roundtable procedure. One or more line
transects are established within these areas roughly perpendicular to the anticipated direction of
travel. All qualifying ITs (see Access Survey section guidance) that intersect with each transect
are inventoried as point features, with assessments of use type, trail width, maximum incision,
vegetation cover, and bare soil recorded for each trail. LTS is less labor intensive than census
trail mapping, yet provides accurate and meaningful sample data on trail locations and conditions
for decision-making. Generally, LTS transects are placed close to roads to pick up the start of
ITs, at locations where topography or vegetation constricts traffic, or at more distant points to see
if ITs are continuing into the backcountry. When possible, place an adequate number of
transects to generate a sufficiently large ―N‖ of sample points to characterize IT conditions.
LTS areas are defined by polygon layers and transects that are downloaded to the Trimble GPS
units so that field staff can navigate to the start of each line transect and walk along each one as
they look for bisecting ITs. As ITs are found, field staff record location and condition assessment
data for the eight quantitative indicators included as ―optional‖ indicators under the Access
Survey. Figure 9 illustrates the application of the Line Transect protocol to the Igloo Canyon
Lakes area. Data yielded by this procedure includes the number of IT’s that intersect each
transect and how they change over time. For example, assessments for Igloo Canyon depicted in
Figure 9 found a total of 19 IT’s along 10 transects. Data for the IT condition assessment
indicators would reveal improving or deteriorating IT conditions when periodically reapplied.
Methods
Materials
o Field manual, data/photos from prior surveys, paper data forms and pencil for backup.
o Trimble GPS, charged battery(s), antenna, stylus, appropriate data dictionary, and
LTS polygons.
o Tape measure, 6 ft.
o Compass
o Telescopic antenna or presentation pointer (extending to 4 ft).
o Logbook
Field Procedures: Load into Trimble GPS’s TerraSync mapping software the boundary polygons
circumscribing areas to be surveyed and configure the data dictionary for data entry.
Open TerraSync on the GPS and select the Data screen to create a new rover file. Select the
LTS data dictionary from the pick list.
Select the Map screen and open the Layers dialog. Select ―Background Files...,‖ locate the
appropriate mapping area polygon layer and designate it as the background layer. Conduct
all mapping efforts in the field within this polygon, making note for later revision if the
boundary polygon needs to be modified based on the field visit.

APPENDIX 2: TRAIL MONITORING WORK FLOW
Page 83
Select the Setup screen, and open the Logging Settings dialog. Ensure logging intervals for
all features in the data dictionary are set to 1 second and are based on time, not distance.
Logging velocity is unnecessary, set H-Star logging to Auto, and set Allow Position Update
to Confirm.
Begin by exploring the previously defined LTS area to get a sense of its size and location,
likely direction of travel for visitors, and presence of ITs. Reassess the boundaries of the
search polygon developed by the roundtable process and record point and/or polygon features
and descriptive notes if needed to document alterations based on local topography, existing
trails, or possible additional areas where trails could develop.
Identify the most appropriate locations for one or more transects that cross the entire area
roughly perpendicular to the direction of visitor travel. These can be placed to assess trail
numbers both close to and further away from the road or formal trail to document decreasing
trail numbers with distance. They may also be placed strategically at locations where trails
are most likely to form. Examples include patches of woody vegetation, areas where
topography concentrates visitor traffic, and areas that might attract visitor use or traffic.
However, make an effort to include alignments that allow field staff to remain mostly on the
transect alignments. A minimum of three transects should be defined, fewer if no trails are
present, more if the area extends a long distance with trails throughout. The spacing between
transects and their alignment will vary according to the size and shape of the LTS area
(Figure 3).
Select and navigate to an endpoint for the first transect. Identify a transect alignment that is
most likely to cross ITs that may be discontinuous and identify a physical feature located
beyond the end of the transect to guide your line of travel.
Start recording a ―LTS Transect‖ feature to document the transect you walk, then take,
record, and follow a transect compass bearing as you walk the transect, looking for and
assessing (collect/nest an ―LTS Point‖) each IT you encounter (as defined in the Access
Survey section, including ―mostly wildlife‖ trails). Excluding the ―mostly wildlife trails,‖
assess each IT for the eight condition assessment indicators included in the optional Access
Survey protocols (see also guidance in Figure 2). If you must deviate off the transect to avoid
dense brush select the direction that allows the least deviation and return to the line transect
as soon as practical. Beware of dangerous wildlife when walking through dense brush, using
loud voices to alert animals of your presence.
Move to the next transect and repeat these steps. When all transects have been collected,
record some summary notes about the LTS area and then move to a new LTS area.

APPENDIX 2: TRAIL MONITORING WORK FLOW
Page 84
Figure 3. Diagrams illustrating possible transect placements based on shape and
size of LTS survey area and direction of travel. Note that polygon boundaries do not
need to be recorded.

APPENDIX 2: TRAIL MONITORING WORK FLOW
Page 85
CENSUS MAPPING SURVEY
Objectives
This survey documents the location, spatial distribution, and lineal extent of all ITs within
selected search polygons defined by the roundtable review process (see Access Survey section
for specific guidance on which IT’s to assess, but note that “mostly wildlife use” IT’s are
omitted from Census surveys). Optional procedures are included for assessing trail conditions if
needed. When reapplied over time, census mapping survey procedures allow managers to
accurately track and characterize changes in the number, spatial distribution, and length of ITs,
and optionally, changes in their condition. Data can also be used to help decide which ITs
should be closed and to evaluate the success of management efforts to close selected trails or
prevent the creation of new trails.
Guidance
Census mapping areas (CMAs) are identified by the roundtable procedure. All ITs within each
CMA are inventoried as line features, with point features recorded at all trail/road intersections
to aid GIS editing. Optional assessments of use type, trail width, maximum incision, vegetation
cover, and bare soil (described in the Access Survey section) can be made at locations where ITs
intersect a GIS grid (e.g., 25 or 50-meter grid) superimposed over the CMA and downloaded for
viewing during survey work on a GPS unit.
Methods
Materials
o Field manual, data/photos from prior surveys, paper data forms and pencil for backup.
o Trimble GPS, charged battery(s), antenna, stylus, appropriate data dictionary, and
CMA polygons.
o Compass
o Optional: GIS grid vector file downloaded to GPS unit.
o Telescopic antenna or presentation pointer (extending to 4 ft).
o Tape measure, 6 ft.
o Geotag-enabled digital camera that links with Trimble GPS position data (preferred).
Option: use a standard digital camera, set it’s time date/time to match the Trimble
unit, and use a software program that matches date/time stamps to record location
data to the photo file (geotagging).
o Logbook
Field Procedures: Begin by exploring the previously defined CMA area to get a sense of its size
and location, and presence of ITs. Reassess the boundaries of the search polygon developed by
the roundtable process and record point and/or polygon features and descriptive notes if needed
to document alterations based on local topography, existing trails, or possible additional areas
where trails could develop.
Open TerraSync on the GPS and select the Data screen to create a new rover file. Select the
CMA data dictionary from the pick list.
Select the Map screen and open the Layers dialog. Select ―Background Files...,‖ locate the
appropriate CMA mapping area polygon layer and designate it as the background layer.

APPENDIX 2: TRAIL MONITORING WORK FLOW
Page 86
Conduct all mapping efforts in the field within this polygon, making note for later revision if
the boundary polygon needs to be modified based on the field visit.
Select the Setup screen, and open the Logging Settings dialog. Ensure logging intervals for
all features in the data dictionary are set to 1 second and are based on time, not distance.
Logging velocity is unnecessary, set H-Star logging to Auto, and set Allow Position Update
to Confirm.
Beginning in one corner of the CMA polygon, record each IT segment as an ‖IT_Segment‖.
Include all ITs as defined in the Access Survey, omitting “mostly wildlife use” trails. Note
that trail segments must be at least 20 ft in length, and that mapping should cease for gaps of
more than 20 ft. If the CMA has a dense network of interconnected trails if may be helpful to
carry some flagging or wire pine flags to place at intersections to denote which trails have
been mapped.
Ensure that the GPS records points as you move along each trail segment, every time the unit
beeps and updates the point count, it has placed a node along the line you are collecting with
the GPS. You are collecting a trail and need to make sure you collect points along it that
adequately capture the location and shape of the trail. Watch the background file showing the
CMA boundaries and stop assessing all trails at the study area boundary. To promote
efficiency in post-hoc data cleanup, pause data collection in the Data or Map screens when
standing still. This prevents the unit from collecting a cloud of points when it is not moving.
At intersections with other ITs, nest an ‖IT_Junction‖ to improve mapping accuracy in GIS
data editing. Use the Options menu in the Data screen and select ―Nest,‖ then select the
―IT_Junction‖ point feature. While the point is averaging positions, record the number of
trail segments meeting at this junction. For example, a ―T-intersection‖ has three connecting
segments. Once the minimum number of positions have been collected for the ―IT_Junction‖,
close the feature, and continue mapping by unpausing/resuming data collection on the GPS.
Resource Condition Photos: Periodically take digital photos of representative trails that are
being mapped. Record ‖CMA Photo Point‖ at each point, attribute with camera photo
numbers, and azimuth of image. These photos can be examined to document the general
conditions and attributes of the mapped trails. Photos could also be replicated during
subsequent surveys for comparing changes in resource conditions (e.g., width, depth,
substrates, muddiness).
Continue mapping until all ITs within the CMA boundaries have been walked and recorded.
Resource Condition Comments: At the conclusion of mapping work for each separate area,
prepare a written summary that qualitatively describes the area and resource conditions along
the trails. Focus your comments on the relative proportion of trails that are obvious and
distinct vs. faint and inconsistent and on proportions that are primarily derived from human
use vs. wildlife use. Also note the number of occurrences of ―problem‖ sections due to
excessive muddiness or rutting that may contribute to trail proliferation and tread widening.
Optional Grid-Based Trail Condition Assessment Protocols
The primary focus of census mapping is to efficiently document the number, lineal extent and
spatial distribution of ITs. Resource condition impacts such as severe muddiness and rutting
generally cause the proliferation of additional parallel trails that census mapping can document.
However, sometimes it may be beneficial to also have qualitative or quantitative data on the
condition of the mapped ITs. Trials at DENA revealed that field staff moving along the trails

APPENDIX 2: TRAIL MONITORING WORK FLOW
Page 87
frequently differed in their subjective walking assessments of attributes such as condition class
and trail width. Adding condition assessment indicators that are continuously assessed and
altered for different segments of the mapped trails also increases the complexity of the mapping
process and slows it down.
Two efficient options for characterizing the resource condition of ITs include taking
representative resource condition photos of ITs during the census mapping fieldwork and writing
a resource condition summary for each area mapped. Both these options are included in the
standard procedures.
More comprehensive and accurate quantitative data on the resource conditions of IT networks
can be collected with the Line Transect Procedures described previously, or by adding optional
grid-based trail condition assessment described here. Better data can be collected when
assessments are performed at specific sample points rather than for trail segments. Point data can
be averaged to obtain a more accurate and robust estimate of IT conditions for various areas.
A recommended method for efficiently sampling IT networks during or after census mapping is
to create a grid superimposed on the CMA and viewable on the GPS. The size of the grid
spacing (e.g., 25m) determines the number of sample points that are collected and could vary by
CMA based on trail density. Survey staff stop at each IT/grid intersection and assess trail
conditions for any subset of the indicators described in the Access Survey. For efficiency, assess
trails only the first time they cross a grid line segment i.e., don’t assess a second crossing within
the same grid cell.

APPENDIX 2: TRAIL MONITORING WORK FLOW
Page 88
POINT SAMPLING SURVEY
Objectives
This survey provides more accurate quantitative assessments for a variety of trail condition
indicators on selected formal or informal trails whose alignments are relatively static.
Guidance
Managers in the round-table process can identify selected informal or formal trails for which
more accurate data are required, perhaps to evaluate their condition in relation to standards of
quality or evaluate the efficacy of management actions. Prior to fieldwork, managers must define
the beginning and endpoints of each trail segment to be assessed and the point sampling interval
(e.g., 200 or 300 ft). Sample points can be generated with a VB script (Points on Poly) with a
GIS, incorporating a random start. The selected sample points are then downloaded to a GPS
device and field staff can navigate to these same sample points during each monitoring
assessment to assess tread conditions.
Methods
Materials
o Field manual, data/photos from prior surveys, paper data forms and pencil for backup.
o Trimble GPS, charged battery(s), antenna, stylus, appropriate data dictionary.
o Tape measure, 6 ft.
o Clinometer
o Compass
o Telescopic antenna or presentation pointer (extending to 4 ft).
o Geotag-enabled digital camera that links with Trimble GPS position data (preferred).
Option: use a standard digital camera, set it’s time date/time to match the Trimble
unit, and use a software program that matches date/time stamps to record location
data to the photo file (geotagging).
Field Procedures:
Open TerraSync on the GPS and select the Data screen to create a new rover file. Select the
point sampling data dictionary from the pick list.
Select the Map screen and open the Layers dialog. Select the Setup screen, and open the
Logging Settings dialog. Ensure logging intervals for all features in the data dictionary are
set to 1 second and are based on time, not distance. Logging velocity is unnecessary, set H-
Star logging to Auto, and set Allow Position Update to Confirm.
Start a line feature to map the trail you are assessing. Navigate to the first trail sample point,
if it is located off-trail then move to the closest point on the trail perpendicular to the point
location . Rejection of a sample point: During the first survey, there may be rare occasions
when you need to reject a sample point due to the presence of uncharacteristic settings, like
trail intersections, stream-crossings, and other odd uncommon situations. The data collected
at sample points should be roughly ―representative‖ of the adjacent sections of trail on either
side of the sample point. Use your judgment but be conservative when deciding to relocate a
sample point. The point should be relocated by moving forward along the trail an additional
30 ft to remove the bias of subjectively selecting a point.

APPENDIX 2: TRAIL MONITORING WORK FLOW
Page 89
At each sample point, collect a ―PS_Point‖ with the GPS and enter the indicator assessment
data and photo numbers associated with that point. Assess the eight indicators included in the
optional Access Survey protocols (see also guidance in Figure 2) and the additional
indicators included below.
8) Secondary Treads (ST): Count the number of trails (excluding the sampled trail), regardless
of their length, that closely parallel the sampled trails at the sample point. These are trails that
split from and return to the sampled trail, remaining within 10 feet.
9) Trail Grade (TG): Two field staff should position themselves on the trail 5 ft either side of
the transect. A clinometer is used to determine the grade (% slope) by sighting and aligning
the horizontal line inside the clinometer with a spot on the opposite person at the same height
as the first person's eyes. Note the percent grade (right-side scale in clinometer viewfinder)
and record (indicate units used). Note: if conducted by one person then place clinometer on a
clipboard with the window facing you. Orient the clipboard to be parallel to the trail grade
and record degrees off the visible scale in the window. Be sure to note the units (degrees)
and convert the data to percent slope = [tan (degrees)] x 100 after field work.
10) Trail Slope Alignment Angle (TSA): Assess the trail’s alignment angle to the prevailing land-
form in the vicinity of the sample point. Position yourself about 5 ft downhill along the trail
from the transect and sight a compass along the trail to a point about 5ft past the transect;
record the compass azimuth (0-360, not corrected for declination) on the left side of the
column. Next face directly upslope (i.e., the fall line where water would flow downhill from
a point 15-20 ft away to your feet), take and record another compass azimuth - this is the
aspect of the local landform. The trail’s slope alignment angle (<900) is computed by
subtracting the smaller from the larger azimuth (done after data entry). Note, if water would
flow down to the transect from both sides and there is nothing lower than the trail (i.e., water
would drain down the tread), then record the same azimuth measure. If water would flow
down to a lower area next to the trail then the trail at that point is still assessed as a side-hill
trail.
11) Digital Photographs: Take a photo of the transect from directly above, looking down and
including the transect endpoints. This photo will help confirm, explain, or illustrate the
transect substrate classes or to verify field estimates and allow assessments if there is missing
data. Also take an oblique photo standing 5-10 feet away from the transect that captures the
entire transect and preferably some distinctive background features. This photo will help in
relocating the transect in the future once the GPS units gets field staff within a few meters.
Check both photos for quality and retake if they have poor exposures or focus. Record these
photo numbers in the GPS unit so they can be georeferenced.
Collect all equipment and move on to the next sample point.

APPENDIX 2: TRAIL MONITORING WORK FLOW
Page 90
ROUTE FINDING EXPERIENCE SURVEY
Objectives
This survey is used to inventory the hiker’s Route Finding Experience (RFE) as they move
through backcountry travel corridors identified by the roundtable. Data is used to inform and
direct future monitoring decisions (e.g., data showing that it is easy to travel through an area on
trails might suggest the need for LTS or CMA mapping). These data inform managers about the
degree to which visitors engage in active route finding decision-making while hiking, as opposed
to traveling along a visually obvious trail for long distances.
Guidance
Survey is to be performed by backcountry staff and/or visitors who are given Garmin GPS units.
A timer will signal data collection every 15 minutes. The data collector may also collect a data
point whenever they feel their RFE has changed from one ―level‖ to another.
Methods
Materials Needed
o RFE instructions sheet
o Garmin GPS with spare batteries
o Timer (watch/snooze alarm or repeating countdown timer)
Field Procedures: Data collector embarks on a backcountry trip, starting the repeating timer to
alarm every 15 minutes.
The Garmin GPS is turned on and a track log is initiated.
When the alarm sounds it is reset and begins counting down again. When each alarm sounds,
the data collector creates a waypoint and appends their RFE code (Class R1 - R4, see
descriptions below) for the last 50 ft of their hike. (WP # - R#). Optional: Enter the WP #
into a notebook to add descriptive comments, include survey date.
In addition to the time interval waypoints, the collector should stop and record a RFE
Waypoint whenever they feel their RFE has changed. The collector can switch to a longer
time interval (1/2 hour to 1 hour suggested) when they feel they have moved into a consistent
RFE area. They should still collect waypoints when they feel RFE has changed in addition to
the longer time interval waypoints.
Upon completion, field staff should prepare a written account of additional trip information,
additional reflections on the trip, the spatial distribution of use impacts, and suggestions for
future RTE surveys.
RTE Class Descriptions
Class R1 - I am spending more time off trails than on trails. It is difficult to piece together trails
or routes that take me in the direction I want to travel and bushwhacking is often required.
Class R2 - I am walking on a trail most of the time, but I have to remain alert and make frequent
choices about which trails to follow. Occasional short trail gaps may exist and periodic
backtracking and/or bushwhacking are required.
Class R3 - I am generally always on a trail, and can easily navigate along trails in the direction I
want to travel.

APPENDIX 2: TRAIL MONITORING WORK FLOW
Page 91
APPENDIX 2: TRAIL MONITORING WORK FLOW
This Appendix contains information to assist field staff in the collection of field data, specifically
the pre-fieldwork set-up tasks and the post-fieldwork data processing tasks.
Data Dictionaries
Access.ddf
Line Transect Sampling.ddf
Census Mapping.ddf
Point Sampling.ddf
Pre-fieldwork Setup Tasks
1. Load necessary data dictionary(s) sample region and background data sets onto the
Trimble GPS(s).
2. Ensure that batteries are charged and ancillary equipment is ready for use:
a. External batteries,
b. Antennas and leads,
c. Backpack antenna mount,
d. Clinometer, digital camera, and measurement tools as required by sampling
protocol to be implemented,
e. Logbook and forms as needed.
3. Create and print schematic/directions to get to sampling area (if needed).
Field Tasks
1. Navigate to the sampling location(s).
2. Implement required sampling protocols(s).
3. Fill in logbook indicating work completed, dates, and field staff names.
4. Return equipment to office with completed logbook and written summaries.
Data Post-Processing Tasks
This guidance provides an outline for post-processing GPS data and implementing an organized
and easily transferable/updateable spatial database. Post-processing and creation/integration of
spatial datasets should be done by a single person, preferably by a GIS staff member. When
transferring the data to the GIS staff, field staff should include a brief narrative describing the
GPS data. This narrative should include:
Date(s) of collection
Field staff names and contact information
Type of survey(s) collected
Area of collection
Additional comments or notes that may be pertinent

APPENDIX 2: TRAIL MONITORING WORK FLOW
Page 92
Suggested Protocols
Use Trimble’s Pathfinder Office software to post-process data (differentially correct, edit and
convert to ESRI shapefiles). Staff should be careful to not create redundant datasets, and to name
files using a system that allows for integration into existing park datasets.
Always work in one Pathfinder Office Project (do not create a new project each time you
correct data)
Download data from GPS devices.
Verify the contents vs. logbook and note any discrepancies (contact field staff to resolve).
Differentially correct GPS data.
Name Files appropriately and/or maintain a spreadsheet with a key to interpret default
GPS rover/pathfinder file names.
Export data to ESRI shapefile using a template that creates shapefiles with desired
attributes and coordinate system. Clean up and recode attribute data, enter paper form
data as needed.
Integrate Shapefiles into existing ArcMAP Spatial Databases
Use standardized file naming conventions with file storage in separate project folders and
maintain appropriate back-up and archiving of datasets.
Monitoring Tasks
1. Create summary data (maps, tables, photo compilations).
2. Prepare comparisons between zones/areas of interest and across time
a. Calculate % and absolute change/difference,
b. Prepare maps to facilitate visual comparison of spatial data.
3. Update monitoring/sampling plans/zones:
a. Based on datasets coming in and comparisons to other times and/or locations,
b. Based on input from field staff, rangers, etc.
Route Finding Experience (RFE) Tasks
1. Coordinate sampling efforts/training with backcountry permit office:
a. Provide written RFE/Garmin user instructions,
b. Develop sampling schedule/plan,
c. Distribute and collect Garmin GPS units from backcountry office.
2. Download and convert Garmin Data to GIS data (use MN DNR software).
3. Integrate field notes and attribute RFE point data as needed.
4. Prepare summary maps:
a. Interpolate surface from data if sufficient points exist,
b. Color code point data for visual comparison of RFE data,
c. Calculate distance to nearest trail/road,
d. Summarize distance(s) to RFE points by RFE class.
5. Maintain an appropriate back-up of datasets using appropriate naming conventions.
6. Integrate RFE data with IT spatial datasets (from other protocols above):
a. Spatially analyze RFE data relative to IT networks and other park infrastructure,
b. Compare data sets at differing times and varied locations within park.