Embed Size (px)
Citation preview

http://mdm.sagepub.com/Medical Decision Making
http://mdm.sagepub.com/content/32/6/831The online version of this article can be found at:
DOI: 10.1177/0272989X12447241 2012 32: 831 originally published online 23 May 2012Med Decis Making
Olga Kostopoulou, J. Edward Russo, Greg Keenan, Brendan C. Delaney and Abdel DouiriInformation Distortion in Physicians' Diagnostic Judgments
Published by:
http://www.sagepublications.com
On behalf of:
Society for Medical Decision Making
can be found at:Medical Decision MakingAdditional services and information for
http://mdm.sagepub.com/cgi/alertsEmail Alerts:
http://mdm.sagepub.com/subscriptionsSubscriptions:
http://www.sagepub.com/journalsReprints.navReprints:
http://www.sagepub.com/journalsPermissions.navPermissions:
What is This?
- May 23, 2012OnlineFirst Version of Record
- Nov 30, 2012Version of Record >>
at Kings College London - ISS on January 8, 2013mdm.sagepub.comDownloaded from

Information Distortion in Physicians’Diagnostic Judgments
Olga Kostopoulou, PhD, J. Edward Russo, PhD, Greg Keenan, MSc,Brendan C. Delaney, MD, Abdel Douiri, PhD
Background: Information distortion suggests that peoplechange the evaluation of new information to support anemerging belief. The present study was designed to mea-sure the extent to which physicians distort incoming med-ical information to support an emerging diagnosis.Design: Data were collected via an anonymous question-naire. The experimental group (102 physicians) read 3patient scenarios, each with 2 competing diagnoses.Physicians first read information that favored 1 of the 2diagnoses (the ‘‘steer’’). They then rated a series of neutralcues that favored neither diagnosis. At each cue presenta-tion, respondents rated the extent to which cues favoredeither diagnosis and updated the strength of their diagnos-tic belief. After the neutral cues in the third scenario,respondents rated cues that opposed the initial steer.A control group (36 physicians) rated all the cues in ran-dom order and not within scenarios, thus providing unbi-ased baseline ratings for calculating distortion in theexperimental group. Results: Distortion was statistically
significant (P \ 0.001) and was associated with thestrength of belief in the leading diagnosis. Physicianswith over 10 years in practice distorted less thantheir less experienced counterparts (x– = 1.04 v. x– = 1.78,P \ 0.05). Having developed an initial diagnostic leaningconsistent with the steer, 56% of physicians remainedcommitted to it after receiving the conflicting cues. Distor-tion was strongly associated with commitment to the steer(odds ratio, 1.4; 95% confidence interval, 1.03–1.79;P = 0.03). Limitations: Physicians did not elicit informa-tion; therefore, the authors cannot estimate the size ofdistortion in tasks involving information search. Conclu-sions: Distortion could partly explain commitment ofphysicians to an early diagnosis. Both distortion andstrength of initial diagnostic belief seem to decline after10 years in family medicine. Key words: cognitive bias;diagnostic reasoning; information distortion; confidence;commitment; experience. (Med Decis Making 2012;32:831–839)
People have been found to bias their interpreta-tion of information to support a valued position1
and consolidate a decision.2 Furthermore, peoplehave been shown to bias their interpretation ofnew information to support an emerging positionduring the decision-making process.3,4 As oneoption emerges as the leader in overall preferenceor judgment, the evaluation of new informationtends to be ‘‘distorted’’ toward supporting thatoption, before a final decision is declared. Theimplication of such predecisional distortion of
information is that decision makers seem to be per-suading themselves of the continued superiority ofthe leading option. This ‘‘emerging’’ version of thebias has been observed even when it is clearly unde-sirable and has demonstrably negative effects on thechoice itself.5 The bias is thought to be driven by theneed for coherence, which dictates that judgmentsbe consistent with the information on which theyare based.4,6
Predecisional distortion of information has beenfound in auditors and salespersons,7 prospectivejurors,8 professional boxing judges,9 racetrack bet-tors10 and the general population.11 Wallsten foundthat physicians sometimes used irrelevant informa-tion about normal findings to reduce the strength oftheir diagnostic beliefs, when such informationshould not have been used at all.12 However, hismethod was indirect, and he had access to only 6physicians as study participants. Kostopoulou,Mousoulis, and Delaney13 found that family physi-cians differed in the way that they evaluated
Received 11 November 2011 from King’s College London, London,United Kingdom (OK, GK, BCD, AD), and Cornell University, Ithaca,New York (JER). Revision accepted for publication 15 February 2012.
Address correspondence to Olga Kostopoulou, PhD, King’s CollegeLondon, School of Medicine, Department of Primary Care and PublicHealth Sciences, Capital House, 42 Weston Street, London SE13QD, UK; e-mail: [email protected].
DOI: 10.1177/0272989X12447241
MEDICAL DECISION MAKING/NOV–DEC 2012 831
at Kings College London - ISS on January 8, 2013mdm.sagepub.comDownloaded from

information (as well as in the amount and type ofinformation elicited), according to the diagnosisthat they eventually gave, when faced with a realistic,computer-driven patient scenario. However, infor-mation evaluation by physicians was assessed onthe basis of stimulated recall—that is, postdecision-ally. The current study is the first to attempt to 1)use a direct method to measure distortion in physi-cians and to do so 2) during, rather than after, thediagnostic process.
There are several reasons why physicians might beless prone than other professional groups to the bias.First, diagnosis is a highly technical skill: a long periodof medical education and training is devoted to teach-ing accurate diagnostic inference from the assembledmedical evidence. Second, the evidence gathered fordiagnosis has an objective diagnostic value in termsof which diagnosis it favors and by how much, whichis derived from research. This may not be the case inother domains of professional judgment. Third, diag-nostic errors can have serious implications for patientsin terms of harm or death and can lead to litigation.Therefore, clinical reasoning ought to be driven byaccuracy rather than coherence goals.1 Given physi-cians’ extensive training, pressure for evidence-baseddecisions, and accountability for good patient out-comes, we expected them to exhibit less informationdistortion than that of other professionals.
METHODSMaterials
Three patient scenarios were constructed using anextensive evidence review conducted for a previousstudy.14 Each scenario had 2 competing diagnosesthat are common in family medicine:
1. Chest pain scenario—musculoskeletal diagnosis v.cardiac diagnosis.
2. Dyspnea scenario—chronic obstructive pulmonarydisease v. left ventricular failure.
3. Fatigue scenario—diabetes v. depression.
The information for each scenario (‘‘cues’’) con-sisted of symptoms and signs that could be obtainedthrough history and physical examination. Two sce-narios contained results of investigations (restingelectrocardiogram and random blood glucose).Some cues were ‘‘diagnostic’’—that is, supporting 1of the 2 competing diagnoses—while others were‘‘neutral’’ and supported neither diagnosis. Neutralcues were relevant to the scenarios; specifically,they were cues that a physician deciding betweenthe 2 diagnoses could well have requested. However,
their values would not help to differentiate betweenthe 2 diagnoses.
Each scenario contained 4 parts: a presenting prob-lem and 3 sets of medical cues. The presenting prob-lem consisted of a brief patient description (name,age, and sex) and the main symptom (chest pain, dysp-nea, or fatigue). One set of cues contained neutral cuesonly, and the other 2 sets contained diagnostic cuesonly. One set of diagnostic cues favored 1 diagnosis,and the other set favored the opposing diagnosis.
Participants
In sum, 138 family physicians in the United King-dom took part in the study: 67% women, 25% train-ees, 25–68 years old (x– = 40, s = 11), and 0–39 yearsof experience in clinical practice (x– = 11, s = 11;0 denotes trainees). Of the 138 participating physi-cians, 102 saw the 3 scenarios, and 36 served as con-trols, according to an established method of havinga separate control group for the measurement of dis-tortion (see Procedure section).15,16
Data were collected via an anonymous printedquestionnaire distributed at conferences and educa-tional meetings for family physicians. At conferen-ces, respondents were compensated with a £10 giftcertificate for a book. At educational meetings, datawere collected from the audience at the start of themeeting, and feedback about the group results wasoffered at the end. The study received ethicalapproval by a research ethics committee in London(Wandsworth REC, approval No. 10/H0803/36).
Procedure
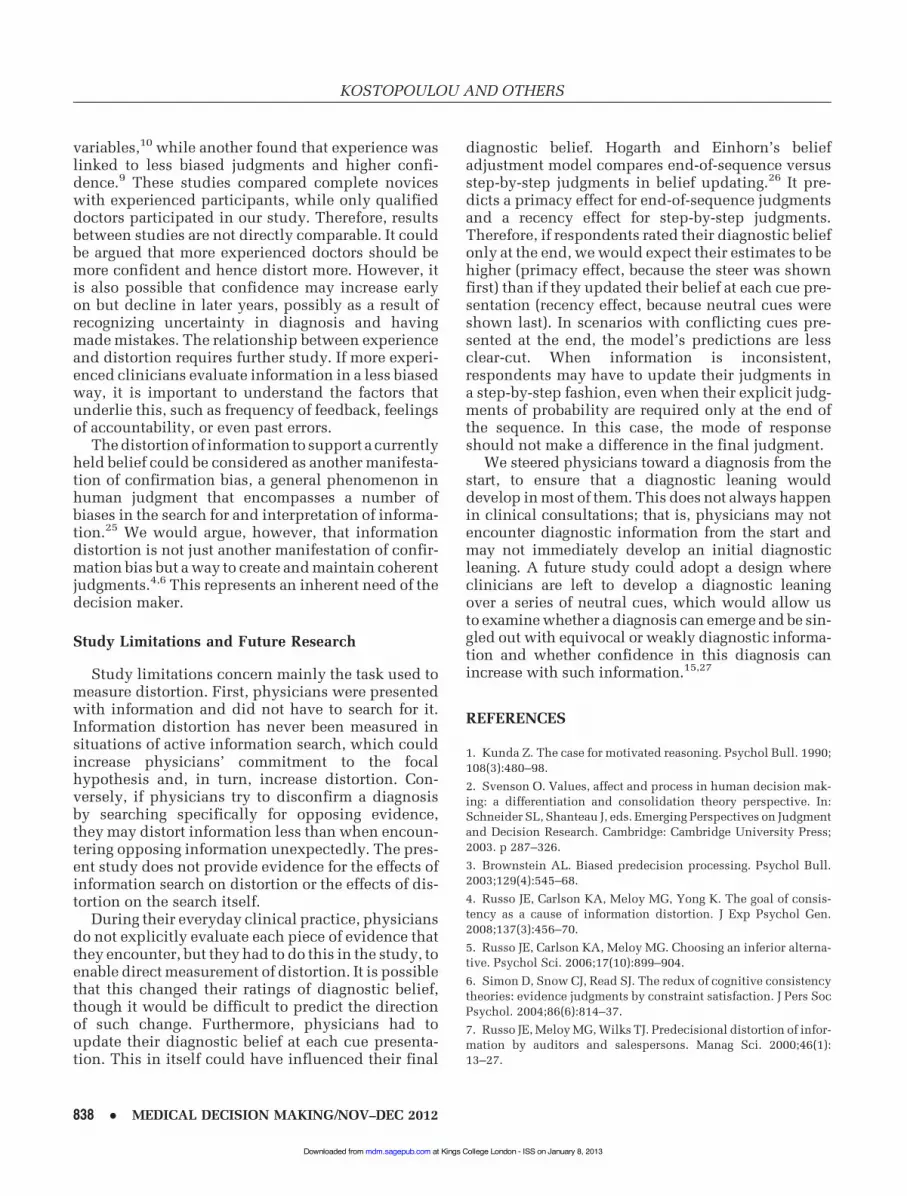
The experimental group. The physicians in theexperimental group read the 3 patient scenarios, pre-sented in a counterbalanced order. Each scenariostarted with the patient’s presenting problem, whichwas immediately followed by a set of diagnosticcues (step 1 in Figure 1). This initial set of diagnosticcues intended to create a diagnostic leaning: ‘‘thesteer.’’ Half the participating physicians received thesteer favoring one diagnosis, and the other halfreceived the steer favoring the competing diagnosis.Physicians were then asked to rate the likelihood ofthe cause of the patient’s problem, assuming thatthere were only 2 mutually exclusive diagnoses.They were given a 21-point scale, with verbal anchorsat 10 = diagnosis A more likely, 0 = equally likely, and10 = diagnosis B more likely. This initial rating ofdiagnostic belief identified whether the steer was suc-cessful in creating the diagnostic leaning intended.
KOSTOPOULOU AND OTHERS
832 ! MEDICAL DECISION MAKING/NOV–DEC 2012
at Kings College London - ISS on January 8, 2013mdm.sagepub.comDownloaded from

Step 2: Neutral cues presented sequentially, in random order, one cue with its ratings per page.
- Patricia says: “I don’t feel like doing very much in the evenings other than watching TV.”
How much does this item of information favour either diagnosis?
Given all the information provided so far, please rate your estimated likelihood of the cause of Patricia’s fatigue.
- Patricia says: “As far as I know, the only person with diabetes in my family is one of my cousins.”
How much does this item of information favour either diagnosis?
Given all the information provided so far, please rate your estimated likelihood of the cause of Patricia’s fatigue.
- Patricia says: “I’ve lost about half a stone over the last 3 months.”
How much does this item of information favour either diagnosis?
Given all the information provided so far, please rate your estimated likelihood of the cause of Patricia’s fatigue.
Step 3 (only in 3rd scenario in the sequence): Conflicting cues
- Patricia says: “Nothing seems like much fun at the moment, even seeing my friends.”
How much does this item of information favour either diagnosis?
Given all the information provided so far, please rate your estimated likelihood of the cause of Patricia’s fatigue.
- Patricia says: “I’ve been generally feeling a bit low about everything.”
How much does this item of information favour either diagnosis?
Given all the information provided so far, please rate your estimated likelihood of the cause of Patricia’s fatigue.
- Patricia says: “I find concentrating quite difficult and often my mind wanders.”
How much does this item of information favour either diagnosis?
Given all the information provided so far, please rate your estimated likelihood of the cause of Patricia’s fatigue.
Step 1: Presenting problem and steer
Patricia Aldridge, 52, presents with fatigue for the past 2 months.
Patricia says: “I get up a couple of times a night to go to the loo but it’s probably because I’ve been drinking more fruit juice than usual.” Her BMI is 30. You measure her random blood glucose level, which is 7.5 mmol/l. (Steer favoring diabetes)
Assuming that there are only 2 mutually exclusive diagnoses, please rate your estimated likelihood of the cause of Patricia’s fatigue. (1st rating of diagnostic belief)
Figure 1 Steps in cue presentation and elicitation of ratings, using the fatigue scenario as an example.
PHYSICIANS’ INFORMATION DISTORTION
ORIGINAL ARTICLES 833
at Kings College London - ISS on January 8, 2013mdm.sagepub.comDownloaded from

The neutral cues were then presented to the physi-cians, each on a separate page and in random order(step 2 in Figure 1). They were 4 or 5, depending onthe scenario. Below each cue, there were 2 similar21-point scales. The first asked participants to ratehow much the cue favored one diagnosis over theother (10 = favors diagnosis A, 0 = favors neither, 10= favors diagnosis B). The second asked them torate the likelihood of the cause of the patient’s prob-lem, given all the information up to that point.
The first 2 scenarios ended with these neutral cues.In the third scenario only, the neutral cues were fol-lowed by a set of diagnostic cues that opposed thesteer (step 3 in Figure 1). These too were presentedon separate pages and in random order. This finalset of cues made the total information for the thirdscenario neutral, favoring neither diagnosis. By con-fronting physicians with conflicting informationlate in the diagnostic process, we tested whether dis-tortion would contribute to preserving the initialdiagnostic leaning. Note that conflicting cues werepresented at the end of the third scenario only, toavoid respondents detecting a pattern and expectingconflicting information at the end of every scenario.
The control group. The 36 physicians in the con-trol group provided unbiased baseline ratings of allthe available cues, neutral and diagnostic, pre-sented in a random order. The patient’s age, sex,and presenting problem (chest pain, dyspnea, orfatigue) were given for each cue. To prevent therespondents from spontaneously forming a coherentimpression of a patient and distort cues thereafter,3 precautions were taken: First, each cue referredto a different patient, denoted by a letter—for exam-ple, patient X, patient D. Second, age varied by upto 4 years, above or below the age in the corre-sponding scenario (the sex always matched that ofthe patient in the scenario). It was deemed thatsuch small variations in age were not clinically sig-nificant. Finally, 3 decoy cues relating to 3
completely different pairs of diagnoses were inter-spersed in the questionnaire.
The 36 physicians in the control group providedratings of each cue—that is, of how much the cuefavored 1 of 2 diagnoses, using the same 21-pointscale with the same diagnoses at either end, as seenby the experimental group in the scenarios. Theywere never asked to estimate diagnostic likelihood.Since they had no opportunity to build a workingdiagnosis, their mean cue ratings served as the ‘‘unbi-ased’’ diagnosticity of each cue, relative to which thedistortion of the experimental group was calculated.
Computation of distortion. The distortion of eachcue’s evaluation by the experimental group was cal-culated as follows (Figure 2).7,15 First, the absolute dif-ference was computed between each individual cuerating and its mean control rating. Then, this differ-ence was signed positively or negatively dependingon whether it pointed toward or away from the leadingdiagnosis (i.e., the diagnosis indicated as being morelikely immediately before the cue was seen). This mea-sure of distortion has been termed leader-signed dis-tortion.16 If the immediately previous rating on thediagnostic likelihood scale was 0—that is, the diagno-ses were deemed equally likely—then distortion couldnot be computed, as there was no currently leadingdiagnosis to distort toward.
ANALYSES
Since each physician provided several observa-tions, we expected that these observations were notindependent. Therefore, we report the mean distor-tion after it was averaged per physician, and we usethese per-physician means in subsequent analyses.A 1-sample t test was used to determine whether dis-tortion was significantly different from 0. A pairedt test was used to test for differences in distortionbetween neutral and diagnostic cues. One-way
Patricia says: “I don’t feel like doing very much in the evenings other than watching TV.”
10 8 6 6 5 51 0 1 8 10
|____|____|____|____|____|____|____|____|____|____|____|____|____|____|____|____|____|____|____|____|
Favors Favors FavorsDiabetes neither Depression
Mean control rating Cue rating by a physician
2 23 34 47 7 99
Figure 2 Calculation of information distortion of an individual cue rating by a physician who currently thinks that depression is morelikely (5 – 2 = 13). If the physician thought that diabetes was more likely before seeing this cue, distortion would have been –3.
KOSTOPOULOU AND OTHERS
834 ! MEDICAL DECISION MAKING/NOV–DEC 2012
at Kings College London - ISS on January 8, 2013mdm.sagepub.comDownloaded from

analysis of variance was used to test for differences indistortion between steers.
Physician experience was not normally distrib-uted, due to 33% of the experimental group beingtrainees (0 years in family medicine). Following the‘‘10-year rule’’ in the expertise literature,17,18 we par-titioned the sample into physicians with . 10 yearsin practice (n = 40) and physicians with " 10 yearsin practice (n = 62). We employed independent-sam-ples t tests to measure differences in distortionbetween the 2 groups. To ensure that any relationshipwith distortion did not depend on the specific cutoffpoint chosen to dichotomize the experience variable,we performed the same comparisons with 2 differentcutoff points, above and below 10 years (8 and 12years). Finally, Spearman rho was used to measurethe correlation between experience (continuous vari-able) and distortion.
Previous research has found a linear relationbetween how strongly a decision maker is leaningtoward one option and how much the subsequentcue is distorted to support that leaning.15 That is, con-fidence in the current leader drives the size of the dis-tortion of incoming information (‘‘leader-drivendistortion’’).16 To test whether information distortionincreased with increasing diagnostic belief, a multi-level linear random coefficients model was built,with diagnostic belief as the predictor, distortion asthe dependent variable, and physician as the group-ing variable.16,19 The model paired the distortion ofeach cue with the immediately preceding diagnosticbelief rating. Absolute values were used for the diag-nostic belief ratings because the direction of the rela-tionship—that is, whether distortion favored thecurrently leading diagnosis or not—was already con-tained in the sign of the distortion values.
We also investigated physician commitment to thesteer, which we defined as leaning toward the steer
from start to end. This required that, having acceptedthe steer, physicians never switched diagnoses—thatis, never crossed to the other side of the diagnosticlikelihood scale and never showed indifference(diagnoses equally likely) at any point during thethird scenario. Commitment to a diagnosis favoredearly in the process has been linked to diagnosticerror.20–23
Differences in physician commitment by experi-ence group and steer were examined with x2 tests.Finally, logistic regression was employed to measurethe influence of mean distortion on physiciancommitment.
RESULTS
Mean distortion was 1.5 (s = 1.57), statistically sig-nificant (t = 9.56, df = 101, P\0.001), and equivalentto 7.6% of the scale. There were no differences in dis-tortion between neutral and diagnostic cues (x– = 1.51for neutral, x– = 1.47 for diagnostic, P = 0.895). How-ever, we cannot firmly conclude that both types ofcues were distorted equally, because of the unequalnumber of observations: each physician saw 14 neu-tral cues across scenarios and only 3 diagnosticcues at the end of the third scenario. Distortion dif-fered significantly by steer, F(5,298) = 8.048, P \0.001: in each scenario, one steer was associatedwith higher distortion than the other steer (Table 1).
As expected, a relationship was found betweenstrength of belief in the currently leading diagnosisand distortion of the next cue. The mean slope ofthis relationship in the multilevel model was 0.3(95% confidence interval [CI]: 0.21–0.38, P \0.001), indicating that for a 1-unit increase in diag-nostic belief, distortion of the next cue increased by0.30 units on average.
Table 1 Final Diagnoses in the Third Scenario and Mean Distortion by Steer
Steer Chosen as the Commitment to Mean DistortionThird Scenario Steer Final Diagnosis % (n) Steer % (n) (All Scenarios)
Chest pain (n = 32) MSK 53 (8/15) 73 (8/11) 2.42Cardiac 53 (9/17) 47 (8/17) 0.64
Dyspnea (n = 35) COPD 12 (2/17) 20 (2/10) 1.16LVF 78 (14/18) 93 (14/15) 2.30
Fatigue (n = 34) Diabetes 29 (5/17) 31 (5/16) 0.43Depression 65 (11/17) 65 (11/17) 1.59
Total (n = 101) 49 (49/101) 56 (48/86)
Note: ‘‘Steer chosen as the final diagnosis’’: the denominator is the number of times that a diagnosis was the scenario steer. ‘‘Commitment to steer’’: thedenominator is the number of times that physicians accepted the steer. MSK, musculoskeletal; COPD, chronic obstructive pulmonary disease; LVF, leftventricular failure.
PHYSICIANS’ INFORMATION DISTORTION
ORIGINAL ARTICLES 835
at Kings College London - ISS on January 8, 2013mdm.sagepub.comDownloaded from

Experience-Related Differences
The highly experienced physicians (. 10 years inpractice) exhibited significantly lower distortionthan their less experienced counterparts (x– = 1.04 v.x– = 1.78, respectively, t = 2.37, df = 100, P = 0.020).When the experience variable was dichotomized at2 different cutoffs (8 and 12 years), group differencesremained significant (P = 0.017 and P = 0.024, respec-tively). A ranked correlation between experience anddistortion was negative, though significance was bor-derline (Spearman rho = –0.17, P = 0.081, 2-tailed).The highly experienced physicians also gave signifi-cantly lower ratings to the initial diagnosis than theless experienced physicians (x– = 5.10 v. x– = 5.95, t =2.10, df = 100, P = 0.038). When mean distortionwas regressed on experience (binary variable) con-trolling for the strength of initial diagnostic belief,both predictors were found to exert independentinfluence on distortion (coefficient, –0.61, P =0.053, for experience; coefficient, 0.15, P = 0.055,for belief), suggesting that, after 10 years of practicingfamily medicine, distortion decreases on average by0.61 units.
To identify any physicians who were genuinelydistortion-free, we applied 2 criteria. The first crite-rion was very low mean distortion (\ 0.100). Asthis was based on only 17 observations per physician,a low mean could have occurred by chance. Thus, weapplied a second criterion: each physician’s slope,provided by the multilevel model. An equally lowslope (\ 0.100) ensured no systematic relationbetween strength of belief and distortion. We identi-fied 15 physicians who had both mean distortionand slope \ 0.100. Nine of these (60%) were highlyexperienced, compared to 39% of experienced physi-cians in the whole sample.
Commitment to Steer
Of the 102 physicians in the experimental group,one did not complete the third scenario. This resultedin a total of 305 responses across scenarios for furtheranalysis (101 in the third scenario). The steer manip-ulation was successful in creating an initial leaningtoward the intended diagnoses in 87% of theresponses (265/305). Of the 40 occasions where thesteer did not initially persuade a physician, most(29/40, 72.5%) suggested indifference (i.e., diagnosesequally likely), reflecting perhaps a wait-and-seeapproach in the knowledge that more informationwas coming. On 11 of 40 occasions (27.5%), theopposing diagnosis was considered more likely.
The steer was chosen as the final diagnosis in thethird scenario by 49% of physicians (49/101). Thisproportion varied widely between the 2 opposingsteers in 2 scenarios: in the dyspnea scenario, thechronic obstructive pulmonary disease steer was cho-sen by only 12% of physicians as the final diagnosis,while the competing steer (left ventricular failure)was chosen by 78% of the physicians. In the fatiguescenario, the diabetes steer was chosen by a third ofthe physicians, and the competing depression steer,by two thirds. Both these highly chosen steers (leftventricular failure and depression) were linked tohigher mean distortions than their competing steers(Table 1).
In the third scenario, the steer was accepted as theinitial diagnosis by 86 of the 101 physicians. Of these,48 showed unwavering commitment to the steer fromstart to end (56%, Table 1). Commitment differed bysteer (x2 = 20.03, df = 5, P = 0.001). The most-commit-ted-to steers (musculoskeletal, left ventricular fail-ure, and depression) were associated with highermean distortions than their opposing steers. Commit-ment did not differ by physician experience (P = 0.47)but did differ by sex. In further exploratory analyses,female physicians were found to remain committedto the steer more frequently than male physicians(57% v. 34%, x2 = 4.95, df = 1, P = 0.026). It shouldbe noted that there were no sex-related differencesin distortion (P = 0.82), in the rate of accepting thesteer as the initial diagnosis (P = 0.39), or in thestrength of the initial diagnostic belief (P = 0.76). Fur-thermore, male and female physicians were repre-sented equally frequently in the low and highexperience groups (P = 0.15).
When commitment was regressed on mean distor-tion in the third scenario, a significant effect wasfound: the odds ratio for distortion was 1.4 (95% CI:1.10–1.68, P = 0.005), suggesting a 40% increase inthe odds of committing to the steer with a 1-unitincrease in distortion. When the model was adjustedfor steer (6-level categorical variable), predictionimproved substantially: the area under the receiveroperating characteristic curve increased from 0.69(95% CI: 0.58–0.79) to 0.80 (95% CI: 0.72–0.89),while distortion remained significant: odds ratio =1.4, 95% CI: 1.03–1.79 (P = 0.03).
In the third scenario, the total information wasdesigned to be neutral—that is, to favor neither diag-nosis. When the mean control ratings were averagedacross cues in the chest pain scenario, the total infor-mation slightly favored the cardiac diagnosis (1.51 onthe 0–10 scale). In the dyspnea scenario, the totalinformation was neutral (0.25 on the 0–10 scale). In
KOSTOPOULOU AND OTHERS
836 ! MEDICAL DECISION MAKING/NOV–DEC 2012
at Kings College London - ISS on January 8, 2013mdm.sagepub.comDownloaded from

the fatigue scenario, the total information slightlyfavored depression (1.23 on the 0–10 scale). Physi-cians should therefore have rated the diagnoses asequally likely or indicated low diagnostic belief atthe end of the scenario. Only 6 physicians consideredthe diagnoses equally likely. The mean final diagnos-tic belief across the sample was 4.60, which could beinterpreted as substantial belief in either of the com-peting diagnoses on the 0–10 scale.
DISCUSSION
This is the first study to directly measure the size ofpredecisional information distortion in physicians,consolidating evidence from earlier studies thatphysicians do distort information to support anemerging diagnosis.12,13 In agreement with previousresearch, distortion was associated with the strengthof belief in the leading diagnosis. Furthermore, dis-tortion was associated with physicians’ tendency tostick with their initial diagnosis, even when discon-firming information was presented to them later inthe process.9
Distortion was equivalent to 7.6% of the scale.This can be compared to other published studies ofdistortion that used similar methods. For example,information distortion by auditors was measured ina scenario that required them to decide which of 2publicly traded companies to visit urgently for anaudit.7 Their distortion was equivalent to 7.8% ofthe scale. Higher values for mean distortion are usu-ally reported in the literature—for example, 10% forrepresentatives of a pharmaceutical company decid-ing which physician to visit for a sales call,7 15.5%for prospective jurors judging evidence from a mocktrial,8 and 11.1% for students choosing consumerproducts.15 Auditors are, however, the most compa-rable group of professionals studied to physicians,and their distortion was of similar size. Being an audi-tor usually necessitates a university degree and addi-tional certification, while the technical knowledgeacquired during education and training is directlyused in auditing work.
Within each scenario, both distortion size andfinal diagnostic choice differed by steer. The sourceof these differences is not apparent. They could beattributed either to different base rates of the compet-ing diagnoses or to the total net information not beingperfectly equivocal. Neither of these plausiblehypotheses is satisfactory across scenarios. Bothdyspnea and fatigue—scenarios with the largest dif-ferences between steers—were designed so that the
competing diagnoses had similar base rates. In con-trast, in the chest pain scenario, where there is anobjective difference in the base rates (musculoskele-tal causes of chest pain are more common than car-diac), each steer was chosen as the final diagnosisas equally frequent as the other.
The other possible explanation is that the totalinformation in the third scenario was not equivocalbut favored one of the competing diagnoses morethan the other. When the mean ratings of the controlgroup were averaged across all cues in each scenario,we found this to be the case in 2 scenarios: the cardiacdiagnosis was slightly favored over musculoskeletalin the chest pain scenario, and depression wasslightly favored over diabetes in the fatigue scenario.One would therefore expect these 2 diagnoses to havebeen chosen more frequently than their competitors.However, this happened only with depression. Fur-thermore, the total information was neutral in the sce-nario with the largest differences in the finaldiagnostic choice (dyspnea). Therefore, neither a dif-ference in the base rates nor the possibility of the totalinformation not being equivocal can explain the dif-ferences across scenarios. These differences speakof ‘‘case specificity,’’ a phenomenon that has beenobserved in previous studies of general physicians(primary care or internal medicine) that possiblyreflects differences in the physicians’ knowledgebase. General physicians respond differently to casesfrom different areas of medicine; performance on onecase does not predict performance on another.14,22,24
This emphasizes the need to employ more than 1patient case when studying general physicians’behavior.
There are several positive messages for cliniciansin this study. First, mean distortion across partici-pants was smaller than most other values of distor-tion reported in the literature. This could reflectgreater objectivity in clinical judgments in compari-son to other professionals. Second, even when distor-tion was very large, commitment to the diagnosis wasless than 100%. Third, highly experienced physi-cians distorted less than their less experienced coun-terparts, and some physicians seemed completelyfree of the bias. We should nevertheless acknowledgea potential demand effect: physicians knew that theywere being studied. As a consequence, they may havebeen more careful in their evaluation of the cues thanin a practice setting.
The literature on the relationship among experi-ence, distortion, and confidence (‘‘strength of diag-nostic belief’’ in this study) is not consistent. Onestudy found a positive relationship among all 3
PHYSICIANS’ INFORMATION DISTORTION
ORIGINAL ARTICLES 837
at Kings College London - ISS on January 8, 2013mdm.sagepub.comDownloaded from
variables,10 while another found that experience waslinked to less biased judgments and higher confi-dence.9 These studies compared complete noviceswith experienced participants, while only qualifieddoctors participated in our study. Therefore, resultsbetween studies are not directly comparable. It couldbe argued that more experienced doctors should bemore confident and hence distort more. However, itis also possible that confidence may increase earlyon but decline in later years, possibly as a result ofrecognizing uncertainty in diagnosis and havingmade mistakes. The relationship between experienceand distortion requires further study. If more experi-enced clinicians evaluate information in a less biasedway, it is important to understand the factors thatunderlie this, such as frequency of feedback, feelingsof accountability, or even past errors.
The distortion of information to support a currentlyheld belief could be considered as another manifesta-tion of confirmation bias, a general phenomenon inhuman judgment that encompasses a number ofbiases in the search for and interpretation of informa-tion.25 We would argue, however, that informationdistortion is not just another manifestation of confir-mation bias but a way to create and maintain coherentjudgments.4,6 This represents an inherent need of thedecision maker.
Study Limitations and Future Research
Study limitations concern mainly the task used tomeasure distortion. First, physicians were presentedwith information and did not have to search for it.Information distortion has never been measured insituations of active information search, which couldincrease physicians’ commitment to the focalhypothesis and, in turn, increase distortion. Con-versely, if physicians try to disconfirm a diagnosisby searching specifically for opposing evidence,they may distort information less than when encoun-tering opposing information unexpectedly. The pres-ent study does not provide evidence for the effects ofinformation search on distortion or the effects of dis-tortion on the search itself.
During their everyday clinical practice, physiciansdo not explicitly evaluate each piece of evidence thatthey encounter, but they had to do this in the study, toenable direct measurement of distortion. It is possiblethat this changed their ratings of diagnostic belief,though it would be difficult to predict the directionof such change. Furthermore, physicians had toupdate their diagnostic belief at each cue presenta-tion. This in itself could have influenced their final
diagnostic belief. Hogarth and Einhorn’s beliefadjustment model compares end-of-sequence versusstep-by-step judgments in belief updating.26 It pre-dicts a primacy effect for end-of-sequence judgmentsand a recency effect for step-by-step judgments.Therefore, if respondents rated their diagnostic beliefonly at the end, we would expect their estimates to behigher (primacy effect, because the steer was shownfirst) than if they updated their belief at each cue pre-sentation (recency effect, because neutral cues wereshown last). In scenarios with conflicting cues pre-sented at the end, the model’s predictions are lessclear-cut. When information is inconsistent,respondents may have to update their judgments ina step-by-step fashion, even when their explicit judg-ments of probability are required only at the end ofthe sequence. In this case, the mode of responseshould not make a difference in the final judgment.
We steered physicians toward a diagnosis from thestart, to ensure that a diagnostic leaning woulddevelop in most of them. This does not always happenin clinical consultations; that is, physicians may notencounter diagnostic information from the start andmay not immediately develop an initial diagnosticleaning. A future study could adopt a design whereclinicians are left to develop a diagnostic leaningover a series of neutral cues, which would allow usto examine whether a diagnosis can emerge and be sin-gled out with equivocal or weakly diagnostic informa-tion and whether confidence in this diagnosis canincrease with such information.15,27
REFERENCES
1. Kunda Z. The case for motivated reasoning. Psychol Bull. 1990;108(3):480–98.
2. Svenson O. Values, affect and process in human decision mak-ing: a differentiation and consolidation theory perspective. In:Schneider SL, Shanteau J, eds. Emerging Perspectives on Judgmentand Decision Research. Cambridge: Cambridge University Press;2003. p 287–326.
3. Brownstein AL. Biased predecision processing. Psychol Bull.2003;129(4):545–68.
4. Russo JE, Carlson KA, Meloy MG, Yong K. The goal of consis-tency as a cause of information distortion. J Exp Psychol Gen.2008;137(3):456–70.
5. Russo JE, Carlson KA, Meloy MG. Choosing an inferior alterna-tive. Psychol Sci. 2006;17(10):899–904.
6. Simon D, Snow CJ, Read SJ. The redux of cognitive consistencytheories: evidence judgments by constraint satisfaction. J Pers SocPsychol. 2004;86(6):814–37.
7. Russo JE, Meloy MG, Wilks TJ. Predecisional distortion of infor-mation by auditors and salespersons. Manag Sci. 2000;46(1):13–27.
KOSTOPOULOU AND OTHERS
838 ! MEDICAL DECISION MAKING/NOV–DEC 2012
at Kings College London - ISS on January 8, 2013mdm.sagepub.comDownloaded from

8. Carlson KA, Russo JE. Biased interpretation of evidence bymock jurors. J Exp Psychol Appl. 2001;7(2):91–103.
9. Tyszka T, Wielochowski M. Must boxing verdicts be biased? JBehav Decis Mak. 1991;4:283–95.
10. Brownstein AL, Read SJ, Simon D. Bias at the racetrack: effectsof individual expertise and task importance on predecision reeval-uation of alternatives. Pers Soc Psychol Bull. 2004;30(7):891–904.
11. Levy AG, Hershey JC. Value-induced bias in medical decisionmaking. Med Decis Making. 2008;28(2):269–76.
12. Wallsten TS. Physician and medical student bias in evaluatingdiagnostic information. Med Decis Making. 1981;1(2):145.
13. Kostopoulou O, Mousoulis C, Delaney BC. Information searchand information distortion in the diagnosis of an ambiguous pre-sentation. Judgm Decis Mak. 2009;4(5):408–18.
14. Kostopoulou O, Oudhoff J, Nath R, et al. Predictors of diagnos-tic accuracy and safe management in difficult diagnostic problemsin family medicine. Med Decis Making. 2008;28(5):668–80.
15. Russo JE, Meloy MG, Medvec VH. Predecisional distortion ofproduct information. J Mark Res. 1998;35(4):438–52.
16. DeKay ML, Stone ER, Miller SA. Leader-driven distortion ofprobability and payoff information affects choices between riskyprospects. J Behav Dec Making. 2011;24(4):394–411.
17. Simon HA, Chase WG. Skill in chess. Am Sci. 1973;61(4):394–403.
18. Ericsson KA. Deliberate practice and the acquisition and main-tenance of expert performance in medicine and related domains.Acad Med. 2004;79(10):S70–80.
19. DeKay ML, Patino-Echeverri D, Fischbeck PS. Distortion ofprobability and outcome information in risky decisions. OrganBehav Hum Decis Process. 2009;109(1):79–92.
20. Barrows HS, Norman GR, Neufeld VR, Feightner JW. The clin-ical reasoning of randomly selected physicians in general medicalpractice. Clin Invest Med. 1982;5(1):49–55.
21. Dubeau CE, Voytovich AE, Rippey RM. Premature conclusionsin the diagnosis of iron-deficiency anemia: cause and effect. MedDecis Making. 1986;6(3):169.
22. Sibbald M, Cavalcanti RB. The biasing effect of clinical historyon physical examination diagnostic accuracy. Med Educ. 2011;45(8):827–34.
23. Kostopoulou O, Devereaux-Walsh C, Delaney BC. Missingceliac disease in family medicine: the importance of hypothesisgeneration. Med Decis Making. 2009;29(3):282–90.
24. Elstein AS, Shulman LS, Sprafka SA. Medical Problem Solv-ing: An Analysis of Clinical Reasoning. Cambridge (MA): HarvardUniversity Press; 1978.
25. Klayman J. Varieties of confirmation bias. In: Busemeyer J,Hastie R, Medin DL, eds. Decision Making From a Cognitive Per-spective. San Diego (CA): Academic Press; 1995. p 385–418.
26. Hogarth RM, Einhorn HJ. Order effects in belief updating: thebelief-adjustment model. Cogn Psychol. 1992;24(1):1–55.
27. Russo JE, Yong K. The distortion of information to support anemerging evaluation of risk. J Econometrics. 2011;162(1):132–9.
PHYSICIANS’ INFORMATION DISTORTION
ORIGINAL ARTICLES 839
at Kings College London - ISS on January 8, 2013mdm.sagepub.comDownloaded from