Embed Size (px)
Citation preview
IEEE TRANSACTIONS ON GEOSCIENCE AND REMOTE SENSING, VOL. 43, NO. 3, MARCH 2004 619
Information-Theoretic HeterogeneityMeasurement for SAR Imagery
Bruno Aiazzi, Luciano Alparone, and Stefano Baronti
Abstract—In this communication, a heterogeneity feature, calculablefrom synthetic aperture radar (SAR) images on a per-pixel basis, butrelying on global image statistics, is defined and discussed. Starting fromthe multiplicative speckle and texture models relating the amount oftexture and speckle to the local mean and variance at every pixel, sucha feature is rigorously derived from Shannon’s information theory asthe conditional information of local standard deviation to local mean.Thanks to robust statistical estimation, it is very little sensitive to the noiseaffecting SAR data, and thus capable of capturing subtle variations oftexture whenever they are embedded in a heavy speckle. Experimentalresults carried out on two SAR images with different degrees of noisinessdemonstrate that the proposed feature is likely to be useful for a variety ofautomated segmentation and classification tasks.
Index Terms—Information-theoretic signal processing, land cover clas-sification, multivariate analysis, synthetic aperture radar (SAR) imagery,textural features, variation coefficient.
I. INTRODUCTION
Works carried out in the past decade have demonstrated that multi-frequency fully polarimetric synthetic aperture radar (SAR) observa-tions can be effective for classification applications, thanks to physicalproperties of the backscattered signal at various frequencies and po-larizations. Power and processing requirements, however, preclude theavailability of such data routinely from satellite platforms. While theAdvanced SAR (ASAR) system operating on the Environmental Satel-lite (Envisat) makes different polarizations available in C-band, whenthe alternating polarization mode (APM) is enabled, the future launchof the COSMO/SkyMed mission will make high-resolution X-bandSAR data routinely available to the scientific and users’ communities.
The motivation underlying the present work is investigating on aclassification algorithm capable of discriminating cover classes presentin the observed scene on the basis of a single SAR observation. Besidesthe development of an advanced classifier, this approach relies on cal-culating from the available SAR image as many significant pixel fea-tures as possible. As examples, the backscattering coefficient may beestimated at several resolutions and delivered to the classifier. The localvariation coefficient may be calculated at different resolutions [1] andused as texture measures. Texture features derived from cooccurrencematrices [2] may be calculated for different orientations and interpixeldistances.
Scene heterogeneity in SAR images has been traditionally measuredby the coefficient of variation (Cv ), defined as the ratio of local standarddeviation to local mean [3]. Such a heterogeneity feature, however, re-lies on statistics calculated locally and thus is not capable to describe an
Manuscript received February 27, 2004; revised August 18, 2004. This workwas supported in part by the Italian Ministry of Education, University, and Re-search (MIUR) under COFIN 2002 and in part by the Italian Space Agency(ASI).
B. Aiazzi and S. Baronti are with the Institute of Applied Physics “NelloCarrara” of the National Research Council (IFAC-CNR), 50127 Florence, Italy(e- mail: [email protected]; [email protected]).
L. Alparone is with the Department of Electronics and Telecommunications,University of Florence, 50139 Florence, Italy (e-mail: [email protected]).
Digital Object Identifier 10.1109/TGRS.2004.837328
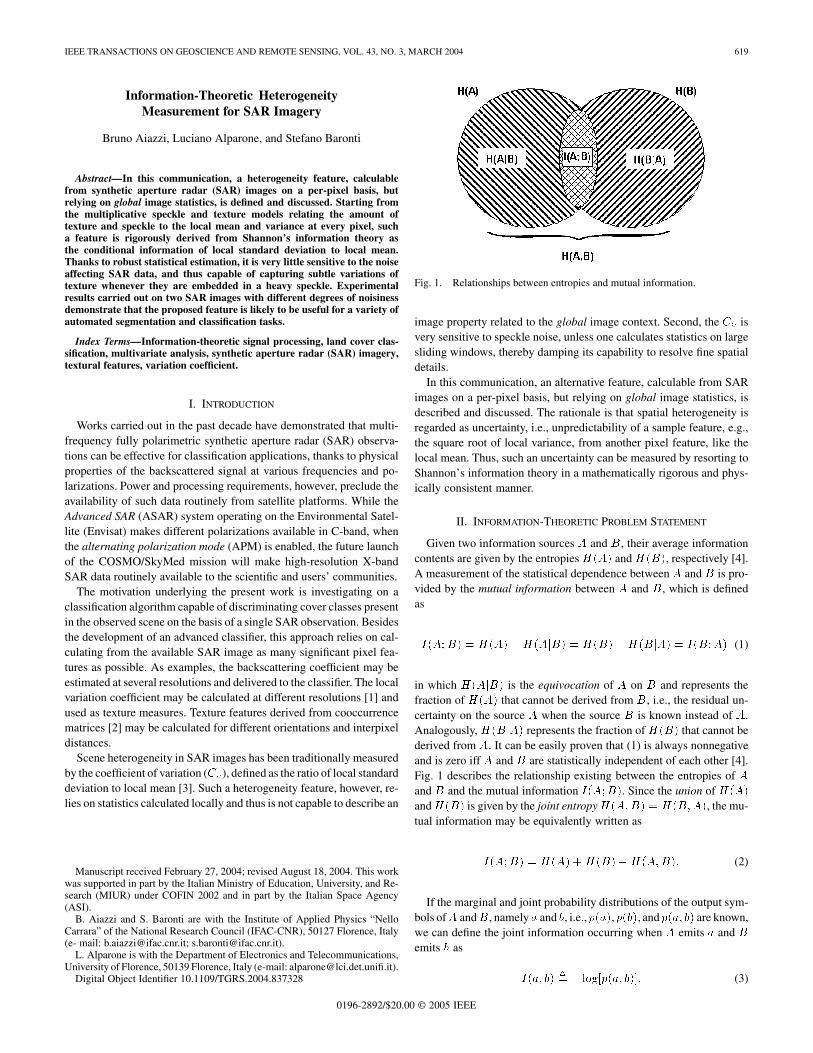
Fig. 1. Relationships between entropies and mutual information.
image property related to the global image context. Second, the Cv isvery sensitive to speckle noise, unless one calculates statistics on largesliding windows, thereby damping its capability to resolve fine spatialdetails.
In this communication, an alternative feature, calculable from SARimages on a per-pixel basis, but relying on global image statistics, isdescribed and discussed. The rationale is that spatial heterogeneity isregarded as uncertainty, i.e., unpredictability of a sample feature, e.g.,the square root of local variance, from another pixel feature, like thelocal mean. Thus, such an uncertainty can be measured by resorting toShannon’s information theory in a mathematically rigorous and phys-ically consistent manner.
II. INFORMATION-THEORETIC PROBLEM STATEMENT
Given two information sources A and B, their average informationcontents are given by the entropiesH(A) andH(B), respectively [4].A measurement of the statistical dependence between A and B is pro-vided by the mutual information between A and B, which is definedas
I(A;B) = H(A)�H(AjB) = H(B)�H(BjA) = I(B;A) (1)
in which H(AjB) is the equivocation of A on B and represents thefraction of H(A) that cannot be derived from B, i.e., the residual un-certainty on the source A when the source B is known instead of A.Analogously,H(BjA) represents the fraction ofH(B) that cannot bederived from A. It can be easily proven that (1) is always nonnegativeand is zero iff A and B are statistically independent of each other [4].Fig. 1 describes the relationship existing between the entropies of Aand B and the mutual information I(A;B). Since the union of H(A)
andH(B) is given by the joint entropyH(A;B) = H(B;A), the mu-tual information may be equivalently written as
I(A;B) = H(A) +H(B)�H(A;B): (2)
If the marginal and joint probability distributions of the output sym-bols ofA andB, namely a and b, i.e., p(a),p(b), and p(a; b) are known,we can define the joint information occurring when A emits a and Bemits b as
I(a; b) � log[p(a; b)]: (3)
0196-2892/$20.00 © 2005 IEEE
620 IEEE TRANSACTIONS ON GEOSCIENCE AND REMOTE SENSING, VOL. 43, NO. 3, MARCH 2004
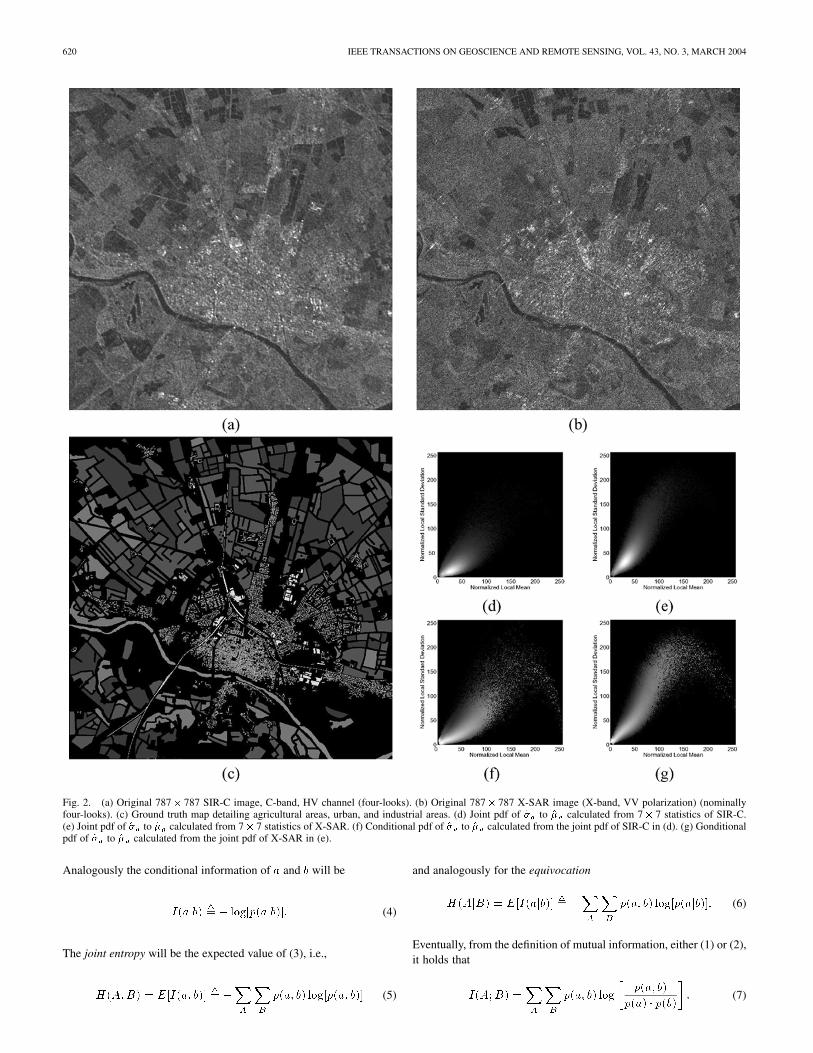
Fig. 2. (a) Original 787� 787 SIR-C image, C-band, HV channel (four-looks). (b) Original 787� 787 X-SAR image (X-band, VV polarization) (nominallyfour-looks). (c) Ground truth map detailing agricultural areas, urban, and industrial areas. (d) Joint pdf of �̂ to �̂ calculated from 7� 7 statistics of SIR-C.(e) Joint pdf of �̂ to �̂ calculated from 7� 7 statistics of X-SAR. (f) Conditional pdf of �̂ to �̂ calculated from the joint pdf of SIR-C in (d). (g) Gonditionalpdf of �̂ to �̂ calculated from the joint pdf of X-SAR in (e).
Analogously the conditional information of a and b will be
I(ajb) � log[p(ajb)]: (4)
The joint entropy will be the expected value of (3), i.e.,
H(A;B) = E[I(a; b)] �A B
p(a; b) log[p(a; b)] (5)
and analogously for the equivocation
H(AjB) = E[I(ajb)] �A B
p(a; b) log[p(ajb)]: (6)
Eventually, from the definition of mutual information, either (1) or (2),it holds that
I(A;B) =A B
p(a; b) logp(a; b)
p(a) � p(b): (7)
IEEE TRANSACTIONS ON GEOSCIENCE AND REMOTE SENSING, VOL. 43, NO. 3, MARCH 2004 621
(a) (b)
(c) (d)
(e) (f)
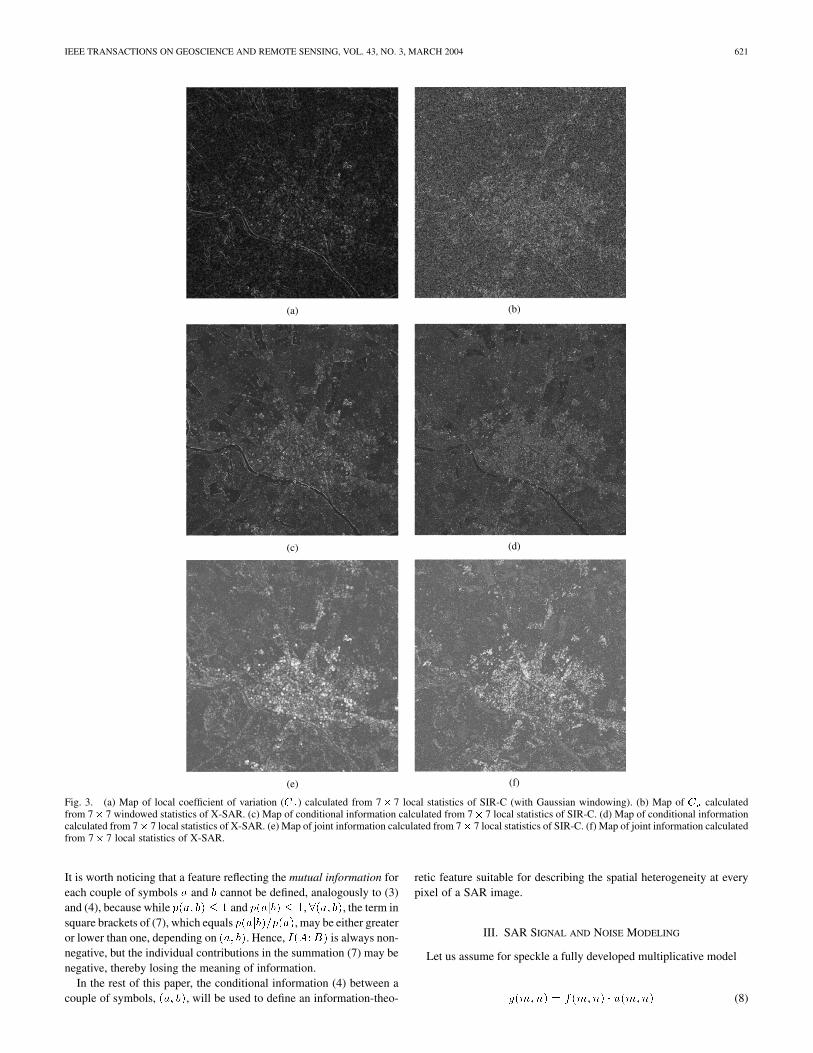
Fig. 3. (a) Map of local coefficient of variation (C ) calculated from 7� 7 local statistics of SIR-C (with Gaussian windowing). (b) Map of C calculatedfrom 7� 7 windowed statistics of X-SAR. (c) Map of conditional information calculated from 7� 7 local statistics of SIR-C. (d) Map of conditional informationcalculated from 7� 7 local statistics of X-SAR. (e) Map of joint information calculated from 7� 7 local statistics of SIR-C. (f) Map of joint information calculatedfrom 7� 7 local statistics of X-SAR.
It is worth noticing that a feature reflecting the mutual information foreach couple of symbols a and b cannot be defined, analogously to (3)and (4), because while p(a; b) � 1 and p(ajb) � 1, 8(a; b), the term insquare brackets of (7), which equals p(ajb)=p(a), may be either greateror lower than one, depending on (a; b). Hence, I(A;B) is always non-negative, but the individual contributions in the summation (7) may benegative, thereby losing the meaning of information.
In the rest of this paper, the conditional information (4) between acouple of symbols, (a; b), will be used to define an information-theo-
retic feature suitable for describing the spatial heterogeneity at everypixel of a SAR image.
III. SAR SIGNAL AND NOISE MODELING
Let us assume for speckle a fully developed multiplicative model
g(m;n) = f(m;n) � u(m;n) (8)
622 IEEE TRANSACTIONS ON GEOSCIENCE AND REMOTE SENSING, VOL. 43, NO. 3, MARCH 2004
in which g(m;n) is the detected intensity, or amplitude, at pixel posi-tion (m;n), f(m;n) is the radar reflectivity, or backscatter coefficient,from (m;n), and u(m;n) is a random noise process, independent off , stationary, with unity mean and variance �2u [5]. The reflectivityf(m;n) may be split into the product of a piecewise spatially constantRCS modulated by a unity mean texture [6].
Let us calculate the variance of the multiplicative model (8)
�2
g(m;n) = �2
f(m;n) � (1 + �2
u) + �2
f(m;n) � �2u (9)
in which �f (m;n) E[f(m;n)] denotes the space-varying meanof f . Trivially, �f (m;n) = �g(m;n) E[g(m;n)], from (8). Outof the two terms on right-hand side of (9), the former is dominant ontextured areas and vanishes in homogeneous areas, in which
�g(m;n) = �u � �f (m;n) = �u � �g(m;n) (10)
whereas on textured inhomogeneous areas it holds that
�g(m;n) � �f(m;n) � 1 + �2u: (11)
Equation (10) states that on homogeneous pixels the square root oflocal variance is proportional to the local mean through the constant�u. Hence, homogeneous pixels yield such two features aligned alonga straight line with slope �u. Instead, (11) shows that on highly texturedareas the square root of the local variance becomes independent of themean. Thus, textured points are not aligned along any line, but spreadthroughout the scatterplot of �g to �g .
Equation (9) still approximately holds when local sample statistics,namely �̂g and �̂g , which are random variables, replace the corre-sponding theoretical ensemble expectation. Hence, one argues that onpixels belonging to homogeneous areas, once the value �̂g is calcu-lated, the probability of �̂g being equal to �u � �̂g , i.e., p(�̂gj�̂g), willbe high. Conversely, p(�̂gj�̂g) will be low on inhomogeneous pixels,since �̂g cannot be predicted from the knowledge of �u � �̂g , becauseof the presence of edges and textures, embodied by the term �f(m;n)
multiplied by the constantp1 + �2u.
Eventually, the conditional probability p(�̂gj�̂g), which measuresthe statistical dependence of �̂g on �̂g , is inversely related to scene het-erogeneity. Hence, the conditional information (4), with a = �̂g andb = �̂g , seems to be a suitable measurement of heterogeneity. Anal-ogously, the joint information (3) measures the information simulta-neously conveyed by �̂g and �̂g . It is obviously maximized when �̂g
and �̂g are statistically independent, but can be considerably large evenwhen the two statistics are strongly dependent on each other, as it hap-pens on homogeneous areas.
It is noteworthy that the proposed approach requires neither first-order nor second-order statistical modeling of backscatter and/or tex-ture [7], [8] to allow information to be measured. Furthermore, the as-sumption of fully developed speckle, which implies constance of �uregardless of the signal, is crucial only for homogeneous regions (10),where it is undoubtedly verified. In strongly textured areas, e.g., urbanareas, the term �u may depend on texture being lower than its expectedvalue where texture is stronger, up to vanish in the presence of pure re-flectors. In this case, (11) is approximated even better, though the termp1 + �2u is no longer constant and may tend to one, which means that
the measured signal variance �2g depends on the variance of texture �2fonly.
A robust procedure for estimating the conditional probability densityfunction (pdf) of �̂g to �̂g , and hence the heterogeneity feature, will bedescribed hereafter.
IV. JOINT AND CONDITIONAL PDF ESTIMATION
An automatic procedure was recently developed, based on the obser-vation that an area having constant backscatter originates a cluster ofscatterpoints [9]. Such clusters are aligned along a straight line passingthrough the origin and having slope equal to the standard deviation ofspeckle �u. Instead, the presence of point targets, signal edges, and tex-tures originates scatterpoints spread throughout the plot.
The scatterplot of �̂g against �̂g calculated on all image pixels maybe regarded as an empirical joint pdf of such two pixel features. Toestimate the two-dimensional (2-D) pdf, the following procedure wasdevised [10].
1) Within a (2p + 1) � (2p + 1) window sliding over the
image calculate local sample statistics to estimate
ensemble statistics:
• average �g(m;n) � �̂ (m;n),
• RMS deviation from average, �̂ (m;n).
To improve estimation of local statistics [11], the
contribution of each pixel inside the sliding window
is weighted by normalized coefficients, i.e., sum-
ming to (2p + 1) , decaying from the center toward the
edges with either linear or Gaussian slope; in the
latter case, 2p+ 1 is the �3� window span.
2) Draw the scatterplots of �̂ (m;n) versus �̂ (m;n).
3) Partition the scatterplot plane into an L � L
array of rectangular blocks to yield the bins of a
2-D histogram h(i; j). The value of L rules quantiza-
tion of local statistics, which are calculated as
analog numbers. Given the noisiness of SAR data,
L = 256 represents a good tradeoff between accuracy
and computational complexity.
4) Normalize the number of scatterpoints in each
block to the overall number of points, so that
h(i; j) = 1.
5) Apply a smoothing operator, e.g., a triangular
or Gaussian-shaped separable filter, to the discrete
2-D function h(i; j), to yield the (discrete) joint
pdf p(i; j) � p(�̂ ; �̂ ). This step is an approximation
of Parzen’s kernel method [12] for pdf estimation
from discrete samples. The kernel length is crucial,
especially when the data are noisy and local statis-
tics estimated on windows of small size. A Gaussian
kernel of length 15 was used throughout. However,
more accurate yet computationally affordable methods
[13] are worth being investigated.
6) Calculate the discrete conditional 2-D pdf as
p(ijj) = p(i; j)
p(j)=
p(i; j)
i
p(i; j): (12)
Given the same (2p+1)� (2p+1) window, for each pixel (m;n)
in the SAR image, standard deviation and mean values are calculated(again with Gaussian windowing) and quantized toL levels. If the con-ditional probability (12) is indexed with such values, the conditionalinformation at (m;n) is given by
I(m;n) = �� � logfp[�̂(m;n)j�g(m;n)]g: (13)
A scaling constant � was introduced in (13). It may be derived by im-posing that the minimum value taken by (13) is equal to the theoretical
IEEE TRANSACTIONS ON GEOSCIENCE AND REMOTE SENSING, VOL. 43, NO. 3, MARCH 2004 623
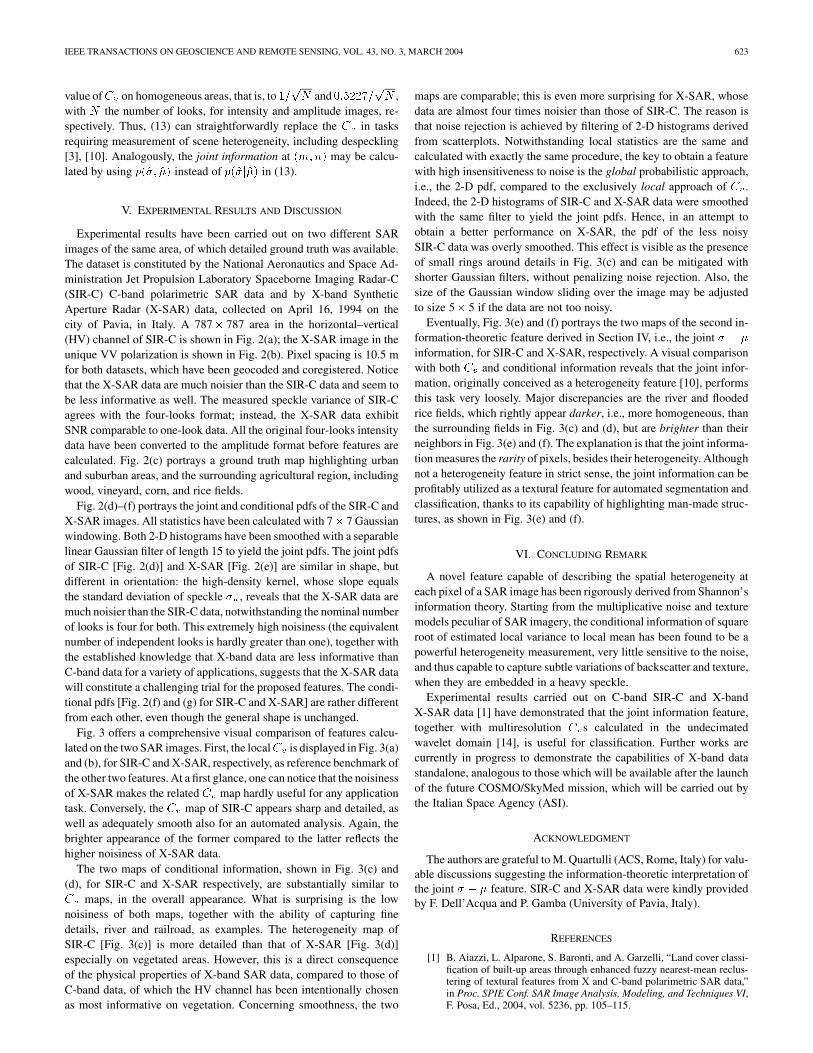
value ofCv on homogeneous areas, that is, to 1=pN and 0:5227=
pN ,
with N the number of looks, for intensity and amplitude images, re-spectively. Thus, (13) can straightforwardly replace the Cv in tasksrequiring measurement of scene heterogeneity, including despeckling[3], [10]. Analogously, the joint information at (m;n) may be calcu-lated by using p(�̂; �̂) instead of p(�̂j�̂) in (13).
V. EXPERIMENTAL RESULTS AND DISCUSSION
Experimental results have been carried out on two different SARimages of the same area, of which detailed ground truth was available.The dataset is constituted by the National Aeronautics and Space Ad-ministration Jet Propulsion Laboratory Spaceborne Imaging Radar-C(SIR-C) C-band polarimetric SAR data and by X-band SyntheticAperture Radar (X-SAR) data, collected on April 16, 1994 on thecity of Pavia, in Italy. A 787� 787 area in the horizontal–vertical(HV) channel of SIR-C is shown in Fig. 2(a); the X-SAR image in theunique VV polarization is shown in Fig. 2(b). Pixel spacing is 10.5 mfor both datasets, which have been geocoded and coregistered. Noticethat the X-SAR data are much noisier than the SIR-C data and seem tobe less informative as well. The measured speckle variance of SIR-Cagrees with the four-looks format; instead, the X-SAR data exhibitSNR comparable to one-look data. All the original four-looks intensitydata have been converted to the amplitude format before features arecalculated. Fig. 2(c) portrays a ground truth map highlighting urbanand suburban areas, and the surrounding agricultural region, includingwood, vineyard, corn, and rice fields.
Fig. 2(d)–(f) portrays the joint and conditional pdfs of the SIR-C andX-SAR images. All statistics have been calculated with 7� 7 Gaussianwindowing. Both 2-D histograms have been smoothed with a separablelinear Gaussian filter of length 15 to yield the joint pdfs. The joint pdfsof SIR-C [Fig. 2(d)] and X-SAR [Fig. 2(e)] are similar in shape, butdifferent in orientation: the high-density kernel, whose slope equalsthe standard deviation of speckle �u, reveals that the X-SAR data aremuch noisier than the SIR-C data, notwithstanding the nominal numberof looks is four for both. This extremely high noisiness (the equivalentnumber of independent looks is hardly greater than one), together withthe established knowledge that X-band data are less informative thanC-band data for a variety of applications, suggests that the X-SAR datawill constitute a challenging trial for the proposed features. The condi-tional pdfs [Fig. 2(f) and (g) for SIR-C and X-SAR] are rather differentfrom each other, even though the general shape is unchanged.
Fig. 3 offers a comprehensive visual comparison of features calcu-lated on the two SAR images. First, the localCv is displayed in Fig. 3(a)and (b), for SIR-C and X-SAR, respectively, as reference benchmark ofthe other two features. At a first glance, one can notice that the noisinessof X-SAR makes the related Cv map hardly useful for any applicationtask. Conversely, the Cv map of SIR-C appears sharp and detailed, aswell as adequately smooth also for an automated analysis. Again, thebrighter appearance of the former compared to the latter reflects thehigher noisiness of X-SAR data.
The two maps of conditional information, shown in Fig. 3(c) and(d), for SIR-C and X-SAR respectively, are substantially similar toCv maps, in the overall appearance. What is surprising is the lownoisiness of both maps, together with the ability of capturing finedetails, river and railroad, as examples. The heterogeneity map ofSIR-C [Fig. 3(c)] is more detailed than that of X-SAR [Fig. 3(d)]especially on vegetated areas. However, this is a direct consequenceof the physical properties of X-band SAR data, compared to those ofC-band data, of which the HV channel has been intentionally chosenas most informative on vegetation. Concerning smoothness, the two
maps are comparable; this is even more surprising for X-SAR, whosedata are almost four times noisier than those of SIR-C. The reason isthat noise rejection is achieved by filtering of 2-D histograms derivedfrom scatterplots. Notwithstanding local statistics are the same andcalculated with exactly the same procedure, the key to obtain a featurewith high insensitiveness to noise is the global probabilistic approach,i.e., the 2-D pdf, compared to the exclusively local approach of Cv .Indeed, the 2-D histograms of SIR-C and X-SAR data were smoothedwith the same filter to yield the joint pdfs. Hence, in an attempt toobtain a better performance on X-SAR, the pdf of the less noisySIR-C data was overly smoothed. This effect is visible as the presenceof small rings around details in Fig. 3(c) and can be mitigated withshorter Gaussian filters, without penalizing noise rejection. Also, thesize of the Gaussian window sliding over the image may be adjustedto size 5� 5 if the data are not too noisy.
Eventually, Fig. 3(e) and (f) portrays the two maps of the second in-formation-theoretic feature derived in Section IV, i.e., the joint � � �
information, for SIR-C and X-SAR, respectively. A visual comparisonwith both Cv and conditional information reveals that the joint infor-mation, originally conceived as a heterogeneity feature [10], performsthis task very loosely. Major discrepancies are the river and floodedrice fields, which rightly appear darker, i.e., more homogeneous, thanthe surrounding fields in Fig. 3(c) and (d), but are brighter than theirneighbors in Fig. 3(e) and (f). The explanation is that the joint informa-tionmeasures the rarity of pixels, besides their heterogeneity. Althoughnot a heterogeneity feature in strict sense, the joint information can beprofitably utilized as a textural feature for automated segmentation andclassification, thanks to its capability of highlighting man-made struc-tures, as shown in Fig. 3(e) and (f).
VI. CONCLUDING REMARK
A novel feature capable of describing the spatial heterogeneity ateach pixel of a SAR image has been rigorously derived from Shannon’sinformation theory. Starting from the multiplicative noise and texturemodels peculiar of SAR imagery, the conditional information of squareroot of estimated local variance to local mean has been found to be apowerful heterogeneity measurement, very little sensitive to the noise,and thus capable to capture subtle variations of backscatter and texture,when they are embedded in a heavy speckle.
Experimental results carried out on C-band SIR-C and X-bandX-SAR data [1] have demonstrated that the joint information feature,together with multiresolution Cvs calculated in the undecimatedwavelet domain [14], is useful for classification. Further works arecurrently in progress to demonstrate the capabilities of X-band datastandalone, analogous to those which will be available after the launchof the future COSMO/SkyMed mission, which will be carried out bythe Italian Space Agency (ASI).
ACKNOWLEDGMENT
The authors are grateful toM. Quartulli (ACS, Rome, Italy) for valu-able discussions suggesting the information-theoretic interpretation ofthe joint � � � feature. SIR-C and X-SAR data were kindly providedby F. Dell’Acqua and P. Gamba (University of Pavia, Italy).
REFERENCES
[1] B. Aiazzi, L. Alparone, S. Baronti, and A. Garzelli, “Land cover classi-fication of built-up areas through enhanced fuzzy nearest-mean reclus-tering of textural features from X and C-band polarimetric SAR data,”in Proc. SPIE Conf. SAR Image Analysis, Modeling, and Techniques VI,F. Posa, Ed., 2004, vol. 5236, pp. 105–115.
624 IEEE TRANSACTIONS ON GEOSCIENCE AND REMOTE SENSING, VOL. 43, NO. 3, MARCH 2004
[2] A. Baraldi and F. Parmiggiani, “An investigation of the textural char-acteristics associated with gray level cooccurrence matrix statisticalparameters,” IEEE Trans. Geosci. Remote Sens., vol. 33, no. 2, pp.293–304, Mar. 1995.
[3] A. Lopès, R. Touzi, and E. Nezry, “Adaptive speckle filters and sceneheterogeneity,” IEEE Trans. Geosci. Remote Sens., vol. 28, no. 6, pp.992–1000, Nov. 1990.
[4] R. E. Blahut, Principles and Practice of Information Theory. Reading,MA: Addison-Wesley, 1987.
[5] C. Oliver and S. Quegan, Understanding Synthetic Aperture Radar Im-ages. Boston, MA: Artech House, 1998.
[6] F. T. Ulaby, F. Kouyate, B. Brisco, and T. H. Lee Williams, “Texturalinformation in SAR images,” IEEE Trans. Geosci. Remote Sens., vol.GE-24, no. 2, pp. 235–245, Mar. 1986.
[7] M. Datcu, K. Seidel, and M. Walessa, “Spatial information retrievalfrom remote sensing images—Part I information theoretical perspec-tive,” IEEE Trans. Geosci. Remote Sens., vol. 36, no. 5, pp. 1431–1445,Sep. 1998.
[8] M. Walessa and M. Datcu, “Model-based despeckling and informationextraction from SAR images,” IEEE Trans. Geosci. Remote Sens., vol.38, no. 5, pp. 2258–2269, Sep. 2000.
[9] B. Aiazzi, L. Alparone, S. Baronti, and A. Garzelli, “Coherence esti-mation from incoherent multilook SAR imagery,” IEEE Trans. Geosci.Remote Sens., vol. 41, no. 11, pp. 2531–2539, Nov. 2003.
[10] B. Aiazzi, L. Alparone, and S. Baronti, “Hybrid despeckling filter drivenby a novel homogeneity feature,” in Proc. SPIE Conf. SAR Image Anal-ysis, Modeling, and Techniques III, ser. EUROPTO Series, F. Posa, Ed.,2000, vol. 4173, pp. 43–53.
[11] C. H. Gierull and I. C. Sikaneta, “Estimating the effective number oflooks in interferometric SAR data,” IEEE Trans. Geosci. Remote Sens.,vol. 40, no. 8, pp. 1733–1742, Aug. 2002.
[12] K. Fukunaga, Introduction to Statistical Pattern Recognition, 2nded. Boston, MA: Academic, 1990.
[13] Y. Kouskoulas, L. E. Pierce, and F. T. Ulaby, “A computationally effi-cient multivariate maximum-entropy density estimation (MEDE) tech-nique,” IEEE Trans. Geosci. Remote Sens., vol. 42, no. 2, pp. 457–468,Feb. 2004.
[14] F. Argenti and L. Alparone, “Speckle removal from SAR images in theundecimated wavelet domain,” IEEE Trans. Geosci. Remote Sens., vol.40, no. 11, pp. 2363–2374, Nov. 2002.


