Embed Size (px)
Citation preview

Inhibition of Neutrophil Migration by Hemopexin Leads to Increased
Mortality Due to Sepsis in Mice
Fernando Spiller,1 Carlotta Costa,
5 Fabrício O. Souto,
1 Francesca Vinchi,
5 Fabíola L.A.C.
Mestriner,1 Helen J. Laure,
3,4 José C. Alves-Filho,
1 Andressa Freitas,
1 José C. Rosa,
2,3,4 Sérgio H.
Ferreira,1
Fiorella Altruda,5 Emilio Hirsch,
5 Lewis J. Greene,
2,3,4 Emanuela Tolosano,
5* and
Fernando Q. Cunha1*
.
From the Departments of 1Pharmacology,
2Cell and Molecular Biology and Pathogenic Agents
and 3Protein Chemistry Center, Faculty of Medicine of Ribeirão Preto, University of São Paulo,
4Hemocenter Foundation of Ribeirão Preto, Ribeirão Preto, SP, Brazil.
5Molecular
Biotechnology Center, University of Torino, Via Nizza 52, 10126 Torino, Italy.
CORRESPONDENCE: Fernando Q. Cunha, Department of Pharmacology, Faculty of Medicine
of Ribeirão Preto, University of São Paulo, Av. Bandeirantes 3900, Monte Alegre 14049–900,
Ribeirão Preto, SP, Brazil. E-mail: [email protected]. Tel. 55 16 3602 3324, Fax. 55 16
3633 2301. Emanuela Tolosano, Molecular Biotechnology Center, University of Torino, Via
Nizza 52, 10126 Torino, Italy. E-mail: [email protected]. Tel. 39 011 6706423, Fax.
39 011 6706432.
*Both authors contributed equally to the research.
This work was supported by grants from the Fundação de Amparo à Pesquisa do Estado de São
Paulo (FAPESP), Coordenação de Aperfeiçoamento de Pessoal de Nível Superior (CAPES),
Conselho Nacional de Pesquisa e Desenvolvimento Tecnológico (CNPq) and Programa de
Núcleos de Excelência (PRONEX).
Running head: Hx inhibits neutrophil migration
Subject descriptor number: 4.12
Word count: 5172
This article has an online data supplement, which is accessible from this issue's table of content
online at www.atsjournals.org.
Scientific Knowledge on the Subject
The reduction of neutrophil migration to the bacterial focus is associated with poor outcome in
sepsis. The mechanism involved in this process is not completely understood, however serum
factors may be responsible for the inhibition of neutrophil migration in severe sepsis.
What This Study Adds to the Field
The abrogation of the acute phase protein hemopexin improves the neutrophil migration to the
focus of infection and survival in sepsis.
Page 1 of 55 AJRCCM Articles in Press. Published on October 22, 2010 as doi:10.1164/rccm.201002-0223OC
Copyright (C) 2010 by the American Thoracic Society.

2
Abstract
Rationale: The reduction of neutrophil migration to the bacterial focus is associated with poor
outcome in sepsis. Objectives: The objective of this study was to identify soluble substances in
the blood of septic mice that inhibit neutrophil migration during the early phases of sepsis.
Results and methods: A pool of serum obtained from mice two hours after the induction of
severe sepsis by cecal ligation and puncture inhibited neutrophil migration. Hemopexin was
identified by mass spectrometry as the serum component responsible for this effect. In sepsis, the
pretreatment of wild type mice with hemopexin inhibited neutrophil migration to the focus of
infection and decreased the survival rate from 87.5% to 50.0%. Hemopexin-null mice submitted
to severe sepsis present normal neutrophil migration and, as a consequence, presented low
bacteremia and an improvement of 40% in survival rate. Moreover, hemopexin inhibited the
neutrophil chemotaxis response evoked by C5a or MIP-2 and induced a reduction of CXCR2 and
L-selectin as well as the up-regulation of CD11b expression in neutrophil membranes. The
inhibitory effect of hemopexin on neutrophil chemotaxis was prevented by serine protease
inhibitors or adenosine-5’-triphosphate (ATP). In addition, serum levels of ATP were decreased
at the early stages of severe sepsis. Conclusion: These data demonstrate for the first time the
inhibitory role of hemopexin on neutrophil migration during sepsis and suggest that the
therapeutic inhibition of hemopexin or its protease activity could improve neutrophil migration
to the focus of infection and survival in sepsis.
Word count: 242
Key-words: neutrophil migration; sepsis; hemopexin; survival; cecal ligation and puncture.
Page 2 of 55

3
INTRODUCTION
Activation of endothelial cells by chemokines (1) during a localized infection process,
stimulates the rolling and tight adhesion of neutrophils to the endothelium and provides
directional migration cues (2). Once at the site of infection, neutrophils internalize pathogens and
produce toxic substances that kill the invading microorganisms (3, 4). However, when the host
fails to contain the pathogens, they or their products spread to the circulation, resulting in over-
production of inflammatory mediators and impaired immune function (5). We have shown that
the severity of sepsis induced by cecal ligation and puncture (CLP) (6), by Gram-positive (7) or
Gram-negative (8) intraperitoneal (i.p.) bacterial inoculation is associated with inhibition of
neutrophil recruitment to the sites of infection. The inability of neutrophils to migrate results in
an increased number of bacteria in the peritoneal cavity and blood, lung leukocyte sequestration
and high mortality. Furthermore, compared to neutrophils from healthy subjects, neutrophils
obtained from severe septic patients have greatly reduced chemotactic responses (9).
The mechanism involved in the reduction of neutrophil migration observed in severe sepsis
is not completely understood. However, bacteria and/or their products spreading and inducing
activation of the systemic TLRs result in excessive circulating cytokines/chemokines (8, 10)
which could inhibit neutrophil migration. In fact, intravenous (i.v.) administration of LPS (6),
TNF- α or IL-8 inhibits neutrophil migration to the mouse peritoneal cavity. The monoclonal
anti–TNF-α antibody partially prevented the inhibition of neutrophil migration in an
endotoxemia model (11). Moreover, TNFR1/R2 double-knockout mice are more resistant to
severe sepsis (12).
Despite the evidence that cytokines mediate the failure of neutrophil migration, clinical
trials using neutralizing antibodies against cytokines or soluble receptors did not show significant
beneficial effects on septic patients (13). However, other serum factors may also be responsible
Page 3 of 55

4
for the inhibition of neutrophil migration because massive fresh plasma transfusions restore
neutrophil function in newborns suffering from sepsis (14). In addition, we recently showed that
the acute phase protein alpha-1-acid glycoprotein (AGP) is a serum factor that inhibits neutrophil
migration in severe human sepsis (15).
In experimental mouse sepsis, the serum AGP concentration was significantly increased
only 6 h after the initiation of severe sepsis (unpublished data, Spiller F and Cunha FQ).
However, 2 h after the induction of severe sepsis in mice, there is a decrease in rolling and
adhesion of leukocytes to the endothelium as well as internalization and desensitization of
chemokine receptor CXCR2 on the neutrophil membrane (16), which are essential for neutrophil
migration. Therefore, other serum factors may be involved in the failure of neutrophil migration
during the early phase of severe sepsis and knowledge of these mediators should help in the
management of severe sepsis. Thus, the objective of the present study was to identify soluble
substances other than AGP in the blood of septic mice (15) that inhibit neutrophil migration
during early phases of sepsis.
MATERIALS AND METHODS
Experimental details are provided in the online supplement.
Word count: 502
Neutrophil migration. Neutrophil migration was determined 6 h after CLP or thioglycolate
administration (17).
Sepsis models. Polymicrobial sepsis was induced by CLP model (18). A single puncture was
made using a 21-gauge needle to induce mild sepsis (MS) or four punctures using an 18-gauge
Page 4 of 55

5
needle to induce severe sepsis (SS). Gram-negative sepsis was induced by Escherichia coli
(ATCC 25922, Bethesda, MD) inoculation.
Neutrophil isolation and chemotaxis assay. Bone marrow neutrophils were isolated by Percoll
gradient (10) and treated (1 h) with 1 µM hemopexin-hemin (Hx-Hem), BSA-Hem or hemopexin
(0.5, 1 and 5 µM). One group was pre-treated (30 min) with ZnDPPG (ZN, 30 µM) before
hemopexin. In another set of experiments, hemopexin (5 µM) was incubated (30 min, 37o) with
phenylmethylsulfonyl fluoride (PMSF, 50 – 200 µM), aprotinin (AP, 2.5 – 10 µM) or adenosine-
5’triphosphate (ATP, 2.5 – 10 µM), then these complexes were incubated with neutrophils for 1
h. After that, neutrophil chemotaxis was performed in response to RPMI (random migration) or
to MIP-2 (20 ng/mL) or C5a (50 or 100 nM).
Flow cytometry analysis. Isolated mouse bone marrow neutrophils were incubated for 1 h with
hemopexin (1, 5 and 10 µM) and stained with antibodies against CD62L, CD11b or CXCR2.
The cells were then analyzed by flow cytometry (FACSort; Becton Dickinson).
Blue-Sepharose chromatography. A pool of 30 ml serum from severe septic mice was
chromatographed on a Blue-Sepharose 6 Fast Flow column to remove most of the albumin (19).
The material with low albumin content was denoted Fraction B-.
Page 5 of 55

6
HPLC. Fraction B- which contained most of the migration inhibitory activity was submitted to
HPLC on a Vydac C18 column (218TP510, Grace Vydac, Hesperia, CA, USA) using a Shimadzu
Li Chromatography System (Tokyo, Japan).
Native electrophoresis. The HPLC effluent containing neutrophil migration inhibitory activity,
F1 (Figure 2), was submitted to non-SDS polyacrylamide gel electrophoresis (PAGE). Eight µg
of protein of the sample per lane was applied and the protein was localized by Coomassie blue
and eluted by diffusion (20).
Mass spectrometry. Proteins purified by PAGE and a commercial hemopexin sample were heat
denatured and hydrolyzed with Promega modified trypsin (15). Peptide sequences were obtained
by CID-MS/MS. The amino acid sequences of 4 tryptic peptides indicated by * in Table E1
were deduced from the series of b and y fragment ions produced by CID. The masses of tryptic
peptides and fragment ions from CID were used to search the Genebank at NCBI using the
Protein Prospector MS-Fit and MS-Tag software (http://prospector.ucsf.edu/).
Statistical analysis. Data are reported as mean ± SEM (except for survival curves) and are
representative of two or three independent experiments with 5 mice in each group. Differences
between two unpaired groups were compared by Student t test. The mean differences between
three or more groups were compared by ANOVA. When significant differences were identified,
individual comparisons were subsequently tested with Bonferroni’s t-test. Statistical significance
was set at P < 0.05. Survival rates (n=10-12) were expressed as percentages, and a log-rank test
(chi-square test) was used to examine differences between survival curves.
Page 6 of 55

7
RESULTS
Serum and serum fractions from severe septic mice inhibits neutrophil migration
Mice subjected to severe sepsis (SS) presented 100% mortality (48 h after surgery) and failure of
neutrophil migration to the focus of infection (6 h after surgery), as previously demonstrated (6).
However, mice subjected to mild sepsis (MS) presented ~10% mortality and an efficient
neutrophil migration to the focus of infection (data not shown). The i.v. pretreatment of naïve
mice with serum collected from SS mice 2 h after CLP, significantly reduced thioglycolate-
induced neutrophil migration compared to the mice pretreated with saline or serum from sham-
operated (sham) mice (Figure 1A). The i.v. pretreatment of naïve mice with serum from MS
mice did not significantly inhibit neutrophil migration (data not shown). The next experiments
were designed to identify the soluble substances in the serum from SS mice that inhibit
neutrophil migration.
Serum from SS mice was filtered through an affinity column to remove albumin (Blue-
Sepharose column). Figure 1A shows that most of the neutrophil migration inhibitory activity
was recovered in the fraction that was not adsorbed to the resin (B-). This fraction with low
albumin content (B-) was then filtered through a HPLC C18 column. A typical UV absorbance
profile of fraction B- is shown in Figure 1B. Neutrophil migration inhibitory activity was
detected only in Fraction 1. When a portion of Fraction 1 was submitted to PAGE under native
non-denaturing conditions (Figure 1C), the neutrophil migration inhibitory activity was
demonstrable only in the diffusates of band 3 (B3) and band 4 (B4) (Figure 1A). In contrast, the
part of the gel that did not stain for protein (GEL) did not inhibit neutrophil migration.
Page 7 of 55

8
Mass spectrometric analysis of the tryptic peptides identified hemopexin as the protein in
fractions B3 and B4. The peptide mass fingerprint of fractions B3 and B4 contained nine
peptides with m/z values that were less than 0.3 mu different from the values expected on the
basis of the amino acid sequence of hemopexin (Figure E1 and Table E1). Four peptides were
submitted to CID-MS/MS and their amino acid sequences were deduced from the ion fragment
pattern (Table E1 and Figure E2). Moreover, the tryptic mass fingerprint obtained from a
commercial sample of hemopexin did not differ significantly from that obtained from fraction B3
or B4 (data not shown). The apparent molecular mass measured by SDS-PAGE of bands B3 and
B4 were ~57 kDa and ~69 kDa (Figure E1C), respectively, as calculated with program Image J
1.37v (National Institutes of Health, USA). The molecular mass of hemopexin is reported to be
~60 kDa (20). A monoclonal antibody against hemopexin detected this protein in fractions B3
and B4 by Western analysis (Figure E1D).
Hemopexin inhibits neutrophil migration and increases mortality in sepsis
Mass spectrometry indicated that hemopexin was the migration inhibitory protein in SS
serum. We used commercial hemopexin to confirm the inhibitory action of hemopexin on
neutrophil migration. Figure 2A shows that i.v. pretreatment of mice with different amounts of
hemopexin significantly inhibited the neutrophil migration stimulated by thioglycolate. BSA
used as a negative control, as expected, did not inhibit neutrophil migration. In addition, serum
collected from hemopexin-null mice 2 h after severe sepsis did not significantly inhibit
neutrophil migration, in contrast to serum collected from wild type mice under the same
conditions from wild type mice (Figure 2A).
Page 8 of 55

9
To determine the role of hemopexin in sepsis, mice were treated with commercial
hemopexin (10, 30 or 150 µg/mouse, i.v.) 30 min before the induction of mild sepsis. As shown
in Figure 2B, hemopexin treatment resulted in significantly reduced neutrophil migration to the
focus of infection compared to wild type mice treated with saline and subjected to the same
septic stimulus (Figure 2B). The inhibition of neutrophil migration induced by hemopexin was
accompanied by an increased mortality rate of MS mice. Figure 2C shows that the survival rate
of mice submitted to MS and pretreated with saline was 100% 3 d after surgery and 90%
thereafter. The i.v. pretreatment with 10 or 30 µg/mouse hemopexin of MS mice reduced the
survival rate to ~65% 3 d after sepsis. The reduction of the survival rate was more evident when
the MS mice were pretreated with 150 µg/mouse of hemopexin. In this experimental condition
the survival rate was ~50% 3 d after sepsis. Post-treatment (6 h after CLP) with hemopexin (150
µg/mouse) also decreased the survival rate in MS mice (Figure E3).
Moreover, pretreatment of MS hemopexin null-mice with hemopexin (150 µg/mouse, i.v.)
also inhibited the neutrophil migration to the focus of infection (Figure E4A). We also evaluated
the levels of hemopexin after administration of this protein in hemopexin-null mice by ELISA
assay. As showed in Figure E4B the levels of hemopexin was not detected in serum from
hemopexin-null mice pretreated with saline. However, 6 h after i.v. administration of hemopexin
(15 – 300 µg/mouse) we were able to detected circulating levels of this protein in naïve and MS
hemopexin-null mice.
Hemopexin-null mice are more resistant to sepsis
In the previous paragraph we demonstrated the detrimental role of hemopexin in sepsis. To
further investigate this issue, CLP was performed in hemopexin-null mice. The data in Figure
Page 9 of 55
10
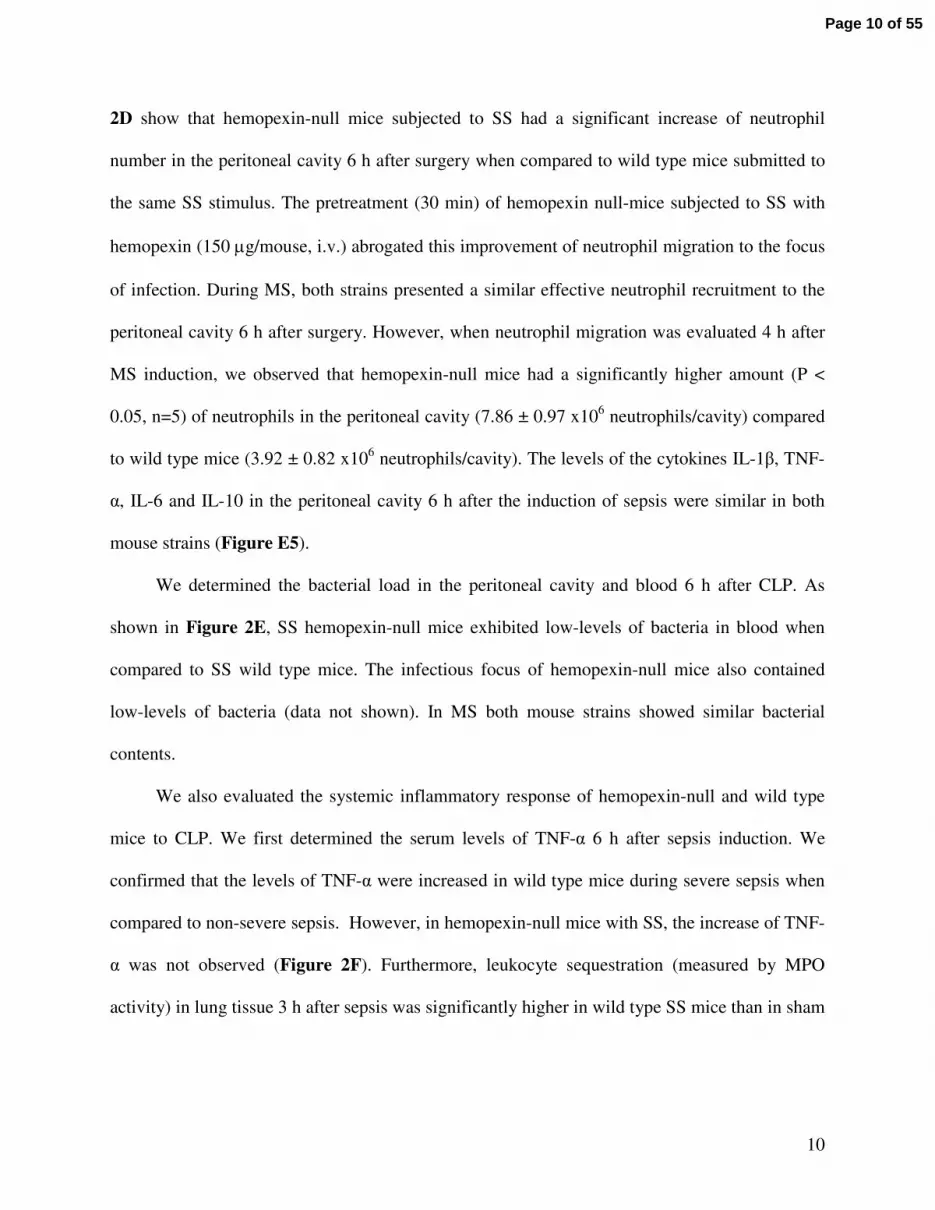
2D show that hemopexin-null mice subjected to SS had a significant increase of neutrophil
number in the peritoneal cavity 6 h after surgery when compared to wild type mice submitted to
the same SS stimulus. The pretreatment (30 min) of hemopexin null-mice subjected to SS with
hemopexin (150 µg/mouse, i.v.) abrogated this improvement of neutrophil migration to the focus
of infection. During MS, both strains presented a similar effective neutrophil recruitment to the
peritoneal cavity 6 h after surgery. However, when neutrophil migration was evaluated 4 h after
MS induction, we observed that hemopexin-null mice had a significantly higher amount (P <
0.05, n=5) of neutrophils in the peritoneal cavity (7.86 ± 0.97 x10⁶ neutrophils/cavity) compared
to wild type mice (3.92 ± 0.82 x10⁶ neutrophils/cavity). The levels of the cytokines IL-1β, TNF-
α, IL-6 and IL-10 in the peritoneal cavity 6 h after the induction of sepsis were similar in both
mouse strains (Figure E5).
We determined the bacterial load in the peritoneal cavity and blood 6 h after CLP. As
shown in Figure 2E, SS hemopexin-null mice exhibited low-levels of bacteria in blood when
compared to SS wild type mice. The infectious focus of hemopexin-null mice also contained
low-levels of bacteria (data not shown). In MS both mouse strains showed similar bacterial
contents.
We also evaluated the systemic inflammatory response of hemopexin-null and wild type
mice to CLP. We first determined the serum levels of TNF-α 6 h after sepsis induction. We
confirmed that the levels of TNF-α were increased in wild type mice during severe sepsis when
compared to non-severe sepsis. However, in hemopexin-null mice with SS, the increase of TNF-
α was not observed (Figure 2F). Furthermore, leukocyte sequestration (measured by MPO
activity) in lung tissue 3 h after sepsis was significantly higher in wild type SS mice than in sham
Page 10 of 55

11
or MS mice (Figure 2G). This increase in lung neutrophil sequestration was not observed in
hemopexin-null mice with SS.
Finally, we evaluated the mortality of wild type and hemopexin-null mice undergoing MS
and SS induced by CLP. As shown in Figure 2H, both mouse strains subjected to MS presented
survival rates of ~80% throughout the 7 d observation period. In contrast, 100% of wild type
mice subjected to SS died within 2 d, whereas about 40% of hemopexin-null mice subjected to
SS survived throughout the 7 d observation period. Interesting, when hemopexin-null mice were
pretreated with hemopexin (150 µg/mouse, i.v.) all mice died within 2 d after severe sepsis. In
another model of sepsis induced by i.p. inoculation of E. coli ( 2 x10⁸ CFU/mouse), the survival
rate of wild type mice was 48% over a 7 d observation period, as opposed to 86% for
hemopexin-null mice. When wild type mice were pretreated with hemopexin all mice died within
1 d after E. coli inoculation (Figure E6A).
Confirming the anti-inflammatory role of hemopexin, the Figure E6 showed that
hemopexin (150 µg/mouse, i.v.) pre-treatment inhibited LPS-induced leukocyte infiltration in
lungs and the mortality (from ∼100% to ∼30%) in mice. This dose of LPS (5 mg/kg, i.p.) induces
a systemic inflammatory response which is responsible for the low survival of the animals.
Serum hemopexin concentration during sepsis
It has been described that serum levels of hemopexin are up-regulated during an infection
process (21), however, it was not fully addressed in sepsis. As showed in Figure 3A, serum
levels of hemopexin were significantly down-regulated 6 h after severe CLP; however, 12 h after
sepsis induction, there is a significantly increased in the concentration of hemopexin only in
mice subjected to MS. In contrast, the mRNA expression of hemopexin was increased in MS and
Page 11 of 55

12
SS sepsis 6 h after surgery, and this up-regulation was sustained at 12 h in SS mice (Figure
E7A). Although the serum levels of hemopexin was not increase during SS, the levels of this
protein was significantly higher in the liver of severe septic mice when compared to sham-
operated mice (Figure E7B). The better-characterized function of hemopexin is to scavenge free
heme, following by its transport to the liver (22). Thus, the absence of the correspondent protein
in the serum could be explained by its high turnover due the transport of heme to the liver. To
confirm this hypothesis, we measured the haptoglobin levels (a known marker of hemolysis) and
the levels of total and free heme. The Figure 3B showed that the levels of haptoglobin were
down-regulated, indicating a scenario of hemolysis during severe sepsis. Moreover, the serum
levels of total (Figure 3C) and free heme (Figure 3D) were significantly increased 6 h and 12 h
after surgery only in SS.
The production of hemopexin is known to be regulated by pro-inflammatory cytokines,
such as IL-6 and TNF-α (20), therefore we evaluated the serum levels of hemopexin after CLP in
TNFR1/R2 double-knockout mice (TNFR1/R2-/-
) and in IL-6-deficient mice (IL-6-/-
). The
hemopexin serum levels 2 h and 6 h after MS and SS sepsis induction was similar in both strains
of mice when compared to wild-type mice (data not shown). However, 12 h after MS induction,
the serum levels of hemopexin was significantly decrease in IL-6-/-
mice when compared to
TNFR1/R2-/-
or wild-type mice (Figure E7C).
Hemopexin inhibits the neutrophil chemotactic response in vitro
Bone marrow cells were collected from wild type and hemopexin-null mice and neutrophils were
isolated for testing the in vitro chemotactic response in a Boyden chamber. The chemotactic
responses of neutrophils from both strains were similar. As shown in Figure 4A, C5a (50 nM)
induced a significant chemotactic response in neutrophils from both wild type and hemopexin-
Page 12 of 55

13
null mice. There was a significant difference between the responses to 50 and 100 nM C5a,
indicating that the response was dose-dependent. The insert in Figure 4A is a Western blot
analysis of serum and of a bone marrow neutrophil extract from wild type and hemopexin-null
naïve mice. A monoclonal antibody against hemopexin detected hemopexin only in serum but
not in neutrophils from wild type mice or in serum from hemopexin-null mice.
The effect of hemopexin on the chemotaxis of neutrophils from bone marrow of wild type
mice was then evaluated. As heme content in serum is increased during severe sepsis, the effect
of the heme-hemopexin complex on neutrophil chemotaxis was also evaluated. Neutrophils were
incubated at 37°C for 1 h in the absence (control, RPMI) or presence of hemopexin (1 µM),
heme-hemopexin (Hx-Hem, 1 µM) or heme-albumin (BSA-Hem, 1 µM) as a negative control
and then the cells (95% viable by Trypan blue exclusion) were allowed to migrate toward 100
nM C5a. As shown in Figure 4B, hemopexin and Hx-Hem pretreatment resulted in a marked
inhibition of C5a-induced chemotaxis. Pretreatment with BSA-Hem had no effect on chemotaxis
at the concentration and time studied. Similarly, hemopexin also inhibited the chemotaxis of
neutrophils from hemopexin-null mice to C5a (Figure 4C). Pretreatment of WT neutrophils with
hemopexin also induced a marked dose-dependent inhibitory effect on chemotactic response to
macrophage-inflammatory protein-2 (MIP-2) (Figure 4D). Moreover, pretreatment (30 min) of
neutrophils with the nonspecific inhibitor of heme oxygenase (HO), zinc deuteroporphyrin 2,4-
bis glycol (ZnDPBG) was not able to block the inhibitory effect of hemopexin on neutrophil
chemotaxis (Figure 4E).
Several studies have provided data demonstrating a protease activity for plasma
hemopexin. Hemopexin purified from human plasma or the recombinant protein was able to
induce transient protein leakage after contact with the rat kidney ex vivo and showed protease
Page 13 of 55
14
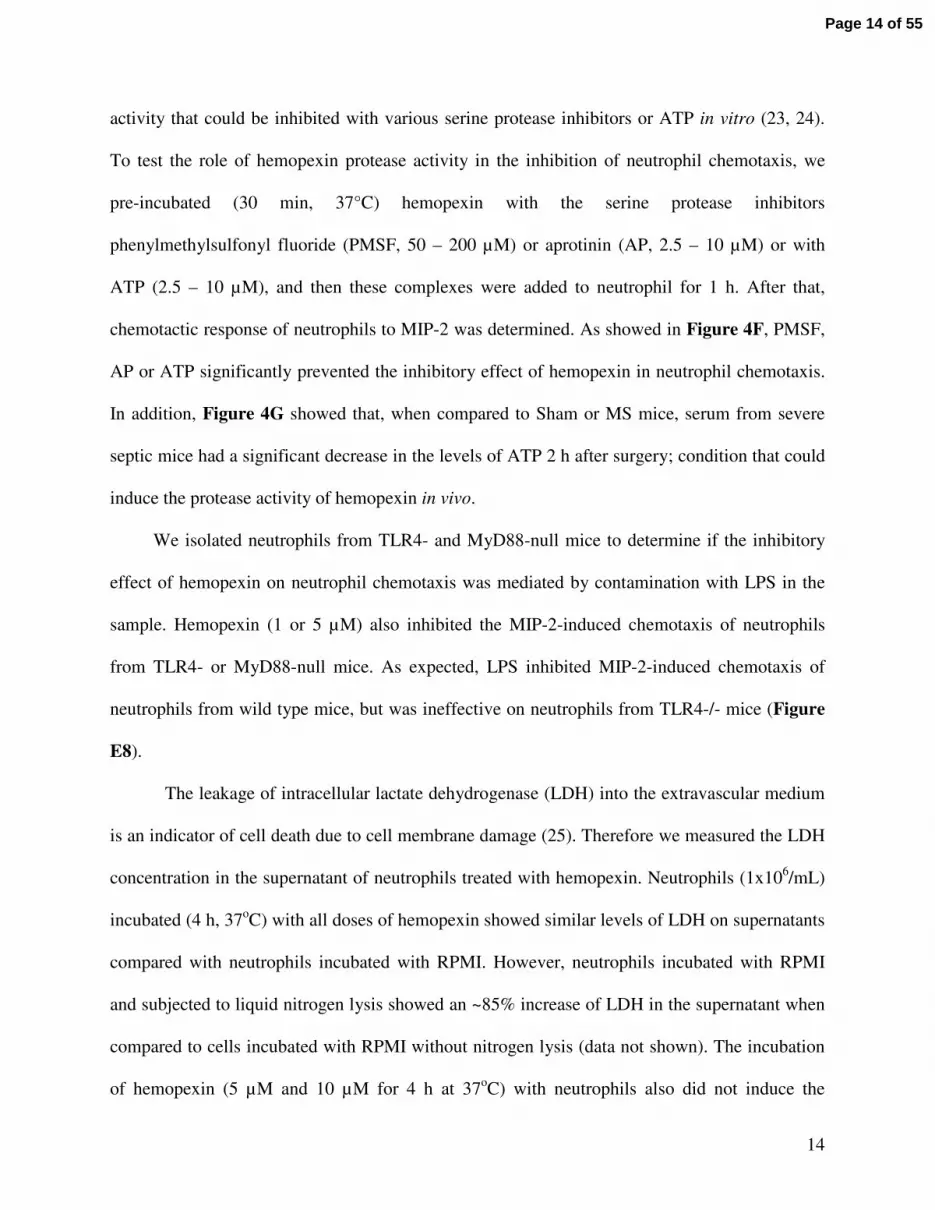
activity that could be inhibited with various serine protease inhibitors or ATP in vitro (23, 24).
To test the role of hemopexin protease activity in the inhibition of neutrophil chemotaxis, we
pre-incubated (30 min, 37°C) hemopexin with the serine protease inhibitors
phenylmethylsulfonyl fluoride (PMSF, 50 – 200 µM) or aprotinin (AP, 2.5 – 10 µM) or with
ATP (2.5 – 10 µM), and then these complexes were added to neutrophil for 1 h. After that,
chemotactic response of neutrophils to MIP-2 was determined. As showed in Figure 4F, PMSF,
AP or ATP significantly prevented the inhibitory effect of hemopexin in neutrophil chemotaxis.
In addition, Figure 4G showed that, when compared to Sham or MS mice, serum from severe
septic mice had a significant decrease in the levels of ATP 2 h after surgery; condition that could
induce the protease activity of hemopexin in vivo.
We isolated neutrophils from TLR4- and MyD88-null mice to determine if the inhibitory
effect of hemopexin on neutrophil chemotaxis was mediated by contamination with LPS in the
sample. Hemopexin (1 or 5 µM) also inhibited the MIP-2-induced chemotaxis of neutrophils
from TLR4- or MyD88-null mice. As expected, LPS inhibited MIP-2-induced chemotaxis of
neutrophils from wild type mice, but was ineffective on neutrophils from TLR4-/- mice (Figure
E8).
The leakage of intracellular lactate dehydrogenase (LDH) into the extravascular medium
is an indicator of cell death due to cell membrane damage (25). Therefore we measured the LDH
concentration in the supernatant of neutrophils treated with hemopexin. Neutrophils (1x10⁶/mL)
incubated (4 h, 37oC) with all doses of hemopexin showed similar levels of LDH on supernatants
compared with neutrophils incubated with RPMI. However, neutrophils incubated with RPMI
and subjected to liquid nitrogen lysis showed an ~85% increase of LDH in the supernatant when
compared to cells incubated with RPMI without nitrogen lysis (data not shown). The incubation
of hemopexin (5 µM and 10 µM for 4 h at 37oC) with neutrophils also did not induce the
Page 14 of 55

15
membrane expression of annexin V or propidium iodide (PI) accumulation in the cells when
compared to control neutrophils (Figure E9).
Hemopexin down-modulates CXCR2 and L-selectin and up-modulates CD11b expression
in neutrophils
In vitro studies have demonstrated that the down-regulation of CXCR2 is responsible for the
reduced neutrophil response to chemokines that bind to CXCR2 (26). Moreover, down-
regulation of CXCR2 on the neutrophil surface is an important event for the failure of neutrophil
migration to the focus of infection during severe sepsis (15). Therefore, we tested whether in
vitro hemopexin neutrophil stimulation leads to CXCR2 down-modulation. Flow cytometric
analysis showed that pretreatment with hemopexin (1, 5 and 10 µM) significantly decreased the
expression of CXCR2 on neutrophils (Figure 5A). Moreover, hemopexin also induced
neutrophil L-selectin shedding (Figure 5B) and up-modulation of CD11b (Figure 5C). All three
effects were dose dependent. L-selectin shedding and increased expression of CD11b on
circulating neutrophils have been used as predictors of severity for septic patients (28, 29).
DISCUSSION
The failure of neutrophil migration to the focus of infection may contribute to the high mortality
rate of severe sepsis (6-8). Several lines of evidence have shown that serum factors induced in
the host during the systemic inflammatory response syndrome (SIRS) are responsible for the
inhibition of neutrophil functions such as migration and oxidative burst (13, 14, 29). In a search
for serum mediators of the inhibition of neutrophil migration during sepsis, we demonstrated
here that the acute phase protein hemopexin participates in this process. First, we showed that
Page 15 of 55

16
serum collected from wild type mice 2 h after severe sepsis inhibited the thioglycolate-induced
neutrophil migration to the mouse peritoneal cavity. Hemopexin was isolated from this serum
and the purified protein inhibited thioglycolate-induced neutrophil migration to the peritoneal
cavity, an activity also demonstrable for commercial hemopexin. In a mild CLP model of sepsis,
hemopexin inhibited neutrophil migration to the focus of infection and increased the mortality
rate. As expected, hemopexin-null mice subjected to severe sepsis did not present failure of
neutrophil migration to the focus of infection. Consequently, these mice presented less
bacteremia and an improved survival rate when compared to wild type mice. When hemopexin-
null mice were treated with hemopexin before severe CLP, their survival rate as well as
recruitment of neutrophils to the peritoneal cavity, were comparable to what observed in severe
septic wild-type animals. Moreover, hemopexin inhibited neutrophil chemotaxis in vitro and
induced down-modulation of CXCR2 and CD62L, and up-modulation of CD11b expression in
neutrophils. Additionally, we demonstrated that the inhibitory effect of hemopexin under
neutrophil chemotaxis depends on its protease activity, since serine protease inhibitors or ATP
inhibited this process. Thus, the present study has demonstrated for the first time a negative role
for hemopexin in sepsis.
The methods used to isolate hemopexin, i.e., blue Sepharose, C18-HPLC, and PAGE were
standard. However, the difficulty in quantifying the biological response to hemopexin made it
impossible to monitor the recovery of activity of the active substance at each purification step or
to improve the recovery of any step. We recovered ~300 µg of hemopexin from 30 ml of serum,
which is very low, considering that the blood of septic mice contains ~0.50 mg/ml hemopexin.
As is the case for many acute phase proteins, the serum concentration of hemopexin could
increases during infection (21, 30). It is a 60-kDa plasma glycoprotein with a high binding
affinity to heme that forms a 1:1 molar complex. After heme binding, hemopexin undergoes a
Page 16 of 55

17
conformational change permitting interaction with a specific receptor, expressed mainly on the
hepatocyte membrane, and then is internalized (20, 31). Hemopexin is the main protein
responsible for the transport of intravascular heme, thus preventing both free heme-catalyzed
oxidative damage and heme-bound iron loss (20). Here, for the first time, we demonstrated the
course of serum hemopexin levels during sepsis. Hemopexin mRNA and protein level in the
liver strongly increased after severe sepsis whereas the serum protein level decreased, suggesting
a rapid turnover caused by intravascular hemolysis. This is in agreement with what occurs in
many other pathologic conditions associated to hemolysis including trauma,
hemoglobinopathies, hemorrhages, malaria (22). In addition, our data suggested that IL-6 is the
main regulator of hemopexin production in sepsis, since the IL-6-/-
mice showed lower levels of
hemopexin then wild type mice mice.
We showed here the inhibitory effect of hemopexin on neutrophil migration. When
hemopexin was administered by the i.v. route to mice subjected to mild sepsis, neutrophil
migration to the focus of infection was inhibited. Consequently, control of infection was
impaired, with increased mortality of the mice. In another model of a local sterile inflammation,
hemopexin also inhibited the thioglycolate-induced neutrophil migration to the peritoneal cavity.
Moreover, hemopexin-null mice subjected to severe sepsis presented a significant increase in
neutrophil content at the focus of infection when compared to wild type mice and were more
resistant to sepsis. Of note, in apparent contradiction with these findings, hemopexin null-mice
are more susceptible to heme overload or intravascular hemolysis (30-32). Moreover, in the
present study, hemopexin protected animals from LPS-induced mortality. These models have
similar physiopathology events. The oxidative stress, endothelial cell and leukocyte activation
are the main factors responsible for the tissue injury (32-34). These alterations are triggered
mainly by free heme in heme-overload and intravascular hemolysis models and by LPS in LPS-
Page 17 of 55

18
induced shock, respectively. In the first two models hemopexin, by sequestering heme, prevents
endothelial and tissue damage. In LPS-induced shock the ability of hemopexin to inhibit
neutrophil migration prevents the neutrophil accumulation in vital organs, such as in lung. In
contrast, the efficient neutrophil migration observed in hemopexin-null mice after the induction
of severe sepsis improved the control of infection, as indicated by the reduction of the CFU
content at the focus of infection and in blood. Bacteria and their products in the blood stream
could induce the activation of TLRs and, therefore, increase the serum levels of cytokines and
trigger leukocyte activation, which accumulated in the lung and other specific organs (8, 35).
Low serum TNF-α levels and the reduction of lung leukocyte sequestration probably account for
the improvement of survival observed in hemopexin-null mice after sepsis.
The higher amounts of neutrophil in the infection focus observed in hemopexin-null mice
undergoing sepsis when compared to wild type mice, was not due to a higher concentration of
cytokines at the site of infection, since both mouse strains presented similar levels of TNF-α, IL-
1β, IL-6 and IL-10 in the exudate. Nevertheless, neutrophil chemotaxis was inhibited when
hemopexin was incubated with neutrophils from wild type or from hemopexin-null mice. Of
note, we observed similar chemotactic response of neutrophils from the bone marrow of wild
type and hemopexin-null mice. Together these results suggest that the mainly effect of the
hemopexin is on the neutrophil locomotion. In addition, Suzuki et. al. (36) demonstrated that
hemopexin inhibits PMA-induced neutrophils adhesion to fibrinogen- and serum-coated surfaces
(37). There is also evidence that hemopexin inhibits the production of cytokines by LPS-
stimulated macrophages (38). However, it seems that it does not happen in sepsis context;
because the level of cytokine production in the focus of infection in hemopexin-null mice was
similar to those in WT mice.
Page 18 of 55

19
The inhibition of chemotaxis was observed with both hemopexin and the Hx-Heme
complex, suggesting that this effect is independent of the low-density receptor-related protein
(LRP/CD91) present in these cells, since hemopexin alone has low affinity for this receptor.
LRP/CD91 has been reported to internalize Hx-Heme complexes (31). Heme is rapidly
catabolized by HO that opens the porphyrin ring, producing biliverdin and carbon monoxide
(CO) and releasing iron that can then be bound by ferritin (39). It has been shown that the
activation of HO by LPS or hemin with consequent CO production inhibits the neutrophil
chemotactic response and that HO inhibitors prevent this inhibition of the chemotactic response
(Freitas A and Cunha FQ, unpublished data). However, the nonspecific inhibitor of HO did not
block the hemopexin effect on neutrophil chemotaxis, suggesting that the inhibitory effect of
hemopexin is independent of the CD91/HO/CO pathway.
As mentioned above, hemopexin had protease activity which could be inhibited by serine
proteases inhibitors or ATP (24). Here we demonstrated that the co-incubation of hemopexin
with serine protease inhibitors or ATP prevented the reduction of neutrophil chemotaxis induced
by hemopexin. Moreover, the serum level of ATP was decreased in mice with severe sepsis.
These data suggest that severe sepsis triggers an inhibitory activity of hemopexin, likely through
the enhancements of its protease activity and/or decrease the efficiency of their endogenous
inhibitor. This hypothesis may explain why only the septic serum inhibited the neutrophil
migration. Moreover, an intriguing find of the present study was that the inhibitory effect of
human hemopexin upon neutrophil migration is achieved with a very low dose (∼ 8-10 times less
than the physiologic concentration in mice). As human hemopexin behaves like the hemopexin
found in septic mice, it is possible that the human protein is more efficient in inhibiting
Page 19 of 55

20
migration and/or that the purification procedure from human serum unmasks the inhibitory
effect.
Chemokines coordinate the migration and chemotaxis of leukocytes by binding to specific
chemokine receptors. CXCR2 plays a central role in the recruitment of neutrophils from the
circulation to the site of inflammation (40). Impaired neutrophil migration during sepsis is
correlated with early down-regulation of CXCR2 expression on circulating neutrophils (15). We
have identified hemopexin as a mediator of this phenomenon, since hemopexin induced the
down-regulation of CXCR2 on neutrophils. Interestingly, this decreased CXCR2 expression was
accompanied by reduced chemotaxis to MIP-2. Moreover, hemopexin induced shedding of L-
selectin and up-regulation of CD11b on neutrophils. These findings suggest that the circulating
hemopexin during sepsis could promote the activation of circulating neutrophils and, therefore
inducing the down-regulation of CXCR2 and L-selectin and up-regulation of CD11b and, as a
consequence the inhibition of neutrophil migration to the focus of infection. In accordance, the
protease activity of hemopexin is able to down-regulate angiotensin II receptor-1 in human
monocytes, endothelial cells, and rat aortic rings (41).
The present study provides evidence for another example of an acute phase protein with
anti-inflammatory effects. It has been shown that C-reactive protein (42), serum amyloid A (43),
AGP (14), pentraxin 3 (44) and now hemopexin inhibit neutrophil migration/chemotaxis. The
anti-inflammatory action of acute phase proteins could be beneficial by limiting tissue neutrophil
infiltration in pathological conditions with SIRS without a focus of infection. However, in sepsis,
the overwhelming anti-inflammatory response in the early phase of sepsis inhibits neutrophil
migration and, consequently, impairs bacterial killing. Thus, therapeutic inhibition of acute phase
proteins such as hemopexin, AGP, C-reactive protein and serum amyloid A in the early phase of
Page 20 of 55

21
sepsis could improve neutrophil migration to the focus of infection and, as a consequence,
improve the survival rate.
Acknowledgments
We thank Giuliana B. Francisco for technical assistance.
REFERENCES
1. Pugin J, Schurer-Maly CC, Leturcq D, Moriarty A, Ulevitch RJ, Tobias PS.
Lipopolysaccharide activation of human endothelial and epithelial cells is mediated by
lipopolysaccharide-binding protein and soluble cd14. Proc Natl Acad Sci U S A 1993;90:2744-
2748.
2. Awad SS. State-of-the-art therapy for severe sepsis and multisystem organ dysfunction.
Am J Surg 2003;186:23S-30S.
3. Zhang X, Kluger Y, Nakayama Y, Poddar R, Whitney C, DeTora A, Weissman SM,
Newburger PE. Gene expression in mature neutrophils: Early responses to inflammatory stimuli.
J Leukoc Biol 2004;75:358-372.
4. Hayashi F, Means TK, Luster AD. Toll-like receptors stimulate human neutrophil
function. Blood 2003;102:2660-2669.
5. Alves-Filho JC, de Freitas A, Spiller F, Souto FO, Cunha FQ. The role of neutrophils in
severe sepsis. Shock 2008;30 Suppl 1:3-9.
6. Benjamim CF, Ferreira SH, Cunha FQ. Role of nitric oxide in the failure of neutrophil
migration in sepsis. J Infect Dis 2000;182:214-223.
7. Crosara-Alberto DP, Darini AL, Inoue RY, Silva JS, Ferreira SH, Cunha FQ.
Involvement of no in the failure of neutrophil migration in sepsis induced by staphylococcus
aureus. Br J Pharmacol 2002;136:645-658.
8. Alves-Filho JC, de Freitas A, Russo M, Cunha FQ. Toll-like receptor 4 signaling leads to
neutrophil migration impairment in polymicrobial sepsis. Crit Care Med 2006;34:461-470.
9. Tavares-Murta BM, Zaparoli M, Ferreira RB, Silva-Vergara ML, Oliveira CH, Murta EF,
Ferreira SH, Cunha FQ. Failure of neutrophil chemotactic function in septic patients. Crit Care
Med 2002;30:1056-1061.
10. Tavares-Murta BM, Cunha FQ, Ferreira SH. The intravenous administration of tumor
necrosis factor alpha, interleukin 8 and macrophage-derived neutrophil chemotactic factor
inhibits neutrophil migration by stimulating nitric oxide production. Br J Pharmacol
1998;124:1369-1374.
Page 21 of 55

22
11. Secher T, Vasseur V, Poisson DM, Mitchell JA, Cunha FQ, Alves-Filho JC, Ryffel B.
Crucial role of tnf receptors 1 and 2 in the control of polymicrobial sepsis. J Immunol
2009;182:7855-7864.
12. Rice TW, Bernard GR. Therapeutic intervention and targets for sepsis. Annu Rev Med
2005;56:225-248.
13. Eisenfeld L, Krause PJ, Herson VC, Block C, Schick JB, Maderazo E. Enhancement of
neonatal neutrophil motility (chemotaxis) with adult fresh frozen plasma. Am J Perinatol
1992;9:5-8.
14. Mestriner FL, Spiller F, Laure HJ, Souto FO, Tavares-Murta BM, Rosa JC, Basile-Filho
A, Ferreira SH, Greene LJ, Cunha FQ. Acute-phase protein alpha-1-acid glycoprotein mediates
neutrophil migration failure in sepsis by a nitric oxide-dependent mechanism. Proc Natl Acad Sci
U S A 2007;104:19595-19600.
15. Rios-Santos F, Alves-Filho JC, Souto FO, Spiller F, Freitas A, Lotufo CM, Soares MB,
Dos Santos RR, Teixeira MM, Cunha FQ. Down-regulation of cxcr2 on neutrophils in severe
sepsis is mediated by inducible nitric oxide synthase-derived nitric oxide. Am J Respir Crit Care
Med 2007;175:490-497.
16. Benjamim CF, Silva JS, Fortes ZB, Oliveira MA, Ferreira SH, Cunha FQ. Inhibition of
leukocyte rolling by nitric oxide during sepsis leads to reduced migration of active microbicidal
neutrophils. Infect Immun 2002;70:3602-3610.
17. Wichterman KA, Baue AE, Chaudry IH. Sepsis and septic shock--a review of laboratory
models and a proposal. J Surg Res 1980;29:189-201.
18. Travis J, Bowen J, Tewksbury D, Johnson D, Pannell R. Isolation of albumin from whole
human plasma and fractionation of albumin-depleted plasma. Biochem J 1976;157:301-306.
19. Castellanos-Serra LR, Fernandez-Patron C, Hardy E, Huerta V. A procedure for protein
elution from reverse-stained polyarcylamide gels applicable at the low picomole level: An
alternative route to the preparation of low abundance proteins for microanalysis. Electrophoresis
1996;17:1564-1572.
20. Tolosano E, Altruda F. Hemopexin: Structure, function, and regulation. DNA Cell Biol
2002;21:297-306.
21. Duan X, Yarmush D, Berthiaume F, Jayaraman A, Yarmush ML. Immunodepletion of
albumin for two-dimensional gel detection of new mouse acute-phase protein and other plasma
proteins. Proteomics 2005;5:3991-4000.
22. Tolosano E, Fagoonee S, Morello N, Vinchi F, Fiorito V. Heme scavenging and the other
facets of hemopexin. Antioxid Redox Signal;12:305-320.
23. Cheung PK, Klok PA, Baller JF, Bakker WW. Induction of experimental proteinuria in
vivo following infusion of human plasma hemopexin. Kidney Int 2000;57:1512-1520.
24. Bakker WW, Borghuis T, Harmsen MC, van den Berg A, Kema IP, Niezen KE, Kapojos
JJ. Protease activity of plasma hemopexin. Kidney Int 2005;68:603-610.
25. Decker T, Lohmann-Matthes ML. A quick and simple method for the quantitation of
lactate dehydrogenase release in measurements of cellular cytotoxicity and tumor necrosis factor
(tnf) activity. J Immunol Methods 1988;115:61-69.
26. Adams JM, Hauser CJ, Livingston DH, Lavery RF, Fekete Z, Deitch EA. Early trauma
polymorphonuclear neutrophil responses to chemokines are associated with development of
sepsis, pneumonia, and organ failure. J Trauma 2001;51:452-456; discussion 456-457.
27. Turunen R, Andersson S, Nupponen I, Kautiainen H, Siitonen S, Repo H. Increased
cd11b-density on circulating phagocytes as an early sign of late-onset sepsis in extremely low-
birth-weight infants. Pediatr Res 2005;57:270-275.
Page 22 of 55

23
28. Seidelin JB, Nielsen OH, Strom J. Soluble l-selectin levels predict survival in sepsis.
Intensive Care Med 2002;28:1613-1618.
29. Lanser ME, Brown GE, Mora R, Coleman W, Siegel JH. Trauma serum suppresses
superoxide production by normal neutrophils. Arch Surg 1986;121:157-162.
30. Wait R, Chiesa G, Parolini C, Miller I, Begum S, Brambilla D, Galluccio L, Ballerio R,
Eberini I, Gianazza E. Reference maps of mouse serum acute-phase proteins: Changes with lps-
induced inflammation and apolipoprotein a-i and a-ii transgenes. Proteomics 2005;5:4245-4253.
31. Hvidberg V, Maniecki MB, Jacobsen C, Hojrup P, Moller HJ, Moestrup SK.
Identification of the receptor scavenging hemopexin-heme complexes. Blood 2005;106:2572-
2579.
32. Vinchi F, Gastaldi S, Silengo L, Altruda F, Tolosano E. Hemopexin prevents endothelial
damage and liver congestion in a mouse model of heme overload. Am J Pathol 2008;173:289-
299.
33. Tolosano E, Fagoonee S, Hirsch E, Berger FG, Baumann H, Silengo L, Altruda F.
Enhanced splenomegaly and severe liver inflammation in haptoglobin/hemopexin double-null
mice after acute hemolysis. Blood 2002;100:4201-4208.
34. Tolosano E, Hirsch E, Patrucco E, Camaschella C, Navone R, Silengo L, Altruda F.
Defective recovery and severe renal damage after acute hemolysis in hemopexin-deficient mice.
Blood 1999;94:3906-3914.
35. Alves-Filho JC, Freitas A, Souto FO, Spiller F, Paula-Neto H, Silva JS, Gazzinelli RT,
Teixeira MM, Ferreira SH, Cunha FQ. Regulation of chemokine receptor by toll-like receptor 2
is critical to neutrophil migration and resistance to polymicrobial sepsis. Proc Natl Acad Sci U S
A 2009;106:4018-4023.
36. Suzuki K, Kobayashi N, Doi T, Hijikata T, Machida I, Namiki H. Inhibition of mg2+-
dependent adhesion of polymorphonuclear leukocytes by serum hemopexin: Differences in
divalent-cation dependency of cell adhesion in the presence and absence of serum. Cell Struct
Funct 2003;28:243-253.
37. Suzuki K, Namiki H. [serum hemopexin: Suppressive effect on neutrophil functions and
prospect of clinical application to autoimmune diseases]. Nippon Rinsho 2004;62:577-586.
38. Liang X, Lin T, Sun G, Beasley-Topliffe L, Cavaillon JM, Warren HS. Hemopexin
down-regulates lps-induced proinflammatory cytokines from macrophages. J Leukoc Biol 2009.
39. Tolosano E, Fagoonee S, Morello N, Vinchi F, Fiorito V. Heme scavenging and the other
facets of hemopexin. Antioxid Redox Signal 2009.
40. Olson TS, Ley K. Chemokines and chemokine receptors in leukocyte trafficking. Am J
Physiol Regul Integr Comp Physiol 2002;283:R7-28.
41. Bakker WW, Henning RH, van Son WJ, van Pampus MG, Aarnoudse JG, Niezen-Koning
KE, Borghuis T, Jongman RM, van Goor H, Poelstra K, et al. Vascular contraction and
preeclampsia: Downregulation of the angiotensin receptor 1 by hemopexin in vitro. Hypertension
2009;53:959-964.
42. Heuertz RM, Tricomi SM, Ezekiel UR, Webster RO. C-reactive protein inhibits
chemotactic peptide-induced p38 mitogen-activated protein kinase activity and human neutrophil
movement. J Biol Chem 1999;274:17968-17974.
43. Renckens R, Roelofs JJ, Knapp S, de Vos AF, Florquin S, van der Poll T. The acute-
phase response and serum amyloid a inhibit the inflammatory response to acinetobacter
baumannii pneumonia. J Infect Dis 2006;193:187-195.
Page 23 of 55

24
44. Deban L, Russo RC, Sironi M, Moalli F, Scanziani M, Zambelli V, Cuccovillo I, Bastone
A, Gobbi M, Valentino S, et al. Regulation of leukocyte recruitment by the long pentraxin ptx3.
Nat Immunol;11:328-334.
Figure Legends
Figure 1. Serum from severe septic mice and their fractions inhibits the neutrophil
migration. (A) Neutrophil migration to the peritoneal cavity of mice. Six hours after injection of
thioglycolate (3%, 500 µl/cavity, i.p.) the cells in the peritoneal cavity were collected and
neutrophils were counted (see Methods). The test substances were administered i.v. 30 min
before thioglycolate. Data are reported as mean ± SEM x106 neutrophils/cavity (n=5) and are the
result of three independent experiments. Data were analyzed by ANOVA followed by
Bonferroni`s t-test. Serum from sham-operated (Sham) or severe sepsis (SS) mice was injected at
9.6 mg protein/mouse. The protein from the serum of septic mice that adsorbed to the Blue-
Sepharose column (B+) and those that did not adsorb (B-) were injected i.v. at 7.40 and 2.05 mg
protein/mouse, respectively. *P < 0.001 compared to the Sal + Thioglycolate or B+ plus
Thioglycolate groups. The effluent fractions of HPLC (F1 – F4) were injected i.v. at 60 µg
protein/mouse. **P < 0.01 vs Sal plus Thioglycolate group. Diffusates of gel bands 1 to 4 were
injected i.v. at 0.41 µg protein/mouse. The gel control (GEL) was a diffusate from a portion of
the gel which was free of protein. #P < 0.05 compared to Sal or GEL. Sal = Saline. (B) HPLC
profile of serum fraction B-. The fraction of the septic serum pool with low albumin content (B-)
was applied to a C18 column and eluted with a linear gradient of acetonitrile in TFA as described
in Methods. The effluent was combined in four pools as indicated on the horizontal line and the
neutrophil migration inhibiting activity of each pool is shown in panel A. (C) Native gel
electrophoresis diffusates from HPLC fraction 1 (F1).
Page 24 of 55

25
Figure 2. A commercial sample of plasma hemopexin inhibits neutrophil migration and
hemopexin-null mice are more resistant to severe sepsis. (A) Serum collected 2 h after the
induction of severe sepsis from wild type mice (Wt, 9.50 mg protein/mouse) or from hemopexin-
null mice (Hx-/-, 9.50 mg protein/mouse) and bovine serum albumin (BSA, 30 µg/mouse) or
commercial hemopexin (Hx, 3 – 30 µg/mouse) was injected i.v. 30 min before thioglycolate
(3%, 500 µl/cavity, i.p.). Six hours after thioglycolate administration the neutrophils in the
peritoneal cavity were counted (see Methods). Data are reported as mean ± SEM x106
neutrophils/cavity and are the result of three independent experiments. *P < 0.01 compared to the
Sal plus Thioglycolate group; ** P < 0.05 compared to the Serum Wt plus Thioglycolate group.
The inset in panel A is a Western blot analysis of serum samples from Wt and Hx-/- mice with
severe sepsis; a monoclonal antibody against Hx was used for detection. We used 10-12
mice/group for survival analysis and 5 mice/group for the other data. A log-rank test (chi-square
test) was used to examine differences between survival curves and the other data were analyzed
by ANOVA followed by Bonferroni`s t-test. Commercial Hx (3 -150µg/mouse, i.v.) was injected
30 min before the induction of mild sepsis (MS) by cecal ligation and puncture (CLP). Six h
later, neutrophil migration to the focus of infection was determined (B) and survival rates were
determined up to 7 days after surgery (C). *P < 0.05 compared to the Sal plus MS group. MS
and severe sepsis (SS) were induced in Hx-/- and Wt mice. Commercial Hx (150µg/mouse, i.v.)
was injected 30 min before the induction of SS in Hx-/- mice. Six h after surgery the neutrophil
(D) and bacterial content in blood (E) and serum TNF-α levels (F) were determined. Leukocyte
sequestration in lung (G) was determined 3 h after surgery with a myeloperoxidase assay and the
Page 25 of 55

26
survival rates (H) were also determined; *P < 0.05 compare to MS Wt group; **P <0.05
compare to SS Wt group.
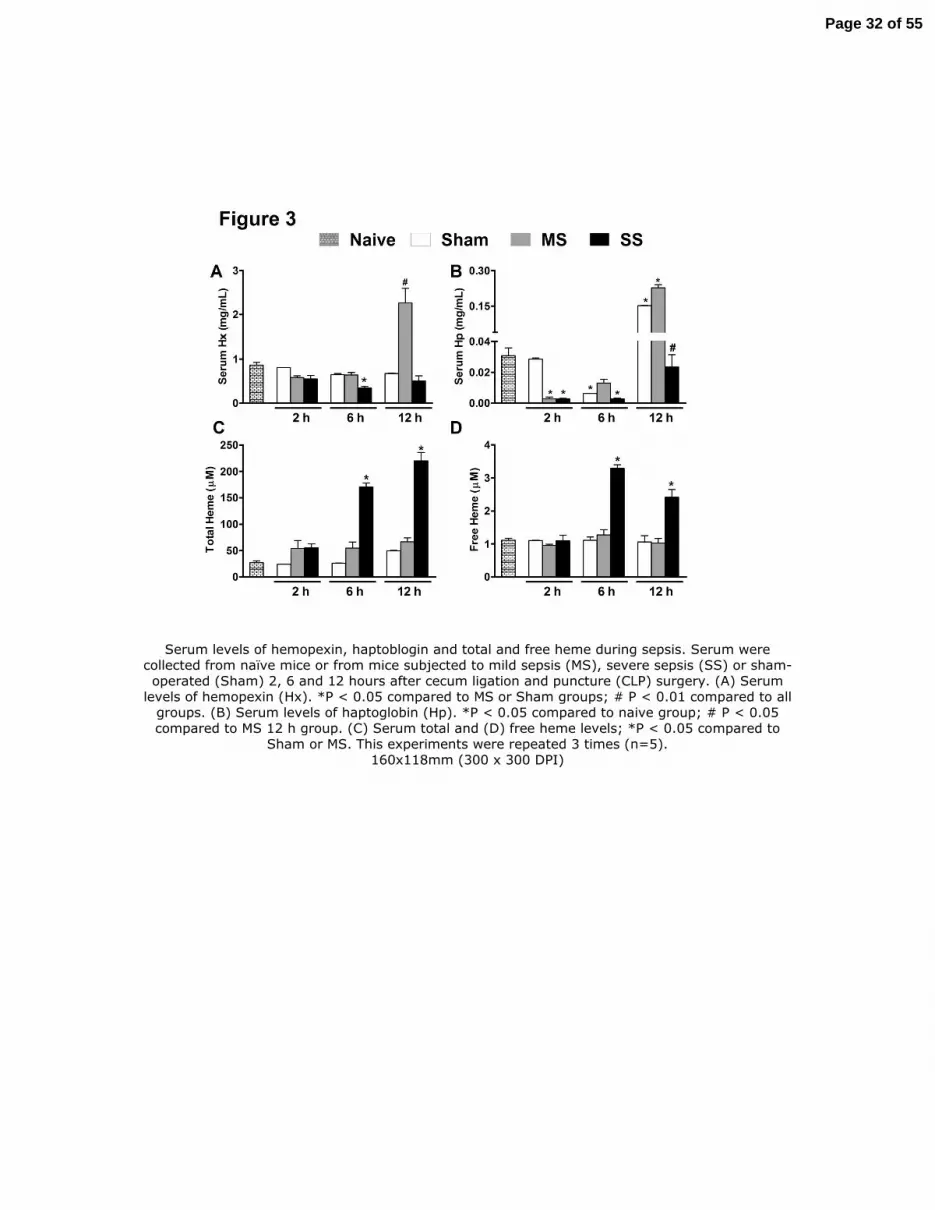
Figure 3. Serum levels of hemopexin, haptoblogin and total and free heme during sepsis.
Serum were collected from naïve mice or from mice subjected to mild sepsis (MS), severe sepsis
(SS) or sham-operated (Sham) 2, 6 and 12 hours after cecum ligation and puncture (CLP)
surgery. (A) Serum levels of hemopexin (Hx). *P < 0.05 compared to MS or Sham groups; # P <
0.01 compared to all groups. (B) Serum levels of haptoglobin (Hp). *P < 0.05 compared to naive
group; # P < 0.05 compared to MS 12 h group. (C) Serum total and (D) free heme levels; *P <
0.05 compared to Sham or MS. This experiments were repeated 3 times (n=5).
Figure 4. Hemopexin inhibits the neutrophil chemotactic response induced by C5a or MIP-
2. (A) Neutrophils purified from bone marrow of Wild-type (Wt) and from Hemopexin-null (Hx-
/-) mice were submitted to chemotaxis stimulated by C5a (50 or 100 nM) or RPMI (control) in a
Boyden chamber. Data are reported as the mean ± SEM of the number of neutrophils per field
and are the results of three independent experiments carried out in triplicate. *P < 0.001
compared to RPMI; #P < 0.001 compared to 50 nM C5a (analysis of variance followed by
Bonferroni’s test). At the top of panel A is a Western blot analysis of serum and a bone marrow
neutrophil extract from Wt and Hx-/- naïve mice. A monoclonal antibody against hemopexin
(Hx) or vinculin was used for detection. (B) Neutrophils purified from bone marrow of Wt mice
were incubated with RPMI medium, 1 µM Hx, 1 µM Hx-Hem complex or 1 µM bovine serum
albumin-Hem complex (BSA-Hem) for 1 h at 37°C before chemotaxis stimulated by 100 nM
C5a or RPMI (control) in a Boyden chamber. *P < 0.01 compared to RPMI plus RPMI; **P <
Page 26 of 55

27
0.01 compared to RPMI plus C5a. (C) Neutrophils purified from bone marrow of hemopexin-
null mice were incubated with RPMI medium or 1 µM Hx for 1 h at 37°C before chemotaxis
stimulated by 100 nM C5a or RPMI (control) in a Boyden chamber. *P < 0.01 compared to
RPMI plus RPMI; **P < 0.01 compared to RPMI plus C5a. (D) Hx (0.5 – 5 µM) also inhibited
the neutrophil chemotaxis stimulated by 20 ng/mL MIP-2 in a dose-dependent manner. *P < 0.01
compared to RPMI plus RPMI; **P < 0.01 compared to RPMI plus MIP-2; #P < 0.01 compared
to Hx 0.5 µM plus MIP-2. (E) The inhibitor of heme oxygenase zinc deuteroporphyrin 2,4-bis
glycol (ZnDPBG; ZN 30 µM) did not block the effect of Hx on neutrophil chemotaxis. *P <
0.001 compared to RPMI plus RPMI; **P < 0.01 compared to RPMI plus MIP-2. (F)
Hemopexin (5 µM) were incubated (30 min, 37°C) with phenylmethylsulfonyl fluoride (PMSF,
50 – 200 µM), aprotinin (AP, 2.5 – 10 µM) or with adenosine-5’-triphosphate (ATP, 2.5 – 10
µM). These complexes were added to neutrophils for 1 h and the chemotaxis response to 100 nM
C5a or RPMI (control) in a Boyden chamber was evaluated. *P < 0.01 compared to RPMI plus
MIP-2; **P < 0.01 compared to Hemopexin plus C5a. (G) Levels of ATP were measured in
serum collected 2 h after mild (MS) or severe (SS) sepsis induction or serum from Sham
operated mice.
Figure 5. Hemopexin decreased the expression of CD62L and CXCR2 and increased
CD11b expression on neutrophils. Flow cytometry of CXCR2 (A), CD62L (B) and CD11b (C)
expression on bone marrow neutrophils incubated with RPMI medium or hemopexin (Hx 1, 5
and 10 µM) for 1 h at 37°C. *P < 0.05 compared to RPMI; #P < 0.01 compared to 1 µM Hx.
Data are reported as the mean ± SEM of mean fluorescence intensity (MFI) and are the result of
the three independent experiments carried out in triplicate.
Page 27 of 55

Figure 1. Serum from severe septic mice and their fractions inhibits the neutrophil migration. (A) Neutrophil migration to the peritoneal cavity of mice. Six hours after injection of thioglycolate (3%, 500 ml/cavity, i.p.) the cells in the peritoneal cavity were collected and neutrophils were counted (see Methods). The test substances were administered i.v. 30 min before thioglycolate. Data are reported as mean ± SEM x106 neutrophils/cavity (n=5) and are the result of three independent experiments. Data were analyzed by ANOVA followed by Bonferroni`s t-test. Serum from sham-operated (Sham) or severe sepsis (SS) mice was injected at 9.6 mg protein/mouse. The protein
from the serum of septic mice that adsorbed to the Blue-Sepharose column (B+) and those that did not adsorb (B-) were injected i.v. at 7.40 and 2.05 mg protein/mouse, respectively. *P < 0.001
compared to the Sal + Thioglycolate or B+ plus Thioglycolate groups. The effluent fractions of HPLC (F1 – F4) were injected i.v. at 60 mg protein/mouse. **P < 0.01 vs Sal plus Thioglycolate group. Diffusates of gel bands 1 to 4 were injected i.v. at 0.41 mg protein/mouse. The gel control (GEL) was a diffusate from a portion of the gel which was free of protein. #P < 0.05 compared to Sal or GEL. Sal = Saline. (B) HPLC profile of serum fraction B-. The fraction of the septic serum pool with
low albumin content (B-) was applied to a C18 column and eluted with a linear gradient of acetonitrile in TFA as described in Methods. The effluent was combined in four pools as indicated on the horizontal line and the neutrophil migration inhibiting activity of each pool is shown in panel A.
Page 28 of 55

(C) Native gel electrophoresis diffusates from HPLC fraction 1 (F1). 166x180mm (300 x 300 DPI)
Page 29 of 55

A commercial sample of plasma hemopexin inhibits neutrophil migration and hemopexin-null mice are more resistant to severe sepsis. (A) Serum collected 2 h after the induction of severe sepsis from wild type mice (Wt, 9.50 mg protein/mouse) or from hemopexin-null mice (Hx-/-, 9.50 mg
protein/mouse) and bovine serum albumin (BSA, 30 µg/mouse) or commercial hemopexin (Hx, 3 – 30 µg/mouse) was injected i.v. 30 min before thioglycolate (3%, 500 ml/cavity, i.p.). Six hours
after thioglycolate administration the neutrophils in the peritoneal cavity were counted (see Methods). Data are reported as mean ± SEM x106 neutrophils/cavity and are the result of three independent experiments. *P < 0.01 compared to the Sal plus Thioglycolate group; ** P < 0.05
compared to the Serum Wt plus Thioglycolate group. The inset in panel A is a Western blot analysis of serum samples from Wt and Hx-/- mice with severe sepsis; a monoclonal antibody against Hx was used for detection. We used 10-12 mice/group for survival analysis and 5 mice/group for the other data. A log-rank test (chi-square test) was used to examine differences between survival
Page 30 of 55

curves and the other data were analyzed by ANOVA followed by Bonferroni`s t-test. Commercial Hx (3 -150µg/mouse, i.v.) was injected 30 min before the induction of mild sepsis (MS) by cecal
ligation and puncture (CLP). Six h later, neutrophil migration to the focus of infection was determined (B) and survival rates were determined up to 7 days after surgery (C). *P < 0.05
compared to the Sal plus MS group. MS and severe sepsis (SS) were induced in Hx-/- and Wt mice. Commercial Hx (150µg/mouse, i.v.) was injected 30 min before the induction of SS in Hx-/- mice. Six h after surgery the neutrophil (D) and bacterial content in blood (E) and serum TNF-α levels (F)
were determined. Leukocyte sequestration in lung (G) was determined 3 h after surgery with a myeloperoxidase assay and the survival rates (H) were also determined; *P < 0.05 compare to MS
Wt group; **P <0.05 compare to SS Wt group. 135x219mm (300 x 300 DPI)
Page 31 of 55
Serum levels of hemopexin, haptoblogin and total and free heme during sepsis. Serum were collected from naïve mice or from mice subjected to mild sepsis (MS), severe sepsis (SS) or sham-operated (Sham) 2, 6 and 12 hours after cecum ligation and puncture (CLP) surgery. (A) Serum
levels of hemopexin (Hx). *P < 0.05 compared to MS or Sham groups; # P < 0.01 compared to all groups. (B) Serum levels of haptoglobin (Hp). *P < 0.05 compared to naive group; # P < 0.05 compared to MS 12 h group. (C) Serum total and (D) free heme levels; *P < 0.05 compared to
Sham or MS. This experiments were repeated 3 times (n=5). 160x118mm (300 x 300 DPI)
Page 32 of 55
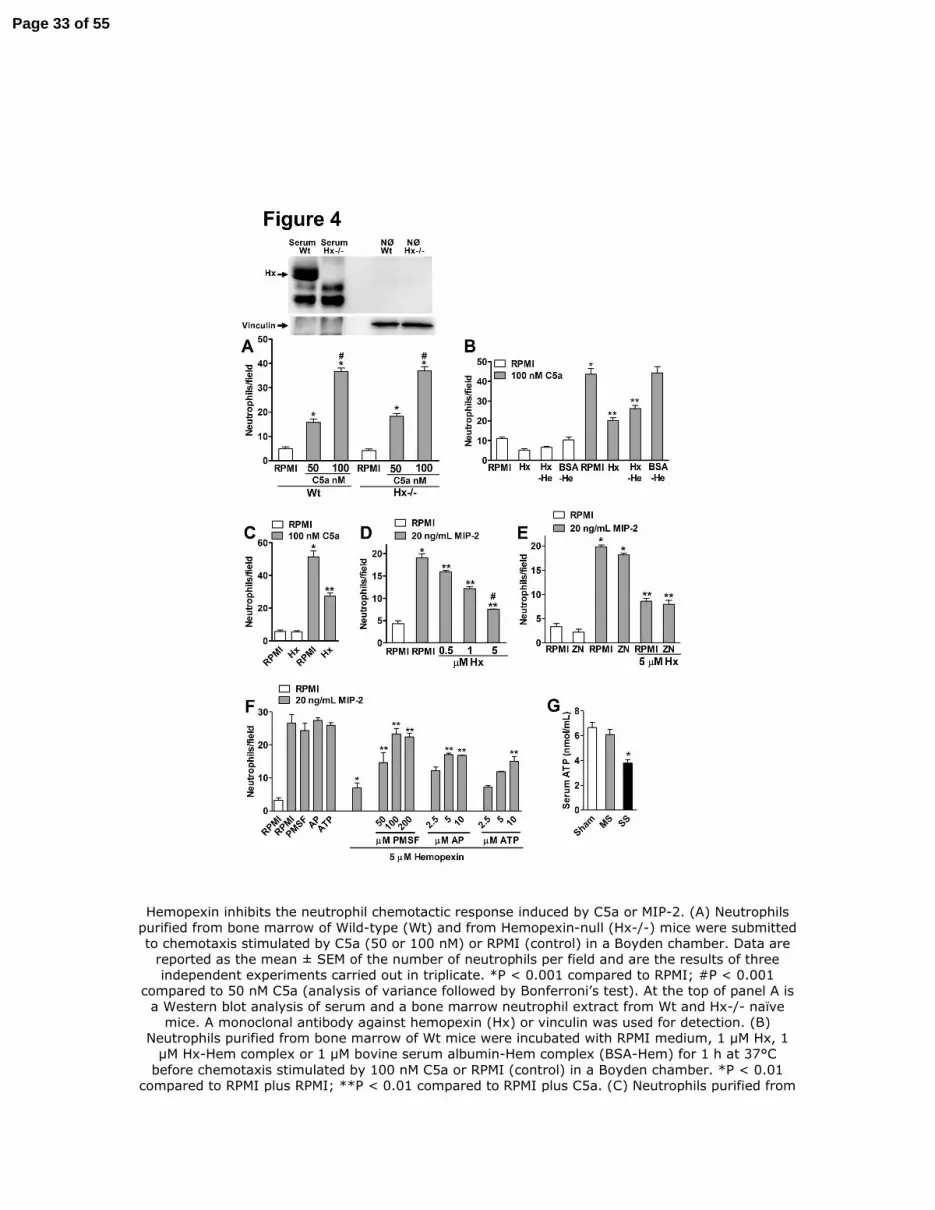
Hemopexin inhibits the neutrophil chemotactic response induced by C5a or MIP-2. (A) Neutrophils purified from bone marrow of Wild-type (Wt) and from Hemopexin-null (Hx-/-) mice were submitted to chemotaxis stimulated by C5a (50 or 100 nM) or RPMI (control) in a Boyden chamber. Data are
reported as the mean ± SEM of the number of neutrophils per field and are the results of three independent experiments carried out in triplicate. *P < 0.001 compared to RPMI; #P < 0.001
compared to 50 nM C5a (analysis of variance followed by Bonferroni’s test). At the top of panel A is a Western blot analysis of serum and a bone marrow neutrophil extract from Wt and Hx-/- naïve
mice. A monoclonal antibody against hemopexin (Hx) or vinculin was used for detection. (B) Neutrophils purified from bone marrow of Wt mice were incubated with RPMI medium, 1 µM Hx, 1
µM Hx-Hem complex or 1 µM bovine serum albumin-Hem complex (BSA-Hem) for 1 h at 37°C before chemotaxis stimulated by 100 nM C5a or RPMI (control) in a Boyden chamber. *P < 0.01
compared to RPMI plus RPMI; **P < 0.01 compared to RPMI plus C5a. (C) Neutrophils purified from
Page 33 of 55

bone marrow of hemopexin-null mice were incubated with RPMI medium or 1 µM Hx for 1 h at 37°C before chemotaxis stimulated by 100 nM C5a or RPMI (control) in a Boyden chamber. *P < 0.01 compared to RPMI plus RPMI; **P < 0.01 compared to RPMI plus C5a. (D) Hx (0.5 – 5 µM) also
inhibited the neutrophil chemotaxis stimulated by 20 ng/mL MIP-2 in a dose-dependent manner. *P < 0.01 compared to RPMI plus RPMI; **P < 0.01 compared to RPMI plus MIP-2; #P < 0.01
compared to Hx 0.5 µM plus MIP-2. (E) The inhibitor of heme oxygenase zinc deuteroporphyrin 2,4-bis glycol (ZnDPBG; ZN 30 µM) did not block the effect of Hx on neutrophil chemotaxis. *P < 0.001
compared to RPMI plus RPMI; **P < 0.01 compared to RPMI plus MIP-2. (F) Hemopexin (5 µM) were incubated (30 min, 37°C) with phenylmethylsulfonyl fluoride (PMSF, 50 – 200 µM), aprotinin (AP, 2.5 – 10 µM) or with adenosine-5’-triphosphate (ATP, 2.5 – 10 µM). These complexes were added to neutrophils for 1 h and the chemotaxis response to 100 nM C5a or RPMI (control) in a
Boyden chamber was evaluated. *P < 0.01 compared to RPMI plus MIP-2; **P < 0.01 compared to Hemopexin plus C5a. (G) Levels of ATP were measured in serum collected 2 h after mild (MS) or
severe (SS) sepsis induction or serum from Sham operated mice. 158x219mm (300 x 300 DPI)
Page 34 of 55

Figure 5. Hemopexin decreased the expression of CD62L and CXCR2 and increased CD11b expression on neutrophils. Flow cytometry of CXCR2 (A), CD62L (B) and CD11b (C) expression on
bone marrow neutrophils incubated with RPMI medium or hemopexin (Hx 1, 5 and 10 µM) for 1 h at 37°C. *P < 0.05 compared to RPMI; #P < 0.01 compared to 1 µM Hx. Data are reported as the mean ± SEM of mean fluorescence intensity (MFI) and are the result of the three independent
experiments carried out in triplicate. 80x137mm (300 x 300 DPI)
Page 35 of 55

Online Data Supplement
Inhibition of Neutrophil Migration by Hemopexin Leads to Increased
Mortality Due to Sepsis in Mice
Fernando Spiller,1 Carlotta Costa,
5 Fabrício O. Souto,
1 Francesca Vinchi,
5 Fabíola L.A.C.
Mestriner,1 Helen J. Laure,
3,4 José C. Alves-Filho,
1 Andressa Freitas,
1 José C. Rosa,
2,3,4 Sérgio H.
Ferreira,1
Fiorella Altruda,5 Emilio Hirsch,
5 Lewis J. Greene,
2,3,4 Emanuela Tolosano,
5* and
Fernando Q. Cunha1*
.
SUPPLEMENT: Table 1
Table E1 – Tryptic peptides of hemopexin isolated from the serum of septic mice and
identified by ESI-MS.
*These peptides were sequenced by CID-MS/MS and the protein was identified as
hemopexin. Molecular weight = 51341 and pI = 7.9.
m/z submitted
MH + found
∆ Da
Residues Sequence
975.73 975.55 0.18 103 111 (R) GPDSVFLIK (E)*
1017.75 1017.54 0.22 115 122 (K) VWVYPPEK (K)
1105.76 1105.56 0.20 331 341 (K) GGNNLVSGYPK (R)
1128.78 1128.52 0.26 167 174 (K) WFWDFATR (T) *
1190.81 1190.61 0.20 92 102 (K) NPITSVDAAFR (G) *
1212.86 1212.63 0.22 208 218 (R) FNPVTGEVPPR (Y) *
1505.00 1504.79 0.21 90 102 (R) WKNPITSVDAAFR (G)
1516.86 1516.69 0 .17 270 282 (R) GATYAFTGSHYWR (L)
1814.08 1813.85 0.24 385 400 (K) SGAQATWTEVSWPHEK (V)
Page 36 of 55

2
SUPPLEMENT: Figure Legends
Figure E1. Peptide mass fingerprint of PAGE bands 3 and 4. Each spectrum contains single
protonated ions obtained by ESI-MS after MaxEnt3 charge deconvolution of proteins from
native electrophoresis bands 3 (A) and 4 (B) (Figure 2B). Four of the ions were identified as
tryptic peptides of Hemopexin (Swiss-prot NP_059067) on the basis of m/z for the ion species
which differed by 0.3 mu or less from the data bank mass assignment (see Table E1). (C) SDS-
PAGE (8-25%) of the proteins diffusates of bands 3 and 4 from native electrophoresis. Standard
0.25 µg of each protein in a low molecular weight calibration kit (Standard), Band 3 and Band 4,
1 µg of each protein diffusates from native electrophoresis Band 3 and Band 4 was applied in
SDS-PAGE. (D) Western blot analysis of commercial hemopexin (Hx), Band 3 and band 4. A
monoclonal antibody against Hx was used for detection.
Figure E2. CID-MS/MS spectrum of ions selected of proteins from native electrophoresis bands
3 and 4. CID-MS/MS of ions m/z 488 [M+2H+] (Mr 974.54) (A); 565 [M+2H+] (Mr 1128.64)
(B); 596 [M+2H+] Mr 1189,60 (C); 607 [M+2H+] Mr 1211,62 (D). The amino acid sequence
deduced from these data are showed in Table E1.
Figure E3. Postreatment with hemopexin increased mortality rate after mild sepsis.
Commercial hemopexin (Hx, 150µg/mouse, i.v.) was injected 6 h after mild sepsis (MS)
induction by cecal ligation and puncture (CLP). Survival rate was evaluated up to 7 days after
surgery (n=10-12).
Figure E4. Hemopexin inhibits the neutrophil migration in mild septic hemopexin-null
mice. Commercial hemopexin (Hx 15 - 150µg/mouse, i.v.) was injected 30 min before the
induction of mild sepsis (MS) by cecal ligation and puncture (CLP) in hemopexin-null mice (Hx-
/-). Six h later, neutrophil migration to the focus of infection (A) and the levels of hemopexin in
serum (B) were determined. The levels of hemopexin were also determined 6 h after
Page 37 of 55

3
administration of this protein in naïve hemopexin-null mice (panel B). Sal = saline. ND = not
detectable.
Figure E5. Hemopexin-null (Hx-/-) mice and Wild-type (Wt) mice have similar local
inflammatory response after sepsis. IL-1β (A), TNF-α (B), IL-6 (C) and IL-10 (D) levels in
the peritoneal exudate were determined at 6 h after induction of mild (MS) or severe (SS) sepsis
induction by cecal ligation and puncture (CLP). Data are reported as mean ± SEM of pg/mL or
ng/mL (n=5) and represent three independent experiments (data was analyzed by ANOVA
followed by Bonferroni t-test). *P < 0.05 compared to MS Wt group; **P < 0.05 compared to
MS Hx-/- group.
Figure E6. Survival curve after intraperitoneal E. coli inoculation or LPS adminitration.
(A) Wild type (Wt) or hemopexin-null (Hx-/-) mice were treated with saline (Sal) or hemopexin
(Hx, 30µg/mouse, i.v.) 30 min before receiving 2 x10⁸ E. coli CFU/cavity (200µl, i.p.) and
survival was determined up to 7 days after bacterial inoculation. Data are reported as per cent
survival (n=10-12) and are representative of three independent experiments. Hx-/- E. coli + Sal
and Wt E. coli + Hx (30µg/mouse, i.v.) are significantly different from Wt E. coli + Sal (P <
0.05, Mantel-Cox log rank test). Wild type mice were pre-treated (15 min) with hemopexin (Hx,
150 µg/mouse, i.v.) or BSA (bovine serum albumin, 150 µg/mouse, i.v.) and LPS (5 mg/Kg, i.p.)
was administrated. (B) Survival rate was evaluated up to 7 days after LPS administration (n=12).
(C) Leukocyte sequestration in lung was evaluated 3 h after LPS administration (n=5). *P < 0.05
compared to BSA plus Sal (saline); #P < 0.05 compared to BSA plus LPS.
Figure E7. Liver levels of mRNA and protein of hemopexin during sepsis. Liver were
collected from naïve mice or from mice subjected to mild sepsis (MS), severe sepsis (SS) or
sham-operated (Sham) 6 h after cecum ligation and puncture (CLP) surgery. (A) Relative
Page 38 of 55

4
expression of hepatic mRNA of hemopexin. *P < 0.01 compared to naïve mice. (B) Liver levels
of hemopexin protein. *P < 0.01 compared to naïve or Sham mice. (C) Serum levels of
hemopexin were evaluated 12 h after mild sepsis (MS) induction by cecum ligation and puncture
(CLP) in wild type (Wt), TNFR1/R2 double-knockout mice (TNFR1/R2-/-) or IL-6-deficient
mice (IL-6-/-
). *P < 0.05 compared naïve mice. #P < 0.05 compared MS Wt or TNFR1/R2-/-
mice. These experiments were repeated 3 times (n=5).
Figure E8. Hemopexin inhibits the chemotaxis response of the neutrophils from Toll-like
receptor 4-deficient mice (TLR4-/-, C3H/HeJ) or MyD88-/- mice. (A) Neutrophils purified
from bone marrow of C3H/HePas (TLR4+/+), C3H/HeJ (TLR4-/-), C57/BL6 (Wt) or TLR2-/-
were incubated with media (RPMI), LPS (10 µg/ml) or Hx (1 or 5 µM) for 1 h at 37°C before
chemotaxis stimulated by MIP-2 (20 ng/mL) or RPMI (control) in Boyden chamber. Data are
reported as the mean ± SEM of neutrophils per field and are representative of three independent
experiments carried out in triplicate. *P < 0.01 compared to RPMI plus MIP-2 (analysis of
variance, followed by Bonferroni’s test).
Figure E9. Hemopexin did not induce up-regulation of annexin V or induce propidium
iodide accumulation in neutrophils. Representative dot plot of the annexin V-FITC and
propidium iodide (PI) expression in purified neutrophils from bone marrow of wild type mice.
Neutrophils were incubated 4 h with medium alone (control) or hemopexin (Hx, 5 µM or 10
µM).
Methods
Chemicals. Thioglycolate, hemin (Hem), bovine serum albumin (BSA) and May-Grunwald-
Giemsa stain were purchased from Sigma Chemical Company (St. Louis, MO, USA). Human
hemopexin (Hx, >95% by SDS-PAGE) was purchased from Athens Research & Technology,
Page 39 of 55

5
Inc. (Athens, GA, USA). Lipopolysaccharide (LPS, from Escherichia coli 0127:B8) and
lipoteichoic acid (LTA, from Staphylococcus aureus) were purchased from Difco (Detroit, MI,
USA). All other chemicals were reagent grade or equivalent.
Animals. Research was approved by the Animal Research Ethics Committee of the Faculty of
Medicine of Ribeirão Preto and University of Torino. Breeding pairs of C3H/HeJ mice were
obtained from Jackson Laboratories (Bar Harbor, ME, USA). C3H/HePas mice were obtained
from Institute Pasteur (Paris, France). TLR2-/-
and MyD88-/- mice (129-C57BL/6) were
produced as described previously (1). Hemopexin-null mice were prepared in our laboratory
(University of Turin, Italy). IL-6-/-, TNFR1/R2-/- and C57BL/6 background were obtained from
the School of Medicine of Ribeirao Preto. Male mice (18-22 g) were housed in an animal room
at 23-25oC, with free access to water and food for one day before the experiments.
Neutrophil migration. Thirty minutes after i.v. hemopexin administration, neutrophil migration
was induced by i.p. injection of 500 µl 4% w/v thioglycolate or sepsis was induced by cecal
ligation and puncture (CLP) (2). Neutrophil migration was determined 6 h after CLP or
thioglycolate administration (3). Data are reported as the mean number of neutrophils ± standard
error of the mean (SEM) per cavity (n=5).
Sepsis models. Sepsis was induced by CLP (2). A single puncture was made in the cecum using
a 21-gauge needle to induce mild sepsis (MS) or four punctures using an 18-gauge needle to
induce severe sepsis (SS). Sham-operated animals were submitted to laparotomy without cecal
puncture. Gram-negative sepsis was induced with Escherichia coli (E. coli, ATCC 25922,
Bethesda, MD) inoculation. Lyophilized bacteria were cultured in BHI medium at 37°C (4). The
bacterial suspension (2 x10⁸
CFU/200 µL per mouse) was injected i.p.
Page 40 of 55

6
Determination of lung tissue myeloperoxidase (MPO) activity. The extent of leukocyte
accumulation in the lung was measured by MPO activity (5). The animals were killed 3 h after
the induction of sepsis or LPS (5 mg/Kg) administration. Lungs were harvested, homogenized
and MPO activity was measured at 450 nm after the addition of tetramethylbenzidine and H2O2.
The results are reported as mean ± SEM of the total number of leukocyte per milligram tissue.
Bacterial count. Mice were killed 6 h after the induction of sepsis. After peritoneal lavage with
sterile PBS/1 mM EDTA and blood collection, aliquots of serial dilutions were plated onto
Müller-Hinton agar dishes (Difco Laboratories) and incubated at 37°C; CFU were counted after
12 h. The results are reported as log CFU per 10 µL.
Neutrophil isolation and chemotaxis assay. An equimolar mixture of hemin with hemopexin or
BSA was prepared (6). Bone marrow
neutrophils were isolated by Percoll
gradient (7).
Neutrophils (106 cells/mL, > 95% homogeneous as determined by May-Grunwald-Giemsa
staining and by high Gr-1 expression by flow cytometry) were treated (1.5 h, 37°C, 5% CO2)
with 1 µM hemopexin-hemin (Hx-Hem), BSA-Hem or hemopexin (0.5, 1 and 5 µM). One group
was pre-treated (30 min) with ZnDPPG (ZN, 30 µM) before hemopexin. In another set of
experiments, hemopexin (5 µM) was incubated (30 min, 37o) with phenylmethylsulfonyl fluoride
(PMSF, 50 – 200 µM), aprotinin (AP, 2.5 – 10 µM) or adenosine-5’triphosphate (ATP, 2.5 – 10
µM), then these complexes were incubated with neutrophils for 1 h at 37°C. Neutrophil
chemotaxis assay (97% viable cells by Trypan blue exclusion) was then performed using a 48-
well modified Boyden chamber (Neuro Probe Inc., Bethesda, MD, USA). Neutrophils were
allowed to migrate in response to RPMI (random migration) or to the chemotactic stimuli MIP-2
(20 ng/mL) or C5a (50 or 100 nM). Data are reported as mean ± SEM number of neutrophils per
field.
Page 41 of 55

7
Cytokine measurements. Cytokine levels were determined using Luminex
multianalyte
technology. The BioPlex system was used in combination with multiplex cytokine kits (Bio-Rad,
Hercules, CA, USA).
Western blotting. Thirty µg of serum protein or total protein from neutrophil extracts were
separated by 10% SDS-PAGE and analyzed by Western blotting using primary antibodies
against hemopexin (mAb 3D6/E12 produced in our laboratory, University of Torino, Italy) or
vinculin (Sigma-Aldrich). In addition, 1 µg each of Band 3, Band 4, and commercial human
hemopexin was separated on a precast 8-25% PhastGel with PhastGel SDS buffer strips and
transferred to a nitrocellulose filter (Amersham Pharmacia Biotech). The blot was then probed
with a mouse antiserum against hemopexin.
Real-time PCR. RNA was extracted from liver with the MIDI-RNA extraction kit (Qiagen).
Probes for hemopexin and GAPDH were purchased from Applied Biosystems and the
quantitative real-time PCR (qRT-PCR) analysis was performed (8).
Flow cytometry analysis. Mouse bone marrow neutrophils (106
cells) isolated on a Percoll
density gradient (9) were incubated for 1 h (37°C, 5% CO2) with hemopexin (1, 5 and 10 µM),
and stained with R-PE-conjugated rat anti-mouse CD62L (L-selectin) monoclonal antibody (BD
Bioscience), FITC-conjugated rat anti-mouse CD11b monoclonal antibody (BD Bioscience), R-
PE anti–CXCR2 antibody (Santa Cruz Biotechnology) or appropriate isotype controls. In another
set of experiments, the bone marrow neutrophils were incubated with hemopexin (5 and 10 µM)
for 4 h (37°C, 5% CO2) and the cells were stained for annexin V and propidium iodide (PI) by an
apoptosis detection kit (Bender MedSystems). The cells were then analyzed by flow cytometry
(FACSort; Becton Dickinson).
Page 42 of 55

8
Protein determination. Amino acid composition and total protein were determined by amino
acid analysis using the PTC method (10). The protein content of serum, HPLC and
electrophoresis fractions as well as hemopexin was determined after hydrolysis in 6 N HCl at
1200C for 22 h.
Blue-Sepharose chromatography. A pool of 30 ml serum from severe septic mice was
chromatographed on a Blue-Sepharose 6 Fast Flow column to remove most of the albumin (11).
The material that was not absorbed was combined and denoted Fraction B-. The column was
then washed to strip albumin and other proteins from the resin. This effluent was denoted
Fraction B+.
HPLC. Fraction B- which contained most of the migration inhibitory activity was submitted to
HPLC on a Vydac C18 column (218TP510, Grace Vydac, Hesperia, CA, USA) using a Shimadzu
Li Chromatography System (Tokyo, Japan). The solvents were A (0.1% trifluoroacetic acid,
TFA) and B (80% acetonitrile containing 0.09% TFA). The column was equilibrated with 80 mL
35 % B. A 200 µl sample was applied to the column and a gradient of 1% B/minute was applied
immediately after sample injection. The flow rate was 4.0 ml/min. Effluent absorbance was
monitored at 220 and 280 nm and effluent was combined on the basis of absorbance.
Native electrophoresis. The HPLC effluent containing neutrophil migration inhibitory activity,
F1 (Figure 2), was submitted to non-SDS polyacrylamide gel electrophoresis (PAGE). Eight µg
of protein of the sample per lane was applied and the protein was localized by Coomassie blue
and eluted by diffusion (12).
Mass spectrometry. Proteins purified by PAGE and a commercial hemopexin sample were heat
denatured and hydrolyzed with Promega modified trypsin (13). The mass fingerprint of the
tryptic peptides was obtained with an electrospray triple-quadrupole mass spectrometer, Quattro
Page 43 of 55
9
II (Micromass, Manchester, UK). Peptide sequences were obtained by collision-induced
dissociation tandem mass spectrometry (CID-MS/MS). All reported spectra are the average of
13-18 scans (2 to 5 sec/scan) and were processed using the Mass Lynx software v.3.3
(Micromass). The amino acid sequences of 4 tryptic peptides indicated by * in Table E1 were
deduced from the series of b and y fragment ions produced by CID. The masses of tryptic
peptides and fragment ions from CID were used to search the Genebank at NCBI using the
Protein Prospector MS-Fit and MS-Tag software (http://prospector.ucsf.edu/).
Analysis of serum ATP levels
The denaturation of sample proteins was performed using 0.6 mol/L perchloric acid. All samples
were then centrifuged (14000 ×g for 10 min) and the supernatants were neutralized with 4.0 N
KOH and clarified with a second centrifugation (14000 ×g for 15 min). Aliquots of 20 µL were
applied to a reverse-phase HPLC system using a 15 cm C18 Shimadzu column (Shimadzu, Japan)
at 260 nm with a mobile phase containing 60 mM KH2PO4, 5.0 mM tetrabutylammonium
chloride, pH 6.0 (buffer A), in 20% methanol (buffer B, 0 to 100% of buffer B in 25 min)
according to a method previously described (14). The peak of ATP were identified by their
retention times and quantified by comparison with standards. The results are expressed by nmol
of ATP per mL of serum.
Quantification of heme levels
Whole blood was collected by cardiac puncture into heparinized tubes and centrifuged (15
minutes, 4°C, 500 g) to obtain the supernatant. The plasma was centrifuged again (10 min, 4°C,
500 g) to remove contaminating red blood cells and passed it through a Centricon YM-3 column
(Millipore) (2 h at 4°C, 3760 g) to remove proteins with MW>3 kDa. Heme and protein-free
heme were quantified using a chromogenic assay according to the manufacturer’s instructions
(QuantiChrom heme assay kit, Bioassay Systems). Heme levels were determined 2, 6 and 12 h
Page 44 of 55

10
after sepsis induction. The absorbance was read at 400 nm. The results are expressed in µM of
heme.
Quantification of hemopexin levels
Hemopexin quantification was performed by ELISA using commercially available kits according
to the respective manufactures specifications (GenWay Biotech).
Statistical analysis. Data are reported as mean ± SEM (except for survival curves) and are
representative of two or three independent experiments with 5 mice in each group. Differences
between two unpaired groups were compared by the Student t test. The mean differences
between three or more groups within an experiment were compared by ANOVA. When
significant differences were identified, individual comparisons were subsequently tested with
Bonferroni’s t-test. Statistical significance was set at P < 0.05. Survival rates (n=10-12) were
expressed as percentages, and a log-rank test (chi-square test) was used to examine differences
between survival curves.
REFERENCES
E1. Takeuchi O, Hoshino K, Akira S. Cutting edge: Tlr2-deficient and myd88-deficient mice
are highly susceptible to staphylococcus aureus infection. J Immunol 2000;165:5392-5396.
E2. Wichterman KA, Baue AE, Chaudry IH. Sepsis and septic shock--a review of laboratory
models and a proposal. J Surg Res 1980;29:189-201.
E3. Benjamim CF, Silva JS, Fortes ZB, Oliveira MA, Ferreira SH, Cunha FQ. Inhibition of
leukocyte rolling by nitric oxide during sepsis leads to reduced migration of active microbicidal
neutrophils. Infect Immun 2002;70:3602-3610.
E4. Alves-Filho JC, de Freitas A, Russo M, Cunha FQ. Toll-like receptor 4 signaling leads to
neutrophil migration impairment in polymicrobial sepsis. Crit Care Med 2006;34:461-470.
E5. Torres-Duenas D, Celes MR, Freitas A, Alves-Filho JC, Spiller F, Dal-Secco D, Dalto
VF, Rossi MA, Ferreira SH, Cunha FQ. Peroxynitrite mediates the failure of neutrophil
migration in severe polymicrobial sepsis in mice. Br J Pharmacol 2007.
E6. Hvidberg V, Maniecki MB, Jacobsen C, Hojrup P, Moller HJ, Moestrup SK.
Identification of the receptor scavenging hemopexin-heme complexes. Blood 2005;106:2572-
2579.
E7. Alves-Filho JC, Freitas A, Souto FO, Spiller F, Paula-Neto H, Silva JS, Gazzinelli RT,
Teixeira MM, Ferreira SH, Cunha FQ. Regulation of chemokine receptor by toll-like receptor 2
Page 45 of 55

11
is critical to neutrophil migration and resistance to polymicrobial sepsis. Proc Natl Acad Sci U S
A 2009;106:4018-4023.
E8. Fagoonee S, Di Cunto F, Vozzi D, Volinia S, Pellegrino M, Gasparini P, Silengo L,
Altruda F, Tolosano E. Microarray and large-scale in silico--based identification of genes
functionally related to haptoglobin and/or hemopexin. DNA Cell Biol 2006;25:323-330.
E9. Tanaka S, Deai K, Konomi A, Takahashi K, Yamane H, Sugimoto Y, Ichikawa A.
Expression of l-histidine decarboxylase in granules of elicited mouse polymorphonuclear
leukocytes. Eur J Immunol 2004;34:1472-1482.
E10. Bidlingmeyer BA, Cohen SA, Tarvin TL. Rapid analysis of amino acids using pre-
column derivatization. J Chromatogr 1984;336:93-104.
E11. Travis J, Bowen J, Tewksbury D, Johnson D, Pannell R. Isolation of albumin from whole
human plasma and fractionation of albumin-depleted plasma. Biochem J 1976;157:301-306.
E12. Castellanos-Serra LR, Fernandez-Patron C, Hardy E, Huerta V. A procedure for protein
elution from reverse-stained polyarcylamide gels applicable at the low picomole level: An
alternative route to the preparation of low abundance proteins for microanalysis. Electrophoresis
1996;17:1564-1572.
E13. Mestriner FL, Spiller F, Laure HJ, Souto FO, Tavares-Murta BM, Rosa JC, Basile-Filho
A, Ferreira SH, Greene LJ, Cunha FQ. Acute-phase protein alpha-1-acid glycoprotein mediates
neutrophil migration failure in sepsis by a nitric oxide-dependent mechanism. Proc Natl Acad Sci
U S A 2007;104:19595-19600.
E14. Fürstenau CR, Trentin D da S, Gossenheimer AN, Ramos DB, Casali EA, Barreto-Chaves
ML, Sarkis JJ. Ectonucleotidase activities are altered in serum and platelets of L-NAME treated
rats. Blood Cells Mol Dis 2008; 41:223-229.
Page 46 of 55
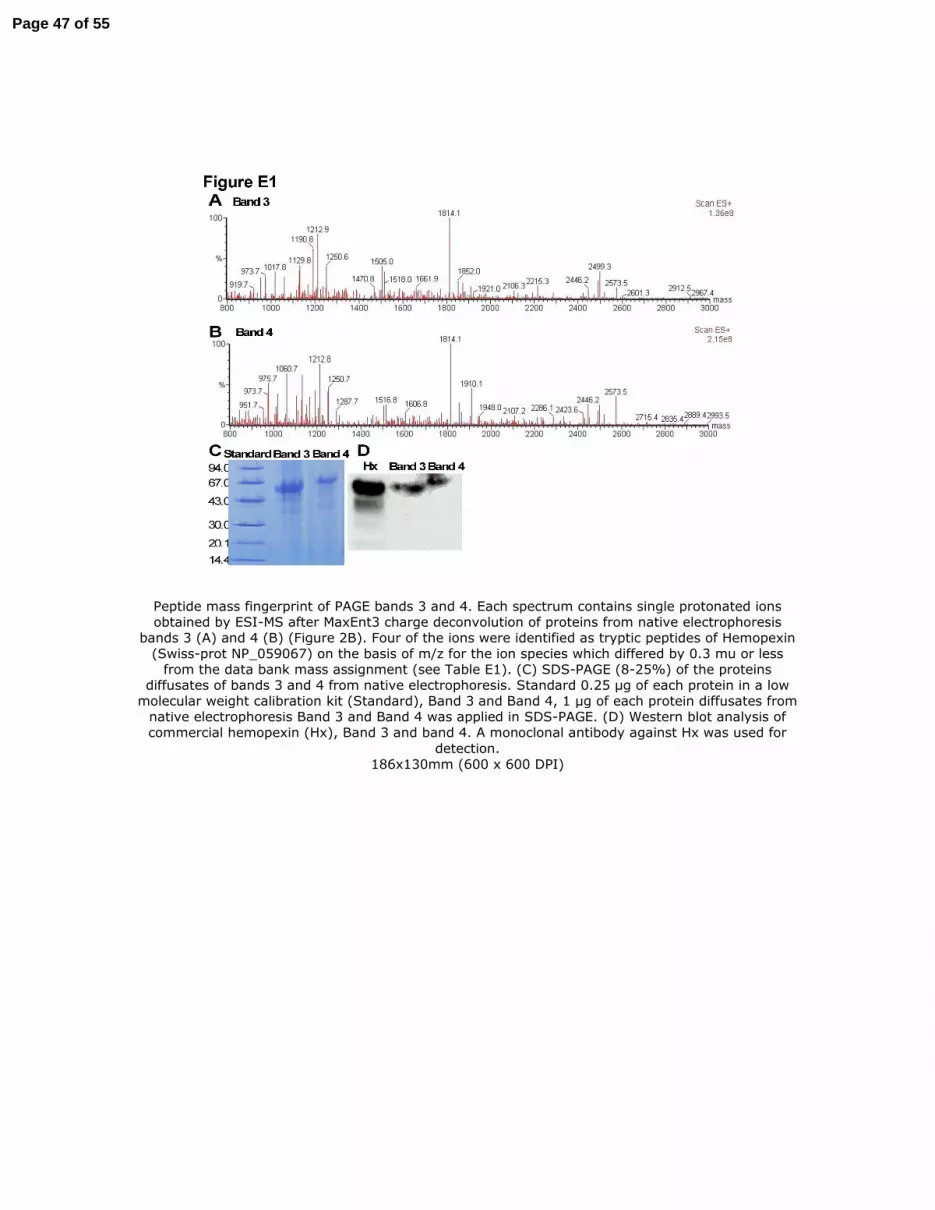
Peptide mass fingerprint of PAGE bands 3 and 4. Each spectrum contains single protonated ions obtained by ESI-MS after MaxEnt3 charge deconvolution of proteins from native electrophoresis
bands 3 (A) and 4 (B) (Figure 2B). Four of the ions were identified as tryptic peptides of Hemopexin (Swiss-prot NP_059067) on the basis of m/z for the ion species which differed by 0.3 mu or less
from the data bank mass assignment (see Table E1). (C) SDS-PAGE (8-25%) of the proteins diffusates of bands 3 and 4 from native electrophoresis. Standard 0.25 µg of each protein in a low
molecular weight calibration kit (Standard), Band 3 and Band 4, 1 µg of each protein diffusates from native electrophoresis Band 3 and Band 4 was applied in SDS-PAGE. (D) Western blot analysis of commercial hemopexin (Hx), Band 3 and band 4. A monoclonal antibody against Hx was used for
detection. 186x130mm (600 x 600 DPI)
Page 47 of 55
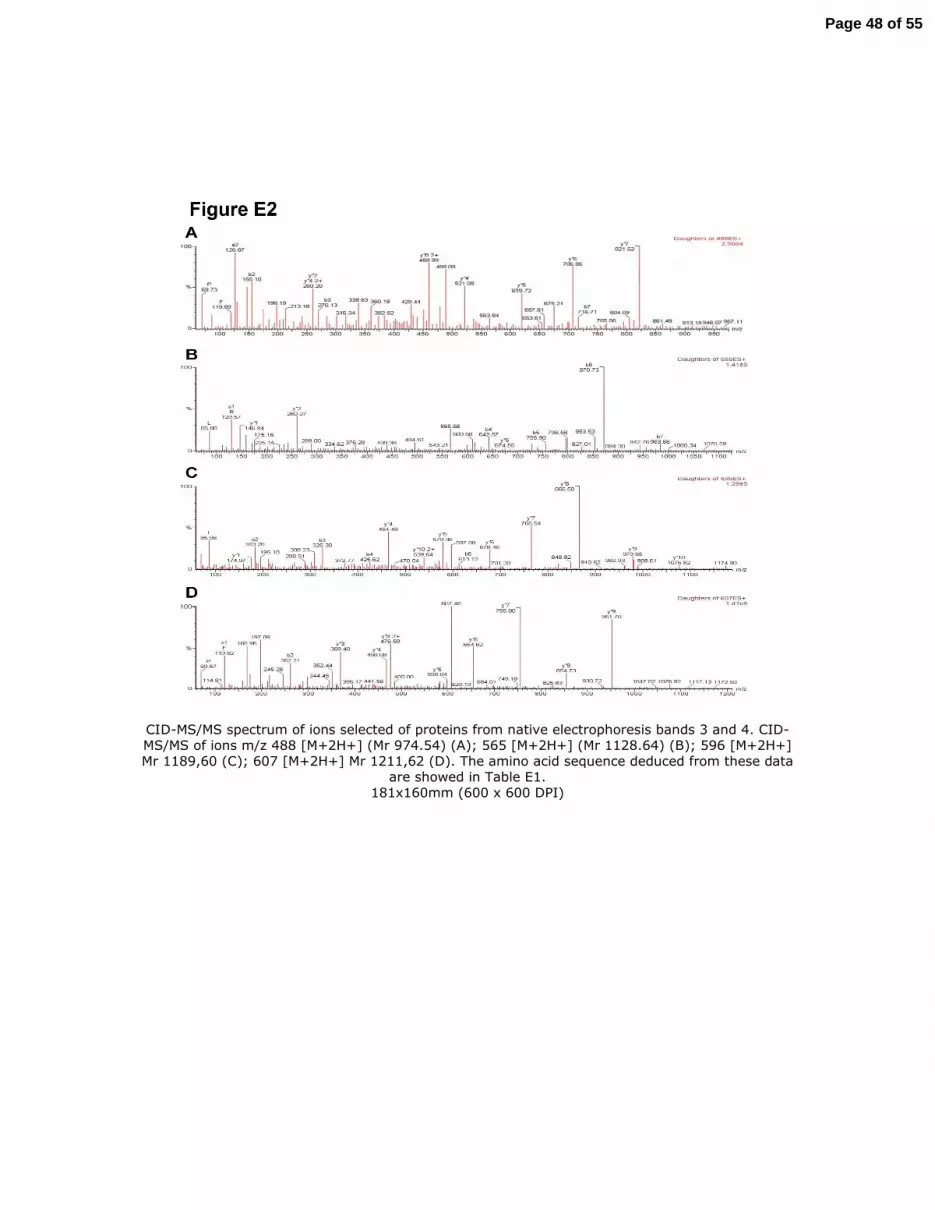
CID-MS/MS spectrum of ions selected of proteins from native electrophoresis bands 3 and 4. CID-MS/MS of ions m/z 488 [M+2H+] (Mr 974.54) (A); 565 [M+2H+] (Mr 1128.64) (B); 596 [M+2H+] Mr 1189,60 (C); 607 [M+2H+] Mr 1211,62 (D). The amino acid sequence deduced from these data
are showed in Table E1. 181x160mm (600 x 600 DPI)
Page 48 of 55

Postreatment with hemopexin increased mortality rate after mild sepsis. Commercial hemopexin (Hx, 150µg/mouse, i.v.) was injected 6 h after mild sepsis (MS) induction by cecal ligation and
puncture (CLP). Survival rate was evaluated up to 7 days after surgery (n=10-12). 78x65mm (300 x 300 DPI)
Page 49 of 55

Hemopexin inhibits the neutrophil migration in mild septic hemopexin-null mice. Commercial hemopexin (Hx 15 - 150µg/mouse, i.v.) was injected 30 min before the induction of mild sepsis (MS) by cecal ligation and puncture (CLP) in hemopexin-null mice (Hx-/-). Six h later, neutrophil
migration to the focus of infection (A) and the levels of hemopexin in serum (B) were determined. The levels of hemopexin were also determined 6 h after administration of this protein in naïve
hemopexin-null mice (panel B). Sal = saline. ND = not detectable. 79x48mm (300 x 300 DPI)
Page 50 of 55

Hemopexin-null (Hx-/-) mice and Wild-type (Wt) mice have similar local inflammatory response after sepsis. IL-1β (A), TNF-α (B), IL-6 (C) and IL-10 (D) levels in the peritoneal exudate were
determined at 6 h after induction of mild (MS) or severe (SS) sepsis induction by cecal ligation and puncture (CLP). Data are reported as mean ± SEM of pg/mL or ng/mL (n=5) and represent three independent experiments (data was analyzed by ANOVA followed by Bonferroni t-test). *P < 0.05
compared to MS Wt group; **P < 0.05 compared to MS Hx-/- group. 179x144mm (300 x 300 DPI)
Page 51 of 55

Survival curve after intraperitoneal E. coli inoculation or LPS adminitration. (A) Wild type (Wt) or hemopexin-null (Hx-/-) mice were treated with saline (Sal) or hemopexin (Hx, 30µg/mouse, i.v.) 30
min before receiving 2 x10⁸ E. coli CFU/cavity (200µl, i.p.) and survival was determined up to 7
days after bacterial inoculation. Data are reported as per cent survival (n=10-12) and are representative of three independent experiments. Hx-/- E. coli + Sal and Wt E. coli + Hx
(30mg/mouse, i.v.) are significantly different from Wt E. coli + Sal (P < 0.05, Mantel-Cox log rank test). Wild type mice were pre-treated (15 min) with hemopexin (Hx, 150 µg/mouse, i.v.) or BSA
(bovine serum albumin, 150 µg/mouse, i.v.) and LPS (5 mg/Kg, i.p.) was administrated. (B) Survival rate was evaluated up to 7 days after LPS administration (n=12). (C) Leukocyte
sequestration in lung was evaluated 3 h after LPS administration (n=5). *P < 0.05 compared to BSA plus Sal (saline); #P < 0.05 compared to BSA plus LPS.
129x146mm (300 x 300 DPI)
Page 52 of 55

Liver levels of mRNA and protein of hemopexin during sepsis. Liver were collected from naïve mice or from mice subjected to mild sepsis (MS), severe sepsis (SS) or sham-operated (Sham) 6 h after cecum ligation and puncture (CLP) surgery. (A) Relative expression of hepatic mRNA of hemopexin. *P < 0.01 compared to naïve mice. (B) Liver levels of hemopexin protein. *P < 0.01 compared to naïve or Sham mice. (C) Serum levels of hemopexin were evaluated 12 h after mild sepsis (MS)
induction by cecum ligation and puncture (CLP) in wild type (Wt), TNFR1/R2 double-knockout mice (TNFR1/R2-/-) or IL-6-deficient mice (IL-6-/-). *P < 0.05 compared naïve mice. #P < 0.05
compared MS Wt or TNFR1/R2-/- mice. These experiments were repeated 3 times (n=5). 129x140mm (300 x 300 DPI)
Page 53 of 55

Hemopexin inhibits the chemotaxis response of the neutrophils from Toll-like receptor 4-deficient mice (TLR4-/-, C3H/HeJ) or MyD88-/- mice. (A) Neutrophils purified from bone marrow of
C3H/HePas (TLR4+/+), C3H/HeJ (TLR4-/-), C57/BL6 (Wt) or TLR2-/- were incubated with media
(RPMI), LPS (10 µg/ml) or Hx (1 or 5 µM) for 1 h at 37°C before chemotaxis stimulated by MIP-2 (20 ng/mL) or RPMI (control) in Boyden chamber. Data are reported as the mean ± SEM of neutrophils per field and are representative of three independent experiments carried out in
triplicate. *P < 0.01 compared to RPMI plus MIP-2 (analysis of variance, followed by Bonferroni’s test).
129x71mm (300 x 300 DPI)
Page 54 of 55

Hemopexin did not induce up-regulation of annexin V or induce propidium iodide accumulation in neutrophils. Representative dot plot of the annexin V-FITC and propidium iodide (PI) expression in
purified neutrophils from bone marrow of wild type mice. Neutrophils were incubated 4 h with medium alone (control) or hemopexin (Hx, 5 µM or 10 µM).
129x56mm (300 x 300 DPI)
Page 55 of 55


