Embed Size (px)
Citation preview


Towards a New Architecture of Knowledge: Big Data, Culture
and Creativity

Distribution IFKAD Institute of Knowledge Asset Management (IKAM) Arts for Business Ltd University of Basilicata Dresden University of Technology ISBN 978-88-96687-09-3 Edited by JC Spender, Giovanni Schiuma, Joerg Rainer Noennig Design & Realization by Gabriela Jaroš

1786
Innovation and Digital Marketing in Guadalajara, Mexico
Juan Mejía-Trejo*
Business at Universidad de Guadalajara
University Address: Periférico Norte 799 “G-306”, Los Belenes,
Zapopan, Jalisco, Mexico. C.P. 45100.
Gonzalo Maldonado Guzmán At Universidad de Autónoma de Aguascalientes Av.
Universidad # 940, Ciudad Universitaria, C.P.
20131,Aguascalientes, Ags. México.
José Sánchez-Gutiérrez
Business at University of Guadalajara
University Address: Periférico Norte 799 “G-306”, Los Belenes,
Zapopan, Jalisco, Mexico. C.P. 45100.
* Corresponding author
Structured Abstract
Purpose. The Innovation (INNOV) process is considered as a driver to increase the competitiveness in the Digital Marketing (DM) sector; however, many firms ignore how
their own DM resources and capabilities affect the INNOV process. So, through a DM-
INNOV proposed conceptual model, the aim of this study is to determine which are the
main factors of INNOV are affected from DM, in Guadalajara, México.
Design/methodology/approach. The design is based on INNOV process model,
construct published previously by Mejía-Trejo et al. (2014) and complemented with the
DM model construct proposed here, with variables which are tested for validity and
reliability through a pilot survey in order to get the final model. The study subjects were
the most important customers of Monster Online (a mexican company, specialized in
DM) and analysed by inferential statistics determining the Cronbach´s Alpha reliability in a pilot test and multiple linear regression (MLR) based on Stepwise Method using SPSS
20 program. The methodology is proposed as a descriptive, exploratory, correlational
and a transversal study, based on documentary research to obtain a final questionnaire
using the Likert scale applied to the total population: 900 Monster’s Online relevant CEO
clients. So, we proposed:
2) For DM: Web integration (WBI); Web Experience (WBE); Web Strategy
(WBS) and Technological Resources (TRS) 3) For INNOV process by Mejía-Trejo’s et al. (2014) conceptual model with:
Innovation Value Added (IVADD); Innovation Income Items (IIIT); Innovation
Process (INPROC); Innovation Performance (IPERF); Innovation Feedback
Items (IFEED); Innovation Outcome Items or Results of Innovation (IOIT).
1787
The approach is based on the importance to relate the DM on INNOV process to
determine their main factors that are affected and generate more innovation in the DM
sector
Originality/Value. This article is aimed to determine the main factors that drive the DM
on INNOV process to get more, about this, by mean of original theoretical models as a
product of the principal related theories about DM and INNOV process. The Value of the study, is to obtain a first settlement for a generalized model able to be applied in other
sectors in Mexico.
Practical implications. The results obtained, will allow us measuring the level of
correlation amongst the variables in study, and discover how the main factors of INNOV
process are influenced for DM components.
Keywords – Digital Marketing, Innovation, Innovation in Marketing
Paper type – Academic Research Paper
1. Introduction
Internet is the cornerstone for the currently marketers . (Chaffey,Ellis-Chadwick,
2014; Wierenga, B., 2008) due they have implemented new tools based on INNOV
process (OCDE,2005) creating several competitive advantages (Porter, 2001). Hence,
marketers are forced to figure out new ways about how to detect new needs and how the
consumers, find the products and services in real time (Forrester, 2009). This article aims
to find the determinants that drive the innovations (INNOV) due the digital marketing
(DM) by mean of a theoretical model, checked empirically to make an assessment of each
one of their components. The structure of this study begins with the INNOV model
construct published previously by Mejía-Trejo et al. (2014) complemented with the DM
model construct proposed here, with variables which are tested for validity and reliability
through a pilot survey in order to get the final model. We selected the 900 most important
CEOs customers of Monster Online (a mexican company, specialized in DM) and
analysed by inferential statistics to conclude a description of the final results highlighting
those indicators that are opportunities for improvement in the INNOV by DM.
2. Problem, Hypotheses and Rationale of the Study
The problem is proposed in a General Question (GQ): which are the components of
INNOV that drives DM? The rationale of the study is due the interest of marketing
companies like Monster Online to identify the determinants of INNOV produced by DM.

1788
The Specific Questions (SQ): SQ1.-Which are the variables and indicators of the general
conceptual model?; SQ2.-Which are the relationships of these variables?; SQ3.-Which
are the most relevant variables of the model?. Hypothesis (H): About the currently
importance, by the firms like Monster Online about the INNOV, it is presented in less
than 50% of the variability in its DM results..
3. Literature Review
We made it in two parts. First, around the definition of DM as a tool that helps to the
marketers, to characterize the profile, the behavior and satisfaction of the customers using
Internet (Chaffey, Ellis-Chadwick, 2014). This is complemented with the concept of
Marketing Innovation (OCDE, 2005) paragraph 171 where is distinguishing features
compared to other changes in a Firm’s marketing instruments in the implementation of a
marketing method not previously used by the firm. It must be part of a new marketing
concept or strategy that represents a significant departure from the firm’s existing
marketing methods. The new marketing method can either be developed by the
innovating firm or adopted from other firms or organizations. These methods can be
implemented for both new and existing products. In this sense, we recognize the
importance of the Technological Resources (TRS) defined as technological issues and
services to be offered in the administration of e–commerce, with direct impact in the
internet growth in the world (Chaffey,Ellis-Chadwick, 2014). The proposed indicators are
gathering in Technology (TEC) based on concepts such as: Management Programs
(Wells et al. 2011; Villamizar et al., 2012); Payment Systems & Security (Busch et
al.,2013) and Architecture & Hosting (Iantrmsky, 2012). Web Integration (WBI) will be
understood as the synergistic process that is necessary to achieve the objectives of the
organization. This synergy can be developed between physical and virtual organization
(Chaffey,Ellis-Chadwick, 2014).The indicators are: Conventional Strategies & Activities
of Marketing (Kotler, 2009; Lamb, et al. 2006; Brondmon, 2002) which are carried by
employees of the company to the customer and grouped in Integration Front Office Front
Office Integration. (FOI.); Sinergy in Operations (Birogul et al. 2011), which are carried
by company employees into the company and are grouped in Back Office Integration
(BOI); Commercial Partners (Min, et al., 2008) and Logistics (Lee,2012) placed in Others
in Integration (OIN). Web Experience (WBE) here the firm’s website is the primary
source of customer experience and therefore the most important element of

1789
communication in DM, as it is the primary source of interaction and transaction with the
consumer web (Chaffey,Ellis-Chadwick, 2014). The indicators are: Domain (Cuesta,
2010); Interface (Zhenhai, 2012); Design and Aesthetic (Cuesta, 2010) gathered in Site
(SIT); easy to use (Constantinides, 2002), identifying the Usability (USA); Comments
(Zhenhai, 2012) belonging to the Social Influence (SIN); and finally, the Number of
Visits (Cohan,2000) grouped in Acknowledgment (ACK).Web Strategy (WBS) has
important consequences for the site's identity, position, atmosphere, etc. to differentiate
the site and create a website with a unique proposition that appeals to the target market ,
offer customer value strengthen competitive advantage (Chaffey,Ellis-Chadwick, 2014).
The indicators are: the Competitors (Juárez, 2012; Lytras,et al.,.2009; Osterwalder &
Pigneur, 2010; Porter, 2001); the Potential Market and the Marketing trends
(Fernández,2010; Anwar et al.,2013) belonging to Market Analysis (MAN); Behavior
(García & Díaz, 2010) , Customer Needs (Hendrix, 2014) grouped in Potential Customers
(PCU); Human Resources, Values, Mission, Visión (Daft, 2007;), grouped in Internal
Analysis (IAN); Finally, the indicator Web Activity Rol (WAR) (Treesinthuros, 2012).
As a second part of the model construct, we have the INNOV process as a matter of study
divided in several stages proposed based on Mejía-Trejo (et al., 2014) as: Innovation
Value Added (IVADD); Innovation Income Items (IIIT); Innovation Process (INPROC);
Innovation Performance (IPERF); Innovation Feedback Items (IFEED); Innovation
Outcome Items or Results of Innovation (IOIT). Hence, according all mentioned above,
we proposed the General Conceptual Model. See Scheme 1.
Scheme 1. General Conceptual Model- Source: Own by Authors adaptation
INNOV
SIT PCU USA
IAN WBS WBE SIN
ACK WBI
FOI INPRO TEC
BOI IIIT IFEED
OIN
IVADD IOIT
DM as Dependent Variable
DM
INNOV as Independent Variable

1790
4. Analysis of Results
Table 1.-Final Questionnaire
DIGITAL MARKETING (DM)
VAR IND Question (by the approach: The Firm) Author(s)
(1)WBS
(1)MAN
1.-At the start of a new project, makes a recognition of
their potential competitors.
Juárez (2012);
Lytraset al.,(2009);
Osterwalder &
Pigneur, (2010);
Porter (2001)
2.-Constantly analyzing their environment, seeking to identify potential competitors, both physical and
virtual.
3.-Knows and uses its competitive advantage.
4.-Knows competitive advantages of its natural
competitors.
5.- Knows competitive advantages of its competitors
on the net.
6.- At the start of a new project, estimates the number
of potential customers.
Fernández (2010);
Anwar et al.(2013) 7.-Seeks to be at the forefront of market trends.
(2)PCU
8.- At the start of a new project. estimates the customer
profile.
García & Díaz,
(2010);
9.- Knows and satisfies the customer needs according
their requirements Hendrix (2014)
(3)IAN
10.-Makes a thorough analysis before hiring a new
element to the team.
Daft (2007);
11.-Takes into account the capabilities and skills of
team members to assign a work.
12.- Knows and apply the values of the organization.
13.- Has a clear mission and helps carry it out every
day.
14.- Has a clear vision and helps carry it out every day.
(4)WAR
15.-Takes the role about their product and services as
information
Treesinthuros, (2012)
16.- Takes the role about their product and services as
about what and how products and services are.
17.- Takes the role about their product and services as media communication
18.- Takes the role about their product and services as
promotion
19.- Takes the role about their product and services are
a combination of all mentioned above.
(2)WBI
(5)FOI 20.- Seeks synergy in the conventional marketing activities
Kotler (2009); Lamb et al.(2006);
Brondmon(2002);
Wierenga, B.. (2008).
21.- The employees, whose are responsible for
receiving payments, schedule visits and survey in the
field, also are in charge of these activities on the web .
(6)BOI 22.- Activities such as receiving payments, schedule
visits and survey in the field, are able to be replicated
in an online environment .
Birogul et al., (2011);
23.- The level of service offered in physical
environment, is the same that is offered by using a web
service.
(7)OIN
24.- Involves Outsourcing in their activities. Min et al.(2008)
25.- Provides toosl to the Outsourcing to join it in the
web activities. (Such as logistics, payment,
promotions, etc).
Lee (2012):
26.- The website of the company makes: promotion, Cuesta (2010)

1791
(3)WB
E
(8)SIT
price, sales catalogs, distribution points , etc. 27.- The website serves as a platform for
communication , interaction and transaction with the
web customer.
Zhenhai, (2012);
Malik & Huet, (2011)
28.- The website shows a nice design that invites you
to discover all that it contains
Cuesta (2010)
(9)USA 29.- The website is designed with multiple interfaces
criteria and is easy to use.
Constantinides,
(2002)
(10)SIN
30.- The website is a sitie easy to make comments or
questions.
31.- The website uses the comments as a posibe
success predictor, of products or servicies
(11)ACK 32.- Uses a strategy on how long the customer will be
in the network and what they share in this .
Cohan, P. (2000); Lehman. &
Vajpayee, (2011)
(4)TRS
(12)TEC
33.-Uses specialized software to do all their core
activities Wells et al., (2011);
Villamizar et
al.(2012): 34.- Uses specialized platforms to manage different
resources (such as Oracle , SAP , Lotus )
35.- Considers the security of stored data as a priority. Busch et al.,(2013)
36.- The organizational architecture is considered as a
priority Iantrmsky(2012);
Ojala,. & Tyrvainen,
(2011): 37.- Technological resources are considered as a
priority
INNOVATION (INNOV) (Please see Mejia-Trejo’s et al. ,2014 for references and
authors )
VAR IND Question Author
(5)IVA
DD
(13)VAEDC 38.-The innovation increases the Emotions & Desire of the Customer
Chaudhuri (2006)
(14)
VACR
39.-The Cost is the main constraint to increase the
value
Bonel (et al.,2003)
40.-The Risk is the main constraint to increase the
value
(15)VACUS 41.-The innovation increases the Customer value
(16)VASHO 42.-The Innovation increases the Shareholder value
(17)VAFR
M 43.-The innovation increases the value of the Firm
(18)VASEC 44.-The innovation increases the value of the Sector
(19)VASOC 45.-The innovation increases the value to the Society
(20)VAPVR 46.-The innovation considers the relation price-value
added
Gale & Chapman
(1994)
(6)IIIT
(21)EIPH 47.-Opportunity Identification
Kausch (et al. 2014)
48.-Opportunity Analysis
49.-Idea Generation
50.-Idea Selection
51.-Concept Definition
(22)FFI 52.-Use of sophisticated equipment to support
innovation Shipp (et al. 2008);
McKinsey (2008)
53.-Invests in R&D+I
54.- Staff to R& D+I
(23)EFFI
55.-Makes efforts to use and / or generate Patents
Canibano (1999);
Shipp (et al. 2008);
Lev (2001); Howells
(2000)
56.-Makes efforts to create and / or improve Databases
57.-Makes efforts to improve the organizational
processes
58.-Makes efforts to use the most of knowledge and
1792
skills of staff 59.- Decisions planning increases its availability to
the risk
60.-Makes efforts to discover New Market Knowledge Popadiuk & Wei-
Choo (2006) 61.-Makes efforts to study the Existing Market
Knowledge
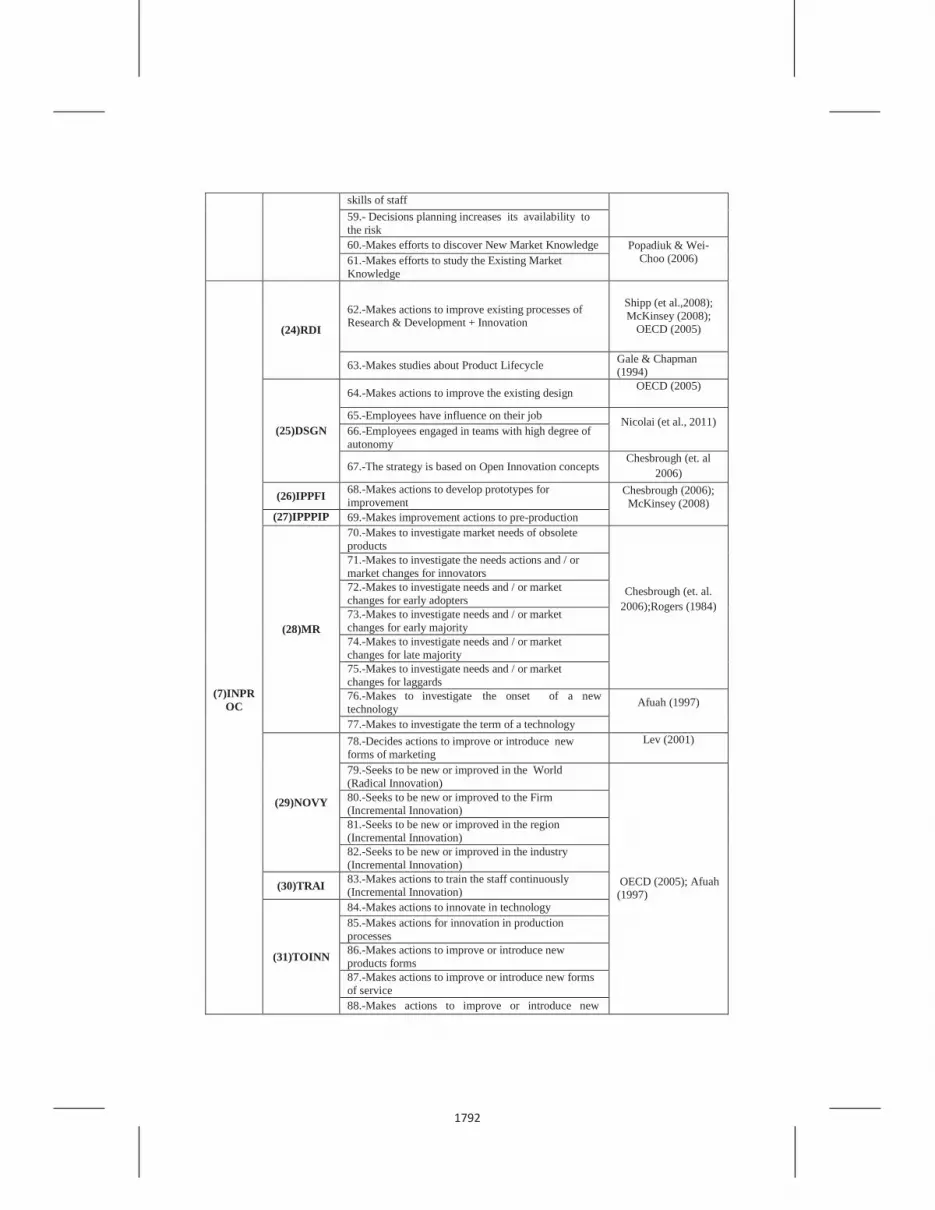
(7)INPR
OC
(24)RDI
62.-Makes actions to improve existing processes of Research & Development + Innovation
Shipp (et al.,2008);
McKinsey (2008);
OECD (2005)
63.-Makes studies about Product Lifecycle Gale & Chapman (1994)
(25)DSGN
64.-Makes actions to improve the existing design OECD (2005)
65.-Employees have influence on their job Nicolai (et al., 2011)
66.-Employees engaged in teams with high degree of
autonomy
67.-The strategy is based on Open Innovation concepts Chesbrough (et. al
2006)
(26)IPPFI 68.-Makes actions to develop prototypes for
improvement Chesbrough (2006);
McKinsey (2008)
(27)IPPPIP 69.-Makes improvement actions to pre-production
(28)MR
70.-Makes to investigate market needs of obsolete
products
Chesbrough (et. al.
2006);Rogers (1984)
71.-Makes to investigate the needs actions and / or
market changes for innovators
72.-Makes to investigate needs and / or market
changes for early adopters
73.-Makes to investigate needs and / or market
changes for early majority
74.-Makes to investigate needs and / or market
changes for late majority
75.-Makes to investigate needs and / or market
changes for laggards
76.-Makes to investigate the onset of a new
technology Afuah (1997)
77.-Makes to investigate the term of a technology
(29)NOVY
78.-Decides actions to improve or introduce new
forms of marketing
Lev (2001)
79.-Seeks to be new or improved in the World
(Radical Innovation)
OECD (2005); Afuah
(1997)
80.-Seeks to be new or improved to the Firm (Incremental Innovation)
81.-Seeks to be new or improved in the region
(Incremental Innovation)
82.-Seeks to be new or improved in the industry
(Incremental Innovation)
(30)TRAI 83.-Makes actions to train the staff continuously (Incremental Innovation)
(31)TOINN
84.-Makes actions to innovate in technology
85.-Makes actions for innovation in production
processes
86.-Makes actions to improve or introduce new
products forms
87.-Makes actions to improve or introduce new forms
of service
88.-Makes actions to improve or introduce new

1793
organizational structures and functions 89.-Innovation activities tend to be rather radical
90.-Innovation activities tend to be incremental
(8)
IOIT
(32)NPSD
91.-Detects the projected level of revenues generated
by innovation Shipp (et al. 2008);
92.-Detects the projected customer satisfaction level
generated by innovation McKinsey (2008)
93.-Detects the projected sales percentages levels
generated by innovation Lev (2001)
94.-Detects the level of the number of launches of new
products/services in a period
McKinsey (2008) 95.-Detects the net present value of its portfolio of
products/services in the market generated by the
innovation
(9)
IPERF
(33)PCBOI 96.- Use of an indicator like: Innovation income /
(Investment in Innovation) ?
Bermúdez-García
(2010)
(34)POIFCI 97.-Use of an indicator like: Innovation Identified
Opportunities / (Total Contributors on the Process)?
(35)PGIR 98.-Use of an indicator like: Generated Ideas / (Market Knowledge Opportunities xTotal Contributors
on Process)?
(36)PEOIG 99.-Use of an indicator like: Number of Approved
Ideas / (Number of Generated Ideas)?
(37)PIEP 100.-Use of an indicator like:Number of Correct and
Timely Prototype Terminated/(Total Prototyping
Approved)?
(38)PIGR 101.-Use of an indicator like: Number of Generated
Innovations / (Identified Innovation Opportunities)?
(39)PINSI 102. Use of an indicator like: Number of unsuccessful
innovations implemented/(Total Innovation)?
(40)PTHP 103.-Does exist any relationship among : university-
government- industry, to develop the innovation?
Smith & Leydesdorff,
(2010)
(10)IFE
ED
(41)IFCAP 104.-Identify intellectual capital dedicated to
innovation for its improvement
Lev(2001);Shipp (et
al. 2008); Nicolai (et
al., 2011)
(42)IFPP
105.- Identify the stages of new or improved process
for upgrading
OECD (2005);
Chesbrough (2006)
106.-Identify attributes of new or improved
product/service for its improvement
(43)IFINN
107.-Iidentify the stages of new or improved form of
marketing for improvement
108.-Identify the stages of new or improved
technology for improvement
109.-Identifies the stages of the new or improved
structure and functions of the organization to its improvement
110.-Identifies the type of innovation (radical or
incremental) that has given best results
(44)IFV 111.-Iidentify the new or improved value proposition
(benefits costs) for its completion; relation value-price
Bonel (et al.,2003)
(45)FLINN
O
112.-The type of leadership that drives innovation is Transactional/Transformational/Passive
Mejía-Trejo (et al.,
2013), Gloet &
Samson (2013) 113.-The type of leadership that drives innovation is
Transformational
114.-The type of leadership that drives innovation is
Passive
Notes: VAR.-Variable; IND.-Indicator
Source:Own

1794
The questionnaire confidence applied to 900 CEO’s, Monster’s Online customers by
Cronbach’s Alfa Test= 0.707 (high reliability, according Hinton, 2004)
-MLR by Stepwise method showed Table 2:
Table 2.- Pearson’s Correlation Coefficient
** Sig. Correlation in 0.01
Source: SPSS 20 as a research result.
5. Discussion and Conclusions
As a general rule, predictor variables can be correlated which each other as much as
0.8 before there is a cause of concern about multicollinearity (Hinton et al., 2004; Hair et
al. 2014).
-Table 3 shows the set of variables entered/ removed by Stepwise Method.
Table 3.- Variables Entered/Removed
Model Variables
Entered
Variables
Removed
Method
1 IVADD Stepwise (Criteria: Probability of F to enter <= .050, Probability of F to remove >= .100). 2 INPROC
Dependent Variable: Digital Marketing (DM)
Source: SPSS 20 as a research result.
Notice that SPSS 20 has entered into the regression equation the 2 variables: IVADD.
INPROC that are significantly correlated with DM.
Table 4 shows the Model Summary where we can see Model 1 and Model 2.
Table 4.-Model Summary
a. Predictors: (Constant), IVADD
b. Predictors: (Constant), IVADD, INPROC
Source: SPSS 20 as a research result.
Pearson’s
Coefficient
DM IVADD IIIT INPROC IPERF IFEED IOIT
DM .741** .300** .688** .290** .120** .218**
IVADD .741** .322** -300** .190** .200** .170**
IIIT .300** .322** .280** .170** .150** .157**
INPROC .688** .300** .280** .156** .180** .160**
IPERF .290** .190** .170** .156** .150** .130**
IFEED .120** .200** .150** .180** .150** .110**
IOIT .218** .170** .157** .160** .130** .110**
Model
R Square
Adjusted R Square
Std. Error of the
Estimate
.741a .550 .490 5.234
.925b .855 .350 3.221

1795
The R Square Value (.550) in the Model Summary shows the amount of variance in
the dependent variable that can be explained by the independent variables. In this case:
Model 1.- The independent variable IVADD, accounts 55%, of the variance in the
scores of the Digital Marketing (DM)
Model 2.- The independent variables IVADD, INPROC together account 85.5%, of the
variance in the scores of the Digital Marketing (DM).
The R Value (.741) in Model 1, is the multiple correlation coefficient between the
predictor variables and the dependent variable. As IVADD is the only independent
variable in this model, we can see that the R value is the same vale as the Pearsosn’s
Correlation Coefficient in our pairwaise correlation matrix.
In Model 2, the independent variables IVADD, INPROC are entered, generating a
multiple correlation coefficient, R= .925
The adjusted R Square adjusts for a bias in R Square. With only a few predictor
variables , the adjusted R should be similar to the R square value. We would usually take
the R square value but we advise to take the adjusted R square value, when we have a lot
of variables. The Std. Error of the Estimate is a measure of the variability of the
multiple correlation.
Table 5 shows the results of Analysis of Variance (ANOVA).
Table 5.-ANOVA (a)
Model Sum of
Squares
df Mean
Square
Test
Statistic F
Value
Sig. (p
value)
1 746.180 1 746.18 37.900 .010(b) Regression 610.467 31 19.69 Residual 1356.647 32
Total 2 1149.018 2 574.509 63.665 .002(c)
Regression 270.737 30 9.024 Residual 1419.755 32
Total a. Predictors: (Constant), IVADD b. Predictors: (Constant), IVADD, INPROC
c. Dependent Variable: DM
Source: SPSS 20 as a result of the research.
The ANOVA tests the significance of each regression model to see if the regression
predicted by the independent variables explains a significant amount of the variance in the
dependent variable. As with any ANOVA the essential items of information needed are

1796
the df, the F value (Regression/Residual) and the probability value. Both the regression
models explain a significant amount of the variation in the dependent variable.
Model 1= F(1,31)=37.9; p<0.05 and Model 2: F(2, 30)=63.655; p<0.01
Dividing the Sums of Squares by the degrees of freedom (df ) gives us the Mean
Square or variance. We can see that the Regression explains significantly more
variance than the error or Residual. We calculate R2 by dividing the Regression Sum
of Squares by the Total Sum of Squares. The values for model 1 have been used as an
example.
746.18/1356.647= 0.550=R square (please, see Table 4).
Due to the Stepwise Method we had the Table 6 that shows the calculus of
Coefficients.
Table 6.-Coefficients by Stepwise Method (A)
Unstandardized
Coefficients
Standardized
Coefficients
t.
Sig.
Model B Std.
Error Beta
1 (Constant)
IVADD
2.375
.679
15.209
.351
.704 .487
3.662
.904
.010
2
(Constant)
IVADD
INPROC
-3.658
.677
.522
11.212 .267
.162
.522
.518
7.344 5.627
3.568
.830
.010
.012 a. Dependent Variable: DM
Source: SPSS 20 as a research result.
The Unstandardized Coefficients B column gives us the coefficients of the
independent variables in the regression equation for each model.
Model 1: DM = 2.375 + .679 IVADD; Model 2: DM= -3.658+ .677 IVADD+ .522
INPROC
The Standardized Beta Coefficient column informs us of the contribution that an
individual variable makes to the model. The beta weight is the average amount the
dependent variable increases when the independent variable increases by one standard
deviation (all other independent variables are held constant). As these are standardized we
can compare them. t tests are performed to test the two-tailed hypothesis that the beta
value is significantly higher or lower than zero. This also enables us to see which
predictors are significant. By observing the Sig. values in our example we can see that for
Model 1 the IVADD scores are significant (p < 0.05). However, with Model 2 both
IVADD scores (p < 0.05) and INPROC (p < 0.05) are found to be significant predictors

1797
(shaded values in the coefficients table). We advise on this occasion that you use Model 2
because it accounts for more of the variance. The Unstandardized Coefficients Std.
Error column provides an estimate of the variability of the coefficient.
When variables are excluded from the model their beta values, t values and
significance values are shown in the Excluded Variables on Table 7.
Table 7.- Excluded Variables (a)
(a) Dependent Variable: DM
(b) Predictors in the Model: (Constant) IVADD
(c) Predictors in the Model. (Constant) IVADD,INPROC
Source: SPSS 20 as a result of the research.
The Beta In value gives an estimate of the beta weight if it was included in the model
at this time. The results of t tests for each independent variable are detailed with their
probability values. From Model 1 we can see that the t value for IIIT is significant (p <
0.05). However as we have used the Stepwise method this variable has been excluded
from the model. As IIIT has been included in Model 2 it has been removed from this
table. As the variable IVADD scores is present in both models it is not mentioned in the
Excluded Variables table. The Partial Correlation value indicates the contribution that
the excluded predictor would make if we decided to include it in our model. Collinearity
Statistics Tolerance values check for any collinearity in our data. As a general rule of
thumb, a tolerance value below 0.1 indicates a serious problem.
Hence, in solving the Hypothesis and the questions proposed in this research, we
obtained:
GQ: which are the components of Innovation (INNOV) that drives digital marketing
(DM)? is solved by mean the results of the Theoretical Framework showing the Scheme
1. General Conceptual Model for DM: 4 Variables/ 24 Indicators /37 questions; for
INNOV process, we used the Mejía-Trejo et al. (2014) with: 6 Variables/ 33 Indicators/
77 questions.
Model
Beta In
t.
Sig.
Partial
Correlation
Collineartity
Statistics
Tolerance
1 IIIT .568 (b) 3.568 .012 .846 .938 .344 (b) 1.445 .222 .638 .906
IFEED -.344(b) -1.474 .336 -.434 .895
IOIT -.232(b) -.937 .420 -.332 .800
2 IPERF .256 (c) .909 .458 .335 .848
IFEED -.248 (c) -1.689 .292 -.549 .892
IOIT -.024 (c) -.056 .900 -.080 .865

1798
About the Specific Questions, we obtained:
SQ1.-Which are the variables, and indicators of the general conceptual model? We
obtained Table 1.-Final Questionnaire relating the DM and INNOV descriptors,
mentioned above included the authors per item.
SQ2.-Which are the relationships of these variables? We obtained Table 2.-
Pearson’s Correlation Coefficient among the DM, and the INNOV model (Mejía-Trejo
et al. , 2014) components: IVADD, IIIE, INPROC, IPERF, IFEED, IOIT. So, we
obtained as a predictive equations of DM, as Model 1: DM = 2.375 + .679 IVADD and
Model 2: DM= -3.658+ .677 IVADD+ .522 INPROC (see Table 6).
SQ3.-Which are the most relevant variables of the model? We obtained: IVADD and
INPROC (see Tables: 3, 4, 5); opposite of these were: IIIT, IPERF, IFEED, IOIT (see
Table 7)
Hypothesis (H): About the currently importance, by the firms like Monster Online
about the INNOV, it is presented in less than 50% of the variability in its DM results..
Table 4, H is rejected because INNOV (85.5%>50%) of our model detects the
variability on the dependent variable DM.
Finally, we conclude for the Monster's Online 900 principal CEOs customers,
perceived that the Firm efforts are aimed to develop INNOV based on : Innovation Value
Added (IVADD, Chaudhuri, 2006; Bonel et al.,2003; Gale & Chapmann, 1994) and
Innovation Process (INPROC, Shipp et al., 2008; McKinsey, 2008; OECD, 2005; Gale &
Chapman , 1994; OECD , 2005; Nicolai, et al., 2011; Chesbrough et. al 2006; Rogers,
1984; Afuah, 1997; Lev 2001) to Digital Marketing (DM), than the other INNOV factors.
References
Anwar, N.; Bahry, F.; Amran, N.; Nor, A. (2013). “Factors influencing the use of Web 2.0 tools:
Usage trends and expectations. Business Engineering and Industrial Applications Colloquium
(BEIAC).” IEEE, pp. 374-379, 7-9 April.
Birogul, S.; Kucukayvaz, E.; Erol, O.M. (2011). “Shop marketing scenario using context based
digital personality. Innovations in Intelligent Systems and Applications (INISTA)”,
International Symposium, pp.536-539, 15-18 June.
Brondmon, H. (2002). Las reglas del marketing directo en internet. Deusto: Bilbao Busch, C., Grill,
G.; Gstrein, E.; Kleedorfer, F.; Tus, A. (2013) “ Web of Needs A New Paradigm for E-
Commerce”. Business Informatics (CBI), pp. 16, 15-18 July.
Chaffey, D.; Ellis-Chadwick, F. (2014). Marketing Digital. Estrategia, Implementación y Práctica.
Pearson: México. Cohan, P. (2000) El negocio está en Internet. San Francisco: Prentice Hall.

1799
Constantinides, E. (2002). “From physical marketing to Web marketing: the Web-Marketing Mix.
System Sciences, HICSS”. Proceedings of the 35th Annual Hawaii International Conference,
pp. 2628-2638, 7-10 Jan.
Cuesta, F. A. (2010) Marketing directo 2.0 como vender más en un entorno digital. Egedsa: España
Daft, R. (2007). Teoría y diseño organizacional. Cengage Learning.:México Fernández, F. (2010).
“Un salto a la nube la computación en los cielos virtuales.” Debates IESA Vol. 15, No.1, pp.
42-45.
Forrester Research (2009). Security concerns hinder cloud computing adoption. Retrieved on
20150130 from http://bit.ly/cWpHNS
García, M.; Díaz, A., (2010). “Webs usables y accesibles en PYMEs. Retos para el futuro”.
(Spanish). Revista Latina De Comunicación Social, Vol. 13, No.(65), pp. 1-18.
Hair,J.F.; Anderson, R.E.; Tatham, R.L.; Black, W.C. (2014). Multivariate Data Analysis. 7th Ed.
Pearson, Prentice Hall, USA. Hendrix, P. E., (2014). “How Digital Technologies Are Enabling Consumers and Transforming the
Practice of Marketing”. Journal Of Marketing Theory & Practice, Vol.22, No. (2), pp. 149-
150. 2014.
Hinton, P.R.; Brownlow, Ch.; McMurray, I.; Cozens, B. (2004). SPSS Explained. USA: Routledge,
Tayloir & Francis Group.
Iantrmsky, H., (2012). “La Computación en Nube y el cambio del Universo Informático.
Pensamiento y Cultura”. Vol 15, No(1), pp. 88-93. Juárez, R. (2012).Hábito de los usuarios de internet en México. Retrieved on 20150405 From
http://www.amipci.org.mx/?P=editomultimediafile&Multimedia=115&Type=1
Kotler, P. (2009). Las preguntas más frecuentes del marketing. Bogota: Norma.
Lamb, C.; Hair, J., McDaniel, C. (2006). Fundamentos del marketing. México: Thomson.
Lee, C. K. (2012). “The Rise, Fall, and Return of E-Marketing Curriculum: A Call for Integration”.
Business Education Innovation Journal, Vol.4, No(1), p. 28-36. Lehman, T.J.; Vajpayee, S. (2011).” We've Looked at Clouds from Both Sides Now”.
SRII Global Conference (SRII), 2011 Annual, March 29, pp. 342-348.
Lytras, M., Damiani, E. ; Ordoñez, P. (2009). Web 2.0 the business model.Springer: New York.
Mejía-Trejo, J.; Sánchez-Gutiérrez; Vázquez-Ávila, G. (2014). “How the Innovation Improves the
Customer Knowledge. Management, in México”. Competition Forum, Vol.12, No. (1), pp.
11-21.
Min, Ch..; Wen, O., (2008). “An Optimal Web Services Integration Using Greedy Strategy. Asia-
Pacific Services.” Computing Conference, 2008. APSCC '08. IEEE , pp. 568-573, 9-12 Dec.
OCDE. (2005). Manual de Oslo: Guidelines for Collecting and Interpreting Innovation Data. 3rd
Ed. France: Organización de Cooperación y Desarrollo Económico Publishing.
Ojala, A.; Tyrvainen, P. (2011) “.Developing Cloud Business Models: A Case Study on Cloud
Gaming”. IEEE Software, Vol.28, No(4), pp. 42-47.
Osterwalder, A. and Pigneur, Y. (2010). Business model generation. Hoboken: John Wiley & sons,
inc.
Porter, M., (2001) Strategy and internet. Retrieved on 20150330 from:
http://hbswk.hbs.edu/item/2165.html
Treesinthuros, W. (2012). “An empirical study of e-commerce visibility. Sustainable e-Government
and e-Business Innovations (E-LEADERSHIP)”. e-Leadership Conference, pp. 1-5, 4-5 Oct.
Villamizar, M., Castro, H.; Mendez, D., (2012). “E-Clouds: A SaaS Marketplace for Scientific
Computing. Utility and Cloud Computing (UCC)”. IEEE Fifth International Conference, pp.
13-20, 5-8 Nov.
Wells, J. D., Parboteeah, V.; Valacich, J. S. (2011). “Online Impulse Buying: Understanding the
Interplay between Consumer Impulsiveness and Website Quality”. Journal Of The
Association For Information Systems, Vol.12, No(1), pp. 32-56.
Wierenga, B.. (2008). Handbook of marketing decision models. Springer: New York Zhenhai, Mu.,(2012). “Based on the electronic commerce environment of the search engine
marketing. Robotics and Applications (ISRA).” IEEE Symposium. pp. 431-435, 3-5 June
2012 doi: 10.1109/ISRA.2012.6219217


