Embed Size (px)
Citation preview
INNOVATIVE DISTRIBUTION STRATEGIES AND
PERFORMANCE OF SELECTED MULTINATIONAL
CORPORATIONS (MNCs) AND DOMESTIC
MANUFACTURING FIRMS IN NIGERIA
MICHAEL MAKEYOH OLADUN
CU03GP0023
BEING A Ph.D THESIS SUBMITTED TO THE SCHOOL OF POST
GRADUATE STUDIES, IN PARTIAL FULFILMENT OF THE
REQUIREMENTS FOR THE AWARD OF DOCTOR OF PHILOSOPHY
(Ph.D) IN BUSINESS ADMINISTRATION (ENTREPRENEURSHIP), OF
DEPARTMENT OF BUSINESS STUDIES, SCHOOL OF BUSINESS,
COLLEGE OF DEVELOPMENT STUDIES, COVENANT UNIVERSITY,
OTA, OGUN STATE, NIGERIA
MAY, 2012
brought to you by COREView metadata, citation and similar papers at core.ac.uk
provided by Covenant University Repository
ii
CERTIFICATION
This is to certify that this study was carried out by Michael Makeyoh Oladun in the Department
of Business Studies, College of Development Studies, Covenant University, under our
supervision and that this thesis has not been submitted for the award of any degree in this or any
other University.
Prof. I. O. Fajana
Supervisor Signature and Date ----------------------------------
Prof. S. O. Otokiti
Co-Supervisor Signature and Date ----------------------------------
Prof. J. A. Bello Signature and Date ----------------------------------
Head of Department of Business Studies
Covenant University
Ota, Ogun State
Nigeria
iii
DECLARATION
It is hereby declared that this research work titled ‘’Innovative Distribution Strategies and
Performance of Multinational Corporations (MNCs) and Domestic Manufacturing Sectors in
Nigeria: A Case Study of Lagos State Industrial Areas’’, was undertaken by Michael Makeyoh
Oladun. It is based on his original study in the Department of Business Studies, College of
Development Studies, Covenant University, Ota, under the supervision of Prof. I. O. Fajana and
Prof. S. O. Otokiti and that ideas and the views of other researchers have been duly expressed
and acknowledged.
Michael Makeyoh Oladun
(Researcher) Signature and Date ------------------------------
Prof. I. O. Fajana
Supervisor Signature and Date ---------------------------------
Prof. S. O. Otokiti
Co-Supervisor Signature and Date ----------------------------------
Prof. J. A. Bello Signature and Date ----------------------------------
Head of Department of Business Studies
Covenant University
Ota, Ogun State. Nigeria
Prof. K. Soremekun Signature and Date ----------------------------------
Dean, College of Development Studies
Covenant University
Ota, Ogun State. Nigeria
Prof. C. O. Awonuga Signature and Date ----------------------------------
Dean, School of Postgraduate Studies
Covenant University
Ota, Ogun State. Nigeria

iv
DEDICATION
This thesis is dedicated to the Almighty God, the owner of the universe and the fountain of life
for giving his servant, Bishop David Oyedepo, the vision of Covenant University and for
empowering me to undertake and finish this work. I also dedicate this thesis to Bishop David
Oyedepo, my Spiritual father, mentor and coach and to the affectionate memory of my late
mother, Mrs. Emasie Asabi Oladun for laying the foundation of my education and career.

v
ACKNOWLEDGEMENTS
In preparing this thesis, I received valuable assistance and support from several persons to whom
I hereby express my sincere gratitude.
First, I owe a great deal of Glory to the Almighty God, my creator and the giver of wisdom and
sincere gratitude to my spiritual father, coach, mentor and role model, Bishop David Oyedepo
and his wife, Pastor Mrs. Faith Oyedepo, who God gave the heavenly mandate of liberation that
birthed Covenant University on which platform this life-long goal was achieved. Daddy, I will
eternally be grateful for your fatherly actions and love specially shown to me throughout the
period of this academic programme that started way back in December, 2003.
My appreciations to the Vice Chancellor, Covenant University, Professor Aize Obayan, Deputy
Vice Chancellor, Prof. Charles Ogbulogo, former Registrars of the University, Pastor Yemi
Nathaniel and Dr. Daniel Rotimi and the incumbent, Mr. J. N. Taiwo, for their leadership role
that aided the actualisation of my dream in the University.
I would like to pay special tribute to my Supervisor, Prof. Isaac Olusola Fajana, who opened my
mind to new research horizon, inspired me and set new standards of excellence. I benefitted
immensely from his supervision in many ways including generosity of his time, usage of library,
invaluable advice and encouragement at different stages of the thesis. I am truly grateful for your
guidance and encouragement. It has been a privilege to work with you and I look forward to
future research collaborations.
It is my pleasure to acknowledge the constructive comments, corrections, generosity and
suggestions provided by my Co-Supervisor, Prof. Sunday Otokiti, especially in the final stages of
this thesis.
Also worthy of mention is the trust and continuous support of the Dean, College of Development
Studies, Prof. Kayode Soremekun, former Dean, Prof. M. O. Ajayi, Dean, College of Science
and Technology, Prof. Fredrick Kofi Hymore and Prof. C.A. Awonuga of the School of
Postgraduate Studies. I thank you all for your useful advice and guidance while this research
work lasted.
My gratitude also goes to Prof. J.A. Bello, Head of Department of Business Studies, the ‘father’
of the Department for his prayers, personal encouragement and friendship. Sharing his research
experience with me motivated me to work harder on this thesis.
Likewise, I salute the academic prowess of the former Head of Department of Business Studies,
Dr. Olalekan U. Asikhia. I am also grateful to other distinguished academics in the College for
their valuable contributions, including Professors J.A.T. Ojo, Don Ike, A.K. Omideyi, T.
Fadayomi, D. Omoweh, Okediji, E.N. Kwofie and Idowu Sobowale and D. Rudrappan.
I also appreciate the contributions of Professors N. Asika, I.C. Achumba, Famous Izedomi,
Adewoye, Adedeji, B. Oghojafor, J.O .Onah, Sola Fajana, S.A. Banjoko, and F. Akingbade, and
the roles of Dr. A. Adedayo, Dr. (Mrs) Jummy Familoni and Dr. Adeleke. I feel privileged to
have studied under the watchful eyes of these erudite scholars in the course of the programme. I
am indeed grateful to them all. I am also grateful to my colleagues at both the Department of
Business Studies and the College of Development Studies of this university for their diverse

vi
contributions and critical comments. These include: Dr. S.O. Ibidunni, Dr. C. Okafor, Dr. O.J.
Kehinde, Dr. O. Oyeniyi, Dr. R.E. Worlu; Dr. S. T. Akinyele; Dr. A.A. Adeniji, Dr. J.K.
Obamiro, Dr. J. Abiodun, Dr. Iyiola, Dr. O. Adegbuyi, Mr. O. Ojo, O.O Ogunaike, A.O.Akande,
C.I. Tongo, Mrs. C. Roland-Otaru, Mrs. E.E. Oni-Ojo, and Miss A. Ogunba.
No less measure of gratitude goes to Professors. P. Enyi and. I. O. Ogunrinola, Dr. P. Adelusi,
Dr. D. Gberevbie, Dr. J. Ayam Dr.. W. Olayiwola, Dr. P. Alege, Dr. J. Enahoro, Dr. B. Umoren,
Dr. E. Ovia, Dr. Duruji, Messrs Olowe, Adetiloye, Fashina, Amoo, Akanbi, Mrs. Adegboye, Mrs
Oyerinde, Dr. F. Iyoha and many others for their personal encouragement and friendship.
I also appreciate the authors of various materials used in the preparation of this thesis, the
Librarian of Covenant University and other libraries as well as the staff of these libraries for their
generous permissions, excellent disposition, suggestions and support.
This research could not have been completed without the assistance of my interview subjects and
survey participants who patiently gave their time and shared their valuable experiences and
knowledge with me. I sincerely appreciate your cooperation.
A special appreciation goes to Dr. G. O. Adejumo for technical and Information Technology (IT)
support, Mr. John A. Philip and Mr. Olarewaju O. Raphael for their excellent secretarial services.
I am sincerely grateful to my parent, Elder Oladun. F. Okiyadah and Prof. E.B. Ajulo, Chief
M.A. Olorunfemi, Rev. F.A Adetukasi, Engr.(Dr) Sir. G.E. Omene, Rev. J.S. Ajulo.and my late
mother Mrs. Asabi E. Oladun for all you went through for me to get to this level. I am also
grateful to my brothers and sisters, Pastor Sunday Oladun Jr., Victoria, Winifred, Cynthia and
Jocyline; my uncles, aunties, and parents in-law Prince A.B. Momoh and Mrs Ajara Momoh,
who although far away were yet so near to listen to my frustrations via phone calls and e-mails
and provided moral cum emotional support all the way. Thank you all for this great journey to
achieve this personal goal.
I am especially grateful to my wife, Charity Oshokenoya Oladun, for her great understanding and
support for my dreams. She has been a blessing to me and to our wonderful children –
Omonofan, Peace, Ojaweh, Orimezo and Azaboh. Her unconditional support throughout the
process of writing this thesis gave me the requisite impetus to complete this thesis with all the
attended challenges.
I am eternally grateful to you all.
Michael Makeyoh Oladun
May, 2012.
vii
ABSTRACT
Innovation reflects the tendency of a firm to enhance, appreciate and acquire new ideas, novelty,
experimentation and the creative processes that may result in new products, services or
technological processes. This study attempts to examine the impact of innovative distribution
strategies on performance of the firms (MNC’s and DE’s) in Lagos industrial areas. The work
examined the relationship between the production capacity, market share, possible return on
investment, profitability as resulting from IDS of both DE’s and MNC’s. Globally, many firms
have been found not to be adequately innovative and there is a wide gap between firms in sub-
Saharan Africa and their counterparts elsewhere. To do this, firms need to develop the capability
to manage technological change, the development of new processes and design. The study in its
descriptive nature, adopts a cross-sectional survey design. One hundred and seventy-five
participants were randomly selected from six multinational and indigenous firms. Five
hypotheses were stated and tested. The findings revealed that the sales turnover of multinational
corporations (MNCs) with high level IDS and domestic enterprises (DEs) with low level of
innovative distribution strategies is significantly different at t= 68.442, df= 89 and >0.05.And
that, Innovative distribution teams/ strategies adopted by MNCs and DEs when compared and
analyzed have a significant effect in predicting annual overall profitability at F (1,174)= 13.086.
The findings also reveal that there is a significant effect of IDS of MNCs and DEs on their
capacity to increase market shares at F(1,174)= 18.237 and there is positive relationship between
the obstructive distribution parameter confronted by MNCs and DEs on their annual sales
turnover to distribution mix and internal channel management. The study revealed that MNCs
because of their size, sophisticated distribution strategies and channels, were able to be more
innovative than indigenous firms and thus achieve better performance. The innovation decision -
making process model rating scale developed by the researcher, is a contribution to knowledge.
viii
TABLE OF CONTENTS
Title Page ….…………………………………………………………………………... i
Certification ……………………………………………………………………………. iii
Declaration … ………………………………………………………………………… iv
Dedication …………………………………………………………………………….. v
Acknowledgements …………………………………………………………………… vi
Abstract ……………………………………………………………………………….. vii
Table of Contents ………………………………………………………………………. viii
List of Tables ………………………………………………………………………….. xi
List of Figures ………………………………………………………………………… xii
Appendix ……………………………………………………………………………… 177
CHAPTER ONE: INTRODUCTION Pages
1.1 Background of the Study ……………………………………………………… 1
1.2 Statement of the Research Problems …………………………..……………… 4
1.3 Objectives of the Study……………………………………….……………… 8
1.4 Research Questions…………………………………………………………… 8
1.5 Hypotheses of the Study……………………………………………………… 9
1.6 Scope of the Study…………………………………………….……………… 10
1.7 Significance of the Study……………………………………………………… 11
1.8 Limitation of the Study………………………………………………………… 11
1.9 Operationalisation of Variables………………………………………………… 12
1.10 The Structure of the Work……………………………………………………… 14
1.11 Definition of Terms…………………………………………………………… 14
CHAPTER TWO: REVIEW OF LITERATURE
2.0 Introduction……………………………………………………….……………… 16
2.1 Conceptual Framework …………………………………………..……………… 16
2.1.1 Historical Background of Industrial Development……………….……………… 17
2.1.2 Manufacturing Firms in Developing Economies………………………………… 23
2.1.3 Production Process ……………………………………………….……………… 28
2.1.4 Production Technology…………………………………………………………… 29
2.1.5 Organisational Structure in the 20th Century …………………………………… 34
2.1.6 Emerging Trends in Organisational Structure…………………………………… 36
2.1.7 Multinational Companies Model………………………………………………… 39
2.1.8 Organisational Strategy ………………………………………………………… 41
2.1.9 Multinational Organisational Strategies ………………………………………… 43
2.1.10 Product Distribution……………………………………………………………… 47
2.1.11 Distribution Channels …………………………………………….……………… 48
2.1.12 Structure of Distribution Channels……………………………….………………. 52
2.1.13 Functions of Distribution Channels …………………………….……………… 54
ix
2.1.14 Physical Distribution Management……………………………..……………… 55
2.1.15 Innovative Physical Distribution Strategies…………………….……………… 57
2.1.16 Physical Distribution…………………………………………………………… 62
2.1.17 Distribution Process…………………………………………………………… 75
2.1.18 Organisational Performance…………………………………………………… 78
2.1.19 Entrepreneurship and Innovative Distribution Strategy……….. ……………… 85
2.1.20 Stages in the Innovation- Decision Process…………………….……………… 93
2.1.21 Obstructive Distribution Parameters…………………………………………… 96
2.2 Theoretical Framework……………………………………….……………… 96
2.2.1 Theories of Distribution Channel…………………………….……………… 97
2.2.2 Depot Theory………………………………………………..……………….. 100
2.2.3 System Theory………………………………………………..……………… 101
2.3 Empirical Framework………………………………………..……………… 102
CHAPTER THREE: RESEARCH METHODOLOGY
3.0 Introduction…………………………………………………………………… 106
3.1 Research Methods……………………………………………..……………… 106
3.2 Research Design……………………………………………………………… 108
3.3 Population of the Study. …………………………………… ………………… 108
3.4 Sample Size Determination………………………………………..………….. 111
3.5 Sampling Procedure…………………………………………………………… 114
3.6 Sampling Frame …………………………………………………..………….. 116
3.7 Sources of data…………………………………………………….………….. 117
3.8 Data Collection Techniques……………………………………….…………… 117
3.9 Research Instruments……………………………………………..…………… 118
3.10 Measurement of Variables ……………………………………….…………… 121
3.11 Validity of Research Instrument……………………………………………… 122
3.12 Reliability of Research Instrument…………………………………………… 123
3.13 Methods of Data Analysis……………………………………….…………… 124
CHAPTER FOUR: PRESENTATION AND INTERPRETATION OF
RESULTS
4.1 Introduction ……………………………………………………………………… 125
4.2 Demographic Data ……………………………………………..……………….. 125
4.3 Hypothesis Testing……………………………………………..……………….. 134
4.3.1 Hypothesis One ………………………………………………..………………… 135
4.3.2 Hypothesis Two ………………………………………………..………………… 136
4.3.3 Hypothesis Three ………………………………………………………………… 138
4.3.4 Hypothesis Four……………………………………………….………………….. 140
4.3.5 Hypothesis Five……………………………………………….………………….. 142
x
CHAPTER FIVE: DISCUSSION, CONCLUSION AND
RECOMMENDATIONS
5.1 Summary of the Work …………………………………………………………… 144
5.2 Discussion of the findings ……………………………………….……………… 144
5.2.1 Discussion of Hypothesis 1……………………………………………………… 145
5.2.2 Discussion of Hypothesis 2 ……………………………………..……………… 147
5.2.3 Discussion of Hypothesis 3……………………………………………………… 149
5.2.4 Discussion of Hypothesis 4……………………………………………………… 150
5.2.5 Discussion of Hypothesis 5……………………………………………………… 152
5.3 Conclusions……………………………………………………………………… 153
5.4 Policy Implications of the Findings……………………………..……………… 158
5.5 Recommendations………………………………………………..……………… 159
5.6 Problems Encountered During the Study………………………………………… 161
5.7 Limitations and Suggestions for Further Research………………..……………… 162
5.8 Contributions to Knowledge……………………………………..……………… 163
References………………………………………………………..……………… 165
Appendices……………………………………………………………………… 177
xi
LIST OF TABLES
Table 3.1: Geographical Zones and Location of Manufacturing companies ………… 109
Table 3.2: South West Manufacturing companies…………………………………… 109
Table 3.3: Population of Participants …………………………………….………… 110
Table 3.4: South West Distribution of Manufacturing Companies……….………… 112
Table 3.5: Companies included in the Study……………………………..………… 112
Table 3.6: Minimum Returned Sample Size Table for Continuous and
Categorical Data ……………………………………………..………… 113
Table 3.7: Random Distribution of the Questionnaires……………………………. 118
Table 4.1: Gender Distribution Respondent……………………………………….. 125
Table 4.2 Marital Status of Respondents …………………………………………. 126
Table 4.3: Age Distribution of Respondents ……………………………….……… 126
Table 4.4: Descriptive Statistics of Respondents by Position……………..……….. 127
Table 4.5: Descriptive Statistics of Qualifications of the Respondents
in Organization s……………………………………………………….. 128
Table 4.6: Descriptive Statistics of Respondents by Job Experience…..………… 128
Table 4.7: Characteristics of Multinationals and Domestic Enterprises….………… 129
Table 4.8: Summary of Sales Turnover of Firms ………………………..………… 131
Table 4.9: Profitability of MNCs and DEs ……………………………..………… 132
Table 4.10: ANOVA Capacity to Increase Market Share ……………….………… 132
Table 4.11: Model Summary of Returns on Investment………………….………… 133
Table 4.12: Annual Sales Turnover ………………………………………………… 134
Table 4.13: Sales Turnover of MNCs and DEs …………………………………… 135
Table 4.14: Model Summary of Profitability MNCs and DEs ……………………… 136
Table 4.15: ANOVA of Model Summary of Profitability of Firms ………………… 136
Table 4.16 Capacity to Increase Market Shares by Firms………………….………… 137
Table 4.17 ANOVA Market Shares of Firms…………………………….………… 138
Table 4.18 Model Summary of Returns on Investments…………………..………… 140
Table 4.19 ANOVA Distribution of DEs………………………………….………… 141
Table 4.20 Relationship of MNCs and DEs ODP…………………………………… 142
xii
LIST OF FIGURES Figure 1: Production Process………………………………………….………… 28
Figure 2: Organisational Structure …………………………………………… 39
Figure 3: Channel of Consumer and Organisational Goods ………….………… 51
Figure 4: Relationship between Entrepreneurship and Distribution ….………… 92
Figure 5: Innovation Decision – Process ……………………………..………… 95
Figure 6: Year of Establishment of Firms …………………………….………… 130
Figure 7: Nature of Firms…………………………………………….. ………… 130
Figure 8: Percentage of MNCs and DEs in the Study………………..………… 131

xiii
APPENDICES
Sample Research Questionnaire …………………………………………………… 177
Psychometric Properties (Validity and Reliability)………………………………… 191
Models of the Study ……………………………………………………………………. 194
1
CHAPTER ONE
INTRODUCTION
1.1 Background of the Study
The capacity to innovate is recognised today as one major way to gain competitive advantage in
the marketing of products and services in particular and corporate world in general. An
innovative firm would readily lend its support to new ideas, novelty, experimentation and the
creative processes that may result in new products, services or technological processes (Fulmer,
Gerhart and Scott, 2003). One traditional means of achieving competitive advantage is to create
new products but can be easily copied. Low-cost of products as a competitive advantage also
suffers from sustainability while the brand name as competitive advantage is possible only if
there is a strong brand. Marketers are turning more and more to channels as a competitive
advantage e.g. Dell Computer (Rhodes, Hung, Lok, Ya-Hui Lien and Wu, 2008). This maximises
control over service level/output, enhances product‘s image and engenders higher markups,
promotes dealers loyalty, better forecast, better inventory and merchandising control and restricts
resellers from carrying competing brands.
The rules of competition in the World today have made it even more important for firms to
innovate or liquidate. Globally, many firms have been found not to be adequately innovative and
there is a wide gap between firms in sub-Saharan Africa and their counterparts elsewhere. Within
the context of developing countries, innovation is best thought of as a process of adopting
existing indigenous technologies. To do this, firms need to develop the capability to manage
technological change. Oyelaran–Oyeyinka, B; .Laditan,G.O.A; and Esubiyi A.O (1996) found
2
out in their study of 50 Nigerian firms that innovation is mostly adaptive and incremental in
nature within the Nigerian industrial sector. Because of constraints that are peculiar to
developing countries (such as poor infrastructure and weak innovative systems), the results of
innovation studies carried out in developed nations may not be of much use in Nigeria.
Nigeria is presently witnessing an emerging entrepreneurial development in various sectors of
the economy. This trend is championed by the presence of multinational corporations (MNCs),
which are responsible for independent/sole venture capital development, joint venture
collaboration and complex intra and inter-industry relationship. The MNCs use this strategy to
develop comparative upper reach in industrial structure, over and above their domestic
counterparts (Kuratko & Hodgetes, 2004). A broad categorisation of innovation is difficult to
achieve, because innovation normally covers a considerable range and combination of
products/markets and technological innovation, as in the case of sophisticated, technologically
innovative products designed to meet demand in a specific market. So far, most, research work
have been based on technological innovation, which mainly consists of the development of
products and processes, engineering, research, with emphasis on industry-relevant technical
expertise and knowledge.
It is important at this introductory stage to distinguish between entrepreneurship and distribution
for purpose of clarity. Almost all definitions of entrepreneurship agreed that the concept entails a
kind of behaviour which includes (i) initiative taking, (ii) the organising and reorganising of
social and economic mechanisms to turn resources into practical outputs which have utility value
to the consumers, (iii) the acceptance of risk or failure (Hisrich & Peters, 2002). According to
Peter Maris (1972), entrepreneurship is practical creativeness and innovativeness, which
3
combines resources and opportunities in new ways. It involves the application of personal
qualities, finance and other resources within the environment for the achievement of business
success.
Distribution in the manufacturing sector, on the other hand, has been defined as the handling and
moving of physical goods within industrial firms and through channel systems (McCarthy, 1968,
1978). It also involves the planning and implementation of physical flow of materials and final
goods from the point of production to the point of use to meet consumer needs at a profit on the
side of the marketer (Gong, Law, Chang, and Xin, 2009). The link between entrepreneurship and
distribution is that any production without effective distribution system is useless because the
produced goods do not gain any utility until the final consumer derives some level of satisfaction
after using them.
It appears today that only economies dominated by entrepreneurial skills, that is market based
economies can survive the current wave of economic realities. This is against the background
that money value has continually failed to drive the productive factors of many developing
economies, whereas the position in developed countries is quite different (Kuratko and
Hodgettes, 2004). But little research works have been carried out in the areas of management and
marketing abilities of entrepreneurs in developing countries and their ability to compete
favourably in global economy. Also, it is observed that within the developing economies, there
exist differences in the level of development injection of entrepreneurial skills and the
consequent performance on the economy (Ariyo, 2000).
4
Given the historical experience of developing countries through the process of colonial capitalist
expansion, there seems to exist the possibility that only an entrepreneurship-driven economy will
remain solvent and prosperous to engender growth and development, (Ajakaiye & Ade, 2003).
In addition to the above, one must incorporate Space Theory to this analysis. However, in view
of the speed with which events unfold globally today, the benefit of physical distribution
management strategies of products and perceived innovativeness necessitated this study. The aim
of this study is therefore to examine the significant difference or otherwise in innovative physical
distribution strategies adopted by selected MNCs and domestic enterprises in their annual
performance in Nigeria, and articulate the problems of the inter-related factors to an effective
distribution in manufacturing companies.
1.2 Statement of the Research Problems
In examining manufacturing distribution strategies, findings of earlier studies indicated a
number of differences and similarities between indigenous and foreign firms using data gathered
from both developed and developing countries. Although there is growing empirical evidence
showing that international firms perform better in almost all areas than their domestic
counterparts, the intervening effects of innovative distribution has not been reported (Holt, 2005,
Stevenson, 2000). Although distribution is very important to the productivity of indigenous and
multinational firms, in actual operation, many indigenous and multinational firms do not realise
this point completely, as there are always several of problems in the distribution strategies.
From a contemporary perspective, it is observed that innovation in industrialisation process has
occupied an important dimension to performance optimisation (Achumba, 1996, Iyanda, 1990,
Nwokoye ,1981and Ige 1975, 1979). In another contribution by Erik and Kelvin (2006), the issue
5
of innovation was associated with metro-logistics particularly with emphasis on some predictors
of successful distribution studies. However, most of the indicators of performance in these
studies were qualitative. The general belief that sales turnover depends on innovative distribution
strategies is evident in existing literature (Truell, Webster & Davidson,1998, Upton, Teal, &
Felan, 2001). The findings showed that companies with innovative distribution teams are
expected to have more sales, although such conclusion is still a subject of empirical verification
because the samples of such studies were mainly drawn from developed countries(Timmons,
2002, Trolt, 2004). This study therefore, attempts to establish the relationship between sales
turnover and innovative distribution strategies between selected MNCs and DE operating in the
manufacturing sector of the Nigerian economy.
Another notion in existing body of knowledge on this concept has it that innovative distribution
process adopted by MNCs and DEs engenders high profitability. However, innovative
distribution strategies have been found to lead to high cost of distribution and marketing of good,
which contradicts the notion of positive correlation between high profit and innovative
distribution teams and process (Trolt, 2004). This study establishes the effect of innovative
distribution teams and process on the profitability of MNCs and DEs against the background that
the profit level is a function of both cost and revenue relationship of these innovations. It has
been asserted, albeit erroneously that the nature and behaviour of cost as well as revenue
functions of innovative distribution process (IDP) and profitability have consequential effect on
MNCs and DEs profit structure (Trolt, 2004). This cost revenue function requires significant
study focusing on MNCs and DEs profit effect and distribution teams on one hand and high
profitability and innovative distribution process on the other.
6
In the studies by Ige (1975, 1979) it was observed that as companies (MNCs and DEs) adopted
innovative distribution processes, they tended to capture new markets, acquire new customers
and gain former and widen foothold in market. Also, the studies brought out the strong
relationship between innovative distribution strategies and new product introduction. Those
studies, however added that innovative distribution (ID) and new products (NP) introduction
might not necessarily result in increased market share and the associated profit. Consequently,
this thesis examined the inclusion of NP and ID in the manufacturing mix, the nature of market
diversification and concentration resulting from ID and NP as part of its major preoccupation.
While MNCs invest more in innovative distribution teams (IDT), that is the trained personnel
charged with effective product distribution, than their domestic counterparts, these domestic
enterprises make more return on investment than the multinationals (Trolt 1998, Illori 2000) This
study therefore attempts to examine why MNCs post less return on investment than domestic
enterprises despite the abundant comparative advantage innovative distribution strategies are
supposed to confer on the MNCs.
Other factors influencing the physical distribution management strategies ( Offiongodon (1991) ;
Baker (1971), include what can be categorized as ―obstructive distribution parameters‖ (ODP).
Administrative bottlenecks in the collection and handling of products.
Unnecessary hoarding of products.
Inadequate storage facility.
Numerous and unnecessary middle men.
Problem of processing and packaging.
Insecurity on the Nigerian roads.
7
These obstructive distribution parameters represent partly, another area or focus of this research
work. There is no doubt that over the years, a number of problems have arisen from economic
policies in Nigeria. These problems have adversely affected the management, marketing,
distribution and productivity of enterprises in the country. They have also affected innovative
distribution strategies in our production systems (Offiongodon, 1991).
Previous research studies had covered much ground in general management, marketing and
economics but not much had been done in the specific area of innovative distribution strategies.
Of more significance is the identified gap in the area of physical distribution management
strategies in domestic enterprises, which this study will identify within the selected
manufacturing sectors in the Nigerian economy.
As in other countries, the innovation distribution channels in Nigeria face some problems. Other
writers and scholars (Davide & Antonello, 2003 and Fareeda, 2010) in this area include but not
limited to the report on ―analysis and evaluation of distribution channels in various sectors of the
Indian economy‖ (www. bee management.com 2005) & Coca-Cola in India: ―Innovative
Distribution Strategies with Right Execution Daily (RED) Approach‖ (Fareeda, 2010). These
two studies involved analysing and evaluating distribution channels of various companies
belonging to sectors of the Indian economy. Davide & Antonello (2003), in their study titled
―Innovation, Foreign Ownership and Multinationality: An Empirical Analysis on Italian
Manufacturing Firms‘‘, stated that combining evidence on the ownership structure,
internationalism and economic performance of Italian manufacturing companies with microdata
from the second Community Innovation Survey showed that significant difference exists in
productivity and innovatory behaviour of (foreign and domestic-owned) multinationasl relative
8
to domestic uni-national firms in Italy. This study attempts to verify the situation of performance
and innovatory behaviours of manufacturing sectors.
1.3 Objectives of the Study
The main objective of this study is to examine the effect of innovative distribution strategies on
the performance of MNCs and DEs..
Other specific objectives are to :
(1) Examine the significant relationship between the sales turnover of multinational corporations
(MNCs) and domestic enterprises (DEs) as a result of innovative distribution strategies;
(2) Determine, if there exists the significant difference between innovative distribution strategies
of both MNCs and DEs in predicting profitability;
(3) Analyze the effect of innovative distribution strategies of MNCs and DEs on their capacity to
increase market share;
(4) Identify the effect of innovative physical distribution strategies of MNCs and DEs in
predicting returns on investment; and
(5) Examine the effect of obstructive distribution parameter confronted by MNCs and DEs on
their annual sales turnover.
1 .4 Research Questions
The following set of questions reflects the thrust of this study:
(1) Is there a relationship between the innovative distribution strategies of MNCs and DEs.
9
(2) Does difference exist in the sales turnover of multinational corporations (MNCs) and
domestic enterprises (DEs) as a result of their innovative distribution strategies?
(3) To what extent can the innovative distribution strategies of both MNCs and DEs be used in
predicting their profitability?
(4) What difference exists between the innovative distribution strategies of MNCs and DEs on
their capacity to increase market share?
(5) What is the effect of innovative physical distribution strategies of MNCs and DEs on return
on investment?
(6) What is the effect of obstructive distribution parameter confronted by MNCs and DEs on
their annual sales turnover?
1.5 Hypotheses of the Study
The following hypotheses were stated and tested in the study;
(1) There is no significant relationship between the innovative distribution strategies of MNCs
and DEs.
(2) The sales turnover of multinational corporations (MNCs) and domestic enterprises (DEs) as a
result of their innovative distribution strategies will not be significantly different.
(3) There is no significant effect of innovative distribution strategies of both MNCs and DEs in
predicting their profitability.
10
(4) There is no significant difference in the effect of innovative distribution strategies of MNCs
and DEs on their capacity to increase market share.
(5) There is no significant effect of innovative physical distribution strategies of MNCs and DEs
in predicting returns on investment.
(6) There is no significant effect of the obstructive distribution parameter confronted by MNCs
and DEs and their annual sales turnover.
1.6 Scope of the Study
The aim of the study is to assess the comparative innovative distribution strategies and
performance of selected multinationals and domestic enterprises in Nigeria‘s manufacturing
sector using Lagos State Industrial areas. The companies were selected to represent examples of
major efforts to determine distributive strategies of indigenous and multinational firms from
developing economies.
The study attempts to address the features of innovative distribution strategy process through
case studies from indigenous and multinational firms in Nigeria‘s manufacturing sector in
relation to their performance. As brought forth in the previous chapter, the underlying premise of
this study is that the earlier research works in this area did not establish the difference between
distribution strategy and innovative distribution strategy. Rather, they addressed the entire
concept from an application perspective.
This study collected information directly from employees of manufacturing firms as regards
innovative distribution strategy and performance indicators. Therefore, the scope of this study is
11
limited to the information sought and supplied at that point in time. The study documented only
situations that were reported and investigated by employees. The study did not include
information about unreported situations.
1.7 Significance of the Study
The findings of this research work are significant in several respects. First, the result will help
consultants and researchers to appreciate the problems encountered by local entrepreneurs and
their multinational counterparts. Second, it will help to influence the decisions of policy makers
in addressing the problems of innovative distribution strategies in Nigeria. Thirdly, the study will
help manufacturers to understand the extent of variation in the performance of multinationals and
domestic manufacturing companies and innovative physical distribution strategies caused by the
amount of innovative teams, process, and strategies introduced to the training needs of the
distribution staff. The innovative distribution process, products distributed & new products
introduced into the markets and the consequence of these in annual sales turnover, profitability,
market share and return on investment of multinationals and domestic enterprises in Nigeria
would be revealed from the study. It will also help to influence the formulation, implementation
and evaluation of government policies while also creating further opportunity for research on the
issues of innovations in physical distribution management strategies, development, trend and
inter-industry relationship in the Nigerian economy. Finally, the study will reveal and broaden
the knowledge of indigenous companies on the competitive uses of innovative distribution
strategies in the distribution and marketing of products.
12
1.8 Limitation of the Study
In the process of this study, the researcher encountered some challenges that are likely to affect
the overall outcome of this work. These problems include insufficiency of secondary data, lack
of sufficient fund, inability to access the required offices for the collection of necessary materials
and other unexpected distortions during the study.
1.9 Operationalisation of the Definition of the Variables/ Model
Specification
The comparative innovative distribution strategies and performance of selected multinationals
and domestic enterprises in manufacturing companies in Nigeria have two main constructs that
have been operationalised for the purpose of this study.
Put mathematically, the two constructs are: Y=f (X)
Where
Y = Vector of Dependent Variable
X = Vector of Independent Variables
Performance of multinationals and domestic enterprises as a function of innovative distribution
strategies is determined as:
PMNs/DE= f (IDS)
Operatinalising PMNDE as a construct shows that;
PMNDE or Y = y1, y2, y3, y4,...........yn
13
Where;
y1 = Sales turnover.
y2 =Profit of the company
y3 = Company market shares in the industry
y4 = Return on investment
(IDS) = Innovative distribution strategies;
Where IDS as a construct can be operationalised into research variables as shown below:
IDS = (X) = x1, x2, x3, x4, x5.........u
X1 = Innovative management structure
X2 = Innovative distribution process
X3 = Innovative product Distribution
X4 = Innovation product teams
X5 = Innovative commercial strategies
X6 = Government policies on distribution
X7 = Physical distribution management (Obstructive distribution parameters)
U = Unspecified (Random Variables)
14
The computation of co-efficient of determination to explain the proportion reduction in error
(PRE) is expressed using r2 expressed as a percentage (%). The principles and assumptions of
each statistical method of analysis are explained in chapter IV of this thesis.
1.10 The Structure of the Work
This study is divided into five chapters. Chapter One focuses on introduction while Chapter Two
is the review of literature with respect to entrepreneurship, physical distribution, innovative
strategies, theoretical and empirical framework, Chapter Three focuses on the research methods
while Chapter Four examines data presentation and analysis. The last chapter contains the
discussion, summary of findings, conclusion, recommendations and suggestions for further
studies.
1.11 Definition of Terms
Entrepreneurial Innovation-Entrepreneurial Innovation is the process of creating a valuable
product or service in a different way by devoting the necessary time and effort, assuming the
accompanying financial, psychological and social risks and receiving the resulting reward of
monetary and cum personal satisfaction (Robert D. Hisrich 1986) It is also a process of doing
something new and/or something different for the purpose of creating wealth for individuals or
adding value to the society.
Entrepreneurial Education-Entrepreneurial education is an educational programme that
focuses on acquainting trainees with issues on entrepreneurship. Entrepreneurial education is
designed to teach and inculcate the skills needed to recognise business opportunity, organise and
start new business venture in trainees.
15
Innovative Distribution Management-Operations and Production management of the efficient
transfer of goods from the place of manufacture to the point of sale or consumption is defined as
innovative distribution management. Distribution management encompasses such activities as
warehousing, materials handling, packaging, stock control, order processing, and transportation.
Innovative Distribution Strategy-An innovative strategy can be defined as a planned course of
action undertaken to achieve the aims and objectives of an organisation.
Multinational or Transnational Corporations: A company or corporation that operates on a
global scale, usually with subsidiaries, offices or production facilities in more than one country.
16
CHAPTER TWO
REVIEW OF LITERATURE
2.0 Introduction
This part of the research thesis reviews existing body of works on the thesis topic. This section is
divided into conceptual, theoretical and empirical frameworks. The conceptual framework of this
study encompasses the system of concepts, assumptions, expectations, beliefs that support and
inform the research (Miles and Huberman, 1994; Robson, 2002). The important thing to note is
that conceptual framework is primarily a conception or model of what is out there that the
researcher plans to study, and of what is going on with these things and why?. Under the
conceptual frame work, the views of different authors in relation to innovation/innovativeness,
management and distribution strategies were reviewed.
The theoretical framework reviews the development of theories of entrepreneurship, innovative
distribution strategies and performance, while empirical framework examines the results and
reports of previous works on innovative distribution strategies and performance.
2.1 Conceptual Framework
This conceptual framework presents a group of concepts that are broadly defined and organised
to provide focus, rationale and tool for the integration and interpretation of information. This is
expressed abstractly through word models and theories employed in this study.

17
2.1.1 Historical Background of Industrial Development
Historical background of industrial development might be incomplete without looking at the
traditional industrial practice and how this was influenced by the Industrial Revolution that
began in Britain. The Industrial Revolution spread to the rest of Europe, America through the
activities of British missionaries and other European expeditionists. These groups of missionaries
and expeditionists later spread their activities to Nigeria in particular and other parts of Africa in
general. In support of this perspective, Amrine, Ritchey and Hulley (1983) argued that the
beginnings of modern industry can be accurately dated and placed. They said that series of
events that brought into being the factory system were referred to as the Industrial Revolution
which occurred largely in England from 1770 to the early 1800. Most writers‘ referred to events
occurring at this time as period of great inventions (Barber, 1967; Jhingan, 1975; Meier, 1976;
Bhatia, 1978; Hagen, 1986 and Todaro, 1990). These inventions brought the machine age to all
civilised people of the World. The machines revolutionalised the character of industrial England
and later the industrial life of the United States. The great inventions are eight in number, with
six of them having been conceived in England, one in France and one in the United States
(Amrine et al, 1983). These inventions related to spinning of yarn and the weaving of cloth.
This is because the principal export commodity of England at that time was cloth, which was in
short supply as a result of considerable expansion of England‘s colonial empire and its
commercial trade worldwide. Nigeria as a colony of Britain provided market for British
traditional industries, and as time went on, there was the need to start setting up some small
production facilities by British authorities. This was the watershed period of industrial
development in Nigeria, albeit on a small scale. Thus, the missionaries, expeditionists and
18
traders began to show interest in areas which had abundant raw materials including the Niger
Delta and Lagos that provided sea ports. This led to the evolution of modern industry in Nigeria.
According to Folayan and Adeogun (1995), evolution of modern industry in Nigeria started with
the beginning of trade between Britain and Nigeria as far back as 17th/18
th centuries. They
argued that the trade volume became substantial after the abolition of the obnoxious slave trade.
They added that for instance, importation of palm oil from Nigeria (Niger Delta) which was then
known as Oil Rivers to Liverpool in Britain rose from 150 tons in 1806 to 13,000 tons in 1839
and 30,000 tons in 1870. Major British trading companies were amalgamated to form the United
African Company (UAC) in 1879. The UAC started with a nominal capital of 250,000 British
Pounds Sterling shared among the four companies that were amalgamated. Gradually, the need
for the establishment of small production facility commenced first with margarine business and
later soap business in the early 1900.
Writing about industrial evolution in Nigeria, Aderinto, Akande, Anyanwuocha and Sani (1999)
discussed six major stages. These are traditional crafts industries, processing industries, import-
substitution industries, assembly industries, heavy manufacturing industries, export industries
and services. They were of the view that the traditional crafts industry was in existence before
colonisation by Europeans. Examples of traditional crafts include mat making, pottery, metal
work, cloth weaving, leather works and calabash carving. They saw the processing industry as
another type earliest form of modern industries to develop in Nigeria because they helped to
process agricultural and mineral products for export. These include cotton, gins, saw mills, and
palm oil processing companies. Import substitution industry came into being after Nigeria
gained independence from Britain. Import substitution industry was set up to produce goods that
19
were hitherto imported to conserve foreign exchange and improve the balance of payments of
Nigeria. These organisations include textile, detergent and soap-making factories, cement
companies and those in the production of soft drinks. In order to reduce the outflow of scarce
foreign exchange and promote development of indigenous technology, a number of organisations
were encouraged to engage in importation of components and assembled them locally.
Examples include car assembly plants, trucks and machinery, electronic and other equipment
factories. Gradually, heavy industries with special emphasis on production of intermediate and
capital goods started growing as a means of laying solid foundation for a sound economic
development. The last stage of industrial development is the emergence of organisations that
specialised in export business. This provided the basis for industry pattern and structure in
Nigeria.
On the basis of the Standard International Trade Classification (SITC), major industrial sectors in
Nigeria could be classified as shown in Table 1.1. The international trade classification is a form
of trade nomenclature. Otokiti (2003) was of the view that SITC is used for international
classification of all imports and exports operations of countries, regions and institutions. SITC,
he maintained, is used worldwide as basis for trade comparison and to calculate global business
volume. He added that SITC is divided into two major parts, which are (a) Import Section and
(b) Export Section. This position was supported by extracts from the Bureau of Statistics (BOS)
indices on trade classification.
Another similar classification of industries is that of the Nigerian Stock Exchange. This
classification is based on the number and categories of companies that were listed on the
Nigerian Stock Exchange Market. There are twenty-five active industrial sectors in Nigeria
20
which are listed in alphabetical order. According to Adejugbe (1979) in Olaloku, Fajana,
Tomori, Ukpong, Fapohunda, Umo, Ubogu and Adejugbe (1979), business ownership deals with
the forms of ownership as well as the identification of the owners of business in an economy. He
argued that the study of business ownership is important from the point of view of income
distribution, resource allocation and economic power which can be easily transformed into
political power. He added that the greater the concentration of ownership in a few hands or
units, the greater the influence of that group on output, employment and even wage rates. High
ownership concentration inhibits competition and this may adversely affect economic
performance and income distribution. Such skewed ownership is called various names in
Economics which include Monopoly, Oligopoly and Duopoly (Whitehead, 1978). Adejugbe
maintained that when such high ownership concentration is skewed in favour of foreigners, there
arise problems of divided loyalty between the national interest and foreign interest. He opined
that forms of business enterprises ownership in Nigeria are sole proprietorship, partnership,
private and public companies, government establishments, cooperatives and statutory
corporations. Business enterprises have peculiar characteristics which are noticeable in modern
organisations.
Amrine et al (1983) posited that there are certain characteristics of modern organisations that
contribute to performance. The first is Specialisation. They saw Specialisation as division of
work or effort which operates at both the worker and management levels. They argued that at
the worker level, there are those who work in trades requiring a great deal of skill, such as
machinists, tool and die makers, and welders. Such craftsmen, they maintained, become highly
skilled specialists. Other workers do special semi-skilled jobs. But both skilled and unskilled
specialists keep mass production assembly lines running continuously. They contended that the
21
result of Specialisation is usually lowered cost of production and improved quality. Both of these
factors will eventually lead to organisational performance, they posited.
The second factor they mentioned is Mechanisation. Mechanisation, they argued, started during
the Industrial Revolution. But today, mechanisation has been taken to a greater height and it has
become part of our ways of life. Some machines can do their work without human aid during the
process. This has led to the extensive use of numerical control to automation of an advanced
variety.
The third factor is increasing use of the technology of industrial engineering. By eliminating
waste and inefficiency, industrial engineers have made significant contributions to increasing
production and reducing costs which are required for organisations to perform and deliver
superior results, argued Amrine et al (1983).
The fourth factor is the use of computer and data processing equipment. Amrine et al (1983)
were of the view that no other recent development has had more impact on industry than the
widespread adoption and application of computers. Computers support the handling of enormous
amount of data and solving of complex problems at unimaginable speed.
The fifth factor is the use of scientific method which conforms to the following steps namely,
clearly state the problem; gather all facts pertaining to the problem; analyse the facts; synthesise
principles to be followed; arrive at solution to the problem; and test solution to prove or disprove
its adequacy (Amrine et al 1983). To encourage the development of modern organisations and
industrial growth, the Federal Government introduced the Industrial Policy Framework.
22
In order to encourage local production and establishment of industries, there are a number of
incentives put in place in Nigeria by the Federal Government. These incentives include pioneer
status, the industrial development income tax relief, local value added and investment in
economically disadvantaged areas, research and development concessions, among others.
The Pioneer Status is a tax incentive status for an initial period of three years, renewable for a
further period of two years. It is granted to industries that are regarded as high priority for
Nigeria‘s economic development. An investor using local raw materials is entitled to 30% tax
relief for five years. The locally sourced raw material contents are Agro 80%, Agro-Allied 70%,
Engineering 60%, Chemical 60% and Petro-chemical 70%.
The local value added tax concession also applies to engineering industries that use some
finished imported products as inputs. Such industries get 10% tax concession for five years to
encourage local fabrication rather than mere assemblage of completely knocked down parts.
Investors who embark on provision of basic infrastructure such as roads, water and electricity
where they do not exist will be entitled to 20% tax deduction of cost of providing such amenities.
For investing in economically disadvantaged areas, there is 100% tax holiday for seven years and
additional 5% depreciation allowance over and above capital depreciation. Organisations that
focus on research and development are offered concession ranging from 120% to 140% tax
deductible expenses on local raw materials. There are good concessions on repatriation of returns
on investment such as profit and capital, management fees and consultancy fee, all aiming at
improving the industrial climate of the country (IMC Switzerland, 2006).
23
2.1.2 Manufacturing Firms in Developing Economies
The manufacturing sector is often the darling of policy makers in less developed countries like
Nigeria. It is viewed as a veritable means of modernisation and skilled job creation as well as a
fundamental source of various positive spillovers. Accordingly, although many developing
economies have scaled back trade barriers over the past 20 years, the industrial sector remains
relatively protected in the typical country (Schiff and Alberto, 1992, Rafik, Kuwahar, Sarafino
Marchese and Renee, 1989; Francis, 1996). Governments also promote manufacturing with
special tax concessions and relatively low tariff rates for importers of manufacturing machinery
and equipment. At the same time, many observers believe that the maze of business regulations
is unusually dense and unpredictable in developing nations.
Moreover, within the manufacturing sector, it is also often argued that policies favour large firms
while inhibiting growth among small companies (Ian Little, 1987). In some cases, investment
incentives are available only to projects above a minimum scale and large-scale producers are
singled out for special subsidies. Anti-trust enforcement is typically weak, and special tax breaks
are sometimes granted to large, influential corporations (Gauthier and Gersovitz, 1997).
Even when policies do not explicitly favour large firms, these firms may enjoy de facto
advantages. Banks view them as relatively low risk and cheap to service (per unit of funds lent),
so they have preferential access to credit. This phenomenon is wide spread in developing
countries because private sector credit is relatively scarce there, information networks are poorly
developed, and binding interest controls are relatively common (Levine, 1997; Little, 1987;
Tybout, 1984). The distribution channels among these manufacturing firms- indigenous and
multinational especially equally differentiates them in performance.
24
A supply channel is composed of three structures. At one end of the channel is the manufacturer.
The manufacturer focuses on the development and production of products and originates the
distribution process. The terminal point in the channel is the retailer who sells goods and services
directly to the customer for their personal, non-business use. In between the two lies a process
called distribution, which is more difficult to define. One involved in the distribution process is
labeled a "distributor." The APICS Dictionary describes a distributor as "a business that does not
manufacture its own products but purchases and resells these products. Such a business usually
maintains a finished goods inventory." The proliferation of alternative distribution forms, such as
warehouse clubs, catalog sales, marketing channel specialists and mail order have blurred
functional distinctions and increased the difficulty of defining both the distribution process and
the term ―distributor‖.
One could ultimately argue that distributors include all enterprises that sell products to retailers
and other merchants—and/or to industrial, institutional and commercial users—but do not sell in
significant amounts to the ultimate customer. According to this definition, most companies that
are involved with the disbursement of raw materials and finished products belong, in one sense
or another, to the distribution industry. By adopting this definition, distribution is expanded to
cover nearly every form of materials management and physical distribution activity performed
by channel constituents, except for the processes of manufacturing and retailing.
A Distribution Manager must find a better way to stay in touch with customer and distributor
stock levels, orders, forecasts, and deliveries as well as liaise with transport providers, the sales
teams and production management to agreed priorities. Being at the top of multiple distribution
levels also means that the company's success depends on the success of other firms. Thus,
finding, training and motivating the right partners is a vital success factor. Literally, excellent
25
companies with great products can be shut out of a market if the appropriate distribution
relationships are not put in place. This is a good place to look if sales revenues for a good
manufacturer are more sluggish than the market indicates.
To make distribution systems work appropriately, the manufacturer must implement excellent
management practices of these customer distribution networks. The first step is to ensure the
existence of excellent communications. Manufacturing companies that employ a multi-tier
distribution system are literally setting up partnerships with their partners to move products
through the system. Therefore, the entire system will only be able to operate as effectively as its
weakest link. Because of this, all players must proceed from the same perspective and work for a
similar goal. This is easier said than done since independent companies will have individual
objectives. Since the manufacturer is often at the top of the distribution chain, it plays a critical
role in implementing a comprehensive distribution communication strategy.
Maintaining the flow of money in the distribution system provides proper financial motivation to
all participating companies. This means understanding the profit incentives, investments required
and ROI (of both time and money) for each company in the distribution process.
Cost accounting is another key to the marketing success of manufacturing firms. Having a solid
understanding of product costs plays a vital role in establishing pricing systems. Given that
manufacturing costs drive wholesale prices, which consequently drive other distribution prices,
slight variances in the calculation of product costs can have a dramatic, leveraged impact on the
final cost to the consumer.
This also has a huge impact on the marketing strategies employed by the company.
Manufacturing costs will also combine with other positioning/imaging aspects of the finished
26
product and will have impact on strategic decisions. For instance, if costs are calculated too high,
it may be necessary to implement a positioning strategy based on "high end" marketing
approaches. Thus, the importance of proper information is critical. Quality management in a
manufacturing firm also has a huge impact on marketing. Ultimately, the customer makes the
critical decisions based on the perceptions of quality. Because of this, the quality parameters
used by the company must match the customer‘s perspectives.
The place of quality in an organization also has an impact on the marketing approach the
company will take. Quality objectives within the company should not operate in a vacuum, but in
careful conjunction with marketing and customers. Quality departments should base key
parameters around market feedback. Marketing and manufacturing departments will also interact
closely on the product line. An important aspect of this concept is found in SKU (stock keeping
unit) management. Sales departments typically want to offer a large number of SKUs to meet the
custom needs of customers. Manufacturers tend to want to produce a smaller number of SKUs to
gain economies of scale, which results in larger, more homogeneous production runs.
Proper balance is essential. Product lines and SKUs should be broad enough to gain market
penetration, yet narrow enough for product efficiencies to be realised. Obviously this can be a
delicate balancing act, which will probably require some give and take on both sides.
A final issue to consider is the rate of growth for sales and marketing in relation to the ability to
grow production capacity. In an ideal world, the ability to sell would grow at exactly the same
rate as the ability to produce. In reality, this rarely happens. If production capabilities grow faster
than sales and marketing, then excess inventories will occur, which can create a significant
financial problem. On the other hand, if sales and marketing capacity grows faster than the
company's ability to manufacture, then the product would be out of stock on a regular basis. This
27
is a disastrous situation that results in unhappy and lost customers and a major loss in marketing
momentum. The importance of balancing manufacturing growth and marketing growth is a
constant and ongoing process of adjustments in a manufacturing company. Of course, these
marketing and business development issues will surface in the financial statements of the
company. In many cases, certain marketing challenges may not even be identified until
aberrations appear in the numbers.
All these may depend on the size of the firm and whether the firm is indigenous or multinational.
Traditionally it has been argued that the industrial relations practices of multinational
corporations tended to conform with the prevailing industrial relations practices of the host
country. Recent arguments claim that this trend has now been reversed. The new orthodoxy
prevails which originates in the multinational corporation's country of origin. This will have
differential effects on distribution strategies and performance of indigenous or multinational.
A firm must purchase all the necessary inputs and then transform them into the product (outputs)
that it wishes to sell. How well organised a firm is at undertaking this transformation process will
determine its success. This is known as the productive efficiency of a firm and it will want to be
as efficient as possible in transforming its inputs into outputs (i.e. using the minimum number of
inputs as possible to achieve a set amount of output). This will reduce the cost per unit of
production and allow the firm to sell at a lower price.
28
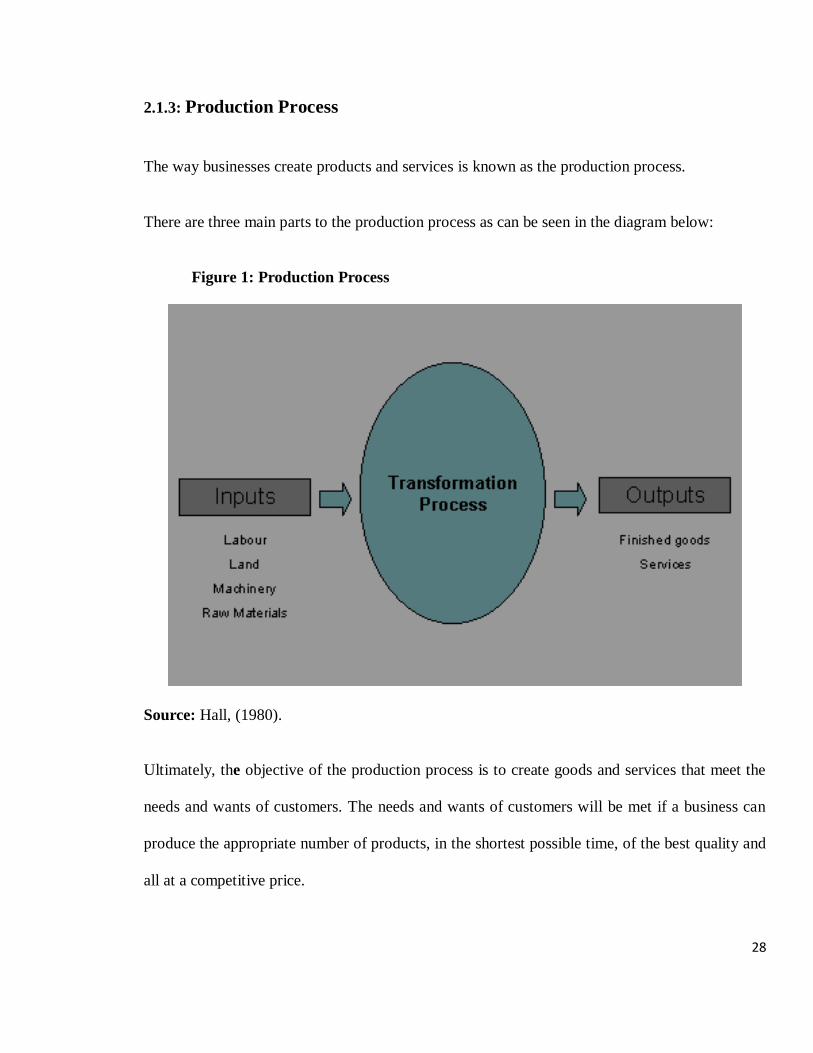
2.1.3: Production Process
The way businesses create products and services is known as the production process.
There are three main parts to the production process as can be seen in the diagram below:
Figure 1: Production Process
Source: Hall, (1980).
Ultimately, the objective of the production process is to create goods and services that meet the
needs and wants of customers. The needs and wants of customers will be met if a business can
produce the appropriate number of products, in the shortest possible time, of the best quality and
all at a competitive price.
29
2.1.4: Production Technology
Ilori (2000) defined technology as an all prevailing phenomenon which concerned everybody
because it is basically the interaction of science and society. It has elements of natural
endowment, culture, environment, knowledge and resourcefulness, politics, etc. As a result,
technology is not a commodity that can be simply bought and used once the funds are available.
Woodward (1965) viewed technology as a mediating variable between an organisation and its
environment. The market environment of an organisation determines what types of technology
are feasible, and these in turn constrain organisational structure and process. Technology choice
has critical implications for growth and productivity in industry. The use of technology is always
tied to an objective. Because various kinds of technologies can be used to achieve an
organisation's objectives, the issue of choice arises. The concept of technology choice assumes
access to information on alternative technologies and the ability to evaluate these effectively.
Moustafa (1990) asserted that effective choice is based on preselected criteria for a technology's
meeting specified needs. Furthermore, it depends on the ability to identify and recognise
opportunities in different technologies. The expected outcome is that the firm will select the most
suitable or "appropriate" technology (AT) in its circumstances.
The concept of AT has been a subject of debate for many years. Stewart (1987) contrasted two
general views. First, welfare economics defined AT as a set of techniques for making optimum
use of available resources in a given environment. Second, social scientists and those working in
AT institutions associated AT with a specific set of characteristics. According to Stewart, the
characteristics defining AT normally included "more labour-using, less capital-using, less skill-
using, making more use of local materials and resources, and smaller in scale."
30
It is also sometimes emphasised that AT should not affect the environment negatively and that it
should fit in with the socioeconomic structures of the community. The suggested characteristics
are too numerous, which implies that a technology can be appropriate in some ways and
inappropriate in others. Kaplinsky examined the trade-offs involved in the choice of technology
and found that mechanised production can, at times, turn out an inexpensive, higher quality
product for consumers, whereas normal production of a lower quality and higher cost product
generates more employment (ATI 1987). This illustrates the dilemma involved in evaluating
technology and raises the question: Appropriate for whom?
Entrepreneurs decide at the enterprise level which technologies to use. The main factors
influencing their choice of technology include the objectives of the firm, the resources available,
the nature of the market, and their knowledge of available technologies (Stewart 1987).
Moreover, the entrepreneur needs technical and managerial skills to choose, adapt and
effectively use technology.
Additionally, one would be in a better position to choose a technology if one were able to assess
the demand for the firm's products, estimate the rate of change in the market that may call for
change in technology, gather information about alternative technologies, and estimate the
potential return on investment for each alternative. However, many entrepreneurs in indigenous
firms lack the education, training, management experience and other competencies needed to
respond to these issues. Because of their economic and organisational characteristics, many
indigenous firms lack information about technologies and have no way of gauging the
appropriateness of those they are aware of (Neck and Nelson 1987). This contradicts what
obtains in multinational corporations.
31
Macro policies also affect technology choice at the firm level through the overall socioeconomic,
political and legal forces. It has been suggested that general socioeconomic environment,
industry-specific regulations, taxes, subsidies, trade and financing policies, science and
technology research and dissemination policies tend to favour large-scale enterprises (ATI 1987).
The effective deployment of technology has been associated with industrial competitiveness,
productivity and efficiency, economic development, business growth and business flexibility,
quality, the maintenance of high-wage jobs and the support of rounds of innovation. In other
words, Science and Technology (S&T) are the cardinal factors in determining the quality of life
of a people and the overall status of their country.
The trend in advanced countries today is towards the use of advanced technologies to promote
rapid industrialisation. Developing countries on the other hand, see more urgency in the need to
improve on rural indigenous technologies which will increase employment, provide food for the
growing populations, and ultimately improve standards of living. Nevertheless, there are times
when a developing country would choose to employ an advanced technology because it is
considered progressive. This has led many developing countries to buying brand new high
technology equipment regardless of operational and maintenance costs and where it would be
employed. They never bothered whether the manufacturers of such complex equipment could
supply them in simpler units that would allow the user to upgrade in complexity as they mastered
the system. As a result, such developing countries have often in the end found themselves
embarrassed owners of shiploads of high technology junks for which neither the seller nor buyer
would want to take the blame.
32
Developing countries like Nigeria should stick to ―bread and butter‖ technologies. Faced with
rising unemployment, they should give priority to projects that maximise the use of local
materials and labour. This, however, should not discourage the deployment of advanced
technology where it is appropriate, thus buttressing the need for rural and intermediate level
technologies to exist alongside each other.
Advanced technology is often necessary for use on a different tier, for example, in
communications and recreation. These are technologies that would improve vital infrastructure
and thereby increase the possibility of export earning or local production of erstwhile imported
raw materials. These objectives are most often the core of any worthwhile technology transfer
programme. The case of new and emerging technology such as new materials sciences and
technology, genetic engineering, micro-electronics, molecular biology, remote sensing, optic
fibres, polymer science, and biotechnology, raises some very complex but fundamental issues
with regards to their precise implications for S&T development in developing countries. There
are those who argue that because countries like Nigeria are largely rural, practically all her S&T
efforts for now should be directed towards upgrading rural technologies, and providing such
other S&T applications and innovations as would help raise the standard of living and
productivity of rural communities. They believe that any consideration of the frontier
technologies at this stage is premature if not irrelevant, with the possible exception of
biotechnology.
While the need to upgrade rural technologies and rural economies has been established as a
major developmental imperative in Nigeria today, the fact of the matter is that we live in an
interdependent world which, at the moment is lopsided in favour of the developed countries.
33
Therefore, in order to reduce the country‘s over-dependence which is exacerbated by these
advanced technologies, there is the need to determine with reasonable clarity the kind of
response Nigeria should make to these technologies, including the kinds of capabilities to
develop in them at this stage. Ilori (2000) suggested that apart from bio-technology, Nigeria
should also embrace micro-electronics and raw materials technologies. Micro-electronics has
found such increasing wide applications that are currently transforming the capabilities of human
society. Micro-electronics is being used in areas such as communications, educational
instructions, agriculture, computer-aided design and manufacturing, data processing and
scientific R&D. Therefore, it is necessary that Nigerian scientists develop capabilities for
evaluating, selecting, assembling, testing, maintaining and repairing imported micro-electronics-
based technologies, he concluded.
Similarly, in view of the great need in Nigeria for all sorts of materials and having regard to
advances in materials research which make the country‘s reliance on export of conventional raw
materials precarious, there is a great need to build a capacity for advanced research in materials
S&T which will enable the proper exploitation of Nigeria‘s material resources. This will add
very high value to these raw materials to satisfy both local and foreign markets. However, this is
only possible by training people at the universities and in postgraduate research institutions in
modern material science as well as in new methods of testing and standardisation in order to
provide solutions to problems posed by the materials industry. Therefore, there is a need for a
national R&D project in material science and technology with linkages to industry, Ilori (2000)
summarised.
34
2.1.5 Organizational Structure in the Twentieth Century
Understanding the historical context from which some of today's organisational structures
developed helps to explain why some structures are the way they are. From Figure 4 in Section
2.1.19 of this thesis, there seems to exist a very strong relationship between entrepreneurship and
distribution on one hand and innovative distribution strategy on the other, which results in
creativity and innovation globally today. For instance, why are the old, but still operational steel
mills such as U.S. Steel and Bethlehem Steel structured using vertical hierarchies? Why are
newer steel mini-mills such as Chaparral Steel structured horizontally, capitalising on the
innovativeness of their employees? One of the reasons, as this section argues, is that
organisational structure has a certain inertia—the idea borrowed from physics and chemistry that
something in motion tends to continue on that same path. Changing an organisation's structure is
a daunting managerial task, and the immensity of such a project is at least partly responsible for
why organisational structures change infrequently.
At the beginning of the Twentieth Century the United States (U.S.) business sector was thriving.
Industry was shifting from job-shop manufacturing to mass production, and thinkers like
Frederick Taylor in the U.S. and Henri Fayol in France studied the new systems and developed
principles to determine how to structure organisations for the greatest efficiency and
productivity, which in their view was very much like a machine. Even before this, German
sociologist and engineer, Max Weber, had concluded that when societies embrace capitalism,
bureaucracy is the inevitable result. Yet, because his writings were not translated into English
until 1949, Weber's work had little influence on American management practice until the middle
of the Twentieth Century.
35
Management thought during this period was influenced by Weber's ideas of bureaucracy, where
power is ascribed to positions rather than to the individuals holding those positions. It was also
influenced by Taylor's scientific management, or the "one best way" to accomplish a task using
scientifically-determined studies of time and motion. Also influential were Fayol's ideas of
invoking unity within the chain-of-command, authority, discipline, task specialisation, and other
aspects of organisational power and job separation. This created the context for vertically-
structured organisations characterised by distinct job classifications and top-down authority
structures, or what became known as the traditional or classical organisational structure.
Job specialisation, a hierarchical reporting structure through a tightly-knit chain-of-command,
and the subordination of individual interests to the super ordinate goals of the organisation
combined to result in organisations arranged by functional departments with order and discipline
maintained by rules, regulations and standard operating procedures. This classical view or
bureaucratic structure of organisations was the dominant pattern as small organisations grew
increasingly larger during the economic boom that occurred from the 1900s until the Great
Depression of the 1930s. Henry Ford's plants were typical of this organisational structure
growth, as the emerging Ford Motor Company grew into the largest U.S. automaker by the
1920s.
The Great Depression temporarily stifled U.S. economic growth, but organisations that survived
emerged with their vertically-oriented bureaucratic structures intact as public attention shifted to
World War II. Post-war rebuilding reignited economic growth, powering organisations that
survived the Great Depression toward increasing in size in terms of sales revenue, employees,
and geographic dispersion. Along with increasing growth, however, came increasing complexity.
Problems in U.S. business structures became apparent and new ideas began to appear. Studies of
36
employee motivation raised questions about the traditional model. The "one best way" to do a
job gradually disappeared as the dominant logic. It was replaced by concerns that traditional
organisational structures might prevent, rather than help, promote creativity and innovation—
both of which were necessary as the century wore on and pressures to compete globally
mounted.
2.1.6 Emerging Trends in Organisational Structure
Section 2.1.20 of this study focuses on stages of the innovation – decision process in modern
organisational structures. However, a look at emerging trends in organisational structure would
explicate their focus today globally (Fajana, 1990). Except for the matrix organisation, all the
structures described above focus on vertical organisation, that is, who reports to whom, who has
responsibility and authority for what parts of the organisation, and so on. Vertical integration is
sometimes necessary but it may be a hindrance in a rapidly changing environment. A detailed
organisational chart of a large corporation structured on the traditional model would show many
layers of managers. Decision making flows vertically up and down the layers, but mostly
downward. In general terms, this is an issue of interdependence.
In any organisation, the different people and functions do not operate completely independently.
To a greater or lesser degree, all parts of the organisation need each other. Important
developments in organisational design in the last few decades of the Twentieth Century and the
early part of the Twenty-first Century included attempts to understand the nature of
interdependence and improve the functioning of organisations in respect to this factor. One
approach is to flatten the organization, develop the horizontal connections and de-emphasize
vertical reporting relationships. At times, this involves simply eliminating layers of middle
37
management. For example, some Japanese companies—even very large manufacturing firms—
have only four levels of management: top management, plant management, department
management, and section management. Some U.S. companies also have drastically reduced the
number of managers as part of a downsizing strategy, not just to reduce salary expense, but also
to streamline the organisation in order to improve communication and decision making.
In a virtual sense, technology is another means of flattening the organisation. The use of
computer networks and software designed to facilitate group work within an organisation can
speed communications and decision making. Even more effective is the use of intranets to make
company information readily accessible throughout the organisation. The rapid rise of such
technology has made virtual and boundaries organisations possible, where managers,
technicians, suppliers, distributors and customers connect digitally rather than physically.
A different perspective on the issue of interdependence can be seen by comparing the organic
model of organisation with the mechanistic model. The traditional, mechanistic structure is
characterised as highly complex because of its emphasis on job specialisation, highly formalised
emphasis on definite procedures and protocols, and centralised authority and accountability. Yet,
despite the advantages of coordination that these structures present, they may hinder tasks that
are interdependent. In contrast, the organic model of organisation is relatively simple because it
de-emphasises job specialisation, is relatively informal and decentralises authority. Decision-
making and goal-setting processes are shared at all levels, and communication ideally flows
more freely throughout the organisation.
A common way that modern business organisations move toward the organic model is by the
implementation of various kinds of teams. Some organisations establish self-directed work teams
as the basic production group. Examples include production cells in a manufacturing firm or
38
customer service teams in an insurance company. At other organisational levels, cross-functional
teams may be established, either on an ad hoc basis (e.g., for problem solving) or on a permanent
basis as the regular means of conducting the organisation's work. Aid Association for Lutherans
is a large insurance organisation that has adopted the self-directed work team approach. Part of
the impetus toward the organic model is the belief that this kind of structure is more effective for
employee motivation. Various studies have suggested that steps such as expanding the scope of
jobs, involving workers in problem solving and planning, and fostering open communications
bring greater job satisfaction and better performance.
Saturn Corporation, a subsidiary of General Motors (GM), emphasises horizontal organisation. It
was started with a "clean sheet of paper," with the intention to learn and incorporate the best in
business practices in order to be a successful U.S. auto manufacturer. The organisational
structure it adopted has been described as a set of nested circles, rather than a pyramid. At the
center is the self-directed production cell, called a Work Unit. These teams make most, if not all,
decisions that affect only team members. Several of such teams make up a wider circle called a
Work Unit Module. Representatives from each team form the decision circle of the module,
which makes decisions affecting more than one team or other modules. A number of modules
form a Business Team, of which there are three in manufacturing. Leaders from the modules
form the decision circle of the Business Team. Representatives of each Business Team form the
Manufacturing Action Council, which oversees manufacturing. At all levels, decision making is
done on a consensus basis, at least in theory. The president of Saturn, finally, reports to GM
headquarters.
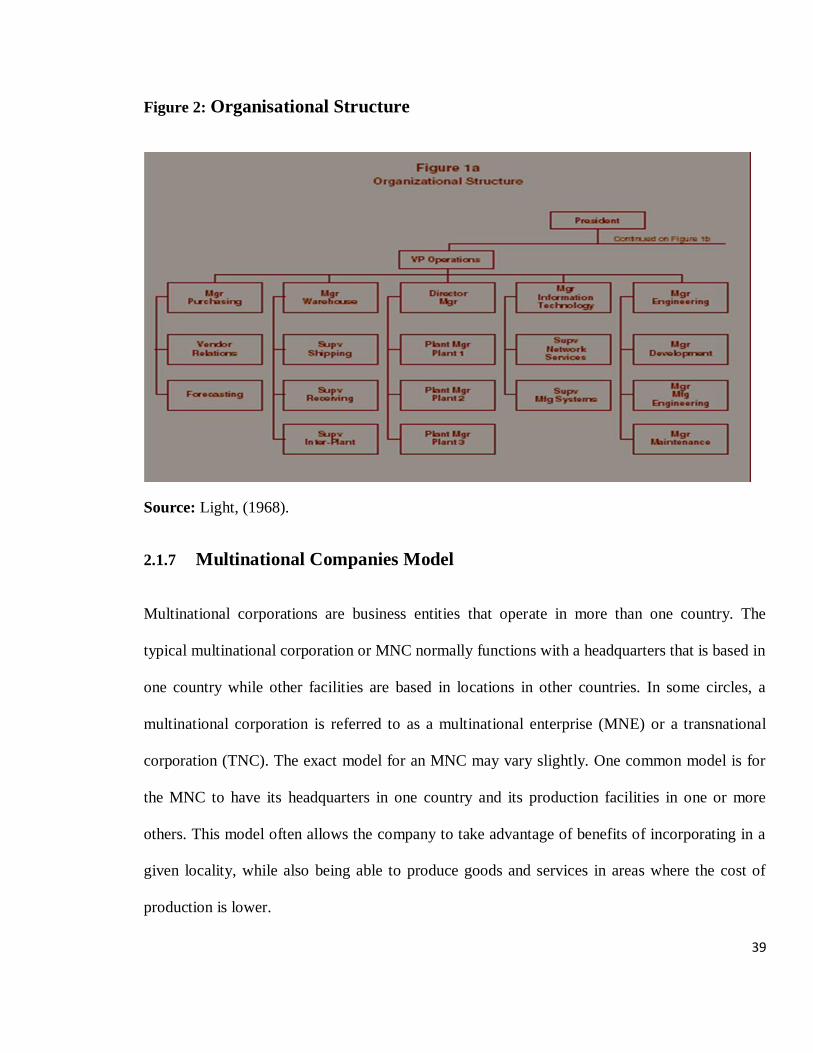
39
Figure 2: Organisational Structure
Source: Light, (1968).
2.1.7 Multinational Companies Model
Multinational corporations are business entities that operate in more than one country. The
typical multinational corporation or MNC normally functions with a headquarters that is based in
one country while other facilities are based in locations in other countries. In some circles, a
multinational corporation is referred to as a multinational enterprise (MNE) or a transnational
corporation (TNC). The exact model for an MNC may vary slightly. One common model is for
the MNC to have its headquarters in one country and its production facilities in one or more
others. This model often allows the company to take advantage of benefits of incorporating in a
given locality, while also being able to produce goods and services in areas where the cost of
production is lower.
40
MNCs account for 40% of the world‘s manufacturing output and almost a quarter of the world
trade. About 85% of global automobiles, 70% of computer, 35% of toothpaste and 65% of soft
drinks are produced and marketed by MNCs (Bartlett et al, 2003). However, most of the MNCs
have come up in recent times of change and globalisation. It is evident in the changed definition
of MNC i.e. till 1973 the United Nations defined MNC as an enterprise which controls assets,
factories, mines, sales offices and the like in two or more countries (Bartlett et al, 2003).
However, the scope of what the term ―Multinational Corporation‖ covers has changed and
required two crucial qualifications. The first qualification requires an MNC to have substantial
direct investment in foreign counties and not just an export business. The second requisite for a
true MNC would be a company engaged in the active management of these offshore assets rather
than simply holding them in a passive financial portfolio (Bartlett et al, 2003).
One of the most important motivations for companies to expand their operation internationally is
the low-cost factors of production in developing countries like China and India
(Papers4you.com, 2006). This has had a tremendous influence on the economies of the
developing countries, acting as a catalyst in their growth process. However, entering a new
market in a different nation is not as easy as it sounds, with factors like local culture and local
market knowledge obstacles to contend with. There are various models which a company can
adopt to enter the market. One of such is the Uppsala model, which suggests that a company
should make an initial commitment of resources to the foreign market through which it gains the
local market know-how on the basis of which further evaluations can be made (Bartlett et al,
2003). However, there are many companies who do not follow this model and take a shortcut to
building the market knowledge by investing in or acquiring a local partner for instance Wal-Mart
41
entered the United Kingdom (UK) by buying the supermarket chain Asda (Papers4you.com,
2006).
However, in recent times most companies have recognised the need to be responsive to local
markets and political needs, hence the management styles being adopted by multinationals are
gradually shifting towards a trans-national strategy of ‗Think global, act local‘.
2.1.8 Organisation‟s Strategy
All organisations benefit from committing themselves to a strategy that facilitates the value that
they intend to produce, the means it would rely on to produce that value and how it would
sustain itself in the future. The most well-developed and commonly used models for developing
organisational strategies come from the private sector. Broadly speaking, an organisation‘s
strategy is defined as ―the basic characteristics of the match the organisation achieves with its
environment‖ (Hofer and Schendel, 1978, p.4). It is useful to differentiate between three major
levels of organisational strategy: (1) corporate strategy, which is concerned primarily with the
determination of the domain in which an organisation chooses to do business; (2) business
strategy, which focuses on how to compete in a particular industry segment; and (3) functional
area strategy, which focuses on how to use resources in a particular functional area. From the
above, it can be opined that performance and sales turnover, high profitability and return on
investment of manufacturing companies are directly related to organisational strategies along
defined channels of innovative teams, process and management of physical distribution of
products and services.
42
Organisational structure refers to the way an organisation arranges people and allocates jobs so
that its work can be performed and its goals met. When a work group is very small and face-to-
face communication is frequent, formal structure may be unnecessary, but in a larger
organisation decisions have to be made about the delegation of various tasks. Thus, procedures
are established that assign responsibilities for various functions. It is these decisions that
determine the organisational structure.
In an organisation of any size or complexity, employees' responsibilities typically are defined by
what they do, who they report to, and for managers, who reports to them. Over time, these are
assigned to positions in the organisation rather than to specific individuals. The relationships
among these positions are illustrated graphically in an organisational chart. The best
organisational structure for any organisation depends on many factors, including the work it
does; its size in terms of employees, revenue, and geographic dispersion of its facilities; and the
range of its businesses i.e. the degree to which it is diversified across markets.
There are multiple structural variations that organisations can take on, but there are a few basic
principles that apply and a small number of common patterns. The following sections explain
these patterns and provide the historical context from which some of them arose. The first
section addresses organisational structure in the Twentieth Century. The second section provides
additional details on traditional, vertically-arranged organisational structures. This is followed by
descriptions of several alternate organisational structures including those arranged by product,
function, and geographical or product markets. Next is a discussion of combination structures, or
matrix organisations. The discussion concludes by addressing emerging and potential future
organisational structures.
43
Creating an effective organisational structure is one of the most important tasks for top managers
of any company. If everyone in a company is in place and knows his duties, if there are rules of
interaction between departments, company's activities will remind a tuned mechanism which
works with maximum results and minimal costs. Organisational structure is a scheme consisting
of units and individual officers of the company, located by levels of importance and
responsibility, which spells out the relationship between them and the chain of command.
Depending on the stage of company development (formation, development, stabilisation, crisis)
require different approaches to build the organisational structure. It is particularly important to
control the situation in transition from one stage to another and at the stage of active growth and
development of the company. A competently built organisational structure optimises the strength
and number of units, simplifies interaction between units, distributes evenly the pressure on staff
to avoid duplication of in order to and to eliminate double and triple subordination, and delimits
the scope of leaders, defines their powers and area of responsibility to increase productivity.
2.1.9 Multinational Organisation‟s Strategy
Organisational structure is the basis for building an effective system of management. Large
multinational corporations require an organisational structure that can house the usual business
functions - finance, marketing, R&D, production, etc. - as well as those functions required for
success beyond the domestic market. The most appropriate organisational structure will be
determined by the overall global strategy of the firm, the relative size of international operations
as compared to domestic operations, and the characteristics of the marketplace in which the firm
competes. The four basic organisational structures are: International Division, Global Area,
Global Product Division and Matrix.
44
The need for new approaches to governance became clear. This occurred because of the sharp
increase in the size of enterprises, the diversification of their activities (multidisciplinary) and the
complication of processes in a dynamically changing environment. In this connection,
international divisional structure which began to emerge, especially in large corporations had to
provide some autonomy to their production units, leaving to their leadership strategy
development, scientific research, financial and investment policies, etc. This type of structure
attempts to combine centralised coordination and control of decentralised administration activity.
A leading company in the soft drinks industry, and a multinational firm, the Coca-Cola
Company, operates with the International Division organisational structure.
International Division Structure represents a more evolved form of organisational system
because of the incorporation of specialised division to act on foreign markets, and that way it is
no limit to export. We can observe that they are more concerned about conducting business in
other countries. The key management figures in an organisation with divisional structure are not
the heads of functional units, but the managers leading the production department (division). The
organisation by division, as a rule, is based on one of these criteria: production (product or
service) - product specialisation; targeting specific groups of consumers - consumer
specialisation of serviced territory - a regional specialty.
The main features of this type of structure are:
typically set up when firms initially expand abroad, often when engaging in a home
replication strategy;
45
foreign subsidiary managers in the international division are not given sufficient voice
relative to the heads of domestic divisions;
the ―silo‖ effect: International division activities are not coordinated with the rest of the
firm, which focuses on domestic activities; and
firms often phase out this structure after their initial overseas expansion.
The main advantages of International Division Structure are:
It manages a diversified enterprise with hundreds of thousands and geographically remote
units;
It provides greater flexibility and quicker response to changes in the environment of
enterprise;
Expanding the companies‘ borders, separate offices become "profit centers" actively
working on improving the efficiency and quality of production; and
closer connection between production and consumers.
The disadvantages of divisional structure are:
A large number of levels managing by vertically, between workers and the managers of
production units - 3 or more levels; between workers and company management - 5 or
more;
Large distance between the office staff structure from the headquarters of the company;
46
The key relationships are vertical, and therefore create common problems for hierarchical
structures - delays, congestion managers, poor cooperation in addressing issues related to
the units, etc.;
Duplication of functions at different "levels" and consequent high cost of maintaining the
management structure;
Offices tend to remain in the linear management structure, with all their shortcomings.
In conclusion, the advantage of divisional structure outweighs its shortcomings only in periods of
fairly stable existence. With an unstable environment, it risks the fate of the dinosaurs. With this
structure, they may embody most of the ideas of the contemporary quality philosophy. Another
example of multinational company structure is the European Aeronautic Defense and Space
Company. This company supports a global strategy in treating each product division as a stand-
alone entity with full worldwide— as opposed to domestic—responsibilities for its activities and
is called the Global Product Division Structure. It facilitates the global planning and strategy for
the product, but is much less responsive to the local conditions and differences in consumer
behaviour and tastes.
The main advantages of this type of structure are:
Single chain of communication for information about product and technology for division
on each level;
Related production and marketing resources are entirely devoted to products offered by
each division, thus determine excellent production and selling results for each local
market;
47
Possibility for each division to develop independently of international economic
activities;
The disadvantages of Global Product Division Structure are:
Local autonomy is very limited and the local subsidiaries are treated as cost centers as
opposed to profit centers;
Communication and coordination difficulties between divisions, which can cause loss of
opportunities of cooperation on the foreign market;
In conclusion, an effective organisational structure would facilitate working relationships
between various entities in the organisation and may improve the working efficiency within the
organisational units. Organisation operating with this structure retain a set order and control to
enable monitoring of the processes. They would support command for coping with a mix of
orders and a change of conditions while performing work. They would also allow application of
individual skills to enable high flexibility and apply creativity. When a business expands, the
chain of command will lengthen and the spans of control will widen. When an organisation
comes of age, the flexibility will decrease and the creativity will fatigue. Therefore,
organisational structures should be altered from time to time to enable recovery. If such
alteration is prevented internally, the final escape is to shut down the organisation to prepare for
a re-launch in an entirely new set up.
2.1.10 Product Distribution
Most producers use intermediaries to bring their products to the market. They try to develop a
distribution channel to do this. A distribution channel is a set of interdependent organisations that
48
help make a product available for use or consumption by the consumer or business user. Channel
intermediaries are firms or individuals such as wholesalers, agents, brokers, or retailers who help
move a product from the producer to the consumer or business user. A company‘s channel
decisions directly affect every other marketing decision. Place decisions, for example, affect
pricing. Marketers who distribute products through mass merchandisers such as Wal-Mart will
have different pricing objectives and strategies than those who sell to specialty stores.
Distribution decisions can sometimes give a product a distinct position in the market. The choice
of retailers and other intermediaries is strongly tied to the product itself. Manufacturers select
mass merchandisers to sell mid-price-range products while they distribute top-of-the-line
products through high-end department and specialty stores. The firm‘s sales force and
communications decisions depend on how much persuasion, training, motivation and support its
channel partners need. Whether a company develops or acquires certain new products may
depend on how well those products fit the capabilities of its channel members. Some companies
pay too little attention to their distribution channels. Others, such as FedEx, Dell Computer, and
Charles Schwab have used imaginative distribution systems to gain a competitive advantage.
2.1.11 Distribution Channels
A distribution channel is a set of interdependent organizations that help make a product available
for use or consumption by the consumer or business user. Armstrong and Kotler (2003) defined
distribution channel as a set of inter-dependent organisations involved in the process of making a
product or service available for use or consumption by the consumer or business buyer. In most
contemporary markets, mass production and consumption have lured intermediaries into the
49
junction between buyer and seller. Intermediaries provide economies of distribution by
increasing the efficiency of the process.
Researchers have credited distribution channels with the following roles: information gathering
and distribution of marketing research and intelligence information (Sawhney, 2000); promotion
(Jantan et al. 2003); contact or prospecting (Sawhney, 2000); matching (Kearney, 2000a);
negotiation (Ndubisi et al. 2003); physical distribution (Sawhney, 2000; Kearney, 2000a);
financing (Jantan et al. 2003); and risk-taking (Ndubisi et al. 2003; Kearney, 2000a;). Bagozzi et
al., (1998) categorises the distribution functions into three: functions for customers; functions for
producers; and functions for both customers and producers. Two forces underlie the need for
intermediaries: the discrepancy of quantity (i.e. differences between the quantity typically
demanded by customers and the quantity that can be produced economically by manufacturers)
and the discrepancy of assortment (differences between the varieties of products typically
demanded and economically produce-able varieties (Bagozzi et al., 1998). Middlemen fill these
needs by carrying out transactional, physical and facilitating roles.
Channel intermediaries are firms or individuals such as wholesalers, agents, brokers or retailers
who help move a product from the producer to the consumer or business user. In this review two
types of channels are identified- for consumer goods and organisational goods.
The existence of distribution channels has helped to make society more efficient in resource
allocation. Most producers use intermediaries both to acquire raw materials for production and to
bring their products to market. They try to forge distribution channel to facilitate the process of
making a product or service available for use or consumption by the consumer or business user
50
(Stern, El-Ansary & Coughlin, 1996). Bagozzi et al., (1998) assert that intermediaries create
savings, which becomes more dramatic as the number of producer-consumers increases.
Armstrong and Kotler (2003) pointed out that intermediaries play an important role in matching
supply and demand, while Waxman (2000) argued that by servicing the thousands of indirect
partners who were the customers, midrange distribution added true value.
The distribution channel of consumer goods is further sub-divided into four channels. These are:
(i) Channel A: In this channel there are no intermediaries. This channel is called direct
marketing.
(ii) Channel B: In this channel goods move from producers to retailers to consumers.
(iii) Channel C: This is the most common. In this channel the producer sells to wholesalers, who
sell to retailers who in turn sell to consumers.
(iv) Channel D: This is the most indirect channel. Goods pass from producers to agents, then to
wholesalers to retailers and then to customers. Agents coordinate a large supply of goods when
there are many small manufacturers and retailers. Small manufacturers lack the capital for their
own sales force and thus use agents to serve as independent sales teams.
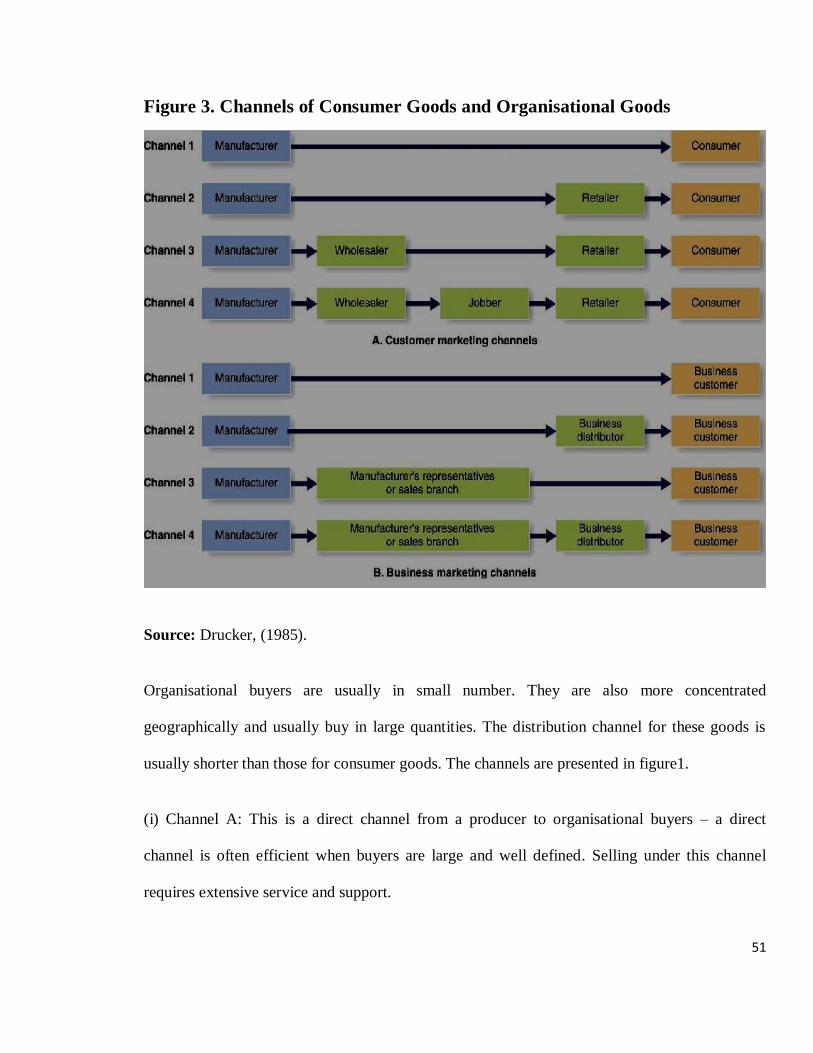
51
Figure 3. Channels of Consumer Goods and Organisational Goods
Source: Drucker, (1985).
Organisational buyers are usually in small number. They are also more concentrated
geographically and usually buy in large quantities. The distribution channel for these goods is
usually shorter than those for consumer goods. The channels are presented in figure1.
(i) Channel A: This is a direct channel from a producer to organisational buyers – a direct
channel is often efficient when buyers are large and well defined. Selling under this channel
requires extensive service and support.
52
(ii) Channel B: Goods flow from producer to a distributor. Using a distributor is efficient for
producers of products targeted at a large number of organisations which buy in small quantities
e.g. software packages.
(iii) Channel C: The goods flow from the producer to agents instead of intermediaries. This
happens when the producer‘s marketing department is small, the producer wants to introduce a
new product or enter a new market.
(iv). Channel D: This brings together producers and organisational distributors. The agent seeks
a market for the producer‘s output and locates sources of supply for a buyer.
2.1.12 Structure of Distribution Channels
The structure of a channel depends on the members of that channel and the extent of their
relationship. These structures are:
(a) Traditional Distribution Channels
In this structure, all members of the channel enter into formal or informal agreements with one
another. The members provide top quality marketing which the customers finds the product easy
to purchase.
(b) Horizontal integration
This involves the organisation combining with other organisations at the same stage in the
distribution channel. Often this involves buying or merging with these organisations. This might
improve the organisation position in the market place but it might not improve distribution.
53
(c) Vertical Integration
This involves members at different levels of a distribution channel coordinating their efforts to
reach the desired market. This is called Vertical Channel Integration.
A vertical marketing system (VMS) is a centrally managed distribution channel that is designed
to achieve efficiency with maximum marketing impact.
(d) Franchising
This is a contractual distribution system in which a parent company gives franchisers the right to
operate the business according to the franchiser‘s marketing plan and to use its trademark. Apart
from the right to operate the business, the franchise receives marketing, management and
technical services. The advantage is that to the franchiser, there is a ready source of funds for
expansion coupled with the ability to establish policies for each franchise. For the franchisee,
there is greater name recognition, better prices from supplier, business advice e.t.c. The
disadvantage of this channel is that it is hard to find qualified franchisees, and even harder to
control the franchiser.
(e) Direct Marketing
This is using the direct channel of distribution. The usual approaches to direct marketing include
offering products through mail, by telephone, door to door e.t.c. Direct mail is not the most
efficient channel of distribution.
54
2.1.13 Functions of Distribution Channels
Distribution channels perform a number of functions that make possible the flow of goods from
the producer to the customer. These functions must be handled by someone in the channel.
Though the type of organisation which performs the different functions can vary from channel to
channel, the functions themselves cannot be eliminated. Channels provide time, place and
ownership utility. They make products available whenever, wherever and in the sizes and
quantities that customers want. Distribution channels provide a number of logistics or physical
distribution functions that increase the efficiency of the flow of goods from producer to
customer. Distribution channels create efficiencies by reducing the number of transactions
necessary for goods to flow from many different manufacturers to large numbers of customers.
This occurs in two ways. The first is called Breaking Bulk. Wholesalers and retailers purchase
large quantities of goods from manufacturers but sell only one or a few at a time to many
different customers. Second, channel intermediaries reduce the number of transactions by
creating assortments—providing a variety of products in one location—so that customers can
conveniently buy many different items from one seller at one time. Channels are efficient.
The transportation and storage of goods is another type of physical distribution function.
Retailers and other channel members move the goods from the production site to other locations
where they are held until they are wanted by customers. Channel intermediaries also perform a
number of facilitating functions that make the purchase process easier for customers and
manufacturers. Intermediaries often provide customer services such as offering credit to buyers
and accepting customer returns. Customer services are often times more important in B2B
markets in which customers purchase larger quantities of higher-priced products
55
Some wholesalers and retailers assist the manufacturer by providing repair and maintenance
service for products they handle. Channel members also perform risk-taking functions. If a
retailer buys a product from a manufacturer and does not sell, the retailer is ―stuck‖ with the item
and would lose money. And, channel members perform a variety of communication and
transaction functions. Wholesalers buy products to make them available for retailers and sell
products to other channel members. Retailers handle transactions with final consumers. Channel
members can provide two-way communication for manufacturers. They may supply the sales
force, advertising and other marketing communications necessary to inform consumers and
persuade them to buy. Channel members can be invaluable sources of information on consumer
complaints, changing tastes and new competitors in the market.
2.1.14 Physical Distribution Management
Physical Distribution Management (PDM) is concerned with ensuring that the product is in the
right place at the right time. ‗Place‘ has always been thought of as being the least dynamic of the
‗4Ps‘. Marketing practitioners and academics have tended to concentrate on the more
conspicuous aspects of marketing. It is now recognised that PDM is a critical area of overall
marketing management. Marketing management realised that distribution could be organised in a
scientific way so the concept of business logistics developed, focusing attention on and
increasing the importance of PDM.
As marketing analysis became increasingly sophisticated, managers became more aware of the
costs of physical distribution. The primary aim of business is to provide customer satisfaction in
a manner that creates profit for the company. Business logistical techniques can be applied to
PDM so that costs and customer satisfaction are optimised. There is little point in making large
56
savings in the cost of distribution if, in the long run, sales are lost because of customer
dissatisfaction. Similarly, it does not make economic sense to provide a level of service that is
not really required by the customer and leads to an erosion of profits. This cost/service balance is
a basic dilemma faced by physical distribution managers.
A final reason for the growing importance of PDM as a marketing function is the increasingly
demanding nature of the business environment. In the past it was not uncommon for companies
to hold large inventories of raw materials and components. Although industries and individual
firms differ widely in their stockholding policies, nowadays, stock levels are kept to a minimum
wherever possible. Holding stock is wasting working capital it is not earning money for the
company. A more financially analytical approach by management has combined to move the
responsibility for carrying stock onto the supplier and away from the customer. Gilbert and
Strebel (1989) pointed out that this has a ‗domino‘ effect throughout the marketing channel, with
each member putting pressure on the next to provide higher levels of service.
Logistical issues facing physical distribution managers today include the increasing application
by customers of just-in-time management techniques or lean manufacturing. Hutchins (1988)
stressed that companies who demand ‗JIT‘ service from their suppliers carry only a few hours‘
stock of material and components and rely totally on supplier service to keep their production
running. This demanding distribution system is supported by company expediters whose task it is
to ‗chase‘ the progress of orders and deliveries, not only with immediate suppliers, but right
along the chain of supply (called ‗supply chain integration‘). Lean manufacturing has been
widely adopted throughout the automotive industry where companies possess the necessary
purchasing power to impose such delivery conditions on their suppliers. Their large purchasing
57
power also necessitates stringent financial controls, and huge financial savings can be made in
the reduction or even elimination of stockholding costs where this method of manufacturing is
employed.
To think of the logistical process merely in terms of transportation is much too narrow a view.
PDM is concerned with the flow of goods from the receipt of an order until the goods are
delivered to the customer. In addition to transportation, PDM involves close liaison with
production planning, purchasing, order processing, material control and warehousing. All these
areas must be managed so that they interact efficiently with each other to provide the level of
service that the customer demands and at a cost that the company can afford.
2.1.15 Innovative Physical Distribution Strategy
Innovative Physical distribution is the set of activities concerned with efficient movement of
finished goods from the end of the production operation to the consumer. Bolt (1987) grouped
innovative physical distribution as one of the various environments in which sales management
operates. He noted that innovative physical distribution, sales services, brand of product and
service group management were all sales interface with marketing and these accounted to a great
extent for the market share of each organisation operating in the industries.
(a) Analysis & Evaluation of Distribution Channels in various Sectors of the Indian
Economy. The research on analysis and evaluation of distribution channels in various
sectors (Bee Mgt Consultancy, 2005) of the Indian economy comprised of activities like
listing down various agencies like manufacturing, distributors, etc and also chambers and
58
libraries like the Indian merchant chambers and interacting with them in order to gather first
hand information.
(i) The Cement Sector.
The Cement production sector is of high significance to this study in many respects. First, this
study examined the works of Ige (1975 & 1979), on Cement distribution in Nigeria an
application model, Secondly, this sector represented the heavy duty transportation sector in this
thesis and finally a comparison between the Indian situation and that of Nigeria can be carried
out of their report.
Cement production industry in India is estimated at Rs. 24-25 billion in value terms and 114
million tonnes by volume. The domestic cement industry is highly deregulated, with over 50
cement players and more than 120 manufacturing plants. Concentration, in terms of the number
of units and the dominance of large players is low. During 1999-2000 and 2003/04, the installed
capacity of the industry increased at a CAGR of installed capacity of all the players in the
industry.(beemanagement.com). The seven states that dominate the industry accounts for around
74% of the total domestic capacity.
(ii) Mechanics of Distribution Channel of Sector: Companies invariably hire c & f agents or
transport cement to own or government warehouses either via roads or railways. Distributor
network in cement industry is highly dominating and companies are compelled to hire as they do
not really have a direct link with the end user of their products. Apart from this, the distributors
have storage facilities which help control well in the entire supply chain as they are the ones who
bring orders and therefore are directly responsible for the business that a manufacturer would do.
59
Accordingly, industry dynamics in The Indian Cement industry do not favour entry of MNCs
into the Indian market, the study reported. However, the dynamics of the Nigerian Cement
industry highly favours the entry of MNCs into the country‘s cement industry.
(b) Innovative Distribution Strategies - Selling Innovative Products.
Selling Innovative Products: Sanchhez (2010) reported that sometimes the most important
feature of a purchase when and where people can buy a product; it is in its innovative
distribution strategies. With innovative distribution strategies, you can capture sales from your
competitors by being more convenient or available than other options (htp: ezinearticles.com).
For example, can you recall the brand of gas you purchased the last time you stopped at the
highway rest stop? Probably not, because it didn‘t matter whatever brand was offered, you
bought it because you manage to secure one of the slots at a rest stop is using a distribution
strategy, the report stated.
As a strategic marketer, you need to keep a sharp eye on your product line and weed out any
fading old products before they drag you down with them. Keep looking for adding hot new ones
so your marketing efforts will be supplemented by the natural growth of exciting new options as
a new and innovative distribution strategy, the report concluded.
(c) Innovation, Foreign Ownership and Multinationality: An Empirical Analysis of Italian
Manufacturing Firms.
Innovative Distribution Strategies combines evidence on ownership structure,
internationalisation and economic performance of Italian manufacturing companies with micro
data from the second Community Innovation Survey, the article reported. The paper attempted to
60
establish that a significant difference exist in productivity and innovatory behaviour of foreign
and domestic- owned multinationals relative to domestic uni-national firms in Italy. However,
while high productivity has diffused throughout all firms belonging to multinationals, crucial
innovative activities including research and development, product innovation, patenting and
technological cooperation with local firms and universities are more likely in Italian domestic
manufacturing firms than in foreign-owned firms in Italy (Davide & Antonello, 2003)..This
suggests that it is highly desirable that the share of dynamic domestic multinational firms grows
in Italian manufacturing industry, but it does not necessarily mean that a lower inflow of foreign
capital is also desirable. In fact, they find no evidence that incoming foreign firms are taking
over the most innovative and productive domestic firms. Hence they appear to add to, much
more than substitute for domestic technological activity.
Comparing productivity and innovative behaviour report, their result derived from the theoretical
and empirical publications, that a firm belonging to multinational groups out-performs domestic
uni-national firms in terms of higher productivity and wages, and exhibiting different innovative
patterns (higher propensity to in
novate products). However, interesting results emerge when we distinguish within domestic
multinational manufacturing firms. First, only manufacturing MNCs have higher productivity
and pay higher wages relative to domestic uni-national. Second, while productivity and wages
are higher in all domestic subsidiaries within an Italian manufacturing multinationals, the most
crucial innovative activities, including product innovation, R & D, patenting and technological
cooperation with foreign parties, appear to be concentrated at the headquarters level.
61
Conclusively, their result suggests that EU- owned multinationals carry out relatively more R &
D and innovative activities in their Italian affiliates than U.S. multinationals while the latter,
consistently with a general characteristic of US firms, tend to pay higher wages and show a very
high propensity to engage in international technological cooperation, they (Davide & Antonello,
2003), summarised.
The figure 4 below is the link between entrepreneurship and innovative distribution strategy.
Since the essence of any production or manufacturing is to satisfy the needs of the final
consumers of such products or goods, there must be an effective innovative distribution strategy
to help manufacturers achieve the objective. Following from the model, an entrepreneur starts his
activities via research and development progresses to product development and strategic
mapping. He then moves on to manufacture his products and do an inventory management of his
production and finally enters the marketing and distribution strategies to get the manufactured
goods to the end users. When an entrepreneur operates with innovative distribution strategy, he
will ensure innovative product distribution, leading to high productivity and competit ion.
Profitability and growth, will lead to increase in market share for the entrepreneur.
The link and relationship described below in Figure 4, describes an entrepreneurship strategy,
leading to strategic market planning, leading to supply chain management. This strategy of
distribution operations leads to implementation management and finally leading to innovative
distribution strategy of the manufacturing sector. This will result in sustainable development of
manufacturing and distribution firms in the Nigerian domestic economy particularly and the
continent of Africa in general if adequately implemented.
62
(d) Coca-Cola in India: Innovative Distribution Strategies with “RED” Approach
The case study of Fareeda under the guidance of Dr. Nagendra, (2010), deals with the distinctive
distribution strategies of Coca-Cola India (CCI) for the rural and urban market segments in India,
and the company‘s efforts towards effective execution of these strategies. CCI built a distribution
network in combination with its bottling partners and contract manufacturers. In urban areas, it
distributed product directly from bottling plants to retailers. However, owing to lack of proper
infrastructure and difficult access to the villages, it modified its distribution chains and adopted
the three tier ―hub and spoke‖ distribution model, to penetrate into the rural areas and increase its
sales. Besides its distribution network, CCI adopted ―Right Execution Daily‖ (RED) strategy for
effective execution of its distribution mainly in the urban areas, which boosted the sales of the
company. RED ensures the proper display, availability and activation of company‘s products in
the retail stores. With the success of RED in urban markets, the company plans to implement it
in rural areas. However, given the potential of the Indian rural markets and the challenges they
poses, the question that arises is, how far can RED be effectively implemented and what are the
challenges the company might face in reaching out to the rural communities? The, scholars
concluded.
2.1.16 Physical Distribution
The field of distribution is made up of two distinct branches which comprise a comprehensive
supply chain from raw materials to finished products: channels of distribution and physical
distribution. Channels of distribution consist of a network of intermediaries that manages a flow
of goods and services from producer to final customer. Physical distribution activities include the
actual movement of goods and services (logistics) with a focus on transporting and warehousing.
63
McCarthy (1978) Defined Physical Distribution as ―the handling and moving of physical goods
within industrial firms and through channel systems. It is also involved in planning and
implementing the physical flow of materials and final goods from the point of production to the
point of use to meet consumer needs and at a profit on the side of the marketer‖. Offiongodon
(1991) defined physical distribution as a concept, which underlies effective and efficient physical
distribution management with emphasis on the cost pattern, thereby coordinating or integrating
all the activities pertaining to physical distribution. Nwokoye (1981) defined physical
distribution or logistics as activities concerned with the efficient movement of raw materials
from supplier and finished goods from the end of the production line to the customers. Customer
service standard include speed, reliability, availability, accuracy and delivery as well as
examined by others Nwokoye summarized. Kirpalani (1984) opined that physical distribution
and channel policy can be over–viewed variously into managing international distribution,
channels of distribution, and distribution channels in different markets, multinational retailers,
multinational wholesalers, and physical distribution management. Physical distribution takes
place within numerous wholesaling and retailing channels, and includes such important decision
areas as customer service, inventory control, material handling, and protective packaging, order
processing, transportation, warehouse site selection and warehousing Artman (1990). Physical
distribution is part of a large process called ―distribution‖, which includes wholesale and retail
marketing as well as the physical movement of the products.
The goal of physical distribution is the optimum or lowest system cost consistent with customer
service objectives of the firm. If the activities in the physical distribution system are viewed
separately without consideration for their interdependence, the final cost of distribution may be
64
higher than the lowest possible cost (optimum cost) and the quality of service may be adversely
affected. Additional variables and costs that are interdependent and must be included in the total
physical distribution decision heighten the distribution problems confronting the international
marketer. As the international firm broadens the scope of its operations, the additional variables
and costs become more crucial in their effect on the efficiency of distribution system.
One of major benefits of the developed nations‘ unification like the European Union (EU) is the
elimination of transportation barriers among member-countries. Instead of approaching Europe
on a country by country basis, a centralised logistics network plan is developed. The trend in
Europe is toward planned Europe distributor centers. Studies indicate that companies operating
in Europe may be able to cut 20 warehousing locations to 3 and maintain the same level of
customer service. A German white goods manufacturer was able to reduce its European
warehouses from 39 to 10 as well as improve its distribution and enhance customer service.
Cutting the number of warehouses reduced total distribution and warehousing costs, brought
downs staff numbers, held fewer items of stock, provided greater access to regional markets,
made better use of transport networks, and improved service to customers all with a 21 percent
reduction of total logistics costs.
Physical distribution activities have recently received increasing attention from business
managers, including small business owners. This is due in part to the fact that these functions
often represent almost half of the total marketing cost of a product. In fact, research studies
indicate that physical distribution costs nationally amount to approximately 20 per cent of the
country‘s total gross national product (GNP). These findings have led many small businesses to
take their cost-cutting efforts beyond their historical focus on production to encompass physical
65
distribution activities Bowersox (1990). The importance of physical distribution is also based on
its relevance to customer satisfaction. By storing goods in convenient locations for shipment to
wholesalers and retailers, and by creating fast reliable means of moving the goods, small
business owners can be assured of continued success in a rapidly changing, competitive global
market, Bowersox (1990) concluded. Physical distribution can be viewed as a system of
components linked together for the efficient movement of products.
(a) Export Shipping and Warehousing
Whenever and however title to goods is transferred those goods must be transported. Exporting
goods to another country presents some peculiar differences from moving products within the
domestic market to a domestic site. The goods can be out of the shipper‘s control for longer
periods of time than in domestic distribution. More shipping and collections documents are
required. Packing must be suitable, and shipping insurance coverage is necessarily more
extensive. The task is to match each order of goods to the shipping needs best suited for swift,
safe and economical delivery. Ocean shipping, air-freight air express and parcel post are all
possibilities. Ocean shipping is usually the least expensive and most frequently used method for
heavy bulk shipment. For certain categories of goods, air-freight can be the most economical and
certainly the fastest.
Shipping costs are an important factor in a product‘s price in export marketing, and the
transportation mode is selected in terms of the total impact on cost. One estimate is that logistics
account for between 19 and 23 percent of the total cost of a finished product. One of the
66
important innovations in ocean shipping in reducing or controlling the high cost of transportation
is use of containerization.
(b) Transport Sector
Over the years, the three tiers of government in Nigeria have continued to invest huge sums of
money in the development of transport infrastructure and services, among others Ogunsanya
(2000) reviewed the catalytic effect of the transport sector, often referred to as the engine of
socio-economic development, which he said cannot be overemphasized. Public sector efforts are
also being complemented by the private sector, particularly in the area of transport services
delivery. The reviews of some key policies that have been introduced or contemplated, in order
to improve the performance of individual transport sub-sectors are considered. The rail,
maritime, air and road transport sub-sectors have been subjected to intense evaluation, using
indicators that were reflected in the Nigerian Development (NRND) report of 2000. The
indicators measuring the performance of comparator countries have been used to assess the place
of Nigeria in comparison to the countries in question. The objective here is to find out what
specific measures and positive lessons could be learnt in Nigeria, particularly if the policy
measures have contributed positively and significantly to the attainment of ―good‖ indicators.
(c) Review of Transport Sector Policies
In the last few years, there have been several policy changes and reviews, which were intended
primarily to improve the performance of the various modes of transport in the country. In this
section, emphasis is placed on policy reviews that occurred between 1996 and 2000.
Nevertheless, it must be pointed out from the outset that despite the priority given by successive
67
governments in Nigeria to transport development, the implementation of the National Transport
Policy of 1993 is yet to take off effectively. The spin-off document prepared in 1994 as
guidelines for the implementation of the policy was also, unfortunately, put in the cooler
(Ogunsanya, 2000). Besides, the policy as it is now lacks clear-cut measurable targets or time
frame for evaluation purposes or target attainment. However, a review of policy measures, as
they relate to each mode of transport is discussed below separately.
(i) Rail Transport
The immense contribution of rail transport to passenger and freight movements and to the
Nigerian economy, which nosedived considerably after the ―Rail Indian Technical
Services‖(RITES) interventions in the late 1970s, spurred the Federal Government into taking
some policy measures to revive the rapidly dwindling relevance of rail transport sector in
overland movement of passengers and goods. The sector suffers poor funding, decreasing
capacity, huge operating losses and other operational problems, among others. Consequently, a
policy on the expansion and revitalisation is being pursued. The elements of this policy include
making better use of existing railway assets through rehabilitation and rail expansion
programmes. In addition, a commercial –led approach is be used in the provision of rail services
as well as in the management of resources. One of the recent steps taken to revive the Nigerian
railway was included a bilateral technical partnership, worth about US$528,697,000 with the
China Civil Engineering and Construction Corporation (CCECC) in December, 1995 for a three-
year period.
The CCECC was charged with the responsibility of track surveying in order to repair and realign
rail tracks, eliminate sharp curves, ease steep track gradients and renew existing sleepers with
68
additional ballast. In addition, the CCECC was asked to rehabilitate and refurbish the existing
rail signalling and telecommunication system as well as rehabilitate old and supply new
locomotives and rolling stock include 50 locomotives, 150 coaches, 400 wagons and 100 guard
vans, among others.
Another initiative aimed at breathing life into the rail transport sub-sector was the contract award
in 1997 of about N2.64 billion to NAIRDA, an Israeli firm, to install a modern and more
advanced comprehensive communication system based on micro-wave technology.
It is rather curious that about seven years on, the impact of the CCECC intervention has not
brought about a dramatic transformation of the Nigerian railways system. The recovery of the
rail transport sub-sector has been very sluggish and this is having devastating effects, not only on
the Nigerian roads, which are being damaged by overloaded heavy duty vehicles used in hauling
goods over long distances, but also on the economy as a whole. Indeed, newspaper reports
indicated that a new technical partner (possibly from Canada) was expected to commence
collaborative work with the NRC. The most recent effort is the preparation of a report, which
provides a strategic vision for the Nigerian railway system for 25 years (FRN, 2002). In addition,
about N5 trillion (US$40 billion) may be required over the next 25 years in order to improve the
ailing Nigerian Railways. (Ezereonwu,2002).
(ii) Water Transport
The Maritime transport accounts for more than 90 per cent of international trade value and
volume in Nigeria. For this reason, recent policies relating to this mode of transport have been
directed towards making shipping and the Nigerian seaports more attractive to users as well as
69
improving port productivity in general. More specifically, the National Transport Policy seeks to
encourage Nigeria‘s participation in international shipping, improve institutional structures and
features of the seaports in order to attain high efficiency (through port commercialisation),
improved-port linked flows with hinterland transport networks, entrench an efficient cargo
clearing and documentation procedures as well as create an enabling environment for maritime
transport operation. The policy recognises the limitations imposed on inland water transport
(IWT) by high siltation along water courses and low patronage due to competition from land
transport. The transport policy intends to encourage private sector‘s involvement in the dredging
and the channelization of waterways in order to promote the movement of people and goods by
IWT.
In order to improve port operations, facilitate the clearance of cargo at the Nigerian seaports
within 48 hours as well as create a favourable environment for port operations and activities-by
ridding the ports of malpractices, instilling sanity and transparency, some ports reforms were
introduced in 1996. Part of the reforms included the rationalisation of agencies at the ports, the
installation of high technology scanners and the introduction of the Automated System for
Customs Data (ASYCUDA).
Also, policy measures have been introduced in the maritime transport industry to encourage
greater participation of indigenous shipping companies in mainstream shipping operations, the
expansion and replacement of obsolete navigational facilities, cargo handling equipment and the
reduction of the high port charges which have made other West African ports more attractive
than the Nigerian seaports. In order to stem the rate of revenue leakage arising from the
doctoring of bills of laden, under-invoicing as well as delays and lack of transparency in pre-
70
shipment inspection procedures among other things, 100 percent cargo inspection, with the initial
port congestion problem, was introduced in early 2001.
Also, in order to organise dock-related activities properly, protect the interest and rights of dock-
workers, and reduce the incidence of debilitating labour unrest in the seaports, Joint Dock
Labour Industrial Council (JODLIC) was established through Dock Labour Act No. 37 of
1999.The Federal Government has also ordered the merging of the Government inspectorate of
Shipping (GIS) with the National Maritime Authority (The Guardian. 2002;37) as a way of
streamlining functions and strengthening the capacity for state port control activities. It is also
noteworthy that since 1999, the proposed privatisation of some port activities and Nigerdock, the
government owned ship-building company, has continued to generate different reactions. What
is not in doubt, however, is the commitment of the Government to private sector- led approach to
managing some of its agencies.
The creation of the National Inland Waterways Authority in 1997 as well as the plans to dredge
River Niger and develop inland river ports at Lokoja, Baro, Nembe and Patani, among others, are
some of the attempts aimed at improving the IWT. So far, the participation of indigenous
shipping companies in coastal shipping is very low. The passage into law of the Coastal and
Inland Shipping (Cabotage) Bill in 2002 is a step towards addressing the problem. Nevertheless,
there is still the need to improve the capacity of the Nigerian shipping companies to actually
participate effectively in coastal shipping as well as consider the waver clause in the cabotage
law that allows the minister to selectively approve the participation of foreign shipping firms. In
addition, Nigerian seaports need to be made more attractive and user-friendly through the
implementation of the port reforms already mentioned as well as improving port capacity to
71
handle, store and clear cargoes within the shortest possible time. Improved participation of
indigenous shipping companies cannot be over emphasised, and it is hoped that the new funding
scheme (proposed Fleet Expansion and Maritime Infrastructure Development) would provide an
avenue for more sustainable vessel funding than the chequered Ship Building and Ship
Acquisition fund.
The provision of more funds and improved management of Ferry services operation by the
public sector in riverine states (such as Lagos, Kogi, Rivers and Ondo) is vital to improving IWT
as well as the provision of incentives (in terms of cheap and subsidised out-board engines) to
private operators of boats and canoes. The menace of water hyacinth also needs to be addressed,
through constant clearing of IWTs.
(iii) Air Transport Sub-sector
The transport policy document plans on the civil aviation industry, to classify Nigerian airports
for better management and revenue generation, optimise the use of existing airports
infrastructure and facilities and provide efficient air services among others, (Olesin &
Ogunkanmi, 2002). The policy document also acknowledged the unviability of many airports,
the poor state of navigational facilities and domestic aircraft maintenance. Since the mid-1990s,
several institutional changes have taken place, in order to improve air transport safety, airspace
and airport management, and provision of air transport and related services. For instance, in
August 1995, the Federal Airport Authority of Nigeria (FAAN) was created through the merging
of the defunct Nigerian Airports Authority (NAA) and the Federal Civil Aviation Authority
(FCAA) in order to align their functions. Two other agencies were created in 1999, namely, the
72
Nigerian Civil Aviation Authority (NCAA) and Nigerian Airspace Management Agency
(NAMA).
The policy of reducing public sector participation in the delivery of air transport services led to
the privatisation of the Nigeria Airways. The International Finance Corporation of the World
Bank as well as technical, legal and accounting consultants were employed to do a detailed
survey/study on the matter and make recommendations. The privatisation of Nigeria Airways is
being vehemently opposed by various trade unions that have high stakes in the company. Indeed
the controversy surrounding the planned partnership between Nigeria Airways and Air wing
Airspace Ltd , to run the so called Air Nigeria, is yet to settle (Olesin and Ogunmakin, 2002) The
foregoing notwithstanding, the deregulation of the civil aviation industry in 1985 has encouraged
more private carriers. Although, the effectiveness and efficiency of the services of private
carriers in particular, coupled with the poor observance of aircraft safety measures have raised a
lot of questions lately, due to some very recent aircraft accidents (such as BAC 1-11 air crash in
Kano and the Beach craft plane crash in May, 2002). In order to improve aircraft safety for
landing and take-off, navigational facilities are being modernised and provided to acceptable
ICAO standards.
(iv) Road Transport Sub-sector
The Nigerian road system is the predominant channel for the internal movement of people and
goods in the country. According to Ogunsanya (2000), the responsibility for the road system is
shared by the federal, state and local governments in the proportion of 22 per cent, 27 per cent
and 51 per cent respectively. Ironically, a sizeable proportion of federal roads, with relatively
lower control of road length, are in good condition, while the physical condition of state and

73
local government roads leave much to be desired. The policy thrusts of the government
concerning this sub-sector include the exploration of new sources of finance for road
infrastructure expansion and maintenance, promotion of intermodal freight transport to reduce
pressure on the roads, establishment of a Highway Authority to harmonise highway planning,
construction and maintenance and the reorganisation of the road transport industry through the
establishment of a Joint Government Initiative Productivity Council, among others (Ogunsanya,
2000).
With roads having an estimated asset value of N5,000 billion, the rapidly deteriorating and the
unsatisfactory situation of many Nigerian roads, including Federal or trunk A roads, about N80
billion is said to be lost annually. The aforementioned loss is estimated at about 5.5 per cent of
the Gross Domestic Product (GDP) (Fadaka, 1996). A key policy measure of the government in
this regard is to repair and rehabilitate bad roads. Already, plans are underway to establish a
Highway Maintenance Agency. In addition, the need to expand the Federal road network, since
1999, has led to the award of several federal road projects across the country. The roads are at
various stages of construction and completion. Some of the Federal road projects include Keffi-
Abuja road expansion work, the new Ilorin-Ibadan and Ife-Iloko highways.
The need to effectively fund and manage roads in Nigeria led to the Road Vision 2000 initiative
in June 1996. This included the proposal to set up a National Road Fund, where monies for road
financing can be pooled from sources such as petroleum tax, vehicle licences, driver licences and
so on, as well as the creation of a National Roads Board. Beyond this, the Federal Ministry of
Works and Housing has also been promoting the use of build-operate and transfer (BOT)
mechanism for road construction, in which the private sector or concessionaries would play
74
dominant role. In addition, as a result of the need to reduce revenue leakage and generate more
funds, for the repairs and maintenance of Federal roads, private sector contactors took over the
duty of toll collection and the management of selected segments of Federal roads and bridges,
after they were privatised in February 1996.
In order to harmonise road traffic legislation, the National Road Traffic Regulations of 1997
came into force. The regulations provide for a more centralised system of motor vehicle
administration (Ibrahims, 1997). It should be mentioned that motor vehicle administration in
Nigeria is supposed to encompass the National Vehicle Identification Scheme, National Vehicle
Licence Scheme, Proof of Ownership Certificate, National Standard Vehicle Inspection Scheme
and the Enhanced National Driver‘s Licence Scheme. In addition, the Federal Road Safety
Commission (FRSC) was merged with the Nigeria Police in early 2000 in order to harmonise
road safety functions.
In spite of the good intentions of the aforementioned policy measures, lip-service is still being
paid to road maintenance. The Road Vision 2000 initiative, with all its laudable proposals, is still
far from being executed. This could be attributed to the pervasive lack of political will to follow
through on programmes or initiatives by the government in particular. Much more worrisome is
the deteriorating condition of roads, despite the commitment of hundreds of billions of naira to
road-works, since May 1999, when the Obasanjo-led government took the reins of power
Ogunsanya (2000) concluded.
75
2.1.17 Distribution process
The distribution process begins when a supplier receives an order from a customer. The customer
is not too concerned with the design of neither the supplier‘s distributive system nor any supply
problems. In practical terms, the customer is only concerned with the efficiency of the supplier‘s
distribution. That is, the likelihood of receiving goods at the time requested. Lead-time is the
period of time that elapses between the placing of an order and receipt of the goods. This can
vary according to the type of product and the type of market and industry being considered.
Lead-time in the shipbuilding industry can be measured in fractions or multiples of years, whilst
in the retail sector, days and hours are common measures. Customers make production plans
based on the lead-time agreed upon when the order was placed. They expect that the quotation
would be adhered to and late delivery is no longer acceptable in most purchasing situations.
(a) Order processing
Bradmore (2004 )described order processing as all of the activities related to filling a customer's
order - checking the order, prices, terms, customer credit and stock levels; producing an invoice;
picking the goods from the warehouse; packing and shipping them and collecting payment. It is
the key element of Order fulfillment. Order processing operations or facilities are commonly
called "distribution centers". It is the term generally used to describe the process or the work
flow associated with the picking, packing and delivery of the packed item(s) to a shipping
carrier. The specific "order fulfillment process" or the operational procedures of distribution
centers are determined by many factors. Each distribution center has its own unique requirements
or priorities. Order processing is the first of the four stages in the logistics process. The
efficiency of order processing has a direct effect on lead times. Orders are received from the
76
sales team through the sales department. Many companies establish regular supply routes that
remain relatively stable over a period of time, providing that the supplier performs satisfactorily.
Very often, contracts are drawn up and repeat orders (forming part of the initial contract) are
made at regular intervals during the contract period. Taken to its logical conclusion, this
effectively does away with ordering and leads to what is called „partnership sourcing‟. This is an
agreement between the buyer and seller to supply a particular product or commodity as at when
required without the necessity of negotiating a new contract every time an order is placed.
Order-processing systems should function quickly and accurately. Other departments in the
company need to know as quickly as possible that an order has been placed and the customer
must have rapid confirmation of the order‘s receipt and the precise delivery time. Even before
products are manufactured and sold the level of office efficiency is a major contributor to a
company‘s image. Incorrect ‗paperwork‘ and slow reactions by the sales office are often an
unrecognised source of ill-will between buyers and sellers. When buyers review their suppliers,
efficiency of order processing is an important factor in their evaluation. A good computer system
for order processing allows stock levels and delivery schedules to be automatically updated so
management can rapidly obtain an accurate view of the sales position. Accuracy is an important
objective of order processing, as are procedures that are designed to shorten the order processing
cycle.
(b) Inventory
Inventory or stock management is a critical area of PDM because stock levels have a direct effect
on levels of service and customer satisfaction. The optimum stock level is a function of the type
of market in which the company operates. Few companies can say that they never run out of
77
stock, but if stock-outs happen regularly, then market share will be lost to more efficient
competitors. Techniques for determining optimum stock levels are illustrated later in this
chapter. The key lies in ascertaining the re-order point. Carrying stock at levels below the re-
order point might ultimately mean a stock-out, whereas too high stock levels are unnecessary and
expensive to maintain. The stock/cost dilemma is clearly illustrated by the systems approach to
PDM that is dealt with later.
Stocks represent opportunity costs that occur because of constant competition for the company‘s
limited resources. If the company‘s marketing strategy requires that high stock levels be
maintained, this should be justified by a profit contribution that will exceed the extra stock
carrying costs. Sometimes a company may be obliged to support high stock levels because the
lead-times prevalent in a given market are particularly short. In such a case, the company must
seek to reduce costs in other areas of the PDM ‗mix‘.
(c) Warehousing
American marketing texts tend to pay more attention to warehousing than do British
publications. This is mainly because of the relatively longer distances involved in distributing in
the USA, where it can sometimes take days to reach customers by the most efficient road or rail
routes. The logistics of warehousing can, therefore, be correspondingly more complicated in the
USA than in the UK. However, the principles remain the same, and indeed the European Union
should be viewed as a large ‗home market‘. Currently, many companies function adequately with
their own on-site warehouses from where goods are dispatched direct to customers. When a firm
markets goods that are ordered regularly, but in small quantities, it becomes more logical to
locate warehouses strategically around the country. Transportation can be carried out in bulk
78
from the place of manufacture to respective warehouses where stocks wait ready for further
distribution to the customers. This system is used by large retail chains, except that the
warehouses and transportation are owned and operated for them by logistics experts (e.g. BOC
Distribution, Excel Logistics and Rowntree Distribution). Levels of service will of course
increase when numbers of warehouse locations increase, but cost will increase accordingly.
Again, an optimum strategy must be established that reflects the desired level of service.
2.1.18 Organisational Performance
Organisational performance is the outcome of both individual and collective efforts of human
elements in the work environment. It should not come as a surprise that researchers and
organisational leaders show age-long deep interest in organisational performance. Podsakoff
(1982) put it succinctly, when he argued that: ―The performance of organisational participants,
both individually and as a collective, has been an overriding concern of corporate and national
leaders for decades, and for good reason. Individual productivity is often taken as a measure of
societal and socioeconomic trends of a culture and is therefore an important determinant of the
welfare and health of an economy (Goodman and Pennings, 1977; Grayson, Note 1: O‘Toole,
Hansot, Herman, Herrick, Leibow, Lusigan, Richman, Sheppard, Stephansky and Wright, 1973;
Sutermeister, 1979; Ruch and Hershauer, 1974). Moreover, the performance of individuals in
work settings is closely related to organisational and managerial success and effectiveness
(Campbell, 1977; Cummings, 1977; Georgeopoulos and Tannenbaum, 1958; Steers, 1976).
Individual performance, to the extent it is followed by or produces rewards, has also been viewed
by many behavioural scientists as an important determinant of satisfaction and morale among
workers (Adam and Scott, 1971; Campbell, Dunnette, Lawler and Weick, 1970; Lawler, 1971;
79
Porter and Lawler, 1968). Finally, an individual‘s performance and its effectiveness are
prominent factors influencing the decisions which management practitioners make with respect
to training, motivation, advancement and identification of outstanding workers. It should come
as no surprise, therefore, that behavioural scientists and organisational leaders alike have long
been interested in the determination of human performance.
Stoner (2005) perceived organisational performance as the measure of how efficient and
effective an organisation is, that is, how well it achieves appropriate objectives. A similar
perspective to the discussion of organisational performance is the view expressed by Ogundele
(2005) when he quoted Katz and Kahn (1966) who viewed it as the totality of organisational
goodness representing the sum of such elements as production, cost performance, turnover, and
quality of output, profitability and efficiency. Performance measures include market share, sales
volume, marketing cost, return on investment, gross earnings, total assets, profit before tax and
current ratio (Osuagwu, 2006 b). The implication of these diverse views is that leadership and
performance measures are the cement that binds all other organisational components together.
The corollary to this idea is that effective internal performance measure is sine qua non to
organisational performance. To support this perspective, Bititci (2007) opined that: ―When it
comes to performance measures, they can also make or break a business. There are numerous
examples where performance measures cause dysfunctional behaviours at all levels and
undermine business results and transformation attempts. What is really needed is a simple but
integrated set of performance measures that links stakeholders‘ expectations, and strategies of
the values streams, to the processes, teams and individuals within the organisation. Furthermore,
the performance measures should provide everyone, from the chief executive officer (CEO)
down to the shop floor, with accurate, factual and timely information to allow these people to
80
make decisions on a daily basis. The measurement system in the organisation should be a living
and breathing thing. It should allow us to monitor performance in certain areas, at the same time
facilitating performance improvements in other areas. What we measure and what we do with the
information we get back should be sensitive to business priorities and, where necessary, we
should be able to change these priorities to realign the organization with a new or changed set of
objectives. The trick here is to develop a simple and integrated performance measurement
system first, and then we can develop a process that allows us to review, refine and change the
performance measurement system as the business needs, environment and strategy changes.
The Foundation for Performance Measurement (1999) saw organisational performance
dimensions as including competitive advantage, financial performance, quality of product or
service, flexibility, resource utilisation and innovation. However, the most noticeable and
convincing measurement of organisational performance, most especially to the shareholders of
an organisation is the level of profitability. Organisations get a lot of things done through the
amount of profit they make in their various business endeavours. Government charges company
income tax from the profit organisations make from their operations. Most publicly quoted
companies pay minimum of 30% to the government as company income tax, which form
substantial part of government revenue. The revenue so generated by the Government is
normally used to provide social and economic infrastructures for the citizenry. These facilities
include good network of roads, hospitals, security, schools and educational institutions of higher
learning, maintenance of embassies abroad and portable water among other good things of life. If
organisations are not performing to provide much of the government revenue, one can make a
good guess of our societal standard. What is incontrovertible is the fact that organisations
contribute substantially to the revenue base of the governments at all levels. Such revenues are
81
generated from their performance, what needs to be done is efficient management and utilisation
of these scarce financial resources which must be managed for their positive effects to trickle
down to all levels of the economy.
Approaches to organisational performance improvement can be examined from internal and
global perspectives. The internal performance concepts include balanced scorecard,
benchmarking, business process reengineering, continuous improvement and cultural change.
The global performance concepts include learning organisation, certification, knowledge
management and management by objectives. Pearce and Robinson (2003) conceived
organisational performance as a multidimensional factor which includes profitability,
productivity, competitive position, employee development, employee relations, technological
leadership and public responsibility.
One of the most radical views of organisational performance was provided by Osuagwu (2006
a). He said organisational performance, whether as a construct or concept, can be measured
objectively or subjectively. There were several good reasons for using subjective performance
measures in business research (Dawes, 1999). First, managers may be reluctant to disclose
actual performance data if it is considered to be commercially sensitive or confidential (Dess and
Robinson, 1984). Second, subjective measures of performance may be more appropriate than
objective measures of performance for comparing profit performance in cross-industry business
research studies. This is because profit levels can vary considerably across industries, thereby
obscuring any relationship between independent variables and measures of performance (Dawes,
1999). Subjective measures of performance may be more appropriate in this situation because
involving managers in a research study can take the relative performance of their industry into
82
account when providing a response. Subjective measure of performance has been recommended
by various researchers (for example, see: Powell, 1992; Venkatraman and Ramanujan, 1987).
Third, objective performance measures, such as profit, may not accurately indicate the
underlying financial health of a company. For instance, profitability may vary due to reasons
such as the level of investment in R&D or marketing activity that might have long-term effects
(Dawes, 1999). Osuagwu (2006 a) stressed that there have been research studies that showed
strong correlation between objective and subjective measures of performance (Dawes, 1999;
Dess and Robinson, 1994; Pearce, Robbins and Robinson, 1987; Venkatraman and Ramanujam,
1985). He supported this view by arguing that subjective measures of performance are popular
in market orientation research studies (Dawes, 1999). Also, he cited existing evidence that
managers can give good subjective estimates of specific financial estimates (Hart and Banbury,
1994; Dess and Robinson, 1984; Venkatraman and Ramanujam, 1986). In conclusion, Osuagwu
(2006 a) listed organisational performance measures to include sales, market share, ability to
gain market share, sales growth rate, return on investment, profits and competitive position or
advantage.
Desarbo (2005) in their research, collected a battery of performance indicators, which included
‗profit (that is, total revenue minus variable costs divided by total revenue); average percentage
of the return on investment; return on investment; return on assets; relative market share; overall
customer retention; retention of major customers; sales growth rate; and overall profit margin
relative to the objective for a business unit.
Thus, organisational performance does not depend on a single attribute, but rather on the fit
among the elements of an organisation (Donaldson, 2001; Miles and Snow, 1978; Miller, 1992,
83
1996; Siggelkow, 2002; Venkatraman and Camillus, 1984; Zajac, Kraatz and Bresser, 2000). As
pointed out by Miles and Snow (1978), organisational performance is a function of the level of
fit (consistency) that managers achieve between strategy, structure and technology. The Miles
and Snow (1978) framework remains one of the most comprehensive, insightful and useful ways
for senior managers to understand patterns of relations among organisational variables and their
effect on effectiveness, and thus respond to the challenges they face in their own organisations
(Ghoshal, 2003). A positive covariance among organisational variables is associated with higher
performance. For instance, an increase in product-market scope must be accompanied by a
similar increase in the degree of decentralisation in the decision-making process and in
production process flexibility. Under this circumstance, the organisation is capable of
maintaining consistency and is therefore effective, Roca-Puig and Bou-Llusar, (2006). One of
the definitions of high performance organisations (HPO) emanated from the description of
achievement or attribute put forward by Epstein (2004) as including strong financial results,
satisfied customers and employees, high levels of individual initiative, productivity and
innovation, aligned performance measurement and reward systems, and strong leadership. In this
connection, De Waal (2007) argued that ―to develop an overall definition of a high performance
organisation (HPO) requires the identification of common themes and composing a uniform
definition based on these common themes‖: ―a HPO achieves sustained growth that is better than
the financial performance of its peer group over a period of at least five years;
a HPO has a great ability to adapt quickly to changes;
a HPO has a long-term orientation;
84
the management processes of a HPO are integrated and the strategy, structure, processes and
people are aligned throughout the organisation;
a HPO focuses on continuously improving and reinventing its core capabilities;
a HPO spends much effort on developing its workforce.‖
Thus, a HPO is a company that achieves financial results that are better than those of its peer
group over a longer period of time by adapting well to changes and reacting quickly, by
managing for the long term, by setting up an integrated and aligned management structure, by
continuously improving its core capabilities, and by truly treating the employees as its main
asset, (De Waal, 2007).
In his discussion of the nature of high performance businesses, Kotler (2000) stated that ―as its
first stop on the road to high performance, the business must define its stakeholders and their
needs.‖ Thus, organisations are becoming more aware of the need to nourish stakeholders, which
include customers, employees, suppliers and distributors, in order to earn enough profits for the
shareholders. Kotler (2000) a similar view: ‗A business must strive to satisfy the minimum
(threshold) expectations of each stakeholder group. At the same time, the company can aim to
deliver satisfaction levels above the minimum for different stakeholder. For example, the
company might aim to delight its customers, perform well for its employees and deliver a
threshold level of satisfaction to its suppliers. In setting these levels, the company must be
careful not to violate the various stakeholder groups‘ sense of fairness about the relative
treatment they are getting. There is a dynamic relationship connecting the stakeholder groups. A
smart company creates a high level of employee satisfaction, which leads to a higher effort,
85
which leads to higher-quality products and services, which creates higher customer satisfaction,
which leads to more repeat business, which leads to higher growth and profits, which leads to
high stockholder satisfaction, which leads to more investment, and so on. This is the virtuous
circle that spells profits and growth,‖ (Kotler, 2000).
Furthermore, ―a company can accomplish its satisfaction goals only by managing and linking
work processes...High performance companies are increasingly focusing on the need to manage
core business processes such as new-product development, customer attraction and retention, and
order fulfillment. They are reengineering the work flows and building cross-functional teams
responsible for each process…To carry out processes, a company needs resources – labour
power, materials, machines, information, (and) energy and so on. Resources can be owned,
leased or rented…Companies are finding that some resources under their control are not
performing as well as those that they could obtain from outside the company. Many companies
today have decided to outsource less critical resources if they can be obtained at better quality or
lower cost from outside the organisation,‖ (Kotler, 2000).
2.1.19 Entrepreneurship and Innovative Distribution Strategy.
(a) Who is an Entrepreneur?
An entrepreneur is a person who has the ability to see and evaluate business opportunities, to
gather the necessary resources to take advantage of them, and to initiate appropriate action to
ensure success (Grabel & Hanusch, 2001). The World Bank‘s definition states that entrepreneurs
are people who perceive profitable opportunities, are willing to take risks in pursuing them and
have the ability to organise a business. Badi and Badi (2005) defined an entrepreneur as a person
86
with vision, original idea, decision-making and daring to try. They see an entrepreneur as one
who acts as leader and boss of the show, who decides how business has to be done, who
coordinates and arranges all the factors of production, one who has expertise in the field, who
anticipates the market trends and demand patterns and prices.
The entrepreneur is also an inventor who brings in new ideas, new commodities, and new
processes and encourages his team in new activities. The entrepreneur is an organiser and good
businessman. However, Carland et al (1984) took the debate further and considered who an
entrepreneur is as distinct from a small business owner. Accordingly, they defined an
entrepreneur as an individual who establishes and manages a business for the purpose of profit
and growth. A Harvard view defines the entrepreneur as the promoter who uses other people‘s
capital to exploit opportunities.
Ologun (2006) defined an entrepreneur as an economic leader who effectively combines factors
of production (land, labour, capital and human resources) to produce goods and services. He can
also be defined as an individual who conceives an idea and makes it work. Inegbenebor (2006)
defined an entrepreneur as an individual who perceives needs, conceives goods and services to
satisfy the needs, organises factors of production and creates and markets the products. In almost
all of the definitions of entrepreneurship, there is agreement that we are talking about a kind of
behaviour that includes: (1) initiative taking (2) the organising and reorganising of social and
economic mechanisms to turn resources and situations to practical account, (3) the acceptance of
risk or failure (Hisrich and Peters, 2002). Olson (1987), taking a leaning towards the classical
theory of the capitalist, defined an entrepreneur as a ―risk-taking, innovative individual who
87
establishes and manages a business for purposes of profit and growth‖. These characteristics are
group together to show a trend.
(b) Characteristics of Entrepreneurs
The concept or idea of all entrepreneurs are action-based or action-oriented; highly motivated
individuals who take risks to achieve set goals. Owualah (1999) observed that the characteristic
feature of an entrepreneur includes direction, supervision, control and risk-taking. It is his (the
entrepreneur) affinity for risk which, according to Mill, distinguished him from the manager.
However, differing from Mill‘s viewpoint, Schumpeter (1934) later emphasised innovation
rather than risk-taking as the most important distinction between the two. In his opinion, an
entrepreneur‘s goal broadly defined is to develop new products or services as well as new
methods of production, identify new markets, discover new sources of supply and develop new
organisational forms. The entrepreneur is characterised principally by innovative behaviour and
will employ strategic management practice in the business‖. Their definition more or less
concurs with Olson‘s and seems to blur the distinction between an entrepreneur and a manager
implied by Mill and Schumpeter. On the other hand, Carland et al (1984) considered a small
business owner as ―an individual who establishes and manages a business for the principal
purpose of furthering personal goals‖.
(c) Who is an Innovative Entrepreneur?
The innovative entrepreneur is that individual who creates a product, service or activity with the
purpose of meeting societal or environmental needs of mankind, earning the financial rewards
and running the risks of an eventual failure of such a venture. The concept of an innovative
88
entrepreneur is further refined when principles and terms from a business, managerial and
personal perspective are considered. In particular, the concept of entrepreneurship from a
personal perspective has been explored in this century, Gartner, (1989, 2001). This exploration is
reflected in the following three definitions of an entrepreneur.
To an economist, an innovative entrepreneur is one who brings resources, labour, materials, and
other assets into combinations that make their value greater than before. He is also one who
introduces changes, innovations and a new order. To a psychologist, such a person is typically
driven by certain forces –the need to obtain or attain something, to experiment, to accomplish or
perhaps to escape the authority of others. To a business man, an innovative entrepreneur appears
as a threat, an aggressive competitor, whereas to another businessman, the same entrepreneur
may be an ally, a source of supply, a consumer, or someone who creates wealth for others as well
as finds better ways to utilise resources, reduce waste and produce jobs others are glad to get,
(Barreto,.1989; Bangs, 1995) Thus, innovative entrepreneurship, like other concepts, has no
specific definition. It has been defined in different ways by many authors. It is generally believed
that the entrepreneur, particularly the small business entrepreneur, is the original, the sole and the
ultimate creator of wealth (Udeh, 1999).
(d) What is Entrepreneurship?
Peter (1980) defined entrepreneurship as ―a practical creativeness, which combines resources and
opportunities in new ways. It involves the application of personal qualities, finance and other
resources within the environment for the achievement of business success‖. Odusina (1975)
defined entrepreneurship as ―the process of using available capital in any form of business
endeavours in an open and free economy for the sole purpose of making profit and it includes all
89
enterprises in new fields or in older ones at all risk levels.‖ He argued that ―entrepreneurship has
to do with a conceptual approach of doing new things, within a new philosophy of value, of
purpose, of utility, of quality and of use which satisfies needs‖. Osagie et.al (1990:26) submitted
that ―entrepreneurship is generally associated with or is usually defined to reflect the indigenous
traits inherent in an individual‖. Barlett (2004) defined entrepreneurship as being concerned
with opportunity creation and seeking behaviour. Holt (2005) defined entrepreneurship as the
dynamic process of creating incremental wealth. This wealth is created by individuals who
assume the major risks in terms of equity, time, and /or career commitment of providing value
for some product or service. The product or service itself may or may not be new or unique but
value must somehow be infused by the entrepreneur by securing and allocating the necessary
skills and resources. Vesper (1987) simply defined entrepreneurship as the ―art of operating in an
exceptional way‖.
These definitions have the following common elements: creativity and innovation; resource
gathering and the founding of economic organisation. This implies that entrepreneurship is
related to innovation. Entrepreneurship can be defined as the creation of an innovative economic
organisation (or network of organisations) for the purpose of gain or growth under conditions of
risk and uncertainty (Dollinger, 2003). Hisrich(1985,2002) defined entrepreneurship, as ―the
process of creating something new with value by devoting the necessary time and effort ,assuring
the accompanying financial psychic, and social risks, and receiving the resulting rewards of
monetary and personal satisfaction and independence.‖
90
(e) Historical perspectives of Entrepreneurship in Nigeria
The origin of entrepreneurship can be traced to the period in human history when people
produced more products than they needed and as such they had to exchange these surpluses. By
this way, producers came to realize that they can concentrate on their areas of production to
produce more and then exchange their product with what they needed. This was known as trade
by barter. Barter was the only means of exchange in the pre-colonial period. Barter is the
exchange of goods for goods. However, barter as a system was not dominant as some
anthropologists would assume, but some assumed that trade by barter pre-dominated the
economy of Nigeria as other African countries; that production for the needs of people was
subsistence. In pre-colonial Nigeria, cowries and, slaves, among other valuables, were used in a
metric of perceived value in relation to one another, for commodity valuation or price system
economies. Through this exchange of products, entrepreneurship started in those pre-colonial
communities.
Modern entrepreneurship in Nigeria started with the coming of the colonial masters who brought
in their wares and made Nigerians their middle men. In this way, modern entrepreneurship was
conceived. Most of the modern entrepreneurs were engaged in retail trade or sole proprietorship.
One of the major factors that discouraged this flow of entrepreneurship development in Nigeria
is the value system brought about by formal education. For many decades, formal education has
been the preserve of the privileged. With formal education people had the opportunity of being
employed in the civil service, because in those days the economy was large enough to absorb
into the prestigious occupation all Nigerians their goods. As such, the system made Nigerians to
be dependent on the colonial masters.
91
The contrast between Nigerian and foreign entrepreneurs during the colonial era was detrimental.
The competitive business strategy of the foreign entrepreneurs was also ruinous and against the
moral standards established by society. They did not adhere to the maxim of ―live and let live‖.
For instance, the United African Company (UAC) that was responsible for a substantial
percentage of the import and export trade of Nigeria had the policy of dealing directly with
producers and refused to make use of the services of Nigerian entrepreneurs. The refusal of the
expatriates to utilise the services of local businessmen inhibited their expansion and acquisition
of necessary skills and competence. Consequently, many eventually folded up. Those that folded
up built up resentment against business, which to other prospective entrepreneurs. As a result,
the growth of indigenous entrepreneurship in the country slowed down. But, with more people
becoming educated and the fact that government could no longer employ most school leavers,
economic programmes to encourage individuals to go into private business and be self- reliant
were initiated.
(f) Entrepreneurship and Innovative Distribution Strategy.
Fundamentally, innovation has to do with changes leading to improvement in the quality and
quantity of products as well as techniques of doing things. Innovation is dynamic and creates
new things out of existing ones. Through innovation, the entrepreneur introduces new production
techniques, new commodities, improve on existing ones, open up new markets, explore new
source of raw materials and design new techniques of management. Research and Development
Programmes are formal avenues of introducing or inculcating innovative skills in the
entrepreneur. These skills are what an innovative entrepreneur involved in distribution activities
translates into business establishment and development as innovative strategies in product
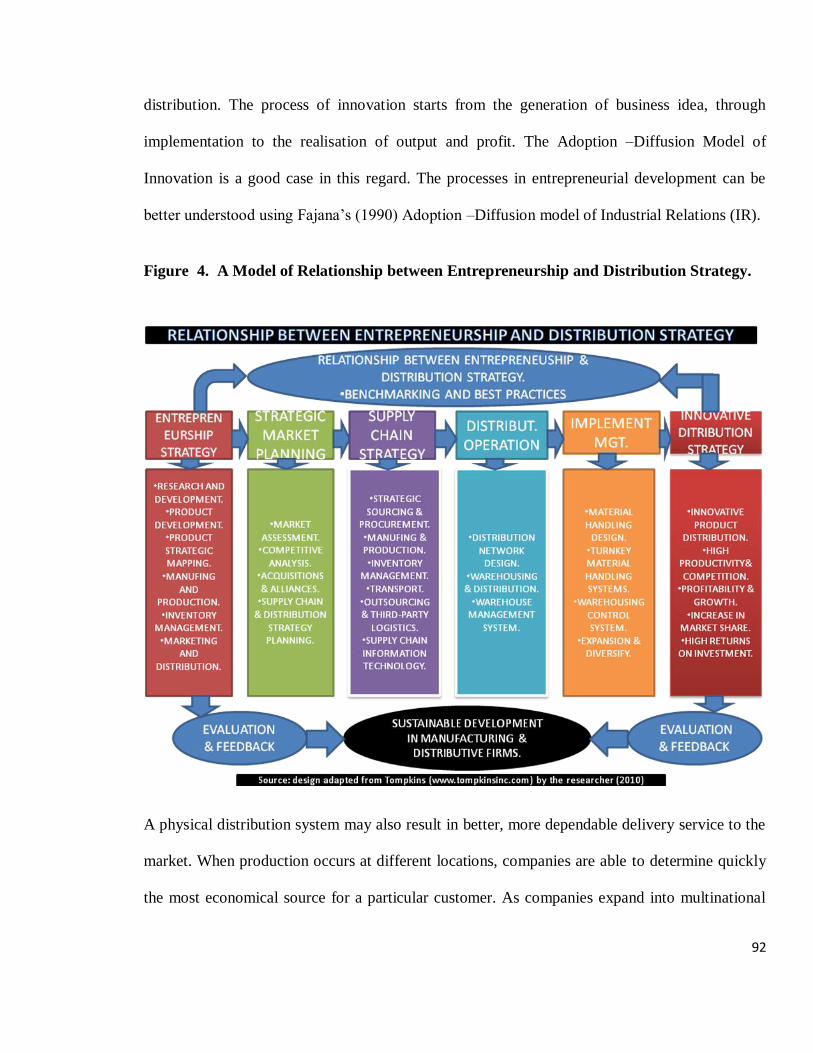
92
distribution. The process of innovation starts from the generation of business idea, through
implementation to the realisation of output and profit. The Adoption –Diffusion Model of
Innovation is a good case in this regard. The processes in entrepreneurial development can be
better understood using Fajana‘s (1990) Adoption –Diffusion model of Industrial Relations (IR).
Figure 4. A Model of Relationship between Entrepreneurship and Distribution Strategy.
A physical distribution system may also result in better, more dependable delivery service to the
market. When production occurs at different locations, companies are able to determine quickly
the most economical source for a particular customer. As companies expand into multinational
93
markets and source the markets form multinational production facilities, they are increasingly
confronted with cost variables that make it imperative to employ a total system approach to the
management of the distribution process in order to achieve efficient operations. Finally, the
physical distribution system can render the natural obstruction created by geography less
economically critical for the multinational marketer. Getting the product to market can mean
multiple transportation models, such as canal boat in China, pedal power in Vietnam and speed
trains in Japan or Europe.
The physical distribution system offers more benefits than cost advantages. An effective physical
distribution system can result in optimal inventory levels and, in multi plant operations optimal
production capacity, both of which can maximise the use of working capital. In making plant
location decisions, a company with a physical distribution system can readily assess operating
costs of alternative locations to serve various markets. From the figure above, an innovative
entrepreneur can continue to increase productivity by simply using this approach.
2.1.20 Stages in the Innovation- Decision Process
An innovation is an idea, practice or object perceived as new. It matters little, so far as human
behaviour is concerned, whether or not the idea is objectively new as measured by the lapse of
time since its first introduction or discovery. If the idea seems new to the individual or decision
unit, it is an innovation. Whereas diffusion is the process by which an innovation is
communicated through certain channels overtime among the members of a social system. The
direction of the communication is usually from one or few to many. The messages are concerned
with new ideas. If we assume that the ideas reside in the home country of the MNCs (USA,
94
Britain and other developed countries), then to the extent that they have not been transferred to
Nigeria, they would be new in Nigeria. However, this newness is only relevant to the Nigerian
subsidiaries and other firms to the degree that expatriates manager from foreign firms possibly
know about them. This knowledge aside, it is only when the developed economies managers
themselves adopt such home practices that effective diffusion can occur in the entire economy of
the Nigerian entrepreneur.
Diffusion models have been used extensively in the sociological studies pertaining to the general
transfer of technological innovations. Nevertheless, it has been applied to IR by Fajana (1990)
and this thesis takes a cue from it to analyse the introduction of entrepreneurial ventures by
MNCs or by other types of domestic companies. There seems to be a considerable similarity
between management practices and physical innovations. This similarity becomes clearer when
―technology‖ is defined. Technology has been conceived as a design for instrumental action that
reduces the uncertainty in the cause-effect relationships involved in achieving a desired outcome
(Rogers, 1983 p12). For instance, a desk calculator reduces the risk of uncertainties of wrong
computations.
Furthermore, technology usually has two components: a hardware aspect or physical object, and
a software or instruction base for the tool. Some technologies consist entirely of either of these.
Hence, it is advisable to speak of political philosophies, religious ideas, a new event, a rumour,
and management practices as software technologies. This notion of management practices as
social technologies should enable the deployment, in the present venture, of diffusion research
methodology which hitherto had been well developed in consumer behaviour and restricted
almost exclusively to research on physical technology (Wentz and Eyrich, 1970).
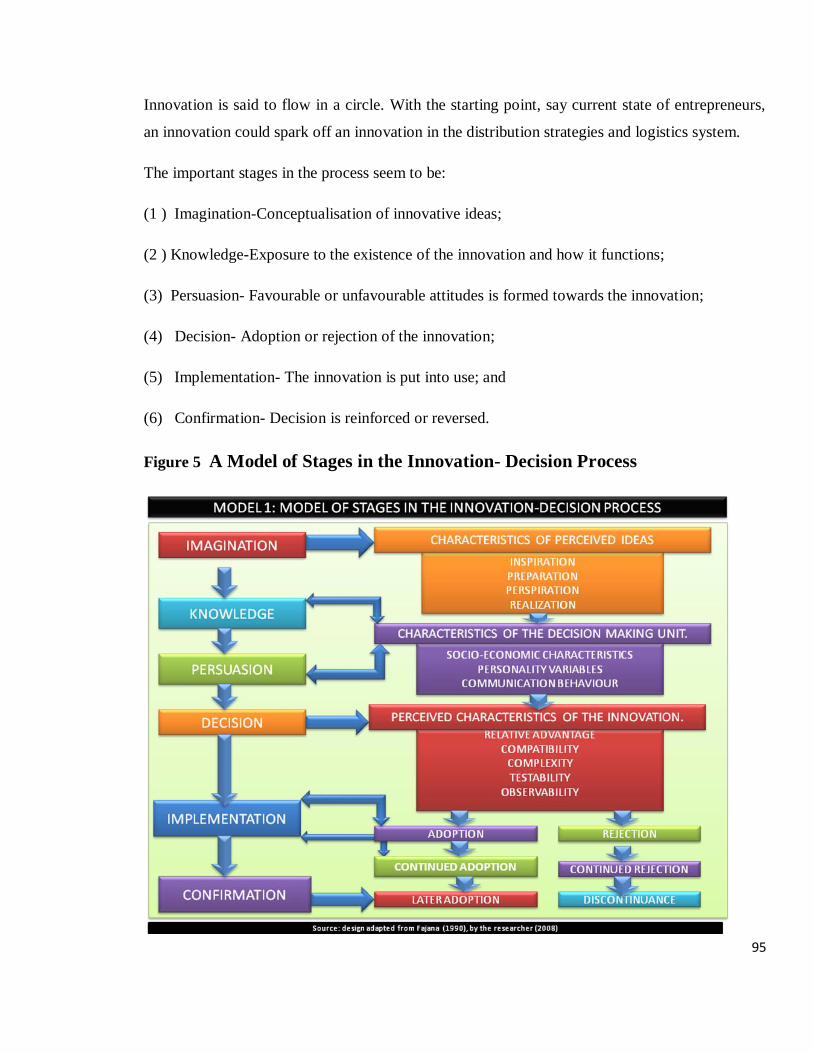
95
Innovation is said to flow in a circle. With the starting point, say current state of entrepreneurs,
an innovation could spark off an innovation in the distribution strategies and logistics system.
The important stages in the process seem to be:
(1 ) Imagination-Conceptualisation of innovative ideas;
(2 ) Knowledge-Exposure to the existence of the innovation and how it functions;
(3) Persuasion- Favourable or unfavourable attitudes is formed towards the innovation;
(4) Decision- Adoption or rejection of the innovation;
(5) Implementation- The innovation is put into use; and
(6) Confirmation- Decision is reinforced or reversed.
Figure 5 A Model of Stages in the Innovation- Decision Process
96
2.1.21 Obstructive Distribution Parameters
Factors that negatively influence the physical distribution management strategies which
according to Baker (1971) and Offiongodon (1991) can be categorised as ―obstructive
distribution parameters‖ (ODP) include the following:
Administrative bottlenecks in the collection and handling of products.
Unnecessary hoarding of products.
Inadequate storage facility.
Numerous and unnecessary middle men.
Problem of processing and packaging.
Insecurity on the Nigerian roads.
There is no doubt that over the years, a number of problems have arisen from economic policies
in Nigeria that can obstruct distribution strategies adoptable by both MNCs and DEs. These
problems, which have adversely affected the management, marketing, distribution and
productivity of enterprises in the economy, have also negatively affected innovative distribution
strategies in our production systems (Offiongodon, 1991). These obstructive distribution
parameters represent partly, another area or focus of this research work and calls for further
studies.
2.2. Theoretical Framework
This study was based on certain relevant theories that form the backbone of ideas which
provided the super structure that culminated in the development of research questions and
97
construction of hypotheses tested. The strands of arguments on the basis of these theoretical
paradigms are discussed below.
2.2.1 Theory of Distribution Channel
Distribution is traditionally the fourth element of the Marketing Mix, also called place, preceding
product, price and promotion. Distribution channels are the intermediary organisations or
channels that a product passes through before it is consumed or used. Typically, these
organisations are marketing or selling specialists and use economies of scale to bring success. In
a context of industrial or consumer products, manufacturers differ on how they distribute their
products to the consumer. Some of them distribute intensively (using a lot of intermediaries) or
exclusively (directly to the consumer).
The role of distribution is to provide for a company, the accomplishment of the task of delivering
the product at the right time, place and quantity at a minimum cost (Bucklin, 1966). Although the
distribution problem was one of the first issues analysed by the marketing researchers in the
beginning of the 20th Century (Bartels, 1965), the distribution problem has an enormous
importance in the marketing literature and managerial contexts today. According to Stern and
Reve (1980), channel theory is divided into two orientations: economic and behavioural
approaches. First analyses the efficiency of the channel, studying issues like channel design and
structure. The latter is sociologically oriented, focusing on power, cooperation, satisfaction and
conflict in channels.
The structure of channels requires a set of strategic decisions (Iyanda, 1990): The first decision
determines the appropriate intermediary type, e.g. wholesaler, retailer, franchise, broker, direct
98
sales force. The second is distribution intensity that is, how many intermediaries to include and
number of levels of a channel structure.
The second strategic decision in a channel, distribution intensity, is a key element of the channel
strategy (Iyanda,, 1990,Fulmer,I.S.; Gerhart, B. ;and Scott,K.S.,, 2003), and often dictate all the
channel structure influencing the type of intermediary, the coverage of the market, and the kind
of distribution (direct or indirect).
A variety of approaches has been taken to distribution channel, but distribution structure and
intensity has received little attention in academic research (Iyanda,. 1991; Rogers, E.M. 1983;
Rosemary- Stewart,S.E,1961); Marketing researchers are more concerned about management
issues like power, conflict, satisfaction and performance (Gaski 1996). Stern and El-Ansary
(1982) affirmed that a channel is not easily selected; there are some constraints such as the
availability of good middlemen, traditional channel patterns, product characteristics, company
finances, competitive strategies, and customer dispersion question. Mcvey (1960) expressed the
same idea when he stated that channels networks were not necessarily designed under the control
of one type of organisation and that they faced limited choices in designing the channels for their
products. He added that ―choice of a channel is not open to any firm unless it has considerable
freedom of action in matters of marketing policy.‖(P 2). According to this approach, the
producer has a variety of limitations, including limited choice of types of middlemen, customers
and locations of trading areas.
99
Some logistics authors are of the view that the channel choice is a cost and financial decision
(Lambert 1981; Bowersox 1969). Lilien et al. (1992) said the channel selection decision is not
only an economic decision but also on the control aspects of channels and their adaptability.
Wilkinson (2001) affirmed that current publications on channels did not explain how a given
channel structure came to be and how it would change over time. The assumptions analysed by
the theory are simplistic and falls within the economic approach ( Balderston, 1958; Baligh and
Richartz,1966).
The channel design publications are not sure yet if a firm choose freely or adapt in a given
channel structure. This decision depends on the innovation of the producer (Wilkinson, 2001).
So, the questions arise; Are firms able to choose or only adapt in a given channel structure? What
factors determine the choice of a channel or follow the structure in a channel?
The primary theoretical statement links distribution structure with class of products (Frazier and
Lassar, 1996; Rangan et al., 1992). The class of products are related to the classification of
consumer goods (convenience, shopping and specialty) first proposed by Copeland (1923). His
intention was to create a guide for the development of marketing strategies by manufacturers.
His purpose was to show how consumer buying habits affected the type of channel of
distribution and promotional strategy (Bucklin, 1962). According to him, convenience goods are
associated with intensive distribution, shopping goods require selective distribution and specialty
goods are related with exclusive distribution. Convenience goods are consumer goods and
services that the consumer buys frequently, immediately and with a minimum of comparison
effort. Shopping products are less frequently purchased and consumers spend considerable time
and effort gathering information and comparing alternative brands. Specialty products are
100
consumer goods with characteristics or brand identification for which a significant group of
buyers is willing to make a special purchase effort (Kotler 1997)
2.2.2 Depot Theory
The flow in the distribution channel has been explained using parallel model, model
postponement and speculation under Depot Theory. How fast do flows move to overcome
separations and match a seller‘s small segment of supply with a buyer‘s small segment of
demand? According to Aspinwall‘s (1958) Depot Theory, goods move toward consumption at a
rate established by the final consumer‘s need for replacement. As detailed in Aspinwall‘s
(1958a) Parallel Systems Theory, replacement rate is inversely related to gross margin, services
required, search time and consumption time. Thus, knowing replacement rate provides
knowledge of the other characteristics determining rate of flow.
The question of which institutional depot (manufacturer, wholesaler, retailer, household, etc.) in
the channel will hold and modify inventory is addressed by Bucklin‘s (1965) ‗Theory of
Postponement and Speculation‘. Alderson (1957) developed the postponement part, arguing that
changes in modifying products and stocking inventory should be postponed to the latest possible
point in the marketing flow because of reduced risk. Bucklin (1965) added the corollary theory
of speculation that changes in form and holding inventory should be made at the earliest possible
point in the marketing flow to take advantage of economies of scale. Thus, speculation takes
advantage of the lower costs of modifying goods early to obtain economies of scale resulting in
mass production, while postponement deals with reducing risk by modifying goods at the latest
point for segmented demand resulting in today‘s mass customisation.
101
Alderson‘s (1965) transvection represents one of the most powerful but underutilised constructs
in marketing thoughts. A transvection includes all purchases and sales from the original seller,
through intermediary purchases and sales to the final buyer of a finished product. That is, it links
all the institutions (depots) in a channel. Alderson (1957, 1965) described what takes place in a
channel transvection in terms of ‗Sorts and Transformations‘. At each institutional depot, goods
are alternatively sorted (sorted-out, accumulated, allocated or assorted) and transformed
(modified, merchandised, stored, transported, or used). If the channel is regarded as structure,
such as the banks of a river, then the transvection represents process - the flow of the river.
Therefore, aggregating the set of parallel channel-transvections taking place in a particular
economy, such as the USA, for a given time frame, say a year, provides ‗an exhaustive
description of the marketing process‘ (Alderson and Miles, 1965: 122). Thus, most fundamental
theories of channels of distribution can be synthesised into a logically coherent whole.
2.2.3 System Theory
Physical distribution can be viewed as a system of components linked together for the efficient
movement of products. Using a system approach to describe physical distribution, the
components include; customer service, transportation, warehousing, order processing, inventory
control, protective packaging and materials handling. These components are interrelated, hence:
decisions made in one area affect the relative efficiency of others. For example, a small business
that provides customised personal computers may transport finished products by air rather than
by truck, as faster delivery times may allow lower inventory costs, which would more than offset
the higher cost of air transport. Viewing physical distribution from a system‘s perspective can be
the key to providing a defined level of customer service at the lowest possible cost.
102
2.3 Empirical Framework
The existing body of knowledge on distribution strategies is vast and suggests several techniques
and management skills. Only some aspects relating to performance, something of fundamental
importance, will be highlighted here. A good starting point is the research done by Doney and
Cannon (1997), which stressed several contributions in the field. Kozak and Cohen (1997)
created a list of statements for companies to use to achieve the level of trust and commitment
with suppliers, which can be adapted in this case to distributors. Distribution builds stable
competitive advantages, since marketing channels are of long-range planning and
implementation, and to build them needs a consistent structure and due also to the fact that they
are focused on people and relationships. This sequence was elaborated based on the revision of
four existing models. (Stern et al., 1996; Rosembloon, 1999; Berman, 1996 and Kotler, 1997);
(Walters & Gattorna, 1996; Ziggers, Trienekens & Zuurbier, 1998; Trienekens & Zuurbier,
1996; among others). Anderson (1985) and John and Weitz (1988) stated that there is a
relationship between sales volume and distribution channel integration. The most important of
these are physical-specific assets, time-specific assets, information and knowledge technology,
human-specific assets, location (site) specificity and marketing/transaction specificity.
A variety of approaches has been taken to distribution channels, but distribution structure and
intensity has received little attention in academic research (Rangan, et al. 1992; Frazier and
Lassar, 1996; Rodriguez et al., 2005; Gattorna 1978). Marketing researchers are more concerned
with management issues like power, conflict, satisfaction and performance (Gaski 1996). Few
empirical studies were conducted to study distribution intensity and structure. Most of ideas
concerning channel design issues are underlying and theoretical that predicts the choice of
103
channel based on some factors. Although these constructs have been well accepted by marketing
scholars, empirical research has to be done to confirm these assumptions and to find new factors
determining the channel choice.
The primary theoretical statement links distribution structure with class of products (Frazier and
Lassar, 1996; Rangan et al., 1992). The class of products are related with the classification of
consumer goods (convenience, shopping and specialty) first proposed by Copeland (1923). His
intent was to create a guide for the development of marketing strategies by manufacturers. His
purpose was to show how consumer buying habits affected the type of channel of distribution
and promotional strategy (Bucklin, 1962). According to these characteristics convenience goods
are associated with intensive distribution, shopping goods require selective distribution and
specialty goods are related with exclusive distribution. Convenience goods are consumer goods
and services that the consumer buys frequently.
Copeland clearly defined the three categories. Convenience goods are ‗those customarily
purchased at easily accessible stores‘. Shopping goods include ―those for which a consumer
wishes to compare prices, quality, and style at the time of purchase‖. With specialty goods,
however, consumers neither travelled to a convenient store location nor made comparisons while
shopping. He thought this category so different hence he called it specialty goods, ―those which
have some (special) attraction for the consumer, other than price, which induces him to put forth
special effort to visit the store . . . and make the purchase without shopping‘ (1924:14). Although
there were a number of rationales for the three sand raised the most questions among subsequent
authors. Holton (1958) conceptualised the distinction between the categories based on the
benefits resulting from price and quality comparisons relative to searching costs. With
104
convenience goods the benefits are small and with shopping goods the benefits are large
compared to the cost of search. Specialty goods overlapped the other categories, and the
distinction Holton made is that such goods had a small demand thereby requiring a buyer‘s
special effort to find the relatively few outlets carrying them.
Luck (1959: 64) rejoined Holton‘s disparagement of specialty goods by arguing that ―the
willingness of consumers to make special purchasing efforts is explanatory, consumer oriented,
and useful‖. Although he used shopping and convenience goods categories, Aspinwall (1958b)
took a very different approach to Copeland‘s classification than prior or subsequent authors.
Using a continuous colour scheme, where red stands for convenience goods, yellow for shopping
goods and shades of orange for goods in between, he related five characteristics of goods to
length of channel and type of promotion required based on summing the values on each
characteristic. Convenience goods have a high (1) replacement rate, and are low on (2) gross
margin, (3) amount of product adjustment or service, (4) time of consumption, and (5) search
time. Based on these characteristics, such goods require long channels and broadcast advertising.
Shopping goods have a low replacement rate, and are high on the other four characteristics.
These goods require short channels and personal selling. The colours are meant to blend, and
shades of orange goods could occur anywhere in between the red and yellow. Orange was more
moderate in all characteristics, requiring mid-length channels and some broadcast promotion.
The specialty category was not included in Aspinwall‘s classification.
The application of this to the present study is that most multinational firms in Nigeria are
producers of convenience goods.
105
Bucklin (1966) contributed to the issue, stating that at distribution, four service output levels are
important: market decentralisation (fragmentation), lot size, assortment, and waiting time.
According to the author, firms chose channels that minimised the distribution costs associated
with delivery time of these outputs. Delivery time is the main factor that predicts the structure of
a channel. Bucklin argued that with a very short delivery time, the intermediate inventory is
necessary because only in this way can goods be rushed quickly to the consumer. The more the
consumer wants the good quickly, the more the inventory and safety stock is needed. These
factors create high costs and an indirect channel is required. But, there is the point that the
delivery time allowed to the consumer receives the good is larger, that it becomes possible and
cheaper for the manufacturer to ship goods directly. As the greater the delivery time the greater
are the economies of direct shipment because it eliminates the costs of handling, and maintaining
the inventory. Lilien (1979) ran a discriminate analysis with data from a sample of 125 industrial
products to study the impact of product and market factors on the selection of direct or indirect
distribution. The study showed that the channel varied from direct to indirect based on the
following:
(i). Size of the firm: The bigger the company is, the better it is able to support a company-owned
distribution channel.
(ii) Size of average order: With the increase of the average order, direct distribution becomes
more economical.
(iii) Technical-purchase complexity: The greater the importance of technical service to the
product‘s success, the more likely is direct distribution.
106
CHAPTER THREE
RESEARCH METHODOLOGY
3.0 Introduction
This section highlights and discusses the sources of data and geographical area where the study
was conducted. The chapter describes the methodology including the research methods and
design, population, sample size determination, sampling technique and procedure, sources of
data collection and techniques of analysis, research instruments adopted, its validity and
reliability.
3.1 Research Methods
Research is regarded as the process of arriving at dependable solution to problem through
objective, planned and systematic collection, analysis, interpretation and reporting of data.
Towards this end, research methods in an organisation‘s marketing and its distribution policy are
specifically adopted as an organised procedure and strategy which involves planning, structuring
and strategy of the investigating issues and problem. Otokiti (2009) identified several types of
method commonly in use in this area of study. These include survey research, experimental
research, case study research, action research, grounded theory research, ethnography research,
archival research and ex-post facto research methods. Thus the multifaceted nature of these
research methods necessitates the use of mixed approaches.
For this study, the following four research methods were employed: (1) At the initial stage,
exploratory method assisted the structuring of relationship between the statement of research
107
problems and the subsequent research questions contained in the study. (2) To answer the
questions on Innovative Distribution Strategies of MNCs and DEs, the action research method
was used. (3) At the Dangote Sugar Refinery, whereas the action method was originally designed
for the work, it was the ex-post facto method that was actually used due to non-availability of the
right type of personnel presented to the researcher for the exercise. (4) A combination of survey
and ex-post facto methods was used in Nestle Foods Nigeria Plc and African Petroleum Plc.
The descriptive survey design was used in this study. A survey is used to collect original data in
order to describe a population too large to observe directly (Mouton, 1996). In this study survey
was used to obtain information from a sample of people by means of self-report that is the people
responded to a series of questions posed by the investigator. The study, collected information
through self- administered questionnaires distributed personally to the subjects by the researcher.
The nature of this research necessitated the use of mixed approaches to meet the requirement of
collecting large and standardised data. Finally, both primary and secondary sources were used
for the data collection concerning information on the contribution of innovative teams and
distribution management/strategies. Secondary data information obtained from the published
data of the Nigerian Stock Exchange (NSE),the Nigerian Capital Market (NCM), Central Bank
of Nigeria (CBN),Federal Office Statistics (FOS) and Lagos Chamber of Commerce, Industry,
Mines and Agriculture (LCCIMA) were used. The information from NSE/NCM Fact book
(2008) was used to determine the selection and inclusion of companies in the study. Journals
and other materials from financial institutions were used to collect the required data. Additional
information on data was sourced from university libraries, including Covenant University,
University of Lagos and University of Ibadan. Internet and other sources were also explored to
source for the relevant materials for the study.
108
3.2. Research Design
The survey research design was used in carrying out this research. It involved a plan that guided
the researcher in data collection phase of the research work. In this study, a two – phase
approach was adopted - the pre-data and data/post-data collection phases. The pre-data collection
phase included the statement of research problems, objectives of the study and the formulation of
research hypotheses. The second phase included data collection, the design and population of the
study, sample size determination, sampling procedure, sampling frame, sources and techniques
of data collection, research instruments and measurement of variables and validity of research
instruments.
The design of this work followed a quantitative approach. Burns and Grove (1993; 777) defined
quantitative research as a formal, objective, systematic process to describe and test relationships
and examine cause and effect interactions among variables. A descriptive survey was selected
because it provides an accurate portrayal or account of the characteristics, for example,
behaviour, opinions, abilities, beliefs and knowledge of a particular individual situation or group.
This design was chosen to meet the objectives of the study.
3.3 Population of the Study
In marketing research for business decisions, the need for adequate and reliable data is necessary
to facilitate good marketing decisions about the population in which include companies, firms,
people and many others in a study. Burns and Grove (1993: 779), defined a population as all
elements (individuals, objects and events) that meet the sample criteria for inclusion in a study.
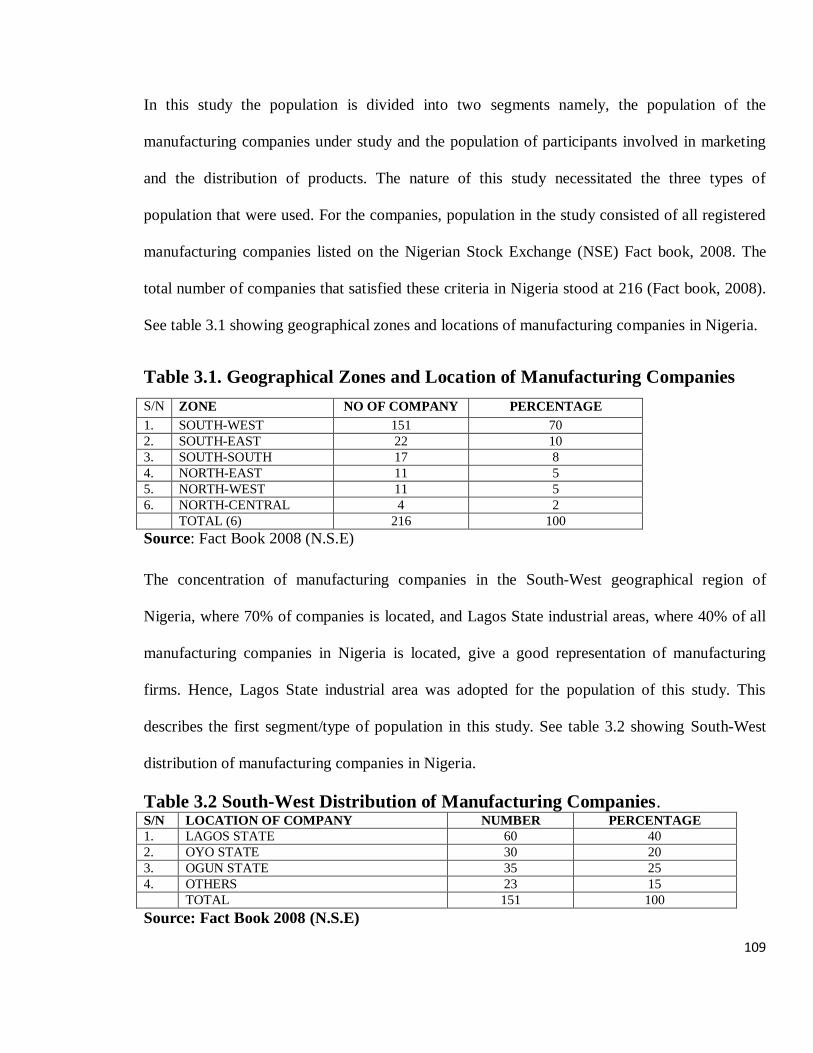
109
In this study the population is divided into two segments namely, the population of the
manufacturing companies under study and the population of participants involved in marketing
and the distribution of products. The nature of this study necessitated the three types of
population that were used. For the companies, population in the study consisted of all registered
manufacturing companies listed on the Nigerian Stock Exchange (NSE) Fact book, 2008. The
total number of companies that satisfied these criteria in Nigeria stood at 216 (Fact book, 2008).
See table 3.1 showing geographical zones and locations of manufacturing companies in Nigeria.
Table 3.1. Geographical Zones and Location of Manufacturing Companies
S/N ZONE NO OF COMPANY PERCENTAGE
1. SOUTH-WEST 151 70
2. SOUTH-EAST 22 10
3. SOUTH-SOUTH 17 8
4. NORTH-EAST 11 5
5. NORTH-WEST 11 5
6. NORTH-CENTRAL 4 2
TOTAL (6) 216 100
Source: Fact Book 2008 (N.S.E)
The concentration of manufacturing companies in the South-West geographical region of
Nigeria, where 70% of companies is located, and Lagos State industrial areas, where 40% of all
manufacturing companies in Nigeria is located, give a good representation of manufacturing
firms. Hence, Lagos State industrial area was adopted for the population of this study. This
describes the first segment/type of population in this study. See table 3.2 showing South-West
distribution of manufacturing companies in Nigeria.
Table 3.2 South-West Distribution of Manufacturing Companies. S/N LOCATION OF COMPANY NUMBER PERCENTAGE
1. LAGOS STATE 60 40
2. OYO STATE 30 20
3. OGUN STATE 35 25
4. OTHERS 23 15
TOTAL 151 100
Source: Fact Book 2008 (N.S.E)
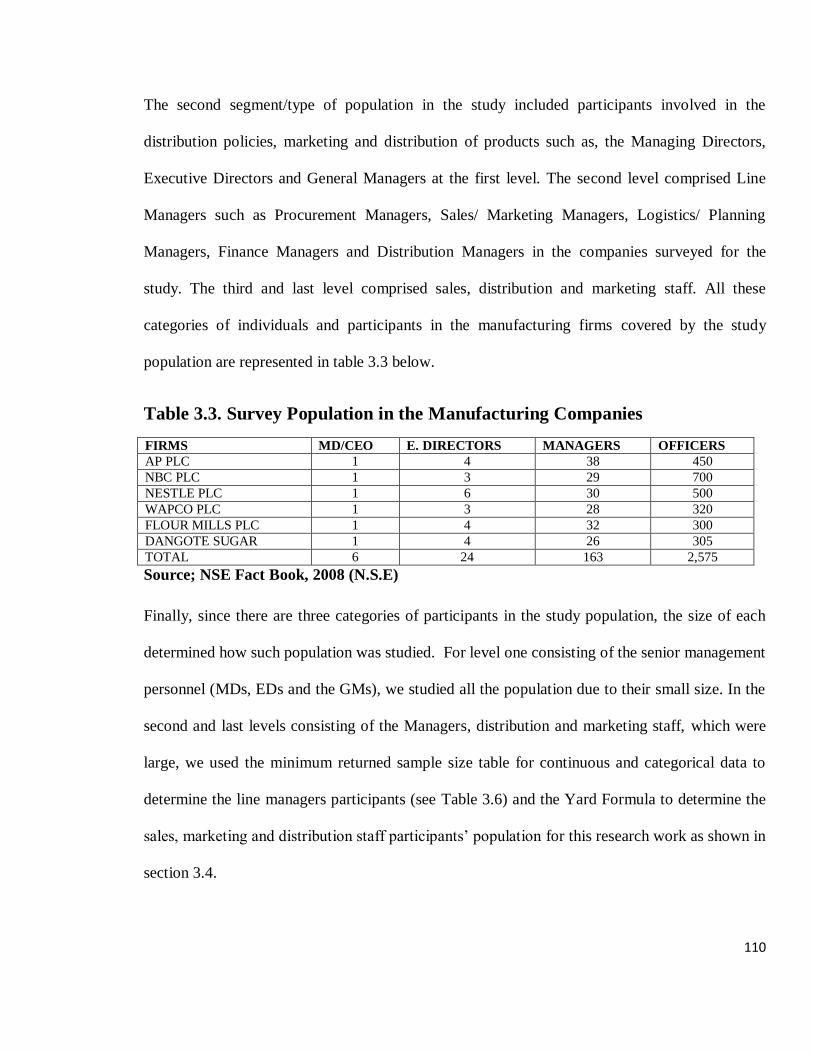
110
The second segment/type of population in the study included participants involved in the
distribution policies, marketing and distribution of products such as, the Managing Directors,
Executive Directors and General Managers at the first level. The second level comprised Line
Managers such as Procurement Managers, Sales/ Marketing Managers, Logistics/ Planning
Managers, Finance Managers and Distribution Managers in the companies surveyed for the
study. The third and last level comprised sales, distribution and marketing staff. All these
categories of individuals and participants in the manufacturing firms covered by the study
population are represented in table 3.3 below.
Table 3.3. Survey Population in the Manufacturing Companies
FIRMS MD/CEO E. DIRECTORS MANAGERS OFFICERS
AP PLC 1 4 38 450
NBC PLC 1 3 29 700
NESTLE PLC 1 6 30 500
WAPCO PLC 1 3 28 320
FLOUR MILLS PLC 1 4 32 300
DANGOTE SUGAR 1 4 26 305
TOTAL 6 24 163 2,575
Source; NSE Fact Book, 2008 (N.S.E)
Finally, since there are three categories of participants in the study population, the size of each
determined how such population was studied. For level one consisting of the senior management
personnel (MDs, EDs and the GMs), we studied all the population due to their small size. In the
second and last levels consisting of the Managers, distribution and marketing staff, which were
large, we used the minimum returned sample size table for continuous and categorical data to
determine the line managers participants (see Table 3.6) and the Yard Formula to determine the
sales, marketing and distribution staff participants‘ population for this research work as shown in
section 3.4.
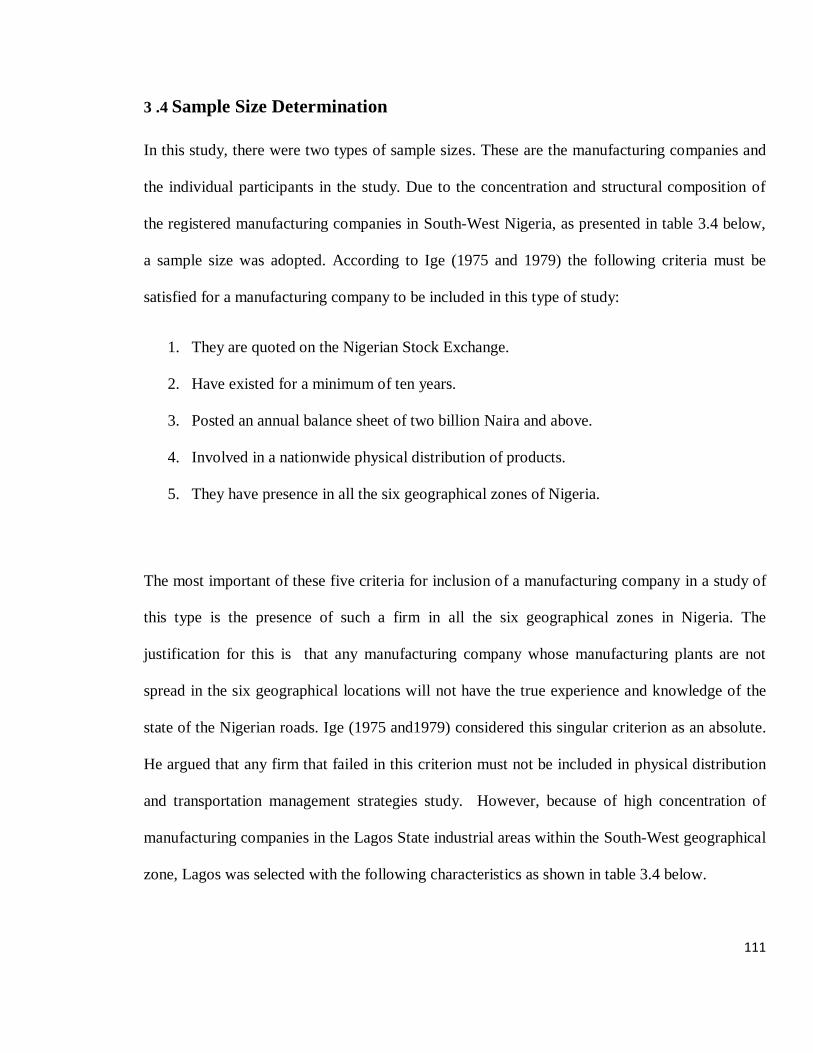
111
3 .4 Sample Size Determination
In this study, there were two types of sample sizes. These are the manufacturing companies and
the individual participants in the study. Due to the concentration and structural composition of
the registered manufacturing companies in South-West Nigeria, as presented in table 3.4 below,
a sample size was adopted. According to Ige (1975 and 1979) the following criteria must be
satisfied for a manufacturing company to be included in this type of study:
1. They are quoted on the Nigerian Stock Exchange.
2. Have existed for a minimum of ten years.
3. Posted an annual balance sheet of two billion Naira and above.
4. Involved in a nationwide physical distribution of products.
5. They have presence in all the six geographical zones of Nigeria.
The most important of these five criteria for inclusion of a manufacturing company in a study of
this type is the presence of such a firm in all the six geographical zones in Nigeria. The
justification for this is that any manufacturing company whose manufacturing plants are not
spread in the six geographical locations will not have the true experience and knowledge of the
state of the Nigerian roads. Ige (1975 and1979) considered this singular criterion as an absolute.
He argued that any firm that failed in this criterion must not be included in physical distribution
and transportation management strategies study. However, because of high concentration of
manufacturing companies in the Lagos State industrial areas within the South-West geographical
zone, Lagos was selected with the following characteristics as shown in table 3.4 below.
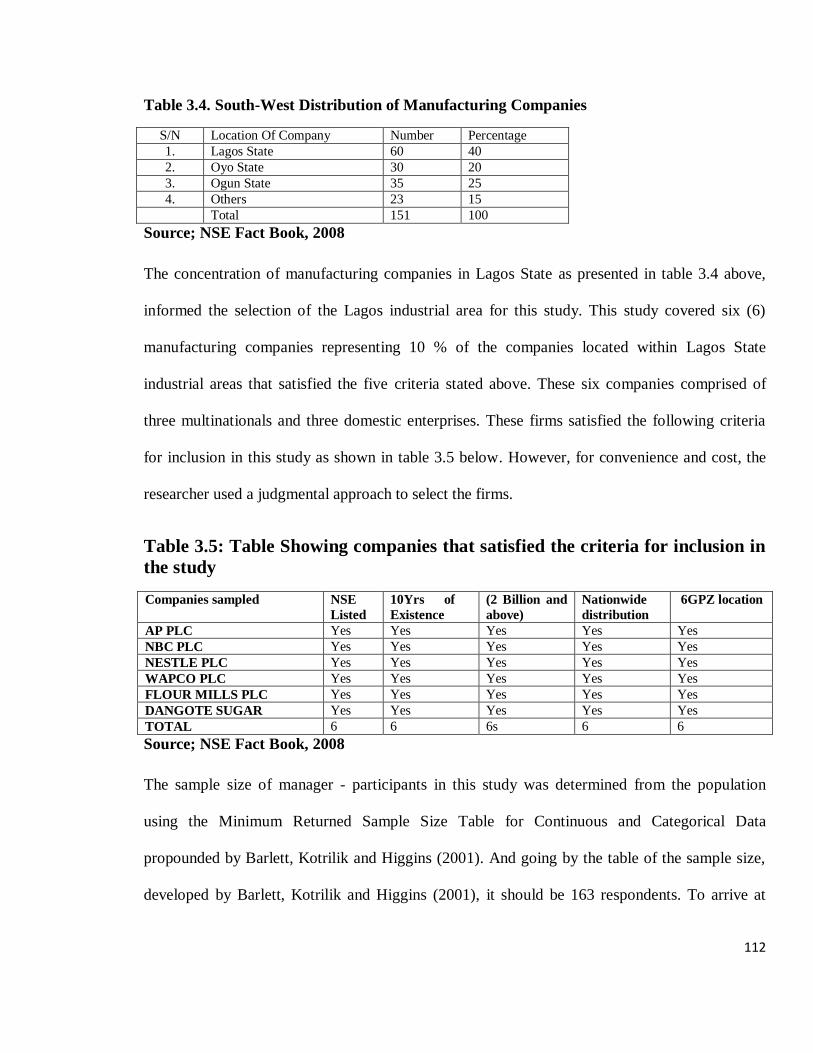
112
Table 3.4. South-West Distribution of Manufacturing Companies
S/N Location Of Company Number Percentage
1. Lagos State 60 40
2. Oyo State 30 20
3. Ogun State 35 25
4. Others 23 15
Total 151 100
Source; NSE Fact Book, 2008
The concentration of manufacturing companies in Lagos State as presented in table 3.4 above,
informed the selection of the Lagos industrial area for this study. This study covered six (6)
manufacturing companies representing 10 % of the companies located within Lagos State
industrial areas that satisfied the five criteria stated above. These six companies comprised of
three multinationals and three domestic enterprises. These firms satisfied the following criteria
for inclusion in this study as shown in table 3.5 below. However, for convenience and cost, the
researcher used a judgmental approach to select the firms.
Table 3.5: Table Showing companies that satisfied the criteria for inclusion in
the study
Companies sampled NSE
Listed
10Yrs of
Existence
(2 Billion and
above)
Nationwide
distribution
6GPZ location
AP PLC Yes Yes Yes Yes Yes
NBC PLC Yes Yes Yes Yes Yes
NESTLE PLC Yes Yes Yes Yes Yes
WAPCO PLC Yes Yes Yes Yes Yes
FLOUR MILLS PLC Yes Yes Yes Yes Yes
DANGOTE SUGAR Yes Yes Yes Yes Yes
TOTAL 6 6 6s 6 6
Source; NSE Fact Book, 2008
The sample size of manager - participants in this study was determined from the population
using the Minimum Returned Sample Size Table for Continuous and Categorical Data
propounded by Barlett, Kotrilik and Higgins (2001). And going by the table of the sample size,
developed by Barlett, Kotrilik and Higgins (2001), it should be 163 respondents. To arrive at
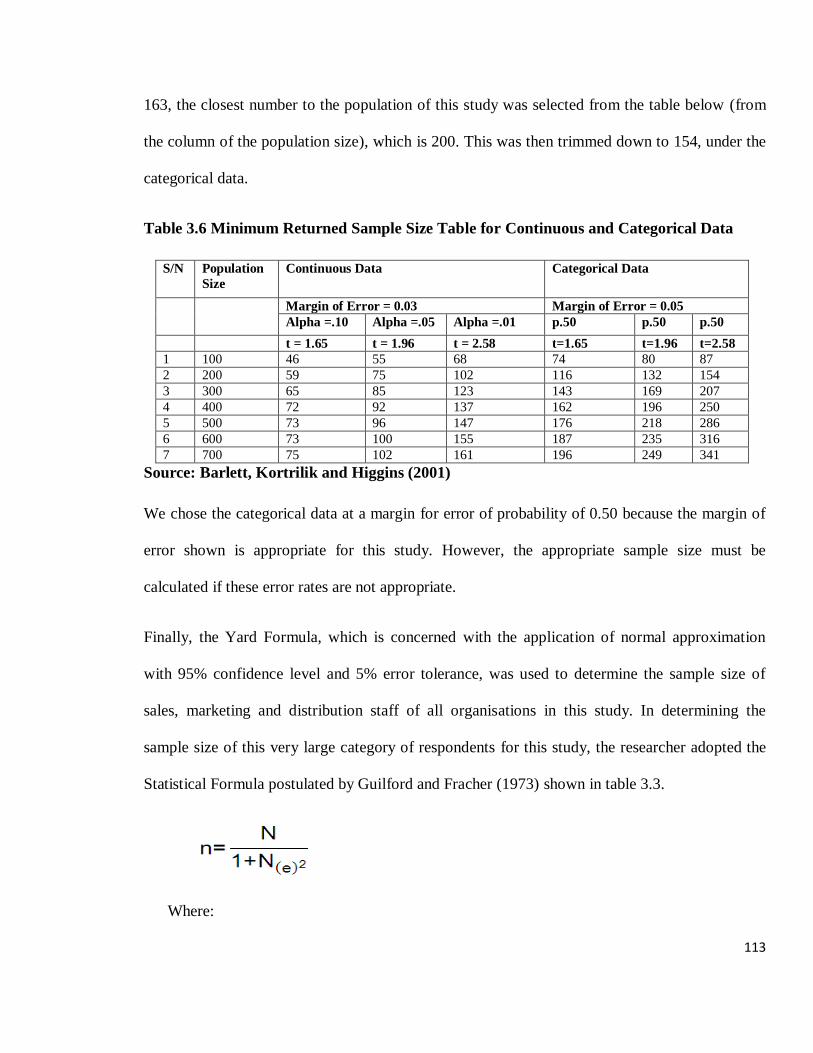
113
163, the closest number to the population of this study was selected from the table below (from
the column of the population size), which is 200. This was then trimmed down to 154, under the
categorical data.
Table 3.6 Minimum Returned Sample Size Table for Continuous and Categorical Data
S/N Population
Size
Continuous Data Categorical Data
Margin of Error = 0.03 Margin of Error = 0.05
Alpha =.10 Alpha =.05 Alpha =.01 p.50 p.50 p.50
t = 1.65 t = 1.96 t = 2.58 t=1.65 t=1.96 t=2.58
1 100 46 55 68 74 80 87
2 200 59 75 102 116 132 154
3 300 65 85 123 143 169 207
4 400 72 92 137 162 196 250
5 500 73 96 147 176 218 286
6 600 73 100 155 187 235 316
7 700 75 102 161 196 249 341
Source: Barlett, Kortrilik and Higgins (2001)
We chose the categorical data at a margin for error of probability of 0.50 because the margin of
error shown is appropriate for this study. However, the appropriate sample size must be
calculated if these error rates are not appropriate.
Finally, the Yard Formula, which is concerned with the application of normal approximation
with 95% confidence level and 5% error tolerance, was used to determine the sample size of
sales, marketing and distribution staff of all organisations in this study. In determining the
sample size of this very large category of respondents for this study, the researcher adopted the
Statistical Formula postulated by Guilford and Fracher (1973) shown in table 3.3.
Where:
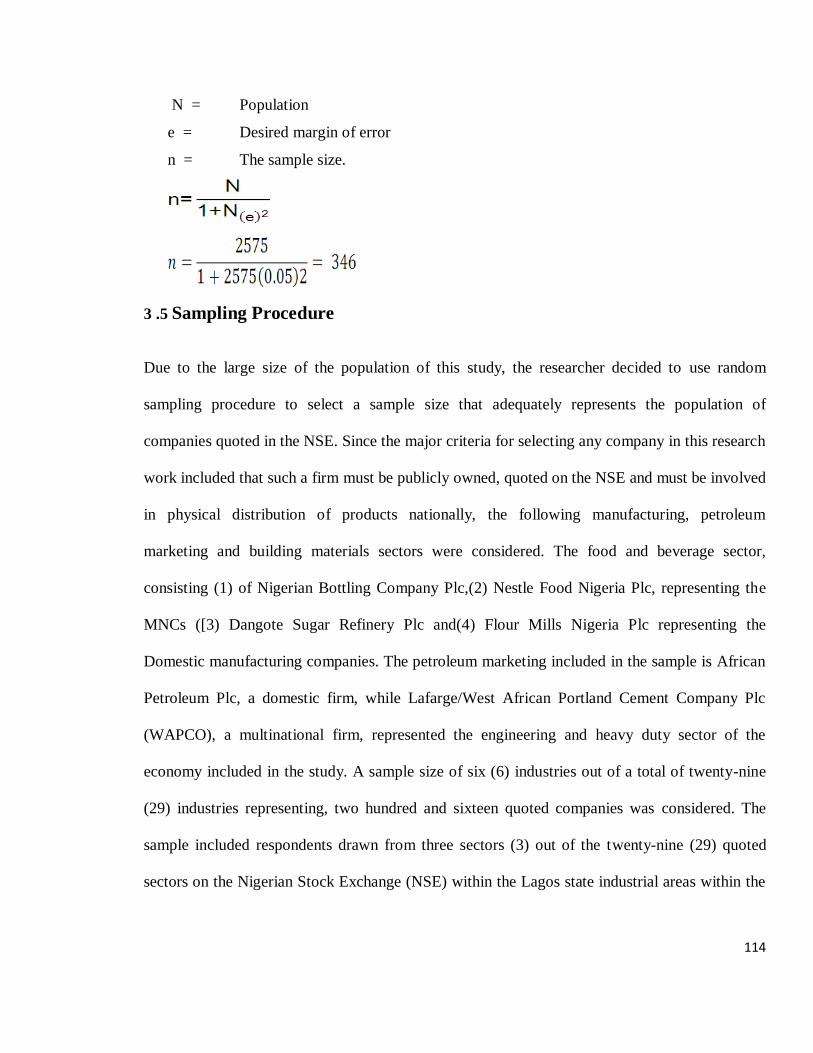
114
N = Population
e = Desired margin of error
n = The sample size.
3 .5 Sampling Procedure
Due to the large size of the population of this study, the researcher decided to use random
sampling procedure to select a sample size that adequately represents the population of
companies quoted in the NSE. Since the major criteria for selecting any company in this research
work included that such a firm must be publicly owned, quoted on the NSE and must be involved
in physical distribution of products nationally, the following manufacturing, petroleum
marketing and building materials sectors were considered. The food and beverage sector,
consisting (1) of Nigerian Bottling Company Plc,(2) Nestle Food Nigeria Plc, representing the
MNCs ([3) Dangote Sugar Refinery Plc and(4) Flour Mills Nigeria Plc representing the
Domestic manufacturing companies. The petroleum marketing included in the sample is African
Petroleum Plc, a domestic firm, while Lafarge/West African Portland Cement Company Plc
(WAPCO), a multinational firm, represented the engineering and heavy duty sector of the
economy included in the study. A sample size of six (6) industries out of a total of twenty-nine
(29) industries representing, two hundred and sixteen quoted companies was considered. The
sample included respondents drawn from three sectors (3) out of the twenty-nine (29) quoted
sectors on the Nigerian Stock Exchange (NSE) within the Lagos state industrial areas within the
115
South-West of Nigeria. The reason for using the minimum returned sample size technique is
because the study considered three sectors in the Nigerian economy as stated above.
Respondents from these sectors were drawn with validation and verification from documents
made available from the NSE Fact book, 2008 and Lagos Chamber of Commerce, Industry,
Mines and Agriculture (LCCIMA). The three sectors have been selected based on judgmental
and convenient sampling methods out of the twenty-nine registered sectors and quoted
companies on the Nigerian Capital Market (NCM, Fact book,2008), Asika (1991). The reasons
for choosing the Lagos State industrial areas are:
(i) most businesses are situated in this State
(ii) the issue of proximity was considered
(iii) all Nigerian ethnic groups are well represented in Lagos State
(iv) all multinational corporations have their head offices or main branches in Lagos State
(v) high income-earning capacity of residents at Lagos State, which serves as a motivating
factor for establishing businesses in this industrial areas.
The respondents went through a two-stage selection process. The first stage looked out for
companies quoted on the Nigerian Stock Exchange (NSE) with an annual balance sheet above
one billion naira minimum and had been in business for over five years.
The second criteria for selecting the respondents included the following technical factors:
(i) must be involved in physical distribution of products in the organization
116
(ii) must be a worker in marketing, sales or distribution departments in the organisations
(iii) must have initiated the business
(iv) must be a chief executive officer (CEO), in top management senior staff or a
distribution/marketing officer.
Some of the respondents asked for clarification on the contents of the questionnaire in order to
know how to answer the questions. Others were not very cooperative in responding to the
contents of the questionnaire. To be able to cover the Lagos industrial areas as our scope, four
research assistants were deployed. Each research assistant was assigned to Nestle Foods Nigeria
Plc, Flour Mills Nigeria Plc, Lafarge/WAPCO Plc, and Nigerian Bottling Company Plc while the
researcher solely handled Dangote Sugar Refinery Plc and African Petroleum Plc aside from the
other four companies due to the sensitivity of the latter organisations.
3 .6 Sampling Frame
This is the list of sampling entities and properties used as basis to determine the factors to
include in sampling frame, such as organisations, institutions, people, men, women, departments
and others in a study. In this study, the sampling frame includes three sectors of the Nigerian
economy- the Food and beverage; petroleum marketing; and building and engineering sectors.
Managing Directors/Chief Executive others, executive directors, general managers, managers
and distribution/sales or marketing personnel were also sampled for this study. The sampling
frame in the study was made up of organizations, people, men, women and different
departments,
117
3 .7 Sources of Data
Primary data for this study was collected through the administration of questionnaire and well
structured personal interviews.
Primary and secondary sources were also used for data collection including quoted
manufacturing companies as listed on the NSE Fact book, 2008. Secondary data information
obtained from the published documents of NSE, NCM, CBN, Federal Office of Statistics and
Lagos Chamber Of Commerce, Industry, Mines and Agriculture. Journals and other materials
from financial institutions were used for information on the contribution of innovative
distribution management strategies. Additional information on data was sourced from university
libraries like Covenant University, University of Lagos and University of Ibadan etc, and from
the Internet and other sources.
3 .8 Data Collection Techniques
The data collection technique used in selecting the respondents for the study is the Yard Formula
method. Using this method, the names of all the companies from the established sources were
first written and numbers assigned to them. The respondents were drawn using a table of random
numbers. A total of 346 respondents were randomly selected out of a total of 2575 sales/
distribution staff (see table 3.3), but because some respondents would likely fail to respond to
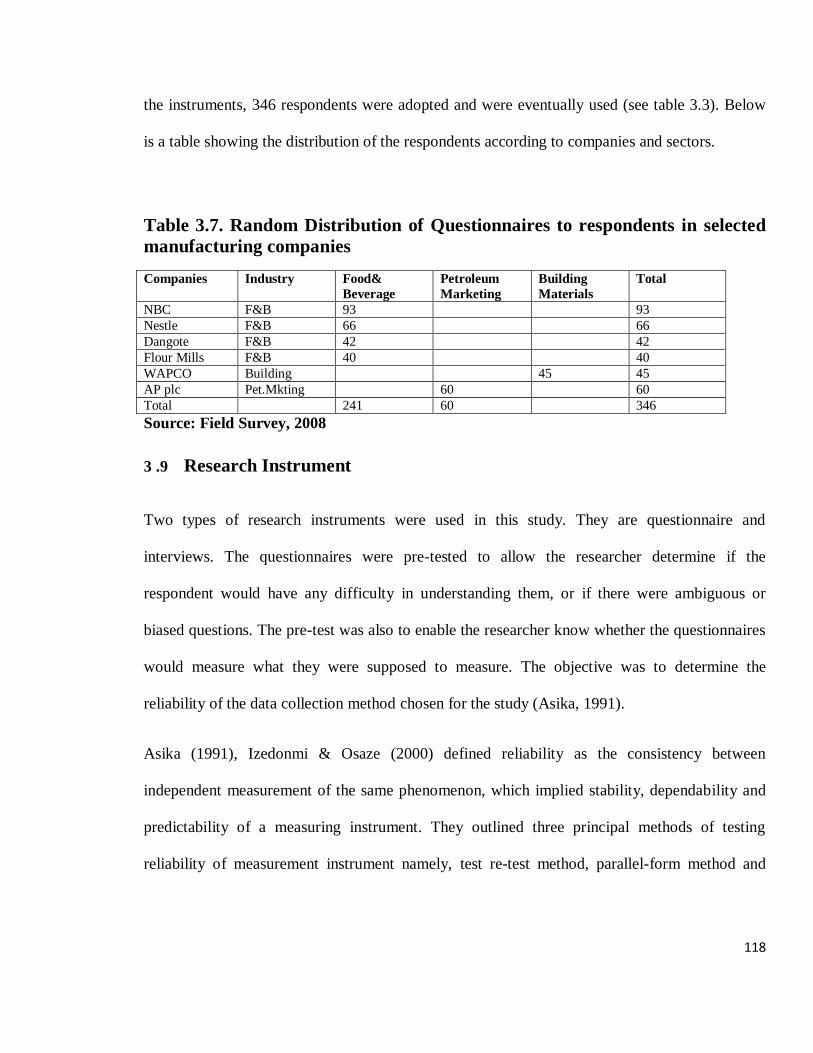
118
the instruments, 346 respondents were adopted and were eventually used (see table 3.3). Below
is a table showing the distribution of the respondents according to companies and sectors.
Table 3.7. Random Distribution of Questionnaires to respondents in selected
manufacturing companies
Companies Industry Food&
Beverage
Petroleum
Marketing
Building
Materials
Total
NBC F&B 93 93
Nestle F&B 66 66
Dangote F&B 42 42
Flour Mills F&B 40 40
WAPCO Building 45 45
AP plc Pet.Mkting 60 60
Total 241 60 346
Source: Field Survey, 2008
3 .9 Research Instrument
Two types of research instruments were used in this study. They are questionnaire and
interviews. The questionnaires were pre-tested to allow the researcher determine if the
respondent would have any difficulty in understanding them, or if there were ambiguous or
biased questions. The pre-test was also to enable the researcher know whether the questionnaires
would measure what they were supposed to measure. The objective was to determine the
reliability of the data collection method chosen for the study (Asika, 1991).
Asika (1991), Izedonmi & Osaze (2000) defined reliability as the consistency between
independent measurement of the same phenomenon, which implied stability, dependability and
predictability of a measuring instrument. They outlined three principal methods of testing
reliability of measurement instrument namely, test re-test method, parallel-form method and
119
split-half method. The test re-test reliability approach was adopted by the researcher. For the
validity of research instrument, see section 3.11.
(i) Questionnaire
The design of the questionnaire was simple and respondent-friendly. The questions were
formulated in order to elicit information on company and respondent profile. The information
sought included age, sex, marital status, and position in organisation, educational background,
type of business, level of income, number of employees at the beginning of business, location of
business, sources of capital, performance measured in terms of gross sales turnover and profit
margin. Apart from these respondents working with multinational companies‘ were also asked if
they had worked in another country before their current job; for how many years; in which
country; and what functional responsibility they were involved in.
The questionnaires were sub-divided into four major sections thus: section A: personal
information; B: company information; C: impact of foreign management in Nigeria; and D:
innovative physical distribution management strategy. Section D was sub-divided into questions
on sales turnover, recruitment and selection, innovative distribution and marketing, training cost,
salaries and wages, products distributed performance appraisal and the role of physical
distribution department in the organisation.
(ii) Interview
Apart from questionnaires, personal interviews were held with twelve top management staff and
executive directors of the six companies specifically selected in their different organisations. To
generate and assess innovativeness in the distribution strategies and teams of their organisations,
120
interviews were scheduled and used to provide a frame for the sections with the respondents. The
interviews were based on categorical and open ended questions. A list of ten questions formed
the basis of the interview section. These are: (i) a brief history of their sales profile
(ii) what methods or type of distribution strategy the company adopts, for how long and whether
the strategy in use now has been changed before
(iii) what are the likely problems affecting distribution strategy
(iv) storage and depot types in use
(v) what transportation, loading and off-loading problems are encountered
(vi) major hazards during products distribution and travelling on the Nigerian roads
(vii) special equipment or vehicles used for distribution
(viii) types of vehicles used for distribution i.e. truck, tanker or trailer
(ix) coordination of distribution strategy effectiveness at the head office; and
(x) evaluation of effectiveness and efficiency of innovative distribution strategies in the
companies.
The researcher interviewed the national distribution managers, sales manager or executive
director of sales and marketing in the selected organisations who agreed to grant interview. The
report of these interviews are in section 2.5.1 of the literature review section of the study.
Though the guide provided a format, the researcher, on several occasions expanded the questions
so as to get more detailed information from the respondents. The interview sessions were
121
conducted in English Language. The interview time for each subject ranged from approximately
45 minutes to 1 hour 30 minutes. The information gathered during the interview sessions was
compared with the evaluated questionnaires to determine the significant difference between the
two data results.
3 .10 Measurement of Variables
Items were generated mainly to assess the comparative innovative distribution strategies of
multinational companies in the study in comparison with their domestic counterparts. The
questions were derived from a careful review of the problems of cement distribution in the works
of Ige (1975, 1979) and those of Davide & Antonello (2003) and Fareeda under the guidance of
Nagendra (2010). Other texts used are, Achumba (1996), Iyanda (1990), and Nwokoye (1981).
Some questions found to be relevant from a careful review of innovative entrepreneurship
publications of Hisrich (1989) and those on problems of distribution management strategies in
the Nigerian economy in the works of Offiongodon (1991), Baker (1971) and Idabacha (1984)
were used. These questions were compiled and the unrelated questions were deleted.
The items included performance, profitability, sales turnover, returns on investments and market
share positioning of the firms (MNCs and DEs). The items frequently cited on innovation and
solutions to distribution bottlenecks were added in the questions. To capture into the knowledge
of the reactions and responses of the respondents, the questions were piloted and tested on
twenty five distribution staff of a local distribution company who were involved in transportation
and logistics of tower aluminium roofing sheets. Questions were constructed and clarified for the
final survey instruments. The 138 items were derived from the result of the piloted test and
review of different publications on innovative physical distribution management strategies. A
122
review of analysis and evaluation of distribution channels in various sectors of the cement
industry in the Indian economy (Bee Management Consultancy Pvt, Ltd, 2005), Innovation,
foreign ownership and multinationality: An empirical analysis on Italian manufacturing firms
(Davide & Antonello, 2003), Innovative distribution strategies- Selling innovative products
(http:enzinearticle.com) and Coca-Cola in India: Innovative distribution strategies with RED
approach (Fareeda under the guidance of Nagendra,2010) were used to measure the variables in
the study.
3.11 Validity of the Research Instrument
Validity test was carried out in order to ensure that the research instrument measured what it was
meant to measure. The four methods of measuring external validity are face (Selltiz et al, 1976;
Philips, 1976) and Bailey (1987); content (Kerlinger, 1964, Goode and Hatt, 1952; Bailey, 1987;
Singleton et al, 1993); criterion (Philips 1971; Selltiz et al 1976; and Bailey 1987) and construct
validity (stevens 1951, Kerlinger 1964 and Bailey 1987, Singleton et al, 1993). Face and content
validity were deployed for this study through the judgement of the supervisors and experts both
in academic institutions and organisations. Content Validity was used to determine the
appropriateness of the wording of the instrument and the objectives of the study while face
Validity was ensured to enable this researcher to assert that he had measured what he set out to
measure (Stevens, 1951). The validity measures of this study were justified using the works of
Levine (1981), Kerlinger (1983), Bailey 1987, Ekpo-Ufot (1992), Singleton et al, 1993. To
ensure face and content validity of the instrument (content-related evidence) senior academics on
entrepreneurship and enterprise development studies, specialists and experts on the topic of
research measured by the instrument were asked to provide inputs and critique the
123
appropriateness of the items on the instrument as earlier mentioned. This was done in order to
discover if the instrument covered the content area and to ascertain if the instrument contains a
representative sample of the content being assessed. The study also confirmed the format used as
appropriate for information from those using the instrument. The Cronbach Alpha of 0.78 was
obtained for the entire instrument. However, the Cronbach Alpha for the subscales were
provided in the appendix
3.12 Reliability of the Research Instrument
Reliability test ensures that the instrument measures consistently as required. It also shows the
extent to which the researcher can confidently rely on the information obtained through the use
of the instrument adopted to gather data for the research work. Consequently, data collected were
subjected to reliability analysis to establish the reliability of the measures and ensure consistent
measurement among the various measurements in the instrument (Goode and Hatt, 1952,
Kerlinger, 1964, Philips, 1976, Selltiz et al, 1976, Bailey, 1987, Singleton et al, 1993). Analysis
to the reliability of coefficient will be used. The reliability measures were justified using the
works of Goode and Hatt (1952). A major reliability test was carried out to ensure the reliability
of the instrument. This included test-retest method. Each of these reliability test instrument
measures consistency differently. The result of the reliability test for the entire instrument
showed r=0.78. This implies that the various research instruments were adequate and suitable for
the analysis expected to be produced at the end of the study. However, the reliability indices for
the subscales were provided in the appendix
124
3.13 Method of Data Analysis
The data were analysed using both manual and electronics-based methods through the data
preparation grid and Statistical Package for the Social Sciences, (SPSS). The utilisation of
structured grids allows specific responses to be located with relative ease and facilitate the
identification of emerging patterns (Munn and Drever, 1990). Also, descriptive, statistical and
content analyses techniques were used in the analysis of the data collected. By the use of
descriptive analysis the study was able to achieve the mean, frequency distribution and
percentage results of the research work. Statistically, the study was able to utilise the following
statistical tools: Analysis of Variance (ANOVA), Correlation Coefficient and Regression
Analysis in testing the hypotheses.
Other methods of data analysis in this study included parametric and non-parametric
measurement such as trend analysis and pictorial graphs i.e. (pie-chart and histogram).
For hypothesis 1, Independent t-test was used.
For hypotheses 2, 3 and 4 Simple linear regression analysis was used.
For hypothesis 5, Correlation coefficient was used.
In the analyses, the researcher was able to carry out a sector by sector review of the variables and
company by comparison in testing the data.
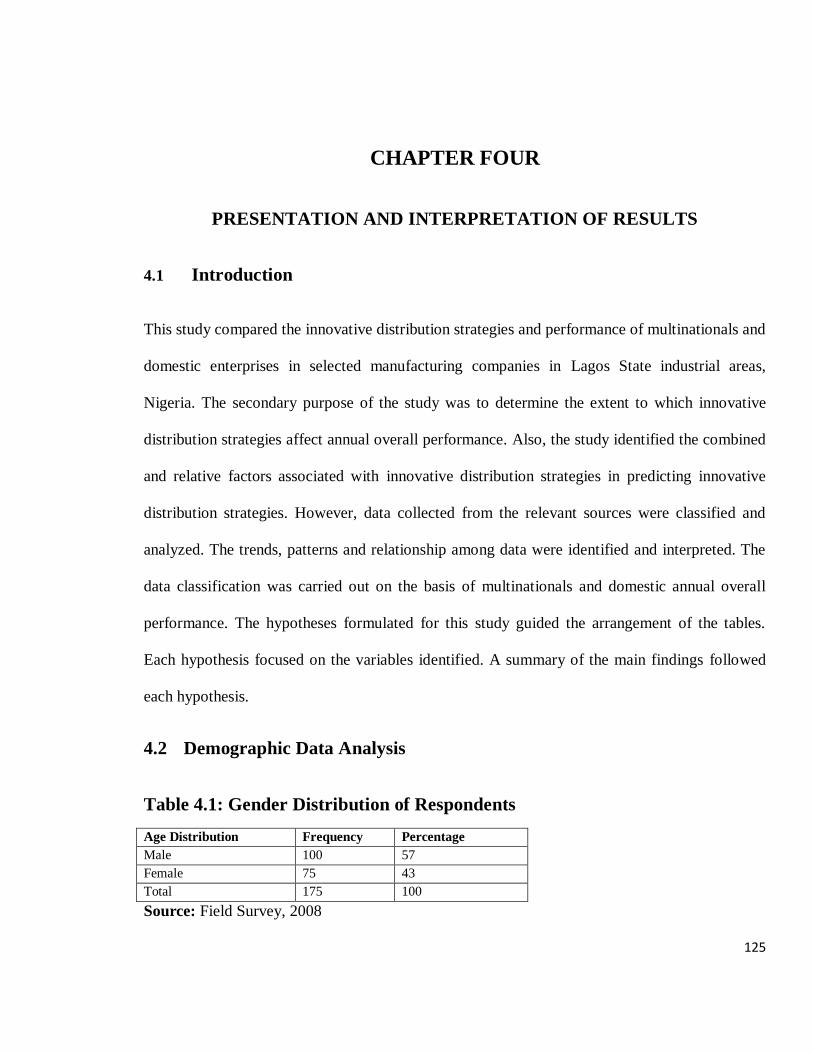
125
CHAPTER FOUR
PRESENTATION AND INTERPRETATION OF RESULTS
4.1 Introduction
This study compared the innovative distribution strategies and performance of multinationals and
domestic enterprises in selected manufacturing companies in Lagos State industrial areas,
Nigeria. The secondary purpose of the study was to determine the extent to which innovative
distribution strategies affect annual overall performance. Also, the study identified the combined
and relative factors associated with innovative distribution strategies in predicting innovative
distribution strategies. However, data collected from the relevant sources were classified and
analyzed. The trends, patterns and relationship among data were identified and interpreted. The
data classification was carried out on the basis of multinationals and domestic annual overall
performance. The hypotheses formulated for this study guided the arrangement of the tables.
Each hypothesis focused on the variables identified. A summary of the main findings followed
each hypothesis.
4.2 Demographic Data Analysis
Table 4.1: Gender Distribution of Respondents
Age Distribution Frequency Percentage
Male 100 57
Female 75 43
Total 175 100
Source: Field Survey, 2008
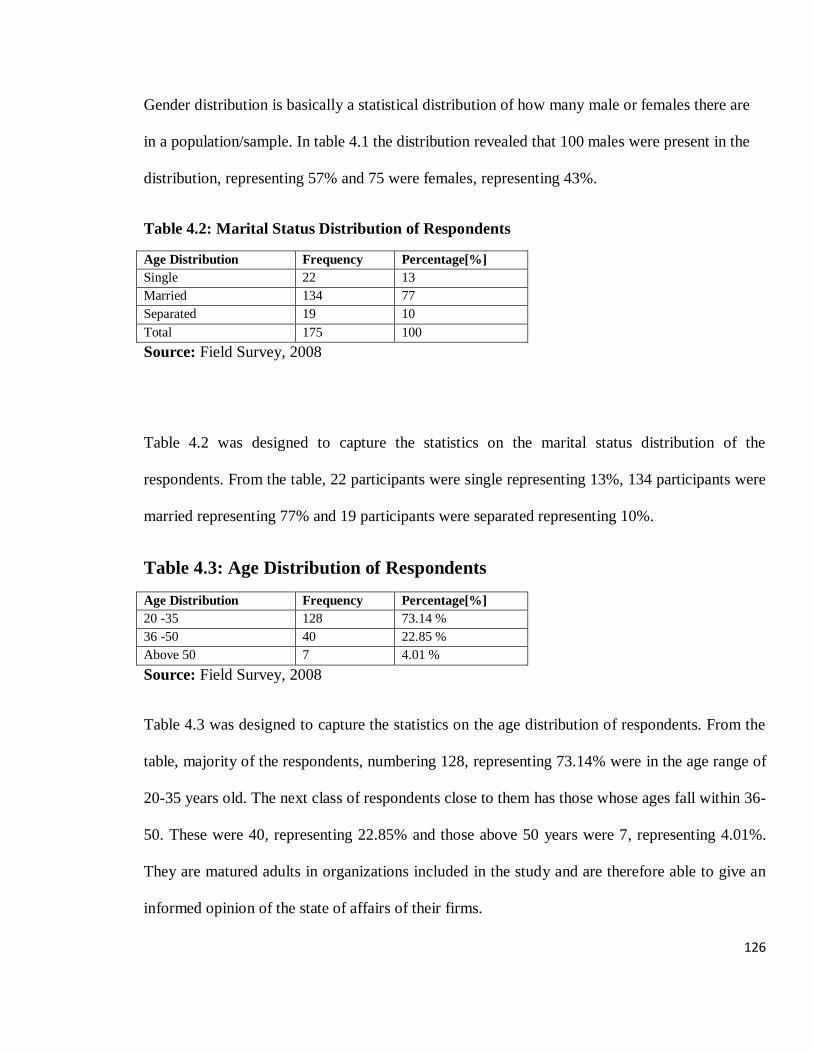
126
Gender distribution is basically a statistical distribution of how many male or females there are
in a population/sample. In table 4.1 the distribution revealed that 100 males were present in the
distribution, representing 57% and 75 were females, representing 43%.
Table 4.2: Marital Status Distribution of Respondents
Age Distribution Frequency Percentage[%]
Single 22 13
Married 134 77
Separated 19 10
Total 175 100
Source: Field Survey, 2008
Table 4.2 was designed to capture the statistics on the marital status distribution of the
respondents. From the table, 22 participants were single representing 13%, 134 participants were
married representing 77% and 19 participants were separated representing 10%.
Table 4.3: Age Distribution of Respondents
Age Distribution Frequency Percentage[%]
20 -35 128 73.14 %
36 -50 40 22.85 %
Above 50 7 4.01 %
Source: Field Survey, 2008
Table 4.3 was designed to capture the statistics on the age distribution of respondents. From the
table, majority of the respondents, numbering 128, representing 73.14% were in the age range of
20-35 years old. The next class of respondents close to them has those whose ages fall within 36-
50. These were 40, representing 22.85% and those above 50 years were 7, representing 4.01%.
They are matured adults in organizations included in the study and are therefore able to give an
informed opinion of the state of affairs of their firms.
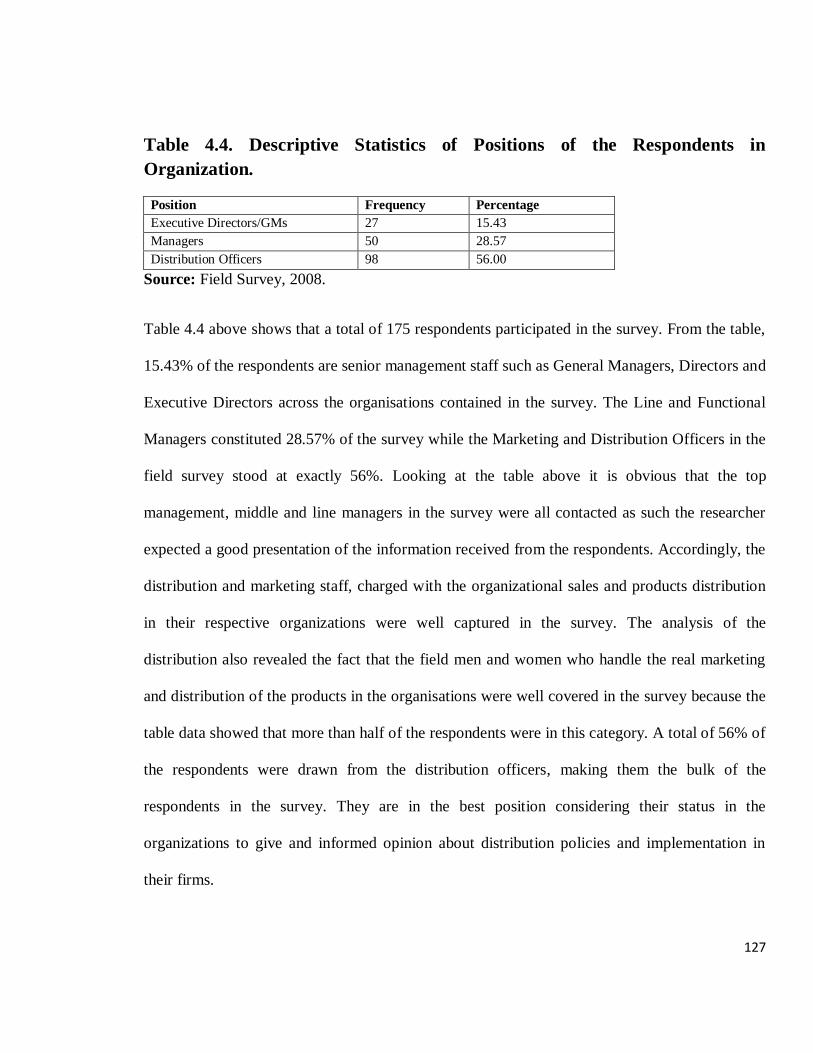
127
Table 4.4. Descriptive Statistics of Positions of the Respondents in
Organization.
Position Frequency Percentage
Executive Directors/GMs 27 15.43
Managers 50 28.57
Distribution Officers 98 56.00
Source: Field Survey, 2008.
Table 4.4 above shows that a total of 175 respondents participated in the survey. From the table,
15.43% of the respondents are senior management staff such as General Managers, Directors and
Executive Directors across the organisations contained in the survey. The Line and Functional
Managers constituted 28.57% of the survey while the Marketing and Distribution Officers in the
field survey stood at exactly 56%. Looking at the table above it is obvious that the top
management, middle and line managers in the survey were all contacted as such the researcher
expected a good presentation of the information received from the respondents. Accordingly, the
distribution and marketing staff, charged with the organizational sales and products distribution
in their respective organizations were well captured in the survey. The analysis of the
distribution also revealed the fact that the field men and women who handle the real marketing
and distribution of the products in the organisations were well covered in the survey because the
table data showed that more than half of the respondents were in this category. A total of 56% of
the respondents were drawn from the distribution officers, making them the bulk of the
respondents in the survey. They are in the best position considering their status in the
organizations to give and informed opinion about distribution policies and implementation in
their firms.
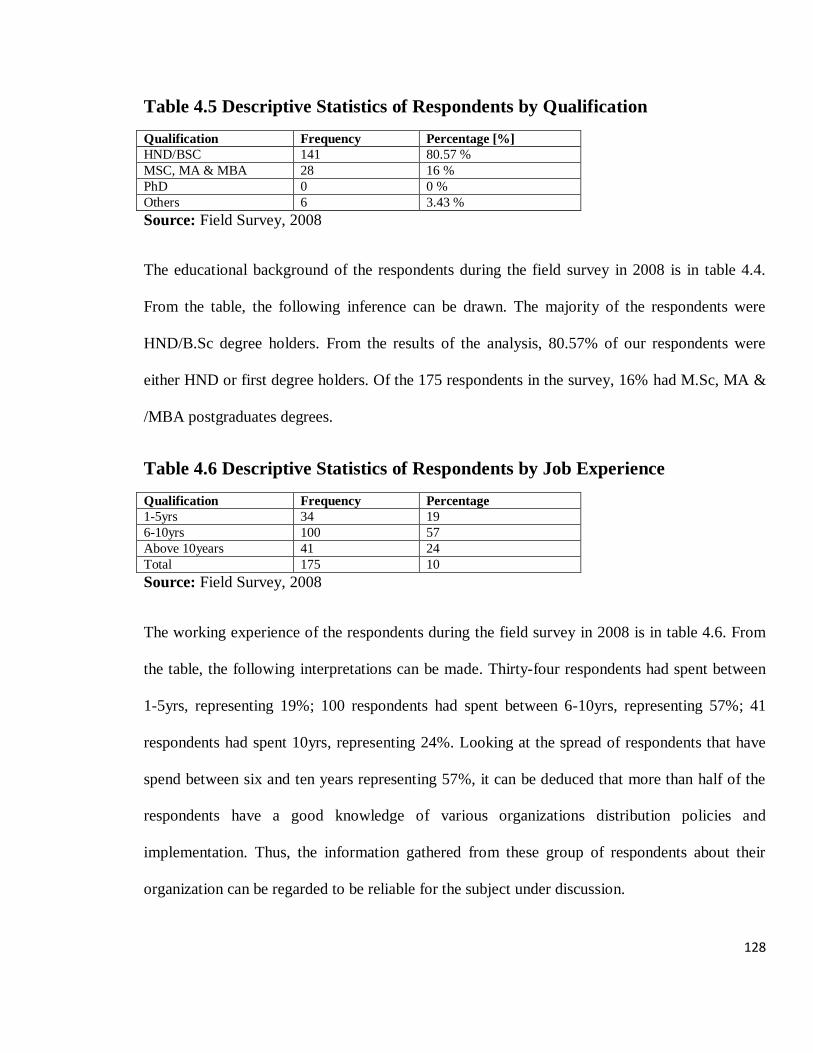
128
Table 4.5 Descriptive Statistics of Respondents by Qualification
Qualification Frequency Percentage [%]
HND/BSC 141 80.57 %
MSC, MA & MBA 28 16 %
PhD 0 0 %
Others 6 3.43 %
Source: Field Survey, 2008
The educational background of the respondents during the field survey in 2008 is in table 4.4.
From the table, the following inference can be drawn. The majority of the respondents were
HND/B.Sc degree holders. From the results of the analysis, 80.57% of our respondents were
either HND or first degree holders. Of the 175 respondents in the survey, 16% had M.Sc, MA &
/MBA postgraduates degrees.
Table 4.6 Descriptive Statistics of Respondents by Job Experience
Qualification Frequency Percentage
1-5yrs 34 19
6-10yrs 100 57
Above 10years 41 24
Total 175 10
Source: Field Survey, 2008
The working experience of the respondents during the field survey in 2008 is in table 4.6. From
the table, the following interpretations can be made. Thirty-four respondents had spent between
1-5yrs, representing 19%; 100 respondents had spent between 6-10yrs, representing 57%; 41
respondents had spent 10yrs, representing 24%. Looking at the spread of respondents that have
spend between six and ten years representing 57%, it can be deduced that more than half of the
respondents have a good knowledge of various organizations distribution policies and
implementation. Thus, the information gathered from these group of respondents about their
organization can be regarded to be reliable for the subject under discussion.
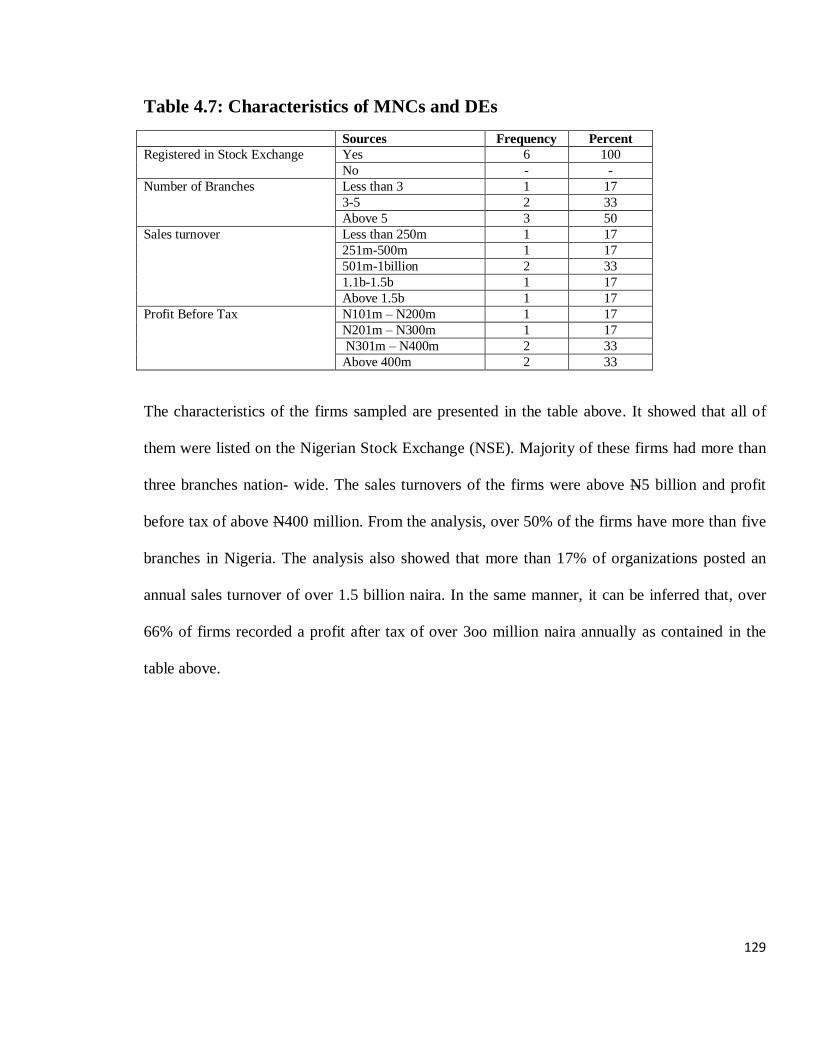
129
Table 4.7: Characteristics of MNCs and DEs
Sources Frequency Percent
Registered in Stock Exchange Yes 6 100
No - -
Number of Branches Less than 3 1 17
3-5 2 33
Above 5 3 50
Sales turnover Less than 250m 1 17
251m-500m 1 17
501m-1billion 2 33
1.1b-1.5b 1 17
Above 1.5b 1 17
Profit Before Tax N101m – N200m 1 17
N201m – N300m 1 17
N301m – N400m 2 33
Above 400m 2 33
The characteristics of the firms sampled are presented in the table above. It showed that all of
them were listed on the Nigerian Stock Exchange (NSE). Majority of these firms had more than
three branches nation- wide. The sales turnovers of the firms were above N5 billion and profit
before tax of above N400 million. From the analysis, over 50% of the firms have more than five
branches in Nigeria. The analysis also showed that more than 17% of organizations posted an
annual sales turnover of over 1.5 billion naira. In the same manner, it can be inferred that, over
66% of firms recorded a profit after tax of over 3oo million naira annually as contained in the
table above.
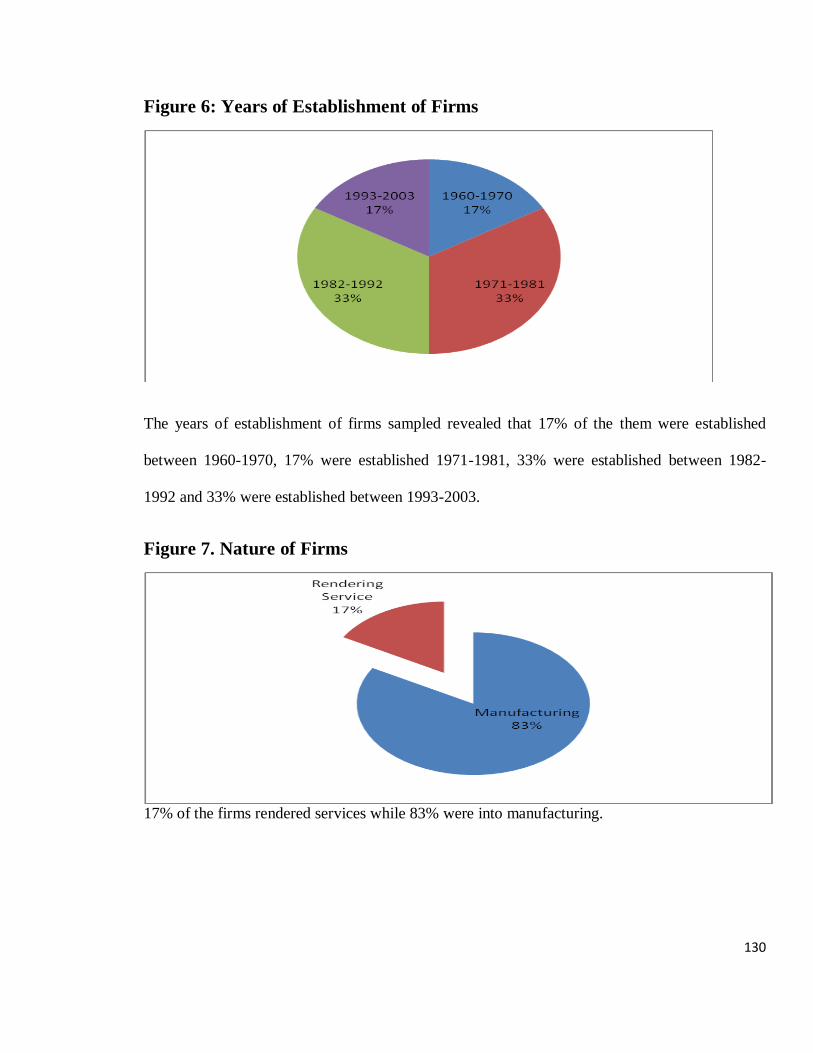
130
Figure 6: Years of Establishment of Firms
The years of establishment of firms sampled revealed that 17% of the them were established
between 1960-1970, 17% were established 1971-1981, 33% were established between 1982-
1992 and 33% were established between 1993-2003.
Figure 7. Nature of Firms
17% of the firms rendered services while 83% were into manufacturing.
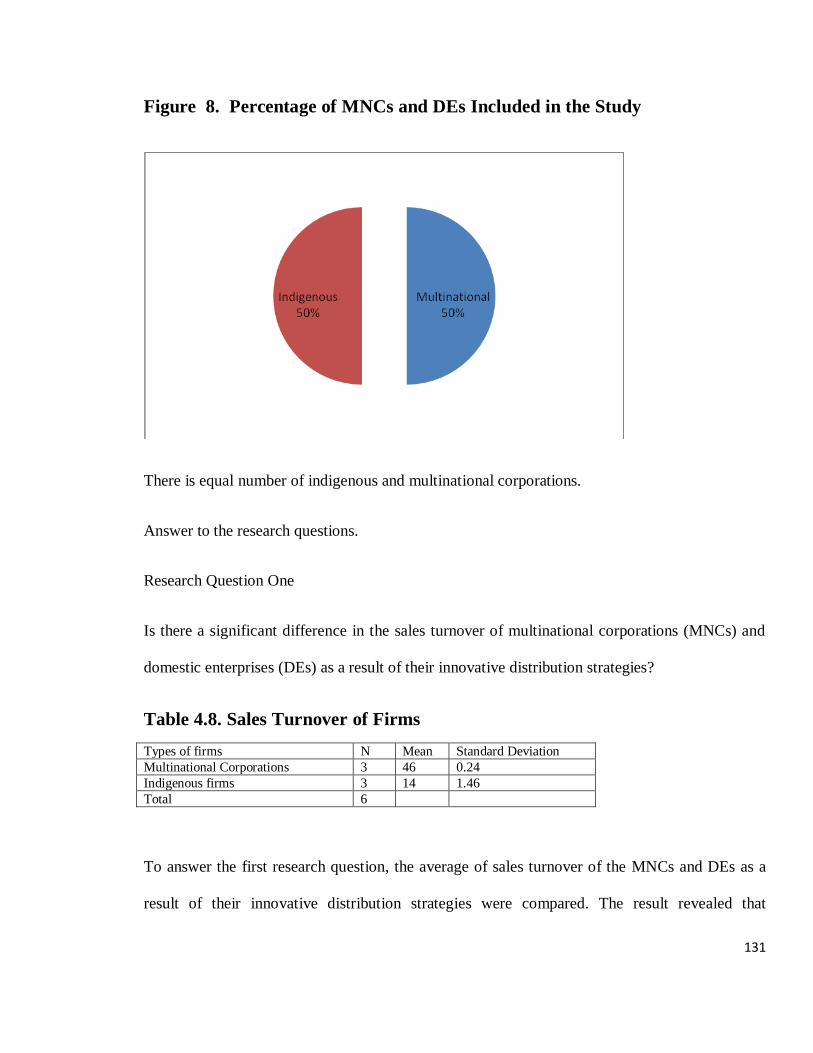
131
Figure 8. Percentage of MNCs and DEs Included in the Study
There is equal number of indigenous and multinational corporations.
Answer to the research questions.
Research Question One
Is there a significant difference in the sales turnover of multinational corporations (MNCs) and
domestic enterprises (DEs) as a result of their innovative distribution strategies?
Table 4.8. Sales Turnover of Firms
Types of firms N Mean Standard Deviation
Multinational Corporations 3 46 0.24
Indigenous firms 3 14 1.46
Total 6
To answer the first research question, the average of sales turnover of the MNCs and DEs as a
result of their innovative distribution strategies were compared. The result revealed that
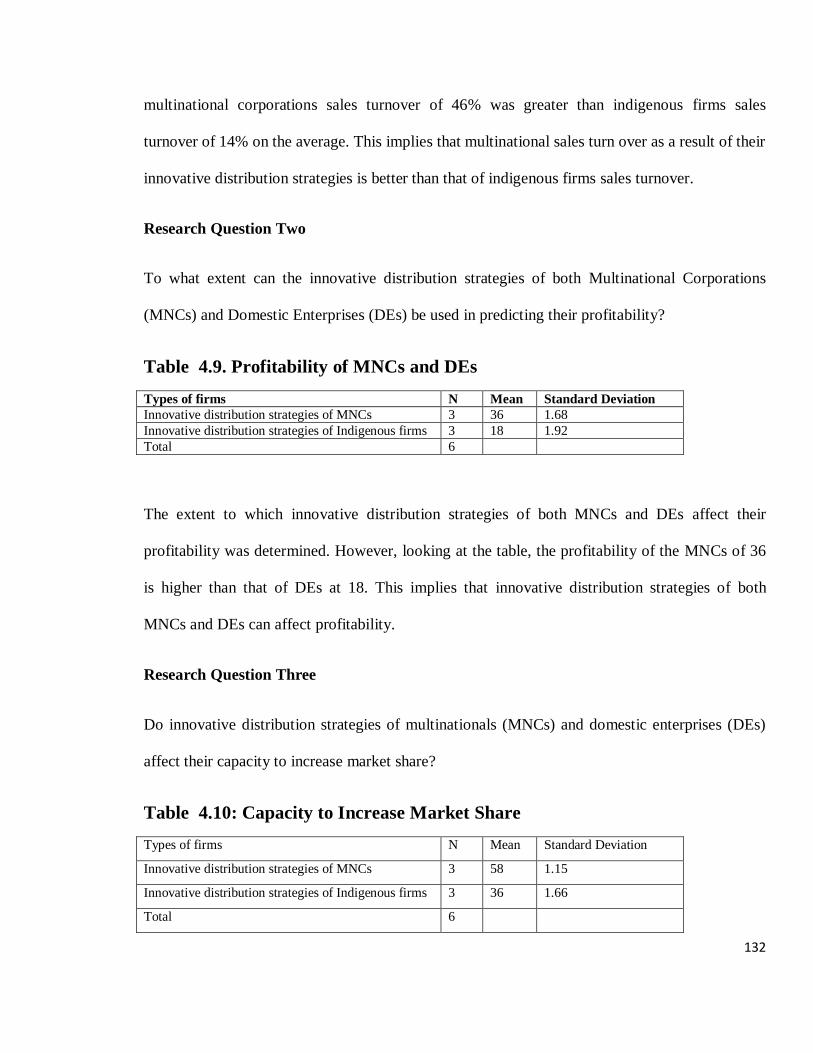
132
multinational corporations sales turnover of 46% was greater than indigenous firms sales
turnover of 14% on the average. This implies that multinational sales turn over as a result of their
innovative distribution strategies is better than that of indigenous firms sales turnover.
Research Question Two
To what extent can the innovative distribution strategies of both Multinational Corporations
(MNCs) and Domestic Enterprises (DEs) be used in predicting their profitability?
Table 4.9. Profitability of MNCs and DEs
Types of firms N Mean Standard Deviation
Innovative distribution strategies of MNCs 3 36 1.68
Innovative distribution strategies of Indigenous firms 3 18 1.92
Total 6
The extent to which innovative distribution strategies of both MNCs and DEs affect their
profitability was determined. However, looking at the table, the profitability of the MNCs of 36
is higher than that of DEs at 18. This implies that innovative distribution strategies of both
MNCs and DEs can affect profitability.
Research Question Three
Do innovative distribution strategies of multinationals (MNCs) and domestic enterprises (DEs)
affect their capacity to increase market share?
Table 4.10: Capacity to Increase Market Share
Types of firms N Mean Standard Deviation
Innovative distribution strategies of MNCs 3 58 1.15
Innovative distribution strategies of Indigenous firms 3 36 1.66
Total 6
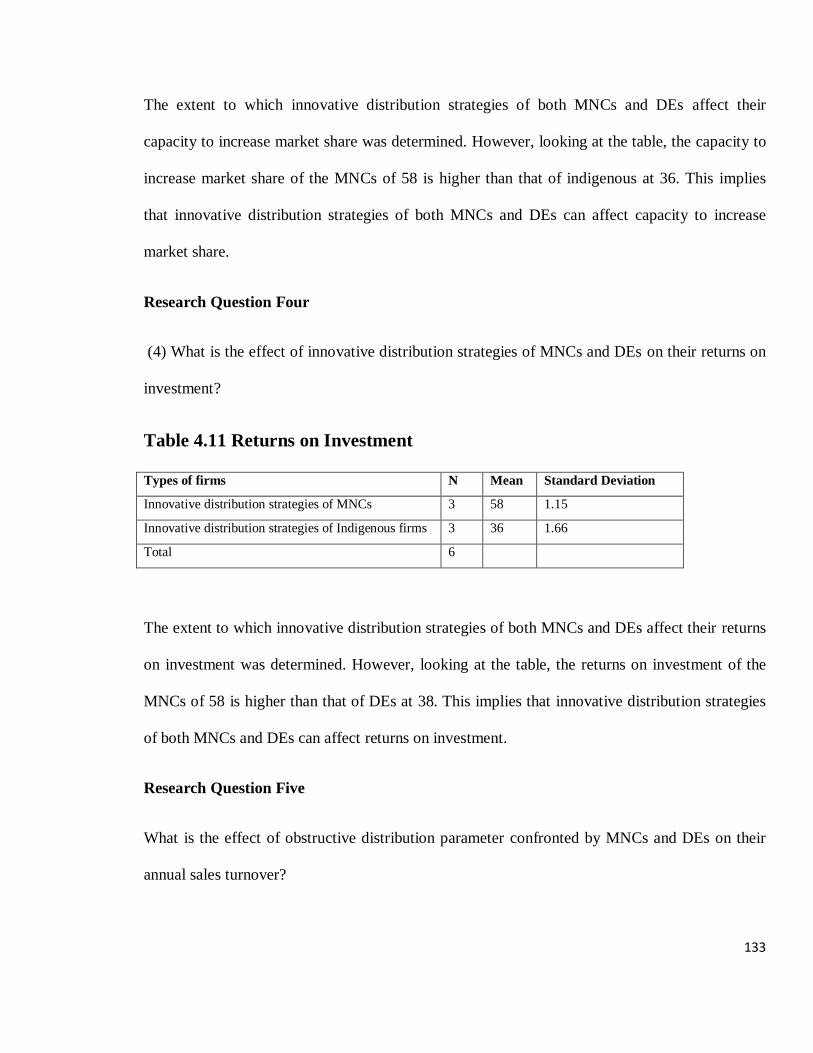
133
The extent to which innovative distribution strategies of both MNCs and DEs affect their
capacity to increase market share was determined. However, looking at the table, the capacity to
increase market share of the MNCs of 58 is higher than that of indigenous at 36. This implies
that innovative distribution strategies of both MNCs and DEs can affect capacity to increase
market share.
Research Question Four
(4) What is the effect of innovative distribution strategies of MNCs and DEs on their returns on
investment?
Table 4.11 Returns on Investment
Types of firms N Mean Standard Deviation
Innovative distribution strategies of MNCs 3 58 1.15
Innovative distribution strategies of Indigenous firms 3 36 1.66
Total 6
The extent to which innovative distribution strategies of both MNCs and DEs affect their returns
on investment was determined. However, looking at the table, the returns on investment of the
MNCs of 58 is higher than that of DEs at 38. This implies that innovative distribution strategies
of both MNCs and DEs can affect returns on investment.
Research Question Five
What is the effect of obstructive distribution parameter confronted by MNCs and DEs on their
annual sales turnover?
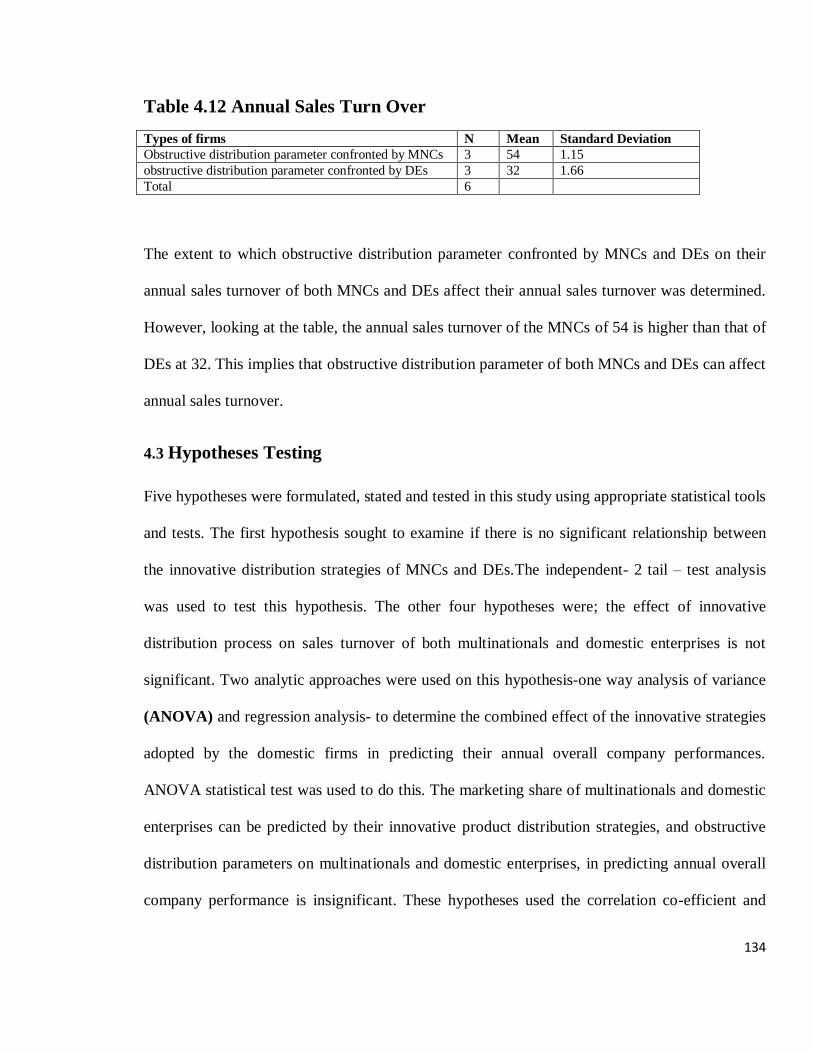
134
Table 4.12 Annual Sales Turn Over
Types of firms N Mean Standard Deviation
Obstructive distribution parameter confronted by MNCs 3 54 1.15
obstructive distribution parameter confronted by DEs 3 32 1.66
Total 6
The extent to which obstructive distribution parameter confronted by MNCs and DEs on their
annual sales turnover of both MNCs and DEs affect their annual sales turnover was determined.
However, looking at the table, the annual sales turnover of the MNCs of 54 is higher than that of
DEs at 32. This implies that obstructive distribution parameter of both MNCs and DEs can affect
annual sales turnover.
4.3 Hypotheses Testing
Five hypotheses were formulated, stated and tested in this study using appropriate statistical tools
and tests. The first hypothesis sought to examine if there is no significant relationship between
the innovative distribution strategies of MNCs and DEs.The independent- 2 tail – test analysis
was used to test this hypothesis. The other four hypotheses were; the effect of innovative
distribution process on sales turnover of both multinationals and domestic enterprises is not
significant. Two analytic approaches were used on this hypothesis-one way analysis of variance
(ANOVA) and regression analysis- to determine the combined effect of the innovative strategies
adopted by the domestic firms in predicting their annual overall company performances.
ANOVA statistical test was used to do this. The marketing share of multinationals and domestic
enterprises can be predicted by their innovative product distribution strategies, and obstructive
distribution parameters on multinationals and domestic enterprises, in predicting annual overall
company performance is insignificant. These hypotheses used the correlation co-efficient and
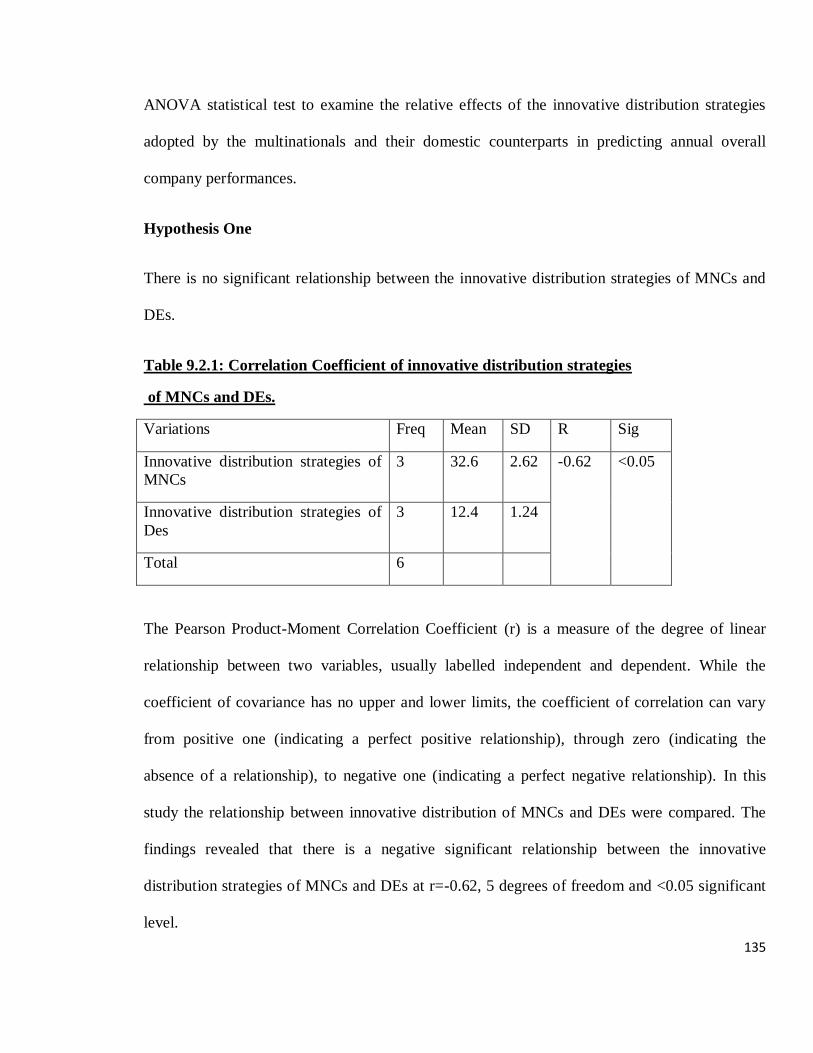
135
ANOVA statistical test to examine the relative effects of the innovative distribution strategies
adopted by the multinationals and their domestic counterparts in predicting annual overall
company performances.
Hypothesis One
There is no significant relationship between the innovative distribution strategies of MNCs and
DEs.
Table 9.2.1: Correlation Coefficient of innovative distribution strategies
of MNCs and DEs.
Variations Freq Mean SD R Sig
Innovative distribution strategies of
MNCs
3 32.6 2.62 -0.62 <0.05
Innovative distribution strategies of
Des
3 12.4 1.24
Total 6
The Pearson Product-Moment Correlation Coefficient (r) is a measure of the degree of linear
relationship between two variables, usually labelled independent and dependent. While the
coefficient of covariance has no upper and lower limits, the coefficient of correlation can vary
from positive one (indicating a perfect positive relationship), through zero (indicating the
absence of a relationship), to negative one (indicating a perfect negative relationship). In this
study the relationship between innovative distribution of MNCs and DEs were compared. The
findings revealed that there is a negative significant relationship between the innovative
distribution strategies of MNCs and DEs at r=-0.62, 5 degrees of freedom and <0.05 significant
level.
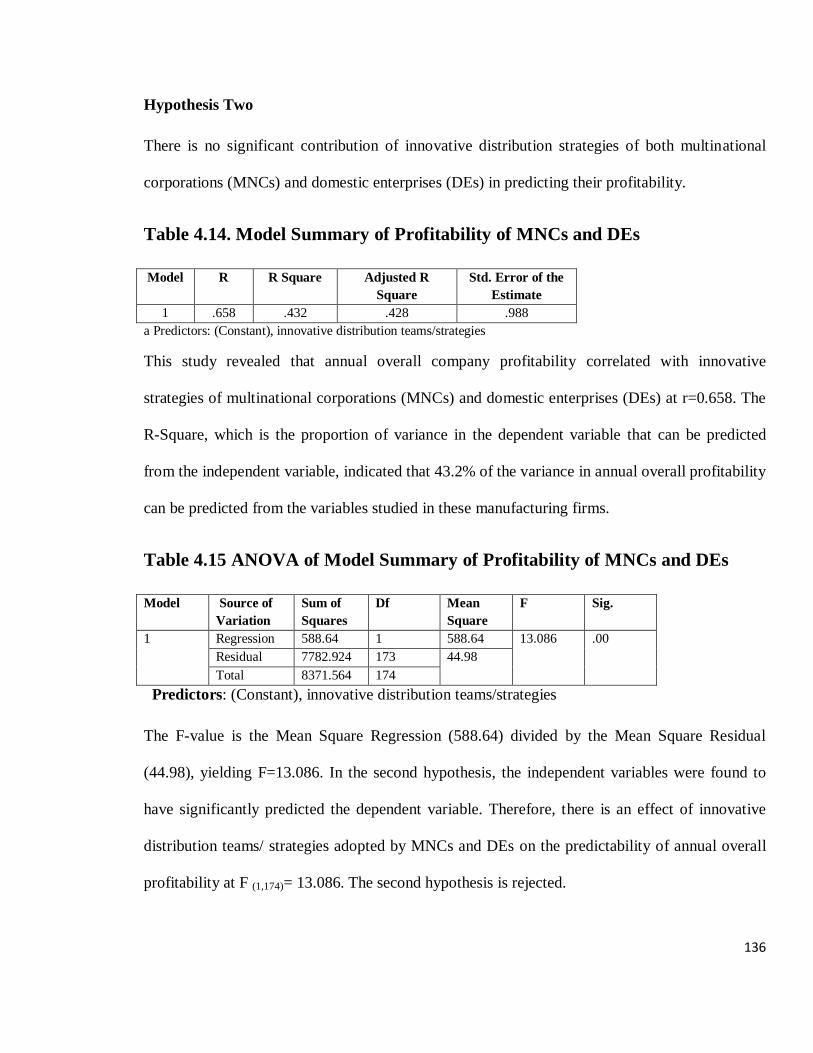
136
Hypothesis Two
There is no significant contribution of innovative distribution strategies of both multinational
corporations (MNCs) and domestic enterprises (DEs) in predicting their profitability.
Table 4.14. Model Summary of Profitability of MNCs and DEs
Model R R Square Adjusted R
Square
Std. Error of the
Estimate
1 .658 .432 .428 .988
a Predictors: (Constant), innovative distribution teams/strategies
This study revealed that annual overall company profitability correlated with innovative
strategies of multinational corporations (MNCs) and domestic enterprises (DEs) at r=0.658. The
R-Square, which is the proportion of variance in the dependent variable that can be predicted
from the independent variable, indicated that 43.2% of the variance in annual overall profitability
can be predicted from the variables studied in these manufacturing firms.
Table 4.15 ANOVA of Model Summary of Profitability of MNCs and DEs
Model Source of
Variation
Sum of
Squares
Df Mean
Square
F Sig.
1
Regression 588.64 1 588.64 13.086
.00
Residual 7782.924 173 44.98
Total 8371.564 174
Predictors: (Constant), innovative distribution teams/strategies
The F-value is the Mean Square Regression (588.64) divided by the Mean Square Residual
(44.98), yielding F=13.086. In the second hypothesis, the independent variables were found to
have significantly predicted the dependent variable. Therefore, there is an effect of innovative
distribution teams/ strategies adopted by MNCs and DEs on the predictability of annual overall
profitability at F (1,174)= 13.086. The second hypothesis is rejected.
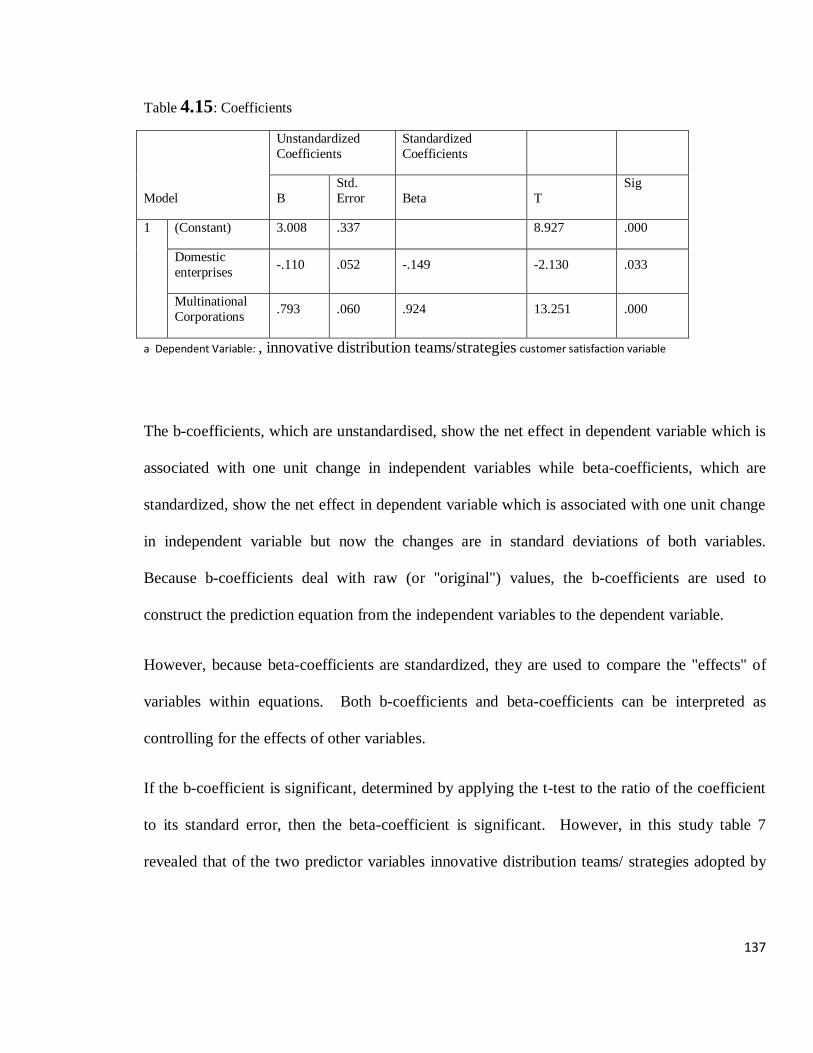
137
Table 4.15: Coefficients
Model
Unstandardized
Coefficients
Standardized
Coefficients
B
Std.
Error Beta T
Sig
1
(Constant) 3.008 .337 8.927 .000
Domestic
enterprises -.110 .052 -.149 -2.130 .033
Multinational
Corporations .793 .060 .924 13.251 .000
a Dependent Variable: , innovative distribution teams/strategies customer satisfaction variable
The b-coefficients, which are unstandardised, show the net effect in dependent variable which is
associated with one unit change in independent variables while beta-coefficients, which are
standardized, show the net effect in dependent variable which is associated with one unit change
in independent variable but now the changes are in standard deviations of both variables.
Because b-coefficients deal with raw (or "original") values, the b-coefficients are used to
construct the prediction equation from the independent variables to the dependent variable.
However, because beta-coefficients are standardized, they are used to compare the "effects" of
variables within equations. Both b-coefficients and beta-coefficients can be interpreted as
controlling for the effects of other variables.
If the b-coefficient is significant, determined by applying the t-test to the ratio of the coefficient
to its standard error, then the beta-coefficient is significant. However, in this study table 7
revealed that of the two predictor variables innovative distribution teams/ strategies adopted by
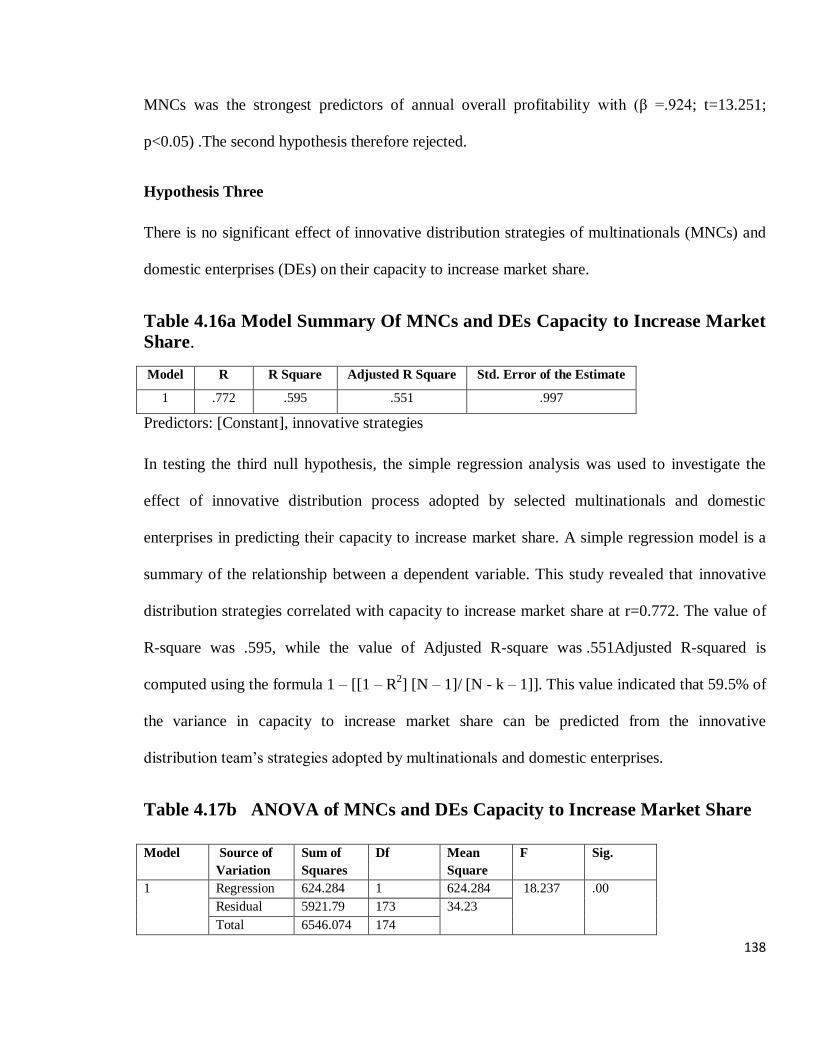
138
MNCs was the strongest predictors of annual overall profitability with (β =.924; t=13.251;
p<0.05) .The second hypothesis therefore rejected.
Hypothesis Three
There is no significant effect of innovative distribution strategies of multinationals (MNCs) and
domestic enterprises (DEs) on their capacity to increase market share.
Table 4.16a Model Summary Of MNCs and DEs Capacity to Increase Market
Share.
Model R R Square Adjusted R Square Std. Error of the Estimate
1 .772 .595 .551 .997
Predictors: [Constant], innovative strategies
In testing the third null hypothesis, the simple regression analysis was used to investigate the
effect of innovative distribution process adopted by selected multinationals and domestic
enterprises in predicting their capacity to increase market share. A simple regression model is a
summary of the relationship between a dependent variable. This study revealed that innovative
distribution strategies correlated with capacity to increase market share at r=0.772. The value of
R-square was .595, while the value of Adjusted R-square was .551Adjusted R-squared is
computed using the formula 1 – [[1 – R2] [N – 1]/ [N - k – 1]]. This value indicated that 59.5% of
the variance in capacity to increase market share can be predicted from the innovative
distribution team‘s strategies adopted by multinationals and domestic enterprises.
Table 4.17b ANOVA of MNCs and DEs Capacity to Increase Market Share
Model Source of
Variation
Sum of
Squares
Df Mean
Square
F Sig.
1
Regression 624.284 1 624.284 18.237 .00
Residual 5921.79 173 34.23
Total 6546.074 174
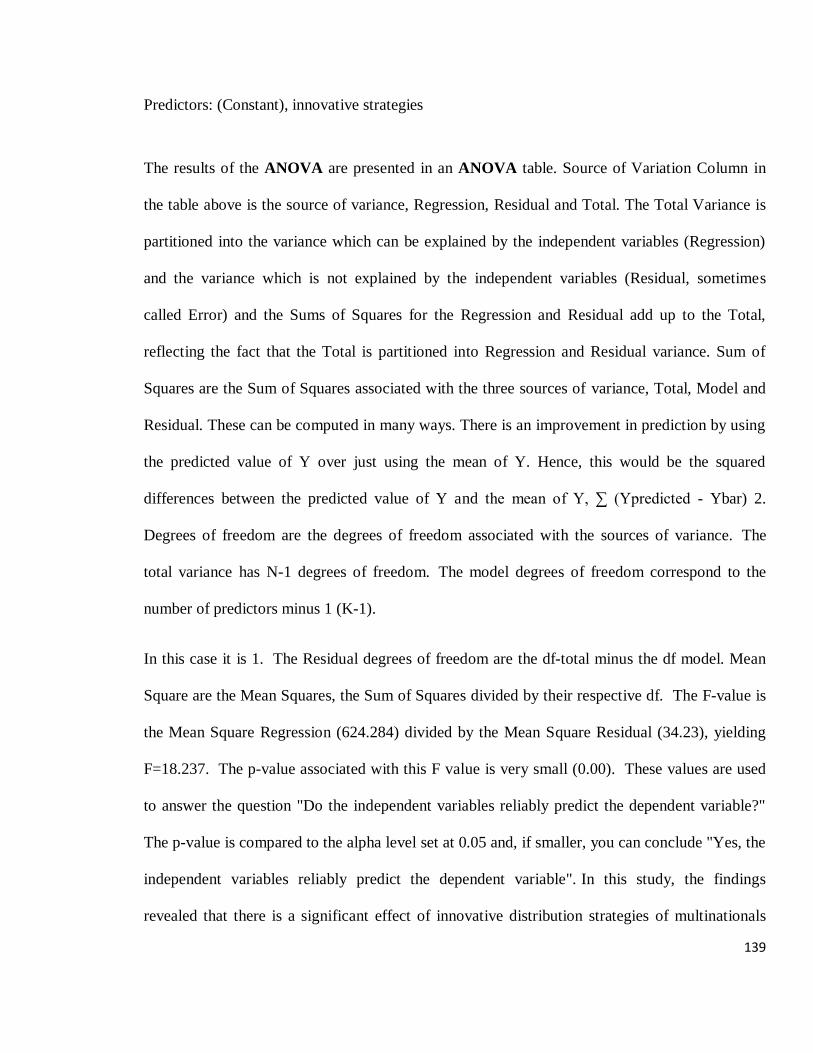
139
Predictors: (Constant), innovative strategies
The results of the ANOVA are presented in an ANOVA table. Source of Variation Column in
the table above is the source of variance, Regression, Residual and Total. The Total Variance is
partitioned into the variance which can be explained by the independent variables (Regression)
and the variance which is not explained by the independent variables (Residual, sometimes
called Error) and the Sums of Squares for the Regression and Residual add up to the Total,
reflecting the fact that the Total is partitioned into Regression and Residual variance. Sum of
Squares are the Sum of Squares associated with the three sources of variance, Total, Model and
Residual. These can be computed in many ways. There is an improvement in prediction by using
the predicted value of Y over just using the mean of Y. Hence, this would be the squared
differences between the predicted value of Y and the mean of Y, ∑ (Ypredicted - Ybar) 2.
Degrees of freedom are the degrees of freedom associated with the sources of variance. The
total variance has N-1 degrees of freedom. The model degrees of freedom correspond to the
number of predictors minus 1 (K-1).
In this case it is 1. The Residual degrees of freedom are the df-total minus the df model. Mean
Square are the Mean Squares, the Sum of Squares divided by their respective df. The F-value is
the Mean Square Regression (624.284) divided by the Mean Square Residual (34.23), yielding
F=18.237. The p-value associated with this F value is very small (0.00). These values are used
to answer the question "Do the independent variables reliably predict the dependent variable?"
The p-value is compared to the alpha level set at 0.05 and, if smaller, you can conclude "Yes, the
independent variables reliably predict the dependent variable". In this study, the findings
revealed that there is a significant effect of innovative distribution strategies of multinationals
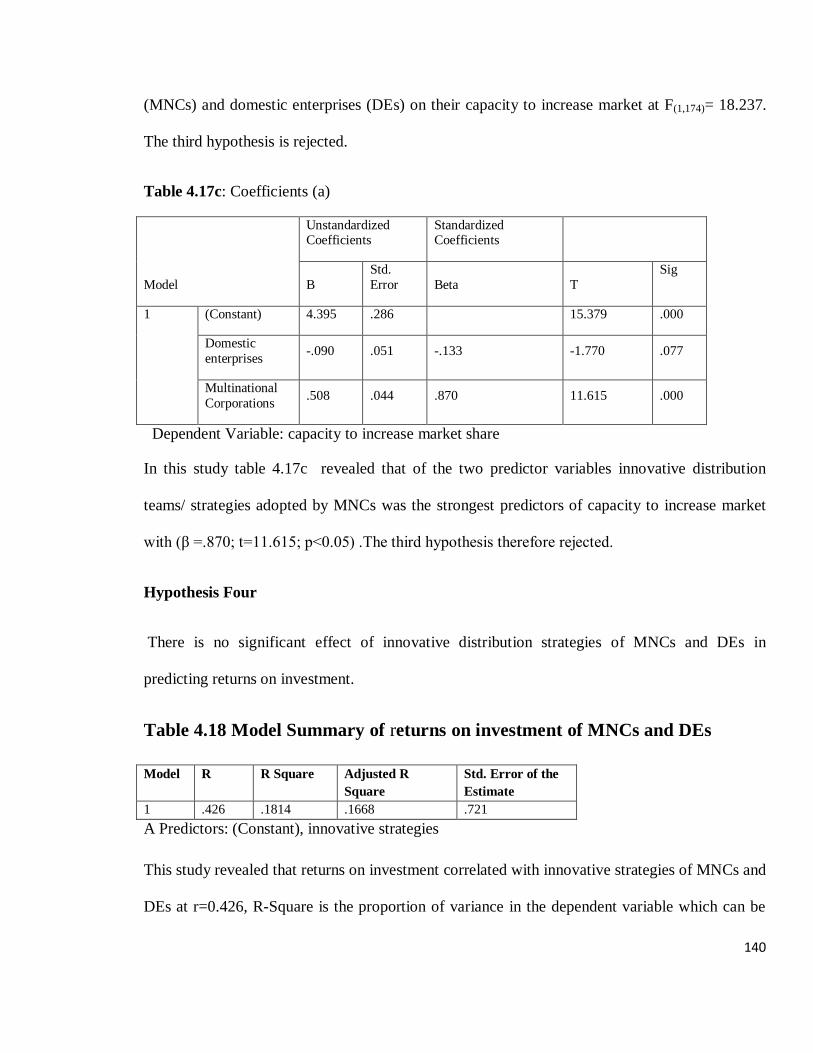
140
(MNCs) and domestic enterprises (DEs) on their capacity to increase market at F(1,174)= 18.237.
The third hypothesis is rejected.
Table 4.17c: Coefficients (a)
Model
Unstandardized Coefficients
Standardized Coefficients
B
Std.
Error Beta T
Sig
1
(Constant) 4.395 .286 15.379 .000
Domestic
enterprises -.090 .051 -.133 -1.770 .077
Multinational
Corporations .508 .044 .870 11.615 .000
Dependent Variable: capacity to increase market share
In this study table 4.17c revealed that of the two predictor variables innovative distribution
teams/ strategies adopted by MNCs was the strongest predictors of capacity to increase market
with (β =.870; t=11.615; p<0.05) .The third hypothesis therefore rejected.
Hypothesis Four
There is no significant effect of innovative distribution strategies of MNCs and DEs in
predicting returns on investment.
Table 4.18 Model Summary of returns on investment of MNCs and DEs
Model R R Square Adjusted R
Square
Std. Error of the
Estimate
1 .426 .1814 .1668 .721
A Predictors: (Constant), innovative strategies
This study revealed that returns on investment correlated with innovative strategies of MNCs and
DEs at r=0.426, R-Square is the proportion of variance in the dependent variable which can be
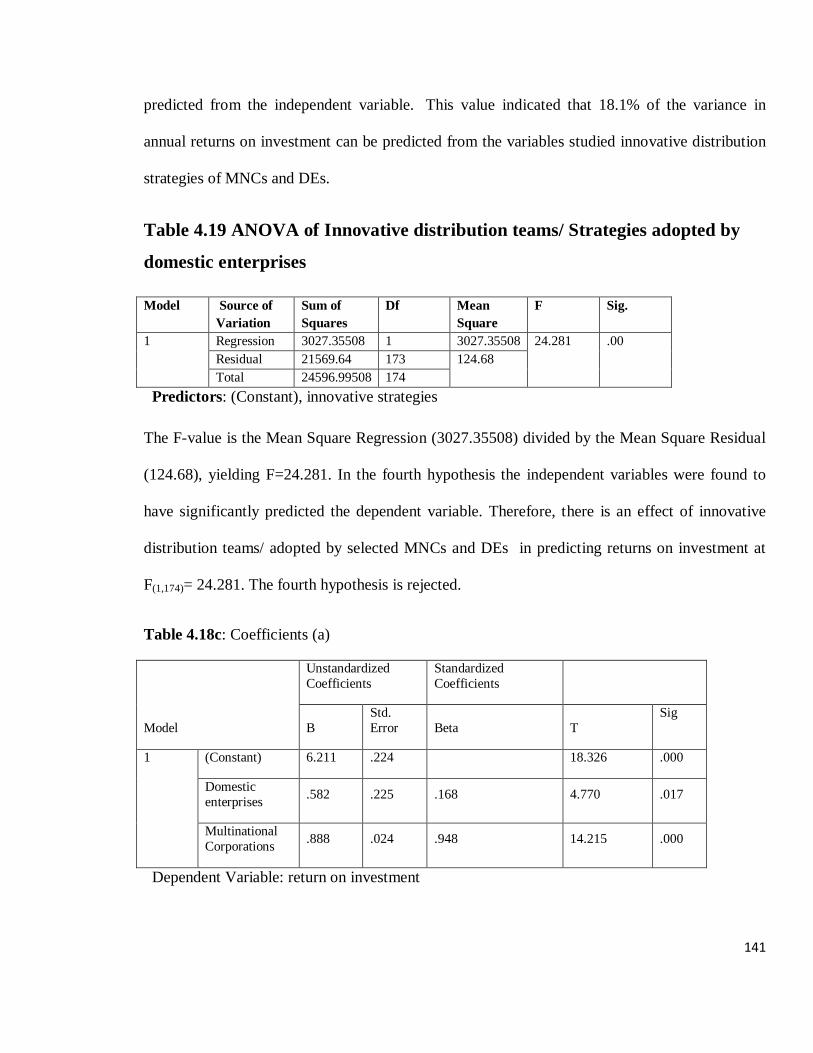
141
predicted from the independent variable. This value indicated that 18.1% of the variance in
annual returns on investment can be predicted from the variables studied innovative distribution
strategies of MNCs and DEs.
Table 4.19 ANOVA of Innovative distribution teams/ Strategies adopted by
domestic enterprises
Model Source of
Variation
Sum of
Squares
Df Mean
Square
F Sig.
1
Regression 3027.35508 1 3027.35508 24.281
.00
Residual 21569.64 173 124.68
Total 24596.99508 174
Predictors: (Constant), innovative strategies
The F-value is the Mean Square Regression (3027.35508) divided by the Mean Square Residual
(124.68), yielding F=24.281. In the fourth hypothesis the independent variables were found to
have significantly predicted the dependent variable. Therefore, there is an effect of innovative
distribution teams/ adopted by selected MNCs and DEs in predicting returns on investment at
F(1,174)= 24.281. The fourth hypothesis is rejected.
Table 4.18c: Coefficients (a)
Model
Unstandardized
Coefficients
Standardized
Coefficients
B
Std.
Error Beta T
Sig
1
(Constant) 6.211 .224 18.326 .000
Domestic
enterprises .582 .225 .168 4.770 .017
Multinational
Corporations .888 .024 .948 14.215 .000
Dependent Variable: return on investment
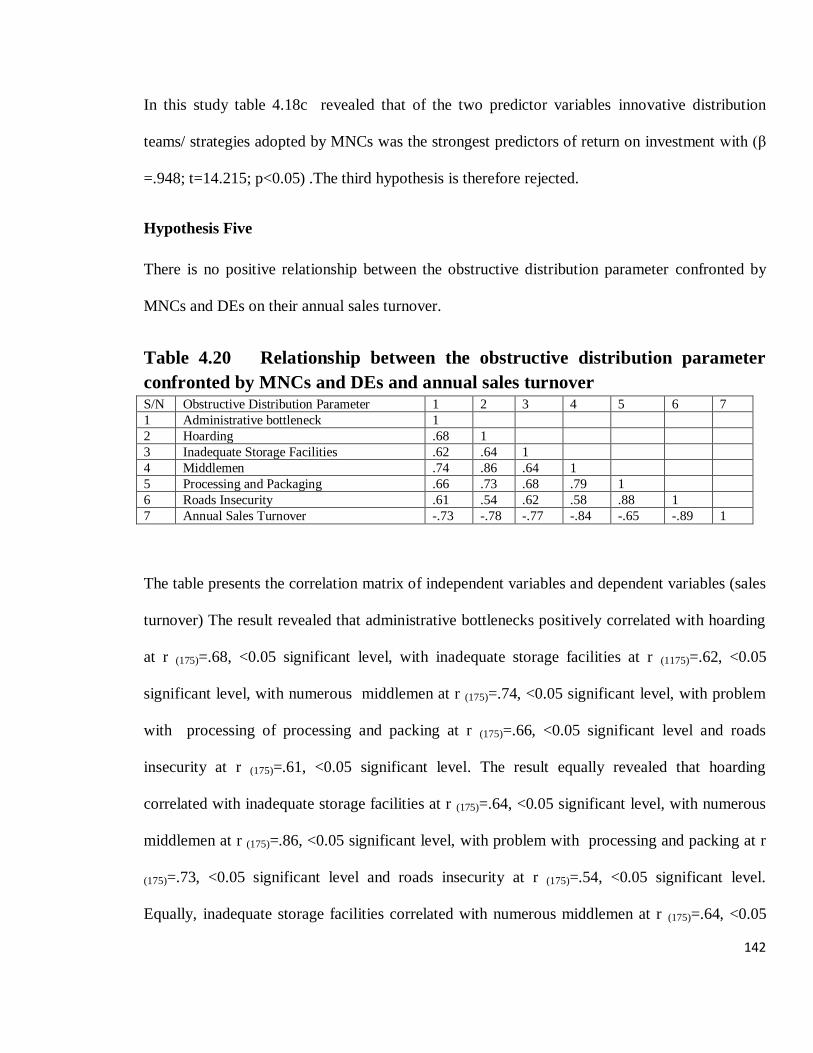
142
In this study table 4.18c revealed that of the two predictor variables innovative distribution
teams/ strategies adopted by MNCs was the strongest predictors of return on investment with (β
=.948; t=14.215; p<0.05) .The third hypothesis is therefore rejected.
Hypothesis Five
There is no positive relationship between the obstructive distribution parameter confronted by
MNCs and DEs on their annual sales turnover.
Table 4.20 Relationship between the obstructive distribution parameter
confronted by MNCs and DEs and annual sales turnover S/N Obstructive Distribution Parameter 1 2 3 4 5 6 7
1 Administrative bottleneck 1
2 Hoarding .68 1
3 Inadequate Storage Facilities .62 .64 1
4 Middlemen .74 .86 .64 1
5 Processing and Packaging .66 .73 .68 .79 1
6 Roads Insecurity .61 .54 .62 .58 .88 1
7 Annual Sales Turnover -.73 -.78 -.77 -.84 -.65 -.89 1
The table presents the correlation matrix of independent variables and dependent variables (sales
turnover) The result revealed that administrative bottlenecks positively correlated with hoarding
at r (175)=.68, <0.05 significant level, with inadequate storage facilities at r (1175)=.62, <0.05
significant level, with numerous middlemen at r (175)=.74, <0.05 significant level, with problem
with processing of processing and packing at r (175)=.66, <0.05 significant level and roads
insecurity at r (175)=.61, <0.05 significant level. The result equally revealed that hoarding
correlated with inadequate storage facilities at r (175)=.64, <0.05 significant level, with numerous
middlemen at r (175)=.86, <0.05 significant level, with problem with processing and packing at r
(175)=.73, <0.05 significant level and roads insecurity at r (175)=.54, <0.05 significant level.
Equally, inadequate storage facilities correlated with numerous middlemen at r (175)=.64, <0.05
143
significant level, with problem with processing of processing and packing at r (175)=.68, <0.05
significant level and roads insecurity at r (175)=.62, <0.05 significant level. The problem with
processing and packing as an independent variable indicator is correlated with roads insecurity at
r (175)=.88, <0.05 significant level. The annual sales turnover negatively correlated with
obstructive distribution parameter confronted by MNCs and DEs at r (175) =.-73, <0.05 significant
level for administrative bottlenecks, hoarding at r (175)=-.78, <0.05 significant level, r (175)=-.77,
<0.05, inadequate storage facilities at r (175)=.77, <0.05 significant level, middlemen problem
with processing and packaging at r (175)=-.65, <0.05 significant level and roads insecurity r (175)=-
.89, <0.05 significant level. The fifth null hypothesis that states that there is positive relationship
between the obstructive distribution parameter confronted by MNCs and DEs on their annual
sales turnover is rejected. This implies that there is a positive relationship between the
obstructive distribution parameter confronted by MNCs and DEs on their annual sales turnover
144
CHAPTER FIVE
DISCUSSION, CONCLUSIONS AND RECOMMENDATIONS
5.1 Summary of the Work
This chapter contains the summary of the work, conclusions and recommendations, limitation of
the study and suggestions for further research. The objective of this study was to examine the
impact of innovative distribution strategies adopted by selected multinationals and domestic
enterprises on predicting annual overall company performances. The study revealed that MNCs
because of their size, sophisticated distribution strategies and channels were able to be more
innovative than indigenous firms and thus possess better performance. Secondly, it was revealed
that the MNCs sales turnover was higher as a result of their better IDS than that of the
indigenous firms. Thirdly, it was revealed that IDS of both MNCs and DEs can affect their
profitability. Fourthly, IDS of both MNCs and DEs have capacity to influence and increase their
market shares annually. The study also revealed that IDS of MNCs and DEs can positively or
negatively affect their annual return on investment and finally that; obstructive distribution
parameter confronted by MNCs and DEs affect their annual sales turnover.
5.2 Discussion of the Findings
As stated earlier, the discussion of this study followed the hypotheses raised, stated and tested as
they are presented below in 5.2.1 to 5.2.5. The findings from this study include but not limited to
the following. (1) E-distribution was a major finding from the study as internet and on- line –
distribution is the latest and fastest means of global products and services delivery to the
145
final/ultimate consumer. (2) Specialized teams of advertisers in MNCs are charged with the
responsibility of global coverage and least cost of products delivery leading to a high significant
difference between the annual performances of MNCs compared with their indigenous
counterparts (DEs). (3) From the findings, it was discovered that a wider range of distribution
such as – go-on- line, connecting with various experts in distribution and market mix as a tool of
innovative distribution strategy in the latest global dispensation was a major factor in
determining their performance. (4) Finally, Employment of consultants and experts distribution
firms are engaged by the MNCs to capture a global product/service distribution where as our
domestic manufacturers depends solely on their internal marketing, sales and distribution efforts
of these departments as an innovative strategy. The five hypotheses stated and tested are where
by discussed below as follows:
: The sales turnover of multinational corporations (MNCs) and domestic enterprises (DEs) as a
result of their innovative distribution strategies will be not be significantly different.
5.2.1 Hypothesis 1
The hypothesis stated that ―the sales turnover of multinational corporations (MNCs) and
domestic enterprises (DEs) as a result of their innovative distribution strategies will not be
significantly different‖. The analysis revealed that the hypothesis was false. This means that
there is a significant difference in sales turnover of MNCs and DEs as a result of their innovative
distribution strategies which was significantly different. Earlier findings highlighted a positive
relationship between novel product innovation and employment growth and, for manufacturing
firms, at least in the short term, a negative relationship between product innovation (both
incremental and novel) and growth in sales or productivity. By contrast, growing sales and
146
productivity appear positively associated with incremental process introductions in service firms
and distribution strategies However, there are other contradictory findings while innovators
appear no more likely to have experienced some form of sales or employment growth, they are
significantly more likely to have grown more. In other words, the innovators' growth rate
distributions are highly negatively skewed. With regards to export intensities, profitability and
productivity levels, the findings are not clear.
On the whole, the results reported here are similar to those of other small firm studies, yet vary
markedly from large firm equivalents; suggesting that the nature of the returns to innovation may
be contingent, at least in part, upon firm size sophistication and capability. Moreover, the high
levels of variation in firm performance should caution us against proffering innovative
imperatives. If we are to counsel firms to "innovate at all costs", we must be clear about, and
clearly demonstrate, the nature of the returns they may reasonably expect and the processes
through which these may be optimised. Other things being equal, larger establishments would be
expected to have more innovative distribution than smaller ones. This is nothing to do with
controversies about whether there is a better ‗climate of innovation‘ in small or in large firms. It
is a statistical effect. Proportional to its resources, a smaller firm may be more innovative, but in
absolute terms, a larger firm is the more likely to have an innovation coming on stream in a
given period, simply because of its wider range of activities and markets. As this study was
unable to measure value added, and as three in five of the samples were unable or unwilling to
give a figure for sales turnover, the best measure of firm size available to this study was number
of employees.
147
Although the size of a firm (multinational and indigenous firms), measured in terms of country
origin, is closely related to its sales turnover, the agreement between the two measures is by no
means perfect. Sales are worth considering separately, if only to check that we reach the same
conclusions as with numbers of employees and other variables. Moreover, financial and growth
indicators (unlike number of employees) can give some impression of the impact of innovative
distribution on competitive performance. Where sales turnover was available, we found that it
correlated very highly with the type of firms in this sample, so the use of number of employees
will also give a good reflection of size differences in terms of sales turnover.
5.2.2 Hypothesis 2
There is no significant contribution of innovative distribution strategies of both multinational
corporations (MNCs) and domestic enterprises (DEs) in predicting their profitability. The finding
of this study is in perfect agreement with earlier research works. Davide and Antonello (2003)
noted that significant difference exists in productivity and innovative behaviour of
manufacturing firms. Particularly, foreign and domestic multinationals both pay higher attention
to higher wages and product innovations than domestic uni-national firms. This can be what
experts refer to as product cycle thesis (Vernon, 1966), a marketing and distribution concept. The
basis of the thesis is that many products undergo a number of clearly defined life stages which
largely determine international production, marketing and distribution strategies. The
assumptions on which the thesis is based are as follows:
that tastes are assumed to be directly related to income;
that markets in technological and commercial knowledge are imperfect; and
148
that the firms incur communication cost when operating internationally.
The first phase of the cycle involves the development of the products and production processes
in the home country (say the U.S.) in response to a large affluent market, scarce labour and
extensive research and development expenditures. As income increases, overseas demand for
these products increases. In the second phase, the firm meets foreign demand through exports
until both products and processes have become standardised (Buckley and Casson, 1976). The
third phase is that of choice between domestic and foreign production either by licensing or DFI,
where the cost considerations are significantly influences on the form of market servicing. The
major source of such cost is imperfections in the transfer of ownership or property rights in the
external markets (Casson, 1979).
Dunning (1979) classified factors inputs as being ownership-specific (and mobile) and location-
specific (and immobile) in his attempt to develop an eclectic theory of international production.
According to him, the market servicing and location decisions of MNCs derive from the
intersection of these two sets of inputs. The experience of colonial Nigeria supports this second
hypothesis, as the multinationals served to encourage the protection of private investments in
local Nigerian economy. Also, the availability of raw materials and the structure of relative and
combined innovative distribution strategies are likely to influence the overall company
performances in terms of sales turnover and marketing services generally.
Dunning‘s contributions have a number of implications. First, his analysis shows that country-
specific characteristics such as local policies are likely to influence both ownership-specific and
location-specific advantages significantly. The nature and distribution of innovations are not
static. They are likely to shift over time as comparative advantage changes. Individual industry-
149
specific considerations appear to be important determinants in the innovative distribution
strategies in the market servicing choices.
Looking at the relationship between the variables in the study, in testing the second hypothesis,
the regression analysis used to investigate the combined effect of innovative strategies adopted
by selected multinationals in predicting annual overall company performance revealed that
innovative strategies correlated with annual overall company performance. The result also
indicated that 59.2% of the variance in annual overall company performance can be predicted
from the innovative strategies adopted by multinational firms.
5.2.3 Hypothesis 3
There is no significant effect of innovative distribution strategies of multinationals (MNCs) and
domestic enterprises (DEs) on their capacity to increase market share. Hypothesis three was
rejected. This implies that there is a significant effect of innovative distribution strategies of
MNCs and DEs on their capacity to increase market share. The fact that correct strategies will
always drive business plans, achieve set down goals and objectives of organisations over time is
represented in this thesis (or: in existing body of knowledge in this area). This present findings
agree with the notion that innovative distribution strategies will lead to increased market shares,
high productivity and high competition. The results of the finding show really significant
criticism of the role of multinationals in the development process in the developing economies.
The multinationals leave an uneven impact on development and in many cases MNCs activities
reinforce dualistic socio-economic structures and exacerbate income inequalities (Fajana, 1990),
contrary to the premise that their operations in less developed countries aid development in those
countries. Following from this argument, the wide gap noticed in the innovative product
150
distribution strategies is a proven multiplier effect of that fact. They tend to promote sectional
interest of a small group of well paid elites against the interest of the rest. The multinationals use
the tool of widening wage differentials to create loyalty problems in the mind of locals, getting
loyalty for their organisations, and consequently aggravating discontents among the working
people (Harrod 1971).
It is also argued that MNCs produce inappropriate goods and services and backed these with
advertising, monopolistic markets and power, as well as the deployment of capital-intensive
technologies of production. Thus local companies‘ resources tend to be allocated towards goods
that are individually and socially undesirable and where the goods are desirable, the qualities of
innovation introduced tend to be poor when compared with their multinational counterparts. This
in turn tends to aggravate poverty, unemployment, income inequalities and serious imbalance
between the urban and rural economic opportunities (Todaro, 1977; p345).
The findings in this study support Todaro (1977) as the regression they revealed that all the
independent variables were significant, meaning that the innovative product distribution
strategies of multinationals significantly predict annual overall company market share
positioning performance. The learning point from this finding is that the domestic enterprises
can use the advantage of being locals to penetrate the MNCs and thereby leverage on their
technology and skills that attend to their strategies.
5.2.4 Hypothesis 4
There is no significant effect of innovative distribution strategies of MNCs and DEs in predicting
returns on investment. There is confusion in the literature. Many researchers utilise traditional
151
accounting measures of profit. One the most common indices, for example, is return on assets
(Staw and Epstein, 2000;; Wan and Hoskisson, 2003). Return on assets is the annual profit or
net income divided by the average assets over the year. More precisely, to compute the
numerator, researchers usually subtract the interest expense and the interest tax savings from the
annual profit. As Van Dyck, Frese, Baer and Sonnentag (2005) highlighted, return on assets is a
measure of operating efficiency, reflecting the long term financial strength of organisations.
Although a ubiquitous measure, return on assets is not always an optimal measure. For example,
return on assets should not be used to compare organisations in different industries. The
peculiarities of any industry will bias this index. Because of the massive reserves in the insurance
and banking industries, for example, return on assets will tend to underestimate the profitability
of these organisations. Returns on assets differ from returns on investment, which is also called
the rate of return. The returns on investment is usually calculated to examine the efficiency of a
specific investment or initiative such as innovative distribution strategies or to compare the
efficiency of several investments of initiatives. Return on investment is merely the return of an
investment, that is, the gain minus the costs divided by the costs of the investment.
Distribution strategy remains, therefore, as it always has been, at the heart of organisations‘
investment choices, positioning choices and likelihood of commercial success. The channels an
organisation uses are not only the pipelines through which revenue and profit arrive. They are
usually the most expensive aspect of the operational structure. They are also central in defining
the type of customer who arrives, the profit created by that customer, the attractiveness of the
organisation compared to its competitors, the everyday experience of its customers and the
‗reality‘ of its brand.
152
This result agrees with Howard (1971), who maintained that the gap in performance occurs
possibly because the multinationals in Nigeria are usually wage leaders in their respective
industries and are consequently able to attract and retain most of the best hands. The effect of
this on innovative strategies in developing countries is undoubtedly profound, as it must be
realised that multinationals‘ concerted strategies of capturing the skill market, coupled with the
company- specific orientation and loyalty training, perhaps served to deter information sharing,
thereby creating a wide gap in adopting new innovative strategies in domestic industries (Harrod,
1970 and Ball, 1968).
5.2.5 Hypothesis 5
There is no positive relationship between the obstructive distribution parameter confronted by
MNCs and DEs on their annual sales turnover. There is no effect in innovative distribution
strategies adopted by multinationals and domestic enterprises in predicting annual sales turnover.
Hypothesis 5 was rejected. Since the study investigated the innovative distribution strategies of
both MNCs and domestic firms, the result of Hypothesis 5 agrees with the study objectives on
two elements. The results revealed that two of the most important variables significantly predict
annual overall company performance in terms of return on investment of domestic firms. The
fundamental argument underlying the framework of this hypothesis is that while some of the
tested variables agrees with the null hypothesis, others tend to agree with the alternate
hypothesis. This could be interpreted to mean that there is a weak relationship between the
variables tested and annual overall company performance among domestic firms. The result of
the analysis means that while a significant positive relationship between obstructive distribution
153
parameters and annual sales turnover are positively correlated the the sales turnover however did
not agree with this result.
5.3 Conclusions
In the course of this research work, the following findings were made:
(i) There is a significant difference in innovative product distribution teams adopted by selected
multinationals and domestic manufacturing companies in predicting their annual overall
company sales turnover and performances. This study agrees with Fajana (1990) on the
historical experience of multinationals in developing countries. Fajana asserted that through
the process of colonial capitalist expansion, there seems to exist the possibility that
workplace behaviour diffused and is transferred as MNCs management and workers of
different economic, social and cultural contexts interest. It was deduced from this study that,
the MNCs Innovative distribution strategies identify the type and also measure the rate of
adoption and local modifications of such strategies, ideas, skills and management if any such
ideas have been transferred according to Fajana (1990). Also it is asserted in this study that
the MNCs innovative distribution strategies in predicting sales turnover reflect or
approximate the home (foreigners in Nigerian business environment) systems. If the cross-
transfer of innovative distribution strategies between the USA, Britain and other
multinationals and Nigeria has been attempted without success as has been claimed (Kilby,
1967), here we attempt to examine the barriers to such exchanges, including
social/distribution policies of government/state, or economic, political, socio-cultural,
industrial, or organisational factors.
154
Outside our position and thinking of a hidden agenda of MNCs, the findings of this study
cannot deduce how for instance, two categories of manufacturing companies operating on the
same Nigerian roads can operate with two different significant effects of any of the
obstructive distribution parameters as was revealed from the results of hypothesis six.
Whereas the domestic manufacturing companies are significantly/heavily affected, their
multinationals counterparts are not affected at all by the same variables. One thing is clear
from this study and that is the wide difference between the innovative distribution strategies
of the MNCs and those of their domestic counterparts, which is a direct product of the above
assertions of the two previous scholars.
(ii) Innovative distribution strategies have an effect on the marketing services and sales turnover
and performances of selected multinationals and domestic manufacturing companies. This
study seeks to determine and describe the current distribution marketing strategies of the
multinationals that give them an edge against the DEs especially as being deployed by
distribution managers and other officials at the MNCs
(iii) The innovative distribution strategies adopted by selected multinationals and domestic
manufacturing companies in predicting their annual overall company profitability and
performance has a significant difference. There is a combined effect of innovative
distribution strategies, product innovation, process innovation, organisational innovation,
management innovation, production innovation, commercial marketing innovation and
service innovation adopted by selected multinationals and domestic enterprises in predicting
annual overall company profitability and performances.
155
(iv) The market share of multinationals and domestic manufacturing companies can be
predicted by their innovative product distribution strategies. There is a significant effect of
innovative product distribution strategies (product teams innovation, product process
innovation, government policies on distribution, management structure innovation, product
distribution innovation, commercial marketing strategies innovation and obstructive
distribution parameters) adopted by selected multinationals and domestic manufacturing
firms on predicting annual overall company market share performances.
(v) There is a significant difference in innovative distribution strategies (product teams
innovation, production process innovation, government policies on distribution, management
structure innovation, product distribution innovation, commercial marketing strategies
innovation, and obstructive distribution parameters/physical distribution management
innovation) adopted by selected multinationals and domestic manufacturing companies in
predicting their annual overall company‘s return on investment performances. That is, the
innovative distribution strategies (product teams innovation, production process innovation,
government policies on distribution, management structure innovation, product distribution
innovation, commercial marketing strategies innovation and obstructive distribution
parameters) adopted by selected multinationals and domestic enterprises have an effect on
predicting annual overall company‘s return on investment performances.
(vi) Obstructive distribution parameters in predicting the annual overall company
performance of both multinationals and domestic manufacturing firms operating in the
Nigerian economy is highly significant.
156
The result of this analysis agrees with other scholars such as Ige (1979) in ―Managing cement
distribution in Nigeria‖ the domestic manufacturing companies while it disagrees with his
findings the multinationals. From our earlier position on the characteristics of corporate strategy
in our literature review, another scholar, Woodward (1968) opined that U.S. firms on average are
oriented toward internationalisation of products operation (see section 2.1.20, on strategy).
Second, it was discovered that U.S. firms were more flexible in their strategic deployment of
resources and that they emphasise short-term resource utilisation while Japanese firms
emphasised long- term resource accumulation and were slow to follow a withdrawal strategy.
This contrast in resource deployment is the most significant difference between Japanese and the
U.S. along the seven earlier stated areas and dimensions of innovation strategies Woodward
(1968), Perrow (1967) and Thompson (1967), as cited in Fajana (1990). This finding
corresponds to the difference in environment and objectives cited earlier between the MNCs and
DEs operating in Nigeria. It is quite reasonable for the MNCs which give higher priority to
profitability as stated in this study (see 2.1.19) Davide & Antonello,(2003) and face a lower
opportunity environment to emphasise mobility and short-term capitalisation of resources.
Accordingly, a better product/market portfolio, while resource development using a longer to
follow a withdrawal strategy comparatively assisted the MNC‘s operating in Nigeria when
looking at obstructive distribution parameters in the Nigerian business environment.
Conclusively, Thompson (1967) and Woodward (1968) agreed that the competitive strategies of
the MNCs are production innovation and product distribution innovation. This is where a typical
MNC builds up its competitive strength by improving production efficiency and product quality
innovation, thereby seeking product differentiation. Research works on Innovative distribution
157
strategy (see 2.2.5) cited in this study showed that the physical condition of the Nigerian roads
leaves much to be desired. Ogunsayan (2000).
(vii) The study revealed the deplorable state of the Nigerian road network. The poor state of
our roads has adversely affected products distribution activities in particular and transportation in
general. What happened to the multi-product pipeline distribution strategy in Nigeria? We are all
living witnesses to the fact that it has long failed as a result of illegal bunkering in the Niger-
Delta region of the Nigerian state. It is shameful that countries without Crude-oil production
have made a success of their petroleum sector and Nigeria, the sixth largest oil-producing
country in the world, cannot succeed with the same strategy and innovation.
(viii) This study has also shown that the environment brings out the best in the individual when
confronted with challenges of strategy, innovation and creativity in any manufacturing industry.
According to Oyedepo (2008), inspiration generated by high praise life - style leads to wisdom
that births divine ideas which are used when confronted with such practical life problems. The
saying that every state in Nigeria is blessed with its own natural resources is generally
acceptable. However, the people of each state will have to explore these natural endowments for
their own good instead of complaining and murmuring Oyedepo, (2008). ―The resultant effect of
either complaining or murmuring can be described as a state of drying sown seeds and no human
being has a solution neither can anything be done in such settings‘. Model One (see 2.1.19) of
this study describes the stages of the Innovation decision- process. In that model, Oyedepo
(2008) analysed the characteristics‘ of perceived ideas which he called imagination, but in the
earlier Model by Fajana (1990), the term perceived idea never surfaced. However both authors
agree that organizations are located in different geographical zones in Nigeria. According to
158
them, inspiration leads to preparation, which leads to perspiration and resulted in realisation of
the intended innovation
5.4 Policy Implication of Findings
The findings of this research study are very important for several reasons. The distributive
functions of industries whether manufacturing or services rendering in nature cannot be over
emphasised. Without proper, adequate and effective distribution of goods and services,
production is useless. Comparative innovative distribution strategy as a topical issue is crucial to
organisational growth and in the globalisation process against the backdrop of the present
financial global meltdown (USA, 2010). The MNCs have advanced their commercial marketing
skills and innovative strategies built-in to these services help their industries to outperform their
domestic counterparts in Nigeria. That being the case, our local entrepreneurs, still lack the basic
training and development programmes to transform their efforts into success as entrepreneurs.
The more adept you are in the distribution of your products, the more share of the market you
control in your sector of any economy. The findings of this work should be relevant as more
local entrepreneurs venture into various enterprises. If the findings of this study are adopted, they
would go a long way in alleviating the current problems of distribution of goods generally in the
country. The current meltdown calls for more local entrepreneurs to create new jobs for young
school leavers. Any productive venture that fails in innovative distribution strategies will fade
out very quickly from the market place and without adequate skills and effective distribution
strategies success would elude the entrepreneur.
159
5.5 Recommendations
Based on the above, the following recommendations are hereby proffered;
(i) The Federal government should aggressively enforce its initiatives for our financial
institutions (commercial, merchant banks and bank of industries), pursue empowerment
programmes for young and upcoming entrepreneurs in terms of tangible financial
assistance to domestic industries geared towards knowledge and skills acquisition
particularly in the area of innovation and creativity. This will enable local entrepreneurs
make more meaningful contributions to the nation‘s economic development in terms of
job creation, wealth creation, poverty alleviation, technology and skills acquisition.
(ii) Before embarking on expensive innovative distribution strategies, managers should ask
themselves some basic questions. Specifically, how does an innovative strategy fit with
their existing and future distribution plans? What are the specific quantitative and
qualitative benefits of innovative systems that will improve distribution productivity?
What organisational changes will be necessary to accommodate a new innovative
distribution strategy? These questions are intended to provide a situation review. If
appropriate, they would evolve a plan for innovative distribution development in
domestic manufacturing firms. Micro-finance banks and Non-governmental Organisation
(NGOs), support domestic industries in terms of capacity and facility.
(iii) The indigenous industrialists should realise that they are the backbone of the nation‘s
economy. As such, they should be prepared to venture into new enterprises geared
towards transferring ideas and skills to viable business ventures. This will help to
160
compete on the global stage and self esteem which are important factors in risk taking
which is a necessary but not a sufficient condition for success in any venture. The
necessary and sufficient condition for sustained business success is; right vision, mission
statement core business values, business objectives, adequate skills and correct strategies
amongst other business factors such as innovation and constant creativity in any field of
human endeavour.
(iv) The Nigerian entrepreneurs should learn to take advantage of their immediate
environment whether favourable or unfavourable. Going by the revelation from the
Kenya multi product pipeline distribution strategy for petroleum products and Seychelles
Crude Oil Taxi Driver position they have created for themselves, environment has the
innate potential of a robbing off effect on any business.
(v) Continued globalization and hegemony of Multinationals operation. The incidence of the
multinational firms is no doubt one of the greatest developments in business management
for the last two decades. Innovation strategies have found it very difficult to cope with
these global organizations. From evidence reviewed in the second chapter, it can be
concluded that the inability of the significant -others to multinationals [via, their
managers, organized labour, state, international community] to exert reasonable and
sufficient influence on them supports the dominance of MNC‘s over other actors such as
the domestic industries within their environment. Unfortunately, it has been very largely
difficult to break this hegemony as shown in the text.
(vi) Actions of Governments in developing Countries and their effectiveness. In meeting up
with the force engendered by MNC,s, the role of the nation state still remains the crucial
161
factor. However, there is foreseen painful accommodation of tensions by local industries
within the Nigerian economy resulting from MNC, s operations by nation states, as the
form of relationship that could possibly emerge in the future.
(vii) Finally, learning how to learn is the world most important skill any business outfit
requires right now. Why? Because until you are ready to be a learner you will never
become an expert and unfortunately, only expertise rules our current world of business.
Domestic enterprises should endeavour to go for the necessary training, irrespective of
the circumstances that led them to start and run business. For optimization purpose,
competence development is a function of training and learning events attained, so both
managerial and technical skills required for effective and efficient business transaction is
a must and not optional if the Nigerian entrepreneur want to be reckoned with in the
globalization process sweeping across most of the international economies right now.
5.6 Problems Encountered During the Study
During the course of carrying out this study, the researcher encountered the following
challenges:
(i) There was resistance from respondents in supplying the required information about
innovation strategies, especially information bordering on creative and innovative
strategies of the MNCs.
(ii) The domestic industries in the Nigerian economy operate under a rather suspicious
atmosphere meant to cover up corporate information on decision making; hence the
researcher experienced strong mistrust from these firms.
162
(iii) Respondents exaggerated information such that their accuracy was in doubt.
(iv) In some of the survey locations and organizations, the managers and officers did not
cooperate enough as expected, perhaps afraid of revealing company information.
(v) We also encountered the problems of interpreting the information in the questionnaire
and helping the respondents to complete their questionnaires because of their literacy
level.
(vi) Finally we had the problem of accurate data storage and documentation in almost all of
the companies contained in the survey, during the research study.
5.7 Limitations and Suggestions for Further Research
The findings of this study suggest several areas for future research. First, the domestic
enterprises in the study were those Nigerian entrepreneurs involved in the major industries
within and outside the Nigerian economy. While they were representative of the general Nigerian
local industries representing the main and major industrialists, they were somewhat less likely to
be in all sectors of the economy as the study focused on only three sectors of the Nigerian
economy.
Second, this study was carried out on selected companies based in the Lagos State Industrial
Area, although these organizations also have manufacturing and/ or distribution presence in the
six geographical regions in the country. However, the study scope of this research did not cover
the thirty-six states of Nigeria. A replication of this study in other states, industrial areas in the
country may produce contrary results.
163
Third, most respondents in the field survey were employees and as such may have withheld vital
information from the researcher. However, another study on MNCs and DEs innovation
strategies can be carried out focusing on employers of labour only. A future investigation can
determine whether there exists a significant difference between the multinationals and domestic
firms‘ innovation strategies in predicting annual overall company performances using the survey
data of only employers.
5.8 Contribution to Knowledge
This study has contributed to the body of knowledge in the following ways:
(i) The innovation decision-making process model rating scale developed by the researcher
can be used for other related research works.
(ii) The results obtained from the analysis of the hypotheses of this study have added value to
the body of knowledge. For instance the result of hypothesis five contradicted the
researcher‘s prior opinion and reservation on the issue in question.
(iii) The thesis presents an invaluable compendium of ideas, facts and figures that can be used
in industrial research and by consultants and Small Medium Enterprises (SMEs)
operators to re-strategies their position for future growth and development.
(iv) The different areas of Limitations identified in the study have created opportunities for
researchers as new topics for further research in Logistics and Production Management.
164
(v) The thesis can be serially published in learned international journals as contribution to
knowledge.
(vi) The models developed in the process of this research can be developed into conceptual
and theoretical framework for Entrepreneurship, Physical distribution, logistics and
production management studies. These models are:
(a) Model 1: Model of stages in the innovation-decision process.
(b) Model 2: Relationship between Entrepreneurship and Innovative Distribution Strategies.
165
REFERENCES
Aaker, D. A. & Day, G. S. (1982) Marketing Research. John Wiley and Sons, 3rd
Edition.
Achumba, I.C. (1996) The Dynamics of Consumer Behaviour, Mac Williams Publishers Ltd,
Nigeria.
Achumba, I.C. (2000) Strategic Marketing Management in the 21st Century, MacWilliams and
Capital Publishing Inc Chartotte NC, 28212.
Ade. S. O & Ajakaiye O. D. (2003) Research Issues in the Management of Socio-Economic
Transformation in Nigeria. NISER, Ibadan.
Anderson, E. & Weitz, B. A . ( 1992) The Use of Pledges to Build and Sustain Commitment in
Distribution Channels. Journal of Marketing Research, v. 24, p. 18-34.
Anderson, G. H., & John, S. S. (1999). The Effect of Human Resource Management Practices on
the Perceptions of Organisational and Market Performance of the Firm. Human Resource
Management, 38, 185-200
Anderson, M.B. (1985). Technology: Implications for Women in Gender Roles in Development
Projects. Kumarian Press, West Hartford, CT, USA.
Ariyo, D (2000). ―Small Firms are the Backbone of the Nigerian Economy‖ African Economic
Analysis.
Asika, Nnamdi. A. (1991) Research Methodology in the Behavioural Sciences Longman, Ikeja.
Appropriate Technology International – ATI (1987). ATI's Macro-policy Programme. ATI.
Annual Report.
Badi, R.V. & Badi, N.V. (2005). Entrepreneurship. Vrinda Publications (P) Ltd. Delhi
Bagozzi, L. W., El-Ansary, A. L. & Coughlin, A. (1998). Marketing Channels, New Jersey:
Prentice Hall.
166
Bailey, K.D. (1987). Methods of Social Research. 3rd Edition, New York: The Free Press.
Baker, J.M. (1971).Marketing, Macmillan Publishing, London.
Bangs D.N (1995). The Planning Guide (7th Ed). Chicago Upstart Publishing.
Banjoko,S.A.(1989). Production and Operation Management, Lagos. Sabau Publishers.
Barber (1967) A History of Economic Thought, Harmondsworth, Penguin Books Ltd,
Bartlett, C; Kotrlik, J. And Higgins, C (2004). 'Transnational Management'. 4th Ed. McGraw-
Hill, London.
Barlett, J.E., Kotrlik, J. and Higgins, C. (2004). ―Organisational Research: Determining
Appropriate Samples Size in Survey Research‖, Information Technology, Learning and
Performance Journal, Vol.19 (1) Pp. 43-50.
Barreto, H. (1989). The Entrepreneur in Microeconomic Theory. Rout ledge, London and New
York.
Bee Management Consultancy (2005). Analysis and Evaluation of Distribution Channels in
various Sectors of Indian Economy. Retrieved February, 6th 2011, http//www.beemgt
consultancy.com
Bello, D. C. & Lohtia, R. (1995). Export Channel Design: The Use of Foreign Distributors and
Agents. Journal of Academy of Marketing Science, v. 23, n. 2, p. 83-93.
Bello .J.A. (2009) ―Social Cognitive to Trust Models‖ in T. Torres – Coronas, M. Aria-Oliva
(Eds). Encyclopaedia of Human Resources Information System: Challenges in HRM No:
2 pp 803-809 (IGI Global), Hershey, PA).
Bittei, P. R. (1984), Organisation and Environment, Illinois: Richard D. Irwin
Bolt, J.G. (1987). Practical Sales Management, Macmillan Publisher, London.
Bowersox, D.J. (1990). Physical Distribution: Development, Current Status and Potentials.
Bucklim, J. S. (1960), ―A Methodology for Linking Customer Acquisition to Customer
Retention,‖ Journal of Marketing Research, Vol.38 No.2, pp 262–68.
Carland, I.W. & J.C. Carland (1984). “Differentiating Entrepreneurs from Small Business
Owners: A Conceptualization”. Academy of Management Review, Vol.9 No.2.
Daves, E. D. (1999), "Some Functions of Marketing Reconsidered". In: Cox, R. and Alderson,
W. (eds.), Theory of Marketing, Chicago: Irwin.
167
Davide, & Antonello (2003). Innovation. Foreign Ownership and Multinationality: An Empirical
Analysis on Italian Manufacturing Firms. Coleman White Paper Series, Retrieved
January, 28th, 2011 from http www bee mgt consultancy.com
De Waal P. R. (2007), Organisation and Environnent, Illinois: Richard D. Irwin
Desarbo, W. D. (1923), "The Economics of Marketing and Advertising", New York: Harper and
Brothers.
Dess, T and Robinson, H and Kotler, P. (2003), Marketing Management: Analysis, Planning,
and Control, Englewood Cliffs: Prentice-Hall, Inc.
Dollinger, M.J. (2006). Entrepreneurship Strategies and Resources Third Edition. Pearson
Education Ltd, New Delhi India.
Donaldson, E.H., (2001), Contingency Views of Organisation and Management, Chicago:
Science Research Associates.
Drucker, F.P (1999). ―Managing Oneself‖. Harvard Business Review.
Drucker, P (1985). Innovation and Entrepreneurship; Practice and Principles, Heinemann,
London.
Dunning, J. H. (1979). ―Explaining Changes of International Production: In defence of Eclectic
Theory‖, Oxford Bulletin of Economic and Statistics. 4, pp. 269–296.
Ekpo-Ufot, A. (1992). The State of the Arts of Finance-Accounting Management in Some Lagos
Organisations in the Chemical Industry: An Exploratory Study, in Ojo, J.A.T. (ed),
Business Performance Improvement Through Cost Management, Lagos: University of
Lagos Press.
Fajana, I.O. (1990). ―Managerial Philosophies and Transfer of Industrial Relations Practice”:
The Case of British Multinational Companies in Nigeria. Ph.D Thesis, University of
Lagos, Nigeria.
Fareeda and Nagendra (2010) Coca-Cola in India: Innovative Distribution Strategies with
―RED‘‘ Approach, Retrieved 28th January, 2011 from http www innovative distribution
strategies.com.
Fulmer, I. S., Gerhart, B., & Scott, K. S. (2003). Are the 100 best better? An empirical
investigation of the relationship between being a "great place to work" and firm
performance. Personnel Psychology, 56, 965-993.
168
Gartner, W.B & Mitchell, T.B & Vesper, K.H. (1989). ―A Taxonomy of New Business
Ventures‖. Journal of Business Venturing. 4, 169-186.
Gartner, W.B. (2001). Is there an elephant in entrepreneurship? Blind assumption in theory
development. Entrepreneurship Theory and Practice. 25(4), pp. 27-39.
Ghosal R., (2003), Non-economic Exchange in Industrial Networks, In Industrial Networks: A
New View of Reality, (Eds) Axelsson, B. and Easton, G., London: Routledge, pp.62-84.
Gong, Y., Law, K. S., Chang, S., & Xin, K. R. (2009). Human Resources Management and Firm
Performance: The Differential Role of Managerial Affective and Continuance
Commitment. Journal of Applied Psychology, 94, 263-275.
Goode, W.J. and Hatt, P.K.(1952). Methods in Social Research. New York: McGraw-Hall.
Gorman, G.. Handlon, D. & King W. (1997). ―Some Research Perspectives of Entrepreneurship
Education, Enterprise Education and Education for Small Business Management: A ten-
year literature review‖. International Small Business Journal, 15, 56-77.
Grabel, T. & Pyka, A & Hanusch, H (2001). ―An Evolutionary Approach to the Theory of
Entrepreneurship”, Dept of Economics, University of Augsburg, Germany
Hall,I. (1975-80). Business Administration, Great Britain, The Chaucer Press
Hall, I. (1969). Business Administration, Macdonald and Evans Ltd, London and Plymouth.
Hisrich, R.D (1989). Entrepreneurship. Fifth Edition, Lexington‘s M A. Lexington Books.
Hisrich, R.D and Peters, M.P. (2002). Entrepreneurship, Fifth Edition, Mc Graw Hill, Boston.
Holt, D.H. (2005). Entrepreneurship New Venture Creation. Eastern Economy Edition. Prentice-
Hall of India Private Limited. New Delhi.
Howard, G. G. (1971) ―The Extent of Nativization of Management in Overseas Affiliates of
Multinational Firms: A worldwide study‖, Indian Management, Vol. 10, No. 1, Jan p11-
20.
Hymer, S. (1976). The International Operations of National Firms: A Study of Direct
Investment, MIT Press.
Idachaba, F.S. (1984). ―Shortage Problems and Distribution”, Sunday Times. Sept, 16.
Ige, C.S. (1975). ―Optimising Cement Distribution in Nigeria:‖ An Application of the
Transportation model, Department of Economics, University of Ibadan.
169
Ige, C.S. (1979). ―Managing Cement Distribution in Nigeria”. A Linear Programming Problem.
Department of Economics, University of Strathecycle, Glasgow.
Ilori, T.A and A. Aju (2000), ―Technology Acquisition and Dispersal in Developing Countries‖,
A paper presented at the 3rd Biennial International Conference of African Broadcasters,
Abuja, 26-28 October.
Inegbenebor, A.U. (2006). The Fundamental of Entrepreneurship. Malhouse Press Limited,
Lagos. Innovation, 97-108 Harper Collins, New York.
Iyanda, O. (1990). Marketing Theory for Practitioners, Heinemann and Co, Nigeria.
Iyanda, O. (1991). ―Multinational Corporations and the Diffusion of skills in Nigeria‖. Nigerian
Journal of Management Studies. Vol.1, No.1.
Izedonmi, F. & Osaze (2002) Unpublished lecture Notes, Benin City.
Jantan, M., Ndubisi, N.O. & Ong, B.Y. (2003). Viability of E-commerce as an Alternative
Distribution Channel, Logistics Information Management, 16(6), 427-439.
Johnson, J. L. (1999). ―Strategic Integration in Industrial Distribution Channel: Managing the
Inter-firm Relationship as a Strategic Asset‖, Journal of the Academy of Marketing
Science, 27(1): 4
Kearney, A.T. (2000). Consumers, Retailers, Manufacturers in the Economy, available (January)
http://www.atkearney.com/main.taf
Kerlinger, F. (1964). Foundations of Behavioural Research. New York: Holt, Rinehart and
Winston.
Kilby, P. (1967). ―Industrial Relations and Wage Determination: Failure of the Anglo-Saxon
Model‖, Journal of Developing Areas, Vol. 1, No. 4.
Kirpalani, V. H. (1984). International Marketing, Prentice Hall International, New Delhi.
Kuratko, D.F. & Welsch, H.P. (2004). Strategic Entrepreneurial Growth (2nd ed.) Mason, OH:
South-Western College Publishers.
Kuratko, D.F. (1996). ―Risk Challenges and Innovation: The Entrepreneurial Experience at Ball
State University‖. Mid-American Journal of Business. 11(2), 43-48.
Kuratko, D.F. (2004). ―Entrepreneurship Education in the 21st Century. From Legitimization to
Leadership”. Proceeding of the U.S. Association for Small Business & Entrepreneurship.
45-60.
170
Kuratko, D.F. Hodgetts, R.M. (2004). Entrepreneurship Theory Process Practice. Mason. OH:
South Western College Publishers.
Levine, Ross. (1997). ―Financial Development and Economic Growth: Views and Agenda‖.
Levitt, T. (1960). Marketing, Business, the Ultimate Resource, A Bloomsbury Reference Book,
London, 2002.
McCarthy, E.J. (1960), Basic Marketing. Homewood: Irwin.
Miles, D and Snow, P., (1976) Developing Relationships in Business Networks, New York:
Routledge
Nwokoye, G.N. (1981). Modern Marketing for Nigeria, Macmillan Publisher, London.
Nwokoye, N. G. (1996), Modern Marketing for Nigeria: Principles and Practice; Onitsha:
Africana First Publishers Ltd.
Odugbesan, O. and Osuagwu L. (1999), Marketing Promotions and Sales Management; Lagos:
Pumark Nigeria Limited.
Odusina, B. (1975). Some Thoughts on Curriculum Development in Nigeria
Offiongodon, A.M. (1991). Marketing: Elements, Approaches and Dynamics, Julab Publisher,
Ibadan.
Ogundele, O.J.K (2005) ―Developing African Entrepreneurs for the Challenges of Globalisation,
the Environment and Sustainability‖, Faculty of Social Sciences International Conference
Publication 127 – 156, Lagos State University, Ojo, Bocsom Publishers.
Ogunsanyan, A. A. (2000). National Transport Policy for Nigeria. Highlights of Issues Held at
ECOWAS Secretariat, Asokoro, Abuja.
Ologun, D.O. (2006). Entrepreneurship Development in Nigeria. Lamplight Educational Books
Akure, Nigeria.
Olson, D.D. (1987). ―Entrepreneur and Management‖. Journal of Small Business Management.
Vol.25. No. 3.
Osagie, E.et.al (1990). ―Socio-Cultural Aspect of Entrepreneurship and the Development of CSIs
in Nigeria‖ Policy Issues in SSI Development in Nigeria CDS, Jos, p.26.
Osuagu, P. (2006), Marketing Management: Analysis, Planning, and Control, Englewood Cliffs:
Prentice-Hall, Inc.
171
Otokiti, S.O. (2003). Manager in International Marketing and Export Management Competition.
Ibadan.
Owualah,S.I. (1999). Entrepreneurship in Small Business Firms. G-Mag Investment
Limited.Ikeja, Lagos.
Oyedepo, D.O. (2008) Success Systems, Dominion Publishing House, Lagos.
Oyelaran-Oyeyinka, B., Laditan, G. O. A. and Esubiyi, A. O. (1996). E-marketing Vs.
Traditional Marketing: Upsides & Downsides‖, Available from Papers4you.com Policy
25 (7), 1081-1096
Penrose, E.T. (1968). The Theory of Growth of the Firm. Basil Blackwell, Oxford.
Philips, B.S. (1971). Social Research: Strategy and Tactics. 2nd Ed. New York: Macmillian.
Porter, M (1980). ―What is Strategy Business the Ultimate Resource‖. In, a Bloomsbury
Reference Book, London, 2002.
Powell, R., (1991), Relationship Marketing: Successful Strategies for the Age of the Customer,
Addission Reading: Wesley, M.A.
Rhodes, J., Hung, R., Lok, P., Ya-Hui Lien., B., & Wu, C. (2008). ―Factors Influencing
Organisational Knowledge Transfer: Implication for Corporate Performance‖. Journal of
Knowledge Management, 12, 84-100.
Robbins D, Benbury, T, and Morgan, G. (2005), Images of Organisation, London: Sage
Publications Ltd.
Robbins, R. E. and C. C. Robinson (1994), Fit Failure and the Hall of Fame: How Companies
Succeed or Fail, New York: Macmillan Inc.
Robinson, P. Hay, M. & Camp, SM. (1996). ―The Mind Field Exercise. ―The challenge‖ in
Entrepreneurship Education‖. Simulation and Gaming. 27, 350-364.
Robson, C. (2002). Real World Research: A Resource for Social Scientists and Practitioner,
Researchers Blackwell Publishers Ltd, Oxford.
Rodney, W. (2005) How Europe Underdeveloped Africa, Abuja, Panaf Press.
Rodngnce, J., Bessant, J. & Pavitt, K. (2005). Managing Innovation: Integrating Technological,
Market and Organisational Change, New York: John Wiley & Sons.
Rogers .E.M. (1983). ―Diffusion of Innovations” Free Press. NY.
172
Rosemary-Stewart S.,. E. (1961), ―An Empirical Analysis of the Influence of Cross-relational
Impacts of Strategy Analysis on Relationship Performance in a Business Network
Context‖ Journal of Strategic Marketing ,Vol. 13 No. 1 pp 219 – 237
Schumpter, J.A. (1934). The Theory of Economic Development. Harvard University Press,
Cambridge, Mass.
Selltiz, C.; Wrightsman, L; and Cook, S. (1976). Research Methods in Social Relations. 3rd Ed.
New York, Holt, Rinehart and Winston.
Sexton, D.L. & Upton N.E. (1984). ―Entrepreneurship Education: Suggestions for Increasing
Effectiveness‖. Journal of Small Business Management. 22(4), 18-25.
Sexton, D.L. & Upton N.E. (1987). ―Evaluation of an Innovative Approach to Teaching
Entrepreneurship‖. Journal of Small Business Management, 25(1), 35-43.
Shane, S. & Venkataraman S. (2000). ―The Promise of Entrepreneurship as a Field of Research‖.
Academy of Management Reviews, 25, 217-226.
Sheperd, D.A. & (2004). ―Educating Entrepreneurship Student about Emotion and Learning
from Failure‖. Academy Management Learning and Education, 3(3), 274-287.
Sheperd, D.A. (2003). ―Learning Form Business Failures: Proposition about the Grief Recovery
Process for the Self Employed.‖ Academy of Management Review, 28, 318-329.
Shepherd, D.A. & Zacharakis, A. (2001). ―Speed to Initial Public Offering of VC-backed
Companies‖. Entrepreneurship Theory and Practice, 25,(3), 59-69.
Shepherd, D.A. Zacharakis, A. (2002). ―Venture Capitalist‘ Expertise: a Call for Research into
Decision Aids and Cognitive Feedback‖. Journal of Business Venturing, 17(1), 1-20.
Singleton, R.A., Straits, B.C. and Straits, M.M. (1993). Approaches to Social Research. 2nd Ed.
New York: Oxford University Press.
Slocum, J. W. (1972). ―Racial Differences in Job Attitudes‖, Journal of Applied
Small Business Administration. (1998). The New America Revolution: The Role and Impact of
Small Firms. Washington, DC: Small Business Administration. Office of Economic
Research.
Sobel, R. (1974). The Entrepreneurs: Exploration within the American Business Tradition. New
York: Wey bright and Talley.
173
Solomon, G.T. & Fernald L.W., Jnr (1991). ―Trends in Small Business Management and
Entrepreneurship in the United State.” Entrepreneurship Theory and Practice, 15. 25-39.
Solomon, G.T. & Fernald L.W., Jr. (1993). ―Assessing the Need for Small Business
Management/Entrepreneurship Course at the University Level”. Proceedings of the 17th
National Small Business Consulting Conference-small Business Institute Director‘s
Association, 102-107.
Solomon, G.T. (1998). ―Small Business Management and Entrepreneurial Education in America:
A National Survey Overview‖. Journal of Private Enterprise, 4(1), 109-118.
Solomon, G.T. Duffy, S., & Tarabishy, A. (2002). “The State of Entrepreneurship Education in
the United State. A Nationwide Analysis”. International Journal or Entrepreneurship
Education, 1(1), 65-86.
Solomon, G.T. Weaver, K.M. & Fernald L.W. Jr. (1994). ―Pedagogical Methods of Teaching
Entrepreneurship: A Historical Perspective.‖ Simulation and Gaming, 25(3), 338-358.
Spahur, W.E. (1934). Economics and Problems, New York Parrar and Rinerhart Inc.P.240.
Staw, B. M., & Epstein, L. D. (2000). What Bandwagons Bring: Effects of Popular Management
Techniques on Corporate Performance, Reputation, and CEO pay. Administrative Science
Quarterly, 45, 523-556
Stevenson, H.H, et al, (1985). New Business Ventures and the Entrepreneur Homewood, Irwin
Stevenson, H.H. (2000). “Why Entrepreneurship has Won Coleman White Paper”, USASBE
National Conference, February.
Stolze, W.J. (1992). Startup: An Entrepreneur’s Guide to Launching and Managing a New
Venture. Hawthorne, N.J: Carcer Press.,
Stumpf, S.S. Dunbar, L., & Mullen, T.P. (1991). ―Simulations in Entrepreneurship Education:
Oxymoron or Untapped Opportunities‖? Frontier of Entrepreneurship Research, 11, 681-
694.
The International Labour Office Programmed Book, (1968). Creating a Market.
Subramony, M., Krause, N., Norton, J., & Burns, G. N. (2008). The Relationship between
Human Resource Investments and Organizational Performance: A Firm-level
Examination of Equilibrium Theory, 93, 778-788.
174
Sunkel, O. (1985). ―Towards an Understanding of the Emerging Transnational System‖. The
CTC Reporter., No. 20, Autumn p48-50.
Timmons, J.A (1994) “New Venture Creation” Entrepreneurship CAPITAL Advantage.
Helsinki School of Economics Publications, A- 113.
Timmons, J.A. (2002). New Venture Creation (6th ed.) Homewood, IL: Irwin.
Todaro,M. P (1077). Economics for a Developing World, Longman, London.
Torrence, R.W. (1992). In the Owner’s Chair, Eaglewood Cliffs, N.J: Prentice Hall.
Trolt, P. (1993) ―Inward Technology Transfer as an Interactive Process: A case study of ICT‖,
PhD thesis, Cranfield University.
Trolt, P. (1998) ―Growing Businesses by Generating Genuine Business Opportunities‘, Journal
of Applied Management Studies, Vol 7, No. 4. 211-22
Trolt, P. (2004) Innovation Management and New Product Development, Third Edition.
Truell, A.D. Webster, L., & Davidson, C (1998). ―Fostering Entrepreneurial Spirit: Integrating
the Business Community into the Classroom.‖ Business Education Forum, 53(2), 28-29,
40.
Tulgan, B. (1999). ―Generation X: The Future is Now” Entrepreneur of the Year Magz, 5(Fall),
42. Tushman. M. L & Moore, W..L Readings in Management
Twealfhoven, B.W.M & Indivers, N.V (1993). The Role of Dynamic Entrepreneurship in
Eastern Europe, D.F. Abell and T. Koellermeier (eds), Delwel Publisher, the Hagne,
1993, pp 7 -13.
Tybout, J. (1984). ―Interest Controls and Credit Allocation in Developing Countries.‖
Udeh, J.O. (1999).‖Entrepreneurship in the 21st Century‖ CIDJAP Publication, Enugu.
Upton, N., Teal, E.J. & Felan, J.T. (2001). ―Strategic and Business Planning Practices of Fast
Growing Family Firms‖. Journal of Small Business Management, 39(4), 60-70.
Useem, J (2001 may). The Risk taker Returns. Fortune Small Business. pp. 70-72.
Van Clouse, G.H. (1990). ―A Controlled Experiment Relating Entrepreneurial Education to
Student‘s Startup Decisions‖. Journal of Small Business Management, 28(2), 45-53.
Van Dyck, C., Frese, M., Baer, M., & Sonnentag, S. (2005). Organizational Error Management
Culture and its Impact on Performance: A Two-study Replication. Journal of Applied
Psychology, 90, 1228-1240.
175
Venkatraman, J. B. and Ramanayan, D. R., (1957), "What is the Marketing Management
Concept?‖ In: Bass, F (ed.). The Frontiers of Marketing Thought in Action, Chicago:
AMA
Vernon, R. (1966). International Investment and International Trade. In the Product Cycle
Quarterly Journal of Economics, Vol. 80.
Vesper, K.H. & Gartner, W.B. (1997). ―Measuring Progress in Entrepreneurship Education‖.
Journal of Business Venturing, 12(5), (May), 403-423.
Vesper, K.H. (1986]. New Development in Entrepreneurship Education. In D.L. Sexton & R.W.
Smilor (Eds). The Art & Science Entrepreneurship, pp. 379-387. Cambridge, M.A:
Ballinger.
Vesper, K.H. (1990). New Venture Strategies Revised Edition, Prentice Hall, Englewood Cliffs,
N.J.
Vesper, K.H. (1999). ―Unfinished Business (Entrepreneurship) of the 20th Century”. Coleman
White Paper. USASBE National Conference, January 1999.
Vesper, K.H. Gartner, W.B. (1999). University Entrepreneurship Program. Lloyd Greif Centre
for Entrepreneurial Studies, University of Southern California. Los Angeles.
Vesper, K.H., & McMullen, W.E. (1998). “Entrepreneurship: Today Courses, Tomorrow
Degrees‖? Entrepreneurship Theory and Practice, 13(1), 7-13.
Virtanen, M. (1996). ―Entrepreneurial Finance and Venture Capital Advantage” Helsinki
School of Economics Publications; A -113.
Walter,C.G.(1974). Marketing Channels, New York: Roland Press Company.
Walters, S. D., & Galtoma, S. L. (1996s). Trust that Binds: The Impact of Collective Felt Trust
on Organizational Performance. Journal of Applied Psychology, 93, 593-601.
Wan, W. P., & Hoskisson, R. E. (2003). Home Country Environments, Corporate Diversification
Strategies, and Firm Performance. Academy of Management Journal, 46, 27-45.
Watt. P& Schmidheiny, S & Holliday, C.O. (2002). Walking the Talk: The Business Case for
Sustainable Development. Greenleaf Publishing, San Francisco.
Wawro, T. (2000). Radicals and Visionaries: The True Life Stories Behind the Entrepreneurs
Revolutionized the 20th Century: Irvine, CA: Entrepreneur Media.
176
Wentz S., and Eyrich R., (1970), "The Strategic Value of Direct Marketing: What are We Good
At?" Journal of Database Marketing, Vol. 9, No.l, pp.9-15
Wolfe, J. & Bruton G. (1994). ―On the Use of Computerized Simulations for Entrepreneurship
Education‖. Simulation and Gaming, 25(3), 405-418.
Woodward, (1965), Industrial Organisation: Theory and Practice, London: Oxford University
Press
Youndt, M. A., Snell, S. A., Dean, J. E., & Lepak, D. P. (1996). Human Resource Management,
Manufacturing Strategy, and Firm Performance. Academy of Management Journal, 39,
836-866.
Zehra S.A. Hayton J., Marcel J., & O‘neall, H. (2001). ―Fostering Entrepreneurship during
International Expansion: Managing Key Challenges‖. European Management Journal.
19(4), 359-369.
Zehra, S.A. Kuratko, D.F. & Jennings, D.F. (1999). ―Corporate Entrepreneurship and Wealth
Creation: Contemporary and Emerging Perspectives.‖ Entrepreneurship Theory and
Practice, 24(2), 5-9.
Zeithaml, C.P. & Rice, G.H. (1987). ―Entrepreneurship Small Business Education in American
Universities.‖ Journal of Small Business Management, 25(1), 44-50.
Zider, B. (1998). ―How Venture Capital Works‖ Harvard Business Review.
177
APPENDICES
APPENDIX I
RESEARCH QUESTIONNAIRE
Department of Business Studies,
School of Business,
College of Development Studies,
Covenant University, Ota
Ogun State
30th January, 2009
Dear Respondent,
RESEARCH QUESTIONNAIRE
My doctoral degree student of Covenant University, is conducting a research in Entrepreneurship, titled:
―Innovative Distribution Strategies and Performance of selected Multinational corporations
(MNC,s) and Domestic Manufacturing Firms in Nigeria: A Case Study of Lagos State Industrial
Areas”. To assist him in this regard, I would appreciate your efforts in completing the attached
questionnaire. I assure you that all the information received in this connection shall be treated and held in
strict confidence.
Yours faithfully,
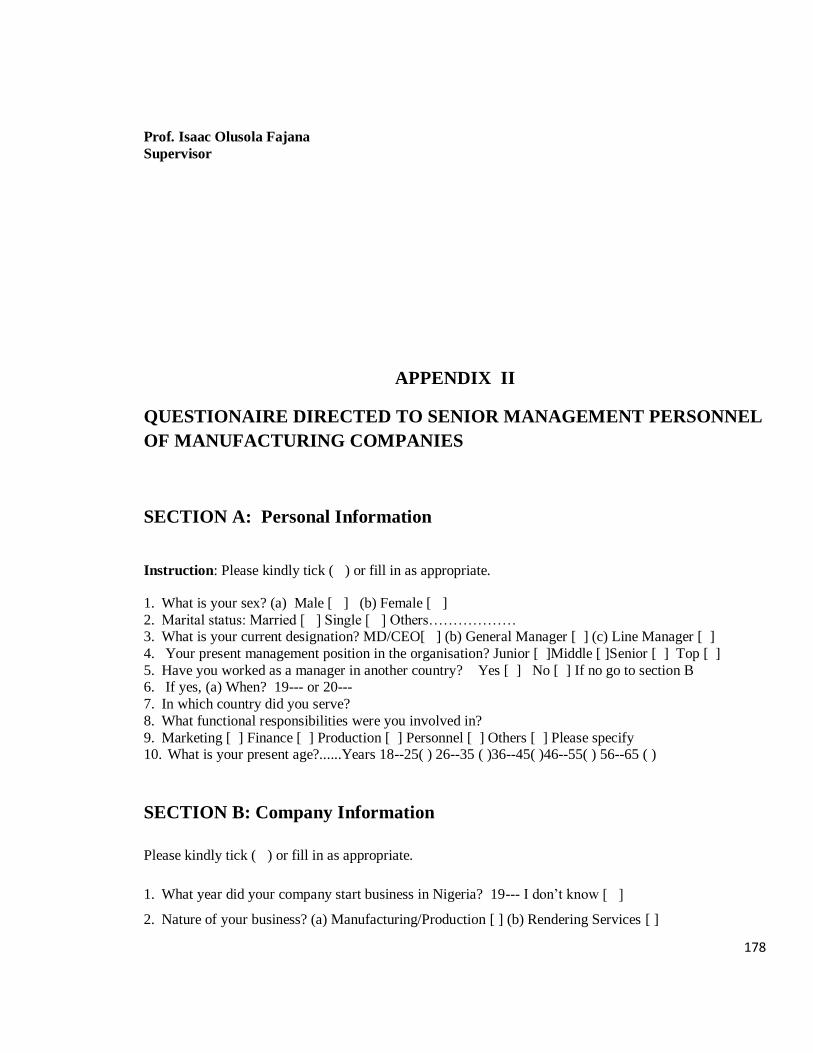
178
Prof. Isaac Olusola Fajana
Supervisor
APPENDIX II
QUESTIONAIRE DIRECTED TO SENIOR MANAGEMENT PERSONNEL
OF MANUFACTURING COMPANIES
SECTION A: Personal Information
Instruction: Please kindly tick ( ) or fill in as appropriate.
1. What is your sex? (a) Male [ ] (b) Female [ ]
2. Marital status: Married [ ] Single [ ] Others……………… 3. What is your current designation? MD/CEO[ ] (b) General Manager [ ] (c) Line Manager [ ]
4. Your present management position in the organisation? Junior [ ]Middle [ ]Senior [ ] Top [ ]
5. Have you worked as a manager in another country? Yes [ ] No [ ] If no go to section B 6. If yes, (a) When? 19--- or 20---
7. In which country did you serve?
8. What functional responsibilities were you involved in?
9. Marketing [ ] Finance [ ] Production [ ] Personnel [ ] Others [ ] Please specify 10. What is your present age?......Years 18--25( ) 26--35 ( )36--45( )46--55( ) 56--65 ( )
SECTION B: Company Information
Please kindly tick ( ) or fill in as appropriate.
1. What year did your company start business in Nigeria? 19--- I don‘t know [ ]
2. Nature of your business? (a) Manufacturing/Production [ ] (b) Rendering Services [ ]
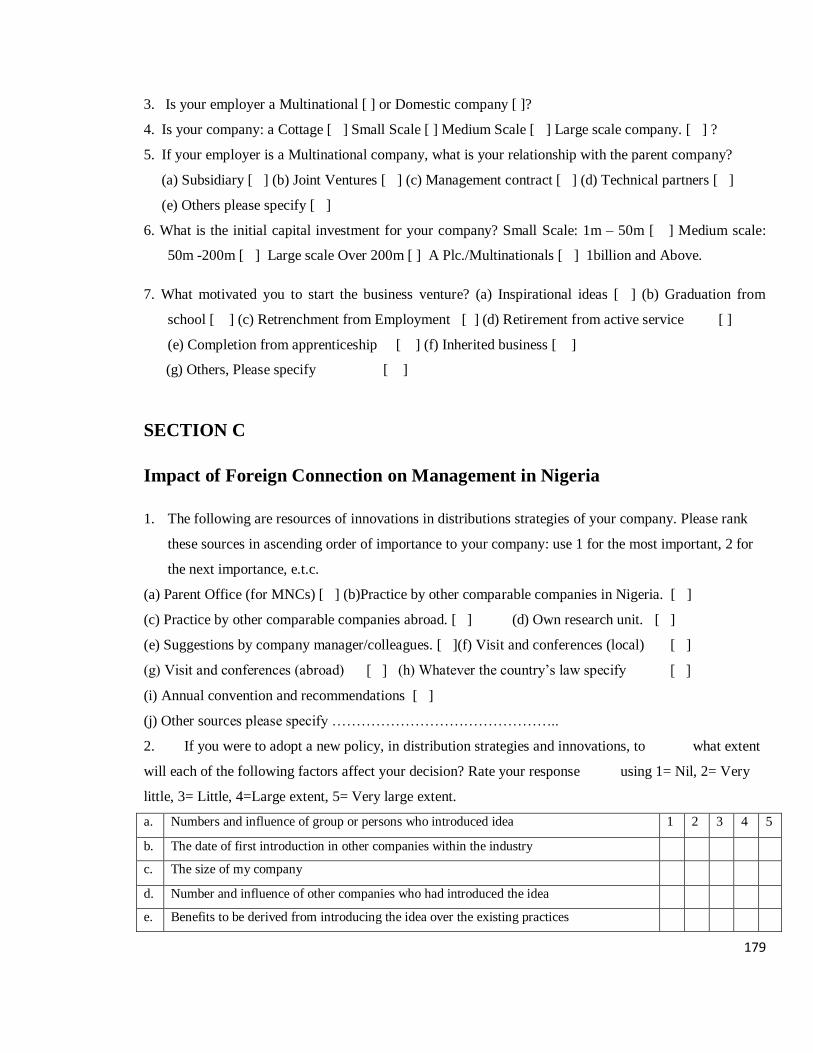
179
3. Is your employer a Multinational [ ] or Domestic company [ ]?
4. Is your company: a Cottage [ ] Small Scale [ ] Medium Scale [ ] Large scale company. [ ] ?
5. If your employer is a Multinational company, what is your relationship with the parent company?
(a) Subsidiary [ ] (b) Joint Ventures [ ] (c) Management contract [ ] (d) Technical partners [ ]
(e) Others please specify [ ]
6. What is the initial capital investment for your company? Small Scale: 1m – 50m [ ] Medium scale:
50m -200m [ ] Large scale Over 200m [ ] A Plc./Multinationals [ ] 1billion and Above.
7. What motivated you to start the business venture? (a) Inspirational ideas [ ] (b) Graduation from
school [ ] (c) Retrenchment from Employment [ ] (d) Retirement from active service [ ]
(e) Completion from apprenticeship [ ] (f) Inherited business [ ]
(g) Others, Please specify [ ]
SECTION C
Impact of Foreign Connection on Management in Nigeria
1. The following are resources of innovations in distributions strategies of your company. Please rank
these sources in ascending order of importance to your company: use 1 for the most important, 2 for
the next importance, e.t.c.
(a) Parent Office (for MNCs) [ ] (b)Practice by other comparable companies in Nigeria. [ ]
(c) Practice by other comparable companies abroad. [ ] (d) Own research unit. [ ]
(e) Suggestions by company manager/colleagues. [ ](f) Visit and conferences (local) [ ]
(g) Visit and conferences (abroad) [ ] (h) Whatever the country‘s law specify [ ]
(i) Annual convention and recommendations [ ]
(j) Other sources please specify ………………………………………..
2. If you were to adopt a new policy, in distribution strategies and innovations, to what extent
will each of the following factors affect your decision? Rate your response using 1= Nil, 2= Very
little, 3= Little, 4=Large extent, 5= Very large extent.
a. Numbers and influence of group or persons who introduced idea 1 2 3 4 5
b. The date of first introduction in other companies within the industry
c. The size of my company
d. Number and influence of other companies who had introduced the idea
e. Benefits to be derived from introducing the idea over the existing practices

180
f. The possibility of first trying out the idea
g. Is the idea easy to understand?
h. Is the idea compatible with the existing practice in the organization?
i. Profitability of the idea
j. The extent to which it can be observed from those who have already adopted it
3, Are there foreign values you think has been introduced to Nigerian industries?
Could you please list them briefly?
… … … … … … … … … …
… … … … … … … … … …
… … … … … … … … … …
… … … … … … … … … …
… … … … … … … … … …
4. Do you think that your company‘s distribution strategies and policies have been modified or influenced
by the values of Nigerian workers? Yes [ ] No [ ]
If yes, in what ways? (please describe briefly)
QUESTIONAIRE ADMINISTERED ON MARKETING/DISTRIBUTION
MANAGEMENT PERSONNEL OF MANUFACTURING COMPANIES
SECTION A: Personal Information
Please kindly tick ( ) or fill in as appropriate.
1. What is your sex? (a) Male [ ] (b) Female [ ]
2. Marital status : Married [ ] Single [ ] Others
3. What is your current designation?
(a) General Manager [ ] (b) Planning Manager [ ] Marketing/Distribution Manager [ ]
4. What is your present management position in the organization?
Junior [ ] Middle [ ] Senior [ ] Top [ ]
5. Have you worked as a manager in another country? Yes [ ] No [ ]
6. If yes, (a) When? 19--- or 20---
(a) In which country did you serve?
(b) What functional responsibilities were you involved in?
(c) Marketing [ ] Finance [ ] Production [ ] Personnel [ ] Others [ ]
Please specify…………………………………………..
7 What is your present age?...Years 18--25 ( ) 26--35( ) 36--45( ) 46--55( ) 56--65( )
SECTION B
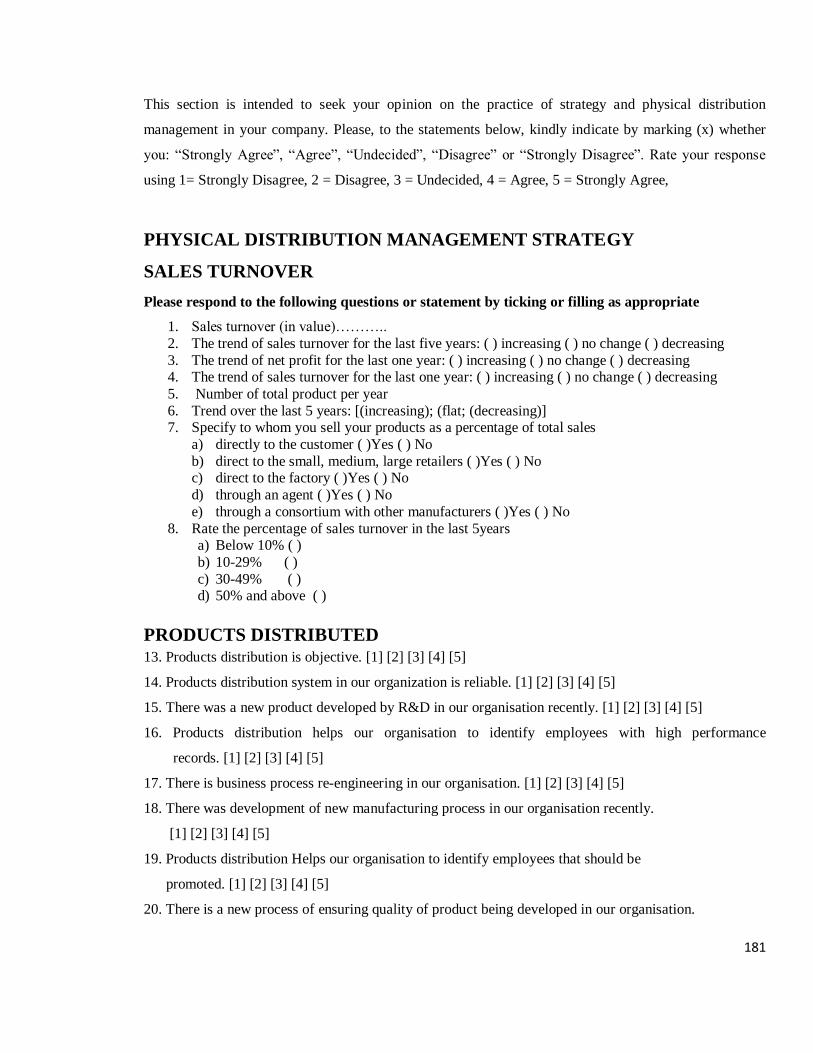
181
This section is intended to seek your opinion on the practice of strategy and physical distribution
management in your company. Please, to the statements below, kindly indicate by marking (x) whether
you: ―Strongly Agree‖, ―Agree‖, ―Undecided‖, ―Disagree‖ or ―Strongly Disagree‖. Rate your response
using 1= Strongly Disagree, 2 = Disagree, 3 = Undecided, 4 = Agree, 5 = Strongly Agree,
PHYSICAL DISTRIBUTION MANAGEMENT STRATEGY
SALES TURNOVER
Please respond to the following questions or statement by ticking or filling as appropriate
1. Sales turnover (in value)………..
2. The trend of sales turnover for the last five years: ( ) increasing ( ) no change ( ) decreasing
3. The trend of net profit for the last one year: ( ) increasing ( ) no change ( ) decreasing 4. The trend of sales turnover for the last one year: ( ) increasing ( ) no change ( ) decreasing
5. Number of total product per year
6. Trend over the last 5 years: [(increasing); (flat; (decreasing)] 7. Specify to whom you sell your products as a percentage of total sales
a) directly to the customer ( )Yes ( ) No
b) direct to the small, medium, large retailers ( )Yes ( ) No c) direct to the factory ( )Yes ( ) No
d) through an agent ( )Yes ( ) No
e) through a consortium with other manufacturers ( )Yes ( ) No
8. Rate the percentage of sales turnover in the last 5years a) Below 10% ( )
b) 10-29% ( )
c) 30-49% ( ) d) 50% and above ( )
PRODUCTS DISTRIBUTED
13. Products distribution is objective. [1] [2] [3] [4] [5]
14. Products distribution system in our organization is reliable. [1] [2] [3] [4] [5]
15. There was a new product developed by R&D in our organisation recently. [1] [2] [3] [4] [5]
16. Products distribution helps our organisation to identify employees with high performance
records. [1] [2] [3] [4] [5]
17. There is business process re-engineering in our organisation. [1] [2] [3] [4] [5]
18. There was development of new manufacturing process in our organisation recently.
[1] [2] [3] [4] [5]
19. Products distribution Helps our organisation to identify employees that should be
promoted. [1] [2] [3] [4] [5]
20. There is a new process of ensuring quality of product being developed in our organisation.

182
[1] [2] [3] [4] [5]
69. There was a new line of production developed in our organisation recently.
[1] [2] [3] [4] [5]
70. Products distribution helps our organisation to discover the training needs of its employees.
[1] [2] [3] [4] [5]
OBSTRUCTIVE DISTRIBUTION PARAMETERS QUESTIONNAIRE
From questions 1 – 10, kindly state in one sentence of not more than 10 words how you will describe the
under listed obstructive distribution parameters.
(i) Does your organisation experience any storage facility problem?
(ii) what methods or type of distribution strategy does the company adopt? For how long and if the
strategy in use now has been changed before?
(iii) what are the likely problems affecting distribution strategy?
(iv) storage and depot types in use
(v) what transportation, loading and off-loading problems are encountered
(vi) major hazards during products distribution and travelling on the Nigerian roads
(vii) specialist equipment or vehicles used for distribution
(viii) types of vehicles used for distribution i.e truck, tanker or trailer
(ix) coordination of distribution strategy effectiveness at the head office and
(x) Mention one unnecessary hoarding of product your organisation experience.
(xi) From your experience how would you describe the state of the Nigerian road? Tick as appropriate
(1) Diplorable (2) Insecure (3) Very unsuitable for our distribution vehicles (4) In very good conditions
(5) In very bad state.
QUESTIONAIRE ADMINISTERED ON TO HUMAN RESOURCES AND
PLANNING MANAGERS IN MANUFACTURING COMPANIES
SECTION A: Personal Information
Please kindly tick ( ) or fill in as appropriate.
1. What is your sex? (a) Male [ ] (b) Female [ ]
2. Marital status : Married [ ] Single [ ] Others
3. What is your current designation?
(a) General Manager [ ] (b) Planning Manager [ ] Marketing/Distribution Manager [ ]
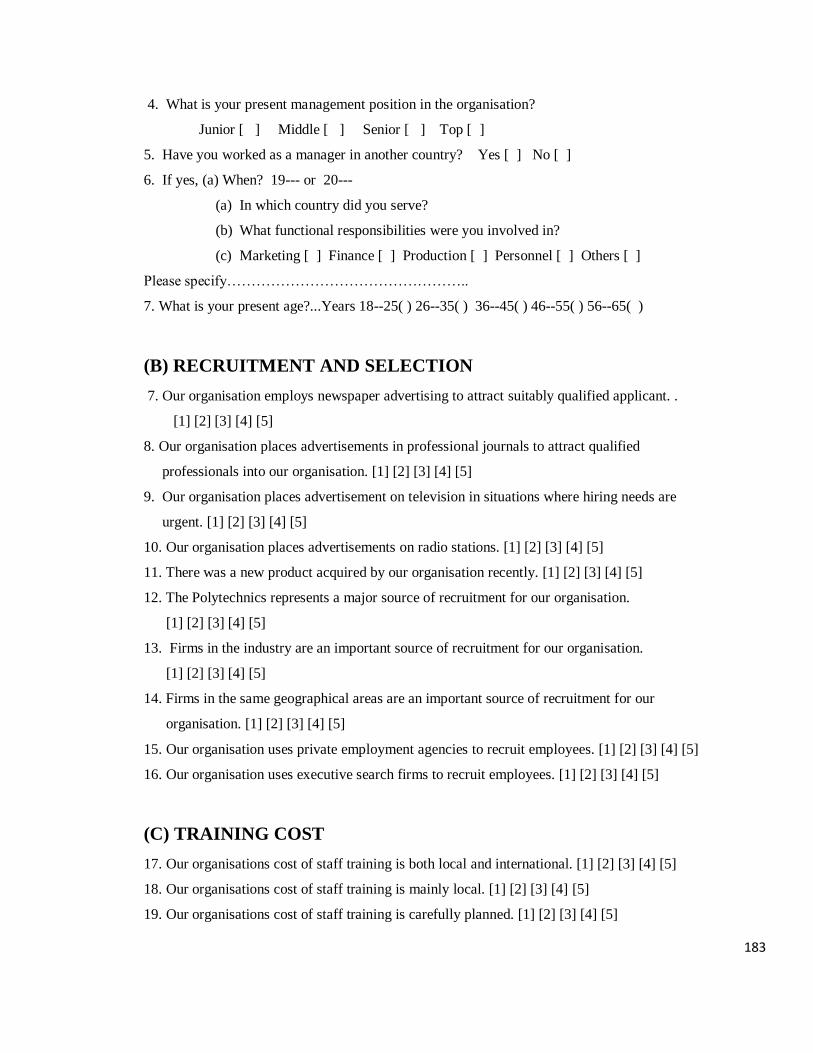
183
4. What is your present management position in the organisation?
Junior [ ] Middle [ ] Senior [ ] Top [ ]
5. Have you worked as a manager in another country? Yes [ ] No [ ]
6. If yes, (a) When? 19--- or 20---
(a) In which country did you serve?
(b) What functional responsibilities were you involved in?
(c) Marketing [ ] Finance [ ] Production [ ] Personnel [ ] Others [ ]
Please specify…………………………………………..
7. What is your present age?...Years 18--25( ) 26--35( ) 36--45( ) 46--55( ) 56--65( )
(B) RECRUITMENT AND SELECTION
7. Our organisation employs newspaper advertising to attract suitably qualified applicant. .
[1] [2] [3] [4] [5]
8. Our organisation places advertisements in professional journals to attract qualified
professionals into our organisation. [1] [2] [3] [4] [5]
9. Our organisation places advertisement on television in situations where hiring needs are
urgent. [1] [2] [3] [4] [5]
10. Our organisation places advertisements on radio stations. [1] [2] [3] [4] [5]
11. There was a new product acquired by our organisation recently. [1] [2] [3] [4] [5]
12. The Polytechnics represents a major source of recruitment for our organisation.
[1] [2] [3] [4] [5]
13. Firms in the industry are an important source of recruitment for our organisation.
[1] [2] [3] [4] [5]
14. Firms in the same geographical areas are an important source of recruitment for our
organisation. [1] [2] [3] [4] [5]
15. Our organisation uses private employment agencies to recruit employees. [1] [2] [3] [4] [5]
16. Our organisation uses executive search firms to recruit employees. [1] [2] [3] [4] [5]
(C) TRAINING COST
17. Our organisations cost of staff training is both local and international. [1] [2] [3] [4] [5]
18. Our organisations cost of staff training is mainly local. [1] [2] [3] [4] [5]
19. Our organisations cost of staff training is carefully planned. [1] [2] [3] [4] [5]
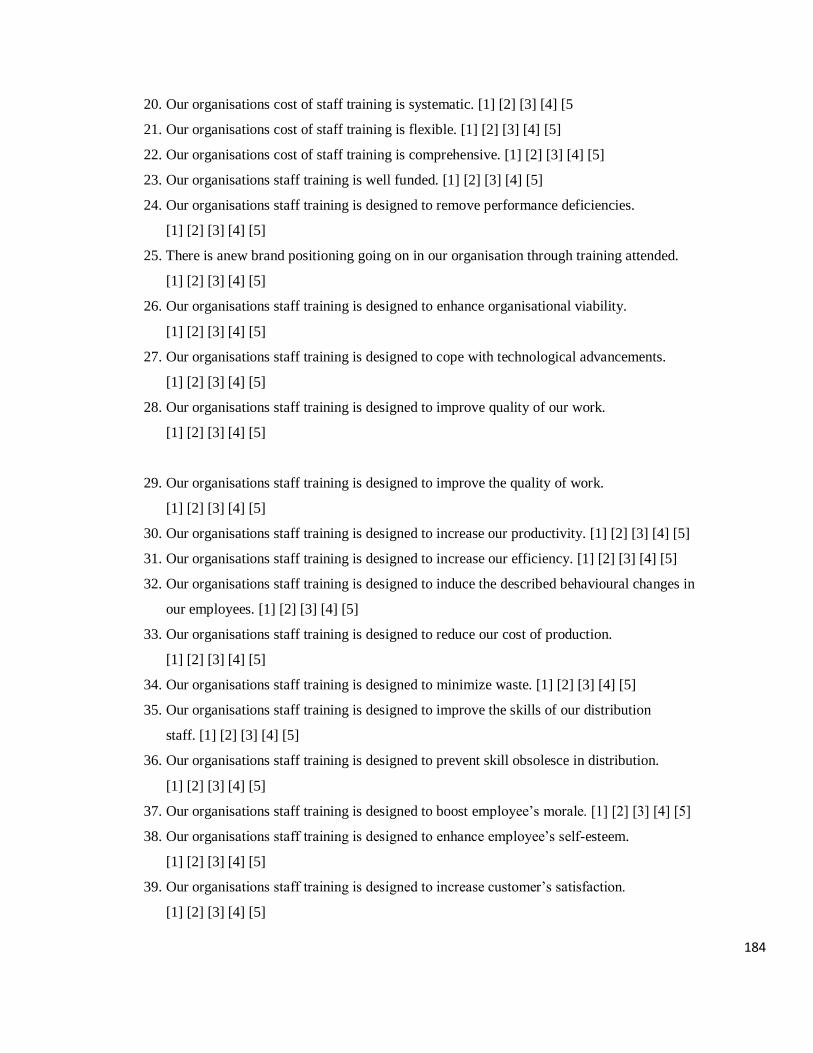
184
20. Our organisations cost of staff training is systematic. [1] [2] [3] [4] [5
21. Our organisations cost of staff training is flexible. [1] [2] [3] [4] [5]
22. Our organisations cost of staff training is comprehensive. [1] [2] [3] [4] [5]
23. Our organisations staff training is well funded. [1] [2] [3] [4] [5]
24. Our organisations staff training is designed to remove performance deficiencies.
[1] [2] [3] [4] [5]
25. There is anew brand positioning going on in our organisation through training attended.
[1] [2] [3] [4] [5]
26. Our organisations staff training is designed to enhance organisational viability.
[1] [2] [3] [4] [5]
27. Our organisations staff training is designed to cope with technological advancements.
[1] [2] [3] [4] [5]
28. Our organisations staff training is designed to improve quality of our work.
[1] [2] [3] [4] [5]
29. Our organisations staff training is designed to improve the quality of work.
[1] [2] [3] [4] [5]
30. Our organisations staff training is designed to increase our productivity. [1] [2] [3] [4] [5]
31. Our organisations staff training is designed to increase our efficiency. [1] [2] [3] [4] [5]
32. Our organisations staff training is designed to induce the described behavioural changes in
our employees. [1] [2] [3] [4] [5]
33. Our organisations staff training is designed to reduce our cost of production.
[1] [2] [3] [4] [5]
34. Our organisations staff training is designed to minimize waste. [1] [2] [3] [4] [5]
35. Our organisations staff training is designed to improve the skills of our distribution
staff. [1] [2] [3] [4] [5]
36. Our organisations staff training is designed to prevent skill obsolesce in distribution.
[1] [2] [3] [4] [5]
37. Our organisations staff training is designed to boost employee‘s morale. [1] [2] [3] [4] [5]
38. Our organisations staff training is designed to enhance employee‘s self-esteem.
[1] [2] [3] [4] [5]
39. Our organisations staff training is designed to increase customer‘s satisfaction.
[1] [2] [3] [4] [5]

185
40. Our organisations staff training is designed to increase our profitability. [1] [2] [3] [4] [5]
41. After the staff training our staff are encouraged to apply what they have learnt from
training to their jobs. [1] [2] [3] [4] [5]
42. In our organisation, trained staff have ample opportunity to apply their training.
[1] [2] [3] [4] [5]
43. Our organisations staff training programme is effective because it has improved our
Performance. [1] [2] [3] [4] [5]
APPENDIX III
QUESTIONAIRE ADMINISTERED ON FINANCE MANAGERS OF
MANUFACTURING COMPANIES
SECTION A: Personal Information
Please kindly tick ( ) or fill in as appropriate.
1. What is your sex? (a) Male [ ] (b) Female [ ]
2. Marital status : Married [ ] Single [ ] Others
3. What is your current designation?
(a) General Manager [ ] (b) Planning Manager [ ] Marketing/Distribution Manager [ ]
4. What is your present management position in the organization?
Junior [ ] Middle [ ] Senior [ ] Top [ ]
5. Have you worked as a manager in another country? Yes [ ] No [ ]
6. If yes, (a) When? 19--- or 20---
(a) In which country did you serve?
(b) What functional responsibilities were you involved in?
(c) Marketing [ ] Finance [ ] Production [ ] Personnel [ ] Others [ ]
Please specify…………………………………………..
7. What is your present age? …Years 18--25( ) 26--35( ) 36--45 ( ) 46—55( ) 56—65( )
(B) SALARIES AND WAGES
7. Remuneration in our organisation is among the best in the industry. [1] [2] [3] [4] [5]
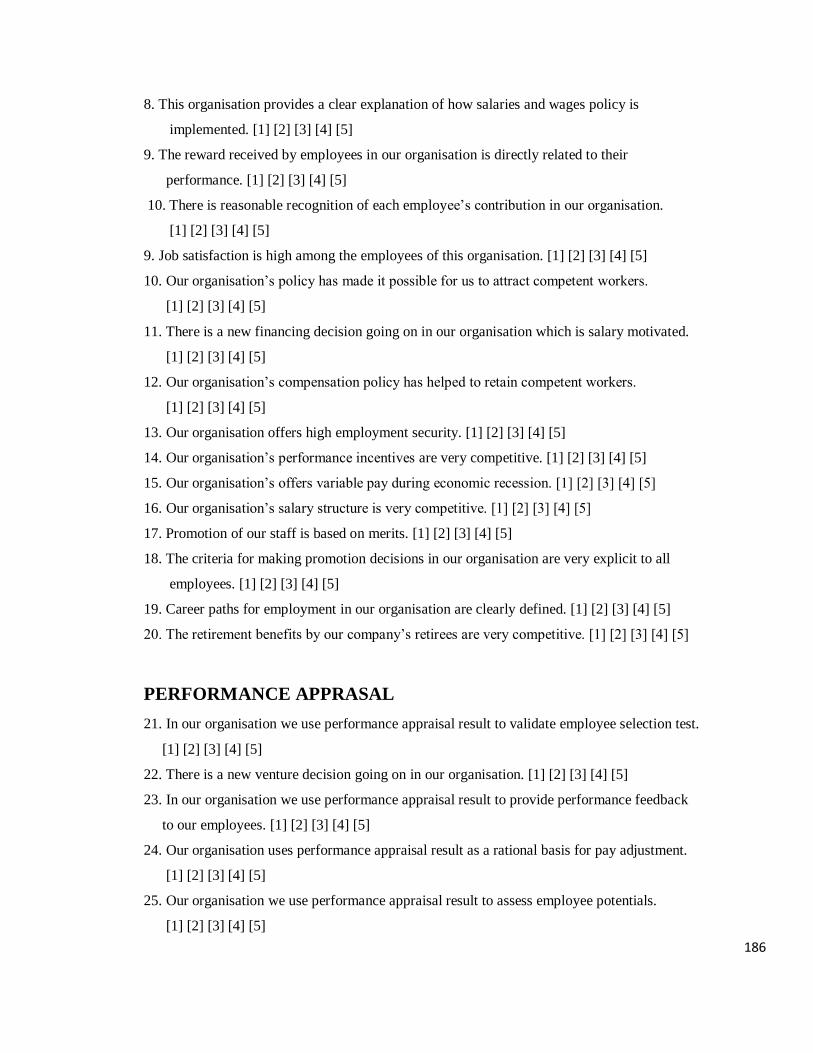
186
8. This organisation provides a clear explanation of how salaries and wages policy is
implemented. [1] [2] [3] [4] [5]
9. The reward received by employees in our organisation is directly related to their
performance. [1] [2] [3] [4] [5]
10. There is reasonable recognition of each employee‘s contribution in our organisation.
[1] [2] [3] [4] [5]
9. Job satisfaction is high among the employees of this organisation. [1] [2] [3] [4] [5]
10. Our organisation‘s policy has made it possible for us to attract competent workers.
[1] [2] [3] [4] [5]
11. There is a new financing decision going on in our organisation which is salary motivated.
[1] [2] [3] [4] [5]
12. Our organisation‘s compensation policy has helped to retain competent workers.
[1] [2] [3] [4] [5]
13. Our organisation offers high employment security. [1] [2] [3] [4] [5]
14. Our organisation‘s performance incentives are very competitive. [1] [2] [3] [4] [5]
15. Our organisation‘s offers variable pay during economic recession. [1] [2] [3] [4] [5]
16. Our organisation‘s salary structure is very competitive. [1] [2] [3] [4] [5]
17. Promotion of our staff is based on merits. [1] [2] [3] [4] [5]
18. The criteria for making promotion decisions in our organisation are very explicit to all
employees. [1] [2] [3] [4] [5]
19. Career paths for employment in our organisation are clearly defined. [1] [2] [3] [4] [5]
20. The retirement benefits by our company‘s retirees are very competitive. [1] [2] [3] [4] [5]
PERFORMANCE APPRASAL
21. In our organisation we use performance appraisal result to validate employee selection test.
[1] [2] [3] [4] [5]
22. There is a new venture decision going on in our organisation. [1] [2] [3] [4] [5]
23. In our organisation we use performance appraisal result to provide performance feedback
to our employees. [1] [2] [3] [4] [5]
24. Our organisation uses performance appraisal result as a rational basis for pay adjustment.
[1] [2] [3] [4] [5]
25. Our organisation we use performance appraisal result to assess employee potentials.
[1] [2] [3] [4] [5]
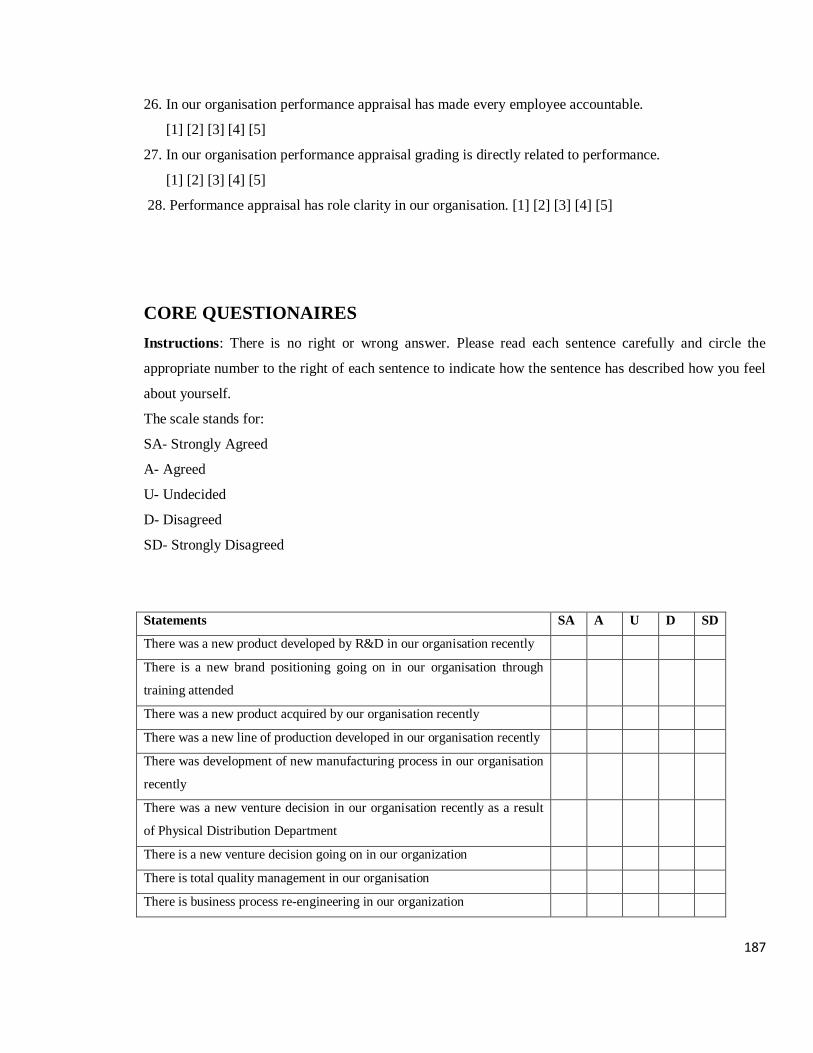
187
26. In our organisation performance appraisal has made every employee accountable.
[1] [2] [3] [4] [5]
27. In our organisation performance appraisal grading is directly related to performance.
[1] [2] [3] [4] [5]
28. Performance appraisal has role clarity in our organisation. [1] [2] [3] [4] [5]
CORE QUESTIONAIRES
Instructions: There is no right or wrong answer. Please read each sentence carefully and circle the
appropriate number to the right of each sentence to indicate how the sentence has described how you feel
about yourself.
The scale stands for:
SA- Strongly Agreed
A- Agreed
U- Undecided
D- Disagreed
SD- Strongly Disagreed
Statements SA A U D SD
There was a new product developed by R&D in our organisation recently
There is a new brand positioning going on in our organisation through
training attended
There was a new product acquired by our organisation recently
There was a new line of production developed in our organisation recently
There was development of new manufacturing process in our organisation
recently
There was a new venture decision in our organisation recently as a result
of Physical Distribution Department
There is a new venture decision going on in our organization
There is total quality management in our organisation
There is business process re-engineering in our organization
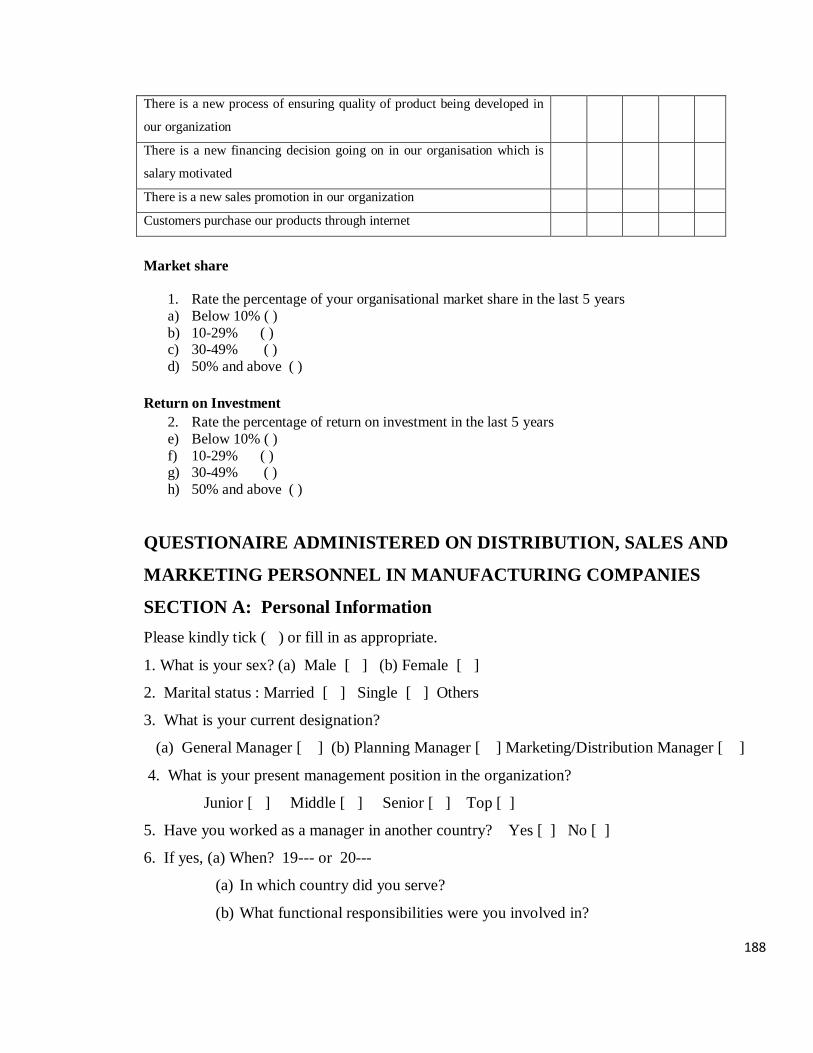
188
There is a new process of ensuring quality of product being developed in
our organization
There is a new financing decision going on in our organisation which is
salary motivated
There is a new sales promotion in our organization
Customers purchase our products through internet
Market share
1. Rate the percentage of your organisational market share in the last 5 years
a) Below 10% ( )
b) 10-29% ( ) c) 30-49% ( )
d) 50% and above ( )
Return on Investment
2. Rate the percentage of return on investment in the last 5 years
e) Below 10% ( )
f) 10-29% ( ) g) 30-49% ( )
h) 50% and above ( )
QUESTIONAIRE ADMINISTERED ON DISTRIBUTION, SALES AND
MARKETING PERSONNEL IN MANUFACTURING COMPANIES
SECTION A: Personal Information
Please kindly tick ( ) or fill in as appropriate.
1. What is your sex? (a) Male [ ] (b) Female [ ]
2. Marital status : Married [ ] Single [ ] Others
3. What is your current designation?
(a) General Manager [ ] (b) Planning Manager [ ] Marketing/Distribution Manager [ ]
4. What is your present management position in the organization?
Junior [ ] Middle [ ] Senior [ ] Top [ ]
5. Have you worked as a manager in another country? Yes [ ] No [ ]
6. If yes, (a) When? 19--- or 20---
(a) In which country did you serve?
(b) What functional responsibilities were you involved in?

189
(c) Marketing [ ] Finance [ ] Production [ ] Personnel [ ] Others [ ]
Please specify…………………………………………..
7. What is your present age? Years 18 - 25( ) 26 - 35( ) 36 - 45( ) 46 - 55( ) 56 – 65 ( )
(B) ROLE OF PHYSICAL DISTRIBUTION DEPARTMENT
Sales turnover
9. Sales turnover (in value)………..
10. The trend of sales turnover for the last five years: ( ) increasing ( ) no change ( )
decreasing
11. The trend of net profit for the last one year: ( ) increasing ( ) no change ( ) decreasing
12. The trend of sales turnover for the last one year: ( ) increasing ( ) no change ( ) decreasing
13. Number of total product per year
14. Trend over the last 5 years: [(increasing); (flat; (decreasing)]
15. Specify to whom you sell your products as a percentage of total sales
f) directly to the customer ( )Yes ( ) No
g) direct to the small, medium, large retailers ( )Yes ( ) No
h) direct to the factory ( )Yes ( ) No
i) through an agent ( )Yes ( ) No
j) through a consortium with other manufacturers ( )Yes ( ) No
16. Rate the percentage of sales turnover in the last 5 years
e) Below 10% ( )
f) 10-29% ( )
g) 30-49% ( )
h) 50% and above ( )
Market share
3. Rate the percentage of your organisational market share in the last 5 years
i) Below 10% ( )
j) 10-29% ( )
k) 30-49% ( )
l) 50% and above ( )
Return on Investment
4. Rate the percentage of return on investment in the last 5years
m) Below 10% ( )
n) 10-29% ( )
o) 30-49% ( )
p) 50% and above ( )
OBSTRUCTIVE DISTRIBUTION PARAMETERS QUESTIONNAIRE
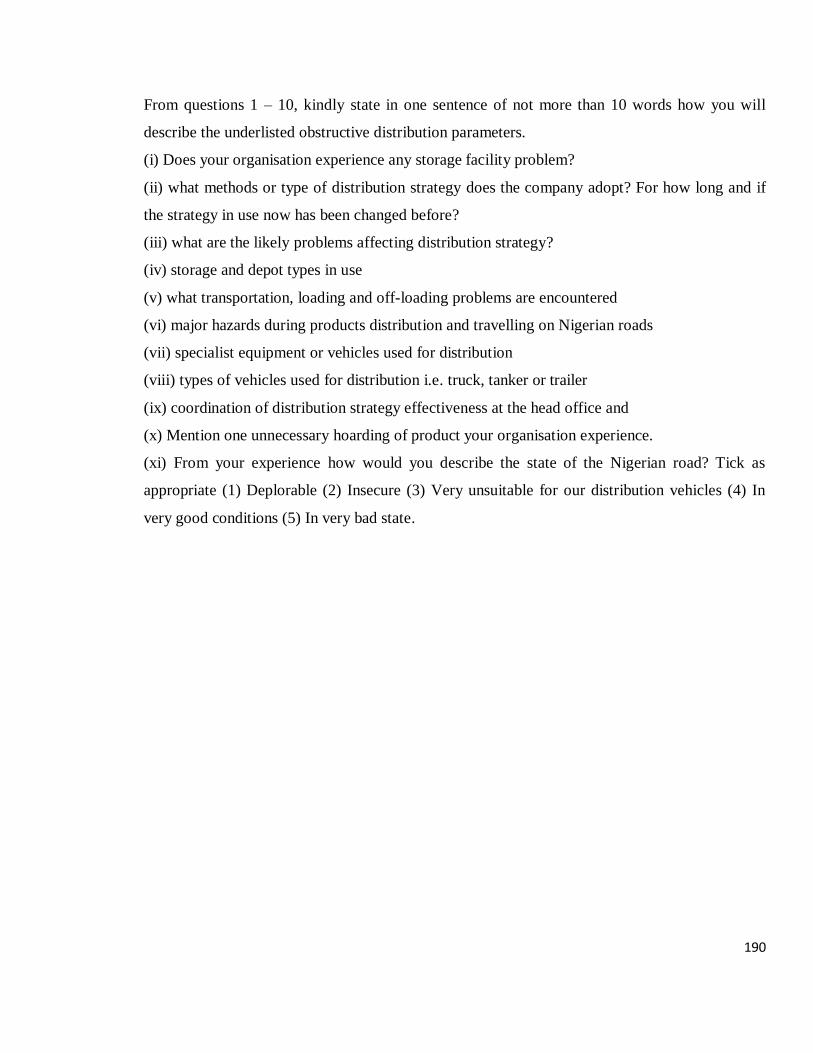
190
From questions 1 – 10, kindly state in one sentence of not more than 10 words how you will
describe the underlisted obstructive distribution parameters.
(i) Does your organisation experience any storage facility problem?
(ii) what methods or type of distribution strategy does the company adopt? For how long and if
the strategy in use now has been changed before?
(iii) what are the likely problems affecting distribution strategy?
(iv) storage and depot types in use
(v) what transportation, loading and off-loading problems are encountered
(vi) major hazards during products distribution and travelling on Nigerian roads
(vii) specialist equipment or vehicles used for distribution
(viii) types of vehicles used for distribution i.e. truck, tanker or trailer
(ix) coordination of distribution strategy effectiveness at the head office and
(x) Mention one unnecessary hoarding of product your organisation experience.
(xi) From your experience how would you describe the state of the Nigerian road? Tick as
appropriate (1) Deplorable (2) Insecure (3) Very unsuitable for our distribution vehicles (4) In
very good conditions (5) In very bad state.
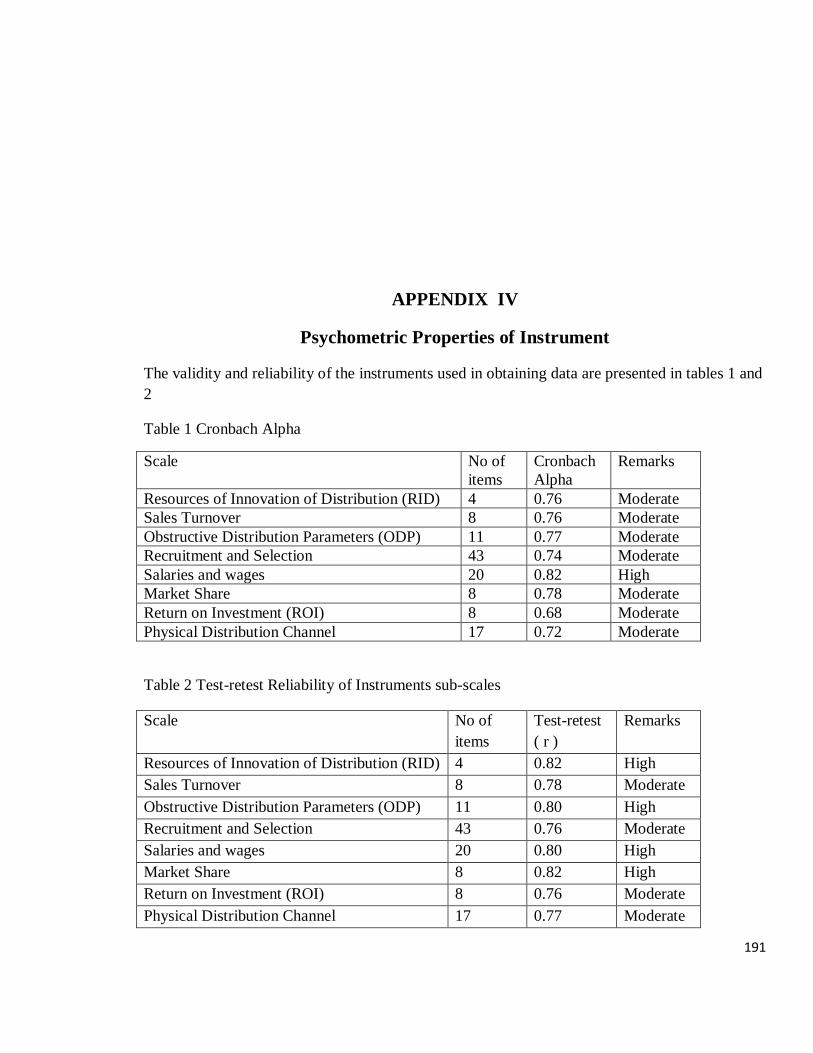
191
APPENDIX IV
Psychometric Properties of Instrument
The validity and reliability of the instruments used in obtaining data are presented in tables 1 and
2
Table 1 Cronbach Alpha
Scale No of
items
Cronbach
Alpha
Remarks
Resources of Innovation of Distribution (RID) 4 0.76 Moderate
Sales Turnover 8 0.76 Moderate
Obstructive Distribution Parameters (ODP) 11 0.77 Moderate
Recruitment and Selection 43 0.74 Moderate
Salaries and wages 20 0.82 High
Market Share 8 0.78 Moderate
Return on Investment (ROI) 8 0.68 Moderate
Physical Distribution Channel 17 0.72 Moderate
Table 2 Test-retest Reliability of Instruments sub-scales
Scale No of
items
Test-retest
( r )
Remarks
Resources of Innovation of Distribution (RID) 4 0.82 High
Sales Turnover 8 0.78 Moderate
Obstructive Distribution Parameters (ODP) 11 0.80 High
Recruitment and Selection 43 0.76 Moderate
Salaries and wages 20 0.80 High
Market Share 8 0.82 High
Return on Investment (ROI) 8 0.76 Moderate
Physical Distribution Channel 17 0.77 Moderate
192
APPENDIX V
Models of innovation in this study
Introduction
Traditional arguments about innovation have focused on two schools of thought. On the one
hand the Social Deterministic School argued that innovations were the result of a combination of
external social factors and influences, such as demographic changes. The argument was that
when the conditions were ‗right‘ innovations would occur. On the other hand, the individual
talents and such innovators are born. Closely linked to the individualistic theory is the important
role played by serendipity; more on this later.
Over the past 10 years the research works on what ‗drivers‘ innovation has tended to divide into
two schools of thought: the market-based view and the resource-based view. The market-based
view argued that market conditions provide the context which facilitate or constrain the extent of
firm innovation activity (Slocum, 1972; Porter, 1980, 1985). The key issue here, is the ability of
firms to recognise opportunities in the market place. Trolt (1998) would argue that firms have the
ability to scan and search their environments effectively.
The resource-based view of innovation considered that a market-driven orientation does not
provide a secure foundation for formulating innovation strategies for markets which are dynamic
and volatile. Rather a firm‘s own resources provide a much more stable context in which to
develop its innovation activity and shape its markets in accordance with its own view (Penrose,
1959; Wernerfelt, 1984; Wernerfelt, 1995; Grant, 1996; Prahalad and Hamel, 1990; Conner and
Prahalad, 1996; Eisenhardt and Martin, 2000) as cited in Trolt, (2004). The resource-based view
of innovation focused on the firm and its resources, capabilities and skills. It argued that when
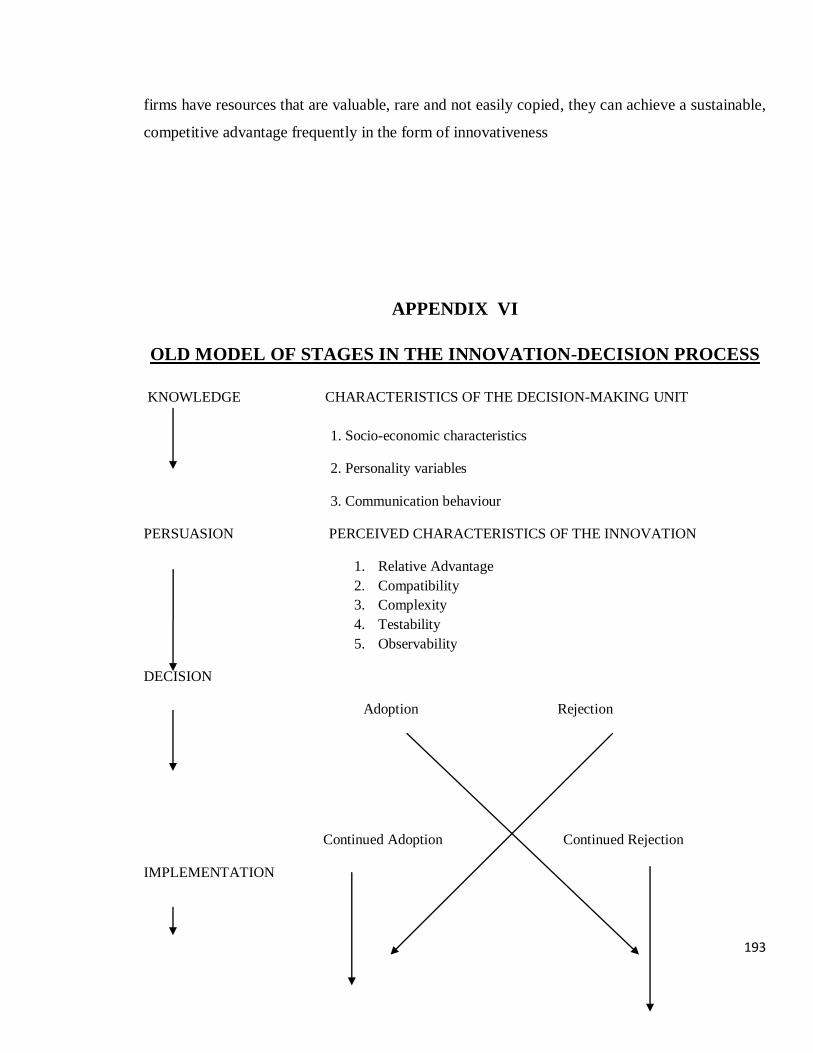
193
firms have resources that are valuable, rare and not easily copied, they can achieve a sustainable,
competitive advantage frequently in the form of innovativeness
APPENDIX VI
OLD MODEL OF STAGES IN THE INNOVATION-DECISION PROCESS
KNOWLEDGE CHARACTERISTICS OF THE DECISION-MAKING UNIT
1. Socio-economic characteristics
2. Personality variables
3. Communication behaviour
PERSUASION PERCEIVED CHARACTERISTICS OF THE INNOVATION
1. Relative Advantage
2. Compatibility
3. Complexity
4. Testability
5. Observability
DECISION
Adoption Rejection
Continued Adoption Continued Rejection
IMPLEMENTATION
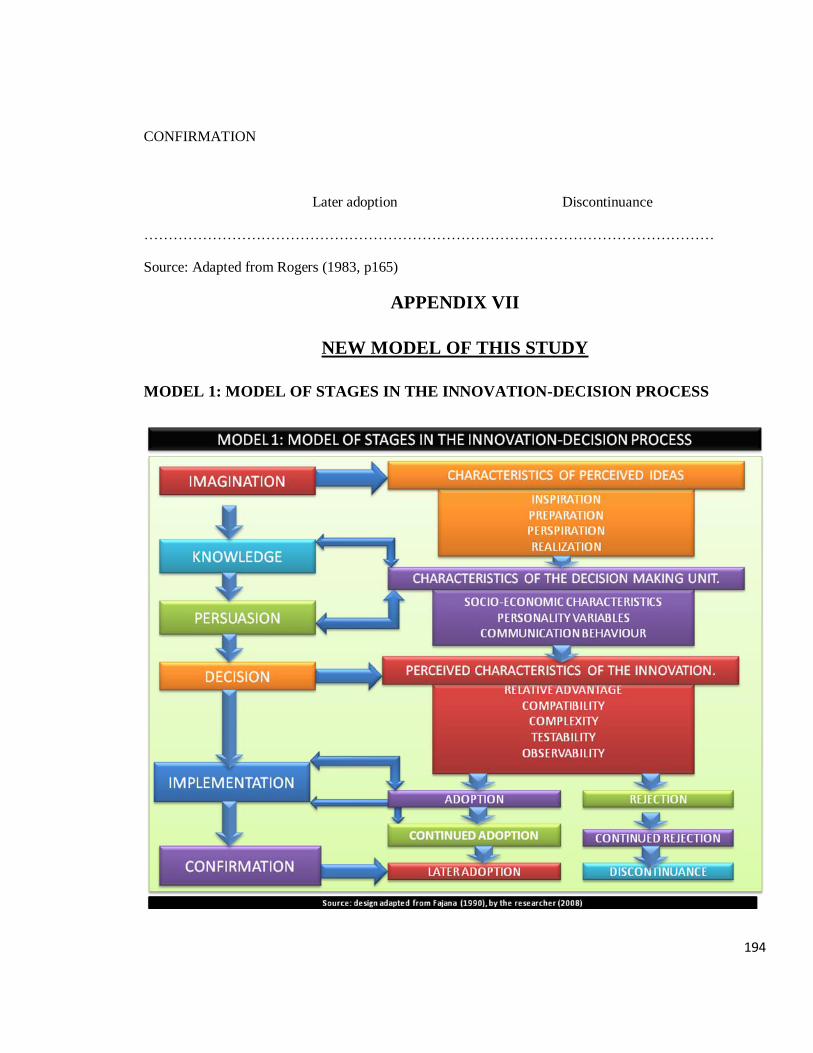
194
CONFIRMATION
Later adoption Discontinuance
………………………………………………………………………………………………………
Source: Adapted from Rogers (1983, p165)
APPENDIX VII
NEW MODEL OF THIS STUDY
MODEL 1: MODEL OF STAGES IN THE INNOVATION-DECISION PROCESS
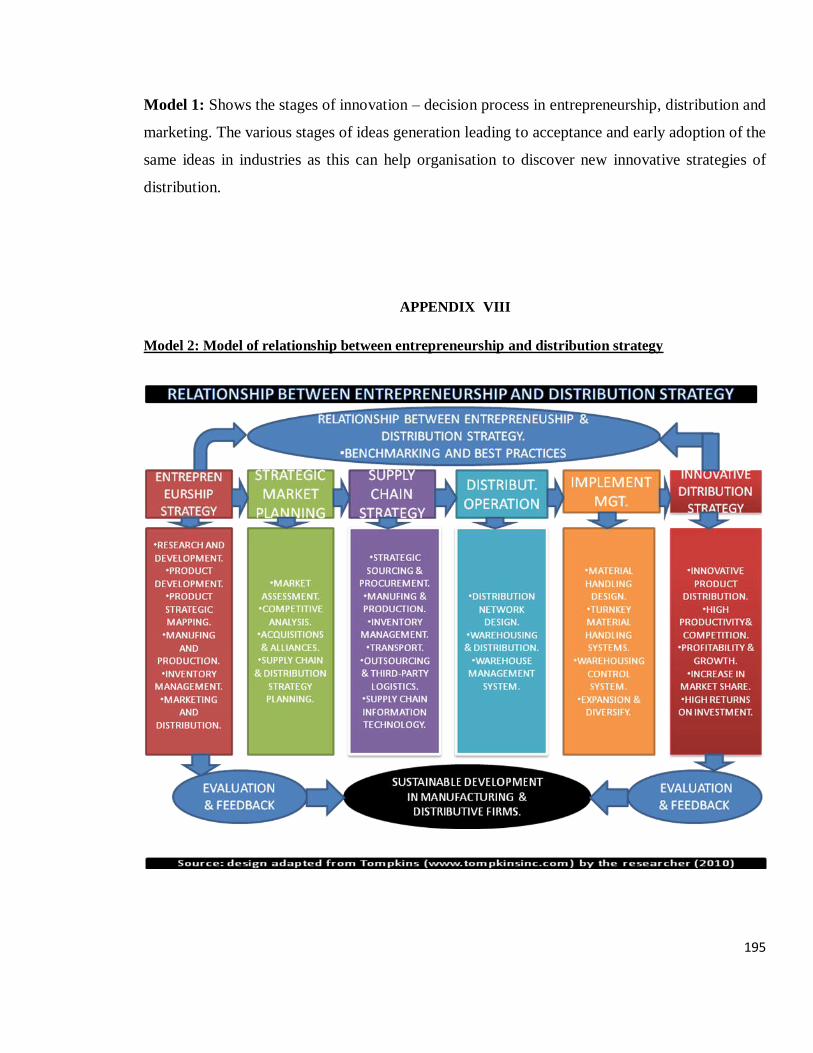
195
Model 1: Shows the stages of innovation – decision process in entrepreneurship, distribution and
marketing. The various stages of ideas generation leading to acceptance and early adoption of the
same ideas in industries as this can help organisation to discover new innovative strategies of
distribution.
APPENDIX VIII
Model 2: Model of relationship between entrepreneurship and distribution strategy