Embed Size (px)
Citation preview
Institutional and country collaboration in an online service of scientific profiles: Google Scholar Citations José Luis Ortega1
VICYT-CSIC, Madrid, Spain Isidro F. Aguillo Cybermetrics Lab, CCHS-CSIC, Madrid, Spain Abstract The purpose of this paper is to analyse and describe the topological properties of the institutional and national collaboration network from the profiles extracted from Google Scholar Citations (GSC). 19,912 unique profiles with “co-authors” were obtained from a web crawl performed in March 2012. Several statistical and network analysis techniques were used to map and analyse these collaboration relationships at the country and institution level. Results show that The United States dominates the world scientific map and that every research institution is grouped by national, geographical and cultural criteria. A clustering phenomenon based on the self-similarity and fractal properties of scale-free networks is also observed. We conclude that GSC is a suitable tool for collaboration studies only at macro level between countries and institutions. Keywords: Web bibliometrics, Google Scholar Citations, Research collaboration, Information Visualization, Network analysis, Academic Search Engines Introduction Since World War II the scientific collaboration between countries has increased considerably due to several factors. The increasing specialisation of science provoked the search of qualitative partners across the national boundaries (Bush and Hattery, 1956); the rise of research funding made it possible to attend international conferences and to make research stay in other countries (Heffner, 1981); and the growth of inter and multidisciplinary relationships caused the strengthening of cross-disciplinary collaborations (Beaver and Rosen, 1978). Due to this, the study and analysis of the collaboration patterns in science has gained more and more interest because it has a strong influence in the assessment of the research activity and in the adoption of scientific policies at several levels (Laudel, 2002). On the other hand, the geospatial distribution of science has been determined by the localisation of economic hubs (Livingstone, 1995). As a consequence of this economic drift, the world scientific centre moves from Europe to The United States after WWII as well (Schott, 1998). Nowadays, the globalisation and the emergence of new economies are generating a distributed and decentralised map of research poles which compete for the attraction of research resources and the generation of recognised knowledge (Kostoff, 2004; Glanzel et al., 2006). These diverse points produce a complex structure of collaborations at several institutional levels. The study of these connections makes it possible to uncover the scientific dynamics between countries and organisations and to understand the reasons of this cooperative behaviour (Katz and Martin, 1997). 1 VICYT-CSIC, Serrano, 113, 28006, Madrid, Spain, [email protected]
1
Related research This type of studies was started by Smith (1958), who suggested that the observation of co-authorship in research papers could be a good proxy to collaboration analyses. He had warned that the co-authorship is not exactly a synonym of collaboration, because there would be relationships that were not formalised in a research papers. However, Solla Price (1963) studied in depth the co-authorships phenomenon and observed an exponential growth in the number of authors by journal articles. In this same vein, Katz (1994) introduced the spatial variable when he described that the co-authorship decrease inversely to the distance separating two partners. This geographical approach has generated a great interest in the collaboration relationships across organisations and countries. Frame and Carpenter (1979) published one of the first and most relevant papers on international collaboration. They found that this increased in basic sciences and that was inversely related with the country scientific performance. Braun, Schubert and Glänzel were specialised in the study of world co-authorship patterns, whose result led to know the economic and political involvements of the scientific relationships (Schubert and Braun, 1990; Braun and Glänzel, 1996; Glänzel, 2001). Other studies evidenced that the collaboration at country level is strongly influenced by cultural (Nagtegaal and De Bruin, 1994) and linguistic ties (Larivière et al., 2006). And other ones were focused on the international collaboration at institutional level (Narvaez-Berthelemot, 1995; Basu and Aggarwal, 2001). However, few papers faced up to map the international collaboration relationships. Schubert and Braun (1990) and Glänzel (2001) mapped the co-author links between countries on a geographic map; and Leydesdorff and Wagner (2008) also used a geographical map to identify the collaboration core at world level. Recently, Gazni et al. (2012) studied international and institutional collaboration according to research disciplines. At the institutional level, Nagpaul (2002) graphed the cooperation network of the most productive Indian institutions; Yang et al. (2009) used cross map to represent the institutional co-authorship in a research specialty; and Duhon (2009) plotted the collaboration ties of the Chinese Academy of Sciences with the rest of academic institution in the world. However, these approaches are limited to one country, to one institution or to a specific field. Objectives The main objective of this paper is to analyse and describe the topological properties of the institutional and national collaboration network from the profiles extracted from Google Scholar Citations (GSC). In this way it intends to analyse the collaboration ties between countries and to understand how this network is shaped; to study the relationship of the different types of collaboration with the scientific production and impact of these profiles at the country level; and to characterise the topological properties and the internal structure of a collaboration network of the world-class research organisations. Finally, we try to prove if GSC “co-authors” feature may be a good proxy to analyse the scientific collaboration at macro level.
2
Methods Data extraction and processing
Several sequential processes were developed to extract the profiles information from GSC. In the first stage, a crawler was designed to ask 600 random queries to GSC in order to crawl all of the resulting profile pages to these queries and to retrieve the most exhaustive list of participant authors. The terms of these queries were built by the combination of the 26 letters of the Latin alphabet in groups of two (i.e. aa, ab, ac, and so on). Two letters were considered the most suitable combination because one letter would produce a high proportion of duplicated, while three letters would produce many empty results (Ortega and Aguillo, 2012). Two-letters string is the syllabic unit most frequent in many languages. The second stage was to harvest the author information from the initial list of profiles. This includes author working address, e-mail domain and co-authors list. To accomplish the data extraction process a SQL routine was implemented both to the crawling and harvesting tasks. The complete data obtaining process was done in March 2012. To test the reliability of the sample and to estimate the total population of GSC we have applied the Lincoln-Petersen formula (Seber, 2002). This equation is widely used in Wildlife management and it is based on the mark and recapture method. This counting method assumes that a high proportion of duplicated items would be an indicator of the completeness of the sample. As more samples are tested more consistency gains the population estimation. As we have only one sample, our estimations have to be considered with caution.
Where N is the total population to estimate, M is the size of the sample (228,845), C is the number of unique profiles (55,103) and R is the number of duplicated profiles (173,742). By this reckoning the total population of GSC in March 2012 would roughly estimate in 72,579 users. According to this estimation, our sample contains the 75.9% of the population, and then we can consider that the sample is highly representative. Moreover, we can consider that the retrieved authors are the most productive and cited because the query results are ranked by citations and therefore their probability to be retrieved is rather higher. In view of the absence of an API or another way to extract a representative sample, we understand that the formulation of a large amount of random queries is a good method to obtain a consistent sample. Thus, the total list of retrieved profiles was 55,103 in March 2012. From this list, only the profiles that contained a co-author list (11,176) were selected. Adding the profiles of their partners, 19,912 unique profiles were obtained and used to build both country and institutional networks. The meaning of co-authorship in GSC is slightly different to the traditional bibliometric concept. In GSC, a co-authors list consists of the partners, also registered in GSC, that have participated in at least one paper. In this way, the co-authorship in GSC introduces some biases or differences that should be considered before any interpretation of the results. The first problem is that not all the co-authors of a given author are listed because it is possible that most of them are not yet signed up in GSC, and even when they are registered they are not publicly accessible. This bias is not homogeneous and it would depend on the way that this service was spread through the scholar community.
3
Ortega and Aguillo (2012), in a first approach on the GSC profiles, evidenced that there is no uniformity in the distribution of profiles, and that there is a high proportion of profiles related to computing, information technologies and online social networking, while there was an important absence of traditional disciplines such as physics and chemistry. The second problem is that, although there were co-authors with a profile in GSC, they are not linked with the author, because he/she did not add them to his/her profile. Finally, these lists do not inform the strength of the collaboration, due to which a momentary collaboration is as important as the one among laboratory colleagues. That means that this is not possible, for now, to discern the most significant and relevant collaboration patterns and to put them in relation with the research activity of one profile. To compensate these effects, it was decided to work at the aggregated level of countries and institutions in which a significant number of co-authors could make it possible to observe more significant collaboration patterns and to dilute particular deviations. Three types of collaboration with the goal of achieving a detailed analysis of each type and their relationships were defined:
• Local collaboration: it is the number of co-authors from the same institution although they come from different departments or institutes.
• National collaboration: partners that work in the same country as the profile. The collaboration with colleagues from the same nationality but working in different countries is excluded.
• International collaboration: collaborations established with researchers employed abroad.
These three types are mutually exclusive, so local collaboration is not included in national collaboration. This favours the independence of the variables between them. A fast way to identify the institutional and country work place of each author is through the web domain of their e-mail addresses, although there should be some restrictions on the use of this data. 6.7% of the profiles do not include an e-mail address and some domains do not contain a country top level domain (i.e., .com, .edu). We have observed some cases in which the e-mail domain corresponds to a professional association (IEEE, ACM, etc.), to a commercial web mail service (hotmail, gmail, etc.) or to a personal domain (johnsmith.net). We have also detected that the e-mail domain does not match the institutional address. In these cases, a manual classification of the profiles was done from the institutional address in each profile. In general, these cases represent less than 1% of the profiles. Due to this, we think that the use of e-mail domains is a good method for institutional classification of personal profiles although it has to be used with caution and with deep manual checking. Moreover, this practice is recommended when the affiliations are signed by the authors in a natural, not controlled language and the addresses present many variations. Network analysis Several social network analysis indicators were calculated to extract the structural properties of the network. The calculation of the network indicators were done with Gephi, except the k-cores algorithm which was calculated with Pajek 1.28.
• Degree centrality (k): It measures the number of lines incident to a node (Freeman, 1979). A variation is the weighted degree centrality, which calculates the weight of each line, indicating the strength of each relationship. In this study the centrality degree allows to describe the labels most frequently used by the
4
GSC scientists and what concepts are central in an academic database, which allows thematically characterising a researcher community.
• Freeman’s Betweenness centrality (CB): It is defined as the capacity of one node to help to connect those nodes that are not directly connected between them (Freeman, 1980). This measurement enables us to detect “gateway” terms that connect remote groups because they are used in different knowledge domains. These labels may be considered as interdisciplinary indicators.
• K-Cores: It is a sub-network in which each node has k degree in that sub-network. The k-cores allow us to detect groups with a strong link density. In scale-free networks, the core with the highest degree is the central nucleus of the network, detecting the set of labels where the network rests on (Seidman, 1983).
• Modularity: it is a clustering measurement that allows detecting modules or clusters in a network. A module is a group of nodes which shows more edges among them than out to that set. Modularity finds close groups iteratively, comparing the fraction of links inside a cluster with respect to the expected value in a random network (Newman, 2006).
Statistics Principal Component Analysis (PCA) was used to characterise the local, national and international collaboration of each country. PCA (Hotelling, 1933). The aim of the PCA is to reduce the dimension of p variables to a set of new variables (principal components) which contain the highest amount of information from the original variables. These components are uncorrelated between them, because the fist one has the highest amount of information, and the second one has the information that the previous does not contain and so on. To simplify the components’ structure and therefore to make its interpretation easier and more reliable, it is usual to apply rotations to the components. The most popular rotation method is Varimax because it makes each component represent only a small number of variables. PCA and graph edition were done with the Excel plug-in XLStat 2008.
5
Results Country level
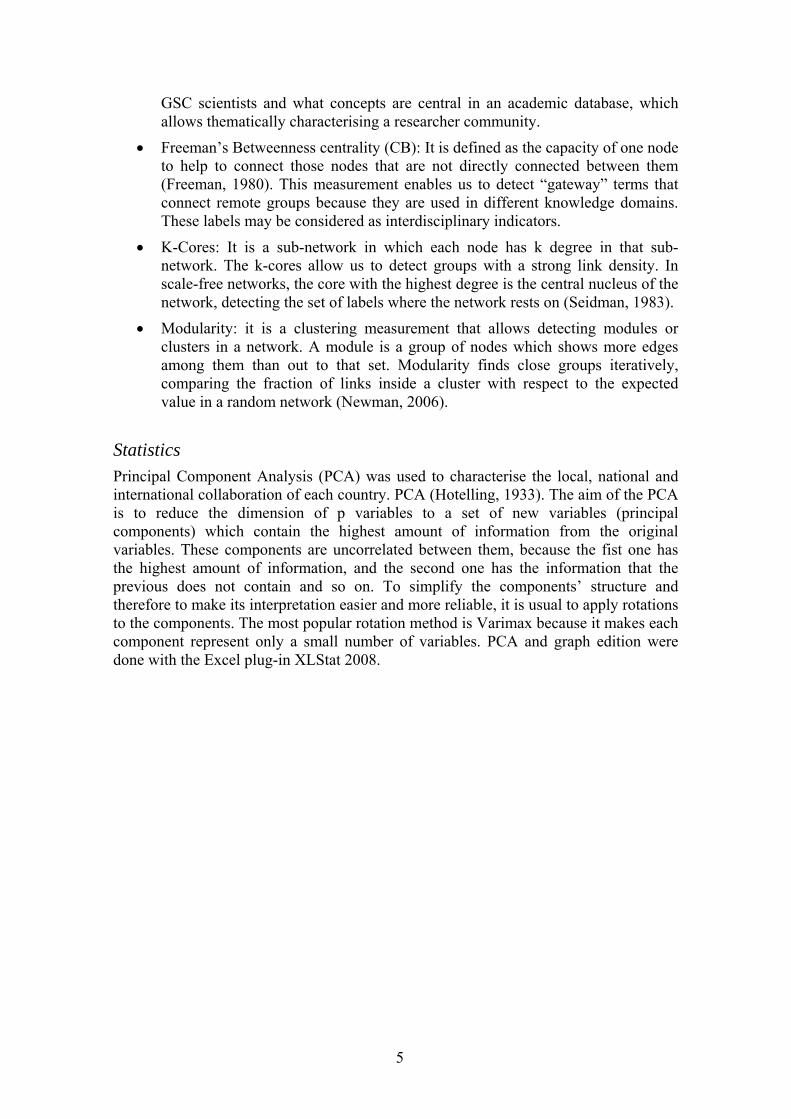
Figure 1. Country collaboration network
Region Country Profiles % Degree North America United States 5,866 29.5 32 Europe United Kingdom 2,041 10.3 25 Europe Spain 1,028 5.2 14 Europe Italy 1,028 5.2 11 Europe Germany 861 4.3 14 TOTAL 19,912 100
Table 1. Network indicators of the five countries with most profiles in GSC The working country of the 19,912 personal profiles was identified, being a total of 100 different countries. Figure 1 shows the profile collaborations at the country level. It only represents the countries which set up more or equal to ten collaboration ties with other countries. 34 countries make up the main component of the principal working countries in GSC in March 2012. Colours describe the geographical regions were each country is located. Figure 1 lets to appreciate that The United States centralises the network, being the country which most collaborates with different countries and most of the profiles have in this network (k=32; 29.5%). In this graph, it is also possible to observe that the
6
European countries (blue) are mainly located in the upper half with strong links between them. In fact, four of the most collaborative countries are European (table 1) such as United Kingdom (k=25), Spain, Germany (k=14) and Italy (k=11). While the lower half are situated in Asian countries with few connections. What we could gather from this is that The United States is the central country in GSC; that European countries establish a dense collaboration sub-network with ties with other developed countries such as Australia, Japan or Canada; and the Asian countries set up strong links with The United States but they are weakly connected with the European ones.
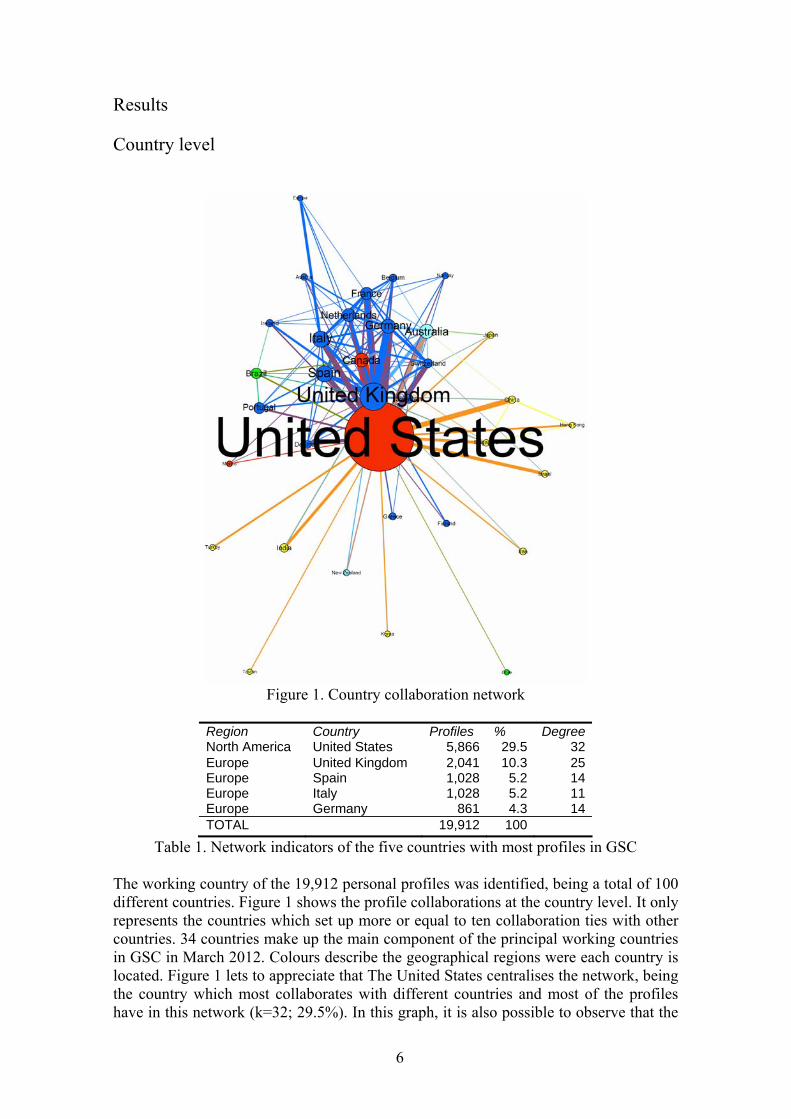
Figure 2. PCA plot. Variance (98.2%) with Varimax rotation
Country authors international
coll. % national coll. %
local coll. %
Cit/papers
United States 5,866 22.6 44.5 32.9 34.8 United Kingdom 2,041 37.5 28.5 34.0 24.5 Spain 1,028 27.1 20.8 52.1 11.6 Italy 1,028 27.7 19.8 52.5 12.4 Germany 861 46.1 19.6 34.2 19.8 Canada 808 49.0 18.2 32.8 24.1 Australia 827 31.3 26.7 42.0 16.4 The Netherlands 727 32.5 17.3 50.2 18.3 France 663 51.1 24.0 24.9 14.8 Portugal 553 21.5 32.4 46.1 8.1 Total 19,912 48.8 14.5 36.7 9.8
Table 2. Different types of collaboration by country and ranked by the number of
profiles with co-authors.
Figure 2 presents a different view about the collaboration patterns at the country level. PCA is used to display the relationship of each country with the three types of collaboration considered in this study. Countries are coloured by their continental region and the size represents the ratio citations per document. Figure shows that the countries related with the local collaboration, in other words, countries with a high proportion of local partners show a low ratio of citation per document. Meanwhile,
7
countries with a high impact show a high proportion of national and international collaboration (Bordons, 1996). Geographically, it can be appreciated that the Asian countries establish more international contacts, while the other regions show a balanced distribution. It is interesting to notice that the most impacted countries such as the Unites States (34.8) and the United Kingdom (24.5), with a consolidated scientific position, are supported more by the national collaboration than by the international one.
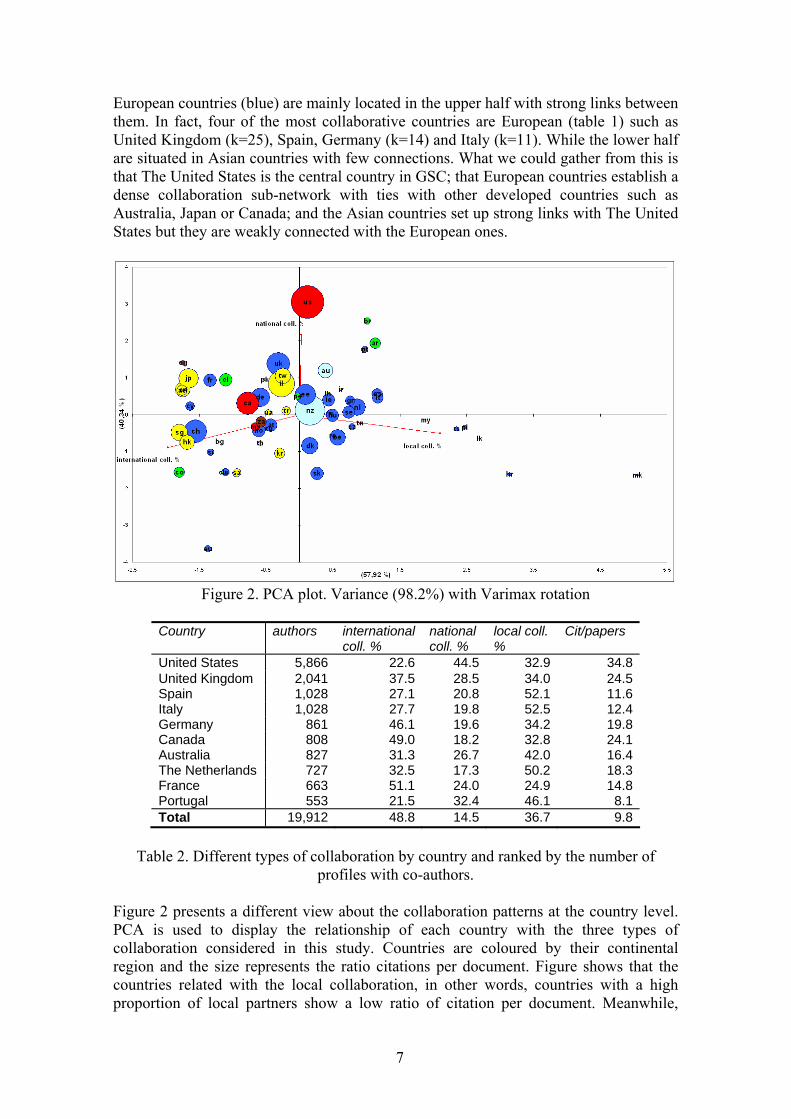
Figure 3. a) Proportion between national vs. international and b) proportion between,
local, national and international collaboration at country level
An interesting aspect of the collaboration pattern at country level is the study of the proportion between the national and international collaboration. Figure 3.a shows the countries grouped by deciles and ranked by the number of authors in the networks. Thus big countries with the highest number of profiles (1st decile) present a low proportion of international collaboration (36.1%) against national collaboration (63.9%). This proportion goes decreasing as we move forward to the next deciles to such an extent that it turns around inverse in the last deciles. In these cases, the ratio of international collaboration is higher (75%) than the national one (25%). If the local collaboration is distinguished from the national one (Figure 3.b), then the picture describes a slow descent of the national and local collaboration as the number of profiles falls. The drop in national collaboration is more noticeably marked while local collaboration is rather stable. This describes a phenomenon in which the relation between inner vs. external collaboration is affected by the number of potential partners in the closest environment. Thus big countries with a large number of researchers are more likely to collaborate between them than with foreign authors, while small countries with a low number of researchers are forced to collaborate with external authors because there is no critical mass in their countries. This pattern can be due more to cultural and linguistic differences than to geographical distances since both the national and local collaboration almost remain the same, with a slow drop. In this sense, different behaviours are observed in every country and factors such as the language, geography and the way this service was spread could affect this distribution. For example, countries with few researchers in the network (Argentina, Sri Lanka or Russia) show high proportions of national collaborations, probably due to the fact that the number of GSC profiles of these countries is not representative enough or to cultural or linguistic differences that cut themselves off from the scientific international community.
8
Institutional level
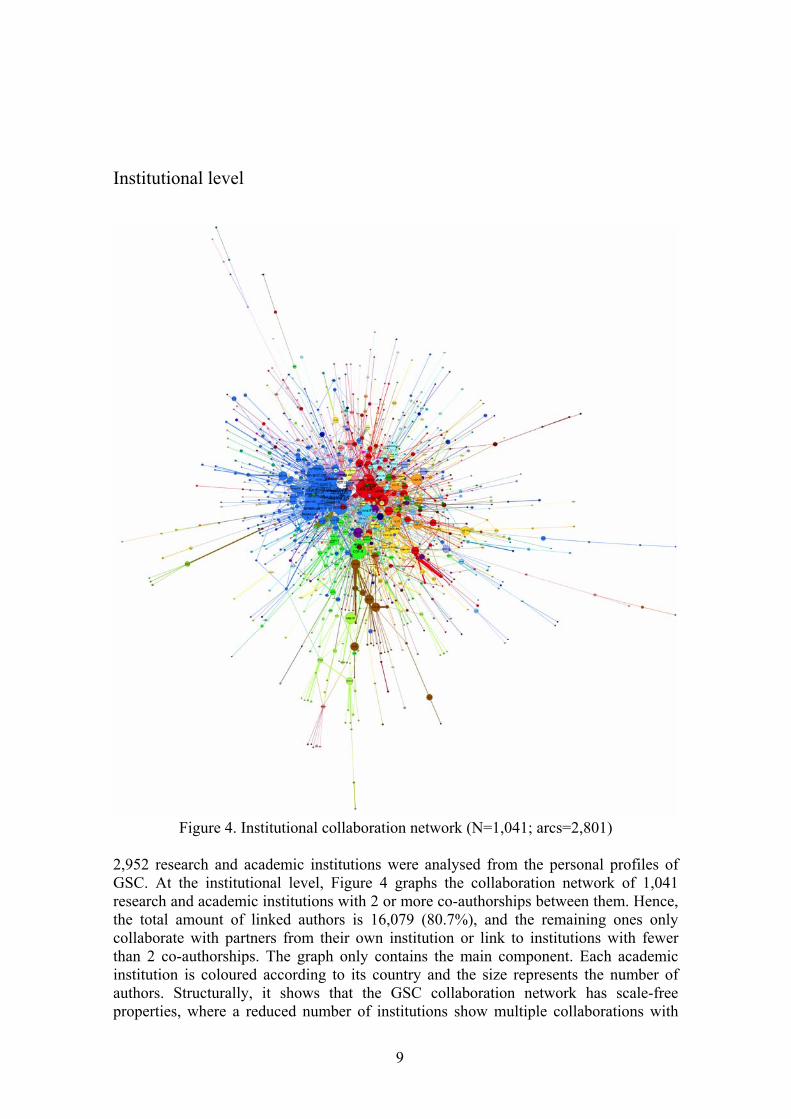
Figure 4. Institutional collaboration network (N=1,041; arcs=2,801)
2,952 research and academic institutions were analysed from the personal profiles of GSC. At the institutional level, Figure 4 graphs the collaboration network of 1,041 research and academic institutions with 2 or more co-authorships between them. Hence, the total amount of linked authors is 16,079 (80.7%), and the remaining ones only collaborate with partners from their own institution or link to institutions with fewer than 2 co-authorships. The graph only contains the main component. Each academic institution is coloured according to its country and the size represents the number of authors. Structurally, it shows that the GSC collaboration network has scale-free properties, where a reduced number of institutions show multiple collaborations with
9
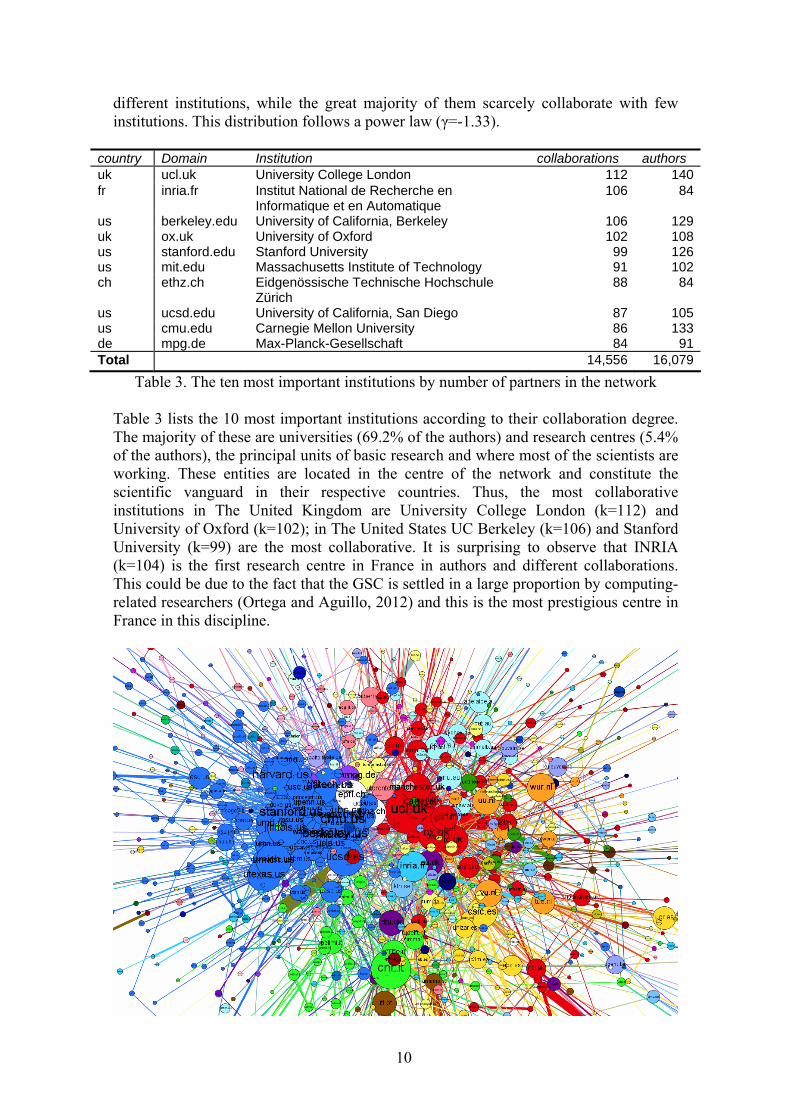
different institutions, while the great majority of them scarcely collaborate with few institutions. This distribution follows a power law (γ=-1.33).
country Domain Institution collaborations authors uk ucl.uk University College London 112 140fr inria.fr Institut National de Recherche en
Informatique et en Automatique 106 84
us berkeley.edu University of California, Berkeley 106 129uk ox.uk University of Oxford 102 108us stanford.edu Stanford University 99 126us mit.edu Massachusetts Institute of Technology 91 102ch ethz.ch Eidgenössische Technische Hochschule
Zürich 88 84
us ucsd.edu University of California, San Diego 87 105us cmu.edu Carnegie Mellon University 86 133de mpg.de Max-Planck-Gesellschaft 84 91Total 14,556 16,079
Table 3. The ten most important institutions by number of partners in the network
Table 3 lists the 10 most important institutions according to their collaboration degree. The majority of these are universities (69.2% of the authors) and research centres (5.4% of the authors), the principal units of basic research and where most of the scientists are working. These entities are located in the centre of the network and constitute the scientific vanguard in their respective countries. Thus, the most collaborative institutions in The United Kingdom are University College London (k=112) and University of Oxford (k=102); in The United States UC Berkeley (k=106) and Stanford University (k=99) are the most collaborative. It is surprising to observe that INRIA (k=104) is the first research centre in France in authors and different collaborations. This could be due to the fact that the GSC is settled in a large proportion by computing-related researchers (Ortega and Aguillo, 2012) and this is the most prestigious centre in France in this discipline.
10
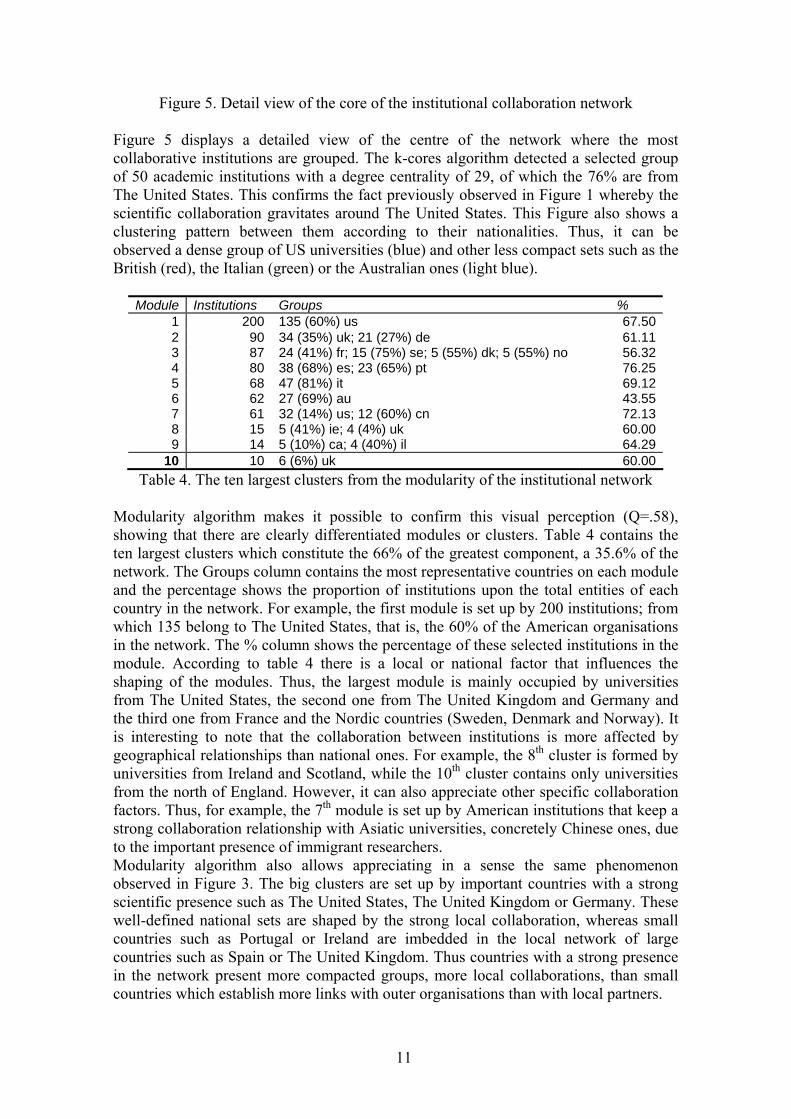
Figure 5. Detail view of the core of the institutional collaboration network Figure 5 displays a detailed view of the centre of the network where the most collaborative institutions are grouped. The k-cores algorithm detected a selected group of 50 academic institutions with a degree centrality of 29, of which the 76% are from The United States. This confirms the fact previously observed in Figure 1 whereby the scientific collaboration gravitates around The United States. This Figure also shows a clustering pattern between them according to their nationalities. Thus, it can be observed a dense group of US universities (blue) and other less compact sets such as the British (red), the Italian (green) or the Australian ones (light blue).
Module Institutions Groups % 1 200 135 (60%) us 67.502 90 34 (35%) uk; 21 (27%) de 61.113 87 24 (41%) fr; 15 (75%) se; 5 (55%) dk; 5 (55%) no 56.324 80 38 (68%) es; 23 (65%) pt 76.255 68 47 (81%) it 69.126 62 27 (69%) au 43.557 61 32 (14%) us; 12 (60%) cn 72.138 15 5 (41%) ie; 4 (4%) uk 60.009 14 5 (10%) ca; 4 (40%) il 64.29
10 10 6 (6%) uk 60.00Table 4. The ten largest clusters from the modularity of the institutional network
Modularity algorithm makes it possible to confirm this visual perception (Q=.58), showing that there are clearly differentiated modules or clusters. Table 4 contains the ten largest clusters which constitute the 66% of the greatest component, a 35.6% of the network. The Groups column contains the most representative countries on each module and the percentage shows the proportion of institutions upon the total entities of each country in the network. For example, the first module is set up by 200 institutions; from which 135 belong to The United States, that is, the 60% of the American organisations in the network. The % column shows the percentage of these selected institutions in the module. According to table 4 there is a local or national factor that influences the shaping of the modules. Thus, the largest module is mainly occupied by universities from The United States, the second one from The United Kingdom and Germany and the third one from France and the Nordic countries (Sweden, Denmark and Norway). It is interesting to note that the collaboration between institutions is more affected by geographical relationships than national ones. For example, the 8th cluster is formed by universities from Ireland and Scotland, while the 10th cluster contains only universities from the north of England. However, it can also appreciate other specific collaboration factors. Thus, for example, the 7th module is set up by American institutions that keep a strong collaboration relationship with Asiatic universities, concretely Chinese ones, due to the important presence of immigrant researchers. Modularity algorithm also allows appreciating in a sense the same phenomenon observed in Figure 3. The big clusters are set up by important countries with a strong scientific presence such as The United States, The United Kingdom or Germany. These well-defined national sets are shaped by the strong local collaboration, whereas small countries such as Portugal or Ireland are imbedded in the local network of large countries such as Spain or The United Kingdom. Thus countries with a strong presence in the network present more compacted groups, more local collaborations, than small countries which establish more links with outer organisations than with local partners.
11
Discussion The observed results for both the country and institutional networks confirm the hegemonic position of The United States in the scholar space. It is the edge of international scientific collaboration in which it acts as an intermediate between Europe and Asia, the other two world scientific centres. On the European side, there is a resilient collaboration structure caused by the European integration and their research programmes where the intra-country partnership is a key element. These results would suggest that European countries act as an “international actor” with a common performance (Leydesdorff and Wagner, 2008). This contrasts with the Asian side, where there is sparsely collaboration between them. Apart from few links between China, Hong Kong and Singapore, the Asian researchers principally collaborate with scholars from The United States (Duhon, 2009). Maybe, due to the strong migration of Asian researchers to the United States, which are up to 60% of the migrant scientists in that country (Kent, 2011). The structural analysis has also showed that there is a grouping factor in which small countries collaborate more internationally than the big ones, whereas the countries with more scientists in the network mainly participate with local partners. This phenomenon was first observed by Frame and Carpenter (1979) in the co-authored papers indexes in Science Citation Index in 1973. And at the institutional level, Adams et al. (2005) found that the smaller research teams increase their international collaboration faster than the bigger ones, which signs the importance of the abroad co-authorship for research units with few resources. Luukkonen, Persson and Sivertsen (1992) argued that this could be due to the increasing specialisation of science, where researchers from scientifically peripheral countries scarcely find partners in their local environment and they are obligated to look for co-authors in other countries. While scientists from consolidated countries have enough critical mass that they are likely to select national partners due to linguistic and cultural affinity. However, we suggest that this also could be a structural phenomenon, typical of scale-free networks in which the nodes are grouped following a self-similarity process (Song, Havlin and Makse, 2005). In this sense, new nodes tend to join to clusters through important hubs. As these nodes create links between them, they tend to reproduce the same structure of the group and then they create a new similar structured set. This phenomenon could be a consequence of fractal properties of scale-free networks (Rozenfeld et al., 2009; Kim et al., 2007), according to which these type of networks evolve creating sub-networks or modules that reproduce the global structure. In this sense, scale free networks are shaped by groups interconnected between them that reproduce an aggregated model similar to fractal geometry (Jung et al., 2002). This fact is also observed in a great diversity of environments such as the international trading (Breedon et al., 2012), games theory (Cassar, 2007), air transport (Guida and Maria, 2007) and the academic web (Ortega and Aguillo, 2008). However, these collaboration patterns are also affected by geographical distances (Katz, 1994) and idiomatic differences (Larivière et al., 2006). Modularity has showed that although the large majority of the clusters are constituted by national criteria, some small cliques are affected by geographical proximities (North England cluster) and cultural affinities (Nordic cluster). Moreover, each local sub-network is located close to geographical neighbouring sets, such as the Italian cluster and the Spanish-Portuguese one or to a cultural referent as the Australian group within the British one. Another important factor to consider is the thematic distribution of the network. Several works have proved that there are significant collaboration patterns between scientific disciplines (Frame and Carpenter, 1979; Glanzel, 1996). In our case, there is an
12
important bias in favour of computing-related disciplines caused by the initial spreading of GSC through scholars familiarised with the new information technologies and the Science 2.0 environments (Ortega and Aguillo, 2012). This could produce a map where the specific collaboration patterns in these disciplines can determinate the interpretation of the obtained results. However, the use of aggregated levels by country and institution level would dilute this bias. Previous studies on international and institutional collaboration, based on bibliographic citation indexes, coincide with our results, founding a similar network shape at country level (Miquel et al., 1995; Glänzel, 2001; Gazni, et al., 2012). On the contrary, no world graphs representations were found at institutional level that make a comparison with our results possible. Conclusions The obtained results allow us to conclude, at the country level, that The United States scientists form the core of the world collaboration network, detecting two geographical poles: the Asian one, that is only connected with The United States and the European one, which constitutes an interconnected sub-network. PCA map has showed that the local collaboration is the type of cooperation that less influences the academic impact, while the national and international collaboration favours the attraction of citations per document. The structural analysis of the institutional network lets summarise that it shows scale-free properties, whose centre is dominated by The United States institutions; in which each organisation is grouped by national and geographical criteria, and that there is a self-similarity phenomenon in which small countries are mainly linked to big countries until they reproduce the similar link structure of those and then increase their local links reducing at the same time their international ties. Finally, the use of the “co-authors” feature of GSC profiles has made it possible to build a global map of scientific relationships at the level of institutions and countries, being representative of the world scientific dynamics. We can conclude that it could be considered as a suitable proxy for the analysis of the scientific activity at macro level and a proper way to empirically observe cooperation patterns between countries and institutions. However, it is important to advise that results from GSC have to be cautiously considered because they do not exactly express a collaboration relationship such as co-authored papers and the voluntary nature of this service can introduce important biases at disciplinary and institutional level when it comes to counting collaboration ties. Acknowledgements We would like to thank to the anonymous referees their important suggestions and to Jennifer Carranza her helpful recommendations on the English version. References Adams, J. D., Black, G. C., Clemmons, J. R., Stephan, P. E. (2005). Scientific teams and institutional collaborations: Evidence from U.S. universities, 1981–1999. Research Policy, 34, 259-285. Barabási, A. L., Ravasz, E., Vicsek, T. (2001). Deterministic scale-free networks. Physica A, 299, 559–564.
13
Basu, A., Aggarwal, R. (2001). International Collaboration in Science in India and its Impact on Institutional Performance. Scientometrics, 52(3), 379-394. Beaver, D. de B., Rosen, R. (1978). Studies in Scientific Collaboration: Part I - The Professional Origins of Scientific Co-authorship. Scientometrics, 1, 65-84. Braun, T., Glänzel, W. (1996). International Collaboration: Will it be Keeping Alive East European Research? Scientometrics, 36, 147-254. Breedon, F., Pétursson, T. G., Rose, A. K. (2012). Exchange Rate Policy in Small Rich Economies. Open Economies Review, 23(3), 421-445. Bush, G. P., Hattery, L. H. (1956). Teamwork and Creativity in Research. Administrative Science Quarterly, 1, 361-62. Cassar, A. (2007). Coordination and Cooperation in Local, Random and Small World Networks: Experimental Evidence. Games and Economic Behavior, 58(2), 209-230 Duhon, R. J. (2009). Understanding outside collaborations of the Chinese Academy of Sciences using Jensen-Shannon Divergence. Proceedings of SPIE-IS&T Visualization and Data Analysis Conference, San Jose . 7243, 72430C. http://ivl.cns.iu.edu/km/pub/2009-duhon-cas.pdf Frame, J. D., Carpenter, M. P. (1979). International Research Collaboration. Social Studies of Science, 9(4), 481-497. Gazni, A., Sugimoto, C. R., Didegah, F. (2012). Mapping world scientific collaboration: Authors, institutions, and countries. Journal of the American Society for Information Science and Technology, 63(2): 323–335. Glänzel, W. (1996). A bibliometric approach to social sciences: National research performance in 6 selected social science areas 1990–1992. Scientometrics, 35(3), 291–307. Glänzel, W. (2001). National Characteristics in International Scientific Co-authorship. Scientometrics, 51, 69-115. Glänzel, W., Debackere, K., Meyer, M. (2006). ‘Triad’ or ‘Tetrad’? On global changes in a dynamic world, 9th International Conference on Science and Technology Indicators, Leuven (Belgium), Guida, M., Maria, F. (2007). Topology of the Italian airport network: A scale-free small-world network with a fractal structure? Chaos, Solitons & Fractals, 31(3), 527–536 Heffner, A. G. (1981). Funded Research, Multiple Authorship, and Subauthorship Collaboration in Four Disciplines. Scientometrics, 3, 5-12.
14
Hotelling, H. (1933). Analysis of a complex of statistical variables into principal components. Journal of Educational Psychology, 24, 417-520. Jung, S., Kim, S., Kahng, B. (2002). Geometric fractal growth model for scale-free networks, Physical Review E, 65(5), 056101 Katz, J. S. (1994). Geographical proximity and scientific collaboration. Scientometrics, 31, 31-43. Katz, J. S., Martin, B. R. (1997). What is research collaboration? Research Policy, 26(1), 1-18. Kent, M. M. (2011). More U.S. Scientists and Engineers Are Foreign-Born, Washington, DC: Population Reference Bureau http://www.prb.org/Articles/2011/usforeignbornstem.aspx Kim, J. S., Goh, K. I., Salvi, G., Oh, E., Kahng, B., Kim, D. (2007). Fractality in complex networks: Critical and supercritical skeletons. Physical Review E, 75(1), 016110 Kostoff, R. (2004). The (scientific) wealth of nations. The Scientist, 18(18), 10-10. Larivière, V., Gingras, Y., Archambault, É. (2006). Canadian collaboration networks: A comparative analysis of the natural sciences, social sciences and the humanities. Scientometrics, 68(3), 519-533 Laudel, G. (2002). What do we measure by co-authorships? Research Evaluation, 11(1), 3-15. Leydesdorff, L., Wagner, C. (2008). International Collaboration in Science and the Formation of a Core Group, Journal of Informetrics, 2(4), 317-325 Livingstone, D. N. (1995). The spaces of knowledge: contributions towards a historical geography of science. Environment and Planning D: Society and Space, 13(1), 5 – 34. Nagpaul, P. S. (2002). Visualizing cooperation networks of elite institutions in India. Scientometrics, 54(2), 213-228. Nagtegaal, L.W., De Bruin, R. E. (1994). The French connection and other neo-colonial patterns in the global network of science. Research Evaluation, 4, 119-127. Narvaez-Berthelemot, N. (1995). An index to measure the international collaboration of developing countries based on the participation of national institutions: The case of Latin America. Scientometrics, 34(1), 37-44. Miquel, J. F., Ojasoo, T., Okubo, Y., Paul, A. Doré, J. C. (1995).World science in 18 disciplinary areas: Comparative evaluation of the publication patterns of 48 countries over the period 1981–1992. Scientometrics, 33(2), 149-167
15
Ortega, J. L., Aguillo, I. F. (2008). Linking patterns in the European Union’s Countries: geographical maps of the European academic web space. Journal of Information Science, 34(5), 705-714 Ortega, J. L., Aguillo, I. F. (2012). Science is all in the eye of the beholder: keyword maps in Google Scholar Citations. Journal of the American Society for Information Science and Technology, 63(12), 2370-2377 Rozenfeld, H. D., Gallos, L. K., Song, C., Makse, H. A., Meyers, R. A. (2009). Fractal and Transfractal Scale-Free Networks. In: Encyclopedia of Complexity and Systems Science: Springer, ISBN-978-0-387-75888-6 Schott, T. (1998). Ties between Center and Periphery in the Scientific World-System: Accumulation of Rewards, Dominance and Self-Reliance in the Center. Journal of World-Systems Research, 4, 112 - 144. Schubert, A., Braun, T. (1990). World Flash on Basic Research: International Collaboration in the Sciences, 1981-1985, Scientometrics, 19, 3-10. Smith, M. (1958). The Trend Toward Multiple Authorship in Psychology. American Psychologist, 13, 596-99. Solla Price, D. J. de (1963). Little Science, Big Science. New York: Columbia University Press, Song, C., Havlin, S., Makse, H. A. (2005). Self-similarity of complex networks. Nature, 433, 392-395 Newman, M. E. J. (2001). Scientific collaboration networks. II. Shortest paths, weighted networks, and centrality. Physical Review E, 64, 016132 Yang, L., Morris, S. A., Barden, E. M. (2009). Mapping institutions and their weak ties in a specialty: A case study of cystic fibrosis body composition research. Scientometrics, 79(2), 421-434. Wagner, C. S. (2005). Six Case Studies of International Collaboration in Science. Scientometrics, 62(1), 3-26. Luukkonen, T., Persson, O., Sivertsen, G. (1992). Understanding Patterns of International Scientific Collaboration. Science, Technology, & Human Values, 17(1), 101-126
16


