Embed Size (px)
Citation preview

Integrated Lane Changing Models
Moshe Ben-Akiva
Department of Civil and Environmental Engineering
Massachusetts Institute of Technology
77 Massachusetts Avenue, Cambridge, MA 02139, USA
Charisma Choudhury
Department of Civil and Environmental Engineering
Massachusetts Institute of Technology
77 Massachusetts Avenue, Cambridge, MA 02139, USA
Tomer Toledo
Faculty of Civil and Environmental Engineering
Tehnion- Israel Institute of Technology
Haifa 32000, Israel

Abstract
This paper summarizes a series of advances in lane changing models aiming at
providing a more complete and integrated representation of drivers’ behaviors.
These advances include the integration of mandatory and discretionary lane
changes in a single framework, the inclusion of an explicit target lane choice in the
decision process and the incorporation of various types of lane-changing
mechanisms, such as cooperative lane changing and forced merging. In the
specifications of these models, heterogeneity in the driver population and
correlations among the various decisions a single driver makes across choice
dimensions and time are addressed. These model enhancements were
implemented in the open source microscopic traffic simulator of MITSIMLab,
and their impact was demonstrated in validation case studies where their
performance was compared to that of existing models. In all cases, a substantial
improvement in simulation capability was observed.

3
Introduction
Lane changing has a significant impact on traffic flow. Lane-changing models
are therefore an important component in microscopic traffic simulators, which are
becoming the tool of choice for a wide range of traffic-related applications at the
operational level. A number of lane-changing models have been proposed and
implemented in various simulators in recent years (see Toledo, 2006 for a review).
While their details vary, the general structure of these models displayed in Figure
1 is similar. Most models classify lane changes as either mandatory or
discretionary (e.g., Ahmed, 1999; Ahmed et al., 1996; Gipps, 1986; Halati et al.,
1997; Hidas, 2002; Hidas and Behbahanizadeh, 1999; Yang and Koutsopoulos,
1996; Zhang et al., 1998). A mandatory lane change (MLC) occurs when a driver
must change lanes to follow a path, and when an MLC is required, it overrides
any other considerations. A discretionary lane change (DLC), on the other hand,
takes place when a driver changes to a lane perceived to offer better traffic
conditions. Gap acceptance models are used to model the execution of lane
changes. The available gaps are compared to the smallest acceptable gap (critical
gap) and a lane-change is executed if the available gaps are greater. Gaps may be
defined either in terms of time or free space. Most models also make a distinction
between the lead gap (i.e., the gap between the subject vehicle and the vehicle
ahead of it in the lane it is changing to) and the lag gap (i.e., the gap between the
subject vehicle and the vehicle behind it in the lane it is changing to) and require
both to be acceptable.
The present paper summarizes several enhancements that have been made to
this generic lane-changing model in order to improve its realism and address
several limitations. The organization of the paper is as follows: first, the general
methodology that was used to develop each one of the models presented in this
paper is given. The next three sections present enhancements that have been made
to the lane-changing model: integration of mandatory and discretionary lane
changes in a single frame- work, explicit modeling of the choice of the target lane
and a model that incorporates courtesy behavior and forced merging in the lane-
changing process. For each of these models, the modified structure of the lane-
changing decision process is presented and the limitations of the basic model that
it addresses are discussed and demonstrated with a real-world case study. The
specification of all these models account for the heterogeneity in the behavior
population and for correlations among the decisions a single driver makes over
choice dimensions and time. The mathematical formulation that permits the
capturing of these effects is presented in the next section. The final section
concludes our findings and discusses directions for further enhancements.

4
MLCMandatory
lane change
Gap
acceptance NO CHANGE
No MLC
No DLC
CHANGENO CHANGE
DLC
CHANGENO CHANGE
Discretionary
lane change
Fig. 1. Generic structure of lane changing models
Methodology
All the models that are presented here were developed using the process shown
in Figure 2, which involves both disaggregate and aggregate data. Disaggregate
data, consisting of detailed vehicle trajectories at a high time resolution, are used in
the model estimation phase, in which the model is specified and explanatory
variables, such as speeds and relations between the subject vehicle and other
vehicles, are generated from the vehicle coordinates extracted from the trajectory
data. The model parameters are estimated with a maximum likelihood technique in
order to match observed lane changes having occurred in the trajectory data. This
estimation approach does not involve the use of a traffic simulator, and so the
estimated models are independent of simulators.
In order to demonstrate the benefits that may be derived from using the modified
models, they must be validated and demonstrated within a microscopic traffic
simulator incorporating not only the lane-changing models under investigation, but
also other driving behavior models, such as acceleration models. As a result, the
estimated model needs to be implemented within a microscopic traffic simulator,
and MITSIMLab (Yang and Koutsopoulos, 1996) was employed in all the cases
described herein. In the validation case studies, aggregate data, which is
significantly cheaper to collect and in many cases readily available, could be
used. Part of the aggregate dataset was first utilized to adjust key parameters in the
lane-changing model as well as parameters of other behavior models, and to
estimate the travel demand on the case study network. This aggregate calibration
problem was formulated as an optimization problem, seeking to minimize a
function of the deviation of the simulated traffic measurements from the observed

5
measurements and of the deviation of calibrated values from their a-priori
estimates, when available (Toledo et al., 2003). The rest of the data was used for
the validation itself, which was based on a comparison of measures of
performances that could be calculated from the available data with corresponding
values from the simulator, e.g., sensor speeds and flows, the distribution of
vehicles among the lanes, the amount and locations of lane changes. The
calibration and validation methodology is outlined in Figure 2 (detailed in Toledo
and Koutsopoulos, 2004).
Model estimation
Data collection
Aggregate calibration
of simulation model
Model refinement
Dis
ag
gre
gate
da
taA
ggre
ga
te
da
ta
Aggregate validation
Calibrated and
validated simulation model
Implementation and
verification
Fig. 2. Estimation, calibration and validation process

6
Integration of MLC and DLC
As noted above, most models classify lane changes as either mandatory or
discretionary, with the former overriding the latter. This separation implies that
there are no trade-offs between mandatory and discretionary considerations. For
example, a vehicle on a freeway which intends to take an off-ramp will not
overtake a slower vehicle if the distance to the off-ramp is below a certain
threshold value, regardless of the speed of that vehicle. Furthermore, in order to
implement the MLC and DLC models separately, rules that dictate when drivers
begin to respond to MLC conditions need to be defined. However, this point is
unobservable, and so only judgment-based heuristic rules, which are often defined
by the distance from the point where the MLC must be completed, are employed.
The model shown in Figure 3 integrates MLC and DLC into a single utility
model. Variables that capture the need to be in the correct lane and to avoid
obstacles as well as variables that capture the relative speed advantages and ease
of driving in the current lane as well as in the lanes to the right and to the left, are
all incorporated in a single utility model that takes into account the trade-offs
among these variables. An important goal that affects drivers’ lane-changing
behavior in this model is following the travel path. This goal is accounted for by a
group of variables that capture the distance to the point where drivers have to be
in specific lanes and the number of lane changes that are needed in order to be in
these lanes. Figure 4 demonstrates the impact of these variables on the
probability that a driver intending to exit a freeway through an off-ramp would
target a change to the right. This probability increases when the distance to the off-
ramp is smaller (approaching 1 when the distance approaches zero) and when the
number of lane changes required increases. Note that with separate MLC and
DLC models, the corresponding graph would be a step function, with probability
0 when the distance to the ramp is larger than a certain threshold value, and 1 when
the distance is smaller.

7
RightLeft CurrentChange
direction
Gap
acceptanceCHANGE
RIGHTCHANGE
LEFTNO
CHANGENO
CHANGENO
CHANGE
Fig. 3. Structure of the integrated MLC and DLC model.
Fig. 4. Impact of the path-plan on the probability of targeting the right lane.
Explicit target lane choice
The decision to seek a lane change and the direction of change in the models
introduced so far have been based on an evaluation of the current lane and the
adjacent lanes to the right and to the left. Therefore, in these models, the set of
lanes that the driver chooses from depends on the lane that the vehicle is currently
in. In multi-lane road facilities, only a subset of the available lanes is evaluated.
This approach may result in unrealistic behavior in cases where drivers change
lanes not because the lane they are changing to is preferable, but as a step on their
way to another lane further away in the lane change direction. This type of
situation may arise, for example, in multi-lane freeways with dedicated lanes (e.g.

8
HOV lanes). Drivers may change lanes in the direction of the dedicated lane, even
to lanes with undesirable characteristics (e.g. slower speeds) in order to eventually
enter the dedicated lane, which may pro- vide higher levels of service.
In order to tackle this problem, the model shown in Figure 5 (for a driver
currently in the second lane from the right, lane 2, of a four-lane freeway) has
been tested. This model introduces an explicit target lane selection. Rather than
choosing a direction change, drivers choose a target lane among all the available
lanes. The target lane is the lane that is perceived as the best lane to be in when
multiple factors and goals are taken into account. The direction of a desired lane
change, if any, is dictated by the direction of the target lane from the lane that the
vehicle is currently in. As with previous models, the completion of the lane change
depends on its feasibility, which is captured by gap acceptance models. An
estimation of this model with trajectory data demonstrated that important factors
affecting the utilities of the various lanes include the microscopic and macroscopic
traffic flow characteristics in the lane (e.g., the presence of heavy vehicles, the
average speed and density), the impact of the path-plan (e.g., whether it would be
a correct lane in order to follow the path), an inertia factor (e.g., whether it is the
current lane and if not, the number of lane changes that would be required to reach
it) and characteristics of the driver (e.g., aggressiveness).
To demonstrate its usefulness, the model was tested on a section of I-80 in
Emeryville, California. This section, shown schematically in Figure 6, is six
lanes wide, and the left-most lane is an HOV lane that can be accessed at any point
in the section. Traffic speeds are significantly higher on this lane as compared to on
the other lanes that experience significant queuing and delays during the peak
period.
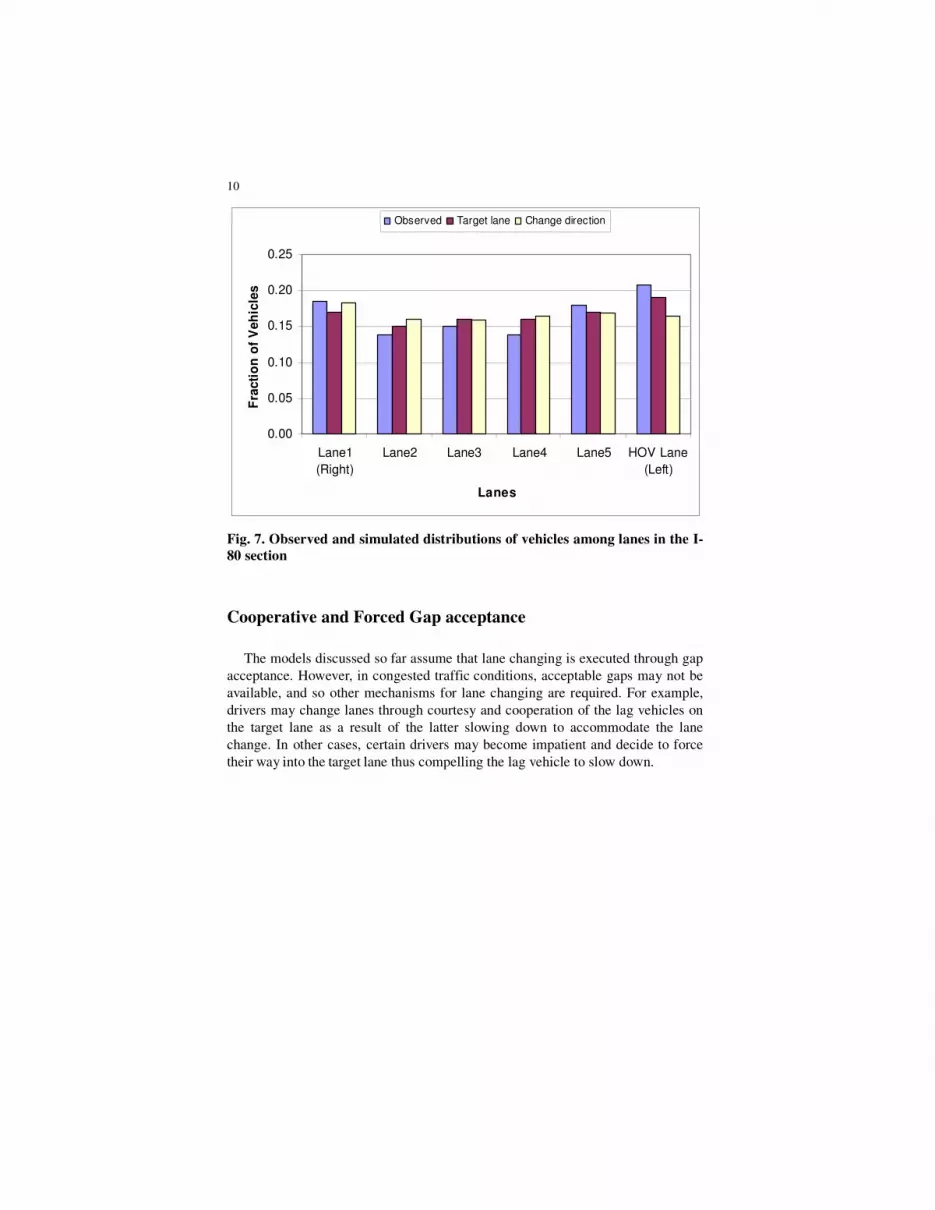
Figure 7 shows a comparison of the distribution of vehicles among lanes
observed in this section to the ones predicted by two versions of MITSIMLab: one
that implements the model with an explicit target lane choice, and another that
implements the model described in the previous section, and which is based on a
myopic choice of direction change. Overall, the model with an explicit target lane
choice matched the observations better, particularly with respect to the usage of
the HOV lane. The change direction model underestimated the usage of the HOV
lane, mainly because it was not in the set of lane choices of the drivers entering the
section from the on-ramp. Consequently, these drivers did not reach this lane. With
the explicit target lane model, drivers also evaluated the HOV lane and some chose
to change to this lane. As a result, the utilization of the HOV lane was higher and
closer to the real- world observations. Additional validation results have been
presented in Choudhury et al. (2007a).

9
Lane 4Lane 1 Lane 2Target Lane
Gap acceptance
NO CHANGE
Lane 3
LeftCurrent
CHANGE LEFT
NO CHANGE
Left
CHANGE LEFT
NO CHANGE
Right
CHANGE RIGHT
NO CHANGE
Change
Direction
Fig. 5. Structure of model with explicit target lane choice (current lane is lane
2)
6
1
2
3
4
5
87Powell St.
On-RampAshby
Off-Ramp
EB I-80
shoulder
HOV Lane
Fig. 6. The I-80 site, Emeryville California
10
Fig. 7. Observed and simulated distributions of vehicles among lanes in the I-
80 section
Cooperative and Forced Gap acceptance
The models discussed so far assume that lane changing is executed through gap
acceptance. However, in congested traffic conditions, acceptable gaps may not be
available, and so other mechanisms for lane changing are required. For example,
drivers may change lanes through courtesy and cooperation of the lag vehicles on
the target lane as a result of the latter slowing down to accommodate the lane
change. In other cases, certain drivers may become impatient and decide to force
their way into the target lane thus compelling the lag vehicle to slow down.
0.00
0.05
0.10
0.15
0.20
0.25
Lane1
(Right)
Lane2 Lane3 Lane4 Lane5 HOV Lane
(Left)
Lanes
Fra
cti
on
of
Veh
icle
s
Observed Target lane Change direction

11
Target lane
Initiate courtesy
merge
courtesy/forced
merging gap
acceptance
Target
lane
Adjacent gap
acceptable
Adjacent gap not acceptable
Initiate courtesy
merge
change No
changeChange
Initiate forced merge
No
changeNo
changeChange
Initiate forced
merge
Normal gap
acceptance
Anticipated gapGap anticipation
Same adjacent gap New adjacent gap
Do not initiate
courtesy merge
Do not initiate forced merge
Same adjacent gap
New adjacent gap
Fig. 8. Structure of a merging model that integrates courtesy and forced
merging
The model shown in Figure 8, which was developed for a merging situation,
integrates courtesy and forced merging mechanisms with “normal” gap
acceptance. This integrated model captures the transitions from one type of
merging to the other and the merging driver first evaluates whether or not the
available adjacent gap is acceptable. This decision is modeled with standard gap
acceptance models that com- pare the lead and lag gaps with the corresponding
critical gaps. If the available gap is acceptable, the driver merges to the mainline.
If, on the other hand, the available gap is unacceptable, the driver anticipates what
the magnitude of the adjacent gap will be in a short time horizon. The anticipated
gap is evaluated based on the magnitude of the available gap and the current speed
and acceleration of the lag vehicle. The time horizon over which the driver
anticipates the gap may vary across the driver population so as to capture
differences in perception and planning abilities among drivers. The anticipated
gap reflects the drivers’ perception of the courtesy or discourtesy of the lag
vehicle. The driver then evaluates whether the anticipated gap is acceptable or not.
An acceptable anticipated gap implies that the lag vehicle is providing courtesy to
the merging vehicle, and so the driver can initiate a courtesy merge. If the
anticipated gap is not acceptable, the lag vehicle is not providing courtesy, in
which situation the merging driver may choose whether or not to begin forcing his
way into the mainline and compel the lag vehicle to slow down.
A driver that has initiated courtesy yielding or forced merging completes the
merge when the available gap is acceptable. Thus, the lane change may not be
completed when initiated, but it may rather take more time. However, the model

12
assumes that a driver that has initiated a courtesy or forced merge will continue to
use this mechanism until the lane change is complete, or if unsuccessful until the
adjacent gap is no longer available (e.g., having been overtaken by the lag vehicle).
Critical gaps for courtesy or forced merging may differ from the ones used in
normal lane changing.
Estimation results for this model (Choudhury et al., 2007b) showed that the
inclusion of the three merging mechanisms were justified by the data and
significantly improved the fit of the model. Critical gaps differed in the various merging
mechanisms. In general, the results showed that drivers were willing to accept
smaller lead and lag gaps if they perceived that the lag vehicle was courtesy
yielding.
To demonstrate the impact of the inclusion of courtesy and forced merging in
the model, a version of MITSIMLab implementing this model was compared with
one that only included a standard lane-changing model (Lee, 2006) similar to the
one described in the previous section. The network used in the validation was a
section of US101 in Los Angeles California, displayed in Figure 9. This
section generally experiences high congestion during the peak period that was
modeled in this case study. Figure 10 shows the distribution of locations of
merges as a function of the remaining distance to the end of the merging lane,
which was observed in the data and predicted by the two MITSIMLab versions.
The results indicated that the full model, which incorporated courtesy and forced
merging, was able to better match the locations of merges as compared to the
model that only captured “normal” lane-changing. Particularly, with the simple
model, vehicles were unable to change lanes by accepting available gaps.
Therefore, a large share of the merges occurred very late (81% occurred less than
100 meters from the end of the merging lane). This may result in the formation of
queues on the ramp and an over-prediction of delays to both ramp and mainline
vehicles. With the full model, the addition of the courtesy and forced merging
mechanisms allowed drivers to merge more quickly and with greater ease, and thus
only 47% of the merges occurred within 100 meters from the end of the ramp. This
value is significantly closer to the observed 44%.
Comparisons of lane-specific flows from both versions of MITSIMLab are
presented in Table 1. The results show that the full model was able to provide a
better match to the actual flows. Thus, the improved realism of the model at the
microscopic level was also translated into an improved fit to the aggregate (or
macroscopic) traffic flow characteristics, which are most often the statistics of
interest in a simulation application.

13
Fig. 9. The US101 site, Los Angeles California
Fig. 10. Observed and predicted merge locations
1
6
5
4
3
2
2100 ft (640 m)
3
4
5
Ventura On -Ramp
1
2
Study Areaof Trajectory Data
Lankershim Off -ramp
698 ft (213 m)
0
10
20
30
40
50
60
0-50 50-100 100-150 150-200 200-250 250+
% o
f M
erg
es
Remaining distance to end of merging lane (m)
Observed
Full
Normal

14
Table 1- Comparison of Lane-Specific Flows
Normal Full Improvement
RMSE (vehicles/5 mins) 19.18 13.22 31.07%
RMSPE 12.18% 7.52% 38.26%
Accounting for heterogeneity
All the lane-changing models discussed above incorporate decisions that
drivers make over several choice dimensions (e.g., the choice of target lane, gap
acceptance). Moreover, these decisions are repeated over time. Invariant
characteristics of the drivers and their vehicles, such as aggressiveness, their level
of driving skill and the vehicle’s speed and acceleration capabilities, create
correlations among the choices made by a given driver over time and choice
dimensions. It is important to capture these correlations in the utility functions.
However, the data available for model estimation does not comprehend
information about these characteristics. Therefore, a model specification including
individual-specific latent variables in the various utilities in order to capture these
correlations was utilized. This individual-specific term appears in the utilities of all
the various alternatives that a driver has in all his choices and in all time periods.
The model assumes that, conditional on the value of this latent variable, the error
terms of different utilities are independent. This specification is given by:
β α υ ε= + +�
Tc c c c c
int i i nt i n intU X (1)
c
intU is the utility of alternative i of choice dimension c to individual n at time t.
c
intX is a vector of explanatory variable. β c
i is a vector of parameters. υn
is an
individual-specific latent variable assumed to follow some distribution in the
population. α c
i is the parameter of υn
. ε c
int is a generic random term with
independently and identically distributed (i.i.d.) across alternatives, individuals
and time. ε c
int and υn
are independent of each other.
The resulting error structure (see Heckman 1981, Walker 2001 for a detailed
discussion) is given by:

15
( )( ) ( )α σ
α α′ ′
′ ′ ′ ′
′ ′ ′ ′+ = = = =
′ ′ ′ ′= = ≠ ≠ ≠ ′≠
c c
i i
c c c c
int i n t i i
if n n , c c , i i and t t
cov U ,U if n n , c c and/or i i and/or t t
0 if n n
2 2
(2)
σ c
i is the standard deviation of ε c
int.
Fig. 11. Median lead and lag critical gaps as a function of the distance to the
end of the merging lane
The impact of this formulation on the resulting behavior is demonstrated with
the application in the lead and lag critical gaps of the merging model described
0
10
20
30
0 20 40 60 80 100 120 140 160 180 200
Remaining Distance to MLC (m)
Med
ian
Lead
Cri
tical
Gap
(m
)
Aggressive Driver Timid Driver
0
2
4
6
8
10
12
0 20 40 60 80 100 120 140 160 180 200
Remaining Distance to MLC (m)
Med
ian
Lag
Cri
tical
Gap
(m
) Aggressive Driver Timid Driver

16
in this model. Here, critical gaps depend on the remaining distance to the end of
the merging lane. The individual specific random term was introduced in the
coefficient of the remaining distance in both the lead and lag critical gaps (as well
as in other parts of the model). This variable was interpreted as representing the
range of drivers’ behavior from timid to aggressive. Figure 11 demonstrates critical
lead and lag gaps for timid and aggressive drivers. Everything else being equal,
aggressive drivers had lower critical gaps as compared to their more timid
counterparts. Furthermore, the difference in critical gaps increased when the merge
became more urgent, as the vehicle approached the end of the merging lane. The
use of the same individual-specific latent variable in both critical gaps also
ensured that the behavior was consistent, and consequently, a driver who is
aggressive in one dimension (e.g., has a small critical lag gap) would also be
aggressive in other dimensions (e.g., would have a small critical lead gap as well).
Conclusion
Lane-changing is an important component of microscopic traffic simulation
models, and has a significant impact on the results of analyses employing these
tools. In recent years, the interest in the development of lane-changing models and
their implementation in traffic simulators has increased dramatically. This paper
presents several enhancements to the basic lane-changing model that has been
utilized, with some variations, in several simulators. These enhancements have
been intended to form a more comprehensive modeling framework for the
integration of various aspects of the lane-changing behavior, such as MLC and
DLC, and other lane changing mechanisms, including courtesy and forced gap
acceptance. Estimation results and validation case studies demonstrated
significant improvements in the ability of the enhanced lane-changing models to
replicate observed behavior and traffic patterns as compared to the simple generic
model. The extent of the improvement obtained with the enhancements presented
herein leads us to believe that further advances in lane- changing models may give
rise to additional improvements in their ability to replicate reality. In particular,
two areas of improvement may be useful in that respect:
Integrating acceleration behavior in lane-changing models. Drivers’
acceleration may be affected by their lane changing behavior. For example, drivers
may accelerate or decelerate in order to position their vehicles such that they are
able to accept available gaps. This type of behavior, if implemented in traffic
simulators, may have a significant impact on simulated traffic flow
characteristics. Some research in this direction, with promising results, has been
conducted by Zhang et al. (1998) and Toledo (2002). However, further research
to experiment with various model structures and specifications as well as to use
more datasets from diverse locations and traffic conditions, is required in order to
better understand the inter-dependencies among lane changing and acceleration
behaviors.

17
Lane-changing behavior in arterial streets. All the results presented in this
paper and most of the research in this field in general are based on data collected
from freeway sections. While the structures of these models are common enough
to be applied on traffic in urban arterials, some factors affecting the lane-
changing behavior in urban streets may not be present in freeway traffic. For
example, the impact of buses and bus stops, paring activity, traffic signals and the
queues that form behind them are important in urban streets but cannot be
observed in data collected from freeway sections.
Furthermore, a significant proportion of lane changes in urban arterials may
occur at intersections and not in the sections themselves. Research in this direction
has been conducted by Wei et al. (2000). In an on-going effort sponsored by the
NGSIM project, data collected in an arterial street in Los Angeles California is
used for this purpose.
Acknowledgments
This paper is based upon work supported by the National Science Foundation
under Grant No. CMS-0085734 and by the Federal Highway Administration under
contract number DTFH61-02-C-00036. Any opinions, findings and conclusions or
recommendations expressed in this publication are those of the authors and do not
necessarily reflect the views of the National Science Foundation or the Federal
Highway Administration. Dr. Toledo is a Horev Fellow supported by the Taub and
Shalom Foundations.
References
1. Ahmed K.I. (1999) Modeling Drivers’ Acceleration and Lane Changing
Behavior, PhD Dissertation, Department of Civil and Environmental
Engineering, MIT.
2. Ahmed K.I., Ben-Akiva M., Koutsopoulos H.N. and Mishalani R.G. (1996)
Models of Freeway Lane Changing and Gap Acceptance Behavior, in
Proceedings of the 13th International Symposium on the Theory of Traffic
Flow and Transportation, pp. 501-515.
3. Choudhury C., Ben-Akiva M. and Toledo, T. (2007a) Modeling Lane-
changing Behavior in Presence of Exclusive Lanes, paper presented at the
11th World Conference on Transport Research, Berkley, USA.
4. Choudhury C., Ben-Akiva M., Toledo T., Rao A. and Lee G. (2007b) State-
dependence in driver behaviour models, in Transportation and Traffic Theory
2007, Allsop R., Bell M.G.H. and Heydecker B. eds., Elsevier Science, pp.
711-734, 2007.

18
5. Gipps P.G. (1986) A Model for the Structure of Lane Changing Decisions,
Transportation Research Part B, 20, pp. 403-414.
6. Halati A., Lieu H. and Walker S. (1997) CORSIM – Corridor Traffic
Simulation Model, in Proceedings of the Traffic Congestion and Traffic
Safety in the 21st Century Conference, pp. 570-576.
7. Heckman J.J. (1981) Statistical Models for Discrete Panel Data, in C.F.
Manski and D. McFadden (Ed.), Structural Analysis of Discrete Data with
Econometric Applications, pp. 114-178.
8. Hidas P. (2002) Modelling Lane Changing and Merging in Microscopic
Traffic Simulation, Transportation Research Part C, 10, pp. 351-371.
9. Hidas P. and Behbahanizadeh, K. (1999) Microscopic Simulation of Lane
Changing under Incident Conditions, in Proceedings of the 14th International
Symposium on the Theory of Traffic Flow and Transportation, abbreviated
presentation sessions, pp. 53-69.
10. Lee G. (2006), Modeling Gap Acceptance in Freeway Merges, MS Thesis,
Department of Civil and Environmental Engineering, MIT.
11. Toledo T., Koutopoulos H.N. and Ben-Akiva M. (2007), Integrated driving
behavior modeling, Transportation Research Part C 15(2), pp. 96-112.
12. Toledo T. (2006) Driving Behaviour: Models and Challenges, Transport
Reviews, 27, pp 65-84.
13. Toledo T., Ben-Akiva M. and Koutsopoulos H.N. (2003) Modeling Integrated
Lane-changing Behavior, Transportation Research Record, 1857, pp 30-38.
14. Toledo T. and Koutsopoulos H.N. (2004) Statistical Validation of Traffic
Simulation Models, Transportation Research Record, 1876, pp 142-150.
15. Toledo T., Koutsopoulos H.N., Davol A., Ben-Akiva M., Burghout W.,
Andreasson I., Johansson T. and Lundin C. (2003) Calibration and validation
of microscopic traffic simulation tools: Stockholm Case Study, Transportation
Research Record, 1831, pp 65-75.
16. Walker J.L. (2001) Extended Discrete Choice Models: Integrated Framework,
Flexible Error Structures and Latent Variables, PhD Dissertation, Department
of Civil and Environmental Engineering, MIT.
17. Wei H., Lee J., Li Q., and Li C.J. (2000) Observation-Based Lane-Vehicle-
Assignment Hierarchy for Microscopic Simulation on an Urban Street
Network, in Preprints of the 79th
Transportation Research Board Annual
Meeting, Washington DC.
18. Yang Q. and Koutsopoulos H.N. (1996) A Microscopic Traffic Simulator for
Evaluation of Dynamic Traffic Management Systems, Transportation
Research Part C, 4, pp. 113-129.
19. Zhang Y., Owen L.E. and Clark J.E. (1998) A Multi-regime Approach for
Microscopic Traffic Simulation, in Preprints of the 77th
Transportation
Research Board Annual Meeting, Washington DC.