Embed Size (px)
Citation preview
INTEGRATED PROFIT & LOSS STATEMENT ANNUAL RESULTS AND ASSUMPTIONS
2020
MEASURING OUR VALUE: THE INTEGRATED PROFIT & LOSS STATEMENT (IP&L)OUR MULTI - CAPITALS1 BUSINESS PERFORMANCE IN 2020LafargeHolcim is one of the pioneers in the growing discipline of impact valuation.
Our journey started in 2012 with our Indian subsidiary (Ambuja Cement) and continued at Group level when we published our first Global IP&L in 2014.
Since then we assess on an annual basis our Economic, Social and Environmental impacts (Triple Bottom Line) in monetized terms and we disclose it through our Integrated Profit & Loss statement (IP&L 2020 results on page 3).
The IP&L complements our traditional financial and sustainability metrics. It enhances decision-making processes to sustain long-term value creation for shareholders, society, and the environment, allowing us to understand and share with our stakeholders the extent of our impacts and to track progress against our sustainability ambitions.
to collectively develop a global impact measurement and valuation (IMV) standard for monetizing and disclosing the impacts companies have on society and to provide guidance on how these impacts can be integrated into business steering. This new sustainability measurement methodology will support the comparability of the long-term value contributions of each company.
Our ambition, working with the Value Balancing Alliance, is to change the way company performance is measured and valued, beyond financials.
The collaboration of the Value Balancing Alliance with different stakeholders such as the European Commission, the OECD, and the World Economic Forum will help to standardize methodologies for measuring sustainability and further develop them.
The IP&L also raises awareness of risks and opportunities posed by externalities (through quantification), and enables analysis on what the impact could be on the bottom line.
THE GROWING DISCIPLINE OF IMPACT VALUATIONEconomic, social, and environmental forces transform the operating landscape of business and have a growing influence on a company’s cash flow and risk profile. So to protect shareholders and society, it is essential to identify and quantify these impacts in a transparent and comparable way.
Since we published our first IP&L, the discipline of impact valuation has been further developed and adopted by many companies using different methodologies and approaches that made comparability a challenge.
In June 2019, together with a diverse group of multinational companies, we founded the Value Balancing Alliance
1 Capitals: Financial, Natural, Human, and Social.
2LafargeHolcim Integrated Profit & Loss Statement 2020
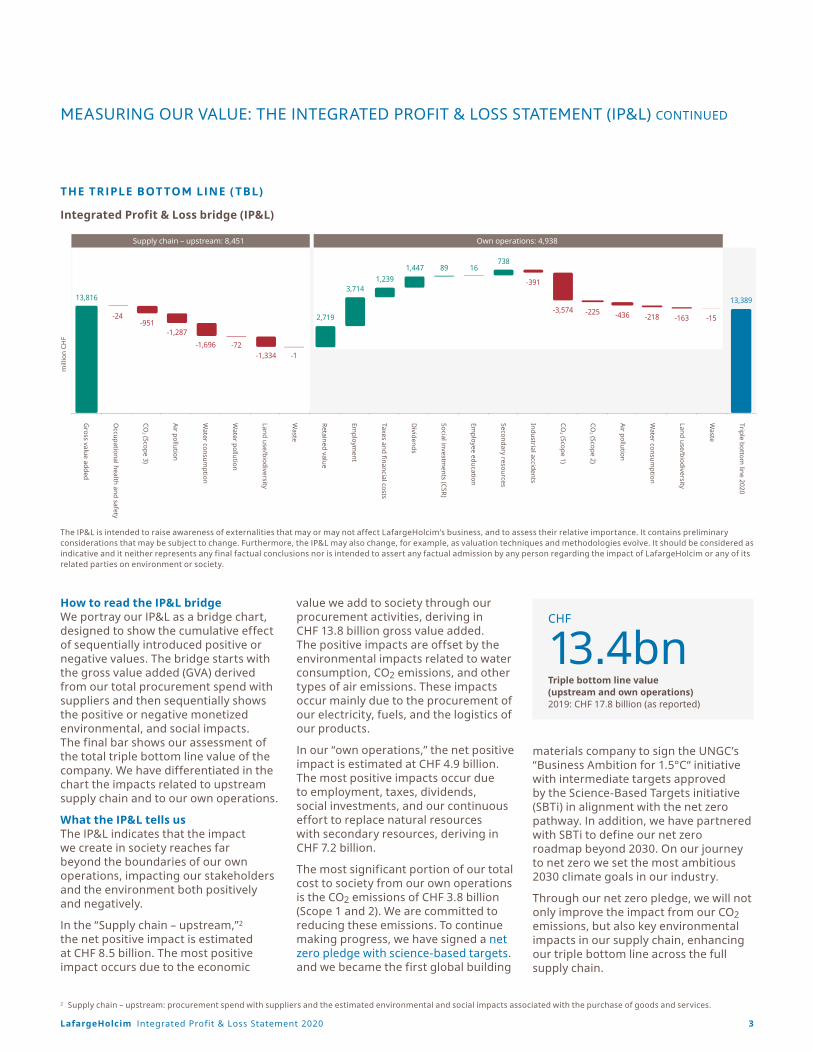
How to read the IP&L bridgeWe portray our IP&L as a bridge chart, designed to show the cumulative effect of sequentially introduced positive or negative values. The bridge starts with the gross value added (GVA) derived from our total procurement spend with suppliers and then sequentially shows the positive or negative monetized environmental, and social impacts. The final bar shows our assessment of the total triple bottom line value of the company. We have differentiated in the chart the impacts related to upstream supply chain and to our own operations.
What the IP&L tells usThe IP&L indicates that the impact we create in society reaches far beyond the boundaries of our own operations, impacting our stakeholders and the environment both positively and negatively.
In the “Supply chain – upstream,”2 the net positive impact is estimated at CHF 8.5 billion. The most positive impact occurs due to the economic
value we add to society through our procurement activities, deriving in CHF 13.8 billion gross value added. The positive impacts are offset by the environmental impacts related to water consumption, CO2 emissions, and other types of air emissions. These impacts occur mainly due to the procurement of our electricity, fuels, and the logistics of our products.
In our “own operations,” the net positive impact is estimated at CHF 4.9 billion. The most positive impacts occur due to employment, taxes, dividends, social investments, and our continuous effort to replace natural resources with secondary resources, deriving in CHF 7.2 billion.
The most significant portion of our total cost to society from our own operations is the CO2 emissions of CHF 3.8 billion (Scope 1 and 2). We are committed to reducing these emissions. To continue making progress, we have signed a net zero pledge with science-based targets. and we became the first global building
materials company to sign the UNGC’s “Business Ambition for 1.5°C“ initiative with intermediate targets approved by the Science-Based Targets initiative (SBTi) in alignment with the net zero pathway. In addition, we have partnered with SBTi to define our net zero roadmap beyond 2030. On our journey to net zero we set the most ambitious 2030 climate goals in our industry.
Through our net zero pledge, we will not only improve the impact from our CO2 emissions, but also key environmental impacts in our supply chain, enhancing our triple bottom line across the full supply chain.
MEASURING OUR VALUE: THE INTEGRATED PROFIT & LOSS STATEMENT (IP&L) CONTINUED
THE TRIPLE BOT TOM LINE (TBL)
The IP&L is intended to raise awareness of externalities that may or may not affect LafargeHolcim’s business, and to assess their relative importance. It contains preliminary considerations that may be subject to change. Furthermore, the IP&L may also change, for example, as valuation techniques and methodologies evolve. It should be considered as indicative and it neither represents any final factual conclusions nor is intended to assert any factual admission by any person regarding the impact of LafargeHolcim or any of its related parties on environment or society.
Gross value added
Occupational health and safety
CO2 (Scope 3)
Air pollution
Water consum
ption
Water pollution
Land use/biodiversity
Waste
Retained value
Employm
ent
Taxes and financial costs
Dividends
Social investments (CSR)
Employee education
Secondary resources
Industrial accidents
CO2 (Scope 1)
CO2 (Scope 2)
Air pollution
Water consum
ption
Land use/biodiversity
Triple bottom line 2020
Waste
mill
ion
CHF
Supply chain – upstream: 8,451 Own operations: 4,938
13,816
2,719
3,714 1,239
1,447 89 16 738
13,389
-24 -951
-1,287 -1,696 -72
-1,334 -1
-391
-3,574 -225 -436 -218 -163 -15
Integrated Profit & Loss bridge (IP&L)
2 Supply chain – upstream: procurement spend with suppliers and the estimated environmental and social impacts associated with the purchase of goods and services.
CHF
13.4bnTriple bottom line value (upstream and own operations) 2019: CHF 17.8 billion (as reported)
3LafargeHolcim Integrated Profit & Loss Statement 2020
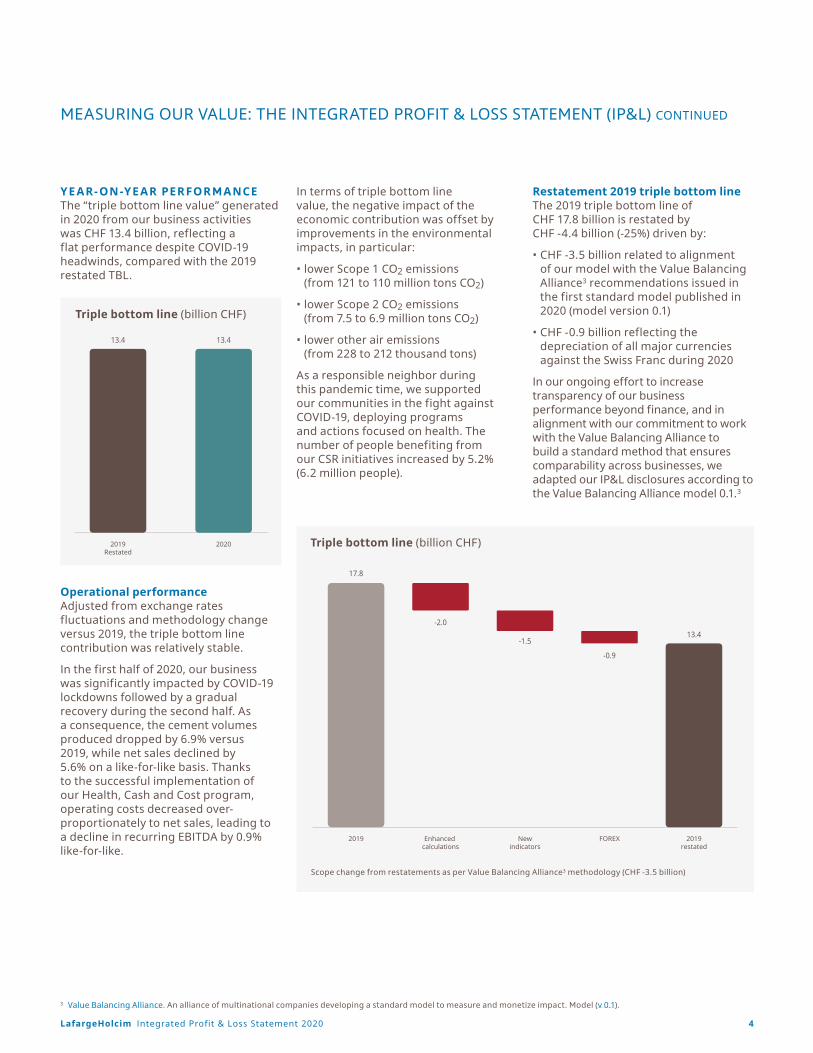
YEAR- ON-YEAR PERFORMANCEThe “triple bottom line value” generated in 2020 from our business activities was CHF 13.4 billion, reflecting a flat performance despite COVID-19 headwinds, compared with the 2019 restated TBL.
Operational performance Adjusted from exchange rates fluctuations and methodology change versus 2019, the triple bottom line contribution was relatively stable.
In the first half of 2020, our business was significantly impacted by COVID-19 lockdowns followed by a gradual recovery during the second half. As a consequence, the cement volumes produced dropped by 6.9% versus 2019, while net sales declined by 5.6% on a like-for-like basis. Thanks to the successful implementation of our Health, Cash and Cost program, operating costs decreased over-proportionately to net sales, leading to a decline in recurring EBITDA by 0.9% like-for-like.
In terms of triple bottom line value, the negative impact of the economic contribution was offset by improvements in the environmental impacts, in particular:
• lower Scope 1 CO2 emissions (from 121 to 110 million tons CO2)
• lower Scope 2 CO2 emissions (from 7.5 to 6.9 million tons CO2)
• lower other air emissions (from 228 to 212 thousand tons)
As a responsible neighbor during this pandemic time, we supported our communities in the fight against COVID-19, deploying programs and actions focused on health. The number of people benefiting from our CSR initiatives increased by 5.2% (6.2 million people).
MEASURING OUR VALUE: THE INTEGRATED PROFIT & LOSS STATEMENT (IP&L) CONTINUED
Restatement 2019 triple bottom lineThe 2019 triple bottom line of CHF 17.8 billion is restated by CHF -4.4 billion (-25%) driven by:
• CHF -3.5 billion related to alignment of our model with the Value Balancing Alliance3 recommendations issued in the first standard model published in 2020 (model version 0.1)
• CHF -0.9 billion reflecting the depreciation of all major currencies against the Swiss Franc during 2020
In our ongoing effort to increase transparency of our business performance beyond finance, and in alignment with our commitment to work with the Value Balancing Alliance to build a standard method that ensures comparability across businesses, we adapted our IP&L disclosures according to the Value Balancing Alliance model 0.1.3
3 Value Balancing Alliance. An alliance of multinational companies developing a standard model to measure and monetize impact. Model (v 0.1).
2019Restated
2020
13.413.4
Triple bottom line (billion CHF)
2019 Enhanced calculations
Newindicators
FOREX 2019restated
13.4
17.8
-2.0
-1.5
-0.9
Scope change from restatements as per Value Balancing Alliance3 methodology (CHF -3.5 billion)
Triple bottom line (billion CHF)
4LafargeHolcim Integrated Profit & Loss Statement 2020
• New indicators in the upstream supply chain,4 resulting in CHF -1.5 billion impact from enhanced scope of externalities, estimated using an Input/Output model (Exiobase macro-economic database):
• Land use (CHF -1.4 billion)
• Water pollution (CHF -0.08 billion)
• Health and safety (CHF -0.03 billion)
• Enhanced calculation methods, resulting in CHF -2.0 billion impact from improved accuracy.
• Gross value added (GVA) (CHF -1.8 billion). This year’s methodology calculates the contribution to Gross Domestic Product (GDP) from our company procurement spend vs last year’s disclosure of “Procurement spend adjusted by inefficiencies” (e.g. corruption index). GDP is an
aggregate measure of the market value of goods and services a country produces to satisfy the needs of final consumers. It is used to express the wealth of a country and measure the economic performance and societal progress of nations. The sum of the private sector’s GVA constitutes the private sector’s share of national GDP. GVA is often referred to as the GDP contribution of a company.
• Health and safety – own operations (CHF -0.4 billion). This year, the methodology includes more granularity by distinguishing disease and injury, and adding several categories of severity, to which a more accurate cost is associated.
• Scope 3 emissions (CHF -0.4 billion).This year, the methodology includes emissions from all goods and services purchased in 2020 vs major categories included in 2019.
• Water in the upstream supply chain (CHF +0.5 billion). This year, the “upstream water” is measured based on consumption volumes instead of withdrawal volumes as done in 2019.
• Employees’ education (CHF +0.02 billion). This year, the method includes more granularity of valuation coefficient at country level.
The Value Balancing Alliance model will continue to evolve in line with the non-financial disclosures developments, and as a commitment we will align our IP&L accordingly to ensure we disclose our performance with the latest enhancements.
MEASURING OUR VALUE: THE INTEGRATED PROFIT & LOSS STATEMENT (IP&L) CONTINUED
4 Supply chain – upstream: procurement spend with suppliers and the estimated environmental and social impacts associated with the purchase of goods and services.
5LafargeHolcim Integrated Profit & Loss Statement 2020
CHF
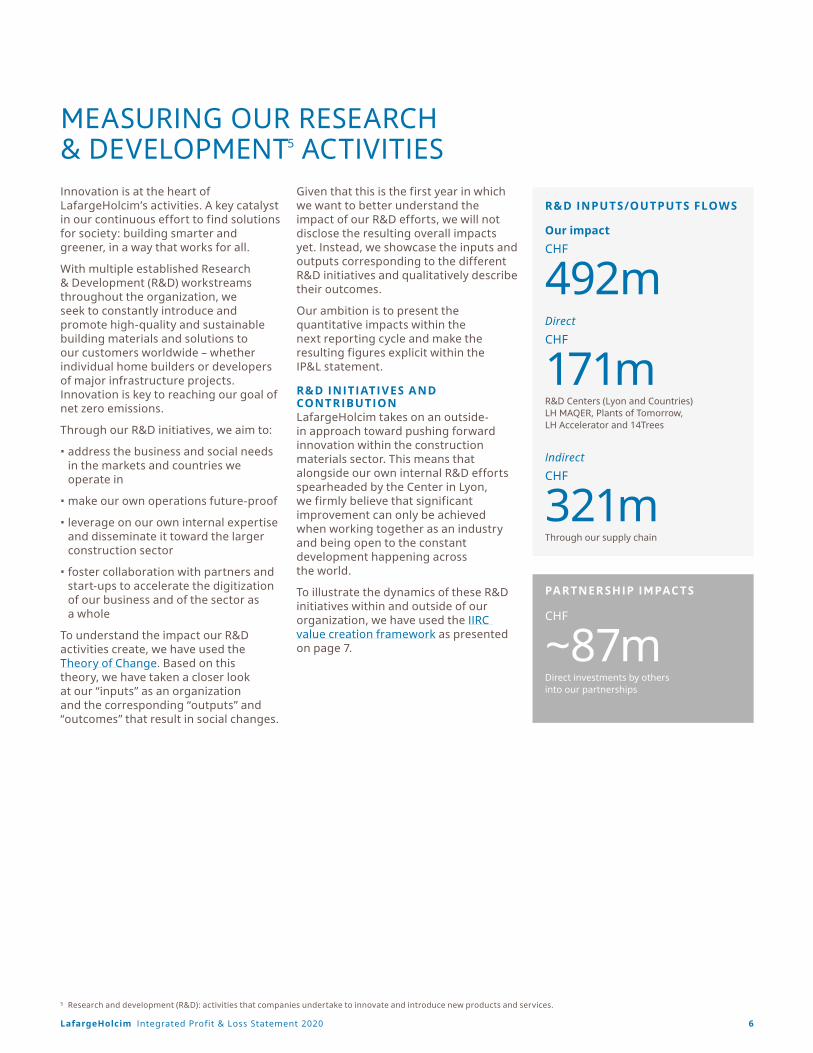
~87mDirect investments by others into our partnerships
R&D INPUTS/OUTPUTS FLOWS
Our impact
CHF
492mDirect
CHF
171mR&D Centers (Lyon and Countries)LH MAQER, Plants of Tomorrow,LH Accelerator and 14Trees
Indirect
CHF
321mThrough our supply chain
MEASURING OUR RESEARCH & DEVELOPMENT5 ACTIVITIESInnovation is at the heart of LafargeHolcim’s activities. A key catalyst in our continuous effort to find solutions for society: building smarter and greener, in a way that works for all.
With multiple established Research & Development (R&D) workstreams throughout the organization, we seek to constantly introduce and promote high-quality and sustainable building materials and solutions to our customers worldwide – whether individual home builders or developers of major infrastructure projects. Innovation is key to reaching our goal of net zero emissions.
Through our R&D initiatives, we aim to:
• address the business and social needs in the markets and countries we operate in
• make our own operations future-proof
• leverage on our own internal expertise and disseminate it toward the larger construction sector
• foster collaboration with partners and start-ups to accelerate the digitization of our business and of the sector as a whole
To understand the impact our R&D activities create, we have used the Theory of Change. Based on this theory, we have taken a closer look at our “inputs” as an organization and the corresponding “outputs” and “outcomes” that result in social changes.
Given that this is the first year in which we want to better understand the impact of our R&D efforts, we will not disclose the resulting overall impacts yet. Instead, we showcase the inputs and outputs corresponding to the different R&D initiatives and qualitatively describe their outcomes.
Our ambition is to present the quantitative impacts within the next reporting cycle and make the resulting figures explicit within the IP&L statement.
R&D INITIATIVES AND CONTRIBUTIONLafargeHolcim takes on an outside-in approach toward pushing forward innovation within the construction materials sector. This means that alongside our own internal R&D efforts spearheaded by the Center in Lyon, we firmly believe that significant improvement can only be achieved when working together as an industry and being open to the constant development happening across the world.
To illustrate the dynamics of these R&D initiatives within and outside of our organization, we have used the IIRC value creation framework as presented on page 7.
5 Research and development (R&D): activities that companies undertake to innovate and introduce new products and services.
PARTNER SHIP IMPACTS
6LafargeHolcim Integrated Profit & Loss Statement 2020
Environment
Communities
Circular economy
Climate & energy
MEASURING OUR RESEARCH & DEVELOPMENT ACTIVITIES CONTINUED
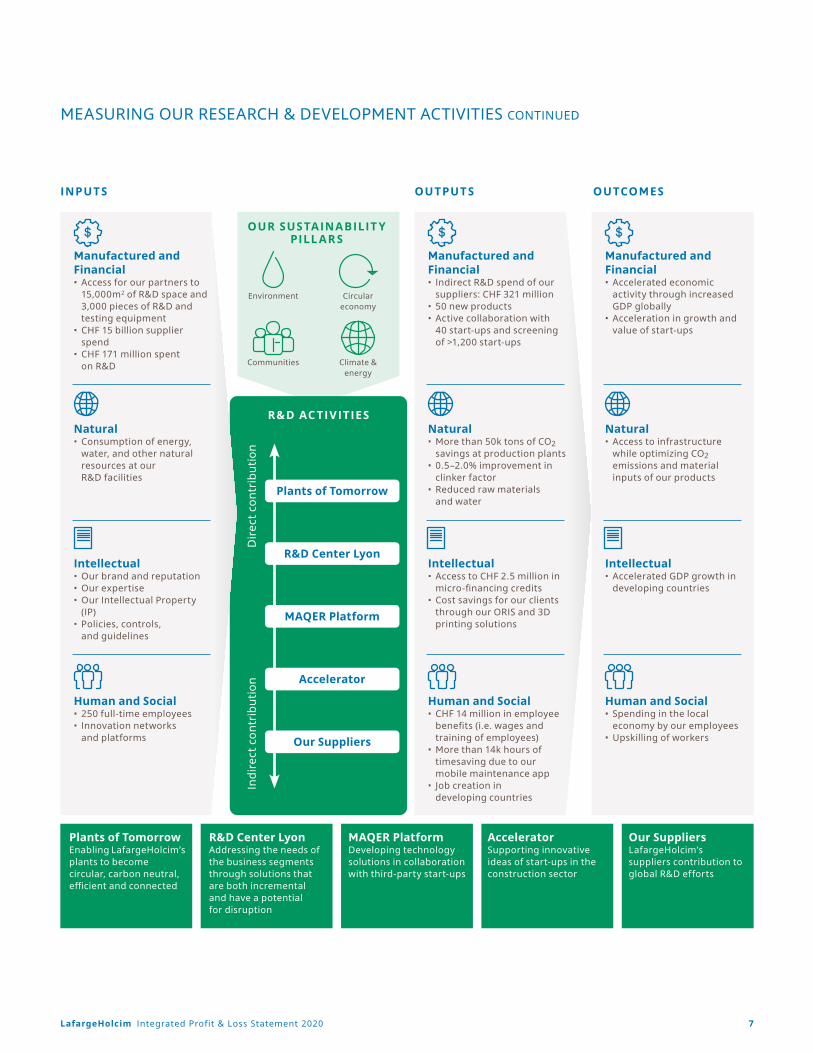
INPUTS
R&D ACTIVITIES
Dir
ect
con
trib
uti
on
Ind
irec
t co
ntr
ibu
tio
n
Plants of Tomorrow
R&D Center Lyon
MAQER Platform
Accelerator
Our Suppliers
OUTPUTS
OUR SUSTAINABILIT Y PILL AR S
OUTCOMES
Manufactured and Financial• Access for our partners to
15,000m2 of R&D space and 3,000 pieces of R&D and testing equipment
• CHF 15 billion supplier spend
• CHF 171 million spent on R&D
Manufactured and Financial• Indirect R&D spend of our
suppliers: CHF 321 million• 50 new products• Active collaboration with
40 start-ups and screening of >1,200 start-ups
Manufactured and Financial• Accelerated economic
activity through increased GDP globally
• Acceleration in growth and value of start-ups
Natural• Consumption of energy,
water, and other natural resources at our R&D facilities
Natural• More than 50k tons of CO2
savings at production plants• 0.5–2.0% improvement in
clinker factor• Reduced raw materials
and water
Natural• Access to infrastructure
while optimizing CO2 emissions and material inputs of our products
Human and Social• CHF 14 million in employee
benefits (i.e. wages and training of employees)
• More than 14k hours of timesaving due to our mobile maintenance app
• Job creation in developing countries
Human and Social• Spending in the local
economy by our employees• Upskilling of workers
Human and Social• 250 full-time employees• Innovation networks
and platforms
Intellectual• Our brand and reputation• Our expertise• Our Intellectual Property
(IP)• Policies, controls,
and guidelines
Intellectual• Access to CHF 2.5 million in
micro-financing credits• Cost savings for our clients
through our ORIS and 3D printing solutions
Intellectual• Accelerated GDP growth in
developing countries
Plants of TomorrowEnabling LafargeHolcim’s plants to become circular, carbon neutral, efficient and connected
R&D Center LyonAddressing the needs of the business segments through solutions that are both incremental and have a potential for disruption
MAQER PlatformDeveloping technology solutions in collaboration with third-party start-ups
AcceleratorSupporting innovative ideas of start-ups in the construction sector
Our SuppliersLafargeHolcim’s suppliers contribution to global R&D efforts
7LafargeHolcim Integrated Profit & Loss Statement 2020
MEASURING OUR RESEARCH & DEVELOPMENT ACTIVITIES CONTINUED
R&D – DIRECT CONTRIBUTION Together with our partners, customers, and academic researchers, our best-in-class R&D teams develop the most innovative products, solutions, and services, as well as advanced manufacturing processes.
In 2020, our innovation initiatives directly contributed CHF 171 million toward R&D activities.
Our R&D initiatives are actioned through our R&D Centers (Lyon and countries) and through “Open Innovation” initiatives (Plants of Tomorrow, MAQER and Accelerator), focus on engaging with start-ups and partners, aiming to:
• promote interdisciplinary collaboration
• disseminate industrial expertise
• create new business opportunities
• develop the solutions and tools needed so that the sector becomes future-proof and minimizes its negative impacts
Half of our innovation projects aim at finding building solutions that work for people and the planet, whether they are digital tools to empower sustainability and circular economy, breakthroughs in the chemical processes, or shaping the future construction industry through 3D printing.
Discover more: https://www.lafargeholcim.com/sustainable-materials-innovative-solutions
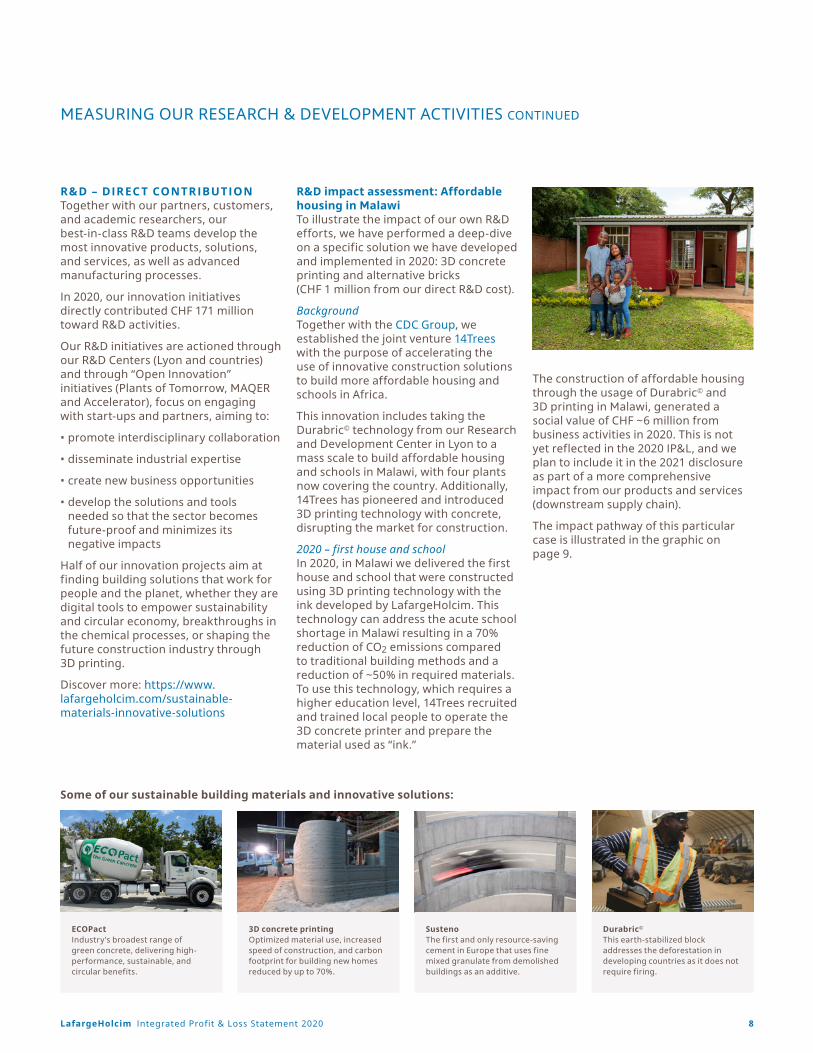
R&D impact assessment: Affordable housing in Malawi To illustrate the impact of our own R&D efforts, we have performed a deep-dive on a specific solution we have developed and implemented in 2020: 3D concrete printing and alternative bricks (CHF 1 million from our direct R&D cost).
BackgroundTogether with the CDC Group, we established the joint venture 14Trees with the purpose of accelerating the use of innovative construction solutions to build more affordable housing and schools in Africa.
This innovation includes taking the Durabric© technology from our Research and Development Center in Lyon to a mass scale to build affordable housing and schools in Malawi, with four plants now covering the country. Additionally, 14Trees has pioneered and introduced 3D printing technology with concrete, disrupting the market for construction.
2020 – first house and schoolIn 2020, in Malawi we delivered the first house and school that were constructed using 3D printing technology with the ink developed by LafargeHolcim. This technology can address the acute school shortage in Malawi resulting in a 70% reduction of CO2 emissions compared to traditional building methods and a reduction of ~50% in required materials. To use this technology, which requires a higher education level, 14Trees recruited and trained local people to operate the 3D concrete printer and prepare the material used as “ink.”
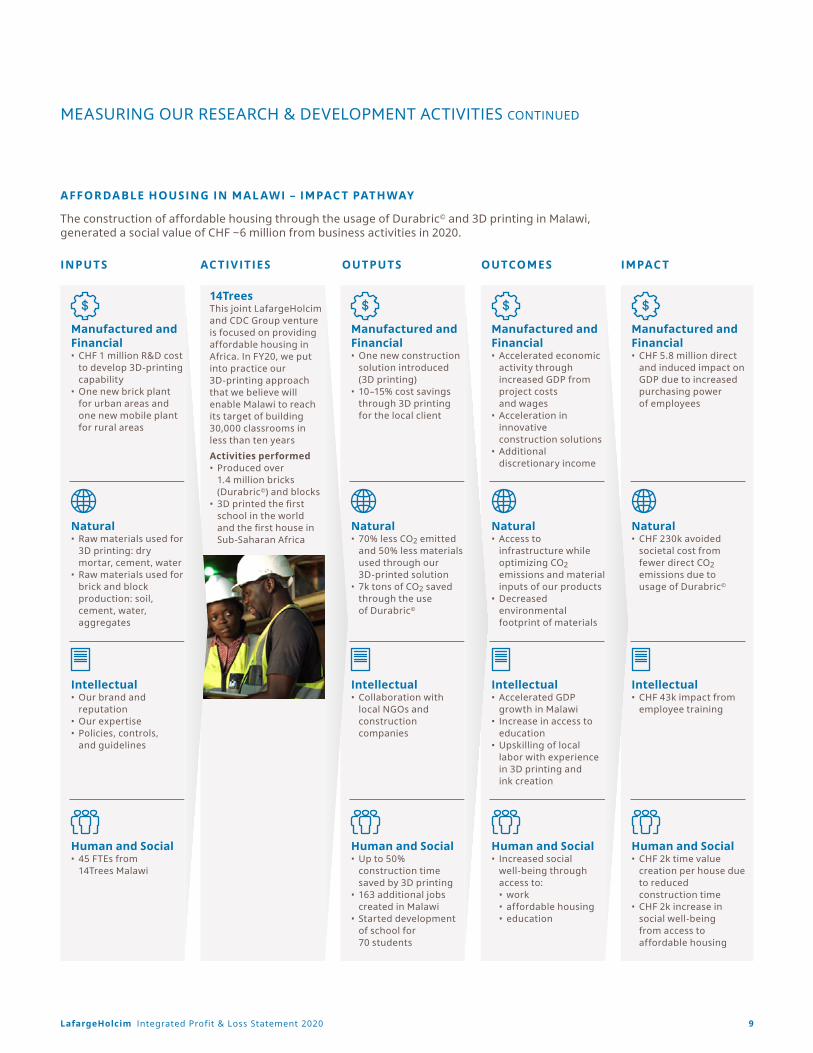
The construction of affordable housing through the usage of Durabric© and 3D printing in Malawi, generated a social value of CHF ~6 million from business activities in 2020. This is not yet reflected in the 2020 IP&L, and we plan to include it in the 2021 disclosure as part of a more comprehensive impact from our products and services (downstream supply chain).
The impact pathway of this particular case is illustrated in the graphic on page 9.
ECOPactIndustry’s broadest range of green concrete, delivering high-performance, sustainable, and circular benefits.
SustenoThe first and only resource-saving cement in Europe that uses fine mixed granulate from demolished buildings as an additive.
3D concrete printingOptimized material use, increased speed of construction, and carbon footprint for building new homes reduced by up to 70%.
Durabric©
This earth-stabilized block addresses the deforestation in developing countries as it does not require firing.
Some of our sustainable building materials and innovative solutions:
8LafargeHolcim Integrated Profit & Loss Statement 2020
MEASURING OUR RESEARCH & DEVELOPMENT ACTIVITIES CONTINUED
The construction of affordable housing through the usage of Durabric© and 3D printing in Malawi, generated a social value of CHF ~6 million from business activities in 2020.
INPUTS IMPACTACTIVITIES OUTPUTS OUTCOMES
Manufactured and Financial• CHF 1 million R&D cost
to develop 3D-printing capability
• One new brick plant for urban areas and one new mobile plant for rural areas
Manufactured and Financial• One new construction
solution introduced (3D printing)
• 10–15% cost savings through 3D printing for the local client
Manufactured and Financial• Accelerated economic
activity through increased GDP from project costs and wages
• Acceleration in innovative construction solutions
• Additional discretionary income
Manufactured and Financial• CHF 5.8 million direct
and induced impact on GDP due to increased purchasing power of employees
14TreesThis joint LafargeHolcim and CDC Group venture is focused on providing affordable housing in Africa. In FY20, we put into practice our 3D-printing approach that we believe will enable Malawi to reach its target of building 30,000 classrooms in less than ten years
Activities performed• Produced over
1.4 million bricks (Durabric©) and blocks
• 3D printed the first school in the world and the first house in Sub-Saharan Africa
Natural• Raw materials used for
3D printing: dry mortar, cement, water
• Raw materials used for brick and block production: soil, cement, water, aggregates
Natural• 70% less CO2 emitted
and 50% less materials used through our 3D-printed solution
• 7k tons of CO2 saved through the use of Durabric©
Natural• Access to
infrastructure while optimizing CO2 emissions and material inputs of our products
• Decreased environmental footprint of materials
Natural• CHF 230k avoided
societal cost from fewer direct CO2 emissions due to usage of Durabric©
Human and Social• 45 FTEs from
14Trees Malawi
Human and Social• Up to 50%
construction time saved by 3D printing
• 163 additional jobs created in Malawi
• Started development of school for 70 students
Human and Social• Increased social
well-being through access to:• work• affordable housing• education
Human and Social• CHF 2k time value
creation per house due to reduced construction time
• CHF 2k increase in social well-being from access to affordable housing
Intellectual• Our brand and
reputation• Our expertise• Policies, controls,
and guidelines
Intellectual• Collaboration with
local NGOs and construction companies
Intellectual• Accelerated GDP
growth in Malawi• Increase in access to
education• Upskilling of local
labor with experience in 3D printing and ink creation
Intellectual• CHF 43k impact from
employee training
AFFORDABLE HOUSING IN MAL AWI – IMPACT PATHWAY
9LafargeHolcim Integrated Profit & Loss Statement 2020
MEASURING OUR RESEARCH & DEVELOPMENT ACTIVITIES CONTINUED
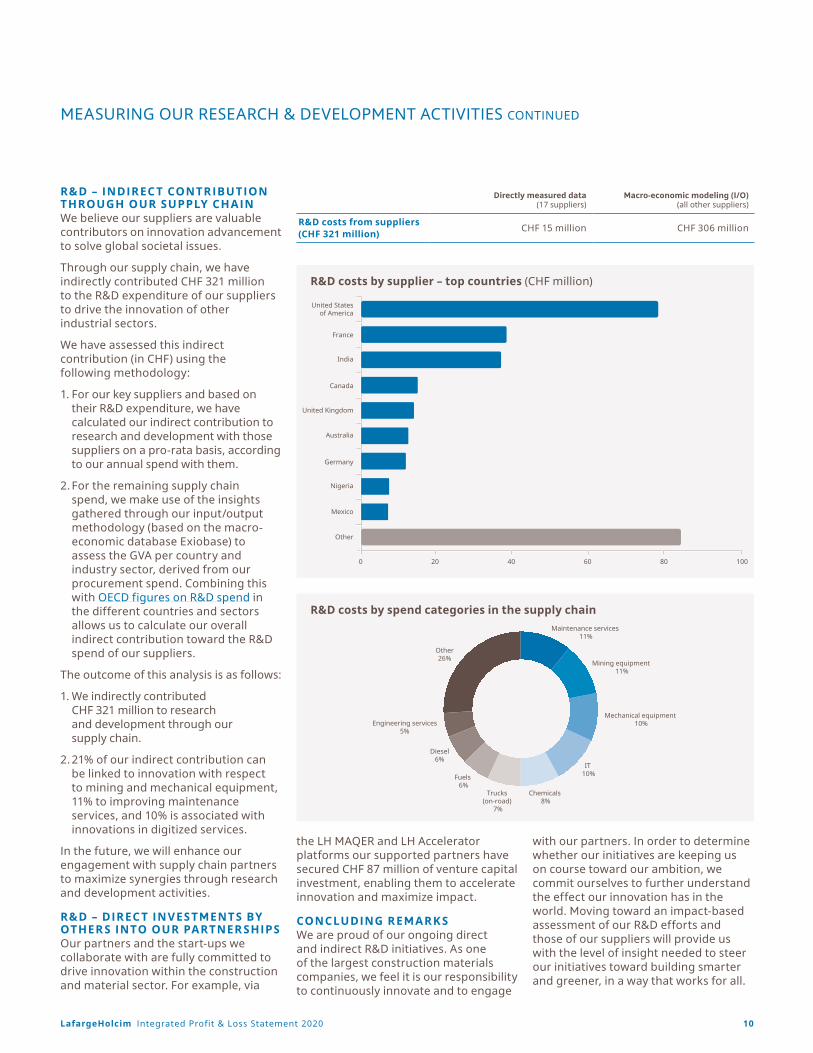
R&D – INDIRECT CONTRIBUTION THROUGH OUR SUPPLY CHAINWe believe our suppliers are valuable contributors on innovation advancement to solve global societal issues.
Through our supply chain, we have indirectly contributed CHF 321 million to the R&D expenditure of our suppliers to drive the innovation of other industrial sectors.
We have assessed this indirect contribution (in CHF) using the following methodology:
1. For our key suppliers and based on their R&D expenditure, we have calculated our indirect contribution to research and development with those suppliers on a pro-rata basis, according to our annual spend with them.
2. For the remaining supply chain spend, we make use of the insights gathered through our input/output methodology (based on the macro-economic database Exiobase) to assess the GVA per country and industry sector, derived from our procurement spend. Combining this with OECD figures on R&D spend in the different countries and sectors allows us to calculate our overall indirect contribution toward the R&D spend of our suppliers.
The outcome of this analysis is as follows:
1. We indirectly contributed CHF 321 million to research and development through our supply chain.
2. 21% of our indirect contribution can be linked to innovation with respect to mining and mechanical equipment, 11% to improving maintenance services, and 10% is associated with innovations in digitized services.
In the future, we will enhance our engagement with supply chain partners to maximize synergies through research and development activities.
R&D – DIRECT INVESTMENTS BY OTHER S INTO OUR PARTNER SHIPSOur partners and the start-ups we collaborate with are fully committed to drive innovation within the construction and material sector. For example, via
the LH MAQER and LH Accelerator platforms our supported partners have secured CHF 87 million of venture capital investment, enabling them to accelerate innovation and maximize impact.
CONCLUDING REMARK SWe are proud of our ongoing direct and indirect R&D initiatives. As one of the largest construction materials companies, we feel it is our responsibility to continuously innovate and to engage
with our partners. In order to determine whether our initiatives are keeping us on course toward our ambition, we commit ourselves to further understand the effect our innovation has in the world. Moving toward an impact-based assessment of our R&D efforts and those of our suppliers will provide us with the level of insight needed to steer our initiatives toward building smarter and greener, in a way that works for all.
Directly measured data (17 suppliers)
Macro-economic modeling (I/O) (all other suppliers)
R&D costs from suppliers (CHF 321 million)
CHF 15 million CHF 306 million
0 20
United Statesof America
France
India
Canada
United Kingdom
Australia
Germany
Nigeria
Mexico
Other
40 60 80 100
R&D costs by supplier – top countries (CHF million)
Maintenance services 11%
Mining equipment 11%
Mechanical equipment 10%
IT 10%
Chemicals 8%
Trucks (on-road)
7%
Fuels 6%
Diesel6%
Engineering services5%
Other26%
R&D costs by spend categories in the supply chain
10LafargeHolcim Integrated Profit & Loss Statement 2020
ANNEX – ASSUMPTIONS USED IN THE IP&L CALCULATIONThe IP&L takes into account the figures and data reported in the LafargeHolcim Integrated Annual Report 2020 and the Sustainability Performance Report 2020. Additionally, we calculate the impact of our upstream supply chain, using an input/output methodology (see Supply chain – upstream below).
During 2021, we will keep enhancing transparency by:
• estimating the impact from our products (downstream supply chain), taking into account the economic benefit to society as well as the associated environmental impacts of the goods and services we sell
• further estimating the impact from R&D activities
• adjusting the IP&L method according to the latest version of the Value Balancing Alliance methodology
SCOPEAligning with Group financial reporting our consolidation scope includes all fully consolidated entities. The list of principal consolidated companies is presented in the LafargeHolcim Integrated Annual Report 2020, page 176. All joint ventures and associates are excluded from this report.
Aligning with the figures in our Sustainability Performance Report 2020, figures for waste and water in own operations include captive power plants.
SUPPLY CHAIN – UPSTREAMThe sum of our total procurement spend (excluding intercompany transfers) has been used to calculate the GVA according to the model 0.1 of the Value Balancing Alliance methodology.
As an organization that purchases goods and services on a global scale, we are committed to determining the impact we are generating throughout our supply chain. We have performed this assessment through an input/output model: Exiobase (version 3.7). This fits our needs best to determine the environmental impact of each
CHF spent in our supply chain. Exiobase has detailed up-to-date environmental impacts for the countries we operate in. Based on this, we were able to calculate the additional air emissions (from NOx, SOx, PM, VOC, Dioxins and furans, Hg, Cd, As, Pb, Cr, and Ni) as well as the water consumption and pollution, land use and waste generated in our supply chain. These figures were built up using as input the expenditure of LafargeHolcim in 30 different spending categories on a country by country basis. To calculate the impact of health and safety incidents in our supply chain, we have used data from the International Labour Organization (ILO) and combined this with the output of the Exiobase calculations.
Aligning with our Sustainability Performance Report 2020, Scope 3 emissions have been assessed according to a methodology aligned with the GCCA and GHG protocols and assured6 by EY (more information in our Sustainability Performance report).
OWN OPER ATIONSFinancial dimensionRetained value (million CHF)The sum of capital retained in the business calculated by taking Recurring EBITDA after leases and subtracting taxes, interest and dividends. The relevant references in the LafargeHolcim Integrated Annual Report 2020 are:
• Recurring EBITDA after leases: CHF 5.61 billion.
• Taxes: CHF 715 million – Consolidated Statement of Cash Flows, page 168.
• Interest: CHF 572 million – Consolidated Statement of Cash Flows, page 168.
• Dividends: CHF 1,503 million – dividends paid from Consolidated Statement of Cash Flows, page 168.
These numbers have been corrected for economic inefficiencies, based on the countries in which LafargeHolcim operates, and based on the Corruption Perceptions Index of 2020.
Socio–economic dimensionMultiplied socio-economic impactsThe multiplier effect of cash transfers to employees (salaries), governments’ direct taxes, finance cost (interest), and shareholders (dividends) has been reflected at a ratio of 1:1 on 2020 expenditure. This number has been corrected for economic inefficiencies, based on the countries in which LafargeHolcim operates, and based on the Corruption Perceptions Index of 2020.
We assume that every Swiss Franc transfer will be spent and therefore contributes to the (local) economy. Even if not all of the money transferred is spent, the assumption of the 1:1 multiplier is justified due to secondary and tertiary socio-economic ripple effects, caused by the cash transfers through enhanced purchasing power.
Social investments (CSR-inclusive business)CSR-drivenHere, we consider the strategic social investment in education projects, community employment projects, community shelter and infrastructure projects, community health projects, community environment projects, community development projects, and donations. For each Swiss Franc invested, an average multiplier effect is considered. This multiplier effect is estimated as follows, based on independent sources:
• Education and community employment projects: Calculated by multiplying actual amount spent in 2020 on education and community employment projects by a factor of 118%. This figure was derived using the assumptions below.
Investments in education generate public returns from higher income levels in the form of income taxes, increased social insurance payments and lower social transfers. We took the global average return on investment (ROI) for education on private and social schooling from a study by G. Psacharopoulos and H.A. Patrinos, 2004.7
6 Refer to the “Assurance statement” of the Sustainability Performance Report 2020, pages 17–18. 7 Source: G. Psacharopoulos and H.A. Patrinos (2004). Returns to Investment in Education: A Further Update. Available at: http://documents.worldbank.org/curated/
en/468021468764713892/pdf/multi-page.pdf.
11LafargeHolcim Integrated Profit & Loss Statement 2020
ANNEX – ASSUMPTIONS USED IN THE IP&L CALCULATION CONTINUED
• Community shelter and infrastructure: Calculated by multiplying the actual amount spent in 2020 on community shelter and infrastructure projects by a factor of 344%. We used the ROIs for infrastructure (250% based on the average factor of a BCG report),8 low-income housing (231%) and sanitation (550%).9
The multiplier for low-income housing was derived from a social ROI on low-income housing evaluated by Salman & Aslam (2009) for a case study in Pakistan.10 The study evaluates the social purpose benefit flow over five years. It takes into account the economic benefits of low-income housing (savings per family household, additional income due to access to mortgage finance, value of new employment generated and potential gains from income-generation programs), but also values social benefits (savings on medical bills due to improved water access, waste management) as well as environmental benefits (cost saving by waste water treatment). The net present value (NPV) of social and environmental benefits was compared to that of project costs (operational and capital costs) to derive the benefit cost ratio ROI of 231%.
For sanitation projects, a study of the WHO (2012) was used which provides insights into the costs and benefits of providing drinking-water supply and sanitation interventions.
• Community environment: Calculated by multiplying the actual amount spent in 2020 on community environment projects by a factor of 250% which is the ROI for infrastructure multiplier. This multiplier was chosen because most of the community environment projects are related to provision of infrastructure.
• Other community development projects: Calculated by multiplying the actual amount spent in 2020 on community development and
other projects by a factor of 267%. This factor was derived using the assumptions below.
To measure the ROI for community development projects, we used the ROIs for infrastructure (250%), education (118%), low-income housing (231%), and sanitation (550%). A weighted average was calculated assuming that education and infrastructure projects account for 30% of community development projects. Further, we assumed that sanitation and low-income housing account for 20%. The resulting multiplier we used for community development ROI is 267%.
• Donations, administration and overheads: Donations (cash and in kind), administration, and overheads have been reflected at a ratio of 1:1 on 2020 expenditure.
For these calculations, we assumed that the benefits of these investments are directly earned in the year of investment. In reality, benefits for society are distributed over several years, but if we assume that these investments occur regularly, then we believe this approach best reflects the social returns.
Inclusive businessCalculated by multiplying the actual amount spent in 2020 on low-income housing projects by 231%, sanitation projects by 550%, and other inclusive business by 267%. These figures were derived using the assumptions below.
For low-income housing projects and sanitation projects, the same factors were used as described previously in the section on community shelter and infrastructure projects.
The multiplier for other inclusive businesses is based on the same multiplier and assumptions as other community development in the strategic social investment section.
Occupational injuriesCalculated by multiplying the number of fatalities and injuries in 2020 per country by a country-specific cost for each of these categories. These figures were derived using the assumptions below.
The figure calculated reflects the economic costs due to injury or loss of life. Costs include social cost for the person affected such as loss of current and future income, and medical costs. Further, we have included the costs for the community, including lost revenue, social welfare payments, and rehabilitation costs.
Costs for the employer were not taken into account, since these are already reflected in the financial section of the IP&L.
For fatalities and injuries, the data was based on an Australian research group (Safe Work Australia 2015).11 The data was adjusted for GDP and inflation, based on the methodology of the Value Balancing Alliance.
Employee educationCalculated by taking into account the total hours of training per country per employee, a country-specific training coefficient, the expected increase in wage due to these trainings, the annual turnover rate, the age of the employees, and the retirement age per country. Based on these numbers, the expected increase in wage was calculated for the people leaving the organization and based on the expected number of years to work, the future enhanced earnings were calculated and discounted to a net present value.
This approach enables us to estimate the wider social benefits of training (i.e. social benefits felt by our former employees). The benefits of training felt by those people who remain at LafargeHolcim will be visible internally through efficiency gains and increased revenues.
8 BCG. The cement sector: a strategic contributor to Europe’s future. Available at: https://cembureau.eu/media/cq5psr22/strategiccontributoreurope_bcg_2013-03-06.pdf.9 G. Hutton (2012). Global costs and benefits of drinking-water supply and sanitation interventions to reach the MDG target and universal coverage. Available at: https://www.
who.int/water_sanitation_health/publications/2012/globalcosts.pdf.10 A. Salman & J. Aslam (2009). Property rights: ensuring wellbeing through low-income housing. Available at: https://acumen.org/wp-content/uploads/2013/03/Property-rights-
for-low-income-housing.pdf.11 The Cost of Work-related Injury and Illness for Australian Employers, Workers and the Community: 2012–13, 2015, Available at: https://www.safeworkaustralia.gov.au/system/
files/documents/1702/cost-of-work-related-injury-and-disease-2012-13.docx.pdf.
12LafargeHolcim Integrated Profit & Loss Statement 2020
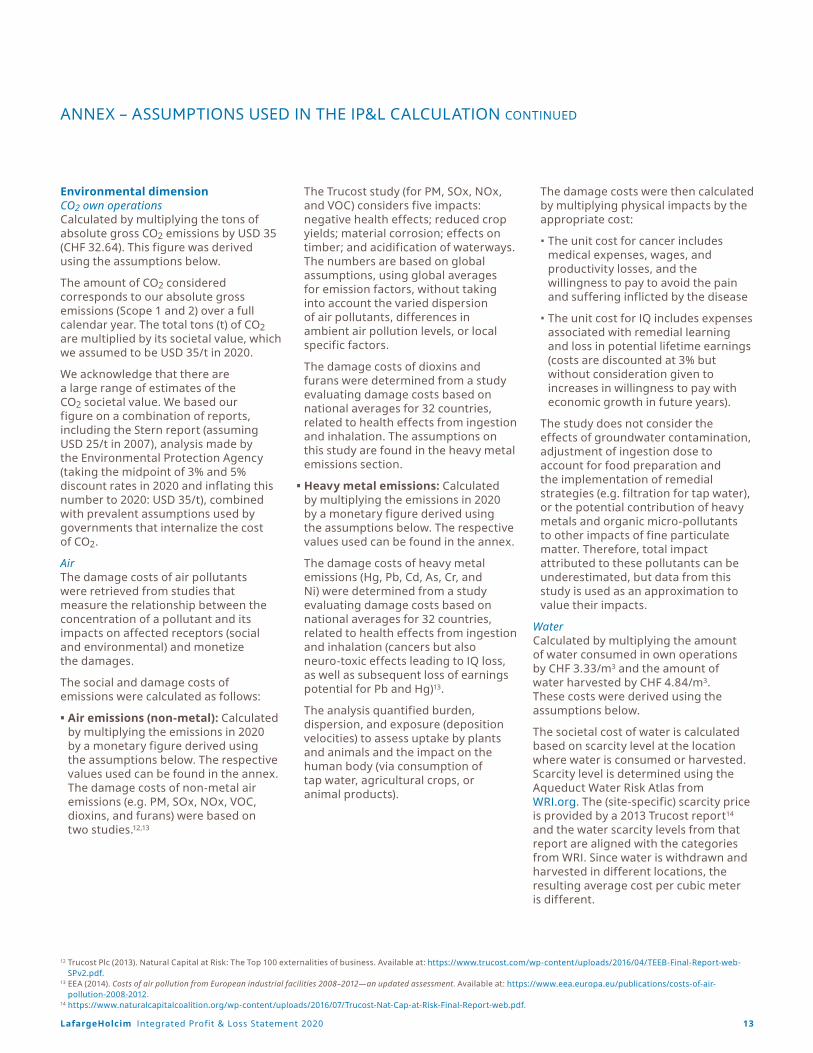
Environmental dimensionCO2 own operationsCalculated by multiplying the tons of absolute gross CO2 emissions by USD 35 (CHF 32.64). This figure was derived using the assumptions below.
The amount of CO2 considered corresponds to our absolute gross emissions (Scope 1 and 2) over a full calendar year. The total tons (t) of CO2 are multiplied by its societal value, which we assumed to be USD 35/t in 2020.
We acknowledge that there are a large range of estimates of the CO2 societal value. We based our figure on a combination of reports, including the Stern report (assuming USD 25/t in 2007), analysis made by the Environmental Protection Agency (taking the midpoint of 3% and 5% discount rates in 2020 and inflating this number to 2020: USD 35/t), combined with prevalent assumptions used by governments that internalize the cost of CO2.
AirThe damage costs of air pollutants were retrieved from studies that measure the relationship between the concentration of a pollutant and its impacts on affected receptors (social and environmental) and monetize the damages.
The social and damage costs of emissions were calculated as follows:
• Air emissions (non-metal): Calculated by multiplying the emissions in 2020 by a monetary figure derived using the assumptions below. The respective values used can be found in the annex. The damage costs of non-metal air emissions (e.g. PM, SOx, NOx, VOC, dioxins, and furans) were based on two studies.12,13
The Trucost study (for PM, SOx, NOx, and VOC) considers five impacts: negative health effects; reduced crop yields; material corrosion; effects on timber; and acidification of waterways. The numbers are based on global assumptions, using global averages for emission factors, without taking into account the varied dispersion of air pollutants, differences in ambient air pollution levels, or local specific factors.
The damage costs of dioxins and furans were determined from a study evaluating damage costs based on national averages for 32 countries, related to health effects from ingestion and inhalation. The assumptions on this study are found in the heavy metal emissions section.
• Heavy metal emissions: Calculated by multiplying the emissions in 2020 by a monetary figure derived using the assumptions below. The respective values used can be found in the annex.
The damage costs of heavy metal emissions (Hg, Pb, Cd, As, Cr, and Ni) were determined from a study evaluating damage costs based on national averages for 32 countries, related to health effects from ingestion and inhalation (cancers but also neuro-toxic effects leading to IQ loss, as well as subsequent loss of earnings potential for Pb and Hg)13.
The analysis quantified burden, dispersion, and exposure (deposition velocities) to assess uptake by plants and animals and the impact on the human body (via consumption of tap water, agricultural crops, or animal products).
The damage costs were then calculated by multiplying physical impacts by the appropriate cost:
• The unit cost for cancer includes medical expenses, wages, and productivity losses, and the willingness to pay to avoid the pain and suffering inflicted by the disease
• The unit cost for IQ includes expenses associated with remedial learning and loss in potential lifetime earnings (costs are discounted at 3% but without consideration given to increases in willingness to pay with economic growth in future years).
The study does not consider the effects of groundwater contamination, adjustment of ingestion dose to account for food preparation and the implementation of remedial strategies (e.g. filtration for tap water), or the potential contribution of heavy metals and organic micro-pollutants to other impacts of fine particulate matter. Therefore, total impact attributed to these pollutants can be underestimated, but data from this study is used as an approximation to value their impacts.
WaterCalculated by multiplying the amount of water consumed in own operations by CHF 3.33/m3 and the amount of water harvested by CHF 4.84/m3. These costs were derived using the assumptions below.
The societal cost of water is calculated based on scarcity level at the location where water is consumed or harvested. Scarcity level is determined using the Aqueduct Water Risk Atlas from WRI.org. The (site-specific) scarcity price is provided by a 2013 Trucost report14 and the water scarcity levels from that report are aligned with the categories from WRI. Since water is withdrawn and harvested in different locations, the resulting average cost per cubic meter is different.
ANNEX – ASSUMPTIONS USED IN THE IP&L CALCULATION CONTINUED
12 Trucost Plc (2013). Natural Capital at Risk: The Top 100 externalities of business. Available at: https://www.trucost.com/wp-content/uploads/2016/04/TEEB-Final-Report-web-SPv2.pdf.
13 EEA (2014). Costs of air pollution from European industrial facilities 2008–2012—an updated assessment. Available at: https://www.eea.europa.eu/publications/costs-of-air-pollution-2008-2012.
14 https://www.naturalcapitalcoalition.org/wp-content/uploads/2016/07/Trucost-Nat-Cap-at-Risk-Final-Report-web.pdf.
13LafargeHolcim Integrated Profit & Loss Statement 2020
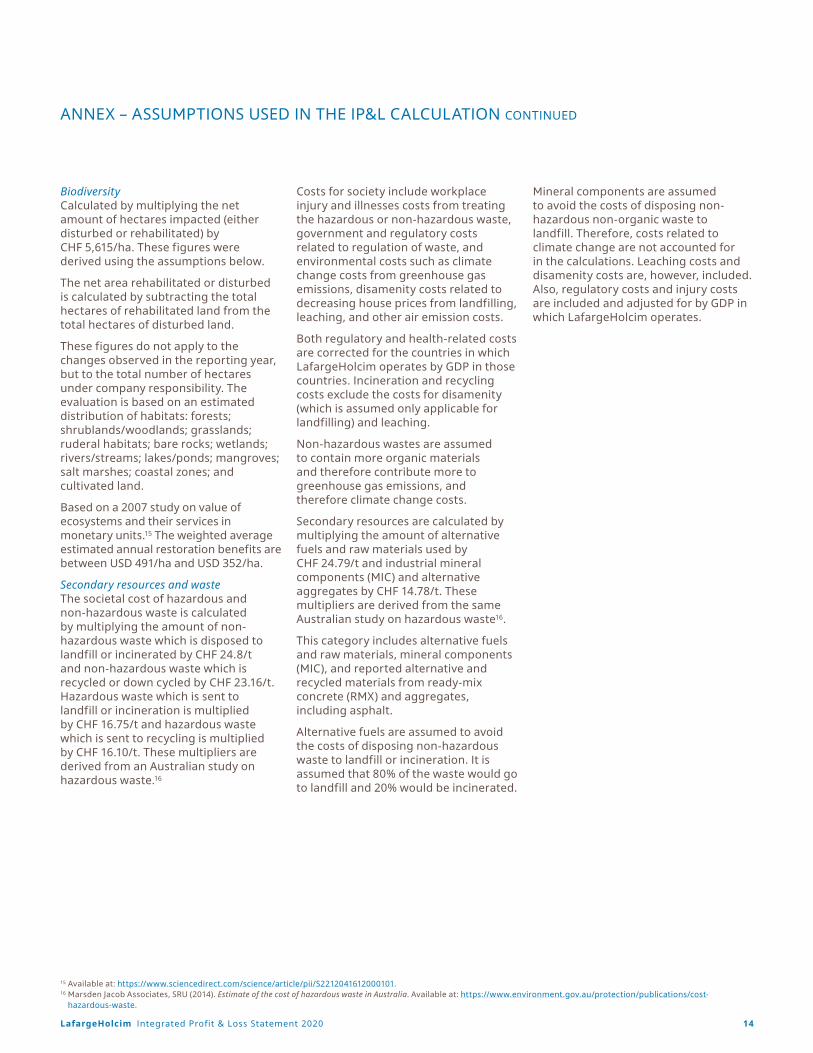
BiodiversityCalculated by multiplying the net amount of hectares impacted (either disturbed or rehabilitated) by CHF 5,615/ha. These figures were derived using the assumptions below.
The net area rehabilitated or disturbed is calculated by subtracting the total hectares of rehabilitated land from the total hectares of disturbed land.
These figures do not apply to the changes observed in the reporting year, but to the total number of hectares under company responsibility. The evaluation is based on an estimated distribution of habitats: forests; shrublands/woodlands; grasslands; ruderal habitats; bare rocks; wetlands; rivers/streams; lakes/ponds; mangroves; salt marshes; coastal zones; and cultivated land.
Based on a 2007 study on value of ecosystems and their services in monetary units.15 The weighted average estimated annual restoration benefits are between USD 491/ha and USD 352/ha.
Secondary resources and wasteThe societal cost of hazardous and non-hazardous waste is calculated by multiplying the amount of non-hazardous waste which is disposed to landfill or incinerated by CHF 24.8/t and non-hazardous waste which is recycled or down cycled by CHF 23.16/t. Hazardous waste which is sent to landfill or incineration is multiplied by CHF 16.75/t and hazardous waste which is sent to recycling is multiplied by CHF 16.10/t. These multipliers are derived from an Australian study on hazardous waste.16
Costs for society include workplace injury and illnesses costs from treating the hazardous or non-hazardous waste, government and regulatory costs related to regulation of waste, and environmental costs such as climate change costs from greenhouse gas emissions, disamenity costs related to decreasing house prices from landfilling, leaching, and other air emission costs.
Both regulatory and health-related costs are corrected for the countries in which LafargeHolcim operates by GDP in those countries. Incineration and recycling costs exclude the costs for disamenity (which is assumed only applicable for landfilling) and leaching.
Non-hazardous wastes are assumed to contain more organic materials and therefore contribute more to greenhouse gas emissions, and therefore climate change costs.
Secondary resources are calculated by multiplying the amount of alternative fuels and raw materials used by CHF 24.79/t and industrial mineral components (MIC) and alternative aggregates by CHF 14.78/t. These multipliers are derived from the same Australian study on hazardous waste16.
This category includes alternative fuels and raw materials, mineral components (MIC), and reported alternative and recycled materials from ready-mix concrete (RMX) and aggregates, including asphalt.
Alternative fuels are assumed to avoid the costs of disposing non-hazardous waste to landfill or incineration. It is assumed that 80% of the waste would go to landfill and 20% would be incinerated.
Mineral components are assumed to avoid the costs of disposing non-hazardous non-organic waste to landfill. Therefore, costs related to climate change are not accounted for in the calculations. Leaching costs and disamenity costs are, however, included. Also, regulatory costs and injury costs are included and adjusted for by GDP in which LafargeHolcim operates.
ANNEX – ASSUMPTIONS USED IN THE IP&L CALCULATION CONTINUED
15 Available at: https://www.sciencedirect.com/science/article/pii/S2212041612000101.16 Marsden Jacob Associates, SRU (2014). Estimate of the cost of hazardous waste in Australia. Available at: https://www.environment.gov.au/protection/publications/cost-
hazardous-waste.
14LafargeHolcim Integrated Profit & Loss Statement 2020
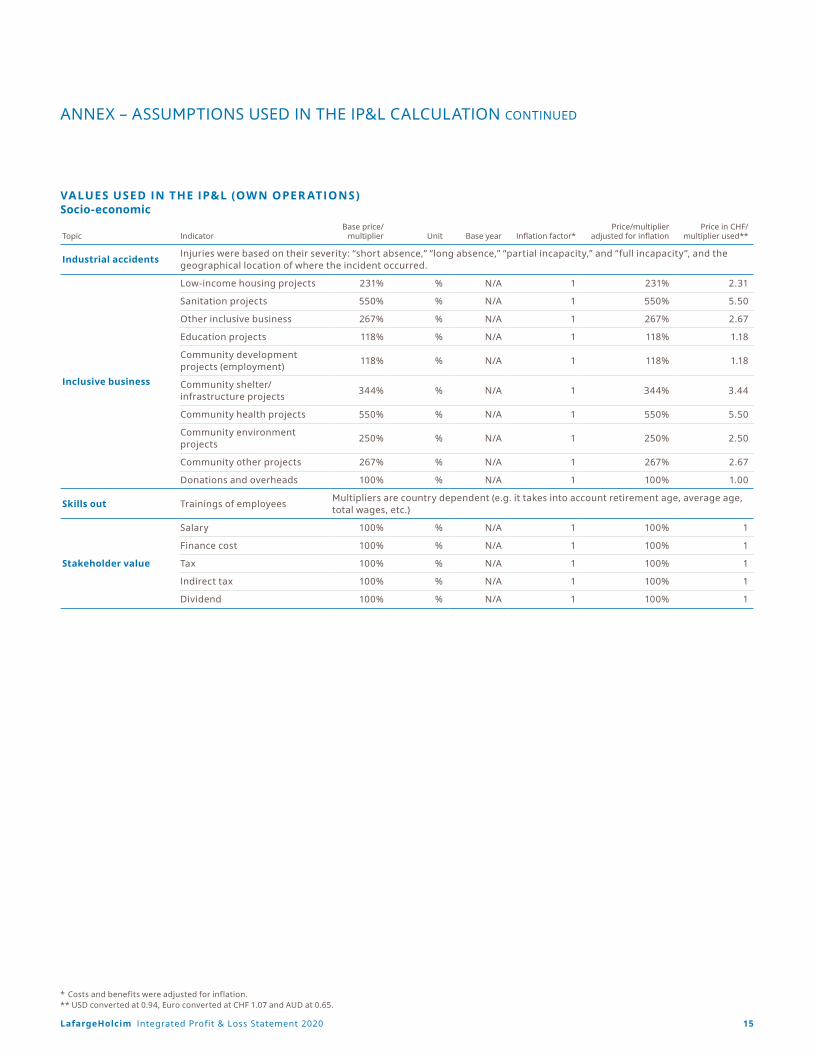
VALUES USED IN THE IP&L (OWN OPER ATIONS)Socio-economic
Topic IndicatorBase price/
multiplier Unit Base year Inflation factor*Price/multiplier
adjusted for inflationPrice in CHF/
multiplier used**
Industrial accidentsInjuries were based on their severity: “short absence,” “long absence,” “partial incapacity,” and “full incapacity”, and the geographical location of where the incident occurred.
Inclusive business
Low-income housing projects 231% % N/A 1 231% 2.31
Sanitation projects 550% % N/A 1 550% 5.50
Other inclusive business 267% % N/A 1 267% 2.67
Education projects 118% % N/A 1 118% 1.18
Community development projects (employment)
118% % N/A 1 118% 1.18
Community shelter/infrastructure projects
344% % N/A 1 344% 3.44
Community health projects 550% % N/A 1 550% 5.50
Community environment projects
250% % N/A 1 250% 2.50
Community other projects 267% % N/A 1 267% 2.67
Donations and overheads 100% % N/A 1 100% 1.00
Skills out Trainings of employeesMultipliers are country dependent (e.g. it takes into account retirement age, average age, total wages, etc.)
Stakeholder value
Salary 100% % N/A 1 100% 1
Finance cost 100% % N/A 1 100% 1
Tax 100% % N/A 1 100% 1
Indirect tax 100% % N/A 1 100% 1
Dividend 100% % N/A 1 100% 1
ANNEX – ASSUMPTIONS USED IN THE IP&L CALCULATION CONTINUED
* Costs and benefits were adjusted for inflation. ** USD converted at 0.94, Euro converted at CHF 1.07 and AUD at 0.65.
15LafargeHolcim Integrated Profit & Loss Statement 2020
ANNEX – ASSUMPTIONS USED IN THE IP&L CALCULATION CONTINUED
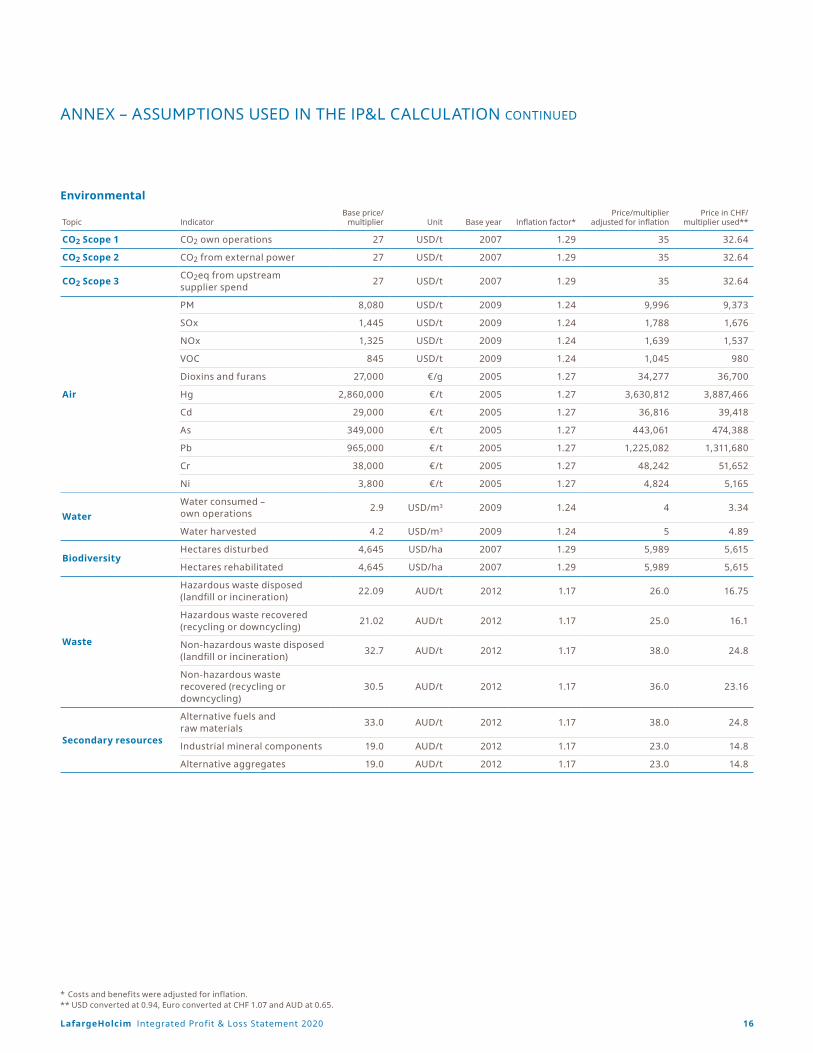
Environmental
Topic IndicatorBase price/
multiplier Unit Base year Inflation factor*Price/multiplier
adjusted for inflationPrice in CHF/
multiplier used**
CO2 Scope 1 CO2 own operations 27 USD/t 2007 1.29 35 32.64
CO2 Scope 2 CO2 from external power 27 USD/t 2007 1.29 35 32.64
CO2 Scope 3 CO2eq from upstream supplier spend
27 USD/t 2007 1.29 35 32.64
Air
PM 8,080 USD/t 2009 1.24 9,996 9,373
SOx 1,445 USD/t 2009 1.24 1,788 1,676
NOx 1,325 USD/t 2009 1.24 1,639 1,537
VOC 845 USD/t 2009 1.24 1,045 980
Dioxins and furans 27,000 €/g 2005 1.27 34,277 36,700
Hg 2,860,000 €/t 2005 1.27 3,630,812 3,887,466
Cd 29,000 €/t 2005 1.27 36,816 39,418
As 349,000 €/t 2005 1.27 443,061 474,388
Pb 965,000 €/t 2005 1.27 1,225,082 1,311,680
Cr 38,000 €/t 2005 1.27 48,242 51,652
Ni 3,800 €/t 2005 1.27 4,824 5,165
Water
Water consumed – own operations
2.9 USD/m3 2009 1.24 4 3.34
Water harvested 4.2 USD/m3 2009 1.24 5 4.89
BiodiversityHectares disturbed 4,645 USD/ha 2007 1.29 5,989 5,615
Hectares rehabilitated 4,645 USD/ha 2007 1.29 5,989 5,615
Waste
Hazardous waste disposed (landfill or incineration)
22.09 AUD/t 2012 1.17 26.0 16.75
Hazardous waste recovered (recycling or downcycling)
21.02 AUD/t 2012 1.17 25.0 16.1
Non-hazardous waste disposed (landfill or incineration)
32.7 AUD/t 2012 1.17 38.0 24.8
Non-hazardous waste recovered (recycling or downcycling)
30.5 AUD/t 2012 1.17 36.0 23.16
Secondary resources
Alternative fuels and raw materials
33.0 AUD/t 2012 1.17 38.0 24.8
Industrial mineral components 19.0 AUD/t 2012 1.17 23.0 14.8
Alternative aggregates 19.0 AUD/t 2012 1.17 23.0 14.8
* Costs and benefits were adjusted for inflation. ** USD converted at 0.94, Euro converted at CHF 1.07 and AUD at 0.65.
16LafargeHolcim Integrated Profit & Loss Statement 2020

Contact us at LafargeHolcim
Sustainable DevelopmentMagali Anderson Phone +41 58 858 [email protected]
Investor RelationsSwetlana IodkoPhone +41 58 858 [email protected]


