Embed Size (px)
Citation preview
Integrating Competing Dimensional Models of Personality:Linking the SNAP, TCI, and NEO Using Item Response Theory
Stephanie D. Stepp and Lan YuUniversity of Pittsburgh School of Medicine
Joshua D. MillerUniversity of Georgia
Michael N. HallquistUniversity of Pittsburgh School of Medicine
Timothy J. TrullUniversity of Missouri
Paul A. PilkonisUniversity of Pittsburgh School of Medicine
Mounting evidence suggests that several inventories assessing both normal personalityand personality disorders measure common dimensional personality traits (i.e., Antag-onism, Constraint, Emotional Instability, Extraversion, and Unconventionality), albeitproviding unique information along the underlying trait continuum. We used Widigerand Simonsen’s (2005) pantheoretical integrative model of dimensional personalityassessment as a guide to create item pools. We then used Item Response Theory (IRT)to compare the assessment of these five personality traits across three establisheddimensional measures of personality: the Schedule for Nonadaptive and AdaptivePersonality (SNAP), the Temperament and Character Inventory (TCI), and the RevisedNEO Personality Inventory (NEO PI-R). We found that items from each inventory maponto these five common personality traits in predictable ways. The IRT analyses,however, documented considerable variability in the item and test information derivedfrom each inventory. Our findings support the notion that the integration of multipleperspectives will provide greater information about personality while minimizing theweaknesses of any single instrument.
Keywords: personality measurement, Item Response Theory
A variety of dimensional personality inven-tories have been advanced by several researchgroups and available data do not clearly supportone proposal over another (Clark, 2007). More-over, many empirical articles attempting to mapthe structure of personality originate from aparticular theory or instrument, with relativelylittle cross-talk among theoretical perspectives
(but see Clark & Livesley, 2002; Widiger,Livesley, & Clark, 2009, for examples). Thereis much evidence to suggest that dimensionalpersonality inventories measure five commonunderlying traits, namely Antagonism, Con-straint, Emotional Instability, Extraversion, andUnconventionality (e.g., see Widiger, 2011a).Widiger and Simonsen (2005) provide a theo-retical framework toward an integrative dimen-sional model of personality, which highlights thiscommon hierarchical structure found across 18different dimensional personality inventories. Wepropose to use Widiger and Simonsen’s (2005)theoretical work as a heuristic to examine the linksbetween three common dimensional personalityinventories: the Schedule for Nonadaptive andAdaptive Personality-2nd edition (SNAP-2; Clark,Simms, Wu, & Casillas, in press), the Tempera-ment and Character Inventory (TCI; Cloninger,Przybeck, Svrakic, & Wetzel, 1994), and the Re-
This article was published Online First November 7, 2011.Stephanie D. Stepp, Lan Yu, Michael N. Hallquist, and
Paul A. Pilkonis, Department of Psychiatry, University ofPittsburgh School of Medicine; Joshua D. Miller, Depart-ment of Psychology, University of Georgia; Timothy J.Trull, Department of Psychological Sciences, University ofMissouri.
Correspondence concerning this article should be ad-dressed to Stephanie D. Stepp, Department of Psychiatry,University of Pittsburgh School of Medicine, Western Psy-chiatric Institute and Clinic, 3811 O’Hara St., Pittsburgh,PA 15213. E-mail: [email protected]
Personality Disorders: Theory, Research, and Treatment © 2011 American Psychological Association2012, Vol. 3, No. 2, 107–126 1949-2715/11/$12.00 DOI: 10.1037/a0025905
107
vised NEO Personality Inventory (NEO PI-R;Costa & McCrae, 1992a).
Common Dimensional Personality Traits
Theoretical and empirical reviews of the la-tent structure of personality provide increasingevidence for the salience of five dimensionalpersonality traits that cut across theoretical per-spectives and inventories (Clark, 2007;Krueger, 2005; Widiger, 2011a). Available ev-idence also supports the notion that abnormaland normal personality share a common hierar-chical structure, with maladaptive traits repre-senting extreme levels of normal traits (Markon,Krueger, & Watson, 2005; O’Connor, 2002). Inaddition, the redundancy across inventories ob-served in several incremental validity studies(e.g., Reynolds & Clark, 2001; Stepp, Trull,Burr, Wolfenstein, & Vieth, 2005) suggests thatintegrating items from competing inventoriesonto a common scale may be the most fruitfulpath for uncovering information about underly-ing personality traits.
Based on a thorough review of the empiricalliterature, Widiger and Simonsen (2005) pro-vided a schematic that maps most of the 18proposals for dimensional personality assess-ment onto five broad traits of Antagonism, Con-straint, Emotional Instability, Extraversion, andUnconventionality. For example, the Mistrustscale from the SNAP and the Agreeablenessscale from the NEO PI-R are hypothesized tomeasure an underlying Antagonism factor. Al-though evidence generally supports the notionof a common latent structure across personalityinventories (Clark & Livesley, 2002; Markon etal., 2005), further study is required to validatethe assertion that a shared factor structure un-derlies most of the 18 dimensional personalityinventories. Moreover, the essential notion thatscales developed from seemingly different the-oretical perspectives are adequately representedby a single dimension needs to be validated. Forexample, does the psychometric evidence sup-port the assertion that items from the NegativeTemperament scale from the SNAP are isomor-phic with items from the Neuroticism scalefrom the NEO PI-R, or are these scales betterconceptualized as two related, but distinct,factors?
In addition to grappling with issues of factorstructure and conceptual isomorphism across
theoretical perspectives, an integrative view ofdimensional personality assessment must ad-dress the pragmatic issue of comparing infor-mation provided by each item from competinginventories to enable researchers and cliniciansto assess personality traits more efficiently, pre-cisely, and flexibly. In view of the shared latentstructure of abnormal and normal personalitytraits, the integration of multiple inventorieswill be best served by a final product that pro-vides information across the range of trait levels(i.e., trait information at normal, subclinical,and clinical levels). Thus, it may be sensible tocombine items from self-report inventories de-veloped to assess maladaptive traits (e.g., theSNAP), with items gleaned from normal per-sonality instruments (e.g., the NEO PI-R), asclinical inventories may provide better informa-tion about extremely high or low trait levels.That said, some have suggested that measuresof maladaptive personality are redundant withnormal personality inventories (Costa & Mc-Crae, 1992b) and some recent evidence sup-ports this assertion (e.g., Walton, Roberts,Krueger, Blonigen, & Hicks, 2008).
Previous research has utilized joint factoranalyses of normal and abnormal personalityinstruments to argue that a common factorstructure underlies different personality inven-tories and that normal and abnormal personalityfall on a common continuum (Markon et al.,2005; Watson, Clark, & Chmielewski, 2008).Although factor analysis is a useful tool forunderstanding whether common traits areshared across personality inventories, it doesnot provide any information about whether ab-normal and normal inventories yield informa-tion at different points along the trait continuum(i.e., ranging from normal to clinical), nor doesit yield detailed feedback about which invento-ries (or items) provide the most informationabout the latent traits.
Item Response Theory
Item Response Theory (IRT) represents aclass of modern psychometric techniques thatmodel levels of a putative latent trait (e.g., Neu-roticism) as a function of item characteristics, inwhich the probability of correct item response ismodeled as a function of latent trait theta (�)and one or more item parameters (Embretson &Reise, 2000; Lord, 1980). Of particular import
108 STEPP ET AL.
to our study, IRT methods provide specificfeedback about the position along �, where eachitem or inventory provides the most psychomet-ric information about the trait. For example, anitem tapping intense expressions of anger (e.g.,throwing objects) would likely provide moreinformation about Emotional Instability at highlevels of � than an item about occasional argu-ments with romantic partners. One advantage ofIRT is that individuals’ � estimates are indepen-dent of the number of items and the specificitems used in the population for calibration.Thus, even when individuals take different setsof items with different response options, (result-ing in different patterns of missingness), thedata can be combined and concurrently cali-brated or linked, estimating item parametersacross three measures within a single latent traitmodel (i.e., on one single computer run; Lord,1980).
Item- and test-information functions in IRTare estimated on the same latent trait scale,yielding psychometric information that is di-rectly comparable across inventories (Reise &Henson, 2003). For example, if one were at-tempting to develop an IRT-informed integra-tive scale of Extraversion, it would be importantto know which items provide maximum infor-mation about the latent trait across the broadestrange of � levels, from extremely shy to ex-tremely outgoing. Because item characteristicestimates are not tied to particular inventories ortheories per se, it is likely that items from sev-eral inventories would provide the most validtrait scale, and inclusion of items from bothnormal and abnormal inventories may be cru-cial to ensure that average and extreme traitlevels are represented. In summary, IRT modelsare ideal for the present purposes because (1)they yield detailed information about the posi-tion along the trait continuum accounted for byparticular inventories (or items from those in-ventories), (2) latent trait estimates for itemsand inventories are directly comparable acrossscales, and (3) they provide specific feedbackabout which tests provide the most valid infor-mation about the underlying traits.
Integrating Dimensional PersonalityInventories
To identify the items that optimally measurefive common dimensional personality traits
from competing dimensional personality assess-ment inventories, we selected three measuresthat represent different approaches to test con-struction: the SNAP-2, which was derived froma bottom-up approach to measure personalitypathology; the TCI, which was rationally de-rived from Cloninger’s (1987) psychobiologicaltheory of personality; and the NEO PI-R, whichwas derived from factor analytic work on nor-mal personality.
Widiger and Simonsen (2005) developed aconceptual framework for creating a pantheo-retical scale for assessing five common person-ality traits. This study sought to extend theirconceptual work by examining how threewidely used personality inventories map on tothese five common personality traits. We soughtto demonstrate that items drawn from differentinventories map onto the five personality traitsas predicted by Widiger and Simonsen (2005)by linking measures using IRT models. To dem-onstrate this, we refined and reorganized thescales to include only the items that providedthe most information about the underlying traitand examined the proportion of items contrib-uted by each inventory in the measurement ofthe underlying trait to determine which inven-tory provided the most information regardingthe underlying trait. For example, does the NEOPI-R provide more information about Conscien-tiousness compared to the SNAP-2 and TCI?Second, we linked these refined item pools fromthe individual inventories to create five pan-theoretical scales that optimally measure Antag-onism, Constraint, Emotion Instability, Extra-version, and Unconventionality. To developthese item pools, we used IRT to identify thebest performing items for each personality traitand linked the SNAP-2, TCI, and NEO PI-R.
Method
Participants and procedures. Partici-pants were recruited from undergraduate psy-chology courses at two universities, psychiatricinpatient, psychiatric outpatient, medical, andcommunity settings. Written informed consentwas obtained from all participants before ad-ministration of the questionnaires. Undergradu-ate student participants were compensated withcredit toward their psychology course grade andpatient and community participants were com-pensated monetarily for their participation.
109LINKING PERSONALITY INVENTORIES
In the student sample (n � 1,517), participantscompleted items from the NEO PI-R, SNAP-2,and TCI. Given the high participant burden in-volved in completing these three personality bat-teries (870 items total), we used a balanced in-complete block design (BIBD; Campbell, Sen-gupta, Santos, & Lorig, 1995; Cochran & Cox,1957; Van de Linden, Veldkamp, & Carlson,2004). This design allowed participants to com-plete a reduced number of items from the threemeasures while allowing us to calibrate our IRTmodels. We created blocks so that each participantwould complete 217 items. The resulting BIBDensured that each item was presented with eachother item an equal number of times withinblocks. To create the BIBD, we first deleted twoitems from the SNAP-2 validity scales (so that thetotal number of items was divisible by 28). Sec-ond, we partitioned the total item pool into 28 setsof 31 items each. Third, we assigned 7 sets to eachparticipant according to BIBD plan 11.39 (p. 482,Cochran & Cox, 1957). There were 36 blocks (b)and each block had 7 sets (k) of items in thisdesign. And there were total of 28 sets (t) of items.Therefore, each set of item had 9 replicates (r)within the 36 blocks. Each participant receivedone booklet with a total of 217 items. Each blockwas administered 42 times (42 administra-tions � 36 blocks � 1, 512 participants) and thefirst five blocks were administered an additionaltime each (1 administration � 5 blocks � 5 par-ticipants), which yielded 1,517 participants. Theoptimal number of participants for this design is5–10 times the number of items any one partici-pant takes, resulting in an optimal sample sizeof 1,000–2,000 for the current study, which al-lowed us to be confident in our parameter estimatewith this level of planned missingness in our de-sign. This BIBD method is commonly used in thefield of educational testing (cf. National Assess-ment of Educational Progress [NAEP]; Rock &Nelson, 1992; Yamamoto & Mazzeo, 1992) and isan appropriate method for using planned missing-ness to reduce the number of items that any oneparticipant is administered (cf. Campbell et al.,1995; Rock & Nelson, 1992; Yamamoto &Mazzeo, 1992).
To augment our student sample, we includedarchival data from three clinical samples con-sisting of psychiatric patients, medical patients,and community participants (n � 400). Thepersonality measures were administered as partof a larger battery of questionnaires and inter-
views regarding interpersonal functioning inPDs. These participants were included to enrichour sample with scores at the higher end of thepersonality dimensions of interest, increasingthe generalizability of our findings. They werenot included in the BIBD. Alternatively, theytook only one of the measures. The inclusion ofthe patient-community participants resulted inmissing data patterns that varied from theplanned missingness in the student sample.However, the large sample allows adequatecoverage of the overall data matrix which en-abled us to estimate the parameters reliably.Specifically, the first sample consisted of psy-chiatric patients that were administered 167items from the NEO PI-R (n � 134),1 the sec-ond sample consisted of psychiatric and medi-cal patients and community participants thatwere administered the TCI (n � 130), and thethird sample consisted of psychiatric outpatientsthat were administered the SNAP-2 (n � 136).
There were 1,917 participants in the total sam-ple, collapsed across the student and patient-community samples. The majority of the samplewas female (64%) and White (85%). Eight per-cent of the sample identified themselves as Afri-can American and 4.3% identified as Asian. Twopercent of the sample identified their ethnicity asHispanic. The mean participant age in the totalsample was 21.9 years (SD � 8.2, range � 18–60). The mean participant age for the three clinicalsamples was 34.47 (SD � 9.37), 38.35(SD � 10.67), and 37.97 (SD � 10.63), who tookthe NEO PI, TCI, and SNAP-2, respectively. Themean participant age for the student samplewas 18.73 (SD � 1.15).
Measures
Schedule for Nonadaptive and AdaptivePersonality-2nd Edition. The SNAP-2 is amultidimensional self-report measure of 12pathological personality traits (e.g., Aggressive-ness, Dependency, Exhibitionism, Workahol-ism, Eccentric Perceptions), as well as the BigThree personality factors (i.e., Positive Affec-tivity, Negative Temperament, and Disinhibi-
1 As a result of using archival data, the earlier version ofthe NEO PI-R, the NEO PI (Costa & McCrae, 1985), wasadministered to the patients in this sample. The 167 itemsfrom the NEO PI that are consistent with those from theNEO PI-R were included in analyses.
110 STEPP ET AL.
tion) that contains 390, true-false self-reportitems. Using items drawn from DSM–III PDcriteria, personality pathology concepts fromother research programs (e.g., psychopathy;Cleckley, 1964), and trait-like symptoms ofAxis I conditions (e.g., dysthymia), raters de-rived 22 item clusters, which were subsequentlyfactor analyzed. Results from exploratory factoranalysis indicated that 12 dimensions of patho-logical personality traits characterized theSNAP items, and the best indicators of thesedimensions were retained to form personalitypathology scales. Subsequent validation of theSNAP indicates the measure has strong psycho-metric properties, is correlated with DSM–IVPDs in predicted ways, and successfully distin-guishes among distinct forms of personality pa-thology (Morey et al., 2003).
Temperament and Character Inventory.The TCI is a 240-item, true-false self-report in-ventory. It is a broadband personality assessmentinstrument developed a priori based on Clon-inger’s (1987) seven-factor psychobiological the-ory of personality, which was strongly influencedby genetic and family studies of personality; lon-gitudinal studies of personality stability andchange; humanistic and transpersonal notions ofpersonality development; and basic conditioning/learning studies in animals and humans (Clon-inger, 1987; Cloninger, Svrakic, & Przybeck,1993). The TCI measures four dimensions of tem-perament (Harm Avoidance, Novelty Seeking,Persistence, and Reward Dependence) and threedimensions of character (Cooperativeness, Self-Directedness, and Self-Transcendence). The sevenmain TCI dimensions comprise 25 facets. TheTCI has generated a large and influential bodyof literature, spanning topics including thegenetic heritability of personality (Ando etal., 2002), personality variability within AxisI diagnoses (e.g., Fassino et al., 2002), andthe impact of personality on psychotherapyoutcome (Joyce, Mulder, McKenzie, Luty, &Cloninger, 2004).
Revised NEO Personality Inventory. TheNEO PI-R is self-report inventory developed tomeasure the Big Five personality domains: Neu-roticism, Extraversion, Openness, Agreeableness,and Conscientiousness. Each of the five broaddomains is divided into six facets and each facet isassessed by eight items. It consists of 240 state-ments for which participants rate their level ofagreement on a 5-point scale, with 1 indicating
strongly agree and 5 indicating strongly disagree.Exploratory factor analyses of large sets of traitadjective self-ratings (e.g., “friendly,” “coura-geous”) or short trait descriptions (e.g., “I am nota worrier.”) consistently yield the Big Five per-sonality domains. Several independent studieshave replicated the essential factor structure of thisinventory (e.g., Savla, Davey, Costa, & Whitfield,2007; Wu, Lindsted, Tsai, & Lee, 2008). TheNEO PI-R has been used extensively in empiricalstudies of normal and abnormal personality (e.g.,Markon et al., 2005; Yamagata et al., 2006), andhas been accepted among many as the dominantBig Five personality assessment instrument(Clark, 2007).
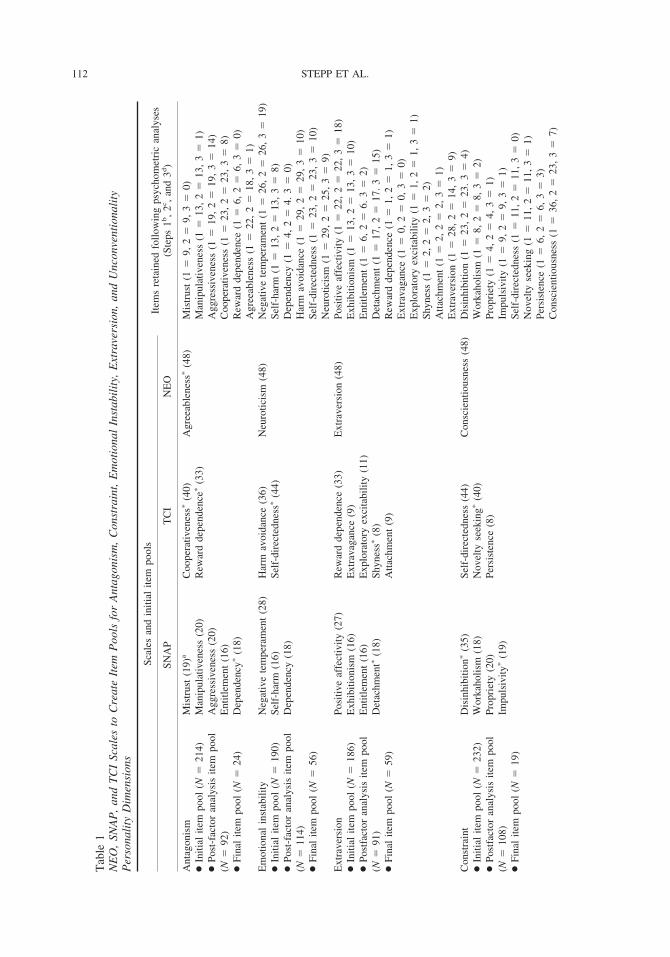
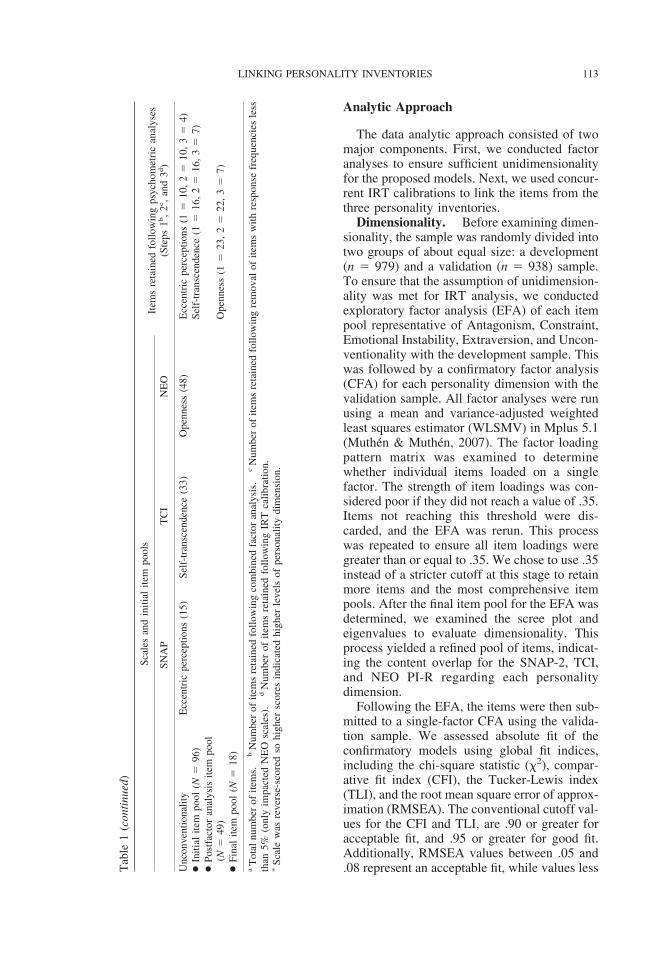
Creating item pools. We used Widiger andSimonsen’s (2005) pantheoretical integrativemodel of personality disorder classification to de-velop item pools for Antagonism, Constraint,Emotional Instability, Extraversion, and Uncon-ventionality from the SNAP-2, TCI, and NEOPI-R. Widiger and Simonsen (2005), classifieditems from these three instruments into the fivescales of interest. Table 1 lists the scales from eachpersonality measure that were used to create thefive item pools. The Entitlement SNAP-2 scalewas included in both Antagonism and Extraver-sion (Widiger & Simonsen, 2005). Table 1 liststhe scales from each personality inventory as wellas the number of items from each of the scalesused in the analyses. The initial item pools con-sisted of a large set of items for each personalitydimension: Antagonism (214 items: 48 NEO, 93SNAP, and 73 TCI items), Constraint (232 items:48 NEO, 92 SNAP, and 92 TCI items), EmotionalInstability (190 items: 48 NEO, 62 SNAP, and 80TCI items), Extraversion (186 items: 48 NEO, 77SNAP, and 61 TCI items), and Unconventionality(96 items: 48 NEO, 15 SNAP, and 33 TCI items).Response frequencies for each item were in-spected before data analysis to ensure that all scalevalues were endorsed by at least 1.0% of thesample.2
2 Additional tables providing item content and responsefrequencies for the Antagonism, Constraint, Emotional In-stability, Extraversion, and Unconventionality initial itempools are available upon request from the correspondingauthor.
111LINKING PERSONALITY INVENTORIES
Tab
le1
NE
O,
SNA
P,
and
TC
ISc
ales
toC
reat
eIt
emP
ools
for
Ant
agon
ism
,C
onst
rain
t,E
mot
iona
lIn
stab
ilit
y,E
xtra
vers
ion,
and
Unc
onve
ntio
nali
tyP
erso
nali
tyD
imen
sion
s
Scal
esan
din
itial
item
pool
sIt
ems
reta
ined
follo
win
gps
ycho
met
ric
anal
yses
(Ste
ps1b
,2c ,
and
3d)
SNA
PT
CI
NE
O
Ant
agon
ism
Mis
trus
t(1
9)a
Coo
pera
tiven
ess�
(40)
Agr
eeab
lene
ss�
(48)
Mis
trus
t(1
�9,
2�
9,3
�0)
●In
itial
item
pool
(N�
214)
Man
ipul
ativ
enes
s(2
0)R
ewar
dde
pend
ence
�(3
3)M
anip
ulat
iven
ess
(1�
13,
2�
13,
3�
1)●
Post
-fac
tor
anal
ysis
item
pool
Agg
ress
iven
ess
(20)
Agg
ress
iven
ess
(1�
19,
2�
19,
3�
14)
(N�
92)
Ent
itlem
ent
(16)
Coo
pera
tiven
ess
(1�
23,
2�
23,
3�
8)●
Fina
lite
mpo
ol(N
�24
)D
epen
denc
y�(1
8)R
ewar
dde
pend
ence
(1�
6,2
�6,
3�
0)A
gree
able
ness
(1�
22,
2�
18,
3�
1)E
mot
iona
lin
stab
ility
Neg
ativ
ete
mpe
ram
ent
(28)
Har
mav
oida
nce
(36)
Neu
rotic
ism
(48)
Neg
ativ
ete
mpe
ram
ent
(1�
26,
2�
26,
3�
19)
●In
itial
item
pool
(N�
190)
Self
-har
m(1
6)Se
lf-d
irec
tedn
ess�
(44)
Self
-har
m(1
�13
,2
�13
,3
�8)
●Po
st-f
acto
ran
alys
isite
mpo
olD
epen
denc
y(1
8)D
epen
denc
y(1
�4,
2�
4.3
�0)
(N�
114)
Har
mav
oida
nce
(1�
29,
2�
29,
3�
10)
●Fi
nal
item
pool
(N�
56)
Self
-dir
ecte
dnes
s(1
�23
,2
�23
,3
�10
)N
euro
ticis
m(1
�29
,2
�25
,3
�9)
Ext
rave
rsio
nPo
sitiv
eaf
fect
ivity
(27)
Rew
ard
depe
nden
ce(3
3)E
xtra
vers
ion
(48)
Posi
tive
affe
ctiv
ity(1
�22
,2
�22
,3
�18
)●
Initi
alite
mpo
ol(N
�18
6)E
xhib
ition
ism
(16)
Ext
rava
ganc
e(9
)E
xhib
ition
ism
(1�
13,
2�
13,
3�
10)
●Po
stfa
ctor
anal
ysis
item
pool
Ent
itlem
ent
(16)
Exp
lora
tory
exci
tabi
lity
(11)
Ent
itlem
ent
(1�
6,2
�6.
3�
2)(N
�91
)D
etac
hmen
t�(1
8)Sh
ynes
s�(8
)D
etac
hmen
t(1
�17
,2
�17
.3
�15
)●
Fina
lite
mpo
ol(N
�59
)A
ttach
men
t(9
)R
ewar
dde
pend
ence
(1�
1,2
�1,
3�
1)E
xtra
vaga
nce
(1�
0,2
�0,
3�
0)E
xplo
rato
ryex
cita
bilit
y(1
�1,
2�
1,3
�1)
Shyn
ess
(1�
2,2
�2,
3�
2)A
ttach
men
t(1
�2,
2�
2,3
�1)
Ext
rave
rsio
n(1
�28
,2
�14
,3
�9)
Con
stra
int
Dis
inhi
bitio
n�(3
5)Se
lf-d
irec
tedn
ess
(44)
Con
scie
ntio
usne
ss(4
8)D
isin
hibi
tion
(1�
23,
2�
23.
3�
4)●
Initi
alite
mpo
ol(N
�23
2)W
orka
holis
m(1
8)N
ovel
tyse
ekin
g�(4
0)W
orka
holis
m(1
�8,
2�
8,3
�2)
●Po
stfa
ctor
anal
ysis
item
pool
Prop
riet
y(2
0)Pe
rsis
tenc
e(8
)Pr
opri
ety
(1�
4,2
�4,
3�
1)(N
�10
8)Im
puls
ivity
�(1
9)Im
puls
ivity
(1�
9,2
�9,
3�
1)●
Fina
lite
mpo
ol(N
�19
)Se
lf-d
irec
tedn
ess
(1�
11,
2�
11,
3�
0)N
ovel
tyse
ekin
g(1
�11
,2
�11
,3
�1)
Pers
iste
nce
(1�
6,2
�6,
3�
3)C
onsc
ient
ious
ness
(1�
36,
2�
23,
3�
7)
112 STEPP ET AL.
Analytic Approach
The data analytic approach consisted of twomajor components. First, we conducted factoranalyses to ensure sufficient unidimensionalityfor the proposed models. Next, we used concur-rent IRT calibrations to link the items from thethree personality inventories.
Dimensionality. Before examining dimen-sionality, the sample was randomly divided intotwo groups of about equal size: a development(n � 979) and a validation (n � 938) sample.To ensure that the assumption of unidimension-ality was met for IRT analysis, we conductedexploratory factor analysis (EFA) of each itempool representative of Antagonism, Constraint,Emotional Instability, Extraversion, and Uncon-ventionality with the development sample. Thiswas followed by a confirmatory factor analysis(CFA) for each personality dimension with thevalidation sample. All factor analyses were runusing a mean and variance-adjusted weightedleast squares estimator (WLSMV) in Mplus 5.1(Muthen & Muthen, 2007). The factor loadingpattern matrix was examined to determinewhether individual items loaded on a singlefactor. The strength of item loadings was con-sidered poor if they did not reach a value of .35.Items not reaching this threshold were dis-carded, and the EFA was rerun. This processwas repeated to ensure all item loadings weregreater than or equal to .35. We chose to use .35instead of a stricter cutoff at this stage to retainmore items and the most comprehensive itempools. After the final item pool for the EFA wasdetermined, we examined the scree plot andeigenvalues to evaluate dimensionality. Thisprocess yielded a refined pool of items, indicat-ing the content overlap for the SNAP-2, TCI,and NEO PI-R regarding each personalitydimension.
Following the EFA, the items were then sub-mitted to a single-factor CFA using the valida-tion sample. We assessed absolute fit of theconfirmatory models using global fit indices,including the chi-square statistic (�2), compar-ative fit index (CFI), the Tucker-Lewis index(TLI), and the root mean square error of approx-imation (RMSEA). The conventional cutoff val-ues for the CFI and TLI, are .90 or greater foracceptable fit, and .95 or greater for good fit.Additionally, RMSEA values between .05 and.08 represent an acceptable fit, while values lessT
able
1(c
onti
nued
)
Scal
esan
din
itial
item
pool
sIt
ems
reta
ined
follo
win
gps
ycho
met
ric
anal
yses
(Ste
ps1b
,2c ,
and
3d)
SNA
PT
CI
NE
O
Unc
onve
ntio
nalit
yE
ccen
tric
perc
eptio
ns(1
5)Se
lf-t
rans
cend
ence
(33)
Ope
nnes
s(4
8)E
ccen
tric
perc
eptio
ns(1
�10
,2
�10
,3
�4)
●In
itial
item
pool
(N�
96)
Self
-tra
nsce
nden
ce(1
�16
,2
�16
,3
�7)
●Po
stfa
ctor
anal
ysis
item
pool
(N�
49)
Ope
nnes
s(1
�23
,2
�22
,3
�7)
●Fi
nal
item
pool
(N�
18)
aT
otal
num
ber
ofite
ms.
bN
umbe
rof
item
sre
tain
edfo
llow
ing
com
bine
dfa
ctor
anal
ysis
.c
Num
ber
ofite
ms
reta
ined
follo
win
gre
mov
alof
item
sw
ithre
spon
sefr
eque
ncie
sle
ssth
an5%
(onl
yim
pact
edN
EO
scal
es).
dN
umbe
rof
item
sre
tain
edfo
llow
ing
IRT
calib
ratio
n.�
Scal
ew
asre
vers
e-sc
ored
sohi
gher
scor
esin
dica
ted
high
erle
vels
ofpe
rson
ality
dim
ensi
on.
113LINKING PERSONALITY INVENTORIES
than .05 indicate a good fit (McDonald & Ho,2002). Given these established standards of CFAfit statistics, we also noted the caution of mechan-ical use of CFA fit criteria as a “permission slip”for modeling data using IRT, because CFA fitresults can be affected dramatically by large num-ber of items and skewed data distributions (Cook,Kallen, & Amtamnn, 2009), which are commoncharacteristics of personality data. For example,Hays and his colleagues (2007) reportedCFI � 0.95 and RMSEA � 0.12 as sufficientlyunidimensional for IRT analysis on their PhysicalFunctioning item bank development. Similarly,Revicki and his colleagues (2009) reportedCFI � 0.902, TLI � 0.991, and RMSEA � 0.156as sufficiently unidimensional for further IRTanalysis. Buysse and his colleagues (2010) re-ported RMSEA � 0.140, TLI � 0.957, andCFI � 0.843 for Sleep Disturbance item bank andRMSEA � 0.157, TLI � 0.955, and CFI � 0.812for Sleep-Related Impairment item bank as suffi-ciently unidimensional for further IRT analysis.Therefore, we also checked the scree plot ofeigenvalues and the ratio of the first two eigenval-ues from EFA in judging unidimensionality. Al-ternatives to the basic one-factor model were con-sidered to improve fit (cf. McHorney & Cohen,2000).
IRT calibration. Following the factoranalyses to determine which items across thethree personality measures were sufficientlyunidimensional for IRT analysis, we further ex-amined item response distributions becauseitem parameter estimates may be biased foritems with sparse cells (Thissen, 2003). Al-though it is common that the item responsedistributions are skewed for questionnaire data,the item response categories with few observa-tions (less than 5% of total frequencies) have tobe combined with their adjacent categories toachieve reliable estimates. We removed thoseitems with at least one response category havingless than 5% of total frequencies to keep theoriginal response scales. Because we had suchlarge item pools, we were able to delete theseitems; there was no need to retain items withsparse cells. Then we concurrently calibrated allitems from each personality dimension of inter-est using the GRM for the NEO PI-R and 2PLfor the SNAP-2 and TCI in Multilog 7.03 (This-sen, 2003). The advantages of this concurrentcalibration include: (1) it retains the integrity ofthe original scale, (2) it allows individuals to
take different sets of items, and (3) it toleratesinventories of differing lengths and rating scales(cf. McHorney & Cohen, 2000; Reise & Waller,2009). The Multilog program for the GRM es-timates a slope (a) parameter and four location(b) parameters for each five-category NEO PI-Ritem. The Multilog program 2PL model esti-mates a slope (a) and one location (b) parameterfor each two-category SNAP-2 and TCI item.
After the initial concurrent calibration, weexamined items in terms of item informationand item content. Items with low item informa-tion were considered to be poor items in IRTcalibration. Item discrimination parameter esti-mates affect an item’s total information func-tion. The higher the discrimination parameter,the more peaked the item information function.Thus, items with discrimination parameter esti-mates less than 1.00 provide little informationand were removed from the item pool. Thereduced item pool was then recalibrated.
Results
Descriptive Statistics
Summed scores of the item pools were com-puted and examined for each personality dimen-sion. The mean of the summed scores for the214 Antagonism items was 41.51 (SD � 14.59)for the total sample, 43.31 (SD � 13.66) for thestudent sample, and 34.42 (SD � 15.97) for thenonstudent sample. The summed score distribu-tions for Antagonism were not significantlyskewed in the total sample or either of thesubsamples when considered separately (totalsample, skew � .27; student sample � .56;nonstudent sample � .08).
The mean of the summed 232 Constraintitems for the total sample was 62.68(SD � 14.51), 64.83 (SD � 14.25) for thestudent sample, and 54.35 (SD � 12.39) for thenonstudent sample. The summed score distribu-tions for Constraint were also not significantlyskewed (total sample, skew � .30; student sam-ple � .38; nonstudent sample � �.20).
For the total sample, the mean of the summedscores for Emotional Instability was 52.61(SD � 31.69), and 47.15 (SD � 14.82)and 73.77 (SD � 59.10) for the student andnonstudent samples, respectively. The summedscore distribution in the total sample for Emo-tional Instability was positively skewed (total
114 STEPP ET AL.
sample, skew � 2.43); however, the distribu-tions were not significantly skewed when exam-ining the subsamples separately (student sam-ple � .73; nonstudent sample � .74).
The mean of the summed scores for the 186Extraversion items was 66.13 (SD � 25.74) forthe total sample, 66.40 (SD � 15.90) for thestudent sample, and 65.06 (SD � 47.40) for thenonstudent sample. The summed score distribu-tions for Extraversion were not significantlyskewed (total sample, skew � .86; student sam-ple � .14; nonstudent sample � .72).
Finally, the mean of the summed 96 Uncon-ventionality items was 48.76 (SD � 33.85) forthe total sample, 46.44 (SD � 12.10) for thestudent sample, and 57.74 (SD � 70.29) for thenonstudent sample. The summed score distribu-tion in the total sample for Unconventionalitywas positively skewed (total sample,skew � 2.13); however, the distributions werenot significantly skewed when examining thesubsamples separately (student sample � .64;nonstudent sample � .78).
Because of the BIBD, internal consistencyreliability coefficients could not be calculatedfor the student sample (i.e., because of plannedmissingness, too few student cases completedall the items from a scale or instrument for � tobe calculated). However, reliability coefficientswere calculated for the nonstudent sample byinstrument within each of the five item banks.For the Antagonism item bank, � � .80 for theNEO items, � � .95 for the SNAP items, and� � .84 for the TCI items. The internal consis-tency coefficients (�) for the Constraint itempool were .83 for the NEO items, .88 for theSNAP items, and .68 for the TCI items. Forthe Emotional Instability item bank, � � .92 forthe NEO items, � � .94 for the SNAP items,and � � .93 for the TCI items. For the Extra-version item bank, � � .87 for the NEO items,� � .94 for the SNAP items, and � � .78 forthe TCI items. Lastly, the internal consistencycoefficients (�) for the Unconventionality itembank were .90 for the NEO items, .86 for theSNAP items, and .85 for the TCI items.
Assessing Dimensionality
For each of the personality dimensions, thescree plot of eigenvalues from the EFA in thedevelopment sample was suggestive of a singlefactor, with the first value larger than the others.
Specifically, the ratio of the first to the secondeigenvalue was greater than 2.0 for all traits:Antagonism (3.10), Constraint (3.54), Emo-tional Instability (3.92), Extraversion (5.90),and Unconventionality (2.03). Although the ra-tio of the first two factors for Unconventionalitywas less than 3, all item loadings were above.35. Specifically, in the final single factor solu-tion, item loadings ranged from .35 to .79 forAntagonism, .35 to .93 for Constraint, .38 to .88for Emotional Instability, .43 to .92 for Extra-version, and .38 to .76 for Unconventionality.
The basic 1-factor CFA model for Extraversionfit well to the validation sample data (CFI � .901,TLI � .930, RMSEA � .035). The RMSEA in-dex indicated at least acceptable fit for the remain-ing four dimensions. However, the CFI/TLIglobal fit indices indicated less than adequate fitfor the basic 1-factor CFA model: Antagonism(CFI � .821, TLI � .838, RMSEA � .031),Constraint (1.85, CFI � .773, TLI � .781,RMSEA � .030), Emotional Instability (2.00,CFI � .861, TLI � .871, RMSEA � .030), andUnconventionality (3.01, CFI � .684, TLI �.696, RMSEA � .046).
Similar to the method used by McHorney andCohen (2000), we next tried alternatives to thebasic 1-factor CFA model. Correlated errorsamong indicators from the same measure werespecified to reflect that some of the covarianceamong the items from the same inventory be-cause of measurement error. The addition ofcorrelations among the residuals of the itemsfrom the same measure (cf. McHorney & Co-hen, 2000) improved the CFI and TLI indexesto acceptable levels: Antagonism (CFI � .900,TLI � .907, RMSEA � .024), Emotional In-stability (CFI � .910, TLI � .909, RMSEA �.027), and Unconventionality (CFI � .957,TLI � .948, RMSEA � .019); with the excep-tion of Constraint (CFI � .884, TLI � .867,RMSEA � .024), where the CFI and TLI in-dexes remained slightly outside the acceptablerange. Although the CFA fit indices wereslightly outside the traditional acceptable range,CFA fit values were found to be sensitive todata distribution and number of items (Cook,Kallen, & Amtmann, 2009). As they suggested,using traditional cutoffs and standards for CFAfit statistics is not recommended for establishingunidimensionality of item banks because theimpact of distribution and item number wasquite large in some cases. We also examined
115LINKING PERSONALITY INVENTORIES
alternative models that posited additional fac-tors (e.g., a model that allowed items fromdifferent measures to load on method factors).These solutions did not yield superior fit relativeto the single-factor model with correlated er-rors. Further, we found in the literature aboutrobustness of item parameter estimation to as-sumptions of unidimensionality: Studies usingmultidimensional data generated by a factor an-alytic approach tend to show that a unidimen-sional IRT model is robust to moderate degreesof multidimensionality (Harrison, 1986; Kirisci,Hsu, & Yu, 2001; Reckase, 1979). Given theEFA results and eigenvalues as well as CFAcutoff values used in previous IRT studies, wejudged these results overall provide sufficientevidence of unidimensionality.
Based on these results, we determined 92Antagonism, 108 Constraint, 114 Emotional In-stability, 91 Extraversion, and 49 Unconven-tionality items were sufficiently unidimensionalfor IRT analysis (Reeve et al., 2007; Tate, 2003;Zwick & Velicer, 1986). Table 1 delineates thename of the scales as well as the number ofitems retained from each of these scales follow-ing the factor analyses. These item pools re-flected the overlapping content in the SNAP-2,TCI, and NEO PI-R. Specifically, the three mea-sures overlapped in measuring anger and verbaland physical aggression for Antagonism; premed-itation and perseverance for Constraint; stress sus-ceptibility, negative affectivity, and impulsivenessfor Emotional Instability; high activity, positiveaffectivity, and sociability for Extraversion; andcuriosity, unusual experiences, and connectednessfor Unconventionality.
IRT Calibration
For item response frequency distribution ex-aminations, all items having at least one re-sponse category with less than 5% of total fre-quencies were NEO items. This was expectedsince NEO had 5 response categories while TCIand SNAP had only 2 response categories.Thirty-six NEO items were removed according-ly: 4 items from Antagonism, 13 items fromConstraint, 4 items from Emotional Instabil-ity, 14 items from Extraversion, and 1 item fromUnconventionality. Using the items banks se-lected from the factor analyses for each person-ality dimension, the slope estimates from theinitial concurrent calibration indicated a wide
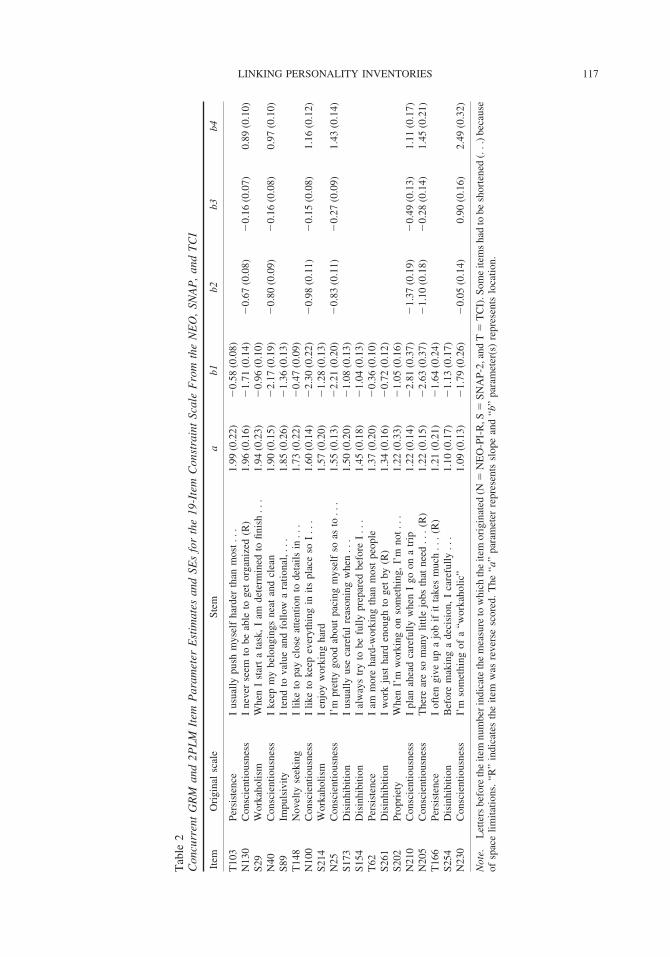
range of item discrimination for Antagonism(as � .48–2.51), Constraint (as � .42–2.05),Emotional Instability (as � .55–2.75), Extra-version (as � .64–2.93), and Unconventionality(as � .38–1.58), with many items providingpoor discrimination (i.e., as � 1.0). Based onthese item parameters, we further reduced thenumber of items to yield a final number of itemsfor each trait: Antagonism (24 items; 1 NEO, 15SNAP, and 8 TCI items), Constraint (19items; 7 NEO, 8 SNAP, and 4 TCI items),Emotional Instability (56 items; 9 NEO, 27SNAP, and 20 TCI items), Extraversion (59items; 9 NEO, 45 SNAP, and 5 TCI items), andUnconventionality (18 items; 7 NEO, 4 SNAP,and 7 TCI items). For illustrative purposes, Ta-ble 2 provides the parameter estimates and theirstandard errors from the final concurrent cali-brations in rank order of their slope parameterestimates for the Constraint domain. The pa-rameter estimates for the remaining domains areavailable upon request from the first author. Theitems retained for each scale maintained a rea-sonable balance of content and provided ade-quate coverage for the dimensions of interest.Interestingly, the final calibration for each of thepersonality dimensions contains items from allthree measures, which suggests that each mea-sure provides some utility in measuring the un-derlying trait. The slope estimates of the finalitem pools for Antagonism (as � 1.11–3.93),Constraint (as � 1.09–1.99), Emotional Insta-bility (as � 1.00 –2.59), Extraversion(as � 1.04 –3.03), and Unconventionality(as � 1.07–2.45) indicated considerable varia-tion in item discrimination. The location param-eters for the Antagonism (bs � �1.70–2.04),Constraint (bs � �2.81–2.49), Emotional Insta-bility (bs � �2.75–2.57), Extraversion (bs ��2.70 –1.90), and Unconventionality (bs ��2.50–1.61) reflect a sizable range of the un-derlying personality dimension of interest.
Next, we compared the psychometric infor-mation at the test level. One of the advantagesof concurrent calibration is that all three mea-sures are on the same metric. For each of thepersonality dimensions, the test informationcurves (see Figure 1) were plotted for the threemeasures separately and combined. Panel 1adisplays the test information curves for Antag-onism. For these three measures, the TCI pro-vided the most information, followed by theSNAP-2. However, the SNAP-2 covered a
116 STEPP ET AL.
Tab
le2
Con
curr
ent
GR
Man
d2P
LM
Item
Par
amet
erE
stim
ates
and
SEs
for
the
19-I
tem
Con
stra
int
Scal
eF
rom
the
NE
O,
SNA
P,
and
TC
I
Item
Ori
gina
lsc
ale
Stem
ab1
b2b3
b4
T10
3Pe
rsis
tenc
eI
usua
llypu
shm
ysel
fha
rder
than
mos
t...
1.99
(0.2
2)�
0.58
(0.0
8)N
130
Con
scie
ntio
usne
ssI
neve
rse
emto
beab
leto
get
orga
nize
d(R
)1.
96(0
.16)
�1.
71(0
.14)
�0.
67(0
.08)
�0.
16(0
.07)
0.89
(0.1
0)S2
9W
orka
holis
mW
hen
Ist
art
ata
sk,
Iam
dete
rmin
edto
finis
h..
.1.
94(0
.23)
�0.
96(0
.10)
N40
Con
scie
ntio
usne
ssI
keep
my
belo
ngin
gsne
atan
dcl
ean
1.90
(0.1
5)�
2.17
(0.1
9)�
0.80
(0.0
9)�
0.16
(0.0
8)0.
97(0
.10)
S89
Impu
lsiv
ityI
tend
tova
lue
and
follo
wa
ratio
nal,
...
1.85
(0.2
6)�
1.36
(0.1
3)T
148
Nov
elty
seek
ing
Ilik
eto
pay
clos
eat
tent
ion
tode
tails
in..
.1.
73(0
.22)
�0.
47(0
.09)
N10
0C
onsc
ient
ious
ness
Ilik
eto
keep
ever
ythi
ngin
itspl
ace
soI
...
1.60
(0.1
4)�
2.30
(0.2
2)�
0.98
(0.1
1)�
0.15
(0.0
8)1.
16(0
.12)
S214
Wor
kaho
lism
Ien
joy
wor
king
hard
1.57
(0.2
0)�
1.28
(0.1
3)N
25C
onsc
ient
ious
ness
I’m
pret
tygo
odab
out
paci
ngm
ysel
fso
asto
...
1.55
(0.1
3)�
2.21
(0.2
0)�
0.83
(0.1
1)�
0.27
(0.0
9)1.
43(0
.14)
S173
Dis
inhi
bitio
nI
usua
llyus
eca
refu
lre
ason
ing
whe
n..
.1.
50(0
.20)
�1.
08(0
.13)
S154
Dis
inhi
bitio
nI
alw
ays
try
tobe
fully
prep
ared
befo
reI
...
1.45
(0.1
8)�
1.04
(0.1
3)T
62Pe
rsis
tenc
eI
amm
ore
hard
-wor
king
than
mos
tpe
ople
1.37
(0.2
0)�
0.36
(0.1
0)S2
61D
isin
hibi
tion
Iw
ork
just
hard
enou
ghto
get
by(R
)1.
34(0
.16)
�0.
72(0
.12)
S202
Prop
riet
yW
hen
I’m
wor
king
onso
met
hing
,I’
mno
t...
1.22
(0.3
3)�
1.05
(0.1
6)N
210
Con
scie
ntio
usne
ssI
plan
ahea
dca
refu
llyw
hen
Igo
ona
trip
1.22
(0.1
4)�
2.81
(0.3
7)�
1.37
(0.1
9)�
0.49
(0.1
3)1.
11(0
.17)
N20
5C
onsc
ient
ious
ness
The
rear
eso
man
ylit
tlejo
bsth
atne
ed..
.(R
)1.
22(0
.15)
�2.
63(0
.37)
�1.
10(0
.18)
�0.
28(0
.14)
1.45
(0.2
1)T
166
Pers
iste
nce
Iof
ten
give
upa
job
ifit
take
sm
uch
...
(R)
1.21
(0.2
1)�
1.64
(0.2
4)S2
54D
isin
hibi
tion
Bef
ore
mak
ing
ade
cisi
on,
Ica
refu
lly..
.1.
10(0
.17)
�1.
13(0
.17)
N23
0C
onsc
ient
ious
ness
I’m
som
ethi
ngof
a“w
orka
holic
”1.
09(0
.13)
�1.
79(0
.26)
�0.
05(0
.14)
0.90
(0.1
6)2.
49(0
.32)
Not
e.L
ette
rsbe
fore
the
item
num
ber
indi
cate
the
mea
sure
tow
hich
the
item
orig
inat
ed(N
�N
EO
-PI-
R,S
�SN
AP-
2,an
dT
�T
CI)
.Som
eite
ms
had
tobe
shor
tene
d(.
..)
beca
use
ofsp
ace
limita
tions
.“R
”in
dica
tes
the
item
was
reve
rse
scor
ed.
The
“a”
para
met
erre
pres
ents
slop
ean
d“b
”pa
ram
eter
(s)
repr
esen
tslo
catio
n.
117LINKING PERSONALITY INVENTORIES
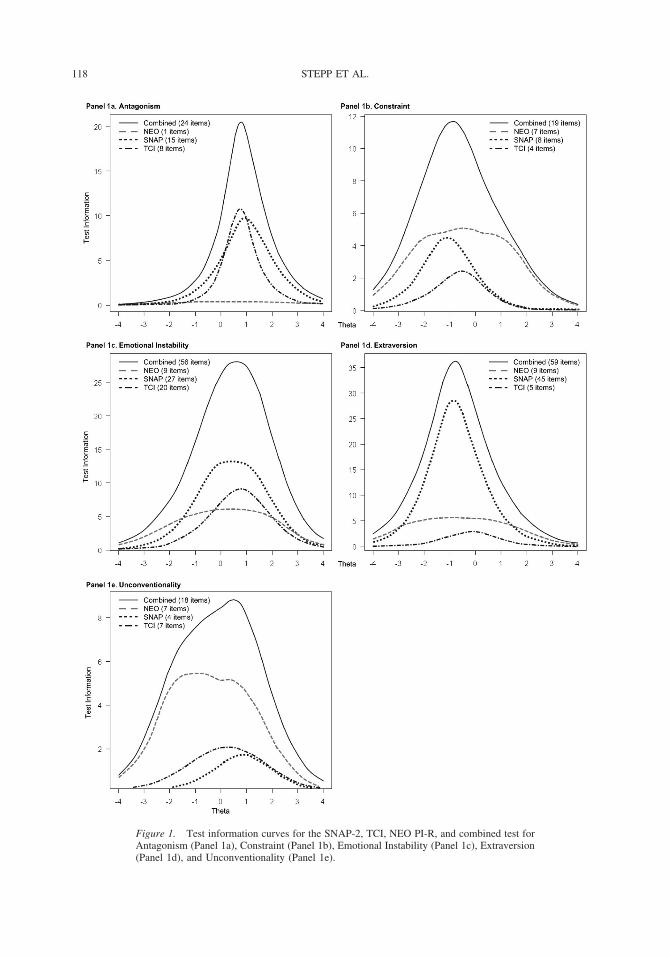
Figure 1. Test information curves for the SNAP-2, TCI, NEO PI-R, and combined test forAntagonism (Panel 1a), Constraint (Panel 1b), Emotional Instability (Panel 1c), Extraversion(Panel 1d), and Unconventionality (Panel 1e).
118 STEPP ET AL.
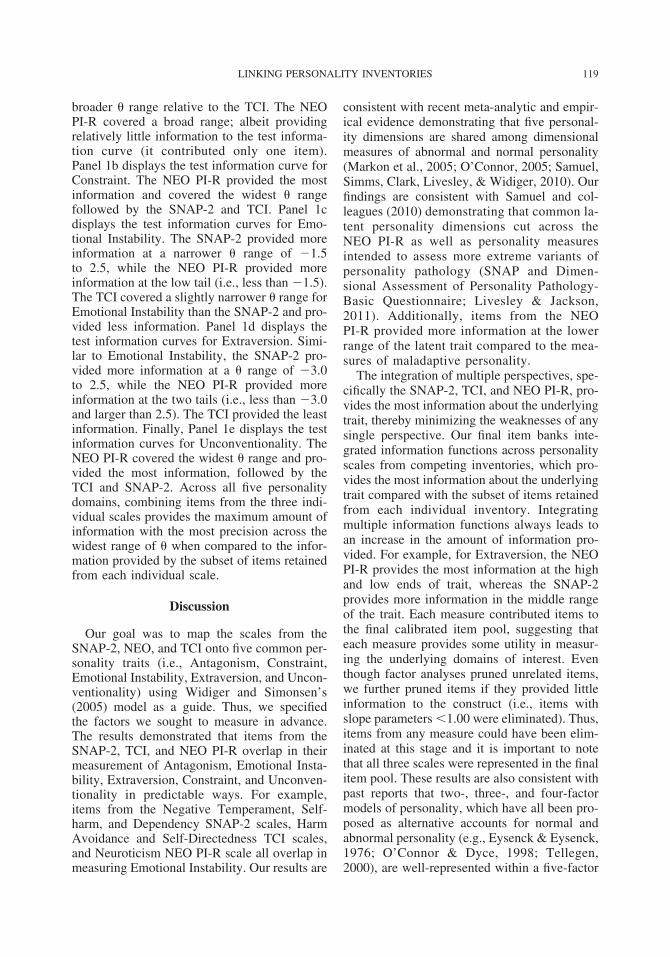
broader � range relative to the TCI. The NEOPI-R covered a broad range; albeit providingrelatively little information to the test informa-tion curve (it contributed only one item).Panel 1b displays the test information curve forConstraint. The NEO PI-R provided the mostinformation and covered the widest � rangefollowed by the SNAP-2 and TCI. Panel 1cdisplays the test information curves for Emo-tional Instability. The SNAP-2 provided moreinformation at a narrower � range of �1.5to 2.5, while the NEO PI-R provided moreinformation at the low tail (i.e., less than �1.5).The TCI covered a slightly narrower � range forEmotional Instability than the SNAP-2 and pro-vided less information. Panel 1d displays thetest information curves for Extraversion. Simi-lar to Emotional Instability, the SNAP-2 pro-vided more information at a � range of �3.0to 2.5, while the NEO PI-R provided moreinformation at the two tails (i.e., less than �3.0and larger than 2.5). The TCI provided the leastinformation. Finally, Panel 1e displays the testinformation curves for Unconventionality. TheNEO PI-R covered the widest � range and pro-vided the most information, followed by theTCI and SNAP-2. Across all five personalitydomains, combining items from the three indi-vidual scales provides the maximum amount ofinformation with the most precision across thewidest range of � when compared to the infor-mation provided by the subset of items retainedfrom each individual scale.
Discussion
Our goal was to map the scales from theSNAP-2, NEO, and TCI onto five common per-sonality traits (i.e., Antagonism, Constraint,Emotional Instability, Extraversion, and Uncon-ventionality) using Widiger and Simonsen’s(2005) model as a guide. Thus, we specifiedthe factors we sought to measure in advance.The results demonstrated that items from theSNAP-2, TCI, and NEO PI-R overlap in theirmeasurement of Antagonism, Emotional Insta-bility, Extraversion, Constraint, and Unconven-tionality in predictable ways. For example,items from the Negative Temperament, Self-harm, and Dependency SNAP-2 scales, HarmAvoidance and Self-Directedness TCI scales,and Neuroticism NEO PI-R scale all overlap inmeasuring Emotional Instability. Our results are
consistent with recent meta-analytic and empir-ical evidence demonstrating that five personal-ity dimensions are shared among dimensionalmeasures of abnormal and normal personality(Markon et al., 2005; O’Connor, 2005; Samuel,Simms, Clark, Livesley, & Widiger, 2010). Ourfindings are consistent with Samuel and col-leagues (2010) demonstrating that common la-tent personality dimensions cut across theNEO PI-R as well as personality measuresintended to assess more extreme variants ofpersonality pathology (SNAP and Dimen-sional Assessment of Personality Pathology-Basic Questionnaire; Livesley & Jackson,2011). Additionally, items from the NEOPI-R provided more information at the lowerrange of the latent trait compared to the mea-sures of maladaptive personality.
The integration of multiple perspectives, spe-cifically the SNAP-2, TCI, and NEO PI-R, pro-vides the most information about the underlyingtrait, thereby minimizing the weaknesses of anysingle perspective. Our final item banks inte-grated information functions across personalityscales from competing inventories, which pro-vides the most information about the underlyingtrait compared with the subset of items retainedfrom each individual inventory. Integratingmultiple information functions always leads toan increase in the amount of information pro-vided. For example, for Extraversion, the NEOPI-R provides the most information at the highand low ends of trait, whereas the SNAP-2provides more information in the middle rangeof the trait. Each measure contributed items tothe final calibrated item pool, suggesting thateach measure provides some utility in measur-ing the underlying domains of interest. Eventhough factor analyses pruned unrelated items,we further pruned items if they provided littleinformation to the construct (i.e., items withslope parameters �1.00 were eliminated). Thus,items from any measure could have been elim-inated at this stage and it is important to notethat all three scales were represented in the finalitem pool. These results are also consistent withpast reports that two-, three-, and four-factormodels of personality, which have all been pro-posed as alternative accounts for normal andabnormal personality (e.g., Eysenck & Eysenck,1976; O’Connor & Dyce, 1998; Tellegen,2000), are well-represented within a five-factor
119LINKING PERSONALITY INVENTORIES
model hierarchy (Digman, 1997; Markon et al.,2005).
Comparing the SNAP, TCI, and NEO
Our data analytic strategy enabled us to di-rectly compare scales from the SNAP-2, TCI,and NEO PI-R by linking the scales to the samemetric. We retained items from each of theinventories that provided the best psychometricinformation to represent the five personalitytraits. By putting items across inventories on thesame underlying latent trait scale, we were ableto provide information to researchers and clini-cians regarding the “best” functioning itemsfrom each of the three inventories. We did notintend to create a new measure based on thesethree inventories, rather to provide informationacross them.
The results demonstrated the relativestrengths and weaknesses of the SNAP-2, TCI,and NEO PI-R when measuring Antagonism,Constraint, Emotional Instability, Extraversion,and Unconventionality as separate personalitydimensions. Specifically, the SNAP-2 and TCIprovided information at narrower bands of � forall personality traits relative to the NEO PI-Rwith the exception of Antagonism. Moreover,the SNAP-2 provided more information at nar-row bands of Antagonism, Emotional Instabil-ity, and Extraversion relative to the NEO PI-R.Additionally, the NEO PI-R provided the mostinformation across all bands of Constraint andUnconventionality relative to the SNAP-2 andTCI. Lastly, the TCI provided the most infor-mation for Antagonism but provided the leastinformation for Constraint, Emotion Instability,and Extraversion compared to the SNAP-2 andNEO PI-R. The TCI provided more informationand measured a wider range of Unconvention-ality relative to the SNAP-2 but not the NEOPI-R.
A comparison of item parameters also dem-onstrated that the NEO PI-R items covered awider � range than SNAP-2 and TCI itemsacross four personality traits. This can be partlyattributed to the structure of the measure. Poly-tomous response items generally cover a widertheta range than dichotomous items since eachpolytomous response item can be treated as aseries of dichotomous items. However, thisstructural difference does not fully account forour findings because increasing the number of
categorical responses does not uniformly in-crease the information for � levels over theentire � range (Muraki, 1993). Moreover, infor-mation from different items, even if indicatorshave different response options, when com-bined in an item pool allows us to directlycompare the information provided by the differ-ent scales. Each NEO item is spread out acrossfour decision points (Strongly Disagree vs. Dis-agree; Disagree vs. Neutral; Neutral vs. Agree;and Agree vs. Strongly Agree). Thus, each NEOitem can be thought of as 4 binary discrimina-tors (k-1 response options). When NEO, SNAP,and TCI indicators comprise an item pool, weare able to compare the aggregate informationprovided by all the items from the scale (testinformation curve). Concurrent calibration en-sured that items from different measures couldbe compared on the same metric. Although thetest information is a sum of individual iteminformation, which means that the height of theinformation curve is often affected by the num-ber of items included in the item pool, this doesnot inevitably mean that the more items in-cluded, the more information the corresponding“test” will have. With IRT, a longer test doesnot provide more information than a shorter test(Embretson & Reise, 2000).
By combining items from different scales, weare able to provide more information about theunderlying construct than any one scale. Thisobservation is important because many person-ality assessments are created with little cross-talk between them. This has resulted in a pleth-ora of personality inventories often viewed ascompeting for “favored” status. However, wehave demonstrated that, by using IRT calibra-tions across different instruments, we canequate them on the same metric and measure thebroadest range of theta with the most precisionwhen compared with any one instrument inisolation.
Constructs of Antagonism, Constraint,Emotional Instability, Extraversion, andUnconventionality
In addition to demonstrating the relativestrengths and weaknesses of the SNAP-2, TCI,and NEO PI-R, latent trait models inform ourunderstanding of the constructs of interest. Thefactor analyses and concurrent calibrationsculled items from all inventories that did not
120 STEPP ET AL.
sufficiently overlap, which ensured the finalitem pool was representative of the unidimen-sional latent trait. Our results distilled core fea-tures of the construct, while culling peripheralaspects.
Antagonism. The majority of the Antago-nism items measured argumentativeness (e.g.,“I often get into arguments with my family andfriends”), physical aggression (e.g., “When I getangry, I am often ready to hit someone”), ani-mosity (e.g., “I enjoy getting revenge on peoplewho hurt me”), and self-centeredness (e.g.,“Some people think I am selfish and egotisti-cal”). The original set of items were from theAggressiveness and Manipulativeness SNAP-2scales, the Cooperativeness TCI scale, and theAgreeableness NEO PI-R scale (i.e., NEO PI-Rfacets: Trust, Straightforwardness, Altruism,Compliance, and Modesty). However, the finalcalibrated scale only contained one item fromthe NEO PI-R Antagonism scale. Contrary toWidiger and Simonsen’s (2005) predictions, noitems from the Reward Dependence TCI scale,Entitlement and Dependency SNAP-2 scales,and the Tender-mindedness facet of the Agree-ableness NEO PI-R scale were represented inthe final item pool. Interestingly, a relativelylarge number of items were dropped from theAntagonism item pool because items factorloadings were �.35, indicating that the Antag-onism construct does not appear to be as unidi-mensional when compared with the other per-sonality domains across the NEO, SNAP, andTCI.
Constraint. The majority of the Constraintitems measured premeditation (e.g., “I planahead carefully when I go on a trip”), persever-ance (e.g., “When I start a task, I am determinedto finish it”), and diligence (e.g., “I enjoy work-ing hard”). Items from the final pool origi-nated from the Workaholism, Impulsivity,Propriety, and Disinhibition SNAP-2 scales,Novelty Seeking and Self-Directedness TCIscales, and Conscientiousness NEO PI-Rscale (i.e., all facets: Competence, Order, Du-tifulness, Achievement Striving, Self-Disci-pline, and Deliberation). At least one itemfrom all proposed overlapping scales wererepresented in the final pool.
Emotional Instability. The preponderanceof Emotional Instability items measure stresssusceptibility (e.g., “I sometimes get too upsetmy minor setbacks”), anxiety (e.g., “I often feel
nervous and stressed”), depression (e.g., “Irarely feel lonely or blue” [reverse-scored]),anger (e.g., “My anger frequently gets the betterof me”), impulsivity (e.g., “Sometimes I get soupset, I feel like hurting myself”), helplessness(e.g., “I often feel that I am the victim of cir-cumstance”), and self-consciousness (e.g., “Iusually stay away from social situations”). Thefinal item pool contained items from the Nega-tive Temperament and Self-harm SNAP-2scales, Harm Avoidance and Self-DirectednessTCI scales, and the Neuroticism NEO PI-Rscale (i.e., all facets: Anxiety, Hostility, Depres-sion, Self-Consciousness, Impulsiveness, andVulnerability). The Dependency SNAP-2 scalewas not represented in the final item pool,which suggests that indecisiveness may not bebest understood as part of the Emotional Insta-bility construct.
Extraversion. The majority of Extraver-sion items measured high activity (e.g., “Mostdays I have a lot of ‘pep’ or vigor”), positiveaffectivity (e.g., “I laugh easily”), and sociabil-ity (e.g., “I go out of my way to meet people”).At least one item was represented from thePositive Affectivity, Exhibitionism, Entitle-ment, and Detachment SNAP-2 scales, theReward Dependence, Exploratory Excitabil-ity, and Shyness TCI scales, and the Extra-version NEO PI-R scale (i.e., all facets:Warmth, Gregariousness, Assertiveness, Ac-tivity, Excitement-Seeking, and PositiveEmotions). Contrary to Widiger and Simons-en’s (2005) predictions, the ExtravaganceTCI scale was not represented in the finalitem pool. This finding suggests that the easewith which one spends money may not be animportant aspect of the Extraversion con-struct.
Unconventionality. The preponderance ofUnconventionality items measured intellectualcuriosity (e.g., “I am intrigued by the patterns Ifind in art”), unusual experiences, (e.g., “Some-times I have this strange experience in whichthings seem “more real’ than usual”) and con-nectedness (e.g., “I sometimes feel so connectedto nature that everything seems to be part of oneliving organism”). As predicted by Widiger andSimonsen (2005) items in our final pool origi-nated from the Eccentric Perceptions SNAP-2scale, Self-Transcendence TCI scale, and Open-ness NEO PI-R scale (i.e., NEO PI-R facets:Ideas, Aesthetics, and Feelings). Three Open-
121LINKING PERSONALITY INVENTORIES
ness facets were not represented in the final itempool: Values, Fantasy, and Actions. IncludingUnconventionality in a dimensional model ofpersonality pathology is somewhat controver-sial because it is not clear that this construct isrelevant to personality pathology (O’Connor &Dyce, 1998; Watson et al., 2008; Watson,Clark, & Harkness, 1994). However, our find-ings are consistent with Widiger (2011b) andsuggest that certain facets from the OpennessNEO PI-R scale (i.e., Ideas, Aesthetics, andFeelings) can be linked with more extreme un-usual experiences as measured with the Eccen-tric Perceptions SNAP-2 scale. Future researchwith this scale is required to determine its va-lidity for psychotic features that may be impor-tant markers for particular manifestations ofpersonality pathology (e.g., Schizotypal PD).
Additional information regarding the natureof the underlying traits can be found by exam-ining the individual item distributions andtest information curves. For Constraint, Emo-tional Instability, Extraversion, and Unconven-tionality, the frequency distributions for indi-vidual items were approximately normal andresulting test information curves were also ap-proximately normally distributed (peaks of thedistributions range from approximately �1 forConstraint to 1 for Extraversion and Unconven-tionality). However, the frequency distributionsfor individual items in our final Antagonismitem bank were positively skewed despite ourattempt to enrich the sample at the ceiling withclinical patients. Thus, the test informationcurves for the SNAP-2, TCI, NEO PI-R, andcombined test were displaced to the right, withmore information and precision provided in themoderate to marked ranges (approximately 0 to�2 SD). It might seem as though it is appropri-ate to identify low threshold Antagonism items;however, it is unclear if such items would mea-sure the same construct as problematic, higherlevels of Antagonism. Reis and Waller (2009)observe that peaked and (most often positively)skewed information functions for clinical scalesare indicative of an underlying “quasi-trait.” Asa result, the construct may be less informative atthe low end of the scale. Thus, low antagonismmay not reflect cooperativeness/amicability butsomething entirely different, such as flexibilityto engage in a wide range of interpersonal be-havior. Reis and Waller note that quasi-traitshave implications for many IRT applications.
Specifically, finding items that provide informa-tion across the entire range of Antagonismcould prove difficult, which poses complica-tions for computer adaptive testing. This statusalso has implications for measuring change asextremely different precision for individuals ex-ists at different ranges of Antagonism.
Nosological Implications
The best classification scheme for personalitydisorders (PDs) is the topic of considerable de-bate (Clark, 2007). Overwhelming evidence in-dicates that the dominant psychiatric nosology,the DSM–IV–TR (American Psychiatric Associ-ation, 2000), which divides personality pathol-ogy into 10 separate diagnoses, fails to alignwith empirical classification research (e.g.,Krueger, 2005; Livesley, 2001; O’Connor,2005), and few clinicians or researchers main-tain that the DSM–IV PD taxonomy adequatelycaptures the range of personality pathology(Westen, 1997; Zimmerman et al., 2005).
Dimensional classification of PDs has beenproposed as an attractive alternative approachbecause it addresses most of the limitations ofthe current categorical system (Widiger & Trull,2007). Conceptualizing an individual’s person-ality as a multidimensional profile composed ofdistinct traits explains the co-occurrence amongPDs as a function of shared trait liabilities, andheterogeneity within a disorder reflects differ-ential interactions among traits (Krueger &Markon, 2006). Additionally, dimensional mod-els preserve information about subclinical man-ifestations of personality pathology that mayhave significant functional consequences, suchas excessive alcohol use and social maladjust-ment (Bagge et al., 2004; Stepp, Trull, & Sher,2005). Several dimensional models have beenexplicitly developed to assess a wide range ofmaladaptive personality traits. Morey and col-leagues (2007) demonstrated the incrementalvalidity of these approaches over the extantdiagnostic system.
Our current work demonstrates the advan-tages of linking competing personality invento-ries into an integrated framework. By linkinginventories from different perspectives, we candevelop a comprehensive classification systemthat capitalizes on the strengths of differentinventories. For example, because the NEOPI-R provided information at the low end of
122 STEPP ET AL.
Emotional Instability and the SNAP-2 providedmore information in more moderate and highranges of Emotional Instability, integratingitems from both of these models provides themost information along the personality traitcontinuum when compared with the subset ofitems from any one inventory. This finding isconsistent with previous work demonstratingequivocal results when pitting one modelagainst another (Harkness & McNulty, 1994;Morey et al., 2007; Reynolds & Clark, 2001;Stepp et al., 2005). Thus, it seems that selectinga single inventory to serve as our future taxon-omy would result in a classification system thatleaves out meaningful aspects of personality.
Our data analytic strategy illustrates IRT asone tool that can be used for linking personalityinventories to develop an improved measure-ment system for personality traits. IRT modelsyield information about the position on the per-sonality trait continuum where each item andinventory provides maximum psychometric in-formation about the trait. This could enable usto develop an empirically informed measure-ment system that contains items that tap thelow, middle, and high ranges of each trait. Forexample, a comprehensive inventory for Extra-version might include items that assess low(e.g., “I am a ‘people person’”), middle (e.g., “Iprefer to start conversations, rather than waitingfor others to talk to me”), and high (e.g., “I oftenfeel as if I’m bursting with energy”) ranges ofthe trait. Future research can develop cut-pointsalong the trait continuum to aid in clinical de-cision-making.
Limitations
We were only able to link a small subset ofthe 18 competing dimensional personality in-ventories in the current study. However, giventhat we have now integrated the SNAP-2, TCI,and NEO PI-R, we will be able to forge ahead.As participants in future studies complete atleast one of the measures we have already con-currently calibrated in addition to another per-sonality inventory (e.g., MPQ, DAPP-BQ), wewill be able to link the additional personalityinventory to the current scales. As more inven-tories are linked and we are able to directlycompare each inventory, we will learn about thebest path for a future integrative measurement
tool and refine our understanding of the under-lying traits.
Although this linking approach based on con-current IRT calibration can be used to create anew integrated inventory, we did not intend tocreate a new inventory based on these threecommercially available inventories. Rather, weintended to provide researchers information onthe item performance form each of these threeinventories with advantages and disadvantagesof each inventories.
Potential biases can sometimes be intro-duced by combining samples (cf. Waller,2008). We wanted to bolster our student sam-ple with psychiatric patient samples to expandthe potential range of scores that would beendorsed. For IRT purposes, we felt that thepotential increase in range of scores by alsousing patients outweighed the concerns ofcommingling the samples.
Future Directions for PersonalityAssessment
Our next set of objectives includes validatingthe integrated item banks by demonstratingtheir utility in predicting social functioning andtreatment response compared with already ex-isting measures of personality, including theextant classification system for personality dis-orders. One of the advantages to our approach isthat we can further refine these item pools. Thepredictive utility of these refined item banksshould also be tested against existing measures.
In summary, we encourage researchers tocontinue to investigate the utility of integrativepersonality inventories. We believe this ap-proach provides the most information along theentire personality trait continuum and will yieldthe most comprehensive, flexible, and preciseinventory. This approach brings together theo-ries and inventories that are distinct but containsignificant overlap. For this reason we feel thatan integrative dimensional personality inven-tory will generate novel empirical studies andrefine our understanding of underlying person-ality traits.
References
American Psychiatric Association. (2000). Diagnos-tic and statistical manual of mental disorders (4th
123LINKING PERSONALITY INVENTORIES
ed. revised). Washington, DC: American Psychi-atric Association.
Ando, J., Ono, Y., Yoshimura, K., Onoda, N., Shi-nohara, M., Kanba, S., & Asai, M. (2002). Thegenetic structure of Cloninger’s seven-factormodel of temperament and character in a Japanesesample. Journal of Personality, 70, 583–609. doi:10.1111/1467-6494.05018
Bagge, C., Nickell, A., Stepp, S., Durrett, C., Jack-son, K., & Trull, T. J. (2004). Borderline person-ality disorder features predict negative outcomes 2years later. Journal of Abnormal Psychology, 113,279–288. doi:10.1037/0021-843X.113.2.279
Buysse, D. J., Yu, L., Moul, D. E., Germain, A.,Stover, A., Dodds, N. E., . . . Pilkonis, P. A.(2010). Development and validation of Patient-Reported Outcome Measures for sleep disturbanceand sleep-related impairments. Sleep, 33, 781–792.
Campbell, B. F., Sengupta, S., Santos, C., & Lorig,K. R. (1995). Balanced incomplete block design:Description, case study and implications for prac-tice. Health Education Quarterly, 22, 201–210.
Clark, L. A. (2007). Assessment and diagnosis ofpersonality disorder: Perennial issues and anemerging reconceptualization. Annual Review ofPsychology, 58, 227–257. doi:10.1146/annurev-.psych.57.102904.190200
Clark, L. A., & Livesley, W. J. (2002). Two ap-proaches to identifying the dimensions of person-ality disorder: Convergence on the five-factormodel. In P. T. Costa & T. A. Widiger (Eds.),Personality disorders and the five-factor model ofpersonality (2nd ed., pp. 161–176). Washington,DC: American Psychological Association.
Clark, L. A., Simms, L. J., Wu, K. D., & Casillas, A.(in press). Schedule for Nonadaptive and AdaptivePersonality: Manual for administration, scoring,and interpretation (2nd ed.). Minneapolis, MN:University of Minnesota Press.
Cleckley, H. (1964). The mask of sanity (4th ed.). St.Louis, MO: Mosby.
Cloninger, C. R. (1986). A unified biosocial theory ofpersonality and its role in the development ofanxiety states. Psychiatric Developments, 4, 167–226.
Cloninger, C. R. (1987). A systematic method forclinical description and classification of personal-ity variants: A proposal. Archives of General Psy-chiatry, 44, 573–588.
Cloninger, C. R., Przybeck, T. R., & Svrakic,D. M. (1994). The Temperament and CharacterInventory (TCI): A guide to its development anduse. St. Louis, MO: Centre for Psychobiology ofPersonality.
Cloninger, C. R., Svrakic, D. M., & Przybeck, T. R.(1993). A psychobiological model of temperamentand character. Archives of General Psychiatry, 50,975–990.
Cochran, W. G., & Cox, G. M. (1957). Experimentaldesigns. New York, NY: Wiley.
Cook, K. F., Kallen, M. A., & Amtmann, D. (2009).Having a fit: Fit statistics for simulated and actualdata fit statistics for IRT models. Quality of LifeResearch, 18, 447–460. doi:10.1007/s11136-009-9464-4
Costa, P. T., & McCrae, R. R. (1985). The NEOPersonality Inventory manual. Odessa, FL: Psy-chological Assessment Resources.
Costa, P. T., & McCrae, R. R. (1992a). NEO PI-Rprofessional manual. Odessa, FL: PsychologicalAssessment Resources, Inc.
Costa, P. T., & McCrae, R. R. (1992b). “‘Normal’personality inventories in clinical assessment:General requirements and the potential for usingthe NEO Personality Inventory”: Reply. Psycho-logical Assessment, 4, 20–22. doi:10.1037/1040-3590.4.1.20
Digman, J. M. (1997). Higher-order factors of theBig Five. Journal of Personality and Social Psy-chology, 73, 1246 –1256. doi:10.1037/0022-3514.73.6.1246
Embretson, S. E., & Reise, S. P. (2000). Item Re-sponse Theory for psychologists. Mahwah, NJ: Er-lbaum.
Eysenck, H. J., & Eysenck, S. B. G. (1976). Psychoti-cism as a dimension of personality. New York,NY: Crane, Russak, & Company.
Fassino, S., Abbate-Daga, G., Amianto, F., Leom-bruni, P., Boggio, S., & Rovera, G. G. (2002).Temperament and character profile of eating dis-orders: A controlled study with the Temperamentand Character Inventory. The International Jour-nal of Eating Disorders, 32, 412– 425. doi:10.1002/eat.10099
Harkness, A. R., & McNulty, J. L. (1994). The Per-sonality Psychopathology Five (PSY-5): Issuesfrom the pp. of a diagnostic manual instead of adictionary. In S. Strack & M. Lorr (Eds.), Differ-entiating normal and abnormal personality (1sted., pp. 291–315). New York, NY: Springer
Harrison, D. A. (1986). Robustness of IRT parameterestimation to violations of the unidimensionalityassumption. Journal of Educational Statistics, 11,91–115. doi:10.2307/1164972
Hays, R. D., Liu, H., Spritzer, K., & Cella, D. (2007).Item response theory analyses of physical func-tioning items in the medical outcomes study. Med-ical Care, 45, S32–S38. doi:10.1097/01.mlr.0000246649.43232.82
Joyce, P. R., Mulder, R. T., McKenzie, J. M., Luty,S. E., & Cloninger, C. R. (2004). Atypical depres-sion, atypical temperament and a differential anti-depressant response to fluoxetine and nortriptyline.Depression and Anxiety, 19, 180 –186. doi:10.1002/da.20001
124 STEPP ET AL.
Kirisci, L., Hsu, T., & Yu, L. (2001). Robustness ofitem parameter estimation programs to assump-tions of unidimensionality and normality. AppliedPsychological Measurement, 25, 146–162. doi:10.1177/01466210122031975
Krueger, R. F. (2005). Continuity of axes I and II:Toward a unified model of personality, personalitydisorders, and clinical disorders. Journal of Per-sonality Disorders, 19, 233–261. doi:10.1521/pedi.2005.19.3.233
Krueger, R. F., & Markon, K. E. (2006). Reinterpret-ing comorbidity: A model-based approach to un-derstanding and classifying psychopathology. An-nual Review of Clinical Psychology, 2, 111–133.doi:10.1146/annurev.clinpsy.2.022305.095213
Livesley, W. J. (2001). Conceptual and taxonomicissues. In W. J. Livesley (Ed.), Handbook of per-sonality disorders (pp. 3–38). New York, NY:Guilford Press.
Livesley, W. J., & Jackson, D. N. (2009). Dimen-sional Assessment of Personality Pathology-BasicQuestionnaire. Port Huron, MI: Research Psychol-ogists Press.
Lord, F. M. (1980). Applications of item responsetheory to practical testing problems. Hillsdale, NJ:Erlbaum.
Markon, K. E., Krueger, R. F., & Watson, D. (2005).Delineating the structure of normal and abnormalpersonality: An integrative hierarchical approach.Journal of Personality and Social Psychology, 88,139–157. doi:10.1037/0022-3514.88.1.139
McDonald, R. P., & Ho, M. H. (2002). Principles andpractice in reporting structural equation analyses.Psychological Methods, 7, 64–82. doi:10.1037/1082-989X.7.1.64
McHorney, C. A., & Cohen, A., S. (2000). Equatinghealth status measures with item response theory:Illustration with functional status items. MedicalCare, 38, 11– 45. doi:10.1097/00005650-200009002-00008
Morey, L. C., Hopwood, C. J., Gunderson, J. G.,Skodol, A. E., Shea, M. T., Yen, S., . . .McGlashan, T. H. (2007). Comparison of alterna-tive models for personality disorders. Psychologi-cal Medicine, 37, 983–994. doi:10.1017/S0033291706009482
Morey, L. C., Warner, M. B., Shea, M. T., Gunder-son, J. G., Sanislow, C. A., Grilo, C., . . .McGlashan, T. H. (2003). The representation offour personality disorders by the Schedule forNonadaptive and Adaptive Personality dimen-sional model of personality. Psychological Assess-ment, 15, 326 –332. doi:10.1037/1040-3590.15.3.326
Muraki, E. (1993). Information functions of the gen-eralized partial credit model. Applied Psychologi-cal Measurement, 17, 351–363. doi:10.1177/014662169301700403
Muthen, B., du Toit, S. H. C., & Spisic, D. (1997).Robust inference using weighted least squares andquadratic estimating equations in latent variablemodeling with categorical and continuous out-comes. Unpublished Technical Report.
O’Connor, B. P. (2002). The search for dimensionalstructure differences between normality and abnor-mality: A statistical review of published data onpersonality and psychopathology. Journal of Per-sonality and Social Psychology, 83, 962–982. doi:10.1037/0022-3514.83.4.962
O’Connor, B. P. (2005). A search for consensus onthe dimensional structure of personality disorders.Journal of Clinical Psychology, 61, 323–345. doi:10.1002/jclp.20017
O’Connor, B. P., & Dyce, J. A. (1998). A test ofmodels of personality disorder configuration. Jour-nal of Abnormal Psychology, 107, 3–16. doi:10.1037/0021-843X.107.1.3
Reckase, M. D. (2009). Multidimensional item re-sponse theory. New York, NY: Srpinger. doi:10.1007/978-0-387-89976-3
Reeve, B. B., Hays, R. D., Bjorner, J. B., Cook, K. F.,Crane, P. K., Teresi, J. A., . . . Cella, D. (2007).Psychometric evaluation and calibration of health-related quality of life item banks: Plans for thepatient-reported outcomes measurement informa-tion system (PROMIS). Medical Care, 45, s22–s31. doi:10.1097/01.mlr.0000250483.85507.04
Reise, S. P., & Henson, J. M. (2003). A discussion ofmodern versus traditional psychometrics as ap-plied to personality assessment scales. Journal ofPersonality Assessment, 81, 93–103. doi:10.1207/S15327752JPA8102_01
Reise, S. P., & Waller, N. G. (2009). Item responsetheory and clinical measurement. Annual Reviewof Clinical Psychology, 5, 25–46.
Revicki, D. A., Chen, W.-H., Harnam, N., Cook, K.,Amtmann, D., Callahan, L. F., . . . Keefe, F. J.(2009). Development and psychometric analysis ofthe PROMIS pain behavior item bank. Pain, 146,158–169. doi:10.1016/j.pain.2009.07.029
Reynolds, S. K., & Clark, L. A. (2001). Predictingdimensions of personality disorder from domainsand facets of the Five-Factor Model. Journal ofPersonality, 69, 199 –222. doi:10.1111/1467-6494.00142
Rock, D. A., & Nelson, J. (1992). Applications andextensions of NAEP concepts and technology.Journal of Educational Statistics, 17, 219–232.doi:10.2307/1165171
Samuel, D. B., Simms, L. J., Clark, L. E., Livesley,W. J., & Widiger, T. A. (2010). An item responsetheory integration of normal and abnormal person-ality scales. Personality Disorders: Theory, Re-search, and Treatment, 1, 5–21. doi:10.1037/a0018136
125LINKING PERSONALITY INVENTORIES
Savla, J., Davey, A., Costa, P. T., & Whitfield, K. E.(2007). Replicating the NEO PI-R factor structurein African-American older adults. Personality andIndividual Differences, 43, 1279 –1288. doi:10.1016/j.paid.2007.03.019
Stepp, S. D., Trull, T. J., Burr, R. M., Wolfenstein,M., & Vieth, A. Z. (2005). Incremental validity ofthe Structured Interview for the Five-Factor Modelof personality (SIFFM). European Journal of Per-sonality, 19, 343–357. doi:10.1002/per.565
Stepp, S. D., Trull, T. J., & Sher, K. J. (2005).Borderline personality features predict alcohol useproblems. Journal of Personality Disorders, 19,711–722. doi:10.1521/pedi.2005.19.6.711
Tate, R. (2003). A comparison of selected empir-ical methods for assessing the structure of re-sponses to test items. Applied PsychologicalMeasurement, 27, 159 –203. doi:10.1177/0146621603027003001
Tellegen, A. (2000). Manual of the MultidimensionalPersonality Questionnaire. Minneapolis, MN:University of Minnesota Press.
Thissen, D. (2003). MULTILOG 7: Multiple categor-ical item analysis and test scoring using item re-sponse theory [computer program]. Chicago, IL:Scientific Software.
Thissen, D., & Wainer, H. (Eds.). (2001). Test scor-ing. Mahwah, NJ: Erlbaum.
Van de Linden, W. J., Veldkamp, B. P., & Carlson,J. E. (2004). Optimizing balanced incompleteblock designs for educational assessments. AppliedPsychological Measurement, 28, 317–331. doi:10.1177/0146621604264870
Waller, N. G. (2008). Commingled Samples: A Ne-glected Source of Bias in Reliability Analysis.Applied Psychological Measurement, 32, 211–223. doi:10.1177/0146621607300860
Walton, K. E., Roberts, B. W., Krueger, R. F., Blo-nigen, D. M., & Hicks, B. M. (2008). Capturingabnormal personality with normal personality in-ventories: An item response theory approach.Journal of Personality, 76, 1623–1647. doi:10.1111/j.1467-6494.2008.00533.x
Watson, D., Clark, L. A., & Chmielewski, M. (2008).Structures of personality and their relevance topsychopathology: II. Further articulation of a com-prehensive unified trait structure. Journal of Per-sonality, 76, 1545–1585. doi:10.1111/j.1467-6494.2008.00531.x
Watson, D., Clark, L. A., & Harkness, A. R. (1994).Structures of personality and their relevance topsychopathology. Journal of Abnormal Psychol-
ogy, 103, 18 –31. doi:10.1037/0021-843X.103.1.18
Westen, D. (1997). Divergences between clinical andresearch methods for assessing personality disor-ders: Implications for research and the evolution ofAxis II. American Journal of Psychiatry, 154,895–903.
Widiger, T. A. (2011a). Integrating normal and ab-normal personality structure: A proposal forDSM-V. Journal of Personality Disorders, 25,338–363. doi:10.1521/pedi.2011.25.3.338
Widiger, T. A. (2011b). The DSM-5 dimensionalmodel of personality disorder: Rationale and empir-ical support. Journal of Personality Disorders, 25,224–234. doi:10.1521/pedi.2011.25.2.222
Widiger, T. A., Livesley, W. J., & Clark, L. E. A.(2009). An integrative dimensional classificationof personality disorder. Psychological Assess-ment, 21, 243–255. doi:10.1037/a0016606
Widiger, T. A., & Simonsen, E. (2005). Alternativedimensional models of personality disorder: Find-ing a common ground. Journal of Personality Dis-orders, 19, 110 –130. doi:10.1521/pedi.19.2.110.62628
Widiger, T. A., & Trull, T. J. (2007). Plate tectonicsin the classification of personality disorder: Shift-ing to a dimensional model. American Psycholo-gist, 62, 71–83. doi:10.1037/0003-066X.62.2.71
Wu, K., Lindsted, K. D., Tsai, S., & Lee, J. W.(2008). Chinese NEO PI-R in Taiwanese adoles-cents. Personality and Individual Differences, 44,656–667. doi:10.1016/j.paid.2007.09.025
Yamagata, S., Suzuki, A., Ando, J., Ono, Y., Kijima,N., Yoshimura, K., . . . Jang, K. L. (2006). Is thegenetic structure of human personality universal?A cross-cultural twin study from North America,Europe, and Asia. Journal of Personality and So-cial Psychology, 90, 987–998. doi:10.1037/0022-3514.90.6.987
Yamamoto, K., & Mazzeo, J. (1992). Item responsetheory scale linking in NAEP. Journal of Educa-tional Statistics, 17, 155–173. doi:10.2307/1165167
Zimmerman, M., Rothschild, L., & Chelminski, I.(2005). The prevalence of DSM–IV personalitydisorders in psychiatric outpatients. AmericanJournal of Psychiatry, 162, 1911–1918. doi:10.1176/appi.ajp.162.10.1911
Zwick, W. R., & Velicer, W. F. (1986). Comparisonof five rules for determining the number of com-ponents to retain. Psychological Bulletin, 99, 432–442. doi:10.1037/0033-2909.99.3.432
126 STEPP ET AL.