Embed Size (px)
Citation preview

1
Integrating historical topographic maps and SRTM data to derive the bathymetry of a tropical reservoir
Enner Alcântara a*, Evlyn Novo a, José Stech a, Arcilan Assireua, Renata Nascimentoa,
João Lorenzzetti a, Arley Souza a,b
a Divisão de Sensoriamento Remoto, Instituto Nacional de Pesquisas Espaciais – INPE b CETEC-ETEP Faculdades, Brasil
{evlyn,stech,,arcilan,renata,loren}@dsr.inpe.br; [email protected] *Corresponding author: [email protected]
Abstract This paper proposes a cheap and fast method for estimating the bathymetry of hydroelectric reservoirs. Brazil has more than 30 large hydroelectric reservoirs with volume exceeding one billion cubic meters. The hydroelectric sector is responsible for 97% of energy generation being the largest hydroelectric park in the world. These dams, however, cause a series of environmental, social and economic impacts, which need to be monitored. Among the variables affecting the environmental impact posed by reservoirs, depth has a key role because it acts on the aquatic system hydrodynamics. Reservoir depth distribution, the bathymetry, is also a fundamental factor controlling physical-chemical and biological properties of the system. In Brazil, the acquisition of bathymetric information for the large reservoirs, however, is not a simple task, because: 1) most of the topographic maps available in the area covered by the lake have very small scale (1:100 000 and smaller); 2) larger charts are property of the hydropower companies and are classified; 3) the size of the reservoirs prevent the use of bathymetric surveys due. The challenge therefore is how to combine the use of low precision topographic charts from the period previous to reservoir filling, SRTM data to obtain a bathymetric map which could be used for planning echo-bathymetric missions so as reducing both cost and time of data acquisition and processing. Keywords: hydroelectric sector, echo-sounder, geoprocessing, water resources.
INPE ePrint: sid.inpe.br/mtc-m18@80/2009/09.30.22.11 v1 2009-10-01

2
Introduction
In accordance to World Commission Dams (WCD, 2000) up to 60% of 227 largest
rivers of the world was hard or moderate fragmented by dams, deviated or canalized,
causing effects on inland water ecosystems and surroundings.
The environmental impacts caused by dammed rivers (Tundisi, 1994) are associated
with their size and volume, time of residence and geographical localization, being the
main ones: flooding of agricultural areas, alteration of fish migration, loss of aquatic
flora and fauna, change of hydrological regime, sediment yielding, dissemination of
disease vectors, loss of historical and cultural sites, social effects and on local
economical activities. One of key parameter to characterize and understanding a lot of
processes in aquatic systems is the bathymetry.
In many studies the bathymetry is a necessary input parameter, as sediment deposition
through the time (Rowan et al. 1995, Gaytán et al., 2008), water quality modeling
(Tufford & McKellar, 1999), circulation and thermal structure modeling (Beletsky &
Schwab, 2001), modeling of macrophyte distribution (Lehmann, 1998), fish ecology
(Jepsen et al. 1999), management (Awulachew, 2006), embankments dams (Charles,
2009), and others.
Moreover, often the bathymetry inventory of reservoirs is realized by echo-sounders
that are based on time pass between sending pulses and the reception of these pulses
after their reflection by bottom (Barbosa et al. 2006). The conventional measuring
bottom depth is generally a expensive procedure and consuming time. Some authors
developed methods based on remote sensing to map the bottom depth (Krug &
Noernberg, 2007, Lafon et al. 2002, Brando et al. 2009) with relatively success in
shallow water bodies and low turbidity. However, using this type of method an
extensive sampling delineation is required to validate the developed models.
Thus, the objective of this work is to develop a cheap method to map the bottom depth
of a tropical hydroelectric reservoir.
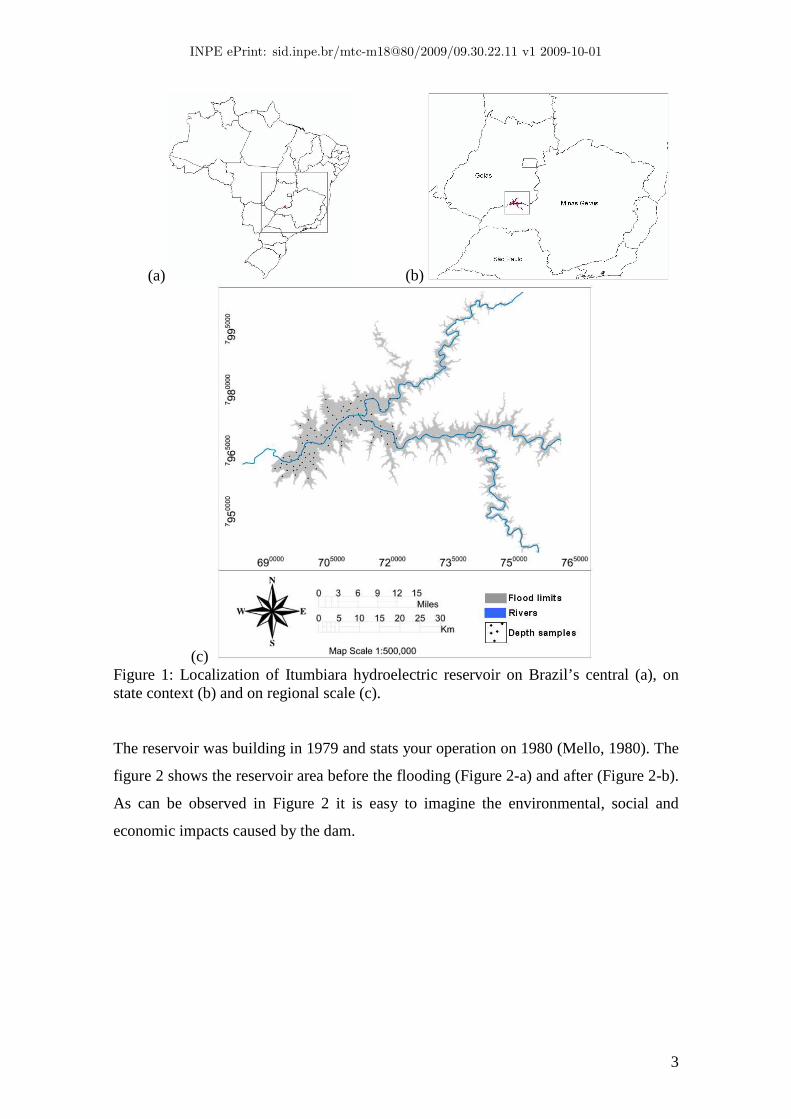
Study Area and background – The Itumbiara hydroelectric reservoir (18°25’S,
49°06’W) is located on tropical grassland savanna, between Minas Gerais and Goiás
States (Brazil’s central). The reservoir was formed by damming the Parnaiba River
which resulted in the backward flood of its main tributaries, Araguari River and
Corumbá. The basin geomorphology resulted in a lake with a dentritic pattern covering
an area of approximately 814 Km² and volume of 17.03m³ (Figure 1).
INPE ePrint: sid.inpe.br/mtc-m18@80/2009/09.30.22.11 v1 2009-10-01
3
(a) (b)
(c) Figure 1: Localization of Itumbiara hydroelectric reservoir on Brazil’s central (a), on state context (b) and on regional scale (c). The reservoir was building in 1979 and stats your operation on 1980 (Mello, 1980). The
figure 2 shows the reservoir area before the flooding (Figure 2-a) and after (Figure 2-b).
As can be observed in Figure 2 it is easy to imagine the environmental, social and
economic impacts caused by the dam.
INPE ePrint: sid.inpe.br/mtc-m18@80/2009/09.30.22.11 v1 2009-10-01

4
(a)
(b)
Figure 2: (a) MSS-Landsat-3 imagery from 11-08-1978 show the area before inundation; and (b) TM-Landsat-5 imagery from 26-05-2007 actual period. The figure also shows the position of dam on reservoir.
The following section provides all methodological bases to reach the objective proposed
here.
Methodological approach
Cartographic Data – a topographic map from 1979 at the scale of 1:250.000 (SE-22-Z-
a) with contour lines spaced every 50 m was used (DSG, 1979). This map was produced
before reservoir construction and allows an overall idea of the topography of the area to
be submersed. .
Remote Sensing Data – A SRTM (Shuttle Radar Topography Mission) from 2000, with
spatial resolution of 90m (Farr et al. 2007) and resized to 30m using the approach
proposed by Valeriano et al. (2006) was used to refine the information on the
topographic chart. A Landsat-5 TM image from May 26 2007 was also acquired to
represent the maximum water level in the Itumbiara reservoir and to define the
land/water limit.
Water Level Data – The water level was record from 1993 to 2008 in each hour
measured by ‘FUNAS Centrais Elétricas S.A.’ (Figure 3). These data was collected near
the dam structure (18º24’22,83”S, 49º05’48,25” W).
Depth Data – A field campaign was carried out using a Lowrance LMS-480 sound from
may 11-15 2009 to measure water quality data and depth data in 25 stations in whole
reservoir (see Figure 1-c for samples location).
INPE ePrint: sid.inpe.br/mtc-m18@80/2009/09.30.22.11 v1 2009-10-01

5
Method
Water Level Dynamics and Water Mask – A monthly mean water level from 2003 to
2008 was used to classify the periods of rising, high, falling and low water regime and
the rate of variation (dt
dC), see Figure 3. These classifications are in accordance to
methodology proposed in Barbosa et al. (2006).
Figure 3: Daily mean variation and rate of water level variation: rising (1), high (2), falling (3) and low water level (4).
According to the water level fluctuation (Figure 3) the best period for carrying out the
bathymetry is from April 21 to June 07, because it corresponds to the smallest time
change in quota. Based on this the water mask was built using the Landsat-5 TM image
acquired May 26 2007 which was the only date available in the period. The mask was
built using the NDWI (Normalized Difference Water Index) algorithm proposed by
McFeeters (1996).
Estimating the bottom depth – The topographic map from 1979 was digitized (Figure 4-
a) using the Computer-Aided Design (CAD) software to generate a digital topographic
map. The contour curve interval was 50 m providing a very poor display of the terrain
(Figure 4-a and b). A SRTM image with contour curve intervals of 20m (Figure 4-c and
d) shows the lack of information in the flooded area since it was acquired in 2000. The
backscattering from the water surface is almost zero because SRTM sensor operates in
bands C and X and is only sensitive to differences in water surface roughness. In the
INPE ePrint: sid.inpe.br/mtc-m18@80/2009/09.30.22.11 v1 2009-10-01

6
area surrounding the reservoir, however, SRTM displays a much finer representation of
the terrain topography (Figure 4-d) as compared with that displayed by the topographic
map (Figure 4-b)
By merging the two data sets, using the SRTM to improve the vertical resolution of the
topographic map in the region bordering the reservoir, it was possible to generate a
hybrid map with an improved quality. This procedure allowed generating a third
contour map (Figure 4-e) and its image (Figure 4-f) with a clear improvement of the
vertical resolution and much better display of the terrain even inside the flooded area
(a)
(b)
(c)
(d)
(e)
(f)
Figure 4: Methodological approach used to enhance the topography map of flooded area
of Itumbiara reservoir. (a) Curve levels of 50 m derived from topography map of 1979
and the image (b); (c) curve level of 20 m derived from SRTM from 2000 and their
image (d); and the enhanced curve levels (e) and their image (f).
INPE ePrint: sid.inpe.br/mtc-m18@80/2009/09.30.22.11 v1 2009-10-01
7
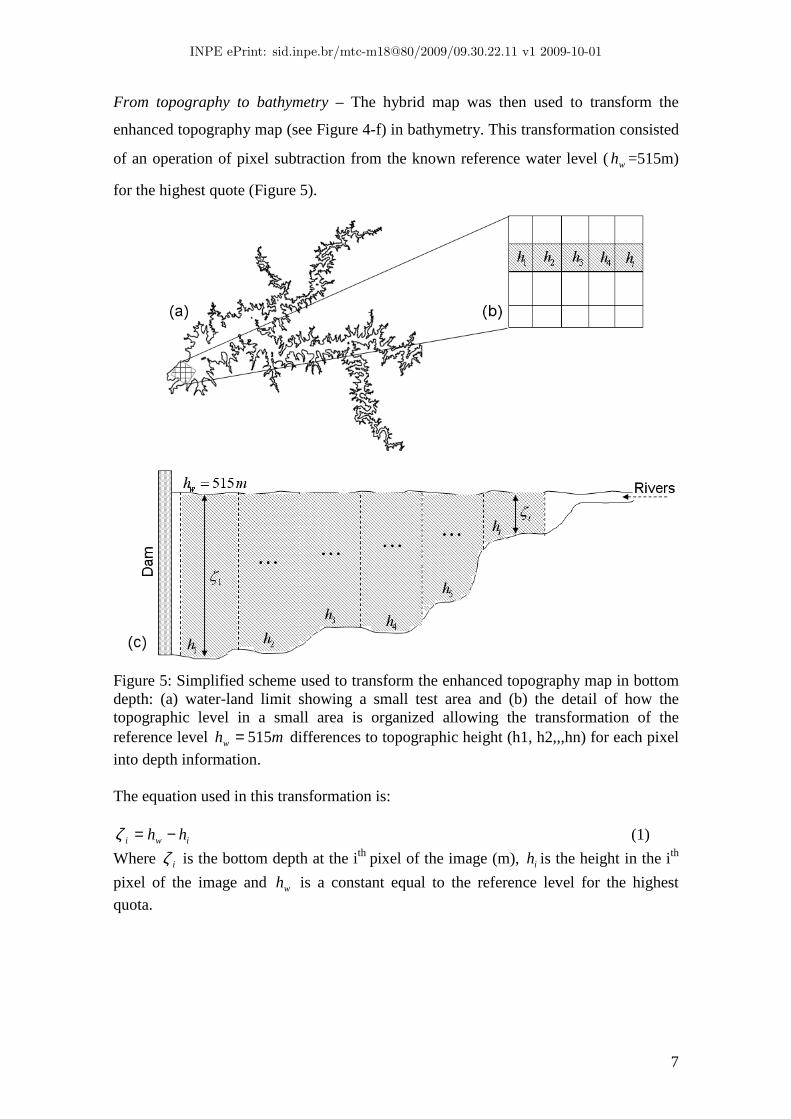
From topography to bathymetry – The hybrid map was then used to transform the
enhanced topography map (see Figure 4-f) in bathymetry. This transformation consisted
of an operation of pixel subtraction from the known reference water level (wh =515m)
for the highest quote (Figure 5).
Figure 5: Simplified scheme used to transform the enhanced topography map in bottom depth: (a) water-land limit showing a small test area and (b) the detail of how the topographic level in a small area is organized allowing the transformation of the reference level mhw 515= differences to topographic height (h1, h2,,,hn) for each pixel
into depth information. The equation used in this transformation is:
iwi hh −=ζ (1)
Where iζ is the bottom depth at the ith pixel of the image (m), ih is the height in the ith
pixel of the image and wh is a constant equal to the reference level for the highest
quota.
INPE ePrint: sid.inpe.br/mtc-m18@80/2009/09.30.22.11 v1 2009-10-01

8
Sensitivity analysis of the method – The sensitivity analysis was carried out using 25
depth measurements (see Figure 1-c for sample location) and confronting with the depth
estimated by the method at the same geolocation.
Results
Figure 6 shows estimated bottom depths for the entire reservoir. Depths near the dam
are approximately 70 m (region 1). This region seems to be the deepest of the reservoir
in conjunction with region 2 with 65 m. Both are near the main river (see Figure 1 for
location of the rivers before the inundation). The region 3 represents the areas with
depth between 25-40 m occurring mainly in the central body of the reservoir.
Figure 6: Estimated bathymetry (m) by the proposed method.
According to Figure 6 the shallow areas are in the regions 4 and 5 corresponding to the
first order channels running straight into the reservoir. These results agree with the
literature (Tundisi et al., 2002), that is, the deepest regions near the dam and shallowest
region in the small channels.
INPE ePrint: sid.inpe.br/mtc-m18@80/2009/09.30.22.11 v1 2009-10-01

9
Figure 7a renders a quantitative assessment of the method. The scatterplot of measured
and estimated depths display a R²=0.98 (100=n , 00.0=ρ ). The highest errors were
observed depths higher than 70m. This failure was already expected because the
topographic surveys do not include information on river depth. In spite of that, these
results are very useful for planning the bathymetric survey in the reservoir, focusing the
data collection on the river channel which is the main source of error, and limiting the
number of sampling sites in the regions where the hybrid topographic chart renders a
good display of reservoir depth distribution.
Figure 7: Evaluation of the proposed methodology: (a) measured versus estimated depth (m) and (b) the residuals.
In a country as Brazil where the hydroelectric energy is responsible for 97% of the total
generated energy and considering the valuable information generated by the bathymetric
map for reservoir operations the methodology should be applied with relatively success
with economy of time, people for surveying and financial resources.
Final remarks
We present a new method to estimate the bottom depths in hydroelectric reservoirs
using cartographic maps and satellite topographic data. Our approach allows the
following applications:
- Planning field campaigns;
- Decision making by the engineers;
INPE ePrint: sid.inpe.br/mtc-m18@80/2009/09.30.22.11 v1 2009-10-01

10
- Bathymetry using sonar;
- Water quality sampling;
- Modelling the sedimentation processes in reservoirs over time.
Acknowledgements
E. Alcântara and colleagues are grateful to Project n. 0258059 PROCAD/CAPES for
the PhD fellowship and the Brazilian funding agency FAPESP under grants
2007/08103-2. We also wish to thanks Carsten Reinhard from School of Biological
Sciences, University of Bristol for the English language review.
References Awulachew, S.B., 2006: Investigation of physical and bathymetric characteristics of
Lakes Abaya and Chamo, Ethipia, and their management implications. Lakes & Reservoirs: Research and Management. 11: 133-140.
Barbosa, C.C.F., Novo, E.M.L.M., Melack, J.M., Freitas, R.M. & Filho, W.P., 2006:
Metodologia de análise da dinâmica de área e volume inundável: o exemplo da várzea do Lago Grande de Curuaí. Revista Brasileira de Cartografia. 58: 201-210.
Beletsky, D. & Schwab, D.J., 2001: Modeling circulation and thermal structure in Lake
Michigan: annual cycle and interannual variability. Journal of Geophysical Research. 106: 19745-19771.
Brando, V.E., Anstee, J.M., Wettle, M., Dekker, A.G., Phinn, S.R. & Roelfsema, C.
2009: A physics based retrieval and quality assessment of bathymetry from suboptimal hyperspectral data. Remote Sensing of Enviroment. 113: 755-770.
Charles, J.A. 2009: The engineering behavior of fill materials and its influence on the
performance of embankment dams. Dams and Reservoirs. 19: 1, 21-33. Farr, T. G., et al. 2007: The Shuttle Radar Topography Mission, Reviews of
Geophysics, 45: RG2004. Gaytán, R., Anda, J. & Nelson, J. 2008: Computation of changes in the run-off regimen
of the Lake Santa Ana watershed (Zacatecas, México). Lakes & Reservoirs: Research and Management. 13: 155-167.
Jepsen, N., Koed, A. & Okland, F. 1999: The movements of pikeperch in a shallow
reservoir. Journal of Fish Biology. 54: 1083-1093. Kelman, J., Pereira, M.V.F., Neto, T.A.A. & Sales, P.R.H. 2002: Hidreletricidade. In:
Rebouças, A.C.; Braga, B.; Tundisi, J.G. (eds.) Águas Doces no Brasil. São Paulo: escrituras, pp. 371-418.
INPE ePrint: sid.inpe.br/mtc-m18@80/2009/09.30.22.11 v1 2009-10-01

11
Krug, L.A. & Noernberg, M.A. 2007: O sensoriamento remoto como ferramenta para determinação de batimetria de baixios na Baía das Laranjeiras, Paranaguá-PR. Revista Brasileira de Geofísica. 25: 101-105.
Lafon, V.; Froidefond, J.M.; Lahet, F. & Castaing, P. 2002: Spot shallow water
bathymetry of a moderately turbid tidal inlet based on field measurements. Remote Sensing of Enviroment. 81: 136-148.
Lehmann, A. 1998: GIS modeling of submerged macrophyte distribution using Generalized Additive Models. Plant Ecology. 139: 113-124.
McFeeters, S.K. 1996: The use of the Normalized Difference Water Index (NDWI) in
the delineation of open water features. International Journal of Remote Sensing. 17: 1425-1432.
Mello, J.A.B. 1980: Usina hidrelétrica de Itumbiara: estudo, formação e enchimento do
reservatório e efeitos no meio ambiente. FURNAS: Rio de Janeiro, pp. 33. Tufford, D.L. & McKellar, H.N. 1999: Spatial and temporal hydrodynamic and water
quality modeling analysis of a large reservoir on the South Carolina (USA) coastal plain. Ecological Modelling. 114: 137-173.
Tundisi, J.G. 1994: Tropical South America: presents and perspectives: In: Margalef, R
(ed) Limnology now: a paradigm of planetary problems. Amsterdan: Elsevier Science, pp. 353-424.
Tundisi, J.A., Tundisi, T.M. & Rocha, O. 2002: Ecossistemas de Águas Interiores. In:
Rebouças, A.C.; Braga, B.; Tundisi, J.G. (eds.) Águas Doces no Brasil. São Paulo: escrituras, pp. 153-194.
Valeriano, M.M., Kuplich, T.M., Storino, M., Amaral, B.D., Jr, J.N.M. & Lima, D.J.
2006: Modeling small watersheds in Brazilian Amazonia with shuttle radar topographic mission-90m data. Computers & Geosciences. 32: 1169-1181.
WCD. 2000: Dams and development: A framework for decisionmaking. The World
Commission on Dams, pp. 412 [http://www.dams.org/].
INPE ePrint: sid.inpe.br/mtc-m18@80/2009/09.30.22.11 v1 2009-10-01

12
INPE ePrint: sid.inpe.br/mtc-m18@80/2009/09.30.22.11 v1 2009-10-01


