Embed Size (px)
Citation preview
Meteorol. Atmos. Phys. 57, 21 29 (I995) Meteorology, and Atmospheric
Physics �9 Springer-Verlag 1995 Printed in Austria
Department of Environment and Planning University of Aveiro, Aveiro, Portugal
Intercomparison of two Meso-Meteorological Models Applied to the Lisbon Region
C. Borrego, M. Coutinho, and N. Barros
Wilh 8 Figures
Received March 8, 1994 Revised August 1, 1994
Summary
In this paper two mesoscale meteorological models are applied to the Lisbon region. A special concern is directed to the initial conditions and input parameterization in order to assure that equal simulation constraints were imposed to both models. Results obtained for 4 August 1992 (a typical summer day) are compared to meteorological data acquired in three monitoring stations. Both simulations show similar reactions to the mesoscale forcings that occur in the modelling region. The minor differences found between simulation and reality for the meteorological situation can cause major errors in predicting air quality.
1. Introduction
During the last 5 years, the University of Aveiro has directed significant research towards the analy- sis of regional air quality and problems related to the transport of airborne pollutants over Portugal (Coutinho et al., 1989; Borrego et al., 1991; Barros, 1994). One of the main conclusions of these studies was the necessity to consider mesoscale atmos- pheric circulations in studying atmospheric dis- persion patterns in Portugal. Routine meteorolo- gical observations are frequently insufficient to represent complex meso-meteorological patterns. Mesoscale meteorological models seem to be the most adequate tool to represent those circulations through the mathematical simulation of atmos- pheric physical processes.
As a result of this concern, two meso-meteoro- logical models have been applied to the Lisbon airshed: the CSU Mesoscale Model (Kessler and Douglas, 1992) and the MEMO model (Flassak, 1990). Both models simulate meteorological fields that can be used to generate gridded meteorologi- cal input fields to photochemical grid models. In fact the CSUMM has been recently coupled (Barros, 1994) to the Urban Airshed Model (Ames et al., 1985) and MEMO has been developed simultaneously with a reactive dispersion model, the MARS model (Moussiopoulos, 1989).
2. Description of the Models
2.t The CSU Mesoscale Model
The Colorado State University Mesoscale Model used in this work is a version (Kessler and Douglas, 1992) of the hydrostatic, incompressible, primitive-equation model originally developed by Pielke (1974). The most thorough descriptions of the model formulation are found in Mahrer and Pielke (1977, 1978) and in Arritt (1985).
The model includes a surface heat budget (Tremback and Kessler, 1985) and parameteriza- tions of the atmospheric surface and planetary boundary layers. The model is based on the atmospheric primitive equations simplified by
22 C. Borrego et al.
adoption of the hydrostatic, incompressible, and Boussinesq approximations and can be executed in one, two or three dimensions. The equations are averaged as described by Pielke (1984), and the resulting subgrid correlations terms are closed at the first moment. A terrain-following coordinate system simplifies the application of the model to domains with an irregular lower boundary. Hori- zontal advection is solved by a quasi-Lagrangean scheme using upwind interpolation on cubic spli- nes (Mahrer and Pielke, 1978), while centred space differencing is used for the pressure gradient force and for the horizontal velocity convergence in the continuity equation. Vertical diffusion is solved using a forward-weighted version of the Crank- Nicholson implicit method discussed by Paegle et al. (1976).
The prognostic model requires terrain informa- tion (topography, land/water coverage), domain- scale initial profiles of potential temperature and specific humidity, and a domain-scale geostrophic wind which can vary with height.
Zero-gradient lateral boundary conditions are imposed on all prognostic variables. In general, the lateral boundaries should be removed as far as is practical from the region of interest to avoid contamination of the solution by boundary effects.
2.2 The MEMO Model
Within MEMO, the conservation equations in the atmosphere for momentum, mass and scalar quantities such as potential temperature, turbulent kinetic energy and specific humidity are solved numerically. More detailed information can be found in Flassak (1990) and Moussiopoulos et al. (1993).
MEMO is a fully vectorized non-hydrostatic mesoscale model with Boussinesq approximation. For the calculation of turbulent diffusion K- theory is applied. The exchange coefficients for momentum and scalars are computed using a one-equation turbulence model (one partial differ- ential equation for the turbulent kinetic energy, algebraic equation for the mixing length). Turbu- lent fluxes and roughness height z o are calculated using similarity theory. The friction velocity u, and the flux temperature 0, are calculated from the Businger equations (Businger, 1973).
The numerical solution is based on second- order discretization applied on a staggered grid
which is allowed to be non-equidistant in all directions. Special care is taken that conservative properties are preserved within the discrete model equations. The discrete pressure equation is solved with a direct elliptic solver in conjunction with a generalized conjugate gradient method as descri- bed by Flassak and Moussiopoulos (1988). Advec- tive transport is treated with a second-order total- variation-diminishing (TVD) scheme based on the one-dimensional scheme proposed by Harten (1986). The calculation of radiative transfer follows an efficient scheme suggested by Moussiopoulos (1987).
For calculations with MEMO, information on orography height and surface type (classified in percentage of 7 land use types) must be provided. To generate the initial state for the prognostic model, a diagnostic model (Kunz, 1991) is applied using measured temperature and wind data (upper air and surface data).
At lateral boundaries, radiation conditions suggested by Carpenter (1982) are used. These conditions allow disturbances to propagate out through the boundary, as well as, the imposition of information from outside. The model can be run with time-dependant boundary conditions.
3. Definition of the Case
3.1 Modelling Region
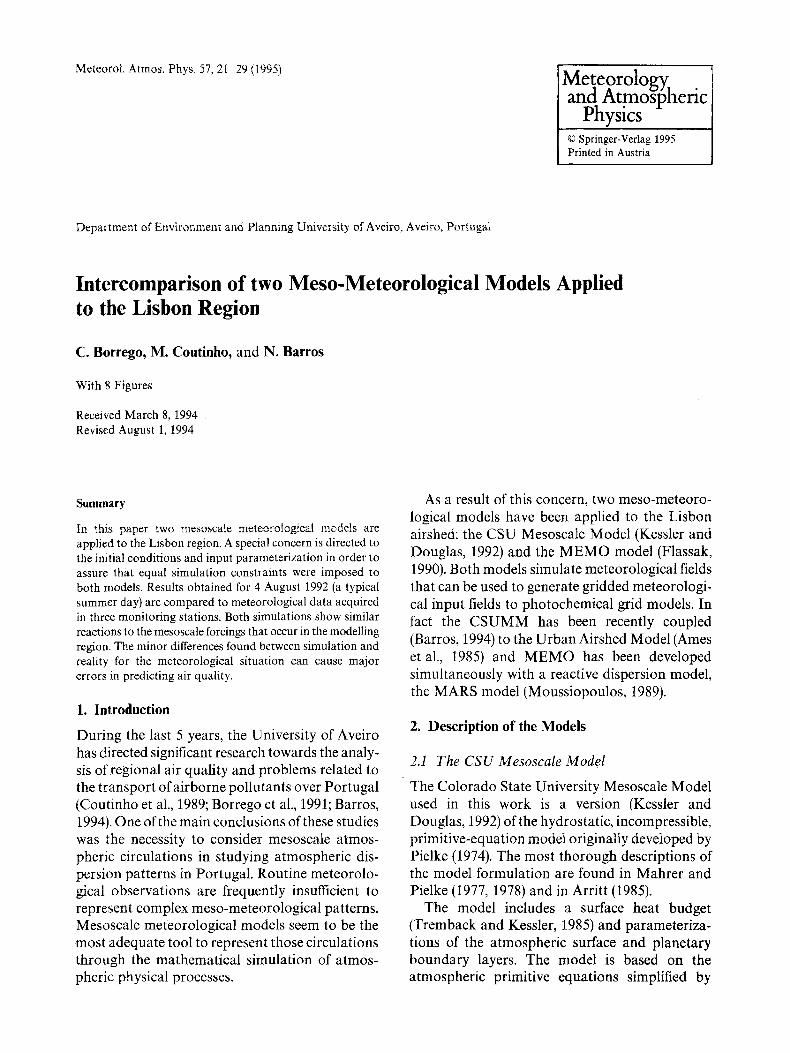
The southern region of Portugal, including the Greater Lisbon Area, was chosen for the applica- tion of an interregional modelling plan (Coutinho et al., 1989). This region was selected taking into account the geographical distribution of the main industrial sources and of the most important urban centres of Portugal (Fig. 1). The modelling domain accounts for circa 3.5 million inhabitants.
Lisbon is built in a very complex topographic region, dominated by a large estuary (320kin 2) and multiple hills reaching 400 m above sea level. Atmospheric flow is strongly affected by the curvature of the coastline. The need to understand the behaviour of this airshed is most felt as a substantial increase of air pollutants emissions is foreseen for the future (Coutinho et al., 1992).
3.2 Meteorological Scenario
The meteorological situation analyzed represents the most frequent meteorological type during
Intercomparison of two Meso-Meteorological Models Applied to the Lisbon Region 23
Fig. 1. Lisbon region. The residentials areas are squared, industrial areas are solid and forest and agricultural areas are marked with diagonals. Carregado meteorological station is marked by a triangle, Lisbon meteorological station by a square and Setfibal meteorological station by a circle
summer in the Iberian Peninsula and has been detailed described by Coutinho et al. (1993). A thermal low is created at the high and arid central plateau of the peninsula, producing a relatively strong (3-4m.s -1) N - N E wind over Portugal. Strong insolation promotes the formation ofmeso- scale circulations.
The lower tropospheric pressure field for the 4th of August 1992 is an example of a typical summer situation. An extension of the Azores anticyclone extended over the northern part of the Iberian Peninsula and a low pressure system was located to the west of the British Islands.
3.3 Definition of Modelling Parameters
A special effort was put on the setting of the initial conditions and land use parameterization of both models. In fact, it is difficult to assure similar initial conditions for the two models, as each model requires different input.
The models were run for an area of 150 x 150 km 2, with a horizontal resolution of 5 x 5 km 2. The same orographic data base was used for both simulations. The spatial discretization used in this work was sufficient to depict the most significant orographic features of the region.
MEMO capacity of using grid cells with mixed land-use was disabled and a land-use data base with only land/water distinction was built. Equal surface properties such as, roughness height, initial soil temperature, albedo, volumetric soil capacity, soil moisture content and thermal soil diffusivity were used in both simulations. Water temperature was kept constant at 18 ~ C.
In CSUMM, initial vertical profiles of tempera- ture and wind have to be input at specific levels. On the other hand M E M O is provided with internal interpolation procedures enabling the input of real sounding. An artificial vertical profile of wind and potential temperature was created through interpolation of the real sounding data to the CSUMM vertical levels and used as input for both models.
Some work was also performed to reduce differ- ences in the vertical grid structure. M E M O uses a non-equidistant grid from ground level to the top of the domain (6000 m). CSUMM develops a non-equidistant vertical grid from ground level to 3500m and a equidistant (500m) grid till the modelling domain top, located at 8000m. The number of vertical levels used in each model (22 for M E M O and 28 for CSUMM) equalizes the spatial discretization of the lower troposphere. Under these assumptions, the lowest 1600 m of the troposphere are described by 16 vertical levels in both models.
4. Results and Discussion
4.1 Wind Fields
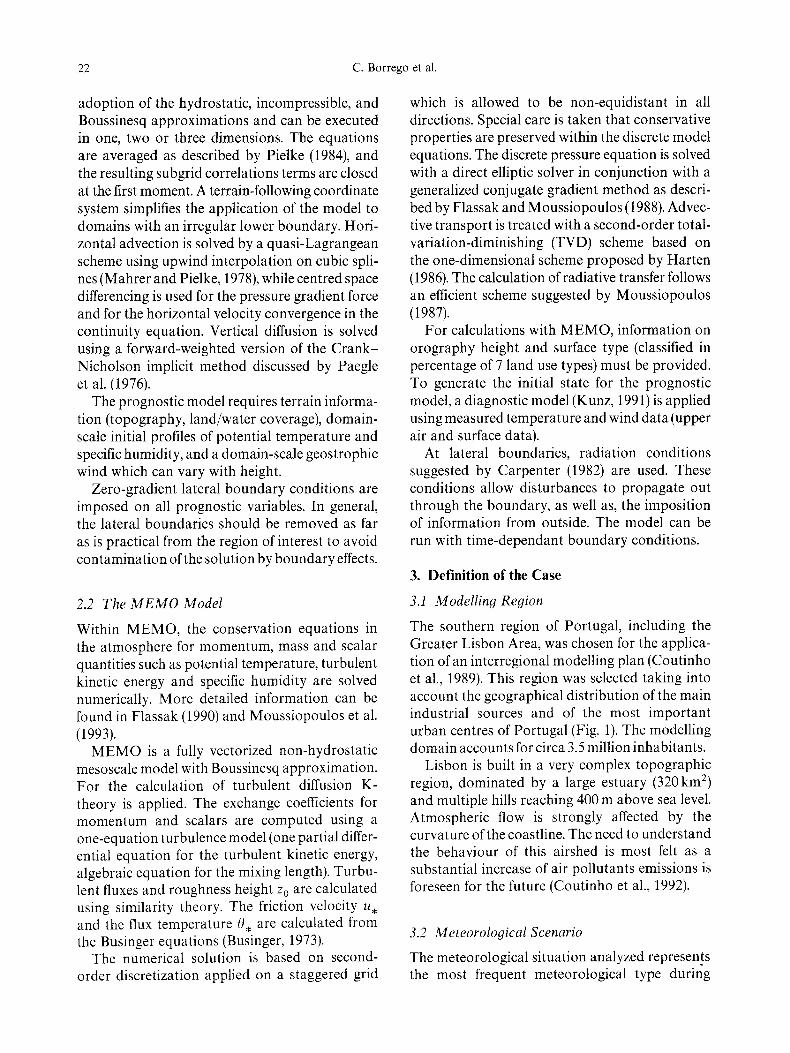
Prognostic air flow patterns generated by MEMO and CSUMM at 10m Above Ground Level (AGL) are presented in Figs. 2 5. Wind fields for 6.00, 14.00, 19.00 and 22.00 Local Standard Time (LST) were selected. Wind velocity is scaled at 4 re.s- ~ per grid spcaing.
The air flow calculted through M E M O within the modelling region during the morning of 4 August 1992 (Fig. 2a) was characterized by offshore directed drainage and downslope flows along the main mountain ridges (4-5 m 's - 1), a northeasterly flow over the Tejo valley and a northerly flow over the Atlantic Ocean. CSUMM (Fig. 2b) develops similar mesoscale forcing with much weaker winds (1-2 m-s - 1) producing a quite different wind field. Mesoscale circulations show a smaller spatial
24 C. Borrego et al.
Fig. 2a. Wind field for 6.00 LST generated by MEMO Fig. 3a. Wind field for 14.00 LST generated by MEMO
Fig. 2b. As Fig. 2a, but generated by CSUMM Fig. 3b. As Fig. 3a, but generated by CSUMM
extent and the airflow is dominated by a north- northwest flow over the Atlantic.
By 14.00 LST (Fig. 3b) C S U M M has developed a full sea breeze along most of the coast line. The sea breeze front follows the coastline curvature. At the same time, M E M O simulation (Fig. 3a)
shows an incipient sea breeze front appearing over the water, 10km from the coast near the Tejo's mouth and 30 km from the Sines coast. Flow over land is still dominated by offshore winds.
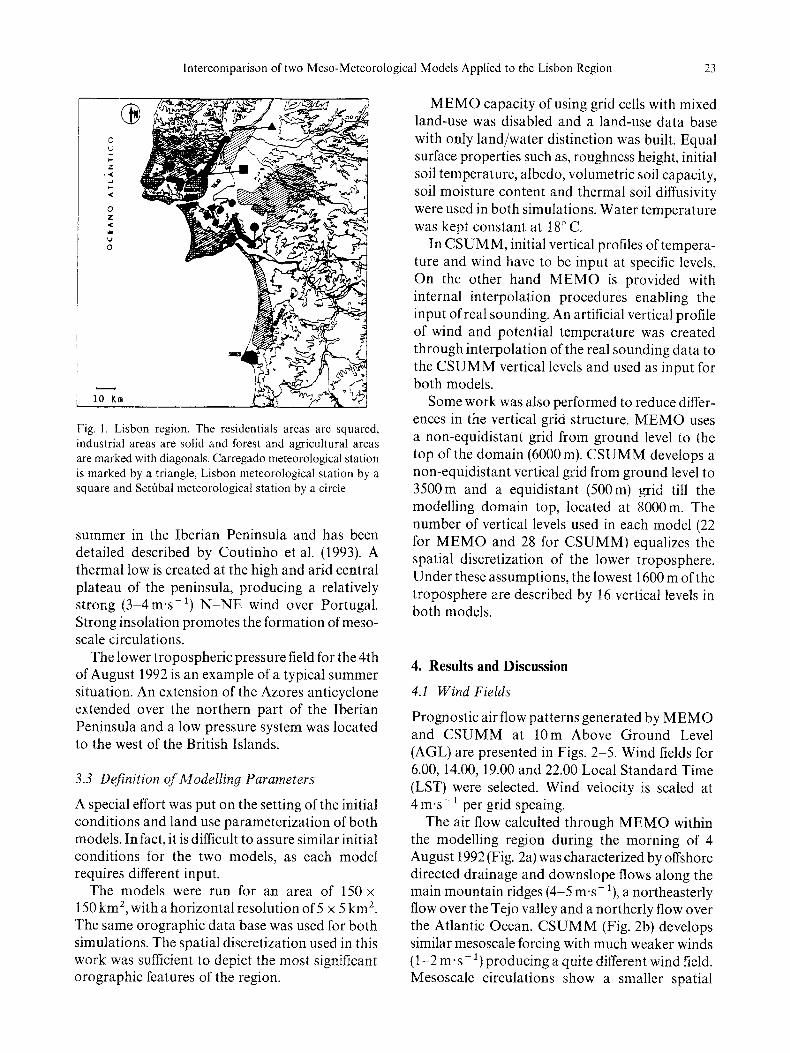
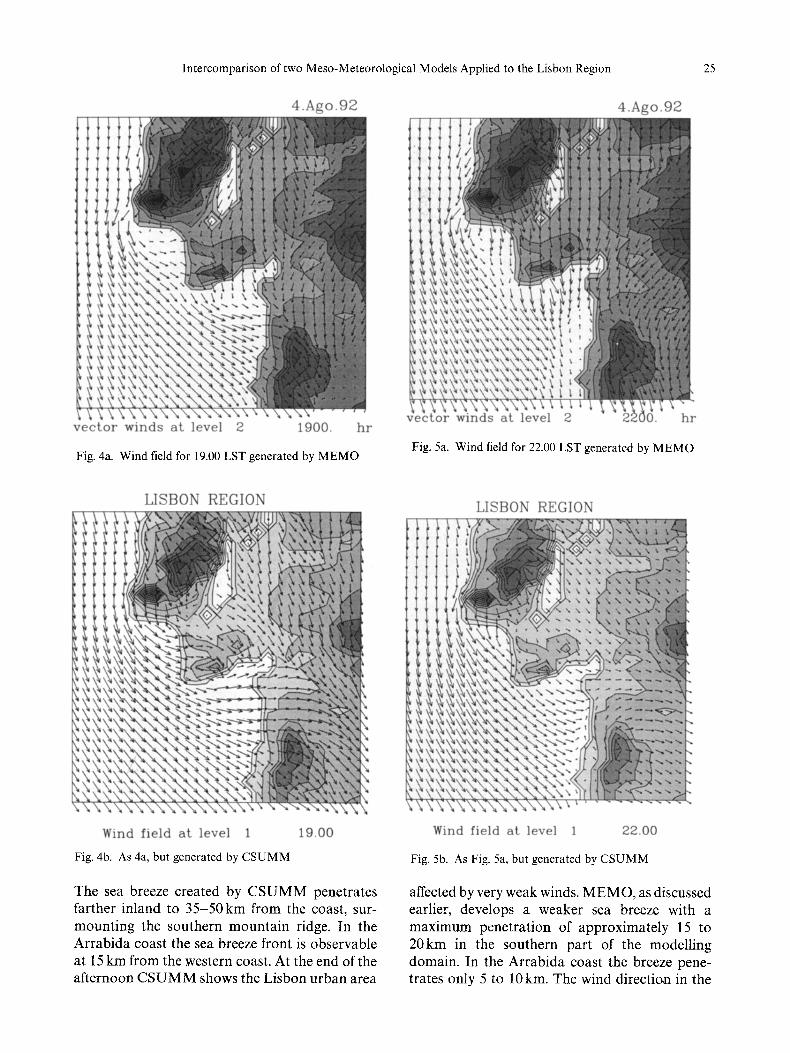
Maximum extent of the sea breeze is reached in both models at 18.00-19.00 LST (Figs. 4a and 4b).
Intercomparison of two Meso-Meteorological Models Applied to the Lisbon Region 25
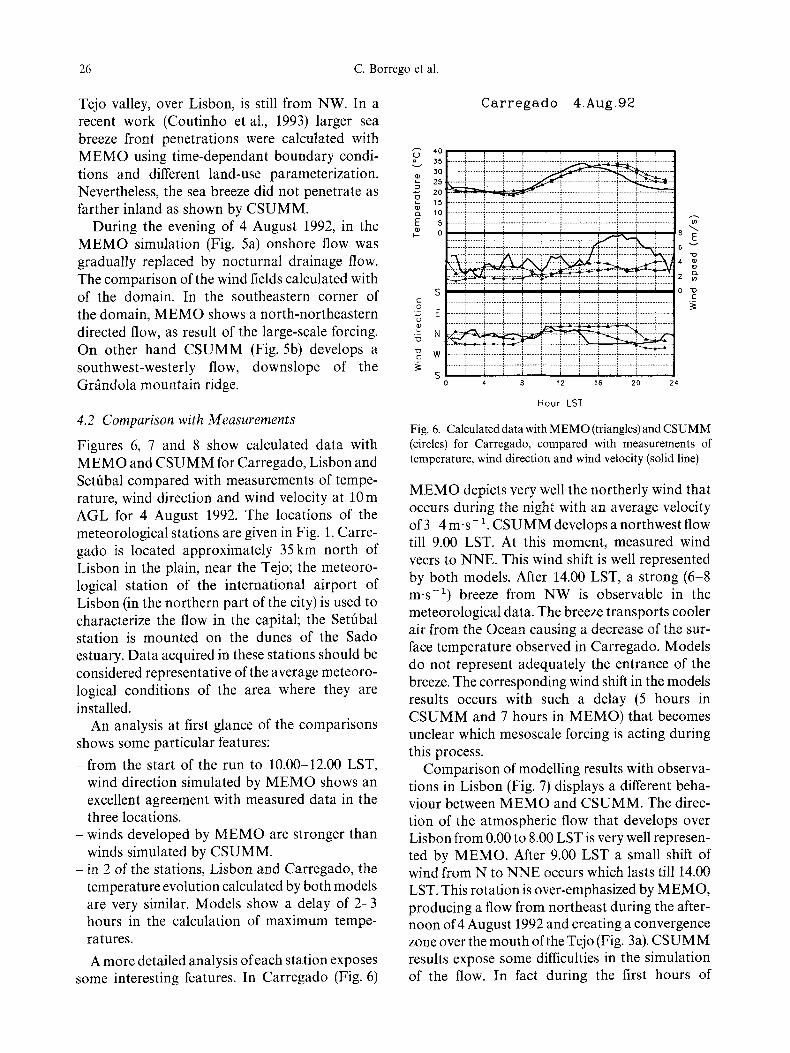
Fig. 4a. Wind field for 19.00 LST generated by MEMO Fig. 5a. Wind field for 22.00 LST generated by MEMO
Wind field at level 1 19.00
Fig. 4b. As 4a, but generated by CSUMM
The sea breeze created by CSUMM penetrates farther inland to 35-50km from the coast, sur- mounting the southern mountain ridge. In the Arrabida coast the sea breeze front is observable at 15 km from the western coast. At the end of the afternoon C S U M M shows the Lisbon urban area
Wind f ie ld a t leve] 1 22.00
Fig. 5b. As Fig. 5a, but generated by CSUMM
affected by very weak winds. MEMO, as discussed earlier, develops a weaker sea breeze with a maximum penetration of approximately 15 to 20km in the southern part of the modelling domain. In the Arrabida coast the breeze pene- trates only 5 to 10 km. The wind direction in the
2 6 C . B o r r e g o e t a l .
Tejo valley, over Lisbon, is still from NW. In a recent work (Coutinho et al., 1993) larger sea breeze front penetrations were calculated with MEMO using time-dependant boundary condi- tions and different land-use parameterization. Nevertheless, the sea breeze did not penetrate as farther inland as shown by CSUMM.
During the evening of 4 August 1992, in the M E M O simulation (Fig. 5a) onshore flow was gradually replaced by nocturnal drainage flow. The comparison of the wind fields calculated with of the domain. In the southeastern corner of the domain, M E M O shows a north-northeastern directed flow, as result of the large-scale forcing. On other hand CSUMM (Fig. 5b) develops a southwest-westerly flow, downslope of the Gr~ndola mountain ridge.
4.2 Comparison with Measurements
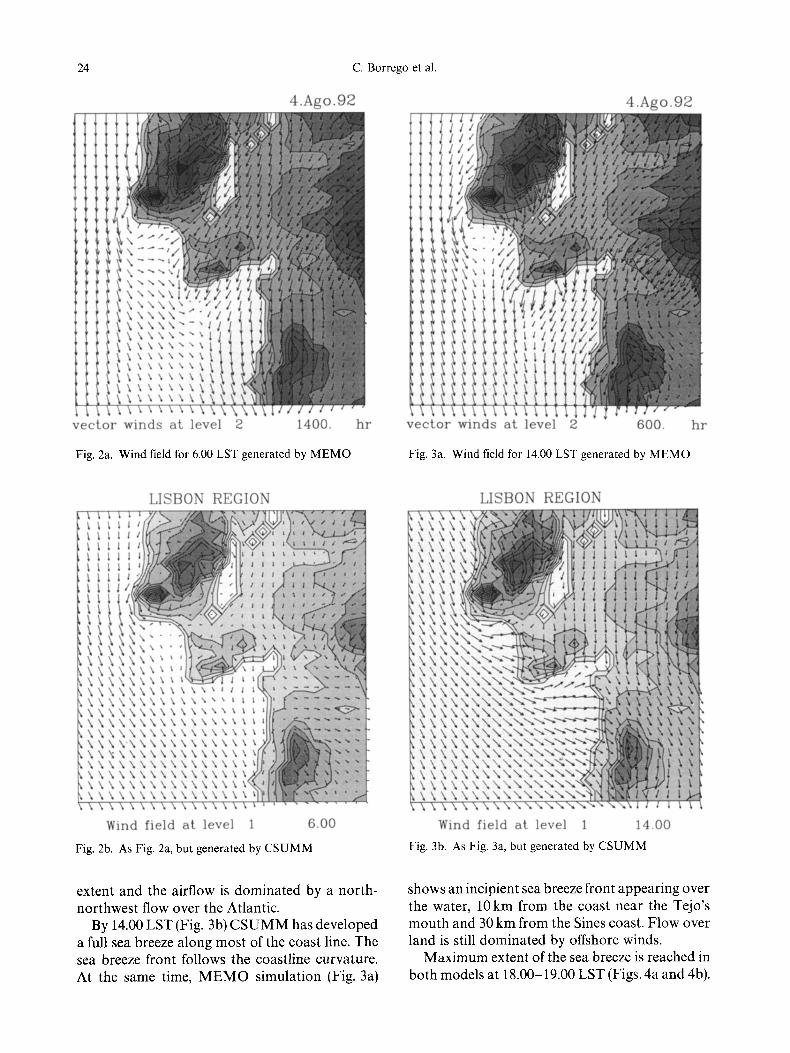
Figures 6, 7 and 8 show calculated data with M E M O and CSUMM for Carregado, Lisbon and Setfibal compared with measurements of tempe- rature, wind direction and wind velocity at 10m AGL for 4 August 1992. The locations of the meteorological stations are given in Fig. 1. Carre- gado is located approximately 35kin north of Lisbon in the plain, near the Tejo; the meteoro- logical station of the international airport of Lisbon (in the northern part of the city) is used to characterize the flow in the capital; the Setfibat station is mounted on the dunes of the Sado estuary. Data acquired in these stations should be considered representative of the average meteoro- logical conditions of the area where they are installed.
An analysis at first glance of the comparisons shows some particular features:
- f r o m the start of the run to 10.00-12.00 LST, wind direction simulated by M E M O shows an excellent agreement with measured data in the three locations.
- winds developed by M E M O are stronger than winds simulated by CSUMM.
- in 2 of the stations, Lisbon and Carregado, the temperature evolution calculated by both models are very similar. Models show a delay of 2-3 hours in the calculation of maximum tempe- ratures.
A more detailed analysis of each station exposes some interesting features. In Carregado (Fig. 6)
C a r r e g a d o 4 .Aug.92
40
a 3.5
.30
z5 20
E s 0
s
E
.-~ N -Q
w
s 0
. . . . . . . . . . . . . . . . . . . . . . . . . . . . . . . . . . . . . . . . . . .
......... i ~ i i i i i i i [ i .......... .......... .......... ........... ........ .......... .......... .......... ........... .......... ........
i i i i i i i j ' i ! . 5 < ::::::::::::::::::::: .......... ~ .......... i ........... 11111111.112....i . . . . . . . . . i ......... 6 ~
. . . . . . . . . ! i ! i i i i i i i ! . . . . . . . . . . . . . . . . . . . . . . . . . . . . . . . . . . . . . . . . . . . . . . . . . . . . . . . . . . . . . . . . . . . . . . . . . . . . . . . . . . . . . . . . . . . . . . . . . . . . . . . . . . . . . . . . . . . . . . . . . . . . . . . . . . . . . . . . . . . . . . . . .
4 8 12 1.5 20 24
H o u r L S T
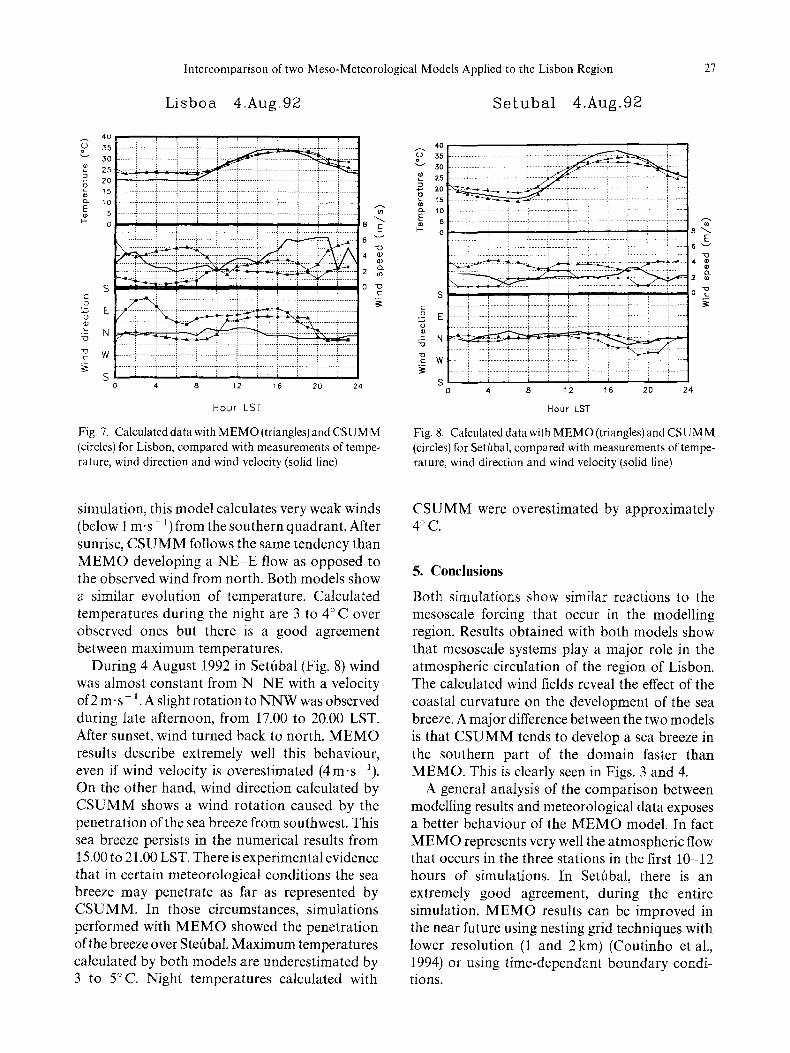
F i g . 6. C a l c u l a t e d d a t a w i t h M E M O ( t r i a n g l e s ) a n d C S U M M
( c i r c l e s ) f o r C a r r e g a d o , c o m p a r e d w i t h m e a s u r e m e n t s o f
t e m p e r a t u r e , w i n d d i r e c t i o n a n d w i n d v e l o c i t y ( s o l i d l i n e )
M E M O depicts very well the northerly wind that occurs during the night with an average velocity of 3-4 m-s- 1. CSUMM develops a northwest flow till 9.00 LST. At this moment, measured wind veers to NNE. This wind shift is well represented by both models. After 14.00 LST, a strong (6-8 m-s -1) breeze from NW is observable in the meteorological data. The breeze transports cooler air from the Ocean causing a decrease of the sur- face temperature observed in Carregado. Models do not represent adequately the entrance of the breeze. The corresponding wind shift in the models results occurs with such a delay (5 hours in CSUMM and 7 hours in MEMO) that becomes unclear which mesoscale forcing is acting during this process.
Comparison of modelling results with observa- tions in Lisbon (Fig. 7) displays a different beha- viour between M E M O and CSUMM. The direc- tion of the atmospheric flow that develops over Lisbon from 0.00 to 8,00 LST is very well represen- ted by MEMO. After 9.00 LST a small shift of wind from N to NNE occurs which lasts till 14.00 LST. This rotation is over-emphasized by MEMO, producing a flow from northeast during the after- noon of 4 August 1992 and creating a convergence zone over the mouth of the Tejo (Fig. 3a). CSUMM results expose some difficulties in the simulation of the flow. In fact during the first hours of
l n t e r c o m p a r i s o n o f t w o M e s o - M e t e o r o l o g i c a l M o d e l s A p p l i e d t o t h e L i s b o n R e g i o n 27
L i s b o a 4 . A u g . 9 2 S e f . u b a l 4 . A u g . 9 2
L. 0)
E
g L ~
g)
k3 " o
4 0 . I i ~ ~ [ 35 . . . . . . . ~ . . . . . . . . . ~ . . . . . . . . . . : . . . . . . . . . . ~ . . . . . . . . . . ~ . . . . . . . . . . ! . . . . . . . . . . . . . . . . . . . . . : . . . . . . . . . . : . . . . . . . . . . ~ . . . . . . . . . . : . . . . . . . .
z s L ~ i i ! [ i i i . ~ ~ o ........ i .......... ~ ......... i .......... ~ .......... i ......... ~ ..:: ........
z0 i ~ ~ ! . . . . . . .
5 ~ i ........... i .......... i ~ ..i .......... ! .......... i .......... i ........... i .......... ~ , ~o ....... i .......... ~ ...... i , 1 i : : ~ . . - . . s ..... i .......... " .......... ~ .......... ~ .......... i ......... i .......... - ........ i ......... i .......... ~ .......... i ........
S 0,~
b :i:j ........... i .......... ........ , .... :::::::::::::::::::::::
N
S 4 8 12 16 20 24
H o u r L S T
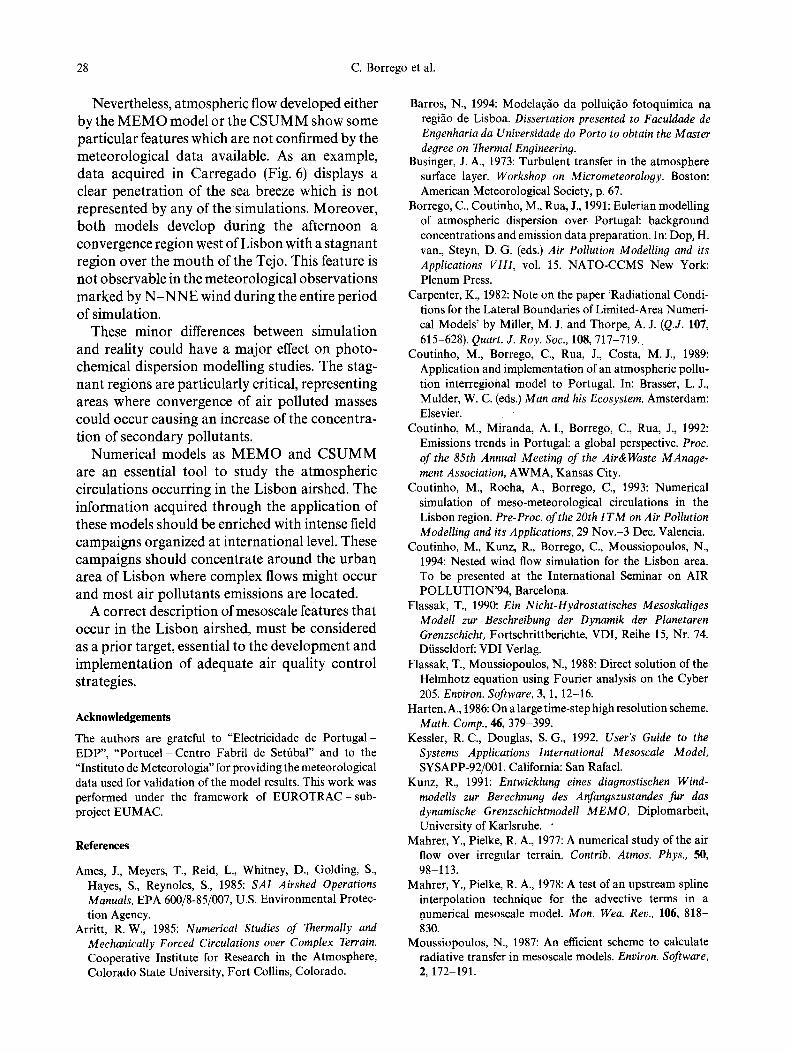
Fig . 7. C a l c u l a t e d d a t a w i t h M E M O ( t r i a n g l e s ) a n d C S U M M
(c i rc les ) f o r L i s b o n , c o m p a r e d w i t h m e a s u r e m e n t s o f t e m p e -
r a t u r e , w i n d d i r e c t i o n a n d w i n d v e l o c i t y ( s o l i d l ine)
s 5 . . . . . . . . i . . . . . . . . . . i i- i ........... i ............ ~ . . . . . . . . . . . . i . ' ..,,,.i . . . . . . ~ . . . . r j - - , =
~o ............ i ...... .... i ..... i ........... i .... i .......... : 2s : ........ i .......... ...... 4 1 ........... ~
E 2 0 ~ - : . . . . . . . . . . . . . . . . : . . . . . . . . . . . . i.. ~ . . . . . . . . . . i ........... i . . . . . . i . . . . . . . . . . . . . . . . . . . . . . . i . . . . . . . . .
; ; ......... . . . . . . . . . . i ........... i ............ ............ ............ ............ ........ ......... i .......... ,,E 5 .......... i i ........... i .......... i ............ f ............ i ~ ~- o I J I ! r . . . .
.......... :~ ...... ........... i ............ i ............ i ............ iZZIiZZII ZZil ZZII Z Z Z Z Z
s i I ! i, i I ! I i,,, I ! ....... ............ i ........... ~ ............ i ............ i ............ i ............ ~ ............ ; ............ ; ............ ~ ......... i ............ ! ............
ZII I I121Z Z 2 2 Z Z 2 Zilll Zilll Zillll Zillll Z 2 2 Z 2 Z S i J
0 4 8 12 16 20 2 4
H o u r L S T
E
2 ~
o~ W
Fig . 8. C a l c u l a t e d d a t a w i t h M E M O ( t r i a n g l e s ) a n d C S U M M
(c i rc les ) f o r S e t 6 b a l , c o m p a r e d w i t h m e a s u r e m e n t s o f t e m p e -
r a t u r e , w i n d d i r e c t i o n a n d w i n d v e l o c i t y ( s o l i d l ine)
simulat ion, this model calculates very weak winds (below 1 m.s - 1) from the southern quadran t . After sunrise, C S U M M follows the same tendency than M E M O developing a N E - E flow as opposed to the observed wind f rom north. Both models show a similar evolut ion of temperature . Calcula ted temperatures dur ing the night are 3 to 4 ~ over observed ones but there is a good agreement between m a x i m u m temperatures.
Dur ing 4 August 1992 in Setfibal (Fig. 8) wind was a lmost cons tan t from N - N E with a velocity of 2 m ' s - 1. A slight rota t ion to N N W was observed dur ing late af ternoon, f rom 17.00 to 20.00 LST. After sunset, wind turned back to north. M E M O results describe extremely well this behaviour, even if wind velocity is overes t imated (4m.s -1) . On the o ther hand, wind direct ion calculated by C S U M M shows a wind ro ta t ion caused by the penet ra t ion of the sea breeze f rom southwest . This sea breeze persists in the numerical results from 15.00 to 21.00 LST. There is experimental evidence that in certain meteorological condi t ions the sea breeze m a y penetra te as far as represented by C S U M M . In those circumstances, s imulat ions per formed with M E M O showed the penet ra t ion of the breeze over Stefibal. M a x i m u m temperatures calculated by both models are underes t imated by 3 to 5 ~ Night tempera tures calculated with
C S U M M were overest imated by approximate ly 4~
5 . C o n c l u s i o n s
Both s imulat ions show similar reactions to the mesoscale forcing that occur in the model l ing region. Results obta ined with both models show tha t mesoscale systems play a major role in the a tmospher ic circulat ion of the region of Lisbon. The calculated wind fields reveal the effect of the coastal curvature on the development of the sea breeze. A major difference between the two models is that C S U M M tends to develop a sea breeze in the southern par t of the doma in faster than M E M O . This is clearly seen in Figs. 3 and 4.
A general analysis of the compar i son between modell ing results and meteorological da ta exposes a better behaviour of the M E M O model. In fact M E M O represents very well the a tmospher ic flow that occurs in the three stat ions in the first 10-12 hours of simulations. In SetObal, there is an extremely good agreement, dur ing the entire s imulat ion. M E M O results can be improved in the near future using nesting grid techniques with lower resolut ion (1 and 2kin) (Cout inho et al., 1994) or using t ime-dependant b o u n d a r y condi- tions.
28 C. Borrego et al.
Nevertheless, atmospheric flow developed either by the MEMO model or the CSUMM show some particular features which are not confirmed by the meteorological data available. As an example, data acquired in Carregado (Fig. 6) displays a clear penetration of the sea breeze which is not represented by any of the simulations. Moreover, both models develop during the afternoon a convergence region west of Lisbon with a stagnant region over the mouth of the Tejo. This feature is not observable in the meteorological observations marked by N - N N E wind during the entire period of simulation.
These minor differences between simulation and reality could have a major effect on photo- chemical dispersion modelling studies. The stag- nant regions are particularly critical, representing areas where convergence of air polluted masses could occur causing an increase of the concentra- tion of secondary pollutants.
Numerical models as MEMO and CSUMM are an essential tool to study the atmospheric circulations occurring in the Lisbon airshed. The information acquired through the application of these models should be enriched with intense field campaigns organized at international level. These campaigns should concentrate around the urban area of Lisbon where complex flows might occur and most air pollutants emissions are located.
A correct description of mesoscale features that occur in the Lisbon airshed, must be considered as a prior target, essential to the development and implementation of adequate air quality control strategies.
Acknowledgements
The authors are grateful to "Electricidade de Portugal- EDP", "Portucel- Centro Fabril de Setfibal" and to the "Instituto de Meteorologia" for providing the meteorological data used for validation of the model results. This work was performed under the framework of EUROTRAC- sub- project EUMAC.
References
Ames, J., Meyers, T., Reid, L., Whitney, D., Golding, S., Hayes, S., Reynolcs, S., 1985: SAI Airshed Operations Manuals, EPA 600/8-85/007, U.S. Environmental Protec- tion Agency.
Arritt, R.W., 1985: Numerical Studies of Thermally and Mechanically Forced Circulations over Complex Terrain. Cooperative Institute for Research in the Atmosphere, Colorado State University, Fort Collins, Colorado.
Barros, N., 1994: Modelag~o da polluiq~o fotoquimica na regi~o de Lisboa. Dissertation presented to Faculdade de Engenharia da Universidade do Porto to obtain the Master degree on Thermal Engineering.
Businger, J. A., 1973: Turbulent transfer in the atmosphere surface layer. Workshop on Micrometeorology. Boston: American Meteorological Society, p. 67.
Borrego, C., Coutinho, M., Rua, J., 1991: Eulerian modelling of atmospheric dispersion over Portugal: background concentrations and emission data preparation. In: Dop, H. van., Steyn, D. G. (eds.) Air Pollution Modelling and its Applications VIII, vol. 15. NATO-CCMS New York: Plenum Press.
Carpenter, K., 1982: Note on the paper 'Radiational Condi- tions for the Lateral Boundaries of Limited-Area Numeri- cal Models' by Miller, M. J. and Thorpe, A. J. (Q.J. 107, 615-628). Quart. J. Roy. Soc., 108, 717-719.
Coutinho, M., Borrego, C., Rua, J., Costa, M.J., 1989: Application and implementation of an atmospheric pollu- tion interregional model to Portugal. In: Brasser, L. J., Mulder, W. C. (eds.) Man and his Ecosystem. Amsterdam: Elsevier.
Coutinho, M., Miranda, A. I., Borrego, C., Rua, J., 1992: Emissions trends in Portugal: a global perspective. Proc. of the 85th Annual Meeting of the Air&Waste MAnage- ment Association, AWMA, Kansas City.
Coutinho, M., Rocha, A., Borrego, C., 1993: Numerical simulation of meso-meteorological circulations in the Lisbon region. Pre-Proc. of the 20th ITM on Air Pollution Modelling and its Applications, 29 Nov.-3 Dec. Valencia.
Coutinho, M., Kunz, R., Borrego, C., Moussiopoulos, N., 1994: Nested wind flow simulation for the Lisbon area. To be presented at the International Seminar on AIR POLLUTION'94, Barcelona.
Flassak, T., 1990: Ein Nicht-Hydrostatisches Mesoskaliges Modell zur Beschreibung der Dynamik der Planetaren Grenzschicht, Fortschrittberichte, VDI, Reihe 15, Nr. 74. DiJsseldorf: VDI Verlag.
Flassak, T., Moussiopoulos, N., 1988: Direct solution of the Helmhotz equation using Fourier analysis on the Cyber 205. Environ. Software, 3, 1, 12-16.
Harten, A., 1986: On a large time-step high resolution scheme. Math. Comp., 46, 379-399.
Kessler, R.C., Douglas, S.G., 1992. User's Guide to the Systems Applications International Mesoscale Model, SYSAPP-92/001. California: San Rafael.
Kunz, R., 1991: Entwicklung eines diagnostischen Wind- modells zur Berechnung des Anfangszustandes fur das dynamische Grenzschichtmodell MEMO, Diplomarbeit, University of Karlsruhe. �9
Mahrer, Y., Pielke, R. A., 1977: A numerical study of the air flow over irregular terrain. Contrib. Atmos. Phys,, 50, 98-113.
Mahrer, Y., Pielke, R. A., 1978: A test of an upstream spline interpolation technique for the advective terms in a numerical mesoscale model. Mon. Wea. Rev., 106, 818- 830.
Moussiopoulos, N., 1987: An efficient scheme to calculate radiative transfer in mesoscale models. Environ. Software, 2, 172-191.
Intercomparison of two Meso-Meteorological Models Applied to the Lisbon Region 29
Moussiopoulos, N., 1989: Mathematische Modellierung mesoskaliger Ausbreitun 9 in der Atmosphi~re. Fortsch.- Ber. VDI. Reihe 15. Nr. 64.
Moussiopoulos, N., Flassak, Th., Sabra, P., Berlowitz, D., 1993: Simulation of the wind field in Athens with the non- hydrostatic mesoscale model MEMO. Environ. Software, 8, 29.
Paegle, J., Zdunkowski, W. G., Welch, R. M., 1976: Implicit differencing of predictive equations of the planetary boun- dary layer. Mon. Wea. Rev., 104, 1321-1324.
Pielke, R. A., 1974: A three-dimensional numerical model of the sea breeze over south Florida_ Mort. Wea. Rev., 102, 115-139.
Pielke, R.A., 1984: Mesoscale Meteorological Modelin 9. Orlando: Academic Press.
Tremback, C., Kessler, R. C., 1985: A surface temperature and moisture parameterization for use in mesoscale nume- rical models. Proc. 7th Conference on Numerical Weather Prediction, Montreal.
Authors' address: C. Borrego, M. Coutinho, and N. Barros, Department of Environment and Planning, University of Aveiro, P-3800 Aveiro, Portugal.


