Embed Size (px)
Citation preview

This article was downloaded by: [Universidade Tecnica de Lisboa]On: 08 September 2011, At: 06:30Publisher: RoutledgeInforma Ltd Registered in England and Wales Registered Number: 1072954 Registered office: Mortimer House,37-41 Mortimer Street, London W1T 3JH, UK
Applied EconomicsPublication details, including instructions for authors and subscription information:http://www.tandfonline.com/loi/raec20
Interdependence and spillovers: is firm performanceaffected by others’’ innovation activities?Pedro de Faria a & Francisco Lima ba Faculty of Economics and Business, Department of Innovation Management and Strategy,University of Groningen, Nettelbosje 2, 9747 AE Groningen, The Netherlandsb Instituto Superior Téécnico, Technical University of Lisbon, and CEG-IST, Av. Rovisco Pais,1049-001 Lisbon, Portugal
Available online: 08 Sep 2011
To cite this article: Pedro de Faria & Francisco Lima (2012): Interdependence and spillovers: is firm performance affected byothers’’ innovation activities?, Applied Economics, 44:36, 4765-4775
To link to this article: http://dx.doi.org/10.1080/00036846.2011.560108
PLEASE SCROLL DOWN FOR ARTICLE
Full terms and conditions of use: http://www.tandfonline.com/page/terms-and-conditions
This article may be used for research, teaching and private study purposes. Any substantial or systematicreproduction, re-distribution, re-selling, loan, sub-licensing, systematic supply or distribution in any form toanyone is expressly forbidden.
The publisher does not give any warranty express or implied or make any representation that the contentswill be complete or accurate or up to date. The accuracy of any instructions, formulae and drug doses shouldbe independently verified with primary sources. The publisher shall not be liable for any loss, actions, claims,proceedings, demand or costs or damages whatsoever or howsoever caused arising directly or indirectly inconnection with or arising out of the use of this material.
Applied Economics, 2012, 44, 4765–4775
Interdependence and spillovers:
is firm performance affected by
others’ innovation activities?
Pedro de Fariaa and Francisco Limab,*
aFaculty of Economics and Business, Department of Innovation Management
and Strategy, University of Groningen, Nettelbosje 2, 9747 AE Groningen,
The NetherlandsbInstituto Superior Tecnico, Technical University of Lisbon, and CEG-IST,
Av. Rovisco Pais, 1049-001 Lisbon, Portugal
The creation of new knowledge is a case in which agents’ behaviour can
affect the performance of other actors positively, given that new knowledge
creates positive externalities in the market. In this context, we investigate
the existence of performance spillovers associated with innovation activ-
ities by quantifying the innovation produced in surrounding firms and
controlling for the fact that a firm is itself an innovation producer. We use
data from the Third Community Innovation Survey (CIS III) that
measures innovation in a broad way, not reducing it to R&D and patents,
which departs from previous literature on spillovers. Furthermore, to
tackle the endogeneity of the innovation variables on the firm production
decision, we resort to the firm intellectual property protection methods as
an instrument. We found a positive spillover of innovation on firm value
added. The results also show that process innovation spillovers are more
prevalent than product innovation spillovers.
Keywords: innovation; spillovers; firm performance; Community
Innovation Survey
JEL Classification: D22; O31; O32
I. Introduction
R&D and innovation have characteristics of public
goods, since the investments and results achieved by
one agent can produce knowledge that is available,
almost freely, to other agents. This process is possible
when the reproduction costs for information are low,
allowing the diffusion of knowledge to actors who did
not invest in its production. As described by Adams
and Jaffe (1996), knowledge production processes
have two different types of effects: one direct, to the
firm enrolled in the knowledge production activity,
and one indirect, to other firms that benefit from the
public availability of some of the knowledge.As for the direct effect, it is broadly accepted that
R&D and innovation are essential to firm perfor-
mance. There is a positive and strong relationship
between R&D expenditures and both growth of
output and total factor productivity (Griliches,
1986; Hall and Mairesse, 1995). As for the indirect
*Corresponding author. E-mail: [email protected]
Applied Economics ISSN 0003–6846 print/ISSN 1466–4283 online � 2012 Taylor & Francis 4765http://www.informaworld.com
DOI: 10.1080/00036846.2011.560108
Dow
nloa
ded
by [
Uni
vers
idad
e T
ecni
ca d
e L
isbo
a] a
t 06:
30 0
8 Se
ptem
ber
2011
effect, the creation of new knowledge is a case inwhich agents’ behaviour can affect the performanceof other actors positively, given that new knowledgecreates positive externalities in the market. Theseexternalities are reflected in the positive differencesbetween social and private internal rates of return onR&D investments (Mansfield et al., 1977). As notedby Nadiri (1993), the social rates of return on R&D(spillovers) are on average close to 50%, varyingconsiderably across industries.1 As stated by Jaffe(1986) and Geroski (1995), the technology developedby innovation projects of one firm is useful to othersas well.
Despite the fact that this availability of knowledgecould be a hampering factor for investment inknowledge production, the existence of these positiveexternalities – knowledge spillovers – can also gener-ate a feedback mechanism that increases the overallreturns on the initial investment in research andinnovation and can benefit both producers andnonproducers of knowledge. On one hand, spilloversare important for innovative firms, since knowledgeproduction activities are associated with high levels ofuncertainty and the existence of a local innovativeculture allows agents to share similar experiences andease the exploitation of new solutions to problems(Feldman, 1993). If a firm masters its absorptivecapacity, it can take advantage, not only of its owninnovative efforts, but also of others’ investment. Theright absorptive skills can enable a firm to managethe external information flows in order to maximizethe incoming spillovers from other firms and, at thesame time, control the spillovers to those firms(Cohen and Levinthal, 1989, 1990). In other words,the production of knowledge by other firms cannotbe merely analysed as a process by which competitorsincrease their knowledge, since innovation activitiesdeveloped in other firms can produce positive spill-overs that are absorbed by firms through severalmeans: publications, reverse engineering, trade ofgoods, exchange of scientists and collaborations.On the other hand, spillovers are also important tononinnovative firms, because these firms can absorbknowledge through the implementation of incremen-tal modifications on production (products and/orprocesses). These effects are not usually identified bythe firm as innovative efforts or adoption of organi-zational innovations and therefore are not capturedby technological innovation surveys.
In this context, our analysis seeks to identify theexistence of knowledge spillovers that spring frominnovation activities and have an impact on theperformance of innovative and noninnovative firms.We use data from the Portuguese Third CommunityInnovation Survey (CIS III) that measures innova-tion in a broad way, not reducing it to R&D andpatents, which departs from previous literature onspillovers. This perspective allows us to enquire if theexistence of nonradical- and nonscience-based inno-vation activities of firms have an impact on theperformance of surrounding firms from the sameindustry.2 Moreover, firm performance is directlymeasured by value added and not by alternativemeasures such as turnover.
Since we include variables that measure the inno-vation performance of firms and the dependentvariable is value added, we may face an endogeneityproblem.3 To tackle this issue, we instrument theinnovation variable. The firm engagement in intellec-tual property protection methods is the instrumentused as there is information on this firm decision forboth innovative and noninnovative firms.
The results drove us to two main conclusions: theperformance of a firm is affected by the fact thatother firms innovate and the effect is positive. Firminnovation not only contributes to the performanceof the investing firm, but also can produce knowledgethat positively affects the performance of other firms.The results also show that process innovation spill-overs are more prevalent than product innovationspillovers.
The remainder of this study is divided into foursections. Section II develops the hypotheses afterbuilding a conceptual framework. Section IIIdescribes the data and presents the model specifica-tion. In Section IV, the main results are presented anddiscussed. Finally, Section V concludes and drawssome policy implications.
II. Conceptual Framework
The innovation capacity of firms and the diffusion,imitation and adoption of innovations have gainedincreasing importance in the analysis of economicperformance of firms, and, in particular, in explainingthe differences between the rates of growth of
1 In industries with well-defined products and strong patents, such as pharmaceuticals, firms are more successful in capturingthe research results and the social rates of return are lower.2 Surrounding firms meaning: firms belonging to the same industry, in the same region and with similar size (an industry-region-firm size cell).3 If better firms (e.g. with higher managerial capabilities) are also the ones investing in innovation, then there is a problem of acorrelation between one independent variable – innovation – and the unobserved firm characteristics.
4766 P. de Faria and F. Lima
Dow
nloa
ded
by [
Uni
vers
idad
e T
ecni
ca d
e L
isbo
a] a
t 06:
30 0
8 Se
ptem
ber
2011
different regions (Solow, 1956; Romer, 1990; Aghionand Howitt, 1992; Griliches, 1992). In particular, theexistence of knowledge spillovers is a central conceptof the theory of new growth economics (Romer, 1986;Aghion and Howitt, 1992), which stresses the cumu-lative nature of invention at the industry andgeographical level. Romer (1986), Grossman andHelpman (1991), Krugman (1991) and Audretsch andFeldman (1996), amongst others, focus on the rolethat spillovers of economic knowledge across agentsand firms play in creating increasing returns andeconomic growth.
Griliches (1979, 1992) distinguish two types ofR&D and innovation spillovers, knowledge and rentspillovers. Rent spillovers happen when firms pay lessfor inputs than the quality of these inputs is worth,more precisely, when quality improvements are notfully reflected in a product’s price or if performanceincreases in the production process lower the price ofa good. Knowledge spillovers are considered byGriliches (1992) the ‘true spillovers’. They are gener-ated when information and ideas flow from oneinstitution to another institution without payment(Griliches, 1992; De Bondt, 1996). Therefore, theycan generate virtuous cycles by attracting additionallabour and other inputs, further facilitating theexchange of ideas.
Concerning the type of relationship between theactors involved on the knowledge exchange process,spillovers can be classified as vertical spillovers, whenthere is costumer/supplier link; horizontal spillovers,when the source of spillovers is a competitor of thereceiving firm; and spillovers from universities(Nadiri, 1993; Atallah, 2002; Kaiser, 2002; Arvanitiset al., 2008). In addition, several studies analyse thedifferences between spillovers that flow from a firm’sown industry, intra-industry spillovers and spilloversthat occur between firms from different industries,inter-industry spillovers (e.g. Bernstein, 1988; Steurs,1995; Kaiser, 2002).
Following these works, several empirical analysesof R&D and productivity have recognized theimportance of spillovers. As referred to by Meagherand Rogers (2004), these studies found that spilloversbetween firms are important in explaining productiv-ity growth by comparing the roles of own researchefforts against research efforts of other firms (pool ofexternal knowledge available to a firm).
Spillovers can also be categorized according to thegeographical location of the knowledge producer andof the knowledge receiver. The relationship betweeninternational and national spillovers are the focus ofHarabi (1997), Jaffe and Trajtenberg (1999),Branstetter (2001), Keller (2002) and Negassi(2009), while regional or intra-regional spillovers are
the subject of several other studies (Arndt andSternberg, 2000; Acs et al., 2002; Fritsch andFranke, 2004; Gumbau-Albert and Maudos, 2009).Audretsch and Feldman (2004) explore the role ofgeographic proximity in the diffusion of knowledge.They find that spillovers are associated with geo-graphic proximity since tacit knowledge is inherentlynonrival in nature. They also state that an increasedconcentration of a particular industry within aspecific geographic region facilitates knowledge spill-overs across firms. The best example of this processand its economic importance is the difference in theinnovative and economic performance of two differ-ent regions of the USA: Silicon Valley and Boston’sRoute 128. The performance of the California clusteris higher because the proximity and interdependenceof the different actors is also higher (Audretsch andFeldman, 2004). In line with this work, Baptista andSwann (1998) and Jaffe et al. (1993) focus theiranalysis on the clustering process and find thatspillovers associated with R&D activity are geo-graphically localized. The concentration of techno-logically similar firms can produce several types ofeconomies for firms and attracts additional entrants(Fritsch and Franke, 2004; Aharonson et al., 2007).
The management of spillovers is also a subject ofresearch. Using the Belgium Second CommunityInnovation Survey (CIS II) database, Cassiman andVeugelers (2002) explore the effects of knowledgeflows on R&D cooperation, focussing on the distinc-tion between incoming spillovers (measured by theimportance of publicly available information for theinnovation process of the firm) and appropriability.They consider that the ability to absorb incomingspillovers from other firms or institutions is linked tothe innovation activities of the firm (e.g. own R&D),participation in cooperative agreements, and thetechnological opportunities in the industry. Theyfind that the level of knowledge of in- and outflows isnot exogenous to the firm since firms, through theirinnovation activities, can model their incoming spill-overs and appropriation capabilities. Also using theCommunity Innovation Survey database, Crespi et al.(2008) analyse, in the UK context, the effect ofknowledge flows on the productivity of firms andconclude that most relevant spillovers are associatedwith competitors and that multinational presencemay be an important source of these spillovers.
Our analysis follows the works described abovethat seek to identify the existence of knowledgespillovers that spring from innovation activities andhave an impact on the performance of the firm. Moreprecisely, we will address the following main researchquestion: is firm performance positively affected bythe fact that other firms located in the same region
Interdependence and spillovers 4767
Dow
nloa
ded
by [
Uni
vers
idad
e T
ecni
ca d
e L
isbo
a] a
t 06:
30 0
8 Se
ptem
ber
2011
and from the same industry innovate (radically ornot)? Our goal is to add new evidence to theknowledge spillovers literature, where nearly everystudy considers only spillovers associated with R&Dand patenting activities (Bottazzi and Peri, 2003;Chen and Yang, 2005; Aharonson et al., 2007;Alcacer and Chung, 2007). In most regions andindustries, R&D and patenting are not activitieswidely implemented by the majority of firms. So, ifwe want to study the spillovers that occur in aneconomy that is not on the technological frontier andwhere most firms are technology adopters and notradical innovators, we cannot focus our analysis onR&D and patents.
Following this perspective, we measure innovationin a broader way than the radical innovation orscientific-based innovation, a standpoint that fitscountries like Portugal.4 We will enquire if firmsare affected not only by the R&D and radicalinnovation but also by small product and processinnovation increments developed by other firmswithin the same region and industry. We seekto identify a possible effect of being included inan environment where firms strive to evolve techno-logically even if not contributing with new knowledgeto society.
To attain this goal we use the Portuguese CIS IIIdatabase, which provides information on the inno-vative performance of manufacturing and servicefirms, as well as their overall performance. Drawingon the information about the innovative behaviourof firms, we built a variable that summarizes theinnovative performance of firms from the sameregion, industry and size of a firm.5 We consider aproduction function with value added as the depen-dent variable and the variable measuring the innova-tion of other firms as a regressor to measure theindirect effect of innovation on performance of firmsof the same industry and region. In this way, weassess regional, inter-industry knowledge spilloversassociated to innovation activities. By incorporating ameasure of ‘borrowed’ innovation into a productionfunction, and following the influential work ofGriliches (1979), which first added data on R&D tothe list of inputs entering the production function, weverify whether spillovers play an important role inenhancing firm performance.
III. Data and Model Specification
This section describes the data used to address theresearch questions. In addition, it presents the modelspecification and the methodological issues associ-ated with it.
Data
Testing if the knowledge produced by firms’ innova-tion activities spills over to other firms requiresmicro-level data with matching firm-level informa-tion on innovation and production. This informationcan be found in the Portuguese CommunityInnovation Survey (CIS) database. The CIS, executedunder the supervision of Eurostat, is focused on theobservation and collection of quantitative data ontechnological innovation. The sample is representa-tive of the population of the manufacturing sectorand also of five selected service sectors (and onlyfirms with more than 10 employees were considered).The usual consistency and logical tests, as well ascorrections for possible bias associated with non-responses, were performed for each country at thefirm level.
Developed under the guiding principles of the OsloInnovation Manual (Organization for EconomicCooperation and Development (OECD), 1992), thesurvey aims at collecting data on innovation under-stood from a broad firm perspective, rather thanexamining just the invention process. Thus, the CIScaptures a larger variety of innovation activities thanjust R&D expenditures, including the acquisition ofpatents and licenses, product design, personnel train-ing, trial production and market analysis. Moreover,it includes measures of innovative output notreflected in the submission of patent filings, includingthe introduction of innovative production processesand organizational changes. The importance of theCIS data is attested by a number of recent works thatdraw on this survey. Results obtained by Cassimanand Veugelers (2002) and Mohnen and Dagenais(2002) are good examples of the growing use of theCIS data to further our understanding of innovationat the micro level.6
The survey enquires if firms have introduced atleast one innovation in the period from 1998 to 2000.
4 Portugal has 4.8 patent applications to the European Patent Office (EPO) per million inhabitants and 0.8% of GrossDomestic Product (GDP) dedicated to R&D (Eurostat, 2007).5We measure spillovers controlling for the factors that Griliches (1992) consider important: relative position in the valuechain; technological intensity and geographic distance. Following this statement, Kafouros and Buckley (2008) find that, eventhough all firms benefit (in terms of productivity) from their own R&D, only small firms and firms from high-tech sectorsbenefit from the innovation activities undertaken by other firms of the same or other industries.6 Smith et al. (2004) and Negassi (2009) are also recent studies using CIS data. These papers also show the capabilities of thesurvey when CIS data is merged with other data sources and where the longitudinal dimension is available and explored.
4768 P. de Faria and F. Lima
Dow
nloa
ded
by [
Uni
vers
idad
e T
ecni
ca d
e L
isbo
a] a
t 06:
30 0
8 Se
ptem
ber
2011
Specifically, the innovation question is asked as abinary query: has your firm incorporated any inno-vation in the last 3 years? This query was comple-mented by a validation question, which asked firmsto describe the innovations. If the answer to thisquestion was no, it asked if the firm had tried toinnovate. To the firm that either introduced orattempted to introduce an innovation, a number ofquestions associated with the innovation processfollowed. The survey also collects information onthe expenditures on innovation activities, such asintramural and extramural R&D, acquisition ofmachinery or other external knowledge, training,market introduction of innovation, design or othertypes of preparations for the production or distribu-tion of innovation.
These two variables – engagement in innovationactivities and expenditures in innovation – are thecritical indicators of innovative activity considered inthis article. Using these variables provides a numberof advantages. First, we look at innovation in a broadsense, not only at the adoption of a specifictechnological innovation. Second, it provides infor-mation about innovations beyond that linked topatent applications. As mentioned above, this helpsto understand the innovation process in countrieswhere patents are not common, or that are far fromthe technological frontier, such as Portugal. Finally,we can investigate differences between product andprocess innovation, in order to enquire if demandenhancing and cost reducing innovations have differ-ent effects on firms’ performance, as stated in severalstudies (Leiponen, 2000; Rouvinen, 2002).
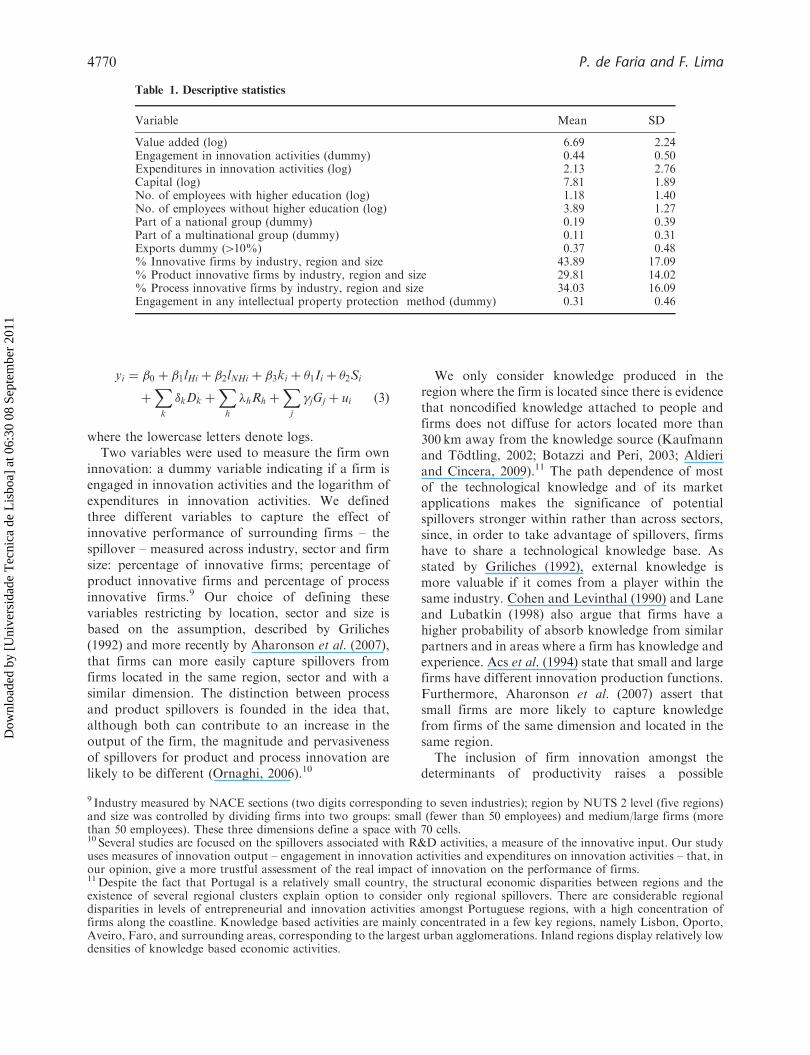
Table 1 presents the mean and SD of the variablesused in this study. The survey provides data on firm’svalue added, capital, number of employees and theirschooling levels, if the firm belongs to a national ormultinational group, the exports weight on turnoverand the above measures of innovation activities.7
As can be seen from Table 1, 44% of the firmsthat answered the survey reported some kind ofinnovation activities. The innovation activities can beseparated between process and product innovation,30% and 35% respectively. Concerning theworkforce structure, on average, employees withhigher education are a minority in this sample.In addition, there is a higher variance in thenumber of employees with higher education than inthe number of employees without this level of
education, given an indication that there aresignificant differences between firms regardingabsorptive capacity. Finally, only 19% and 11% ofthe firms are part of a national and multinationalgroup, respectively; only 37% export more than10% of their turnover; and the majority are notengaged in any intellectual property protectionmethod (69%).
Model
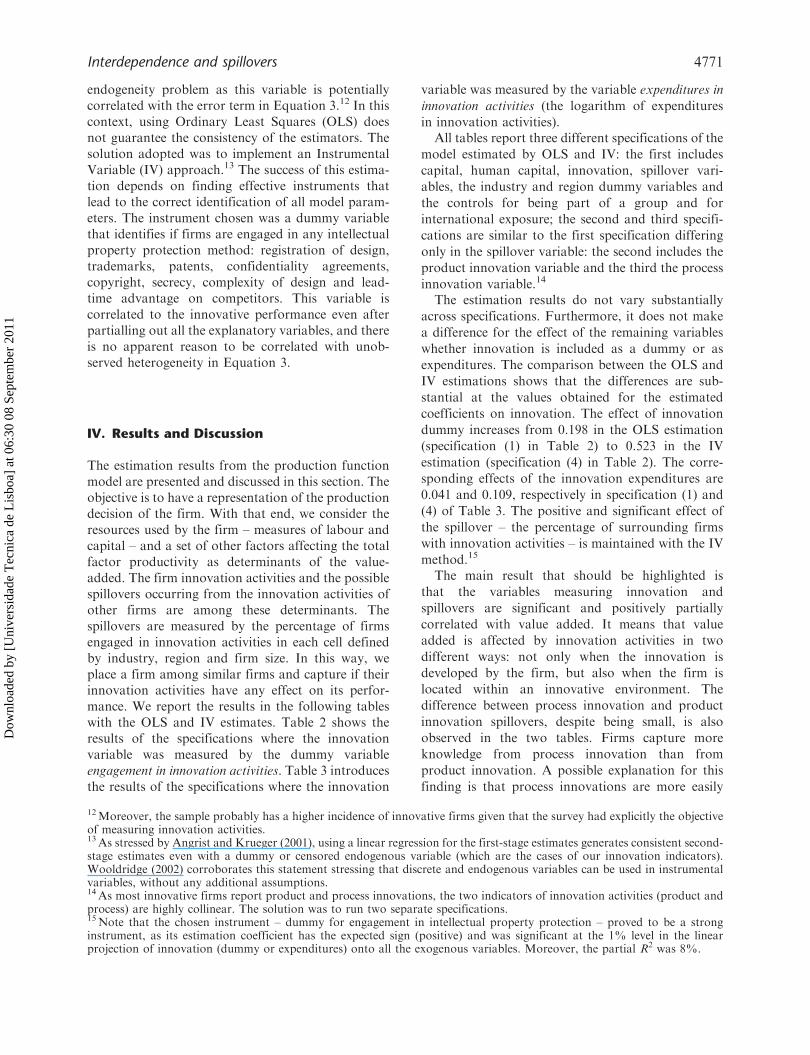
We consider a production function model to analysethe existence of knowledge spillovers associated withinnovation activities. We quantify the innovationproduced in surrounding firms by the percentage ofinnovative firms across industry, sector and size andcontrol for the fact that a firm itself can be aninnovation producer. We assume a value-addedCobb–Douglas production function for firm i withthe following specification8:
Yi ¼ AiL�1HiL
�2NHiK
�3ieui ð1Þ
where LH and LNH are the number of employees withhigher education (college or higher) and withouthigher education, respectively, in order to control forthe qualifications of the workforce and measure theabsorptive capacity of the firm; K is capital and u is astochastic disturbance. The total factor productivityparameter (A) is assumed to be driven by exports,inclusion in a group (national or multinational),industry and region characteristics and the innova-tion activities of the firm and surrounding firms.We define A as
Ai¼ exp �1Iiþ�2SiþXk
�kDkþXh
�hRhþXj
�jGj
!
ð2Þ
where I and S are indicators of innovation activitiesof the firm and the surrounding firms, respectively.The industry (D) and region (R) dummies capturedifferences in market and technological opportunitiesacross industries and regions. The dummies fordifferences in internal organization and firm perfor-mance (G ) are defined as firm belonging to a nationalgroup and/or a multinational group, and firm exportsare higher than 10% of its turnover. Taking loga-rithms, the production function becomes,
7 The survey does not provide information on the book values of capital stock for equipment and structures. Therefore, wehad to resort to the closest variables available: the value of gross investment in tangible goods and an indicator of capital usecalculated by the difference between turnover and value added. We assume that the sum of these two variables reflects therelative levels of capital stock employed by firms.8 Value added is used instead of productivity (value added per worker) because the use of productivity implies a restriction ofthe coefficients and constant returns to scale. The variable value added is specific to the Portuguese CIS.
Interdependence and spillovers 4769
Dow
nloa
ded
by [
Uni
vers
idad
e T
ecni
ca d
e L
isbo
a] a
t 06:
30 0
8 Se
ptem
ber
2011
yi ¼ �0 þ �1lHi þ �2lNHi þ �3ki þ �1Ii þ �2Si
þXk
�kDk þXh
�hRh þXj
�jGj þ ui ð3Þ
where the lowercase letters denote logs.Two variables were used to measure the firm own
innovation: a dummy variable indicating if a firm isengaged in innovation activities and the logarithm ofexpenditures in innovation activities. We definedthree different variables to capture the effect ofinnovative performance of surrounding firms – thespillover – measured across industry, sector and firmsize: percentage of innovative firms; percentage ofproduct innovative firms and percentage of processinnovative firms.9 Our choice of defining thesevariables restricting by location, sector and size isbased on the assumption, described by Griliches(1992) and more recently by Aharonson et al. (2007),that firms can more easily capture spillovers fromfirms located in the same region, sector and with asimilar dimension. The distinction between processand product spillovers is founded in the idea that,although both can contribute to an increase in theoutput of the firm, the magnitude and pervasivenessof spillovers for product and process innovation arelikely to be different (Ornaghi, 2006).10
We only consider knowledge produced in theregion where the firm is located since there is evidencethat noncodified knowledge attached to people andfirms does not diffuse for actors located more than300 km away from the knowledge source (Kaufmannand Todtling, 2002; Botazzi and Peri, 2003; Aldieriand Cincera, 2009).11 The path dependence of mostof the technological knowledge and of its marketapplications makes the significance of potentialspillovers stronger within rather than across sectors,since, in order to take advantage of spillovers, firmshave to share a technological knowledge base. Asstated by Griliches (1992), external knowledge ismore valuable if it comes from a player within thesame industry. Cohen and Levinthal (1990) and Laneand Lubatkin (1998) also argue that firms have ahigher probability of absorb knowledge from similarpartners and in areas where a firm has knowledge andexperience. Acs et al. (1994) state that small and largefirms have different innovation production functions.Furthermore, Aharonson et al. (2007) assert thatsmall firms are more likely to capture knowledgefrom firms of the same dimension and located in thesame region.
The inclusion of firm innovation amongst thedeterminants of productivity raises a possible
Table 1. Descriptive statistics
Variable Mean SD
Value added (log) 6.69 2.24Engagement in innovation activities (dummy) 0.44 0.50Expenditures in innovation activities (log) 2.13 2.76Capital (log) 7.81 1.89No. of employees with higher education (log) 1.18 1.40No. of employees without higher education (log) 3.89 1.27Part of a national group (dummy) 0.19 0.39Part of a multinational group (dummy) 0.11 0.31Exports dummy (410%) 0.37 0.48% Innovative firms by industry, region and size 43.89 17.09% Product innovative firms by industry, region and size 29.81 14.02% Process innovative firms by industry, region and size 34.03 16.09Engagement in any intellectual property protection method (dummy) 0.31 0.46
9 Industry measured by NACE sections (two digits corresponding to seven industries); region by NUTS 2 level (five regions)and size was controlled by dividing firms into two groups: small (fewer than 50 employees) and medium/large firms (morethan 50 employees). These three dimensions define a space with 70 cells.10 Several studies are focused on the spillovers associated with R&D activities, a measure of the innovative input. Our studyuses measures of innovation output – engagement in innovation activities and expenditures on innovation activities – that, inour opinion, give a more trustful assessment of the real impact of innovation on the performance of firms.11Despite the fact that Portugal is a relatively small country, the structural economic disparities between regions and theexistence of several regional clusters explain option to consider only regional spillovers. There are considerable regionaldisparities in levels of entrepreneurial and innovation activities amongst Portuguese regions, with a high concentration offirms along the coastline. Knowledge based activities are mainly concentrated in a few key regions, namely Lisbon, Oporto,Aveiro, Faro, and surrounding areas, corresponding to the largest urban agglomerations. Inland regions display relatively lowdensities of knowledge based economic activities.
4770 P. de Faria and F. Lima
Dow
nloa
ded
by [
Uni
vers
idad
e T
ecni
ca d
e L
isbo
a] a
t 06:
30 0
8 Se
ptem
ber
2011
endogeneity problem as this variable is potentiallycorrelated with the error term in Equation 3.12 In thiscontext, using Ordinary Least Squares (OLS) doesnot guarantee the consistency of the estimators. Thesolution adopted was to implement an InstrumentalVariable (IV) approach.13 The success of this estima-tion depends on finding effective instruments thatlead to the correct identification of all model param-eters. The instrument chosen was a dummy variablethat identifies if firms are engaged in any intellectualproperty protection method: registration of design,trademarks, patents, confidentiality agreements,copyright, secrecy, complexity of design and lead-time advantage on competitors. This variable iscorrelated to the innovative performance even afterpartialling out all the explanatory variables, and thereis no apparent reason to be correlated with unob-served heterogeneity in Equation 3.
IV. Results and Discussion
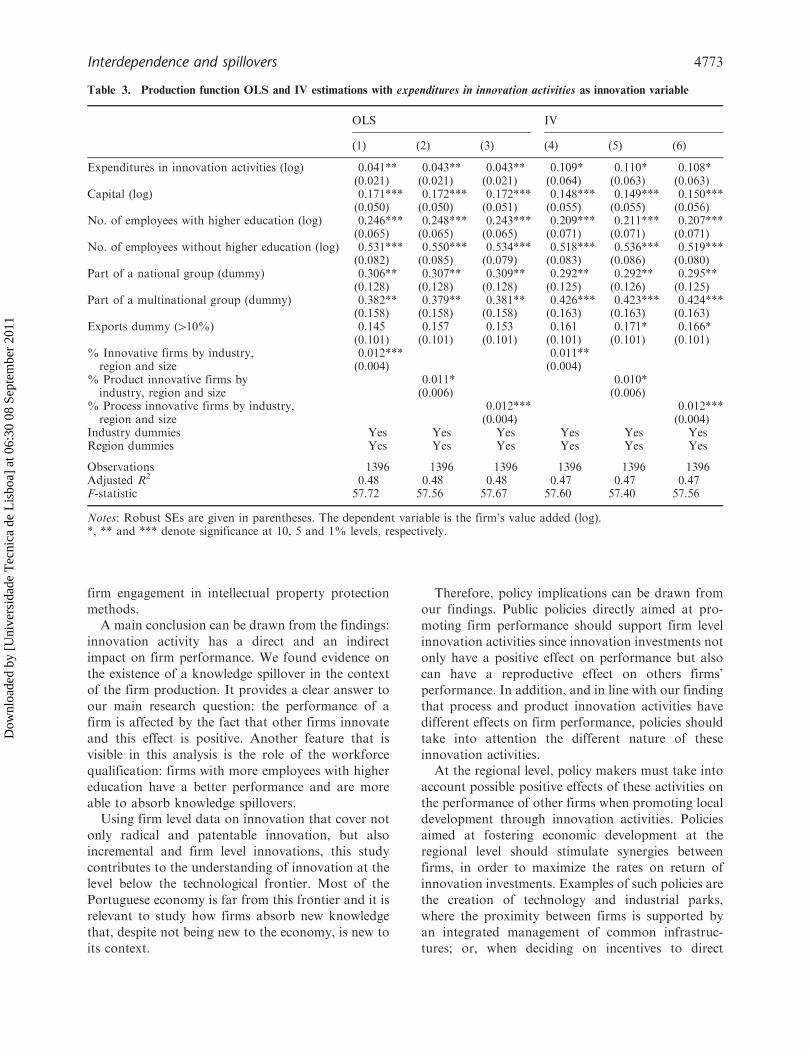
The estimation results from the production functionmodel are presented and discussed in this section. Theobjective is to have a representation of the productiondecision of the firm. With that end, we consider theresources used by the firm – measures of labour andcapital – and a set of other factors affecting the totalfactor productivity as determinants of the value-added. The firm innovation activities and the possiblespillovers occurring from the innovation activities ofother firms are among these determinants. Thespillovers are measured by the percentage of firmsengaged in innovation activities in each cell definedby industry, region and firm size. In this way, weplace a firm among similar firms and capture if theirinnovation activities have any effect on its perfor-mance. We report the results in the following tableswith the OLS and IV estimates. Table 2 shows theresults of the specifications where the innovationvariable was measured by the dummy variableengagement in innovation activities. Table 3 introducesthe results of the specifications where the innovation
variable was measured by the variable expenditures in
innovation activities (the logarithm of expenditures
in innovation activities).All tables report three different specifications of the
model estimated by OLS and IV: the first includes
capital, human capital, innovation, spillover vari-
ables, the industry and region dummy variables and
the controls for being part of a group and for
international exposure; the second and third specifi-
cations are similar to the first specification differing
only in the spillover variable: the second includes the
product innovation variable and the third the process
innovation variable.14
The estimation results do not vary substantially
across specifications. Furthermore, it does not make
a difference for the effect of the remaining variables
whether innovation is included as a dummy or as
expenditures. The comparison between the OLS and
IV estimations shows that the differences are sub-
stantial at the values obtained for the estimated
coefficients on innovation. The effect of innovation
dummy increases from 0.198 in the OLS estimation
(specification (1) in Table 2) to 0.523 in the IV
estimation (specification (4) in Table 2). The corre-
sponding effects of the innovation expenditures are
0.041 and 0.109, respectively in specification (1) and
(4) of Table 3. The positive and significant effect of
the spillover – the percentage of surrounding firms
with innovation activities – is maintained with the IV
method.15
The main result that should be highlighted is
that the variables measuring innovation and
spillovers are significant and positively partially
correlated with value added. It means that value
added is affected by innovation activities in two
different ways: not only when the innovation is
developed by the firm, but also when the firm is
located within an innovative environment. The
difference between process innovation and product
innovation spillovers, despite being small, is also
observed in the two tables. Firms capture more
knowledge from process innovation than from
product innovation. A possible explanation for this
finding is that process innovations are more easily
12Moreover, the sample probably has a higher incidence of innovative firms given that the survey had explicitly the objectiveof measuring innovation activities.13As stressed by Angrist and Krueger (2001), using a linear regression for the first-stage estimates generates consistent second-stage estimates even with a dummy or censored endogenous variable (which are the cases of our innovation indicators).Wooldridge (2002) corroborates this statement stressing that discrete and endogenous variables can be used in instrumentalvariables, without any additional assumptions.14As most innovative firms report product and process innovations, the two indicators of innovation activities (product andprocess) are highly collinear. The solution was to run two separate specifications.15Note that the chosen instrument – dummy for engagement in intellectual property protection – proved to be a stronginstrument, as its estimation coefficient has the expected sign (positive) and was significant at the 1% level in the linearprojection of innovation (dummy or expenditures) onto all the exogenous variables. Moreover, the partial R2 was 8%.
Interdependence and spillovers 4771
Dow
nloa
ded
by [
Uni
vers
idad
e T
ecni
ca d
e L
isbo
a] a
t 06:
30 0
8 Se
ptem
ber
2011
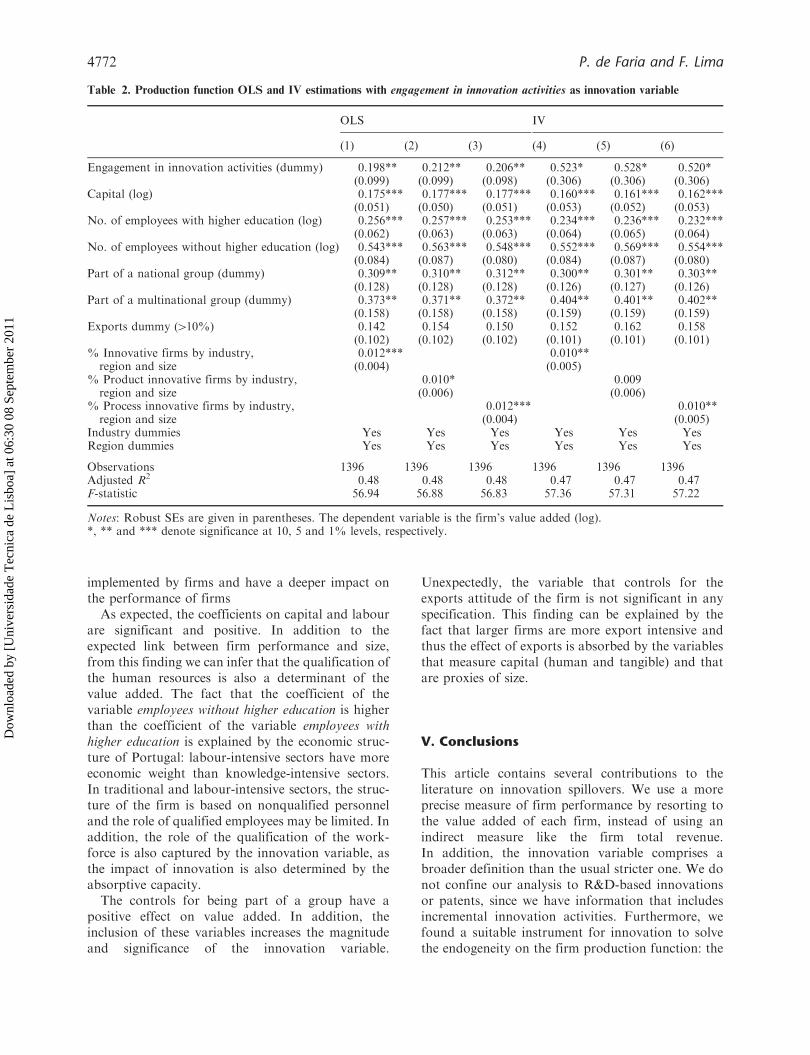
implemented by firms and have a deeper impact onthe performance of firms
As expected, the coefficients on capital and labourare significant and positive. In addition to theexpected link between firm performance and size,from this finding we can infer that the qualification ofthe human resources is also a determinant of thevalue added. The fact that the coefficient of thevariable employees without higher education is higherthan the coefficient of the variable employees withhigher education is explained by the economic struc-ture of Portugal: labour-intensive sectors have moreeconomic weight than knowledge-intensive sectors.In traditional and labour-intensive sectors, the struc-ture of the firm is based on nonqualified personneland the role of qualified employees may be limited. Inaddition, the role of the qualification of the work-force is also captured by the innovation variable, asthe impact of innovation is also determined by theabsorptive capacity.
The controls for being part of a group have apositive effect on value added. In addition, theinclusion of these variables increases the magnitudeand significance of the innovation variable.
Unexpectedly, the variable that controls for theexports attitude of the firm is not significant in anyspecification. This finding can be explained by thefact that larger firms are more export intensive andthus the effect of exports is absorbed by the variablesthat measure capital (human and tangible) and thatare proxies of size.
V. Conclusions
This article contains several contributions to theliterature on innovation spillovers. We use a moreprecise measure of firm performance by resorting tothe value added of each firm, instead of using anindirect measure like the firm total revenue.In addition, the innovation variable comprises abroader definition than the usual stricter one. We donot confine our analysis to R&D-based innovationsor patents, since we have information that includesincremental innovation activities. Furthermore, wefound a suitable instrument for innovation to solvethe endogeneity on the firm production function: the
Table 2. Production function OLS and IV estimations with engagement in innovation activities as innovation variable
OLS IV
(1) (2) (3) (4) (5) (6)
Engagement in innovation activities (dummy) 0.198** 0.212** 0.206** 0.523* 0.528* 0.520*(0.099) (0.099) (0.098) (0.306) (0.306) (0.306)
Capital (log) 0.175*** 0.177*** 0.177*** 0.160*** 0.161*** 0.162***(0.051) (0.050) (0.051) (0.053) (0.052) (0.053)
No. of employees with higher education (log) 0.256*** 0.257*** 0.253*** 0.234*** 0.236*** 0.232***(0.062) (0.063) (0.063) (0.064) (0.065) (0.064)
No. of employees without higher education (log) 0.543*** 0.563*** 0.548*** 0.552*** 0.569*** 0.554***(0.084) (0.087) (0.080) (0.084) (0.087) (0.080)
Part of a national group (dummy) 0.309** 0.310** 0.312** 0.300** 0.301** 0.303**(0.128) (0.128) (0.128) (0.126) (0.127) (0.126)
Part of a multinational group (dummy) 0.373** 0.371** 0.372** 0.404** 0.401** 0.402**(0.158) (0.158) (0.158) (0.159) (0.159) (0.159)
Exports dummy (410%) 0.142 0.154 0.150 0.152 0.162 0.158(0.102) (0.102) (0.102) (0.101) (0.101) (0.101)
% Innovative firms by industry,region and size
0.012*** 0.010**(0.004) (0.005)
% Product innovative firms by industry,region and size
0.010* 0.009(0.006) (0.006)
% Process innovative firms by industry,region and size
0.012*** 0.010**(0.004) (0.005)
Industry dummies Yes Yes Yes Yes Yes YesRegion dummies Yes Yes Yes Yes Yes Yes
Observations 1396 1396 1396 1396 1396 1396Adjusted R2 0.48 0.48 0.48 0.47 0.47 0.47F-statistic 56.94 56.88 56.83 57.36 57.31 57.22
Notes: Robust SEs are given in parentheses. The dependent variable is the firm’s value added (log).*, ** and *** denote significance at 10, 5 and 1% levels, respectively.
4772 P. de Faria and F. Lima
Dow
nloa
ded
by [
Uni
vers
idad
e T
ecni
ca d
e L
isbo
a] a
t 06:
30 0
8 Se
ptem
ber
2011
firm engagement in intellectual property protectionmethods.
A main conclusion can be drawn from the findings:
innovation activity has a direct and an indirectimpact on firm performance. We found evidence on
the existence of a knowledge spillover in the contextof the firm production. It provides a clear answer to
our main research question: the performance of afirm is affected by the fact that other firms innovate
and this effect is positive. Another feature that isvisible in this analysis is the role of the workforce
qualification: firms with more employees with highereducation have a better performance and are more
able to absorb knowledge spillovers.Using firm level data on innovation that cover not
only radical and patentable innovation, but alsoincremental and firm level innovations, this study
contributes to the understanding of innovation at thelevel below the technological frontier. Most of the
Portuguese economy is far from this frontier and it isrelevant to study how firms absorb new knowledge
that, despite not being new to the economy, is new toits context.
Therefore, policy implications can be drawn fromour findings. Public policies directly aimed at pro-
moting firm performance should support firm levelinnovation activities since innovation investments notonly have a positive effect on performance but alsocan have a reproductive effect on others firms’
performance. In addition, and in line with our findingthat process and product innovation activities havedifferent effects on firm performance, policies should
take into attention the different nature of theseinnovation activities.
At the regional level, policy makers must take intoaccount possible positive effects of these activities onthe performance of other firms when promoting local
development through innovation activities. Policiesaimed at fostering economic development at theregional level should stimulate synergies between
firms, in order to maximize the rates on return ofinnovation investments. Examples of such policies arethe creation of technology and industrial parks,
where the proximity between firms is supported byan integrated management of common infrastruc-tures; or, when deciding on incentives to direct
Table 3. Production function OLS and IV estimations with expenditures in innovation activities as innovation variable
OLS IV
(1) (2) (3) (4) (5) (6)
Expenditures in innovation activities (log) 0.041** 0.043** 0.043** 0.109* 0.110* 0.108*(0.021) (0.021) (0.021) (0.064) (0.063) (0.063)
Capital (log) 0.171*** 0.172*** 0.172*** 0.148*** 0.149*** 0.150***(0.050) (0.050) (0.051) (0.055) (0.055) (0.056)
No. of employees with higher education (log) 0.246*** 0.248*** 0.243*** 0.209*** 0.211*** 0.207***(0.065) (0.065) (0.065) (0.071) (0.071) (0.071)
No. of employees without higher education (log) 0.531*** 0.550*** 0.534*** 0.518*** 0.536*** 0.519***(0.082) (0.085) (0.079) (0.083) (0.086) (0.080)
Part of a national group (dummy) 0.306** 0.307** 0.309** 0.292** 0.292** 0.295**(0.128) (0.128) (0.128) (0.125) (0.126) (0.125)
Part of a multinational group (dummy) 0.382** 0.379** 0.381** 0.426*** 0.423*** 0.424***(0.158) (0.158) (0.158) (0.163) (0.163) (0.163)
Exports dummy (410%) 0.145 0.157 0.153 0.161 0.171* 0.166*(0.101) (0.101) (0.101) (0.101) (0.101) (0.101)
% Innovative firms by industry,region and size
0.012*** 0.011**(0.004) (0.004)
% Product innovative firms byindustry, region and size
0.011* 0.010*(0.006) (0.006)
% Process innovative firms by industry,region and size
0.012*** 0.012***(0.004) (0.004)
Industry dummies Yes Yes Yes Yes Yes YesRegion dummies Yes Yes Yes Yes Yes Yes
Observations 1396 1396 1396 1396 1396 1396Adjusted R2 0.48 0.48 0.48 0.47 0.47 0.47F-statistic 57.72 57.56 57.67 57.60 57.40 57.56
Notes: Robust SEs are given in parentheses. The dependent variable is the firm’s value added (log).*, ** and *** denote significance at 10, 5 and 1% levels, respectively.
Interdependence and spillovers 4773
Dow
nloa
ded
by [
Uni
vers
idad
e T
ecni
ca d
e L
isbo
a] a
t 06:
30 0
8 Se
ptem
ber
2011
foreign investment, the government has to take intoaccount the possible knowledge spillovers, in additionto the effects on the employment creation or directtechnology transfers between firms. In the Portuguesecontext, these are very important results, given thatthey stress the role of two priority issues for thecountry: education and institutional trust – anessential condition for the creation of cooperationarrangements that facilitate knowledge creation andspillovers.
Acknowledgements
The authors would like to thank Marco Vivarelli,Maria do Rosario Martins, Tobias Schmidt,Wolfgang Sofka and the participants of theEuropean Regional Science Association (ERSA)47th Congress, DRUID-DIME Academy Winter2008 PhD Conference, and 2008 Technology,Management and Policy Graduate ConsortiumAnnual Meeting for their valuable comments. Theresearch reported in this article was partially sup-ported by Gabinete de Planeamento, Estrategia,Avaliacao e Relacoes Internacionais (GPEARI)[Statistical Office of the Ministry for Science andHigher Education, Portugal], by the project PTDC/ESC/67665/2006 of the Portuguese Foundation forScience and Technology (FCT) and by theCOINVEST project, www.coinvest.org.uk, fundedby the European Commission Seventh FrameworkProgramme, Theme 9, Socio-economic Science andHumanities, grant number 217512. The authors aregrateful to the Portuguese Foundation for Scienceand Technology (FCT) – POS_C Programme – for itsfinancial support. Substantial parts of this researchwere conducted while Pedro de Faria was at INþCenter for Innovation, Technology and PolicyResearch, Instituto Superior Tecnico, Portugal.
References
Acs, Z., Anselin, L. and Varga, A. (2002) Patents andinnovation counts as measures of regional productionof new knowledge, Research Policy, 31, 1069–85.
Acs, Z., Audretsch, D. and Feldman, M. (1994) R&Dspillovers and recipient firm size, Review of Economicsand Statistics, 76, 336–40.
Adams, J. and Jaffe, A. (1996) Bounding the effects ofR&D: an investigation using matched establishment-firm data, The RAND Journal of Economics, 27,700–21.
Aghion, P. and Howitt, P. (1992) A model of growththrough creative destruction, Econometrica, 60,323–51.
Aharonson, B., Baum, J. and Feldman, M. (2007)Desperately seeking spillovers? Increasing returns,industrial organization and the location of newentrants in geographic and technological space,Industrial and Corporate Change, 16, 89–130.
Alcacer, J. and Chung, W. (2007) Location strategies andknowledge spillovers, Management Science, 53,760–76.
Aldieri, L. and Cincera, M. (2009) Geographic andtechnological R&D spillovers within the triad: microevidence from US patents, Journal of TechnologyTransfer, 34, 196–211.
Angrist, J. and Krueger, A. (2001) Instrumental variablesand the search for identification: from supply anddemand to natural experiments, Journal of EconomicPerspectives, 15, 69–85.
Arndt, O. and Sternberg, R. (2000) Do manufacturingfirms profit from intraregional innovation linkages?An empirical based answer, European PlanningStudies, 8, 465–85.
Arvanitis, S., Sydow, N. and Woerter, M. (2008) Is thereany impact of university–industry knowledge transferon innovation and productivity? An empirical analysisbased on Swiss firm data, Review of IndustrialOrganization, 32, 77–94.
Atallah, G. (2002) Vertical R&D spillovers, cooperation,market structure, and innovation, Economics ofInnovation and New Technology, 11, 179–209.
Audretsch, D. and Feldman, M. (1996) R&D spillovers andthe geography of innovation and production,American Economic Review, 86, 253–73.
Audretsch, D. and Feldman, M. (2004) Knowledge spill-overs and the geography of innovation, in Handbookof Regional and Urban Economics, Vol. 4 (Eds)V. Henderson and J. Thisse, Elsevier, Amsterdam,pp. 2713–39.
Baptista, R. and Swann, P. (1998) Do firms in clustersinnovate more?, Research Policy, 27, 525–40.
Bernstein, J. (1988) Costs of production, intra- and inter-industry R&D spillovers: Canadian evidence,Canadian Journal of Economics, 21, 324–47.
Bottazzi, L. and Peri, G. (2003) Innovation and spilloversin regions: evidence from European patent data,European Economic Review, 47, 687–710.
Branstetter, L. (2001) Are knowledge spillovers interna-tional or intranational in scope?, Journal ofInternational Economics, 53, 53–80.
Cassiman, B. and Veugelers, R. (2002) R&D cooperationand spillovers: some empirical evidence from Belgium,American Economic Review, 92, 1169–84.
Chen, J.-R. and Yang, C.-H. (2005) Technological knowl-edge, spillover and productivity: evidence fromTaiwanese firm level panel data, Applied Economics,37, 2361–71.
Cohen, W. and Levinthal, D. (1989) Innovation andlearning: the two faces of R&D, The EconomicJournal, 99, 569–96.
Cohen, W. and Levinthal, D. (1990) Absorptive capacity:a new perspective on learning and innovation,Administrative Science Quarterly, 35, 128–52.
Crespi, G., Criscuolo, C., Haskel, J. and Slaughter, M.(2008) Productivity growth, knowledge flows andspillovers, NBER Working Paper No. 13959.
De Bondt, R. (1996) Spillovers and innovation activities,International Journal of Industrial Organization, 15,1–28.
4774 P. de Faria and F. Lima
Dow
nloa
ded
by [
Uni
vers
idad
e T
ecni
ca d
e L
isbo
a] a
t 06:
30 0
8 Se
ptem
ber
2011
Eurostat (2007) Europe in Figures – Eurostat Yearbook2006–07, Eurostat, Luxembourg.
Feldman, M. (1993) An examination of the geography of theinnovation, Industrial and Corporate Change, 2, 451–70.
Fritsch, M. and Franke, G. (2004) Innovation, regionalknowledge spillovers and R&D cooperation, ResearchPolicy, 33, 245–55.
Geroski, P. (1995) Markets for technology: knowledge,innovation, and appropriability, in Handbook of theEconomics of Innovation and Technological Change(Ed.) P. Stoneman, Blackwell, Oxford, pp. 90–131.
Griliches, Z. (1979) Issues in assessing the contribution ofresearch and development to productivity growth, BellJournal of Economics, 10, 92–116.
Griliches, Z. (1986) Productivity, R&D, and basic researchat the firm level in the 1970s, American EconomicReview, 76, 141–54.
Griliches, Z. (1992) The search for R&D spillovers,Scandinavian Journal of Economics, 94, 29–47.
Grossman, G. and Helpman, E. (1991) Innovation andGrowth in the Global Economy, MIT Press, Cambridge,MA.
Gumbau-Albert, M. and Maudos, J. (2009) Patents,technological inputs and spillovers among regions,Applied Economics, 41, 1473–86.
Hall, B. and Mairesse, J. (1995) Exploring the relationshipbetween R&D and productivity in French manufactur-ing firms, Journal of Econometrics, 65, 263–93.
Harabi, N. (1997) Channels of R&D spillovers: anempirical investigation of Swiss firms, Technovation,17, 627–35.
Jaffe, A. (1986) Technological opportunity and spillovers ofR&D, American Economic Review, 76, 984–1001.
Jaffe, A. and Trajtenberg, M. (1999) International knowl-edge flows: evidence from patent citations, Economicsof Innovation and New Technology, 8, 105–37.
Jaffe, A., Trajtenberg, M. and Henderson, R. (1993)Geographic localization of knowledge spillovers asevidenced by patent citations, Quarterly Journal ofEconomics, 63, 577–98.
Kafouros, M. and Buckley, P. (2008) Under what condi-tions do firms benefit from the research efforts of otherorganizations?, Research Policy, 37, 225–39.
Kaiser, U. (2002) Measuring knowledge spillovers inmanufacturing and services: an empirical assessmentof alternative approaches, Research Policy, 31, 125–44.
Kaufmann, A. and Todtling, F. (2002) How effective isinnovation support for SMEs? an analysis of theregion of Upper Austria, Technovation, 22, 147–59.
Keller, W. (2002) Geographical localization of interna-tional technology diffusion, American EconomicReview, 92, 120–40.
Krugman, P. (1991) Geography and Trade, MIT Press,Cambridge, MA.
Lane, P. and Lubatkin, M. (1998) Relative absorptivecapacity and inter-organizational learning?, StrategicManagement Journal, 19, 461–77.
Leiponen, A. (2000) Competencies, innovation and profit-ability of firms, Economics of Innovation and NewTechnology, 9, 1–24.
Mansfield, E., Rapoport, J., Romeo, A., Wagner, S. andBeardsley, G. (1977) Social and private rates of returnfrom industrial innovations, Quarterly Journal ofEconomics, 91, 221–40.
Meagher, K. and Rogers, M. (2004) Network density andR&D spillovers, Journal of Economic Behavior andOrganization, 53, 237–60.
Mohnen, P. and Dagenais, M. (2002) Towards an innova-tion intensity index: the case of CIS 1 in Denmark andIreland, in Innovation and Firm Performance:Econometric Explorations of Survey Data (Eds)A. Kleinknecht and P. Mohnen, Palgrave,Hampshire, New York, pp. 3–30.
Nadiri, M. (1993) Innovations and technological spillovers,NBER Working Paper No. 4423.
Negassi, S. (2009) International R&D spillovers andeconomic performance of firms: an empirical studyusing random coefficient models, Applied Economics,41, 947–76.
Organization for Economic Co-operation andDevelopment (OECD) (1992) Proposed Guidelines forCollecting and Interpreting Technology InnovationData – Oslo Manual, OECD, Paris.
Ornaghi, C. (2006) Spillovers in product and processinnovation: evidence from manufacturing firms,International Journal of Industrial Organization, 24,349–80.
Romer, P. (1986) Increasing returns and long run growth,Journal of Political Economy, 94, 1002–37.
Romer, P. (1990) Endogenous technological change,Journal of Political Economy, 98, S71–S102.
Rouvinen, P. (2002) Characteristics of product andprocess innovators: some evidence from the Finnishinnovation survey, Applied Economics Letters, 9,575–80.
Smith, V., Dilling-Hansen, M., Eriksson, T. andMadsenand, E. S. (2004) R&D and productivity inDanish firms: some empirical evidence, AppliedEconomics, 36, 1797–806.
Solow, R. (1956) A contribution to the theory ofeconomic growth, Quarterly Journal of Economics,70, 65–94.
Steurs, G. (1995) Inter-industry R&D spillovers: whatdifference do they make?, International Journal ofIndustrial Organization, 13, 249–76.
Wooldridge, J. (2002) Econometric Analysis ofCross Section and Panel Data, MIT Press,Cambridge, MA.
Interdependence and spillovers 4775
Dow
nloa
ded
by [
Uni
vers
idad
e T
ecni
ca d
e L
isbo
a] a
t 06:
30 0
8 Se
ptem
ber
2011


