Embed Size (px)
Citation preview
Internet Citizens 2014 Use of selected citizen-related online content and
services
Research Document
Publication date: 27 November 2014
About this document Ofcom’s role in furthering the interests of citizens includes seeking to ensure that people have access to the services and content they need in order to participate fully in society. This report provides an overview of people’s online use of such services and content in a range of citizen-orientated areas.
It provides metrics relating to UK adults’ online participation in government websites, e-petitions, health, education, public service broadcasting, news, local websites, hyperlocal sites, citizen journalism, cultural activities and libraries. We have examined these activities together to get a clearer picture of the range of citizen-focused activity that is taking place online.
The report follows on from our 2013 Internet Citizens report. We hope to continue to track this activity to build a clear picture of how the consumption of online citizen content is developing.
Internet Citizens Report 2014
Contents
Section Page Executive summary 1
1 Introduction 7
2 Overview of internet use 11
3 Government and politics 18
4 Health 34
5 Education 39
6 Public service broadcasting, news, citizen journalism and hyperlocal media 46
7 Culture and libraries 60
Annex Page 1 Annex A: comScore methodology 70
Internet Citizens Report 2014
Executive summary This report provides an overview of metrics relating to UK adults’ online participation in citizen-orientated content and services; in other words, those elements of online activity which further societal or democratic participation.
A selected range of core topics are covered, including use of government websites, e-petitions, health, education, public service broadcasting, news, local websites, hyperlocal sites, citizen journalism, cultural activities and libraries. We have examined these activities together to gain a clearer picture of the range of citizen-focused activity that is taking place online. Where possible, findings are provided for the devolved nations as well as for the UK as a whole.
The report follows on from our 2013 Internet Citizens report. Where possible, we compare findings between 2013 and 2014, although changes to the way the data are collected mean that such comparisons are limited1. The main data source used is the comScore online measurement system2, supplemented with a selected range of published survey research.
We welcome comments on our approach and the topics covered, and suggestions as to how they might be modified in any future publications.
Key themes
Engagement with citizen content and services shows a mixed picture
The report shows that there is variable use made of citizen-orientated content and services. There are increasing numbers of new and enhanced services, which can make it challenging to map the extent of increase in overall use. However, it appears that use of some sites and services has remained fairly similar year on year.
For example, data from our Media Use and Attitudes tracker indicates that six in ten (61%) of UK adult internet users say they ever complete government processes online, unchanged since the previous year, although the figure has increased since 2011. According to comScore, over one third (35%) of active internet users used any kind of government service in July 2014. In terms of health, some 20.9 million internet users visited health information websites in July 20143, the same number as visited in July 2013 (20.8 million). And in terms of education, overall visits to the three main websites in comScore’s education category changed little between July 2013 and July 2014.
Big names get the biggest audiences but small players are important too
In terms of user figures for individual sites, the biggest names are, unsurprisingly, drawing the biggest audiences. BBC websites attracted 31.6 million unique users in July 2014, 65% of active internet users, and NHS.uk attracted 10.1 million unique users, 21% of active internet users. However, while the smaller players do not attract such large audiences they
1 See page 8 for more details on this. 2 More details on the comScore measurement system can be found in Annex A at the end of this report. 3 Unless otherwise stated, all data points in this Executive Summary are from the internet measurement system comScore and relate to activity in July 2014.
1
Internet Citizens Report 2014
can still play an important role. For instance, research into the hyperlocal media sector4 suggests that not only are these sites providing their communities with information about local events, they are also playing an important role in upholding democratic accountability by initiating and conducting investigations into subjects as diverse as a waste incinerator breaching emissions guidelines, plans to develop land poisoned by previous industrial owners, and secret or illegal payments by local councils.
Citizen-orientated content is being disseminated through a variety of channels
While much activity is still taking place through the main websites of large public organisations, many large and small citizen-orientated organisations are also disseminating their content through apps, social media and blogs or video sites. For instance, NHS Choices makes use of a variety of social media platforms to engage with users. Data from the most recent NHS Choices annual report5 show that as of March 2013 the site had 52,000 followers on Facebook and 65,000 followers on Twitter, and NHS Choices videos have been viewed several millions of times on their YouTube channel.
Politicians, political parties and even Government departments are also using social media and other online tools to forge more direct relationships with citizens. For instance, David Cameron, Prime Minister and leader of the Conservative Party, has 795,771 Twitter followers6, and party leaders, MPs and other political figures are using Twitter to develop additional lines of communication with voters.
…and in a variety of formats Citizen-orientated content is also being presented in a variety of formats, including videos, games, photos, and information tools. Examples of this can be seen throughout the report. For example, the collections held by the National Archives can be viewed on Flickr and downloaded as podcasts; NHS Choices has provided a range of interactive tools for Facebook users, who can now check their drinking levels and find sports that suit their personality without leaving Facebook; TED Talks provides video footage of over 1900 talks designed to, as the site puts it, ‘stir your curiosity’; and the BBC provides educational content in formats including online courses, audiobooks, videos and games.
And a high proportion of traffic for these sites comes from mobiles
Analysis of comScore MMX Multi-Platform data shows that there is wide variation in the proportion of a site’s audience that originates from a mobile phone, ranging from Yahoo News, with 77% of its unique users accessing the site using a mobile phone, to whatdotheyknow and ParentPay, with less than 1% of their unique audience coming from mobile phones. News sites and public service broadcasting sites are some of the sites most likely to have high proportions of their unique audiences accessing their sites using a mobile phone. Government and civic sites tend to have lower proportions of users accessing from mobiles7. Although visits from mobiles are generally shorter, many mobile users are spending substantial periods of time on some of these sites.
4 Williams, A., Barnett, S., Harte, D. and Townend, J. (2014) Hyperlocal Community News in the UK: Findings from a survey of practitioners. 5 NHS (2013) Transparency, transaction, participation, NHS Choices Annual Report 2012/2013 6 http://twitter.com accessed 22/09/2014 7 It is not possible to capture all visits to government sites from mobiles as some mobile traffic to these sites goes through secure https connections which can’t be tracked by the comScore system. This may affect findings for some of these sites.
2
Internet Citizens Report 2014
Citizen transactions are also taking place online…
As well as engaging with content, citizens are also able to carry out transactions with the Government and other organisations online, and the number of UK internet users who say that they have ever completed a government process online has increased from 53% in 2011 to 61% in 2013 (there was no change between 2012 and 2013). Other civic activities, like looking at political, campaign or issues websites, or contacting a local councillor or an MP, did not increase between 2011 and 20138.
Government processes available to citizens online range from completing a self-assessment tax return, with 71% of the 7.2 million individuals who completed a tax return in January to March 2014 doing this online, to applying for a fishing rod licence, done online by 41% of the 47,700 people who applied.9
Non-government sites are also providing opportunities to conduct civic business online. One example is the site whatdotheyknow10, which enables users to send Freedom of Information requests to UK public authorities. The site claims to have sent 229,780 requests to 15,546 UK public authorities on behalf of users wanting to find out information. Another is ParentPay11, which provides an online payment system that lets parents pay for things like their child’s school meals or school trips and view their child’s balance online. ParentPay had 269,000 unique visitors in July 2014.
…and new content and services are being developed all the time
It is not possible to capture all of the citizen-focused activity taking place online in a single report. Much online content has both citizen and commercial elements, and there is a high rate of innovation in this space, with new content and services appearing all the time. We have given examples throughout this report to provide a flavour of what is available. Examples include: a mobile game to help develop treatments for cancer; a searchable online archive containing thousands of Wills and final messages from soldiers in WW1; an immersive app tour of the Palace of Westminster and a website that allows people to donate action instead of money.
Key research findings by chapter
Government
Over one third (35%) of active internet users in July 2014 used any kind of government website, including local authority sites. The website most likely to be visited is the UK government web portal GOV.UK, which aggregates information and services from across government. The website had a unique audience in July 2014 of 9.0 million, or 19% of active internet users in the UK for that month, according to comScore data. Visitors were more likely to be in the AB than the DE socio-economic group.
NI Direct, the government website for Northern Ireland, attracted 624,000 unique visitors in July 2014 across the UK, 1.3% of UK active internet users. The Scottish government website attracted a unique audience of 193,000 visitors across the UK in July 2014, 0.4% of active
8 Ofcom (2014) Adults’ Media Use and Attitudes 9 www.gov.uk/performance 10 www.whatdotheyknow.com 11 www.parentpay.com
3
Internet Citizens Report 2014
internet users. The Welsh Assembly website had 154,000 unique visits in July 2014 across the UK; 0.3% of active internet users12.
Citizens can interact with the government in other ways than visiting government websites, including through online petitions, hosted both by governments themselves and by civic organisations, and through other means such as accessing government data online or making online Freedom of Information requests. Politicians too are increasingly interacting directly with citizens through social media platforms like Twitter.
Citizens can also conduct civic business online. Data from Ofcom’s Media Use and Attitudes tracker show that 61% of UK internet users say they ever complete government processes online, with those in ABC1 households are more likely to have done this than those in C2DE households13. This translates into large numbers of online transactions. The government services with the highest number of online transactions are: completing a self-assessment tax return, done by over 7.2 million individuals in January to March 2014, 71% of whom did it online, and checking to see whether a vehicle is taxed, carried out by over 7.1 million individuals, with almost all (97%) of these done online.
Health
NHS websites are the most popular health information site, with WebMD the next popular site. Around two in ten of the UK internet population accessed NHS sites in July 2014, with the vast majority of these going to NHS.uk, the NHS Choices website. Visitors to the site are more likely to be women, and from AB households. The largest group of visitors in both 2013 and 2014 were in the 35-54 age groups.
NHS Choices users are able to access a wide range of information as well as carry out health-related transactions such as booking appointments and sharing their views and experiences of health services. They are able to engage with the site through a range of channels and platforms, with social media and access via mobiles and tablets increasingly popular.
Education
There were over 17 million unique visitors to websites in comScore’s ‘education’ category in July 2014, equivalent to 35% of UK internet users. The most popular site is the StudentRoom group, a student community website providing a range of content including chat and discussion forums, educational resources and advice. The site has over 2 million unique visitors in July 2014, equivalent to over 4% of active internet users. This was followed by about.com Education, with over 1.3 million unique visitors in July 2014, equivalent to nearly 3% of active internet users, and BBC Learning with over one million unique visitors in July 2014, equivalent to over 2% of active internet users.
The StudentRoom Group’s audience is most likely to come from the AB (35%) and C1 (36%) groups, while audiences for both about.com Education and BBC Learning are most likely to come from the AB group, at 40% and 26% respectively.
12 We are unable to tell from our data why audiences for NI Direct are larger than for the Scottish and Welsh government sites, or where in the UK those audiences come from. It may be that citizens in Northern Ireland make more use of the NI Direct site than is the case for citizen use of government sites in Scotland and Wales, or that NI Direct is more likely to come up in searches related to content and services that are not specific to Northern Ireland. 13 Ofcom (2014) Adults’ Media Use and Attitudes
4
Internet Citizens Report 2014
Roughly equal proportions of visitors to the StudentRoom Group came from the 18-24, 25-34 and 35-54 age groups. In contrast, most visitors to about.com Education and BBC Learning were in the 35-54 age group.
In addition to the sites with the largest number of hits, some other sites provide an interesting insight into new and emerging ways in which people can interact with education and educational content online. These include ParentPay, which provides an online payment system that lets parents pay for school meals and trips and TED Talks, which provides videos of over 1900 talks designed to “stir your curiosity”.
ParentPay had 269,000 unique visitors in July 2014, equivalent to 0.6% of active internet users. The majority of visitors were female and from the 35-54 age group and the most represented socio-economic group were ABs. TED Talks had 858,000 unique visitors in July 2014, equivalent to 2% of active internet users. Visitors were more or less evenly split between men and women, were most likely to come from the 25-34 age group, and almost half were from the AB demographic group.
PSB, news, local media and blogs
The BBC is the most popular public service broadcasting (PSB) website, by a considerable margin, with 65% of UK internet users using BBC sites in July 2014.
The BBC is also the most-used website for news provision. According to Ofcom’s news survey research, 59% of online news users say they use it, while 18% say they use Google, 17% Facebook, 17% Sky and 9% say they use Twitter14. The BBC is also the most visited site in the comScore general news category, with 17.6 million unique visitors in July 2014, equivalent to over one-third (36%) of the online population.
Research by the Reuters Institute15 found that a substantial minority of internet users are talking about and sharing news stories online, particularly via Twitter and Facebook.
According to Ofcom’s news survey research, half (51%) of UK adults say they use an online source for local news and information at least monthly, with almost two in five (39%) doing this at least weekly. This compares to 47% and 36% respectively in 2013. While TV is most likely to be nominated as the most important local source (40% in 2014, 29% in 2013) one in five (19%) of regular local news users in 2014 nominated ‘any online source’ as their most important type of local media (17% in 2013)16.
Blogging websites are visited by over half the internet population and survey research finds that almost a quarter say that they comment on blogs17.
Culture and libraries
The most popular kinds of cultural websites are heritage sites18, visited by three in ten adults in England in 2013/1419. Since 2005/06 there have been increases in the numbers of adults in England visiting heritage websites, museum or gallery websites and library websites20.
14 Ofcom (2014) News Consumption in the UK: 2014 Report 15 University of Oxford and Reuters Institute for the Study of Journalism (2014) Digital News Report 2014 16 Ofcom (2014) News Consumption in the UK: 2014 Report and Ofcom (2013) News Consumption in the UK: 2013 Report 17 Ofcom (2014) Adults’ Media Use and Attitudes
5

Internet Citizens Report 2014
Visitors are engaging with culture and library websites to look for information and book tickets, but are also engaging in other ways, including by downloading documents and podcasts, viewing objects or exhibitions, taking virtual tours and keeping updated via Twitter.
Although in most areas the in-person visit is still dominant, a higher proportion of adults in England visited an archive or records office online than in person (11% vs. 4%).
Visitors to culture and library websites are most likely to be in the AB socio-economic groups.
In July 2014, the top three UK museum/gallery websites visited were the Victoria and Albert Museum, with 171,000 unique visitors (0.4% of active internet users in the UK), the Tate Modern, with 154,000 (0.3% of active users) and the Natural History Museum with 127,000 (0.3% of active users).
18 Digital engagement with the heritage sector, as defined by DCMS, includes visiting a heritage website to take a virtual tour of a historical site, learn about history or the historic environment, or discuss history or the historic environment on a forum. 19 Data taken from the DCMS Taking Part survey which covers adults in England only. 20 DCMS (2014) Taking Part: England’s Survey of Leisure, Culture and Sport, 2014/15 Quarter 1: Report
6
Internet Citizens Report 2014
Section 1
1 Introduction Ofcom’s principal duty, as set out in Section 3(1) of the Communications Act is:
• to further the interests of citizens in relation to communications matters; and
• to further the interests of consumers in relevant markets, where appropriate by promoting competition.
Our role in furthering the interests of citizens includes seeking to ensure that people have access to the services and content they need in order to participate fully in society. This report provides an overview of people’s online use of such services and content in selected areas.
The report provides useful contextual information to the Ofcom report Citizens and Communications Services21, published in October 2014. That report reviews the development of communications services and how they further the interests of citizens. It focuses on the work Ofcom does to ensure that as many people as possible can use and benefit from communications services, looking in particular at three main areas: availability, accessibility and affordability.
In our 2008 discussion paper Citizens, Communications and Convergence22, we described the citizen interest as follows:
As citizens, we participate in society, which includes the marketplace, but also extends far beyond it. Citizens are free to exchange goods and services, but are also free to participate in a whole range of social, cultural and political activities that are not the subject of commercial contracts. It is important to note that our activities as citizens and consumers often overlap and blur. For example, much of the online content described in this report can be delivered and consumed commercially, and as such could also be deemed relevant to consumer interests. Much of it is of personal interest or importance as well as being of use to society as a whole. For example, news content online straddles commercial, consumer-focused services and those of public service or civic provision. Nonetheless, we have selected some core categories that, taken together, can be seen to represent a landscape of broadly citizen-orientated content and services that enable participation in society.
It is challenging to create a fully comprehensive and universally-accepted list of online citizen-related content and services, and we do not claim such comprehensiveness here. As in our 2013 report23, we have focused on a number of core topics to provide a breadth of comparative analysis across a range of types of activity. Following feedback, we have added education to the topics covered. We welcome comments on our selection, and we are open to modifications to this list in any further publication.
21 http://stakeholders.ofcom.org.uk/market-data-research/other/cross-media/citizens-comms-services/?utm_source=updates&utm_medium=email&utm_campaign=citizens-consumers-report 22 http://stakeholders.ofcom.org.uk/consultations/citizens/summary 23 http://stakeholders.ofcom.org.uk/market-data-research/other/telecoms-research/internet-citizens-2013/
7
Internet Citizens Report 2014
It should be noted that the report focuses on the more mainstream or major providers of this type of content. This is in large part because measuring smaller, grassroots citizen initiatives is by definition more difficult, although where possible we have included additional research from surveys or have referred to initiatives or examples that are either indicative of these kinds of activities, or are particularly innovative and seem to be pointing to citizen-oriented developments in online content and services.
The core categories are:
• Government and politics
• Health information
• Education
• Media - public service broadcasting, news, citizen journalism and hyperlocal content
• Culture - heritage, archives, museums, galleries and libraries
Our introductory chapter also includes a comparative look at the category of social networking, which can offer the potential to enhance societal cohesion and provide a space for citizen-orientated networks and information.
Our main data source is comScore, the online measurement system24. These data are predominantly from July 2014, and the methodology of this system is described below and in annex A. We have used ComScore’s multi-platform data in order to capture internet activity across mobiles and tablets as well as desktops and laptops. Data are deduplicated to provide information on the number of individual users, regardless of whether those users are accessing websites across multiple devices or from multiple browsers25. This dataset was not available at the time of our 2013 report, and data in the two reports are therefore not directly comparable.
In most cases data are provided for a single month, July 2014, and wherever possible are compared with data from July 2013. In some cases it is also possible to provide a month-by-month average, and this is included where it provides additional insight.
We also use other research sources, including:
• Ofcom data from the Technology Tracker, Q2 2014, the Adults’ media use and attitudes report 2014 and News Consumption in the UK: 2014 Report
• University of Oxford and Reuters Institute for the Study of Journalism (2014) Digital News Report 201426
• Office for National Statistics (2014) Internet Access – Households and Individuals 201427
• DCMS (2014) Taking Part: England’s Survey of Leisure, Culture and Sport, 2014/15 Quarter 1: Report28
24 http://www.comscore.com/ 25 ComScore MMX multi-platform uses observations of cookies per person to derive actual people behind the cookies, resolving the fact that many people use more than just one browser per computer and many of those have auto-cookie-deletion enabled by default. It also de-duplicates use across devices and excludes non-UK users. Figures derived from this methodology may therefore differ from those provided by other web analytic tools. 26 http://www.digitalnewsreport.org/ 27 http://www.ons.gov.uk/ons/dcp171778_373584.pdf 28 https://www.gov.uk/government/statistics/taking-part-201415-quarter-1-statistical-release
8
Internet Citizens Report 2014
• Williams, A., Harte, D. and Turner, J. (2014) The Value of UK Hyperlocal Community News: Findings from a content analysis, an online survey and interviews with producers.
• Williams, A., Barnett, S., Harte, D. and Townend, J. (2014) Hyperlocal Community News in the UK: Findings from a survey of practitioners.
• NHS (2013) Transparency, transaction, participation, NHS Choices Annual Report 2012/201329
• Public Petitions Committee (2014) Annual Report 2013/1430
• Data from gov.uk’s performance metrics31
• Data from Twitter and Tweetminster
• Analysis of Openly Local database by Harte, D., Birmingham City University
• Data provided by STV Glasgow from comScore – digital analytix
Where possible, data are shown by devolved nation as well as by socio-economic and age groups32. It is important to monitor how content and services with a citizen dimension are used at a nation level, particularly as devolved governments have their own strategies for encouraging online take-up and use.
Because the report uses a range of different surveys and data points it is difficult to assess what constitutes a significant or insignificant measure. Rather than being definitive about absolute numbers, the purpose and value of the report is to allow a focus on the range of content that has some kind of citizen dimension, and to look at the possible means by which it can be measured. Showing the use that is made of various types of citizen-oriented content and services also helps us understand which areas might need further promotion or signposting to attract greater participation. We hope to continue to track this use to build a clear picture of how the consumption of online citizen content is developing.
Overview of comScore measurement
The UK Online Measurement Company (UKOM) was formed in 2009 with a mandate from the advertising industry to establish measurement standards for digital media. In 2011, comScore was appointed the sole data supplier for UKOM under a three-year contract from January 2013.
comScore MMX MP™ uses comScore MMX Multi-Platform to analyse website and app use across laptop/desktop computers, mobiles and tablets. The digital audience is an unduplicated unique audience between each of these devices, and the unique viewers of videos on laptop/desktop computers. Its methodology combines internet traffic, captured from a panel of internet users, with website interaction data from website publishers, in order
29 http://www.nhs.uk/aboutNHSChoices/professionals/developments/Documents/annual-report/nhs-choices-annual-report-2012.pdf 30 http://www.scottish.parliament.uk/S4_PublicPetitionsCommittee/Reports/puR-14-02w.pdf 31 www.gov.uk/performance 32 ComScore’s multi-platform data set does not allow us to break the data down by nation. The range of nations' data in this report is therefore limited, but where possible we have attempted to supplement comScore data with other data that does provide nation specific data.
9
Internet Citizens Report 2014
to provide a projection of which websites people are visiting and how long they are spending browsing web pages. This is comScore’s Unified Digital Measurement™ (UDM) methodology.
Throughout this report web entities are followed by a letter in square brackets e.g. [C]. This letter designates where in a ‘hierarchy’ of web entities a particular entity sits. This hierarchy is comScore’s dictionary. A property [P] is the legal parent of any web entities that sit within it, such as a media title [M], channel [C], or group [G]. How the entities of a property are defined in comScore’s dictionary is determined by the properties themselves. As such, while there are similarities between different entities at a similar dictionary level, they are not always equivalent.
The comScore metrics used in this report are:
Unique audience: the total number of unique persons who have visited a website or used an application at least once in a given month. Persons visiting the same website more than once are therefore counted only once in this measure
Active reach (%): the unique audience of a website as a proportion of the total number of people who visited any website, or used any internet-connected application, at least once in a given month (the active audience).
Time spent per month: the average time spent browsing a website per unique visitor per month (excludes time spent watching online video and listening to streamed audio).
10
Internet Citizens Report 2014
Section 2
2 Overview of internet use This section provides a contextual overview of internet use. It begins with a reminder of the demographic differences that persist in internet use, particularly in relation to age groups.
In order to establish a context for the relative position of citizen-related websites, we first provide an overview of the use of a range of websites by category (as defined by comScore), and then highlight those categories that potentially serve citizen functions. Finally, we collate the range of citizen websites that are highlighted in later sections of the report to provide a snapshot of the active reach of different types of citizen activity.
2.1 Internet use
Demographic divisions endure in internet use
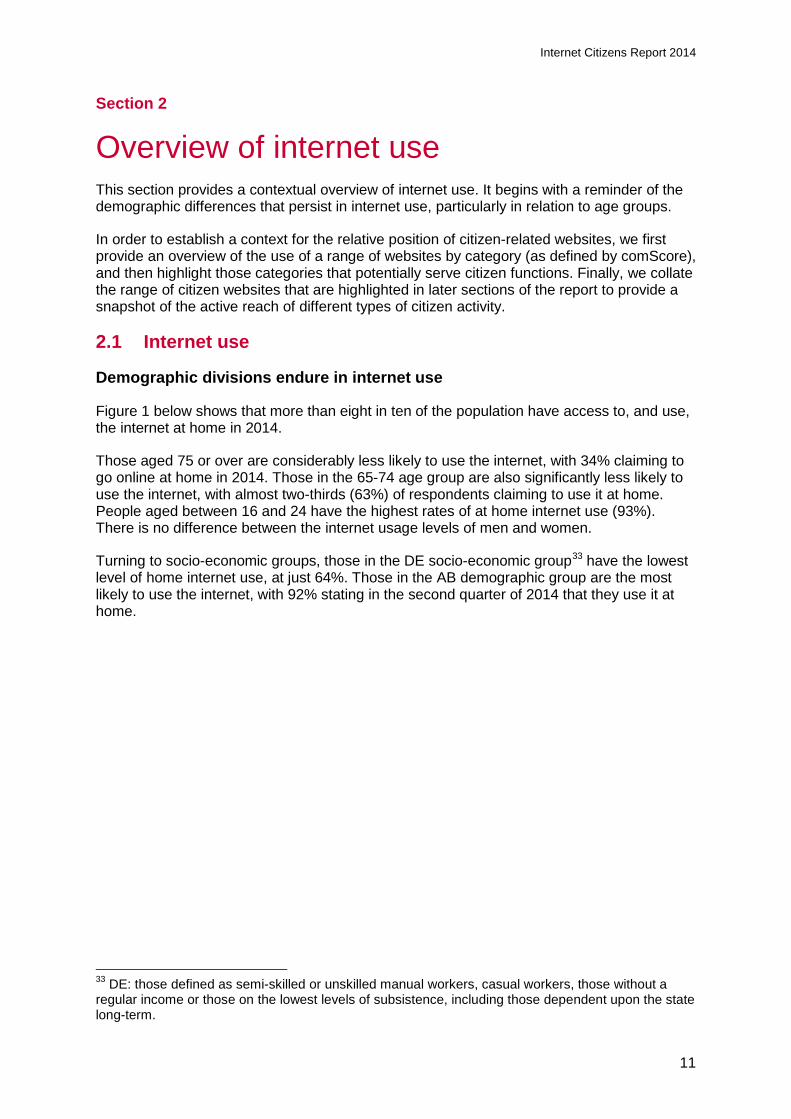
Figure 1 below shows that more than eight in ten of the population have access to, and use, the internet at home in 2014.
Those aged 75 or over are considerably less likely to use the internet, with 34% claiming to go online at home in 2014. Those in the 65-74 age group are also significantly less likely to use the internet, with almost two-thirds (63%) of respondents claiming to use it at home. People aged between 16 and 24 have the highest rates of at home internet use (93%). There is no difference between the internet usage levels of men and women.
Turning to socio-economic groups, those in the DE socio-economic group33 have the lowest level of home internet use, at just 64%. Those in the AB demographic group are the most likely to use the internet, with 92% stating in the second quarter of 2014 that they use it at home.
33 DE: those defined as semi-skilled or unskilled manual workers, casual workers, those without a regular income or those on the lowest levels of subsistence, including those dependent upon the state long-term.
11
Internet Citizens Report 2014
Figure 1: Use of the internet at home, by age, gender and SEG
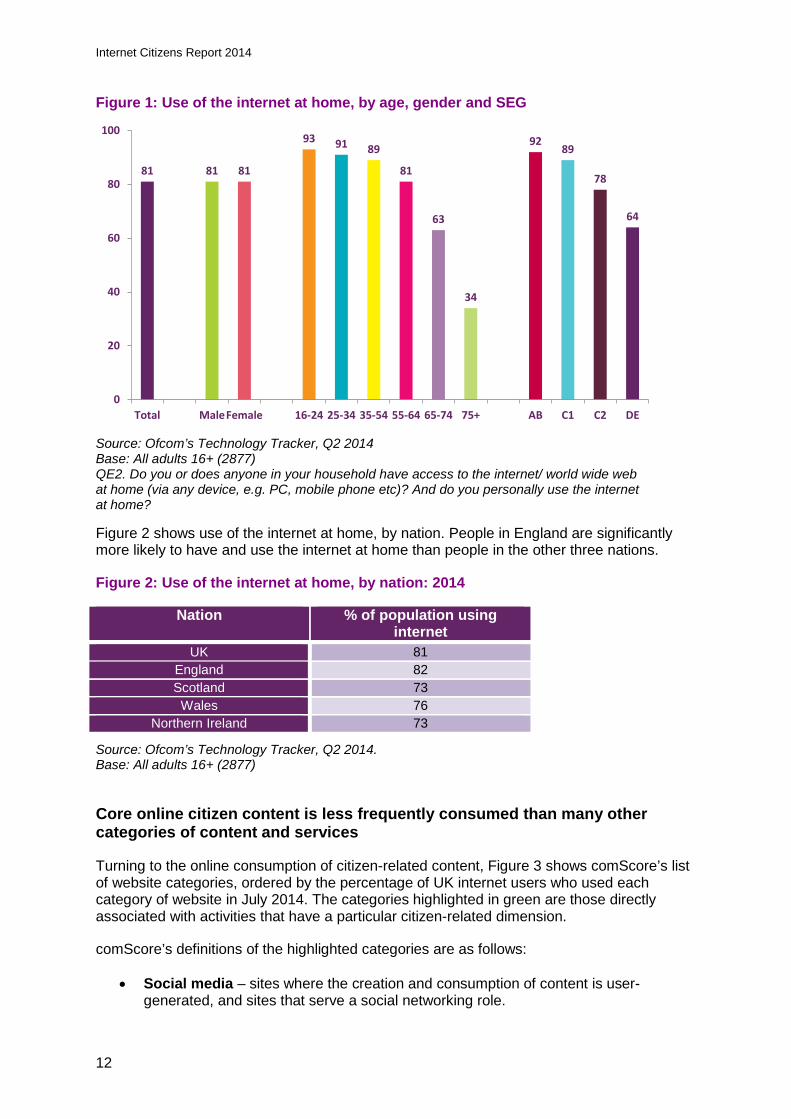
Source: Ofcom’s Technology Tracker, Q2 2014 Base: All adults 16+ (2877) QE2. Do you or does anyone in your household have access to the internet/ world wide web at home (via any device, e.g. PC, mobile phone etc)? And do you personally use the internet at home? Figure 2 shows use of the internet at home, by nation. People in England are significantly more likely to have and use the internet at home than people in the other three nations.
Figure 2: Use of the internet at home, by nation: 2014
Source: Ofcom’s Technology Tracker, Q2 2014. Base: All adults 16+ (2877) Core online citizen content is less frequently consumed than many other categories of content and services
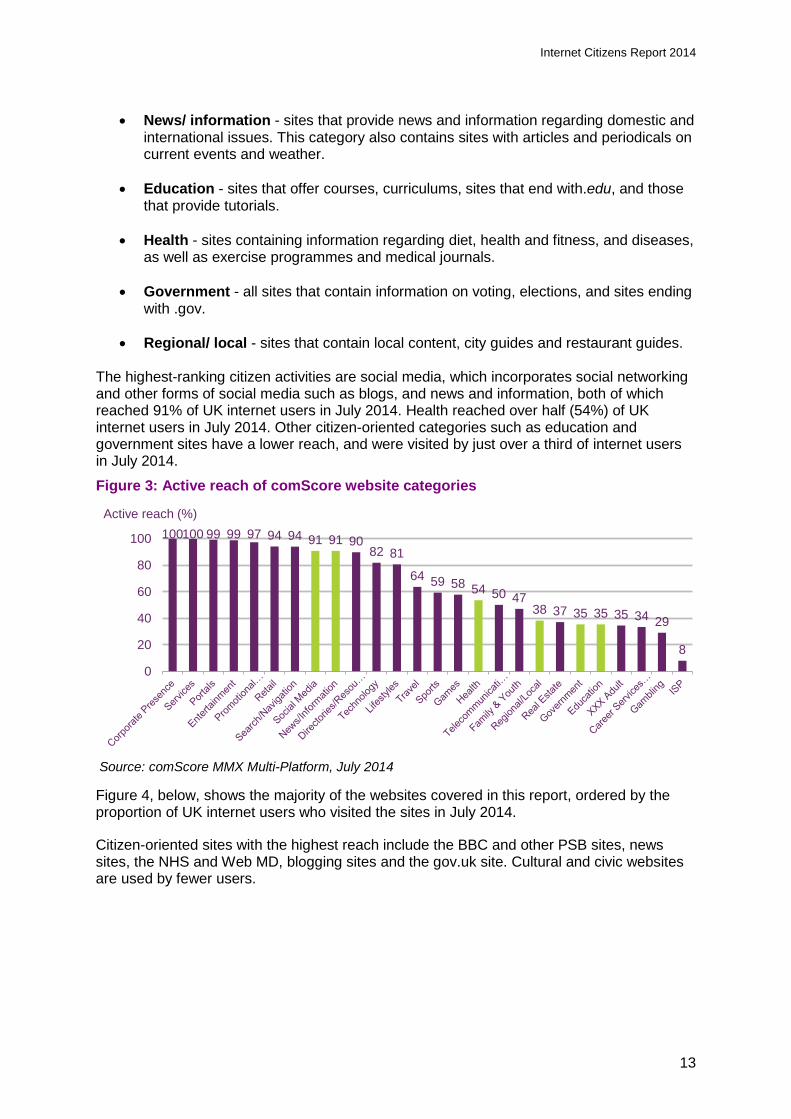
Turning to the online consumption of citizen-related content, Figure 3 shows comScore’s list of website categories, ordered by the percentage of UK internet users who used each category of website in July 2014. The categories highlighted in green are those directly associated with activities that have a particular citizen-related dimension.
comScore’s definitions of the highlighted categories are as follows:
• Social media – sites where the creation and consumption of content is user-generated, and sites that serve a social networking role.
81 81 81
93 91 89
81
63
34
9289
78
64
0
20
40
60
80
100
Total MaleFemale 16-24 25-34 35-54 55-64 65-74 75+ AB C1 C2 DE
Nation % of population using internet
UK 81 England 82 Scotland 73 Wales 76
Northern Ireland 73
12
Internet Citizens Report 2014
• News/ information - sites that provide news and information regarding domestic and
international issues. This category also contains sites with articles and periodicals on current events and weather.
• Education - sites that offer courses, curriculums, sites that end with.edu, and those
that provide tutorials.
• Health - sites containing information regarding diet, health and fitness, and diseases, as well as exercise programmes and medical journals.
• Government - all sites that contain information on voting, elections, and sites ending
with .gov.
• Regional/ local - sites that contain local content, city guides and restaurant guides. The highest-ranking citizen activities are social media, which incorporates social networking and other forms of social media such as blogs, and news and information, both of which reached 91% of UK internet users in July 2014. Health reached over half (54%) of UK internet users in July 2014. Other citizen-oriented categories such as education and government sites have a lower reach, and were visited by just over a third of internet users in July 2014.
Figure 3: Active reach of comScore website categories
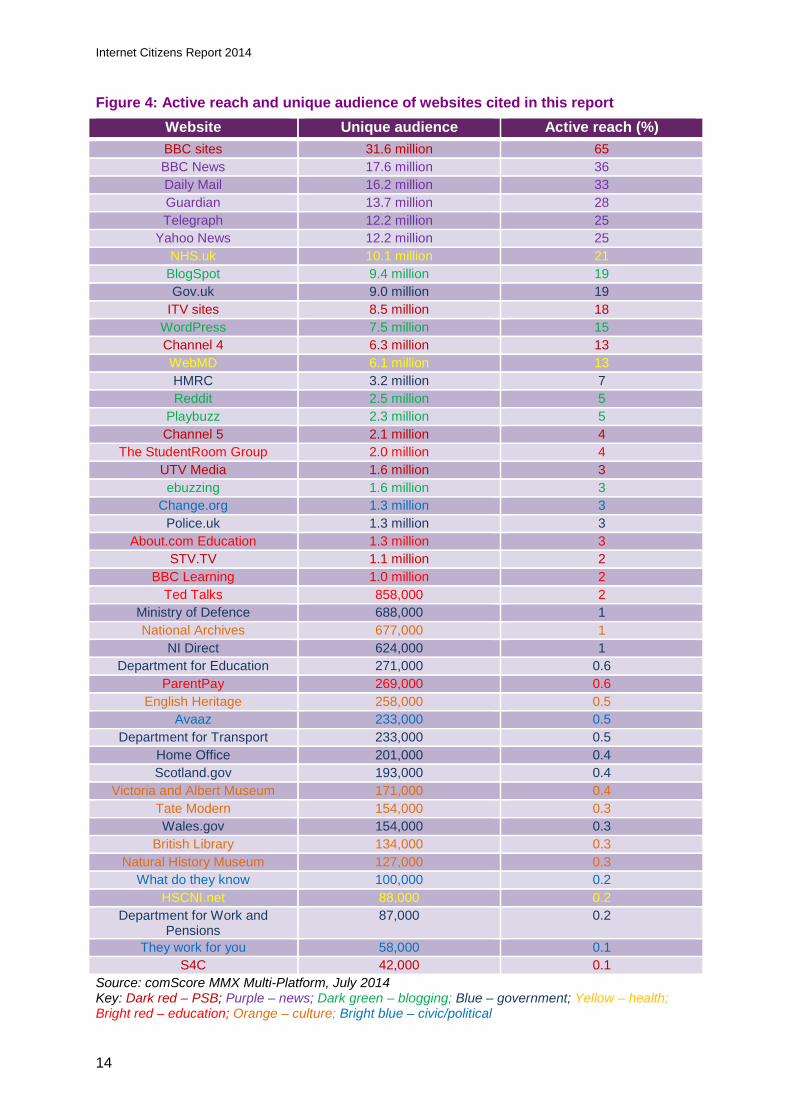
Source: comScore MMX Multi-Platform, July 2014 Figure 4, below, shows the majority of the websites covered in this report, ordered by the proportion of UK internet users who visited the sites in July 2014.
Citizen-oriented sites with the highest reach include the BBC and other PSB sites, news sites, the NHS and Web MD, blogging sites and the gov.uk site. Cultural and civic websites are used by fewer users.
100100 99 99 97 94 94 91 91 9082 81
64 59 58 54 50 4738 37 35 35 35 34 29
8
0
20
40
60
80
100
Active reach (%)
13
Internet Citizens Report 2014
Figure 4: Active reach and unique audience of websites cited in this report
Source: comScore MMX Multi-Platform, July 2014 Key: Dark red – PSB; Purple – news; Dark green – blogging; Blue – government; Yellow – health; Bright red – education; Orange – culture; Bright blue – civic/political
Website Unique audience Active reach (%) BBC sites 31.6 million 65 BBC News 17.6 million 36 Daily Mail 16.2 million 33 Guardian 13.7 million 28 Telegraph 12.2 million 25
Yahoo News 12.2 million 25 NHS.uk 10.1 million 21
BlogSpot 9.4 million 19 Gov.uk 9.0 million 19
ITV sites 8.5 million 18 WordPress 7.5 million 15 Channel 4 6.3 million 13 WebMD 6.1 million 13 HMRC 3.2 million 7 Reddit 2.5 million 5
Playbuzz 2.3 million 5 Channel 5 2.1 million 4
The StudentRoom Group 2.0 million 4 UTV Media 1.6 million 3 ebuzzing 1.6 million 3
Change.org 1.3 million 3 Police.uk 1.3 million 3
About.com Education 1.3 million 3 STV.TV 1.1 million 2
BBC Learning 1.0 million 2 Ted Talks 858,000 2
Ministry of Defence 688,000 1 National Archives 677,000 1
NI Direct 624,000 1 Department for Education 271,000 0.6
ParentPay 269,000 0.6 English Heritage 258,000 0.5
Avaaz 233,000 0.5 Department for Transport 233,000 0.5
Home Office 201,000 0.4 Scotland.gov 193,000 0.4
Victoria and Albert Museum 171,000 0.4 Tate Modern 154,000 0.3 Wales.gov 154,000 0.3
British Library 134,000 0.3 Natural History Museum 127,000 0.3
What do they know 100,000 0.2 HSCNI.net 88,000 0.2
Department for Work and Pensions
87,000 0.2
They work for you 58,000 0.1 S4C 42,000 0.1
14
Internet Citizens Report 2014
2.2 The role of mobile phones
In this report we use comScore MMX Multi-Platform to analyse website and app use across laptop/desktop computers, mobiles and tablets. This not only provides a more accurate picture of internet use in a multi-device environment, it also allows us to analyse the specific role played by mobile phones.
In addition to total unique visitors, comScore MMX Multi-Platform also provides details on the number of these visits that originated from a mobile phone, using either 3G or wireless networks. These figures are de-duped and therefore many of those mobile users are also likely to visit the sites from other devices or browsers.
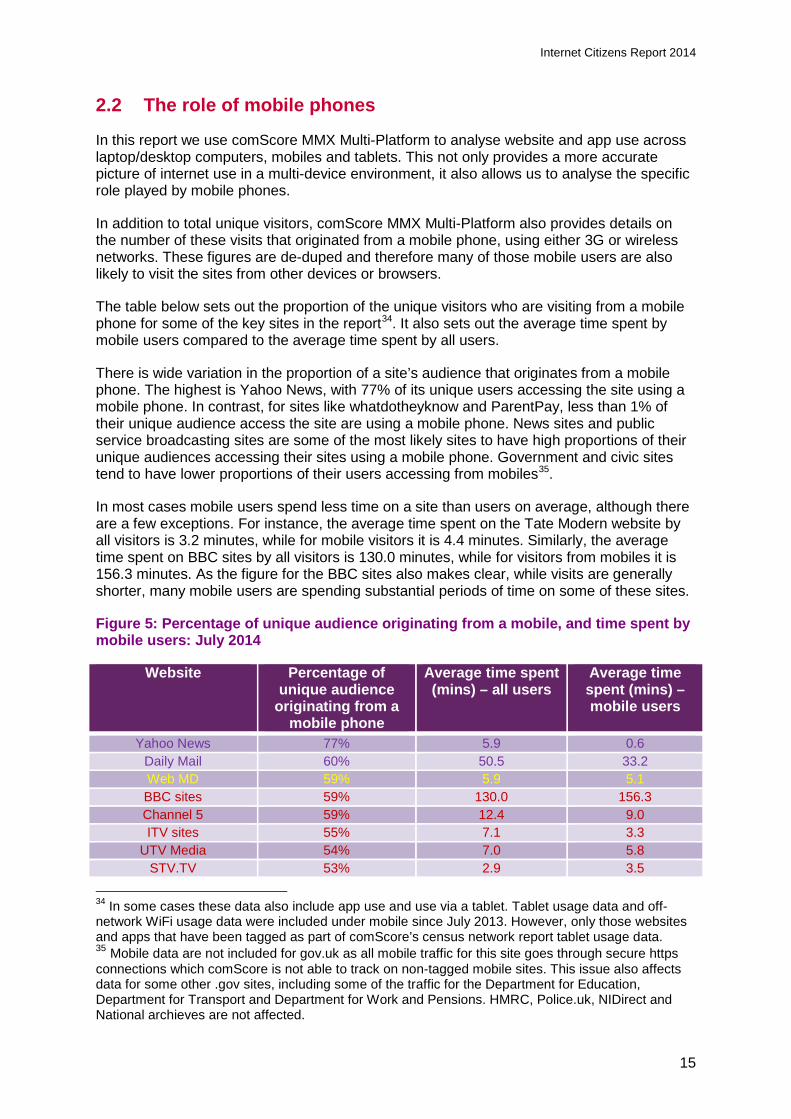
The table below sets out the proportion of the unique visitors who are visiting from a mobile phone for some of the key sites in the report34. It also sets out the average time spent by mobile users compared to the average time spent by all users.
There is wide variation in the proportion of a site’s audience that originates from a mobile phone. The highest is Yahoo News, with 77% of its unique users accessing the site using a mobile phone. In contrast, for sites like whatdotheyknow and ParentPay, less than 1% of their unique audience access the site are using a mobile phone. News sites and public service broadcasting sites are some of the most likely sites to have high proportions of their unique audiences accessing their sites using a mobile phone. Government and civic sites tend to have lower proportions of their users accessing from mobiles35.
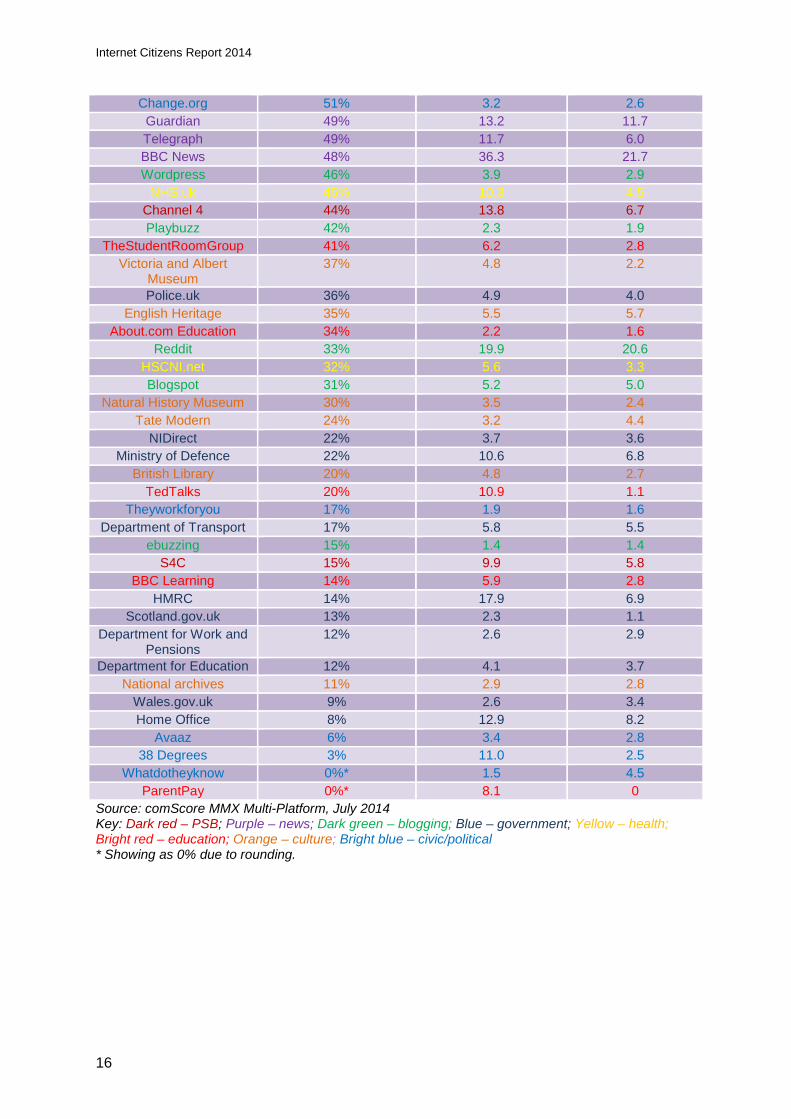
In most cases mobile users spend less time on a site than users on average, although there are a few exceptions. For instance, the average time spent on the Tate Modern website by all visitors is 3.2 minutes, while for mobile visitors it is 4.4 minutes. Similarly, the average time spent on BBC sites by all visitors is 130.0 minutes, while for visitors from mobiles it is 156.3 minutes. As the figure for the BBC sites also makes clear, while visits are generally shorter, many mobile users are spending substantial periods of time on some of these sites.
Figure 5: Percentage of unique audience originating from a mobile, and time spent by mobile users: July 2014
34 In some cases these data also include app use and use via a tablet. Tablet usage data and off-network WiFi usage data were included under mobile since July 2013. However, only those websites and apps that have been tagged as part of comScore’s census network report tablet usage data. 35 Mobile data are not included for gov.uk as all mobile traffic for this site goes through secure https connections which comScore is not able to track on non-tagged mobile sites. This issue also affects data for some other .gov sites, including some of the traffic for the Department for Education, Department for Transport and Department for Work and Pensions. HMRC, Police.uk, NIDirect and National archieves are not affected.
Website Percentage of unique audience
originating from a mobile phone
Average time spent (mins) – all users
Average time spent (mins) – mobile users
Yahoo News 77% 5.9 0.6 Daily Mail 60% 50.5 33.2 Web MD 59% 5.9 5.1 BBC sites 59% 130.0 156.3 Channel 5 59% 12.4 9.0 ITV sites 55% 7.1 3.3
UTV Media 54% 7.0 5.8 STV.TV 53% 2.9 3.5
15
Internet Citizens Report 2014
Source: comScore MMX Multi-Platform, July 2014 Key: Dark red – PSB; Purple – news; Dark green – blogging; Blue – government; Yellow – health; Bright red – education; Orange – culture; Bright blue – civic/political * Showing as 0% due to rounding.
Change.org 51% 3.2 2.6 Guardian 49% 13.2 11.7 Telegraph 49% 11.7 6.0 BBC News 48% 36.3 21.7 Wordpress 46% 3.9 2.9
NHS.uk 45% 10.3 4.5 Channel 4 44% 13.8 6.7 Playbuzz 42% 2.3 1.9
TheStudentRoomGroup 41% 6.2 2.8 Victoria and Albert
Museum 37% 4.8 2.2
Police.uk 36% 4.9 4.0 English Heritage 35% 5.5 5.7
About.com Education 34% 2.2 1.6 Reddit 33% 19.9 20.6
HSCNI.net 32% 5.6 3.3 Blogspot 31% 5.2 5.0
Natural History Museum 30% 3.5 2.4 Tate Modern 24% 3.2 4.4
NIDirect 22% 3.7 3.6 Ministry of Defence 22% 10.6 6.8
British Library 20% 4.8 2.7 TedTalks 20% 10.9 1.1
Theyworkforyou 17% 1.9 1.6 Department of Transport 17% 5.8 5.5
ebuzzing 15% 1.4 1.4 S4C 15% 9.9 5.8
BBC Learning 14% 5.9 2.8 HMRC 14% 17.9 6.9
Scotland.gov.uk 13% 2.3 1.1 Department for Work and
Pensions 12% 2.6 2.9
Department for Education 12% 4.1 3.7 National archives 11% 2.9 2.8
Wales.gov.uk 9% 2.6 3.4 Home Office 8% 12.9 8.2
Avaaz 6% 3.4 2.8 38 Degrees 3% 11.0 2.5
Whatdotheyknow 0%* 1.5 4.5 ParentPay 0%* 8.1 0
16
Internet Citizens Report 2014
Summary
While internet use is prevalent among most of the UK population, older people and those in DE households remain less likely to be online. Social media and news/information are the most popular online categories that have a citizen dimension, reaching around nine in ten of UK internet users. Health reaches around half of UK internet users, with other citizen-oriented categories reaching around a third of users. The BBC has the largest reach of all the citizen oriented websites looked at in this report. These findings are consistent with the 2013 report. There is wide variation in the proportion of a site’s audience that originates from a mobile phone, ranging from Yahoo News, with 77% of its unique users accessing the site using a mobile phone, to whatdotheyknow and ParentPay, with less than 1% of their unique audience in the second quarter of 2014 coming from mobile phones. News sites and public service broadcasting sites are some of the most likely sites to have high proportions of their unique audiences accessing their sites using a mobile phone. Government and civic sites tend to have lower proportions of their users accessing from mobiles. While visits from mobiles are generally shorter, many mobile users are spending substantial periods of time on some of these sites.
17
Internet Citizens Report 2014
Section 3
3 Government and politics Citizens can interact with government directly or indirectly in a range of ways. Government and local councils are providing more ways to encourage citizens to interact, and other types of organisation are also providing means for democratic involvement in the policy and scrutiny process.
This section provides information about take-up of online government services. Among other things, these services allow people to pay taxes, apply for benefits, search for jobs and learn more about how the government and its departments operate.
This section looks at which demographic groups are using online government services, the content and services that are available online, and how these are evolving over time. The section also includes findings from surveys that asked respondents about their online habits in this area, and information about non-government websites that seek to engage citizens in democratic processes.
3.1 Use of any type of government website
Over a third of all UK internet users access any type of government website per month
Over a third (35%) of active internet users access any type of government website in a month, according to comScore data for July 2014. These sites are defined as any site with a .gov suffix, and incorporate many different local and devolved-nation government websites as well as major Westminster government departments. The average time spent per visitor per month was 23 minutes, and there were 17.2 million unique visitors.
3.2 Use of GOV.UK website
One in five UK internet users used the GOV.UK portal in July 2014
The UK government web portal GOV.UK provides services and advice on a range of topics, including transport and travel, businesses and the self-employed, benefits, education, taxes, and information for people with disabilities36. The websites of all Government departments and many other public bodies are being moved onto the GOV.UK web domain and the service replaces Directgov and Business Link37.
The website had a unique audience in July 2014 of 9.0 million, or 19% of active internet users in the UK for that month. The average time spent per visitor in July 2014 was 5 minutes.
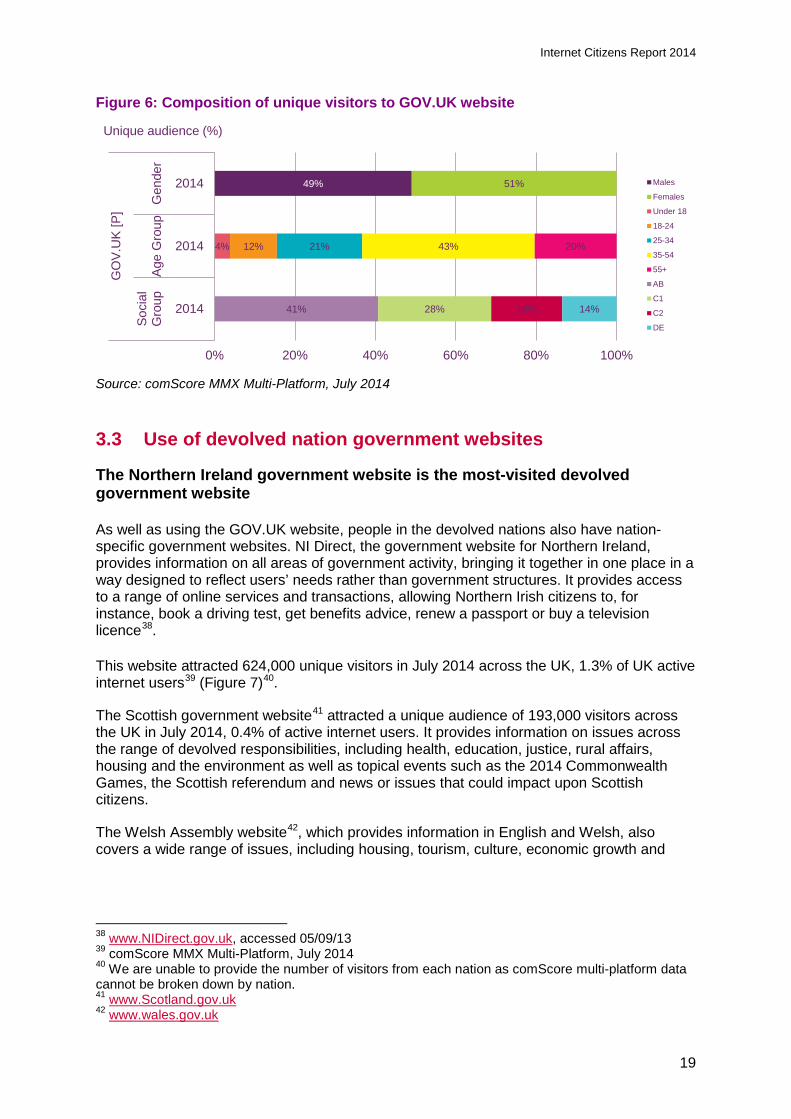
As Figure 6 shows, among visitors to the site 43% were aged 35-54, while 12% were aged 18-24. Visitors were more likely to be in the AB socio-economic group (41%) than the DE group (14%).
36 Much of this type of information and services for the nations is provided at a devolved level, as subsequent analysis notes. 37 Searches for Directgov and Business Link are now routed directly to gov.uk. Given the evolving nature of the gov.uk site during this period we have not provided month by month analysis.
18
Internet Citizens Report 2014
Figure 6: Composition of unique visitors to GOV.UK website
Source: comScore MMX Multi-Platform, July 2014 3.3 Use of devolved nation government websites
The Northern Ireland government website is the most-visited devolved government website
As well as using the GOV.UK website, people in the devolved nations also have nation-specific government websites. NI Direct, the government website for Northern Ireland, provides information on all areas of government activity, bringing it together in one place in a way designed to reflect users’ needs rather than government structures. It provides access to a range of online services and transactions, allowing Northern Irish citizens to, for instance, book a driving test, get benefits advice, renew a passport or buy a television licence38.
This website attracted 624,000 unique visitors in July 2014 across the UK, 1.3% of UK active internet users39 (Figure 7)40.
The Scottish government website41 attracted a unique audience of 193,000 visitors across the UK in July 2014, 0.4% of active internet users. It provides information on issues across the range of devolved responsibilities, including health, education, justice, rural affairs, housing and the environment as well as topical events such as the 2014 Commonwealth Games, the Scottish referendum and news or issues that could impact upon Scottish citizens.
The Welsh Assembly website42, which provides information in English and Welsh, also covers a wide range of issues, including housing, tourism, culture, economic growth and
38 www.NIDirect.gov.uk, accessed 05/09/13 39 comScore MMX Multi-Platform, July 2014 40 We are unable to provide the number of visitors from each nation as comScore multi-platform data cannot be broken down by nation. 41 www.Scotland.gov.uk 42 www.wales.gov.uk
49% 51%
4% 12% 21% 43% 20%
41% 28% 18% 14%
0% 20% 40% 60% 80% 100%
2014
2014
2014
Soc
ial
Gro
upA
ge G
roup
Gen
der
GO
V.U
K [P
]
Males
Females
Under 18
18-24
25-34
35-54
55+
AB
C1
C2
DE
Unique audience (%)
19
Internet Citizens Report 2014
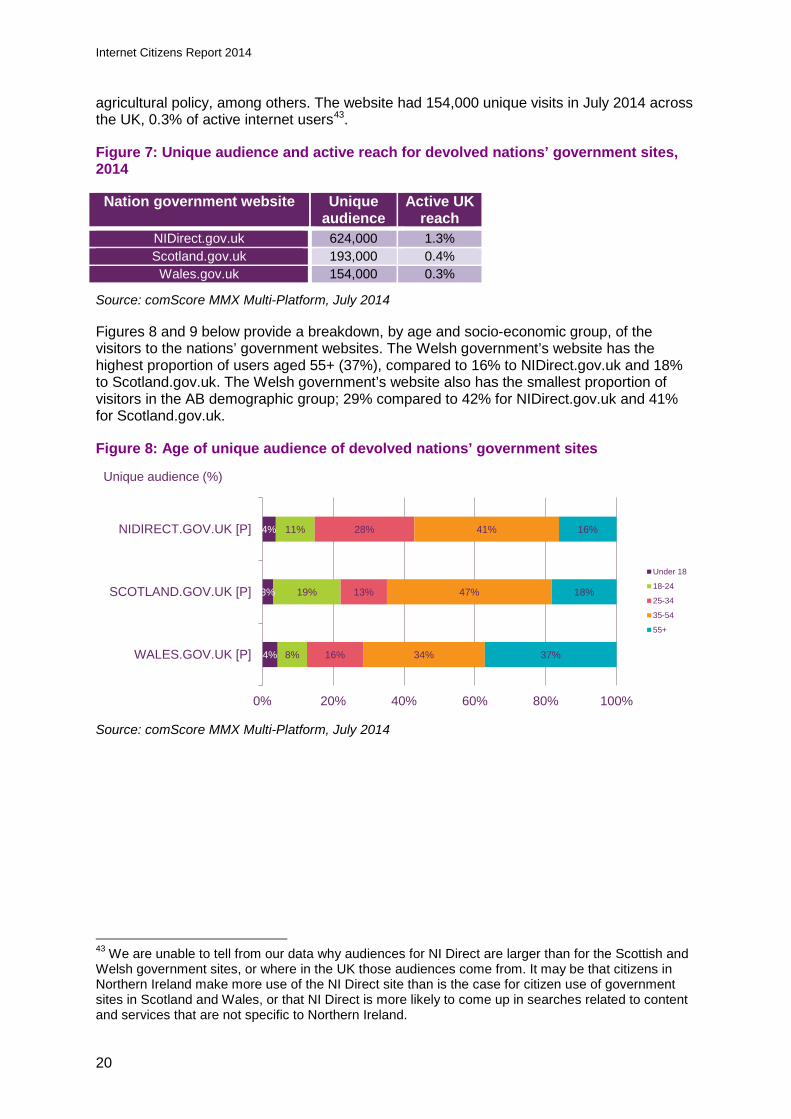
agricultural policy, among others. The website had 154,000 unique visits in July 2014 across the UK, 0.3% of active internet users43.
Figure 7: Unique audience and active reach for devolved nations’ government sites, 2014
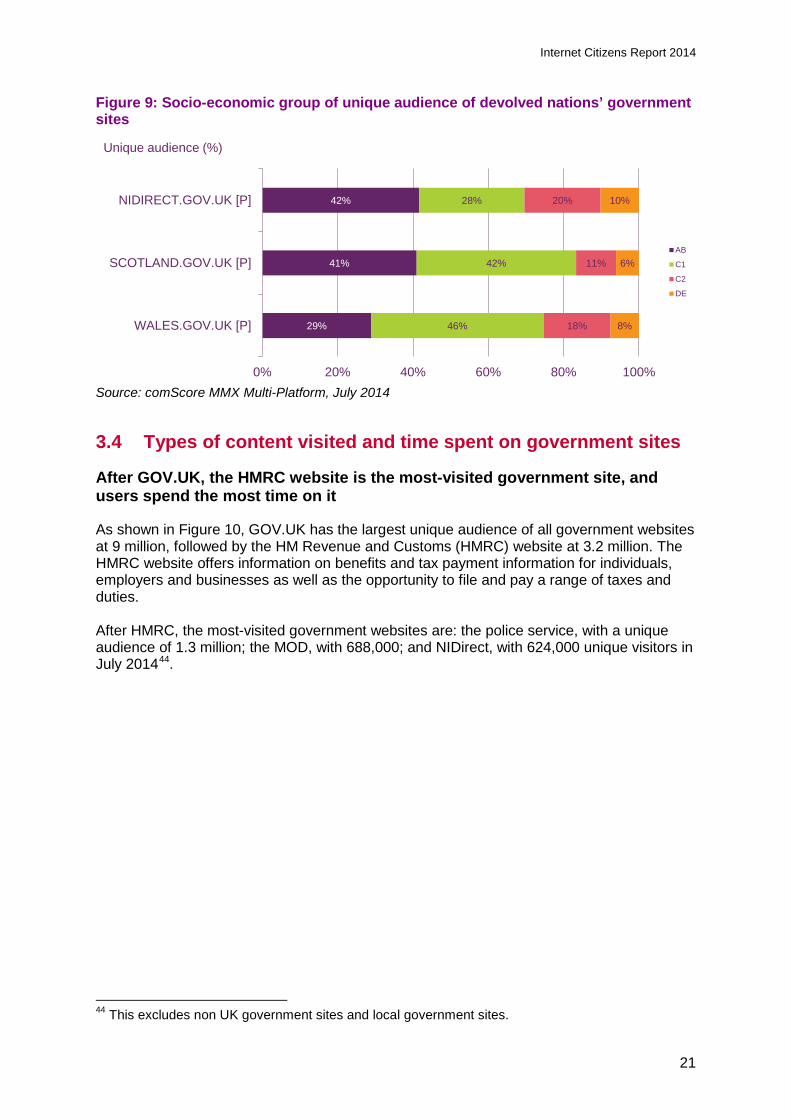
Source: comScore MMX Multi-Platform, July 2014 Figures 8 and 9 below provide a breakdown, by age and socio-economic group, of the visitors to the nations’ government websites. The Welsh government’s website has the highest proportion of users aged 55+ (37%), compared to 16% to NIDirect.gov.uk and 18% to Scotland.gov.uk. The Welsh government’s website also has the smallest proportion of visitors in the AB demographic group; 29% compared to 42% for NIDirect.gov.uk and 41% for Scotland.gov.uk.
Figure 8: Age of unique audience of devolved nations’ government sites
Source: comScore MMX Multi-Platform, July 2014
43 We are unable to tell from our data why audiences for NI Direct are larger than for the Scottish and Welsh government sites, or where in the UK those audiences come from. It may be that citizens in Northern Ireland make more use of the NI Direct site than is the case for citizen use of government sites in Scotland and Wales, or that NI Direct is more likely to come up in searches related to content and services that are not specific to Northern Ireland.
Unique audience (%)
4%
3%
4%
8%
19%
11%
16%
13%
28%
34%
47%
41%
37%
18%
16%
0% 20% 40% 60% 80% 100%
WALES.GOV.UK [P]
SCOTLAND.GOV.UK [P]
NIDIRECT.GOV.UK [P]
Under 18
18-24
25-34
35-54
55+
Nation government website Unique audience
Active UK reach
NIDirect.gov.uk 624,000 1.3% Scotland.gov.uk 193,000 0.4% Wales.gov.uk 154,000 0.3%
20
Internet Citizens Report 2014
Figure 9: Socio-economic group of unique audience of devolved nations’ government sites
Source: comScore MMX Multi-Platform, July 2014 3.4 Types of content visited and time spent on government sites
After GOV.UK, the HMRC website is the most-visited government site, and users spend the most time on it
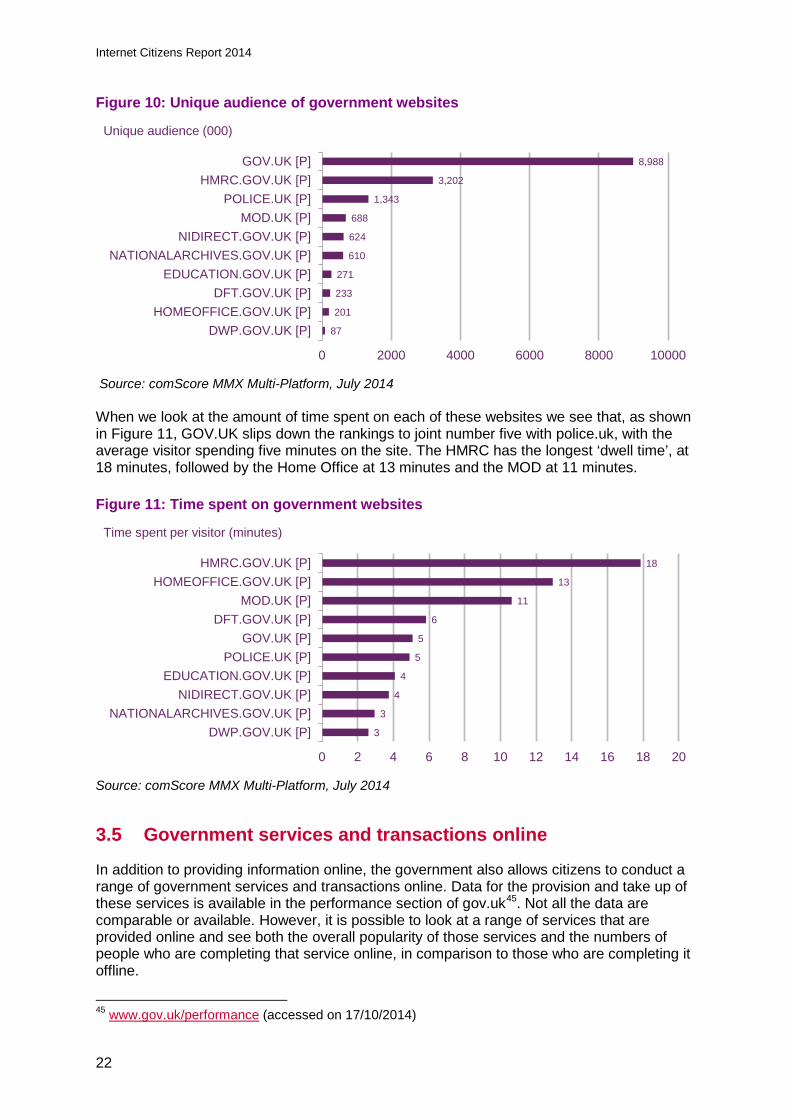
As shown in Figure 10, GOV.UK has the largest unique audience of all government websites at 9 million, followed by the HM Revenue and Customs (HMRC) website at 3.2 million. The HMRC website offers information on benefits and tax payment information for individuals, employers and businesses as well as the opportunity to file and pay a range of taxes and duties. After HMRC, the most-visited government websites are: the police service, with a unique audience of 1.3 million; the MOD, with 688,000; and NIDirect, with 624,000 unique visitors in July 201444.
44 This excludes non UK government sites and local government sites.
Unique audience (%)
29%
41%
42%
46%
42%
28%
18%
11%
20%
8%
6%
10%
0% 20% 40% 60% 80% 100%
WALES.GOV.UK [P]
SCOTLAND.GOV.UK [P]
NIDIRECT.GOV.UK [P]
AB
C1
C2
DE
21
Internet Citizens Report 2014
Figure 10: Unique audience of government websites
Source: comScore MMX Multi-Platform, July 2014 When we look at the amount of time spent on each of these websites we see that, as shown in Figure 11, GOV.UK slips down the rankings to joint number five with police.uk, with the average visitor spending five minutes on the site. The HMRC has the longest ‘dwell time’, at 18 minutes, followed by the Home Office at 13 minutes and the MOD at 11 minutes.
Figure 11: Time spent on government websites
Source: comScore MMX Multi-Platform, July 2014 3.5 Government services and transactions online
In addition to providing information online, the government also allows citizens to conduct a range of government services and transactions online. Data for the provision and take up of these services is available in the performance section of gov.uk45. Not all the data are comparable or available. However, it is possible to look at a range of services that are provided online and see both the overall popularity of those services and the numbers of people who are completing that service online, in comparison to those who are completing it offline.
45 www.gov.uk/performance (accessed on 17/10/2014)
Unique audience (000)
87
201
233
271
610
624
688
1,343
3,202
8,988
0 2000 4000 6000 8000 10000
DWP.GOV.UK [P]HOMEOFFICE.GOV.UK [P]
DFT.GOV.UK [P]EDUCATION.GOV.UK [P]
NATIONALARCHIVES.GOV.UK [P]NIDIRECT.GOV.UK [P]
MOD.UK [P]POLICE.UK [P]
HMRC.GOV.UK [P]GOV.UK [P]
Time spent per visitor (minutes)
3
3
4
4
5
5
6
11
13
18
0 2 4 6 8 10 12 14 16 18 20
DWP.GOV.UK [P]NATIONALARCHIVES.GOV.UK [P]
NIDIRECT.GOV.UK [P]EDUCATION.GOV.UK [P]
POLICE.UK [P]GOV.UK [P]
DFT.GOV.UK [P]MOD.UK [P]
HOMEOFFICE.GOV.UK [P]HMRC.GOV.UK [P]
22
Internet Citizens Report 2014
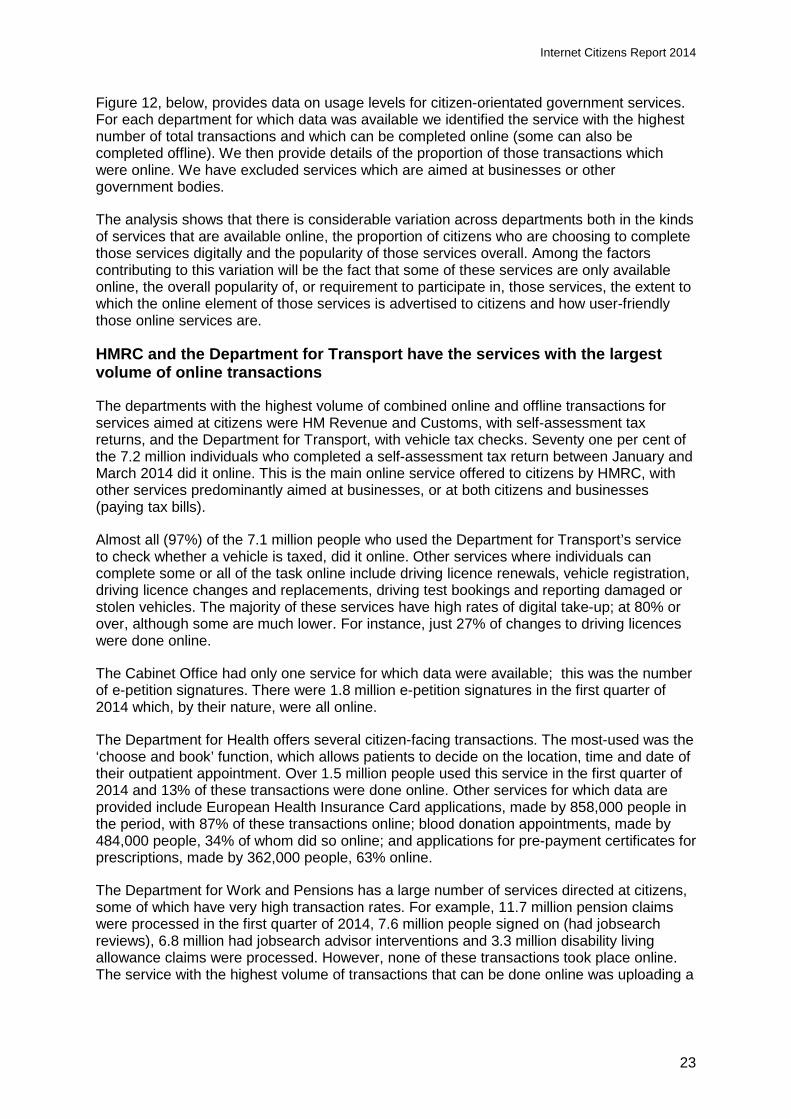
Figure 12, below, provides data on usage levels for citizen-orientated government services. For each department for which data was available we identified the service with the highest number of total transactions and which can be completed online (some can also be completed offline). We then provide details of the proportion of those transactions which were online. We have excluded services which are aimed at businesses or other government bodies.
The analysis shows that there is considerable variation across departments both in the kinds of services that are available online, the proportion of citizens who are choosing to complete those services digitally and the popularity of those services overall. Among the factors contributing to this variation will be the fact that some of these services are only available online, the overall popularity of, or requirement to participate in, those services, the extent to which the online element of those services is advertised to citizens and how user-friendly those online services are.
HMRC and the Department for Transport have the services with the largest volume of online transactions
The departments with the highest volume of combined online and offline transactions for services aimed at citizens were HM Revenue and Customs, with self-assessment tax returns, and the Department for Transport, with vehicle tax checks. Seventy one per cent of the 7.2 million individuals who completed a self-assessment tax return between January and March 2014 did it online. This is the main online service offered to citizens by HMRC, with other services predominantly aimed at businesses, or at both citizens and businesses (paying tax bills).
Almost all (97%) of the 7.1 million people who used the Department for Transport’s service to check whether a vehicle is taxed, did it online. Other services where individuals can complete some or all of the task online include driving licence renewals, vehicle registration, driving licence changes and replacements, driving test bookings and reporting damaged or stolen vehicles. The majority of these services have high rates of digital take-up; at 80% or over, although some are much lower. For instance, just 27% of changes to driving licences were done online.
The Cabinet Office had only one service for which data were available; this was the number of e-petition signatures. There were 1.8 million e-petition signatures in the first quarter of 2014 which, by their nature, were all online.
The Department for Health offers several citizen-facing transactions. The most-used was the ‘choose and book’ function, which allows patients to decide on the location, time and date of their outpatient appointment. Over 1.5 million people used this service in the first quarter of 2014 and 13% of these transactions were done online. Other services for which data are provided include European Health Insurance Card applications, made by 858,000 people in the period, with 87% of these transactions online; blood donation appointments, made by 484,000 people, 34% of whom did so online; and applications for pre-payment certificates for prescriptions, made by 362,000 people, 63% online.
The Department for Work and Pensions has a large number of services directed at citizens, some of which have very high transaction rates. For example, 11.7 million pension claims were processed in the first quarter of 2014, 7.6 million people signed on (had jobsearch reviews), 6.8 million had jobsearch advisor interventions and 3.3 million disability living allowance claims were processed. However, none of these transactions took place online. The service with the highest volume of transactions that can be done online was uploading a
23
Internet Citizens Report 2014
CV for the universal jobmatch service. This was done by 1.3 million people in the first quarter of 2014 and was entirely done online46.
The Department for Business, Innovation and Skills has a range of services aimed at individuals. The most popular is applications for apprenticeships; this was completed by 486,000 people in the first quarter of 2014, and all the applications were done online. The next most popular transaction was land registry searches, with 477,000 searches made in the first quarter of 2014, 99% of them online. This was followed by student finance applications for full-time study; 387,000 of these applications were made, 98% of them online.
The Ministry of Justice provided data for only one service that could be done both online and offline. That service is money claims, which allows individuals to take court action against someone who owes them money and won’t pay it back. In the first quarter of 2014 337,000 people used this service, 14% of whom did it online.
The final department for which information is available is the Department for Environment, Food and Rural Affairs. The only service aimed at individuals for which data were provided is fishing rod licence applications; 47,700 people applied for these licences, 41% of them online.
Figure 12: Selected government transactions that can be completed online, by department, total volume, and proportion completed online: Jan-Mar 2014
Source: www.gov.uk/performance
46 It is likely that this situation will change with the introduction of Universal Credit, roll out of which is intended to be complete by the end of 2017 and which can only be claimed online.
24
Internet Citizens Report 2014
3.6 Self-reported use of government and council websites
As well as using online measurement industry metrics, it is useful to examine evidence from various surveys that ask respondents about their e-government activity, especially in order to track how this has changed over time.
Nearly three-quarters of internet users say they have ever found out information about government services online
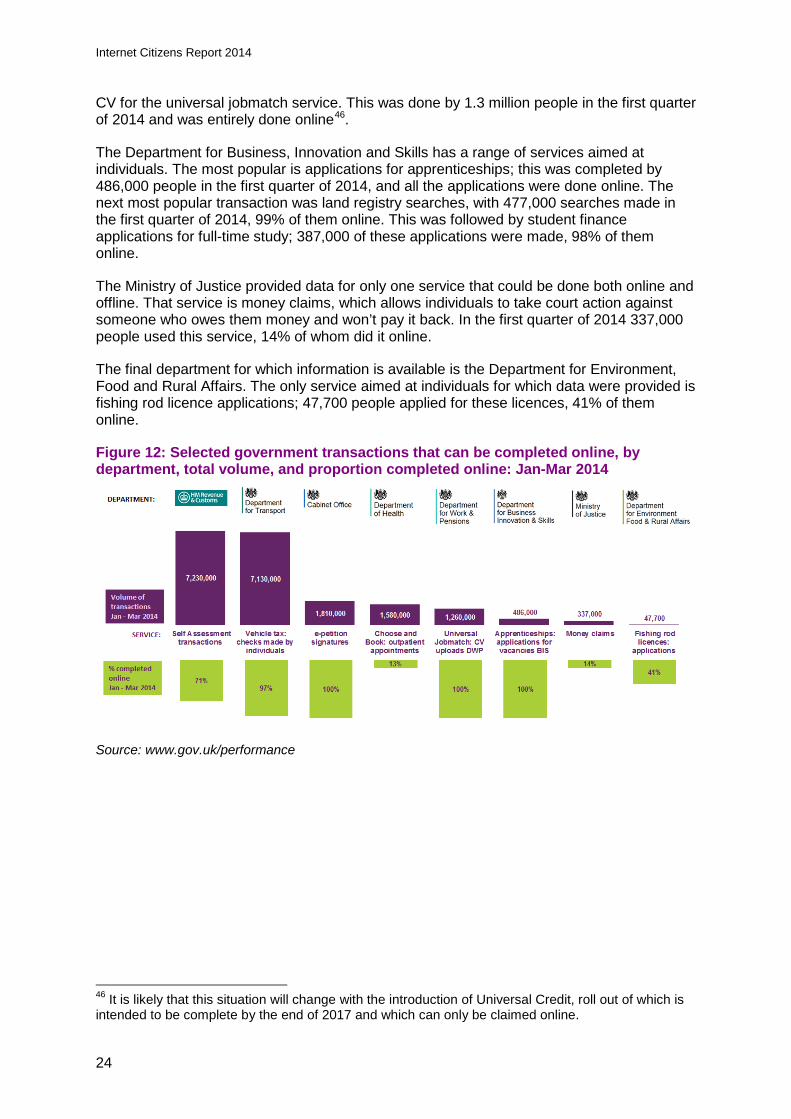
As Figure 13 shows, Ofcom’s Adults’ Media Use and Attitudes Report (2014) finds that nearly three-quarters (70%) of internet users say they have ever found information online about local or national government public services, six in ten (61%) say that they have ever completed a government process online, nearly a third (29%) have looked at political, campaign or issues websites and just over one in ten (13%) have contacted their local councillor or an MP.
Completing a government process online is up from 53% in 2011, although there has not been an increase over the same period in the other activities listed above.
These activities are less likely among those aged 65 and over, and those in DE households; just 61% of those aged 65 and over, and 54% of DEs have ever found information online, compared to 70% of UK internet users. Similarly, 47% of those aged 65 and over and 43% of DEs say that they have ever completed a government process online, compared to 61% of all UK internet users.
Figure 13: Individual government-related activities ever undertaken: 2009-2012
Source: Adults’ Media Use and Attitudes Report 2014, Ofcom research, fieldwork carried out by Saville Rossiter-Base in October to November 2013. Base: All adults aged 16+ who use the internet at home or elsewhere (1369 in 2011, 1381 in 2012, 1272 in 2013). IN18N – Please think about going online on any type of computer, on a mobile phone, on a games player or on a media player. From this list please tell me the types of things you currently do online and how often you do each? (Prompted responses, single coded) The Office for National Statistics data47 report that in 2014 37% of adults in Great Britain obtained information from a public authority or service website (such as local authorities, schools and universities, or government departments). Adults in the 45-54 age group had the highest level of interaction with public authorities or services, across all categories surveyed; almost half (49%) obtaining information from websites, 36% downloading official
47 http://www.ons.gov.uk/ons/dcp171778_373584.pdf
68
53
27
12
74
60
32
13
7061
29
13
0
25
50
75
100
Finding information aboutpublic services provided
by local or nationalgovernment
Complete governmentprocesses online
Looking at political orcampaign issues
websites
Contacting localcouncillor or MP
201120122013
25
Internet Citizens Report 2014
forms and 40% submitting official forms. They were closely followed by adults in the 35-44 age group, at 45%, 35% and 40% respectively.
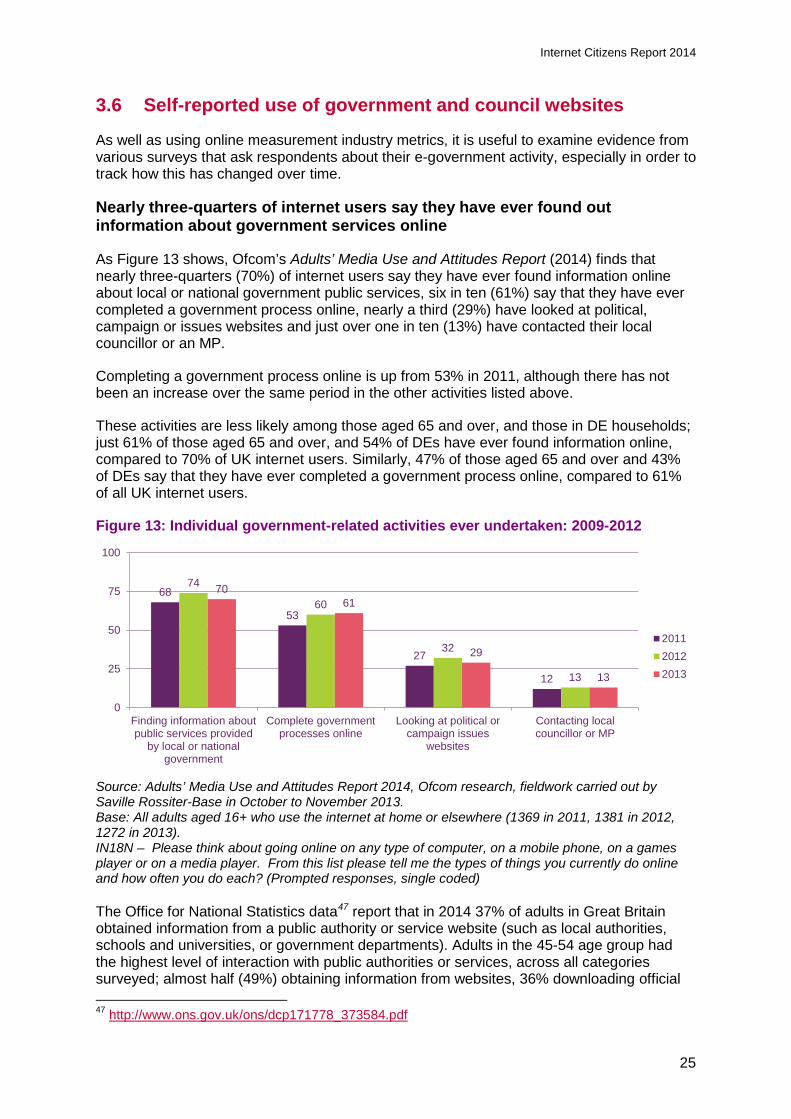
Ofcom’s 2014 Adults’ Media Use and Attitudes report examined the frequency of use made of various public/ civic activities. As Figure 14 highlights, for the majority of internet users, these kinds of government-related activities are not a weekly occurrence. Although 70% of internet users say they have ever found information online about public services provided by local or national government, this reduces to just under a third who do this at least quarterly, and one in ten who do it at least once a week. Similarly, while 61% of users ever complete government processes online, only 22% do it at least quarterly and 6% do it once a week.
Figure 14: Self-reported frequency of government-related activities ever undertaken
Source: Adults’ Media Use and Attitudes Report 2014, Ofcom research, fieldwork carried out by Saville Rossiter-Base in October to November 2013. Base: All adults aged 16+ who use the internet at home or elsewhere (1369 in 2011, 1381 in 2012, 1272 in 2013). IN18N – Please think about going online on any type of computer, on a mobile phone, on a games player or on a media player. From this list please tell me the types of things you currently do online and how often you do each? (Prompted responses, single coded) Self-reported participation across the nations is generally lower for Northern Ireland
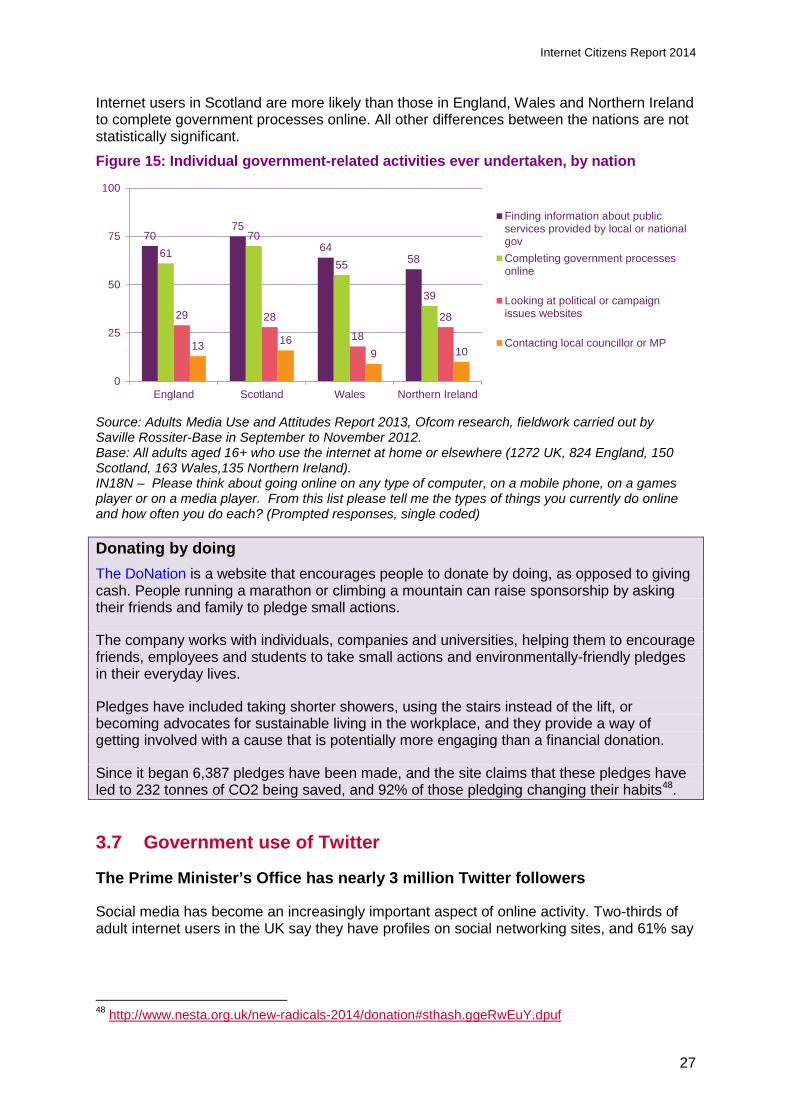
Figure 15 shows levels of self-reported participation across the UK nations. The relative popularity of each of the four activities remains the same across all four nations, with ‘finding information about public services’ the most popular and ‘contacting a councillor or MP’ the least common. However, there are some differences between the nations in how likely their respective citizens are to participate in these activities. Internet users in Northern Ireland are significantly less likely than those in all other nations to say they complete government processes online. They are also significantly less likely than users in both England and Scotland to say they look for information about public services online. Internet users in Wales are significantly less likely than users in all other nations to look at political, campaign or issue websites, and less likely than those in Scotland to complete government processes online and to look for information about public services online.
9 6 6
3022
93
3033
149
0
25
50
75
100
Finding information aboutpublic services provided by
local or nationalgovernment
Complete governmentprocesses online
Looking at political orcampaign issues websites
Contacting local councilloror MP
At least weekly At least quarterly Less often
26
Internet Citizens Report 2014
Internet users in Scotland are more likely than those in England, Wales and Northern Ireland to complete government processes online. All other differences between the nations are not statistically significant.
Figure 15: Individual government-related activities ever undertaken, by nation
Source: Adults Media Use and Attitudes Report 2013, Ofcom research, fieldwork carried out by Saville Rossiter-Base in September to November 2012. Base: All adults aged 16+ who use the internet at home or elsewhere (1272 UK, 824 England, 150 Scotland, 163 Wales,135 Northern Ireland). IN18N – Please think about going online on any type of computer, on a mobile phone, on a games player or on a media player. From this list please tell me the types of things you currently do online and how often you do each? (Prompted responses, single coded) Donating by doing The DoNation is a website that encourages people to donate by doing, as opposed to giving cash. People running a marathon or climbing a mountain can raise sponsorship by asking their friends and family to pledge small actions.
The company works with individuals, companies and universities, helping them to encourage friends, employees and students to take small actions and environmentally-friendly pledges in their everyday lives.
Pledges have included taking shorter showers, using the stairs instead of the lift, or becoming advocates for sustainable living in the workplace, and they provide a way of getting involved with a cause that is potentially more engaging than a financial donation.
Since it began 6,387 pledges have been made, and the site claims that these pledges have led to 232 tonnes of CO2 being saved, and 92% of those pledging changing their habits48.
3.7 Government use of Twitter
The Prime Minister’s Office has nearly 3 million Twitter followers
Social media has become an increasingly important aspect of online activity. Two-thirds of adult internet users in the UK say they have profiles on social networking sites, and 61% say
48 http://www.nesta.org.uk/new-radicals-2014/donation#sthash.ggeRwEuY.dpuf
7075
645861
70
55
39
29 28
18
28
13 169 10
0
25
50
75
100
England Scotland Wales Northern Ireland
Finding information about publicservices provided by local or nationalgovCompleting government processesonline
Looking at political or campaignissues websites
Contacting local councillor or MP
27
Internet Citizens Report 2014
they look at social networking sites at least once a week. Ninety-six per cent of adults with at least one social networking profile have one on Facebook, and 28% have one on Twitter49.
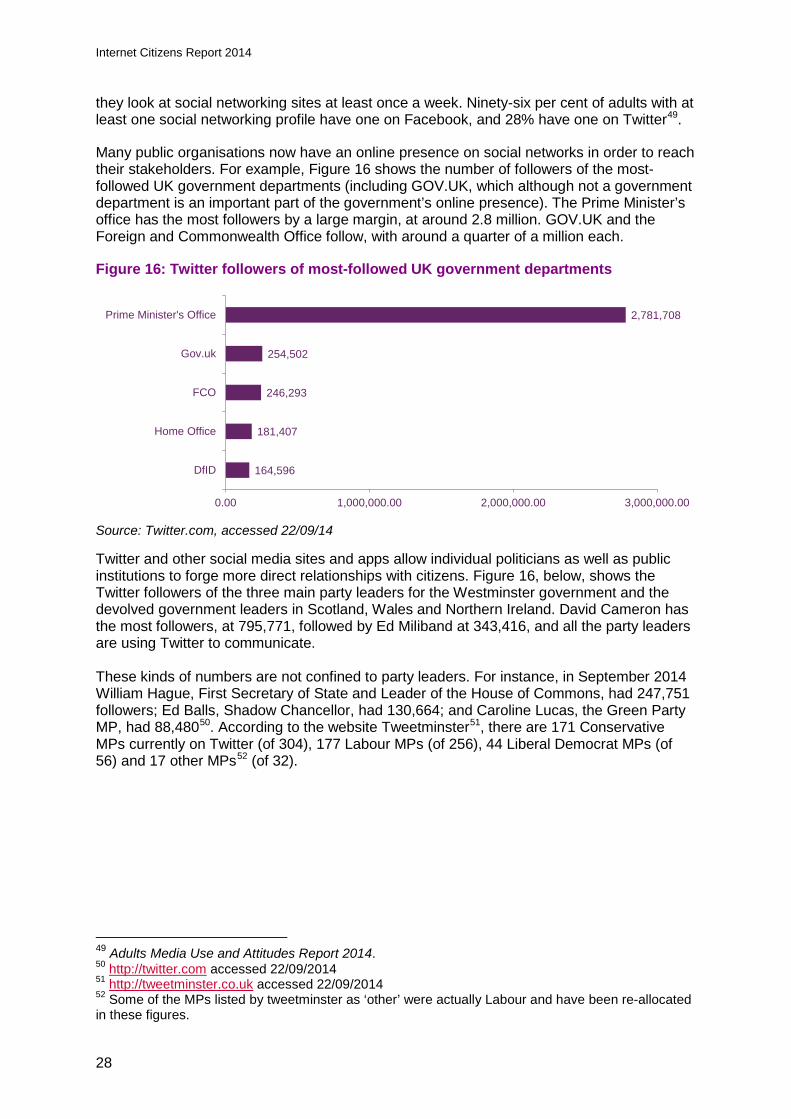
Many public organisations now have an online presence on social networks in order to reach their stakeholders. For example, Figure 16 shows the number of followers of the most-followed UK government departments (including GOV.UK, which although not a government department is an important part of the government’s online presence). The Prime Minister’s office has the most followers by a large margin, at around 2.8 million. GOV.UK and the Foreign and Commonwealth Office follow, with around a quarter of a million each.
Figure 16: Twitter followers of most-followed UK government departments
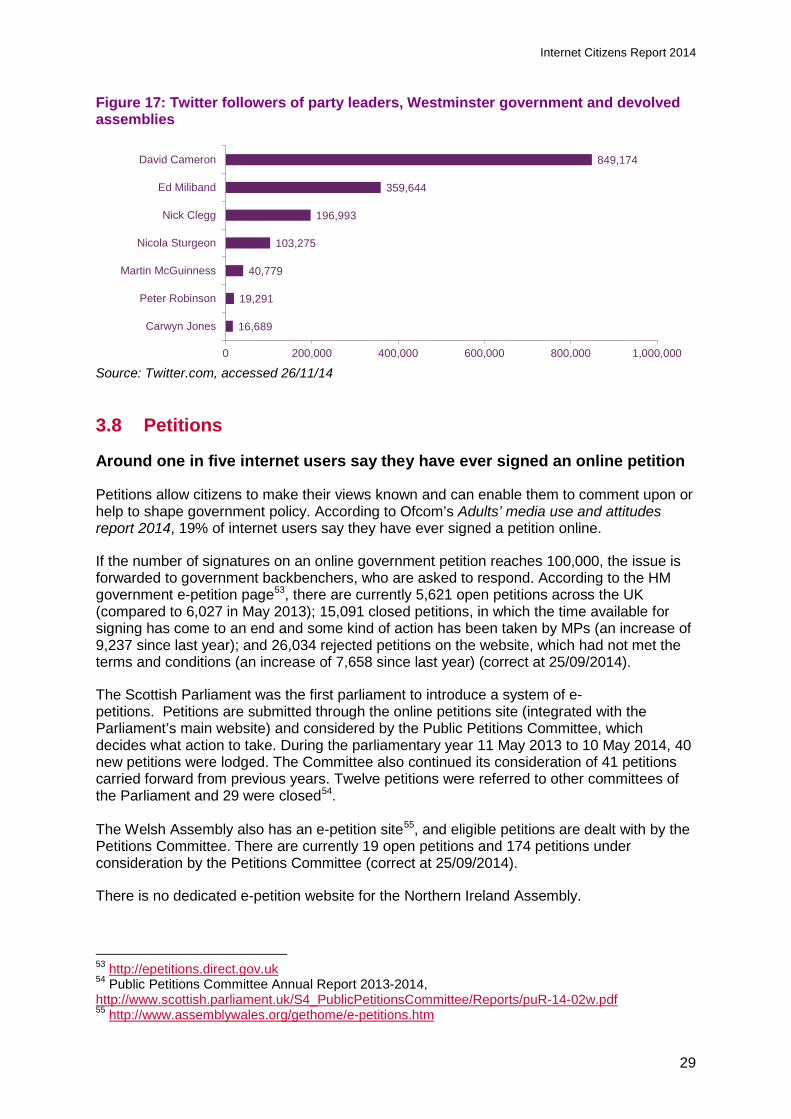
Source: Twitter.com, accessed 22/09/14 Twitter and other social media sites and apps allow individual politicians as well as public institutions to forge more direct relationships with citizens. Figure 16, below, shows the Twitter followers of the three main party leaders for the Westminster government and the devolved government leaders in Scotland, Wales and Northern Ireland. David Cameron has the most followers, at 795,771, followed by Ed Miliband at 343,416, and all the party leaders are using Twitter to communicate. These kinds of numbers are not confined to party leaders. For instance, in September 2014 William Hague, First Secretary of State and Leader of the House of Commons, had 247,751 followers; Ed Balls, Shadow Chancellor, had 130,664; and Caroline Lucas, the Green Party MP, had 88,48050. According to the website Tweetminster51, there are 171 Conservative MPs currently on Twitter (of 304), 177 Labour MPs (of 256), 44 Liberal Democrat MPs (of 56) and 17 other MPs52 (of 32).
49 Adults Media Use and Attitudes Report 2014. 50 http://twitter.com accessed 22/09/2014 51 http://tweetminster.co.uk accessed 22/09/2014 52 Some of the MPs listed by tweetminster as ‘other’ were actually Labour and have been re-allocated in these figures.
164,596
181,407
246,293
254,502
2,781,708
0.00 1,000,000.00 2,000,000.00 3,000,000.00
DfID
Home Office
FCO
Gov.uk
Prime Minister's Office
28
Internet Citizens Report 2014
Figure 17: Twitter followers of party leaders, Westminster government and devolved assemblies
Source: Twitter.com, accessed 26/11/14 3.8 Petitions
Around one in five internet users say they have ever signed an online petition
Petitions allow citizens to make their views known and can enable them to comment upon or help to shape government policy. According to Ofcom’s Adults’ media use and attitudes report 2014, 19% of internet users say they have ever signed a petition online.
If the number of signatures on an online government petition reaches 100,000, the issue is forwarded to government backbenchers, who are asked to respond. According to the HM government e-petition page53, there are currently 5,621 open petitions across the UK (compared to 6,027 in May 2013); 15,091 closed petitions, in which the time available for signing has come to an end and some kind of action has been taken by MPs (an increase of 9,237 since last year); and 26,034 rejected petitions on the website, which had not met the terms and conditions (an increase of 7,658 since last year) (correct at 25/09/2014).
The Scottish Parliament was the first parliament to introduce a system of e-petitions. Petitions are submitted through the online petitions site (integrated with the Parliament’s main website) and considered by the Public Petitions Committee, which decides what action to take. During the parliamentary year 11 May 2013 to 10 May 2014, 40 new petitions were lodged. The Committee also continued its consideration of 41 petitions carried forward from previous years. Twelve petitions were referred to other committees of the Parliament and 29 were closed54. The Welsh Assembly also has an e-petition site55, and eligible petitions are dealt with by the Petitions Committee. There are currently 19 open petitions and 174 petitions under consideration by the Petitions Committee (correct at 25/09/2014).
There is no dedicated e-petition website for the Northern Ireland Assembly.
53 http://epetitions.direct.gov.uk 54 Public Petitions Committee Annual Report 2013-2014, http://www.scottish.parliament.uk/S4_PublicPetitionsCommittee/Reports/puR-14-02w.pdf 55 http://www.assemblywales.org/gethome/e-petitions.htm
16,689
19,291
40,779
103,275
196,993
359,644
849,174
0 200,000 400,000 600,000 800,000 1,000,000
Carwyn Jones
Peter Robinson
Martin McGuinness
Nicola Sturgeon
Nick Clegg
Ed Miliband
David Cameron
29
Internet Citizens Report 2014
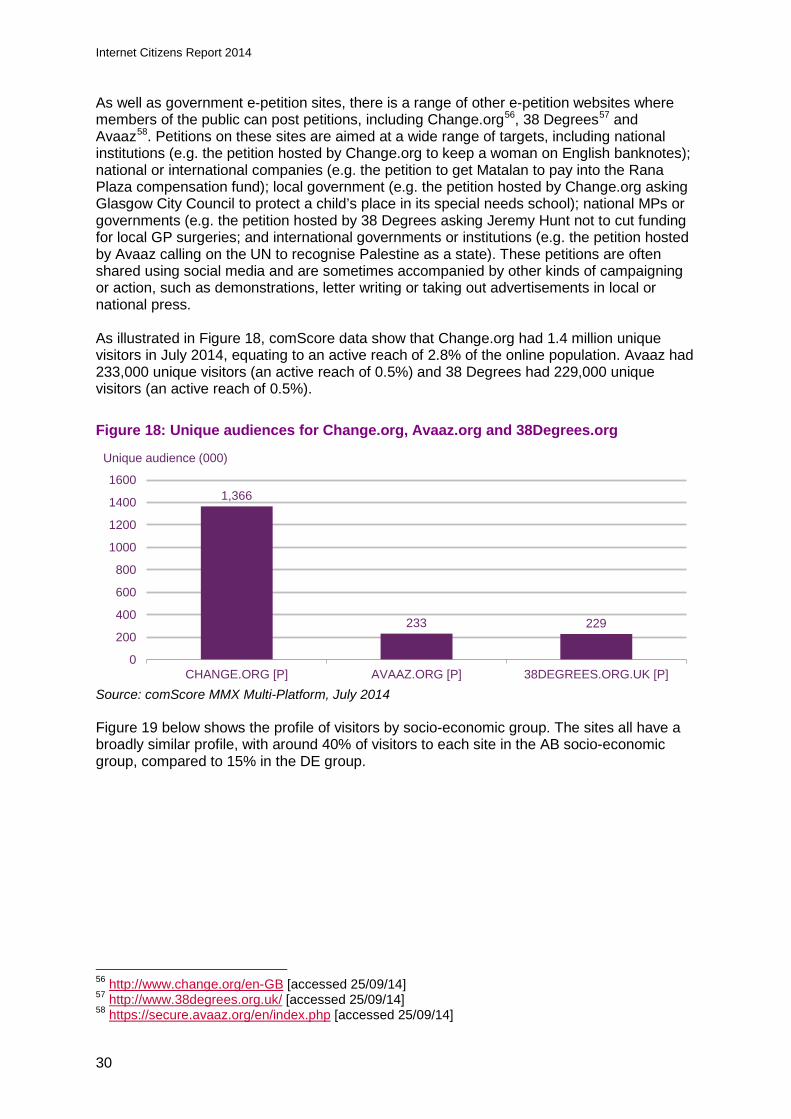
As well as government e-petition sites, there is a range of other e-petition websites where members of the public can post petitions, including Change.org56, 38 Degrees57 and Avaaz58. Petitions on these sites are aimed at a wide range of targets, including national institutions (e.g. the petition hosted by Change.org to keep a woman on English banknotes); national or international companies (e.g. the petition to get Matalan to pay into the Rana Plaza compensation fund); local government (e.g. the petition hosted by Change.org asking Glasgow City Council to protect a child’s place in its special needs school); national MPs or governments (e.g. the petition hosted by 38 Degrees asking Jeremy Hunt not to cut funding for local GP surgeries; and international governments or institutions (e.g. the petition hosted by Avaaz calling on the UN to recognise Palestine as a state). These petitions are often shared using social media and are sometimes accompanied by other kinds of campaigning or action, such as demonstrations, letter writing or taking out advertisements in local or national press. As illustrated in Figure 18, comScore data show that Change.org had 1.4 million unique visitors in July 2014, equating to an active reach of 2.8% of the online population. Avaaz had 233,000 unique visitors (an active reach of 0.5%) and 38 Degrees had 229,000 unique visitors (an active reach of 0.5%).
Figure 18: Unique audiences for Change.org, Avaaz.org and 38Degrees.org
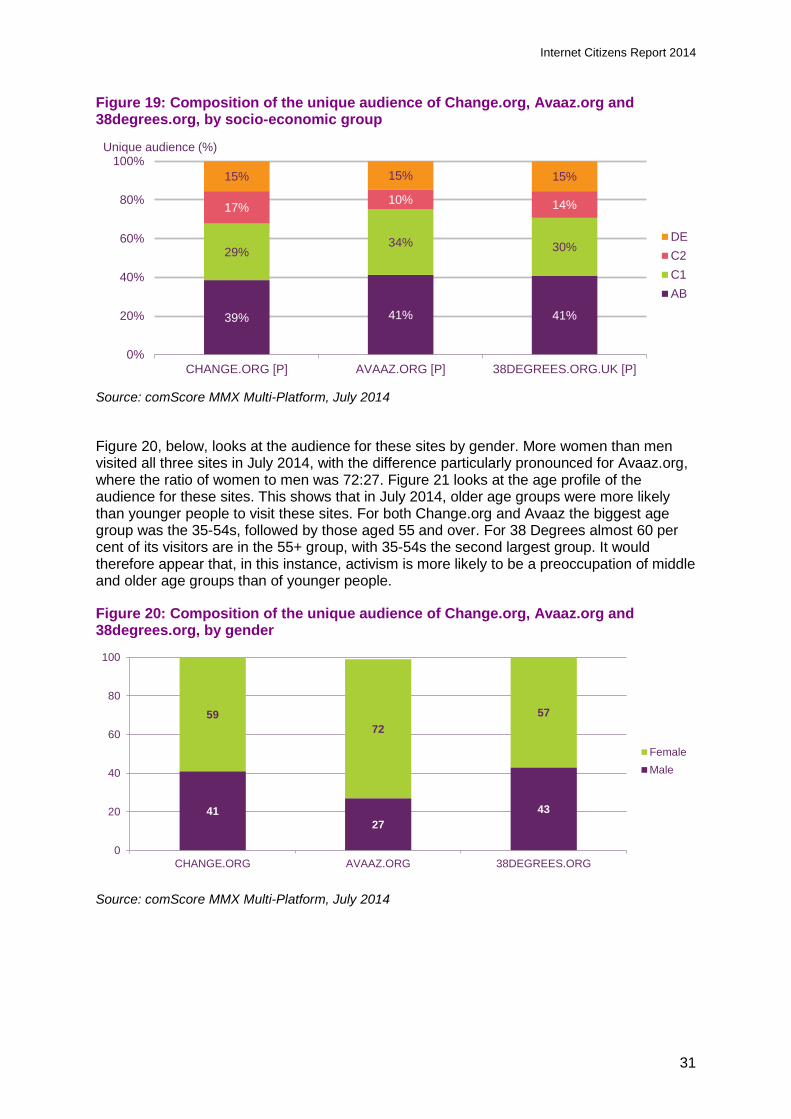
Source: comScore MMX Multi-Platform, July 2014 Figure 19 below shows the profile of visitors by socio-economic group. The sites all have a broadly similar profile, with around 40% of visitors to each site in the AB socio-economic group, compared to 15% in the DE group.
56 http://www.change.org/en-GB [accessed 25/09/14] 57 http://www.38degrees.org.uk/ [accessed 25/09/14] 58 https://secure.avaaz.org/en/index.php [accessed 25/09/14]
Unique audience (000)
1,366
233 229
0
200
400
600
800
1000
1200
1400
1600
CHANGE.ORG [P] AVAAZ.ORG [P] 38DEGREES.ORG.UK [P]
30
Internet Citizens Report 2014
Figure 19: Composition of the unique audience of Change.org, Avaaz.org and 38degrees.org, by socio-economic group
Source: comScore MMX Multi-Platform, July 2014
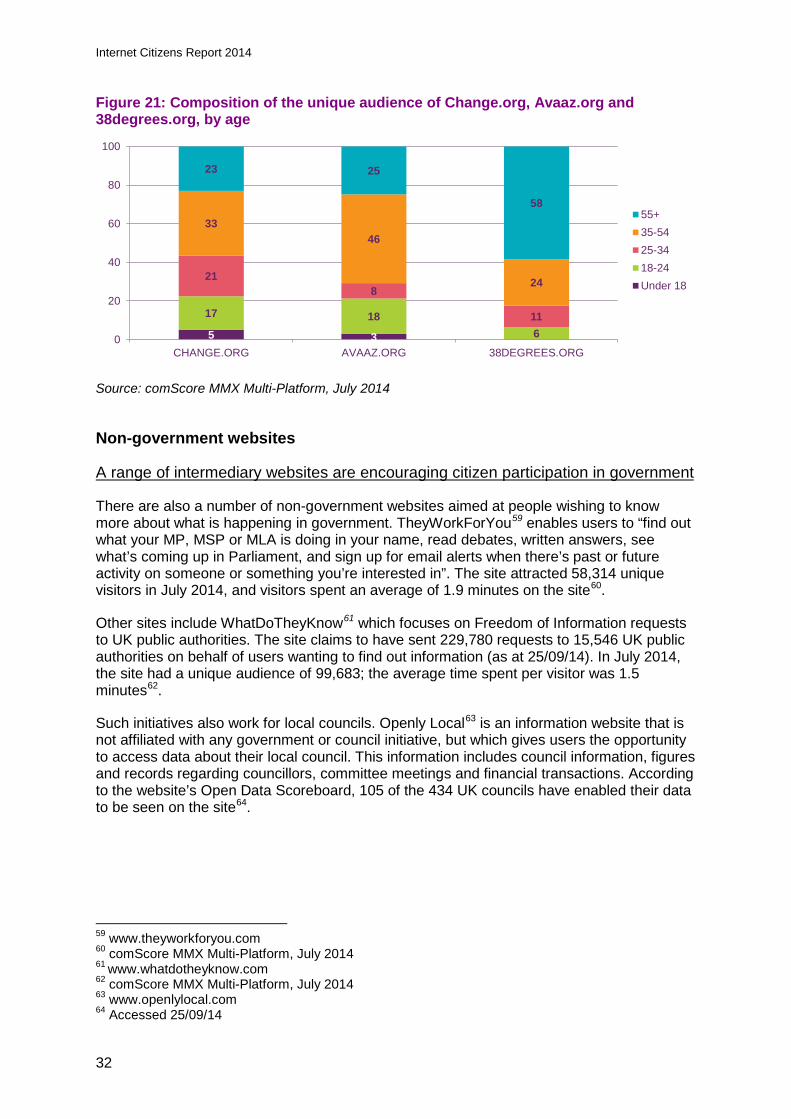
Figure 20, below, looks at the audience for these sites by gender. More women than men visited all three sites in July 2014, with the difference particularly pronounced for Avaaz.org, where the ratio of women to men was 72:27. Figure 21 looks at the age profile of the audience for these sites. This shows that in July 2014, older age groups were more likely than younger people to visit these sites. For both Change.org and Avaaz the biggest age group was the 35-54s, followed by those aged 55 and over. For 38 Degrees almost 60 per cent of its visitors are in the 55+ group, with 35-54s the second largest group. It would therefore appear that, in this instance, activism is more likely to be a preoccupation of middle and older age groups than of younger people.
Figure 20: Composition of the unique audience of Change.org, Avaaz.org and 38degrees.org, by gender
Source: comScore MMX Multi-Platform, July 2014
39% 41% 41%
29%34% 30%
17% 10% 14%
15% 15% 15%
0%
20%
40%
60%
80%
100%
CHANGE.ORG [P] AVAAZ.ORG [P] 38DEGREES.ORG.UK [P]
DEC2C1AB
Unique audience (%)
4127
43
5972
57
0
20
40
60
80
100
CHANGE.ORG AVAAZ.ORG 38DEGREES.ORG
FemaleMale
31
Internet Citizens Report 2014
Figure 21: Composition of the unique audience of Change.org, Avaaz.org and 38degrees.org, by age
Source: comScore MMX Multi-Platform, July 2014
Non-government websites
A range of intermediary websites are encouraging citizen participation in government
There are also a number of non-government websites aimed at people wishing to know more about what is happening in government. TheyWorkForYou59 enables users to “find out what your MP, MSP or MLA is doing in your name, read debates, written answers, see what’s coming up in Parliament, and sign up for email alerts when there’s past or future activity on someone or something you’re interested in”. The site attracted 58,314 unique visitors in July 2014, and visitors spent an average of 1.9 minutes on the site60.
Other sites include WhatDoTheyKnow61 which focuses on Freedom of Information requests to UK public authorities. The site claims to have sent 229,780 requests to 15,546 UK public authorities on behalf of users wanting to find out information (as at 25/09/14). In July 2014, the site had a unique audience of 99,683; the average time spent per visitor was 1.5 minutes62.
Such initiatives also work for local councils. Openly Local63 is an information website that is not affiliated with any government or council initiative, but which gives users the opportunity to access data about their local council. This information includes council information, figures and records regarding councillors, committee meetings and financial transactions. According to the website’s Open Data Scoreboard, 105 of the 434 UK councils have enabled their data to be seen on the site64.
59 www.theyworkforyou.com 60 comScore MMX Multi-Platform, July 2014 61 www.whatdotheyknow.com 62 comScore MMX Multi-Platform, July 2014 63 www.openlylocal.com 64 Accessed 25/09/14
5 3
17 186
218
11
3346
24
23 25
58
0
20
40
60
80
100
CHANGE.ORG AVAAZ.ORG 38DEGREES.ORG
55+35-5425-3418-24Under 18
32
Internet Citizens Report 2014
Summary
Over a third (35%) of active internet users access any type of government website each month, according to comScore data for July 2014. The website most likely to be visited is the UK government web portal GOV.UK, which aggregates information and services from across government. The website had a unique audience in July 2014 of 9.0 million, or 19% of active internet users in the UK for that month, according to comScore data. Visitors were more likely to be in the AB than the DE group socio-economic group.
NI Direct, the government website for Northern Ireland, attracted 624,000 unique visitors in July 2014 across the UK, 1.3% of UK active internet users. The Scottish government website attracted a unique audience of 193,000 visitors across the UK in July 2014, 0.4% of active internet users. The Welsh Assembly website had 154,000 unique visits in July 2014 across the UK, 0.3% of active internet users.
Citizens can interact with government in ways other than visiting government websites. The UK, Scottish and Welsh governments provide facilities for members of the public to petition their elected representatives, with mechanisms in place for those representatives to respond. Other civic organisations are also providing means for democratic involvement in the policy and scrutiny process, including through facilitating petitions aimed at local, national and international governing bodies and at other public and private bodies, and in other ways; for example, through making public data more easily available and by facilitating Freedom of Information requests. Politicians too are increasingly interacting directly with citizens through social media platforms like Twitter.
Citizens can also conduct civic business online. Data from Ofcom’s Media Literacy tracker show that 61% of UK internet users say they ever complete government processes online. This translates into large numbers of online transactions. The government services with the highest number of online transactions are: completing a self-assessment tax return, done by over 7.2 million individuals in January to March 2014, 71% of whom did it online, and checking to see whether a vehicle is taxed, carried out by over 7.1 million individuals, with almost all (97%) of these done online. Internet users in Northern Ireland are significantly less likely than those in all other nations to say they complete government processes online, and those in ABC1 households are more likely than those in C2DE households to have done this.
33
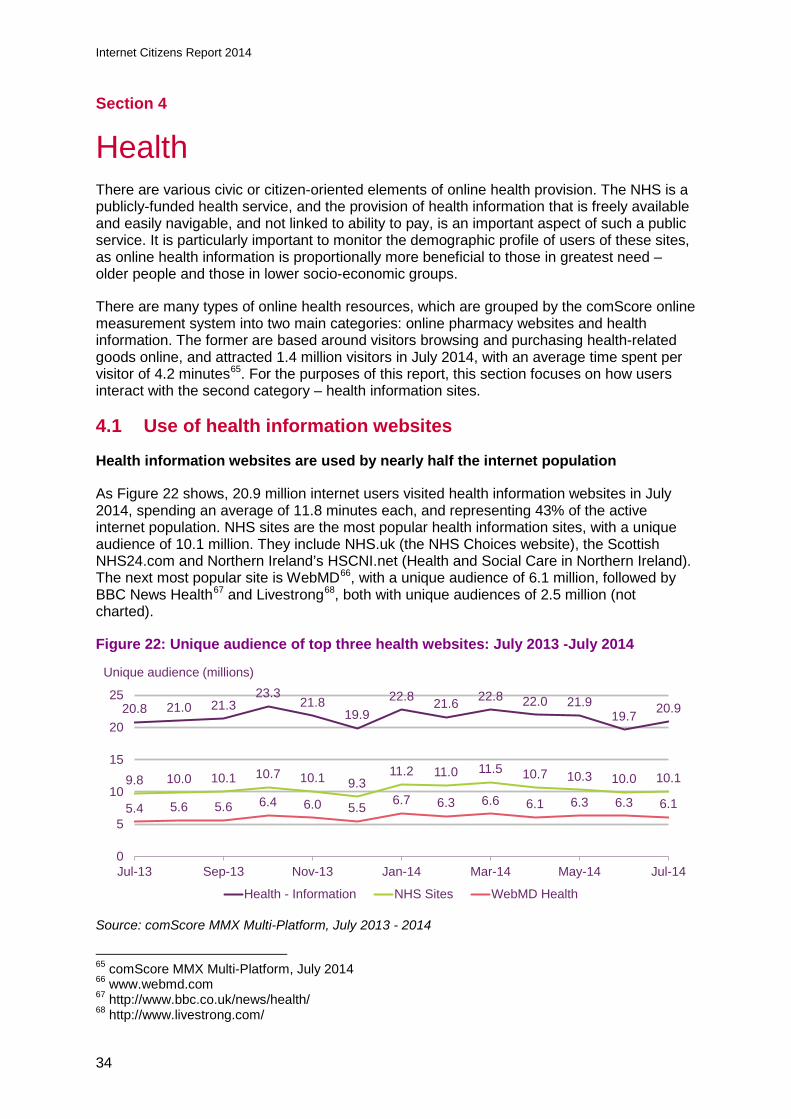
Internet Citizens Report 2014
Section 4
4 Health There are various civic or citizen-oriented elements of online health provision. The NHS is a publicly-funded health service, and the provision of health information that is freely available and easily navigable, and not linked to ability to pay, is an important aspect of such a public service. It is particularly important to monitor the demographic profile of users of these sites, as online health information is proportionally more beneficial to those in greatest need – older people and those in lower socio-economic groups.
There are many types of online health resources, which are grouped by the comScore online measurement system into two main categories: online pharmacy websites and health information. The former are based around visitors browsing and purchasing health-related goods online, and attracted 1.4 million visitors in July 2014, with an average time spent per visitor of 4.2 minutes65. For the purposes of this report, this section focuses on how users interact with the second category – health information sites.
4.1 Use of health information websites
Health information websites are used by nearly half the internet population
As Figure 22 shows, 20.9 million internet users visited health information websites in July 2014, spending an average of 11.8 minutes each, and representing 43% of the active internet population. NHS sites are the most popular health information sites, with a unique audience of 10.1 million. They include NHS.uk (the NHS Choices website), the Scottish NHS24.com and Northern Ireland’s HSCNI.net (Health and Social Care in Northern Ireland). The next most popular site is WebMD66, with a unique audience of 6.1 million, followed by BBC News Health67 and Livestrong68, both with unique audiences of 2.5 million (not charted).
Figure 22: Unique audience of top three health websites: July 2013 -July 2014
Source: comScore MMX Multi-Platform, July 2013 - 2014
65 comScore MMX Multi-Platform, July 2014 66 www.webmd.com 67 http://www.bbc.co.uk/news/health/ 68 http://www.livestrong.com/
20.8 21.0 21.323.3
21.819.9
22.8 21.6 22.8 22.0 21.919.7 20.9
9.8 10.0 10.1 10.7 10.1 9.311.2 11.0 11.5 10.7 10.3 10.0 10.1
5.4 5.6 5.6 6.4 6.0 5.5 6.7 6.3 6.6 6.1 6.3 6.3 6.1
0
5
10
15
20
25
Jul-13 Sep-13 Nov-13 Jan-14 Mar-14 May-14 Jul-14
Health - Information NHS Sites WebMD Health
Unique audience (millions)
34
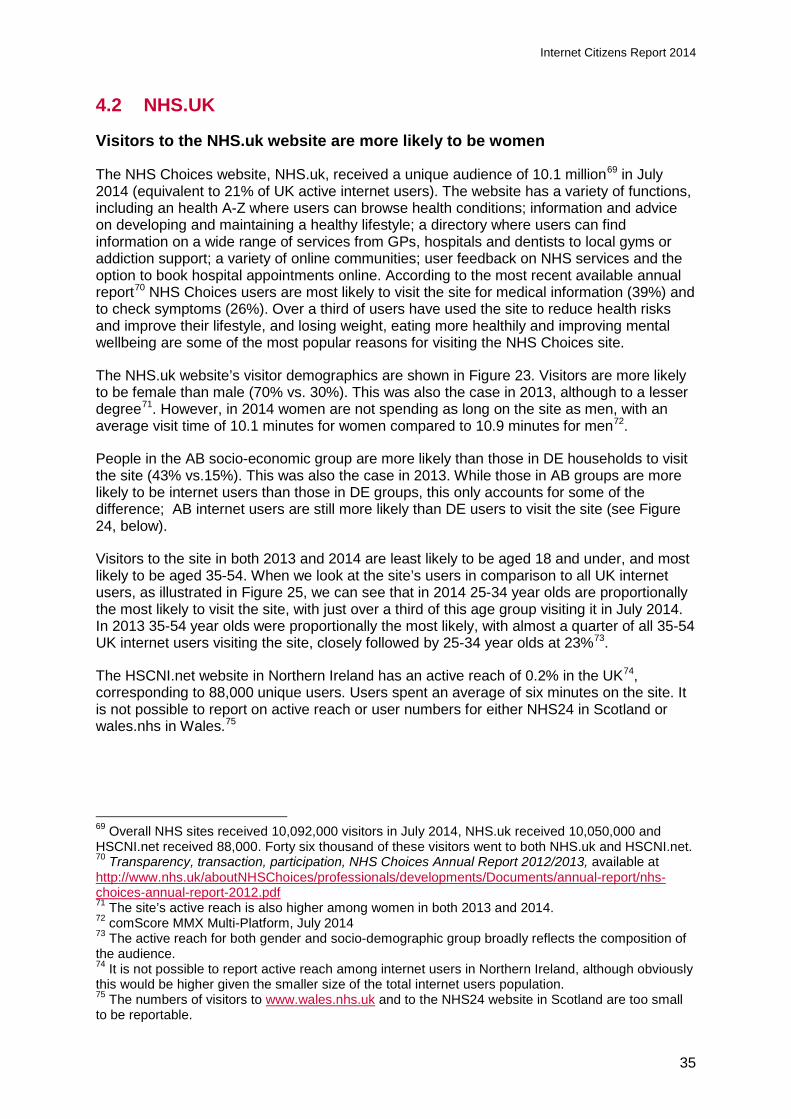
Internet Citizens Report 2014
4.2 NHS.UK
Visitors to the NHS.uk website are more likely to be women
The NHS Choices website, NHS.uk, received a unique audience of 10.1 million69 in July 2014 (equivalent to 21% of UK active internet users). The website has a variety of functions, including an health A-Z where users can browse health conditions; information and advice on developing and maintaining a healthy lifestyle; a directory where users can find information on a wide range of services from GPs, hospitals and dentists to local gyms or addiction support; a variety of online communities; user feedback on NHS services and the option to book hospital appointments online. According to the most recent available annual report70 NHS Choices users are most likely to visit the site for medical information (39%) and to check symptoms (26%). Over a third of users have used the site to reduce health risks and improve their lifestyle, and losing weight, eating more healthily and improving mental wellbeing are some of the most popular reasons for visiting the NHS Choices site.
The NHS.uk website’s visitor demographics are shown in Figure 23. Visitors are more likely to be female than male (70% vs. 30%). This was also the case in 2013, although to a lesser degree71. However, in 2014 women are not spending as long on the site as men, with an average visit time of 10.1 minutes for women compared to 10.9 minutes for men72.
People in the AB socio-economic group are more likely than those in DE households to visit the site (43% vs.15%). This was also the case in 2013. While those in AB groups are more likely to be internet users than those in DE groups, this only accounts for some of the difference; AB internet users are still more likely than DE users to visit the site (see Figure 24, below).
Visitors to the site in both 2013 and 2014 are least likely to be aged 18 and under, and most likely to be aged 35-54. When we look at the site’s users in comparison to all UK internet users, as illustrated in Figure 25, we can see that in 2014 25-34 year olds are proportionally the most likely to visit the site, with just over a third of this age group visiting it in July 2014. In 2013 35-54 year olds were proportionally the most likely, with almost a quarter of all 35-54 UK internet users visiting the site, closely followed by 25-34 year olds at 23%73.
The HSCNI.net website in Northern Ireland has an active reach of 0.2% in the UK74, corresponding to 88,000 unique users. Users spent an average of six minutes on the site. It is not possible to report on active reach or user numbers for either NHS24 in Scotland or wales.nhs in Wales.75
69 Overall NHS sites received 10,092,000 visitors in July 2014, NHS.uk received 10,050,000 and HSCNI.net received 88,000. Forty six thousand of these visitors went to both NHS.uk and HSCNI.net. 70 Transparency, transaction, participation, NHS Choices Annual Report 2012/2013, available at http://www.nhs.uk/aboutNHSChoices/professionals/developments/Documents/annual-report/nhs-choices-annual-report-2012.pdf 71 The site’s active reach is also higher among women in both 2013 and 2014. 72 comScore MMX Multi-Platform, July 2014 73 The active reach for both gender and socio-demographic group broadly reflects the composition of the audience. 74 It is not possible to report active reach among internet users in Northern Ireland, although obviously this would be higher given the smaller size of the total internet users population. 75 The numbers of visitors to www.wales.nhs.uk and to the NHS24 website in Scotland are too small to be reportable.
35
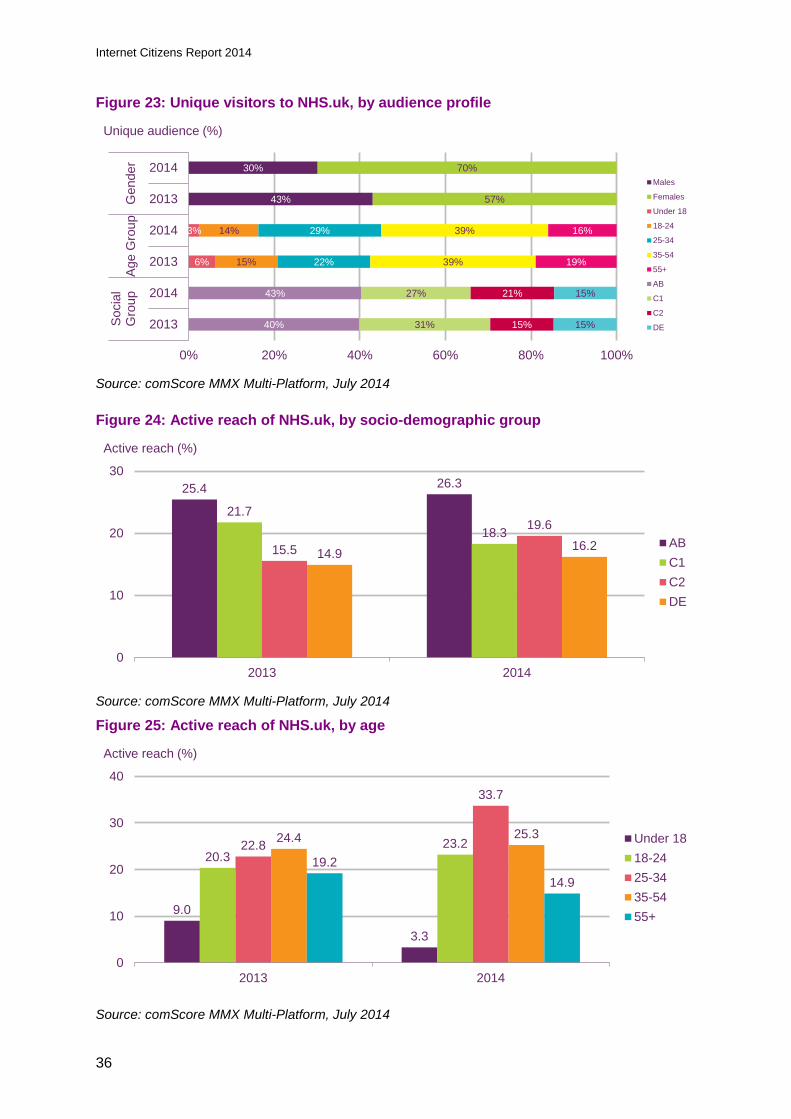
Internet Citizens Report 2014
Figure 23: Unique visitors to NHS.uk, by audience profile
Source: comScore MMX Multi-Platform, July 2014
Figure 24: Active reach of NHS.uk, by socio-demographic group
Source: comScore MMX Multi-Platform, July 2014
Figure 25: Active reach of NHS.uk, by age
Source: comScore MMX Multi-Platform, July 2014
43%
30%
57%
70%
6%
3%
15%
14%
22%
29%
39%
39%
19%
16%
40%
43%
31%
27%
15%
21%
15%
15%
0% 20% 40% 60% 80% 100%
2013
2014
2013
2014
2013
2014
Soci
alG
roup
Age
Gro
upG
ende
r
Males
Females
Under 18
18-24
25-34
35-54
55+
AB
C1
C2
DE
Unique audience (%)
25.4 26.3
21.7
18.315.5
19.6
14.9 16.2
0
10
20
30
2013 2014
ABC1C2DE
Active reach (%)
9.0
3.3
20.323.222.8
33.7
24.4 25.3
19.214.9
0
10
20
30
40
2013 2014
Under 1818-2425-3435-5455+
Active reach (%)
36
Internet Citizens Report 2014
4.3 NHS use of interactive and social media
In 2013 the NHS Choices website published more than 32,000 user reviews
As we saw above, NHS Choices provides a range of online content, allowing users to access information, interact with services and proactively manage their own health. Research cited in the most recently available annual report found that four in ten (41%) of NHS Choices users agreed that the website helps them to manage their own symptoms and half agreed that in the past 12 months, using the NHS Choices website helped them be more confident when seeing a doctor or other health professional.
NHS Choices is also helping citizens share information with each other about the quality of services, through the online feedback facility. Users can leave feedback on the majority of NHS services; in 2013 the NHS Choices website published more than 32,000 user reviews, bringing the total number on the site to almost 95,000. This is now being extended into social care, with users able to comment on their experiences of England’s 24,000 registered adult social care centres76.
Facebook users can check their drinking levels, find sports that suit them and sign up for NHS Choices emails without leaving Facebook
NHS Choices makes wide use of social media to engage with users. As of November 2014 the site had 67,000 followers on Facebook77 and 153,000 followers on Twitter78. Its most recent annual report stated that as of March 2013 it also had 150,000 email subscribers. NHS Choices also has a presence on YouTube, and NHS Choices videos have been viewed several millions of times on the YouTube channel79.
Facebook has become one of the top referral sites driving traffic to NHS Choices; Facebook users can check their drinking levels, find sports that suit their personality, and sign up for NHS Choices emails without leaving Facebook80.
Mobiles and tablets are also increasingly important platforms for interacting with NHS Choices. Between 2011 and 2013 the number of visits to the site from mobile and tablet users increased by 265% and there are more than 20 apps available81.
4.4 Other online health services
In addition to NHS sites there is a range of other services that provide online health-related assistance and support to UK citizens. These include services such as Health Unlocked82, which hosts online communities dedicated to discussion, and providing advice and support for those suffering from, or knowing someone who suffers from, particular illnesses. Other services include the Family Planning Association83, whose website provides advice and
76 Transparency, transaction, participation, NHS Choices Annual Report 2012/2013, available at http://www.nhs.uk/aboutNHSChoices/professionals/developments/Documents/annual-report/nhs-choices-annual-report-2012.pdf 77 www.facebook.com [accessed 20th November 2014] 78 www.twitter.com [accessed 20th November 2014] 79 Transparency, transaction, participation, NHS Choices Annual Report 2012/2013, available at http://www.nhs.uk/aboutNHSChoices/professionals/developments/Documents/annual-report/nhs-choices-annual-report-2012.pdf 80 Ibid. 81 Ibid. 82 www.healthunlocked.com 83 www.fpa.org.uk
37
Internet Citizens Report 2014
information regarding sexual health and relationships. This website contains information on community projects run by the charity, including its Speakeasy project which advises parents how to talk to their children about sex and relationships.
Play to Cure™: Genes in Space Play to Cure is a free mobile game that uses an approach known as ‘citizen science’ - the collective force of players - to analyse real genetic data in an attempt to find better cancer treatments.
Cancer Research UK, Amazon Web Services, Facebook and Google developers joined academics, scientists, gamers and designers to create an engaging game that translates data: ‘Genes in Space’.
The mission of the game is to collect a fictional substance called ‘Element Alpha’’, which represents genetic cancer data.
By playing this game the user is actually analysing significant amounts of genetic data, cutting the time taken by researchers to analyse the data from 18 months to just three. The data can then be used to develop new cancer treatments.
Summary
NHS websites are the most popular health information sites, with WebMD the next popular . Around two in ten of the UK internet population access NHS sites on a monthly basis, with the vast majority of these going to NHS.uk, the NHS Choices website. Visitors to the site are more likely to be women, and from AB households. The largest group of visitors in both 2013 and 2014 are in the 35-54 age group. However, when looked at as a proportion of all active internet users within each age group, 25-34 year olds were proportionally the most likely to visit the site in July 2014. NHS Choices users are able to access a wide range of information as well as carry out health-related transactions like booking appointments, and sharing their views and experiences of health services. They are also able to engage with the site through a range of channels and platforms, with social media and access via mobiles and tablets increasingly popular.
38
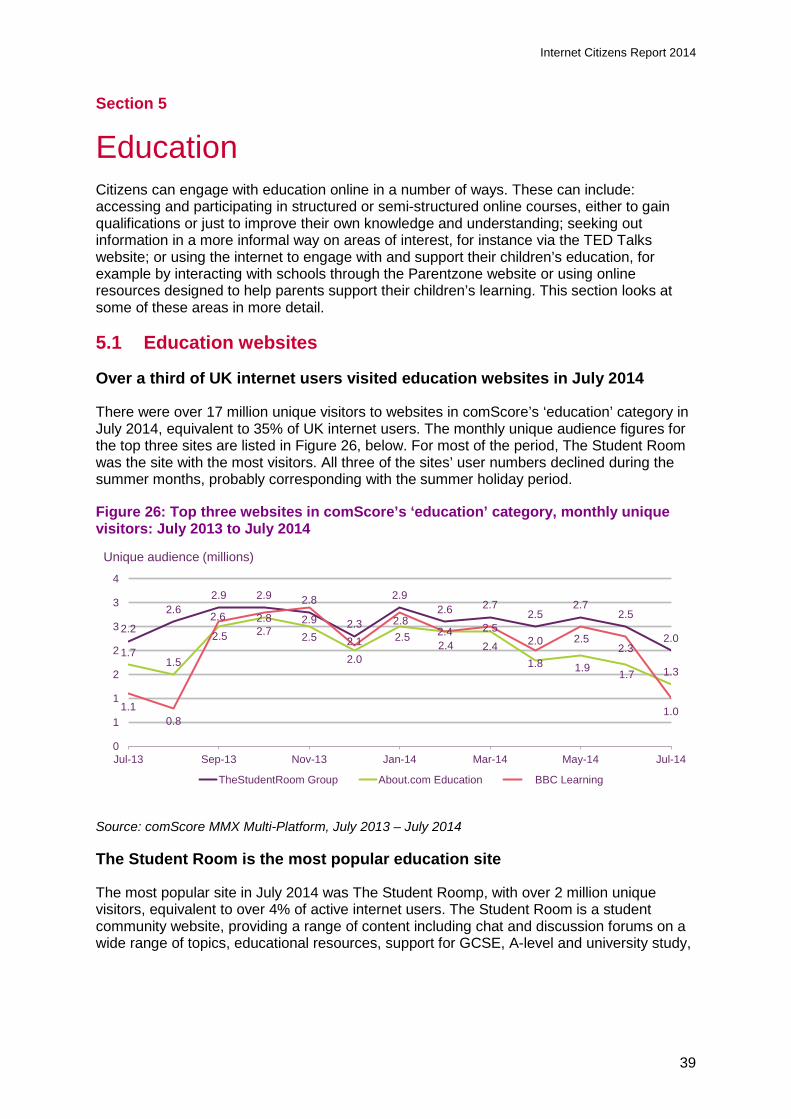
Internet Citizens Report 2014
Section 5
5 Education Citizens can engage with education online in a number of ways. These can include: accessing and participating in structured or semi-structured online courses, either to gain qualifications or just to improve their own knowledge and understanding; seeking out information in a more informal way on areas of interest, for instance via the TED Talks website; or using the internet to engage with and support their children’s education, for example by interacting with schools through the Parentzone website or using online resources designed to help parents support their children’s learning. This section looks at some of these areas in more detail.
5.1 Education websites
Over a third of UK internet users visited education websites in July 2014
There were over 17 million unique visitors to websites in comScore’s ‘education’ category in July 2014, equivalent to 35% of UK internet users. The monthly unique audience figures for the top three sites are listed in Figure 26, below. For most of the period, The Student Room was the site with the most visitors. All three of the sites’ user numbers declined during the summer months, probably corresponding with the summer holiday period.
Figure 26: Top three websites in comScore’s ‘education’ category, monthly unique visitors: July 2013 to July 2014
Source: comScore MMX Multi-Platform, July 2013 – July 2014 The Student Room is the most popular education site
The most popular site in July 2014 was The Student Roomp, with over 2 million unique visitors, equivalent to over 4% of active internet users. The Student Room is a student community website, providing a range of content including chat and discussion forums on a wide range of topics, educational resources, support for GCSE, A-level and university study,
2.2
2.62.9 2.9 2.8
2.3
2.92.6 2.7
2.52.7
2.5
2.01.7
1.5
2.5 2.7 2.5
2.0
2.52.4 2.4
1.8 1.9 1.7 1.3
1.10.8
2.6 2.8 2.9
2.1
2.82.4 2.5
2.0 2.52.3
1.0
0
1
1
2
2
3
3
4
Jul-13 Sep-13 Nov-13 Jan-14 Mar-14 May-14 Jul-14
TheStudentRoom Group About.com Education BBC Learning
Unique audience (millions)
39
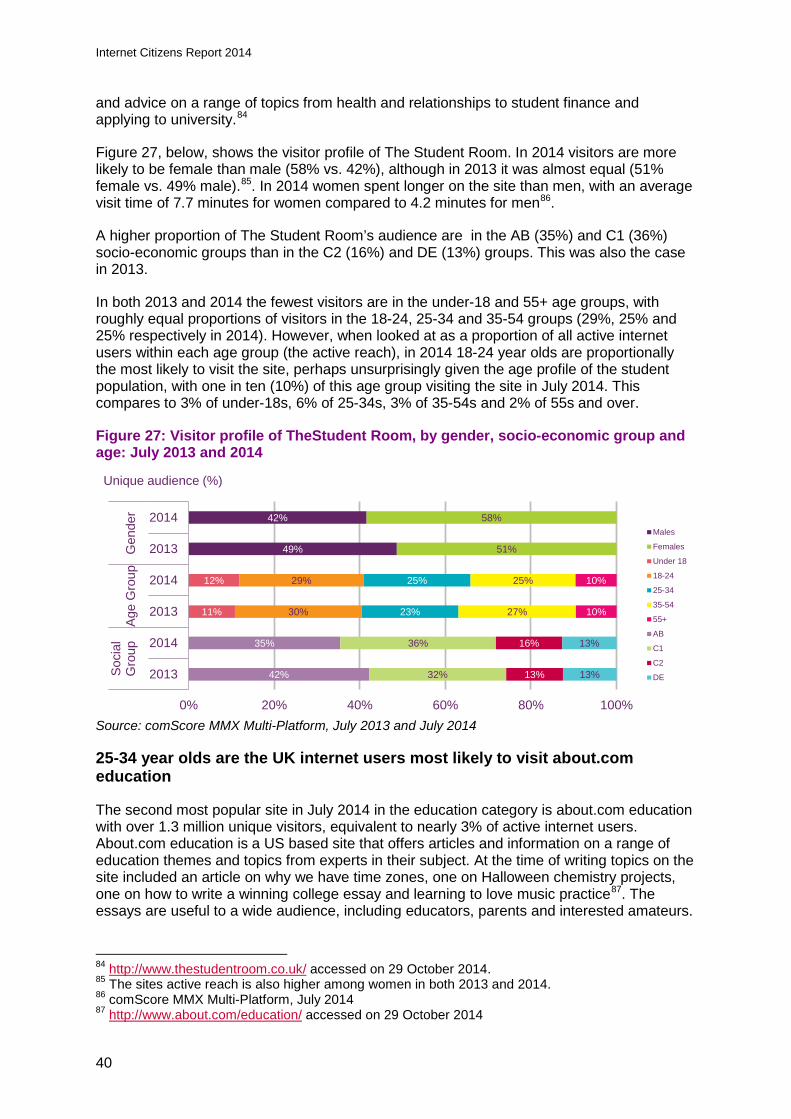
Internet Citizens Report 2014
and advice on a range of topics from health and relationships to student finance and applying to university.84
Figure 27, below, shows the visitor profile of The Student Room. In 2014 visitors are more likely to be female than male (58% vs. 42%), although in 2013 it was almost equal (51% female vs. 49% male).85. In 2014 women spent longer on the site than men, with an average visit time of 7.7 minutes for women compared to 4.2 minutes for men86.
A higher proportion of The Student Room’s audience are in the AB (35%) and C1 (36%) socio-economic groups than in the C2 (16%) and DE (13%) groups. This was also the case in 2013.
In both 2013 and 2014 the fewest visitors are in the under-18 and 55+ age groups, with roughly equal proportions of visitors in the 18-24, 25-34 and 35-54 groups (29%, 25% and 25% respectively in 2014). However, when looked at as a proportion of all active internet users within each age group (the active reach), in 2014 18-24 year olds are proportionally the most likely to visit the site, perhaps unsurprisingly given the age profile of the student population, with one in ten (10%) of this age group visiting the site in July 2014. This compares to 3% of under-18s, 6% of 25-34s, 3% of 35-54s and 2% of 55s and over.
Figure 27: Visitor profile of TheStudent Room, by gender, socio-economic group and age: July 2013 and 2014
Source: comScore MMX Multi-Platform, July 2013 and July 2014 25-34 year olds are the UK internet users most likely to visit about.com education
The second most popular site in July 2014 in the education category is about.com education with over 1.3 million unique visitors, equivalent to nearly 3% of active internet users. About.com education is a US based site that offers articles and information on a range of education themes and topics from experts in their subject. At the time of writing topics on the site included an article on why we have time zones, one on Halloween chemistry projects, one on how to write a winning college essay and learning to love music practice87. The essays are useful to a wide audience, including educators, parents and interested amateurs.
84 http://www.thestudentroom.co.uk/ accessed on 29 October 2014. 85 The sites active reach is also higher among women in both 2013 and 2014. 86 comScore MMX Multi-Platform, July 2014 87 http://www.about.com/education/ accessed on 29 October 2014
49%
42%
51%
58%
11%
12%
30%
29%
23%
25%
27%
25%
10%
10%
42%
35%
32%
36%
13%
16%
13%
13%
0% 20% 40% 60% 80% 100%
2013
2014
2013
2014
2013
2014
Soc
ial
Gro
upA
ge G
roup
Gen
der
Males
Females
Under 18
18-24
25-34
35-54
55+
AB
C1
C2
DE
Unique audience (%)
40
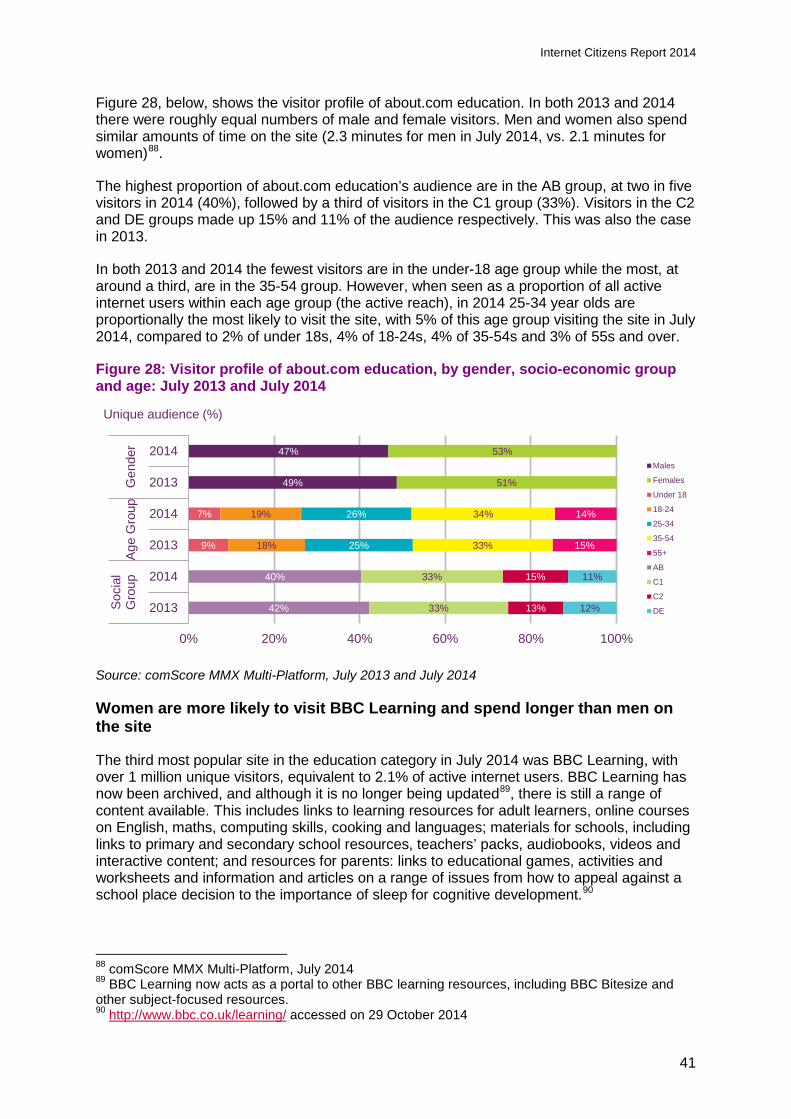
Internet Citizens Report 2014
Figure 28, below, shows the visitor profile of about.com education. In both 2013 and 2014 there were roughly equal numbers of male and female visitors. Men and women also spend similar amounts of time on the site (2.3 minutes for men in July 2014, vs. 2.1 minutes for women)88.
The highest proportion of about.com education’s audience are in the AB group, at two in five visitors in 2014 (40%), followed by a third of visitors in the C1 group (33%). Visitors in the C2 and DE groups made up 15% and 11% of the audience respectively. This was also the case in 2013.
In both 2013 and 2014 the fewest visitors are in the under-18 age group while the most, at around a third, are in the 35-54 group. However, when seen as a proportion of all active internet users within each age group (the active reach), in 2014 25-34 year olds are proportionally the most likely to visit the site, with 5% of this age group visiting the site in July 2014, compared to 2% of under 18s, 4% of 18-24s, 4% of 35-54s and 3% of 55s and over.
Figure 28: Visitor profile of about.com education, by gender, socio-economic group and age: July 2013 and July 2014
Source: comScore MMX Multi-Platform, July 2013 and July 2014
Women are more likely to visit BBC Learning and spend longer than men on the site
The third most popular site in the education category in July 2014 was BBC Learning, with over 1 million unique visitors, equivalent to 2.1% of active internet users. BBC Learning has now been archived, and although it is no longer being updated89, there is still a range of content available. This includes links to learning resources for adult learners, online courses on English, maths, computing skills, cooking and languages; materials for schools, including links to primary and secondary school resources, teachers’ packs, audiobooks, videos and interactive content; and resources for parents: links to educational games, activities and worksheets and information and articles on a range of issues from how to appeal against a school place decision to the importance of sleep for cognitive development.90
88 comScore MMX Multi-Platform, July 2014 89 BBC Learning now acts as a portal to other BBC learning resources, including BBC Bitesize and other subject-focused resources. 90 http://www.bbc.co.uk/learning/ accessed on 29 October 2014
49%
47%
51%
53%
9%
7%
18%
19%
25%
26%
33%
34%
15%
14%
42%
40%
33%
33%
13%
15%
12%
11%
0% 20% 40% 60% 80% 100%
2013
2014
2013
2014
2013
2014
Soc
ial
Gro
upA
ge G
roup
Gen
der
Males
Females
Under 18
18-24
25-34
35-54
55+
AB
C1
C2
DE
Unique audience (%)
41
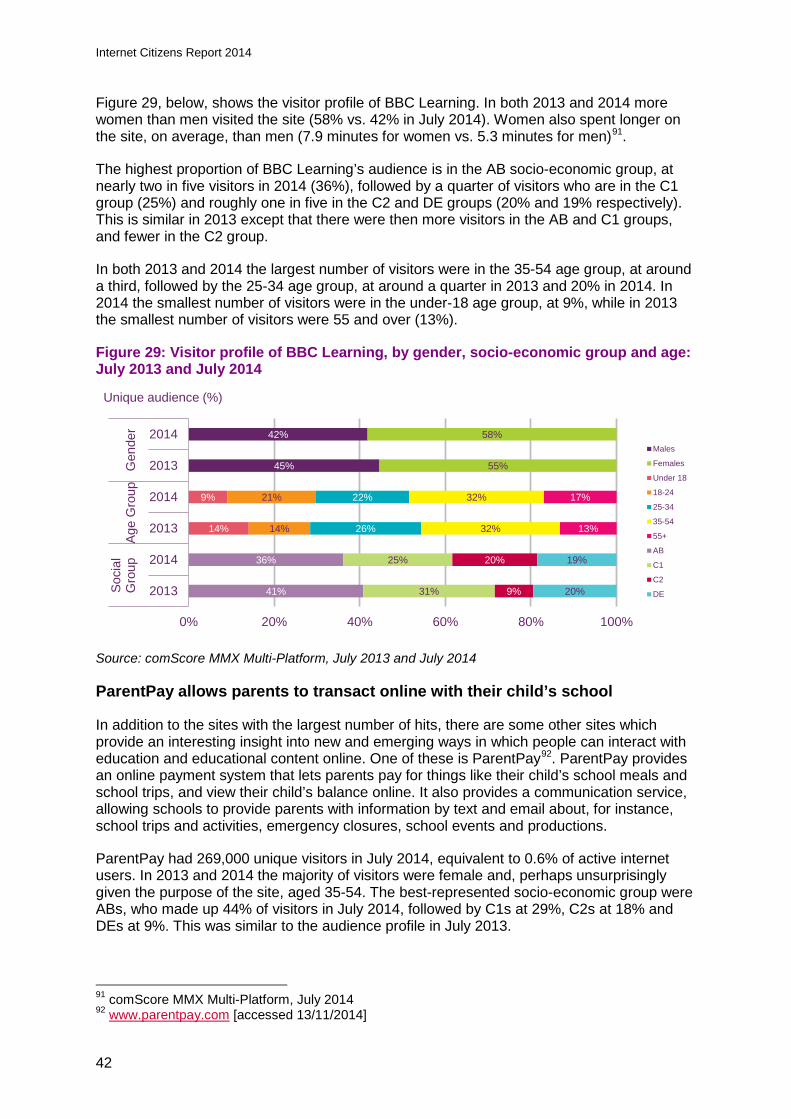
Internet Citizens Report 2014
Figure 29, below, shows the visitor profile of BBC Learning. In both 2013 and 2014 more women than men visited the site (58% vs. 42% in July 2014). Women also spent longer on the site, on average, than men (7.9 minutes for women vs. 5.3 minutes for men)91.
The highest proportion of BBC Learning’s audience is in the AB socio-economic group, at nearly two in five visitors in 2014 (36%), followed by a quarter of visitors who are in the C1 group (25%) and roughly one in five in the C2 and DE groups (20% and 19% respectively). This is similar in 2013 except that there were then more visitors in the AB and C1 groups, and fewer in the C2 group.
In both 2013 and 2014 the largest number of visitors were in the 35-54 age group, at around a third, followed by the 25-34 age group, at around a quarter in 2013 and 20% in 2014. In 2014 the smallest number of visitors were in the under-18 age group, at 9%, while in 2013 the smallest number of visitors were 55 and over (13%).
Figure 29: Visitor profile of BBC Learning, by gender, socio-economic group and age: July 2013 and July 2014
Source: comScore MMX Multi-Platform, July 2013 and July 2014
ParentPay allows parents to transact online with their child’s school
In addition to the sites with the largest number of hits, there are some other sites which provide an interesting insight into new and emerging ways in which people can interact with education and educational content online. One of these is ParentPay92. ParentPay provides an online payment system that lets parents pay for things like their child’s school meals and school trips, and view their child’s balance online. It also provides a communication service, allowing schools to provide parents with information by text and email about, for instance, school trips and activities, emergency closures, school events and productions.
ParentPay had 269,000 unique visitors in July 2014, equivalent to 0.6% of active internet users. In 2013 and 2014 the majority of visitors were female and, perhaps unsurprisingly given the purpose of the site, aged 35-54. The best-represented socio-economic group were ABs, who made up 44% of visitors in July 2014, followed by C1s at 29%, C2s at 18% and DEs at 9%. This was similar to the audience profile in July 2013.
91 comScore MMX Multi-Platform, July 2014 92 www.parentpay.com [accessed 13/11/2014]
45%
42%
55%
58%
14%
9%
14%
21%
26%
22%
32%
32%
13%
17%
41%
36%
31%
25%
9%
20%
20%
19%
0% 20% 40% 60% 80% 100%
2013
2014
2013
2014
2013
2014
Soc
ial
Gro
upA
ge G
roup
Gen
der
Males
Females
Under 18
18-24
25-34
35-54
55+
AB
C1
C2
DE
Unique audience (%)
42
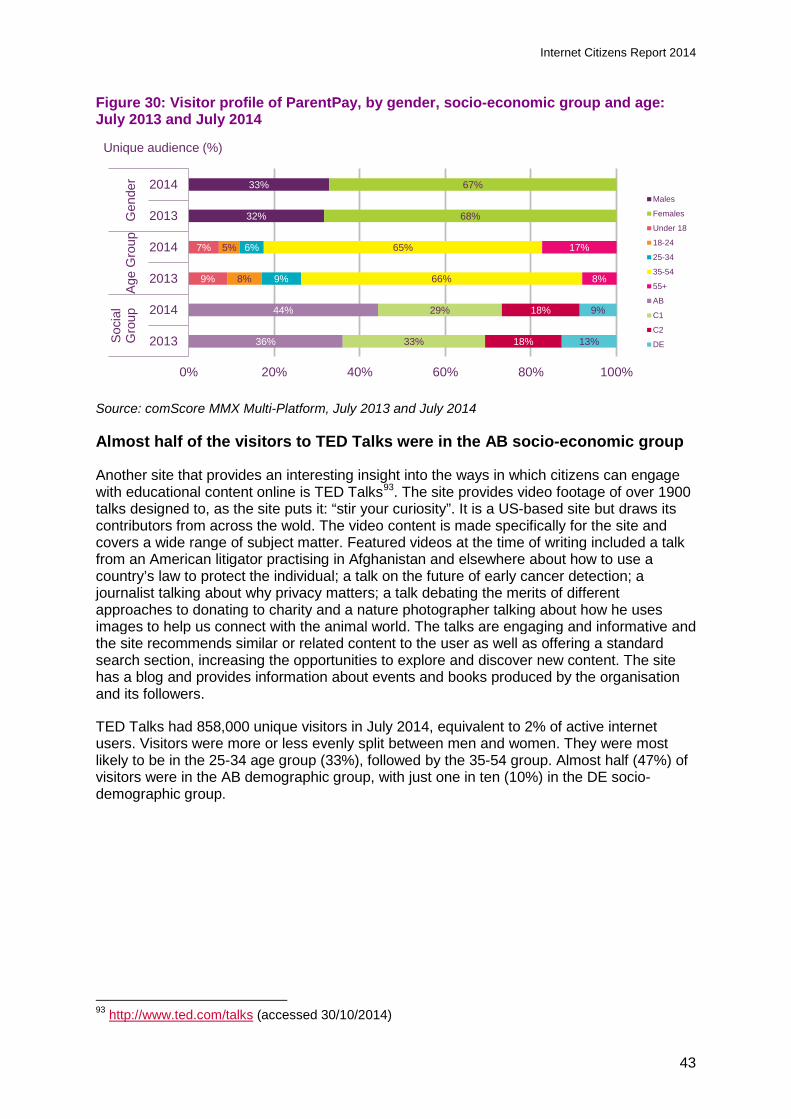
Internet Citizens Report 2014
Figure 30: Visitor profile of ParentPay, by gender, socio-economic group and age: July 2013 and July 2014
Source: comScore MMX Multi-Platform, July 2013 and July 2014
Almost half of the visitors to TED Talks were in the AB socio-economic group
Another site that provides an interesting insight into the ways in which citizens can engage with educational content online is TED Talks93. The site provides video footage of over 1900 talks designed to, as the site puts it: “stir your curiosity”. It is a US-based site but draws its contributors from across the wold. The video content is made specifically for the site and covers a wide range of subject matter. Featured videos at the time of writing included a talk from an American litigator practising in Afghanistan and elsewhere about how to use a country’s law to protect the individual; a talk on the future of early cancer detection; a journalist talking about why privacy matters; a talk debating the merits of different approaches to donating to charity and a nature photographer talking about how he uses images to help us connect with the animal world. The talks are engaging and informative and the site recommends similar or related content to the user as well as offering a standard search section, increasing the opportunities to explore and discover new content. The site has a blog and provides information about events and books produced by the organisation and its followers.
TED Talks had 858,000 unique visitors in July 2014, equivalent to 2% of active internet users. Visitors were more or less evenly split between men and women. They were most likely to be in the 25-34 age group (33%), followed by the 35-54 group. Almost half (47%) of visitors were in the AB demographic group, with just one in ten (10%) in the DE socio-demographic group.
93 http://www.ted.com/talks (accessed 30/10/2014)
32%
33%
68%
67%
9%
7%
8%
5%
9%
6%
66%
65%
8%
17%
36%
44%
33%
29%
18%
18%
13%
9%
0% 20% 40% 60% 80% 100%
2013
2014
2013
2014
2013
2014
Soc
ial
Gro
upA
ge G
roup
Gen
der
Males
Females
Under 18
18-24
25-34
35-54
55+
AB
C1
C2
DE
Unique audience (%)
43
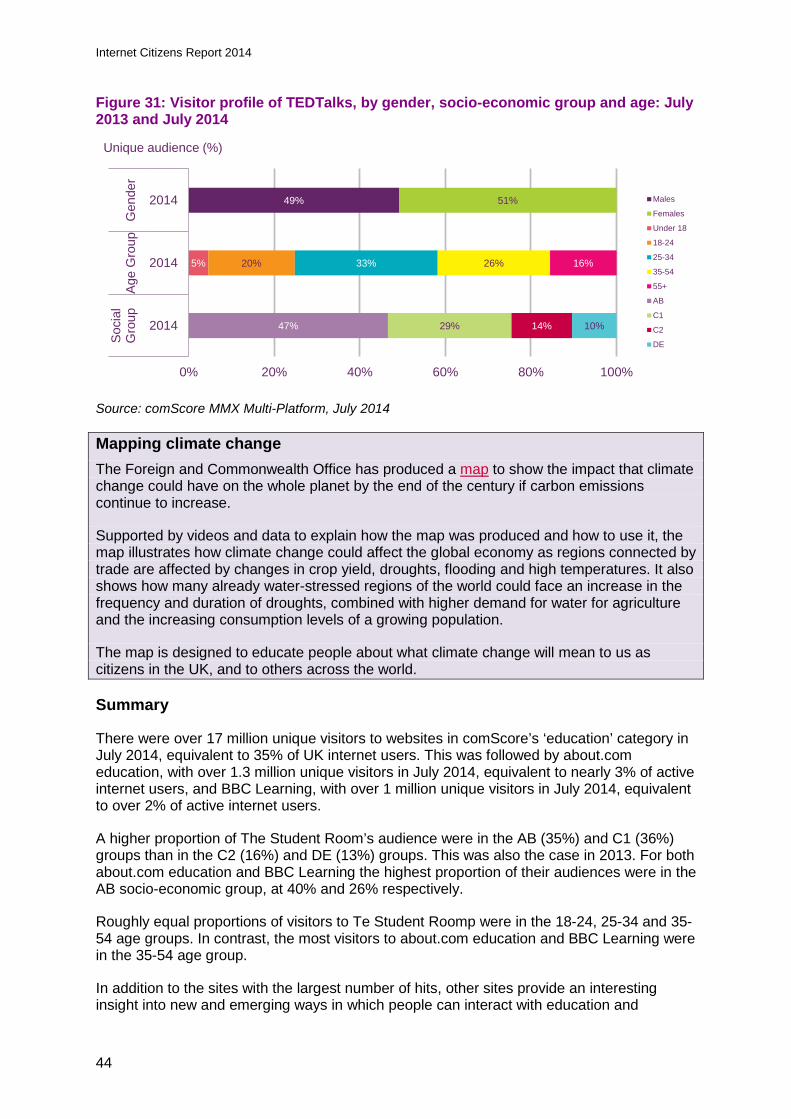
Internet Citizens Report 2014
Figure 31: Visitor profile of TEDTalks, by gender, socio-economic group and age: July 2013 and July 2014
Source: comScore MMX Multi-Platform, July 2014
Mapping climate change The Foreign and Commonwealth Office has produced a map to show the impact that climate change could have on the whole planet by the end of the century if carbon emissions continue to increase.
Supported by videos and data to explain how the map was produced and how to use it, the map illustrates how climate change could affect the global economy as regions connected by trade are affected by changes in crop yield, droughts, flooding and high temperatures. It also shows how many already water-stressed regions of the world could face an increase in the frequency and duration of droughts, combined with higher demand for water for agriculture and the increasing consumption levels of a growing population.
The map is designed to educate people about what climate change will mean to us as citizens in the UK, and to others across the world.
Summary
There were over 17 million unique visitors to websites in comScore’s ‘education’ category in July 2014, equivalent to 35% of UK internet users. This was followed by about.com education, with over 1.3 million unique visitors in July 2014, equivalent to nearly 3% of active internet users, and BBC Learning, with over 1 million unique visitors in July 2014, equivalent to over 2% of active internet users.
A higher proportion of The Student Room’s audience were in the AB (35%) and C1 (36%) groups than in the C2 (16%) and DE (13%) groups. This was also the case in 2013. For both about.com education and BBC Learning the highest proportion of their audiences were in the AB socio-economic group, at 40% and 26% respectively.
Roughly equal proportions of visitors to Te Student Roomp were in the 18-24, 25-34 and 35-54 age groups. In contrast, the most visitors to about.com education and BBC Learning were in the 35-54 age group.
In addition to the sites with the largest number of hits, other sites provide an interesting insight into new and emerging ways in which people can interact with education and
49% 51%
5% 20% 33% 26% 16%
47% 29% 14% 10%
0% 20% 40% 60% 80% 100%
2014
2014
2014
Soc
ial
Gro
upA
ge G
roup
Gen
der
Males
Females
Under 18
18-24
25-34
35-54
55+
AB
C1
C2
DE
Unique audience (%)
44

Internet Citizens Report 2014
educational content online. These include ParentPay, which provides an online payment system that lets parents pay for school meals and school trips, and TED Talks, which provides videos of over 1900 talks.
ParentPay had 269,000 unique visitors in July 2014, equivalent to 0.6% of active internet users. The majority of visitors were female and in the 35-54 age group and the most represented socio-economic group were ABs. TED Talks had 858,000 unique visitors in July 2014, equivalent to 2% of active internet users. Visitors were more or less evenly split between men and women, were most likely to be in the 25-34 age group and almost half were in the AB demographic group.
45
Internet Citizens Report 2014
Section 6
6 Public service broadcasting, news, citizen journalism and hyperlocal media This section provides a brief overview of media-related citizen content and services online, covering use of public service broadcasting websites, news and journalism sites, citizen journalism and hyperlocal sites.
These areas are a major focus of other studies and analysis94. Rather than replicate this detail, this section provides a distillation of key metrics in these areas, to illustrate the relative use of news-related online content within the wider context of online citizen experience.
6.1 Public service broadcasting (PSB)
The BBC is the most popular PSB website by a considerable margin
The designated public service television broadcasters are the BBC95, ITV196, ITV Breakfast, Channel 4, Channel 5 and S4C97. They are mandated to deliver public service purposes as set out in the 2003 Communications Act. These purposes can be summarised as follows:
• to deal with a wide range of subjects;
• to cater for the widest possible range of audiences – across different times of day and through different types of programme; and
• to maintain high standards of programme-making98.
Online, obligations vary between the broadcasters. The BBC’s online content, regulated by the BBC Trust, must comply with the same standards as other BBC content. On-demand services from ITV Plc, Channel 4 Corporation and Channel 5 are not PSBs, and so are not subject to the same regulatory framework. They must instead comply with the rules set out by the Authority for Television On Demand (ATVOD). Channel 4 also has a digital remit in the Digital Economy Act 2010 which sets out some commitments across the range of its digital content99. In the light of the varying legislative and regulatory requirements, the focus and range of content across the broadcasters’ websites varies considerably.
94 See Kantar, 2012: Measuring News Consumption and Attitudes; Ofcom, 2014: News Report 2014; Reuters Institute, 2014: Digital News Report; Nesta, 2013: UK Demand for Hyperlocal Media Research Report. 95 The BBC PSB channels are BBC One, BBC Two, BBC Three, BBC Four, CBBC, CBeebies, BBC HD, BBC News, BBC Parliament and BBC One HD 96 The Channel 3 regional licensees are usually referred to by the most commonly-used collective terms: ITV1, or simply ITV. However, these terms are not used within the devolved nations. Instead Channel 3 is referred to as STV in north and central Scotland, UTV in Northern Ireland and ITV1 Wales in Wales. 97 The Welsh Authority has the statutory responsibility to provide S4C Digidol (digital) services for viewers in Wales. 98 See Ofcom, 2013: PSB Annual Report for more detail http://stakeholders.ofcom.org.uk/broadcasting/reviews-investigations/public-service-broadcasting/annrep/psb13/ 99 For further detail see http://www.legislation.gov.uk/ukpga/2010/24/section/22
46
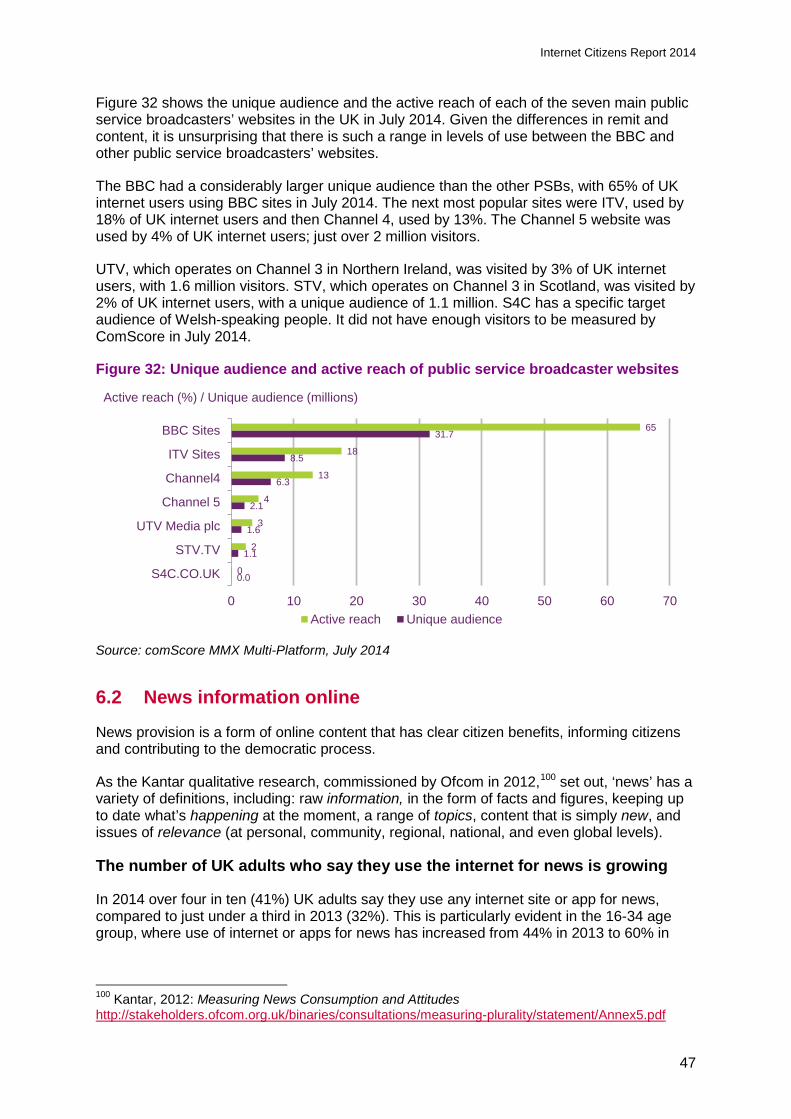
Internet Citizens Report 2014
Figure 32 shows the unique audience and the active reach of each of the seven main public service broadcasters’ websites in the UK in July 2014. Given the differences in remit and content, it is unsurprising that there is such a range in levels of use between the BBC and other public service broadcasters’ websites.
The BBC had a considerably larger unique audience than the other PSBs, with 65% of UK internet users using BBC sites in July 2014. The next most popular sites were ITV, used by 18% of UK internet users and then Channel 4, used by 13%. The Channel 5 website was used by 4% of UK internet users; just over 2 million visitors.
UTV, which operates on Channel 3 in Northern Ireland, was visited by 3% of UK internet users, with 1.6 million visitors. STV, which operates on Channel 3 in Scotland, was visited by 2% of UK internet users, with a unique audience of 1.1 million. S4C has a specific target audience of Welsh-speaking people. It did not have enough visitors to be measured by ComScore in July 2014.
Figure 32: Unique audience and active reach of public service broadcaster websites
Source: comScore MMX Multi-Platform, July 2014
6.2 News information online
News provision is a form of online content that has clear citizen benefits, informing citizens and contributing to the democratic process.
As the Kantar qualitative research, commissioned by Ofcom in 2012,100 set out, ‘news’ has a variety of definitions, including: raw information, in the form of facts and figures, keeping up to date what’s happening at the moment, a range of topics, content that is simply new, and issues of relevance (at personal, community, regional, national, and even global levels).
The number of UK adults who say they use the internet for news is growing
In 2014 over four in ten (41%) UK adults say they use any internet site or app for news, compared to just under a third in 2013 (32%). This is particularly evident in the 16-34 age group, where use of internet or apps for news has increased from 44% in 2013 to 60% in
100 Kantar, 2012: Measuring News Consumption and Attitudes http://stakeholders.ofcom.org.uk/binaries/consultations/measuring-plurality/statement/Annex5.pdf
Active reach (%) / Unique audience (millions)
0.0
1.1
1.6
2.1
6.3
8.5
31.7
0
2
3
4
13
18
65
0 10 20 30 40 50 60 70
S4C.CO.UK
STV.TV
UTV Media plc
Channel 5
Channel4
ITV Sites
BBC Sites
Active reach Unique audience
47
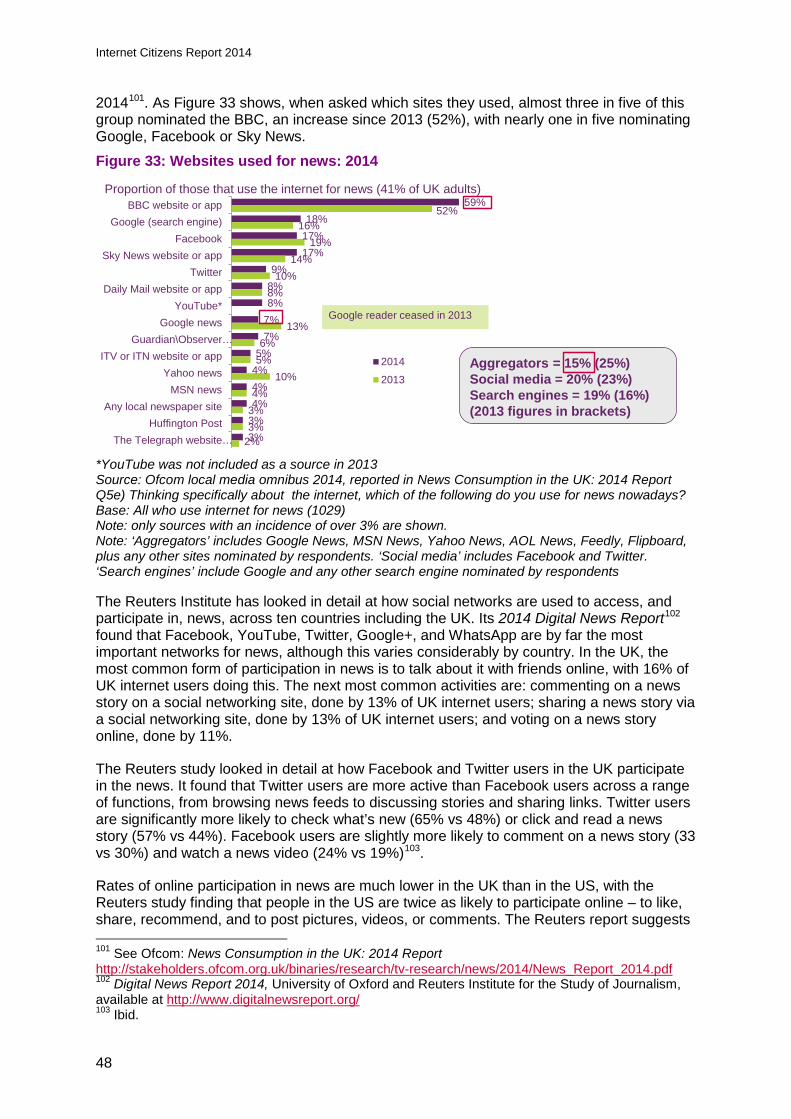
Internet Citizens Report 2014
2014101. As Figure 33 shows, when asked which sites they used, almost three in five of this group nominated the BBC, an increase since 2013 (52%), with nearly one in five nominating Google, Facebook or Sky News.
Figure 33: Websites used for news: 2014
*YouTube was not included as a source in 2013 Source: Ofcom local media omnibus 2014, reported in News Consumption in the UK: 2014 Report Q5e) Thinking specifically about the internet, which of the following do you use for news nowadays? Base: All who use internet for news (1029) Note: only sources with an incidence of over 3% are shown. Note: ‘Aggregators’ includes Google News, MSN News, Yahoo News, AOL News, Feedly, Flipboard, plus any other sites nominated by respondents. ‘Social media’ includes Facebook and Twitter. ‘Search engines’ include Google and any other search engine nominated by respondents The Reuters Institute has looked in detail at how social networks are used to access, and participate in, news, across ten countries including the UK. Its 2014 Digital News Report102 found that Facebook, YouTube, Twitter, Google+, and WhatsApp are by far the most important networks for news, although this varies considerably by country. In the UK, the most common form of participation in news is to talk about it with friends online, with 16% of UK internet users doing this. The next most common activities are: commenting on a news story on a social networking site, done by 13% of UK internet users; sharing a news story via a social networking site, done by 13% of UK internet users; and voting on a news story online, done by 11%.
The Reuters study looked in detail at how Facebook and Twitter users in the UK participate in the news. It found that Twitter users are more active than Facebook users across a range of functions, from browsing news feeds to discussing stories and sharing links. Twitter users are significantly more likely to check what’s new (65% vs 48%) or click and read a news story (57% vs 44%). Facebook users are slightly more likely to comment on a news story (33 vs 30%) and watch a news video (24% vs 19%)103.
Rates of online participation in news are much lower in the UK than in the US, with the Reuters study finding that people in the US are twice as likely to participate online – to like, share, recommend, and to post pictures, videos, or comments. The Reuters report suggests
101 See Ofcom: News Consumption in the UK: 2014 Report http://stakeholders.ofcom.org.uk/binaries/research/tv-research/news/2014/News_Report_2014.pdf 102 Digital News Report 2014, University of Oxford and Reuters Institute for the Study of Journalism, available at http://www.digitalnewsreport.org/ 103 Ibid.
Proportion of those that use the internet for news (41% of UK adults)59%
18%17%17%
9%8%8%
7%7%
5%4%4%4%
3%3%
52%16%
19%14%
10%8%
13%6%
5%10%
4%3%3%
2%
BBC website or appGoogle (search engine)
FacebookSky News website or app
TwitterDaily Mail website or app
YouTube*Google news
Guardian\Observer…ITV or ITN website or app
Yahoo newsMSN news
Any local newspaper siteHuffington Post
The Telegraph website…
2014
2013
Google reader ceased in 2013
Aggregators = 15% (25%)Social media = 20% (23%)Search engines = 19% (16%)(2013 figures in brackets)
48
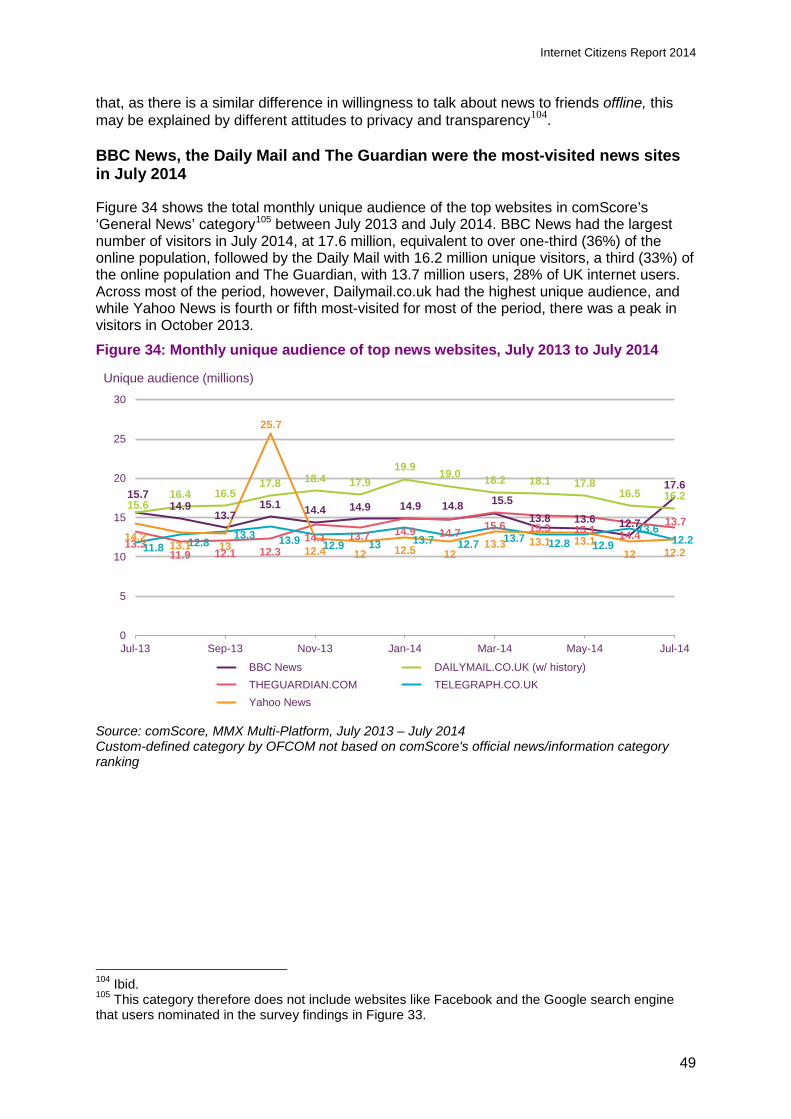
Internet Citizens Report 2014
that, as there is a similar difference in willingness to talk about news to friends offline, this may be explained by different attitudes to privacy and transparency104. BBC News, the Daily Mail and The Guardian were the most-visited news sites in July 2014
Figure 34 shows the total monthly unique audience of the top websites in comScore’s ‘General News’ category105 between July 2013 and July 2014. BBC News had the largest number of visitors in July 2014, at 17.6 million, equivalent to over one-third (36%) of the online population, followed by the Daily Mail with 16.2 million unique visitors, a third (33%) of the online population and The Guardian, with 13.7 million users, 28% of UK internet users. Across most of the period, however, Dailymail.co.uk had the highest unique audience, and while Yahoo News is fourth or fifth most-visited for most of the period, there was a peak in visitors in October 2013.
Figure 34: Monthly unique audience of top news websites, July 2013 to July 2014
Source: comScore, MMX Multi-Platform, July 2013 – July 2014 Custom-defined category by OFCOM not based on comScore's official news/information category ranking
104 Ibid. 105 This category therefore does not include websites like Facebook and the Google search engine that users nominated in the survey findings in Figure 33.
15.714.9
13.715.1 14.4 14.9 14.9 14.8 15.5
13.8 13.6 12.7
17.6
15.616.4 16.5
17.8 18.4 17.919.9 19.0 18.2 18.1 17.8
16.5 16.2
13.311.9 12.1 12.3
14.1 13.7 14.9 14.7 15.6 15.3 15.1 14.413.7
11.8 12.8 13.3 13.9 12.9 13 13.7 12.7 13.7 12.8 12.913.6
12.214.213.1 13
25.7
12.4 12 12.5 1213.3 13.1 13.1
12 12.2
0
5
10
15
20
25
30
Jul-13 Sep-13 Nov-13 Jan-14 Mar-14 May-14 Jul-14
BBC News DAILYMAIL.CO.UK (w/ history) THEGUARDIAN.COM TELEGRAPH.CO.UK Yahoo News
Unique audience (millions)
49
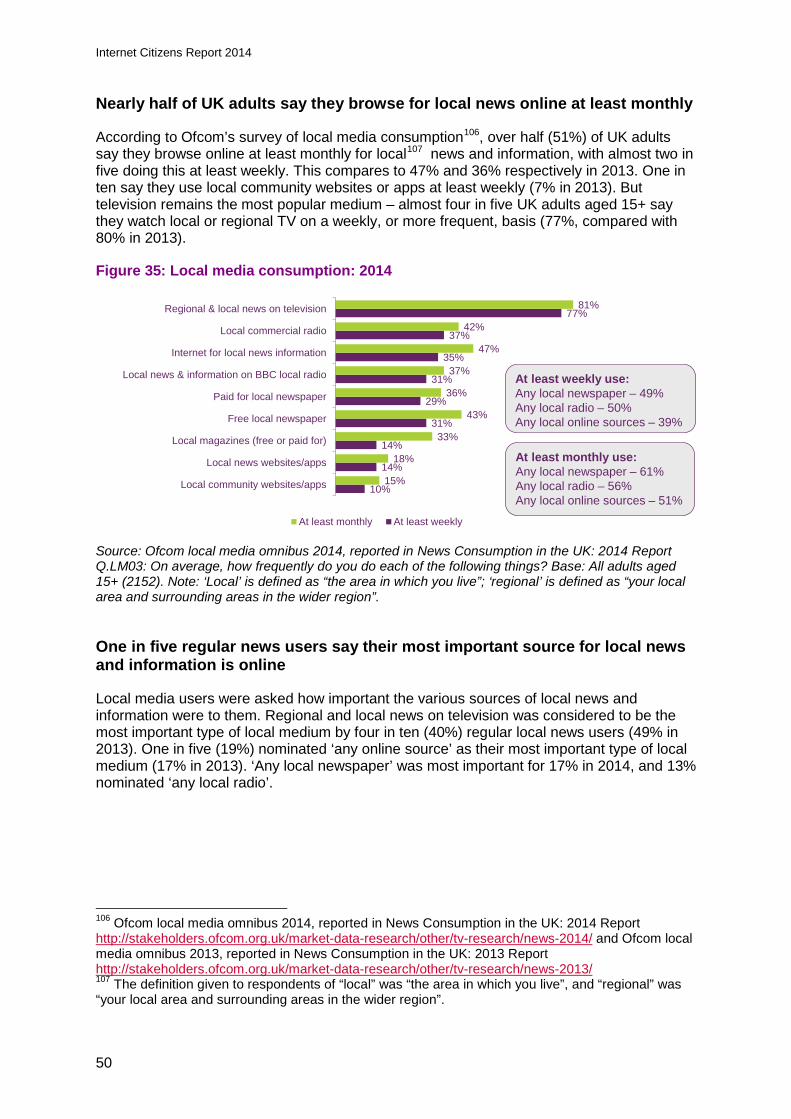
Internet Citizens Report 2014
Nearly half of UK adults say they browse for local news online at least monthly
According to Ofcom’s survey of local media consumption106, over half (51%) of UK adults say they browse online at least monthly for local107 news and information, with almost two in five doing this at least weekly. This compares to 47% and 36% respectively in 2013. One in ten say they use local community websites or apps at least weekly (7% in 2013). But television remains the most popular medium – almost four in five UK adults aged 15+ say they watch local or regional TV on a weekly, or more frequent, basis (77%, compared with 80% in 2013).
Figure 35: Local media consumption: 2014
Source: Ofcom local media omnibus 2014, reported in News Consumption in the UK: 2014 Report Q.LM03: On average, how frequently do you do each of the following things? Base: All adults aged 15+ (2152). Note: ‘Local’ is defined as “the area in which you live”; ‘regional’ is defined as “your local area and surrounding areas in the wider region”.
One in five regular news users say their most important source for local news and information is online
Local media users were asked how important the various sources of local news and information were to them. Regional and local news on television was considered to be the most important type of local medium by four in ten (40%) regular local news users (49% in 2013). One in five (19%) nominated ‘any online source’ as their most important type of local medium (17% in 2013). ‘Any local newspaper’ was most important for 17% in 2014, and 13% nominated ‘any local radio’.
106 Ofcom local media omnibus 2014, reported in News Consumption in the UK: 2014 Report http://stakeholders.ofcom.org.uk/market-data-research/other/tv-research/news-2014/ and Ofcom local media omnibus 2013, reported in News Consumption in the UK: 2013 Report http://stakeholders.ofcom.org.uk/market-data-research/other/tv-research/news-2013/ 107 The definition given to respondents of “local” was “the area in which you live”, and “regional” was “your local area and surrounding areas in the wider region”.
10%
14%
14%
31%
29%
31%
35%
37%
77%
15%
18%
33%
43%
36%
37%
47%
42%
81%
Local community websites/apps
Local news websites/apps
Local magazines (free or paid for)
Free local newspaper
Paid for local newspaper
Local news & information on BBC local radio
Internet for local news information
Local commercial radio
Regional & local news on television
At least monthly At least weekly
At least weekly use:Any local newspaper – 49%Any local radio – 50%Any local online sources – 39%
At least monthly use:Any local newspaper – 61%Any local radio – 56%Any local online sources – 51%
50
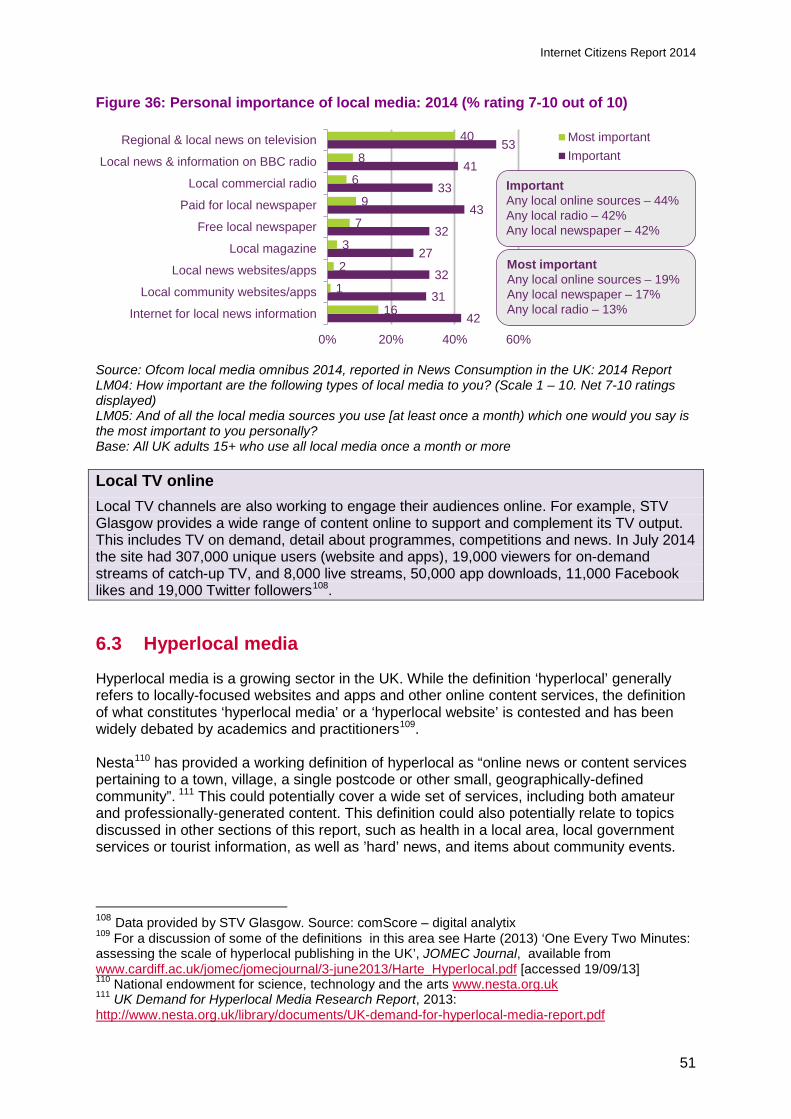
Internet Citizens Report 2014
Figure 36: Personal importance of local media: 2014 (% rating 7-10 out of 10)
Source: Ofcom local media omnibus 2014, reported in News Consumption in the UK: 2014 Report LM04: How important are the following types of local media to you? (Scale 1 – 10. Net 7-10 ratings displayed) LM05: And of all the local media sources you use [at least once a month) which one would you say is the most important to you personally? Base: All UK adults 15+ who use all local media once a month or more Local TV online Local TV channels are also working to engage their audiences online. For example, STV Glasgow provides a wide range of content online to support and complement its TV output. This includes TV on demand, detail about programmes, competitions and news. In July 2014 the site had 307,000 unique users (website and apps), 19,000 viewers for on-demand streams of catch-up TV, and 8,000 live streams, 50,000 app downloads, 11,000 Facebook likes and 19,000 Twitter followers108.
6.3 Hyperlocal media
Hyperlocal media is a growing sector in the UK. While the definition ‘hyperlocal’ generally refers to locally-focused websites and apps and other online content services, the definition of what constitutes ‘hyperlocal media’ or a ‘hyperlocal website’ is contested and has been widely debated by academics and practitioners109. Nesta110 has provided a working definition of hyperlocal as “online news or content services pertaining to a town, village, a single postcode or other small, geographically-defined community”. 111 This could potentially cover a wide set of services, including both amateur and professionally-generated content. This definition could also potentially relate to topics discussed in other sections of this report, such as health in a local area, local government services or tourist information, as well as ’hard’ news, and items about community events.
108 Data provided by STV Glasgow. Source: comScore – digital analytix 109 For a discussion of some of the definitions in this area see Harte (2013) ‘One Every Two Minutes: assessing the scale of hyperlocal publishing in the UK’, JOMEC Journal, available from www.cardiff.ac.uk/jomec/jomecjournal/3-june2013/Harte_Hyperlocal.pdf [accessed 19/09/13] 110 National endowment for science, technology and the arts www.nesta.org.uk 111 UK Demand for Hyperlocal Media Research Report, 2013: http://www.nesta.org.uk/library/documents/UK-demand-for-hyperlocal-media-report.pdf
42
31
32
27
32
43
33
41
53
16
1
2
3
7
9
6
8
40
0% 20% 40% 60%
Internet for local news information
Local community websites/apps
Local news websites/apps
Local magazine
Free local newspaper
Paid for local newspaper
Local commercial radio
Local news & information on BBC radio
Regional & local news on television Most importantImportant
ImportantAny local online sources – 44%Any local radio – 42%Any local newspaper – 42%
Most importantAny local online sources – 19%Any local newspaper – 17%Any local radio – 13%
51
Internet Citizens Report 2014
Alternatively, some definitions of ‘hyperlocal’ are narrower and have a specific focus on news. For example, Baines states: “’Hyper-local’ has gained currency as a term referring to a news website, sometimes accompanied by a printed paper, serving city suburbs, a small town, village or postcode (US zip code)”112. Despite these differences in definitions, services described as ‘hyperlocal’ are rooted in place and are more narrowly localised in terms of geographical and story focus. Many of the stories covered may therefore differ from those in mainstream news outlets in terms of content and perspective113. In addition to dedicated hyperlocal websites (and smartphone/tablet apps), citizens can also access hyperlocal content (i.e. content relevant to and/or about small defined geographic areas) via national and international social media such as Facebook and Twitter, and on subject-led websites such as Mumsnet and Squaremeal114. Given their relatively small geographic focus, and as absolute visitor numbers to individual hyperlocal websites may be relatively small, traditional panel-based approaches to audience measurement may need to be supplemented with other approaches to fully understand the reach and impact of this sector115. Hyperlocal media plays an important role in supporting and developing civic society
Research with producers of hyperlocal media found that these sites produce a lot of news about community activities, local politics, civic life, and local business116. The sites are complementing, and in some cases substituting for, a reduction in or absence of traditional local news media. Their content is predominantly very local, and while there are some stories of national or international significance, they are almost exclusively covered with a local angle that makes the story more relevant to local audiences. This suggests that hyperlocal media plays an important role in representing communities back to themselves, potentially fostering community cohesion.
The research also looked at who gets to speak in hyperlocal media sources. It found that while official news sources get a strong platform, the public (local citizens, community groups) get more of a say than they do in much mainstream local news. While these sites do not necessarily provide traditional balance by quoting a diverse range of views and sources, many of the producers of these sites have developed alternative strategies for ensuring
112 Baines (2010) ‘Hyperlocal: Globalised rural news’, International Journal of Sociology and Social Policy, 30 9/10, pp. 581-592 113 A content analysis of citizen-led hyperlocal websites by Cardiff and Birmingham City Universities found that these tended to have a strong focus on local politics, and a stronger emphasis on quoting from members of the general public and representatives of community organisations than traditional local media outlets – see http://www.communityjournalism.co.uk/research/the-value-of-hyperlocal-news-content/ [accessed 19/09/13] 114 See, for example, Nesta (2013) Understanding the use of hyperlocal content through consumer search, [online] available from: http://www.nesta.org.uk/areas_of_work/creative_economy/destination_local/assets/documents/understanding_the_use_of_hyperlocal_content_through_consumer_search [accessed 19/09/13] 115 As well as technical issues around audience measurement methodologies and small audiences, the nature of the hyperlocal sector means that its impact may also be felt offline. For more details, see Pearson, Kingsbury and Fox (2013) Destination Local: Our Lessons to Date, Nesta [Online] available from http://www.nesta.org.uk/areas_of_work/creative_economy/destination_local/assets/documents/destination_local_our_lessons [accessed 13/11/14] 116 Williams, A., Harte, D. and Turner, J. (2014) The Value of UK Hyperlocal Community News: Findings from a content analysis, an online survey and interviews with producers.
52
Internet Citizens Report 2014
balance and plurality, particularly on issues that are likely to be contentious. These include introducing a range of views or ‘rights to reply’ across different posts, exercising editorial judgement about when balance is needed, the nature of the sources and the documentation used to support their stories, and, in some cases, setting themselves up as an alternative voice to critique or contest more established news sources.
Hyperlocal sites support and initiate local campaigns
The majority of hyperlocal news producers cover community campaigns, and a significant minority have initiated their own117. The subjects of these campaigns vary greatly in size, range, and impact. Some of the examples cited in the research include the protection of local green spaces, the granting of alcohol or take-away food licences, opposition to cuts to local public services, ‘shop local’ campaigns and calls for improvements to local amenities such as signage, local parks, car parking, play areas, or the cleanliness of a local area. Several campaigns also called for greater transparency and accountability from local government institutions, calling on councils to allow the filming, recording, or live coverage of meetings, and in some cases there were campaigns about more serious council-related malpractice such as the misuse of public funds, or illegal payments made to local businesses.
Hyperlocal producers argued that their coverage of many of these issues was instrumental in full or partial victories by the campaigners. Even when campaigns were unsuccessful the researchers argued that much of the coverage is likely to have led to an enriched local public sphere in the affected communities118.
Hyperlocal journalists are also investigative journalists
A substantial proportion of hyperlocal news producers are also carrying out investigations. Examples of investigations cited in the research include: environment stories such as a waste incinerator breaching emissions guidelines and plans to develop land poisoned by previous industrial owners; council stories about lack of transparency, or involving (documented) secret or illegal payments; planning issues around supermarket developments, the proposed High Speed 2 railway line, and greenfield sites being re-allocated as brownfield in order to allow developments; also, a range of data-led stories about issues as diverse as parking fines, environmental enforcement activities, rates of crimes solved by local police, use of local libraries in order to argue against cuts to services, and lift failures in council-owned flats119.
Most hyperlocal media sites have a relatively small reach, although a few have large monthly audiences
The research concluded that the great majority of sites have relatively small audiences, but a few have audiences of between 10,000 and 100,000 or more per month. The research also found that visitors to the sites were only part of the picture, and that hyperlocal players are active on a variety of social media platforms, with Twitter and Facebook the most widely used120.
Most hyperlocal sites reach only a small proportion of the residents of their local communities and areas, although most are seeing audience growth on both their sites and
117 Ibid. 118 Ibid. 119 Ibid. 120 Williams, A., Barnett, S., Harte, D. and Townend, J. (2014) Hyperlocal Community News in the UK: Findings from a survey of practitioners.
53
Internet Citizens Report 2014
social media, and some are branching out into offline publishing as a way of increasing their reach into their local communities and generating more advertising revenue.121
Three-quarters of the hyperlocal sites sampled had been active for at least three years
Hyperlocal media is an emerging sector, so trade associations and official membership bodies have yet to be established122. Research into the sector suggests that it is quite fluid, with some sites starting up and closing in quick succession, due in part to the low barriers to entry associated with setting up a free blog, combined with the significant investment of labour required to develop and maintain content and audiences. Despite this, the research found that around three-quarters (73%) of the hyperlocal sites in the sample had been going for at least three years, and almost a third (32%) for more than five years.123 In 2014, 408 active hyperlocal sites were recorded by Openly Local, a fall since 2012
The fluidity of the sector and its small scale can make gauging its size difficult.124 However, Openly Local has established a database of hyperlocal websites, developed through websites’ self-declaration and research by Openly Local.125 Analysis of the database126 found that, of the 696 (632 in 2013) hyperlocal websites listed127 on 25 October 2014, 408 were ‘active’ and operating in the UK. This is a decrease since 2013, when 496 sites were active, and 2012, when there were 432 active sites. 'Active' is defined as a website having posted a news story at least once in the five months prior to the sampling date (25th October 2014) or functioning as an active forum-only or wiki-based website.
In 2014, 288 sites are no longer active, an increase on 133 in 2013. This figure represents websites that have closed, or have not published anything in the five months prior to the sample period. Many of these sites (86) are part of the ‘Local People’ franchise, a network of local community sites across the UK aiming to serve the local community by providing a space online where locals can interact and connect with each other about what’s important to them within their neighbourhood.128 Although 37 of these sites still show evidence of activity by local residents (such as events, or reviews of businesses), the vast majority comprise nothing but spam postings, and although online were therefore declared as inactive. The Local People network no longer receives financial support.129
121 Ibid. 122 Communications Market Report 2012: http://stakeholders.ofcom.org.uk/market-data-research/market-data/communications-market-reports/cmr12/ 123 Williams, A., Barnett, S., Harte, D. and Townend, J. (2014) Hyperlocal Community News in the UK: Findings from a survey of practitioners. 124 This difficulty in counting the number of services is not unique to the UK – see http://streetfightmag.com/2012/11/14/in-market-sizing-who-gets-counted-as-hyperlocal/ for a discussion of attempts to count the number of US hyperlocal services [accessed 13/11/4] 125 See http://openlylocal.com/hyperlocal_sites. 126 Analysis conducted for Ofcom in October 2014 by Dave Harte, Co-Investigator, ‘Media, Community and the Creative Citizen’. Birmingham School of Media, Birmingham City University. The analysis builds on data from 2012 and 2013 reports examining the extent of hyperlocal news websites in the UK: Hyperlocal Publishing in the UK – A Snapshot (2012) and Hyperlocal Publishing in the UK – A Snapshot (2013 update). 127 http://openlylocal.com_hyperlocal_sites 128 http://www.localpeople.co.uk/ 129 See www.pressgazette.co.uk/node/49450 and http://www.holdthefrontpage.co.uk/2013/news/freelance-publishers-axed-from-local-world-sites/
54
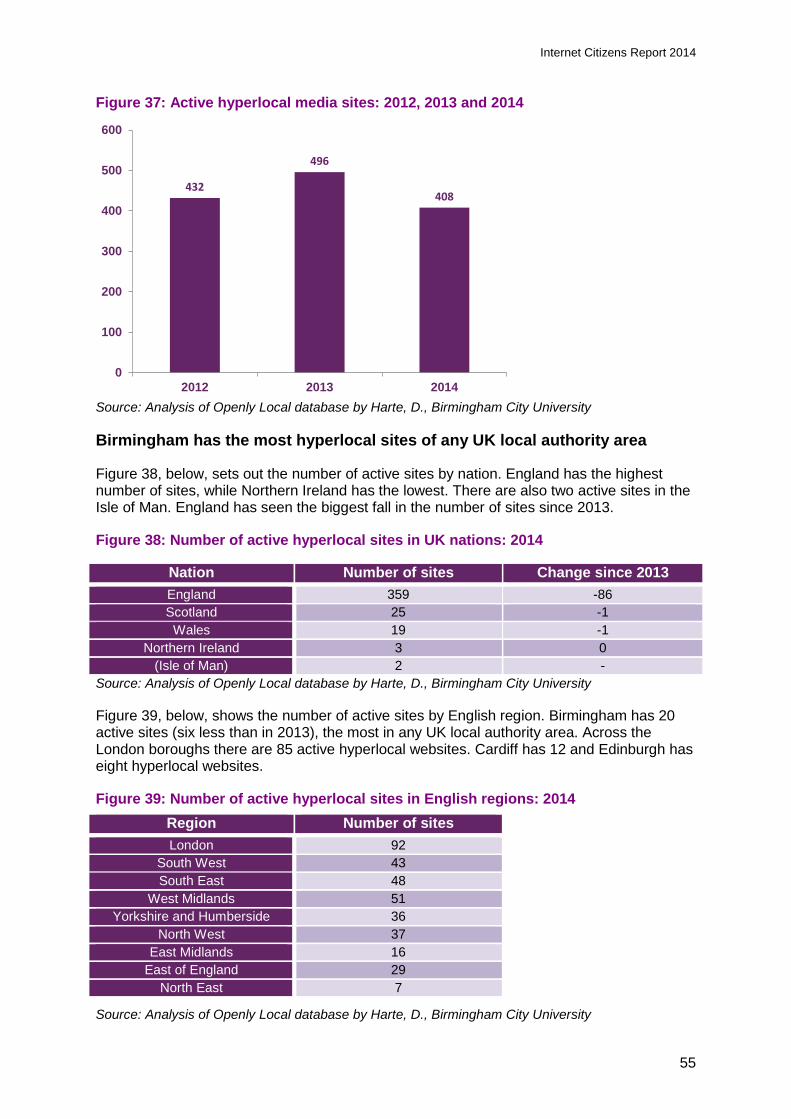
Internet Citizens Report 2014
Figure 37: Active hyperlocal media sites: 2012, 2013 and 2014
Source: Analysis of Openly Local database by Harte, D., Birmingham City University
Birmingham has the most hyperlocal sites of any UK local authority area
Figure 38, below, sets out the number of active sites by nation. England has the highest number of sites, while Northern Ireland has the lowest. There are also two active sites in the Isle of Man. England has seen the biggest fall in the number of sites since 2013.
Figure 38: Number of active hyperlocal sites in UK nations: 2014
Source: Analysis of Openly Local database by Harte, D., Birmingham City University
Figure 39, below, shows the number of active sites by English region. Birmingham has 20 active sites (six less than in 2013), the most in any UK local authority area. Across the London boroughs there are 85 active hyperlocal websites. Cardiff has 12 and Edinburgh has eight hyperlocal websites.
Figure 39: Number of active hyperlocal sites in English regions: 2014
Source: Analysis of Openly Local database by Harte, D., Birmingham City University
432
496
408
0
100
200
300
400
500
600
2012 2013 2014
Nation Number of sites Change since 2013 England 359 -86 Scotland 25 -1 Wales 19 -1
Northern Ireland 3 0 (Isle of Man) 2 -
Region Number of sites London 92
South West 43 South East 48
West Midlands 51 Yorkshire and Humberside 36
North West 37 East Midlands 16
East of England 29 North East 7
55
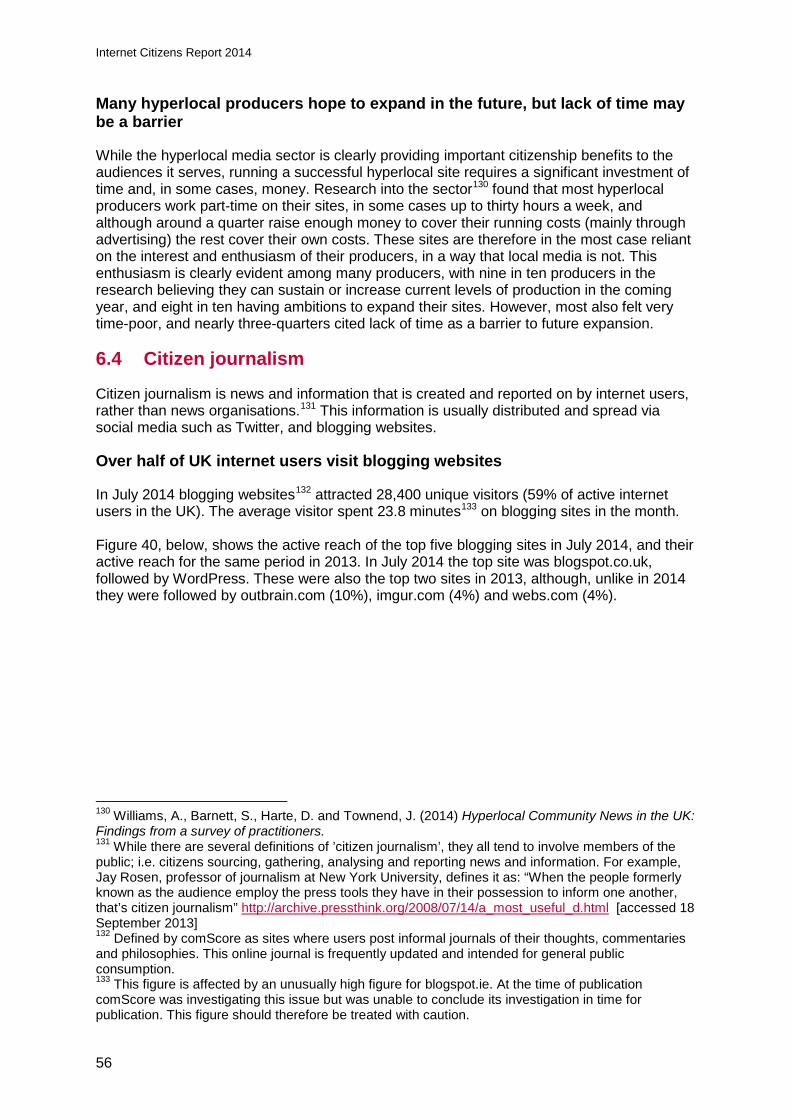
Internet Citizens Report 2014
Many hyperlocal producers hope to expand in the future, but lack of time may be a barrier
While the hyperlocal media sector is clearly providing important citizenship benefits to the audiences it serves, running a successful hyperlocal site requires a significant investment of time and, in some cases, money. Research into the sector130 found that most hyperlocal producers work part-time on their sites, in some cases up to thirty hours a week, and although around a quarter raise enough money to cover their running costs (mainly through advertising) the rest cover their own costs. These sites are therefore in the most case reliant on the interest and enthusiasm of their producers, in a way that local media is not. This enthusiasm is clearly evident among many producers, with nine in ten producers in the research believing they can sustain or increase current levels of production in the coming year, and eight in ten having ambitions to expand their sites. However, most also felt very time-poor, and nearly three-quarters cited lack of time as a barrier to future expansion.
6.4 Citizen journalism
Citizen journalism is news and information that is created and reported on by internet users, rather than news organisations.131 This information is usually distributed and spread via social media such as Twitter, and blogging websites.
Over half of UK internet users visit blogging websites
In July 2014 blogging websites132 attracted 28,400 unique visitors (59% of active internet users in the UK). The average visitor spent 23.8 minutes133 on blogging sites in the month. Figure 40, below, shows the active reach of the top five blogging sites in July 2014, and their active reach for the same period in 2013. In July 2014 the top site was blogspot.co.uk, followed by WordPress. These were also the top two sites in 2013, although, unlike in 2014 they were followed by outbrain.com (10%), imgur.com (4%) and webs.com (4%).
130 Williams, A., Barnett, S., Harte, D. and Townend, J. (2014) Hyperlocal Community News in the UK: Findings from a survey of practitioners. 131 While there are several definitions of ’citizen journalism’, they all tend to involve members of the public; i.e. citizens sourcing, gathering, analysing and reporting news and information. For example, Jay Rosen, professor of journalism at New York University, defines it as: “When the people formerly known as the audience employ the press tools they have in their possession to inform one another, that’s citizen journalism” http://archive.pressthink.org/2008/07/14/a_most_useful_d.html [accessed 18 September 2013] 132 Defined by comScore as sites where users post informal journals of their thoughts, commentaries and philosophies. This online journal is frequently updated and intended for general public consumption. 133 This figure is affected by an unusually high figure for blogspot.ie. At the time of publication comScore was investigating this issue but was unable to conclude its investigation in time for publication. This figure should therefore be treated with caution.
56
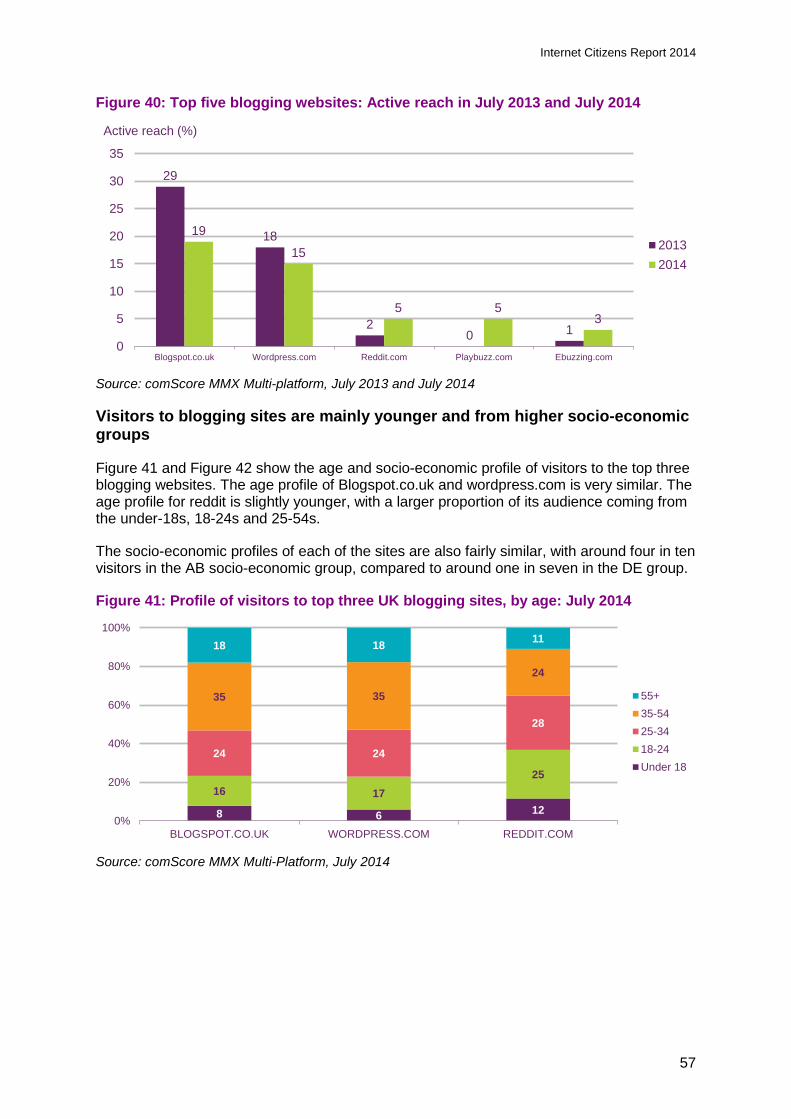
Internet Citizens Report 2014
Figure 40: Top five blogging websites: Active reach in July 2013 and July 2014
Source: comScore MMX Multi-platform, July 2013 and July 2014 Visitors to blogging sites are mainly younger and from higher socio-economic groups
Figure 41 and Figure 42 show the age and socio-economic profile of visitors to the top three blogging websites. The age profile of Blogspot.co.uk and wordpress.com is very similar. The age profile for reddit is slightly younger, with a larger proportion of its audience coming from the under-18s, 18-24s and 25-54s.
The socio-economic profiles of each of the sites are also fairly similar, with around four in ten visitors in the AB socio-economic group, compared to around one in seven in the DE group.
Figure 41: Profile of visitors to top three UK blogging sites, by age: July 2014
Source: comScore MMX Multi-Platform, July 2014
Active reach (%)
29
18
20 1
19
15
5 53
0
5
10
15
20
25
30
35
Blogspot.co.uk Wordpress.com Reddit.com Playbuzz.com Ebuzzing.com
20132014
8 6 1216 17
25
24 24
28
35 35
24
18 18 11
0%
20%
40%
60%
80%
100%
BLOGSPOT.CO.UK WORDPRESS.COM REDDIT.COM
55+35-5425-3418-24Under 18
57
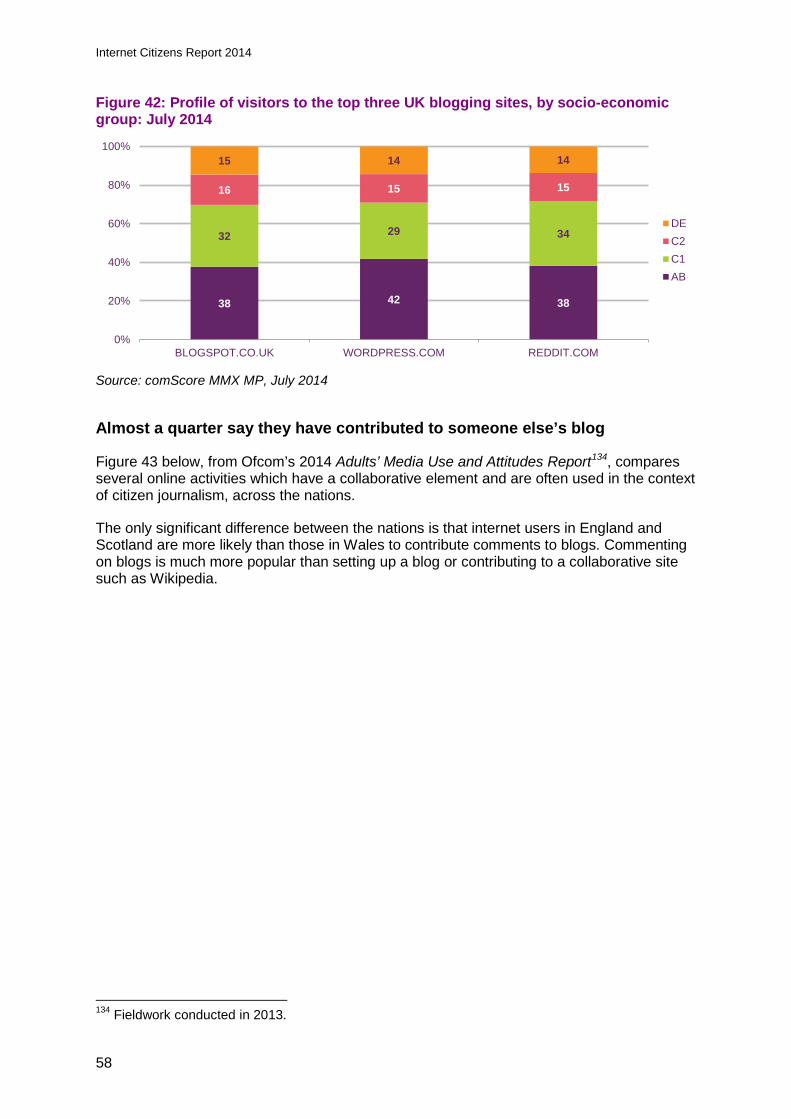
Internet Citizens Report 2014
Figure 42: Profile of visitors to the top three UK blogging sites, by socio-economic group: July 2014
Source: comScore MMX MP, July 2014 Almost a quarter say they have contributed to someone else’s blog
Figure 43 below, from Ofcom’s 2014 Adults’ Media Use and Attitudes Report134, compares several online activities which have a collaborative element and are often used in the context of citizen journalism, across the nations.
The only significant difference between the nations is that internet users in England and Scotland are more likely than those in Wales to contribute comments to blogs. Commenting on blogs is much more popular than setting up a blog or contributing to a collaborative site such as Wikipedia.
134 Fieldwork conducted in 2013.
38 42 38
32 29 34
16 15 15
15 14 14
0%
20%
40%
60%
80%
100%
BLOGSPOT.CO.UK WORDPRESS.COM REDDIT.COM
DEC2C1AB
58
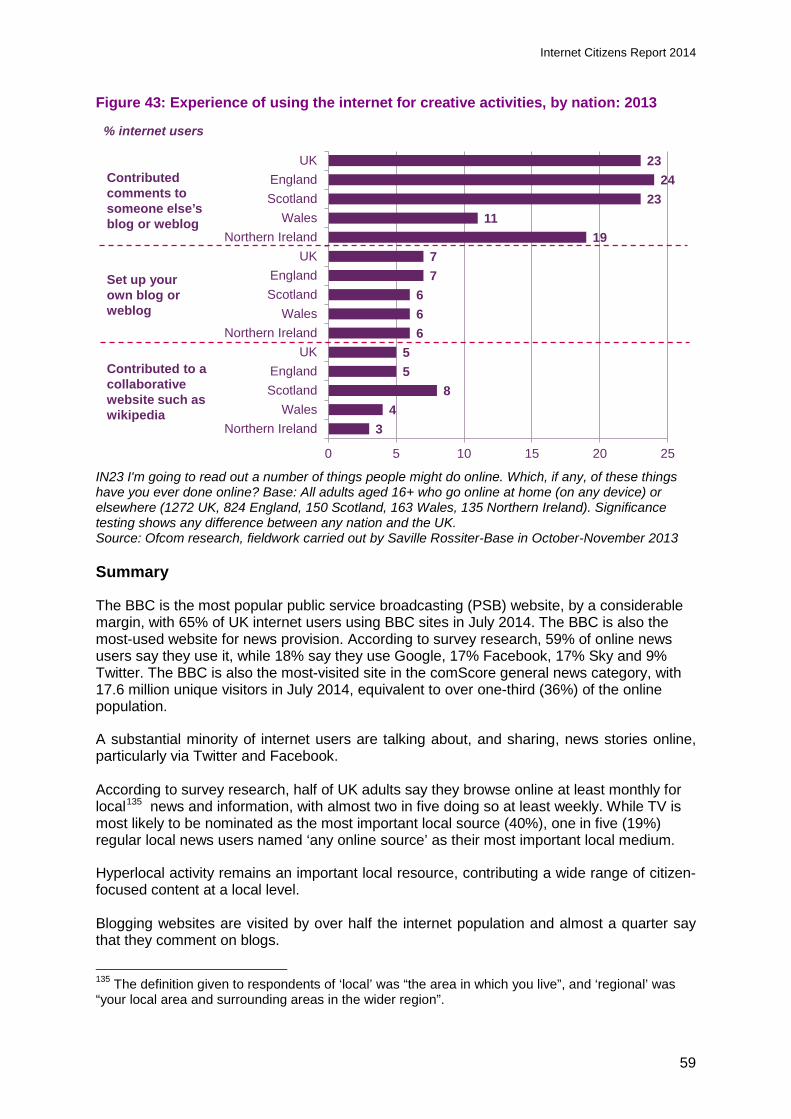
Internet Citizens Report 2014
Figure 43: Experience of using the internet for creative activities, by nation: 2013
IN23 I'm going to read out a number of things people might do online. Which, if any, of these things have you ever done online? Base: All adults aged 16+ who go online at home (on any device) or elsewhere (1272 UK, 824 England, 150 Scotland, 163 Wales, 135 Northern Ireland). Significance testing shows any difference between any nation and the UK. Source: Ofcom research, fieldwork carried out by Saville Rossiter-Base in October-November 2013 Summary
The BBC is the most popular public service broadcasting (PSB) website, by a considerable margin, with 65% of UK internet users using BBC sites in July 2014. The BBC is also the most-used website for news provision. According to survey research, 59% of online news users say they use it, while 18% say they use Google, 17% Facebook, 17% Sky and 9% Twitter. The BBC is also the most-visited site in the comScore general news category, with 17.6 million unique visitors in July 2014, equivalent to over one-third (36%) of the online population.
A substantial minority of internet users are talking about, and sharing, news stories online, particularly via Twitter and Facebook. According to survey research, half of UK adults say they browse online at least monthly for local135 news and information, with almost two in five doing so at least weekly. While TV is most likely to be nominated as the most important local source (40%), one in five (19%) regular local news users named ‘any online source’ as their most important local medium.
Hyperlocal activity remains an important local resource, contributing a wide range of citizen-focused content at a local level. Blogging websites are visited by over half the internet population and almost a quarter say that they comment on blogs.
135 The definition given to respondents of ‘local’ was “the area in which you live”, and ‘regional’ was “your local area and surrounding areas in the wider region”.
34
855
666
77
1911
2324
23
0 5 10 15 20 25
Northern IrelandWales
ScotlandEngland
UKNorthern Ireland
WalesScotlandEngland
UKNorthern Ireland
WalesScotlandEngland
UKContributed comments to someone else’s blog or weblog
Set up your own blog or weblog
Contributed to a collaborative website such as wikipedia
% internet users
59
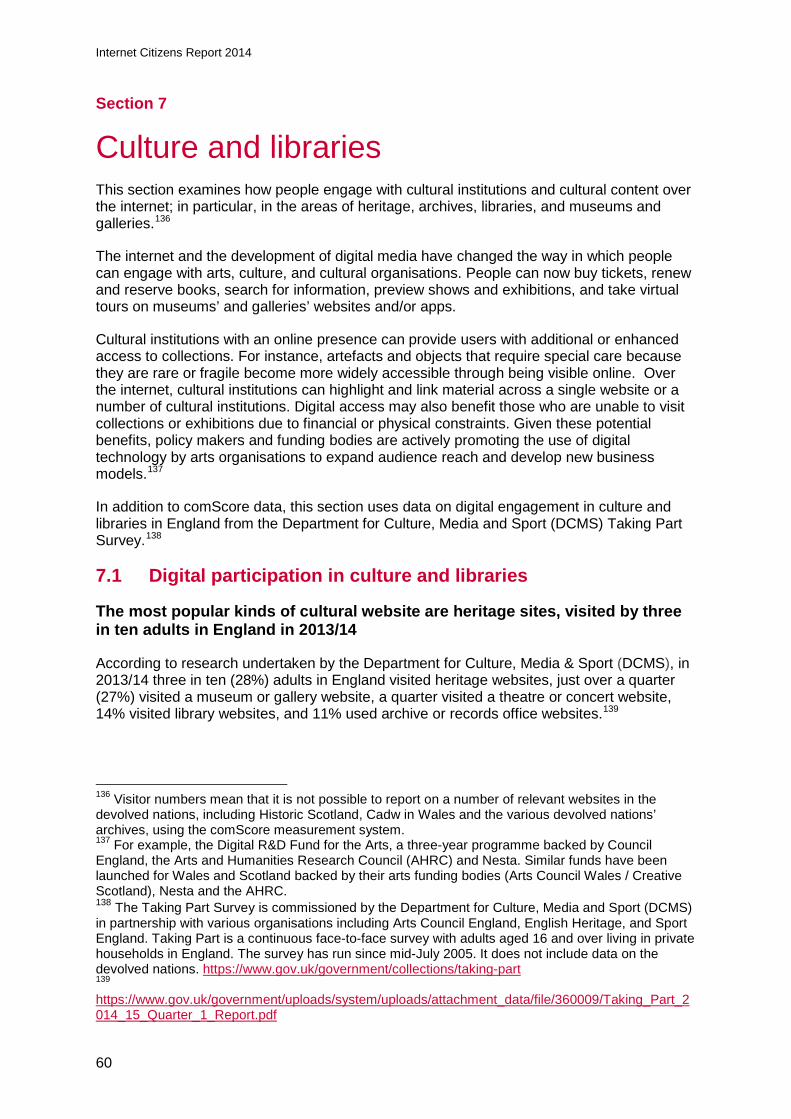
Internet Citizens Report 2014
Section 7
7 Culture and libraries This section examines how people engage with cultural institutions and cultural content over the internet; in particular, in the areas of heritage, archives, libraries, and museums and galleries.136
The internet and the development of digital media have changed the way in which people can engage with arts, culture, and cultural organisations. People can now buy tickets, renew and reserve books, search for information, preview shows and exhibitions, and take virtual tours on museums’ and galleries’ websites and/or apps.
Cultural institutions with an online presence can provide users with additional or enhanced access to collections. For instance, artefacts and objects that require special care because they are rare or fragile become more widely accessible through being visible online. Over the internet, cultural institutions can highlight and link material across a single website or a number of cultural institutions. Digital access may also benefit those who are unable to visit collections or exhibitions due to financial or physical constraints. Given these potential benefits, policy makers and funding bodies are actively promoting the use of digital technology by arts organisations to expand audience reach and develop new business models.137
In addition to comScore data, this section uses data on digital engagement in culture and libraries in England from the Department for Culture, Media and Sport (DCMS) Taking Part Survey.138
7.1 Digital participation in culture and libraries
The most popular kinds of cultural website are heritage sites, visited by three in ten adults in England in 2013/14
According to research undertaken by the Department for Culture, Media & Sport (DCMS), in 2013/14 three in ten (28%) adults in England visited heritage websites, just over a quarter (27%) visited a museum or gallery website, a quarter visited a theatre or concert website, 14% visited library websites, and 11% used archive or records office websites.139
136 Visitor numbers mean that it is not possible to report on a number of relevant websites in the devolved nations, including Historic Scotland, Cadw in Wales and the various devolved nations’ archives, using the comScore measurement system. 137 For example, the Digital R&D Fund for the Arts, a three-year programme backed by Council England, the Arts and Humanities Research Council (AHRC) and Nesta. Similar funds have been launched for Wales and Scotland backed by their arts funding bodies (Arts Council Wales / Creative Scotland), Nesta and the AHRC. 138 The Taking Part Survey is commissioned by the Department for Culture, Media and Sport (DCMS) in partnership with various organisations including Arts Council England, English Heritage, and Sport England. Taking Part is a continuous face-to-face survey with adults aged 16 and over living in private households in England. The survey has run since mid-July 2005. It does not include data on the devolved nations. https://www.gov.uk/government/collections/taking-part 139 https://www.gov.uk/government/uploads/system/uploads/attachment_data/file/360009/Taking_Part_2014_15_Quarter_1_Report.pdf
60
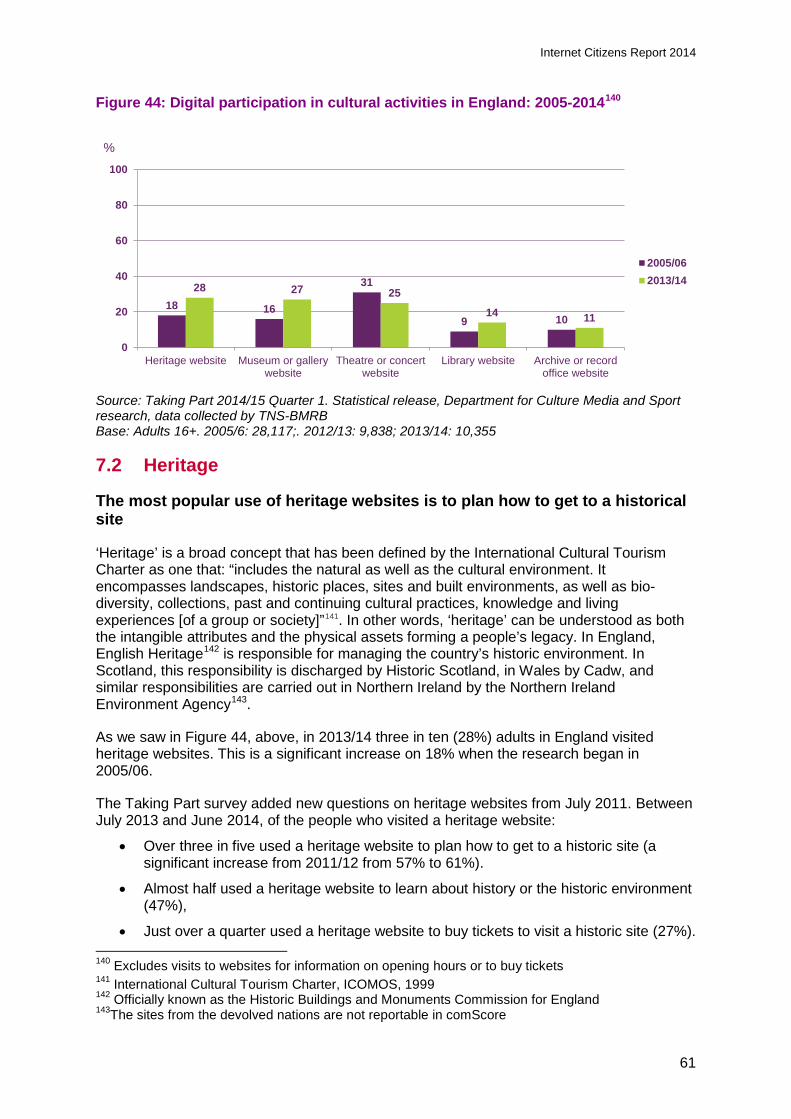
Internet Citizens Report 2014
Figure 44: Digital participation in cultural activities in England: 2005-2014140
Source: Taking Part 2014/15 Quarter 1. Statistical release, Department for Culture Media and Sport research, data collected by TNS-BMRB Base: Adults 16+. 2005/6: 28,117;. 2012/13: 9,838; 2013/14: 10,355 7.2 Heritage
The most popular use of heritage websites is to plan how to get to a historical site
‘Heritage’ is a broad concept that has been defined by the International Cultural Tourism Charter as one that: “includes the natural as well as the cultural environment. It encompasses landscapes, historic places, sites and built environments, as well as bio-diversity, collections, past and continuing cultural practices, knowledge and living experiences [of a group or society]”141. In other words, ‘heritage’ can be understood as both the intangible attributes and the physical assets forming a people’s legacy. In England, English Heritage142 is responsible for managing the country’s historic environment. In Scotland, this responsibility is discharged by Historic Scotland, in Wales by Cadw, and similar responsibilities are carried out in Northern Ireland by the Northern Ireland Environment Agency143.
As we saw in Figure 44, above, in 2013/14 three in ten (28%) adults in England visited heritage websites. This is a significant increase on 18% when the research began in 2005/06.
The Taking Part survey added new questions on heritage websites from July 2011. Between July 2013 and June 2014, of the people who visited a heritage website:
• Over three in five used a heritage website to plan how to get to a historic site (a significant increase from 2011/12 from 57% to 61%).
• Almost half used a heritage website to learn about history or the historic environment (47%),
• Just over a quarter used a heritage website to buy tickets to visit a historic site (27%).
140 Excludes visits to websites for information on opening hours or to buy tickets 141 International Cultural Tourism Charter, ICOMOS, 1999 142 Officially known as the Historic Buildings and Monuments Commission for England 143The sites from the devolved nations are not reportable in comScore
18 16
31
9 10
28 27 25
14 11
0
20
40
60
80
100
Heritage website Museum or gallerywebsite
Theatre or concertwebsite
Library website Archive or recordoffice website
2005/062013/14
%
61
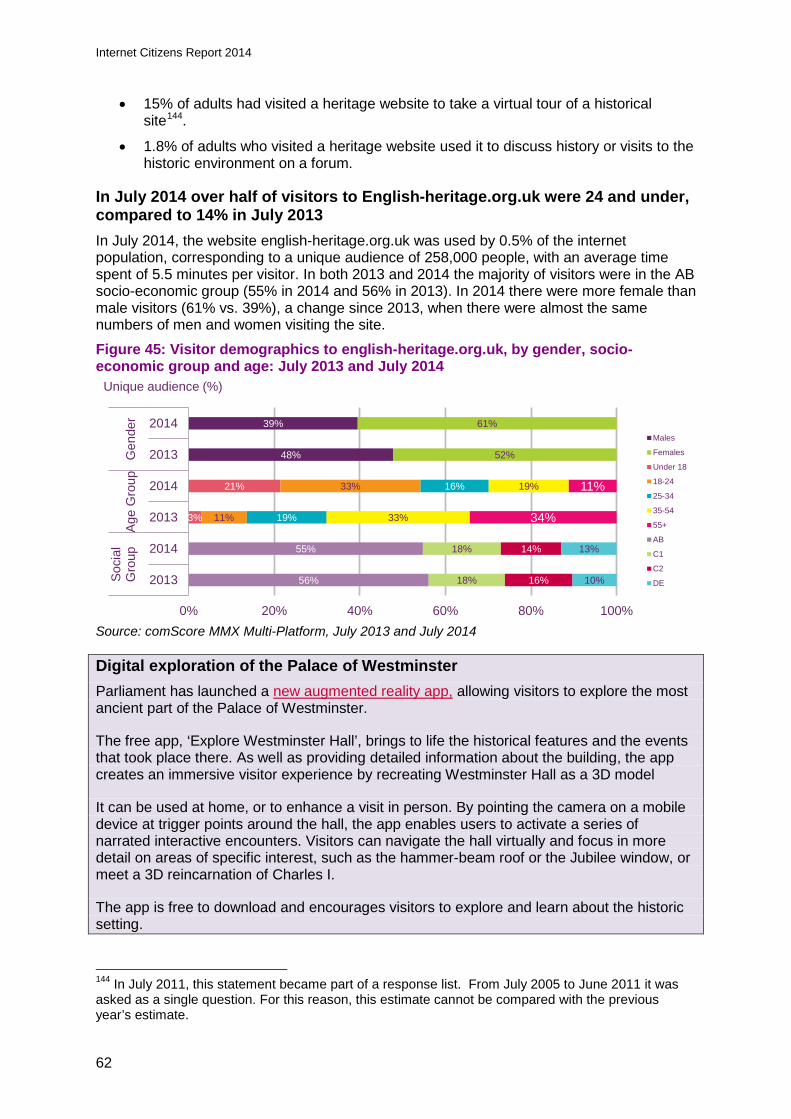
Internet Citizens Report 2014
• 15% of adults had visited a heritage website to take a virtual tour of a historical site144.
• 1.8% of adults who visited a heritage website used it to discuss history or visits to the historic environment on a forum.
In July 2014 over half of visitors to English-heritage.org.uk were 24 and under, compared to 14% in July 2013 In July 2014, the website english-heritage.org.uk was used by 0.5% of the internet population, corresponding to a unique audience of 258,000 people, with an average time spent of 5.5 minutes per visitor. In both 2013 and 2014 the majority of visitors were in the AB socio-economic group (55% in 2014 and 56% in 2013). In 2014 there were more female than male visitors (61% vs. 39%), a change since 2013, when there were almost the same numbers of men and women visiting the site.
Figure 45: Visitor demographics to english-heritage.org.uk, by gender, socio-economic group and age: July 2013 and July 2014
Source: comScore MMX Multi-Platform, July 2013 and July 2014 Digital exploration of the Palace of Westminster Parliament has launched a new augmented reality app, allowing visitors to explore the most ancient part of the Palace of Westminster.
The free app, ‘Explore Westminster Hall’, brings to life the historical features and the events that took place there. As well as providing detailed information about the building, the app creates an immersive visitor experience by recreating Westminster Hall as a 3D model
It can be used at home, or to enhance a visit in person. By pointing the camera on a mobile device at trigger points around the hall, the app enables users to activate a series of narrated interactive encounters. Visitors can navigate the hall virtually and focus in more detail on areas of specific interest, such as the hammer-beam roof or the Jubilee window, or meet a 3D reincarnation of Charles I.
The app is free to download and encourages visitors to explore and learn about the historic setting.
144 In July 2011, this statement became part of a response list. From July 2005 to June 2011 it was asked as a single question. For this reason, this estimate cannot be compared with the previous year’s estimate.
48%
39%
52%
61%
3%
21%
11%
33%
19%
16%
33%
19%
34%
11%
56%
55%
18%
18%
16%
14%
10%
13%
0% 20% 40% 60% 80% 100%
2013
2014
2013
2014
2013
2014
Soci
alG
roup
Age
Gro
upG
ende
r
Males
Females
Under 18
18-24
25-34
35-54
55+
AB
C1
C2
DE
Unique audience (%)
62
Internet Citizens Report 2014
7.3 Museums and galleries
Finding out about or ordering tickets for an exhibition or event is the most popular reason for visiting a museum or gallery website
Figure 44, above, shows that just over a quarter (27%) of adults in England visited a museum or gallery website in 2013/14, a significant increase from 16% when the data were first collected in 2005/06, although the rate has decreased slightly from a peak of 31% in 2012/13.
Between 2005/06 and 2013/14 there was a significant increase in the proportion of adults who had visited a museum or gallery website to find out about or order tickets for an exhibition or event (from 48% to 65%). Over the same period there was a significant decrease in the proportion of adults who had visited a museum or gallery website to look at items from a collection (from 34% to 18%).
The Taking Part survey added new questions on museum and gallery websites in July 2011. Between June 2013 and July 2014, of those who had visited a museum or gallery website, 44% had done so to find out about a particular subject, and 11% had viewed or downloaded an event or exhibition, both at a similar rate to 2011/12. Thirteen per cent had visited a museum or gallery website to take a virtual tour, a significant decrease on the 2011/12 figure of 16%.
The Victoria and Albert Museum website is the most-visited museum/gallery website
In July 2014, the top three UK museum/gallery websites visited were the Victoria and Albert Museum, with 171,000 unique visitors, the Tate Modern with 154,000, and the Natural History Museum with 127,000145.
Figure 46: Top three most-visited museum/gallery websites: July 2014
Source: comScore MMX Multi-Platform, July 2014 Figures 47 to 49 show the profile of visitors to these three sites by gender, age and socio-economic group. Visitors to the Victoria and Albert Museum and the Tate Modern are slightly more likely to be male than female. However, visitors to the Natural History Museum are more likely to be female (61%) than male (39%).
The age profile is similar across all three sites. Thirty-five to 54 year olds are the largest age group, while under- 18s are the smallest.
145 Visitor numbers to websites of museums and galleries in Scotland, Wales and Northern Ireland were too small to be reportable by comScore.
Website Unique visitors Active reach (%)
Victoria and Albert Museum 171,000 0.35
Tate Modern 154,000 0.32
Natural History Museum 127,000 0.26
63
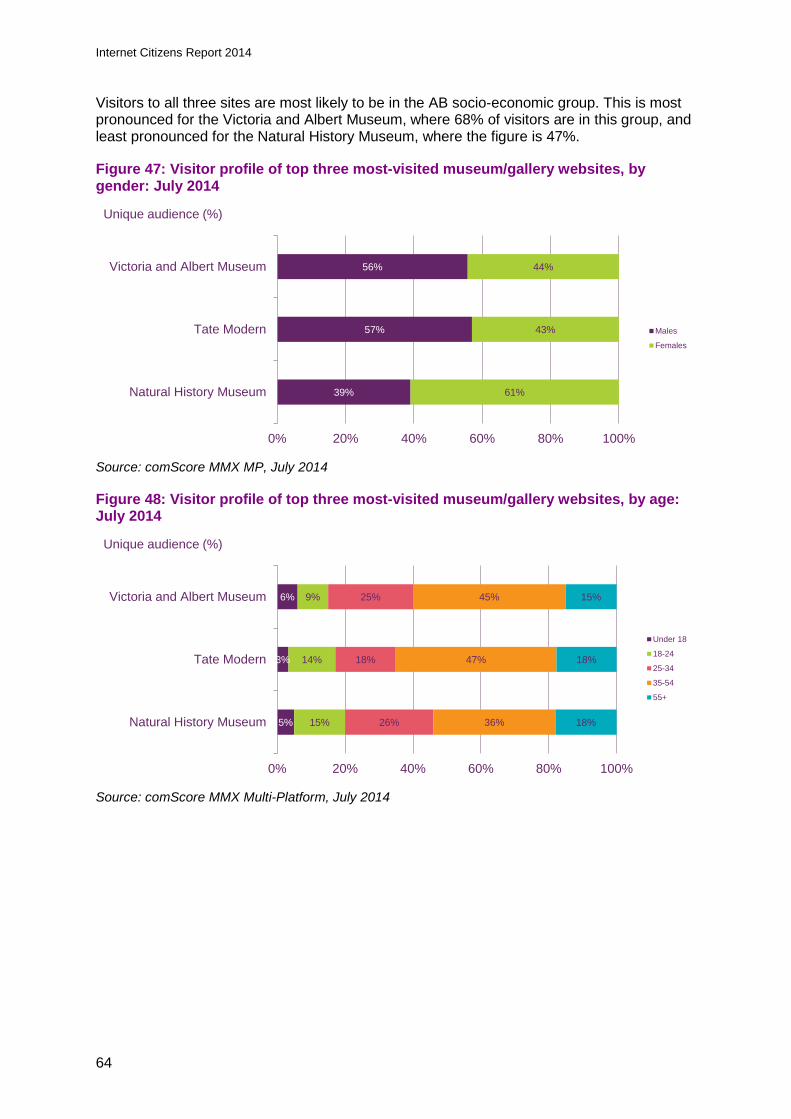
Internet Citizens Report 2014
Visitors to all three sites are most likely to be in the AB socio-economic group. This is most pronounced for the Victoria and Albert Museum, where 68% of visitors are in this group, and least pronounced for the Natural History Museum, where the figure is 47%.
Figure 47: Visitor profile of top three most-visited museum/gallery websites, by gender: July 2014
Source: comScore MMX MP, July 2014
Figure 48: Visitor profile of top three most-visited museum/gallery websites, by age: July 2014
Source: comScore MMX Multi-Platform, July 2014
39%
57%
56%
61%
43%
44%
0% 20% 40% 60% 80% 100%
Natural History Museum
Tate Modern
Victoria and Albert Museum
Males
Females
Unique audience (%)
Unique audience (%)
5%
3%
6%
15%
14%
9%
26%
18%
25%
36%
47%
45%
18%
18%
15%
0% 20% 40% 60% 80% 100%
Natural History Museum
Tate Modern
Victoria and Albert Museum
Under 18
18-24
25-34
35-54
55+
64
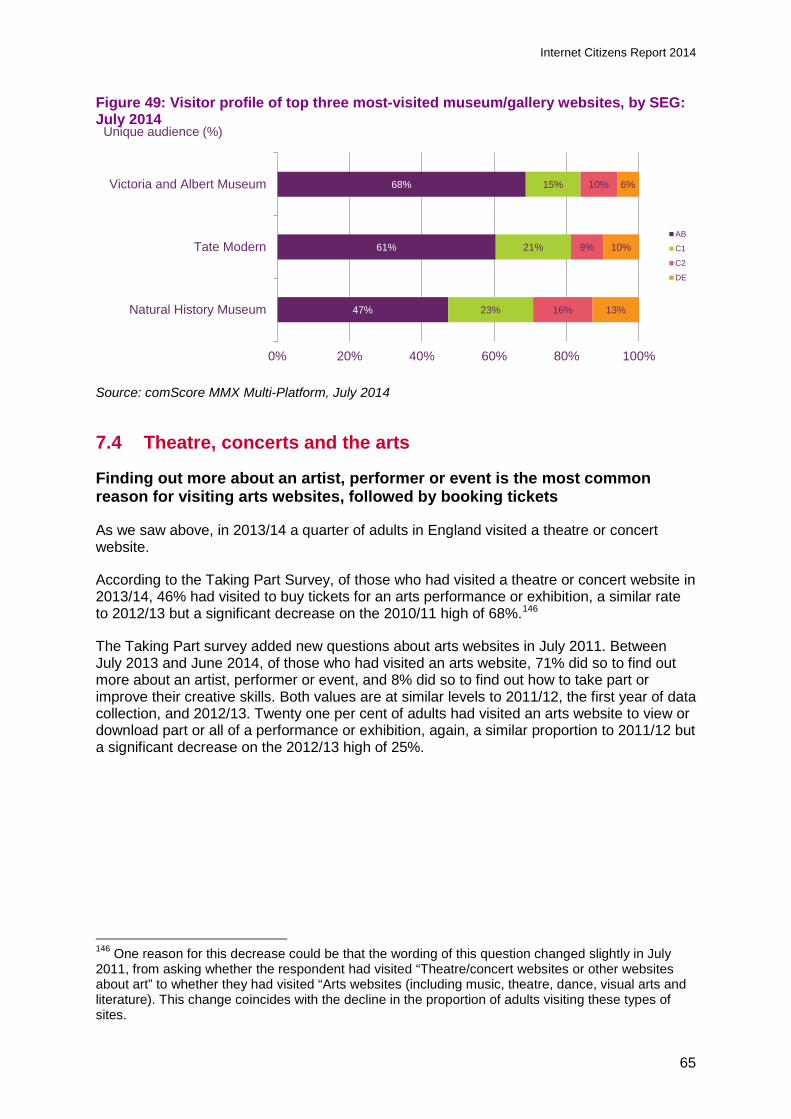
Internet Citizens Report 2014
Figure 49: Visitor profile of top three most-visited museum/gallery websites, by SEG: July 2014
Source: comScore MMX Multi-Platform, July 2014
7.4 Theatre, concerts and the arts
Finding out more about an artist, performer or event is the most common reason for visiting arts websites, followed by booking tickets
As we saw above, in 2013/14 a quarter of adults in England visited a theatre or concert website.
According to the Taking Part Survey, of those who had visited a theatre or concert website in 2013/14, 46% had visited to buy tickets for an arts performance or exhibition, a similar rate to 2012/13 but a significant decrease on the 2010/11 high of 68%.146
The Taking Part survey added new questions about arts websites in July 2011. Between July 2013 and June 2014, of those who had visited an arts website, 71% did so to find out more about an artist, performer or event, and 8% did so to find out how to take part or improve their creative skills. Both values are at similar levels to 2011/12, the first year of data collection, and 2012/13. Twenty one per cent of adults had visited an arts website to view or download part or all of a performance or exhibition, again, a similar proportion to 2011/12 but a significant decrease on the 2012/13 high of 25%.
146 One reason for this decrease could be that the wording of this question changed slightly in July 2011, from asking whether the respondent had visited “Theatre/concert websites or other websites about art” to whether they had visited “Arts websites (including music, theatre, dance, visual arts and literature). This change coincides with the decline in the proportion of adults visiting these types of sites.
Unique audience (%)
47%
61%
68%
23%
21%
15%
16%
9%
10%
13%
10%
6%
0% 20% 40% 60% 80% 100%
Natural History Museum
Tate Modern
Victoria and Albert Museum
AB
C1
C2
DE
65
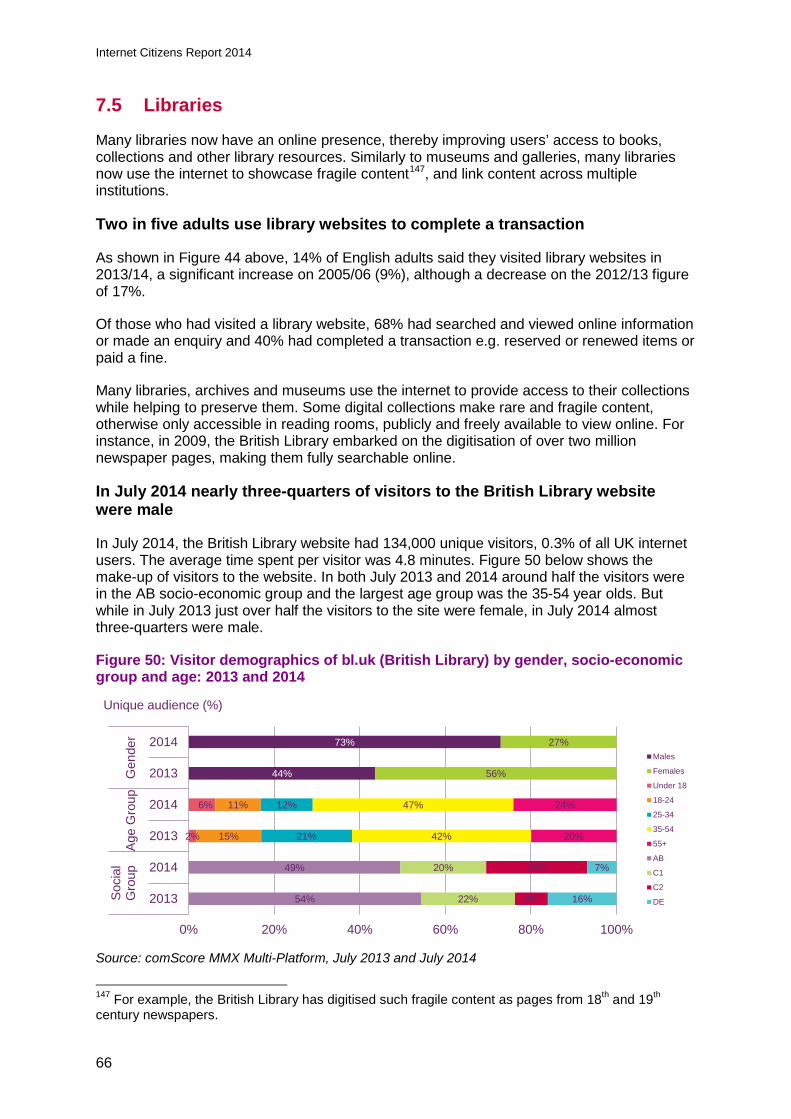
Internet Citizens Report 2014
7.5 Libraries
Many libraries now have an online presence, thereby improving users’ access to books, collections and other library resources. Similarly to museums and galleries, many libraries now use the internet to showcase fragile content147, and link content across multiple institutions.
Two in five adults use library websites to complete a transaction
As shown in Figure 44 above, 14% of English adults said they visited library websites in 2013/14, a significant increase on 2005/06 (9%), although a decrease on the 2012/13 figure of 17%.
Of those who had visited a library website, 68% had searched and viewed online information or made an enquiry and 40% had completed a transaction e.g. reserved or renewed items or paid a fine.
Many libraries, archives and museums use the internet to provide access to their collections while helping to preserve them. Some digital collections make rare and fragile content, otherwise only accessible in reading rooms, publicly and freely available to view online. For instance, in 2009, the British Library embarked on the digitisation of over two million newspaper pages, making them fully searchable online.
In July 2014 nearly three-quarters of visitors to the British Library website were male
In July 2014, the British Library website had 134,000 unique visitors, 0.3% of all UK internet users. The average time spent per visitor was 4.8 minutes. Figure 50 below shows the make-up of visitors to the website. In both July 2013 and 2014 around half the visitors were in the AB socio-economic group and the largest age group was the 35-54 year olds. But while in July 2013 just over half the visitors to the site were female, in July 2014 almost three-quarters were male.
Figure 50: Visitor demographics of bl.uk (British Library) by gender, socio-economic group and age: 2013 and 2014
Source: comScore MMX Multi-Platform, July 2013 and July 2014
147 For example, the British Library has digitised such fragile content as pages from 18th and 19th century newspapers.
44%
73%
56%
27%
2%
6%
15%
11%
21%
12%
42%
47%
20%
24%
54%
49%
22%
20%
8%
24%
16%
7%
0% 20% 40% 60% 80% 100%
2013
2014
2013
2014
2013
2014
Soc
ial
Gro
upA
ge G
roup
Gen
der
Males
Females
Under 18
18-24
25-34
35-54
55+
AB
C1
C2
DE
Unique audience (%)
66
Internet Citizens Report 2014
Wikipedia is used by half of all internet users
In contrast, the user-generated information website Wikipedia has an active reach of half (50%) of all internet users, equating to over 24 million unique users. The average time spent on the site is 8.9 minutes148.
7.6 Archives
More people visit archives and records offices online than in person
As we saw in Figure 44, above, more than one in ten (11%) of adults in England use archive or records office websites.
In contrast to the other cultural sectors examined in the Taking Part report, a higher proportion of adults visited an archive or records office online than in person (11% vs. 4%). Of those who had visited an archive or records office website, 70% had done so to view digitised documents, 28% had searched a catalogue, a fifth (21%) had found information about the archive (e.g. opening hours) and 16% had completed a transaction, e.g. to purchase records.
In 2012 145 million National Archives documents were downloaded
The National Archives is the government’s archive for England and Wales149. Its website allows internet users to view digitised documents.
The collections held by National Archives can be searched through its online catalogue. According to National Archives, over 5% of National Archives’ records have been digitised.150 In 2012 145 million National Archive documents had been downloaded from its website, its partner websites and from Flickr; 890,000 podcasts were downloaded (an increase from 175,000 in 2008); and it gained over 8,400 new Twitter followers151.
In July 2014, the National Archives website attracted 677,000 users, 1.3% of all UK internet users.152 Figure 51 below outlines nationalarchives.gov.uk visitor demographics by gender and age. In both 2013 and 2014 the majority of visitors to the National Archives were female (54% in 2014 and 57% in 2013). In 2014 around three in ten visitors to the website were in each of the 25-34, 35-54 and 55+ age groups, while just one in ten were under 25. This contrasts with 2013 when there were slightly more younger users (4% were under 18 and 14% were 18-24), and a higher proportion of users aged 35-54. In both 2013 and 2014 the AB socio-economic group was the largest, and the smallest number of visitors were in the DE group.
148 comScore MMX Multi-Platform, July 2014 149Scotland and Northern Ireland hold separate national archives. The National Archives of Scotland hold government and private documents relating to Scotland, while the Public Records Office of Northern Ireland holds private and official records for Northern Ireland. These are not reportable on comScore. 150 www.nationalarchives.gov.uk 151 http://labs.nationalarchives.gov.uk/zeitgeist/ 152 comScore MMX Multi-Platform, July 2014
67
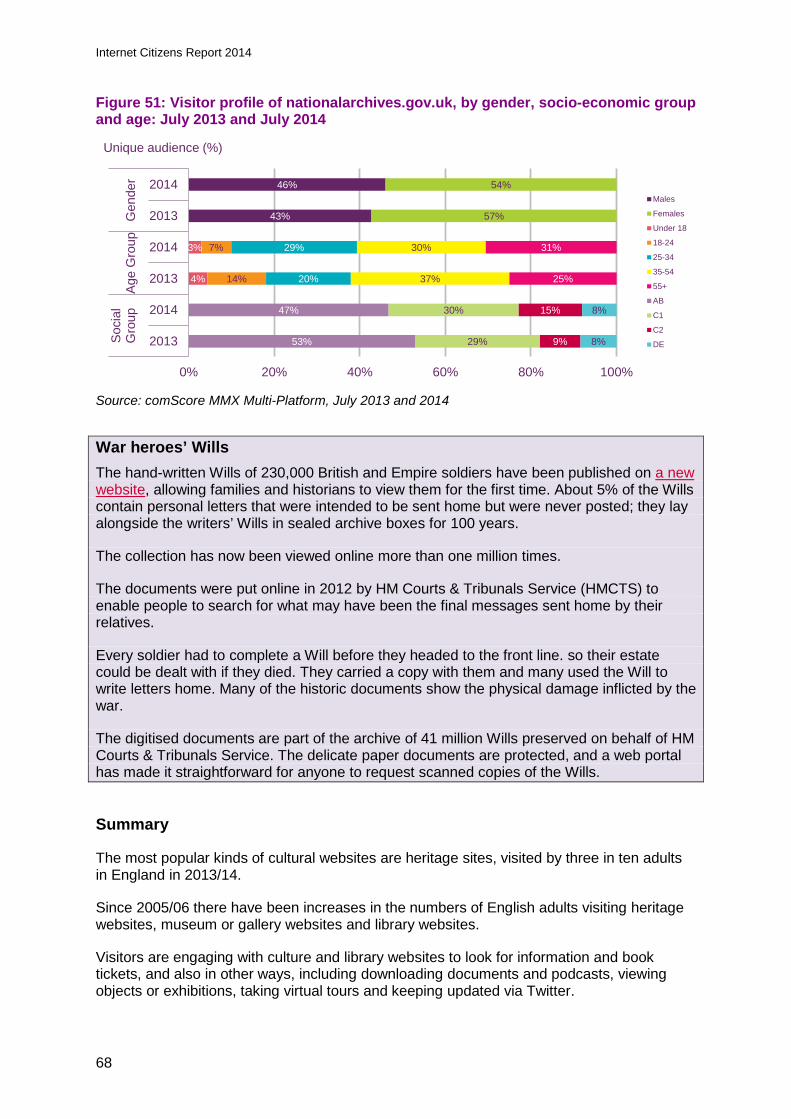
Internet Citizens Report 2014
Figure 51: Visitor profile of nationalarchives.gov.uk, by gender, socio-economic group and age: July 2013 and July 2014
Source: comScore MMX Multi-Platform, July 2013 and 2014 War heroes’ Wills The hand-written Wills of 230,000 British and Empire soldiers have been published on a new website, allowing families and historians to view them for the first time. About 5% of the Wills contain personal letters that were intended to be sent home but were never posted; they lay alongside the writers’ Wills in sealed archive boxes for 100 years.
The collection has now been viewed online more than one million times.
The documents were put online in 2012 by HM Courts & Tribunals Service (HMCTS) to enable people to search for what may have been the final messages sent home by their relatives.
Every soldier had to complete a Will before they headed to the front line. so their estate could be dealt with if they died. They carried a copy with them and many used the Will to write letters home. Many of the historic documents show the physical damage inflicted by the war.
The digitised documents are part of the archive of 41 million Wills preserved on behalf of HM Courts & Tribunals Service. The delicate paper documents are protected, and a web portal has made it straightforward for anyone to request scanned copies of the Wills.
Summary
The most popular kinds of cultural websites are heritage sites, visited by three in ten adults in England in 2013/14.
Since 2005/06 there have been increases in the numbers of English adults visiting heritage websites, museum or gallery websites and library websites.
Visitors are engaging with culture and library websites to look for information and book tickets, and also in other ways, including downloading documents and podcasts, viewing objects or exhibitions, taking virtual tours and keeping updated via Twitter.
43%
46%
57%
54%
4%
3%
14%
7%
20%
29%
37%
30%
25%
31%
53%
47%
29%
30%
9%
15%
8%
8%
0% 20% 40% 60% 80% 100%
2013
2014
2013
2014
2013
2014
Soc
ial
Gro
upA
ge G
roup
Gen
der
Males
Females
Under 18
18-24
25-34
35-54
55+
AB
C1
C2
DE
Unique audience (%)
68

Internet Citizens Report 2014
Although in most areas the in-person visit is still dominant, a higher proportion of adults in England visited an archive or records office online than in person (11% vs. 4%).
Visitors to culture and library websites are most likely to be in the AB socio-economic group.
69
Internet Citizens Report 2014
1 Annex A: comScore methodology comScore The UK Online Measurement Company (UKOM) was formed in 2009 with a mandate from the advertising industry to establish measurement standards for digital media. In 2011, comScore was appointed the sole data supplier for UKOM on a three-year contract from January 2013.
Methodology
comScore’s Unified Digital Measurement (UDM) methodology applies combined panel and census measurement techniques to digital audience measurement. UDM uses comScore’s global measurement panel to determine audience reach and demographics. Census-level activity is captured from publishers’ digital content, such as on websites, videos, and computer and mobile applications. comScore combines census-level data with data captured from the panel to help provide a more accurate view of audiences and their consumption habits. This approach allows comScore to capture the most accurate consumption activity from publishers, and attribute this to audience demographics in a way that is not affected by cookie deletion, blocking, and rejection.
In this report we use comScore MMX Multi-Platform to analyse website and app use across laptop/desktop computers, mobiles and tablets. The digital audience is an unduplicated unique audience between each of these devices and the unique viewers of videos on laptop/desktop computers. Tablet usage data and off-network WiFi usage data are included under mobile since July 2013. However, only those websites and apps that have been tagged as part of comScore’s census network report tablet usage data. Therefore caution is advised in comparing data between entities that tag and entities that don’t.
It is not possible to break down comScore MMX Multi-platform data by nation.
Metrics
Throughout this report we make reference to a number of metrics as defined below:
Unique audience – the total number of unique persons who visited a website or used an application at least once in a given month. Persons visiting the same website more than once in the month are therefore counted only once in this measure.
Active audience – the total number of people who visited any website or used any application at least once in a given month.
Digital audience – the active audience across platforms: laptop/desktop computers; mobile phones; and tablets (for those websites who have tagged in comScore’s census network).
Active reach – the proportion that the unique audience of a website makes up of the active audience
Time spent per month – the average time spent browsing a website per unique visitor per month (excludes time spent watching online video and listening to streamed music, and for mobile audiences excludes any traffic over a home or public WiFi connection).
Dictionary
Each of the entities reported by comScore are attributed to a level in comScore’s Client Focused Dictionary. Several entities can exist within one website (e.g. BBC Sport and BBC iPlayer) and comScore’s dictionary defines how these entities are structured and related to each other. It is client focused because comScore’s clients define how their websites appear in reports according to this dictionary. All comScore reports use the same six tiered dictionary structure, as explained below:
70

Internet Citizens Report 2014
Property [P] - The highest level of reporting in the Client Focus structure, Properties represent all Full Domains (i.e. felmont.com), Pages (i.e. sports.felmont.com/tennis), Applications or Online Services under common ownership or majority ownership for a single legal entity. A Property may also contain any digital media content that is not majority owned but has been legally signed over for reporting purposes by the majority owner.
Media Title [M] - A Media Title is an editorially and brand consistent collection of content in the digital landscape that provides the marketplace with a view of online user behaviour. This may represent a domain, a group of domains, online service or application.
Channel [C], SubChannel [S], Group [G] and SubGroup [SG] - Within a Media Title there may be grouped URLs of editorially consistent content that make up a Channel. For some of the largest Media Titles, Channels themselves may be broad, and Subchannels, Groups and Subgroups within the larger Channels may prove useful for categorisation within the comScore Dictionary.153
153 “Glossary – Key Terms for comScore Dictionary”, comScore.
71