Embed Size (px)
Citation preview

GSM GUARD BANDS ECONOMIC IMPACT STUDY
A Final Report for Ofcom
Prepared by NERA
July 2004
London
Project Team: Nigel Attenborough
Yogesh Sharma Becky Stuttard
Lisa Correa Howard Cobb
National Economic Research Associates Economic Consultants 15 Stratford Place London W1C 1BE Tel: (+44) 20 7659 8500 Fax: (+44) 20 7659 8501 Web: http://www.nera.com An MMC Company
n/e/r/a
n/e/r/a
TABLE OF CONTENTS
1. INTRODUCTION 1
2. SCENARIO SPECIFICATION 2 2.1. Introduction 2 2.2. Detailed Specification 2
3. KEY MODELLING ISSUES 4 3.1. Modelling Time Period 4 3.2. Benefits to be Measured 4 3.3. Treatment of Scenario 1 5 3.4. Treatment of Scenarios 2a and 2b 6 3.5. Treatment of Scenario 3 7
4. OVERVIEW OF MODELLING APPROACH 10 4.1. Introduction 10 4.2. Model Schematic 11 4.3. Overview of Modules 12
5. PRICES MODULE 13 5.1. Discussion of Modelling Approach 13 5.2. Data Sources 13 5.3. Assumptions 15
6. VOLUMES MODULE 16 6.1. Scenario 1 16 6.2. Migration 18 6.3. Scenarios 2a and 2b 18 6.4. S-curve estimations 22
7. COST MODULE 24 7.1. Data Sources 24 7.2. Assumptions 24
8. REPORTING MODULES 28 8.1. Revenues Module 28 8.2. Producer Surplus Module 28 8.3. Consumer Surplus Module 28 8.4. Results Module 28
9. RESULTS 30
n/e/r/a Introduction
1
1. INTRODUCTION
This report sets out the results of NERA’s modelling of the economic benefits of three alternative scenarios for the use of the GSM 1800/DECT guard bands. These three scenarios, which were set out in Ofcom’s Consultation Document of April 2003, are:
• To make the spectrum available, on a national or regional basis, either to the existing GSM operators or to new entrants wishing to provide public mobile telecommunications services.
• To make the spectrum available for short-range, low power use on a licence-exempt basis.
• To retain the guard band and leave the paired band unassigned, in order to assist migration of GSM 1800 to future IMT-2000 use and to facilitate testing and development licensing.
In the report we set out:
• NERA’s specification of the three scenarios for the purposes of economic impact modelling.
• A discussion of the treatment of key modelling issues, such as:
- the time period to be modelled;
- how the benefits (both producer and consumer) are to be measured under the different scenarios; and
- the stylised examples to be modelled under scenario 2.
• A summary of the overall modelling approach that has been used, and how this differs between the different scenarios. This includes a schematic of the model, a high-level discussion of the modules within the model, and a description of how information will flow between these modules.
• A description of the modelling work carried out in each module. This includes a discussion of data sources and any assumptions made.
• The results of the economic impact modelling and a discussion of their implications.
n/e/r/a Scenario Specification
2
2. SCENARIO SPECIFICATION
2.1. Introduction
In this section we discuss how each of the three scenarios identified by Ofcom in its consultation document of April 2003 have been modelled. It is important that the three scenarios are specified in such a way as to allow a meaningful comparison of the outcomes under each scenario. To achieve this, the scenarios must not only reflect alternative uses of the spectrum, but must also separately model the implementation of alternative policy choices. For example, the model needs to consider the following:
• allowing wide-area use;
• allowing low-power use; or
• allowing no “ new” use (i.e. allowing testing and development in this band to continue).
2.2. Detailed Specification
In completing the modelling analysis we have used the following scenario specification:
• Scenario 1: Spectrum is used by either an existing or new wide-area GSM operator until it is migrated for 3G use. After this it is used for wide-area 3G services.
• Scenario 2a: Spectrum is used for low-power GSM applications under a regime where no licences are required. As a result it is not possible to migrate these guard bands for wide-area 3G use.
• Scenario 2b: Spectrum is used for low-power GSM under ‘no-cost licences’. As a result it can be migrated, after a set-time period, for wide-area 3G use.
• Scenario 3: Spectrum is used for testing and development until it is migrated for 3G use. After this it is used for providing wide-area 3G services.
This specification allows a conclusion to be reached about both:
• The relative economic benefits of allowing the spectrum to be used for wide-area GSM services, the provision of low-power GSM services, and allowing no new use of the spectrum (i.e. allowing use of this spectrum for testing and development purposes to continue). This conclusion is reached by comparing the outcomes of scenarios 1, 2 and 3.
• The respective impacts of allowing and not allowing the migration of the spectrum at a later date. This conclusion is reached by comparing the outcomes of scenarios 2a and 2b.
n/e/r/a Scenario Specification
3
It is important to model the impact of the use of spectrum for low power applications both with and without the possibility of subsequent migration, as this allows a judgement to be made on the relative economic benefits of the three different uses of the spectrum, irrespective of whether there is licensing to facilitate future spectrum migration under scenario 2.
The pre-migration period under scenario 2b has been assumed to be of a sufficiently long duration so as to remove any disincentives to invest. Therefore, any difference between scenarios 2a and 2b will be limited to the net benefit to be derived from the migration itself (i.e. the use of the spectrum to provide 3G services at a future date). The time period over which the modelling takes place is discussed in greater detail below.
n/e/r/a Key Modelling Issues
4
3. KEY MODELLING ISSUES
3.1. Modelling Time Period
To capture the impact of migration of the spectrum, it has been necessary to ensure that the modelling horizon is sufficiently long for migration to have taken place. However, at the same time, caution has to be exercised when extending the model duration, as the further one moves away from the present day the more uncertain the results become.
Therefore, based on discussions with Ofcom and the respondents to the consultation document we decided to model the use of the spectrum over the period 2004/05 to 2014/15 with migration occurring during the financial year 2010/11. This time period allows sufficient time for low-power users to recover their investment cost, so as to remove the disincentive to invest under scenario 2b above, but is also sufficiently long to enable a reasonable assessment of the impact of allowing, or not allowing, migration.
3.2. Benefits to be Measured
The model measures the following benefits under each of the scenarios:
• The net private benefit of producers (i.e. producer surplus). This is measured as (actual or derived) revenues minus costs (operating and capital costs). In the case of public use of the spectrum, the relevant revenues are those generated from selling the service. In the case of private use of the spectrum the revenues are derived using either market prices for similar services or, for substitution traffic, the amount saved by using the spectrum rather than an alternative medium of communication (e.g. substitution from wide-area GSM to local-area GSM).
• The consumer surplus. This measures the benefits private consumers derive from the service less the amount they pay for the service. Consumer surplus has been measured for all public uses of the spectrum. For private uses of the spectrum the net private producer benefits will capture any additional consumer surplus.
In order for the scenario comparison to be meaningful, when the local-area use of the spectrum involves the substitution of traffic volumes away from another medium of communication, the benefits (both producer and consumer) have been measured as the additional private benefits from the local use of the spectrum, as compared to the alternative method of communication, rather than the total benefits (as would be measured for a completely new service).
For example, some of the traffic under scenario 2 (a and b) would also have been present under scenarios 1 and 3. The traffic would, however, be provided over a wide-area GSM network rather than a local-area network. The economic benefits of scenario 2 (a and b), compared to either scenario 1 or 3, are therefore the additional net private producer benefits
n/e/r/a Key Modelling Issues
5
and additional consumer surplus generated from use of the local-area network rather than a wide-area network. If the full impact of using the local-area network were included (rather than the additional benefit), this would overstate the relative economic benefit of this scenario1.
3.3. Treatment of Scenario 1
NERA discussed the possible options for the use of the spectrum under Scenario 1 with the wide-area GSM operators. The overall views expressed by these operators were that:
• The spectrum would be insufficient for a new entrant to enter the market and offer a viable service. The wide-area operators indicated that they were unaware of any operator who had rolled out a network with less than 2 x 5MHz of spectrum (only 2 x 3.3MHz is available from the GSM 1800/DECT guard bands).
• The fragmented nature of the spectrum would affect the usability of the spectrum for those operators whose spectrum is not currently located close to the guard bands.
Therefore, it was concluded that modelling the impact of the use of this spectrum by existing operators would represent a more valid estimate of the economic value of the wide-area use of this spectrum. Additionally, to identify the maximum benefit that could possibly be generated from this spectrum, it was assumed that the spectrum would be allocated in such a way that spectrum fragmentation would not affect its usability.2
The wide-area operators also expressed the following concerns over the impact of allowing licence exempt use of this spectrum upon future migration of the spectrum for 3G uses:
• The operators indicated that the impact of this would largely be on the efficiency of the spectrum allocation for 3G users.3
• They also indicated that there could be an impact upon the ease with which operators could be moved within the band during the migration process.
These considerations were taken into account when modelling the net benefits available from migration.
1 Unless those benefits from this traffic which are common to all scenarios are included under all scenarios. 2 This could either involve the allocation of the spectrum to those operators whose spectrum is currently located in
the vicinity of the GSM 1800/DECT guard bands, or the reorganisation of the allocation of spectrum within the GSM 1800 band. The latter option however, may impose additional costs upon the wide-area operators.
3 However, they also indicated that the maximum amount of capacity which would be lost would be 2x5Mhz of spectrum. This maximum potential spectrum loss is small in comparison to the total amount of spectrum which is either currently allocated for 3G services or is earmarked for their future expansion (2x5Mhz of spectrum would account for in the region of 2% of the total 3G spectrum).
n/e/r/a Key Modelling Issues
6
An additional consideration taken into account when establishing the net benefits from migration was the usability of this spectrum for the provision of 3G services, and for facilitating movement of operators within the band during the migration process, as this could be limited by the power restrictions that would be required to eliminate potential interference with DECT users. To take account of this potential limitation, it was assumed that, for 3G operators, use of this spectrum would be limited to hotspot capacity relief, just as would be the case for the wide-area GSM operators.
An additional concern expressed by one of the wide-area operators was that the assessment of the impact of using this spectrum for low-power GSM services should be considered in conjunction with the assessment of the impact of other spectrum allocation issues (for example the allocation of spectrum for WLAN application). Whilst this is beyond the scope of the current study, this is an issue that Ofcom may wish to consider in its wider regulatory impact assessment.
3.4. Treatment of Scenarios 2a and 2b
Based on the responses Ofcom received to its April 2003 consultation document, and upon the interviews that NERA held with the respondents, it was decided to model the following stylised examples under scenarios 2a and 2b.
• University Campuses: In this example a service provider offers pre-paid low cost outbound and on-campus calling to students. The low power GSM network will provide coverage in halls of residence and other communal areas on campus (for example Student Union buildings).
• Campus Corporate Organisations: In this example, campus corporate organisations, such as Health Trusts, Airports, Car Plants, Oil Refineries, self-provide a low power GSM network for private use to allow cordless PBX functionality. This network will provide both indoor and outdoor coverage on the campus site.
• Retail Corporate Organisations: In this example, large retailers (e.g. retailers with a central office plus a large number of stores countrywide) self-provide a low power GSM network for private use to enable cordless PBX functionality both at a central office, but also between the different stores and the central office. Inter-site traffic will be routed over the organisation’s existing infrastructure.
• Other Large Corporate Organisations: In this example, other large corporate organisations (i.e. organisations with more than 250 employees which do not fit into either the Campus Corporate or Retail Corporate categories) self provide a low power GSM network for private use to enable in-building cordless PBX functionality, possibly with links between a small number of different sites.
• Small and Medium Size Corporate Organisations: In this example, small and medium size organisations (i.e. organisations with less than 250 employees) enter
n/e/r/a Key Modelling Issues
7
into agreements with a service provider to provision a low power GSM network for their private use, to enable in-building cordless PBX functionality.
• Theme Parks and Holiday Villages: In this example, theme parks and holiday villages offer on-site calling and information services to visitors to allow them to keep in touch during their visit and to inform them of site specific information (e.g. queue lengths at rides, reminders of facility bookings etc.).
• Hotels: In this example, hotels provide low power GSM networks for public use within Hotel buildings. This service will extend coverage in potential black-spot areas, allow on-site calling at conference facilities and pre-paid outbound calling to guests.
The model estimates the total potential market size, for each of the stylised examples, based on indicative take-up rates, volumes, and revenues, for each of the uses.
In modelling these examples, interoperability with wide-area operators was considered. One possible solution to this is an over-arching organisation which facilities interoperability by acting as a central point of contact between the low power GSM operators and the wide area operators. The costs of such an organisation have been reflected in the model.
The following potential uses of the spectrum were investigated but were not modelled during this study:
• The use of this spectrum on aircraft: NERA discussed this potential use of spectrum with a number of respondents. However, discussions with Ofcom indicated that the ability to allow this use of the spectrum was not wholly within Ofcom’s remit. For this use of the spectrum to be allowed the agreement of other organisations, both in the UK and Internationally, would need to be obtained. Therefore, owing to the degree of regulatory uncertainty over this application, it was not considered in this model.
• The use of this spectrum for community networks: NERA discussed with one of the respondents the potential for using this spectrum for the provision of community networks. This respondent indicated that the main value of this spectrum would be to facilitate communication between users with common interests. Whilst it may be possible to quantify the benefits of this communication facilitation within a wider social benefits assessment, they cannot be measured in terms of a private economic benefits stream (as they generate no quantifiable revenues or reduced costs).
3.5. Treatment of Scenario 3
Under Scenario 3, the GSM 1800/DECT guard band would be reserved for testing and development purposes until the spectrum is migrated for 3G uses. Testing and development use of this spectrum is already allowed, and there are currently four
n/e/r/a Key Modelling Issues
8
applications within this band. When allowing the use of this band for testing and development Ofcom has a duty to resolve any associated interference problems. This places some limitations on the use of this spectrum for testing and development purposes, as high power uses of this spectrum would need to be located in such a way that they did not interfere with either GSM 1800 or DECT users.
If this spectrum were made available on a licence exempt basis it would still be possible for testing and development activities to take place, although these activities would need to comply with the requisite power restrictions. This would rule out only some of the current applications for testing and development within this band. However, it is not clear that these testing and development activities could not be accommodated under Scenarios 2a and 2b.
To allow high power testing and development use of the spectrum, within a limited geographical area, under Scenarios 2a or 2b, Ofcom would need to investigate the use of this spectrum by low-power users, and the potential of high power use interfering with either low power GSM, or GSM 1800/DECT users in the relevant geographical area. This is not dissimilar to the investigations Ofcom would need to complete when issuing a licence for such testing and development under Scenario 3.
Assuming that the restrictions on the use of this spectrum under Scenarios 2a and 2b would only impact upon some of the current testing and development uses of this spectrum, and that it may still be possible to facilitate high power testing and development uses within limited geographical areas4, there are no quantifiable additional economic benefits from reserving this spectrum for testing and development purposes when compared to either Scenarios 2a or 2b.
NERA discussed the use of this spectrum for testing and development purposes with some of the respondents to the consultation. These discussions identified that:
• The wide-area GSM operators would not consider using this spectrum, instead of using their own activated spectrum, for the purposes of testing and development. This suggests that, for these operators, there are no cost savings from using this spectrum rather than using their own spectrum.
• Some of the respondents indicated that they expected that making this spectrum licence exempt would encourage additional non-commercial testing and development. For example testing and development completed by universities and other educational organisations. The implications of this for the modelling analysis are that:
4 High power use of the spectrum under Scenario 3 would also need to be limited in terms of its geographic location and duration in order to limit interference with GSM 1800 and DECT users.
n/e/r/a Key Modelling Issues
9
- As it is the licence exempt nature of the spectrum which would encourage this testing and development, these activities would be more likely to occur under scenarios 2a than under scenario 3.
- As the testing and development which the licence exempt spectrum would encourage is non-commercial (e.g. educational) it is not possible to quantify a private economic benefit stream which these activities generate. However, in its regulatory impact analysis Ofcom may wish to consider the wider social benefits which arise from these activities.
Given all of the issues discussed above, it is NERA’s view that retaining the spectrum for testing and development purposes alone does not generate significant incremental benefits over allowing either licence exempt or low-cost licensing of this spectrum. Additionally, any benefits which may be generated by higher levels of testing and development activity are likely to be limited to non-commercial uses. Therefore, these activities, whilst generating wider social benefits, are unlikely to produce a private economic benefits stream which can be measured for the purpose of this analysis.
Therefore the benefits to be modelled under Scenario 3 are limited to the post-migration benefits derived from using this spectrum for 3G service provision.
n/e/r/a Overview of Modelling Approach
10
4. OVERVIEW OF MODELLING APPROACH
4.1. Introduction
In this section we set out the approach that has been used to model the scenarios listed in section 2.2 above.
At a high-level, a common modelling approach has been used for each of the scenarios. However, the type of data that needs to be captured for each scenario will differ. We have therefore provided:
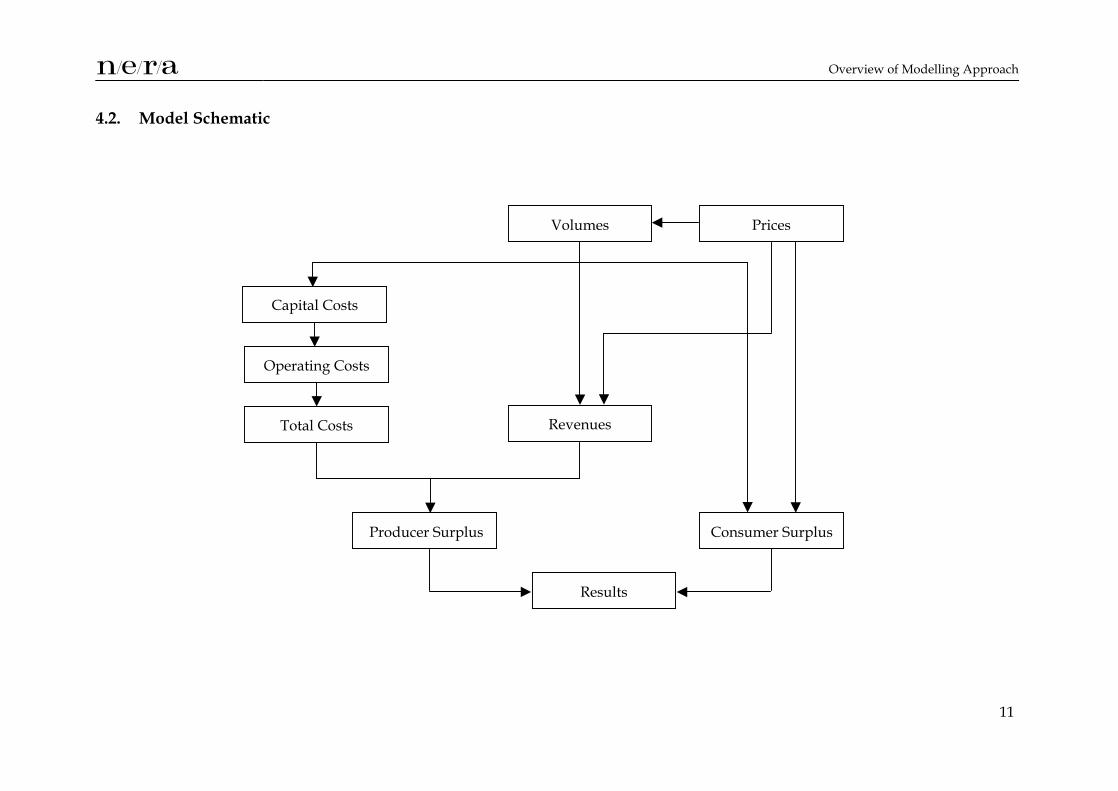
• An overall schematic of the model, indicating the different modules within the model and how these fit together to measure economic benefits. This schematic can be thought of as the high-level common modelling approach to be applied to all scenarios.
• A brief description of the purpose of each module and the information flows between the modules.
n/e/r/a Overview of Modelling Approach
11
4.2. Model Schematic
Prices Volumes
Revenues
Consumer Surplus
Operating Costs
Capital Costs
Total Costs
Producer Surplus
Results
n/e/r/a Overview of Modelling Approach
12
4.3. Overview of Modules
Set out below is a high-level overview of the purpose of each of the modules shown in the diagram above.
• Prices module: This module models either the price at which each service is to be sold, or, for private uses of spectrum, the derived price of communicating using this spectrum rather than using an alternative means of communication, if such an alternative exists, (e.g. the saved costs or, in other words, the price that would have been charged for an alternative communication service). The prices feed into the Volumes, Revenues and Consumer Surplus modules. It is necessary to establish the prices for services before determining volumes, as the price of any service will be one of the factors determining demand for that service.
• Volumes module: This module estimates the volumes of the different services. These volumes are measured in terms of minutes of use, which are determined by factors such as: price elasticities of demand, income elasticities of demand, take-up rates of new services, and existing service usage levels (for substitution traffic). The output of the Volumes module feeds into the Revenues, Operating Costs and Capital Cost modules.
• Costs module: This module takes the volumes derived in the Volumes module and converts these into the required levels of capital expenditure and operating costs. These costs are then combined into a measure of total costs. The results of this module feed into the Producer Surplus module.
• Revenues module: This module combines the outputs of the Prices and Volumes modules to derive the total revenues generated from the services. The results of this module feed into the Producer Surplus module.
• Producer Surplus module: This module uses the results of the Revenues and Total Costs modules to derive a stream of net private benefits. These net benefits are then discounted to identify the net present value of this benefits stream.
• Consumer Surplus module: This module uses information from the Prices and Volumes Modules to identify the stream of consumer surplus generated from different services. This is then discounted to identify the net present value of this benefits stream.
• Results module. This module combines information from the Producer Surplus and Consumer Surplus modules to provide the present value of the overall benefits stream under each scenario.
n/e/r/a Prices Module
13
5. PRICES MODULE
5.1. Discussion of Modelling Approach
The prices module forecasts prices for different call types over the period covered by the model. These forecasts are all based on starting price data, which is then trended forward using information on past trends in telecommunications call prices.
The prices module forecasts prices for each of the following call types:
• Fixed line calls:
- Local calls;
- National calls;
- International calls; and
- Fixed to mobile calls.
• 2G Mobile calls:
- On-net mobile calls;
- Off-net mobile calls;
- Mobile to fixed calls;
- International mobile calls; and
- Roaming calls.
The prices module also forecasts prices for 3G mobile calls and the price of using an on-site calling and informational service at a Theme Park or Holiday Village (it is assumed that consumers of this service will pay a daily subscription rather than itemised call charges).
All prices are forecast on a nominal basis.
5.2. Data Sources
5.2.1. Starting Price Data
5.2.1.1. Fixed Line Calls
Call price data for fixed calls was derived from the revenue and volume data in “ The UK Telecommunications Industry Market Information 2001/02” , published by Oftel in March 2003 and “ The Market Information Fixed Update Q4 2002/03” , published by Oftel in
n/e/r/a Prices Module
14
September 2003. These sources provided data on total market call volumes and revenues, and on the split of these between Business and Residential users, for the years 1997/98 to 2002/03.
The implied prices per minute (revenues divided by call volumes) in 2002/03 were used as the starting prices for the price forecasts for each of the fixed line call types.
5.2.1.2. Mobile Calls
GSM call prices were obtained from the reports of the Competition Commission on its inquiry into the charges made by the mobile operators for terminating calls from fixed and mobile networks. Tables 5.21 and 6.10 of this report provide call price data for 2002 split into the following call categories:
• On-net mobile call;
• Off-net mobile call;
• Mobile to fixed call; and
• Mobile call to the rest of the world.
Table 6.5 of the same report provides data on the destination of outgoing mobile calls. Using this information, an average mobile call price in 2002 was derived. This average price was used as the starting price for the price forecasts for mobile calls.
The price for 3G mobile calls was derived from an Analysys forecast of 3G ARPU in Western Europe in 2008.
5.2.1.3. Additional Starting Price Information
Under the Universities stylised example in Scenarios 2a and 2b the starting prices were based on information provided by respondents during the interview process.
The starting price for the on-site calling and informational service provided by Theme Parks and Holiday Villages was also based on information provide by respondents during the interview process.
5.2.2. Price Trend Data
Information on price trends was obtained from a number of different sources.
• Information on UK fixed line and mobile prices was obtained from the Analysys Cutting the Cost database. This benchmarking database compares the tariffs of telecom services in different European countries, by customer type, and over time.
n/e/r/a Prices Module
15
• Information on trends in UK mobile prices over time was obtained from the mobile price index produced by Oftel.
• Information on trends in UK fixed line and mobile prices was also obtained from the ITU World Telecommunications Indicators database.
These sources suggested that mobile prices would fall in nominal terms over time, whilst overall fixed prices would remain broadly stable in nominal terms, but would fall in real terms.
The historical data on fixed prices may be distorted by rebalancing between line and call prices. However, the Analysys database provides data on national and international call prices separately from line charges, and the trend in these supports the conclusion that fixed call prices are likely to remain broadly stable in nominal terms.
One exception to this trend will be the price of fixed to mobile calls. The cap on the prices that mobile operators can charge for terminating such calls means that the price of these calls can be expected to fall by, on average, 12%per annum in real terms until 2007/8.
5.3. Assumptions
The key assumptions included in the Prices Module are:
• Firstly, that future price trends can generally be predicted based on historical price trend information. The exception is the price of fixed to mobile calls, the forecast for which reflected the price cap on fixed to mobile termination charges.
• Secondly, that when a service provider is entering a market it will offer discounts on market prices in order to attract consumers. Therefore, for those stylised examples in Scenarios 2a and 2b, which involve the public provision of a substitute service we have factored in a discount on market prices. The stylised examples which involve the inclusion of a discount are:
- The provision of lower power GSM services to university students;
- The provision of on-site lower power GSM services to small and medium size enterprises 5; and
- The provision of prepaid outbound calls to hotel guests.
5 It is assumed that large enterprises will install their own low-power networks rather than purchasing this service from a service provider.
n/e/r/a Volumes Module
16
6. VOLUMES MODULE
The volumes module uses information from the prices module, and evidence of take-up rates for mobile services, to forecast volumes. The volumes forecast for each scenario are discussed in detail below.
6.1. Scenario 1
A three step modelling process was used to assess the impact on the volume of successful call completions of allowing the existing wide-area mobile operators to use the GSM 1800/DECT guard bands:
• Firstly, total market demand for GSM minutes was forecast for the duration of the model. This forecast was based on the growth in total mobile minutes and the split of these minutes between GSM and 3G technologies. The growth in mobile minutes was established by using published demand elasticities, and assessing the impact that forecast changes in mobile call prices, income levels and the predicted growth in mobile subscriber numbers would have upon the volume of mobile minutes. The split of mobile minutes between GSM and 3G was then determined based on the rate of uptake of 3G services (see section 6.2 below for a discussion of 3G take-up rates).
• Secondly, the level of congestion experienced on GSM networks was investigated, and the impact of this congestion upon successful GSM call minutes was identified. This assessment was based upon the results of the Mobile Networks Call Success Rate Survey, published by Oftel. It resulted in an estimate of the number of GSM minutes which are either not set-up, or are dropped during a call6.
• Thirdly, an estimate was made of the proportion of those calls, which are either not set up or are dropped, that could be converted into successful calls if the GSM 1800/DECT guard bands were made available to the wide-area operators. This was based upon estimates of:
- the proportion of calls which are never re-made by a user (e.g. when the call is dropped the user does not call back); and
- upon the proportion of such lost calls which could be successfully completed if the additional spectrum were available.
This three step modelling process identified the volume of GSM minutes per annum which the wide-area operators could gain if the additional spectrum were made available.
It involved a number of key assumptions. These are set out below.
6 These are calls that are dropped when moving from one-cell site coverage areas to an adjacent BTS cell.
n/e/r/a Volumes Module
17
Assumptions were made about the proportions of calls which are not re-made when either there is a failure during call set-up or when the call is dropped. It was considered that a higher proportion of calls which are dropped would be remade. Therefore, NERA assumed that 75% of calls that are dropped would be remade, but that only 50% of calls which experience a call set-up failure would be remade7. Sensitivity analysis (i.e. flexing the percentages by plus or minus 10%) on these assumptions shows that the results do not change significantly.
Assumptions were also made in relation to the proportion of such lost calls which could be converted into successful calls if the additional spectrum were available. In NERA’s view, the extent of capacity relief that the additional capacity would provide differs between those calls which are not set-up and those calls which are dropped.
• For calls that are not set-up the additional capacity could offer a relatively high level of capacity relief. Given the power restrictions on the use of the available spectrum, congestion relief will be provided through the addition of ‘hotspot’ coverage, this will provide extra coverage in a narrow area (possibly up to only a few kilometres) and therefore will be most suitable for relieving capacity constraints in small locations, for example at a shopping complex or a train station. Additional coverage at such areas could have a significant impact upon call set-up success rates. Therefore we have assumed that the available capacity would provide 75% capacity relief for non-set up calls8.
• For calls that are dropped the extent of capacity relief offered by the available spectrum is more limited, and may not exceed 25% of the total volume of dropped calls. One of the key reasons for a call dropping is when a large numbers of users pass between coverage cells (for example when a train load of passengers all pass between cells). Given that the power restrictions on the spectrum limit coverage relief to additional ‘hotspot’ coverage, the additional spectrum may not provide significant relief for such non-static causes of congestion.
7 This issue was discussed with the respondents to Ofcom’s consultation during the interview process. However, none of the respondents were able to provide NERA with estimates for these proportions.
8 Given the size of the spectrum under consideration there may be limitations on the amount of relief hotspot areas can provide. One of the key causes of unsuccessful call set-up is non-independent call presentation. For example, a delayed commuter train whose passengers all attempt to make a call from their mobile handsets at the same time would give rise to a non-independent call presentation. The provision of one or two additional carriers of capacity would not significantly relieve capacity constraints in such cases. Even if another 15 traffic channels were available there would remain many tens of passengers whose call attempts would fail. We have not factored this limitation into the capacity relief percentage for non-set up calls as the unsuccessful call set-up data in the Oftel survey is based on drive-by call testing, and therefore may not reflect the problem of non-independent call presentation in public spaces such as train stations.
n/e/r/a Volumes Module
18
6.2. Migration
The volumes of 3G minutes were forecast based upon the overall growth in mobile minutes and the split of these minutes between GSM and 3G technologies. This split was forecast based on publicly available information on current 3G subscriber numbers, future expectations of subscriber growth, and forecasts of 3G subscriber numbers in future years:
• The information on 3G subscriber numbers in 2003/04 and on forecast quarterly additions in the near future was obtained from the publication “ Mobile Communications” 9 and upon estimates of quarterly 3G subscriber additions from Credit Suisse First Boston10.
• The information on 3G subscribers in future years was based on an Analysys forecast of the number of 3G subscribers in Western Europe in 200811.
This information, which provides estimates of subscriber numbers at different points in time, was combined with a diffusion curve12 to predict the levels of 3G subscribers between the point estimates.
6.3. Scenarios 2a and 2b
The forecasting of volumes for each of the stylised examples involved the following three step modelling process:
• Firstly, the potential first-year market under each example, and the size of this potential market in terms of the volumes of telecommunications services demanded was identified.
• Secondly, these overall potential market volumes were forecast forward based on changes in prices, income and subscriber numbers combined with the elasticities of demand for each of these factors.
• Thirdly, the proportion of this available market that takes up the service was identified. This was based on the estimation of product diffusion curves. Diffusion curves which follow an s-curve shape were considered. These include both the Logistic and Gompertz diffusion curves.
The implementation of the first two steps is discussed for each stylised example in sections 6.3.1 to 6.3.4 below. This discussion sets out the data sources used and any key assumptions
9 Mobile Communications, Issue 372. 10 CSFB predict that from 3Q03 subscriber additions will be in the range of 50,000 to 150,000 per quarter. 11 Analysys forecast 61% penetration of 3G subscribers in Western Europe in 2008. 12 A Logistic curve which produces an s-curve shaped diffusion profile was used.
n/e/r/a Volumes Module
19
made. The estimation of diffusion curves under the third modelling step is then discussed in section 6.4.
6.3.1. Universities
The potential market for low power GSM services on universities campuses was identified by examining:
• The number of universities and HE colleges in the UK. This information was obtained from “ Higher Education in the UK” , published by the Higher Education Funding Council for England in January 2004.
• The average number of students at HE colleges in the UK. This information was also obtained from “ Higher Education in the UK” , published by the Higher Education Funding Council for England in January 2004.
• The proportions of students at these institutions who live in halls of residence. This information was obtained by sampling the numbers of halls of residence, the numbers of rooms in these halls, and the total number of students studying at 40 universities and HE colleges in the UK. This information was used to inform the market saturation point for students at each institution, as it would be those students who live in halls of residence for which the service would be most useful.
The growth in the potential market was forecast based on the trend in overall mobile call prices, the growth in UK GDP and the growth in mobile subscriber numbers, and the elasticity of demand with respect to each of these factors. To be conservative, the numbers of universities and HE colleges and the average number of students per institution was assumed to remain stable throughout the modelling period.
6.3.2. Campus Corporates, Retailers, Large Corporates, SME Corporates
The potential market for private use of low power GSM networks by Campus Corporates, Retailers, Large Corporates and SME Corporates was identified through analysis of both the numbers of such organisations in the UK, and total Business demand for telecommunications services, split by size of organisation.
The numbers of organisations were obtained from data published by Small Business Services. This data contains numbers of enterprises and the number of employees split by the following size categories:
• No employees;
• 1-4 employees;
• 5-9 employees;
n/e/r/a Volumes Module
20
• 10-19 employees;
• 20-49 employees;
• 50-99 employees;
• 100-199 employees;
• 200-249 employees;
• 250-499 employees; and
• 500 or more employees.
In addition this information is split out by 2 digit SIC codes such as:
• 23 - Manufacture of coke, refined petroleum products and nuclear fuel;
• 34 - Manufacture of motor vehicles, trailers and semi-trailers;
• 52 - Retail trade, except motor vehicles; and
• 85 - Health and social work.
Using both the information on the split of organisations by size, and the split of large organisations (i.e. those with 250 or more employees) between different SIC codes, NERA identified the number of organisations within each of the stylised examples.
The demand for telecommunications services by these organisations was established using the following key sources:
• “ The UK Telecommunications Industry Market Information 2001/02” , published by Oftel in March 2003.
• “ The Market Information Fixed Update Q4 2002/03” , published by Oftel in September 2003.
• “ The Market Information Mobile Update Q4 2002/03” , published by Oftel in June 2003.
• “ Business Use of Fixed Telephony Oftel Small and Medium Business Survey” published by Oftel in 2002.
The first two sources provided information on the total business demand for fixed services from 1997/98 to 2002/03. The first and third source provided information on total demand (residential and business) for mobile services from 1997/98 to 2002/03. The business proportion of these volumes was identified by applying the split of fixed service volumes between business and residential customers.
n/e/r/a Volumes Module
21
Once the total business demand for fixed and mobile telecommunications services was established, the proportion of this demand that was relevant to each of the stylised examples was identified. As large organisations demand a greater overall volume of telecommunications services than smaller organisations it was necessary to identify the typical telecommunications demand of large, medium and small organisations. This was established using information from the fourth source listed above.
Therefore, the potential market for each stylised examples was based on the following information:
• the numbers of, and size of, organisations in each stylised example;
• the total volume of business demand for fixed and mobile telecommunications services; and
• the typical level of demand by organisations of different size.
The potential market was then forecast forward based on the trend in overall fixed and mobile call prices, the growth in UK GDP and the growth in business lines and mobile subscriber numbers, and the elasticity of demand with respect to each of these factors.
6.3.3. Theme Parks and Holiday Villages
To identify the potential market for on-site calling at theme parks and holiday villages, the numbers of large theme parks and holiday villages within the UK were identified along with annual visitor numbers at these attractions. This information was obtained from a variety of different sources including data published by STARUK (Statistics on Tourism and Research) and information published on the websites of companies such as Center Parks and Alton Towers.
The potential market (e.g. numbers of theme parks and holiday villages) was then assumed to remain stable for the duration of the model.
6.3.4. Hotels
The potential market for outbound calling from hotels was identified through analysis of the branded hotel chains in the UK and typical hotel occupancy rates.
• The numbers of hotels and the average number of rooms per hotel for the top 30 branded hotel chains in the UK were obtained from the UK Hotel Group Directory 2003.
• Occupancy rates were obtained from STARUK (Statistics on Tourism and Research).
This information was used to identify the total number of guests in UK hotels, who might consider using a low-power GSM network. The potential market in terms of the numbers of
n/e/r/a Volumes Module
22
hotels and the numbers of guests per hotel was assumed to remain stable for the duration of the model.
The typical volume and destination of calls per guest was also considered. The total volume of calls per guest per night was assumed to be 60 minutes at the start of the modelling period. The destination of calls was estimated using information on the numbers of non-UK guests in hotels, and the split of UK mobile calls between calls to mobiles, calls to UK fixed lines and international calls.
The volume of demand for telecommunications services per guest was forecast forward based on the trend in overall mobile call prices, the growth in UK GDP and the growth in mobile subscriber numbers, and the elasticity of demand with respect to each of these factors.
6.4. S-curve estimations
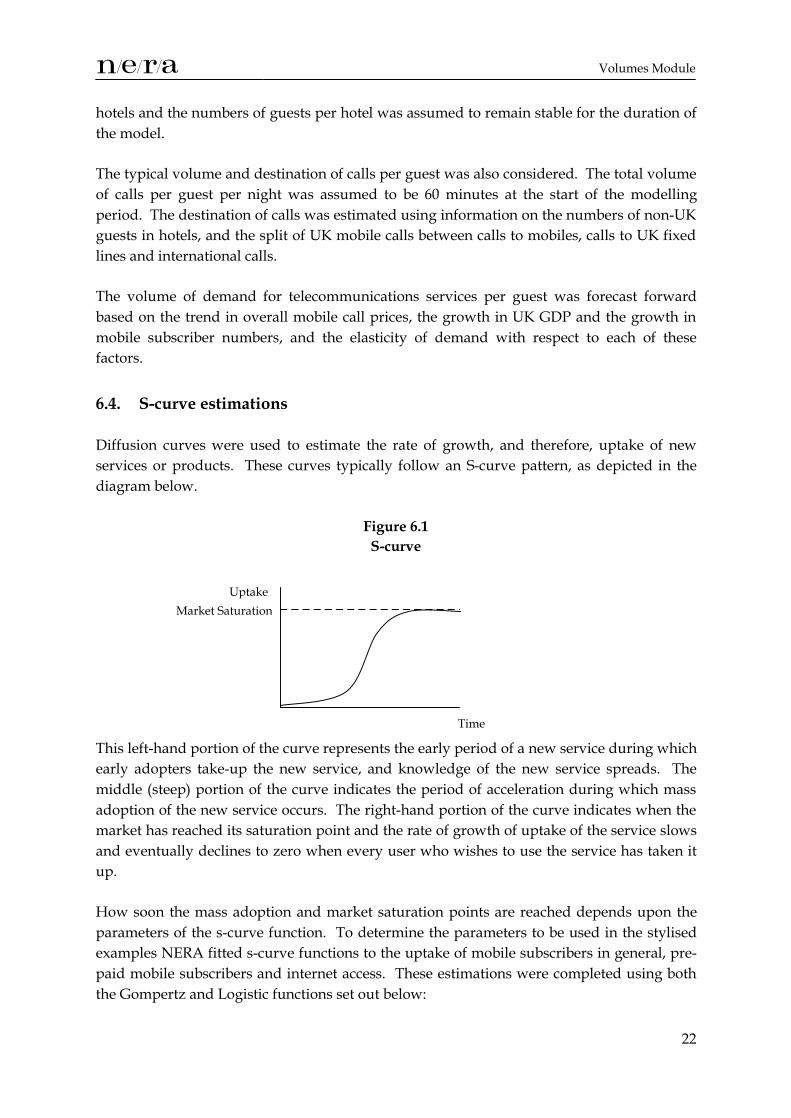
Diffusion curves were used to estimate the rate of growth, and therefore, uptake of new services or products. These curves typically follow an S-curve pattern, as depicted in the diagram below.
Figure 6.1 S-curve
This left-hand portion of the curve represents the early period of a new service during which early adopters take-up the new service, and knowledge of the new service spreads. The middle (steep) portion of the curve indicates the period of acceleration during which mass adoption of the new service occurs. The right-hand portion of the curve indicates when the market has reached its saturation point and the rate of growth of uptake of the service slows and eventually declines to zero when every user who wishes to use the service has taken it up.
How soon the mass adoption and market saturation points are reached depends upon the parameters of the s-curve function. To determine the parameters to be used in the stylised examples NERA fitted s-curve functions to the uptake of mobile subscribers in general, pre-paid mobile subscribers and internet access. These estimations were completed using both the Gompertz and Logistic functions set out below:
Time
UptakeMarket Saturation
n/e/r/a Volumes Module
23
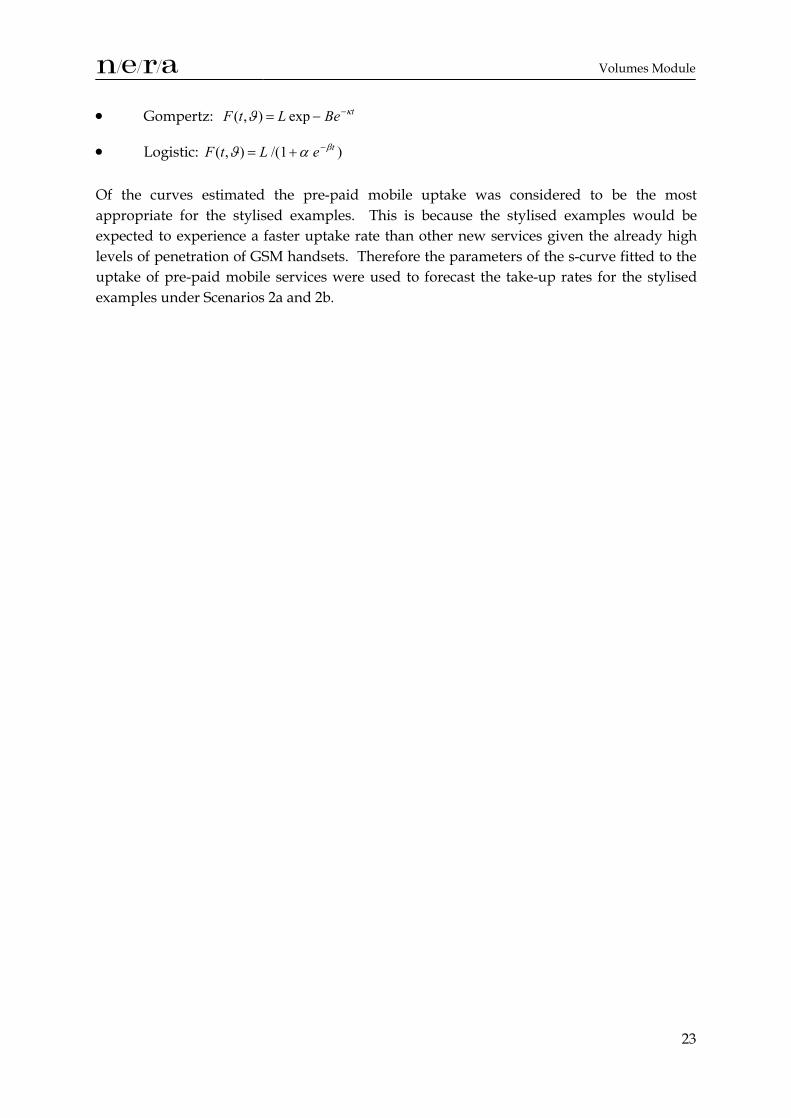
• Gompertz: tBeLtF κϑ −−= exp ),(
• Logistic: ) /(1),( teLtF βαϑ −+=
Of the curves estimated the pre-paid mobile uptake was considered to be the most appropriate for the stylised examples. This is because the stylised examples would be expected to experience a faster uptake rate than other new services given the already high levels of penetration of GSM handsets. Therefore the parameters of the s-curve fitted to the uptake of pre-paid mobile services were used to forecast the take-up rates for the stylised examples under Scenarios 2a and 2b.
n/e/r/a Cost Module
24
7. COST MODULE
7.1. Data Sources
Following the preparation of a detailed data request, a number of respondents provided NERA with cost information relevant for low power GSM equipment. This included requests for the following information to help determine the equipment capacity requirements for Scenarios 2a and 2b:
• Unit equipment costs;
• Equipment capacity assumptions;
• Operating costs expressed as a percentage of unit equipment cost;
• Equipment price trends; and
• Asset lives.
During the interview process with interested parties, NERA also received a range of views about low power GSM systems which could be reflected in the modelling assumptions.
All information provided by respondents, either in their response to the data request or during interviews, was assessed to establish its reasonableness.
7.2. Assumptions
7.2.1. Inputs from Volumes Module
The following annual outputs from the Volumes module are used as inputs in the Cost module:
• Average number of users per organisation;
• Total number of organisations taking up the low power GSM service; and
• Total volume of incoming and outgoing minutes.
7.2.2. Determining BTS requirements
A number of steps were taken to convert total traffic minutes per organisation into a required number of traffic capacity BTSs:
• Total annual traffic volumes were converted into total daily BTS minutes per user;
• A proportion of this was assumed to be busy hour traffic;
n/e/r/a Cost Module
25
• Total busy hour minutes per user was divided by 60 to convert minutes per user into erlangs per user; and
• The required number of traffic or capacity BTSs was derived on the basis of knowledge of the maximum number of transmitter sites per organisation and the maximum erlang capacity limits for different sizes of BTSs (measured by the number of TRXs).
7.2.3. Determining Coverage BTS requirements
For each stylised example, NERA has assumed that there will be slightly differing coverage requirements in terms of numbers of:
• Multi-storey buildings;
• Square metres of multi-storey floor space;
• Floors;
• Low rise buildings;
• Low rise floor space;
• Square metres of open space;
• Square metres of front entrance coverage; and
• Square metres of rear entrance coverage.
Applying a generic figure to each size parameter for each type of application determines the total surface area to be covered by BTS deployments internally and externally (if applicable). The coverage area for a BTS will vary depending on its location inside or outside an organisation. Many respondents provided information on BTS ranges for both internal and external use. NERA used an average of these figures in its model. The total number of coverage BTSs can then be determined once an average coverage area for an organisation and BTS are determined.
7.2.4. Capital Costs
A price trend, capturing expected changes in equipment prices, and a nominal inflation trend was applied to the starting figure for unit costs for BTSs and IP switches.
7.2.5. System Replacement
Several respondents provided views on the expected asset life of the low power systems, after which new equipment would be installed.
n/e/r/a Cost Module
26
7.2.6. Operating Costs
The operating costs were derived using ratios of operating costs to equipment purchase costs which were provided by a number of respondents to NERA’s data request. These use the required asset base to drive operating costs in the first year. In subsequent years, a nominal inflation rate is applied to the operating cost figure derived in the first year.
7.2.7. Call Completion Costs
For the stylised examples under Scenario 2a and 2b, which involve the provision of public off-site calling (e.g. Universities and Hotels), the model captures the costs of completing calls from low power networks on:
• fixed networks;
• wide-area mobile networks; and
• international networks.
In factoring these costs into the model, BT’s wholesale price list and the Competition Commission report on terminating calls from fixed and mobile networks was utilised. Prices were obtained for the period 2001/02 for the following services:
• Fixed call termination;
• Single tandem interconnection;
• Double tandem interconnection;
• IDD fixed network termination;
• IDD mobile network termination; and
• Mobile termination.
Using BT’s Current Cost Financial Statements for the Businesses and Activities 2003 and 2002, prices for the first five services were weighted by BT’s annual traffic totals to obtain average prices across all time periods. Oftel’s Market information on international traffic by route for 2001/02 was then used to weight the IDD termination prices so as to obtain a weighted average pence per minute rate for terminating traffic internationally on either a fixed or mobile network.
Fixed call termination prices were then forecast forward using an assumed price cap of RPI-10%. Similarly, single tandem, double tandem and the weighted IDD prices were forecast forward using the tandem layer basket price cap of RPI-13%.
n/e/r/a Cost Module
27
In the case of mobile network charges, these prices were obtained from the Competition Commission report on terminating calls from fixed and mobile networks and were forecast forward using the mobile termination caps.
7.2.8. PBX Replacement
According to some respondents, the installation of ‘soft’ switches in low power GSM networks could also support PBX functionality which some existing organisations in the stylised examples already employ. As the purpose of the modelling exercise is to measure the incremental costs and benefits, this would suggest the possibility of double counting the cost of PBX functionality. In the light of this, the model can be flexed to exclude the annual costs of existing PBX equipment from the total costs of installing and running new low power GSM networks, depending on the stylised example being modelled.
7.2.9. Annual System Costs per Organisation
Annual costs are determined by:
• Cost of capital, which is applied to the NBV of system assets on a year on year basis;
• Depreciation, which is derived using straight line depreciation; and
• Operating costs.
n/e/r/a Reporting Modules
28
8. REPORTING MODULES
The revenues, producer surplus, consumer surplus and results modules take information from the processing modules (i.e. prices, volumes, and cost modules) to derive the benefits stream arising under each of the scenarios.
8.1. Revenues Module
The revenues module uses information from the prices and volumes modules to calculate total revenues generated under each scenario.
In the case of public use of the spectrum, the revenues will be measured as the revenues generated from selling the service. In the case of private use of the spectrum, for example the stylised examples of Campus Corporates, Retailers, Large Corporates and SME Corporates, the revenues will be derived based on the amount saved from using the spectrum rather than an alternative medium of communication (e.g. substitution from wide-area GSM to local-area GSM). To derive the cost savings it is necessary to forecast forward the price that would have been paid if the on-site low power GSM networks were not available.
8.2. Producer Surplus Module
The producer surplus module uses information from the revenues and total cost modules to identify the producer surplus gain from the provision of the service under consideration. Producer surplus is measured as (derived) revenues minus total costs (operating and capital costs).
8.3. Consumer Surplus Module
The consumer surplus module uses information from the prices and volumes modules to identify the consumer surplus gain from consuming the services under consideration.
Consumer surplus is measured as the benefits private consumers derive from consuming the service less the amount they have paid for the service. Consumer surplus will be measured for public uses of the spectrum and for those private uses which do not involve substitution of traffic away from existing services. When private use of the spectrum involves substitution of traffic away from another service the additional net private benefits will capture any additional consumer surplus.
8.4. Results Module
The results module uses information from the producer and consumer surplus modules to identify the present value of the benefits streams under the different scenarios as follows:
n/e/r/a Reporting Modules
29
• For Scenario 1, the net benefits stream consists of the consumer and producer surpluses from the use of the spectrum by the wide-area GSM operators from 2004/5 to 2009/10, followed by the use of the spectrum for wide-area 3G services from 2010/11 to 2014/15.
• For Scenario 2a, the net benefits stream is the consumer and producer surpluses from the different stylised examples from 2004/5 to 2014/15. Any stylised examples which do not result in a positive benefits stream are assumed not to occur and therefore are excluded from the net benefits calculation, as, in the long run, loss making services would not be provided.
• For Scenario 2b, the net benefits stream is the consumer and producer surpluses from the different stylised examples from 2004/5 to 2009/10, followed by the use of the spectrum for wide-area 3G services from 2010/11 to 2014/15. As with Scenario 2a, any stylised examples which do not result in a positive benefits stream are assumed not to occur and therefore are excluded from the net benefits calculation.
• For Scenario 3, the net benefits stream is the consumer and producer surpluses from the use of the spectrum for wide-area 3G services from 2010/11 to 2014/15. It is assumed, as discussed in section 3.5 above, that reserving this spectrum for testing and development purposes will not generate a stream of incremental or quantifiable private benefits. However, this use may generate social benefits which Ofcom may wish to consider in its wider regulatory impact analysis.
The present value calculation discounts the benefits stream with an appropriate cost of capital. For public sector uses of the spectrum (e.g. the Health Authorities) a cost of capital of 5.5% is used. This was obtained from the Government Green Book. For private sector service provider uses of the spectrum (e.g. use of the spectrum by wide-area operators or the universities stylised example) a cost of capital of 17% is used. This is the average of the existing GSM operators’ costs of capital, as reported in the Competition Commission report on terminating charges from fixed and mobile networks. For other private sector uses of the spectrum (e.g. private provision of low power networks by Large Corporates) a cost of capital of 10% is used13.
13 NERA investigated cost of capital rates for large corporate organisations. A figure of 10% was identified as a reasonable estimate of the cost of capital faced by such organisations.
n/e/r/a Results
30
9. RESULTS
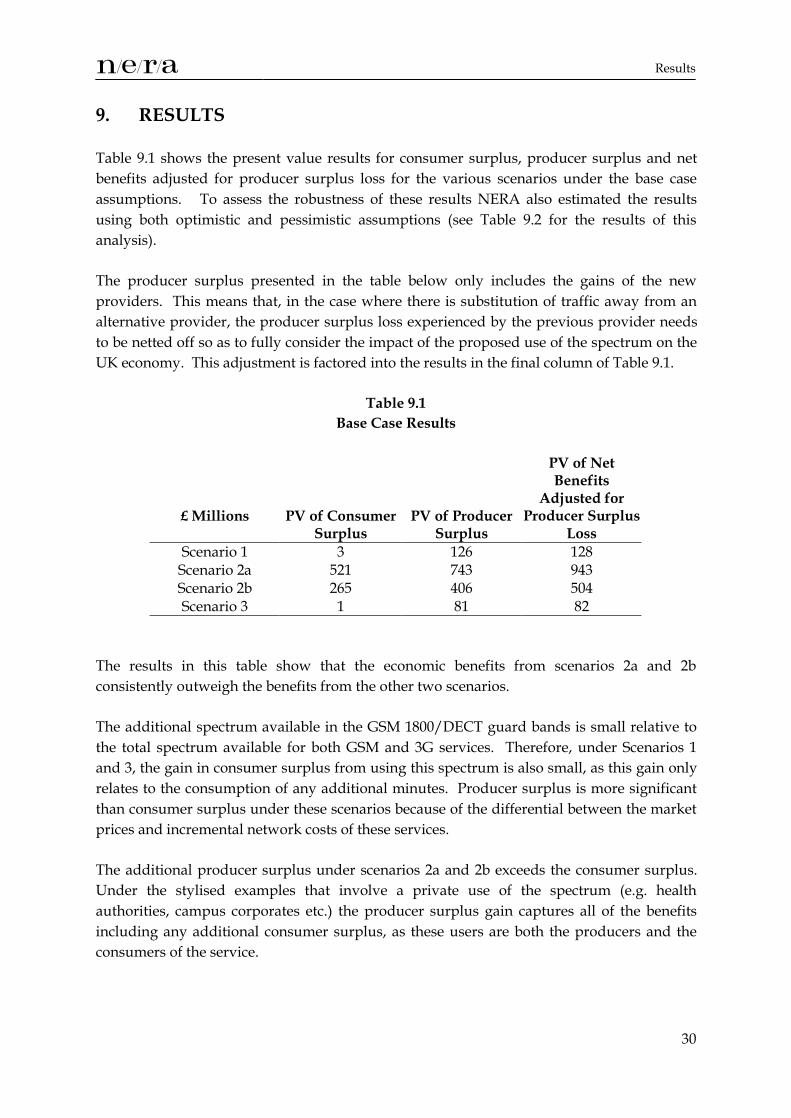
Table 9.1 shows the present value results for consumer surplus, producer surplus and net benefits adjusted for producer surplus loss for the various scenarios under the base case assumptions. To assess the robustness of these results NERA also estimated the results using both optimistic and pessimistic assumptions (see Table 9.2 for the results of this analysis).
The producer surplus presented in the table below only includes the gains of the new providers. This means that, in the case where there is substitution of traffic away from an alternative provider, the producer surplus loss experienced by the previous provider needs to be netted off so as to fully consider the impact of the proposed use of the spectrum on the UK economy. This adjustment is factored into the results in the final column of Table 9.1.
Table 9.1 Base Case Results
£ Millions
PV of Consumer Surplus
PV of Producer Surplus
PV of Net Benefits
Adjusted for Producer Surplus
Loss Scenario 1 3 126 128 Scenario 2a 521 743 943 Scenario 2b 265 406 504 Scenario 3 1 81 82
The results in this table show that the economic benefits from scenarios 2a and 2b consistently outweigh the benefits from the other two scenarios.
The additional spectrum available in the GSM 1800/DECT guard bands is small relative to the total spectrum available for both GSM and 3G services. Therefore, under Scenarios 1 and 3, the gain in consumer surplus from using this spectrum is also small, as this gain only relates to the consumption of any additional minutes. Producer surplus is more significant than consumer surplus under these scenarios because of the differential between the market prices and incremental network costs of these services.
The additional producer surplus under scenarios 2a and 2b exceeds the consumer surplus. Under the stylised examples that involve a private use of the spectrum (e.g. health authorities, campus corporates etc.) the producer surplus gain captures all of the benefits including any additional consumer surplus, as these users are both the producers and the consumers of the service.
n/e/r/a Results
31
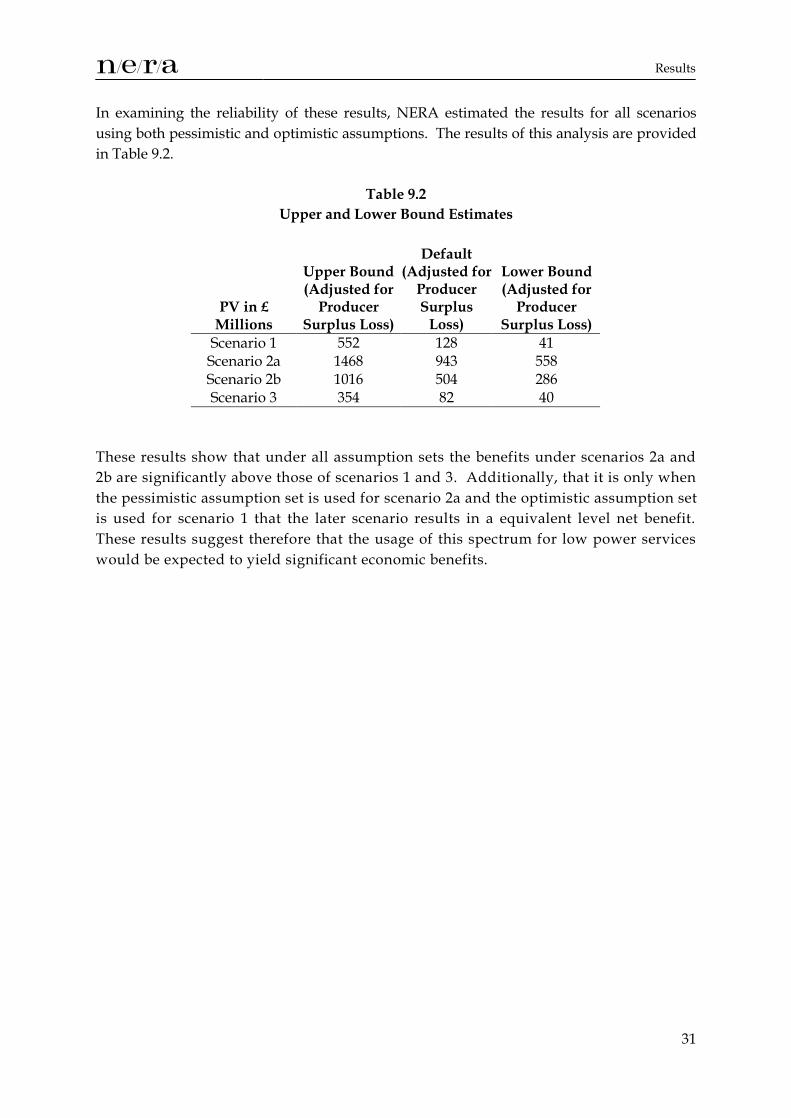
In examining the reliability of these results, NERA estimated the results for all scenarios using both pessimistic and optimistic assumptions. The results of this analysis are provided in Table 9.2.
Table 9.2 Upper and Lower Bound Estimates
PV in £ Millions
Upper Bound (Adjusted for
Producer Surplus Loss)
Default (Adjusted for
Producer Surplus
Loss)
Lower Bound (Adjusted for
Producer Surplus Loss)
Scenario 1 552 128 41 Scenario 2a 1468 943 558 Scenario 2b 1016 504 286 Scenario 3 354 82 40
These results show that under all assumption sets the benefits under scenarios 2a and 2b are significantly above those of scenarios 1 and 3. Additionally, that it is only when the pessimistic assumption set is used for scenario 2a and the optimistic assumption set is used for scenario 1 that the later scenario results in a equivalent level net benefit. These results suggest therefore that the usage of this spectrum for low power services would be expected to yield significant economic benefits.


