Embed Size (px)
Citation preview
JOURNAL OF RAMAN SPECTROSCOPYJ. Raman Spectrosc. 2006; 37: 1346–1353Published online 24 May 2006 in Wiley InterScience (www.interscience.wiley.com). DOI: 10.1002/jrs.1544
Vibrational characterization of poly(1-methylpyrrole-co-squaric acid) and poly(1-dodecylpyrrole-co-squaricacid) by enhanced Raman spectroscopy
Antonio Carlos Sant’Ana, Leonardo Jose Amaral de Siqueira, Paulo Sergio Santos andMarcia Laudelina Arruda Temperini∗
Departamento de Quımica Fundamental, Instituto de Quımica, Universidade de Sao Paulo, CP 26.077, CEP 05513-870, Sao Paulo, Brazil
Received 17 October 2005; Accepted 17 February 2006
Poly(1-methylpyrrole-co-squaric acid) (PMPS) and poly(1-dodecylpyrrole-co-squaric acid) (PDPS), copoly-mers of the class of polysquaraines, were synthesized and their structure determined by UV-VIS-NIR,resonance Raman and surface-enhanced Raman scattering (SERS) and electron paramagnetic resonance(EPR) spectroscopies. The spectroscopic results led to a structure different from that proposed in theliterature, having radical units localized in the protonated squarate moieties and polypyrrole dication-likesegments. The resonance Raman profiles indicate the presence of two chromospheres that are consistentwith the electronic data. The Raman assignment was supported by density functional theory (DFT)calculations. Copyright 2006 John Wiley & Sons, Ltd.
KEYWORDS: polysquaraine; resonance Raman; squaric acid; 1-substituted pyrrole
INTRODUCTION
Conducting polymers display many potential applications,generally related to their conductivities and optical prop-erties. Among these materials, polypyrrole is the mostrepresentative because of its properties such as remarkablechemical and thermal stabilities, as well as the straightfor-ward monitoring of its degree of polymerization and doping.Such characteristics make it suitable to be used in a widerange of applications, such as electrochemical sensors1 pho-toelectrochemical devices2 and modified electrodes in solarcells.3
To achieve better control of the physical and chemicalproperties of conducting polymers, the synthesis of copoly-mers has attracted great research interest. Donor–acceptorcopolymers with a low optical band gap and a high intrinsicelectrical conductivity were obtained using squaraine dyes(molecular species obtained from a condensation reactionbetween squaric acid and organic molecules bearing oneor more electron donating moieties4 as building blocks),owing to their high conjugation and characteristic chargeseparation. The conducting copolymers so obtained, namedpolysquaraines, present outstanding optical properties.5 – 7
ŁCorrespondence to: Marcia Laudelina Arruda Temperini,Departamento de Quımica Fundamental, Instituto de Quımica,Universidade de Sao Paulo, CP 26.077, CEP 05513-870, SaoPaulo, Brazil. E-mail: [email protected]
In fact, squaraines are ideal molecules for the synthe-sis of conducting conjugated copolymers because of theirhighly delocalized electronic structures, with the presenceof an acceptor moiety in between two donor moieties(donor–acceptor–donor). In addition, squaraines are poten-tial nonlinear optical materials8 displaying substantial sol-vatochromism. Squaraines also stand out for the presencein their optical spectra of very intense charge-transfer bandsthat extend to the near-infrared region, which explains whythey are known as infrared dyes.9 Another source of interestin the study of squaraines comes from their photoconduc-tive behavior, which has been explored in the context ofxerography.4 It is now well known that in the solid statesquaraine molecules are packed in stacks, the intermolecu-lar interactions within the stacks giving rise to very broadabsorption bands that extend over the entire optical spectrumdown to the near-infrared.10 In fact, for some squaraines it hasbeen shown that even in relatively diluted solutions aggre-gates are formed, with substantial changes in the electronicspectrum.11
More recently, Havinga et al.12 synthesized copolymersfrom squaric acid, obtaining materials with small bandgaps and photoconductive properties. Brocks and Tol13
calculated small band gap values for polysquaraines formedfrom squaric acid and molecules bearing groups suchas phenyl, vinyl and amine. Later on Lynch et al.14 andChenthamarakshan et al.15 prepared polysquaraines from
Copyright 2006 John Wiley & Sons, Ltd.
Vibrational characterization of PMPS and PDPS 1347
squaric acid and substituted pyrroles, obtaining conductingpolymers with small optical band gaps and high thermalstabilities. However, in all such previous investigations onpolysquaraines, the focus was not on the detailed structuralcharacterization of such materials. In the present paper, ouraim is the structural characterization of two copolymers, i.e.poly(1-methylpyrrole-co-squaric acid) (PMPS) and poly(1-dodecylpyrrole-co-squaric acid) (PDPS) by means of UV-VIS-NIR, resonance Raman and surface-enhanced Ramanscattering (SERS) and electron paramagnetic resonance(EPR) spectroscopies. The squaraine formed by squarateand pyrrole moieties was used as a molecular model forthe calculation of its vibrational wavenumbers by densityfunctional theory (DFT), which was used as support for theassignment of the polymer wavenumbers.
EXPERIMENTAL
Chemicals and synthesesSquaric acid (Sigma Chemical) and all other reagents(Aldrich) were used without further purification. Deionizedwater and analytical grade chemicals were used for allprepared solutions. The gold rod used as the workingelectrode was 99.99% pure polycrystalline material. Thesynthesis of K2Sq was carried out by the reaction, in aqueousmedium, of H2Sq with KOH in stoichiometric proportion.
Syntheses of polysquaraines15
The synthesis of PMPS was done using 5 mmol of1-methylpyrrole and 5 mmol of squaric acid, dissolved in10 ml of benzene and 20 ml of 1-butanol, under nitrogenatmosphere, stirring and refluxing for 24 h with azeotropicremoval of water. The dark blue mixture obtained was fil-tered, and the solid obtained was washed with benzene andmethanol and dried.
The synthesis of PDPS was analogous, using 5 mmol of1-dodecylpyrrole and 5 mmol of squaric acid, and the darkblue solid was washed with chloroform and acetone anddried.
The 1-dodecylpyrrole derivative was synthesized byan alkylation reaction via charge-transfer catalysis:16 Fivemilliliters of 50% sodium hydroxide aqueous solutionwas added to a solution of 10 mmol of pyrrole, 11 mmolof 1-bromodocecyl and 1 mmol of tetrabutylammoniumbromide in 10 ml of dichloromethane, with external cooling.The mixture was stirred and refluxed for 20 h and thendiluted with water and extracted with dichloromethane.The extracted fraction in the organic phase was washedwith 2 mol l�1 of HCl aqueous solution, water and saturatedbrine, and dried with MgSO4. The solvent was removed invacuum and the resultant brown liquid was distilled andpurified in a chromatographic column (hexane/ethylacetate,9 : 1). 1H NMR (300 MHz, TMS, CDCl3) υ: 0.88 (tap, 3H); 1.25(sl, 20 H); 3.85 (tap, 2H); 6.12 (t, 2H, J D 2.1 Hz); 6.63 (t, 2H,J D 2.1 Hz).
SERS proceduresThe in situ SERS spectra were obtained from a gold elec-trode surface exposed to an acetonitrile working solutionof ca 0.01% M of the PDPS soluble fraction and 10�1 mol l�1
tetraethylammonium chloride as electrolyte. The referenceelectrode was Ag/AgCl (saturated KCl solution). All poten-tials quoted in this work are given with reference to thisreference electrode. The SERS activation of the gold electrodewas performed by oxidation–reduction cycles with 1.5 mAoxidation peak current, using 0.1 mol l�1 KCl aqueous elec-trolyte solution. After the activation procedure, the cell andthe electrode were washed thoroughly and the working solu-tion was introduced. Then the SERS spectra were obtainedat different applied potentials.
InstrumentationThe following Raman spectrometers were used: (1) ARenishaw, model System 3000, with an Olympus BTH-2 microscope, using 50ð objective lens (laser spot 10 µm)and a charge coupled device (CCD) detector, with spectralresolution of 2 cm�1. The exciting radiations were the632.8 nm line of a Spectra Physics He–Ne laser, model 127,and the 514.5 nm line of an Omnichrome laser, model 543R-AP-A01; (2) A Bruker FT-Raman, model RFS100, with the1064 nm line of a Nd : YAG laser as exciting radiation anda Ge detector. The UV-VIS-NIR spectra were acquired on aShimadzu model UV-3101PC spectrometer.
The in situ electrochemical experiments were carried outusing an EG&G potentiostat-galvanostat PAR 263 (PrincetonApplied Research). The thermogravimetric analysis wascarried out on a Shimadzu model TGA-50 apparatus with asynthetic air flux of 50 ml min�1 and a heating rate of 20 °Cmin�1. The NMR spectra were acquired on a Varian INOVA300 MHz instrument. The elemental data were obtained ina Perkin-Elmer elemental analyzer CHN, model 2400. TheEPR data were obtained in a Bruker EMX instrument, modelER-200, operating in X-band frequency, with the samplesat room temperature. DPPH (1,1-diphenyl-2-picrylhydrazil)was used for frequency calibration (g D 2.0036).
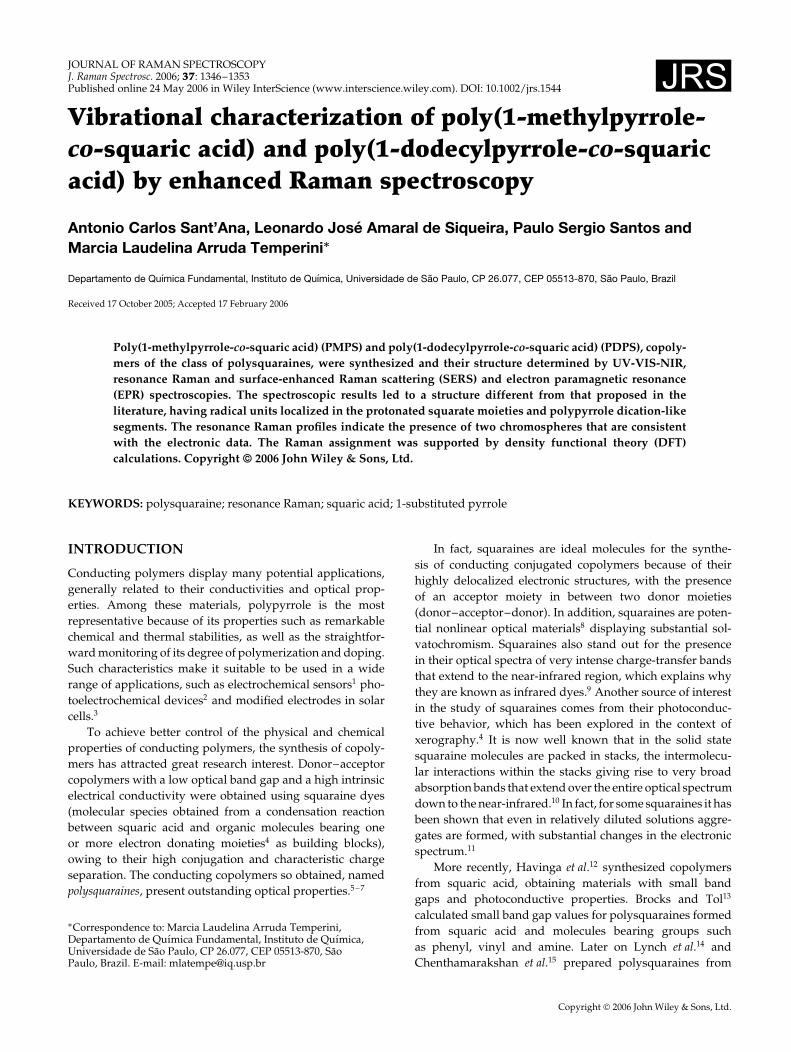
Computational detailsThe protonated bis(1-methylpyrrol-2-yl)squaraine (Fig. 1)was used as a molecular model for PMPS to obtain thevibrational wavenumbers, which were used as a guide forthe assignment of the bands in the polymer Raman spectra.Equilibrium geometry and vibrational wavenumbers of sucha squaraine model were obtained by using the DFT methodwith the B3LYP functional and basis set function 6–31G(d)from the Gaussian 03 package.17 Calculated wavenumbervalues were not corrected, and the assignment of vibrationalmodes was obtained by visual inspection of displacementvectors. DFT calculations were performed for two protonatedsquaraine models, i.e. trans and cis, to see the function of apossible rotation of the pyrrole rings.
Copyright 2006 John Wiley & Sons, Ltd. J. Raman Spectrosc. 2006; 37: 1346–1353
1348 A. C. Sant’Ana et al.
Figure 1. Squaraine used in the DFT calculation as model forthe polymers.
RESULTS AND DISCUSSION
In the syntheses of PMPS and PDPS polysquaraines, thepolymerization routes employed lead to polymers in whichthe proposed repetitive units are the squarate and the pyrrolegroups.15 In the present study the polymers, as-synthesized(form A, Scheme 1), were characterized in the solid state.
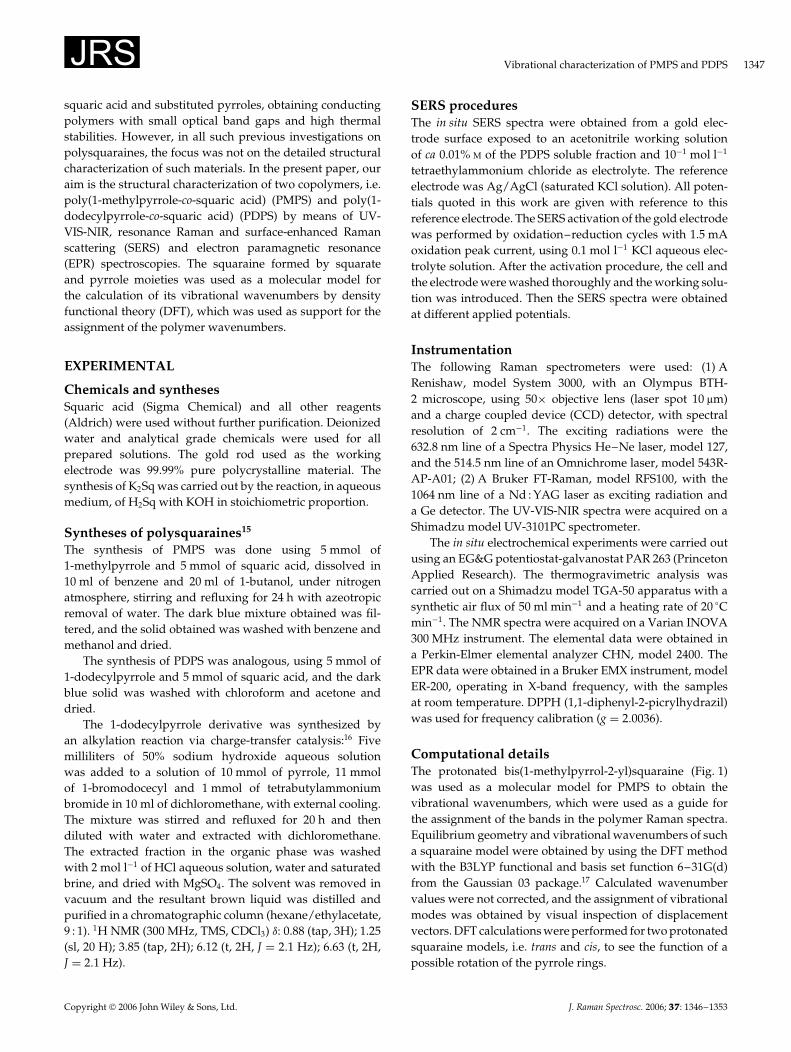
The CHN elemental analyses of the polymers werecarried out, and the results agreed with the theoretical valueswhen a water molecule was added to the repetitive unit(Table 1). In order to verify the nature of polymer–waterinteraction, the thermal behavior of the polymers wasinvestigated (Fig. 2). For the PMPS polymer the first mass lossoccurs at around 50 °C, while the PDPS polymer has thermalstability up to ca 180 °C. The CHN elemental analyses of thepolymers were repeated after heating the samples at 100 °Cunder reduced pressure (10�2 Torr). Comparing the CHNvalues after and before heating, the substantial differences forPMPS indicate its decomposition, while for PDPS the smallchanges suggest that the water molecules are incorporatedin the polymer structure and cannot be released without thepolymer degradation. Using these data one can postulate thatthe oxygen atom of the squarate moiety bearing a negativecharge undergoes protonation by the water molecule whenexposed to air, leaving the hydroxide as the counter-ion. Therepetitive unit proposed is presented as form B in Scheme 1.
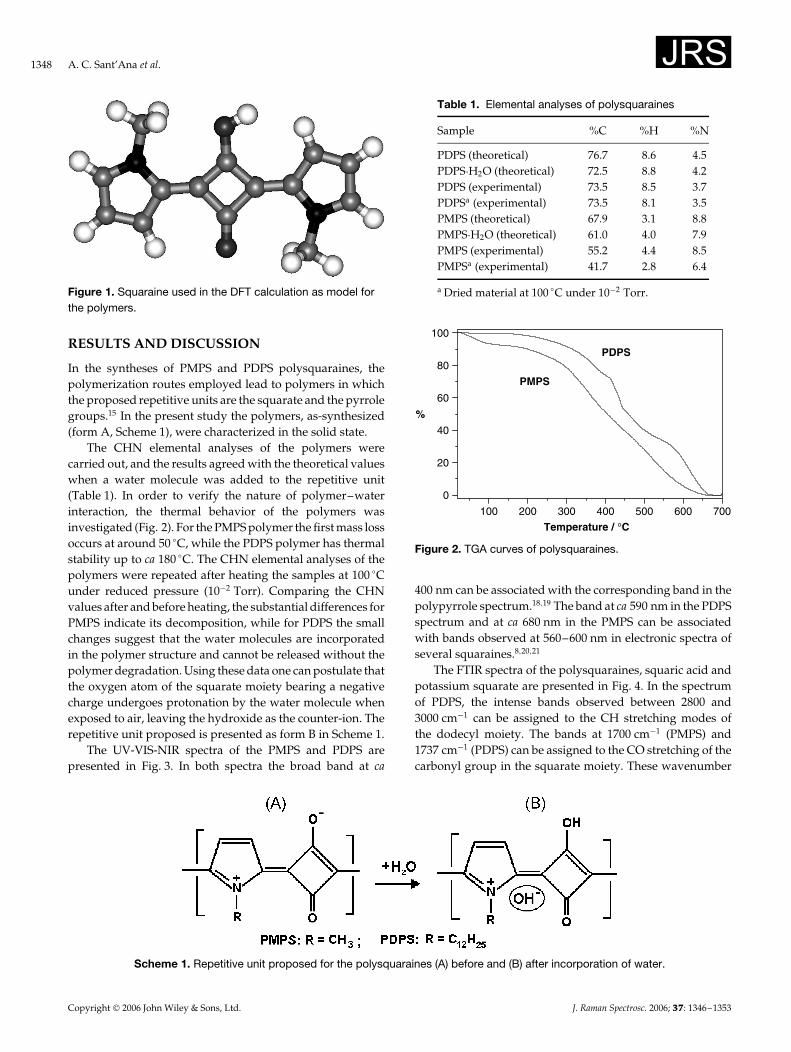
The UV-VIS-NIR spectra of the PMPS and PDPS arepresented in Fig. 3. In both spectra the broad band at ca
Table 1. Elemental analyses of polysquaraines
Sample %C %H %N
PDPS (theoretical) 76.7 8.6 4.5PDPSÐH2O (theoretical) 72.5 8.8 4.2PDPS (experimental) 73.5 8.5 3.7PDPSa (experimental) 73.5 8.1 3.5PMPS (theoretical) 67.9 3.1 8.8PMPSÐH2O (theoretical) 61.0 4.0 7.9PMPS (experimental) 55.2 4.4 8.5PMPSa (experimental) 41.7 2.8 6.4
a Dried material at 100 °C under 10�2 Torr.
100 200 300 400 500 600 700
0
20
40
60
80
100
Temperature / °C
PDPS
%
PMPS
Figure 2. TGA curves of polysquaraines.
400 nm can be associated with the corresponding band in thepolypyrrole spectrum.18,19 The band at ca 590 nm in the PDPSspectrum and at ca 680 nm in the PMPS can be associatedwith bands observed at 560–600 nm in electronic spectra ofseveral squaraines.8,20,21
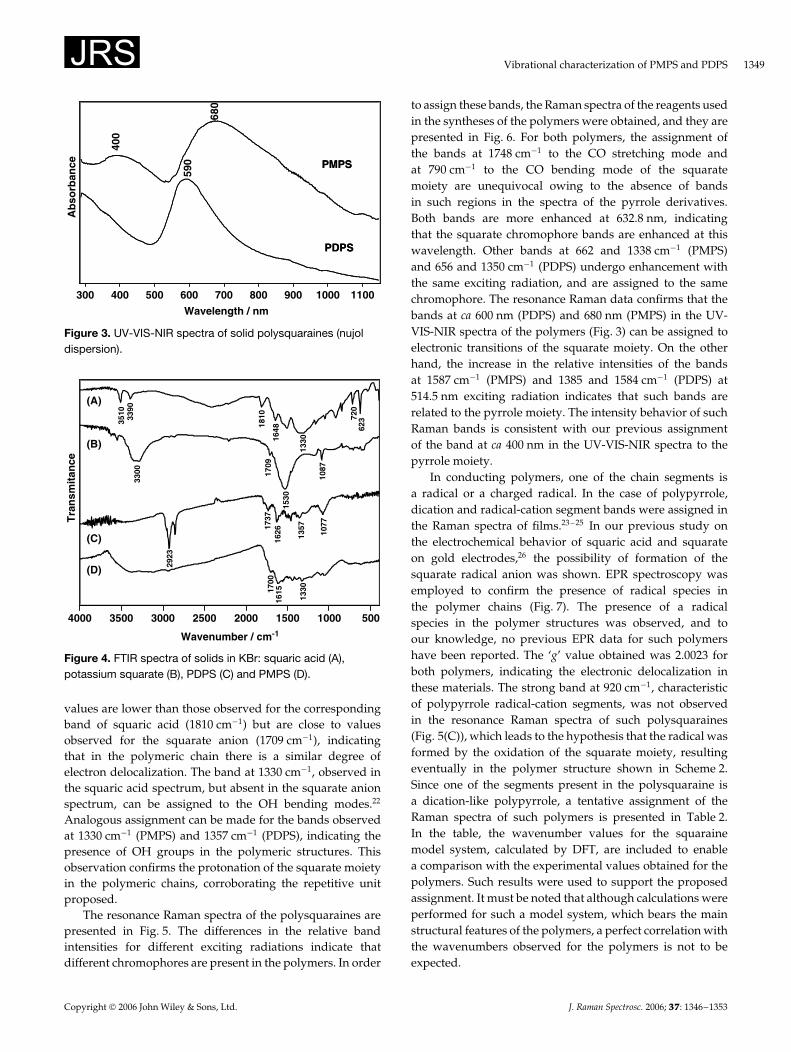
The FTIR spectra of the polysquaraines, squaric acid andpotassium squarate are presented in Fig. 4. In the spectrumof PDPS, the intense bands observed between 2800 and3000 cm�1 can be assigned to the CH stretching modes ofthe dodecyl moiety. The bands at 1700 cm�1 (PMPS) and1737 cm�1 (PDPS) can be assigned to the CO stretching of thecarbonyl group in the squarate moiety. These wavenumber
Scheme 1. Repetitive unit proposed for the polysquaraines (A) before and (B) after incorporation of water.
Copyright 2006 John Wiley & Sons, Ltd. J. Raman Spectrosc. 2006; 37: 1346–1353
Vibrational characterization of PMPS and PDPS 1349
300 400 500 600 700 800 900 1000 1100
400
680
590
Wavelength / nm
Ab
sorb
ance PMPS
PDPS
PMPS
PDPS
Figure 3. UV-VIS-NIR spectra of solid polysquaraines (nujoldispersion).
4000 3500 3000 2500 2000 1500 1000 500
Tra
nsm
itan
ce
3390
2923
3510
1615
133017
00
Wavenumber / cm-1
(a)
(b)
(c)
(d)
3390
2923
3510
1615
133017
00
(A)
(B)
(C)
(D)
623
1648
1626
1810
1330
1737
1087
1530
720
1357
1077
1709
3300
Figure 4. FTIR spectra of solids in KBr: squaric acid (A),potassium squarate (B), PDPS (C) and PMPS (D).
values are lower than those observed for the correspondingband of squaric acid (1810 cm�1) but are close to valuesobserved for the squarate anion (1709 cm�1), indicatingthat in the polymeric chain there is a similar degree ofelectron delocalization. The band at 1330 cm�1, observed inthe squaric acid spectrum, but absent in the squarate anionspectrum, can be assigned to the OH bending modes.22
Analogous assignment can be made for the bands observedat 1330 cm�1 (PMPS) and 1357 cm�1 (PDPS), indicating thepresence of OH groups in the polymeric structures. Thisobservation confirms the protonation of the squarate moietyin the polymeric chains, corroborating the repetitive unitproposed.
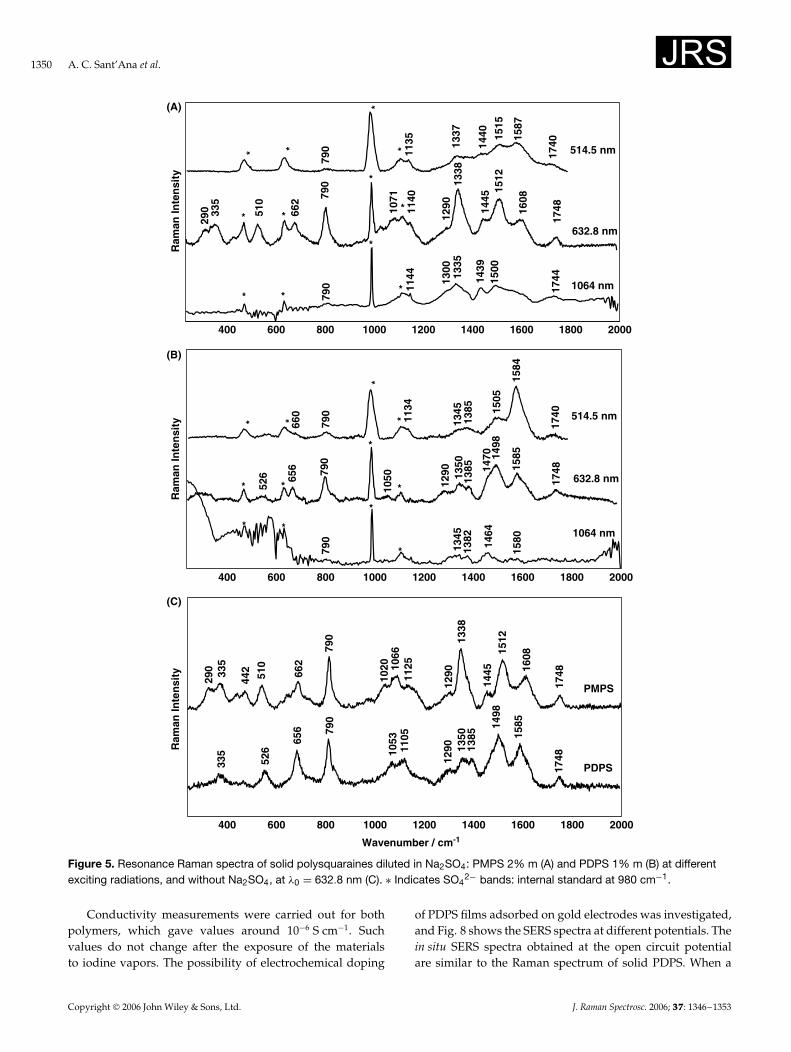
The resonance Raman spectra of the polysquaraines arepresented in Fig. 5. The differences in the relative bandintensities for different exciting radiations indicate thatdifferent chromophores are present in the polymers. In order
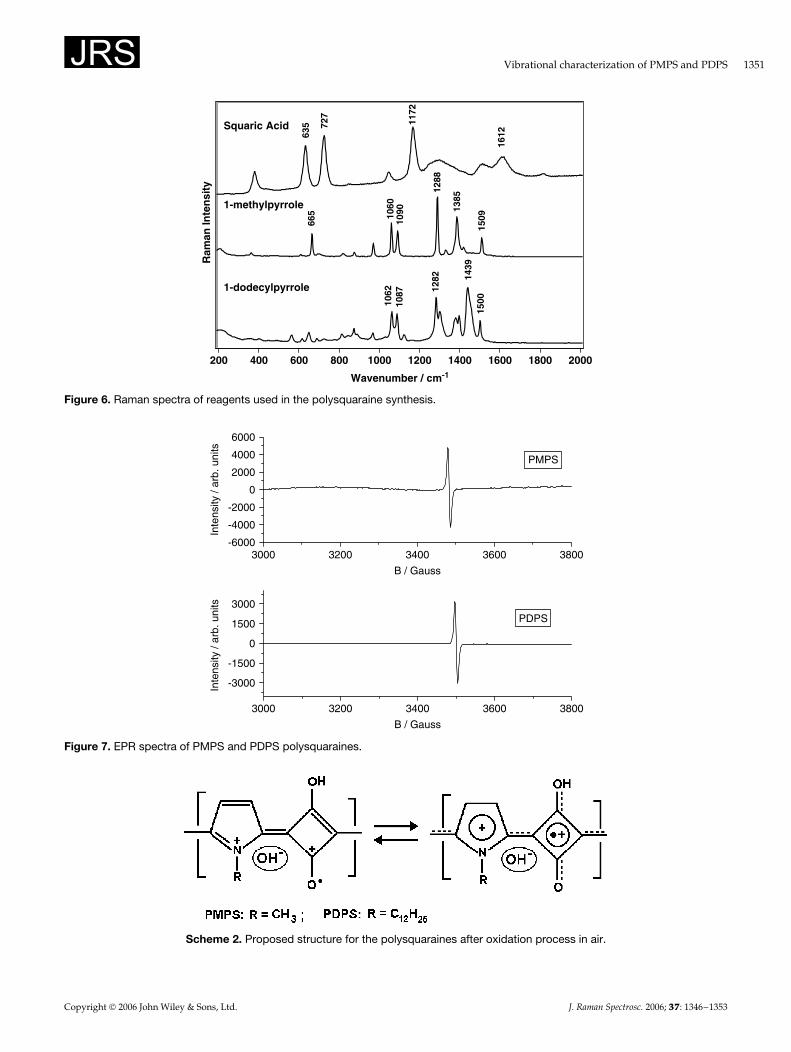
to assign these bands, the Raman spectra of the reagents usedin the syntheses of the polymers were obtained, and they arepresented in Fig. 6. For both polymers, the assignment ofthe bands at 1748 cm�1 to the CO stretching mode andat 790 cm�1 to the CO bending mode of the squaratemoiety are unequivocal owing to the absence of bandsin such regions in the spectra of the pyrrole derivatives.Both bands are more enhanced at 632.8 nm, indicatingthat the squarate chromophore bands are enhanced at thiswavelength. Other bands at 662 and 1338 cm�1 (PMPS)and 656 and 1350 cm�1 (PDPS) undergo enhancement withthe same exciting radiation, and are assigned to the samechromophore. The resonance Raman data confirms that thebands at ca 600 nm (PDPS) and 680 nm (PMPS) in the UV-VIS-NIR spectra of the polymers (Fig. 3) can be assigned toelectronic transitions of the squarate moiety. On the otherhand, the increase in the relative intensities of the bandsat 1587 cm�1 (PMPS) and 1385 and 1584 cm�1 (PDPS) at514.5 nm exciting radiation indicates that such bands arerelated to the pyrrole moiety. The intensity behavior of suchRaman bands is consistent with our previous assignmentof the band at ca 400 nm in the UV-VIS-NIR spectra to thepyrrole moiety.
In conducting polymers, one of the chain segments isa radical or a charged radical. In the case of polypyrrole,dication and radical-cation segment bands were assigned inthe Raman spectra of films.23 – 25 In our previous study onthe electrochemical behavior of squaric acid and squarateon gold electrodes,26 the possibility of formation of thesquarate radical anion was shown. EPR spectroscopy wasemployed to confirm the presence of radical species inthe polymer chains (Fig. 7). The presence of a radicalspecies in the polymer structures was observed, and toour knowledge, no previous EPR data for such polymershave been reported. The ‘g’ value obtained was 2.0023 forboth polymers, indicating the electronic delocalization inthese materials. The strong band at 920 cm�1, characteristicof polypyrrole radical-cation segments, was not observedin the resonance Raman spectra of such polysquaraines(Fig. 5(C)), which leads to the hypothesis that the radical wasformed by the oxidation of the squarate moiety, resultingeventually in the polymer structure shown in Scheme 2.Since one of the segments present in the polysquaraine isa dication-like polypyrrole, a tentative assignment of theRaman spectra of such polymers is presented in Table 2.In the table, the wavenumber values for the squarainemodel system, calculated by DFT, are included to enablea comparison with the experimental values obtained for thepolymers. Such results were used to support the proposedassignment. It must be noted that although calculations wereperformed for such a model system, which bears the mainstructural features of the polymers, a perfect correlation withthe wavenumbers observed for the polymers is not to beexpected.
Copyright 2006 John Wiley & Sons, Ltd. J. Raman Spectrosc. 2006; 37: 1346–1353
1350 A. C. Sant’Ana et al.
Ram
an In
ten
sity
Ram
an In
ten
sity
Ram
an In
ten
sity
(A)
400 600 800 1000 1200 1400 1600 1800 2000
400 600 800 1000 1200 1400 1600 1800 2000
400 600 800 1000 1200 1400 1600 1800 2000
1445
1071
1748
1500
510
*
*
790 13
37 1587
1744
1144
790
662
1135
1300 1335
1439
1608
1290
1740
790
335
*
1140
*
1515
151213
38
1440
* *
* *
*
*
*
*
514.5 nm
632.8 nm
1064 nm
290
1385
1050 17
48
1580
526
*
*
790
1345
1584
1470
790
656
1134
1345
1382 1464
1585
1290
1740
790
* *
1505
1498
1350
1385
* *
* *
*
*
*
*
514.5 nm
632.8 nm
1064 nm
660
(B)
Wavenumber / cm-1
PDPS
1053
1748
PMPS
510
662 10
66
790 13
38
1608
1498
110579
0
656
335
526 13
5013
85 1585
1290
174833
529
0
442
1125
1020
1512
1445
1290
(C)
Figure 5. Resonance Raman spectra of solid polysquaraines diluted in Na2SO4: PMPS 2% m (A) and PDPS 1% m (B) at differentexciting radiations, and without Na2SO4, at �0 D 632.8 nm (C). Ł Indicates SO4
2� bands: internal standard at 980 cm�1.
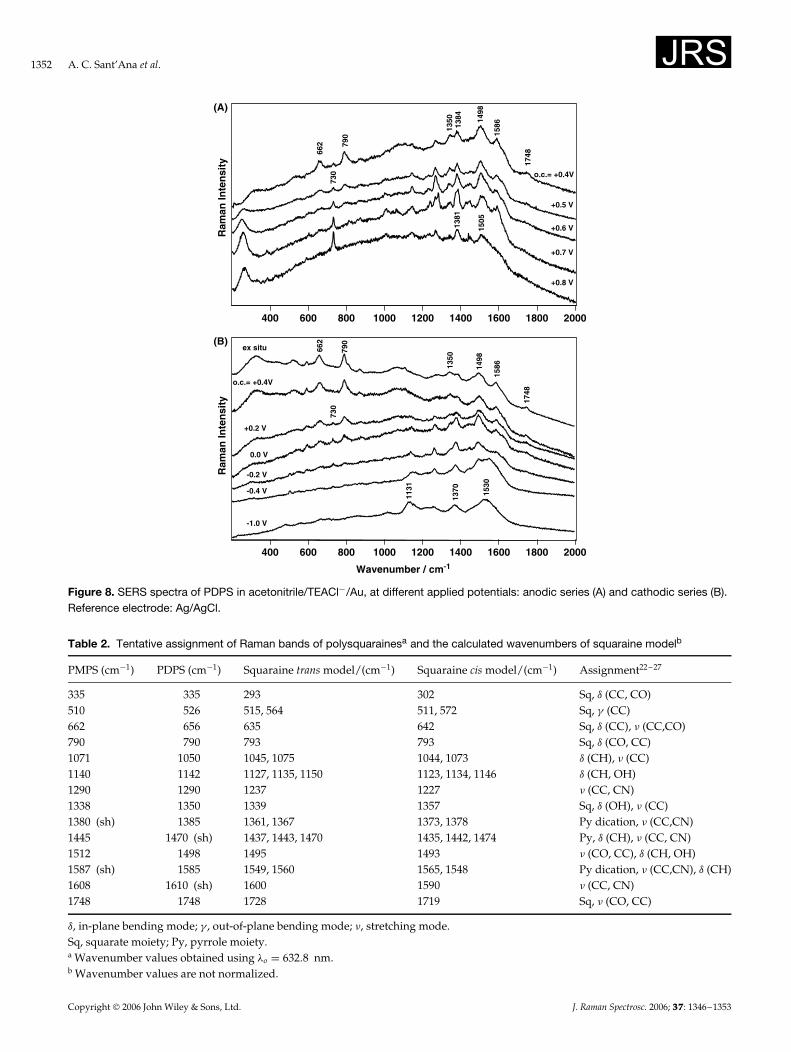
Conductivity measurements were carried out for bothpolymers, which gave values around 10�6 S cm�1. Suchvalues do not change after the exposure of the materialsto iodine vapors. The possibility of electrochemical doping
of PDPS films adsorbed on gold electrodes was investigated,and Fig. 8 shows the SERS spectra at different potentials. Thein situ SERS spectra obtained at the open circuit potentialare similar to the Raman spectrum of solid PDPS. When a
Copyright 2006 John Wiley & Sons, Ltd. J. Raman Spectrosc. 2006; 37: 1346–1353
Vibrational characterization of PMPS and PDPS 1351
Ram
an In
ten
sity
140012001000800600400200 1600 1800 2000
635 11
72
727
1439
1612
1288
1385
1509665 10
6010
90
1282
150010
6210
87
Squaric Acid
1-methylpyrrole
1-dodecylpyrrole
Wavenumber / cm-1
Figure 6. Raman spectra of reagents used in the polysquaraine synthesis.
3000 3200 3400 3600 3800
-3000
-1500
0
1500
3000
3000 3200 3400 3600 3800-6000
-4000
-2000
0
2000
4000
6000
Inte
nsity
/ ar
b. u
nits
B / Gauss
PDPS
Inte
nsity
/ ar
b. u
nits
B / Gauss
PMPS
Figure 7. EPR spectra of PMPS and PDPS polysquaraines.
Scheme 2. Proposed structure for the polysquaraines after oxidation process in air.
Copyright 2006 John Wiley & Sons, Ltd. J. Raman Spectrosc. 2006; 37: 1346–1353
1352 A. C. Sant’Ana et al.
400 600 800 1000 1200 1400 1600 1800 2000
400 600 800 1000 1200 1400 1600 1800 2000
Ram
an In
ten
sity
Ram
an In
ten
sity
790
662
+0.5 V
o.c.= +0.4V
+0.7 V
+0.8 V
1384
+0.6 V
1350
1505
730
1748
1586
1381
1498(A)
790
662
0.0 V
o.c.= +0.4V
-0.4 V
-1.0 V
1370
-0.2 V
1350
1530
730
1748
Wavenumber / cm-1
1586
1131
1498
ex situ
+0.2 V
(B)
Figure 8. SERS spectra of PDPS in acetonitrile/TEACl�/Au, at different applied potentials: anodic series (A) and cathodic series (B).Reference electrode: Ag/AgCl.
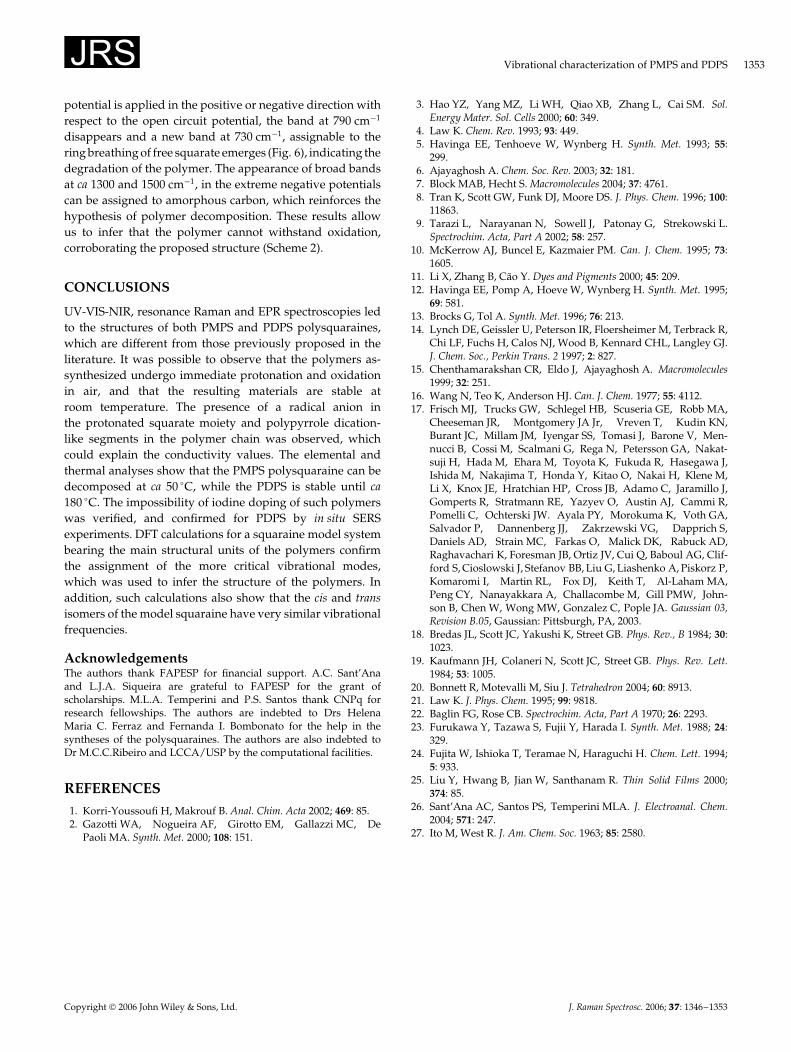
Table 2. Tentative assignment of Raman bands of polysquarainesa and the calculated wavenumbers of squaraine modelb
PMPS (cm�1) PDPS (cm�1) Squaraine trans model/(cm�1) Squaraine cis model/(cm�1) Assignment22 – 27
335 335 293 302 Sq, υ (CC, CO)510 526 515, 564 511, 572 Sq, � (CC)662 656 635 642 Sq, υ (CC), � (CC,CO)790 790 793 793 Sq, υ (CO, CC)1071 1050 1045, 1075 1044, 1073 υ (CH), � (CC)1140 1142 1127, 1135, 1150 1123, 1134, 1146 υ (CH, OH)1290 1290 1237 1227 � (CC, CN)1338 1350 1339 1357 Sq, υ (OH), � (CC)1380 (sh) 1385 1361, 1367 1373, 1378 Py dication, � (CC,CN)1445 1470 (sh) 1437, 1443, 1470 1435, 1442, 1474 Py, υ (CH), � (CC, CN)1512 1498 1495 1493 � (CO, CC), υ (CH, OH)1587 (sh) 1585 1549, 1560 1565, 1548 Py dication, � (CC,CN), υ (CH)1608 1610 (sh) 1600 1590 � (CC, CN)1748 1748 1728 1719 Sq, � (CO, CC)
υ, in-plane bending mode; � , out-of-plane bending mode; �, stretching mode.Sq, squarate moiety; Py, pyrrole moiety.a Wavenumber values obtained using �o D 632.8 nm.b Wavenumber values are not normalized.
Copyright 2006 John Wiley & Sons, Ltd. J. Raman Spectrosc. 2006; 37: 1346–1353
Vibrational characterization of PMPS and PDPS 1353
potential is applied in the positive or negative direction withrespect to the open circuit potential, the band at 790 cm�1
disappears and a new band at 730 cm�1, assignable to thering breathing of free squarate emerges (Fig. 6), indicating thedegradation of the polymer. The appearance of broad bandsat ca 1300 and 1500 cm�1, in the extreme negative potentialscan be assigned to amorphous carbon, which reinforces thehypothesis of polymer decomposition. These results allowus to infer that the polymer cannot withstand oxidation,corroborating the proposed structure (Scheme 2).
CONCLUSIONS
UV-VIS-NIR, resonance Raman and EPR spectroscopies ledto the structures of both PMPS and PDPS polysquaraines,which are different from those previously proposed in theliterature. It was possible to observe that the polymers as-synthesized undergo immediate protonation and oxidationin air, and that the resulting materials are stable atroom temperature. The presence of a radical anion inthe protonated squarate moiety and polypyrrole dication-like segments in the polymer chain was observed, whichcould explain the conductivity values. The elemental andthermal analyses show that the PMPS polysquaraine can bedecomposed at ca 50 °C, while the PDPS is stable until ca180 °C. The impossibility of iodine doping of such polymerswas verified, and confirmed for PDPS by in situ SERSexperiments. DFT calculations for a squaraine model systembearing the main structural units of the polymers confirmthe assignment of the more critical vibrational modes,which was used to infer the structure of the polymers. Inaddition, such calculations also show that the cis and transisomers of the model squaraine have very similar vibrationalfrequencies.
AcknowledgementsThe authors thank FAPESP for financial support. A.C. Sant’Anaand L.J.A. Siqueira are grateful to FAPESP for the grant ofscholarships. M.L.A. Temperini and P.S. Santos thank CNPq forresearch fellowships. The authors are indebted to Drs HelenaMaria C. Ferraz and Fernanda I. Bombonato for the help in thesyntheses of the polysquaraines. The authors are also indebted toDr M.C.C.Ribeiro and LCCA/USP by the computational facilities.
REFERENCES1. Korri-Youssoufi H, Makrouf B. Anal. Chim. Acta 2002; 469: 85.2. Gazotti WA, Nogueira AF, Girotto EM, Gallazzi MC, De
Paoli MA. Synth. Met. 2000; 108: 151.
3. Hao YZ, Yang MZ, Li WH, Qiao XB, Zhang L, Cai SM. Sol.Energy Mater. Sol. Cells 2000; 60: 349.
4. Law K. Chem. Rev. 1993; 93: 449.5. Havinga EE, Tenhoeve W, Wynberg H. Synth. Met. 1993; 55:
299.6. Ajayaghosh A. Chem. Soc. Rev. 2003; 32: 181.7. Block MAB, Hecht S. Macromolecules 2004; 37: 4761.8. Tran K, Scott GW, Funk DJ, Moore DS. J. Phys. Chem. 1996; 100:
11863.9. Tarazi L, Narayanan N, Sowell J, Patonay G, Strekowski L.
Spectrochim. Acta, Part A 2002; 58: 257.10. McKerrow AJ, Buncel E, Kazmaier PM. Can. J. Chem. 1995; 73:
1605.11. Li X, Zhang B, Cao Y. Dyes and Pigments 2000; 45: 209.12. Havinga EE, Pomp A, Hoeve W, Wynberg H. Synth. Met. 1995;
69: 581.13. Brocks G, Tol A. Synth. Met. 1996; 76: 213.14. Lynch DE, Geissler U, Peterson IR, Floersheimer M, Terbrack R,
Chi LF, Fuchs H, Calos NJ, Wood B, Kennard CHL, Langley GJ.J. Chem. Soc., Perkin Trans. 2 1997; 2: 827.
15. Chenthamarakshan CR, Eldo J, Ajayaghosh A. Macromolecules1999; 32: 251.
16. Wang N, Teo K, Anderson HJ. Can. J. Chem. 1977; 55: 4112.17. Frisch MJ, Trucks GW, Schlegel HB, Scuseria GE, Robb MA,
Cheeseman JR, Montgomery JA Jr, Vreven T, Kudin KN,Burant JC, Millam JM, Iyengar SS, Tomasi J, Barone V, Men-nucci B, Cossi M, Scalmani G, Rega N, Petersson GA, Nakat-suji H, Hada M, Ehara M, Toyota K, Fukuda R, Hasegawa J,Ishida M, Nakajima T, Honda Y, Kitao O, Nakai H, Klene M,Li X, Knox JE, Hratchian HP, Cross JB, Adamo C, Jaramillo J,Gomperts R, Stratmann RE, Yazyev O, Austin AJ, Cammi R,Pomelli C, Ochterski JW. Ayala PY, Morokuma K, Voth GA,Salvador P, Dannenberg JJ, Zakrzewski VG, Dapprich S,Daniels AD, Strain MC, Farkas O, Malick DK, Rabuck AD,Raghavachari K, Foresman JB, Ortiz JV, Cui Q, Baboul AG, Clif-ford S, Cioslowski J, Stefanov BB, Liu G, Liashenko A, Piskorz P,Komaromi I, Martin RL, Fox DJ, Keith T, Al-Laham MA,Peng CY, Nanayakkara A, Challacombe M, Gill PMW, John-son B, Chen W, Wong MW, Gonzalez C, Pople JA. Gaussian 03,Revision B.05, Gaussian: Pittsburgh, PA, 2003.
18. Bredas JL, Scott JC, Yakushi K, Street GB. Phys. Rev., B 1984; 30:1023.
19. Kaufmann JH, Colaneri N, Scott JC, Street GB. Phys. Rev. Lett.1984; 53: 1005.
20. Bonnett R, Motevalli M, Siu J. Tetrahedron 2004; 60: 8913.21. Law K. J. Phys. Chem. 1995; 99: 9818.22. Baglin FG, Rose CB. Spectrochim. Acta, Part A 1970; 26: 2293.23. Furukawa Y, Tazawa S, Fujii Y, Harada I. Synth. Met. 1988; 24:
329.24. Fujita W, Ishioka T, Teramae N, Haraguchi H. Chem. Lett. 1994;
5: 933.25. Liu Y, Hwang B, Jian W, Santhanam R. Thin Solid Films 2000;
374: 85.26. Sant’Ana AC, Santos PS, Temperini MLA. J. Electroanal. Chem.
2004; 571: 247.27. Ito M, West R. J. Am. Chem. Soc. 1963; 85: 2580.
Copyright 2006 John Wiley & Sons, Ltd. J. Raman Spectrosc. 2006; 37: 1346–1353


