Embed Size (px)
Citation preview

284 Adv. in Pet. Engg. I: Refining
11
Interpretation of Palaeoclimate, Relative SeaLevel and Scale of Stratigraphic Correlation
through Spatio-temporal Variationsof Depositional and Diagenetic
Environments: A Case StudyMU.RAMKUMAR1,2*, FRANZ T. FÜRSICH2 AND MATTHIAS ALBERTI2
ABSTRACT
Interpretations of palaeoclimate, relative sea level, depositional anddiagenetic conditions of ancient strata are routine tasks for sedimentologistsand hydrocarbon exploration professionals. In this paper, we present a casestudy to demonstrate how affirmatively different scales of stratigraphiccorrelation could be attempted based on documentation of spatio-temporalvariations of depositional and diagenetic environments. The Dhosa OoliteMember of the Chari Formation of the Kachchh Basin, western India,deposited under Oxfordian eustatic sea-level rise, is known for its ooidcontent, hardground surfaces and faunal composition. Based on these traitsand facies characteristics, traditionally it is correlated with global oolitepeak, documented in Madagascar and many European Jurassic sectionslocated at France, England, Poland, etc. In the Kachchh mainland, thismember shows extensive development of iron crusts, well cemented cap rockand reworked fauna, recognizable for over 100 kilometers in its strikedirection due to which it is considered to be a regional marker that couldfacilitate stratigraphic correlation not only in the Kachchh basin, but alsowith coeval strata of the adjacently located Jaisalmer Basin. Statisticalanalyses of geochemical and petrographic data of the Upper Callovian-Oxfordian strata of the Kachchh Basin, western India, in which the Dhosa
1 Department of Geology, Periyar University, Salem - 636 011, India.2 GeoZentrum Nordbayern, Fachgruppe PaläoUmwelt, Friedrich-Alexander-Universität
Erlangen-Nürnberg, D-91054 Erlangen, Germany*Corresponding author: E-mail: [email protected]

285Interpretation of Palaeoclimate, Relative Sea Level and...
Oolite Member is also a part, revealed that there are spatio-temporalvariations of depositional and diagenetic characteristics observable in terms ofunique variations in petrographic, mineralogical and geochemical compositionsbetween and within different stratigraphic units and sections under study.Distinct palaeoclimatic and environmental conditions prevalent during thedeposition of Dhosa Oolite Member, in terms of rise in sea-level, absence ofchemical weathering in the source area, cessation of siliciclastic influx mighthave promoted enhanced carbonate and ooid production and preservation. Whilethis distinct nature of DOM, as observable in lithological as well as geochemicalcharacteristics offer an unique potential to correlate the strata with coevaldeposits elsewhere, occurrences of omission surfaces, recycling events and spatio-temporal variations of diagenetic intensity, suggest that caution has to beexercised while correlating this member with coeval strata located elsewhere.
Key words: Fe-Ooid, Upper callovian-oxfordian, Spatio-temporal variations,Depositional environment, Diagenesis, Kachchh, India
INTRODUCTION
The ooids and oolitic rocks are of special interest to sedimentologists owing totheir specific conditions of formation (Tucker and Wright) and reservoirproperties, due to which they are considered to be most important as well ascontroversial in environmental modeling (Flügel, 1982). Despite decades ofresearch and excellent reviews on ooids (Land et al., 1979; Peryt, 1983), nosingle model or a combination of mechanisms could explain the origin of ooidsin geological record. The Dhosa Oolite Member (hereinafter referred as DOM)of the Chari Formation, Western Kachchh Basin (Fig. 1) of India, depositedduring Oxfordian (Table 1) under transgressive systems tract (Kulkarni andBorkar, 2000) is known for its ferruginous ooid-bearing carbonates. Occurrencesof ooids coeval with globally recorded oolite peak, condensed section and hardgrounds in this member were reported earlier (Singh, 1989; Fürsich andOschmann, 1993; Fürsich et al., 1991; 1992; 2001; 2004; 2005). Owing to itscondensed nature, occurrences of omission and hardground surfaces, mixedfauna typical of many biozones and resedimented nature of sediments,correlation of this member with regional and global equivalents is often foundto be complex and tenuous. In addition, there exists a gap in understanding itsconditions of origin and implications on palaeoenvironmental and climatologicalconditions, besides its relationship with global occurrences of oolite duringOxfordian. As the Jurassic deposits of the Kachchh Basin have been judged tobe the result of eustatic sea-level changes and have unique depositional featuresdifferent from that of adjacently located Jaisalmer Basin (Pandey et al., 2006;2009), understanding the conditions of origin of these ooid-bearing rocks gainsfurther importance. Lack of such information poses constraints on precisecorrelation of these deposits with counterparts elsewhere. A systematic studyof Callovian-Oxfordian deposits of the Chari Formation, in which the Dhosa

286 Adv. in Pet. Engg. I: Refining
Oolite Member (DOM) is a part, through documenting the structural, faunal,sedimentological, and geochemical characteristics was initiated recently.This paper discusses the spatio-temporal geochemical variations as observedfrom geographically separated exposures to constrain on depositional anddiagenetic environments. Objective of this paper is to draw implications onthe potential and/or validity of regional and basinal scale correlation of thestrata, particularly the DOM, based on the environmental conditions prevalent.
MATERIALS AND METHODS
Systematic field survey was conducted in the Kachchh Basin to log availableexposures of the DOM for lithofacies variation, contact relationships, faunaloccurrence and association and sedimentary structures etc. Among variousexposures examined, three sections located in Lodai (LDS), Fakirwari (FWS)and Jumara (JMS) and an isolated exposure located at Jara are discussed inthis paper. From these well preserved and geographically separated sections atotal of 48 rock samples were collected (20 from FWS, 17 from LDS and 9 fromJMS and 2 from an outcrop located in Jara dome). Fig. 2 shows the lithologs ofthese sections and litho and biostratigraphic positions of the samples. Thesamples were subjected to major and trace elemental analyses through XRF
Table 1: Litho- and biostratigraphic framework of the upper Middle and lower UpperJurassic of Kachchh Mainland (Biostratigraphy after Krishna et al., 1996; Albertiet al., 2011; as well as John H. Callomon, pers. comm., 2000).

287Interpretation of Palaeoclimate, Relative Sea Level and...
method following standard laboratory procedures (Kramar, 1997). With thehelp of elemental analyzer (C-S analyzer), total carbon, inorganic carbonand organic carbon were determined. Following the method presented in(Murray and Leinen, 1993, 1996; Ramkumar et al., 2005), excess barium(BaExcess) was computed. The geochemical data were examined in terms ofaverage geochemical compositions of stratigraphic units, variation betweensections studied and through statistical correlation, cluster analysis andDiscriminant Function Analysis (DFA). Thin sections were prepared for allthese samples and were studied under polarizing microscope to generateddata on modal composition. Statistical analyses were performed followingstandard procedures (Johnson and Wichern, 1992). The database for thisanalysis consisted of quantitative measurements of 28 geochemical elements,computed ratio of Baexcess, and modal composition of the rocks, accountingfor 10 parameters, totaling 39 variables. These quantitative data were found
Fig. 1: Location of the study area and studied sections (modified after Fürsich et al., 2004,2005).

288 Adv. in Pet. Engg. I: Refining
Fig. 2: Sections with litho- and biostratigraphic framework as well as position of samples.A) Lodai section; B) Fakirwari section; C) Jumara section; D) Jara exposure; Tr.Transversarium zone; Div. Divisum zone.

289Interpretation of Palaeoclimate, Relative Sea Level and...
to be portraying non-gaussian nature, which would eventually thwart anyfruitful statistical analyses (Ramkumar, 2001). The measurement units ofthese variables are also different; in which case, transformation of the dataprior to statistical analyses is necessary (Sahu, 1995; Nayak et al., 1997;Ramkumar, 2001; Ramkumar and Guha, 2000; Ramkumar et al., 2010). Theentire dataset was standardized with a transform function z=(x-m)/s (wherex is the value of the random variable; m is mean of the random variable; s isstandard deviation; z is standardized variable) following the instructions ofDavis (1973) and Clark and Hosking (1986). Contrary to the widely scatteredraw data, the standardized values have an acute range with a mean value ofzero and standard deviation of 1. For statistical analyses of this study, onlythe standardized dataset is utilized. Statistical analyses were performedwith STATISTICA software. The interpretations made through theseanalyses were then discussed in the context of spatial (sections studied) andtemporal (stratigraphic units under study) variations in depositional anddiagenetic history of the rocks to constrain on the voracity of correlatingthe DOM with Oxfordian global oolite peak.
Lithology
The oldest stratigraphic unit in the studied sections, the Gypsiferous ShaleMember is composed of bioclastic very fine silt with interlayers of bioclasticarenaceous packstone and rare arenaceous peloidal bioclastic packstone. Theseinterlayers appear without any break in sedimentation and differ in terms ofhigher proportion of bioclasts of bivalves and echinoderms. In addition, quartzand mud rich layers are also found within the bioclastic very fine silt. In theLodai section, this member is represented by very finely laminated, marly/argillaceous very fine silt. The matrix is micritic, organic rich and shows calcitesparitization.
The next younger stratigraphic unit, the Dhosa Sandstone Member consistsof marly/argillaceous coarse silt – fine sand with varying abundance of bioclasts.The micritic and argillaceous matrix is present only in intergranular porosity.Only a dark colored insoluble residue could be observed as matrix in most ofthe samples owing to the compaction and dissolution. However, the organicmatter rich micritic matrix forms about 25% of the rock.
The DOM is exposed for about 100 km along its strike direction in theKachchh mainland. It is easily recognizable in the field by its red colored, wellcemented cap rock and massive amorphous iron crusts at top. The DOM restsover the Dhosa Sandstone Member with a distinct erosional/non-depositionalsurface. This surface is a chronological boundary between Callovian-Oxfordian(Fürsich et al., 2001) and also a transgressive systems tract surface (Pandey etal., 2009). In the LDS, the DOM comprises bioclastic wacke-pack-floatstones,bioclastic oolitic wacke-pack-floatstones, calcareous siltstones, bioclastic-ooliticsiltstones and stromatolitic oolitic siltstones, almost distributed evenly. Peloidal

290 Adv. in Pet. Engg. I: Refining
and arenaceous varieties are comparatively abundant in LDS than the FWS.Towards top, this member shows a gradual shift from carbonates toarenaceous varieties and finally into oolitic siltstone.
In the FWS, the DOM is predominantly a bioclastic and oolitic wacke-pack-floatstone with varying amounts of quartz silt. The variability ofsiliciclastic admixture results in arenaceous varieties of these carbonatepetrographic types and bioclastic and oolitic siltstones. High variation in theabundance of ooids produces cyclic layers with ooid-rich, scarce and absentnature. At top, the bioclastic and oolitic limestones are capped by stromatolites.In addition to mud, ooid, bioclast and quartz silt, many intraclasts of calcareoussiltstone and bioclastic wacke-packstone, rich in organic matter and or ironoxide, etc., are also found trapped between stromatolites. The bioclasts andooids in these intraclasts show features of iron-mineral replacement, probablyby siderite, marcasite and ankerite (indicated by X-Ray diffraction pattern)while the bioclasts in the host rock typically show low-magnesian calcitic nature.
In JMS, the DOM shows the development of predominantly oolitic wacke/packstone, oolitic siltstone and oncoidal oolitic bioclastic wacke/packstone inthe order of decreasing abundance.
The youngest stratigraphic unit of the studied sections, the KatrolFormation is represented by friable, argillaceous/marly very fine silt in FWS.It grades to bioclastic siltstone and arenaceous bioclastic floatstone in LDS. InJMS, it shows the presence of dusty brown colored, alternate thin, parallel andeven bedded bioclastic siltstone and argillaceous siltstone.
Spatio-temporal Variations of Geochemical Composition
Mean values of the geochemical data, tabulated according to stratigraphic units(members, formation), stratigraphic sections (LDS, FWS, JMS) and all thesamples (hereinafter referred as ATS) are listed in Table 2. Comprehensiveobservation on these data together with lithological information presented inprevious section and lithological succession (Fig. 2) leads to the surmise thatthe geochemical composition of the rocks under study is strongly influenced bythe lithology as could be observed elsewhere. However, there are subtledifferences in geochemical compositions between various stratigraphic membersand sections disguised within this lithological control as detailed herein.
The JMS ranks least in detrital elements Si, Ti, and Zr along with K andBa, when compared with other sections and mean values of ATS (Table 2). Thedetrital elements such as Si and Ti, Al, Na, K, Ba and Zr are highly enriched inFWS, followed by LDS. These differences in detrital and associated elementsmay indicate proximity of FWS and LDS to source than JMS. However, as theJMS exposes only DOM and basal beds of Katrol Formation, this observationof “distal” nature of JMS should be viewed under the context of predominant

291Interpretation of Palaeoclimate, Relative Sea Level and...
Ta
ble
2: G
eoch
emic
al c
hara
cter
isti
cs o
f the
stu
died
sec
tion
s an
d st
rati
grap
hic
mem
bers
12
34
56
78
910
1112
1314
1516
1718
Si
17.2
817
.32
20.1
013
.62
25.4
112
.46
8.10
13.6
627
.49
18.3
013
.03
10.5
415
.76
29.1
526
.39
21.6
028
.79
6.15
Ti
0.30
0.26
40.
378
0.23
20.
610.
210.
190.
210.
420.
380.
190.
180.
260.
500.
370.
170.
740.
13A
l3.
342.
574.
292.
916.
702.
321.
912.
464.
035.
162.
172.
042.
924.
083.
991.
349.
352.
87F
e7.
075.
845.
1711
.79
4.03
7.84
8.24
8.03
3.43
12.3
15.
637.
3810
.04
3.44
3.42
17.9
43.
8617
.94
Mn
0.06
0.06
0.06
0.09
0.06
0.07
0.06
0.08
0.04
0.06
0.06
0.07
0.10
0.03
0.04
0.14
0.02
0.06
Mg
0.58
0.48
0.57
0.72
0.67
0.56
0.60
0.54
0.48
0.82
0.49
0.51
0.63
0.46
0.50
0.47
0.77
1.04
Ca
14.3
717
.29
13.5
58.
936.
6819
.52
24.9
617
.75
8.54
2.30
21.8
023
.35
10.4
87.
149.
483.
790.
333.
52N
a0.
190.
113
0.29
60.
122
0.38
0.13
0.08
0.15
0.29
0.16
0.12
0.17
0.14
0.12
0.40
0.05
0.32
0.06
K1.
000.
921.
270.
754
1.74
0.64
0.32
0.74
1.55
1.37
0.73
0.54
0.77
1.57
1.54
0.56
2.44
0.71
P0.
180.
100.
190.
240.
240.
210.
150.
230.
100.
100.
130.
230.
260.
020.
150.
100.
030.
16B
a24
627
227
514
828
619
412
721
137
126
323
116
017
636
637
538
541
748
Ce
9685
105
9113
887
5795
125
6166
8411
216
010
112
129
17C
o28
2026
3517
3135
3016
4420
3827
1517
4724
62C
r12
695
107
209
107
127
144
128
9220
810
111
516
193
9140
126
375
Cu
2930
2138
2727
2029
2646
2821
2536
1928
1784
La
3323
3447
6025
1629
3455
1719
4442
2825
6461
Ni
6144
5273
4363
6365
4889
3167
6477
2967
8410
7P
b15
1218
1822
115
1319
2811
916
1920
442
26S
r16
615
519
512
819
215
517
214
920
512
714
219
913
221
020
284
162
115
V18
215
516
924
513
720
522
919
912
120
918
419
124
186
145
8122
126
2Y
3527
3743
5834
2836
3330
2334
4639
2814
3633
Zn
188
202
114
319
9318
521
617
776
505
157
143
273
6286
1300
129
483
Zr
239
258
269
174
320
154
129
160
436
273
164
122
197
574
345
119
530
93T
h18
1918
1821
1211
1230
2312
820
4421
742
12
1: M
ean
of a
ll t
he 4
8 sa
mpl
es; 2
: Mea
n of
all
the
sam
ples
of L
odai
Sec
tion
; 3: M
ean
of a
ll t
he s
ampl
es o
f F
akir
war
i Sec
tion
; 4: M
ean
of a
ll t
hesa
mpl
es o
f Jh
umar
a S
ecti
on; 5
: M
ean
of a
ll t
he s
ampl
es o
f G
ypsi
fero
us S
hal
e M
embe
r fr
om a
ll t
he s
ecti
ons;
6: M
ean
of a
ll t
he
sam
ples
of
Dh
osa
Ool
ite
Mem
ber
from
all
th
e se
ctio
ns;
7:
Mea
n o
f al
l th
e sa
mpl
es o
f “m
atri
x” p
orti
on o
f th
e D
OM
fro
m a
ll t
he s
ampl
es f
rom
all
the
sect
ions
; 8: M
ean
of a
ll t
he
sam
ples
of
DO
M o
ther
th
an m
atri
x po
rtio
n of
all
the
sec
tion
s; 9
: M
ean
of a
ll t
he s
ampl
es o
f D
hosa
San
dsto
neM
embe
r fr
om a
ll t
he
sect
ion
; 10:
Mea
n o
f al
l the
sam
ples
of
Kat
rol F
orm
atio
n fr
om a
ll t
he s
ecti
ons;
11:
Mea
n of
all
the
sam
ples
of D
OM
at
Lod
ai S
ecti
on; 1
2: M
ean
of a
ll t
he s
ampl
es o
f DO
M a
t F
akir
war
i Sec
tion
; 13:
Mea
n of
all
the
sam
ples
of D
OM
at
Jhum
ara
Sec
tion
; 14:
Mea
nof
all
th
e sa
mpl
es o
f D
hosa
San
dsto
ne M
embe
r at
Lod
ai S
ecti
on;
15:
Mea
n of
all
the
sam
ples
of
Dho
sa S
ands
ton
e M
embe
r at
Fak
irw
ari
sect
ion;
16:
Mea
n of
all
the
sam
ples
of
Kat
rol
For
mat
ion
at
Lod
ai S
ecti
on;
17:
Mea
n of
all
the
sam
ples
of
Kat
rol
For
mat
ion
at F
akir
war
iS
ecti
on; 1
8: M
ean
of a
ll t
he
sam
ples
of K
atro
l For
mat
ion
at
Jhum
ara
Sec
tion
. Si,
Ti,
Al,
Fe,
Mn,
Mg,
Ca,
Na,
K a
nd
P a
re e
xpre
ssed
in w
eigh
tpe
rcen
tage
s. B
a, C
e, C
o, C
r, C
u, L
a, N
i, P
b, S
r, V
, Y, Z
n, Z
r, T
h ar
e ex
pres
sed
in p
pm.

292 Adv. in Pet. Engg. I: Refining
carbonate deposits there than geographic location with reference to detritalsource. Even if predomination of carbonates is considered, movement ofshoreline farthest from JMS during the deposition of DOM carbonates andthus, “not so distal” nature of FWS and LDS, all through their stratigraphicrecords (from upper part of Gypsiferous Shale Member to basal part ofKatrol Formation) could be discerned.
Based on the values of Si, Na, K and Al, it is inferred that while quartzwas the dominant detrital sediment during the deposition of DhosaSandstone Member, aluminosilicates, in the form of clay were the dominantdetrital sediments during the deposition of Gypsiferous Shale Member. TheKatrol Formation ranks between these two while the DOM shows leastsiliciclastic influx, either in the form of quartz and or aluminosilicates. WithinDOM, there seem to be a disparity of geochemical composition, depositionalconditions between the “matrix” and oolitic limestone/siltstone parts. It isinteresting to note that the oolite portion records significant detritalsignature (Si, Al, Ti, K, Ba), while the matrix portion shows domination ofcarbonate as well as diagenetic incorporation of Fe and other relatedelements such as Cr, V, Zn, signifying variations in depositional anddiagenetic conditions between these two parts of DOM. Very high enrichmentof Fe and depletion of Ca in Katrol Formation are significant. It is importantto note that Sr is more or less equally distributed in all the sections, may beas a result of its principal association with carbonates and/or diageneticleaching. Occurrences of higher amounts of Fe, Mn, V and Zn along withhighly depleted nature of Sr in JMS than other two sections suggest leachingof Ca and Sr with simultaneous incorporation of Fe, Mn and Zn, probably inmeteoric phreatic zone and more intensively at JMS than other two sections.
The element Zr, an indicator of terrigenous influx, shows highly depletednature in DOM in FWS section, while the Dhosa Sandstone Member, followedby Katrol Formation in FWS shows highest enrichment. During the depositionof Dhosa Sandstone Member, the LDS received higher siliciclastic influx asindicated by enrichment of Si, Ti and Zr, followed by FWS and JMS. However,during the deposition of Katrol Formation, FWS received higher siliciclasticinflux as indicated by Si, Al, Ti, Zr, followed by LDS and JMS. Thesefluctuations may indicate changes in principal loci of sediment influx duringvarious time spans, perhaps as a function of sea-level variations and resultantgeographic positional variation of confluence point (if it were by a pointsource of sediment influx).
Relationships Within and Between Stratigraphic Members andSections
From the correlation matrix of studied parameters (geochemical elementalcompositions and modal counts of petrographic components) of ATS (Table3), a general grouping in terms of strongly positive correlations between

293Interpretation of Palaeoclimate, Relative Sea Level and...
Ta
ble
3: C
orre
lati
on m
atri
x of
all
th
e sa
mpl
es (
n: 4
8)
SiTi
AlFe
Mn
Mg
CaN
aK
PS
CO
rgC
Inor
gBa
CeCo
CrCu
LaN
iP
bSr
VY
ZnZr
ThBa
exce
ssG
ra-M
at-C
em-
Qua
-B
ioc-
Pel
-O
oid
Lith
o-Ce
m.
Neo
.in
sri
xen
trt
zla
stoi
dcl
ast
Spar
Spar
Si1.
00Ti
0.77
1.00
Al0.
690.
921.
00Fe
–0.4
7–0
.30
–0.2
11.
00Mn
–0.4
3–0
.41
–0.3
90.
121.
00Mg
–0.1
30.
210.
400.
51–0
.11
1.00
Ca–0
.71
–0.6
9–0
.71
–0.1
30.
44–0
.26
1.00
Na0.
690.
610.
60–0
.45
–0.2
5–0
.13
–0.4
71.
00K
0.92
0.79
0.79
–0.4
6–0
.41
–0.0
5–0
.72
0.74
1.00
P–0
.48
–0.4
0–0
.37
0.12
0.35
–0.0
30.
35–0
.20
–0.4
61.
00S
–0.0
90.
050.
020.
29–0
.04
0.10
–0.2
00.
00–0
.07
0.04
1.00
C Org
–0.0
60.
250.
330.
47–0
.11
0.47
–0.3
60.
260.
050.
100.
211.
00C In
org
–0.2
9–0
.47
–0.4
6–0
.21
0.22
–0.3
70.
53–0
.30
–0.2
60.
10–0
.12
–0.3
41.
00Ba
0.88
0.56
0.50
–0.4
8–0
.35
–0.2
9–0
.55
0.62
0.86
–0.4
5–0
.18
–0.2
0–0
.13
1.00
Ce0.
170.
310.
16–0
.33
0.01
–0.1
0–0
.08
0.19
0.14
0.57
0.00
–0.0
3–0
.14
0.10
1.00
COrg
–0.4
2–0
.19
–0.0
70.
770.
010.
630.
06–0
.39
–0.3
90.
090.
280.
48–0
.11
–0.4
3–0
.34
1.00
Cr–0
.18
–0.0
10.
090.
59–0
.25
0.67
–0.2
4–0
.22
–0.1
10.
010.
290.
37–0
.25
–0.2
6–0
.21
0.61
1.00
Cu–0
.26
–0.0
60.
000.
650.
020.
47–0
.17
–0.2
8–0
.23
–0.0
30.
070.
39–0
.20
–0.3
6–0
.16
0.54
0.38
1.00
La0.
130.
390.
390.
15–0
.11
0.35
–0.4
90.
170.
230.
470.
250.
36–0
.38
0.00
0.65
0.05
0.32
0.18
1.00
Ni–0
.18
0.04
0.08
0.56
–0.2
00.
52–0
.10
–0.3
4–0
.19
0.05
0.19
0.42
–0.2
0–0
.23
–0.0
80.
780.
520.
350.
131.
00Pb
0.71
0.69
0.80
–0.2
3–0
.39
0.30
–0.7
20.
500.
80–0
.33
–0.0
50.
14–0
.44
0.56
0.12
–0.1
50.
27–0
.02
0.37
0.04
1.00
Sr0.
060.
11–0
.05
–0.3
90.
05–0
.17
0.22
0.12
0.01
0.32
0.07
–0.1
60.
080.
020.
48–0
.16
–0.1
3–0
.18
0.26
–0.2
0–0
.02
1.00
V–0
.44
–0.1
40.
010.
60–0
.13
0.65
0.02
–0.3
5–0
.39
0.04
0.19
0.39
–0.2
3–0
.49
–0.2
50.
560.
600.
340.
060.
46–0
.05
–0.2
81.
00Y
–0.2
00.
00–0
.05
0.02
0.26
0.07
0.08
–0.0
3–0
.18
0.82
0.13
0.15
–0.0
6–0
.31
0.75
0.00
0.06
0.04
0.73
0.06
–0.0
80.
45–0
.04
1.00
Zn–0
.22
–0.2
7–0
.20
0.55
0.34
0.34
–0.0
4–0
.38
–0.3
00.
080.
060.
04–0
.11
–0.2
0–0
.29
0.42
0.36
0.16
0.06
0.21
–0.0
9–0
.20
0.17
0.01
1.00
Zr0.
800.
860.
68–0
.34
–0.4
40.
03–0
.62
0.51
0.74
–0.4
9–0
.01
0.07
–0.4
00.
640.
33–0
.28
–0.0
3–0
.07
0.27
0.00
0.59
0.15
–0.2
7–0
.09
–0.2
71.
00Th
0.58
0.76
0.57
–0.2
2–0
.40
0.05
–0.5
90.
300.
53–0
.49
0.14
0.04
–0.4
00.
430.
31–0
.27
0.04
–0.0
10.
32–0
.01
0.48
0.18
–0.0
6–0
.10
–0.2
50.
851.
00Ba
exce
ss0.
830.
440.
38–0
.46
–0.3
1–0
.36
–0.4
80.
570.
80–0
.41
–0.2
0–0
.26
–0.0
60.
990.
05–0
.43
–0.2
8–0
.37
–0.0
7–0
.25
0.49
0.00
–0.5
1–0
.33
–0.1
70.
550.
341.
00Gr
ains
–0.0
6–0
.33
–0.3
20.
050.
06–0
.22
0.16
0.18
–0.0
7–0
.02
0.05
–0.0
60.
220.
14–0
.30
–0.0
50.
09–0
.17
–0.3
0–0
.30
–0.1
70.
010.
01–0
.24
0.09
–0.3
1–0
.31
0.21
1.00
Mat
rix0.
080.
360.
35–0
.04
–0.0
60.
23–0
.19
–0.1
60.
090.
01–0
.08
0.09
–0.2
4–0
.12
0.31
0.02
–0.0
80.
190.
330.
290.
19–0
.04
–0.0
20.
25–0
.08
0.33
0.33
–0.2
0–0
.99
1.00
Ceme
nt0.
130.
070.
03–0
.08
0.07
–0.1
9–0
.04
0.38
0.05
0.10
0.08
0.14
–0.0
90.
080.
01–0
.07
–0.2
3–0
.19
–0.0
6–0
.21
–0.0
80.
11–0
.27
–0.0
20.
100.
03–0
.07
0.08
0.22
–0.2
71.
00Qu
artz
0.86
0.44
0.31
–0.5
1–0
.37
–0.3
9–0
.45
0.54
0.71
–0.4
2–0
.16
–0.2
9–0
.08
0.83
0.11
–0.5
2–0
.24
–0.3
6–0
.14
–0.2
80.
450.
01–0
.51
–0.2
7–0
.29
0.61
0.39
0.83
0.19
–0.1
70.
131.
00Bi
oc-
–0.4
8–0
.32
–0.2
20.
290.
250.
230.
26–0
.18
–0.3
80.
120.
070.
230.
09–0
.47
–0.2
90.
290.
190.
32–0
.02
–0.0
7–0
.24
0.05
0.13
0.01
0.30
–0.3
9–0
.37
–0.4
60.
28–0
.28
0.11
–0.5
51.
00la
stPe
loid
–0.0
5–0
.10
–0.0
70.
220.
100.
13–0
.08
0.04
–0.1
10.
050.
010.
29–0
.14
–0.1
2–0
.07
0.13
0.09
0.40
–0.0
4–0
.13
–0.0
40.
110.
19–0
.02
0.07
–0.0
4–0
.03
–0.1
10.
14–0
.15
0.35
–0.0
10.
161.
00Oo
id–0
.59
–0.4
6–0
.47
0.36
0.09
–0.0
10.
40–0
.45
–0.5
90.
310.
16–0
.03
0.20
–0.4
5–0
.06
0.30
0.17
0.03
–0.0
80.
35–0
.48
–0.2
10.
450.
070.
02–0
.47
–0.2
4–0
.40
0.11
–0.1
3–0
.15
–0.4
3–0
.21
–0.2
71.
00Li
tho-
–0.4
0–0
.29
–0.2
70.
100.
490.
100.
38–0
.13
–0.4
00.
45–0
.09
–0.0
30.
20–0
.33
0.21
0.12
–0.1
1–0
.04
0.01
0.03
–0.3
40.
130.
110.
270.
08–0
.31
–0.3
2–0
.30
0.00
–0.0
20.
03–0
.39
0.13
–0.0
40.
281.
00cla
stCe
m.
–0.2
9–0
.23
–0.1
30.
400.
260.
19–0
.16
–0.0
5–0
.20
0.21
0.25
0.37
–0.1
6–0
.33
–0.1
20.
200.
300.
340.
24–0
.05
0.00
–0.1
60.
070.
100.
35-0
.24
-0.1
6-0
.31
0.12
-0.1
00.
39–0
.30
0.47
0.42
–0.0
50.
061.
00Sp
arNe
o.–0
.49
–0.4
3–0
.35
0.44
0.31
0.26
0.19
-0.4
9–0
.50
0.03
0.05
–0.0
20.
04–0
.48
–0.3
00.
170.
200.
40–0
.09
–0.0
7–0
.29
–0.2
80.
39–0
.03
0.54
–0.4
0–0
.25
–0.4
50.
13–0
.10
–0.1
2–0
.45
0.38
0.30
0.20
–0.0
30.
391.
00Sp
ar

294 Adv. in Pet. Engg. I: Refining
detrital elements such as Si, Ti, Al, Na, K, Ba, Pb, Th, and Zr, modal countof quartz and Baexcess against negative correlations of Ca, Fe, Mn, P, Co, V,Bioclast, Ooids, lithoclasts and neomorphic spar could be observed. It is in-deed, the reflection of lithological influence and association of detritalelements with Si and association of heavy metals with carbonates and Ca.Other significant correlations are, Positive correlations of Fe with Mg, COrg,Co, Cr, Cu, Ni, V, Zn, Cement spar and Neomorphic spar, positive correlationsof Mn with Ca and Lithoclasts, positive correlations of Ca with ooids andlithoclasts, positive correlation of P with lithoclasts and strong positivecorrelations of Ba and Baexcess with detrital elements than organic matterand carbonates. The ooids show sympathetic relationship with V and negativecorrelations with detrital elements and Baexcess. The negative correlations ofbioclasts and neomorphic with Zr and positive correlation of neomorphicspars with Fe and Zn are significant. These correlation relationships indicatepreservation of depositional and diagenetic signatures and predominationof depositional characteristics. Prevalence of synsedimentary lithification,sediment recycling, calcareous nature of ooids and the incorporation of Fe,Mn, etc into carbonate components including ooids during later stagediagenesis are also inferred from these correlation relationships. Thesediment recycling events might have been intrabasinal and affected thecarbonate mud and bioclasts, due to which significant positive correlationsbetween Ca, ooid and lithoclasts exist.
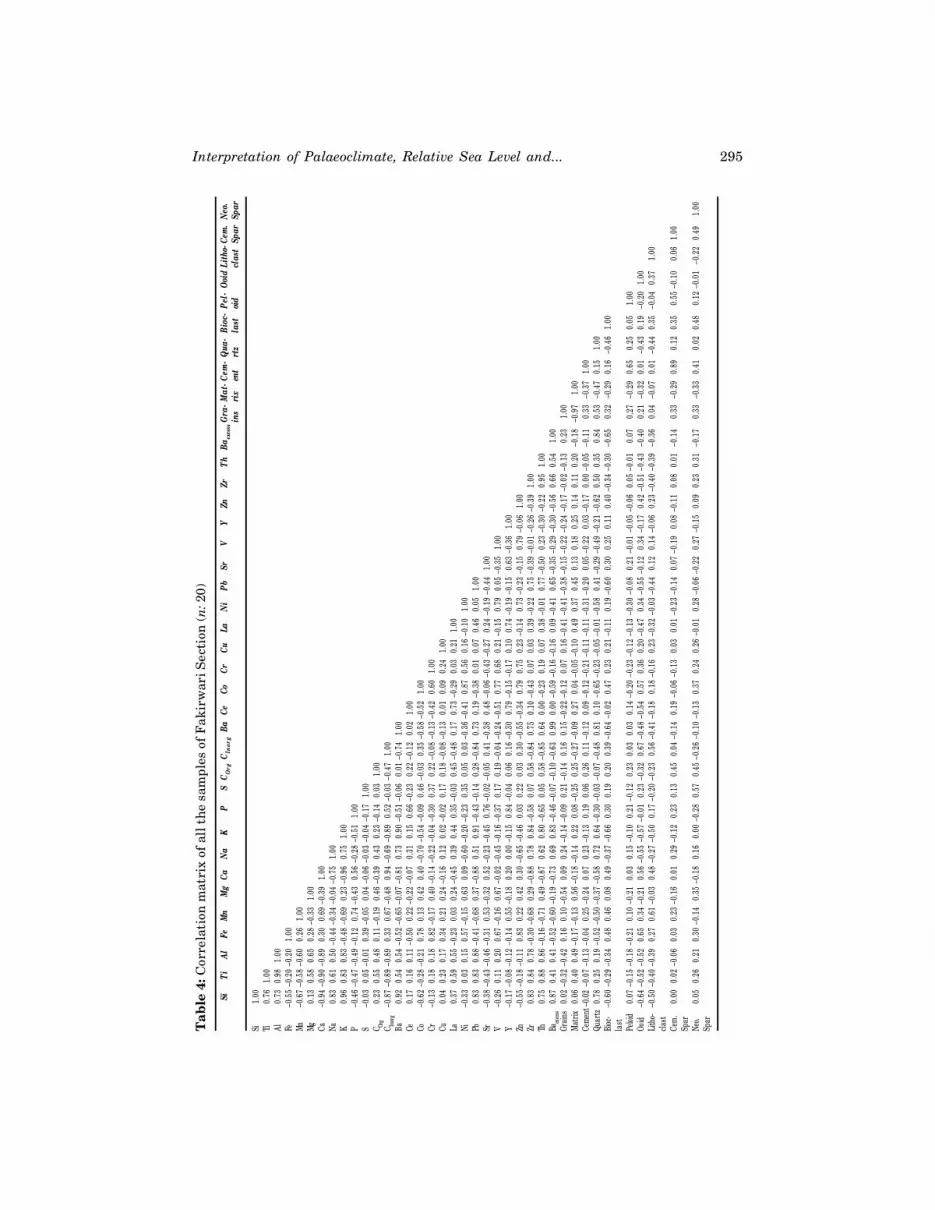
The correlation matrix of samples of Fakirwari section (Table 4) broadlyfollows the observations based on samples of all the sections. The differenceis that those grouping and many of the correlation ratios are stronger (eitherpositively or negatively) than those found in all-data. Strontium is negativelycorrelated with Si and other detrital elements and shows positive correlationwith Ca. Presence of similar negative correlations of Zn, Mn, Fe, etc, with Siare observed, that may indicate dependence of these elements on the availablecarbonates and incorporation of these elements with simultaneous expulsionof Sr under meteoric diagenesis. Positive correlations of Bioclasts, ooids,neomorphic spars with Fe, Ca, Co, Cr, Ni, V, Zn in varying amounts andtheir negative correlation with Na, K, clearly support the surmise thatenrichment of either of the group of elements (Si or Ca) which in turn,indicative of prevalent depositional and diagenetic conditions. The ooidsshow stronger correlation with Ca signifying their original calcareous nature.The positive correlation between lithoclasts and P is stronger confirmingthe interpretation of prevalent sediment/nutrient redistribution events.
Though the correlation matrix of LDS samples (Table 5) follows thebroad trends of ATS, there are few differences. Strontium shows slight(less significant) positive correlation with Si and shows negative correlations(less significant) with Ca and carbonate hosted elements signifying influx ofSr from detrital sources too. Unlike ATS and FWS section, the Mg does notshow positive correlation with Si. While negative correlations are observed
295Interpretation of Palaeoclimate, Relative Sea Level and...
Ta
ble
4: C
orre
lati
on m
atri
x of
all
the
sam
ples
of
Fak
irw
ari S
ecti
on (
n: 2
0)
SiTi
AlFe
Mn
Mg
CaN
aK
PS
CO
rgC
Inor
gBa
CeCo
CrCu
LaN
iP
bSr
VY
ZnZr
ThBa
exce
ssG
ra-M
at-C
em-
Qua
-B
ioc-
Pel
-O
oid
Lith
o-Ce
m.
Neo
.in
sri
xen
trt
zla
stoi
dcl
ast
Spar
Spar
Si1.
00Ti
0.76
1.00
Al0.
730.
981.
00Fe
–0.5
5–0
.20
–0.2
01.
00Mn
–0.6
7–0
.58
–0.6
00.
261.
00Mg
0.13
0.58
0.65
0.28
–0.3
31.
00Ca
–0.9
4–0
.90
–0.8
90.
300.
69–0
.39
1.00
Na0.
830.
610.
50–0
.44
–0.3
4–0
.04
–0.7
51.
00K
0.96
0.83
0.83
–0.4
8–0
.69
0.23
–0.9
60.
751.
00P
–0.4
6–0
.47
–0.4
9–0
.12
0.74
–0.4
30.
56–0
.28
–0.5
11.
00S
–0.0
30.
05–0
.01
0.39
–0.0
50.
04–0
.06
–0.0
3–0
.04
–0.1
71.
00C Or
g0.
230.
550.
480.
11–0
.19
0.46
–0.3
90.
430.
23–0
.14
0.03
1.00
C Inor
g–0
.87
–0.8
9–0
.89
0.33
0.67
–0.4
80.
94–0
.69
–0.8
90.
52–0
.03
–0.4
71.
00Ba
0.92
0.54
0.54
–0.5
2–0
.65
–0.0
7–0
.81
0.73
0.90
–0.5
1–0
.06
0.01
–0.7
41.
00Ce
0.17
0.16
0.11
–0.5
00.
22–0
.22
–0.0
70.
310.
150.
66–0
.23
0.22
–0.1
20.
021.
00Co
–0.6
2–0
.28
–0.2
10.
780.
130.
420.
40–0
.70
–0.5
4–0
.09
0.46
–0.0
30.
35–0
.58
–0.5
21.
00Cr
–0.1
30.
180.
180.
82–0
.17
0.40
–0.1
4–0
.22
–0.0
4–0
.30
0.37
0.22
–0.0
8–0
.13
–0.4
20.
601.
00Cu
0.04
0.23
0.17
0.34
0.21
0.24
–0.1
60.
120.
02–0
.02
0.17
0.18
–0.0
8–0
.13
0.01
0.09
0.24
1.00
La0.
370.
590.
55–0
.23
0.03
0.24
–0.4
50.
390.
440.
35–0
.03
0.45
–0.4
80.
170.
73–0
.29
0.03
0.21
1.00
Ni–0
.33
0.03
0.15
0.57
–0.1
50.
630.
09–0
.60
–0.2
0–0
.23
0.35
0.05
0.03
–0.3
6–0
.41
0.87
0.56
0.16
–0.1
01.
00Pb
0.83
0.83
0.88
–0.4
1–0
.68
0.37
–0.8
80.
510.
91–0
.43
–0.1
40.
28–0
.84
0.73
0.19
–0.3
80.
010.
070.
460.
051.
00Sr
–0.3
8–0
.43
–0.4
6–0
.31
0.53
–0.3
20.
52–0
.23
–0.4
50.
76–0
.02
–0.0
50.
41–0
.38
0.48
–0.0
6–0
.43
–0.2
70.
24–0
.19
–0.4
41.
00V
–0.2
60.
110.
200.
67–0
.16
0.67
–0.0
2–0
.45
–0.1
6–0
.37
0.17
0.19
–0.0
4–0
.24
–0.5
10.
770.
680.
21–0
.15
0.79
0.05
–0.3
51.
00Y
–0.1
7–0
.08
–0.1
2–0
.14
0.55
–0.1
80.
200.
00–0
.15
0.84
–0.0
40.
060.
16–0
.30
0.79
–0.1
5–0
.17
0.10
0.74
–0.1
9–0
.15
0.63
–0.3
61.
00Zn
–0.5
5–0
.18
–0.1
10.
830.
220.
420.
30–0
.65
–0.4
60.
030.
220.
030.
30–0
.55
–0.3
40.
790.
750.
23–0
.14
0.73
–0.2
3–0
.15
0.79
–0.0
61.
00Zr
0.83
0.84
0.78
–0.3
0–0
.68
0.29
–0.8
80.
780.
84–0
.58
0.07
0.58
–0.8
40.
750.
10–0
.43
0.07
0.03
0.39
–0.2
20.
75–0
.39
–0.0
1–0
.26
–0.3
91.
00Th
0.75
0.88
0.86
–0.1
6–0
.71
0.49
–0.8
70.
620.
80–0
.65
0.05
0.58
–0.8
50.
640.
00–0
.23
0.19
0.07
0.38
–0.0
10.
77–0
.50
0.23
–0.3
0–0
.22
0.95
1.00
Baex
cess
0.87
0.41
0.41
–0.5
2–0
.60
–0.1
9–0
.73
0.69
0.83
–0.4
6–0
.07
–0.1
0–0
.63
0.99
0.00
–0.5
9–0
.16
–0.1
60.
09–0
.41
0.65
–0.3
5–0
.29
–0.3
0–0
.56
0.66
0.54
1.00
Grain
s0.
02–0
.32
–0.4
20.
160.
10–0
.54
0.09
0.24
–0.1
4–0
.09
0.21
–0.1
40.
160.
15–0
.22
–0.1
20.
070.
16–0
.41
–0.4
1–0
.38
–0.1
5–0
.22
–0.2
4–0
.17
–0.0
2–0
.13
0.23
1.00
Mat
rix0.
060.
400.
49–0
.17
–0.1
30.
56–0
.18
–0.1
40.
220.
08–0
.25
0.25
–0.2
7–0
.09
0.27
0.04
–0.0
5–0
.10
0.49
0.37
0.45
0.13
0.18
0.25
0.14
0.11
0.20
–0.1
8–0
.97
1.00
Ceme
nt–0
.02–0
.07
–0.1
3–0
.04
0.25
–0.2
40.
070.
23–0
.13
0.19
0.06
0.26
0.11
–0.1
20.
09–0
.12
–0.2
1–0
.11
–0.1
1–0
.31
–0.2
00.
05–0
.22
0.03
–0.1
70.
00–0
.05
–0.1
10.
33–0
.37
1.00
Quar
tz0.
780.
250.
19–0
.52
–0.5
0–0
.37
–0.5
80.
720.
64–0
.30
–0.0
3–0
.07
–0.4
80.
810.
10–0
.65
–0.2
3–0
.05
–0.0
1–0
.58
0.41
–0.2
9–0
.49
–0.2
1–0
.62
0.50
0.35
0.84
0.53
–0.4
70.
151.
00Bi
oc-
–0.6
0–0
.29
–0.3
40.
480.
460.
080.
49–0
.37
–0.6
60.
300.
190.
200.
39–0
.64
–0.0
20.
470.
230.
21–0
.11
0.19
–0.6
00.
300.
250.
110.
40–0
.34
–0.3
0–0
.65
0.32
–0.2
90.
16–0
.46
1.00
last
Peloi
d0.
07–0
.15
–0.1
8–0
.21
0.10
–0.2
10.
030.
15–0
.10
0.21
–0.1
20.
230.
030.
030.
14–0
.20
–0.2
3–0
.12
–0.1
3–0
.30
–0.0
80.
21–0
.01
–0.0
5–0
.06
0.05
–0.0
10.
070.
27–0
.29
0.65
0.25
0.05
1.00
Ooid
–0.6
4–0
.52
–0.5
20.
650.
34–0
.21
0.56
–0.5
5–0
.57
–0.0
10.
23–0
.32
0.67
–0.4
8–0
.54
0.57
0.36
0.20
–0.4
70.
34–0
.55
–0.1
20.
34–0
.17
0.42
–0.5
1–0
.43
–0.4
00.
21–0
.32
0.01
–0.4
30.
19–0
.20
1.00
Lith
o-–0
.50
–0.4
0–0
.39
0.27
0.61
–0.0
30.
48–0
.27
–0.5
00.
17–0
.20
–0.2
30.
56–0
.41
–0.1
80.
18–0
.16
0.23
–0.3
2–0
.03
–0.4
40.
120.
14–0
.06
0.23
–0.4
0–0
.39
–0.3
60.
04–0
.07
0.01
–0.4
40.
35–0
.04
0.37
1.00
clast
Cem
.0.
000.
02–0
.06
0.03
0.23
–0.1
60.
010.
29–0
.12
0.23
0.13
0.45
0.04
–0.1
40.
19–0
.06
–0.1
30.
030.
01–0
.23
–0.1
40.
07–0
.19
0.08
–0.1
10.
080.
01–0
.14
0.33
–0.2
90.
890.
120.
350.
55–0
.10
0.06
1.00
Spar
Neo.
0.05
0.26
0.21
0.30
–0.1
40.
35–0
.18
0.16
0.00
–0.2
80.
570.
45–0
.26
–0.1
0–0
.13
0.37
0.24
0.26
–0.0
10.
28–0
.06
–0.2
20.
27–0
.15
0.09
0.23
0.31
–0.1
70.
33–0
.33
0.41
0.02
0.48
0.12
–0.0
1–0
.22
0.49
1.00
Spar

296 Adv. in Pet. Engg. I: Refining
Ta
ble
5: C
orre
lati
on m
atri
x of
all
the
sam
ples
of L
odai
Sec
tion
(n:
17)
SiTi
AlFe
Mn
Mg
CaN
aK
PS
CO
rgC
Inor
gBa
CeCo
CrCu
LaN
iP
bSr
VY
ZnZr
ThBa
exce
ssG
ra-
Mat
-C
em-
Qua
-B
ioc-
Pel
-O
oid
Cem
.N
eo.
ins
rix
ent
rtz
last
oid
Spar
Spar
Si1.
00Ti
0.74
1.00
Al0.
710.
881.
00Fe
–0.2
9–0
.22
–0.1
51.
00Mn
–0.2
8–0
.41
–0.3
70.
421.
00Mg
–0.4
90.
040.
070.
58–0
.02
1.00
Ca–0
.86
–0.6
9–0
.70
–0.2
20.
110.
161.
00Na
0.43
0.08
0.08
–0.5
8–0
.21
–0.8
5–0
.12
1.00
K0.
880.
560.
57–0
.49
–0.2
1–0
.71
–0.6
30.
661.
00P
–0.3
5–0
.48
–0.4
00.
160.
20–0
.12
0.30
0.27
–0.2
11.
00S
0.62
0.73
0.61
0.02
–0.1
1–0
.01
–0.6
6–0
.01
0.39
–0.4
41.
00C Or
g–0
.34
–0.2
10.
000.
680.
110.
47–0
.05
–0.2
5–0
.43
0.19
–0.1
41.
00C In
org
–0.0
1–0
.32
–0.1
6–0
.32
–0.0
5–0
.35
0.19
0.19
0.25
–0.2
6–0
.11
–0.0
71.
00Ba
0.81
0.38
0.29
–0.2
9–0
.01
–0.7
5–0
.65
0.63
0.89
–0.0
70.
35–0
.41
0.16
1.00
Ce0.
620.
900.
71–0
.42
–0.3
4–0
.10
–0.4
50.
230.
57–0
.33
0.55
–0.3
6–0
.30
0.39
1.00
Co–0
.36
–0.1
5–0
.04
0.92
0.33
0.65
–0.1
4–0
.56
–0.5
40.
090.
050.
85–0
.29
–0.4
3–0
.34
1.00
Cr–0
.12
0.35
0.27
0.02
–0.5
10.
480.
06–0
.14
–0.1
50.
090.
120.
13–0
.28
–0.1
80.
300.
131.
00Cu
–0.3
00.
080.
250.
650.
220.
67–0
.08
–0.4
7–0
.40
–0.0
50.
150.
77–0
.22
–0.5
4–0
.02
0.82
0.13
1.00
La0.
640.
890.
72–0
.01
–0.2
60.
00–0
.68
0.10
0.49
–0.2
70.
78–0
.11
–0.3
70.
420.
830.
030.
360.
191.
00Ni
0.33
0.51
0.43
0.22
–0.2
00.
35–0
.46
–0.3
30.
08–0
.34
0.07
0.13
–0.4
30.
040.
480.
200.
100.
250.
391.
00Pb
0.73
0.67
0.68
–0.5
2–0
.18
–0.4
6–0
.49
0.47
0.77
–0.0
70.
42–0
.43
–0.1
00.
560.
72–0
.48
–0.0
5–0
.22
0.54
0.15
1.00
Sr0.
280.
600.
36–0
.28
–0.1
9–0
.07
–0.1
60.
170.
33–0
.21
0.70
–0.3
1–0
.03
0.25
0.66
–0.1
90.
420.
020.
73–0
.16
0.40
1.00
V–0
.72
–0.3
1–0
.27
0.27
–0.1
80.
730.
57–0
.44
–0.7
40.
32–0
.34
0.35
–0.1
9–0
.74
–0.3
10.
340.
640.
31–0
.32
–0.0
7–0
.54
–0.1
11.
00Y
0.37
0.84
0.73
–0.0
7–0
.27
0.29
–0.4
0–0
.10
0.26
–0.2
40.
570.
02–0
.37
0.07
0.86
0.08
0.52
0.37
0.85
0.49
0.50
0.66
0.00
1.00
Zn–0
.06
–0.2
3–0
.38
0.66
0.39
0.17
–0.2
5–0
.42
–0.3
50.
050.
150.
21–0
.25
0.04
–0.3
90.
50–0
.20
0.03
–0.0
60.
13–0
.45
–0.2
2–0
.03
–0.2
71.
00Zr
0.71
0.95
0.79
–0.2
2–0
.41
0.01
–0.6
40.
110.
57–0
.48
0.55
–0.2
2–0
.32
0.41
0.93
–0.1
80.
300.
060.
840.
680.
610.
49–0
.33
0.81
–0.2
51.
00Th
0.60
0.95
0.73
–0.2
6–0
.39
0.06
–0.5
20.
070.
46–0
.48
0.72
–0.2
7–0
.33
0.31
0.93
–0.1
70.
430.
060.
910.
450.
570.
74–0
.22
0.87
–0.2
20.
921.
00Ba
exce
ss0.
740.
250.
16–0
.27
0.05
–0.8
0–0
.57
0.64
0.84
0.01
0.26
–0.3
90.
220.
990.
26–0
.43
–0.2
5–0
.58
0.30
–0.0
40.
490.
16–0
.72
–0.0
60.
080.
280.
18Gr
ains
–0.3
7–0
.60
–0.6
8–0
.09
0.25
–0.3
30.
470.
19–0
.13
0.40
–0.1
8–0
.23
0.41
0.09
–0.5
1–0
.18
–0.0
7–0
.43
–0.4
1–0
.84
–0.2
80.
130.
09–0
.54
0.17
–0.6
9–0
.49
0.19
1.00
Mat
rix0.
370.
600.
680.
09–0
.25
0.33
–0.4
7–0
.19
0.13
–0.4
00.
180.
23–0
.41
–0.0
90.
510.
180.
070.
430.
410.
840.
28–0
.13
–0.0
90.
54–0
.17
0.69
0.49
–0.1
9–1
.00
1.00
Ceme
nt0.
13–0
.17
–0.2
90.
430.
25–0
.13
–0.3
2–0
.06
–0.0
90.
080.
210.
02–0
.22
0.23
–0.2
60.
27–0
.35
–0.1
10.
050.
03–0
.27
–0.1
9–0
.25
–0.2
90.
77–0
.17
–0.1
80.
270.
19–0
.19
1.00
Quar
tz0.
890.
580.
57–0
.45
–0.2
9–0
.56
–0.6
60.
520.
89–0
.31
0.33
–0.4
70.
100.
820.
52–0
.54
–0.1
3–0
.50
0.39
0.24
0.68
0.11
–0.6
40.
16–0
.24
0.59
0.43
0.77
–0.2
40.
240.
031.
00Bi
oc–
–0.7
0–0
.62
–0.6
30.
240.
440.
210.
58–0
.40
–0.6
70.
21–0
.27
0.26
0.17
–0.5
3–0
.54
0.30
–0.1
60.
19–0
.42
–0.3
8–0
.59
–0.1
00.
23–0
.29
0.33
–0.6
4–0
.47
–0.4
50.
44–0
.44
0.05
–0.8
11.
00la
stPe
loid
–0.3
0–0
.01
0.13
0.68
0.16
0.49
–0.1
1–0
.29
–0.3
10.
170.
070.
74–0
.20
–0.3
1–0
.15
0.84
0.35
0.78
0.21
0.02
–0.2
70.
080.
310.
260.
11–0
.06
–0.0
2–0
.32
–0.0
90.
090.
06–0
.42
0.17
1.00
Ooid
–0.5
7–0
.43
–0.4
6–0
.04
–0.2
20.
230.
62–0
.05
–0.4
50.
35–0
.41
–0.0
7–0
.03
–0.4
6–0
.33
–0.0
60.
24–0
.09
–0.4
6–0
.29
–0.3
0–0
.13
0.68
–0.3
3–0
.15
–0.4
3–0
.37
–0.4
10.
36–0
.36
–0.0
2–0
.35
–0.0
4–0
.02
1.00
Cem
.–0
.12
–0.2
7–0
.22
0.48
0.39
–0.0
5–0
.13
0.04
–0.1
60.
27–0
.14
0.41
–0.2
20.
05–0
.35
0.51
–0.2
50.
20–0
.15
–0.0
8–0
.18
–0.2
8–0
.13
–0.2
50.
43–0
.29
–0.3
30.
100.
16–0
.16
0.54
–0.0
90.
070.
510.
011.
00Sp
arNe
o.–0
.76
–0.5
4–0
.54
0.59
0.21
0.60
0.45
–0.6
4–0
.84
0.21
–0.2
80.
42–0
.07
–0.6
9–0
.57
0.61
0.10
0.41
–0.4
0–0
.07
–0.7
0–0
.22
0.61
–0.2
40.
48–0
.55
–0.4
6–0
.64
0.22
–0.2
20.
20–0
.84
0.61
0.44
0.43
0.31
1.00
Spar

297Interpretation of Palaeoclimate, Relative Sea Level and...
between Mg, Si, Na, K, Quartz that indicate non-detrital nature of Mg inthis section, presence of significant positive correlation between Mg and Fe,V, Co, Cr, Cu, Ni, peloid, neomorphic spar may suggest diageneticincorporation of these elements into the carbonates during neomorphism.In addition, variations of diagenetic environments (Mg signifying oxygenatedconditions, while other elements signify anoxic conditions) are also revealedby these correlation relationships. Presence of very strong positivecorrelations between Ba, Na, K and Si, suggests influx of Ba-orthoclase inless or unaltered state and quick burial. It calls for physical erosion in thesource area, rapid influx of detrital sediments into the depositional site andfaster rate of sedimentation, all of which could provide insights into theshort-term fluctuations in climate, sea-level and energy conditions prevalent.
Despite following general characteristics of ATS, the samples of JMSshow the following differences of correlation matrices (Table 6). Mn showsnon-related nature with Si as well as Fe and V. Its positive correlation withP (less significant) and very strong positive correlation with lithoclastssuggest multiple stages of diagenesis and also that the incorporation of Mninto the carbonate components might have predated Fe and other heavymetal enrichment (which in turn happened at later stage). Strong positivecorrelation of Fe with Co, Cr, Cu, La, Ni, V, Mg, cement spar, bioclast andits negative correlation with Sr, Ca, Mn, could indicate early stagestabilization of bioclasts that survived total dissolution during late stagetransformation. In addition, specific expulsion of Sr, Ca and Mn andsimultaneous incorporation of Fe, Co, Cr, Cu, La, Ni, V in bioclasts andprecipitation of calcite cement spars are the events that could be envisagedfrom these relationships.
The strong positive correlations (>0.71) among Si and related group ofelements and their strong negative correlations (>0.51) with Ca, bioclast,peloid, cement and neomorphic spar are probably reflective of the lithologicalcharacter of the Katrol Formation that it is predominantly a siliciclasticdeposit with argillaceous admixture. Presence of positive correlation betweenSi and matrix (0.54) suggests argillaceous matrix. Very strong positivecorrelations between Si, Al, Na and K and their very strong negativecorrelations with Ca suggest influx of Na+K feldspars, and deprivation ofbiogenic carbonate during periods of siliciclastic influx. Strong positivecorrelations between Fe, cement (0.88) and neomorphic spars (0.99), bioclasts(0.86) and peloids (0.76) and negative correlations of Fe with Si (-0.83) anddetrital element groupings suggest late stage diagenetic precipitation ofcement spars and neomorphic alteration of bioclasts and other carbonatephases such as peloids, etc. Positive correlations between Ca with Fe, Co, Cr,Ni, Zn, bioclast, cement spar and neomorphic spar (>0.69) are all indicativeof dependence of Fe group of elements over available carbonate phases to getincorporated into them.

298 Adv. in Pet. Engg. I: Refining
Ta
ble
6: C
orre
lati
on m
atri
x of
all
the
sam
ples
of
Jum
ara
Sec
tion
(n:
9)
SiTi
AlFe
Mn
Mg
CaN
aK
PS
CO
rgC
Inor
gBa
CeCo
CrCu
LaN
iP
bSr
VY
ZnZr
ThBa
exce
ssG
ra-
Mat
-Q
ua-
Bio
c-P
el-
Ooi
dLi
tho-
Cem
.N
eo.
ins
rix
rtz
last
oid
clas
tSp
arSp
ar
Si1.
00Ti
0.90
1.00
Al0.
860.
901.
00Fe
–0.2
7–0
.27
0.02
1.00
Mn–0
.44
–0.4
2–0
.51
–0.5
51.
00Mg
0.15
0.07
0.49
0.55
–0.3
21.
00Ca
–0.4
1–0
.45
–0.5
6–0
.67
0.90
–0.3
31.
00Na
0.94
0.97
0.88
–0.2
8–0
.36
0.04
–0.4
31.
00K
0.88
0.91
0.98
0.02
–0.4
80.
40–0
.58
0.92
1.00
P–0
.62
–0.5
5–0
.58
0.05
0.24
–0.2
10.
33–0
.57
–0.6
21.
00S
–0.6
8–0
.56
–0.5
80.
35–0
.17
–0.1
5–0
.01
–0.6
7–0
.63
0.34
1.00
C Org
–0.0
10.
280.
350.
55–0
.36
0.28
–0.5
60.
190.
40–0
.10
0.12
1.00
C Inor
g–0
.49
–0.4
9–0
.64
–0.6
60.
87–0
.43
0.97
–0.4
8–0
.66
0.32
0.14
–0.5
81.
00Ba
0.99
0.90
0.84
–0.2
5–0
.41
0.08
–0.4
40.
960.
89–0
.62
–0.7
00.
02–0
.50
1.00
Ce–0
.25
–0.1
2–0
.36
–0.3
00.
13–0
.58
0.25
–0.1
4–0
.37
0.82
0.13
–0.1
30.
24–0
.23
1.00
Co0.
090.
130.
510.
58–0
.33
0.93
–0.3
80.
080.
43–0
.20
0.00
0.47
–0.4
30.
05–0
.56
1.00
Cr0.
04–0
.06
0.33
0.59
–0.4
80.
92–0
.37
–0.1
30.
20–0
.10
0.13
0.15
–0.4
2–0
.06
–0.4
70.
821.
00Cu
–0.1
4–0
.16
0.15
0.87
–0.3
40.
62–0
.56
–0.1
60.
18–0
.24
0.06
0.61
–0.6
1–0
.14
–0.5
60.
590.
541.
00La
–0.4
1–0
.24
–0.0
90.
60–0
.37
0.26
–0.3
6–0
.31
–0.1
70.
680.
430.
38–0
.33
–0.3
90.
450.
360.
370.
251.
00Ni
0.31
0.23
0.59
0.70
–0.6
60.
86–0
.69
0.22
0.52
–0.1
3–0
.12
0.35
–0.7
50.
28–0
.37
0.83
0.83
0.60
0.49
1.00
Pb0.
610.
430.
750.
36–0
.54
0.83
–0.5
30.
450.
68–0
.41
–0.4
60.
07–0
.63
0.55
–0.5
10.
680.
760.
420.
070.
871.
00Sr
0.06
–0.1
8–0
.13
–0.4
50.
320.
120.
59–0
.16
–0.2
00.
29–0
.27
–0.5
90.
44–0
.07
0.22
–0.1
30.
17–0
.38
–0.2
0–0
.11
0.15
1.00
V0.
10–0
.06
0.05
0.64
–0.8
40.
23–0
.68
–0.0
80.
05–0
.12
0.44
0.12
–0.6
30.
05–0
.19
0.19
0.47
0.39
0.29
0.51
0.34
–0.2
01.
00Y
–0.5
1–0
.43
–0.4
7–0
.07
0.28
–0.1
80.
40–0
.46
–0.5
10.
970.
19–0
.08
0.34
–0.5
30.
84–0
.19
–0.1
1–0
.29
0.60
–0.1
5–0
.36
0.42
–0.2
31.
00Zn
–0.2
1–0
.33
0.01
0.12
0.29
0.72
0.36
–0.3
2–0
.10
0.21
–0.1
0–0
.19
0.27
–0.2
9–0
.25
0.63
0.65
0.16
0.18
0.41
0.43
0.54
–0.2
10.
261.
00Zr
0.92
0.98
0.94
–0.2
7–0
.42
0.20
–0.4
20.
950.
92–0
.59
–0.6
20.
20–0
.49
0.90
–0.2
10.
200.
08–0
.12
–0.2
70.
300.
56–0
.05
–0.0
6–0
.46
–0.1
91.
00Th
0.34
0.40
0.21
–0.1
4–0
.39
–0.3
5–0
.38
0.36
0.20
–0.5
90.
14–0
.10
–0.2
20.
37–0
.22
–0.3
1–0
.20
–0.1
7–0
.33
–0.1
9–0
.05
–0.4
80.
29–0
.67
–0.6
70.
371.
00Ba
exce
ss0.
980.
870.
82–0
.25
–0.4
00.
08–0
.43
0.95
0.87
–0.6
2–0
.71
–0.0
2–0
.49
1.00
–0.2
40.
04–0
.06
–0.1
3–0
.41
0.28
0.56
–0.0
50.
07–0
.53
–0.2
70.
880.
361.
00Gr
ains
0.76
0.47
0.58
0.03
–0.4
20.
37–0
.37
0.55
0.62
–0.4
2–0
.67
–0.1
0–0
.53
0.70
–0.2
80.
130.
290.
20–0
.31
0.45
0.73
0.37
0.31
–0.3
20.
050.
56–0
.02
0.73
1.00
Mat
rix–0
.76
–0.4
7–0
.58
–0.0
30.
42–0
.37
0.37
–0.5
5–0
.62
0.42
0.67
0.10
0.53
–0.7
00.
28–0
.13
–0.2
9–0
.20
0.31
–0.4
5–0
.73
–0.3
7–0
.31
0.32
–0.0
5–0
.56
0.02
–0.7
3–1
.00
1.00
Quar
tz0.
950.
770.
66–0
.40
–0.3
7–0
.02
–0.2
50.
820.
70–0
.57
–0.6
0–0
.22
–0.3
30.
91–0
.17
–0.1
2–0
.07
–0.2
9–0
.54
0.12
0.47
0.22
0.16
–0.4
7–0
.27
0.79
0.37
0.92
0.78
–0.7
81.
00Bi
oc-
–0.3
9–0
.31
0.00
0.68
0.06
0.62
–0.1
8–0
.34
0.00
0.06
0.02
0.60
–0.2
6–0
.39
–0.3
50.
610.
480.
850.
360.
440.
24–0
.18
–0.0
40.
060.
44–0
.25
–0.5
0–0
.40
–0.0
60.
06–0
.58
1.00
last
Peloi
d0.
03–0
.12
–0.0
70.
18–0
.03
0.16
0.01
–0.1
00.
04–0
.35
0.06
0.24
–0.0
8–0
.03
–0.4
70.
110.
090.
41–0
.43
–0.0
20.
010.
120.
27–0
.30
–0.0
1–0
.12
–0.1
8–0
.01
0.33
–0.3
30.
150.
241.
00Oo
id–0
.44
–0.4
1–0
.57
–0.1
50.
12–0
.55
0.21
–0.4
0–0
.63
0.50
0.48
–0.5
00.
38–0
.39
0.53
–0.4
9–0
.31
–0.5
10.
31–0
.36
–0.4
9–0
.11
0.04
0.35
–0.2
1–0
.45
0.29
–0.3
8–0
.58
0.58
–0.3
5–0
.47
–0.6
71.
00Li
tho-
–0.4
9–0
.45
–0.5
5–0
.43
0.85
–0.3
60.
79–0
.39
–0.5
30.
66–0
.15
–0.3
20.
73–0
.45
0.56
–0.3
8–0
.47
–0.4
00.
05–0
.52
–0.5
30.
39–0
.75
0.70
0.28
–0.4
7–0
.60
–0.4
5–0
.40
0.40
–0.4
40.
04–0
.27
0.29
1.00
clast
Cem
.–0
.74
–0.6
7–0
.40
0.70
0.11
0.43
–0.0
4–0
.72
–0.4
30.
230.
440.
36–0
.03
–0.7
4–0
.26
0.44
0.45
0.73
0.44
0.25
–0.0
3–0
.21
0.10
0.14
0.40
–0.6
2–0
.36
–0.7
4–0
.38
0.38
–0.8
30.
860.
15–0
.05
0.08
1.00
Spar
Neo.
–0.7
1–0
.84
–0.7
20.
110.
530.
090.
59–0
.83
–0.7
10.
340.
34–0
.17
0.54
–0.7
7–0
.08
–0.0
20.
130.
22–0
.06
–0.2
5–0
.32
0.43
–0.0
90.
330.
47–0
.78
–0.5
7–0
.75
–0.2
30.
23–0
.57
0.42
0.51
–0.0
70.
430.
611.
00Sp
ar

299Interpretation of Palaeoclimate, Relative Sea Level and...
Apart from the general groupings of Si and Ca, following differencesare observed in correlation relationships of samples of DOM.
Though the ooid % shows positive correlations with Fe, Cr, Ni, V,presence of non-correlation (-0.01) with Ca is interesting. While all otherstratigraphic members and all-data show good correlation with Ca andooid %, presence of non-correlation between Ca and ooids in Dhosa OolitieMember is intriguing. It may indicate the altered nature of the ooid. i.e., itis no more a calcareous ooid! Alternatively, as the DOM containspredominantly calcareous rock components than other members, thesignificance of ooid and its carbonate signature might have been masked.To check all these possibilities, the samples that do not contain ooids wereremoved from the geochemical and petrographic sub-dataset of DOM andcorrelation was performed again which has returned the correlationmatrices of ooids with Ca (-0.5), Mg (-0.24) and Sr (-0.37), bioclast (-0.32),peloid (-0.38) and less significant, but positive correlations with Fe, Cr, Ni,V and significant positive correlation with cement spar (0.45). In addition,there are correlation matrices of ooids sympathetic with terrestrialelements. Together, all these could be interpreted such that, the periodsof significant ooid influx into the bioclastic carbonate deposition wasaccompanied by significant reduction in bioclast accumulation; the diagenesisof ooids was through specific leaching of Sr, Mg, etc., and this diagenetictransformation took place under reducing conditions wherein the Fe andother related elements got incorporated into carbonate phases of ooids.Owing to the non-existence of significant difference in bulk chemistrybetween host rock and diagenetic fluid, only the most susceptible partsand or components of the host rocks were enriched with these heavy metalswhich in turn were variable highly. As the bioclasts were already lowmagnesian calcites, they remained stable (as indicated by stainingcharacteristics and internal morphological details as observed underpetrographic microscope), the anoxic conditions of digenesis affectedintensively the ooids than other components of the carbonate rocks. Theintensity of diagenetic transformation was variable geographically and alsodepended on available less stable carbonate grains, that resulted ininsignificant but non-correlated nature between Ca and ooids.
Cr in this member shows positive correlation with Fe as well as Ti, Al,Co and negative correlation with Ca, signifying its influx together with otherdetrital elements. Sr show significant positive correlation with Ca, indicatingpreservation of pristine nature of bioclasts (as the carbonates are predominantlybioclasts) and its biogenic incorporation into the carbonates. Its negativecorrelation with Fe, Cu, Ni, indicates specific exclusion of Sr and simultaneousincorporation of these elements into carbonate grains. Positive correlation ofSr with lithoclasts indicates early stage diagenesis of lithoclasts (as could beexpected of them) before their erosion and final burial and their relative stabilityin the late stage diagenetic events. The positive correlation of Mn with Ca and
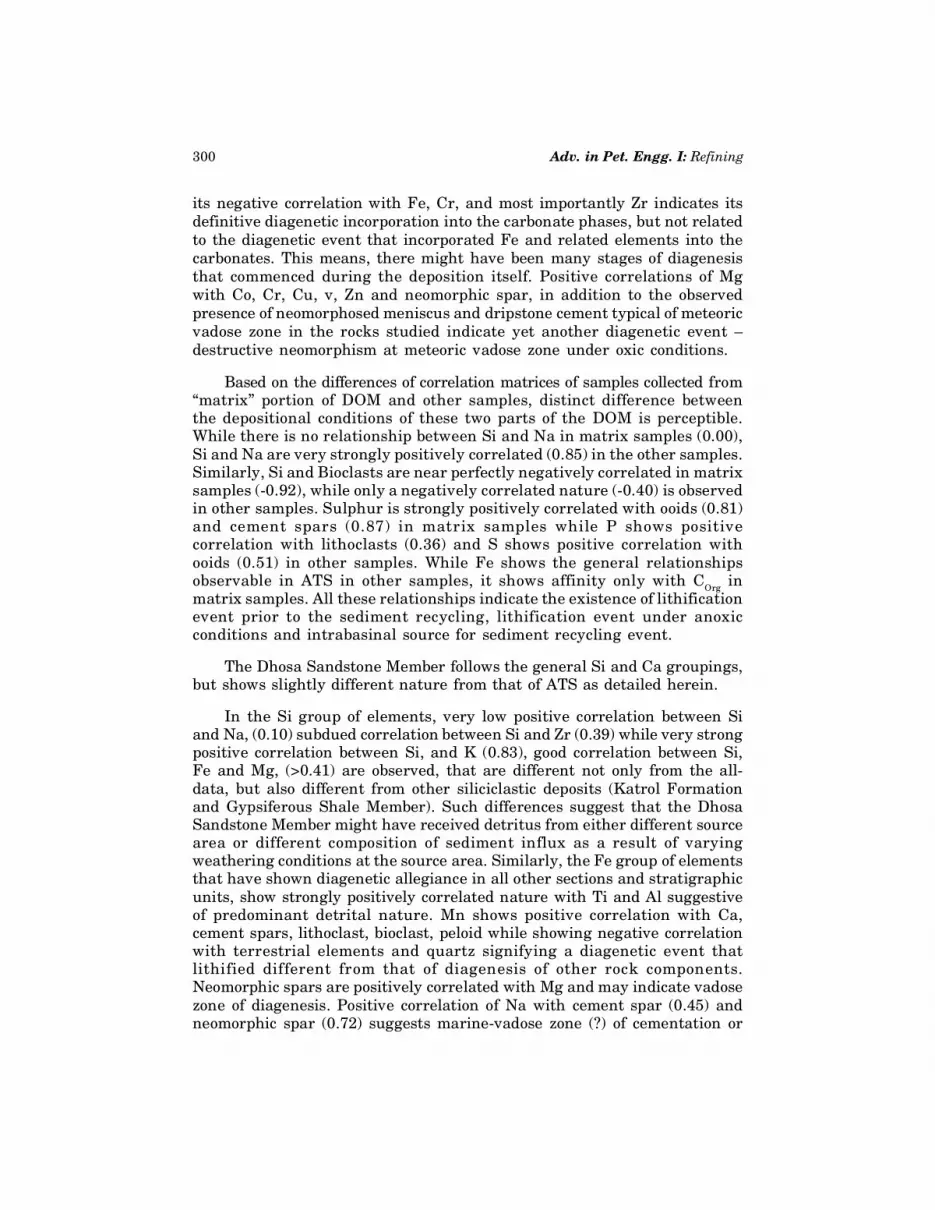
300 Adv. in Pet. Engg. I: Refining
its negative correlation with Fe, Cr, and most importantly Zr indicates itsdefinitive diagenetic incorporation into the carbonate phases, but not relatedto the diagenetic event that incorporated Fe and related elements into thecarbonates. This means, there might have been many stages of diagenesisthat commenced during the deposition itself. Positive correlations of Mgwith Co, Cr, Cu, v, Zn and neomorphic spar, in addition to the observedpresence of neomorphosed meniscus and dripstone cement typical of meteoricvadose zone in the rocks studied indicate yet another diagenetic event –destructive neomorphism at meteoric vadose zone under oxic conditions.
Based on the differences of correlation matrices of samples collected from“matrix” portion of DOM and other samples, distinct difference betweenthe depositional conditions of these two parts of the DOM is perceptible.While there is no relationship between Si and Na in matrix samples (0.00),Si and Na are very strongly positively correlated (0.85) in the other samples.Similarly, Si and Bioclasts are near perfectly negatively correlated in matrixsamples (-0.92), while only a negatively correlated nature (-0.40) is observedin other samples. Sulphur is strongly positively correlated with ooids (0.81)and cement spars (0.87) in matrix samples while P shows positivecorrelation with lithoclasts (0.36) and S shows positive correlation withooids (0.51) in other samples. While Fe shows the general relationshipsobservable in ATS in other samples, it shows affinity only with COrg inmatrix samples. All these relationships indicate the existence of lithificationevent prior to the sediment recycling, lithification event under anoxicconditions and intrabasinal source for sediment recycling event.
The Dhosa Sandstone Member follows the general Si and Ca groupings,but shows slightly different nature from that of ATS as detailed herein.
In the Si group of elements, very low positive correlation between Siand Na, (0.10) subdued correlation between Si and Zr (0.39) while very strongpositive correlation between Si, and K (0.83), good correlation between Si,Fe and Mg, (>0.41) are observed, that are different not only from the all-data, but also different from other siliciclastic deposits (Katrol Formationand Gypsiferous Shale Member). Such differences suggest that the DhosaSandstone Member might have received detritus from either different sourcearea or different composition of sediment influx as a result of varyingweathering conditions at the source area. Similarly, the Fe group of elementsthat have shown diagenetic allegiance in all other sections and stratigraphicunits, show strongly positively correlated nature with Ti and Al suggestiveof predominant detrital nature. Mn shows positive correlation with Ca,cement spars, lithoclast, bioclast, peloid while showing negative correlationwith terrestrial elements and quartz signifying a diagenetic event thatlithified different from that of diagenesis of other rock components.Neomorphic spars are positively correlated with Mg and may indicate vadosezone of diagenesis. Positive correlation of Na with cement spar (0.45) andneomorphic spar (0.72) suggests marine-vadose zone (?) of cementation or

301Interpretation of Palaeoclimate, Relative Sea Level and...
cementation at the groundwater table level wherein oxygenating environmentwas prevalent and the ground water was saturated with host rock componentto cause large scale diagenetic alteration.
DISCUSSION
Existence of lithological control over geochemical composition of the rocksunder study is revealed from the mean values of ATS, sectional mean valuesand mean values of stratigraphic units. If lithology was the controlling factor,as seen in the pristine nature of depositional signatures in terms ofgeochemical composition, definitive influence of sea level and climate overdepositional environments could be inferred. This inference is furthersupported by the existences of grouping (Si and Ca) in elemental andpetrographic compositions of the rocks in terms of detrital signature andbiogenic and or diagenetic signature. Presence of such grouping as expressedby strong to very strongly correlated nature between elemental compositionsand petrographic components of respective groups itself is confirmatory tolithological control over depositional and diagenetic processes, control ofclimate and sea-level over lithological succession and preservation ofdepositional criteria without much obliteration. It also leads to a surmisethat fluctuations in climate have had significant impact on the weatheringin the source area. In resonance with climatic fluctuations, sea level in thedepositional basin also had changed, impacting on the delivery, restrictionand cessation of detrital influx during sea-level low, rise and highrespectively. Due to these (significant weathering and absence of weatheringin the source area, control on influx of detrital sediment into depositionalsites by sea-level), there were changes in dominant lithology (eithercarbonates or siliciclastics), and dominant mineralogy (quartz or feldsparsand/or clay) as observed in the mean values and correlation relationships ofdifferent sections and stratigraphic units. Occurrences of such observablechanges suggest prevalence of coupling between climate, source areaweathering, sea level and depositional conditions. Based on this surmise, agradual reduction in chemical weathering in the source area from GypsiferousShale Member towards Dhosa Sandstone Member, thenceforth significantreduction of siliciclastics during the deposition of DOM, and resumption ofsignificant influx of quartz in the basal beds of Katrol Formation areinterpreted. Existences of differences in the abundances of detrital elementsbetween sections (LDS, FWS, JMS), and between individual stratigraphicunits at different sections suggest shifting nature of geographic locations ofsediment influx as a function of sea-level variation.
At this juncture, it was felt imperative to differentiate the influences ofdepositional and diagenetic processes and their geographic variations. To thiseffect, cluster analysis was performed to group the variables (geochemicalelements and petrographic components). It has classified the variables intotwo major groups (Fig. 3) namely MG-1 (consisting of the variables Peloid-

302 Adv. in Pet. Engg. I: Refining
Cement-Grains-Cement Spar-Bioclast-Neomorphic Spar-Zn-Cinorg-Ca-Lithoclast-Mn-Ooid-S-Ni-Co-V-Cr-Mg-Ctotal-Corg-Cu-Fe) and MG-2 (Matrix-Sr-La-Ce-Y-P-Quartz-Baexcess-Ba-Na-Th-Zr-Al-Ti-Pb-K-Si). These clusters largelyespouse the nature of the depositional system to behave either as siliciclasticdominated or carbonate dominated nature at a given point of time. Thesemajor groups consist sub-groups (Fig. 3) namely SG-1 (Peloid-Cement-Grains-Cement Spar-Bioclast-Neomorphic Spar-Zn-CiInorg-Ca-Lithoclast-Mn), SG-2(Ooid-S-Ni-Co-V-Cr-Mg-Ctotal-Corg-Cu-Fe), SG-3 (consisting of Matrix-Sr-La-Ce-Y-P) and SG-4 (Quartz-Baexcess-Ba-Na-Th-Zr-Al-Ti-Pb-K-Si). While SG-1represents the bioclasts, micritic matrix and carbonate cement spars(authigenic sediments and possibly marine diagenetic cement, as the cementspars are mostly of marine-phreatic and sediment-water interface zones),the SG-4 represents the physical depositional process brought to thedepositional site from extraneous (detrital) sources, the SG-3 representsthe recycling event and associated physico-chemical process and the SG-2represents the anoxic diagenetic process that depended on the availablecarbonates to get the heavy metals such as Fe, Cr, Co, V, by leaching Mgsimultaneously. This anoxic diagenetic process might have happened duringoxidation of organic matter and is why this sub-group includes S and Corg.These groupings and sub-groupings confirm the inferences drawn based ongeochemical composition of sections and stratigraphic units and correlationrelationships detailed in preceding section. In addition, record of depositionalas well as diagenetic imprints and predomination of depositional signaturesin the geochemical and petrographic compositions of the rocks are revealedby these groupings. Cross correlation of the Euclidean distances measuredbetween the variables during cluster analysis has returned a highest distance
Fig. 3: Results of cluster analysis showing major groupings (MG) and sub-grouping (SG)of geochemical elements and petrographic components

303Interpretation of Palaeoclimate, Relative Sea Level and...
of 12.24 between Si and ooids and 11.45 for Si and lithoclasts, signifyingtheir nature that they were sourced from intrabasinal region. Similarly, theooids and lithoclasts have shown close affinity with Ca in terms of shortestEuclidean distances of 7.51 and 7.61 respectively, espousing calcareous natureof them. Close affinity of ooids with S, P, Co, Cr, Ni, V suggest anoxicconditions of diagenesis experienced by them before recycling.
Given cognizance to these four processes, the samples of sections andstratigraphic units were discriminated through Discriminant Function analysis(DFA). It is interesting to note that there are 100% distinction of FWS in termsof Mn, Zr and Neomorphic Spar. While Mn and neomorphic spar indicatediagenetic process, Zr is indicative of depositional process. Similarly, Na coulddistinguish LDS from other sections to the tune of 100%. Highest averagediscrimination of all the sections was 66.67 and it was shown by Na, Corg andCtotal, all of which have role in depositional as well as diagenetic processes.While discriminating the stratigraphic units, it emerged that the DOM standsdistinct to the tune of 100% individually by Fe, Na, Cinorg, Ba, Co, Cr, Baexcess,Grains, Matrix, Bioclast, Lithoclast, Cement spar and Neomorphic Spar. It isimportant to note that these variables show better than 79.31% discriminationof all the stratigraphic units, signifying distinct depositional and diageneticcharacteristics embedded in DOM than other stratigraphic units. Highestaverage discrimination of all the stratigraphic units was achieved by Si(70.83%), which, again indicates the preservation and predomination ofdepositional signatures in the rocks under study.
Now, it stands confirmed from cluster and discriminant function analysesthat groupings in variables, primarily associated either with Si or Ca, are in-deed depositional characteristics, while the diagenetic imprints are only atsubdued level. In this context, the role of sea-level that favored ooid formationand deposition in DOM requires consideration. While the sandwiched natureof DOM between siliciclastic rocks (the Dhosa Sandstone Member at bottomand unnamed siliciclastic member and the Katrol Formation at top) indicatea perturbation in sea-level from general trend that might have causedswitching from predomination of siliciclastics to carbonates, presence ofepisodic siliciclastic rich interbeds within DOM suggest short-termoscillations (Kulkarni and Borkar, 2000; Pandey et al., 2009). The top of theDOM is interpreted as a maximum flooding surface of a relative sea-levelhighstand (Fürsich et al., 1991; 2001) that is in tune with the inferences ontemporal changes in geochemical composition and correlation relationshipsdocumented in the present study.
Data from non-condensed sections of Callovian-Oxfordian suggest globalsea-level rise much before the dawn of Oxfordian (Wierzbowski et al., 2009), afact that could not be verified with other correlative equivalents locatedelsewhere, owing to their condensed nature and presence of frequent omissionsurfaces and hardground surfaces in them. The changes in predominant

304 Adv. in Pet. Engg. I: Refining
mineralogy of individual stratigraphic units, documented in the present studycould perhaps be a result of the sea-level fluctuations reported elsewhere.Absence of shallow-water benthic fauna and sedimentary structures typicalof supratidal-intertidal and subaerial exposure in the Spanish Iberian sectionswere interpreted as a phase of sediment starvation and maximal flooding inthe uppermost Callovian and lowermost Oxfordian (Norris and Hallam, 1995).The shift from predomination of aluminosilicate to quartz observed in theGypsiferous Shale Member to Dhosa Sandstone Member and within DhosaSandstone Member, occurrences of strong positive correlation of Si with Tiand Zr than other other detrital elements, suggest sediment starved nature,reduction of aluminosilicate influx and by implication reduction of chemicalweathering in the source area, followed by cessation of detrital influx towardstop of the DOM that are all in conformity with the gradual increase in sea-level and associated impact on the depositional characteristics. Thus,enhanced production and accumulation of ooids with either sea-level high ortransgression in this basin is ascertained.
While reviewing the carbonate factories of Phanerozoic based on LateJurassic sections distributed Worldover et al. (2008), stated that this timeslice was dominated by carbonate production in shallow seas and conspicuousfor re-sedimentation process and basinward transport of lime mud and othersediments. Occurrences of positive correlations of P with lithoclasts andooids in DOM samples support interpretation of similar processes in theKachchh basin during Oxfordian. Recognition of such process prevalentduring Oxfordian indicated by P which in turn has link with carbon budget(and thus with climate and sea-level cycles - Tappan, 1967; Froelich, 1988;Ruttenberg, 1993; Munnecke et al., 2010) affirms the interpretation ofsediment recycling events. Oblivious to this, occurrences of partially relatednature of Na, Mg, Sr, Fe in depositional as well as diagenetic processes,occurrences of regional variations in diagenetic intensity as exemplified bynon-correlated and negatively correlated nature of Fe, Mn, Mg, Sr, with Sias well as Ca in different sections and stratigraphic units in different sectionswould thwart precise chemostratigraphic correlation of these strata at basinaland regional scale. Compounded with this is the problem of occurrences ofomission surfaces, erosional surfaces, hardground surfaces, sedimentrecycling events and varied depositional rates between different geographiclocations. Nevertheless, these do not preclude correlation of the individualstratigraphic units to be recognized from regional counterparts, providedsufficient caution is exercised.
CONCLUSIONS
Examination of the geochemical and petrographic compositions tabulatedaccording to geographically separated sections (spatial) and stratigraphicallyseparated units (temporal) of the Upper Callovian-Oxfordian strata of theKachchh Basin led to the proposition that the rocks under study preserve

305Interpretation of Palaeoclimate, Relative Sea Level and...
predominantly depositional and subdued diagenetic imprints, in terms ofgroups of elemental and petrographic components.
Spatial and temporal variations of quantum of these components aswell as intensity (values of correlation matrix scores) and nature ofcorrelations (positive, negative and non-correlated nature, in addition tostrong, very strong and perfect correlations) are observed, that helpedidentification of coupled nature of depositional pattern with climate, sourcearea weathering and sea-level fluctuations.
A general sea-level increase from Upper Callovian that reached its zenithnear the top of Dhosa Oolite Member accompanied by shift in reduction ofaluminosilicates followed by enhanced influx of siliciclastics and finallycessation of siliciclastic influx is interpreted. Associated with this sea-levelcycle is the enhanced production and accumulation of ooids in DOM, aperturbation, distinct from other stratigraphic units and expressed by thegeochemical and petrographic composition.
Regional variations of diagenetic intensity, control of depositionalcharacteristics over intensity of diagenesis are also observed, that may thwartprecise correlation of the strata with coeval strata elsewhere. This problemis compounded by the prevalent varying rates of deposition and shiftingnature of point of detrital influx that imparted varying geochemical signaturesof stratigraphic units at different geographic locations.
While documentation of perfect coupling between climate, sea-level anddepositional pattern in the basin, offer potential to correlate the strataunder study with coeval strata elsewhere, spatio-temporal variations ofdepositional and diagenetic characteristics within stratigraphic unitsdocumented by the present study suggests that proper caution has to beexercised during such attempts. The study has also demonstrated theprocedure to elicit depositional and diagenetic conditions and their spatio-temporal variability to aid in palaeoclimatic interpretations and differentscales stratigraphic correlation.
ACKNOWLEDGEMENTS
This work is supported by German Research Foundation research grant No.Fü/131. Revisit opportunities provided by Alexander von Humboldt Foundation,Germany, to MR to work at the Geozentrum Nordbayern of ErlangenUniversity, is gratefully acknowledged. The authors thank Melanie Hertel,Heike Schmidt, and Daniel Leicht for assistance in sample preparation,Birgit Leipner-Mata and Ramona Dotzler for thin-section preparation andDoris Bergmann-Dörr for Carbon and Sulphur measurements.

306 Adv. in Pet. Engg. I: Refining
REFERENCES
Alberti, M., Pandey, D.K. and Fürsich, F.T. 2011. Ammonites of the genus Peltoceratoides SPATH,1924 from the Oxfordian of Kachchh, Western India. Neu. Jb. Geol. Paläont., DOI: 10: 1127/0077–7749/0178.
Clark, W.A.V. and Hosking, P.C. 1986. Statistical methods for geographers. John Wiley and Sons.Inc., New York, p. 90.
Davis, J.C. 1973. Statistics and data analysis in geology. John Wiley and Sons. Inc, New York, p.148.
Flügel, E. 1982. Microfacies analysis of limestone. Springer-Verlag, Heidelberg, p. 633.Froelich, P.N. 1988. Kinetic control of dissolved phosphate in natural rivers and estuaries: A
primer on the phosphate buffer mechanism. Limnol. Oceanogr., 33: 649–668.Fürsich, F.T. and Oschmann, W. 1993. Shell beds as tool in facies analysis: The Jurassic of
Kachchh, western India. Jour. Geol. Soc. London, 150: 169–185.Fürsich, F.T., Callomon, J.H., Pandey, D.K. and Jaitly, A.K. 2004. Environments and faunal
patterns in the Kachchh rift basin, western India, during the Jurassic – Riv. It. Paleont.Stratigr., 110: 181–190.
Fürsich, F.T., Oschmann, W. and Jaitly, A.K. 1991. Faunal response to transgressive-regressivecycles: Example from the Jurassic of western India. Palaeogeogr. Palaeoclimatol. Palaeoecol.,85: 149–159.
Fürsich, F.T., Oschmann, W. and Singh, I.B. 1992. Hardgrounds, reworked concretion levels andcondensed horizons in the Jurassic of western India: Their significance for basin analysis.Jour. Geol. Soc. London, 149: 313–331.
Fürsich, F.T., Pandey, D.K. and Collomon, J.H. 2001. Marker beds in the Jurassic of the Kachchhbasin, western India: Their depositional environment and sequence stratigraphic significance.Jour. Palaeont. Soc. India, 46: 173–198.
Fürsich, F.T., Singh, I.B., Joachimski, M., Krumm, S., Schlirl, M. and Schlirl, S. 2005.Palaeoclimate reconstructions of the Middle Jurassic of Kachchh (western India): Anintegrated approach based on palaeoecological, oxygen isotopic and clay mineralogical data.Palaeogeogr. Palaeoclimatol. Palaeoecol., 217: 289–309.
Johnson, R.A. and Wichern, D.W. 1992. Applied multivariate statistical analysis: III Edition.New Delhi, Prentice -Hall of India. Pvt. Ltd., p. 372.
Kramar, U. 1997. Advances in energy-dispersive X-ray fluorescence. Jour. Geochem. Expl., 58:73–80.
Krishna, J., Pathak, D.B. and Pandey, B. 1996. Quantum refinement in the Kimmeridgianammonoid chronology in Kachchh (India). Geo. Res. Forum., 1–2: 195–204.
Kulkarni, K.G. and Borkar, V.D. 2000. Palaeonvironmental niches towards the close of depositionof Dhosa Oolite (Early Oxfordian), Kuch, India. Ind. Jour. Petrol. Geol. 9: 49–58.
Land, L.S., Behrens, E.W. and Frishman, S.A. 1979. The ooids of baffin bay. Texas. Jour. Sediment.Petrol., 49: 1269–1278.
Munnecke, A., Calner, M., Harper, D.A.T. and Servais, T. 2010. Ordovician and Silurian sea–water chemistry, sea-level, and climate: A synopsis. Palaeogeogr. Palaeoclimatol. Palaeoecol.,296: 389–413.
Murray, R.W. and Leinen, M. 1993. Chemical transport to the seafloor of the equatorial PacificOcean across a latitudinal transect at 135°W: Tracking sedimentary major, trace and rareearth element fluxes at the equator and the intertropical convergence zone. Geochim.Cosmochim. Acta, 57: 4141–4163.
Murray, R.W. and Leinen, M. 1996. Scavenged excess aluminium and its relationship to bulktitanium in biogenic sediment from the central equatorial Pacific Ocean. Geochim. Cosmochim.Acta, 60: 3869–3878.
Nayak, B.J., Rajev, S.M. and Sahoo, R.K. 1997. R-mode factor analysis and its implications on thegeochemistry of Nishikhal manganese deposit, Raiguda district, Orissa. Jour. Geol. Soc. India,49: 133–144.
Norris, M.S. and Hallam, A. 1995. Facies variations across the middle–upper jurassic boundaryin Western Europe and the relationship to sea-level changes. Palaeogeogr. Palaeoclimatol.Palaeoecol., 116: 189–245.
307Interpretation of Palaeoclimate, Relative Sea Level and...
Pandey, D.K., Fürsich, F.T. and Sha, J.G. 2009. Interbasinal marker intervals – A case study fromthe Jurassic basins of Kachchh and Jaisalmer, western India. Science in China Series, D:Ear. Sci., 52: 1924–1931.
Pandey, D.K., Sha, J.G. and Choudhary, S. 2006. Depositional history of the early part of theJurassic succession on the Rajasthan shelf, western India. Prog. Nat. Sci., 16: 176–185.
Peryt, T.M. 1983. Coated grains. Springer Verlag, Berlin. p. 655.Pomar, L. and Hallock, P. 2008. Carbonate factories: A conundrum in sedimentary geology. Earth
Sci. Rev., 87: 134–169.Ramkumar, M. 2001. Sedimentary microenvironments of modern Godavari delta: Characterization
and statistical discrimination – Towards computer assisted environment recognition scheme.Jour. Geol. Soc. India, 57: 49–63.
Ramkumar, M. and Guha, A.K. 2000. Multivariate statistical verification of petrographic andstandard microfacies types and lithostratigraphy of Tertiary carbonates of western Kutchch,Gujarat, India: Implications on global stratigraphic correlation and hydrocarbon exploration.Ind. Jour. Petrol. Geol., 9: 52–74.
Ramkumar, M., Harting, M. and Stüben, D. 2005. Barium anomaly preceding K/T boundary:Plausible causes and implications on end Cretaceous events of K/T sections in Cauvery basin(India), Israel, NE-Mexico and Guatemala. Inter. Jour. Earth Sci., 94: 475–489.
Ruttenberg, K.C. 1993. Reassessment of the oceanic residence time of phosphorus. Chem. Geol.,107: 405–409.
Sahu, B.K. 1995. Statistical inference from geochemical and petrographic data. Proceedings ofrecent researches in geology of Western India. pp. 59–64.
Singh, I.B. 1989. Dhosa oolite – A transgressive condensation horizon of Oxfordian age in Kachchh,western India. Jour. Geol. Soc. Ind., 34: 152–160.
Tappan, H. 1967. Primary production, isotopes, extinctions and the atmosphere. Palaeogeogr.Palaeoclimatol. Palaeoecol., 4: 187–210.
Tucker, M.E. and Wright, V.P. 1990. Carbonate sedimentology. Blackwell Science, p. 482.Wierzbowski, H., Dembicz, K. and Praszkier, T. 2009. Oxygen and carbon isotope composition of
callovian–lower oxfordian (Middle–Upper Jurassic) belemnite rostra from central Poland: Arecord of a Late Callovian global sea-level rise? Palaeogeogr. Palaeoclimatol. Palaeoecol.,283: 182–194.


