Embed Size (px)
Citation preview

Inter Subject Variability and Reproducibility of DiffusionTensor Imaging within and between Different ImagingSessionsTonny V. Veenith1, Eleanor Carter1, Julia Grossac1, Virginia F. J. Newcombe1, Joanne G. Outtrim1,
Victoria Lupson2, Guy B. Williams2, David K. Menon1, Jonathan P. Coles1*
1Division of Anaesthesia, University of Cambridge, Cambridge, Cambridgeshire, United Kingdom, 2Wolfson Brain Imaging Centre, Addenbrooke’s Hospital, Cambridge,
Cambridgeshire, United Kingdom
Abstract
The aim of these studies was to provide reference data on intersubject variability and reproducibility of diffusion tensorimaging. Healthy volunteers underwent imaging on two occasions using the same 3T Siemens Verio magnetic resonancescanner. At each session two identical diffusion tensor sequences were obtained along with standard structural imaging.Fractional anisotropy, apparent diffusion coefficient, axial and radial diffusivity maps were created and regions of interestapplied in normalised space. The baseline data from all 26 volunteers were used to calculate the intersubject variability,while within session and between session reproducibility were calculated from all the available data. The reproducibility ofmeasurements were used to calculate the overall and within session 95% prediction interval for zero change. The within andbetween session reproducibility data were lower than the values for intersubject variability, and were different across thebrain. The regional mean (range) coefficient of variation figures for within session reproducibility were 2.1 (0.9–5.5%), 1.2(0.4–3.9%), 1.2 (0.4–3.8%) and 1.8 (0.4–4.3%) for fractional anisotropy, apparent diffusion coefficient, axial and radialdiffusivity, and were lower than between session reproducibility measurements (2.4 (1.1–5.9%), 1.9 (0.7–5.7%), 1.7 (0.7–4.7%)and 2.4 (0.9–5.8%); p,0.001). The calculated overall and within session 95% prediction intervals for zero change weresimilar. This study provides additional reference data concerning intersubject variability and reproducibility of diffusiontensor imaging conducted within the same imaging session and different imaging sessions. These data can be utilised ininterventional studies to quantify change within a single imaging session, or to assess the significance of change inlongitudinal studies of brain injury and disease.
Citation: Veenith TV, Carter E, Grossac J, Newcombe VFJ, Outtrim JG, et al. (2013) Inter Subject Variability and Reproducibility of Diffusion Tensor Imaging withinand between Different Imaging Sessions. PLoS ONE 8(6): e65941. doi:10.1371/journal.pone.0065941
Editor: Xi-Nian Zuo, Institute of Psychology, Chinese Academy of Sciences, China
Received February 6, 2013; Accepted April 30, 2013; Published June 28, 2013
Copyright: � 2013 Veenith et al. This is an open-access article distributed under the terms of the Creative Commons Attribution License, which permitsunrestricted use, distribution, and reproduction in any medium, provided the original author and source are credited.
Funding: Dr. TV Veenith was supported by clinical research training fellowship from the National Institute of Academic Anaesthesia and Raymond Beverly Sacklerstudentship. VFJN is supported by an NIHR academic clinical fellowship. JPC was supported by Wellcome trust project grant. DKM is supported by an NIHR SeniorInvestigator Award. This work was supported by a Medical Research Council (UK) Program Grant (Acute brain injury: heterogeneity of mechanisms, therapeutictargets and outcome effects (G9439390 ID 65883)), the UK National Institute of Health Research Biomedical Research Centre at Cambridge, and the TechnologyPlatform funding provided by the UK Department of Health. The funders had no role in study design, data collection and analyses, decision to publish, orpreparation of the manuscript.
Competing Interests: The authors have declared that no competing interests exist.
* E-mail: [email protected]
Introduction
Diffusion tensor imaging (DTI) has been used to identify
neuronal injury and predict outcome in a variety of neurological
disorders such as traumatic brain injury [1–3], multiple sclerosis
[4–6], Alzheimer’s dementia and psychiatric disorders [7–9].
Previous human studies using DTI have provided invaluable
reference data regarding normal values within different brain
structures and several groups have reported data comparing DTI
measurements between subjects, between scanners in different
centres, following service upgrades, and reproducibility within the
same centre over time [10–28]. However, there are limited data
that compare intersubject variability and reproducibility of DTI
measurements [23], or published studies that compare reproduc-
ibility of DTI measurements obtained within the same imaging
session (within session reproducibility) with that obtained during
repeat imaging sessions on the same or different days (between
session reproducibility). This is of particular relevance for group
comparisons with healthy volunteers, and longitudinal and
interventional studies where DTI can be used as a non-invasive
imaging biomarker of disease progression or response to therapy.
The rational design and interpretation of such studies is hampered
by lack of knowledge regarding how the variability of DTI
measurements in data obtained during the same scanning session
differs when compared with similar data obtained during a
different session or day. In studies where consecutive measure-
ments are performed on each subject under resting and
experimental conditions problems associated with variation
between subjects due to individual differences (intersubject
variability) can be limited. However, baseline DTI measurements
may vary within an individual patient (intrasubject variability) and
limit the ability to detect significant changes over time or following
a therapeutic intervention. Where DTI is repeated after several
days or weeks in different imaging sessions the measurements may
PLOS ONE | www.plosone.org 1 June 2013 | Volume 8 | Issue 6 | e65941

vary within an individual patient even in the absence of disease
progression due to a combination of intrasubject and scanner
variability [29,30]. Without knowledge of such differences it is
difficult to accurately determine the clinical significance of
pathophysiological changes, as they evolve following various
causes of brain injury or disease.
The aim of these studies was to provide reference data on
intersubject variability and reproducibility of fractional anisotropy,
apparent diffusion coefficient, radial and axial diffusivity measure-
ments in a group of healthy volunteers. These data will inform the
design of interventional studies, where repeated measurements are
conducted within the same session, and longitudinal studies, where
assessments are repeated over time in several different imaging
sessions.
Materials and Methods
Ethics statementEthical approval was obtained from the Cambridgeshire 2
Research Ethics Committee (reference number 97/290), and
written informed consent was obtained from all volunteers in
accordance with the Declaration of Helsinki.
Imaging data acquisitionTwenty six healthy volunteers without any history of
neuropsychiatric disorder or substance abuse underwent imaging
using a 3T Siemens Verio MRI scanner (Siemens AG, Erlangen,
Germany) within the Wolfson Brain Imaging Centre (WBIC),
University of Cambridge. All volunteers were right handed (ten
males and sixteen females) with mean (range) age of 34 (25–44)
years, and employed by Cambridge University Hospitals NHS
Trust. Each subject was requested to attend two imaging sessions
and undergo DTI twice during each session. Twenty-two
volunteers attended a second imaging session within a mean
(range) of 33 (3–181) days. Structural sequences included 3D T1-
weighted magnetization prepared rapid gradient echo
(MPRAGE), fluid attenuated inversion recovery (FLAIR), gradi-
ent echo and dual spin echo (proton density/T2-weighted). The
DTI data were acquired using 63 non-collinear directions,
b = 1000 s/mm2 with one volume acquired without diffusion
weighting (b = 0), echo time (TE) 106 ms, repetition time (TR)
11700 ms, 63 slices, field of view 192 mm692 mm, 2 mm3
isotropic voxels, and an acquisition time of 13:50 minutes. The
two DTI sequences were interspersed within the structural
sequences at different intervals within each imaging session in
order to allow realistic comparison with clinical studies. In a
single subject the second DTI dataset from the baseline imaging
session was not successfully completed due to scanner malfunc-
tion, while four volunteers failed to attend the second imaging
session within six months. Imaging data were checked for patient
movement, and data sets degraded by motion artefact were
excluded [1].
Image processingFractional anisotropy (FA), apparent diffusion coefficient
(ADC) and axial (AD) maps were created using the Oxford
Centre for functional MRI of the brain FSL Diffusion Toolbox
[31,32], while radial (RD) diffusivity values were calculated as the
mean of the second and third eigenvalues. To aid coregistration,
the skull and extracranial soft tissue were stripped from the T1
weighted image using the Brain Extraction Tool of FSL [33].
The diffusion weighted data were normalized using a two-step
approach. First, volunteer T1 weighted images were coregistered
to the Montreal Neurological Institute 152 (MNI152) template
using the vtkCISG normalized mutual information algorithm
[34]. Using the b= 0 image the diffusion weighted data were
coregistered to the subjects own T1 weighted image obtained
during the same session. The transformation matrix normalizing
the MPRAGE was then applied to the diffusion weighted data.
Regions of interest (ROIs) from the Harvard Oxford subcortical
and MNI structural probabilistic atlases available within FSL
were applied in normalised space (figure 1) [35,36]. All
normalised images were inspected using FSL View by a single
experienced clinical investigator (TV) to confirm that data
processing had completed successfully and that the ROIs were
aligned and corresponded to the regions specified. The ROI
template was modified by erosion of a single voxel using fslmaths
to improve spatial localisation and reduce the impact of
coregistration, normalisation and partial volume errors. The
FA, mean ADC, AD and RD values for the different ROIs were
calculated using in-house software using Matlab (Mathworks,
Natick, USA).
Analysis StrategyThe baseline data from all 26 volunteers were used to
calculate the intersubject variability, while within session and
between session reproducibility were calculated from available
Figure 1. Region of interest template. T1 weighted magneticresonance image in MNI152 space (2 mm resolution) showing frontallobe left (Frontal L), frontal lobe right (Frontal R), anterior corpuscallosum (ACC), caudate left (Caudate L), caudate right (Caudate R),thalamus left (Thalamus L), thalamus right (Thalamus R), posteriorcorpus callosum (PCC), occipital left (Occipital L) and occipital right(Occipital R). Additional regions not shown include body corpuscallosum, ventral midbrain, dorsal midbrain, forceps minor, forcepsmajor and bilateral regions covering the hippocampus, parietal lobe,temporal lobe, cerebral peduncle, pons, cerebellum, anterior thalamicradiation, superior longitudinal fasciculus, inferior longitudinal fascicu-lus, cingulum, uncinate fasciculus and corticospinal tract.doi:10.1371/journal.pone.0065941.g001
Reproducibility of DTI at 3T
PLOS ONE | www.plosone.org 2 June 2013 | Volume 8 | Issue 6 | e65941

data. The acquisition of two sets of imaging data in each of the
two imaging sessions allows the calculation of four independent
sets of DTI data, which could be used to assess the
reproducibility of measurements. We used the average SD for
all DTI measurements obtained in 26 volunteers in both sessions
to calculate the population 95% prediction interval (PI) for zero
change (using two SD values). These calculated thresholds are
prediction intervals for assuming no changes from zero with the
repeat DTI measurement rather than confidence intervals for
variability of the measurement. Although these average data are
extremely useful, the calculated SD could vary within different
sessions and particular ROIs within subjects. It would therefore
be helpful to have a more specific measure of variability within a
session (within session reproducibility), and preferably for each
ROI. While this is possible, the small sample numbers (two
readings obtained in each of the two sessions) means that a
conventional threshold of change greater than 2SD cannot be
used to assess the statistical significance of changes in this
context. While any estimate of variance based on a t distribution
with two degrees of freedom must be treated with caution,
statistical theory suggests that an estimate of the 95% prediction
interval for zero change may be provided by a threshold of 4.3
SDs. These within session measurements could therefore be used
to assess the significance of the changes in DTI parameters
following a therapeutic intervention within the same imaging
session.
Statistical analysisStatistical analyses were conducted using Statview (Version 5,
1998, SAS Institute Inc., Cary, North Carolina, USA) and SPSSH
Statistics Version 21 (IBM H Corporation, New York, United
States). All data are expressed and displayed as mean and standard
deviation (SD), unless otherwise stated. To compare the repro-
ducibility of DTI measurements the SD and coefficient of
variation (CoV) (CoV = SD/mean) of measurements were
calculated within each ROI. Data were compared using paired
t-tests, factorial analysis of variance (ANOVA) and intraclass
correlation (ICC) as appropriate. Using ANOVA the residual
standard deviation was used to calculate the 95% prediction
interval for zero change of repeat DTI studies. All p values are
quoted after Bonferroni corrections for multiple comparisons
(where appropriate).
Table 1. Intersubject variability for diffusion tensor imaging measurements for predominantly white matter regions of interest(ROI).
Region of Interest (ROI) FA (mm2/second) ADC (mm2/second)Axial diffusivity (mm2/second)
Radial diffusivity (mm2/second)
Mean SD CoV (%) Mean SD CoV (%) Mean SD CoV (%) Mean SD CoV (%)
Ant corpus callosum 0.667162 0.079716 11.9 0.000828 0.000052 6.2 0.001604 0.000071 4.4 0.000440 0.000092 20.9
Body corpus callosum 0.564869 0.179244 31.7 0.000997 0.000187 18.7 0.001678 0.000091 5.4 0.000657 0.000286 43.5
Post corpus callosum 0.695110 0.101172 14.6 0.000993 0.000335 33.7 0.001812 0.000271 15.0 0.000584 0.000369 63.2
Ant thalamic radiation left 0.407562 0.019832 4.9 0.000833 0.000037 4.5 0.001198 0.000031 2.6 0.000652 0.000042 6.4
Ant thalamic radiation right 0.366557 0.019831 5.4 0.000936 0.000046 5.0 0.001274 0.000036 2.9 0.000768 0.000052 6.7
Sup longitudinal fasciculus left 0.345421 0.012185 3.5 0.000845 0.000027 3.2 0.001135 0.000027 2.4 0.000699 0.000029 4.1
Sup longitudinal fasciculusright
0.371603 0.012607 3.4 0.000828 0.000023 2.7 0.001146 0.000023 2.0 0.000669 0.000024 3.6
Inf longitudinal fasciculus left 0.387245 0.017434 4.5 0.000817 0.000020 2.4 0.001171 0.000018 1.5 0.000641 0.000026 4.0
Inf longitudinal fasciculus right 0.413091 0.019417 4.7 0.000860 0.000029 3.4 0.001258 0.000033 2.6 0.000660 0.000034 5.2
Cingulum left 0.301153 0.035238 11.7 0.000900 0.000051 5.6 0.001184 0.000049 4.1 0.000762 0.000058 7.6
Cingulum right 0.300470 0.051387 17.1 0.001013 0.000098 9.7 0.001311 0.000086 6.5 0.000861 0.000113 13.1
Uncinate fasciculus left 0.399732 0.018942 4.7 0.000816 0.000021 2.6 0.001177 0.000027 2.3 0.000636 0.000024 3.8
Uncinate fasciculus right 0.373047 0.022351 6.0 0.000915 0.000051 5.5 0.001273 0.000046 3.6 0.000736 0.000057 7.7
Corticospinal tract left 0.485927 0.016789 3.5 0.000838 0.000036 4.3 0.001275 0.000034 2.7 0.000621 0.000037 6.0
Corticospinal tract right 0.485927 0.018213 3.7 0.000819 0.000034 4.2 0.001256 0.000030 2.4 0.000603 0.000035 5.9
Forceps Minor 0.391980 0.015603 4.0 0.000895 0.000032 3.6 0.001269 0.000038 3.0 0.000706 0.000035 5.0
Forceps Major 0.410602 0.033072 8.1 0.000934 0.000077 8.2 0.001354 0.000082 6.0 0.000724 0.000082 11.3
Ventral Midbrain 0.575076 0.065234 11.3 0.000806 0.000102 12.6 0.001405 0.000147 10.4 0.000506 0.000089 17.5
Dorsal Midbrain 0.535710 0.037926 7.1 0.000778 0.000044 5.6 0.001262 0.000070 5.5 0.000536 0.000047 8.7
Cerebral peduncle left 0.504359 0.023937 4.7 0.000701 0.000027 3.9 0.001136 0.000041 3.6 0.000483 0.000027 5.6
Cerebral peduncle right 0.527349 0.017429 3.3 0.000683 0.000023 3.4 0.001132 0.000030 2.6 0.000459 0.000026 5.6
Pons left 0.528268 0.030525 5.8 0.000816 0.000091 11.2 0.001308 0.000094 7.2 0.000570 0.000092 16.2
Pons right 0.545961 0.027195 5.0 0.000792 0.000065 8.3 0.001300 0.000062 4.8 0.000537 0.000071 13.2
Mean 0.460182 0.038056 7.9 0.000854 0.000066 7.3 0.001301 0.000062 4.5 0.000631 0.000076 12.4
Intersubject variability for Fractional anisotropy (FA), apparent diffusion coefficient (ADC), axial and radial diffusivity. Data displayed were obtained in 26 subjects andshow mean, standard deviation (SD) and coefficient of variation (CoV).doi:10.1371/journal.pone.0065941.t001
Reproducibility of DTI at 3T
PLOS ONE | www.plosone.org 3 June 2013 | Volume 8 | Issue 6 | e65941

Results
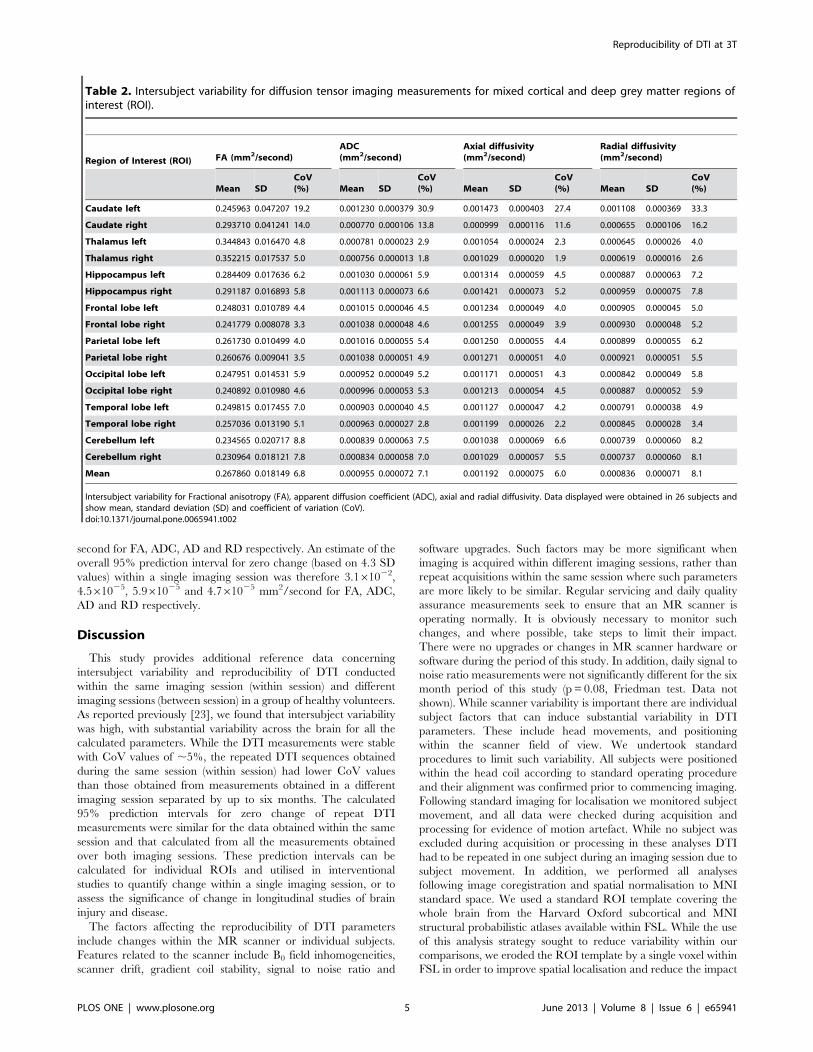
Intersubject variability of diffusion tensor imagingmetricsThe intersubject variability of DTI measurements is displayed in
Tables 1 and 2 for the predominantly white matter and mixed
cortical and deep grey matter regions. The intersubject variability
was high for all the calculated parameters with a mean (range)
CoV across the ROIs for FA of 7.9 (3.3–31.7%) and 6.8 (3.3–
19.2%), ADC of 7.3 (2.4–33.7%) and 7.1 (1.8–30.9%), AD of 4.5
(1.5–15.0%) and 6.0 (1.9–27.4%) and RD of 12.4 (3.6–63.2%) and
8.1 (2.6–33.3%) for the white matter and mixed cortical and deep
grey matter regions respectively.
Within session and between session reproducibility ofdiffusion tensor imagingThe ROI data for within and between session reproducibility
were variable across the different brain regions, but lower than the
values for intersubject variability (Tables 3–6). The within session
reproducibility measurements were significantly lower than
between session reproducibility measurements for all the DTI
parameters (p,0.001, paired ‘t’ test with Bonferroni correction).
As an example, the difference between intersubject variability,
within and between session reproducibility is displayed for FA in
figure 2.
The mean (range) ROI ICC for within session measurements
were for FA 0.79 (0.46–0.99) and 0.81 (0.57–0.93), ADC 0.91
(0.73–0.99) and 0.92 (0.74–0.98), AD 0.82 (0.59–0.98) and 0.89
(0.68–0.98), and for RD 0.89 (0.76–0.99) and 0.91 (0.59–0.99) for
the white matter and mixed cortical and deep grey matter regions
respectively. The between session measurements were for FA 0.78
(0.56–0.98) and 0.69 (0.42–0.93), ADC 0.79 (0.17–0.99) and 0.78
(0.40–0.98), AD 0.74 (0.47–0.98) and 0.68 (0.19–0.98), and for RD
0.82 (0.46–0.99) and 0.79 (0.48–0.99) for the white matter and
mixed cortical and deep grey matter regions respectively.
Calculation of 95% prediction interval for zero changeUsing the four DTI measurements obtained from both sessions
we used ANOVA to determine the significance of the differences
(Table 7). These confirm that there is a significant difference
between regions and subjects, and that there is a significant
interaction between brain region and subject. The residual
variance of the DTI measurements which could not be accounted
for by the known independent variables is shown in Table 7, and
the calculated SD for FA, ADC, AD and RD were 1.261022,
3.261025, 3.261025 and 8.461025 mm2/second respectively.
The overall population 95% prediction intervals for zero change
(based on two SD values) were therefore 2.461022, 6.361025,
6.361025 and 1.761024 mm2/second for FA, ADC, AD and RD
respectively. The calculated SD for the within session measure-
ments were 7.161023, 1.061025, 1.461025 and 1.161025 mm2/
Figure 2. Variability in fractional anisotropy measurements. Box and whisker plot for fractional anisotropy values (mm2/second) for the whitematter region of interest (ROI) measurements. The spread of data within each ROI reflects inter subject variation, while the difference between runs1–2 and 3–4 reflects within session reproducibility, and the change from first to second sessions reflects between session reproducibility. The centrallines in each box denote median values, the lower and upper boundaries the 25th and 75th centile, the error bars the 10th and 90th centile, and theclosed circles outlying data points. Anterior corpus callosum (ACC), body corpus callosum (BCC), posterior corpus callosum (PCC), left anteriorthalamic radiation (ATR L), right anterior thalamic radiation (ATR R), left superior longitudinal fasciculus (SLF L), right superior longitudinal fasciculus(SLF R), left inferior longitudinal fasciculus (ILF L), right inferior longitudinal fasciculus (ILF R), left cingulum (Cingulum L), right cingulum (Cingulum R),left uncinate fasciculus (UFL), right uncinate fasciculus (UFR), left corticospinal tract (CST L), right corticospinal tract (CST R), dorsal midbrain (dorsalMB), ventral midbrain (ventral midbrain), left cerebral peduncle (CP L), right cerebral peduncle (CP R), left pons (pons L) and right pons (pons R).doi:10.1371/journal.pone.0065941.g002
Reproducibility of DTI at 3T
PLOS ONE | www.plosone.org 4 June 2013 | Volume 8 | Issue 6 | e65941
second for FA, ADC, AD and RD respectively. An estimate of the
overall 95% prediction interval for zero change (based on 4.3 SD
values) within a single imaging session was therefore 3.161022,
4.561025, 5.961025 and 4.761025 mm2/second for FA, ADC,
AD and RD respectively.
Discussion
This study provides additional reference data concerning
intersubject variability and reproducibility of DTI conducted
within the same imaging session (within session) and different
imaging sessions (between session) in a group of healthy volunteers.
As reported previously [23], we found that intersubject variability
was high, with substantial variability across the brain for all the
calculated parameters. While the DTI measurements were stable
with CoV values of ,5%, the repeated DTI sequences obtained
during the same session (within session) had lower CoV values
than those obtained from measurements obtained in a different
imaging session separated by up to six months. The calculated
95% prediction intervals for zero change of repeat DTI
measurements were similar for the data obtained within the same
session and that calculated from all the measurements obtained
over both imaging sessions. These prediction intervals can be
calculated for individual ROIs and utilised in interventional
studies to quantify change within a single imaging session, or to
assess the significance of change in longitudinal studies of brain
injury and disease.
The factors affecting the reproducibility of DTI parameters
include changes within the MR scanner or individual subjects.
Features related to the scanner include B0 field inhomogeneities,
scanner drift, gradient coil stability, signal to noise ratio and
software upgrades. Such factors may be more significant when
imaging is acquired within different imaging sessions, rather than
repeat acquisitions within the same session where such parameters
are more likely to be similar. Regular servicing and daily quality
assurance measurements seek to ensure that an MR scanner is
operating normally. It is obviously necessary to monitor such
changes, and where possible, take steps to limit their impact.
There were no upgrades or changes in MR scanner hardware or
software during the period of this study. In addition, daily signal to
noise ratio measurements were not significantly different for the six
month period of this study (p = 0.08, Friedman test. Data not
shown). While scanner variability is important there are individual
subject factors that can induce substantial variability in DTI
parameters. These include head movements, and positioning
within the scanner field of view. We undertook standard
procedures to limit such variability. All subjects were positioned
within the head coil according to standard operating procedure
and their alignment was confirmed prior to commencing imaging.
Following standard imaging for localisation we monitored subject
movement, and all data were checked during acquisition and
processing for evidence of motion artefact. While no subject was
excluded during acquisition or processing in these analyses DTI
had to be repeated in one subject during an imaging session due to
subject movement. In addition, we performed all analyses
following image coregistration and spatial normalisation to MNI
standard space. We used a standard ROI template covering the
whole brain from the Harvard Oxford subcortical and MNI
structural probabilistic atlases available within FSL. While the use
of this analysis strategy sought to reduce variability within our
comparisons, we eroded the ROI template by a single voxel within
FSL in order to improve spatial localisation and reduce the impact
Table 2. Intersubject variability for diffusion tensor imaging measurements for mixed cortical and deep grey matter regions ofinterest (ROI).
Region of Interest (ROI) FA (mm2/second)ADC(mm2/second)
Axial diffusivity(mm2/second)
Radial diffusivity(mm2/second)
Mean SDCoV(%) Mean SD
CoV(%) Mean SD
CoV(%) Mean SD
CoV(%)
Caudate left 0.245963 0.047207 19.2 0.001230 0.000379 30.9 0.001473 0.000403 27.4 0.001108 0.000369 33.3
Caudate right 0.293710 0.041241 14.0 0.000770 0.000106 13.8 0.000999 0.000116 11.6 0.000655 0.000106 16.2
Thalamus left 0.344843 0.016470 4.8 0.000781 0.000023 2.9 0.001054 0.000024 2.3 0.000645 0.000026 4.0
Thalamus right 0.352215 0.017537 5.0 0.000756 0.000013 1.8 0.001029 0.000020 1.9 0.000619 0.000016 2.6
Hippocampus left 0.284409 0.017636 6.2 0.001030 0.000061 5.9 0.001314 0.000059 4.5 0.000887 0.000063 7.2
Hippocampus right 0.291187 0.016893 5.8 0.001113 0.000073 6.6 0.001421 0.000073 5.2 0.000959 0.000075 7.8
Frontal lobe left 0.248031 0.010789 4.4 0.001015 0.000046 4.5 0.001234 0.000049 4.0 0.000905 0.000045 5.0
Frontal lobe right 0.241779 0.008078 3.3 0.001038 0.000048 4.6 0.001255 0.000049 3.9 0.000930 0.000048 5.2
Parietal lobe left 0.261730 0.010499 4.0 0.001016 0.000055 5.4 0.001250 0.000055 4.4 0.000899 0.000055 6.2
Parietal lobe right 0.260676 0.009041 3.5 0.001038 0.000051 4.9 0.001271 0.000051 4.0 0.000921 0.000051 5.5
Occipital lobe left 0.247951 0.014531 5.9 0.000952 0.000049 5.2 0.001171 0.000051 4.3 0.000842 0.000049 5.8
Occipital lobe right 0.240892 0.010980 4.6 0.000996 0.000053 5.3 0.001213 0.000054 4.5 0.000887 0.000052 5.9
Temporal lobe left 0.249815 0.017455 7.0 0.000903 0.000040 4.5 0.001127 0.000047 4.2 0.000791 0.000038 4.9
Temporal lobe right 0.257036 0.013190 5.1 0.000963 0.000027 2.8 0.001199 0.000026 2.2 0.000845 0.000028 3.4
Cerebellum left 0.234565 0.020717 8.8 0.000839 0.000063 7.5 0.001038 0.000069 6.6 0.000739 0.000060 8.2
Cerebellum right 0.230964 0.018121 7.8 0.000834 0.000058 7.0 0.001029 0.000057 5.5 0.000737 0.000060 8.1
Mean 0.267860 0.018149 6.8 0.000955 0.000072 7.1 0.001192 0.000075 6.0 0.000836 0.000071 8.1
Intersubject variability for Fractional anisotropy (FA), apparent diffusion coefficient (ADC), axial and radial diffusivity. Data displayed were obtained in 26 subjects andshow mean, standard deviation (SD) and coefficient of variation (CoV).doi:10.1371/journal.pone.0065941.t002
Reproducibility of DTI at 3T
PLOS ONE | www.plosone.org 5 June 2013 | Volume 8 | Issue 6 | e65941

Table
3.Within
andbetw
eensessionvariab
ility
ofdiffusiontensorim
agingregionofinterest
measurements.
FA
ADC
AD
RD
Within
session
repro
ducibility
Betw
eense
ssion
repro
ducibility
Within
session
repro
ducibility
Betw
eense
ssion
repro
ducibility
Within
session
repro
ducibility
Betw
eense
ssion
repro
ducibility
Within
session
repro
ducibility
Betw
eense
ssion
repro
ducibility
Antco
rpusca
llosu
m2.06102261.661022
1.96102261.761022
1.26102561.161025
1.56102561.261025
2.26102562.061025
2.56102562.161025
1.96102561.961025
2.36102562.361025
Bodyco
rpusca
llosu
m1.76102261.561022
1.86102261.861022
2.36102562.261025
3.26102562.861025
2.66102562.861025
3.56102562.561025
2.46102562.461025
3.36102563.561025
Post
corp
usca
llosu
m1.06102261.561022
1.06102268.261023
2.26102563.761025
2.36102562.461025
2.16102562.861025
2.36102562.061025
2.26102564.161025
2.26102562.961025
Antth
alamic
radiation
left
3.66102365.161023
4.66102364.661023
6.46102661.061025
9.76102669.961026
7.46102668.161026
1.16102569.261026
6.56102661.261025
9.66102661.161025
Antth
alamic
radiation
right
4.56102366.061023
5.36102364.961023
8.76102661.761025
1.16102561.461025
8.86102661.561025
1.36102561.261025
9.56102661.961025
1.26102561.561025
Suplongitudinal
fasciculusleft
4.96102361.961022
4.46102361.461022
5.66102662.261025
8.26102661.761025
9.16102663.861025
1.26102563.061025
4.26102661.461025
6.76102661.261025
Suplongitudinal
fasciculusright
5.46102361.961022
5.96102361.461022
3.36102661.061025
7.76102661.061025
6.66102662.661025
1.36102562.261025
2.56102663.261026
6.06102665.661026
Inflongitudinal
fasciculusleft
5.16102361.761022
4.96102361.261022
3.16102662.761026
6.16102665.361026
5.76102661.661025
7.96102661.461025
4.76102669.961026
7.36102668.061026
Inflongitudinal
fasciculusright
5.26102361.361022
5.16102369.661023
4.36102665.561026
7.96102666.461026
7.06102661.661025
9.56102661.361025
6.26102661.061025
8.96102668.161026
Cingulum
left
7.36102368.361023
7.96102367.161023
1.26102561.461025
1.36102561.061025
1.66102562.061025
1.66102561.661025
1.36102561.561025
1.46102561.261025
Cingulum
right
8.06102369.561023
9.66102368.361023
1.96102561.561025
2.26102561.861025
2.46102561.861025
2.56102561.961025
1.96102561.761025
2.06102561.861025
Uncinate
fasciculusleft
4.66102368.061023
5.46102366.761023
4.76102665.361026
7.36102666.861026
6.46102664.961026
9.66102668.361026
6.66102661.261025
9.16102661.061025
Uncinate
fasciculus
right
4.86102364.261023
4.76102363.461023
7.76102669.061026
9.06102668.561026
8.26102669.461026
1.06102568.561026
9.76102669.761026
1.06102568.961026
Corticosp
inaltract
left
6.76102362.061022
6.56102361.561022
6.46102661.061025
9.96102661.061025
1.06102562.861025
1.46102562.261025
6.86102661.261025
1.06102561.161025
Corticosp
inaltract
right6.46102361.561022
7.06102361.261022
5.36102667.761026
9.26102669.661026
8.96102662.061025
1.46102561.861025
6.06102661.361025
9.66102661.361025
ForcepsMinor
5.56102366.961023
6.96102366.261023
7.96102668.461026
1.06102568.261026
9.46102669.061026
1.46102561.161025
8.96102661.161025
1.26102568.761026
ForcepsMajor
5.46102361.561022
4.36102361.161022
4.66102666.661026
7.36102666.761026
7.96102662.161025
1.06102561.761025
5.66102667.561026
7.46102665.861026
VentralMidbrain
3.06102263.761022
2.66102262.561022
3.06102562.661025
4.36102563.461025
5.16102565.161025
6.36102564.461025
2.26102561.861025
2.96102562.361025
DorsalMidbrain
1.36102261.161022
2.16102261.861022
1.36102561.461025
3.16102563.761025
1.66102561.661025
3.56102563.561025
1.96102561.961025
2.56102562.861025
Cerebralpeduncleleft
7.56102367.661023
9.36102367.461023
8.86102661.161025
1.56102561.361025
1.46102561.561025
2.06102561.561025
9.46102661.061025
1.46102561.361025
Cerebralpeduncleright5.96102364.361023
6.96102365.061023
7.46102666.261026
1.16102568.761026
1.26102561.061025
1.76102561.261025
8.56102668.361026
1.36102561.661025
Ponsleft
8.96102368.161023
1.26102261.161022
1.36102561.261025
3.16102562.261025
1.66102561.561025
3.66102562.361025
1.76102561.661025
2.86102563.061025
Ponsright
7.76102367.361023
1.36102267.461023
1.16102569.361026
2.76102562.161025
1.56102561.361025
2.76102562.461025
1.46102561.261025
2.76102562.661025
Mean
7.16102361.361022
8.36102361.161022
1.06102561.661025
1.76102562.161025
1.46102562.261025
2.16102562.561025
1.16102561.761025
1.66102562.161025
Individualwhitematterregionofinterestmeasurementsforwithin
sessionreproducibility
obtainedin
thefirstan
dsecondim
agingsessionsin
26an
d22subjectsrespectively,andthebetw
eensessionreproducibility
forthose
22
subjectswhounderw
entim
agingat
both
sessions.Datadisplayedarestan
darddeviationofmeasurements
forfractional
anisotropy(FA),ap
parentdiffusioncoefficient(ADC),axial(AD)an
dradial(RD)diffusivity.
doi:10.1371/journal.pone.0065941.t003
Reproducibility of DTI at 3T
PLOS ONE | www.plosone.org 6 June 2013 | Volume 8 | Issue 6 | e65941

Table
4.Within
andbetw
eensessionvariab
ility
ofdiffusiontensorim
agingregionofinterest
measurements.
FA
ADC
AD
RD
Within
session
repro
ducibility
Betw
eense
ssion
repro
ducibility
Within
session
repro
ducibility
Betw
eense
ssion
repro
ducibility
Within
session
repro
ducibility
Betw
eense
ssion
repro
ducibility
Within
session
repro
ducibility
Betw
eense
ssion
repro
ducibility
Caudate
left
9.06102367.561023
9.16102368.561023
4.16102564.161025
4.26102563.561025
4.86102564.561025
4.96102564.061025
3.16102563.561025
3.06102562.761025
Caudate
right
9.26102368.161023
9.76102367.261023
1.46102561.961025
1.96102563.361025
1.56102561.961025
2.16102563.561025
1.36102561.961025
1.76102563.261025
Thalamus
left
6.16102364.561023
6.86102364.961023
7.96102666.861026
1.16102568.461026
1.16102568.361026
1.66102561.161025
7.86102668.261026
1.16102561.661025
Thalamus
right
5.76102364.961023
6.96102365.761023
6.26102664.861026
8.86102666.161026
8.26102667.861026
1.46102569.861026
7.56102667.961026
1.16102561.761025
Hippoca
mpus
left
4.26102364.861023
4.86102364.361023
7.06102668.461026
1.36102561.161025
8.56102668.161026
1.46102561.261025
8.26102661.261025
1.46102562.061025
Hippoca
mpus
right
4.76102366.761023
5.76102363.861023
9.76102669.861026
1.66102561.261025
1.16102569.061026
1.66102561.361025
9.26102661.261025
1.66102561.961025
Fro
ntallobe
left
3.16102363.761023
4.16102364.161023
9.16102669.661026
2.06102561.661025
1.16102561.361025
2.36102562.061025
9.66102668.061026
1.56102561.361025
Fro
ntallobe
right
3.26102363.061023
3.96102363.661023
9.06102668.461026
2.06102561.761025
1.16102561.161025
2.46102562.161025
8.96102667.761026
1.66102561.461025
Parietallobe
left
3.76102364.361023
4.96102364.961023
7.36102668.461026
1.36102561.261025
9.16102661.161025
1.76102561.661025
7.16102668.261026
1.36102561.361025
Parietallobe
right
2.46102362.861023
4.06102363.661023
4.56102663.361026
1.26102561.261025
5.16102664.361026
1.46102561.461025
5.76102666.361026
1.26102561.461025
Occipitallobe
left
5.06102366.861023
5.56102365.261023
6.56102666.861026
1.36102569.461026
9.36102661.061025
1.56102561.261025
6.46102667.261026
1.26102561.461025
Occipitallobe
right
3.76102364.761023
4.46102364.861023
6.36102666.661025
1.36102561.261025
8.86102669.261026
1.56102561.561025
7.46102668.161026
1.46102561.761025
Temporallobe
left
6.76102368.561023
6.76102367.561023
1.06102569.461026
1.36102561.161025
1.46102561.461025
1.76102561.661025
8.66102668.261026
1.46102561.661025
Temporallobe
right
4.46102365.161023
4.76102364.861023
7.06102665.461026
1.16102568.561026
8.96102668.161026
1.36102561.061025
1.36102564.461025
1.56102563.661025
Cerebellum
left
4.56102364.761023
1.36102261.361022
1.26102561.561025
3.56102563.861025
1.56102561.961025
4.46102564.961025
1.36102561.461025
2.46102562.761025
Cerebellum
right
4.06102364.461023
1.26102261.261022
8.96102661.161025
3.16102563.461025
1.26102561.361025
4.06102564.261025
1.26102561.261025
2.46102562.461025
Mean
5.06102365.861023
6.66102367.261023
1.06102561.661025
1.86102562.261025
1.36102561.861025
2.26102562.761025
1.16102561.861025
1.66102562.261025
Individual
mixedcortical
anddeepgreymatterregionofinterest
measurements
forwithin
sessionreproducibility
obtainedin
thefirstan
dsecondim
agingsessionsin
26an
d22subjectsrespectively,an
dthebetw
eensession
reproducibility
forthose
22subjectswhounderw
entim
agingat
both
sessions.Datadisplayedarestan
darddeviationofmeasurements
forfractionalan
isotropy(FA),ap
parentdiffusioncoefficient(ADC),axial(AD)an
dradial(RD)
diffusivity.
doi:10.1371/journal.pone.0065941.t004
Reproducibility of DTI at 3T
PLOS ONE | www.plosone.org 7 June 2013 | Volume 8 | Issue 6 | e65941

Table
5.Within
andbetw
eensessionvariab
ility
ofdiffusiontensorim
agingregionofinterest
measurements.
FA
ADC
AD
RD
Within
session
repro
ducibility
Betw
eense
ssion
repro
ducibility
Within
session
repro
ducibility
Betw
eense
ssion
repro
ducibility
Within
session
repro
ducibility
Betw
eense
ssion
repro
ducibility
Within
session
repro
ducibility
Betw
eense
ssion
repro
ducibility
Antco
rpusca
llosu
m3.262.6
3.062.7
1.561.3
1.961.4
1.461.3
1.661.3
4.364.6
5.265.0
Bodyco
rpusca
llosu
m3.663.6
3.864.2
2.462.4
3.162.7
1.661.7
2.161.6
3.964.6
5.265.7
Post
corp
usca
llosu
m1.662.1
1.561.3
2.263.4
2.262.1
1.161.4
1.361.0
3.866.6
4.064.2
Antth
alamic
radiation
left
0.961.3
1.161.1
0.861.2
1.261.2
0.660.7
0.960.8
1.061.8
1.461.6
Antth
alamic
radiation
right
1.361.6
1.561.4
0.961.8
1.261.4
0.761.2
1.060.9
1.262.3
1.561.8
Suplongitudinal
fasciculusleft
1.767.4
1.465.5
0.763.0
1.062.3
0.964.0
1.163.1
0.662.3
1.061.8
Suplongitudinal
fasciculusright
1.766.3
1.764.7
0.461.4
1.061.3
0.662.6
1.162.2
0.460.5
0.960.9
Inflongitudinal
fasciculusleft
1.465.0
1.363.6
0.460.3
0.760.7
0.561.4
0.761.2
0.761.5
1.161.2
Inflongitudinal
fasciculusright
1.363.5
1.362.5
0.560.7
0.960.7
0.661.3
0.861.1
0.961.6
1.461.2
Cingulum
left
2.562.8
2.762.3
1.361.5
1.461.1
1.361.6
1.461.3
1.761.9
1.961.6
Cingulum
right
2.763.0
3.262.6
1.961.5
2.261.8
1.861.4
1.961.5
2.261.9
2.462.0
Uncinate
fasciculusleft
1.262.1
1.461.8
0.660.6
0.960.8
0.560.4
0.860.7
1.061.8
1.461.5
Uncinate
fasciculus
right
1.361.2
1.360.9
0.861.0
1.060.9
0.660.8
0.860.7
1.361.4
1.461.2
Corticosp
inaltract
left
1.564.8
1.463.5
0.861.4
1.261.3
0.862.4
1.161.9
1.161.9
1.961.8
Corticosp
inaltract
right1.463.6
1.562.9
0.761.0
1.161.2
0.761.7
1.161.5
1.062.1
1.662.1
ForcepsMinor
1.561.9
1.861.7
0.960.9
1.160.9
0.760.7
1.160.8
1.361.5
1.661.2
ForcepsMajor
1.564.4
1.163.2
0.560.8
0.860.8
0.661.8
0.861.4
0.861.1
1.060.8
VentralMidbrain
5.566.6
4.764.4
3.963.5
5.764.5
3.864.0
4.763.4
4.363.6
5.864.5
DorsalMidbrain
2.562.2
4.063.4
1.761.7
3.864.4
1.361.2
2.762.5
3.363.0
4.564.9
Cerebralpeduncleleft
1.561.6
1.861.5
1.361.6
2.261.9
1.261.4
1.861.4
1.962.1
3.062.6
Cerebralpeduncleright1.160.9
1.360.9
1.160.9
1.761.3
1.060.9
1.561.1
1.861.7
2.863.3
Ponsleft
1.761.6
2.362.1
1.561.5
3.862.8
1.261.2
2.861.8
2.962.6
4.965.4
Ponsright
1.461.4
2.361.4
1.461.2
3.462.6
1.261.0
2.161.8
2.662.0
4.864.4
Mean
1.963.7
2.163.0
1.261.9
1.962.4
1.161.9
1.561.9
1.962.9
2.663.5
Individualwhitematterregionofinterestmeasurementsforwithin
sessionreproducibility
obtainedin
thefirstan
dsecondim
agingsessionsin
26an
d22subjectsrespectively,andthebetw
eensessionreproducibility
forthose
22
subjectswhounderw
entim
agingat
both
sessions.Datadisplayedarepercentagecoefficientofvariationofmeasurements
forfractional
anisotropy(FA),ap
parentdiffusioncoefficient(ADC),axial(AD)an
dradial(RD)diffusivity.
doi:10.1371/journal.pone.0065941.t005
Reproducibility of DTI at 3T
PLOS ONE | www.plosone.org 8 June 2013 | Volume 8 | Issue 6 | e65941

Table
6.Within
andbetw
eensessionvariab
ility
ofdiffusiontensorim
agingregionofinterest
measurements.
FA
ADC
AD
RD
Within
session
repro
ducibility
Betw
eense
ssion
repro
ducibility
Within
session
repro
ducibility
Betw
eense
ssion
repro
ducibility
Within
session
repro
ducibility
Betw
eense
ssion
repro
ducibility
Within
session
repro
ducibility
Betw
eense
ssion
repro
ducibility
Caudate
left
3.863.4
3.964.0
3.363.3
3.663.0
3.262.9
3.462.8
2.963.2
3.062.8
Caudate
right
3.262.9
3.462.5
1.762.2
2.263.0
1.461.7
2.062.6
1.962.5
2.263.4
Thalamusleft
1.861.3
2.061.5
1.060.9
1.461.1
1.060.8
1.561.0
1.261.2
1.662.3
Thalamusright1.661.4
2.061.6
0.860.6
1.260.8
0.860.8
1.361.0
1.261.1
1.862.5
Hippoca
mpus
left
1.561.7
1.761.6
0.760.8
1.261.1
0.660.6
1.160.9
0.961.3
1.662.2
Hippoca
mpus
right
1.662.3
2.061.4
0.960.9
1.461.1
0.860.6
1.160.9
1.061.3
1.762.0
Fro
ntallobe
left
1.261.5
1.761.6
0.961.0
1.961.6
0.961.0
1.961.6
1.160.9
1.661.5
Fro
ntallobe
right
1.461.2
1.661.5
0.960.8
2.061.7
0.960.9
1.961.7
1.060.8
1.761.5
Parietallobe
left
1.461.6
1.961.9
0.760.8
1.361.2
0.760.9
1.361.2
0.860.9
1.461.4
Parietallobe
right
0.961.1
1.661.4
0.460.3
1.261.2
0.460.3
1.261.2
0.660.6
1.361.5
Occipitallobe
left
2.162.8
2.262.1
0.760.7
1.361.0
0.860.8
1.361.0
0.760.8
1.461.6
Occipitallobe
right
1.662.0
1.962.0
0.660.6
1.361.2
0.760.7
1.361.2
0.860.8
1.561.8
Temporallobe
left
2.763.4
2.863.0
1.161.0
1.561.2
1.361.2
1.561.4
1.161.0
1.861.9
Temporallobe
right
1.762.0
1.961.9
0.760.6
1.260.9
0.760.7
1.160.9
1.866.9
1.965.3
Cerebellum
left2.162.5
5.966.4
1.562.1
4.364.9
1.562.1
4.465.1
1.761.9
3.363.8
Cerebellum
right
1.962.2
5.566.3
1.161.4
3.864.0
1.261.4
4.064.2
1.661.7
3.263.1
Mean
1.962.3
2.663.3
1.161.5
1.962.4
1.161.4
1.962.4
1.362.3
1.962.7
Individual
mixedcortical
anddeepgreyregionofinterest
measurements
forwithin
sessionreproducibility
obtainedin
thefirstan
dsecondim
agingsessionsin
26an
d22subjectsrespectively,an
dthebetw
eensession
reproducibility
forthose
22subjectswhounderw
entim
agingat
both
sessions.Datadisplayedarepercentagecoefficientofvariationofmeasurements
forfractionalan
isotropy(FA),ap
parentdiffusioncoefficient(ADC),axial(AD)
andradial(RD)diffusivity.
doi:10.1371/journal.pone.0065941.t006
Reproducibility of DTI at 3T
PLOS ONE | www.plosone.org 9 June 2013 | Volume 8 | Issue 6 | e65941

of coregistration, normalisation and partial volume errors. Finally,
all ROIs were manually inspected to ensure that they were aligned
with the imaging data and corresponded to the regions specified.
In summary, we considered possible sources of DTI variability
within our centre and attempted to limit their impact and ensure
that the data we acquired were comparable within and between
the different imaging sessions.
While our results for DTI reproducibility are in line with
published data [12,19,37], we report data specifically concerning
the difference between intersubject variability, within session and
between session reproducibility. It is useful to consider the sources
of variability in DTI data in the setting where we are trying to
address the significance of changes between normal physiology
and disease states, or changes that are the consequence of a
therapeutic intervention. In the first case, the relevant sources of
error are the intersubject variability in the patient and volunteer
groups. Our data for healthy volunteers are broadly concordant
with results from other groups [23], and show that these are high,
with mean (range) CoV of 7% (3–32) for FA, 7% (2–34) for ADC,
5% (2–27) for axial diffusivity and 11% (3–63) for radial diffusivity.
To be certain that DTI values derived from an individual patient
are significantly lower, with a confidence of 95%, these figures
suggest that we need to have mean ROI FA values (for example)
that are at least 14% lower than volunteer means. This estimate,
and the secure distinction of a patient group as abnormal, is
further confounded by the fact that intersubject CoV in patients
with neurological disorders is larger [38,39], and is variable across
different brain regions. These figures underline the difficulty of
using DTI in small groups of patients with various causes of
neurological disease who have variable pathophysiology. In
practice, however, estimated sample sizes in such studies are
moderated by the fact that the changes in DTI are often dramatic,
and significance is often detected with manageable numbers,
despite the large intersubject variability in volunteer and patients
groups [38,39].
However, it is important to point out that these figures are
largely irrelevant when considering the power and design of
clinical studies, when DTI is being used to monitor changes within
the same subject in the same scanning session (within session
reproducibility) or during longitudinal assessments over time in
several different imaging sessions (between session reproducibility).
In such settings, the subject is his or her own control, and the
relevant parameter is intrasubject variability or reproducibility.
Our data show that these figures for CoV are much smaller than
those obtained from the discussion in the previous paragraph. In
addition, we provide reference data for FA, ADC, AD and RD in
healthy volunteers demonstrating that the CoV for within session
reproducibility is lower than between session reproducibility
(Tables 3–6). These data provide helpful guidance for designing
clinical studies, and suggest that it should be possible to detect
differences of approximately 5 to 10% with confidence, particu-
larly within single session interventional studies. For example,
although the reproducibility of measurements is variable for the
different brain regions we can use these data to calculate sample
sizes for interventional and longitudinal clinical studies. Even
when we consider the brain region with the highest CoV (ventral
midbrain) we should be able to detect a 10% change in DTI with
95% power at a significance level of 1% within a group of 10
subjects within a single interventional or longitudinal study design
[40]. Clearly, such estimates only strictly apply to our scanner and
institution, but they provide a useful starting point for study design.
There are a number of factors particular to our scanning protocols
and institutional setup that limit the use of the reproducibility
measurements that we provide. These include, but might not be
limited to, scanner, acquisition protocols, data correction and
reconstruction, and processing. Despite these variations, it should
be possible for other groups to use the methodology that we
describe to derive ‘in house’ data for their studies. In addition,
although these data provide guidance for designing clinical studies,
particular groups of subjects (including those with brain injury)
may require sedation and control of ventilation as part of clinical
Table 7. Analysis of variance table for diffusion tensor imaging parameters.
Parameter Session DF Sum of Squares Mean Square F Value p Value
FA ROI 38 5.46101 1.4 9.66103 ,.0001
subject 21 3.561021 1.761022 1.16102 ,.0001
ROI * subject 798 5.3 6.661023 4.46101 ,.0001
Residual 2574 3.861021 1.561024
ADC ROI 38 4.661025 1.261026 2.16103 ,.0001
subject 21 2.261026 1.161027 1.96102 ,.0001
ROI * subject 798 2.961025 3.661028 6.46101 ,.0001
Residual 2574 1.561026 5.7610210
AD ROI 38 9.561025 2.561026 3.06103 ,.0001
subject 21 1.961026 8.961028 1.16102 ,.0001
ROI * subject 798 2.761025 3.461028 4.16101 ,.0001
Residual 2574 2.161026 8.3610210
RD ROI 38 7.361025 1.961026 2.86102 ,.0001
subject 21 2.061026 9.561028 1.4 ,.0001
ROI * subject 798 2.561025 3.261028 4.6 ,.0001
Residual 2574 1.861025 6.961029
Data (mm2/second) were obtained from 26 volunteers using the region of interest (ROI) template for fractional anisotropy (FA), apparent diffusion coefficient (ADC),axial diffusivity (AD), and radial diffusivity (RD). Degrees of freedom (DF).doi:10.1371/journal.pone.0065941.t007
Reproducibility of DTI at 3T
PLOS ONE | www.plosone.org 10 June 2013 | Volume 8 | Issue 6 | e65941

care. While such patient groups may appear complex and difficult
to manage within the context of an imaging study the fact that
they remain completely immobile and have stable physiology
should result in lower CoV for reproducibility measurements and
an increase in the sensitivity of interventional studies [41].
Methodological limitationsWhile we were able to obtain multiple DTI datasets on up to
two occasions in this group of volunteers, scanner availability and
subject tolerance prevented us from acquiring further DTI
datasets within the same session and additional scanning sessions.
We found that the within session reproducibility measurements
were lower than between session reproducibility measurements
obtained over a six month period. The expected change in DTI in
healthy volunteers of a similar age over a period of up to six
months is small and unlikely to have resulted in the differences we
have found [42,43]. The 95% prediction intervals for zero change
for the within session DTI measurements were similar to that
calculated from the DTI measurements obtained within all
sessions. The lack of difference between these measures could be
related to the fact that we were only able to obtain two sets of DTI
within each session and that the 95% prediction interval for zero
change for within session measurements is based on 4.3 rather
than 2 SDs. These overall prediction intervals for zero change are
calculated from all the ROI data, but can easily be calculated for
individual ROIs using the same technique and used as a method
for determining the significance of changes following an interven-
tion or longitudinal change over time.
There were differences in the intersubject variability and
reproducibility of DTI across the different brain regions. These
differences are demonstrated in Tables 1–6 and figure 2, and are
particularly relevant within the corpus callosum, caudate, cingu-
lum and midbrain structures. The increase in variability and lower
reproducibility of these regions may be related to partial volume
errors within these relatively small structures secondary to
variation in the quality of coregistration and spatial normalisation
within individual subjects. We tried to limit these errors by eroding
the ROI template by a single voxel to improve accuracy. Despite
this, errors remain within some ROIs where DTI values differ in
closely adjacent brain regions. However, the purpose of this study
was to determine the variability of measurements using an ROI
template and standard processing pipeline. While variability in the
fitting of template ROIs in individual subjects may result in higher
intersubject variability for particular brain regions this is less likely
for measurements of reproducibility within the same subject. Here
any differences in ROI template fitting between the sessions are
likely to be small. However, these regional differences underline
that DTI studies seeking to compare different subject groups or
assess interventional or longitudinal change should compare data
from within the same brain region using the same data processing
technique. While the data we report are specific to our methods
the reproducibility measurements that we report provide a useful
starting point for study design.
Conclusions
This study provides additional reference data concerning
intersubject variability and reproducibility of DTI conducted in
a group of healthy volunteers. The CoV for repeat DTI
measurements obtained during the same session were lower than
those obtained from measurements obtained in a different imaging
session separated by up to six months. These data can be used to
calculate the 95% prediction interval for zero change and may
inform the design of interventional studies to quantify change
within a single imaging session, or to assess the significance of
change in longitudinal studies.
Author Contributions
Conceived and designed the experiments: TVV JPC DKM GBW.
Performed the experiments: TV EC JG VFJN JGO VL. Analyzed the
data: TV JPC EC JG VFJN GBW. Contributed reagents/materials/
analysis tools: TV JPC GBW. Wrote the paper: TV JPC EC JG VFJN
JGO VL GBW DKM.
References
1. Newcombe VFJ, Outtrim JG, Chatfield DA, Manktelow A, Hutchinson PJ, et al.(2011) Parcellating the neuroanatomical basis of impaired decision-making in
traumatic brain injury. Brain 134: 759–768.
2. Kraus MF, Susmaras T, Caughlin BP, Walker CJ, Sweeney JA, et al. (2007)White matter integrity and cognition in chronic traumatic brain injury: a
diffusion tensor imaging study. Brain 130: 2508–2519.
3. Ling JM, Pena A, Yeo RA, Merideth FL, Klimaj S, et al. (2012) Biomarkers of
increased diffusion anisotropy in semi-acute mild traumatic brain injury: a
longitudinal perspective. Brain 135: 1281–1292.
4. Hannoun S, Durand-Dubief F, Confavreux C, Ibarrola D, Streichenberger N, et
al. (2012) Diffusion Tensor-MRI Evidence for Extra-Axonal Neuronal
Degeneration in Caudate and Thalamic Nuclei of Patients with MultipleSclerosis. AJNR Am J Neuroradiol 33: 1363–1368.
5. Senda J, Watanabe H, Tsuboi T, Hara K, Watanabe H, et al. (2012) MRI meandiffusivity detects widespread brain degeneration in multiple sclerosis. J Neurol
Sci 319: 105–110.
6. Cassol E, Ranjeva JP, Ibarrola D, Mekies C, Manelfe C, et al. (2004) Diffusiontensor imaging in multiple sclerosis: a tool for monitoring changes in normal-
appearing white matter. Mult Scler 10: 188–196.
7. Bozzali M, Falini A, Franceschi M, Cercignani M, Zuffi M, et al. (2002) Whitematter damage in Alzheimer’s disease assessed in vivo using diffusion tensor
magnetic resonance imaging. J Neurol Neurosurg Psychiatry 72: 742–746.
8. Assaf Y, Pasternak O (2008) Diffusion tensor imaging (DTI)-based white mattermapping in brain research: a review. J Mol Neurosci 34: 51–61.
9. Friston KJ, Frith CD (1995) Schizophrenia: a disconnection syndrome? Clin
Neurosci 3: 89–97.
10. Brander A, Kataja A, Saastamoinen A, Ryymin P, Huhtala H, et al. (2010)
Diffusion tensor imaging of the brain in a healthy adult population: Normative
values and measurement reproducibility at 3 T and 1.5 T. Acta Radiol 51: 800–807.
11. Cercignani M, Bammer R, Sormani MP, Fazekas F, Filippi M (2003) Inter-
sequence and inter-imaging unit variability of diffusion tensor MR imaging
histogram-derived metrics of the brain in healthy volunteers. AJNR
Am J Neuroradiol 24: 638–643.
12. Takao H, Hayashi N, Kabasawa H, Ohtomo K (2012). Effect of scanner in
longitudinal diffusion tensor imaging studies. Hum Brain Mapp 33: 466–477.
13. Takao H, Abe O, Yamasue H, Aoki S, Sasaki H, et al. (2011) Gray and white
matter asymmetries in healthy individuals aged 21–29 years: a voxel-based
morphometry and diffusion tensor imaging study. Hum Brain Mapp 32: 1762–
1773.
14. Jansen JFA, Kooi ME, Kessels AGH, Nicolay K, Backes WH (2007)
Reproducibility of quantitative cerebral T2 relaxometry, diffusion tensor
imaging, and 1H magnetic resonance spectroscopy at 3.0 Tesla. Invest Radiol
42: 327–337.
15. Farrell JAD, Landman BA, Jones CK, Smith SA, Prince JL, et al. (2007) Effects
of signal-to-noise ratio on the accuracy and reproducibility of diffusion tensor
imaging-derived fractional anisotropy, mean diffusivity, and principal eigenvec-
tor measurements at 1.5 T. J Magn Reson Imaging 26: 756–767.
16. Pfefferbaum A, Adalsteinsson E, Sullivan EV (2003) Replicability of diffusion
tensor imaging measurements of fractional anisotropy and trace in brain. J Magn
Reson Imaging 18: 427–433.
17. Huppertz HJ, Kroll-Seger J, Kloppel S, Ganz RE, Kassubek J (2010) Intra- and
interscanner variability of automated voxel-based volumetry based on a 3D
probabilistic atlas of human cerebral structures. Neuroimage 49: 2216–2224.
18. Ciccarelli O, Toosy AT, Parker GJM, Wheeler-Kingshott CAM, Barker GJ, et
al. (2003) Diffusion tractography based group mapping of major white-matter
pathways in the human brain. Neuroimage 19: 1545–1555.
19. Danielian LE, Iwata NK, Thomasson DM, Floeter MK (2010) Reliability of
fiber tracking measurements in diffusion tensor imaging for longitudinal study.
Neuroimage 49: 1572–1580.
20. Ciccarelli O, Parker GJM, Toosy AT, Wheeler-Kingshott CAM, Barker GJ, et
al. (2003) From diffusion tractography to quantitative white matter tract
measures: a reproducibility study. Neuroimage 18: 348–359.
Reproducibility of DTI at 3T
PLOS ONE | www.plosone.org 11 June 2013 | Volume 8 | Issue 6 | e65941

21. Hermoye L, Saint-Martin C, Cosnard G, Lee SK, Kim J, et al. (2006) Pediatric
diffusion tensor imaging: normal database and observation of the white mattermaturation in early childhood. Neuroimage 29: 493–504.
22. Wakana S, Caprihan A, Panzenboeck MM, Fallon JH, Perry M, et al. (2007)
Reproducibility of quantitative tractography methods applied to cerebral whitematter. Neuroimage 36: 630–644.
23. Heiervang E, Behrens TEJ, Mackay CE, Robson MD, Johansen-Berg H (2006)Between session reproducibility and between subject variability of diffusion MR
and tractography measures. Neuroimage 33: 867–877.
24. Takao H, Hayashi N, Ohtomo K (2011) Effect of scanner in asymmetry studiesusing diffusion tensor imaging. Neuroimage 54: 1053–1062.
25. Zhu T, Hu R, Qiu X, Taylor M, Tso Y, et al. (2011) Quantification of accuracyand precision of multi-center DTI measurements: a diffusion phantom and
human brain study. Neuroimage 56: 1398–1411.26. Vollmar C, O’Muircheartaigh J, Barker GJ, Symms MR, Thompson P, et al.
(2010). Identical, but not the same: intra-site and inter-site reproducibility of
fractional anisotropy measures on two 3.0T scanners. Neuroimage 51: 1384–1394.
27. Lemkaddem A, Daducci A, Vulliemoz S, O’Brien K, Lazeyras F, et al. (2012). Amulti-center study: Intra-scan and inter-scan variability of diffusion spectrum
imaging. Neuroimage 62: 87–94.
28. Teipel SJ, Reuter S, Stieltjes B, Acosta-Cabronero J, Ernemann U, et al. (2011)Multicenter stability of diffusion tensor imaging measures: a European clinical
and physical phantom study. Psychiatry Res 194: 363–371.29. Huisman TAGM, Loenneker T, Barta G, Bellemann ME, Hennig J, et al. (2006)
Quantitative diffusion tensor MR imaging of the brain: field strength relatedvariance of apparent diffusion coefficient (ADC) and fractional anisotropy (FA)
scalars. Eur Radiol 16: 1651–1658.
30. Landman BA, Farrell JAD, Jones CK, Smith SA, Prince JL, et al. (2007) Effectsof diffusion weighting schemes on the reproducibility of DTI-derived fractional
anisotropy, mean diffusivity, and principal eigenvector measurements at 1.5T.Neuroimage 36: 1123–1138.
31. Smith SM, Jenkinson M, Woolrich MW, Beckmann CF, Behrens TEJ, et al.
(2004) Advances in functional and structural MR image analysis andimplementation as FSL. Neuroimage 23 Suppl 1: S208–S219.
32. Woolrich MW, Jbabdi S, Patenaude B, Chappell M, Makni S, et al. (2009)
Bayesian analysis of neuroimaging data in FSL. Neuroimage 45: S173–S186.
33. Smith SM (2002) Fast robust automated brain extraction. Hum Brain Mapp 17:
143–155.
34. Studholme C, Hill DL, Hawkes DJ (1996) Automated 3-D registration of MR
and CT images of the head. Med Image Anal 1: 163–175.
35. Collins DL, Holmes CJ, Peters TM, Evans AC (1995) Automatic 3-D model-
based neuroanatomical segmentation. Hum. Brain Mapp 3: 190–208.
36. Lancaster JL, Woldorff MG, Parsons LM, Liotti M, Freitas CS, et al. (2000)
Automated Talairach atlas labels for functional brain mapping. Hum Brain
Mapp 10: 120–131.
37. Bisdas S, Bohning DE, Besenski N, Nicholas JS, Rumboldt Z (2008)
Reproducibility, interrater agreement, and age-related changes of fractional
anisotropy measures at 3T in healthy subjects: effect of the applied b-value.
AJNR Am J Neuroradiol 29: 1128–1133.
38. Newcombe V, Chatfield D, Outtrim J, Vowler S, Manktelow A, et al. (2011)
Mapping traumatic axonal injury using diffusion tensor imaging: correlations
with functional outcome. PloS one 6: e19214.
39. Alves GS, O’Dwyer L, Jurcoane A, Oertel-Knochel V, Knochel C, et al. (2012)
Different patterns of white matter degeneration using multiple diffusion indices
and volumetric data in mild cognitive impairment and Alzheimer patients. PloS
one 7: e52859.
40. Faul F, Erdfelder E, Lang AG, Buchner A (2007) G*Power 3: a flexible statistical
power analysis program for the social, behavioral, and biomedical sciences.
Behav Res Methods 39: 175–191.
41. Coles JP, Fryer TD, Smielewski P, Chatfield DA, Steiner LA, et al. (2004)
Incidence and mechanisms of cerebral ischemia in early clinical head injury.
J Cereb Blood Flow Metab 24: 202–211.
42. Stamatakis EA, Shafto MA, Williams G, Tam P, Tyler LK (2011) White matter
changes and word finding failures with increasing age. PloS one 6: e14496.
43. Lebel C, Gee M, Camicioli R, Wieler M, Martin W, et al. (2012) Diffusion
tensor imaging of white matter tract evolution over the lifespan. Neuroimage 60:
340–352.
Reproducibility of DTI at 3T
PLOS ONE | www.plosone.org 12 June 2013 | Volume 8 | Issue 6 | e65941


![Effects of Timing and Duration of Cognitive Activation in [15O]water PET Studies](https://img.pdfslide.net/doc/110x75/6348e6b309e11fdd740b01d3/effects-of-timing-and-duration-of-cognitive-activation-in-15owater-pet-studies.jpg)


