Embed Size (px)
Citation preview
Paper Revised August, 2012
Inter-temporal Changes in Ethnic Urban Earnings Disparities in China
by
DING Sai, LI Shi and Samuel L. Myers, Jr.
Working Paper # 2011-21 October 2011
CIBC Working Paper Series
Department of Economics Social Science Centre
The University of Western Ontario London, Ontario, N6A 5C2
Canada
This working paper is available as a downloadable pdf file on our website http://economics.uwo.ca/centres/cibc/
674
TWELVE
Inter-temporal Changes in Ethnic Urban Earnings Disparities in China*
DING Sai, LI Shi, and Samuel L. Myers, Jr.
675
I. Introduction The opening of the Chinese economy in 1978 by Deng Xiaoping ushered in an era of significant
economic growth (Chow 1993). During the following thirty years, gross domestic production
expanded, the manufacturing sector grew, and exports to the outside world skyrocketed. Much
of this dramatic growth has been attributed to capital accumulation and productivity increases
(Chow and Li 2002). Yet the period also represented a significant shift in national policies
toward growth tempered by attention to social equity (Friedman 2006). This shift under the Hu
Jintao-Wen Jiabao leadership is commonly referred to as promotion of a “harmonious society.”
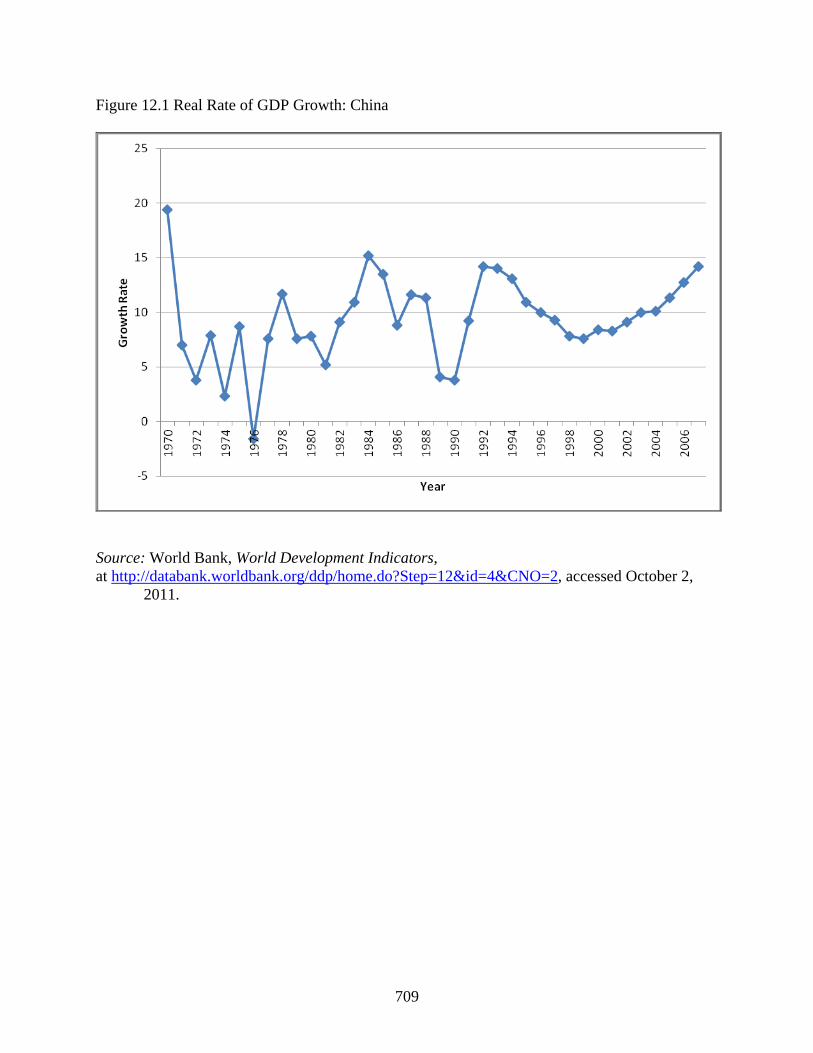
Figure 12.1 shows the significant advances of the Chinese economy over the thirty-year
period. Annual average GDP growth during the period from 1978 to 2007 was 9.74 percent. By
way of comparison, annual GDP growth in the United States during the same period was only
3.3 percent (Myers forthcoming).
One clear indicator of the slowing of the Chinese economy occurred during the 1992-99
period. Figure 12.1 shows a growth rate of almost 15 percent in 1992, followed by a sharp
decline in the ensuing years and only a little more than 7 percent in 1999.
<Figure 12.1 about here>
It is well known that one of the consequences of the overall pattern of sharp economic
growth in the post-reform era has been a widening of inequality between those at the top and
those at the bottom of the income distribution, both overall and regionally (Cai, Wang, and Du
2002). Measures of overall income inequality, as well as of the spatial inequality of income
uniformly, show sizable increases from the early reform years to the present (OECD 2010, pp.
140–141). Corrections for measures of imputed rents and public subsidies yield high, but stable,
676
measures of inequality from 1995 to 2002 (Gustafsson, Li, and Sicular 2008). Inequality in
disposable household income per capita, as measured by the Gini coefficient, widened in urban
areas in China during the period of rapid economic growth from the 1980s to the early twenty-
first century. In urban China the Gini coefficient rose from 0.244 in 1988 to 0.339 in 1995 and
0.322 in 2002 (Gustafsson, Li, and Sicular 2008). Income inequality continued to grow from
2002 to 2007 in urban China but not as rapidly as it had grown prior to the Hu Jintao-Wen Jiabao
era (see Chapter 7). By the mid-2000s, the overall level of inequality indices placed China ahead
of most European nations and the United States, similar to Mexico and Chile, and behind South
Africa and Brazil (OECD 2010, p. 130).
One lesser-known consequence of the economic policies leading to the expansion of the
Chinese economy has been the narrowing of the earnings gap between the majority Han
population and the ethnic minorities in the urban areas. Among rural households, the ratio of
minority to Han per capita household income stagnated at 66.3 percent in 1988, 67.14 percent in
1995, and 65.73 percent in 2002. But among urban households, the ratio increased from 92
percent in 1988 to over 100 percent in 2002, leading some commentators to conclude that a Han-
minority earnings gap no longer existed in urban China.
This finding contrasts with the findings of a deterioration in the relative status of
minorities in rural areas. Gustafsson and Li (2003), examining survey information from nineteen
provinces in 1988 and 1995, find that the per capita income gap of 19.2 percent in 1988 had
increased to 35.9 percent by 1995. Gustafsson and Li (2003) decompose the rural income gaps
into portions that can be explained by human capital, spatial and political factors, and an
unexplained portion. They report that most of the gap in rural incomes between the majority and
minority populations can be explained by human capital and related factors. In those rural
677
provinces where the gaps actually diminished, increased educational attainment among
minorities stands out as a key explanatory factor.
The Gustafsson and Li (2003) findings of widening gaps in rural per capita household
incomes between 1988 and 1995 contrast with the narrowing gaps in rural per capita household
incomes tentatively found in research by Luo and Sicular (2012) examining changes in per capita
income between 1995 and 2002. The gap in 2002, however, is still wider than the gap in 1988.
An important insight for understanding changes in the relative economic well-being of minorities
in rural and/or urban areas is thus the timing of the changes.
The mechanism by which government policies might have contributed to improvements
in the relative economic status of minorities in urban areas, but not necessarily in rural areas,
stems from an inherent selection effect. In addition to targeted affirmative action policies that
provided assistance to minority-group members in admissions to college and exemptions from
restrictions on child-bearing, the Chinese government initiated investment protocols that boosted
incomes in rural areas, which indirectly improved the well-being of minorities, who are largely
concentrated in rural areas (Hannun 2002). The outmigration of minority rural workers to urban
areas depressed the overall incomes of the remaining minorities in the rural areas and contributed
to the widening of the Han-minority income gap observed by Gustaffson and Li (2003). But
these policies arguably contributed to the migration of higher-educated minorities to urban areas,
further contributing to the perception that there were no longer income disparities between Han
and minorities in urban areas. The conventional wisdom is that there are now only small
differences in per capita household incomes between Han and minorities in urban areas (Zang
and Li 2001). Thus, in addition to a broad expansion of the Chinese economy during the entire
678
thirty-year period, the Chinese government advanced policies to assist ethnic minorities that
putatively resulted in reduced disparities between Han and minorities.
This chapter details the factors that contributed to the historic narrowing of the minority-
Han earnings gap during the period from 1995 to 2002, as rates of economic growth were falling
slightly. It also explores the heretofore undocumented rise in ethnic disparities between 2002
and 2007 in urban China. An innovative contribution of this analysis is that it provides two
different types of decompositions of the changes in income disparities: a) inter-temporal, within-
group differences, and b) intra-temporal, between group differences.
The chapter is organized as follows. First, we provide background information about the
nature of the changes in the conditions facing Han and minority workers during the past several
decades. Then we provide an analytical framework for understanding wage and salary income
disparities between Han and minorities, wherein we decompose the earnings gaps between
periods within groups and between groups within periods. The approach is to construct a
measure of minority versus Han wage and salary disparities and to decompose that measure into
portions explained by differences in endowments and portions explained by differences in
treatment, both between groups and between time periods. In a concluding section, we discuss
the implications for the policies aimed at improving access to education for minorities and for
the policies designed to promote minorities in state-owned enterprises.
II. Background
Conventional wisdom states that the expansion of economic growth through the market reforms
in China was accompanied by a widening of overall inequality in per capita incomes. Much of
this widening inequality is attributed to rural-urban differences in access to infrastructure as well
679
as the attendant implications of changes in educational attainment and the quality of education.
Although literacy rates, attendance rates, and overall educational attainment improved, the gaps
between rural and urban areas widened (Hannum 2002). Because ethnic minorities are
concentrated in rural and underdeveloped regions of China, the gaps in educational outcomes are
attributed to vocational differences (Hannum and Yu 1998; Rong and Shi 2001; Zhang and
Kanbur 2005). National statistics show that poverty rates in autonomous ethnic areas are much
higher than they are in the rest of rural China. From 2006 to 2009, the poverty rates in
autonomous ethnic areas were 18.9, 18.6, 17, and 16.4 percent, respectively. In the same years,
the poverty rates in rural China were 6, 4.6, 4.2, and 3.6 percent, respectively (Central People’s
Government 2011).
Zang and Li (2001), using a small sample of Han and minorities in Beijing, find few
demographic differences between Han and minorities, which can be attributed to the selective
migration of higher-educated minorities to urban areas (Zang and Li 2001, p. 41). They also
contend that the state-sanctioned entitlements provided to ethnic minorities provided a source of
upward mobility (Zang and Li 2001, p. 41). They find no statistically significant ethnic
differences in total earnings, including bonuses, investment returns, and wages and salaries.
However, they do find wide disparities in the returns to education and returns to state
employment. Thus they argue that minorities benefit more than non-minorities from improved
education and employment in state enterprises.
Estimating a simple human capital model using data from 1989 and 1992, with no
controls for rural-urban residence or for ethnic minority status, Maurer-Fazio (1999, p. 27) finds
rates of return to education of about 3 to 4 percent, with higher rates for females than for males.
680
This points to the possibility that changes in earnings disparities might be due to differences in
returns to schooling between males and females.
These stylized facts about Han-minority urban wage differentials conflict with other
evidence about disparities in family household incomes, personal incomes, and wage and salary
incomes drawn from national samples during different periods of economic growth in China.
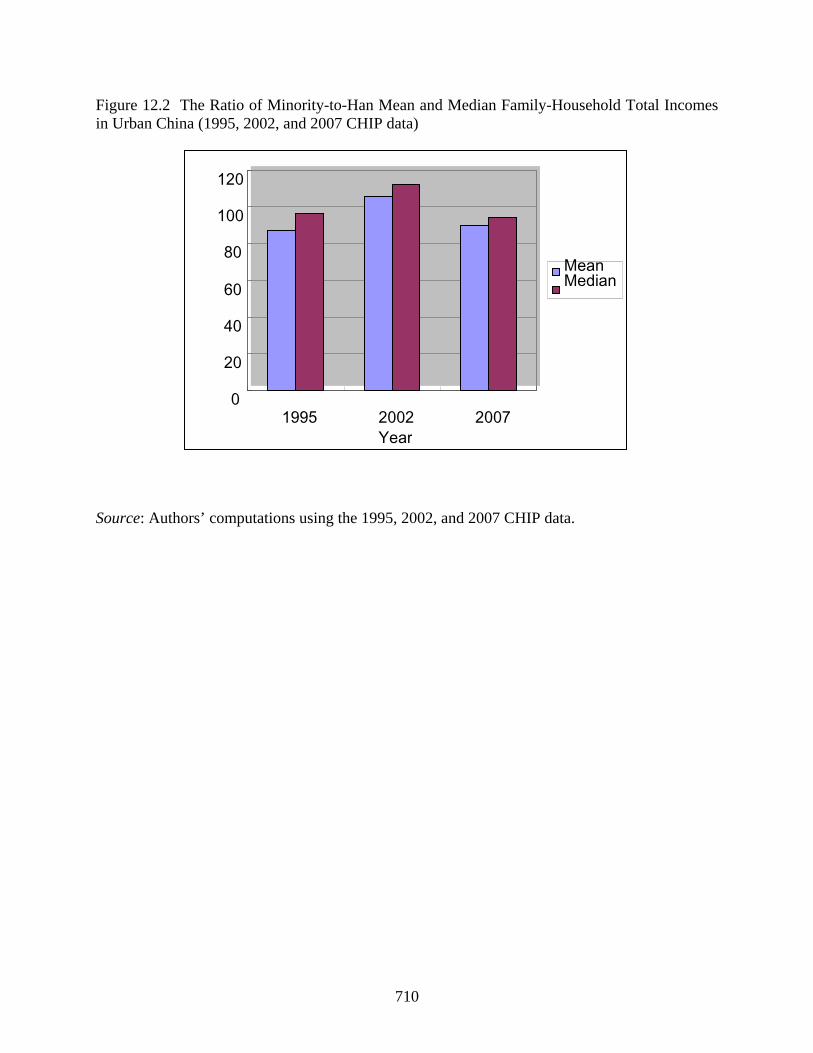
Figure 12.2 shows that during the period of a downward trend in economic growth, 1995, the
ratio of minority-to-Han mean and median incomes was lower than it was during the upturn in
2002. The growth rate remained stable thereafter with only minor declines in 2007, the point at
which income ratios were again lower (see Figure 12.2). Because the evidence does not point to
a constant pattern of income disparities, a more careful look at the underlying labor-market
dynamics that might contribute to a narrowing and then a widening of the earnings gap is called
for.
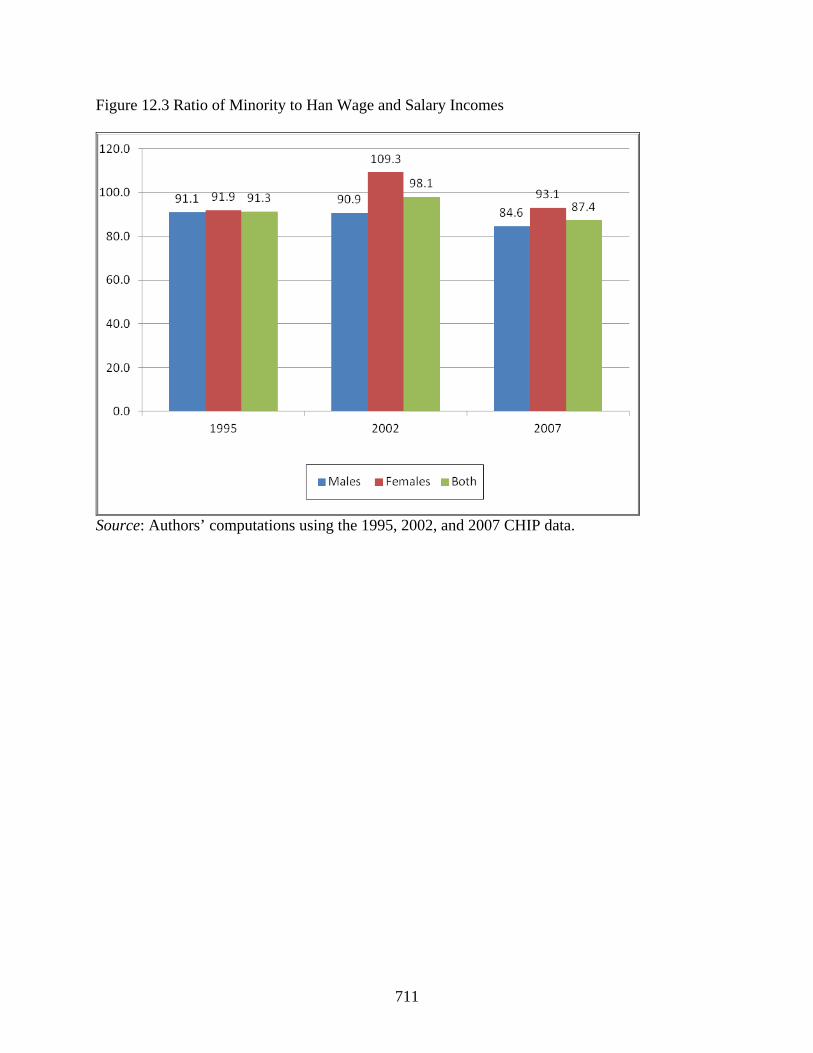
<Figure 12.2 about here> Figure 12.3 details the ratio of the mean wage and salary incomes for ethnic-minority
group members to the mean wage and salary incomes for Han in urban areas. For simplicity, we
focus only on wage and salary incomes and not on bonuses, subsidies, or related benefits. The
reason for this specific focus on wages and salaries is that other forms of compensation – such as
bonuses, housing subsidies and health care – vary widely from industry to industry and are more
loosely related to worker productivity than are wages and salaries.
The sample years are 1995, 2002, and 2007. The calculations are based on persons with
positive wage and salary incomes who are ages 18 and over, and are restricted to persons with an
urban household registration (hukou). The sampled provinces are common across the years
presented. The ratios are presented for males, females, and both males and females. According
681
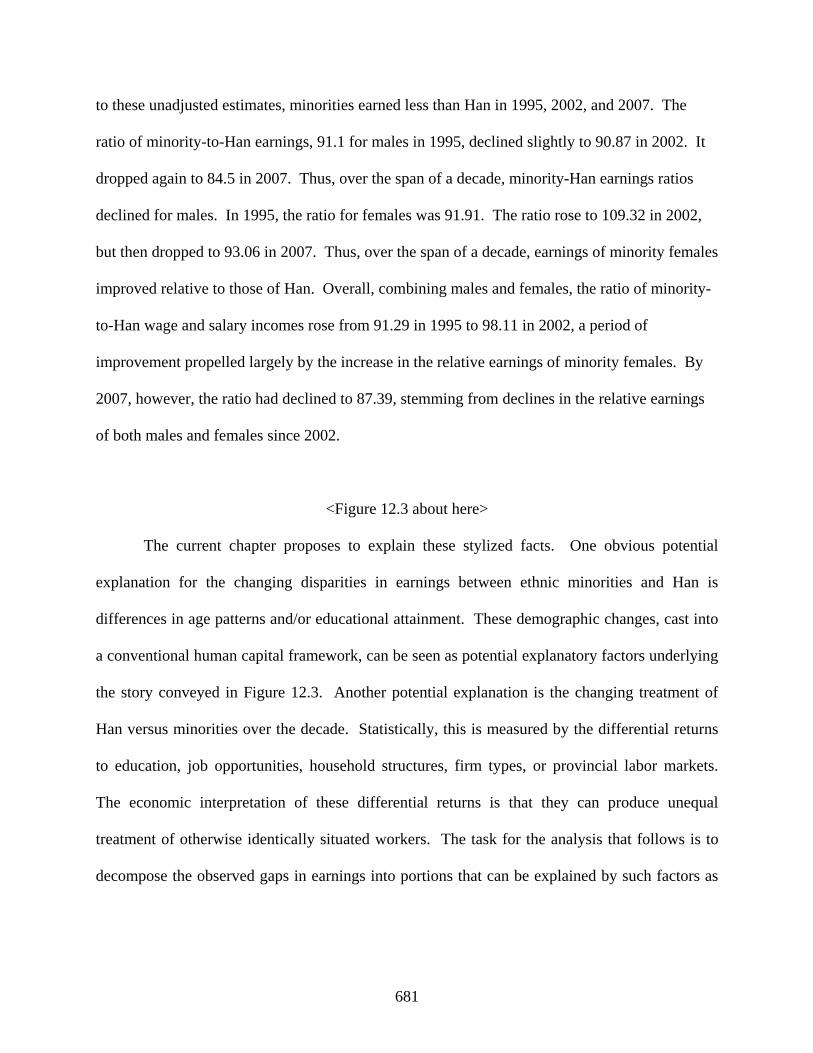
to these unadjusted estimates, minorities earned less than Han in 1995, 2002, and 2007. The
ratio of minority-to-Han earnings, 91.1 for males in 1995, declined slightly to 90.87 in 2002. It
dropped again to 84.5 in 2007. Thus, over the span of a decade, minority-Han earnings ratios
declined for males. In 1995, the ratio for females was 91.91. The ratio rose to 109.32 in 2002,
but then dropped to 93.06 in 2007. Thus, over the span of a decade, earnings of minority females
improved relative to those of Han. Overall, combining males and females, the ratio of minority-
to-Han wage and salary incomes rose from 91.29 in 1995 to 98.11 in 2002, a period of
improvement propelled largely by the increase in the relative earnings of minority females. By
2007, however, the ratio had declined to 87.39, stemming from declines in the relative earnings
of both males and females since 2002.
<Figure 12.3 about here>
The current chapter proposes to explain these stylized facts. One obvious potential
explanation for the changing disparities in earnings between ethnic minorities and Han is
differences in age patterns and/or educational attainment. These demographic changes, cast into
a conventional human capital framework, can be seen as potential explanatory factors underlying
the story conveyed in Figure 12.3. Another potential explanation is the changing treatment of
Han versus minorities over the decade. Statistically, this is measured by the differential returns
to education, job opportunities, household structures, firm types, or provincial labor markets.
The economic interpretation of these differential returns is that they can produce unequal
treatment of otherwise identically situated workers. The task for the analysis that follows is to
decompose the observed gaps in earnings into portions that can be explained by such factors as
682
age, education, and job markets and into portions that are unexplained and thus can be attributed
to differential returns.
III. Law and Policy Regarding Anti-Discrimination and the Development of Ethnic
Minorities in China
Law and public policy providing protections against discrimination and preferences to ethnic
minority members have evolved over the years.1 The evolution shows a subtle shift from
protection of minorities against discrimination prior to the Hu Jintao-Wen Jiabao era to
preferential treatment thereafter. The Constitution of the People’s Republic of China bans ethnic
minority group discrimination.2 Other examples of anti-discrimination efforts include the 1951
ban against derogatory ethnic names for streets or towns and the 1997 criminalization of
discrimination against minorities. More recent initiatives have taken on the tone of ethnic
preferences. These include extra points awarded on the national college admissions examination,
which is the primary vehicle for admissions to college, the ability to take examinations in
languages other than Mandarin, relaxed population control measures, and guarantees of political
representation in the autonomous regions (Gustafsson and Ding 2009).
Certain minorities and persons in rural areas are exempt from China’s 1979 one-child
policy. Based on the Law of Population and Family Planning, the people’s congresses in the
provinces and autonomous regions can enact their own specific rules. In general, a minority
family in a rural minority area may have three children. There is no limit to the number of
children in families in Tibet. In urban areas, however, the policy is much stricter. In some urban
areas, such as Anhui or Shandong, if the husband and wife are both minorities they may have
two children. In other urban areas, such as Xinjiang and Qinghai, if only one member of the
683
couple is a member of a minority, they may have two children. In still other urban areas, such as
Guangxi and Hebei, if only one member of the couple is a member of a minority and the city has
a population of less than 10 million, the couple may apply to have a second child.
There are five autonomous regions for ethnic minorities at the provincial level; 77 cities
at the prefectural level, prefectures, autonomous prefectures, and mengs (leagues) at the
prefectural level; 698 districts under the jurisdiction of cities, cities at the county level, counties,
banners, autonomous counties, and autonomous banners at the county level; and 7,745
administrative units at the township and town government level (NBS 2009a). These areas with
high concentrations of ethnic minorities have special political and administrative status.
The Law of Regional National Autonomy was enacted in 1984 and updated in 2001. It is
one of the three basic political systems in China. Ethnic regional autonomy is under the
leadership of China’s central government and is implemented in the ethnic minority autonomous
areas. According to the Law of Regional National Autonomy, once autonomous agencies are
established, minorities have the right to autonomy, and they can manage their own internal
affairs in the ethnic minority autonomous areas.
The Regulations on Urban Nationality Work were enacted in 1993. Among its thirty
articles, thirteen articles encourage the hiring of more minorities, the generation of minority
enterprises, the training and selection of minority cadres, attention to minority education, and the
provision of tax rebates.
In addition, international conventions about discrimination against minorities affect
China as well, such as the International Covenant on Economic, Social, and Cultural Rights,
which entered into effect in China in March 2001; the International Convention on the
684
Elimination of All Forms of Racial Discrimination, which entered into effect in December 1981;
and the Employment Policy Convention, which was ratified in December 1997.
IV. The Model
The conventional human capital perspective posits that (the log of) wage and salary incomes
depend on experience and education, proxied by age, age-squared, and educational attainment or
years of education. Within the context of China, however, one must also account for the
industrial structure. The market reforms have resulted in an occupational class that is related to
the educational system as well as to the hierarchical structure of the labor market, which, in turn,
influences wage determination. We first consider the determination of wages as a function of
human capital, family structure, industry, occupation, and location. We then detail our method
for decomposing wages between minorities and Han. Finally, we describe a technique for
understanding the changes in the ratio of minority-to-Han incomes over time.
A. The Effects of Minority Status on Wage and Salary Income
Consider a vector of human capital and industry/occupational indicators, X. Denote minority
status by M, equal to one if a person is a member of one of the 55 officially recognized minority
groups and equal to zero otherwise. We estimate the following model separately for males and
female for each period t:
ttttititt Mxy εδαα +++= ∑0ln (1)
where the random error term, ε, is assumed to be normally distributed, with a zero mean and a
constant variance, and is assumed to be uncorrelated with M or X. The test of the hypothesis that
685
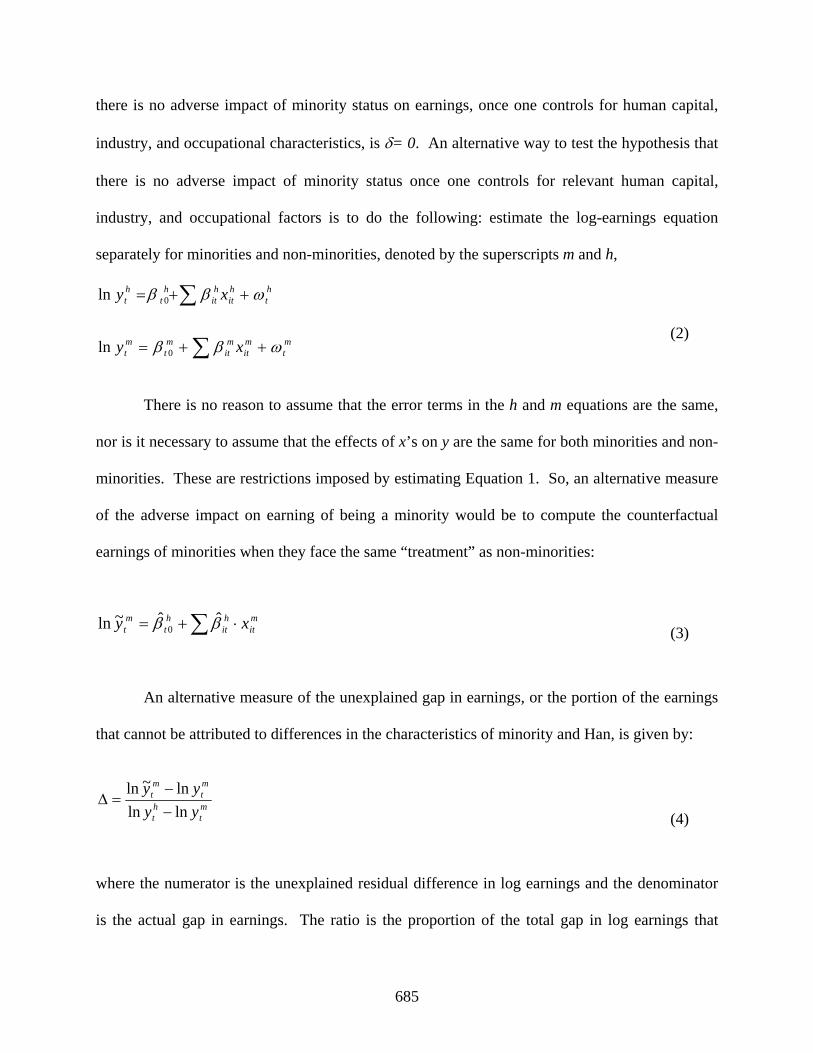
there is no adverse impact of minority status on earnings, once one controls for human capital,
industry, and occupational characteristics, is δ= 0. An alternative way to test the hypothesis that
there is no adverse impact of minority status once one controls for relevant human capital,
industry, and occupational factors is to do the following: estimate the log-earnings equation
separately for minorities and non-minorities, denoted by the superscripts m and h,
mt
mit
mit
mt
mt
ht
hit
hit
ht
ht
xy
xy
ωββ
ωββ
++=
++=
∑
∑
0
0
ln
ln
(2)
There is no reason to assume that the error terms in the h and m equations are the same,
nor is it necessary to assume that the effects of x’s on y are the same for both minorities and non-
minorities. These are restrictions imposed by estimating Equation 1. So, an alternative measure
of the adverse impact on earning of being a minority would be to compute the counterfactual
earnings of minorities when they face the same “treatment” as non-minorities:
∑ ⋅+= mit
hit
ht
mt xy ββ ˆˆ~ln 0 (3)
An alternative measure of the unexplained gap in earnings, or the portion of the earnings
that cannot be attributed to differences in the characteristics of minority and Han, is given by:
mt
ht
mt
mt
yyyy
lnln
ln~ln
−−
=Δ (4)
where the numerator is the unexplained residual difference in log earnings and the denominator
is the actual gap in earnings. The ratio is the proportion of the total gap in log earnings that
686
cannot be explained by differences in the characteristics of Han and minorities. This is the
familiar Blinder-Oaxaca decomposition. We hypothesize that patterns of unexplained residuals
will be different between males and females, with minority males facing larger disparities than
minority females, and we hypothesize that the unexplained disparities will differ across years.
To know, however, how much of the inter-temporal changes in characteristics explain the pattern
of changing income disparities requires that we decompose the gaps between periods.
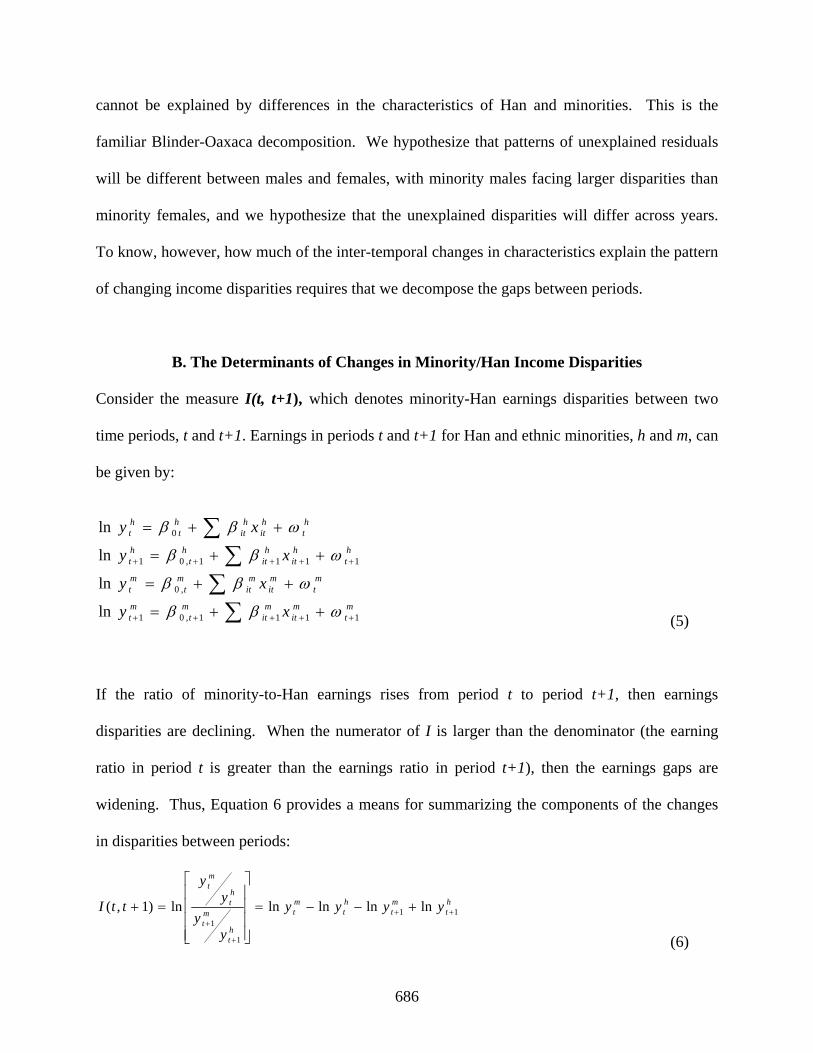
B. The Determinants of Changes in Minority/Han Income Disparities
Consider the measure I(t, t+1), which denotes minority-Han earnings disparities between two
time periods, t and t+1. Earnings in periods t and t+1 for Han and ethnic minorities, h and m, can
be given by:
mt
mit
mit
mt
mt
mt
mit
mit
mt
mt
ht
hit
hit
ht
ht
ht
hit
hit
ht
ht
xy
xy
xy
xy
1111,01
,0
1111,01
0
ln
ln
ln
ln
+++++
+++++
++=
++=
++=
++=
∑∑
∑∑
ωββ
ωββ
ωββ
ωββ
(5)
If the ratio of minority-to-Han earnings rises from period t to period t+1, then earnings
disparities are declining. When the numerator of I is larger than the denominator (the earning
ratio in period t is greater than the earnings ratio in period t+1), then the earnings gaps are
widening. Thus, Equation 6 provides a means for summarizing the components of the changes
in disparities between periods:
ht
mt
ht
mt
ht
mt
ht
mt
yyyy
yy
yy
ttI 11
1
1
lnlnlnlnln)1,( ++
+
+
+−−=
⎥⎥⎥⎥
⎦
⎤
⎢⎢⎢⎢
⎣
⎡
=+
(6)
687
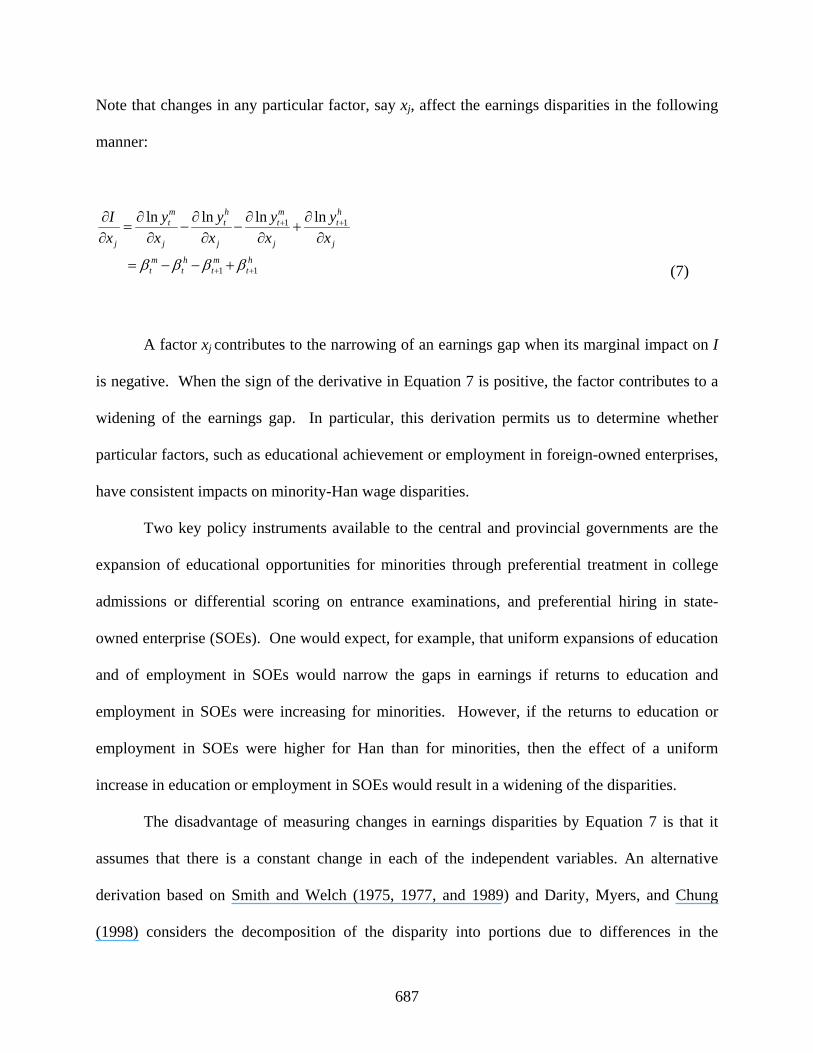
Note that changes in any particular factor, say xj, affect the earnings disparities in the following
manner:
ht
mt
ht
mt
j
ht
j
mt
j
ht
j
mt
j xy
xy
xy
xy
xI
11
11 lnlnlnln
++
++
+−−=
∂∂
+∂
∂−
∂∂
−∂
∂=
∂∂
ββββ (7)
A factor xj contributes to the narrowing of an earnings gap when its marginal impact on I
is negative. When the sign of the derivative in Equation 7 is positive, the factor contributes to a
widening of the earnings gap. In particular, this derivation permits us to determine whether
particular factors, such as educational achievement or employment in foreign-owned enterprises,
have consistent impacts on minority-Han wage disparities.
Two key policy instruments available to the central and provincial governments are the
expansion of educational opportunities for minorities through preferential treatment in college
admissions or differential scoring on entrance examinations, and preferential hiring in state-
owned enterprise (SOEs). One would expect, for example, that uniform expansions of education
and of employment in SOEs would narrow the gaps in earnings if returns to education and
employment in SOEs were increasing for minorities. However, if the returns to education or
employment in SOEs were higher for Han than for minorities, then the effect of a uniform
increase in education or employment in SOEs would result in a widening of the disparities.
The disadvantage of measuring changes in earnings disparities by Equation 7 is that it
assumes that there is a constant change in each of the independent variables. An alternative
derivation based on Smith and Welch (1975, 1977, and 1989) and Darity, Myers, and Chung
(1998) considers the decomposition of the disparity into portions due to differences in the
688
coefficients between groups and between time periods, and differences in the endowments
between groups and between time periods. Two different decompositions can be envisioned: an
inter-temporal decomposition that examines the differences in endowments and coefficients
between time periods and an intra-temporal decomposition that examines the differences in
endowments and coefficients between groups within time periods.
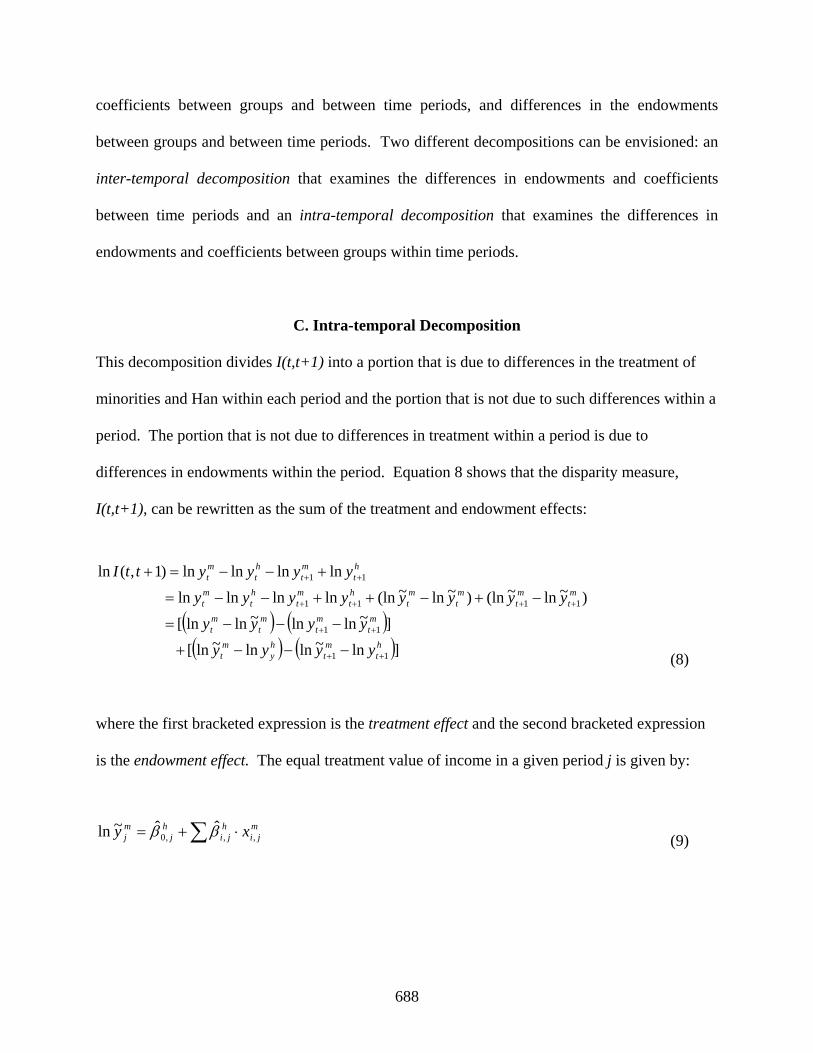
C. Intra-temporal Decomposition
This decomposition divides I(t,t+1) into a portion that is due to differences in the treatment of
minorities and Han within each period and the portion that is not due to such differences within a
period. The portion that is not due to differences in treatment within a period is due to
differences in endowments within the period. Equation 8 shows that the disparity measure,
I(t,t+1), can be rewritten as the sum of the treatment and endowment effects:
( ) ( )( ) ( )]ln~lnln~ln[
]~lnln~lnln[
)~ln~(ln)~ln~(lnlnlnlnln
lnlnlnln)1,(ln
11
11
1111
11
ht
mt
hy
mt
mt
mt
mt
mt
mt
mt
mt
mt
ht
mt
ht
mt
ht
mt
ht
mt
yyyy
yyyy
yyyyyyyy
yyyyttI
++
++
++++
++
−−−+
−−−=
−+−++−−=
+−−=+
(8)
where the first bracketed expression is the treatment effect and the second bracketed expression
is the endowment effect. The equal treatment value of income in a given period j is given by:
mji
hji
hj
mj xy ,,,0
ˆˆ~ln ⋅+= ∑ββ (9)
689
denoting the income of minorities if they faced the treatment of Han in period j. It is the
predicted value of the ln-earnings for minorities if they were treated as non-minorities but had
the characteristics of minorities. If the coefficients on all of the betas are the same within a time
period for both minorities and non-minorities, the left-hand-side value in Equation 9 will be
equal to the minority ln-earnings, resulting in the first bracketed term in Equation 8 being equal
to zero.
D. Inter-temporal Decomposition
This decomposition divides I(t,t+1) into portions that are due to inter-temporal treatment effects,
wherein the treatment of both minorities and Han in period t+1 is the same as it is in period t and
an inter-temporal endowment effect, wherein the endowments in period t+1 are the same as they
are in period t.
( ) ( )( ) ( )]ln~lnln~ln[
]~lnln~lnln[
lnlnlnln)1,(ln
11,11,
1,1,
11
ht
htt
mt
mtt
htt
ht
mtt
mt
ht
mt
ht
mt
yyyy
yyyy
yyyyttI
++++
++
++
−−−+
−−−=
+−−=+
(10)
where the inter-temporal equal treatment for the kth group is given by:
kti
kti
kt
ktt xy 1,,,01,
ˆˆ~ln ++ ⋅+= ∑ββ (11)
Equation 11 denotes the instance in which the kth group’s treatment in period t+1 is predicted
by its treatment in period t but by its characteristics in period t+1. Thus it is possible to
decompose the disparities measure I(t,t+1) into portions that can be attributed to a.) differences
690
in endowments within groups between time periods, and b.) differences in the rates of return on
those endowments (or treatment) between time periods.
V. Data and Descriptive Statistics
This chapter uses data from the 1995, 2002, and 2007 CHIP urban surveys. The CHIP data are
part of the data collected through a sample survey of urban households conducted by the
National Bureau of Statistics (NBS). To make the data comparable across years, we restrict the
analysis to the provinces that are common to all three urban surveys. The twelve common
provinces for the three years are: Beijing, Shanxi, Liaoning, Yunnan, Gansu, Jiangsu, Anhui,
Henan, Hubei, Guangdong, Chongqing, and Sichuan. Our samples were collected in cities of
various sizes, numbering 69 in 1995, 77 in 2002, and 300 in 2007.
The sample cities and towns in the urban areas are selected by using a stratified random
sampling method (NBS 2009b), where stratification is based on province and city size. The
sampling of households within cities and towns results in a random population sample. For the
purposes of the creation of the CHIP sample, households were selected randomly from provinces
organized along the geographic distribution of the national population. Accordingly, the CHIP
urban sample is regarded as a self-weighted sample.
An important limitation of the CHIP urban sample is that it excludes persons who work
in the urban area but whose hukou is elsewhere. This exclusion has important implications for
the interpretation of our results, to which we return in a concluding section of the chapter.
To facilitate the estimation of Equation 5, we identified variables that are common across
all three surveys. They include: age, years of education, minority status, and household head.
In our analysis, these are identified as human capital variables.
691
The occupational variables include: owner or manager of a private enterprise;
professional or technical worker; manager of an institution; and workers, including office
workers, skilled workers, and unskilled workers; or other occupations not classified elsewhere.
The excluded category in the analysis is professional or technical workers.
The type of firm includes: SOEs, including local publicly-owned firms; collectives;
privately-owned firms or self-employed firms, including partnerships and individual enterprises;
and other types of firms such as Sino-foreign joint ventures, foreign-owned firms, township and
village enterprises, and jointly-owned economic units; limited liability corporations; and share-
holding corporations, foreign-funded economic units, and overseas Chinese from Hong Kong-,
Macao-, and Taiwan-funded economic units. The comparison group for the purposes of the
regression analysis is collectives.
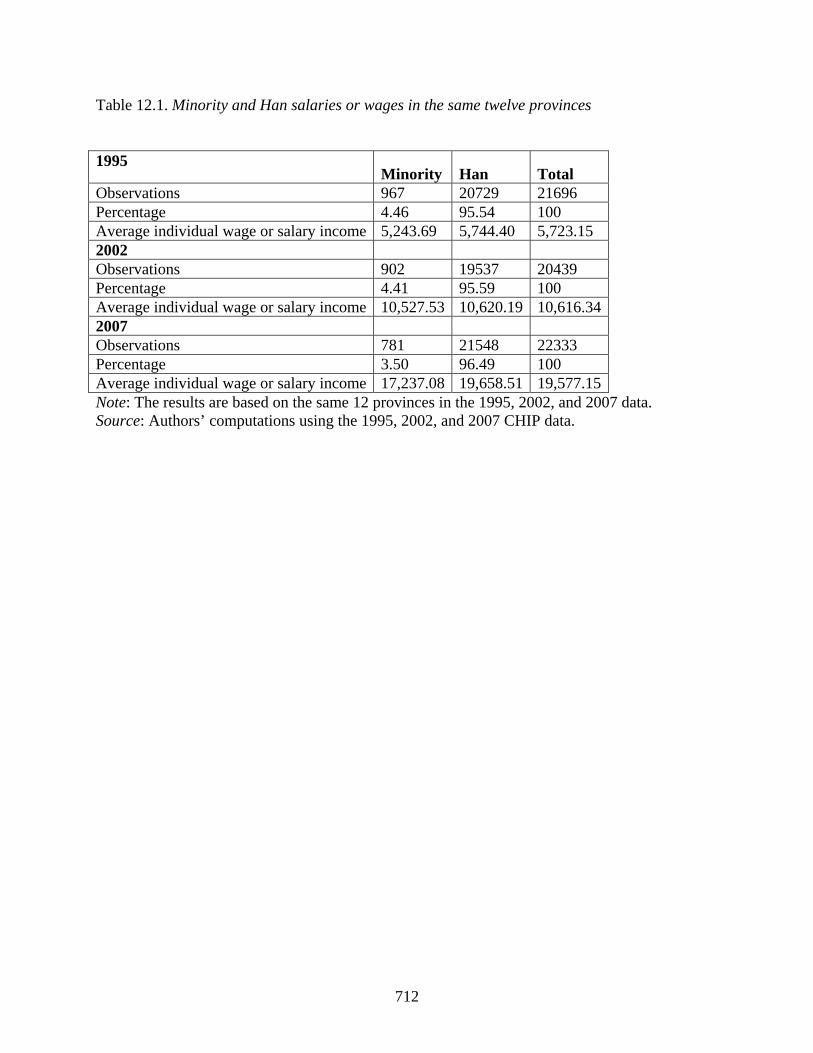
Table 12.1 provides the key information that is the source of our inquiry: changes in
wage and salary incomes across the years for the common provinces. The table highlights the
dramatic increase in wage and salary incomes as well as the changes in the disparities between
minorities and Han.
<Table 12.1 about here>
Wage and salary earnings nearly doubled between 1995 and 2002 and increased more
than threefold between 1995 and 2007. In each year, minority wage and salary incomes lagged
behind those of Han. For example, in 2007 the annual average wage and salary income of urban
residents in the common provinces was 17,237 yuan for minorities but 19,659 yuan for Han.
This gap is wider than it was in 1995, when minorities earned 5,244 yuan and Han earned 5,744
yuan.
692
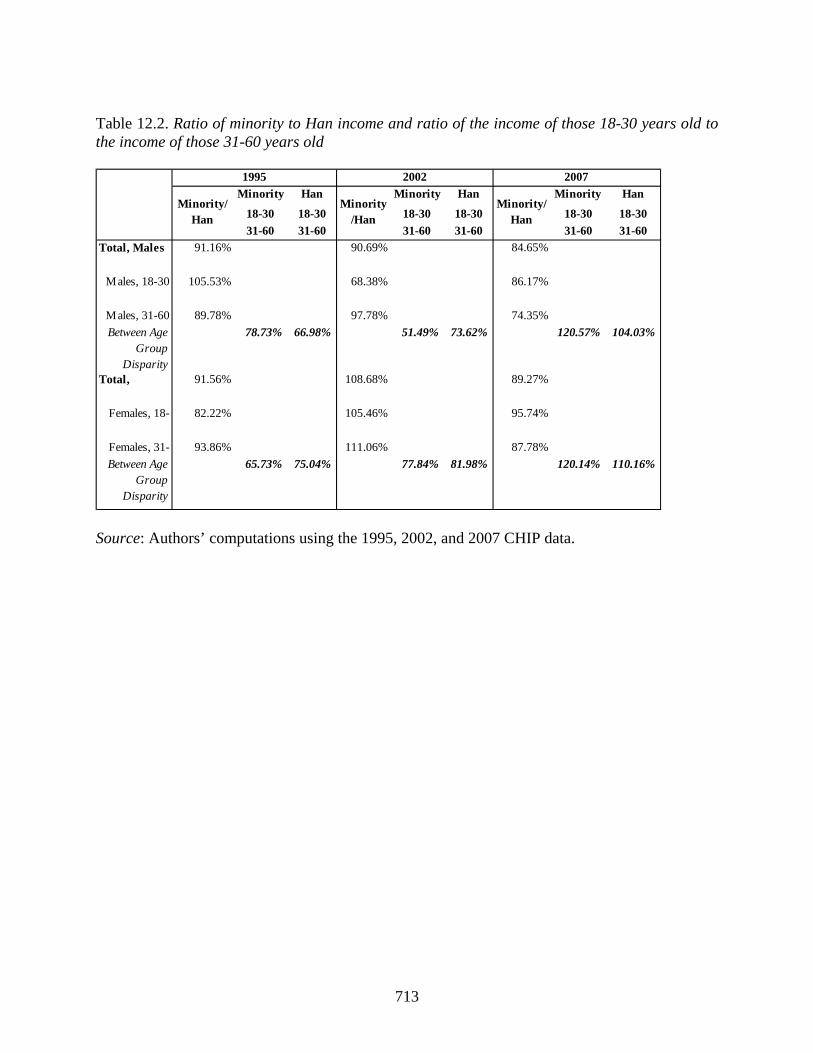
<Table 12.2 about here>
Table 12.2 reports on the Han-minority disparities in income within age groups and also
Han-minority disparities between age groups, separately for Han and minority males and females.
An important insight gleaned from this table is that within the gender groups there are widening
disparities between younger workers (18 to 30 years of age) and older workers (31 to 60 years of
age). This limitation of persons to ages 18 to 60 represents a partition of the sample that is not
reported in Figure 12.2. There we saw that there was an improvement in relative earnings of
minority females from 1995 to 2007. Table 12.2 shows that the ratio of minority to Han earnings
among females improved from 91.56 percent in 1995 to 108.68 percent in 2002. But the ratio
dropped to 89.27 percent in 2007, denoting a slight decline for this restricted age group. Still,
the broad year-to-year patterns for both males and females ages 18 to 60 are the same as those
found in Figure 12.2: there was a continuous decline in the ratio of minority-to-Han earnings
among males from 1995 to 2002 to 2007. There was also an increase in the ratio among females
from 1995 to 2002 and then a decline from 2002 to 2007. For males between the ages of 18 and
60, the minority-to-Han ratio was 91.16 percent in 1995, 90.69 percent in 2002, and 84.65
percent in 2007. For females between the ages of 18 and 60 the ratio was 91.56 percent in 1995,
108.68 percent in 2002, and 89.27 percent in 2007. Within specific age groups, however, the
patterns diverge. For example, among males between the ages of 18 and 30, the minority-to-Han
earnings ratio dropped from 105.53 percent in 1995 to 68.38 percent in 2002; it thereafter rose to
693
86.17 percent in 2007. By way of contrast, among males between the ages 31 of 60, the ratio
was 89.78 percent in 1995, 97.78 percent in 2002, but 74.35 percent in 2007.
Among females, the minority-to-Han earnings ratio rose for both age groups from 1995
to 2002 but fell from 2002 to 2007, although the ultimate result of the changes between 1995 and
2007 differs between the 18-30 year olds and the 31-60 year olds. Among the younger females,
the ratio was larger in 2007 than it was in 1995; among the older females the ratio was smaller in
2007 than it was in 1995.
Table 12.2 also reveals information on the changing earnings within ethnic groups
between younger and older workers. The rows labeled “between age group disparity” compute
the ratio of the earnings of 18-30 year olds to the earnings of 31-60 year olds within an ethnic
group, by year and by gender. Among minority males, the ratio of earnings of 18-30 year olds to
the earnings of 31-60 year olds declined from 78.73 percent in 1995 to 51.49 percent in 2002.
Among Han males, the ratio rose from 66.98 percent in 1995 to 73.62 percent in 2002. For both
Han and minority males, the ratio jumped to over 100 percent in 2007. For both minority and
Han females, the ratio of earnings between the younger age group and the older age group
increased continually from 1995 to 2007.
In short, there are important age and gender differences in the changing Han-minority
patterns in earnings disparities. Controlling for these differences may account for the observed
differences in earnings across years.
VI. Results
Equation 1, which predicts ln-earnings as a function of M, the minority dichotomous variable,
provides the starting point for our analysis. Ordinary least squares estimates of the coefficient δ,
694
the percentage difference in earnings due to minority status, were obtained separately for year
and gender, first without controls and then controlling successively for human capital, family
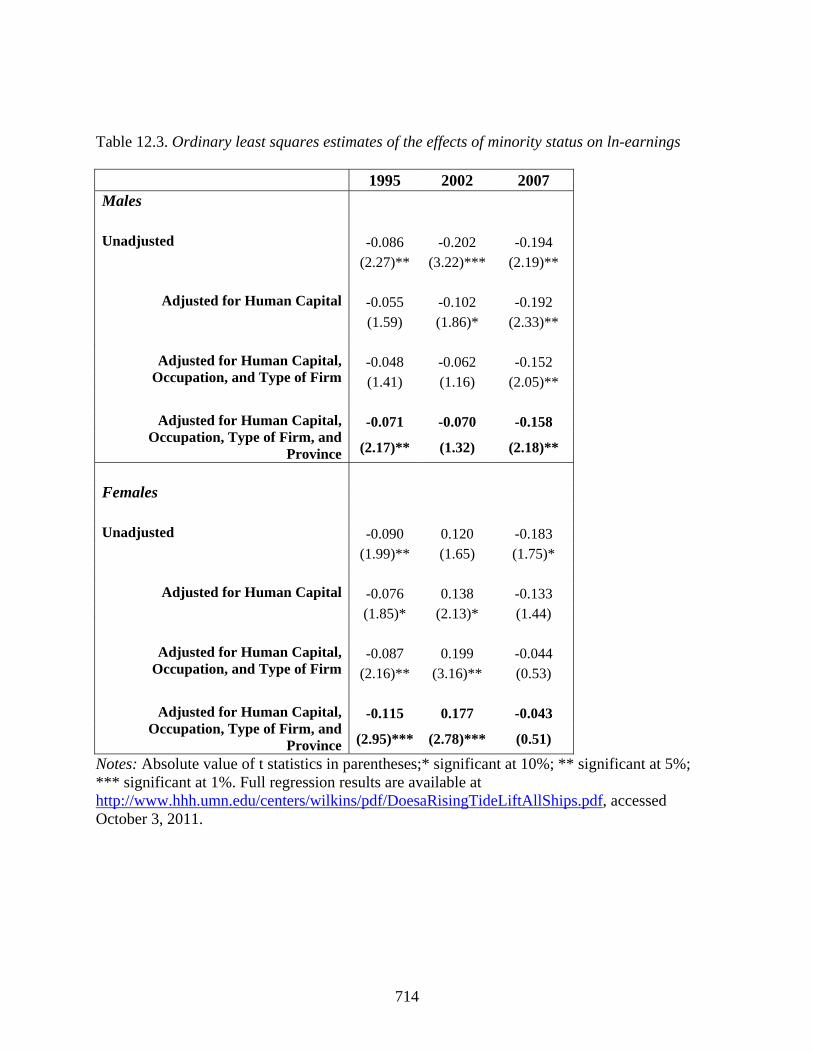
structure, occupation, industry, and province. Table 12.3 presents these results, providing
separately the coefficients on M for males and females in each year for each set of controls.
Without controls, the estimate of δ is negative and statistically significant for males in all
years and for females in 1995 and 2007, which confirms our earlier results of a Han-minority
disparity. The interpretation of the estimated coefficients on δ is the percentage difference in
earnings between minorities and Han. A negative coefficient indicates that minorities earn less
than Han. The first set of rows for males and females do not control for age, education, or family
structure. When one controls for these human capital-related variables, the size of the estimated
coefficient on minority status, δ, drops from -0.086 to -0.055 and from -0.202 to -0.102 for males
in 1995 and 2002. The 1995 coefficient is not significant; the 2002 coefficient is barely
significant. Thus controlling for human capital factors in 1995 and 2002 “explains” much of the
differential earnings among male minorities. In 2007, by way of contrast, controlling for human
capital variables leaves the estimated coefficient δ largely unchanged.
<Table 12.3 about here>
The adjusted value is -0.194. The adjusted value for human capital factors is -0.192. Controlling
for occupation and type of firm further reduces the size and significance of the coefficient on
minority status, but adjusting for the province effects produces revised estimates of δ that are
statistically significant in 1995 and 2007, although smaller in absolute value than the unadjusted
values. In 1995, the estimate of δ is -0.071. In 2007, the estimate is -0.158. In short, using this
model, we conclude that there is a negative effect of minority status on earnings in 1995 and
2007 and that effect increases in absolute value.
695
Among females, the unadjusted effect of minority status is negative and statistically
significant in 1995 and 2007, but positive and statistically significant in 2002. Controlling for
human capital, occupation, type of firm, and province, the estimated coefficients on δ are
negative and statistically significant in 1995, positive and statistically significant in 2002, and
negative but not statistically significant in 2007. The coefficients in 1995 and 2007 are -0.115 to
-0.043, reflecting a decline in the adverse impact of minority status on earnings among females
between the two years.
A. Returns to Education and Premium to SOEs
It is instructive to isolate two key economic factors that appear to have consistently significant
impacts on earnings for males and females and for each ethnicity. Educational attainment in
every instance has a positive and significant coefficient across years and across gender and
ethnicity. Employment in state-owned enterprises also has positive and significant coefficients.
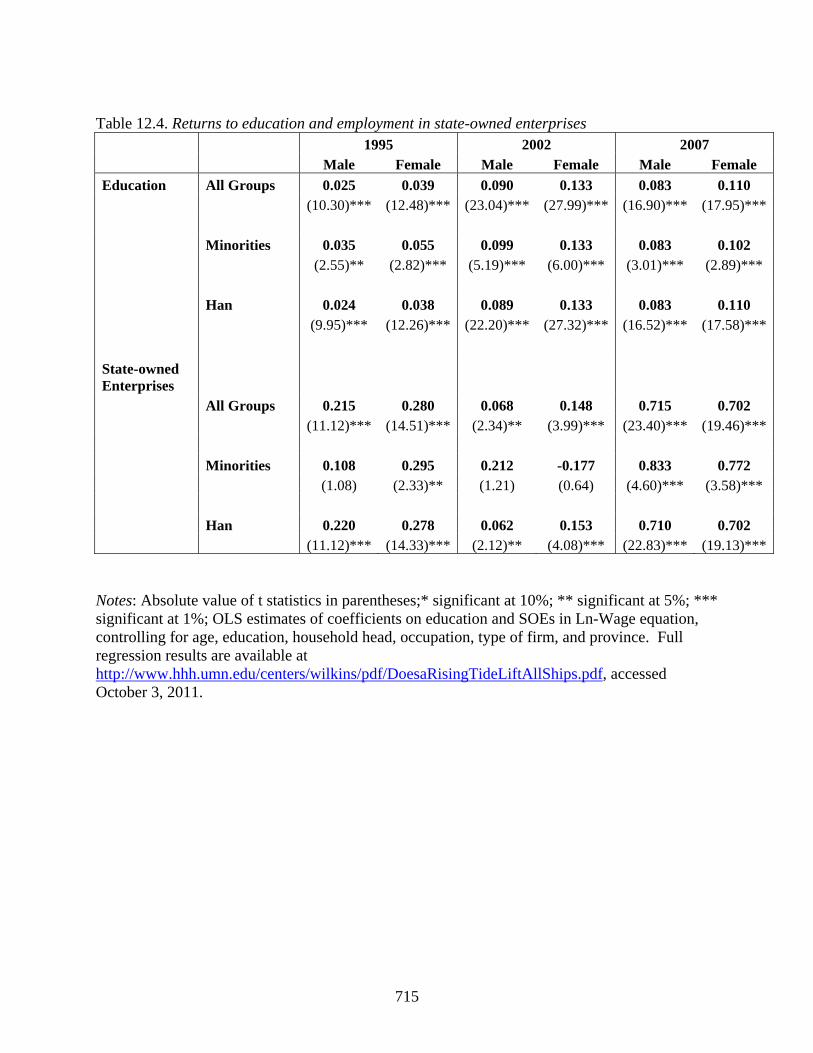
Table 12.4 reports these results. It shows returns to education in 1995 of 2.5 to 3.9 percent, on
the same order of magnitude reported by Maurer-Fazio for a similar time period. In 2002, these
returns explode to 9 percent for males and 13 percent for females. In 2007, the estimated return
to education was 8.3 percent for males and 11 percent for females.
As can be seen in Table 12.4, there were marked differences in the rates of return to
education in 1995, but virtually no difference between minorities and non-minorities in returns to
education in 2002 and 2007. In 1995, the return to education for minority males was 3.5 percent,
but for Han it was 2.4 percent. For females in 1995, the return to education was 5.5 percent for
minorities, but 3.8 percent for Han. This evidence of higher rates of return to education for
minorities disappears in 2002 and 2007, where the estimated coefficients are remarkably similar
696
for minorities and Han. The convergence in the returns to education is an important finding that
heretofore has not been recognized.
<Table 12.4 about here>
Table 12.4 also provides estimates of the premium associated with employment in state-owned
enterprises. During the expansion of the Chinese economy and the opening of the private sector,
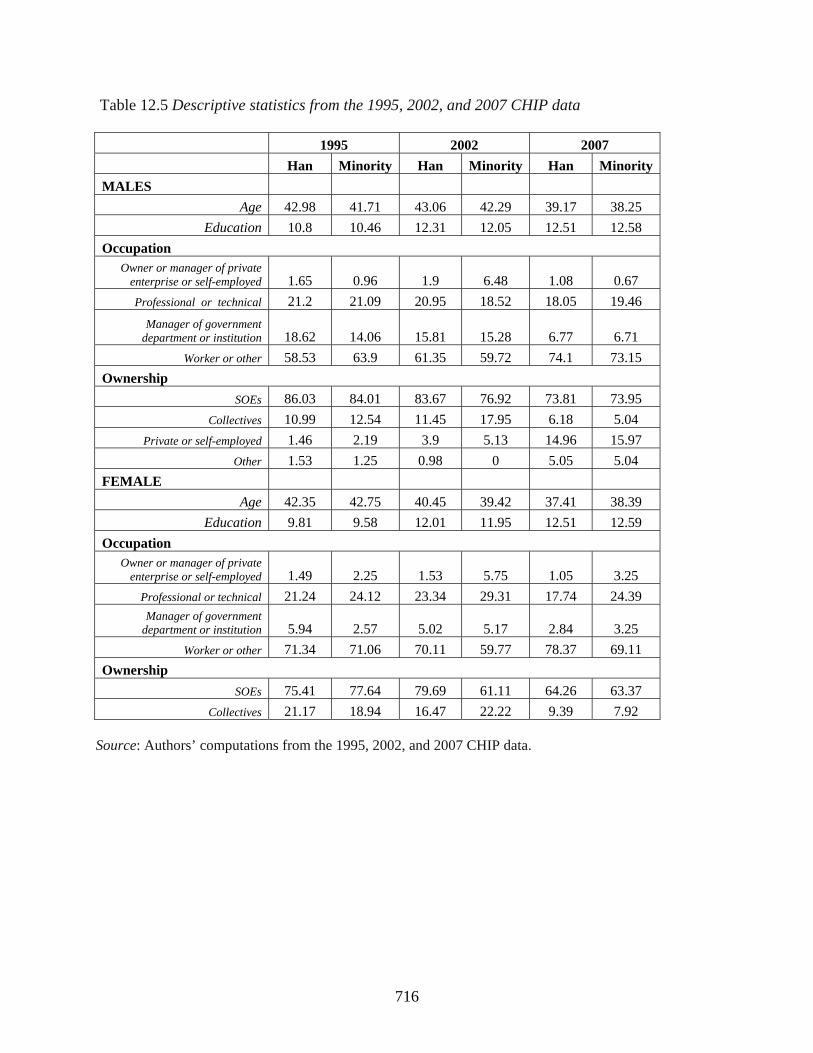
the share of jobs in non-state-owned enterprises increased substantially. Table 12.5 reports that
the share of Han vs. minority male workers employed in private enterprises skyrocketed from
1.46 vs. 2.19 percent in 1995 to 14.96 vs. 15.97 percent in 2007. The share of workers in various
forms of foreign-owned or jointly-owned partnerships and corporations also increased
substantially. In contrast, the share of Han vs. minority workers in state-owned enterprises
dropped from 86.03 percent and 84.01 percent for Han and minority males in 1996 to 73.81
percent and 73.95 percent respectively in 2007. For females, the share of workers employed in
state-owned enterprises dropped from 75.41 and 77.64 percent for Han and minorities in 1995 to
64.26 and 63.37 percent for Han and minorities in 2007.
Surprisingly, though the premium associated with employment in SOEs was once higher
for Han males than for minority males, from 1995 to 2007 there was a faster rise for minority
males than for Han. By 2007, the SOE employment premium for minority males was higher
than that for Han males. The premium for employment in SOEs was 10.8 percent and 22 percent
for minority males and Han males respectively in 1995. The premium for employment in SOEs
was 83.3 percent and 71.0 percent for minority and Han males in 2007. This surprisingly large
697
shift over such a short period of time is consistent with the hypothesis that changing labor-
market structures toward privatization have had a large influence on disparities in ethnic earnings.
Among females, the premium associated with employment in SOEs also increased
substantially. Among all females, the premium associated with employment in SOEs rose from
28.0 percent in 1995 to 70.2 percent in 2007. Among minority females, the premium was 29.5
percent in 1995 and 77.2 in 2007. Among Han females, the premium was 27.8 percent in 1995
and 70.2 percent in 2007. Thus, the marginal returns to working in SOEs were remarkably
similar for minority and Han females.
<Table 12.5 about here>
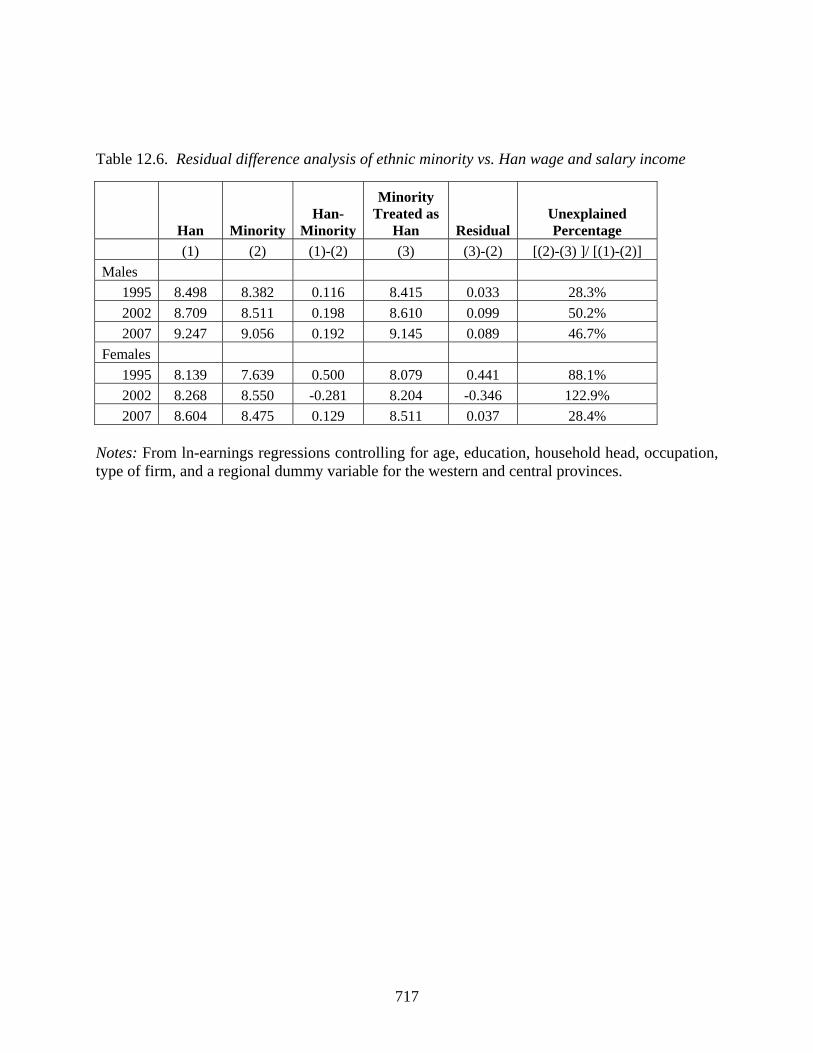
B. Residual Difference Analysis
The estimates of Equation 1 hinge on the untenable assumption that in every case there are no
interactions between minority status and the other variables. Therefore, we have estimated
separate regressions for Han and minorities in 1995, 2002, and 2007 and decomposed the gaps in
ln-earnings between the explained and unexplained portions, as indicated in Equations 2-4.
The results are displayed in Table 12.6. The first column of the table presents the ln-
earnings for Han by gender and year. The second column presents the ln-earnings for minorities
by gender and year. In the third column, the difference between Han and minority ln-earnings is
computed. This difference is positive in every year for both males and females except for 2002,
when minority females register higher ln-earnings than Han females. These disparities require
explanation. Therefore, ln-earnings are estimated separately for Han and minorities by gender to
compute the predicted ln-earnings of minorities when they face the same treatment as Han. This
698
computation is displayed in column 3 of the table. The difference between columns 2 and 3 is
the unexplained residual difference in ln-earnings, or the portion of the gap in ln-earnings that
cannot be explained by differences in endowments. The ratio of this difference to the actual
disparity in ln-earnings (multiplied by 100) is the percentage of the disparity that is unexplained. .
<Table 12.6 about here>
Two key conclusions emerge from these calculations. First, the unexplained percentage declined
from 1995 to 2007 for females, but it increased for males. The percentage of the minority versus
Han earnings disparity that was unexplained in 1995 was 28 percent for males and 88 percent for
females. In 2007 the measure of the unexplained gap rose to 47 percent for males but it fell to 28
percent for females. A second conclusion is that between 2002 and 2007, a period of recovery,
the unexplained gap declined slightly for males, from 50 percent to 47 percent, but it increased
for females as females moved from a favored to a less favored position. Still, the unexplained
percentage for males was larger than that for females in 2007.
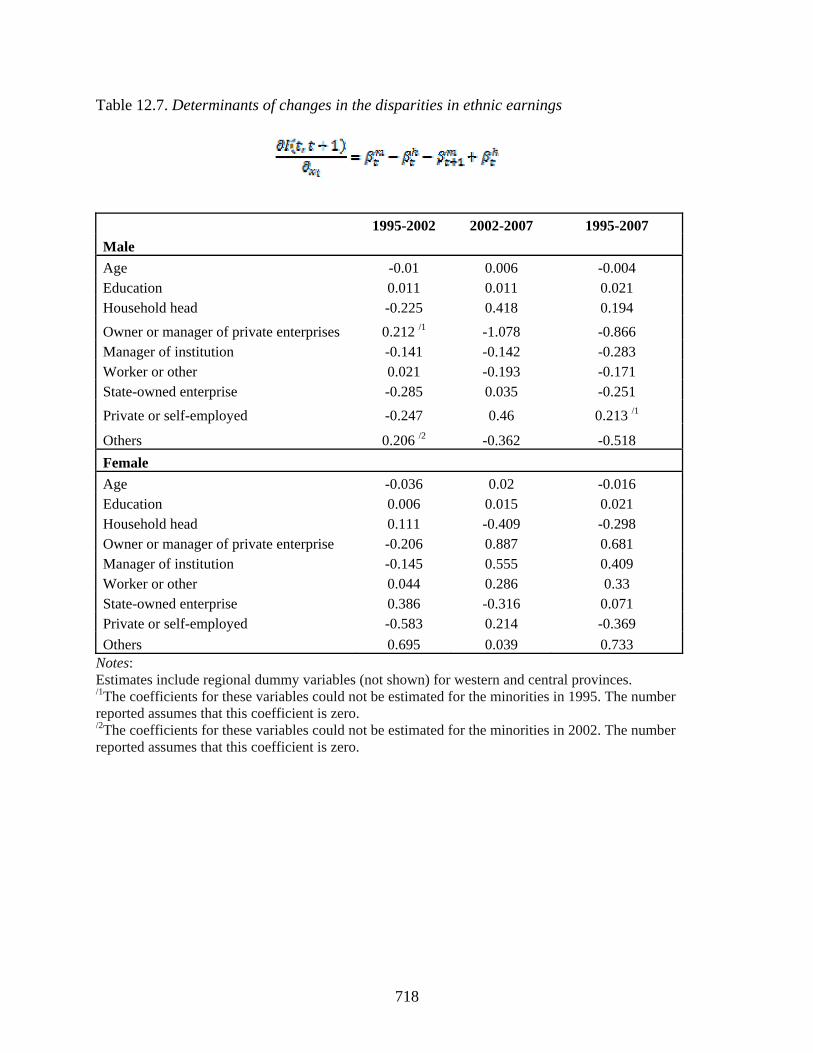
<Table 12.7 about here>
C. Determinants of Earnings Disparities
Equations 5-7 provide a preliminary tool to explore the relative contributions of specific factors
in determining minority-Han earnings disparities over time. The results of a unit increase in each
factor show that for both males and females any increases in educational attainment are
associated with increases in disparities. These positive values, however, are not always
statistically significant and they are relatively small in magnitude. Moreover, as we have already
seen, in recent years the actual returns to education have been remarkably similar both for
minorities and for Han. Likewise, age effects are small and statistically insignificant. The larger
impacts appear to be relative to changes in firm type. For males, an increase in employment in
699
SOEs is associated with a large reduction in minority-Han earnings disparities between 1995 and
2007. The net-effect for females combines two opposing impacts. Table 12.7 shows that from
1995 to 2002 inequality for females increased as a result of employment in SOEs (.386). From
2002 to 2007, however, inequality declined (-.316). Thus, inequality over the period from 1995
to 2007 increased slightly (.071). This contrasts with the larger reduction in inequality between
Han and minority males due to employment in SOEs (-.251). Table 12.7 also shows that for the
1995-2007 period a uniform increase in employment as a manager increased inequality for
females (.409) but reduced inequality for males (-.283).
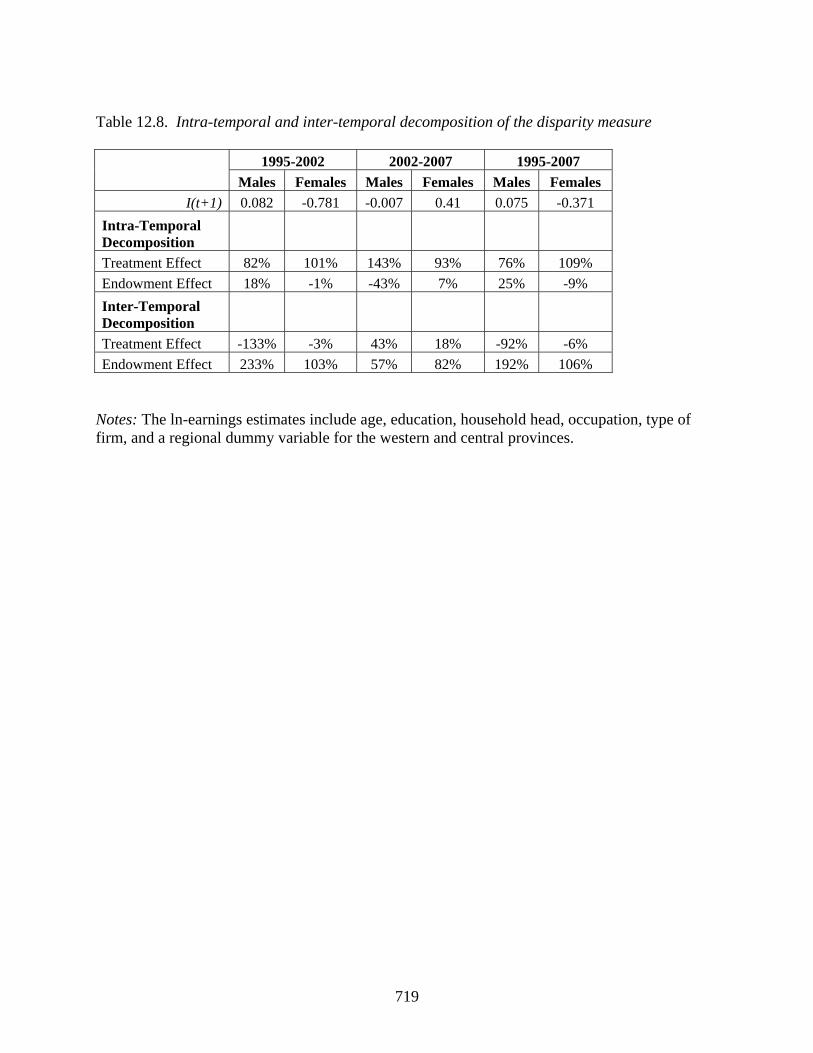
An alternative way of thinking about the decomposition of the disparity measure is to
consider inter-temporal differences in treatment versus endowments and intra-temporal
differences in treatment and endowments. The results from computing the values detailed in
Equations 8 to 11 are provided in Table 12.8.
The first row in the table reports I(t,t+1), or the change in the disparity measure for males
and females for the 1995–2002, 2002–7, and 1995–2007 periods. Note that when this index is
positive, the ratio of minority-to-Han earnings is declining, or the earnings disparity is rising.
When the ratio is negative, the earnings disparity is declining. The first row indicates that from
1995 to 2002 the earnings disparity widened for males and narrowed for females, with the values
of I(t,t+1) equal to .082 and -.781 respectively. From 2002 to 2007, the earnings disparity
narrowed slightly for males and widened for females, with the values of I(t,t+1) equal to -0.007
and 0.410 respectively. The net effect from 1995 to 2007, equal to the sum of the effects from
1995 to 2002 and from 2002 to 2007, was a widening of the earnings disparity for males and a
narrowing of the earnings disparity for females, with the value of I(t,t+1) equal to 0.075 and -
700
0.371 respectively. Next, we explain how this earnings disparity breaks down between
differences in treatment and differences in endowments.
<Table 12.8 about here>
D. Intra-Temporal Decomposition
The second set of rows in Table 12.7 reports the decomposition of the disparity measure into
portions that can be explained by differences in the coefficients between the minority and Han
ln-earnings regressions within each period and the differences in endowments within each period.
The former is called the treatment effect. The latter is called the endowment effect. The
computation asks how much of the observed change in earnings disparities can be attributed to
differences in treatment between minorities and Han and how much it can be attributed to
differences in endowments. Between 1995 and 2002, almost all of the change in earnings
disparities for females can be attributed to differences in treatment. In fact, one can argue that
the differences in treatment disproportionately favored minority females over Han females in
urban areas. During the same period, most of the change in earnings disparities among males—
82 percent—can also be attributed to differences in treatment. Similar findings emerge for the
2002–7 period, leading to the conclusion that the dominant component of the intra-temporal
change in earnings disparities can be attributed to minority-Han differences in treatment. Since
earnings disparities declined for females, however, the differences in treatment favored minority
females, or acted as a form of what some analysts might call reverse discrimination. An
alternative interpretation is that the preferred position of minority females is the result of
preferences for urban minority females that produce higher ln-wages than identically situated
Han females. Among the males, the opposite impact is found. Because the earnings disparities
701
increased, differences in the returns to endowments between Han and minority males produced
an adverse impact on the relative wages of minority males.
E. Inter-temporal Decomposition
The second decomposition displayed in Table 12.8 considers the partitioning of the disparity
measure into portions attributable to differences in endowments within a group between time
periods and differences in the returns to such endowments. The same group is being compared to
itself during the two time periods. As we have noted in the data description, the composition of
the groups changed as did the relative earnings of younger and older members of each group.
Unsurprisingly, almost none of the inter-temporal changes in earnings disparities can be
attributed to differences in treatment of minorities in one period versus treatment of minorities in
another period or to differences in treatment of Han in one period versus treatment of Han in
another period. Instead, most of the changes can be attributed to changes in endowments.
These results are tempered by the fact that we focus solely on urban wage-earners. There
are three forms of selection that this analysis does not take into account. The first is the selection
of wage-earners among all potential workers. Darity and Myers (2001), using data on blacks and
whites in the United States, show that this type of selection will bias upward measures of
minority-majority earnings. The second form of selection, alluded to in the introduction to this
chapter, involves the migration of the most talented minorities from rural areas to urban areas.
This sort of (self-) selection helps to explain how it is possible for minority-majority income
disparities to be narrowing in urban areas while they are widening in rural areas. A third
unexplored form of selection is a policy-induced selection. Preferences for minorities in college
admissions or in hiring for government jobs or state-owned enterprises can produce a
702
concentration of highly qualified minorities in locations like Beijing, the seat of the central
government where there are large numbers of college graduates. In short, the underlying
measures of urban earnings disparities examined in this chapter reflect multiple sources of
selection that merit additional investigation in future research.
VII. Summary and Conclusions
This chapter provides documentation on a pattern of first narrowing and then widening of
minority-Han earnings disparities between 1995 and 2007 among urban workers. The patterns
differ for males and females, with a widening occurring among minority versus Han males but an
initial narrowing occurring among minority versus Han females followed by a more recent
widening of the earnings gaps.
A. Females
A key component in the change in minority-Han earnings gaps is the difference in
treatment. For 1995, we estimate the portion of the gap between minority and Han females that
is unexplained. By 2002, there continued to be minority-Han differences in treatment.
Consistent with a national policy of preferences for minorities, the differences in treatment on
some variables favored minority females, who experienced higher earnings in 2002 than Han
females. Accounting for differences in human capital, occupation, firm type, and province does
not eliminate this apparent advantage experienced by minority females in 2002. Using a single
regression equation and controlling for age, education, occupation, firm type, and province, in
2007 minority status has a small but statistically insignificant impact on ln-earnings. When a full
703
residual difference model is estimated, a small unexplained gap is measured. On balance, any
unexplained disparity in 1995 seems to have dissipated by 2007.
Why did the ratio of minority to Han earnings rise for females between 1995 and 2002
and then fall in 2007? Only part of the answer can be found in the analysis of returns to
education or returns to employment in state-owned enterprises. Differences in the rates of return
to education and to employment in state-owned enterprises between Han and minorities can be
interpreted as policy-induced differences in treatment. The policy instrument is understood to be
preferences in college admission and hiring in state-owned enterprises. Table 12.4 shows that the
returns to education and returns to employment in state-owned enterprises essentially converged
for Han and minority females by 2007. The answer lies in part in the nature of the sample and
the changing hukou policies.
The urban sample does not include migrants with hukou in another jurisdiction. All
persons in the urban sample are individuals with their hukou in the specified urban area. Thus,
technically, the sample excludes migrants and persons with their hukou in other locations.
However, an important policy change regarding hukou affects this interpretation. At the time of
the data collection for the 2002 CHIP sample, rural persons admitted to universities in urban
areas were permitted to change their hukou to the urban area. As such, some of the urban
workers in the 2002 sample may well be migrants in the sense that their original hukou was in
another jurisdiction, but their change in hukou was brought about because of their clearly
selective admissions to universities. This permissive policy changed again by the time of the
collection of the 2007 data. Therefore, even with selective admissions to universities, persons
from other jurisdictions will not appear in the 2007 data set.
704
Further evidence of a selective process involved in the determination of the earnings of
minority females is found in Table 12.5. Minority educational levels jumped from 1995 to 2002.
The share of minority females employed in professional jobs increased considerably. The percent
employed as managers in government enterprises almost doubled, from 2.57 percent to 5.02
percent. In short, minority females earned more in 2002 than Han females because the share of
minority females among high earners increased.
B. Males
The minority-Han ratio of wage and salary earnings among males, by way of contrast,
declined steadily throughout the period examined. This widening gap in earnings cannot be
attributed solely to ethnic differences in endowments. Our results suggest that there has been a
rise in the unexplained portion of the overall gap in earnings between minority males and Han
males in urban areas. Although the education attainment of urban minority males approached
that of urban Han males and other measures of human capital also improved, the gap in earnings
widened for males. The reason? Changes in the impacts that these human capital factors had on
earnings. The improved endowments of urban minority males were overshadowed by their
differential treatment relative to that of Han workers. An important insight is that minority male
employment in managerial jobs and jobs in SOEs helps to reduce earnings disparities, partly
because in recent years the estimated returns to managerial jobs and SOE employment have been
higher for minorities than for Han. Still, other factors counteract these impacts. One of the
greatest is the growing private-sector employment relative to state-owned enterprise employment.
Thus, although there are positive effects for urban minority males employed in SOEs, as the
private sector expands, SOE employment represents a declining share of employment.
705
Thus, to answer the core question raised at the outset of this chapter, we find that the two
state policies of preferential treatment in education and employment had their intended impacts,
at least among males. These policies worked to reduce gaps in earnings between Han and
minority males. The returns to education were essentially equalized between Han and minority
males by 2007 while the returns to employment in state-owned enterprises steadily rose for
minority males to the point that by 2007 they were higher than the returns for Han males.
However, these impacts were not large enough to prevent an otherwise widening disparity in
earnings between Han and minorities.
Among females we find that the “unexplained” portion of the disparity in wage and
salary incomes between Han and minorities narrowed from 1995 to 2007. We cannot directly
attribute this narrowing of wage and salary incomes among females to state policies of
preferential treatment in education and employment. But the evidence clearly shows that Han-
minority wage and salary gaps were smaller in 2007 than they were in 1995. We have
speculated that changes in hukou policies might account for the surprising jump in the ratio of
minority to Han wage and salary incomes from 1995 to 2007. The sample is restricted to urban
residents and technically excludes migrants. However, the policy that permitted university
students from rural areas to change their hukou to the urban location of their universities could
serve as a selection mechanism associated with the higher mean earnings of the beneficiaries of
these policies. This, along with the policy of permitting rural women who marry urban men to
change their hukou, the policy in force in 2002 of permitting minority students to change their
hukou might explain the narrowing of the wage gap for females.
In short, several forms of selection are likely to be underlying these trends: widening
earnings disparities between Han and minority males; and narrowing, and then widening,
706
disparities among females. One obvious form relates to differential labor-force participation.
Another form that might explain the surprising results for females in 2002 is the policy-induced
selection affecting the ability of minority females to change their hukou by marriage to urban
males and/or via university enrollment. Other, less well-understood forms of selection include
the process of being selected for employment in state-run enterprises via membership in the
Communist Party. These complexities provide areas for future research.
.
707
References
Cai, F., D. Wang, and Y. Du (2002), “Regional Disparity and Economic Growth in China: The Impact of Labor Market Distortions,” China Economic Review, 13(2-3), 197–212. Chow, G. C. (1993), “Capital Formation and Economic Growth in China,” Quarterly Journal of Economics, 108(3), 809–842. Chow, G. C. and K. W. Li (2002), “China’s Economic Growth: 1952–2010,” Economic Development and Cultural Change, 51(1), 247–256. Darity, W. A., Jr. (1982), “The Human Capital Approach to Black-White Earnings Inequality: Some Unsettled Questions,” Journal of Human Resources, 17(1), 72–93. Darity, W. and S.L. Myers, Jr. (2001), “Why Did Black Relative Earnings Surge in the Early 1990s?” Journal of Economic Issues, 35(2), 533–542. Darity, W., S.L. Myers, Jr., and C. Chung (1998), “Racial Earnings Disparities and Family Structure," Southern Economic Journal, 65(1), 20–41. Central People’s Government (2011), “Minwei fabu 2010 nian shaoshu minzu diqu nongcun pinkun jiance jieguo” (State Ethnic Affairs Commission Publishes the 2010 Poverty Monitor Results for Rural Ethnic Areas), July 29, at http:www.gov.cn/gzdt/2011- 07/29/content_1916420.htm, accessed September 29, 2011. Friedman, E. (2006), “Jiang Zemin’s Successors and China’s Growing Rich-Poor Gap,” in T.J. Cheng, J. deLisle, and D. Brown, eds., China Under Hu Jintao, 97-134, Singapore: World Scientific Publishing Co. Gustafsson, B. and S. Ding (2009), “Villages Where China’s Ethnic Minorities Live,” China Economic Review, 20(2), 193-207. Gustafsson, B. and S. Li (2003), “The Ethnic Minority-Majority Income Gap in Rural China During Transition,” Economic Development and Cultural Change, 51(4), 805-822. Gustafsson, B. A., S. Li, and T. Sicular (2008), Inequality and Public Policy in China, New York: Cambridge University Press. Hannum, E. (2002), “Educational Stratification by Ethnicity in China: Enrollment and Attainment in the Early Reform Years,” Demography, 39(1), 95–117. Hannum, E. and X. Yu (1998), “Ethnic Stratification in Northwest China: Occupational Differences between Han Chinese and National Minorities in Xinjiang, 1982-1990,” Demography, 35(3), 323-333.
708
Luo, C. and T. Sicular (2012), “Minority-Han Income Differentials in Rural China, 1988-2002,” unpublished draft paper, Western University, London, Ontario, Canada. Maurer-Fazio, M. (1999), “Earnings and Education in China’s Transition to a Market Economy: Survey Evidence from 1989 and 1992,” China Economic Review, 10(1), 17–40. Myers, S. L. Jr. (forthcoming), “Prosperity and Inequality: Lessons from the United States,” Chinese Academy of Social Sciences Proceedings. National Bureau of Statistics (NBS) (2009a), Zhongguo minzu tongji nianjian 2008 (China’s Ethnic Statistical Yearbook 2008), Beijing: Zhongguo tongji chubanshe. National Bureau of Statistics (NBS) (2009b), Zhongguo tongji nianjian 2009 (China Statistical Yearbook 2009), Beijing: Zhongguo tongji chubanshe. Organisation for Economic Co-operation and Development (OECD) (2010), Economic Surveys: China, Paris. Rong, Xue Lan and Tianjian Shi (2001), “Inequality in Chinese Education,” Journal of Contemporary China, 10(26), 107-124. Sicular, T., X. Yue, B. Gustafsson, and S. Li (2007), “The Urban-Rural Income Gap and Inequality in China,” Review of Income and Wealth, 53(1), 93-126. Smith, J. P. and F. R. Welch (1975), “Black-White Earnings and Employment, 1960–1970,” The RAND Corporation, R-1666. Smith, J. P. and F. R. Welch (1977), “Black-White Male Wage Ratios: 1960–70,” American Economic Review, 67(3), 323-338. Smith, J. P. and F. R. Welch (1989), “Black Economic Progress After Myrdal,” Journal of Economic Literature, 27(2), 519–564. Zang, X. and L. Li (2001), “Ethnicity and Earnings Determination in Urban China,” New Zealand Journal of Asian Studies, 3(1), 34–48. Zhang, X. and R. Kanbur (2005), “Spatial Inequality in Education and Health Care in China,” China Economic Review, 16(2), 189–204.
709
Figure 12.1 Real Rate of GDP Growth: China
Source: World Bank, World Development Indicators, at http://databank.worldbank.org/ddp/home.do?Step=12&id=4&CNO=2, accessed October 2,
2011.
710
Figure 12.2 The Ratio of Minority-to-Han Mean and Median Family-Household Total Incomes in Urban China (1995, 2002, and 2007 CHIP data) Source: Authors’ computations using the 1995, 2002, and 2007 CHIP data.
0
20
40
60
80
100
120
1995 2002 2007Year
MedianMean
711
Figure 12.3 Ratio of Minority to Han Wage and Salary Incomes
Source: Authors’ computations using the 1995, 2002, and 2007 CHIP data.
712
Table 12.1. Minority and Han salaries or wages in the same twelve provinces
1995 Minority Han Total
Observations 967 20729 21696 Percentage 4.46 95.54 100 Average individual wage or salary income 5,243.69 5,744.40 5,723.15 2002 Observations 902 19537 20439 Percentage 4.41 95.59 100 Average individual wage or salary income 10,527.53 10,620.19 10,616.34 2007 Observations 781 21548 22333 Percentage 3.50 96.49 100 Average individual wage or salary income 17,237.08 19,658.51 19,577.15 Note: The results are based on the same 12 provinces in the 1995, 2002, and 2007 data. Source: Authors’ computations using the 1995, 2002, and 2007 CHIP data.
713
Table 12.2. Ratio of minority to Han income and ratio of the income of those 18-30 years old to the income of those 31-60 years old
Minority Han Minority Han Minority Han
18-30 18-30 18-30 18-30 18-30 18-30
31-60 31-60 31-60 31-60 31-60 31-60
Total, Males 91.16% 90.69% 84.65%
Males, 18-30 105.53% 68.38% 86.17%
Males, 31-60 89.78% 97.78% 74.35%
Between Age Group
Disparity
78.73% 66.98% 51.49% 73.62% 120.57% 104.03%
Total, 91.56% 108.68% 89.27%
Females, 18- 82.22% 105.46% 95.74%
Females, 31- 93.86% 111.06% 87.78%
Between Age Group
Disparity
65.73% 75.04% 77.84% 81.98% 120.14% 110.16%
1995 2002 2007
Minority/Han
Minority/Han
Minority/Han
Source: Authors’ computations using the 1995, 2002, and 2007 CHIP data.
714
Table 12.3. Ordinary least squares estimates of the effects of minority status on ln-earnings
1995 2002 2007 Males
Unadjusted -0.086 -0.202 -0.194 (2.27)** (3.22)*** (2.19)**
Adjusted for Human Capital -0.055 -0.102 -0.192
(1.59) (1.86)* (2.33)**
Adjusted for Human Capital, Occupation, and Type of Firm
-0.048 -0.062 -0.152 (1.41) (1.16) (2.05)**
Adjusted for Human Capital,
Occupation, Type of Firm, and Province
-0.071 -0.070 -0.158
(2.17)** (1.32) (2.18)**
Females Unadjusted -0.090 0.120 -0.183
(1.99)** (1.65) (1.75)*
Adjusted for Human Capital -0.076 0.138 -0.133 (1.85)* (2.13)* (1.44)
Adjusted for Human Capital,
Occupation, and Type of Firm-0.087 0.199 -0.044
(2.16)** (3.16)** (0.53)
Adjusted for Human Capital, Occupation, Type of Firm, and
Province
-0.115 0.177 -0.043
(2.95)*** (2.78)*** (0.51)
Notes: Absolute value of t statistics in parentheses;* significant at 10%; ** significant at 5%; *** significant at 1%. Full regression results are available at http://www.hhh.umn.edu/centers/wilkins/pdf/DoesaRisingTideLiftAllShips.pdf, accessed October 3, 2011.
715
Table 12.4. Returns to education and employment in state-owned enterprises 1995 2002 2007 Male Female Male Female Male Female
Education All Groups 0.025 0.039 0.090 0.133 0.083 0.110 (10.30)*** (12.48)*** (23.04)*** (27.99)*** (16.90)*** (17.95)*** Minorities 0.035 0.055 0.099 0.133 0.083 0.102 (2.55)** (2.82)*** (5.19)*** (6.00)*** (3.01)*** (2.89)*** Han 0.024 0.038 0.089 0.133 0.083 0.110 (9.95)*** (12.26)*** (22.20)*** (27.32)*** (16.52)*** (17.58)***
State-owned Enterprises All Groups 0.215 0.280 0.068 0.148 0.715 0.702 (11.12)*** (14.51)*** (2.34)** (3.99)*** (23.40)*** (19.46)*** Minorities 0.108 0.295 0.212 -0.177 0.833 0.772 (1.08) (2.33)** (1.21) (0.64) (4.60)*** (3.58)*** Han 0.220 0.278 0.062 0.153 0.710 0.702 (11.12)*** (14.33)*** (2.12)** (4.08)*** (22.83)*** (19.13)***
Notes: Absolute value of t statistics in parentheses;* significant at 10%; ** significant at 5%; *** significant at 1%; OLS estimates of coefficients on education and SOEs in Ln-Wage equation, controlling for age, education, household head, occupation, type of firm, and province. Full regression results are available at http://www.hhh.umn.edu/centers/wilkins/pdf/DoesaRisingTideLiftAllShips.pdf, accessed October 3, 2011.
716
Table 12.5 Descriptive statistics from the 1995, 2002, and 2007 CHIP data
1995 2002 2007
Han Minority Han Minority Han Minority
MALES
Age 42.98 41.71 43.06 42.29 39.17 38.25
Education 10.8 10.46 12.31 12.05 12.51 12.58
Occupation Owner or manager of private
enterprise or self-employed 1.65 0.96 1.9 6.48 1.08 0.67
Professional or technical 21.2 21.09 20.95 18.52 18.05 19.46
Manager of government department or institution 18.62 14.06 15.81 15.28 6.77 6.71
Worker or other 58.53 63.9 61.35 59.72 74.1 73.15
Ownership
SOEs 86.03 84.01 83.67 76.92 73.81 73.95
Collectives 10.99 12.54 11.45 17.95 6.18 5.04
Private or self-employed 1.46 2.19 3.9 5.13 14.96 15.97
Other 1.53 1.25 0.98 0 5.05 5.04
FEMALE
Age 42.35 42.75 40.45 39.42 37.41 38.39
Education 9.81 9.58 12.01 11.95 12.51 12.59
Occupation Owner or manager of private
enterprise or self-employed 1.49 2.25 1.53 5.75 1.05 3.25
Professional or technical 21.24 24.12 23.34 29.31 17.74 24.39 Manager of government
department or institution 5.94 2.57 5.02 5.17 2.84 3.25
Worker or other 71.34 71.06 70.11 59.77 78.37 69.11
Ownership
SOEs 75.41 77.64 79.69 61.11 64.26 63.37
Collectives 21.17 18.94 16.47 22.22 9.39 7.92 Source: Authors’ computations from the 1995, 2002, and 2007 CHIP data.
717
Han Minority Han-
Minority
Minority Treated as
Han ResidualUnexplained Percentage
(1) (2) (1)-(2) (3) (3)-(2) [(2)-(3) ]/ [(1)-(2)] Males
1995 8.498 8.382 0.116 8.415 0.033 28.3% 2002 8.709 8.511 0.198 8.610 0.099 50.2% 2007 9.247 9.056 0.192 9.145 0.089 46.7%
Females 1995 8.139 7.639 0.500 8.079 0.441 88.1% 2002 8.268 8.550 -0.281 8.204 -0.346 122.9% 2007 8.604 8.475 0.129 8.511 0.037 28.4%
Notes: From ln-earnings regressions controlling for age, education, household head, occupation, type of firm, and a regional dummy variable for the western and central provinces.
Table 12.6. Residual difference analysis of ethnic minority vs. Han wage and salary income
718
Table 12.7. Determinants of changes in the disparities in ethnic earnings
1995-2002 2002-2007 1995-2007 Male Age -0.01 0.006 -0.004 Education 0.011 0.011 0.021 Household head -0.225 0.418 0.194
Owner or manager of private enterprises 0.212 /1 -1.078 -0.866 Manager of institution -0.141 -0.142 -0.283 Worker or other 0.021 -0.193 -0.171 State-owned enterprise -0.285 0.035 -0.251
Private or self-employed -0.247 0.46 0.213 /1
Others 0.206 /2 -0.362 -0.518
Female Age -0.036 0.02 -0.016 Education 0.006 0.015 0.021 Household head 0.111 -0.409 -0.298 Owner or manager of private enterprise -0.206 0.887 0.681 Manager of institution -0.145 0.555 0.409 Worker or other 0.044 0.286 0.33 State-owned enterprise 0.386 -0.316 0.071 Private or self-employed -0.583 0.214 -0.369 Others 0.695 0.039 0.733
Notes: Estimates include regional dummy variables (not shown) for western and central provinces. /1The coefficients for these variables could not be estimated for the minorities in 1995. The number reported assumes that this coefficient is zero. /2The coefficients for these variables could not be estimated for the minorities in 2002. The number reported assumes that this coefficient is zero.
719
Table 12.8. Intra-temporal and inter-temporal decomposition of the disparity measure
1995-2002 2002-2007 1995-2007 Males Females Males Females Males Females
I(t+1) 0.082 -0.781 -0.007 0.41 0.075 -0.371
Intra-Temporal Decomposition Treatment Effect 82% 101% 143% 93% 76% 109% Endowment Effect 18% -1% -43% 7% 25% -9%
Inter-Temporal Decomposition Treatment Effect -133% -3% 43% 18% -92% -6% Endowment Effect 233% 103% 57% 82% 192% 106%
Notes: The ln-earnings estimates include age, education, household head, occupation, type of firm, and a regional dummy variable for the western and central provinces.
720
*Blanca Monter and Juan Cardenas provided valuable research assistance. Support from the U.S. Fulbright Foundation is gratefully acknowledged. 1 The People’s Republic of China currently officially recognizes the Han majority and 55 different ethnic minorities (minzu, meaning ethnic group or nationality). Based on the Rules of Classifying the Nationality of Chinese Citizens, which were enacted in 1990, a person is classified as a minority based freely on the nationality of one of his or her parents. Minority status can be registered by a person’s parents before he or she is 18 years old, or the person can select a nationality when he or she is 18 or older. One’s nationality cannot be changed after the age of 20. 2 Article 4: All nationalities in the People’s Republic of China are equal. The state protects the lawful rights and interests of the minority nationalities and upholds and develops a relationship of equality, unity, and mutual assistance among all of China's nationalities. Discrimination against and oppression of any nationality are prohibited; any act which undermines the unity of the nationalities or instigates division is prohibited.
The state assists areas inhabited by minority nationalities in accelerating their economic and cultural development according to the characteristics and needs of the various minority nationalities.
Regional autonomy is practiced in areas where people of minority nationalities live in concentrated communities; in these areas organs of self-government are established to exercise the power of autonomy. All national autonomous areas are integral parts of the People's Republic of China.
All nationalities have the freedom to use and develop their own spoken and written languages and to preserve or reform their own folkways and customs.


