Embed Size (px)
Citation preview

Interviewer Effects on Nonresponse in the EuropeanSocial Survey
Annelies G. Blom1, Edith D. de Leeuw2, and Joop J. Hox3
In face-to-face surveys interviewers play a crucial role in making contact with and gainingcooperation from sample units. While there are a few studies investigating the influence ofinterviewers on nonresponse, they are typically restricted to analyses within a single country.However, interviewer training, contacting and cooperation strategies as well as surveyclimates differ across countries, thus influencing differential nonresponse processes andpossibly nonresponse biases. Combining call-record data from the European Social Survey(ESS) with data from a detailed interviewer questionnaire on attitudes and doorstep behavior,we analyze interviewer and country effects on nonresponse. Our findings show that there aresystematic differences between countries in contacting and cooperation processes, which canin part be explained by differences in interviewer characteristics, such as contacting strategiesand avowed doorstep behavior.
Key words: Contact; cooperation; interviewer attitudes; doorstep behavior; interviewerquestionnaire; contact form; cross-cultural research; international surveys; paradata.
1. Introduction
Nonresponse in surveys is a serious concern of survey researchers all over the world, and
there is considerable evidence that survey nonresponse has been increasing over time
due to an increase in both noncontact and refusal rates (De Leeuw and De Heer 2002;
Couper and De Leeuw 2003). All sectors of the survey industry – academic, government,
business, and media – are suffering from falling response rates (Brehm 1994); also, all
modes of data collection show this trend (Goyder 1987; Hox and De Leeuw 1994). In the
past two decades, researchers have developed theoretic frameworks for the nonresponse
process (Dillman 1978; Dillman et al. 2009; Goyder 1987; Groves et al. 1992; Groves and
Couper 1998; Hox et al. 1996), and practical implementations based on these theories have
been described (e.g., Campanelli et al. 1997; Stoop 2005 (see also the JOS special issue
on survey nonresponse 1999).
q Statistics Sweden
1 Mannheim Research Institute for the Economics of Aging (MEA), University of Mannheim, L13, 17, D-68131Mannheim, Germany. Email: [email protected] Utrecht University, Department of Methodology and Statistics, PO Box 80.140, NL-3508 TC Utrecht,The Netherlands. Email: [email protected] Utrecht University, Department of Methodology and Statistics, PO Box 80.140, NL-3508 TC Utrecht,The Netherlands. Email: [email protected]: The authors are listed in alphabetical order. The authors would like to thank Heikki Ervasti(Finland), Lilli Japec (Sweden), Dominique Joye (Switzerland), Geert Loosveldt (Belgium), Peer Scheepers andFrans Louwen (Holland), Katarina Thomson and Peter Lynn (UK), Pawel Sztabinski (Poland), and Jorge Vala(Portugal) for their enthusiastic support in translating and implementing the interviewer questionnaire in theircountries, and David Marker for his comments on earlier versions.
Journal of Official Statistics, Vol. 27, No. 2, 2011, pp. 359–377

Several design features have proven to be effective in reducing nonresponse for all types
of surveys and modes, and across different countries. Meta analyses, giving a statistical
summary and synthesis of empirical research, provide evidence that both the use of
prenotification (advance) letters (De Leeuw et al. 2007) and the use of incentives (Singer
2002; Singer et al. 1999; Cantor et al. 2008) raise response rates, although the effect sizes
are modest.
Groves and Couper (1998, p. 30) point out that many factors influencing survey
response, such as the social environment, are out of the researcher’s control, while others,
such as the survey design, can be influenced by the researcher. In face-to-face surveys,
the interviewer is the researcher’s representative, and through selection, training, and
supervision, the researcher may influence the interviewer’s work. While the main role of
interviewers is conducting high-quality interviews, they also play a key role in contacting
and convincing sample units. As a consequence, research into the role of interviewers in
the nonresponse process is growing, and attention has been paid to interviewer attributes,
such as experience (Durban and Stuart 1951; Couper and Groves 1992; Singer et al. 1983;
Snijkers et al. 1999) and skills (Campanelli et al. 1997; Morton-Williams 1993), and to
interviewer-respondent interaction (Groves and Couper 1998), as well as to survey design
characteristics such as interviewer burden (Japec 2008) and interviewer payment (De Heer
1999; Durrant et al. 2010).
To explain differential response rates between interviewers and why more experienced
interviewers achieve higher response rates, survey methodologists have examined
interviewer attitudes and motivation (Campanelli et al. 1997; Groves and Couper 1998;
Hox and De Leeuw 2002; Durrant et al. 2010). This strand of research was inspired by the
work of Lehtonen (1996), who developed a short interviewer attitudes scale and showed
that attitudes correlate with attained response rate. A second line of studies focuses on
interviewer behavior and interviewer-respondent interaction (Campanelli et al. 1997;
Couper and Groves 1992; Groves and Couper 1998; Snijkers et al. 1999). This started with
the pioneering work of Morton-Williams (1993), who analyzed tape recordings of survey
introductions and identified successful interviewer strategies, such as using professional
and social skills, and adapting these to the doorstep situation.
Previous research has shown that the magnitude and composition of nonresponse differ
across countries (De Leeuw and De Heer 2002; Couper and De Leeuw 2003; Billiet et al.
2007; Symons et al. 2008), and that there are cross-country differences in contact and
cooperation processes (Blom, forthcoming; Kreuter and Kohler 2009). Research has also
shown that interviewers’ experience, motivation, attitudes, and behavior are related to
interviewers’ response rates within a single country (Campanelli et al. 1997; Couper and
Groves 1992; Groves and Couper 1998; Pickery and Loosveldt 2002; Snijkers et al. 1999;
Durrant et al. 2010), and that interviewers’ attitudes and behavior differ between countries
(Hox and De Leeuw 2002). However, cross-national analyses of the influence of
interviewers on contact and cooperation are rare indeed, although a first attempt was made
by Hox and De Leeuw (2002). This is not surprising, as survey methodologists have only
recently started collecting and analyzing standardized paradata on (non)response
processes in cross-national surveys (see Blom et al. 2010 for a review).
We were able to draw on the cross-national call record data of the first round of the
European Social Survey (ESS) conducted in 2002/2003, linked to interviewer data from
Journal of Official Statistics360

a specially designed international interviewer questionnaire (De Leeuw and Hox 2009).
This provides us with a unique data set in which both contact data, paradata on sample
units, and data on interviewer characteristics are combined for a large standardized
international survey. The high methodological quality and standardization of these
cross-national data permit us to examine how interviewer attributes affect contact and
cooperation rates across different European countries, something that has not been possible
before due to data limitations (cf. Hox and De Leeuw 2002; cf. Durrant et al. 2010).
2. Design and Data Collection
The European Social Survey (ESS) is an academic cross-national survey of social and
political attitudes and behavior in Europe. It follows high methodological standards, such
as strict probability sampling, careful comparative questionnaire design and translation
procedures, in-person interviewer training, advance letters, and cross-national fieldwork
monitoring (for more information see www.europeansocialsurvey.org). Data collection
takes place through face-to-face interviews, and in each country interviewers are carefully
selected and trained for this survey. Maximizing response in each country is a focal point
of ESS survey implementation (see Stoop et al. 2010; Koch et al. 2009); nevertheless,
countries differ in the magnitude and composition of their nonresponse (Symons et al.
2008). To monitor nonresponse processes in each ESS country, the survey implements
standardized contact (call record) forms and conducts analyses to foster round-to-round
improvement. This makes the ESS a unique data source to investigate nonresponse
differences across European countries and interviewers’ influence thereupon.
2.1. ESS Contact Forms
The ESS interviewers use standardized contact forms to collect call-level information on
the contacting and cooperation processes, as well as on the neighborhood of each sample
unit. The call-record data are measurements of key aspects of the process that leads to a
fieldwork outcome. They provide information on all sample units (i.e., respondents and
nonrespondents) and on all contact attempts. Information collected includes the date, time,
mode (phone, mail or in-person), interviewer and outcome (no contact, interview, refusal,
unable, ineligible, appointment, etc.) of each contact attempt. The data are used to monitor
and optimize different stages of the data collection process. In addition to contact data, the
ESS collects information on the housing and neighborhood of the sample unit, such as the
state of the neighborhood, the presence of an intercom and security features at the house
(Blom et al. 2010). From these paradata we derived indicators of contact and cooperation
at the level of the sample unit and interviewer.
Table 1 presents the overall response rates, in-person household contact rates, and
cooperation rates across those countries where contact data were available and the
interviewer questionnaire had been administered.
2.2. International Interviewer Questionnaire
Prior to the first round of the ESS, a standardized international interviewer questionnaire
was developed, based on earlier work by Hox and De Leeuw (2002). The core
Blom, de Leeuw, and Hox: Interviewer Effects on Nonresponse 361

questionnaire consisted of attitude questions on persuasion strategies based on Lehtonen
(1996), and questions on avowed doorstep behavior based on Campanelli et al. (1997),
Groves et al. (1992), and Morton-Williams (1993). Drawing on new theoretical and
empirical findings, several questions were added to this core questionnaire. These include
questions on verbally dealing with reluctance (Pondman 1998) and on reported successful
interviewer strategies (Snijkers et al. 1999). In addition, interviewer background
characteristics (age, experience, and education) were collected. An English master
questionnaire was made available to all countries participating in the first round of the ESS
in 2002. For a detailed description of the interviewer questionnaire, including question
texts and psychometric properties, see De Leeuw and Hox (2009).
Before the start of the ESS data collection all country coordinators were approached by
email and asked if they were willing and able to let their interviewers fill out an interviewer
questionnaire. This activity was entirely voluntary and eight countries participated. The
coordinators of these countries provided for a careful translation of the master
questionnaire and the subsequent data collection. Table 2 lists the participating countries,
the number of interviewers in each country, their age, sex, and average years of experience.
Due to privacy regulations, age and gender of the Swedish interviewers were not
recorded. Due to the same privacy regulations, the ESS interviewer identification for the
Swedish interviewers was not provided and no Swedish contact data were available in
Round 1. For all other countries the interviewer questionnaire data could be successfully
Table 2. Interviewers by country: number, mean age, % male, and mean years of experience
Country Frequency Percent Mean age % Male Mean experience
Netherlands 60 6.8 52 .40 10.4Belgium 82 9.3 48 .41 6.8Switzerland 46 5.2 34 .50 1.8United Kingdom 149 16.9 56 .49 6.5Sweden 177 20.1 – – 7.9Poland 175 19.9 40 .40 4.9Portugal 58 6.6 38 .29 6.4Finland 133 15.1 52 .96 12.7Total 880 100.0 47 .52 7.4
Table 1. Response by country: response rate, contact rate, and cooperation rate
Country Response rate Contact rate Cooperation rate% % %
Belgium 58.6 89.2 65.7Finland 73.2 80.1 91.4Netherlands 67.9 94.1 72.1Poland 72.2 94.2 76.6Portugal 68.9 93.7 73.5Switzerland 34.0 74.6 45.5United Kingdom 53.3 94.5 56.4
Note: The contact rates are based on contact defined as in-person contact with the household.
Due to data protection laws there are no contact data available for Sweden in ESS Round 1 and thus no response
rates could be calculated.
Journal of Official Statistics362

linked to the contact-form data. In Switzerland half of the sample was included in an
experiment, during which all the initial contacting was conducted via telephone in a call
center. Since this meant that the experimental part of the Swiss sample could not be
compared to the samples from the other ESS countries, where initial contact is usually
attempted in person, we only examine the nonexperimental (face-to-face) part of the
Swiss sample. Our analysis thus included seven countries: the Netherlands, Belgium,
Switzerland (nonexperimental sample), the United Kingdom, Poland, Portugal, and
Finland, and the data of the 703 interviewers in these countries.
3. Analysis Method
The two most important components of nonresponse in household interview surveys are
noncontacts and refusals (Groves and Couper 1998) and attempts to reduce nonresponse
focus mainly on these components (Dillman et al. 2002). Furthermore, processes leading
to cooperation differ from those leading to contact (Lynn and Clarke 2002). Therefore we
model the two processes separately and the resulting dependent variables in our study are
(1) contact (i.e., whether in-person contact with the household was made or not), and (2)
cooperation (i.e., whether the sample unit was interviewed or not, after successful contact
had been made). Accordingly, two separate data files were created: one to investigate the
interviewers’ influence on contact, the second to investigate the interviewers’ influence on
cooperation after the sample unit had been successfully contacted.
All Swedish interviewers had to be excluded as due to Swedish privacy rules their
interviewer data could not be linked to the ESS contact-form data (177 interviewers in
total). Due to missing or incomplete interviewer identification numbers on the contact-
forms, the call record and interviewer data could not always be matched (23 nonmatching
interviewers across the remaining countries). In addition, cases at the level of the sample
unit and the interviewer had to be deleted list-wise due to incomplete call record and
interviewer data (item missings).
For the analyses of interviewers’ effect on (non)contact, the sample units in the ESS
contact-form data were linked to the interviewer questionnaire data of the interviewer who
undertook the last contact attempt at these sample units. This resulted in a noncontact data
set with questionnaire data on 662 interviewers and contact-form data for 15,700 eligible
sample units, of whom 14,292 were contacted.
For the analyses of interviewers’ effect on cooperation, the sample units in the ESS
contact-form data were linked to the interviewer questionnaire data of the last interviewer
that tried to convince the sample unit to participate in the interview, given contact had
been established. The contacted sample units consisted of completed interviews, refusals,
unable (e.g., language barrier), and otherwise noncooperative sample units (e.g., broken
appointment). In our analysis we do not distinguish between the different forms of
noncooperation, since the line between refusals and other forms of nonresponse is
indistinct, the group of “other contact but no interview” is rather heterogeneous, and the
numbers for these categories were small (see Blom 2009, Chapter 2). This resulted in a
cooperation data set with data on 660 interviewers and contact-form information for
13,717 contacted sample units, of whom 10,044 cooperated.
Blom, de Leeuw, and Hox: Interviewer Effects on Nonresponse 363

We performed separate analyses for contact and for cooperation. A three-level logistic
regression model was used with sample units nested within interviewers nested within
countries. Multi-level analysis is now standard good practice for the analysis of
interviewer effects on nonresponse (e.g., Hox et al. 1991; Hox 1994; O’Muircheartaigh
and Campanelli 1999; Pickery and Loosveldt 2004). Because the number of countries
(seven) is relatively small, all models were estimated using Supermix (Hedeker et al.
2008), which has the advantage of using full numerical integration for the estimation
procedure. Numerical integration is generally more accurate than the Taylor series
expansion used in other software packages, especially with small samples and when
estimating the variance components. Regression coefficients were tested using a two-sided
Wald test, while variances were tested using the deviance difference test, which is more
accurate for variances (Hox 2010).
This approach enables us to answer the following three research questions:
(1) Are there systematic differences between countries and between interviewers?
(2) Can these differences be explained by observable characteristics of sample units and
interviewer (contact) strategies?
(3) Can these differences be explained by differences in interviewer characteristics?
In the subsequent sections we describe the available variables on the sample-unit level
and interviewer-level, and discuss their relevance for contact and cooperation.
3.1. Sample-Unit Level Variables
All sample-unit level variables are derived from the ESS contact-forms and consist of both
call-record data and information on housing and neighborhood. The outcome variables
were also derived from the contact-forms. These are contact (i.e., whether in-person
contact made or not) and cooperation conditional on contact (i.e., whether the sample unit
cooperated or not, once contact had been made). Two groups of sample-unit-level
predictor variables can be discerned: those describing the interviewer’s contacting and
cooperation strategy for the specific sample unit, and those based on the interviewer’s
observations of the sample unit’s environment.
The first group of variables describes the contacting and cooperation strategies
employed at a sample unit to achieve an interview. These include whether initial contact
was made by telephone, whether contact attempts were made outside office hours (i.e.,
after 5 pm on weekdays or during the weekend), and whether initial contact was achieved
outside office hours. Stoop (2005, p. 95) reviews the empirical evidence on the influence of
telephone precontact on response in face-to-face surveys and concludes that there is not
much evidence regarding the advantages and disadvantages of using the telephone before
making home calls to obtain an interview. Lipps and Benson (2005) argue that for certain
respondents at certain time points (e.g., for the elderly later in the evening) a telephone
contact may be better, and they indeed find some evidence for a curvilinear relationship
with response. Timing of contact attempts is generally seen as a major determinant of
successful contact, and earlier studies of call-record data for face-to-face interviews
provide evidence that contact rates in the evenings and during weekends are higher than
during office hours (e.g., Purdon et al. 1999; Stoop 2005, p. 160). Finally, Lipps and
Journal of Official Statistics364

Benson (2005) found a relationship between contact outside office hours and cooperation:
initial contact on Saturday afternoon was most likely to lead to a completed interview.
Purdon et al. (1999) and Stoop (2005, p. 162), however, did not find a clear relationship
between time of first contact and willingness to cooperate.
The second group of variables describes the housing and neighborhood situation of
the sample unit, based on detailed interviewer observations. These include whether or not
the house had an intercom, whether there were any security features at the house, the type
of building (single-unit building or not), the state of buildings in the immediate
neighborhood, and the state of the sampled house compared to other houses in the
neighborhood. Physical impediments, such as an intercom or security features, may
obstruct contact with the sample unit (Groves and Couper 1998, p. 88); an intercom system
also hampers face-to-face interviewers’ ability to tailor and use their full battery of
strategies to convince sample units (Stoop 2005, p. 55). Type and state of housing are part
of the socio-economic environment of sample units (Groves and Couper 1998, p. 30) and
have been associated with cooperation, with those in well-maintained dwellings and
neighborhoods and in single houses being less likely to refuse (Stoop 2005, p. 208).
Groves and Couper (1998, p. 140) also find significantly higher nonresponse rates for
multi-unit housing structures, for both noncontact and refusal, and attribute this to social
isolation. Since the ESS housing and neighborhood variables are based on interviewer
observations, and therefore also subject to measurement error, we only used the most
objective aspects of these observations as described above.
3.2. Interviewer-Level Variables
The available interviewer-level variables can be classified in five groups. The first are
interviewer background variables collected in the interviewer questionnaire: age, sex,
education, and experience. Based on the literature (Durban and Stuart 1951; Groves and
Fultz 1985; Couper and Groves 1992; Hox et al. 1996; Pickery and Loosveldt 2002; Singer
et al. 1983), we expect experienced interviewers to perform better in achieving contact and
gaining cooperation with sample units, because they have acquired more professional,
cultural, and local knowledge relevant in this process (Groves and Couper 1998,
pp. 201–205).
The second group concerns work-related variables. These are the ESS workload, the
urbanicity of the region worked in, and the interviewer’s individual ESS contact and
cooperation rate, all derived from the contact-form data. The workload of interviewers is
generally seen as a negative influence on performance (see Japec 2008), and Bottman and
Thornberry (1992) argue that increased workload give interviewers less time to attempt
contact during the most productive times. Urbanicity is a strong correlate of nonresponse,
both for contact and for cooperation (Groves 1989, pp. 233–234; Campanelli et al. 1997;
Groves and Couper 1998, Chapters 4 and 5). Based on the findings of O’Muircheartaigh
and Campanelli (1999), who found that interviewers who are good at gaining cooperation
are also good at making contact, we added the interviewer’s ESS cooperation rate as
predictor in the model for contact, and the interviewer’s ESS contact rate as predictor in
the model for cooperation.
Blom, de Leeuw, and Hox: Interviewer Effects on Nonresponse 365

The third group of interviewer-level variables refers to contacting and cooperation
strategies. These are the percentage of cases ever attempted by phone (based on the
contact-form data), and reported interviewer behavior regarding asking neighbors for
information when a sample unit could not be contacted and regarding leaving a message
(e.g., a calling card) when nobody was at home at the sampled address (both based on the
interviewer questionnaire). In a study of cross-national contact strategies from the Survey
of Health, Ageing, and Retirement (SHARE), Lipps and Benson (2005) found that
although generally in-person contact attempts were positively related to successful
contact, whether initial in-person or telephone attempts were more successful depended on
the situation: well-performing interviewers were able to apply the most appropriate mode
of initial contact. Morton-Williams (1993) and Groves and Couper (1998) both emphasize
that good interviewers gather information about the sampled household to guide further
calls leading to successful contact. Social exchange theory (see Dillman 1978) suggests
that leaving a calling card when nobody is at home enhances cooperation and conveys the
sincerity of the survey purpose.
The fourth group contains measures of interviewer attitudes regarding persuading
reluctant respondents, the voluntary nature of surveys, the importance of the interviewer’s
image, and the importance of tailoring interviewer approaches. These indices and the
indices in the fifth group are based on questions from the interviewer questionnaire. The
indices were constructed using multigroup exploratory and confirmatory factor analysis,
which is described in detail in De Leeuw and Hox (2009). The variables in groups four and
five are all calculated using the “item mean scores” method with imputation. Questions
were appropriately rescored so that a high score on an index indicates a high level of
the measured characteristic. All computed indices have a theoretical minimum of 1 and a
maximum of 5.
A positive attitude towards persuasion indicates that an interviewer is persuasion-
oriented and is convinced that most people are willing to respond, and can and should be
persuaded when approached at the right time. Voluntariness indicates that interviewers
have a high respect for sample units’ privacy and believe in the voluntary nature of survey
cooperation. These interviewer attitudes were first described by Lehtonen (1996).
Research (e.g., Lehtonen 1996; De Leeuw et al. 1998; Hox and De Leeuw 2002) has
shown that persuasion is positively related to cooperation, while voluntariness is
negatively related to cooperation. Interviewer image, which is also positively related to
cooperation (Snijkers et al. 1999), describes the interviewer’s belief in the importance of
projecting a positive and professional image and refers to social skills and self-
presentation necessary for successful interviewers (Morton-Williams 1993). Interviewers
who assign high importance to tailoring think that each sample unit is different and needs a
unique approach; tailoring is seen as an important concept in nonresponse reduction
(Morton-Williams 1993; Groves and Couper 1998).
The last group of interviewer-level variables describes self-reported doorstep-behavior.
This includes a competent start of the introduction, tailoring the introduction, selling the
survey, using social validation arguments, dealing with reluctance, and respondent-
oriented behavior. A competent start of introduction describes the interviewers’ repertoire
during initial contact, such as, introducing themselves, naming the survey agency they
represent, and introducing the topic. A tailored introduction refers to the strategy of
Journal of Official Statistics366

adapting to the (doorstep) situation and varying the introduction, emphasizing specific
elements. Selling the survey indicates that interviewers do a good job at explaining the
importance of the survey, using practical arguments and compliance principles, whilst
linking the topic of the survey with its usefulness for the respondent. Social validation
describes interviewers that use person-oriented arguments and social validation principles
in their introduction to elicit a positive response (examples include statements such as
“most people enjoy this,” “most people participate”). Dealing with reluctance indicates a
positive way of reacting to refusals, such as, never repeating the arguments for refusal, but
giving positive, relevant information instead. Finally, respondent-oriented behavior
describes interviewer behavior and orientation necessary for good tailoring in the
introduction. Important aspects of respondent orientation include trying to understand
differences between sample units and adjusting language and arguments to the sample
unit’s characteristics and initial reactions. These six indices all refer to important concepts
discussed in the literature on interviewer behavior and nonresponse as described by
Cialdini et al. (1992), Morton-Williams (1993), Couper and Groves (1992), Hox et al.
(1996), Groves and Couper (1998), Pondman (1998), Snijkers et al. (1999), Hox and
De Leeuw (2002), and Stoop (2005).
4. Results
Both for contact and for cooperation three models were analyzed. The first model is the
intercept-only model, containing no predictor variables. This model estimates the variance
at the respondent, the interviewer and the country level, and provides an answer to the
first question:
(1) Are there systematic differences between countries and between interviewers?
Ideally, an interpenetrated design is employed, where interviewers are allocated at random
to sample units (Schnell and Kreuter 2005). In an international comparative survey,
allocating interviewers across countries is impossible, and in the context of the ESS
interviewers are also not allocated at random within countries. Therefore, we have to rely
on statistical control to distinguish between sample unit and interviewer effects. To
accomplish this, sample unit and interviewer variables are added in two separate steps. The
second model adds to the intercept-only model those sample unit variables that explain
significant variation. The third model then adds those interviewer variables that explain
significant variation. Thus, the effect of the interviewer variables is analyzed conditional
on the effect of the sample unit variables. This provides a conservative answer to the
second and the third question:
(2) Can the differences be explained by observable characteristics of sample units and
interviewer (contact) strategies?
(3) Can the differences be explained by differences in interviewer characteristics?
We analyzed the data by means of a multilevel logistic regression. In logistic regression,
multilevel or otherwise, the scale of the outcome variable changes when predictors are
added to the model. This makes it difficult to compare regression coefficients and variance
components across different models. We used McKelvey and Zavoina’s (1975) method to
Blom, de Leeuw, and Hox: Interviewer Effects on Nonresponse 367
rescale the second and third models to the metric of the empty model. In addition, we
calculated their pseudo R-square for logistic regression at all available levels. In a review
of several pseudo R-square measures, Long (1997) concludes that the McKelvey and
Zavoine pseudo R-square is to be preferred; Hox (2010) describes the multilevel extension
of their approach.
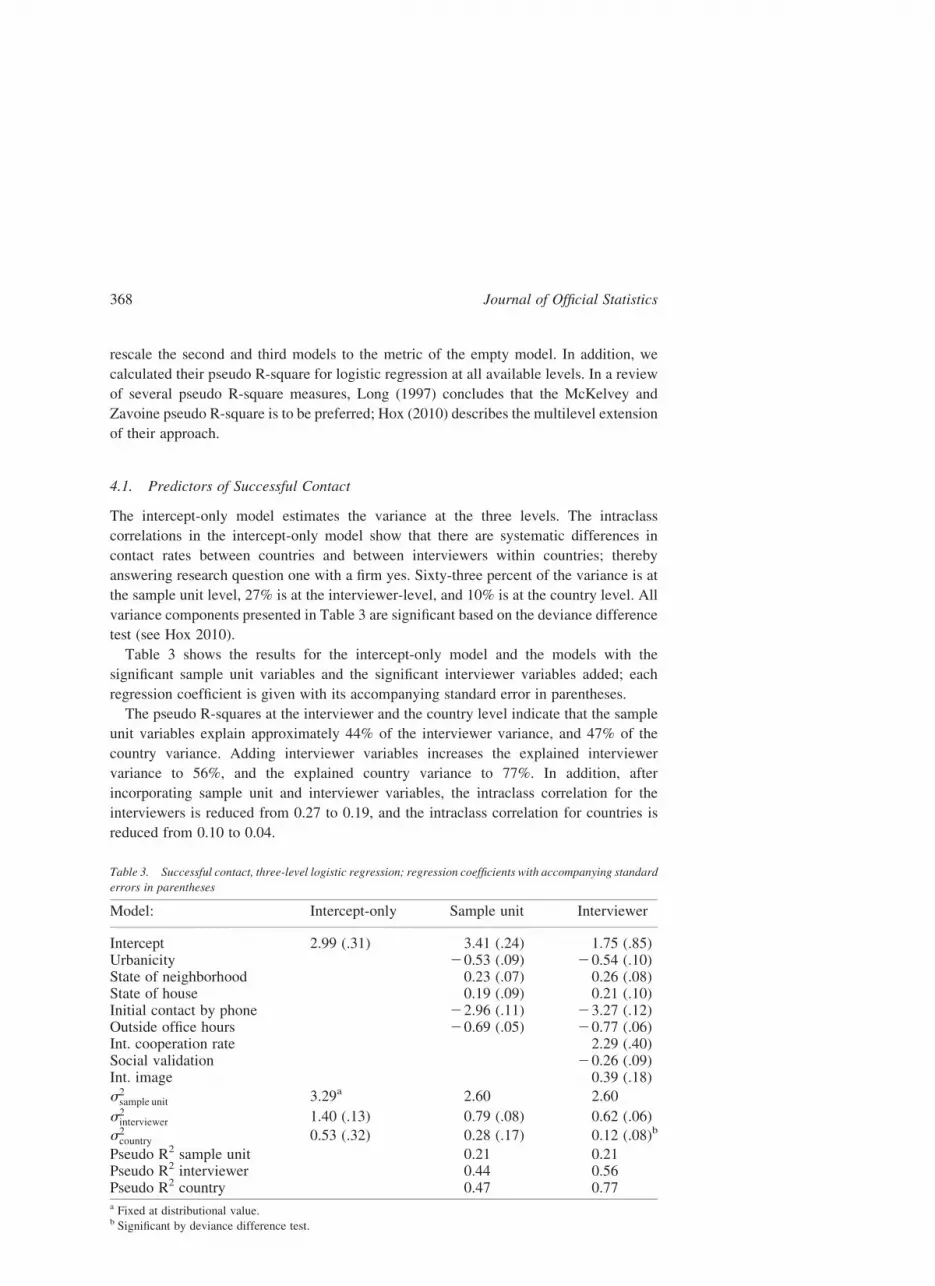
4.1. Predictors of Successful Contact
The intercept-only model estimates the variance at the three levels. The intraclass
correlations in the intercept-only model show that there are systematic differences in
contact rates between countries and between interviewers within countries; thereby
answering research question one with a firm yes. Sixty-three percent of the variance is at
the sample unit level, 27% is at the interviewer-level, and 10% is at the country level. All
variance components presented in Table 3 are significant based on the deviance difference
test (see Hox 2010).
Table 3 shows the results for the intercept-only model and the models with the
significant sample unit variables and the significant interviewer variables added; each
regression coefficient is given with its accompanying standard error in parentheses.
The pseudo R-squares at the interviewer and the country level indicate that the sample
unit variables explain approximately 44% of the interviewer variance, and 47% of the
country variance. Adding interviewer variables increases the explained interviewer
variance to 56%, and the explained country variance to 77%. In addition, after
incorporating sample unit and interviewer variables, the intraclass correlation for the
interviewers is reduced from 0.27 to 0.19, and the intraclass correlation for countries is
reduced from 0.10 to 0.04.
Table 3. Successful contact, three-level logistic regression; regression coefficients with accompanying standard
errors in parentheses
Model: Intercept-only Sample unit Interviewer
Intercept 2.99 (.31) 3.41 (.24) 1.75 (.85)Urbanicity 20.53 (.09) 20.54 (.10)State of neighborhood 0.23 (.07) 0.26 (.08)State of house 0.19 (.09) 0.21 (.10)Initial contact by phone 22.96 (.11) 23.27 (.12)Outside office hours 20.69 (.05) 20.77 (.06)Int. cooperation rate 2.29 (.40)Social validation 20.26 (.09)Int. image 0.39 (.18)
s2sample unit 3.29a 2.60 2.60
s2interviewer 1.40 (.13) 0.79 (.08) 0.62 (.06)
s2country 0.53 (.32) 0.28 (.17) 0.12 (.08)b
Pseudo R2 sample unit 0.21 0.21Pseudo R2 interviewer 0.44 0.56Pseudo R2 country 0.47 0.77a Fixed at distributional value.b Significant by deviance difference test.
Journal of Official Statistics368

Regarding research question two, the differences in contact rates can indeed be partly
explained by observable sample-unit characteristics and interviewer strategies. Significant
predictors are urbanicity, the state of the buildings in the immediate neighborhood, the
state of the sampled house compared to other buildings in the neighborhood, whether
initial contact is made by telephone, and whether contact attempts are made outside office
hours. All associations are in the expected direction, except for making calls outside office
hours, which has a negative regression coefficient. We come back to this in the Discussion.
Regarding research question three about successful interviewer characteristics for
contact, we find that interviewers who value a positive and professional interviewer
image achieve higher contact rates. However, using social validation arguments by the
interviewer is negatively related to successful contact. Finally, interviewers who are good
at gaining cooperation (after contact) are also good at making contact.
4.2. Predictors of Cooperation Conditional on Contact
The intraclass correlations in the intercept-only model show that there are systematic
differences in cooperation rates between countries and between interviewers within
countries. Again research question one can be answered in the affirmative: there are
systematic differences in cooperation after contact between countries and between
interviewers. Sixty-two percent of the variance is at the sample unit level, 8% is at the
interviewer-level, and 30% is at the country level. All variance components in Table 4 are
significant (using the deviance difference test, Hox 2010). Comparing the variances in the
intercept-only model in Table 4 and Table 3, it is interesting to note that systematic country
differences account for a much greater part of variability in cooperation than in contacts.
Table 4 shows the results for the intercept-only model and the models with the
significant sample unit and the interviewer variables added; each regression coefficient is
given with its accompanying standard error in parentheses.
Table 4. Cooperation conditional on contact, three-level logistic regression; regression coefficients with
accompanying standard errors in parentheses
Model: Intercept-only Sample unit Interviewer
Intercept 1.27 (.90) 0.50 (.45) 22.56 (.78)Intercom 20.56 (.16) 20.56 (.16)State of neighborhood 0.36 (.13) 0.33 (.13)State of house 0.32 (.15) 0.34 (.15)Initial contact by phone 1.87 (.19) 1.88 (.18)Dealing with reluctance 0.38 (.15)Age 0.04 (.01)
s2sample unit 3.29a 3.75 3.75
s2interviewer 0.44 (.03) 0.52 (.03) 0.43 (.02)
s2country 1.59 (.85) 0.34 (.19) 0.06 (.03)
Pseudo R2 sample unit 0.00 0.00Pseudo R2 interviewer 0.00 0.17Pseudo R2 country 0.79 0.82a Fixed at distributional value.
Blom, de Leeuw, and Hox: Interviewer Effects on Nonresponse 369

In contrast to the contact rate, interviewer-level variance in cooperation cannot be
explained very well by the available variables. Country level variance can be explained
well. As Table 4 shows, adding sample-unit variables to the model actually increases the
variances at the sample unit and the interviewer-level, resulting in a negative pseudo
R-square, which is constrained to zero in Table 4. This indicates that in the intercept-only
model differences between interviewers are obscured, most likely because the ESS
does not use an interpenetrated design where interviewers are randomly assigned to
respondents. This reflects the common strategy that more successful and experienced
interviewers are assigned to the more difficult cases. After including the sample unit
characteristics, adding additional interviewer variables explains 17% of the interviewer
variance, and hardly changes the explained country variance. In addition, after
incorporating sample unit and interviewer variables, the intraclass correlation for the
interviewers remains relatively constant, but the intraclass correlation for countries is
dramatically reduced from 0.30 to 0.01.
Regarding research question two, the differences in cooperation rate after contact can
partly be explained by observable sample-unit characteristics and interviewer strategies.
The differences in cooperation rates are partly explained by impediments to
communication such as an intercom system, by the state of the buildings in the
immediate neighborhood, the state of the house compared to other buildings in the
neighborhood, and by initial contact made by phone. All relations are in the expected
direction. It should be noted that an initial contact by telephone has a positive relationship,
contrary to its effect on contact; we come back to this in the Discussion.
Regarding research question three, interviewers who are able to deal positively with
reluctance achieve higher cooperation rates, as do older interviewers.
5. Conclusion and Discussion
In this study we investigated whether there are systematic differences between countries
and interviewers in contact and cooperation rates in the ESS, and whether these
differences can be explained by observable characteristics of sample units, by interviewer
(contact) strategies, and by differences in interviewer characteristics.
Differences in contact and cooperation rates are observed at the level of the sample unit.
This is where we find the largest variance components (over 60% of the variance is at
sample unit level). But we also find substantial variance at the interviewer and country
levels, and we can answer our first research question in the affirmative. Yes, there are
systematic differences between countries and between interviewers within countries both
in contact and in cooperation rates. For contact we find sizeable variance at the
interviewer-level (27%) and less but still substantial variance at the country level (10%).
For cooperation more variance is found at the country level (30%) but far less at the
interviewer-level (8%). Therefore, while we find stronger interviewer effects on contact,
for cooperation there is evidence for a country effect supporting theories of differential
survey climates across countries (see Lyberg and Dean 1992). Alternatively, this country
effect may also be partly due to an agency effect. The ESS employs one carefully selected
survey agency per country, therefore country and agency effects cannot be statistically
disentangled. Thus, the country effect on cooperation may also be due to potential
Journal of Official Statistics370

differences in survey management or differential interviewer training of the agencies,
which are not all captured in our data.
The usefulness of paradata for analyzing and adjusting for nonresponse is currently
well-discussed amongst survey methodologists (e.g., Kreuter et al. 2010; Kreuter and
Kohler 2009). We find that paradata are effective in explaining some of the differences
between countries and between interviewers within countries. For contact rate almost half
of the variance on the interviewer-level and the country level could be explained by the
paradata; for cooperation we can explain country differences well with paradata, but not
interviewer differences. Still, we must realize that the paradata we used are based on
contact-data recorded by interviewers and on interviewer observations of neighborhoods
and housing units, and are not perfectly measured but contain measurement error.
Although interviewers did receive instructions on the use of all instruments, a rigorous
training of field staff on the use of contact forms cannot be assumed for all countries. In our
study we focused on paradata that had, a priori, the best reliability and only considered the
most objective aspects of interviewer observations. For instance, interviewer ratings on the
amount of litter and graffiti in the neighborhood were not included in the analyses.
Nevertheless, there is a possibility that the information used is not completely reliable, and
that thus sample-unit effects are underestimated.
When taking interviewer and country effects into account, we find that various
indicators derived from the contact-forms predict contact and cooperation. Most of these
indicators relate to interviewer observations of the house and neighborhood. The state of
the neighborhood and the state of the house compared to the rest of the neighborhood
predict both contact and cooperation. Interestingly, the presence of an intercom, which is
usually regarded an access impediment and thus as being negatively related to contact and
cooperation, only has a significant effect in the cooperation model. This may well be due
to the presence of an intercom being related to socio-economic characteristics of the
sample units, because intercoms are often found at large apartment blocks. Furthermore,
when sample units are at home, they usually check through the intercom system who is
there, so contact is made. But the intercom system will hamper communication and a
successful introduction, resulting in a refusal.
Urbanicity on the other hand is only significantly related to contact, where we find that
sample units living in urban areas are more difficult to contact; after initial contact has
been established urbanicity has no relationship with cooperation itself.
As mentioned, sample units that were attempted outside office hours (i.e., on a weekday
evening or during the weekend) were less likely to be successfully contacted. While this is
counterintuitive, it corresponds to earlier findings in the ESS. When restricted to the initial
contact attempt, the timing of the contact is not correlated with ultimately successful
contact. The first contact might be at any time of day or week. But if the first attempt is
unsuccessful it is likely that for subsequent calls alternative times would be attempted.
Thus most homes that were never successfully contacted were attempted at least once
outside of office hours, while some successful contacts never required these visits. Thus
the negative association between successful contact and outside office hours is likely a
reflection of attempting all contact options. Moreover, since first and subsequent contact
attempts in the ESS were not randomly assigned, interviewers chose to call at times and on
days that they felt might be most productive and that suited them. Thus, interviewers
Blom, de Leeuw, and Hox: Interviewer Effects on Nonresponse 371

develop their own calling strategies, based on their local knowledge and reacting to the
situation, and call patterns may reflect perceived difficulties in making contact (see Stoop
2005, p. 54).
We further find that sample units that were first contacted by phone were more likely to
cooperate with the survey request. This is an interesting finding; however, again one
should be careful with its interpretation, since phone attempts were not randomly allocated
to sample units, interviewers or countries. It could reflect that a first contact by phone is
only successful in specific situations (see also Lipps and Benson 2005). Finally, the ESS
interviewer cooperation rate, which was also derived from the contact-form data, is
positively related to gaining contact. Therefore, interviewers who are good at gaining
cooperation are also good at contacting, as O’Muirchertaigh and Campanelli (1999) found
previously in the UK.
It is remarkable that interviewer’s workload did not have an effect in this study, as is
often hypothesized. This may be the result of the well-conducted fieldwork in the ESS;
workloads were not excessive and it is feasible that with heavier workloads interviewers
have less time to work the field and therefore achieve lower contact rates.
The interviewer questionnaire gathered rich information on the attitudes and self-
reported doorstep behavior of the ESS interviewers. These variables were especially
successful in explaining differences in contact rates between countries, reflecting
differences between countries on interviewer variables. Interviewer variables were also
moderately successful in explaining differences in cooperation between countries and
between interviewers within countries.
While most of the questions in the interviewer questionnaire concerned typical
interviewer strategies for gaining cooperation, we also find associations with contact. For
instance, interviewers who believe in the importance of projecting a positive and
professional image are also more likely to gain contact. This might be because of an
association between interviewers’ professionalism and how carefully they try to gain
contact with sample units. Thus the interviewer image scale might well reflect a more
general professionalism and self-confidence, as was found by Durrant et al. (2010).
However, in our analyses we do not find any additional effect of interviewer image on
cooperation after contact is established. Similarly, the use of social validation arguments
on the doorstep is related to achieving contact, but this factor is not related to cooperation
in our analyses. Apparently, we are picking up an underlying trait of these interviewers
which is mostly related to contact rates. The only interviewer behavior significantly
related to cooperation is a positive way of reacting to refusals. Interviewers who report that
they try to avoid refusals on the doorstep by actively providing positive information, do
achieve higher actual cooperation rates. These interviewers also report that they never
repeat the arguments for refusal, but try to give relevant information instead. For instance
by never repeating “you think you are too old?” but saying instead that this survey is of
particular interest to older people (see also Pondman 1998; Hox et al. 1998). Finally,
interviewer age is related to cooperation, older interviewers are more likely to gain
cooperation than younger ones; this may partly reflect differences in experience.
Our results are in line with those well-controlled recent studies. Interviewers’ attitudes
and avowed behavior have limited predictive power and explain only a part of the variance
(e.g., Durrant et al. 2010; Hox and De Leeuw 2002). Still, several interviewer-level
Journal of Official Statistics372

variables were able to explain differences between countries and between interviewers
within countries. Interviewers with a professional self-image and of great confidence do
better, and more senior interviewers do better. Also interviewers do better if they know
how to deal with reluctance, react positively to refusals, avoid repeating negatively
formulated arguments and provide positively formulated information instead. These are
important elements that should be emphasized in country-specific training sessions and
during fieldwork and may well contribute to better interviewer-respondent interactions.
The bad news is that although the paradata explained a relatively large proportion of
interviewer and country differences in nonresponse, most of these variables are beyond the
control of the researchers (e.g., urbanization, state of housing). Nevertheless, registering
and investigating these variables may be useful, as they help us to understand the
nonresponse processes, and suggest adjustment models.
6. References
Billiet, J., Phillipsen, M., Fitzgerald, R., and Stoop, I. (2007). Estimation of Nonresponse
Bias in the European Social Survey: Using Information from Reluctant Respondents.
Journal of Official Statistics, 23, 135–162.
Blom, A.G. (forthcoming). Understanding Cross-Country Differences in Survey Contact
Rates: Application of Decomposition Methods, Journal of the Royal Statistical Society,
Series A (Statistics in Society).
Blom, A.G. (2009). Measuring, Explaining and Adjusting for Cross-Country Differences
in Unit Nonresponse: What Can Process Data Contribute? Doctoral Dissertation, Essex
University UK.
Blom, A.G., Jackle, A., and Lynn, P. (2010). The Use of Contact Data in Understanding
Cross-national Differences in Unit Nonresponse. In Survey Methods in Multinational,
Multiregional, and Multicultural Contexts, J. Harkness, M. Braun, B. Edwards,
T. Johnson, L.E. Lyberg, and P.P. Mohler (eds). New York: Wiley, 335–354.
Bottman, S.L. and Thornberry, O.T. (1992). Survey Design Features Correlates of
Nonresponse. In Proceedings of the American Statistical Association, Survey Research
Methods Section. Alexandria, VA: American Statistical Association, Available at
www.amstat.org/sections/SRMS/Proceedings/papers/1992_048.pdf (accessed May
2010), 309–314.
Brehm, J. (1994). The Phantom Respondents: Opinion Surveys and Political
Representation. Ann Arbor: University of Michigan Press.
Campanelli, P., Sturgis, P., and Purdon, S. (1997). Can You Hear Me Knocking? An
Investigation into the Impact of Interviewers on Survey Response Rates. London: Social
and Community Planning Research.
Cantor, D., O’Hare, B.C., and O’Connor, K. (2008). The Use of Monetary Incentives to
Reduce Nonresponse in Random Digit Dial Telephone Surveys. In Advances in
Telephone Survey Methodology, J.M. Lepkowski, C. Tucker, J.M. Brick, E.D. de
Leeuw, L. Japec, P.J. Lavrakas, M.W. Link, and R.L. Sangster (eds). Hoboken: Wiley,
471–498.
Cialdini, R.B., Braver, S.L., Wolf, W.S., and Pitts, S. (1992). Who Says No to Legitimate
Survey Requests? Evidence from a New Method for Studying the Causes of Survey
Blom, de Leeuw, and Hox: Interviewer Effects on Nonresponse 373
Nonresponse. Paper presented at the Third International Workshop on Household
Survey Nonresponse. The Hague.
Couper, M.P. and De Leeuw, E.D. (2003). Nonresponse in Cross-cultural and Cross-
national Surveys. In Cross-Cultural Survey Methods, J.A. Harkness, F.J.R. van de
Vijver, and P.Ph. Mohler (eds). New York: Wiley, 157–177.
Couper, M.P. and Groves, R.M. (1992). The Role of the Interviewer in Survey
Participation. Survey Methodology, 18, 263–277.
De Leeuw, E. and De Heer, W. (2002). Trends in Household Survey Nonresponse:
A Longitudinal and International Comparison. In Survey Nonresponse, R.M. Groves,
D.A. Dillman, J.L. Eltinge, and R.J.A. Little (eds). New York: Wiley, 41–54.
De Leeuw, E.D. and Hox, J.J. (2009). International Interviewer Questionnaire (IQUEST).
Development and Scale Properties. Department of Methodology and Statistics,
University Utrecht. Available at http://www.xs4all.nl/,edithl/ See also: http://
surveymethodology.eu/conferences/warsaw-2009/presentation/151/ (accessed May
2010).
De Leeuw, E.D., Callegaro, M., Hox, J.J., Korendijk, E., and Lensvelt-Mulders, G. (2007).
The Influence of Advance Letters on Response in Telephone Surveys: A Meta-analysis.
Public Opinion Quarterly, 71, 1–31.
De Leeuw, E.D., Hox, J.J., Snijkers, G., and De Heer, W. (1998). Interviewer Opinions,
Attitudes, and Strategies Regarding Survey Participation and Their Effect on Response.
In Nonresponse in Survey Research, A. Koch and R. Porst (eds). ZUMA Nachrichten
SPEZIAL 4, 239-262. Available at http://www.gesis.org/fileadmin/upload/forschung/
publikationen/zeitschriften/zuma_nachrichten_spezial/znspezial4.pdf (accessed May
2010).
De Heer, W. (1999). International Response Trends: Results of an International Survey.
Journal of Official Statistics, 15, 129–142.
Dillman, D.A. (1978). Mail and Telephone Surveys: The Total Design Method. New York:
Wiley.
Dillman, D.A., Eltinge, J.L., Groves, R.M., and Little, R.J.A. (2002). Survey Nonresponse
in Design, Data Collection, and Analysis. In Survey Nonresponse, R.M. Groves, D.A.
Dillman, J.L. Eltinge, and R.J.A. Little (eds). New York: Wiley, 3–26.
Dillman, D.A., Smyth, J., and Christian, L.M. (2009). Internet, Mail and Mixed-Mode
Surveys: The Tailored Design Method, (Third Edition). Hoboken, NJ: Wiley.
Durban, J. and Stuart, A. (1951). Differences in Response Rates of Experienced and
Inexperienced Interviewers. Journal of the Royal Statistical Society, Series A (Statistics
in Society), 114, 163–206.
Durrant, G.B., Groves, R.M., Staetsky, L., and Steele, F. (2010). Effects of Interviewer
Attitudes and Behaviors on Refusal in Household Surveys. Public Opinion Quarterly,
74, 1–36.
Goyder, J. (1987). The Silent Minority: Nonrespondents on Sample Surveys. Cambridge:
Policy Press.
Groves, R.M. (1989). Survey Errors and Survey Costs. New York: Wiley.
Groves, R.M. and Couper, M.P. (1998). Nonresponse in Household Interview Surveys.
New York: Wiley.
Journal of Official Statistics374

Groves, R.M. and Fultz, N.H. (1985). Gender Effects Among Telephone Interviewers in
A Survey of Economic Attitudes. Sociological Methods and Research, 14, 31–52.
Groves, R.M., Cialdini, R.B., and Couper, M.P. (1992). Understanding the Decision to
Participate in A Survey. Public Opinion Quarterly, 56, 475–495.
Hedeker, D., Gibbons, R., duToit, M., and Cheng, Y. (2008). SuperMix: For Mixed Effects
Models. Lincolnwood: Scientific Software International, Inc.
Hox, J.J. (1994). Hierarchical Regression Models for Interviewer and Respondent Effect.
Sociological Methods and Research, 22, 3001–3018.
Hox, J.J. (2010). Multilevel Analysis. Techniques and Application, (Second Edition).
New York: Routledge.
Hox, J.J. and De Leeuw, E.D. (2002). The Influence of Interviewers’ Attitude and
Behavior on Household Survey Nonresponse: An International Comparison. In Survey
Nonresponse, R.M. Groves, D.A. Dillman, J.L. Eltinge, and R.J.A. Little (eds).
New York: Wiley, 103–118.
Hox, J.J. and De Leeuw, E.D. (1994). A Comparison of Nonresponse in Mail, Telephone,
and Face to face Surveys: Applying Multilevel Modeling to Meta-analysis. Quality and
Quantity, 28, 329-344. Reprinted in de Vaus, D. (2002), Social Surveys, Part Eleven,
Nonresponse Error. London: Sage, Benchmarks in Social Research Methods Series.
Hox, J.J., De Leeuw, E.D., and Kreft, I.G.G. (1991). The Effect of Interviewer and
Respondent Characteristics on the Quality of Survey Data: A Multilevel Model.
In Measurement Errors in Surveys, P.P. Biemer, R.M. Groves, L.E. Lyberg, N.A.
Mathiowetz, and S. Sudman (eds). New York: John Wiley and Sons, 439–462.
Hox, J.J., De Leeuw, E.D., and Snijkers, G. (1998). Fighting Nonresponse in Telephone
Interviews: Successful Interviewer Tactics. In Nonresponse in Survey Research,
A. Koch and R. Porst (eds). ZUMA Nachrichten SPEZIAL 4, 173-185. Available at
http://www.gesis.org/fileadmin/upload/forschung/publikationen/zeitschriften/
zuma_nachrichten_spezial/znspezial4.pdf (Accessed December 2010).
Hox, J.J., De Leeuw, E.D., and Vorst, H. (1996). A Reasoned Action Explanation for
Survey Nonresponse. In International Perspectives on Nonresponse, S. Laaksonen (ed).
Proceedings of the Sixth International Workshop on Household Survey Nonresponse.
Statistics Finland, Research report 219, 101-110. Helsinki: Statistics Finland.
Japec, L. (2008). Interviewer Error and Interviewer Burden. In Advances in Telephone
Survey Methodology, J.M. Lepkowski, C. Tucker, J.M. Brick, E.D. de Leeuw, L. Japec,
P.J. Lavrakas, M.W. Link, and R.L. Sangster (eds). Hoboken: Wiley, 187–211.
Koch, A., Blom, A.G., Stoop, I., and Kappelhof, J. (2009). Data Collection Quality
Assurance in Cross-national Surveys at the Example of the ESS. Methoden, Daten,
Analysen, Zeitschrift fur Empirische Sozialforschung, 3, 219–247.
Kreuter, F., Olson, K., Wagner, J., Yan, T., Ezzati-Rice, T.M., Casas-Cordero, C., Lemay,
M., Peytchev, A., Groves, R.M., and Raghunathan, T.E. (2010). Using Proxy Measures
and Other Correlates of Survey Outcomes to Adjust for Nonresponse: Examples from
Multiple Surveys. Journal of the Royal Statistical Society, Series A (Statistics in
Society), 173, 389–407.
Kreuter, F. and Kohler, U. (2009). Analyzing Contact Sequences in Call Record Data.
Potential and Limitations of Sequence Indicators for Nonresponse Adjustments in the
European Social Survey. Journal of Official Statistics, 25, 203–226.
Blom, de Leeuw, and Hox: Interviewer Effects on Nonresponse 375

Lehtonen, R. (1996). Interviewer Attitudes and Unit Nonresponse in Two Different
Interview Schemes. In International Perspectives on Nonresponse: Proceedings of the
Sixth International Workshop on Household Survey Nonresponse, S. Laaksonen (ed.).
Helsinki: Statistics Finland.
Lipps, O. and Benson, G. (2005). Cross-national Contact Strategies. Proceedings of
the American Statistical Association, Survey Research Methods Section, 3905-3914.
Alexandria, VA: American Statistical Association. Available at http://www.amstat.org/
sections/SRMS/Proceedings/ (Accessed May 2010).
Long, J.S. (1997). Regression Models for Categorical and Limited Dependent Variables.
Thousand Oaks, CA: Sage.
Lyberg, L. and Dean, P. (1992). Methods for Reducing Nonresponse Rates: A Review.
Paper Presented at the Annual Meeting of the American Association for Public Opinion
Research, St. Petersburg, FL. Unpublished manuscript.
Lynn, P. and Clarke, P. (2002). Separating Refusal Bias and Non-Contact Bias: Evidence
from UK National Surveys. The Statistician, 51, 319–333.
McKelvey, R. and Zavoina, W. (1975). A Statistical Model for the Analysis of Ordinal
Dependent Variables. Journal of Mathematical Sociology, 4, 103–120.
Morton-Williams, J. (1993). Interviewer Approaches. Aldershot: Dartmouth.
O’Muircheartaigh, C. and Campanelli, P. (1999). A Multilevel Exploration of the Role of
Interviewers in Survey Non-response. Journal of the Royal Statistical Society, Series A
(Statistics in Society), 162, 437–446.
Pickery, J. and Loosveldt, G. (2004). A Simultaneous Analysis of Interviewer Effects on
Various Data Quality Indicators with Identification of Exceptional Interviewers. Journal
of Official Statistics, 20, 77–89.
Pickery, J. and Loosveldt, G. (2002). A Multilevel Multinomial Analysis of Interviewer
Effects on Various Components of Unit Nonresponse. Quality and Quantity, 36,
427–437.
Pondman, L.M. (1998). The Influence of the Interviewer on the Refusal Rate in Telephone
Surveys. Amsterdam: Vrije Universiteit/Print Partners Ipsekamp.
Purdon, S., Campanelli, P., and Sturgis, P. (1999). Interviewers’ Calling Strategies on
Face-to-face Interview Surveys. Journal of Official Statistics, 15, 199–216.
Schnell, R. and Kreuter, F. (2005). Separating Interviewer and Sampling-point Effects.
Journal of Official Statistics, 21, 389–410.
Singer, E. (2002). The Use of Incentives to Reduce Nonresponse in Households Surveys.
In Survey Nonresponse, R.M. Groves, D.A. Dillman, J.L. Eltinge, and R.J.A. Little
(eds). New York: Wiley, 163–178.
Singer, E., van Hoewyk, J.V., Gebler, N., Raghunathan, T., and McGonagle, K. (1999).
The Effect of Incentives on Response Rates in Interviewer-Mediated Surveys. Journal
of Official Statistics, 15, 217–230.
Singer, E., Frankel, M.R., and Glassman, M.B. (1983). The Effect of Interviewer
Characteristics and Expectations on Response. Public Opinion Quarterly, 47, 84–95.
Snijkers, G., Hox, J.J., De Leeuw, E.D. (1999). Interviewers’ Tactics for Fighting Survey
Nonresponse. Journal of Official Statistics, 15, 185-198. Reprinted in de Vaus, D.
(2002), Social Surveys, Part Eleven, Nonresponse Error. London: Sage, Benchmarks
in Social Research Methods Series.
Journal of Official Statistics376
Statistics Sweden (1999). Special Issue on Survey Nonresponse, Guest Editor Edith de
Leeuw. Journal of Official Statistics, 15, 2. Available http://www.jos.nu/Contents/
issue.asp?vol=15&no=2 (Accessed May 2010).
Stoop, I. (2005). The Hunt for the Last Respondent. The Hague: Social and Cultural
Planning Office.
Stoop, I., Billiet, J., Koch, A., and Fitzgerald, R. (2010). Improving Survey Response.
Lessons Learned from the European Social Survey. New York: Wiley.
Symons, K., Matsuo, H., Beullens, K., and Billiet, J. (2008). Response Based Quality
Assessment in the ESS – Round 3: An Update for 19 countries. London: Centre for
Comparative Social Surveys, City University.
Received June 2010
Revised February 2011
Blom, de Leeuw, and Hox: Interviewer Effects on Nonresponse 377


