Embed Size (px)
Citation preview

MPR Reference No.: 8217-909 and 8703-106
Nonrespondents and Nonresponse Bias: Evidence from a Survey of Former Welfare Recipients in Iowa June 2002 Jacqueline Kauff Robert Olsen Thomas Fraker
Submitted to:
U.S. Department of Health and Human Services Iowa Department of Human Services The Joyce Foundation Smith Richardson Foundation
Submitted by:
Mathematica Policy Research, Inc. 600 Maryland Ave., SW, Suite 550 Washington, DC 20024-2512 Telephone: (202) 484-9220 Facsimile: (202) 863-1763
Project Director: Jacqueline Kauff

PAGE IS INTENTIONALLY LEFT BLANK TO ALLOW FOR DOUBLE-SIDED COPYING

iii
ACKNOWLEDGMENTS
The study of nonresponse in the survey of families that left Iowa’s TANF program was conducted by Mathematica Policy Research, Inc., (MPR) with funding from The Joyce Foundation, Smith Richardson Foundation, and the Office of the Assistant Secretary for Planning and Evaluation (ASPE) at the U.S. Department of Health and Human Services. We thank these organizations for their support of this study.
Several individuals assisted in conducting the study and producing this report. At ASPE,
Kelleen Kaye provided overall guidance to the study, was responsible for the business and technical aspects of the study, and reviewed a draft of the report. Four additional people reviewed a draft of the report: Julie Isaacs (ASPE), Jennifer Phillips (The Joyce Foundation), Phoebe Cottingham (Smith Richardson Foundation), and Bob Krebs (Iowa Department of Human Services). Fritz Scheuren (National Opinion Research Center) provided input into the design of the study and provided comments on early findings from the study.
At MPR, Joe Garrett and Don Jang provided input into the design of the study. Julita
Milliner Wadell directed the survey. Ama Takyi provided research assistance in the analysis of the data. Joe Garrett provided comments on the final report. Carol Soble and Carl Spector edited the report. Donna Dorsey and Sharon Clark produced the report.
The opinions and conclusions expressed herein are solely those of the authors and should
not be construed as representing the opinions or policies of any government agency.

PAGE IS INTENTIONALLY LEFT BLANK TO ALLOW FOR DOUBLE-SIDED COPYING

v
CONTENTS
Chapter Page
EXECUTIVE SUMMARY........................................................................................... ix I INTRODUCTION.......................................................................................................... 1
A. RESEARCH OBJECTIVES ................................................................................... 1 B. METHODOLOGY AND DATA SOURCES......................................................... 2 C. STRUCTURE OF THE REPORT ..........................................................................4
II BARRIERS TO RESPONDING TO THE WAVE-1 SURVEY ................................... 5
A. TELEPHONE SERVICE ........................................................................................ 5 B. CONTACT WITH SURVEY NONRESPONDENTS AND HOUSING INSTABILITY ........................................................................... 6
III DIFFERENCES BETWEEN RESPONDENTS AND NONRESPONDENTS IN THE WAVE-1 SURVEY.................................................. 11
A. DIFFERENCES ACCORDING TO ADMINISTRATIVE DATA...................... 12
1. Upon Leaving TANF .................................................................................... 12 2. One Year After Leaving TANF .................................................................... 14
B. DIFFERENCES ACCORDING TO SURVEY DATA ........................................ 14
1. Labor Market Experiences and Income ........................................................ 15 2. Health Insurance Coverage and Health Problems......................................... 16 3. Housing Stability........................................................................................... 17

CONTENTS (continued)
Chapter Page
vi
IV NONRESPONSE BIAS IN THE WAVE-1 SURVEY ESTIMATES......................... 19 A. DATA AND METHODS...................................................................................... 19 B. WHAT IF THE WAVE-1 RESPONSE RATE HAD BEEN 93 PERCENT?........................................................................................... 21 C. WHAT IF THE WAVE-1 RESPONSE RATE HAD BEEN 100 PERCENT? ........................................................................................ 21
V WEIGHTING ADJUSTMENTS TO ADDRESS WAVE-1 NONRESPONSE BIAS ............................................................................................... 27
A. WEIGHTING TO ACCOUNT FOR SURVEY NONRESPONSE...................... 27
1. Motivation ..................................................................................................... 27 2. Variation in Response Rates.......................................................................... 28 3. Nonresponse-Adjusted Weights .................................................................... 29
B. COMPARISON OF WEIGHTED AND UNWEIGHTED ESTIMATES............ 30
VI SUMMARY OF FINDINGS ON NONRESPONSE IN THE WAVE-1 SURVEY...................................................................................................... 33
A. WHAT INTERVIEWERS LEARNED ABOUT NONRESPONDENTS FROM TELEPHONE CONVERSATIONS ......................................................... 33 B. WHAT WE LEARNED ABOUT NONRESPONDENTS FROM STATE ADMINISTRATIVE DATA....................................................... 33 C. WHAT WE LEARNED ABOUT NONRESPONDENTS FROM WAVE-2 SURVEY DATA ...................................................................... 34
REFERENCES............................................................................................................. 37 APPENDIX A: WAVE-2 SURVEY METHODOLOGY.........................................A-1 APPENDIX B: RECALL ERROR IN THE WAVE-2 SURVEY ............................ B-1

vii
EXHIBITS
Exhibit Page
1.1 SAMPLE AND RESPONSE FLOW FOR IOWA TANF LEAVER SURVEYS ......... 3 2.1 TELEPHONE SERVICE AT THE TIME OF THE WAVE-1 SURVEY ..................... 6 2.2 TELEPHONE CONTACT WITH WAVE-1 SURVEY NONRESPONDENTS AND REASONS FOR NONRESPONSE...................................................................... 7 2.3 MAIL CONTACT WITH WAVE-1 NONRESPONDENTS WHO WERE NOT CONTACTED BY TELEPHONE ................................................. 8 2.4 CONTACT WITH WAVE-1 NONRESPONDENTS.................................................... 9 3.1 DEMOGRAPHIC CHARACTERISTICS AND EXPERIENCES WITH PROGRAMS AND EMPLOYMENT: BASED ON ADMINISTRATIVE DATA................................................................... 13 3.2 LABOR MARKET EXPERIENCES AND INCOME ONE YEAR AFTER LEAVING TANF: BASED ON WAVE-2 SURVEY DATA.......................................................................................... 16 3.3 HEALTH INSURANCE COVERAGE AND HEALTH PROBLEMS ONE YEAR AFTER LEAVING TANF: BASED ON WAVE-2 SURVEY DATA..................................................................... 17 3.4 HOUSING STABILITY ONE YEAR AFTER LEAVING TANF: BASED ON WAVE-2 SURVEY DATA..................................................................... 18 4.1 WAVE-1 SURVEY ESTIMATES UNDER 76 PERCENT RESPONSE RATE (ACTUAL) AND 93 PERCENT RESPONSE RATE (SIMULATED)............................................................................ 22 4.2 SIMULATED WAVE-1 SURVEY ESTIMATES UNDER 100 PERCENT RESPONSE RATE ASSUMING THE BEST AND WORST FOR REPEAT NONRESPONDENTS................................................ 24 4.3 UPPER AND LOWER BOUNDS FOR NONRESPONSE BIAS IN WAVE-1 ESTIMATES ............................................................................... 25

EXHIBITS (continued)
Exhibit Page
viii
5.1 RESPONSE RATES AND WEIGHTS ACROSS 12 WEIGHTING CLASSES ........ 29 5.2 WAVE-1 ESTIMATES OF AVERAGE OUTCOMES ONE YEAR AFTER
LEAVING TANF: UNWEIGHTED AND WEIGHTED TO ACCOUNT FOR SURVEY NONRESPONSE ....................................................................................... 31
ix
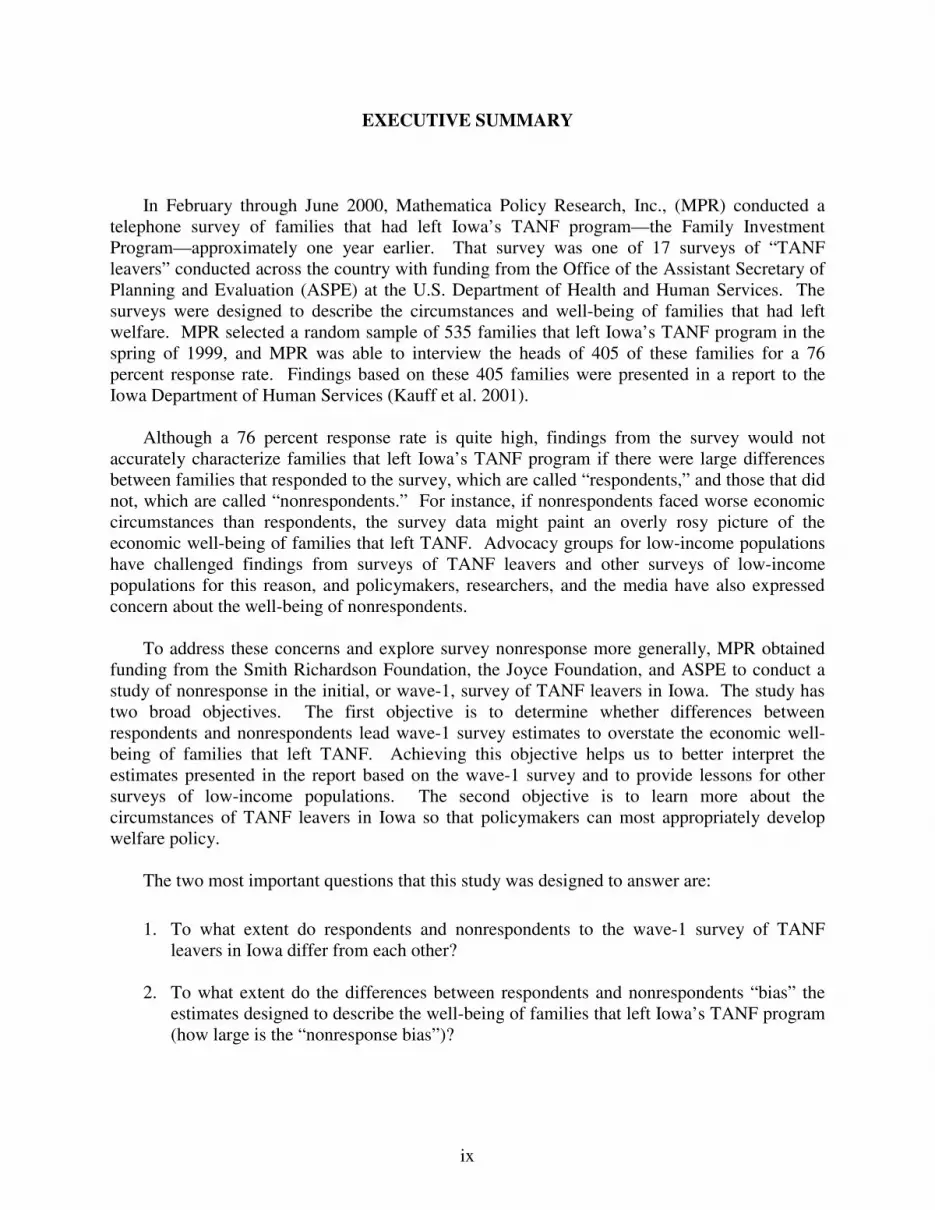
EXECUTIVE SUMMARY
In February through June 2000, Mathematica Policy Research, Inc., (MPR) conducted a telephone survey of families that had left Iowa’s TANF program—the Family Investment Program—approximately one year earlier. That survey was one of 17 surveys of “TANF leavers” conducted across the country with funding from the Office of the Assistant Secretary of Planning and Evaluation (ASPE) at the U.S. Department of Health and Human Services. The surveys were designed to describe the circumstances and well-being of families that had left welfare. MPR selected a random sample of 535 families that left Iowa’s TANF program in the spring of 1999, and MPR was able to interview the heads of 405 of these families for a 76 percent response rate. Findings based on these 405 families were presented in a report to the Iowa Department of Human Services (Kauff et al. 2001).
Although a 76 percent response rate is quite high, findings from the survey would not
accurately characterize families that left Iowa’s TANF program if there were large differences between families that responded to the survey, which are called “respondents,” and those that did not, which are called “nonrespondents.” For instance, if nonrespondents faced worse economic circumstances than respondents, the survey data might paint an overly rosy picture of the economic well-being of families that left TANF. Advocacy groups for low-income populations have challenged findings from surveys of TANF leavers and other surveys of low-income populations for this reason, and policymakers, researchers, and the media have also expressed concern about the well-being of nonrespondents.
To address these concerns and explore survey nonresponse more generally, MPR obtained
funding from the Smith Richardson Foundation, the Joyce Foundation, and ASPE to conduct a study of nonresponse in the initial, or wave-1, survey of TANF leavers in Iowa. The study has two broad objectives. The first objective is to determine whether differences between respondents and nonrespondents lead wave-1 survey estimates to overstate the economic well-being of families that left TANF. Achieving this objective helps us to better interpret the estimates presented in the report based on the wave-1 survey and to provide lessons for other surveys of low-income populations. The second objective is to learn more about the circumstances of TANF leavers in Iowa so that policymakers can most appropriately develop welfare policy.
The two most important questions that this study was designed to answer are:
1. To what extent do respondents and nonrespondents to the wave-1 survey of TANF leavers in Iowa differ from each other?
2. To what extent do the differences between respondents and nonrespondents “bias” the
estimates designed to describe the well-being of families that left Iowa’s TANF program (how large is the “nonresponse bias”)?

x
DATA AND METHODS
The primary source of data for this study was a follow-up, or wave-2, survey of families that left Iowa’s TANF program in the spring of 1999. Under a separate contract with ASPE, MPR was already conducting a wave-2 survey in the spring of 2001 with all 405 families interviewed in the wave-1 survey to explore the circumstances of families two years after leaving TANF. To examine nonresponse in the wave-1 survey, MPR randomly selected 78 (60 percent) of the wave-1 nonrespondents for the wave-2 sample and devoted substantially more resources to contacting them than was possible during the wave-1 survey. The additional resources allowed MPR to go beyond the telephone and mail efforts used in the wave-1 survey to contact people: interviewers were sent into communities to locate the people who could not be reached by telephone. We were able to complete wave-2 interviews with 85 percent of the wave-1 respondents and 69 percent of the wave-1 nonrespondents, for an overall response rate of 82 percent.
In the wave-2 survey, MPR included retrospective questions about families’ circumstances
one year earlier to assess the well-being of wave-1 nonrespondents one year after they left TANF. These questions were designed to provide information on how wave-1 nonrespondents would have answered specific questions in the wave-1 survey if they had completed a wave-1 interview. In addition to the data collected directly from families in the wave-2 survey, MPR obtained administrative data on the families’ demographic characteristics, receipt of government assistance, employment, and earnings from Iowa’s Automated Benefit Calculation system and Unemployment Insurance Wage Data system.
SUMMARY OF RESEARCH FINDINGS
Our findings can be divided into two categories: findings based commonly available administrative data, and findings based on data from the wave-2 survey. From administrative data, we learned that nonrespondents were more likely to come from a racial or ethnic minority; more likely to have left TANF involuntarily; less likely to have been employed; and less likely to receive government assistance one year after leaving TANF. These findings suggest that wave-1 nonrespondents were not faring as well as wave-1 respondents when they left TANF and one year later.
Similarly, findings based on wave-2 survey data also indicate that wave-1 nonrespondents
were not faring as well as wave-1 respondents one year after leaving TANF. Key findings from these data are summarized below:
• Nonrespondents were less likely to have health insurance coverage than
respondents. Nonrespondents were less likely to be covered by Medicaid or employer-sponsored insurance. About two out of five nonrespondents and three out of five respondents were covered by some type of health insurance plan one year after leaving TANF. Lack of health insurance makes people vulnerable to financial shocks associated with health problems and increases the likelihood that illnesses go untreated. Therefore, wave-1 nonrespondents appear to be particularly vulnerable to these problems.

xi
• Nonrespondents were more likely than respondents to have housing-related problems. While few nonrespondents reported being homeless around the time of the wave-1 survey, nonrespondents were more likely to have gone without utilities because they could not afford them and to have lived with friends or relatives. These differences suggest that nonrespondents endured greater financial hardships than respondents one year after leaving TANF.
• The nonresponse bias in most estimates based on the wave-1 survey of families that left Iowa’s TANF program is probably small. Our findings suggest that the wave-1 survey estimates would not have been much different if the response rate had been considerably higher. Therefore, the wave-1 estimates presented in Kauff et al. (2001) paint a fairly accurate picture of the well-being of families that left Iowa’s TANF program one year after leaving TANF.

PAGE IS INTENTIONALLY LEFT BLANK TO ALLOW FOR DOUBLE-SIDED COPYING

1
I. INTRODUCTION
In February through June 2000, Mathematica Policy Research, Inc., (MPR) conducted a telephone survey of families in Iowa that had left the state’s TANF program—the Family Investment Program (FIP)—approximately one year earlier. That survey was one of 17 surveys of TANF leavers conducted across the country with funding from the Office of the Assistant Secretary of Planning and Evaluation (ASPE) at the U.S. Department of Health and Human Services. The purpose of the surveys was to describe the circumstances and well-being of families that had left welfare. Beginning with a random sample of 535 of the 958 Iowa families that left TANF in the spring of 1999, MPR was able to interview the heads of 405 families, for a 76 percent response rate. All efforts to contact and interview sample members were made via telephone along with repeated mailings that encouraged those without telephones at home to use a public or other telephone to call MPR on a toll-free number to complete an interview.
Although a 76 percent response rate is high, the survey’s capacity to accurately characterize
families that left Iowa’s TANF program would be compromised if there were large differences in outcomes measured by the survey between families that did not respond to the survey and those that did. For instance, if survey nonrespondents faced worse economic circumstances than survey respondents, the survey data might paint an overly rosy picture of the economic well-being of families that left TANF. Advocacy groups for low-income populations have challenged findings from surveys such as the leaver surveys for this reason, and policymakers, researchers, and the media have also expressed concern about the circumstances of nonrespondents.
In order to address these concerns and explore the issue of survey nonresponse more
generally, MPR obtained funding from the Smith Richardson Foundation, the Joyce Foundation, and ASPE to conduct a study of nonresponse in the initial, or wave-1, survey of TANF leavers in Iowa. This report presents our findings.
A. RESEARCH OBJECTIVES
The study of survey nonresponse has two broad objectives, one methodological and one substantive. The methodological objective is to determine whether and how nonresponse—in surveys of low-income populations, generally, and of TANF leavers, specifically—affects the survey estimates on which research findings are based. The substantive objective is to shed more light on the circumstances of TANF leavers in Iowa so that policymakers can most appropriately develop welfare policy. To achieve these broad objectives, we addressed four key questions:
1. What were the barriers to responding to the wave-1 survey?
2. Are wave-1 survey nonrespondents different from respondents? (If so, to what extent?)
3. To what extent do the differences between respondents and nonrespondents bias the wave-1 survey estimates presented in an earlier report (Kauff et al. 2001)?
4. How much can nonresponse bias be reduced through weighting adjustments?

2
B. METHODOLOGY AND DATA SOURCES
The primary source of data for this study was a follow-up, or wave-2, survey of Iowa families that left TANF in the spring of 1999. Under a separate contract with ASPE, MPR was already conducting a wave-2 survey in the spring of 2001 with all 405 families interviewed in the wave-1 survey. The original purpose of the wave-2 survey was to explore the circumstances of families two years after leaving TANF. The interviews were again done via telephone with extensive mail contact.
To address the four questions about wave-1 nonresponse listed in Section A, MPR randomly
selected 78 (60 percent) of the wave-1 nonrespondents to include in the wave-2 sample, and devoted substantially more resources to contacting them than was possible during the wave-1 survey. The allocation of additional resources was motivated by the difficulty we anticipated in interviewing sample members that we were previously unable to interview for the wave-1 survey. Time and budget constraints and the need to achieve a high response rate for wave-1 nonrespondents necessitated the exclusion of some wave-1 nonrespondents from the wave-2 sample. Interview attempts with wave-1 nonrespondents included telephone, mail, and extensive in-person efforts.1
In the wave-2 survey questionnaire, MPR included retrospective questions about families’
circumstances one year earlier to assess the well-being of wave-1 nonrespondents during the wave-1 survey fielding period. These questions were designed to provide information on how wave-1 nonrespondents would have answered specific questions in the wave-1 survey if they had completed a wave-1 interview.
We were able to complete wave-2 interviews with 343 (85 percent) of the wave-1
respondents and 54 (69 percent) of the wave-1 nonrespondents. Therefore, we were able to complete interviews with 397 out of 483 wave-2 sample members for an 82 percent response rate.2 Exhibit 1.1 illustrates the sample and response flow for the wave-1 and wave-2 surveys. In later chapters, we refer to each group identified in the exhibit by the capital letter at the top of the sample box.
In addition to the data collected directly from families in the wave-2 survey, MPR obtained
administrative data on the families’ demographic characteristics, receipt of government assistance, employment, and earnings from Iowa’s Automated Benefit Calculation system and Unemployment Insurance Wage Data system. These data covered the period from the month or calendar quarter in which families left TANF (June 1999 or April-June 1999) through the eighth quarter after families left TANF (April-June 2001).
1A more detailed description of the survey methodology is provided in Appendix A.
2The weighted response rate—accounting for the inclusion probabilities of wave-2 sample members—was 81 percent.

3
SAMPLE AND RESPONSE FLOW FOR IOWA TANF LEAVER SURVEYS
Not Selected forW ave-1 Survey
Sam ple423
APopulation of Fam ilies That Left TANF in Spring 1999
958
BSam ple Selected for
W ave-1 Survey535
CResponded to
W ave-1 Survey405
DDid Not Respond to
W ave-1 Survey130
GNot Selected forW ave-2 Survey
Sam ple52
EResponded to
W ave-2 Survey343
FDid Not Respond to
W ave-2 Survey62
HSam ple Selected for
W ave-2 Survey78
IResponded to
W ave-2 Survey54
JDid Not Respond to
W ave-2 Survey24
EXHIBIT 1.1

4
C. STRUCTURE OF THE REPORT
This report is organized into six chapters. Chapters II through V address the four questions described in Section A. Chapter VI summarizes the study’s findings.

5
II. BARRIERS TO RESPONDING TO THE WAVE-1 SURVEY
Advocates and survey critics often surmise that in surveys of low-income populations conducted over the telephone, the sample members who are not interviewed are those without telephone service in their homes. Some go further, suggesting that the sample members who are not interviewed are those who do not have a residence at all or who lack housing stability and are thus too transient to be contacted and interviewed. These concerns often lower the credibility of survey findings for low-income populations. Because little is typically known about survey nonrespondents, it is usually difficult to assess the validity of these concerns.
Using retrospective data from the wave-2 survey, this chapter explores the relationship
between telephone service and nonresponse in the wave-1 survey. It also indirectly explores the relationship between housing instability and wave-1 nonresponse by measuring the success rate of survey interviewers in contacting nonrespondents. The chapter finds that:
• Most wave-1 nonrespondents had telephone service at the time of the wave-1 survey. Therefore, while lack of telephone service may have prevented some sample members from responding to the wave-1 survey, it did not prevent most nonrespondents from responding to the survey.
• Most wave-1 nonrespondents were contacted by survey interviewers via telephone or mail. Therefore, while housing instability may have prevented some sample members from being contacted by interviewers, it did not prevent survey interviewers from contacting most nonrespondents.
A. TELEPHONE SERVICE
By design, all interviews for the wave-1 survey of TANF leavers in Iowa were conducted over the telephone. Obviously, this required personal telephone contact with sample members. Lack of telephone service might reduce the likelihood that sample members respond to the survey for two reasons. First, interviewers might have less success contacting sample members to inform them about the survey. Second, for sample members who were contacted by interviewers, lack of telephone service might reduce the likelihood that they call MPR’s toll-free number to complete interviews.
Data from the wave-1 and wave-2 surveys suggest that wave-1 nonrespondents were less
likely to have telephone service at the time of the wave-1 survey than wave-1 respondents, but that most wave-1 nonrespondents had telephone service. About 89 percent of respondents to the wave-1 survey had telephone service in their homes when they were interviewed, and only 64 percent of the nonrespondents had telephone service at the same time (see Exhibit 2.1).3,4
3Data on telephone service at the time of the wave-1 survey came from wave-1 interviews
for respondents and from wave-2 interviews for nonrespondents. The wave-1 survey instrument

6
Approximately one out of three nonrespondents lacked telephone service, and the lack of telephone service might have discouraged these sample members from responding to the wave-1 survey. However, approximately two out of three nonrespondents had telephone service. Therefore, for most nonrespondents, there must have been some other reason that they did not respond to the wave-1 survey.
SOURCE: MPR sample member tracking system, and wave-1 and wave-2 surveys of Iowa families that left TANF in the spring of 1999.
B. CONTACT WITH SURVEY NONRESPONDENTS AND HOUSING INSTABILITY
Housing instability—which is common in low-income populations—can make people difficult to find, contact, and interview for a telephone survey. Sample members who cannot be contacted are probably not aware of the survey and unlikely to respond. Therefore, part of the nonresponse problem in the wave-1 survey may be attributable to housing instability. We address this issue indirectly by estimating the percentage of sample members who were contacted by MPR either by telephone or by mail. We found that around 60 percent were contacted. Therefore, whatever housing stability problems were present in the wave-1 sample,
(continued) included questions about telephone service in the home only, while the wave-2 survey instrument included questions about telephone service in the home as well as cellular telephone service.
4The difference between respondents and nonrespondents is statistically significant.
EXHIBIT 2.1
TELEPHONE SERVICE AT THE TIME OF THE WAVE-1 SURVEY
89%
64%
0 100
Respondents
Nonrespondents
Percent with Telephone Service

7
they did not prevent MPR from contacting the majority of wave-1 nonrespondents during the wave-1 survey.
During the wave-1 survey, interviewers were able to contact by telephone—personally (or, in a few cases, by close proxy)—one-quarter of the wave-1 nonrespondents (see Exhibit 2.2). The most common reason for nonresponse was an explicit refusal to complete an interview despite multiple interview attempts and financial incentives that were offered to sample members to participate. (See Appendix A for more detail on survey incentives.) According to an agreement with Iowa DHS, MPR considered a sample member to have refused an interview after survey interviewers received a total of two verbal or written refusals from the sample member.5
SOURCE: MPR sample member tracking system and wave-1 and wave-2 surveys of Iowa families that left TANF
in the spring of 1999. NOTE: “Other reasons” indicate that the sample member ended the interview prematurely, was unavailable
during the survey fielding period, had a language barrier, was ill or hospitalized, was deceased, or could not complete the interview for another reason.
5Upon receiving two refusals, interviewers no longer attempted telephone contact with
sample members, but continued to send mail encouraging their participation in the survey.
EXHIBIT 2.2
TELEPHONE CONTACT WITH WAVE-1 SURVEY NONRESPONDENTS AND REASONS FOR NONRESPONSE
Telephone Contact--Other Reasons
(8%)
Telephone Contact--Explicit Refusal
(19%)
No Telephone Contact(73%)

8
Interviewers were unable to make telephone contact with almost three-quarters of all wave-1 nonrespondents during the wave-1 survey (see Exhibit 2.2). Most of these nonrespondents had home telephones. For many others, survey interviewers had good leads on their whereabouts, such as telephone numbers of relatives, but were unable to talk with sample members themselves.
When telephone contact failed, interviewers sent letters, flyers, postcards, and Federal
Express packages advertising the survey and encouraging sample members to use a public or other telephone to call MPR’s toll-free number. (Interviews had to be conducted over the telephone.) It was not possible for survey interviewers to assess whether most sample members had received mail about the survey. Therefore, the wave-2 survey was used to ask wave-1 nonrespondents whether they remembered receiving mail about the survey.
We conclude that during the wave-1 survey, mail outreach efforts were successful at making
initial contact with almost half of the sample members who were not contacted by telephone (see Exhibit 2.3). Forty-three percent of wave-1 nonrespondents who completed wave-2 interviews (Group I) and were not contacted by telephone remembered receiving at least one piece of mail. Presumably, these sample members chose not to participate in the survey, did not understand what was being asked of them in the correspondence they received, or were unable to contact MPR to complete an interview. For the 57 percent who did not remember receiving any mail about the survey, it is possible that interviewers did not know the current addresses of sample members or that sample members did not have a stable residence at which they received mail.
SOURCE: MPR sample member tracking system and wave-2 survey of Iowa families that left TANF in the spring
of 1999.
EXHIBIT 2.3
MAIL CONTACT WITH WAVE-1 NONRESPONDENTSWHO WERE NOT CONTACTED BY TELEPHONE
Does Not Remember Mail Contact
(57%)
Remembers Mail Contact(43%)

9
Despite telephone and mail outreach efforts, wave-2 survey data suggest that 42 percent of
all wave-1 nonrespondents were not contacted by survey interviewers via telephone or mail during the wave-1 survey (see Exhibit 2.4). This is the group about whom advocates and survey critics are often most concerned. Though not small, the percentage of nonrespondents in this group is probably lower than what some advocates and survey critics might suspect. It is possible that the reason why interviewers were unable to contact all or some of these sample members is that their housing situations were particularly tenuous around the time of the wave-1 survey—and thus, sample members were very transient—or they had no homes at all. Subsequent chapters explore the housing situations and overall well-being of nonrespondents around the time of the wave-1 survey.
SOURCE: MPR sample member tracking system, and wave-1 and wave-2 surveys of Iowa families that left TANF in the spring of 1999.
EXHIBIT 2.4
CONTACT WITH WAVE-1 NONRESPONDENTS
No Contact(42%)
Mail Contact Only(33%)
Telephone Contact(25%)

PAGE IS INTENTIONALLY LEFT BLANK TO ALLOW FOR DOUBLE-SIDED COPYING

11
III. DIFFERENCES BETWEEN RESPONDENTS AND NONRESPONDENTS IN THE WAVE-1 SURVEY
In surveys of low-income populations, concern is often expressed that the people facing the greatest hardships are the most difficult to locate and interview. If so, survey nonrespondents may represent a particularly disadvantaged subgroup of the population that deserves policy attention. Furthermore, survey estimates based on respondents will understate the financial hardships faced by the population if nonrespondents face greater hardships than respondents.
Typically, researchers attempt to identify differences between respondents and
nonrespondents by analyzing administrative data, which is often the only data available for both groups. However, administrative data often do not contain information of particular concern to advocacy groups, policymakers, and researchers—for example, data on health status, homelessness, and other measures of deprivation. The wave-2 survey obtained such information for both wave-1 respondents and wave-1 nonrespondents. This chapter explores how wave-1 nonrespondents differ from respondents, first according to data from administrative files that are often available, and then according to data from the wave-2 survey that are unique to this study. It finds that:
• Nonrespondents were more likely to belong to a racial or ethnic minority group. Our analysis reveals no other demographic differences between respondents and nonrespondents.
• Nonrespondents were more likely to have left TANF involuntarily. Nonrespondents were considerably more likely to have left TANF because they were assigned to Iowa’s Limited Benefit Plan (LBP). TANF participants in Iowa are assigned to the LBP when they do not comply with the program’s employment and training requirements. Assignment to the LBP results in immediate, indefinite ineligibility for TANF.6
• Nonrespondents were less attached to government programs and less involved in the labor market. Nonrespondents were less likely to receive TANF and food stamps one year after leaving the program. They were also were less likely to be employed when they left TANF and one year later, and they had considerably lower average earnings.
6A first instance of noncompliance with employment and training requirements results in
ineligibility for TANF in Iowa until the participant signs an individualized self-sufficiency plan. A second or subsequent instance of noncompliance results in ineligibility for TANF that lasts at least six months and continues until the participant signs an individualized self-sufficiency plan and completes 20 hours of employment and training activities.

12
• Nonrespondents were less likely to have health insurance coverage. Nonrespondents were less likely to be covered by Medicaid or employer-sponsored insurance one year after leaving TANF.
• Nonrespondents were more likely to have housing-related problems. While few nonrespondents reported being homeless around the time of the wave-1 survey, nonrespondents were more likely to have gone without utilities and to have lived with friends or relatives one year after leaving TANF.
A. DIFFERENCES ACCORDING TO ADMINISTRATIVE DATA
Administrative data are often the only data available to researchers for comparisons of survey respondents and nonrespondents. Moreover, the most readily available administrative data often pertain to the time that the survey sample was selected. However, data around the time that the survey was conducted may be more relevant for determining whether nonrespondents are worse off than respondents and whether, as a result, estimates based on survey data are biased. This section compares the characteristics of respondents and nonrespondents around the time that the wave-1 sample was selected (upon leaving TANF) and the average outcomes for these groups around the time that the wave-1 survey was fielded (one year after leaving TANF). Comparisons are made using chi-square tests for dichotomous variables and two-sample t tests for continuous variables.
In summary, the administrative data suggest that nonrespondents were worse off than
respondents when they left TANF and one year later, when we attempted to interview them for the wave-1 survey (see Exhibit 3.1). Nonrespondents had lower employment rates and lower average earnings at both points in time, and they were less likely to receive assistance from government programs one year after leaving TANF.
1. Upon Leaving TANF
a. Demographic Characteristics
Data on demographic characteristics measured when families left TANF show little difference between survey respondents and nonrespondents. The demographic characteristics on which wave-1 respondents and nonrespondents were compared include sex, race, marital status, county of residence (urban or rural), and age. At the time they left TANF, both groups consisted primarily of single white females who were, on average, 30 years old. About half lived in urban counties throughout Iowa. The only significant difference between the two groups was in their race or ethnicity: nonrespondents were significantly more likely to belong to a racial or ethnic minority group than respondents.
b. Experiences with Government Programs
Wave-1 respondents and nonrespondents differed in the reasons they left TANF. Respondents were more likely to leave TANF for positive reasons—specifically, because of increased income or because they no longer wanted or needed the assistance—while nonrespondents were more likely to leave for negative reasons—specifically, because they did

13
EXHIBIT 3.1
DEMOGRAPHIC CHARACTERISTICS AND EXPERIENCES WITH PROGRAMS AND EMPLOYMENT: BASED ON ADMINISTRATIVE DATA
Respondents Nonrespondents Difference P-value
UPON LEAVING TANF
Demographic Characteristics
Female 92.8 88.5 4.4 0.11
Racial/ethnic minority 15.3 22.3 -7.0 0.06 *
Married 18.5 23.1 -4.6 0.25
Living in urban county 50.1 55.4 -5.3 0.30
Age 29.5 30.2 -0.7 0.39
Experiences with Government Programs
Received food stamps (June 1999) 87.7 85.4 2.3 0.50
Number of children in TANF case 2.0 2.2 -0.1 0.33
Number of persons in TANF case 4.2 4.3 -0.1 0.68
Reasons for leaving TANF
Increased income 21.2 13.1 8.2 0.04 ** Noncompliance 49.4 60.0 -10.6 0.04 ** Assigned to Limited Benefit Plan 14.8 26.9 -12.1 0.00 *** Other noncompliance 34.6 33.1 1.5 0.76 Ineligible for other reasons 9.4 13.1 -3.7 0.23 No longer wanted or needed 13.8 6.9 6.9 0.04 ** Reason missing 6.2 6.9 -0.8 0.76
Labor Market Experiences
Employed (April 1999 – June 1999) 58.3 47.7 10.6 0.03 **
Earnings (April 1999 – June 1999) $1,033 $625 $408 0.00 ***
ONE YEAR AFTER LEAVING TANF
Experiences with Government Programs
Received TANF (April 2000) 22.5 13.1 9.4 0.02 **
Received food stamps (April 2000) 38.0 27.7 10.3 0.03 **
Labor Market Experiences
Employed (April 2000 – June 2000) 55.6 44.6 10.9 0.03 **
Earnings (April 2000 – June 2000) $1,468 $1,085 $383 0.03 **
Sample Size 405 130 -- --
SOURCE: Iowa's Automated Benefit Calculation system and Iowa’s Unemployment Insurance system. METHODS: P-values are based on chi-square tests or Fisher’s exact tests for dichotomous variables and two-sample t
tests for continuous variables. */**/*** Statistically significant difference at the .10/.05/.01 level.

14
not comply with welfare program requirements. In fact, nonrespondents were almost twice as likely as respondents to have been assigned to Iowa’s LBP. These comparisons suggest that nonrespondents may have been struggling more than respondents when they left TANF.
c. Labor Market Experiences
When they left TANF, wave-1 nonrespondents were less likely than wave-1 respondents to be employed, or put differently, to have positive earnings. Furthermore, including case heads with zero earnings, nonrespondents had lower average earnings than respondents. In the quarter that families left TANF (1999:Q2), the employment rates of respondents and nonrespondents were 58 percent and 48 percent, respectively; the average earnings of respondents and nonrespondents were $1,033 and $625, respectively. Therefore, nonrespondents were probably less able to support their families by working than respondents.
2. One Year After Leaving TANF
a. Experiences with Government Programs
While families must have received TANF in Iowa in the spring of 1999 but not in the summer of 1999 to be included in the study, these families may have remained off TANF or may have returned to TANF any time after August 1999. The administrative data reveal that one year after leaving TANF, wave-1 nonrespondents were significantly less likely than wave-1 respondents to receive TANF in Iowa. The TANF participation rates of respondents and nonrespondents were 23 percent and 13 percent, respectively. Furthermore, wave-1 nonrespondents were significantly less likely than wave-1 respondents to receive Food Stamps in Iowa one year after leaving TANF. The food stamp participation rates of respondents and nonrespondents were 38 percent and 28 percent, respectively.
b. Labor Market Experiences
One year after leaving TANF, wave-1 nonrespondents displayed less attachment to the labor market than wave-1 respondents. In the fourth quarter after families left TANF (2000:Q2), the employment rates for respondents and nonrespondents were 56 percent and 45 percent, respectively; average monthly earnings for respondents and nonrespondents were $1,486 and $1,085, respectively. The differences in employment rates and average earnings between respondents and nonrespondents one year after leaving TANF are similar to the differences measured when families left TANF.
B. DIFFERENCES ACCORDING TO SURVEY DATA
Data from the wave-2 survey of TANF leavers in Iowa provide a much richer picture of the differences between respondents and nonrespondents one year after they left TANF. Survey data include information about labor market experiences, sources and amounts of income, health insurance and health problems, and housing stability that is not typically available in state administrative files. This section relies on responses to retrospective questions in the wave-2 survey provided by sample members who responded to both the wave-1 and wave-2 surveys (Group E) and sample members who only responded to the wave-2 survey (Group I). In the

15
analysis, we weight the second group to reflect the 60 percent random sampling of wave-1 nonrespondents for the wave-2 survey. The methods used to detect significant differences between wave-1 respondents and nonrespondents are identical to those used for the administrative data comparisons described in Section A.
Using wave-2 survey data to compare the circumstances of wave-1 respondents and
nonrespondents one year after they left TANF poses two challenges. First, some sample members in both groups did not respond to the wave-2 survey. Therefore, estimates based on wave-2 survey data may contain nonresponse bias. Second, the retrospective questions in the wave-2 survey require sample members to recall their circumstances one year earlier. Therefore, recall error could lead to biased estimates.
Wave-2 survey data provide useful information for comparing wave-1 respondents and
nonrespondents one year after they left TANF if two conditions are met. First, the nonresponse bias in the wave-2 survey is the same for wave-1 respondents and wave-1 nonrespondents. Practically speaking, if wave-2 nonresponse bias is similar for respondents and nonrespondents, the analysis described in this chapter is useful in describing the differences between the two groups. Second, the recall bias is the same for wave-1 respondents and wave-1 nonrespondents. The issue of recall error is explored further in Appendix B.
In summary, wave-2 survey data from retrospective questions provide some additional
evidence that nonrespondents were worse off than respondents one year after they left TANF. Wave-1 nonrespondents were significantly less likely to have health insurance coverage and significantly more likely to face housing problems associated with financial difficulties.
1. Labor Market Experiences and Income
One year after leaving TANF, wave-1 nonrespondents were not significantly different from wave-1 respondents in average outcomes based on survey measures of labor market experiences and income (see Exhibit 3.2). These measures capture earnings and income for the same month as the wave-2 interview but for the previous year (2000)—approximately one year after families left TANF. For example, about 63 percent of respondents and 56 percent of nonrespondents were employed in that month, and the difference is not statistically significant. Also, average monthly earnings was $682 for respondents and $616 for nonrespondents, and again the difference is not statistically significant.7 Lastly, average monthly income was essentially the same for the two groups at just over $1,000.
7 When converted to quarterly measures, our survey-based estimates of average earnings are
larger than our estimates of average quarterly earnings from Iowa’s Unemployment Insurance (UI) system (see Exhibit 3.1). Given the limited coverage of state Unemployment Insurance systems, this difference is not surprising. Iowa’s UI system does not contain information on earnings from self-employment, informal (“under-the-table”) employment, or employment at employers that are not required to report to the state of Iowa, including employers located outside the state.

16
EXHIBIT 3.2
LABOR MARKET EXPERIENCES AND INCOME ONE YEAR AFTER LEAVING TANF: BASED ON WAVE-2 SURVEY DATA
Respondents Nonrespondents Difference P-value
Labor Market Experiences
Employed 62.5 55.8 6.7 0.35
Employed full-time – 35 or more hours / week 44.9 44.2 0.7 0.92
Monthly earnings $682 $616 $66 0.64
Barriers to employment/reasons not employed
Pregnancy 4.7 1.9 2.8 0.49 Not yet found decent job 3.3 1.9 1.4 1.00 Child care problems 2.4 5.7 -3.3 0.18 Health problems/learning disabilities 2.4 1.9 0.5 1.00 Transportation problems 2.1 3.8 -1.7 0.35 Health problems – family member 1.5 0.0 1.5 1.00 In jail/treatment facility 0.9 3.8 -2.9 0.14
Income
Sources of income
Child support 30.2 20.4 9.8 0.14
Government assistance 30.1 24.1 6.0 0.37
Other household members 20.8 25.9 -5.1 0.39
Amount of income
Monthly income $1,025 $1,029 -$4 0.98
Yearly income (2000) $11,064 $10,156 $908 0.46
Sample Size 343 54 -- --
SOURCE: Wave-2 survey of Iowa families that left TANF in the spring of 1999. METHODS: P-values are based on chi-square tests or Fisher’s exact tests for dichotomous variables and two-sample t
tests for continuous variables.
*/**/*** Statistically significant difference at the .10/.05/.01 level. 2. Health Insurance Coverage and Health Problems
Wave-2 survey data provide no evidence that wave-1 nonrespondents were more likely to have health problems than wave-1 respondents one year after leaving TANF. However, wave-2 data provide strong evidence that nonrespondents were less likely to have health insurance coverage (see Exhibit 3.3). Nonrespondents were significantly less likely to be covered by Medicaid (28 percent) than respondents (41 percent); nonrespondents were also significantly less likely to be covered by employer-sponsored medical plans (8 percent) than respondents (17 percent).

17
EXHIBIT 3.3
HEALTH INSURANCE COVERAGE AND HEALTH PROBLEMS ONE YEAR AFTER LEAVING TANF: BASED ON WAVE-2 SURVEY DATA
Respondents Nonrespondents Difference P-value
Health Insurance Coverage
Medicaid 40.6 28.3 12.3 0.09 *
Employer-sponsored – own employer 16.6 7.5 9.1 0.09 *
Employer-sponsored – spouse’s employer 3.6 5.7 -2.1 0.44
Any health insurance coverage 61.2 41.5 19.7 0.01 **
Health Problems
Poor health 8.2 11.1 -2.9 0.44
Physical disability/illness 19.8 16.7 3.1 0.59
Mental health problem 13.1 18.5 -5.4 0.29
Learning disability 5.2 11.1 -5.9 0.12
Substance abuse 1.5 3.7 -2.2 0.24
Sample Size 343 54 -- --
SOURCE: Wave-2 survey of Iowa families that left TANF in the spring of 1999. METHODS: P-values are based on chi-square tests or Fisher’s exact tests for dichotomous variables and two-sample t
tests for continuous variables.
*/**/*** Statistically significant difference at the .10/.05/.01 level. 3. Housing Stability
Measures of housing stability suggest that nonrespondents were significantly more likely to have housing-related problems around the time of the wave-1 survey than respondents (see Exhibit 3.4). Nonrespondents were much more likely to have gone without utilities (33 percent)—specifically heat, electricity, or telephone service—because they could not afford it than respondents (19 percent). Nonrespondents were also more likely to be living “doubled up” with friends or relatives at the time of the wave-1 survey (26 percent) than respondents (17 percent). The number of families that reported being homeless—living in a shelter, in a hotel or motel, in a car, or on the street—one year earlier was very low for both groups.8
8Only one nonrespondent and two respondents reported being homeless at that time.

18
EXHIBIT 3.4
HOUSING STABILITY ONE YEAR AFTER LEAVING TANF: BASED ON WAVE-2 SURVEY DATA
Respondents Nonrespondents Difference P-value
Unable to Pay Housing Costs
Utilities – went without 19.3 33.3 -14.0 0.02 **
Rent or mortgage 15.5 19.6 -4.1 0.49
Living Arrangements
Lived with friends or relatives 16.7 25.9 -9.2 0.10 *
Homeless† 0.6 1.9 -1.3 0.36
Sample Size 343 54 -- --
SOURCE: Wave-2 survey of Iowa families that left TANF in the spring of 1999. METHODS: P-values are based on chi-square tests or Fisher’s exact tests for dichotomous variables and two-sample t
tests for continuous variables.
† Homeless is defined as living in a shelter, in a hotel or motel, in a car, or on the street. */**/*** Statistically significant difference at the .10/.05/.01 level.

19
IV. NONRESPONSE BIAS IN THE WAVE-1 SURVEY ESTIMATES
Chapter III indicates that wave-1 nonrespondents were less likely to have health insurance coverage and more likely to have housing-related problems than wave-1 respondents one year after leaving TANF. This conclusion raises the following question: How large is the nonresponse bias in the wave-1 survey estimates? For example, by how much does the wave-1 survey estimate of the rate of health insurance coverage overstate the health insurance coverage rate of all sample members? And if the nonresponse bias is large, how much would additional data collection have changed the wave-1 survey estimates reported in Kauff et al. (2001)?
This chapter presents two important findings. First, if the wave-1 response rate had been
raised from 76 to 93 percent, the wave-1 survey estimates would not have been much different from those reported in Kauff et al. (2001). Second, we can compute upper and lower bounds for the nonresponse bias in the wave-1 survey estimates, and these bounds indicate that the bias for most estimates is small.
A. DATA AND METHODS
Measuring nonresponse bias requires information on survey nonrespondents that is not typically available. However, the wave-2 survey instrument contained questions about the well-being of the family one year earlier when the wave-1 survey was fielded. Furthermore, we were able to interview 69 percent of the wave-1 nonrespondents who were randomly selected for the wave-2 sample. Therefore, wave-2 survey data can be used to infer how wave-1 nonrespondents would have responded to key questions if they had completed a wave-1 interview.
Wave-2 data can provide useful information about how wave-1 nonrespondents would have
responded to a particular wave-1 survey question if the following two conditions are met:
1. There exists a wave-2 question designed to measure the same outcome for the same period of time as the wave-1 question. For many wave-1 questions, wave-2 questions exist that capture the same information. However, for the variables related to housing problems—such as the inability to pay for utilities—there are no wave-2 questions that measure the prevalence of these problems over the same time period covered by the wave-1 questions (the year after leaving TANF).9 Therefore, we exclude the variables related to housing problems from the analysis presented in this chapter.
9 The wave-1 questions measure the prevalence of housing problems over the year between
exit from TANF and the wave-1 survey; the wave-2 retrospective questions measure the prevalence of housing problems at the time of the wave-1 survey.
20
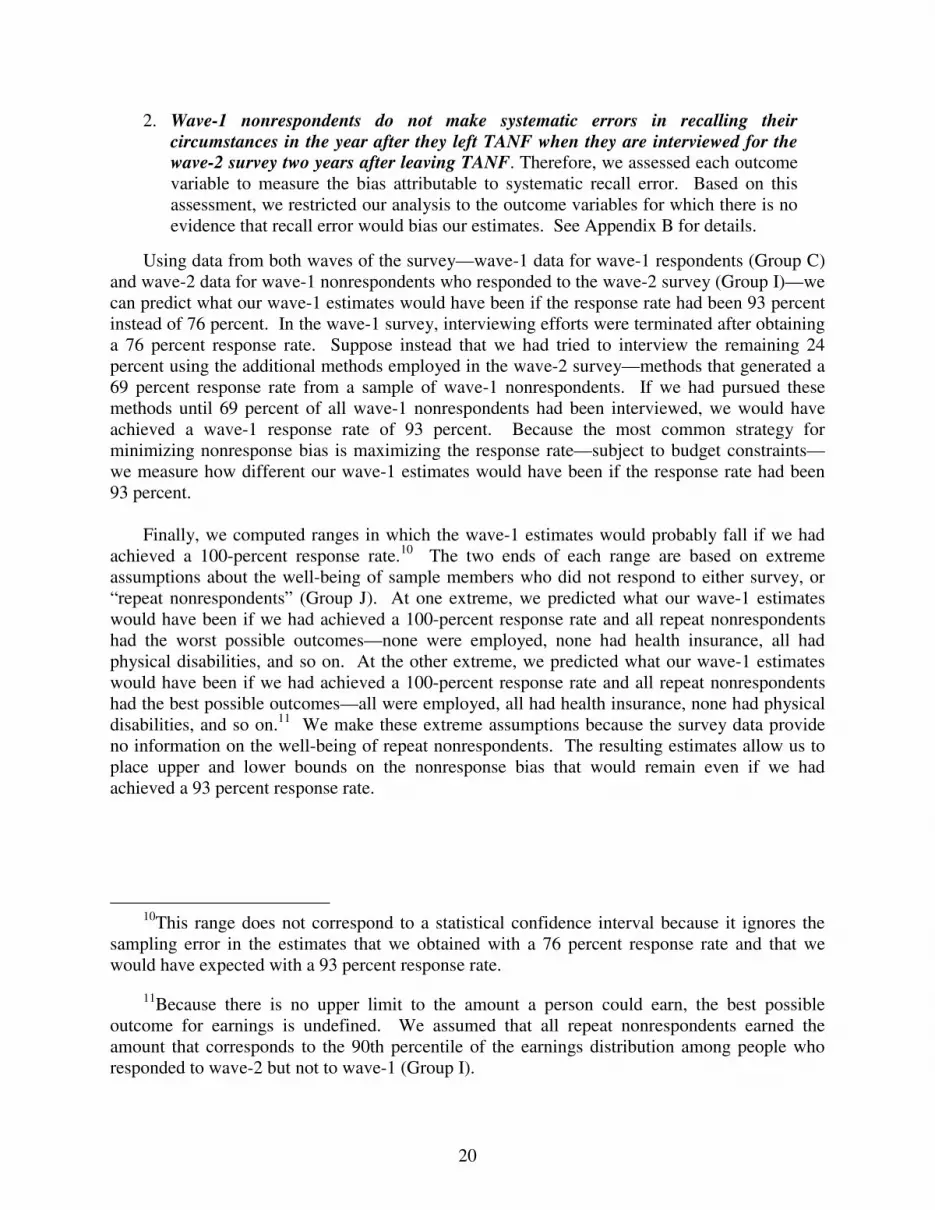
2. Wave-1 nonrespondents do not make systematic errors in recalling their circumstances in the year after they left TANF when they are interviewed for the wave-2 survey two years after leaving TANF. Therefore, we assessed each outcome variable to measure the bias attributable to systematic recall error. Based on this assessment, we restricted our analysis to the outcome variables for which there is no evidence that recall error would bias our estimates. See Appendix B for details.
Using data from both waves of the survey—wave-1 data for wave-1 respondents (Group C) and wave-2 data for wave-1 nonrespondents who responded to the wave-2 survey (Group I)—we can predict what our wave-1 estimates would have been if the response rate had been 93 percent instead of 76 percent. In the wave-1 survey, interviewing efforts were terminated after obtaining a 76 percent response rate. Suppose instead that we had tried to interview the remaining 24 percent using the additional methods employed in the wave-2 survey—methods that generated a 69 percent response rate from a sample of wave-1 nonrespondents. If we had pursued these methods until 69 percent of all wave-1 nonrespondents had been interviewed, we would have achieved a wave-1 response rate of 93 percent. Because the most common strategy for minimizing nonresponse bias is maximizing the response rate—subject to budget constraints—we measure how different our wave-1 estimates would have been if the response rate had been 93 percent.
Finally, we computed ranges in which the wave-1 estimates would probably fall if we had
achieved a 100-percent response rate.10 The two ends of each range are based on extreme assumptions about the well-being of sample members who did not respond to either survey, or “repeat nonrespondents” (Group J). At one extreme, we predicted what our wave-1 estimates would have been if we had achieved a 100-percent response rate and all repeat nonrespondents had the worst possible outcomes—none were employed, none had health insurance, all had physical disabilities, and so on. At the other extreme, we predicted what our wave-1 estimates would have been if we had achieved a 100-percent response rate and all repeat nonrespondents had the best possible outcomes—all were employed, all had health insurance, none had physical disabilities, and so on.11 We make these extreme assumptions because the survey data provide no information on the well-being of repeat nonrespondents. The resulting estimates allow us to place upper and lower bounds on the nonresponse bias that would remain even if we had achieved a 93 percent response rate.
10This range does not correspond to a statistical confidence interval because it ignores the sampling error in the estimates that we obtained with a 76 percent response rate and that we would have expected with a 93 percent response rate.
11Because there is no upper limit to the amount a person could earn, the best possible outcome for earnings is undefined. We assumed that all repeat nonrespondents earned the amount that corresponds to the 90th percentile of the earnings distribution among people who responded to wave-2 but not to wave-1 (Group I).

21
B. WHAT IF THE WAVE-1 RESPONSE RATE HAD BEEN 93 PERCENT?
The wave-1 survey obtained a response rate of 76 percent, which is high for this type of survey. However, our success in interviewing wave-1 nonrespondents for the wave-2 survey suggests that with enough additional funds, the wave-1 survey could probably have obtained a 93 percent response rate. Furthermore, the flip side of a 76 percent response rate is a 24 percent nonresponse rate. The magnitude of the nonresponse rate allows for the mathematical possibility that our wave-1 survey estimates greatly overstate (or understate) the well-being of TANF leavers in Iowa; if so, additional data collection might reduce the nonresponse bias.12
However, we find that the wave-1 estimates would not have been much different if we had
achieved a 93 percent response rate (see Exhibit 4.1). The estimated employment rate, for example, would have been approximately 1 percentage point lower if we had achieved a 93 percent response rate. The small difference can be attributed to the small difference in employment rates between respondents and nonrespondents described in Chapter III (see Exhibit 3.2). Even if we focus on a variable where the analysis in Chapter III showed significant differences between respondents and nonrespondents—health insurance coverage—a 93 percent response rate would have reduced our estimate of the coverage rate by only 4 percentage points from 63 to 59 percent. While this difference is statistically significant, the policy implications of the two estimates are probably the same: about two out of five heads of families that left TANF lacked health insurance coverage one year after leaving the program.
C. WHAT IF THE WAVE-1 RESPONSE RATE HAD BEEN 100 PERCENT?
Without making assumptions about the well-being of repeat nonrespondents—which we want to avoid—we cannot be sure what our wave-1 estimates would have been if all sample members had been interviewed. However, for each outcome variable, we can provide two estimates that are based on best- and worst-case scenarios for repeat nonrespondents: the estimate that would have resulted from a 100 percent response rate probably falls between these two estimates. This analysis treats the estimates in Section B—based on a 93 percent response rate—as known with certainty and the outcomes of the remaining 7 percent as completely unknown. In other words, it assumes that we achieved a 93 percent response rate in the wave-1 survey, that the survey estimates based on respondents match the numbers in Exhibit 4.1, and that nothing is known about the well-being of nonrespondents. By construction, the estimates
12This point can be illustrated using a hypothetical example. Our wave-1 estimates indicate
that 61 percent of respondents were employed one year after leaving TANF. However, if none of the nonrespondents were employed, then the employment rate in our survey sample—respondents and nonrespondents together—would be 46 percent, and the error due to nonresponse would be 61-46=15 percentage points. However, if the response rate were raised to 93 percent, the employment rate for respondents would equal 49 percent, and the error due to nonresponse would fall to 49-46=3 percentage points.

22
EXHIBIT 4.1
WAVE-1 SURVEY ESTIMATES UNDER 76 PERCENT RESPONSE RATE (ACTUAL) AND 93 PERCENT RESPONSE RATE (SIMULATED)
76 Percent Response
Rate
93 Percent Response
Rate Difference P-value
Labor Market Experiences and Income
Employed 60.7 59.9 0.8 0.49
Monthly earnings $653 $646 $7 0.74
Barriers to employment/reasons not employed
Pregnancy 4.4 4.0 0.4 0.71 Transportation problems 3.0 3.1 -0.1 0.67 Health problems – family member 2.5 2.0 0.5 0.61 In jail/treatment facility 1.5 1.9 -0.4 0.23
Source of income – child support 1.0 1.5 -0.5 0.15
Health Insurance Coverage
Employer-sponsored – own employer 14.2 13.0 1.2 0.18
Any health insurance coverage 62.8 59.0 3.8 0.00 ***
Health Problems
Poor health 6.4 7.3 -0.9 0.25
Physical disability/illness 19.9 19.3 0.6 0.58
Substance abuse 2.0 2.4 -0.4 0.35
Sample Size 405 459 -- --
SOURCE: Wave-1 and wave-2 surveys of Iowa families that left TANF in the spring of 1999. METHODS: P-values are based on chi-square tests or Fisher’s exact tests for dichotomous variables and two-sample t
tests for continuous variables. */**/*** Statistically significant difference at the .10/.05/.01 level.

23
based on best- and worst-case scenarios for repeat nonrespondents span a range that includes the estimate associated with a 93 percent response rate.13
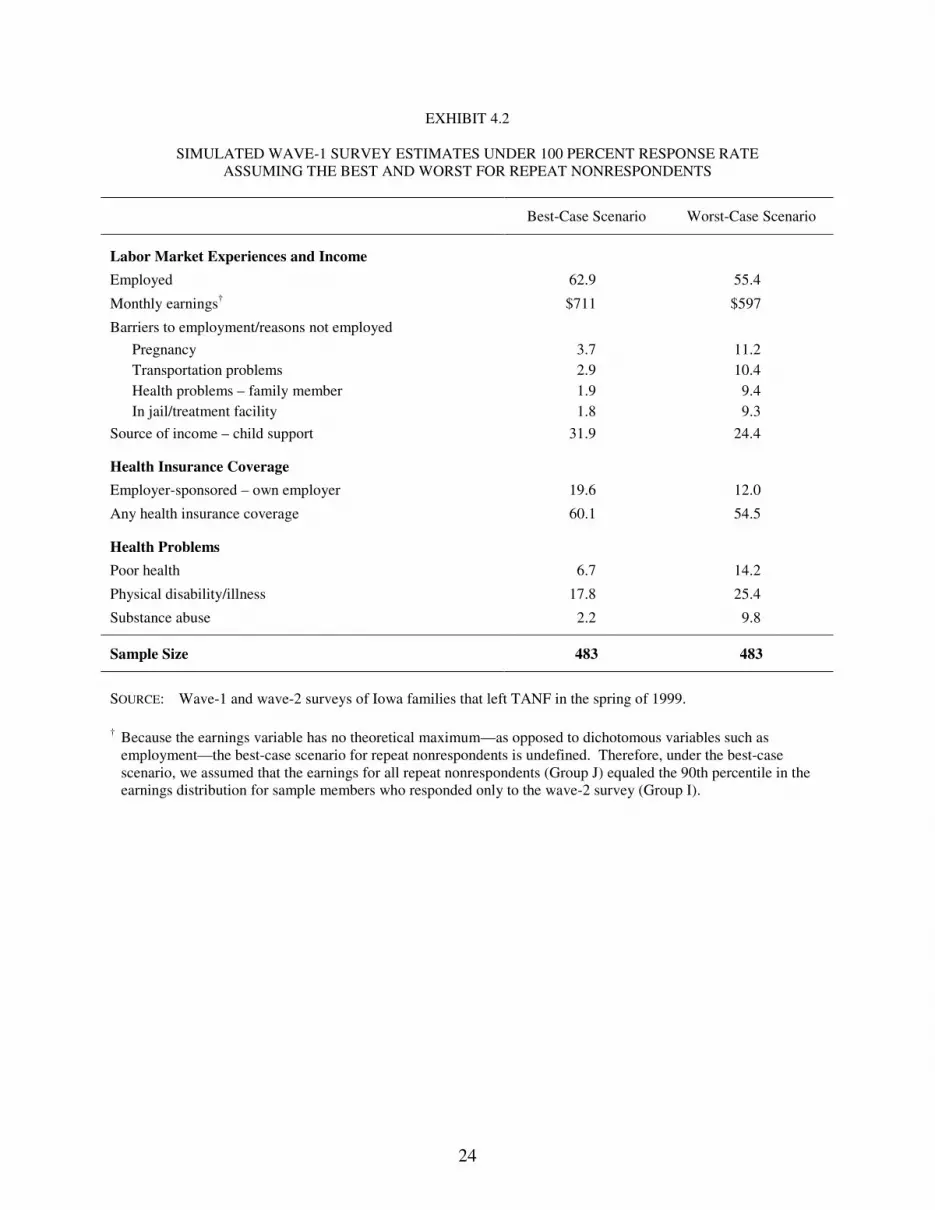
Despite being based on polar opposite assumptions, the estimates based on the best- and worst-case scenarios for repeat nonrespondents are close to each other (see Exhibit 4.2). Therefore, the policy implications of all estimates that fall with the range defined by the best- and worst-case scenarios are probably similar. For all dichotomous variables, such as employment, the difference between the two estimates approximately equals the simulated nonresponse rate—7 percentage points. For example, the employment rate implied by the best case scenario (62.9 percent) is approximately 7 percentage points higher than the coverage rate implied by the worst case scenario (55.4 percent). Therefore, Exhibit 4.2 illustrates that a 93 percent response rate leaves little room for nonresponse bias.
Finally, we decompose the nonresponse bias in each survey estimate into two parts: the bias
from achieving a 76 percent response rate instead of a 93 percent rate, and the bias from achieving a 93 percent response rate instead of a 100 percent rate. Exhibit 4.1 provides estimates of the first part, and Exhibit 4.2 provides a range that can be used to compute upper and lower bounds on the second part. We combine this information to compute upper and lower bounds on the nonresponse bias for wave-1 survey estimates (see Exhibit 4.3). For example, our findings indicate that the wave-1 estimate of the employment rate one year after families left TANF, 60.7 percent, may be too small by as many as 2.2 percentage points or too large by as many as 5.3 percentage points. The estimate with the largest possible nonresponse bias is the rate of health insurance coverage. Our findings indicate that the wave-1 estimate of 62.8 percent is too large by 2.7-8.3 percentage points.
Based on these results, we conclude that the nonresponse bias is fairly small in most wave-1
estimates. Therefore the wave-1 survey estimates provide a reasonably accurate picture of the well-being of TANF leavers in Iowa one year after they left the program.
13The estimates associated with a 93 percent response rate are approximately what we would
have found if the response rate had been 100 percent and there were no systematic differences between repeat nonrespondents and other sample members. Therefore, these estimates fall within the range defined by the best- and worst-case scenarios for repeat nonrespondents.
24
EXHIBIT 4.2
SIMULATED WAVE-1 SURVEY ESTIMATES UNDER 100 PERCENT RESPONSE RATE ASSUMING THE BEST AND WORST FOR REPEAT NONRESPONDENTS
Best-Case Scenario Worst-Case Scenario
Labor Market Experiences and Income
Employed 62.9 55.4
Monthly earnings† $711 $597
Barriers to employment/reasons not employed
Pregnancy 3.7 11.2 Transportation problems 2.9 10.4 Health problems – family member 1.9 9.4 In jail/treatment facility 1.8 9.3
Source of income – child support 31.9 24.4
Health Insurance Coverage
Employer-sponsored – own employer 19.6 12.0
Any health insurance coverage 60.1 54.5
Health Problems
Poor health 6.7 14.2
Physical disability/illness 17.8 25.4
Substance abuse 2.2 9.8
Sample Size 483 483
SOURCE: Wave-1 and wave-2 surveys of Iowa families that left TANF in the spring of 1999. † Because the earnings variable has no theoretical maximum—as opposed to dichotomous variables such as
employment—the best-case scenario for repeat nonrespondents is undefined. Therefore, under the best-case scenario, we assumed that the earnings for all repeat nonrespondents (Group J) equaled the 90th percentile in the earnings distribution for sample members who responded only to the wave-2 survey (Group I).

25
EXHIBIT 4.3
UPPER AND LOWER BOUNDS FOR NONRESPONSE BIAS IN WAVE-1 ESTIMATES
Nonresponse Bias
Estimate Lower Bound
† Upper Bound
†
Labor Market Experiences and Income
Employed 60.7 -2.2 5.3
Monthly earnings $653 -$58 $56
Barriers to employment/reasons not employed
Pregnancy 4.4 -6.8 0.7 Transportation problems 3.0 -7.4 0.1 Health problems – family member 2.5 -6.9 0.6 In jail/treatment facility 1.5 -7.8 -0.3
Source of income – child support 27.7 -4.2 3.3
Health Insurance Coverage
Employer-sponsored – own employer 14.2 -5.4 2.2
Any health insurance coverage 62.8 2.7 8.3
Health Problems
Poor health 6.4 -7.8 -0.3
Physical disability/illness 19.9 -5.5 2.1
Substance abuse 2.0 -7.8 -0.2
Sample Size 405 -- --
SOURCE: Wave-1 and wave-2 surveys of Iowa families that left TANF in the spring of 1999. † The upper and lower bounds are based on the differences between the wave-1 estimate and the estimates based on
the best- and worst-case scenarios from Exhibit 4.2.

PAGE IS INTENTIONALLY LEFT BLANK TO ALLOW FOR DOUBLE-SIDED COPYING

27
V. WEIGHTING ADJUSTMENTS TO ADDRESS WAVE-1 NONRESPONSE BIAS
Chapter IV provides no evidence of nonresponse bias in most of the wave-1 survey estimates. However, the estimate of the rate of health insurance coverage appears to be biased: if the response rate had been higher, the rate of health insurance coverage for respondents would have been lower. Furthermore, other wave-1 estimates may contain nonresponse bias that is not sufficiently great to be detected by our statistical tests.
A common way to address unit nonresponse is through weighting adjustments. Information
on respondents and nonrespondents is used to estimate each sample member’s probability of responding to the survey. The estimates are used to construct weights for survey respondents that may allow them to represent more accurately the population from which the survey sample was drawn.
In this chapter, we address the following question: To what extent can nonresponse bias in
the wave-1 survey estimates be reduced through weighting adjustments? To answer the question, we assign nonresponse-adjusted weights to survey respondents, compute weighted wave-1 survey estimates, and compare the estimates to the unweighted wave-1 estimates presented in Kauff et al. (2001).
This analysis revealed that the estimates weighted to account for survey nonresponse are
very similar to the unweighted estimates. For most wave-1 estimates, the small difference can probably be attributed to the small size of the nonresponse bias. However, for the wave-1 estimate of the health insurance coverage rate, which may contain a modest amount of nonresponse bias, the small difference between the weighted and unweighted estimates may suggest that the combination of weighting techniques and state administrative data was not very successful in reducing nonresponse bias.
A. WEIGHTING TO ACCOUNT FOR SURVEY NONRESPONSE
This section provides a brief motivation for using weights to address nonresponse bias and then describes how we computed weights for survey respondents.
1. Motivation
Sampling weights are designed to account for variation in the inclusion probability across sample members. However, because the survey outcomes are unknown for nonrespondents, survey estimates are typically based on respondents only. Furthermore, the probability of responding to the survey may vary across sample members. If so, survey estimates based on sampling weights may contain nonresponse bias.
One way to address nonresponse bias is to create weights that account for the variation
across sample members in both the inclusion probability and the probability of responding to the survey, or the “response propensity.” One method for estimating response propensities involves defining “weighting classes”—mutually exclusive subgroups of the sample—based on data that

28
are available for both respondents and nonrespondents. We use administrative data to define weighting classes, and we estimate response propensities by computing the response rate separately for each weighting class. We then use the response rates to construct weights. Application of these weights in computing survey estimates will reduce nonresponse bias if the response propensities and survey outcomes vary across weighting classes.
2. Variation in Response Rates
Of the 535 wave-1 survey sample members, 405 responded to the wave-1 survey. Therefore, the overall response rate to the wave-1 survey was 76 percent. However, the response rate may vary across subgroups of the survey sample. To identify variables from administrative data that distinguish between sample members with high and low response propensities—variables to be used in defining weighting classes—we took the following three steps:
1. We selected administrative variables from Exhibit 3.1 for which the difference between respondents and nonrespondents was significant at the 5 percent level.14
2. We used all of the variables identified in step 1 to estimate a logit model of response to the wave-1 survey.
3. We implemented a “stepwise” procedure to remove the variables with the least predictive power from the model estimated in step 2 until all the remaining variables were significant at the 20 percent level.
The following variables remained in the logit model after all three steps were taken: the reasons for leaving TANF, TANF receipt in April 2000, and earnings in the second quarter of 1999. Because earnings in the second quarter of 1999 is a continuous variable, we divided the survey sample into three different earnings categories. First, we split the sample into people with zero earnings and people with positive earnings. Second, among the people with positive earnings, we computed the median level of earnings and split the sample into two groups of equal size: people with earnings below the median and people with earnings above the median.
Finally, we decided not to use all of the reasons for leaving TANF in defining weighting
classes because some of the reasons were reported infrequently; the variables corresponding to these reasons would have generated weighting classes with very small sample sizes. Therefore, we only included the reason with the highest significance level in the logit model—involuntary exit due to noncompliance with the policies of Iowa’s TANF program.
14These variables include indicators of TANF and food stamp receipt in April 2000,
employment in the second quarter of 1999 and the second quarter of 2000, different reasons for leaving TANF, and the amount of earnings in the second quarters of 1999 and 2000. Although some of the individual reasons did not meet the significance threshold, we selected all of the reason variables because an F-test revealed that they were jointly significant at the 5 percent level.

29
In sum, three variables were used to divide the sample into 12 weighting classes. Exhibit 5.1 shows the number of sample members, the number of respondents, and the response rate for each weighting class:
EXHIBIT 5.1
RESPONSE RATES AND WEIGHTS ACROSS 12 WEIGHTING CLASSES
Left TANF Involuntarily Due to Noncompliance
Earnings
TANF Receipt
Sample (number)
Respondents (number)
Response Rate
(percent)
Nonresponse-Adjusted Weight
No Zero No 90 62 69 2.6 Yes Zero No 104 69 66 2.7 No Low No 45 36 80 2.2 Yes Low No 71 47 66 2.7 No High No 68 59 87 2.1 Yes High No 49 41 84 2.1 No Zero Yes 21 19 90 2.0 Yes Zero Yes 22 19 86 2.1 No Low Yes 13 12 92 1.9 Yes Low Yes 20 14 70 2.6 No High Yes 20 17 85 2.1 Yes High Yes 12 10 83 2.1
Sample Size 535 405 -- --
SOURCE: Iowa’s Automated Benefit Calculation system, Iowa’s Unemployment Insurance system, and wave-1
survey of Iowa families that left TANF in the spring of 1999. 3. Nonresponse-Adjusted Weights
Based on the response rates, we computed nonresponse-adjusted weights for the 405 wave-1 respondents. These weights, shown in Exhibit 5.1, account for the probability of inclusion in the survey sample—the same for all 535 sample members—and the response rate for each weighting class. To be precise, the nonresponse-adjusted weight for a sample member equals the inverse of the sampling probability (958/535) times the inverse of the response rate for the weighting class to which the sample member belongs.
The following example illustrates how the nonresponse-adjusted weights account for the
representation of different groups in the sample of survey respondents. The weighting class consisting of sample members who left TANF due to noncompliance, remained off TANF in April 2000, and had no earned income in the quarter they left TANF (the second quarter of 1999) had the lowest response rate (66 percent); respondents in this group were therefore assigned weights of (958/535)*(1/.66) = 2.7. In contrast, the weighting class consisting of the sample members who left TANF for other reasons, had returned to Iowa’s TANF program by April 2000, and had low positive earnings in the quarter of TANF exit had the highest response rate

30
(92 percent) and were assigned weights of (958/535)*(1/.92) = 1.9. The higher weight assigned to members of the first group compensates for the group’s underrepresentation in the respondent sample relative to the second group.
B. COMPARISON OF WEIGHTED AND UNWEIGHTED ESTIMATES
Using the weights described in the previous section, we computed weighted wave-1 survey estimates for comparison with the unweighted estimates reported in Kauff et al. (2001). We find that most weighted wave-1 estimates based on dichotomous variables differ from the unweighted estimates by less than one percentage point (see Exhibit 5.2). For average monthly earnings, the estimates differ by 4 dollars; for average monthly income, including and excluding food stamps, the estimates differ by 12 dollars and 14 dollars, respectively. Therefore, the nonresponse-adjusted weights have very little effect on the survey estimates. For most survey estimates, the similarity between the weighted and unweighted estimates can probably be attributed to relatively small nonresponse bias and not to a failure of the methods to reduce nonresponse bias.
However, we showed in Chapter 4 that the wave-1 survey estimate of the health insurance
coverage rate is probably biased upward and could be 8 percentage points too large. We find that the weighted estimate of the health insurance coverage rate is lower than the unweighted estimate, which suggests that weighting reduced the nonresponse bias in the unweighted estimate. However, the difference between the weighted and unweighted estimates is approximately one percentage point. Furthermore, estimates presented in Chapter 4 suggest that the nonresponse bias is greater than one percentage point and probably falls between three and eight percentage points. Therefore, weighting does not seem to greatly reduce nonresponse bias in this estimate.

31
EXHIBIT 5.2
WAVE-1 ESTIMATES OF AVERAGE OUTCOMES ONE YEAR AFTER LEAVING TANF: UNWEIGHTED AND WEIGHTED TO ACCOUNT FOR SURVEY NONRESPONSE
Unweighted Weighted
Labor Market Experiences and Income
Employed 60.7 60.3
Employed full-time – 35 or more hours / week 38.3 38.4
Monthly earnings $653 $649
Barriers to employment/reasons not employed
Pregnancy 4.4 4.4 Not yet found decent job 7.4 7.5 Child care problems 5.7 5.6 Health problems/learning disabilities 9.9 10.0 Transportation problems 3.0 2.9 Health problems – family member 2.5 2.5 In jail/treatment facility 1.5 1.6
Income
Sources of income
Child support 27.7 27.5 Government assistance 37.8 36.9 Other household members 39.9 40.3
Amount of income
Monthly income (including food stamps) $1,558 $1,570 Monthly income (excluding food stamps) $1,456 $1,470
Health Insurance Coverage
Medicaid 47.8 46.5
Employer-sponsored – own employer 14.2 13.6
Any health insurance coverage 62.8 61.7
Health Problems
Poor health 6.4 6.6
Physical disability/illness 19.9 19.8
Mental health problem 5.6 5.8
Substance abuse 2.0 2.1
Sample Size 405 405
SOURCE: Wave-1 survey of Iowa families that left TANF in the spring of 1999. METHODS: The unweighted estimates were presented in Kauff et al. (2001) and reproduced in Exhibit 4.1; the
weighted estimates are based on weights constructed using state administrative data on survey respondents and nonrespondents.

PAGE IS INTENTIONALLY LEFT BLANK TO ALLOW FOR DOUBLE-SIDED COPYING

33
VI. SUMMARY OF FINDINGS ON NONRESPONSE IN THE WAVE-1 SURVEY
The wave-1 survey of families that left Iowa’s TANF program in the spring of 2000 was designed to characterize the well-being of these families one year after they left TANF. The wave-2 survey provides information that is useful in assessing the nonresponse bias in the wave-1 survey estimates. Information of this type is not available in most studies. Below we list four important findings about wave-1 nonresponse that are based on data from the wave-2 survey:
1. Most wave-1 nonrespondents were contacted by survey interviewers, and most had telephone service—which lessens the burden of responding to a telephone survey like the wave-1 survey.
2. Wave-1 nonrespondents were less likely than wave-1 respondents to have health insurance coverage one year after leaving TANF.
3. Wave-1 nonrespondents were more likely than wave-1 respondents to have housing problems attributable to financial difficulties one year after leaving TANF.
4. Despite the differences between wave-1 respondents and nonrespondents, the nonresponse bias in the wave-1 survey estimates seems to be relatively small.
Two additional data sources—the sample tracking database maintained for survey
operations and state administrative data—both provide some information about nonrespondents. The value of the wave-2 survey in assessing wave-1 nonresponse can be seen by first identifying what we learned from the other two data sources and then identifying the additional information learned from wave-2 survey interviews.
A. WHAT INTERVIEWERS LEARNED ABOUT NONRESPONDENTS FROM TELEPHONE CONVERSATIONS
The sample tracking database contains information from telephone conversations between survey interviewers and sample members (or close proxies for them). The database indicates that only 25 percent of nonrespondents were contacted by telephone. For these sample members, the tracking database contains a code indicating the reason that they were unable or unwilling to complete an interview. However, the sample tracking database was not designed to record information about the well-being of nonrespondents. Furthermore, the tracking database provides no information at all about the 75 percent of nonrespondents that survey interviewers were unable to contact by telephone.
B. WHAT WE LEARNED ABOUT NONRESPONDENTS FROM STATE ADMINISTRATIVE DATA
Administrative data maintained by the state of Iowa provide useful information on the differences between respondents and nonrespondents, both when they left TANF and one year later at the time of the wave-1 survey. Nonrespondents were more likely to belong to a racial or

34
ethnic minority group; more likely to have left TANF involuntarily; less likely to have been employed; and less likely to receive government assistance one year after leaving TANF. These findings suggest that wave-1 nonrespondents were not faring as well as wave-1 respondents when they left TANF and one year later.
However, administrative data provide a limited number of variables that measure the well-
being of families. As a consequence, the study of TANF leavers in Iowa has relied heavily on data from two waves of survey interviews. The interviews provide information that paints a richer picture of the well-being of TANF leavers—at least those who responded to the surveys.
Furthermore, administrative data provide only indirect evidence on the extent of the
nonresponse bias in the wave-1 survey estimates. By construction, the surveys measure outcomes that are not measured in administrative data. Therefore, administrative data are not particularly helpful in assessing the magnitude of nonresponse bias in survey estimates. For example, knowledge that nonrespondents were 9 percentage points less likely to receive TANF in April 2000, as administrative data show, does not help us measure the extent to which the survey estimate of the rate of health insurance coverage overstates or understates the true rate of health insurance coverage among families that left TANF in Iowa.
C. WHAT WE LEARNED ABOUT NONRESPONDENTS FROM WAVE-2 SURVEY DATA
Wave-2 survey data collected by MPR provide additional detail on the characteristics and outcomes of families who did not respond to the wave-1 survey and on the differences between respondents and nonrespondents beyond the information provided by state administrative data. Findings based on wave-2 data are summarized below:
Survey interviewers were able to contact at least half of wave-1 nonrespondents by
telephone or mail. Survey interviewers knew that they contacted at least 25 percent of nonrespondents because they had a telephone conversation with them. Wave-2 survey data indicates that two out of five nonrespondents who were not contacted by telephone received mail about the survey and that at least half of wave-1 nonrespondents were contacted by either telephone or mail. Therefore, it appears that a large minority of nonrespondents can be classified as “soft refusals” because they received mail about the survey but did not respond by calling the toll-free number to complete an interview.
Nonrespondents were less likely to have health insurance coverage than respondents. Nonrespondents were less likely to be covered by Medicaid or employer-sponsored insurance. About two in five nonrespondents and three in five respondents were covered by some type of health insurance plan one year after leaving TANF. Lack of health insurance makes people vulnerable to financial shocks associated with health problems and increases the likelihood that illnesses go untreated. Therefore, wave-1 nonrespondents appear to be particularly vulnerable to these problems.
Nonrespondents were more likely than respondents to have housing-related problems.
While few nonrespondents reported being homeless around the time of the wave-1 survey, nonrespondents were more likely to have gone without utilities because they could not afford

35
them and to have lived with friends or relatives. While wave-2 survey data do not reveal a large difference in average income between respondents and nonrespondents, the housing problems faced more commonly by nonrespondents suggest that nonrespondents probably endured greater financial hardships than respondents one year after leaving TANF.
Nonresponse bias in the wave-1 survey estimates is probably small for most outcomes.
The wave-2 survey allowed us to measure nonresponse bias in the wave-1 survey estimates. As shown in Chapter 4, wave-2 responses by wave-1 nonrespondents allowed us to simulate what the wave-1 estimates would have been if the additional locating and interviewing methods employed in the wave-2 survey had been used to increase the wave-1 response rate to 93 percent. This exercise revealed that our survey estimates would have been very similar under a 93 percent response rate to what they were under the 76 percent response rate achieved in the wave-1 survey. Furthermore, a 93 percent response rate leaves little room for nonresponse bias. Therefore, our findings suggest that the wave-1 survey estimates do not contain much nonresponse bias.

PAGE IS INTENTIONALLY LEFT BLANK TO ALLOW FOR DOUBLE-SIDED COPYING
37
REFERENCES
Kauff, Jacqueline, Lisa Fowler, Thomas Fraker, and Julita Milliner-Waddell. “Iowa Families That Left TANF: Why Did They Leave and How Are They Faring?” Washington, DC: Mathematica Policy Research, Inc., February 2001.
Kauff, Jacqueline, Thomas Fraker, and Julita-Milliner-Waddell. “Iowa Families That Left TANF: How Are They Faring Two Years Later?” Washington, DC: Mathematica Policy Research, Inc., February 2002.

PAGE IS INTENTIONALLY LEFT BLANK TO ALLOW FOR DOUBLE-SIDED COPYING

APPENDIX A
WAVE-2 SURVEY METHODOLOGY

PAGE IS INTENTIONALLY LEFT BLANK TO ALLOW FOR DOUBLE-SIDED COPYING

A-3
MPR conducted a follow-up, or wave-2, survey of Iowa families that left FIP in the spring of 1999 during the spring of 2001, exactly one year after the initial, or wave-1, survey of these families. MPR used two distinct methodologies in the wave-2 survey—one for respondents to the wave-1 survey and another for nonrespondents to that survey. Efforts to interview wave-1 respondents were made through telephone and mail contact, while efforts to interview wave-1 nonrespondents were made through telephone, mail, and in person contact. These methodologies are described this appendix.
A. SAMPLE DESIGN
All 405 sample members who responded to the wave-1 survey were included in the wave-2 survey sample. The 130 sample members who did not respond to the wave-1 survey were randomly divided into 10 groups of 13 sample members each, and 6 of these groups were randomly selected for the wave-2 sample.15 Therefore, the sample for the wave-2 survey consisted of all 405 wave-1 respondents and a random sample of 78 wave-1 nonrespondents for a total of 483 sample members.
B. SURVEY INSTRUMENT AND PRETEST
The wave-2 survey instrument was based largely on the wave-1 instrument developed by MPR in consultation with Iowa DHS, but it included an additional set of retrospective questions that asked respondents to describe their circumstances one year ago—during the time of the wave-1 survey. As in the wave-1 survey, the instrument was designed for paper-and-pencil administration over the telephone. The average length of time required to complete the survey was 37 minutes.
MPR conducted a full pretest of the wave-2 survey instrument in February 2001 with 11
individuals. These pretest sample members were selected from among the respondents and nonrespondents to the pretest from the wave-1 survey. These individuals left FIP in the spring of 1999 but were not included in the wave-1 survey sample of 535 families. The purpose of the pretest was to ensure that the skip patterns in the survey instrument were correct, adjust the length of the survey, improve the flow and sequencing of the questions, clarify question wording for sample members, and clarify instructions for interviewers.
Procedures from the actual wave-2 survey, such as sending advance letters and offering
incentives, were used during the pretest as well. The purpose of testing procedures was to obtain the best information possible in terms of locating sample members, their willingness to participate, and survey comprehension among both respondents and interviewers. We modified the survey on the basis of feedback received from debriefing sessions with interviewers and according to what we observed while monitoring the interviews. Another important aspect of the pretest was to train interviewers on how to administer the survey.
15The high cost of locating and interviewing sample members who we had been unable to
interview in the wave-1 survey and the need to achieve a high response rate for this group prevented us from including all wave-1 nonrespondents in the wave-2 sample.

A-4
C. SURVEY DATA COLLECTION
Data collection for the wave-2 survey ran from early March 2001 through mid-July (approximately 20 weeks). Because we expected that the passage of time since the wave-1 survey would make it difficult to locate and contact sample members, we took several steps to facilitate the data collection process:
• We sent holiday greeting cards followed by an advance letter.
• We conducted intensive telephone and, for wave-1 nonrespondents, in-person locating efforts.
• We sent additional mailings encouraging sample members to participate in the survey.
• We offered special incentives to various groups of sample members.
1. Holiday Cards
MPR sent holiday cards to the full wave-2 sample in December 2000. The cards were designated “return service requested”, which provided MPR with forwarding information from the postal service in the event the address on the card was incorrect. Enclosed with the card was a self-addressed, postage-paid return postcard requesting updated address and telephone information. The holiday mailing yielded new contact information for about one-third (34 percent) of the sample members. However, the bulk of that information came from the postal service, not from sample members. Of the 164 cards returned by the postal service, 86 had forwarding addresses and 78 were returned as undeliverable without forwarding information. Only 18 postcards were returned by sample members.
Exhibit A.1 shows the distribution of holiday card returns by survey status in the wave-1
data collection period. One-hundred sixteen returns, approximately two-thirds, came from sample members who completed a wave-1 survey. Nearly all of these respondents had moved since the wave-1 survey, suggesting that the population is highly mobile.
2. Advance Letters
About one week before the start of the wave-2 fielding period (before any telephone contact was attempted), we sent a letter to each sample member explaining the study, encouraging participation, and offering a $35 incentive for completing an interview.16 The letter explained that participation was voluntary and that the identities and responses of all participants would be kept confidential. It also gave sample members a toll-free number they could call to complete
16The $35 incentive represented a $10 increase over the initial incentive offered in the wave-
1 survey.

A-5
EXHIBIT A.1
DISTRIBUTION OF HOLIDAY CARD RETURNS
Final Status, Wave-1 Survey Returned Postcards
Returned Envelopes With Address
Updates Returned Envelopes
Without Updates Total
Complete 18a 68 30 116
Refused 0 5 2 7
Incomplete 0 2 1 3
Unlocatable 0 10 43 53
Unavailable 0 0 1 1
Barrier 0 0 1 1
Hospitalized 0 1 0 1
Total 18 86 78 182
aHalf (9) of the returned postcards contained updated address information.
the interview. One-third of the completed interviews were the result of sample member calls to the toll-free number; just less than two-thirds were from calls to sample members from MPR telephone center staff, and the remainder resulted from in-person locating efforts.
3. Telephone and In-Person Locating Efforts
MPR called sample members using phone numbers collected from respondents during the wave-1 survey effort or, in the case of nonrespondents, using telephone numbers obtained from DHS. If telephone numbers were incorrect or unavailable, MPR’s locating department used a variety of techniques to find valid contact information, ranging from calling directory assistance to more extensive methods such as tapping into reverse directories and searching through the Lexis-Nexis national database. We used a special version of Lexis-Nexis containing information on state motor vehicle records for the sample members hardest to locate. We also contacted local community action agencies in Iowa for help in locating sample members. Locating efforts were required for 73 percent of wave-1 nonrespondents and 63 percent of wave-1 respondents.
For the 40 wave-1 survey nonrespondents for whom telephone and mail efforts were
unsuccessful, we used in-person locating. Fourteen field interviewers were hired and trained to locate and expedite interviews. These interviewers were located in nine states where wave-1 survey nonrespondents were believed to be living—Arkansas, Illinois, Iowa, Kansas, Louisiana, Minnesota, Mississippi, Ohio, and Texas. The number of cases assigned to field interviewers ranged from 1 to 15. Field interviewers attempted to locate wave-1 nonrespondents by visiting all addresses at which the sample members might have been living and by gathering contact information from family, friends, neighbors, and local community organizations—such as food banks or homeless shelters—with which the sample members may have come in contact. Of the 40 cases assigned to field interviewers, 21 interviews were completed. Four interviews were

A-6
administered in person by the field interviewer, and the remaining 17 were completed by sample members using cell phones, temporarily loaned to them by field interviewers, to call in to MPR’s toll-free number.
4. Additional Mailings
In addition to the advance letter explaining the study, several additional mailings were sent to sample members to encourage their participation. These mailings included specialized letters, fliers, and postcards, which went to all sample members who had not completed an interview at the time of each additional mailing.17 We sometimes sent letters to all the addresses we had for the sample member, including secondary contacts identified during the wave-1 data collection effort. We also occasionally used priority mail service. Some letters offered increased incentive amounts as the data collection period progressed.
5. Incentives
Special incentives were offered to select groups of sample members such as those who had moved out of state. For instance, wave-1 nonrespondents living out of state were offered $75 in a Western Union account, and wave-1 respondents living out of state were offered $50 in a Western Union account.18 Out-of-state sample members received flyers by priority mail alerting them that they could pick up their incentive payments locally immediately after they completed the survey. Differences in the incentives offered to wave-1 respondents and nonrespondents were determined on the basis of budget and our judgment that wave-1 nonrespondents would require more motivation than respondents to complete interviews.
Special incentives were offered to both wave-1 respondents and nonrespondents who
originally refused to participate in the wave-2 survey as well. About eight weeks after the wave-2 survey began, we sent wave-1 respondents who originally refused to complete a wave-2 interview a letter encouraging them to participate. We tailored these refusal conversion letters to the concern or issue voiced by the sample member and included in them an offer of $50 to complete the interview. Eleven of the 12 who originally refused to participate ultimately completed interviews.
Wave-1 nonrespondents who originally refused to complete a wave-2 interview were sent
letters that explained that a field interviewer would try to contact them in person if they did not call in to MPR’s toll-free number by a specific date. The letter offered $75 for completing an interview, the same amount that was offered to wave-1 survey nonrespondents residing outside the state of Iowa. Seven of eight wave-1 nonrespondents who originally refused to participate in the wave-2 survey were assigned to field interviewers along with all other wave-1 survey
17Current interview status and address information was tracked using an Access database.
18In addition, wave-1 nonrespondents with whom we had made some contact but had not been able to complete an interview were sent a special mailing which included either Wal Mart or McDonalds gift certificates valued at $15 and offered $60 for completing the survey.

A-7
nonrespondents who had not yet completed wave-2 interviews; the eighth individual was not assigned to a field interviewer because of the nature of the refusal. Individuals assigned to a field interviewer were offered $100, payable by check, to complete the survey. The money was distributed by field interviewers when the interview was completed. Six of the seven who originally refused to participate and who were assigned to field interviewers eventually completed the survey. Overall, only three sample members—one wave-1 respondents and two wave-1 nonrespondents—refused to participate in the wave-2 survey.
D. SURVEY DATA PREPARATION
As each interview was completed, MPR supervisors reviewed it for completeness and consistency. Based on guidelines developed by MPR, interviewers called back respondents to obtain missing information or to clarify contradictory responses. Reviewers back-coded “other-specify” responses to prelisted choices where appropriate or assigned new codes if responses were common enough to warrant it. They also assigned numeric codes to open-ended questions.
After completed interviews were reviewed and coded, they were sent through the data entry
process. The data entry program was written to restrict entries to allowable ranges and to adhere to skip patterns in the survey instrument. The data were entered twice, each time by a different data entry operator, to verify the accuracy of the entries. After data entry was verified, a file of frequencies was produced and reviewed for inconsistencies and out-of-range data. Inconsistent data were reconciled on the basis of a review of the source data and, in some cases, through callbacks to sample members. The process culminated in a final data file for analysis.
E. SURVEY RESPONSE RATE
Interviews were completed with 397 of the 483 sample members for an 82 percent response rate. For wave-1 respondents, 343 interviews were completed for an 85 percent response rate; for wave-1 nonrespondents, 54 interviews were completed for a 69 percent response rate.

PAGE IS INTENTIONALLY LEFT BLANK TO ALLOW FOR DOUBLE-SIDED COPYING

APPENDIX B
RECALL ERROR IN THE WAVE-2 SURVEY

PAGE IS INTENTIONALLY LEFT BLANK TO ALLOW FOR DOUBLE-SIDED COPYING

B-3
Recall error is a function of the relationship between memory and the passage of time. It applies to situations in which an individual remembers or describes an event at a later point in time as different than it actually was at an earlier point in time. The retrospective questions included in the wave-2 survey ask respondents to think back to their circumstances at the time of the wave-1 survey—approximately one year ago—and, thus, introduce the possibility of recall error.
In Chapter IV, we use responses to the retrospective questions in the wave-2 survey to infer
how wave-1 nonrespondents would have responded to wave-1 questions if they had completed a wave-1 interview. This analysis, however, is only valid if wave-2 retrospective questions yield responses similar to the responses that wave-1 nonrespondents would have given to wave-1 questions. However, systematic recall error could lead to estimates that overstate or understate the prevalence of some outcomes one year after the families left TANF.
It is impossible to determine the extent of recall error among wave-1 nonrespondents
because there are no wave-1 responses with which to compare wave-2 responses. However, assuming that the rate of recall error is the same among all wave-2 respondents, regardless of whether they responded to the wave-1 survey, comparisons of wave-1 and wave-2 responses for sample members who responded to both waves (Group E) can provide insight into this issue.19 Indeed, recall error in the responses to wave-2 retrospective questions appears to bias the estimates for some outcome variables, as demonstrated by significant differences between average outcomes based on retrospective wave-2 questions and comparable wave-1 questions.20 Measures for which there is evidence of bias due to systematic recall error are excluded from the analyses in Chapter IV.
Systematic recall error in responses to wave-2 retrospective questions seems to generate
biased estimates for some employment-related measures (see Exhibit B.1 on page B-5). For full-time employment and some barriers to employment, the bias due to recall error is statistically significant.
Systematic recall error in responses to wave-2 retrospective questions also biases estimates
of income and income sources one year after leaving TANF. Receipt of child support was the only income-related measure for which the estimated bias was statistically insignificant. For all other income variables, respondents to both surveys tended to underreport income sources and income amounts in the wave-2 survey.
19There is no reason to believe that recall error would be different among wave-2
respondents who did and did not respond to wave-1 unless perhaps the repetition of wave-1 questions in the wave-2 survey made wave-1 respondents better prepared to accurately answer the wave-2 questions. This seems unlikely as the two surveys were administered one year apart.
20An example of a wave-2 retrospective question is “were you employed at this time last year?” The comparable wave-1 question is “are you currently employed?”

B-4
However, recall error in wave-2 does not seem to bias most estimates related to health insurance coverage and health problems one year after leaving TANF. The bias due to recall error is statistically significant for only two of nine measures—Medicaid participation and mental health problems. Respondents to both surveys tended to under-report their participation in Medicaid and over-report mental health problems in the wave-2 survey.
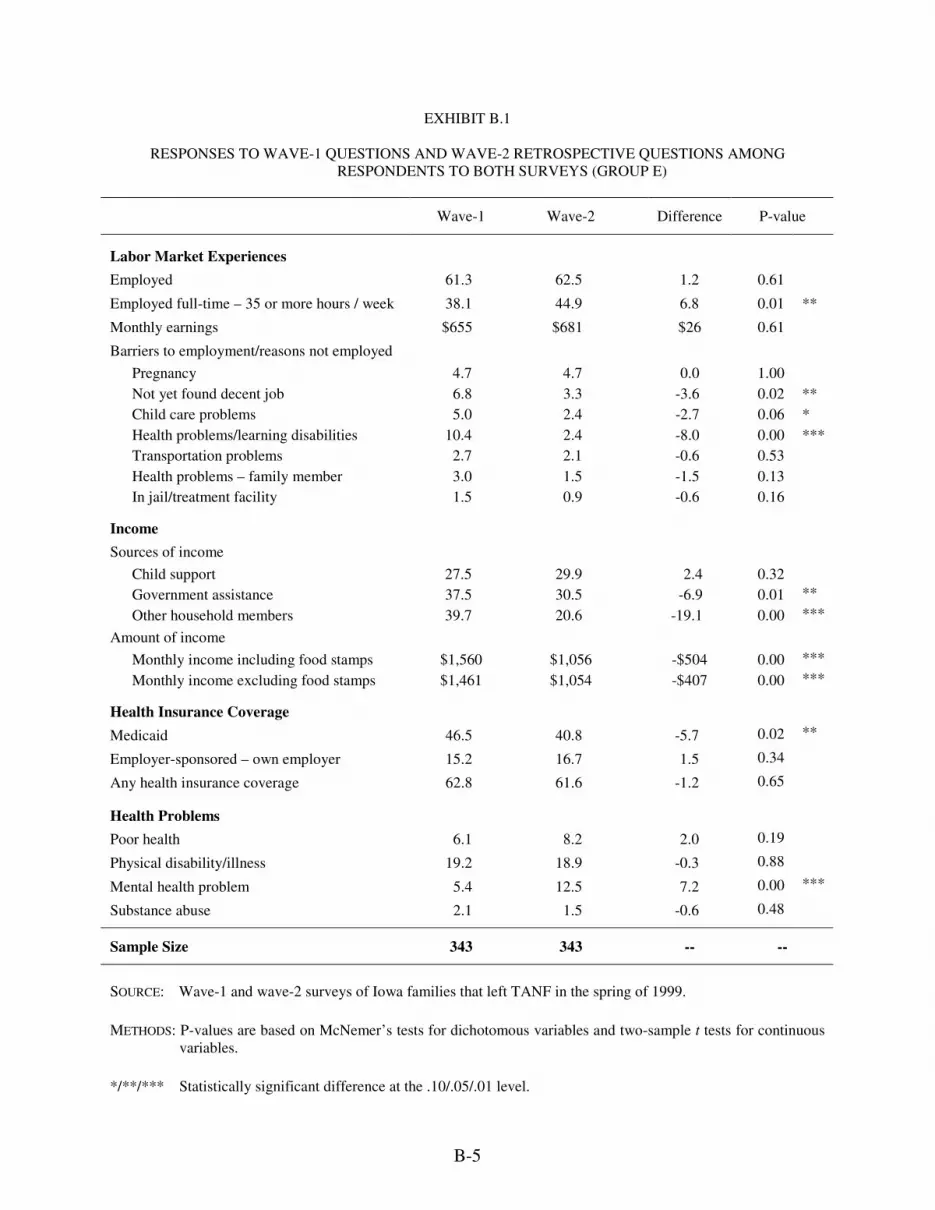
B-5
EXHIBIT B.1
RESPONSES TO WAVE-1 QUESTIONS AND WAVE-2 RETROSPECTIVE QUESTIONS AMONG RESPONDENTS TO BOTH SURVEYS (GROUP E)
Wave-1 Wave-2 Difference P-value
Labor Market Experiences
Employed 61.3 62.5 1.2 0.61
Employed full-time – 35 or more hours / week 38.1 44.9 6.8 0.01 **
Monthly earnings $655 $681 $26 0.61
Barriers to employment/reasons not employed
Pregnancy 4.7 4.7 0.0 1.00 Not yet found decent job 6.8 3.3 -3.6 0.02 ** Child care problems 5.0 2.4 -2.7 0.06 * Health problems/learning disabilities 10.4 2.4 -8.0 0.00 *** Transportation problems 2.7 2.1 -0.6 0.53 Health problems – family member 3.0 1.5 -1.5 0.13 In jail/treatment facility 1.5 0.9 -0.6 0.16
Income
Sources of income
Child support 27.5 29.9 2.4 0.32
Government assistance 37.5 30.5 -6.9 0.01 **
Other household members 39.7 20.6 -19.1 0.00 ***
Amount of income
Monthly income including food stamps $1,560 $1,056 -$504 0.00 ***
Monthly income excluding food stamps $1,461 $1,054 -$407 0.00 ***
Health Insurance Coverage
Medicaid 46.5 40.8 -5.7 0.02 **
Employer-sponsored – own employer 15.2 16.7 1.5 0.34
Any health insurance coverage 62.8 61.6 -1.2 0.65
Health Problems
Poor health 6.1 8.2 2.0 0.19
Physical disability/illness 19.2 18.9 -0.3 0.88
Mental health problem 5.4 12.5 7.2 0.00 ***
Substance abuse 2.1 1.5 -0.6 0.48
Sample Size 343 343 -- --
SOURCE: Wave-1 and wave-2 surveys of Iowa families that left TANF in the spring of 1999. METHODS: P-values are based on McNemer’s tests for dichotomous variables and two-sample t tests for continuous
variables.
*/**/*** Statistically significant difference at the .10/.05/.01 level.