Embed Size (px)
Citation preview
Introduction
Beyond Customer and EmployeeSatisfaction—The Ownership Quotient
Excerpted from
The Ownership Quotient:
Putting the Service Profit Chain to Work for Unbeatable Competitive Advantage
By
James L. Heskett, W. Earl Sasser, Joe Wheeler
Buy the book:Amazon
Barnes & NobleHarvardBusiness.org
Harvard Business PressBoston, Massachusetts
ISBN-13: 978-1-4221-6537-9
6538BC
This document is authorized for use only by JAIME ROMERO ([email protected]). Copying or posting is an infringement of copyright. Please contact [email protected] or 800-988-0886 for additional copies.

Copyright 2008 Harvard Business School Publishing CorporationAll rights reserved
Printed in the United States of America
This chapter was originally published as chapter 1 of The Ownership Quotient:Putting the Service Profit Chain to Work for Unbeatable Competitive Advantage,
copyright 2008 Harvard Business School Publishing Corporation.
No part of this publication may be reproduced, stored in or introduced into a retrieval system,or transmitted, in any form, or by any means (electronic, mechanical, photocopying,recording, or otherwise), without the prior permission of the publisher. Requests for
permission should be directed to [email protected], or mailed to Permissions,Harvard Business School Publishing, 60 Harvard Way, Boston, Massachusetts 02163.
You can purchase Harvard Business Press books at booksellers worldwide.You can order HarvardBusiness Press books and book chapters online at www.harvardbusiness.org/press,
or by calling 888-500-1016 or, outside the U.S. and Canada, 617-783-7410.
This document is authorized for use only by JAIME ROMERO ([email protected]). Copying or posting is an infringement of copyright. Please contact [email protected] or 800-988-0886 for additional copies.

1
1
Introduction
Lanham Napier is CEO of Rackspace
Hosting, based in San Antonio, Texas. Napier is obsessed with the develop-
ment of customer owners, even though he doesn’t use the term. His orga-
nization, which provides IT hosting services for its business customers,
makes surprisingly high profits in a commoditized business that many
regard as operating in the gritty backwater of the Internet.
Rackspace succeeds by carefully selecting its customers, providing them
with easy access to its customer-centered teams as well as personalized, fast
responses to their needs, and listening to and acting on their reactions and
suggestions. The results are impressive customer satisfaction and loyalty
levels, referral rates that account for a high proportion of Rackspace’s new
business, low marketing costs that help deliver relatively high margins, and
annual business growth rates of just under 60 percent from 2003 to 2007—
in spite of prices that can sometimes be higher than competitors’.
In the explanation we heard repeatedly from Rackspace executives,
“Customers act as if they own the company.” They show intense loyalty,
commitment, and engagement and even take responsibility for the suc-
cess of Rackspace’s business—the true mark of ownership. And as you
will see, none of this could have happened without a strong sense of
ownership among “Rackers,” the company’s term for its employees.
This document is authorized for use only by JAIME ROMERO ([email protected]). Copying or posting is an infringement of copyright. Please contact [email protected] or 800-988-0886 for additional copies.

2THE OWNERSHIP QUOT IENT
We explore the lessons from Rackspace and many other ownership-
oriented organizations throughout this book. But the bottom line is that
a customer who behaves like an owner is worth more than a hundred
typical price-sensitive customers over the customer owner’s lifetime with
your organization. Similarly, the lifetime value of an employee who can
promote customer ownership is priceless. And an organization that
learns how to cultivate an ownership attitude creates a self-reinforcing
relationship between customers and frontline employees.
A customer owner is one who tries a product or service, is so satisfied
that she returns to buy more, states a willingness to tell others of her
experiences, actually convinces others to buy, provides constructive criti-
cism of existing offerings, and even suggests or helps test new products
or ideas. Some customer owners even help select new employees.
Employee owners take satisfaction in creating value for customers.
They exhibit their sense of ownership through loyalty, referrals of other
high-potential employees to the organization, and suggestions for
improving the quality of processes and work life as well as the organiza-
tion’s overall effectiveness in serving customers. Employee owners are
the most important contributors to a company’s customer ownership
quotient—or OQ—which we define as the proportion of all customers
who are actively engaged in significant work on behalf of a product,
service, or brand. Similarly, the employee OQ is the proportion of all
employees who are so satisfied, loyal, and committed to the value offered
by the organization that they contribute ideas for further improvement
and help recruit high-potential friends to join the cause.
These descriptions use the term ownership not in a financial sense
but in the sense of commitment to shared values and desired out-
comes. But when companies learn to engineer ownership, everyone
also gains financially because a strong community of owners creates a
larger pie to divide among employees, customers, investors, and other
partners.
Who are these potential customer and employee owners? How can
you identify them? How can you expand their ranks and nurture their
This document is authorized for use only by JAIME ROMERO ([email protected]). Copying or posting is an infringement of copyright. Please contact [email protected] or 800-988-0886 for additional copies.

3Introduction
sense of ownership? How can you track the results of your efforts? Which
companies are leading the way, and what can the rest of us learn from
them? These are our concerns in this book. But first, a few words about
how we arrived at these questions and their answers.
ADVANCING THE CONCEPT OF THE SERVICE PROFIT CHAIN
Rackspace’s accomplishments exemplify the best of next-generation
thinking about the service profit chain, a set of insights that we have been
examining for more than twenty years. (For more on this, see “The
Service Profit Chain: A Two-Minute Primer.”) In its simplest form, the
service profit chain is about developing a working environment in which
carefully selected, highly capable, engaged employees interact with cus-
tomers to create customer value far superior to that offered by the
competition.
As a result of careful application of service profit chain thinking, cus-
tomers remain loyal (exhibiting high rates of retention), they buy more
(related sales), they tell others about their positive experience (providing
referrals), and they suggest ways of enhancing the customer experience
by complaining constructively, suggesting new products or services and
process improvements (research and development). These “four R’s” fuel
long-term profitability and organic growth. They also spawn new ideas
that lead directly to new business development that delivers the results
that customers really seek.
In formulating and refining these concepts originally, we learned a
great deal from a group of pioneering firms such as USAA, MBNA,
Intuit, and Southwest Airlines. They taught us the clear relationships that
exist between employee satisfaction and loyalty and customer satisfac-
tion and loyalty, as well as the impact that these factors can have on
growth and profitability. Although our original research partners didn’t
have a name for these phenomena, we came to regard them as forming a
service profit chain. Other academics, consultants, and business execu-
tives added to the evidence of the validity of the model. Some established
This document is authorized for use only by JAIME ROMERO ([email protected]). Copying or posting is an infringement of copyright. Please contact [email protected] or 800-988-0886 for additional copies.

4THE OWNERSHIP QUOT IENT
The Service Profit Chain: A Two-Minute Primer
When we introduced the service profit chain in the early 1990s, we described
seven fundamental propositions that formed the links in the chain:
1. Customer loyalty drives profitability and growth. A 5 percent increase in
customer loyalty can boost profits by 25 to 85 percent. The benefit of
retaining customers on average one more year has a significant impact on
the bottom line.
2. Customer satisfaction drives customer loyalty. This was a new idea in the
beginning, but now we find few organizations that are not focused on
driving improvement in their top-box customer satisfaction scores (the
highest ratings given by those surveyed) precisely for this reason.
3. Value drives customer satisfaction. Value—results plus process quality in
relation to total cost to the customer—is critical in creating satisfied
customers.
4. Employee capability (latitude within limits to deliver value to targeted
customers) and productivity drive value.
causal relationships—for example, that the chain is forged most logically
beginning with employees—whereas earlier, only correlations between
elements of the chain had been measured.1 Since then, hundreds of orga-
nizations around the world have used the service profit chain as a busi-
ness model for achieving improved performance. They now constitute a
laboratory for observation that we have studied for this book.
This time around we engaged a recent set of adopters (see “A Note
About the Research”) that were advancing the application of the service
profit chain as a performance and growth platform. It became clear to us
that some of these organizations, armed with sophisticated emerging
information technology, had taken our ideas further than any of us had
envisioned. They had, in a sense, developed more scientific ways of
This document is authorized for use only by JAIME ROMERO ([email protected]). Copying or posting is an infringement of copyright. Please contact [email protected] or 800-988-0886 for additional copies.

5Introduction
thinking about them. They were using powerful new techniques to
deliver value to employees and customers and, through them, to share-
holders as well.
Across the board, we found that these service profit chain leaders
have worked to align key components of their businesses—marketing,
operations, information, and human resources—into a single force,
dedicated to consistently exceeding their customers’ expectations at
critical moments of truth.2 They have created strategies, policies, and
practices that integrate logic and technology to support the people who
deliver value for customers. Most important, they have set out to create
a core of employees and customers that we have come to think of as
owners.
5. Employee loyalty drives productivity. Service profit chain leaders draw a
clear line of sight between the impact of lower turnover on the productivity
of the operating model. Having loyal employees also means that you spend
less money recruiting and training new employees, and in high-service
organizations those savings can be significant.
6. Quality of work life drives employee satisfaction and loyalty. Quality of
work life includes such things as the fairness of one’s boss, the chance
to work with “winners,” the opportunity for personal development, and
reasonable compensation. In addition, the capability (latitude within
limits) of frontline employees to produce results for valued customers
remains an essential driver of employee satisfaction, retention, and
productivity.
7. Value delivered (as perceived by customers) in relation to cost yields
long-term profit.
Note: For additional information about the service profit chain, see James L. Heskett, W. EarlSasser Jr., and Leonard A. Schlesinger, The Service Profit Chain (New York: The Free Press, 1997);and James L. Heskett et al., “Putting the Service Profit Chain to Work,” Harvard Business Review,March–April 1994.
This document is authorized for use only by JAIME ROMERO ([email protected]). Copying or posting is an infringement of copyright. Please contact [email protected] or 800-988-0886 for additional copies.

6THE OWNERSHIP QUOT IENT
BEYOND SATISFACTION AND LOYALTY: THE OWNERSHIP QUOTIENT
Every company that adopts the concepts of the service profit chain tries to
create the conditions that foster high rates of satisfaction and loyalty
among employees and customers. These are preconditions for ownership.
Figure 1-1 depicts what we call the ownership hierarchy. It shows that
owners are satisfied, loyal, and engaged or committed (willing to recom-
mend an organization or its products and services to others). Beyond
A Note About the Research
We began by conducting an extensive literature search of research and case
studies that tested and demonstrated the impact of the service profit chain over
the past fifteen years. This work included revisiting case studies we had written
on organizations such as the New York Police Department and ING Direct, but for
the most part, we decided not to revisit organizations such as USAA and
Southwest Airlines, about which we have written extensively elsewhere. We then
selected a core sample of companies that had been recognized for accomplish-
ments such as high customer satisfaction, best places to work, or significant
market share, assuming that these were organizations that could demonstrate
best practice on two or more links in the service profit chain. To these we added
several other companies about which we learned, in some cases through direct
interviews, during our study:
For more information on this research, please visit our Web site at www.ownershipquotient.com.
Baptist Health Care Build-A-Bear Workshop®
Fairmont Hotels & Resorts Harrah’s Entertainment
ING Direct Irving Oil Ltd.
PrairieStone Pharmacy Rackspace Hosting
SAS Victoria’s Secret
Wegmans Food Markets EMC
This document is authorized for use only by JAIME ROMERO ([email protected]). Copying or posting is an infringement of copyright. Please contact [email protected] or 800-988-0886 for additional copies.

7Introduction
Ownership
Apostle-likeviral behaviors
Commitment
Loyalty
Satisfaction
Trial
Awareness and curiosity
Employee ownership
Offering ideas about how to improveprocesses
Recruiting potential new employees
Testing, recommending newproducts and services
Customer ownership
Offering constructive complaints
Recruiting new customers
Testing, recommending newproducts and services
F IGURE 1 -1
The ownership hierarchy (for employees and customers)
that, they act as apostles, recruiting new customers and employees.
As customers, they are in frequent contact with the company, construc-
tively complaining or suggesting improvements in products, processes,
or services. They help in testing new products or services. They may, at
times, be a pain in the neck, but they may also be the source of useful new
product ideas.
Measurable indicators that your organization has a high customer
OQ go beyond high customer curiosity, satisfaction, loyalty, and com-
mitment to highlight such things as:
• A high proportion of new customers resulting from referrals
• A significant proportion of new or improved products resulting
from customer suggestions and constructive criticism
This document is authorized for use only by JAIME ROMERO ([email protected]). Copying or posting is an infringement of copyright. Please contact [email protected] or 800-988-0886 for additional copies.

8THE OWNERSHIP QUOT IENT
• A high degree of customer willingness to test new products and
processes
The ultimate measure of ownership is the proportion of your cus-
tomers actively engaged in significant work on behalf of the product,
service, or brand. You can determine this by asking them whether the
following apply.
• They have made referrals to potential customers.
• Those referrals were successful.
• They have helped test a product or service.
• They have provided constructive complaints regarding existing
products or services.
• They have suggested process, product, or service improvements.
The core number of customer owners need not be large. Companies
with ownership quotients as small as 3 percent have achieved significant
success. But the greater the ownership quotient, the higher the probabil-
ity that your organization will distance itself from its competition, in
extreme examples literally changing the rules of the game for entire
industries, as companies such as Toyota, eBay, Intuit, Southwest Airlines,
and Amazon.com have done.
The primary driver of customer ownership is the employee ownership
quotient. It is measured by determining the proportion of employees who
have in, say, the past year, done any of the following:
• Succeeded in persuading a friend or acquaintance to apply for
work at the organization
• In some way constructively criticized the ways things are done
• Offered a suggestion for a process change or product improvement
• Volunteered to test new processes or products
This document is authorized for use only by JAIME ROMERO ([email protected]). Copying or posting is an infringement of copyright. Please contact [email protected] or 800-988-0886 for additional copies.

9Introduction
Another measure of the employee OQ is the proportion of applicants or
new hires that results from employee recommendations
Because it takes a significant, sustained effort from all employees—but
especially those in direct contact with customers—the employee OQ must
be several times that of the customer OQ you wish to sustain. In fact, the
ideal target level for the employee OQ should approach 100 percent.
A high employee OQ enhances value for customers through increased
retention and continuity in customer relations. It also dramatically
reduces the costs of hiring, training, and lost productivity from turnover.
It helps explain why service organizations such as Rackspace and Harrah’s
Entertainment deliver high value for customers at relatively modest costs.
BUILDING THE OQ: HARRAH’S ENTERTAINMENT
Perhaps the most advanced of our research sites in engineering owner-
ship is Harrah’s Entertainment, the Las Vegas-based gaming empire that
includes Harrah’s, Golden Horseshoe, and Caesars Palace. The com-
pany’s remarkable database yields astonishing results that underscore the
importance of the ownership quotient. But it took a concerted effort to
push Harrah’s beyond the original benefits of the service profit chain.
Let’s explore a bit of that history.
In 1987, Laughlin, Nevada, appeared to be the ideal location to open
a new Harrah’s casino and resort hotel. A resort town in the southern-
most tip of Nevada, Laughlin had transformed a piece of the rugged
Mojave Desert into a fast-growing tourist destination. By the late 1990s,
revenues at Harrah’s Laughlin had grown, and its customer satisfaction
scores were the envy of the rest of the company. Life in Laughlin was
good—until things changed.
By 1999, Laughlin began to face stiff competition from Native Amer-
ican gaming in Southern California and Arizona. Although revenues had
not fallen off, they had flattened considerably from previous years. Mir-
roring the revenue performance, customer satisfaction scores also had
leveled off, triggering a falloff in bonuses keyed to improvement in the
This document is authorized for use only by JAIME ROMERO ([email protected]). Copying or posting is an infringement of copyright. Please contact [email protected] or 800-988-0886 for additional copies.
10THE OWNERSHIP QUOT IENT
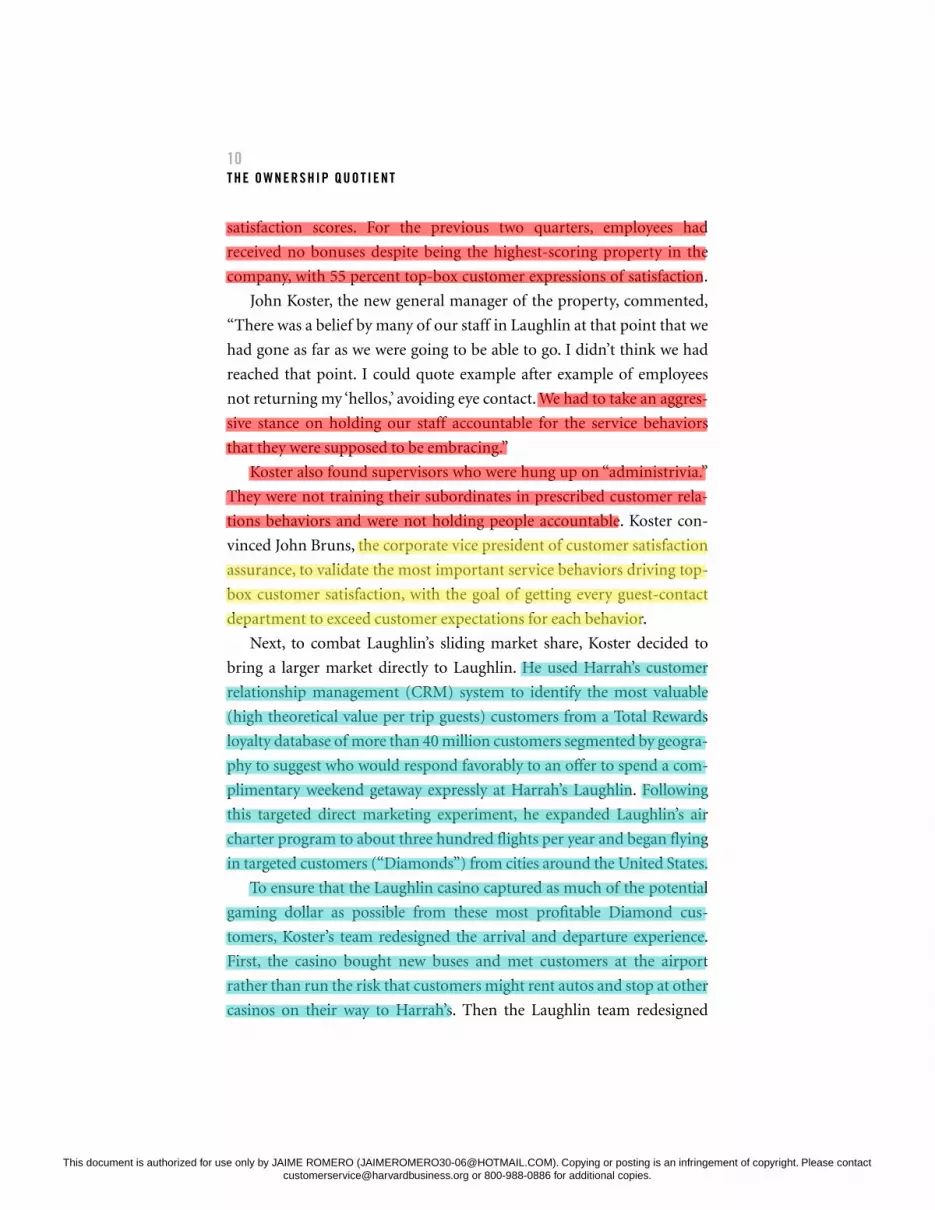
satisfaction scores. For the previous two quarters, employees had
received no bonuses despite being the highest-scoring property in the
company, with 55 percent top-box customer expressions of satisfaction.
John Koster, the new general manager of the property, commented,
“There was a belief by many of our staff in Laughlin at that point that we
had gone as far as we were going to be able to go. I didn’t think we had
reached that point. I could quote example after example of employees
not returning my ‘hellos,’ avoiding eye contact. We had to take an aggres-
sive stance on holding our staff accountable for the service behaviors
that they were supposed to be embracing.”
Koster also found supervisors who were hung up on “administrivia.”
They were not training their subordinates in prescribed customer rela-
tions behaviors and were not holding people accountable. Koster con-
vinced John Bruns, the corporate vice president of customer satisfaction
assurance, to validate the most important service behaviors driving top-
box customer satisfaction, with the goal of getting every guest-contact
department to exceed customer expectations for each behavior.
Next, to combat Laughlin’s sliding market share, Koster decided to
bring a larger market directly to Laughlin. He used Harrah’s customer
relationship management (CRM) system to identify the most valuable
(high theoretical value per trip guests) customers from a Total Rewards
loyalty database of more than 40 million customers segmented by geogra-
phy to suggest who would respond favorably to an offer to spend a com-
plimentary weekend getaway expressly at Harrah’s Laughlin. Following
this targeted direct marketing experiment, he expanded Laughlin’s air
charter program to about three hundred flights per year and began flying
in targeted customers (“Diamonds”) from cities around the United States.
To ensure that the Laughlin casino captured as much of the potential
gaming dollar as possible from these most profitable Diamond cus-
tomers, Koster’s team redesigned the arrival and departure experience.
First, the casino bought new buses and met customers at the airport
rather than run the risk that customers might rent autos and stop at other
casinos on their way to Harrah’s. Then the Laughlin team redesigned
This document is authorized for use only by JAIME ROMERO ([email protected]). Copying or posting is an infringement of copyright. Please contact [email protected] or 800-988-0886 for additional copies.

11Introduction
processes for interacting with guests. After being welcomed and engaged
by the bus driver, customers watch an information video en route to the
casino. As the bus pulls into the property, guests encounter a party atmo-
sphere day or night, including music, drinks, and an opportunity to have
a picture taken with a showgirl. To banish the need for customers to wait
at the registration counter, their room key packets are ready upon arrival.
Koster reports on the impact of these changes: “You would see many
tired travelers suddenly perk up and get in the spirit of a true vacation.
Instead of heading to bed they headed to the restaurants, bars, and
casino to enjoy themselves.”
At the casino, Harrah’s data-driven program delivers customized
service at each of several touch points. For example, when a Diamond
customer on slot machine 387 signals for service, a Harrah’s associate is
able to ask, “The usual, Mr. Smith?” and then track the time it takes for
a server to fill Mr. Smith’s request. It’s the kind of individual attention
the customer can’t get at the casino across the street. At the end of
Mr. Smith’s memorable experience, he receives photographs of his
arrival as a trip memento.
Not content with those improvements, management continued
training Laughlin’s frontline associates to reinforce the five service
behaviors most important to customer delight: friendly greeting, smiling
and eye contact, upbeat and positive attitude, checking for guest satisfac-
tion, and a warm farewell. Managers also focused on reducing or elimi-
nating the wait time for Diamond customers during specific parts of the
experience, such as dining, valet parking, and the cashier station.
After twenty-one months without improvement in top-box scores,
the fourth quarter of 2003 saw employees begin to meet their targets
again. They increased the satisfaction score to 57.2 percent. After finish-
ing all of the training, in the second quarter of 2004 they broke the
60 percent barrier, something no other Harrah’s property had ever done.
During the next quarter they improved to 62 percent, and in the last
quarter of 2004 they achieved 64.2 percent. In addition, associates were
removed (or removed themselves) from customer-facing roles in which
This document is authorized for use only by JAIME ROMERO ([email protected]). Copying or posting is an infringement of copyright. Please contact [email protected] or 800-988-0886 for additional copies.
12THE OWNERSHIP QUOT IENT
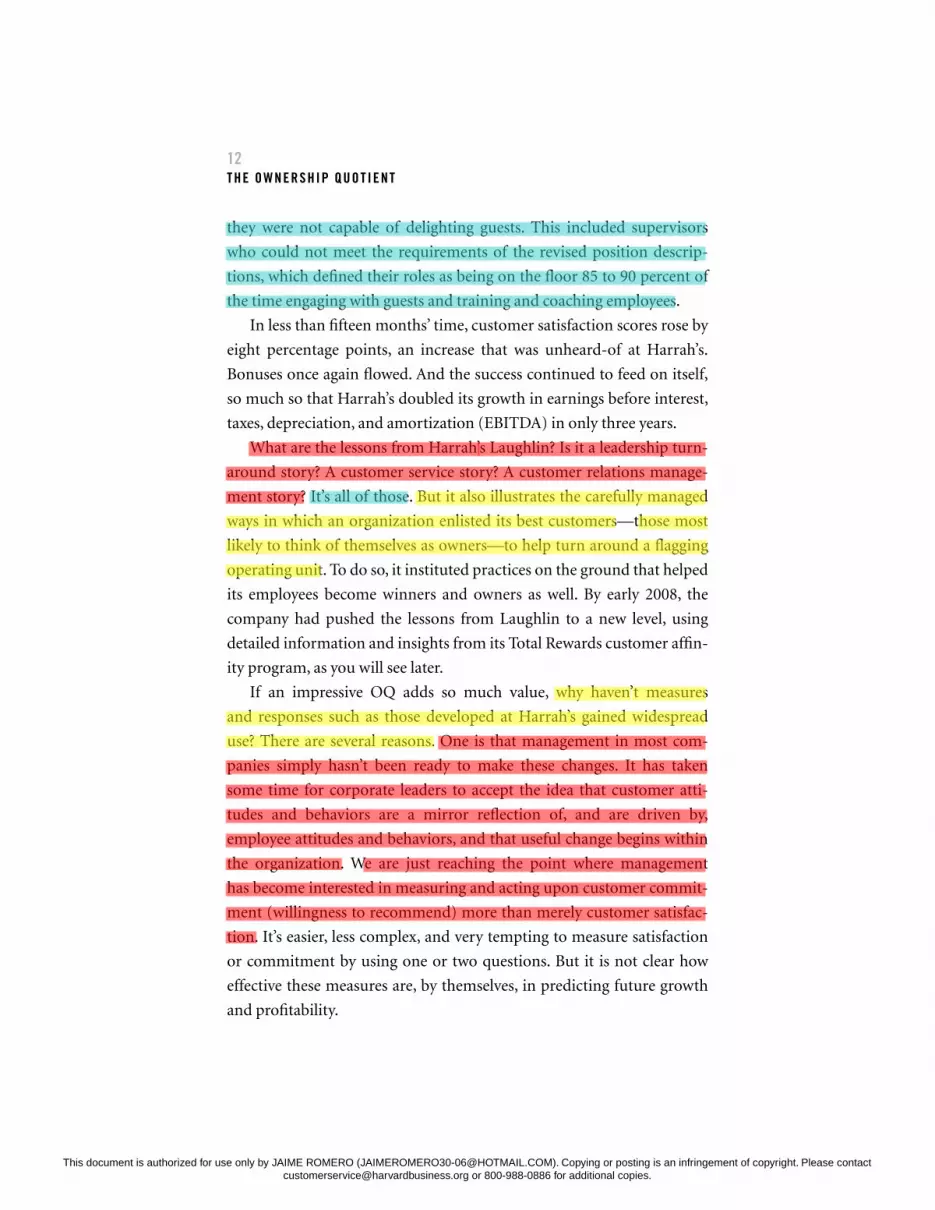
they were not capable of delighting guests. This included supervisors
who could not meet the requirements of the revised position descrip-
tions, which defined their roles as being on the floor 85 to 90 percent of
the time engaging with guests and training and coaching employees.
In less than fifteen months’ time, customer satisfaction scores rose by
eight percentage points, an increase that was unheard-of at Harrah’s.
Bonuses once again flowed. And the success continued to feed on itself,
so much so that Harrah’s doubled its growth in earnings before interest,
taxes, depreciation, and amortization (EBITDA) in only three years.
What are the lessons from Harrah’s Laughlin? Is it a leadership turn-
around story? A customer service story? A customer relations manage-
ment story? It’s all of those. But it also illustrates the carefully managed
ways in which an organization enlisted its best customers—those most
likely to think of themselves as owners—to help turn around a flagging
operating unit. To do so, it instituted practices on the ground that helped
its employees become winners and owners as well. By early 2008, the
company had pushed the lessons from Laughlin to a new level, using
detailed information and insights from its Total Rewards customer affin-
ity program, as you will see later.
If an impressive OQ adds so much value, why haven’t measures
and responses such as those developed at Harrah’s gained widespread
use? There are several reasons. One is that management in most com-
panies simply hasn’t been ready to make these changes. It has taken
some time for corporate leaders to accept the idea that customer atti-
tudes and behaviors are a mirror reflection of, and are driven by,
employee attitudes and behaviors, and that useful change begins within
the organization. We are just reaching the point where management
has become interested in measuring and acting upon customer commit-
ment (willingness to recommend) more than merely customer satisfac-
tion. It’s easier, less complex, and very tempting to measure satisfaction
or commitment by using one or two questions. But it is not clear how
effective these measures are, by themselves, in predicting future growth
and profitability.
This document is authorized for use only by JAIME ROMERO ([email protected]). Copying or posting is an infringement of copyright. Please contact [email protected] or 800-988-0886 for additional copies.

13Introduction
Technology—particularly in assembling, mining, storing, and com-
municating information—makes it eminently possible to measure the
OQ of customers and employees, link it to long-term performance, and
then carry out the experiments and activities that will increase OQ value
over time—to the delight of employees, customers, and investors alike.
How many owners does your organization have? What proportion of
the total do they represent? How do you know? What are you doing to
develop the cadre of owners?
THE PLAN OF THIS BOOK
Seasoned service profit chain leaders such as Harrah’s view their OQ-
building efforts as closer to a science than a craft. Think of the OQ as
both a measure of the effectiveness of policies and practices that enhance
value for customers and employees and a predictor of future organiza-
tional performance. In the chapters that follow we’ll concentrate on
selected policies, practices, and measures employed by organizations
likely to be found at the head of rankings in both customer satisfaction
and as good places to work. Our purpose is to help you find your own
combination of ingredients that will work best for your organization. In
the chapters that follow, we’ll help you see how you can do just that.
Increasing your ownership quotients starts with developing a strat-
egy that delivers differentiated, customized value to customers and
employees, our concern in chapter 2. For example, the management of
ING Direct, the world’s fastest-growing thrift organization, has designed
experiences based on a vision that provides compelling value for its tar-
geted customers and employees. At the core is an intent and capability to
deliver customer and employee experiences that exceed expectations at
critical moments of truth that each truly values. These expectations are
centered on results (rather than products or services) and provide a focal
point for everything from business definition to policies and practices to
growth through business development that extends and enhances the
value you deliver.
This document is authorized for use only by JAIME ROMERO ([email protected]). Copying or posting is an infringement of copyright. Please contact [email protected] or 800-988-0886 for additional copies.

14THE OWNERSHIP QUOT IENT
Chapter 3 explores how to leverage value over cost. Customized
offerings often carry a higher value for customers, but they don’t need to
cost more. That’s where value levers come in. They take many forms. For
example, at PrairieStone Pharmacy, an innovative chain of retail pharma-
cies, levers range from the redefinition of the job of pharmacist to unique
applications of technology. Rackspace Hosting achieves leverage through
its unique customer-centered, team-based organization and distinctive
Racker culture, all supported by a common technological base.
Chapter 4 helps you think about how you can put customers to work.
Many customers are more than happy to put themselves to work for their
favorite brands. A company that invites customers to help create the kinds
of value they desire is offering them the opportunity to control some
aspects of their purchase. With that control comes the chance to customize
the aspects they value most, and with that chance comes an expanded
sense of ownership. From involving hernia patients in their own recovery
at Toronto’s Shouldice Hospital to creating an online community for fre-
quent business travelers at InterContinental Hotels, the possibilities for
putting customers to work are limited only by the imagination.
Chapter 5, “Boost Your Employee OQ,” discusses the ways you can
foster value and a sense of ownership for employees. Your customer OQ
is a function of your employee OQ. Beyond satisfaction, loyalty, and
commitment, employee owners experience real pleasure in their ability
to deliver value for customers. They offer suggestions for improving the
business and making it a better place to work, and they identify and
recruit other high-potential employees.
How do you boost the sense of ownership for employees? The com-
panies in our sample do so by learning to create the kinds of value that
matter most to employees. Not surprisingly, financial compensation rep-
resents only one aspect of the value employees seek. Recognizing this,
companies such as Baptist Health Care, Fairmont Hotels & Resorts,
Wegmans Food Markets, and SAS create what we call a cycle of capability:
a self-reinforcing set of activities that helps employees feel like winners
when they deliver winning results for customers.
This document is authorized for use only by JAIME ROMERO ([email protected]). Copying or posting is an infringement of copyright. Please contact [email protected] or 800-988-0886 for additional copies.

15Introduction
Chapter 6,“Engineer Ownership Through Anticipatory Management,”
describes how Harrah’s Entertainment, Build-A-Bear Workshop, and
other organizations are taking the concepts of the service profit chain to a
new level. Business literature is filled with reports of companies investing
heavily in CRM, data warehousing, direct marketing, supply chain man-
agement, and other enterprise-wide systems to improve almost any busi-
ness metric one can imagine. Your own organization may have
implemented some of them or may be considering such efforts. But true
customer delight often results from the creation of “one enterprise” cen-
tered on employees and customers, operating from a common base of
extensive information about customer behaviors and organization capa-
bilities, with functions working side by side and encouraged by multifunc-
tional team incentives to achieve coordinated solutions. The goal is to
address employee and customer needs before they arise—a kind of antici-
patory management—rather than merely react to them.
Chapter 7, “Build a Strong and Adaptive Ownership Culture,”
explores how leading service organizations are doing just that. Baptist
Health Care, Irving Oil, and SAS, among others, are developing much
more than a loyal customer base. They are enlisting a community of
owners among employees, customers, and suppliers from which they
endeavor to obtain customer referrals, constructive complaints, and sug-
gestions for new products and services as well as ways to help improve
the business. These organizations know the power of creating such an
ownership culture and community. They know how little it costs to do
so. And they recognize the value of their investments in sustaining the
gains in profit and growth. Finally, in chapter 8 we examine what it takes
to sustain your success as an organization that fosters ownership.
Google, the company Fortune magazine recently identified as the best
place to work in the United States, offers an inspiring example of man-
agement practices that engage employee and customer owners to help
create the value that both groups desire. But can Google sustain its suc-
cess? And can the OQ work for companies in less glamorous industries,
even those that risk commoditization of the products and services they
This document is authorized for use only by JAIME ROMERO ([email protected]). Copying or posting is an infringement of copyright. Please contact [email protected] or 800-988-0886 for additional copies.

16THE OWNERSHIP QUOT IENT
deliver? Cemex, the best-in-Mexico producer of cement and related
products, thinks it can. So does Lanham Napier at Rackspace Hosting—
and so do we. We’ll tell you how and why we’ve come to believe in the
power of the philosophy represented by the ownership quotient.
THE PAYOFF
None of the managers we studied would have shown much interest in
these ideas if they were merely theoretical. Lanham Napier is a believer,
not a theorist. He has estimated that a Rackspace customer exhibiting
ownership behaviors is worth at least a hundred who don’t. He and his
team turned around his company in a very difficult industry by building
a strategy centered on these ideas, as we will see later.
At Fairmont Hotels & Resorts, management has studied the relation-
ship between employee engagement and quality of service and found
that hotels with the highest employee engagement scores also have the
highest guest service scores (as measured by J.D. Power surveys and
Richey International benchmarking standards audits).The correlations
between the two measures provide evidence that its straighforward oper-
ating philosophy, “We believe that talented and engaged Colleagues will
provide memorable service and create Guest loyalty which in-turn drives
profitability and long-term sustainability,” is working.3
Fairmont’s Employee Engagement Survey uses three indices to mea-
sure employee ownership: a Rational Index, an Emotional Index, and a
Leadership Index. Their 2007 study revealed that all three of these
engagement indices correlate to high service scores—and most interest-
ingly, the Emotional Index has the strongest correlation of the three. The
Emotional Index is made up of several survey items that examine how
employees feel about various aspects of work including factors such as
shared values, commitment to the organization, motivational energy,
contribution to organizational success, and leadership effectiveness. It
measures the “heart” and the “will” of Fairmont employees that is so
critical to creating an emotional connection with their guests. Carolyn
This document is authorized for use only by JAIME ROMERO ([email protected]). Copying or posting is an infringement of copyright. Please contact [email protected] or 800-988-0886 for additional copies.

17Introduction
Clark, senior vice president of human resources, told us, “We believe the
emotional engagement of our Colleagues and our ‘warm and engaging’
style of service is one of the things that truly defines the Fairmont guest
experience, setting us apart from the competition and helping us achieve
our mission of ‘turning moments into memories for our guests’” with
higher guest satisfaction and thus provides the greatest opportunity for
increasing service scores.4 More specifically, hotels in the top 10 percent
on their Emotional Index score demonstrated a 12 percent improvement
in their Richey score—and better results in terms of revenue and
profitability.5
The results at Harrah’s Entertainment provide further dramatic evi-
dence of the power of customer and employee ownership and the
importance of developing and tracking it. We were particularly inter-
ested in Harrah’s Entertainment because of its extensive customer data-
base, by which it is able to estimate the potential lifetime value of
millions of individual customers. Diamond, Platinum, and Gold cus-
tomers have prospective lifetime values of $100,000, $20,000, and
$2,000, respectively. Harrah’s recently added a new category, Seven Star,
for those total reward members with a yearly value of $50,000 or more.
In early 2008, when we posed questions designed to measure Harrah’s
OQ to a sample of each of these groups (overall, roughly forty-five
hundred customers at all three gaming properties—Harrah’s, Horseshoe,
and Caesars), we found remarkable results.
Seven Star and Diamond customers, although registering roughly the
same “willingness to recommend” levels as Gold customers, actually had
made 20 percent more recommendations to friends to visit Harrah’s
properties than Gold customers during the preceding year.6 Further,
their recommendations were more effective, resulting in 32 percent
more recruits, with an estimated total lifetime value 73 percent greater
than those recruited by Gold customers.
The comparisons didn’t stop there. Seven Star and Diamond cus-
tomers offered more than twice as many suggestions for service improve-
ments as Gold customers did. They were 16 percent more willing than
This document is authorized for use only by JAIME ROMERO ([email protected]). Copying or posting is an infringement of copyright. Please contact [email protected] or 800-988-0886 for additional copies.

18THE OWNERSHIP QUOT IENT
Gold customers to attend a gathering organized by Harrah’s to identify
new service ideas. And they were 39 percent more willing to help Harrah’s
select new frontline service employees.
As defined by Harrah’s management, Seven Star and Diamond cus-
tomers have lifetime values at least fifty times those of Gold customers.
Perhaps most remarkable of all, we found that as a group the Seven Star
and Diamond customers attracted, in only the twelve months preceding
the study, a new group of customers whose aggregate lifetime value is
greater than their own. And that figure includes only those new recruits
that Harrah’s was able to identify. It helps explain why only the 8 percent
of Harrah’s customers who behave like owners (comprising its customer
OQ) have a profound impact on its profits.
None of this would have been possible without a high rate of owner-
ship among Harrah’s employees. We found, in a companion survey, that
54 percent of employees had recommended Harrah’s as a place to work
to two or more of their friends.
Does the ownership quotient pay off? You be the judge. In late 2006,
Harrah’s board of directors accepted an offer from two private equity
firms to acquire the company for a price representing a threefold
increase in enterprise value over a five-year period.
If Harrah’s and other high-OQ organizations have found new ways to
enhance their performance through the service profit chain—and we’re
convinced that they have—then other organizations can learn from their
example. Let us turn now to what we see as the first step: building owner-
ship into the strategic value vision.
This document is authorized for use only by JAIME ROMERO ([email protected]). Copying or posting is an infringement of copyright. Please contact [email protected] or 800-988-0886 for additional copies.

NOTES
Chapter 1
1. See, for example, David H. Maister, Practice What You Preach: WhatManagers Must Do to Create a High Achievement Culture (New York: The FreePress, 2001).
2. Jan Carlson, Moments of Truth (Cambridge, MA: Ballinger PublishingCompany, 1987).
3. Carolyn Clark, Fairmont Hotels & Resorts 2008 HR ConferencePresentation.
4. Interview with Carolyn Clark, November 2006, Toronto.5. Ibid.6. As measured by net promoter score as well as other measures. Intro-
duced in a 2003 article in Harvard Business Review, the concept is discussed atlength in Fred Reichheld, The Ultimate Question: Driving Good Profits and TrueGrowth (Boston: Harvard Business School Publishing, 2006). To calculate thenet promoter score, you take the responses, on a scale of 1 to 10, to the question,“How likely is it that you would recommend us to a friend or colleague?” Yousubtract the percentage of 0–6 scores from the percentage of 9 and 10 scores toproduce the net promoter score.
19
This document is authorized for use only by JAIME ROMERO ([email protected]). Copying or posting is an infringement of copyright. Please contact [email protected] or 800-988-0886 for additional copies.


