Embed Size (px)
Citation preview

ECONOMIC SURVEY OF DELHI, 2017-18 1
CHAPTER – 1INTRODUCTION
Delhi is the capital of India. Through most of its history, Delhi has served as a capital of var-ious kingdoms and empires. Delhi is located at 28.61°N 77.23°E, and lies in Northern India. It borders the Indian states of Haryana on the north, west and south and Uttar Pradesh (UP) to the east. Two prominent features of the geography of Delhi are the Yamuna flood plains and the Delhi ridge. The Yamuna, a sacred river in Hinduism, is the only major river flowing through Delhi. The River Yamuna, separates Ghaziabad from the eastern part of Delhi. The Delhi ridge originates from the Aravalli Range in the south and encircles the west, north-east and north-west parts of the city.
2. The National Capital Territory of Delhi covers an area of 1,483 km2, of which 1114 km2 is designated as urban, and 369 km2 as rural. It has a length of 51.9 km and a width of 48.48 km. At its largest extent, there is a population of about 1.68 crore residents as per census 2011. Set on the both sides of River Yamuna, Delhi is seen as one of the fastest growing cities in India. The city reflects two sides of a same coin i.e. Old Delhi and New Delhi. New Delhi is a reflection of modern India with having VVIPs buildings, offices and diplomat zones whereas Old Delhi gives an incredible picture of traditional and historical values of India. Delhi has a mixed culture as people of all communities and religions live here. However, English, Hindi, Urdu and Punjabi are the key languages spoken in the city. Delhi is the largest commercial centre in northern India. The city has robust growth of infra-structure and economic growth during the last several years.
3. The 69th constitutional amendment is a milestone in Delhi’s history. In 1991, Delhi was de-clared as the National Capital Territory by the Government of National Capital Territory of Delhi Act, 1991. Delhi has a complex administrative structure having dual jurisdiction i.e. of the Union Government and the State Government. There are 11 Districts and 33 Sub Divi-sions in Delhi. As per census 2011, there are 110 census towns and 112 villages in NCT of Delhi. The Delhi metropolitan area lies within the National Capital Territory of Delhi (NCT), which has five local municipal corporations; North Delhi Municipal Corporation, South Delhi Municipal Corporation, East Delhi Municipal Corporation, New Delhi Municipal Council and Delhi Cantonment Board (DCB). The former single MCD serving 95% of the area of Delhi with 98% of total population got trifurcated in 2012 for better delivery of services to the pub-lic into three smaller Municipal Corporations i.e. North DMC, South DMC and East DMC. The Municipal corporations handle civic administration for the city.
DEMOGRAPHIC PROFILE4. Total area of the NCT of Delhi is 1483 square kilometer. With the rapid pace of urbanization,
rural population and area is continuously decreasing as confirmed by successive Census Reports. Delhi’s rural population has decreased from 9.49 lakh in 1991 lakh, to 4.19 lakh in 2011. This pace of urbanization has reduced the number of rural villages in Delhi from 300 in 1961 to 165 in 2001 and 112 in 2011. The number of urbanized villages has increased from 20 in 1961 to 135 in 2011. The number of census towns has increased from 3 in 1971 to 29 in 1991 and 110 in 2011. More than 97 per cent of the population was in urban areas in 2011 as compared to 53 per cent in 1901. This clearly indicates fast growth of urbanization in the national capital.
5. For the first time since 1951, the decadal growth rate of population in the NCT of Delhi has declined and recorded at 21.2 percent in 2011 as compared 47.02 percent in 2001. This is

ECONOMIC SURVEY OF DELHI, 2017-182
a peculiar feature of Census 2011 of Delhi as in all Census since 1951, the decadal growth rate of population was more than 50% except in 2001 when it was 47%. The rapid increases in population has raised density of population from 6352 persons per square kilometer in 1991 to 9340 persons per square kilometer in 2001 and to 11320 persons per square kilo-meter in 2011.
6. As per 2011 census, the density of population in Delhi worked out at 11320 persons per square kilometer as against the national level of 382 persons per square kilometer. Density of population in Delhi was the highest among all States and Union Territories during the year 2011.
STATE DOMESTIC PRODUCT
7. Delhi is the prosperous state with the second highest per capita income in India. The aver-age per capita income of Delhi remained more than 2.5 lakh in three consecutive years i.e. 2015-16, 2016-17 & 2017-18. Delhi’s per capita income was almost three times of the national average, both at current and constant prices. The per capita income of Delhi at cur-rent prices reached at the level of 300793 in 2016-17 as compared to 271305 in 2015-16 and 249635 in 2014-15. The advance estimate of per capita income of Delhi at current prices during 2017-18 estimated at 329093.
8. Gross State Domestic Product of Delhi (GSDP) at constant prices recorded at 474058 crore, during 2015-16 showed a growth of 10.53 % over the preceding year. The GSDP of Delhi at constant prices increased to 514871 crore during 2016-17 indicating a growth of 8.61 %. The advance estimate of GSDP of Delhi at constant prices during 2017-18 was recorded at 556800 crore at a growth of 8.14 % over 2016-17.
9. Delhi’s economy has a predominant service sector with its share of contribution to GSVA followed by contribution of secondary and Agriculture sectors. More than 80 per cent of in-come of Delhi was from service sector, about 12 per cent from secondary sector and about 2 per cent from the primary sector. The tertiary sector plays a pivotal role in the State econ-omy both in terms of employment generation and contribution to State Income.
PUBLIC FINANCE
10. Delhi Government’s Revenue Receipts consist of Tax Revenue, Non-Tax Revenue and Grants-in-Aid from the Centre. The Tax Revenue covers the receipts under SGST/Value Added Tax (VAT), Stamps and Registration Fees, State Excise and Motor Vehicle Tax. These taxes together account for 91% of the state government’s total revenue receipts. All components in the tax revenue showed a higher growth during 2017-18 (BE) except for other taxes on goods & services which show a lesser growth of 9.66% as compared to 12.70% in 2016-17. Tax Collection of Delhi Government targeted a growth of 19.33 per cent in 2017-18 (BE) as compared to actual growth of 3.03 per cent in 2016-17 (Prov.)On the other hand, its Non Tax Revenue mainly comprises Interest Receipts, Dividend and Profit from investments and Service Charges/Fees/Fines etc. from various Government Depart-ments and various public sector undertakings.
11. Delhi Legislative Assembly passed the State Goods and Services Act on 31st May 2017 and thus GST rolled out in Delhi w.e.f 01-07-2017. As a result, erstwhile VAT (excluding items like petroleum, liquor etc) & other taxes viz Entertainment tax, Luxury Tax and Cable TV tax subsumed in GST. Trade & Tax Department, GNCTD made all efforts for smooth migration of all existing VAT dealers in new regime of Goods & Services Tax. Around 75.23% existing VAT dealers have migrated to GST up to 29-12-2017.

ECONOMIC SURVEY OF DELHI, 2017-18 3
12. The state government had an outstanding debt of 25338.96 crore in 2007-08, equaling 16.04 percent of its GSDP. In 2016-17, the outstanding debt had increased to 33344.90 crore and the Debt: GSDP ratio had declined substantially to 5.41%. The ratio of interest payment to revenue receipts also got reduced to 8.39% 2016-17 from the high of 16.79% in 2007-08. This clearly indicates that the debt problem is well under the control of the state government. Delhi Government has received Small Saving Loan of 1695.53 crore in 2016-17 as against 2241.13 crore received in 2015-16.
13. Delhi has maintained its consistent Revenue Surplus which was 5044 crore in 2016-17 (Prov.) as compared to 8656 crore in 2015-16. Delhi’s revenue surplus was 1.58% of GSDP in 2016-17 which is reduced to 0.82% in 2017-18 (BE).
14. Like earlier Central Finance Commissions, Delhi has not been covered under the recom-mendations of Fourteenth Central Finance Commission (14th CFC) whose term covers the period from 2015-16 to 2019-20. Thus, Delhi remains looser on account of the dispensations recommended by the Fourteenth Central Finance Commission to the States which include share in Central Taxes, Grant-in-aid for Local Bodies on account of basic and performance grants and grants for Calamity Relief etc. Delhi only get discretionary grant in lieu of Share in Central Taxes which is stagnant at 325 crore since 2001-02.
15. Financing of Annual Scheme/ Project outlay of Delhi is almost similar to that of other States. However, Delhi does not get the benefit of the dispensations recommended by the succes-sive Finance Commissions to the States and also it cannot take resort to Market Borrowing/Negotiated loan/Provident Fund etc for its budget financing.
EMPLOYMENT & UNEMPLOYMENT
16. As per Census 2001, population of Delhi was 138.50 lakh. In 2011 census, the population of Delhi increased to the level of 167.88 lakh which indicate the fact that on an average, pop-ulation of Delhi increased at 2.12 per cent per annum during 2001-2011. During the same period, the proportion of working population to the total population in Delhi increased at the rate of 0.46 per cent. Female workers constitutes less percentage of workers during 2011 and it worked out at 14 per cent of workers in Delhi.
PRICE TRENDS
17 At national level Wholesale Price Index (WPI) is used to measures changes in prices of commodities in wholesale market. The current series of WPI reflect the change in wholesale Prices over a period as compared to the base year (2011-12=100). Consumer price index (IW) is generally used for measuring the trends of retail prices of the most common items of daily consumption. Labour Bureau, Shimla has been compiling and releasing consumer prices index on monthly bases for 78 selected centre / market in India, including Delhi.
18. The Index is separately prepared for six groups and then combined by assigning weights to each group. The highest weight is assigned to food group at 43.75 per cent, followed by miscellaneous at 22.34 per cent, housing at 20.72 per cent, clothing, bedding and footwear at 5.68 per cent, fuel & light at 5.39 per cent and pan, supari, tobacco and intoxicants at 2.12 per cent respectively.
19. The annual average consumer price index for industrial workers in Delhi increased from 246 in 2016 to 257 in 2017 registering an increase of 11 points. The increase in consumer price index for industrial workers in Delhi was recorded at 4.5 per cent during 2017 over last year 2016. The average consumer price index (IW) number in All India was recorded at

ECONOMIC SURVEY OF DELHI, 2017-184
281during 2017. At national level, the average consumer price index in food group during the year 2017 recorded at 308 while in Delhi recorded at 289.
OUTLAY AND EXPENDITURE
20. A major change which introduced in 2017-18 was doing away with the “Plan”-“Non-Plan” classification of expenditure based on NITI Aayog decision to do away with the Five Year Plans and Annual Plans with ending of Annual Plan 2016-17 which was terminating year of 12th Five Year Plan (2012-17). The expenditure, henceforth, will be classified broadly into (i) Establishment Expenditure, (ii) Schemes/Projects, (iii) Centrally Sponsored Schemes (CSS) and (iv) other expenditure which will be categories under revenue and capital heads in budgeting from the year 2017-18.
21. Another major change which was introduced by Government of NCT of Delhi was to follow output/outcome based budgeting in the annual budgeting process from the year 2017-18 onwards and introduction of an Outcome Budget 2017- 18 which is based on “Quantifiable Output and Outcome Indicators” having baseline data for 2016-17 and targets for 2017-18. The Government also carried out department wise quarterly review meetings of Outcome Budget 2017-18.
22. The plan outlay of Delhi increased from 6.3 crore in the First Five year Plan to 90000 crore in the Twelfth Five Year Plan. During the First (1951-56) to Fifth Five Year Plan (1974-79), the plan expenditure was less than the approved outlay for each Five Year Plan. Plan expenditure was more than the approved outlay during 6th, 7th and 8th Five Year Plan. Ex-penditure of the Eleventh Five Year Plan was totaled at 53478.86 crore, which is 97.95 per cent of the total plan outlay. Expenditure reported in Twelfth Five Year Plan was 70497.04 crore which is 78.33% of total plan outlay.
23. In the financial year 2017-18 Education Sector has continued to be the first priority sector with maximum share of allocation of 19.1% of the budget allocated for Schemes/Projects followed with Social Security & Welfare(16.7%), Transport (16.5%), Medical & Public Health (14.2%), and Housing & Urban Development (12.8%). Water Supply and Sanitation has a share of 9.5%. The five priority sectors including Water Supplies and Sanitation mentioned above accounts for approximately 88.8 % of the Budget Allocation 2017-18.
24. The Social Services Sectors all together has a share of 72% under Schemes/ Projects in 2017-18 with allocation 13321 crore under the Education, Medical & Public Health, Water Supply & Sanitation, Housing and Urban Development, Social Welfare, WCD, Welfare of SC/ST/OBC/Minorities, Nutrition, Labour, Food & Civil Supplies Sectors. Total budget allo-cation under schemes/project in 2017-18 (BE) was 18500 crore.
ENVIRONMENT
25. Rapid rise in population and speedy economic development has raised the concern for the environmental degradation in Delhi because of which Delhi is one of the heavily polluted city in India, having for instance one of the country’s highest volumes of particulate matter pollu-tion. Unprecedented scale and speed of urbanization in Delhi and consequent pressure on physical and social infrastructure has created damaging stress on living environment and affected the level of pollution adversely.
26. Increase in number of vehicles in Delhi, construction of roads, other construction activities, agriculture burning in the NCR and neighbouring states are the major contributor of the par-ticulate and other gaseous pollutants in Ambient Air of Delhi. Noise pollution comes mainly

ECONOMIC SURVEY OF DELHI, 2017-18 5
from industries, transportation, aircraft etc. Water pollution and lack of adequate solid waste treatment facilities have caused serious damage to the river Yamuna on which banks Delhi grew. Several steps have been taken in the recent past to improve the environment con-dition which includes massive focus on afforestation, universal use of CNG by commercial vehicles, odd-even traffic scheme, financial subsidy on newly purchased Battery Operated Four Wheelers and Two wheelers, ban on plastic use, better management of solid waste, treatment of waste water and improvement of sewage system etc. But there are still many challenges remain to contain the environmental pollution.
27. Keeping in view deteriorating ambient air quality in Delhi and need to implement area spe-cific interventions, DPCC has augment the Ambient Air Quality monitoring infrastructure by installing 20 new state of art Continuous Ambient Air Quality Monitoring Stations in Delhi on 09.11.2017. The old network has only Six stations of DPCC and by this addition Delhi has network of 26 stations operated by DPCC.
28. DPCC has been conducting monthly water quality monitoring of river Yamuna (at 9 lo-cations) and major drains (24 drains) falling into river Yamuna. Water quality monitoring results of the drains indicate that most of the drains are not meeting the standards with respect to Bio-chemical Oxygen Demand (BOD), Chemical Oxygen Demand (COD) and Total Suspended Solids (TSS). In Delhi, 5 Municipal Authorities are responsible for Munic-ipal solid Waste Generation and Management. There are 4 landfill sites namely Bhalaswa land fill site (since 1993), Ghazipur land fill site (since 1984), Okhla land fill site (1994) and Bawana land fill site (Developed as Engineering Landfill Site and operating since 2011). In the absence of availability of landfill sites, all the 5 Municipal Bodies are also using the first 3 sites for disposal of Municipal Solid Waste though these are not Engineering Landfill Site.
29. The total forest and tree cover area in Delhi increased to 305.41 sq km. In 2017 and nearly 279 sq km has been added during the period 1997 to 2017. As far as tree cover is con-cerned - sparse vegetation along roads or small- scale plantations - Delhi has the sec-ond-highest tree cover as a percentage of the total geographical area among states. The overall increase in Delhi’s green cover is a good sign. Delhi’s green cover has increased from around 20.2% during 2015 to 20.6% during 2017. South Delhi constitutes the highest forest cover area at 83.35 sq. km, South West Delhi at 51.10 sq. km, North West Delhi at 17.55 sq. km, New Delhi at 16.41 sq. km, respectively. On the contrary the lowest forest cover observed in East Delhi at 3.70 sq. Km.
30. Asola Bhatti Wildlife Sanctuary spread over 4845.57 acres is situated near Tughlakabad Fort in South Delhi. The Wildlife Sanctuary is considered the breathing lung of the cos-mopolitan city of Delhi. It was established in 1992 with the aim to protect the wildlife in the area between Delhi and Surajkund (Delhi-Haryana border). The sanctuary is located on the Southern Ridge which is part of the northern terminal of Aravalli Hills. Eco-restoration of habitat through Eco Task Force in Asola Bhatti Wildlife Sanctuary has been done by car-rying out plantation by ETF.
31. The Government is committed to provide soothing and green environment to the citizen of Delhi. Massive tree plantation drive was launched during July-September, 2016 involving 19 other greening agencies, eco-clubs and RWAs for plantation of 10 lakh tree saplings and 5 lakh shrubs as middle canopy. During 2016-17 a total of 8.72 Lakh sapling and 12.31 Lakh shrubs had been planted by the Forest Department alongwith other greening agencies. During 2017-18, about 5.5 lakh saplings and 7.93 lakh shrubs have already been planted till December, 2017.

ECONOMIC SURVEY OF DELHI, 2017-186
INDUSTRIES
32. The Industrial Policy of Delhi 2010 – 2021 focuses on promotion of knowledge based in-dustries with priority for skill development and its vision is to make Delhi a hub of clean, high-technology & skilled economic activities by 2021
33. The Industrial Policy for Delhi 2010-21 aims to promote transparent and business friendly environment, promotion of non-polluting and clean industries, promotion of high-technology and skill industries to keep in-migration of unskilled labour to minimum, to develop world class infrastructure within planned industrial estates and regularised industrial clusters, pro-motion of cluster approach and walk to work concept, wherever possible, to facilitate busi-ness through procedural simplifications and e-governance measures.
34. There are 8.75 Lakh total establishments operating in Delhi as per Sixth Economic Census conducted in 2013: out of which, 1.42% in rural areas and 98.58% in urban areas. Sixth Economic Census registered an annual growth rate of 1.94%, in absolute term 1.18 lakh establishments increased in Sixth Economic Census 2013 over 5th Economic Census 2005.
35. As per GSVA Estimates at current prices, income from manufacturing has increased from 18907 crore in 2011-12 to 27756 crore in 2017-18. However, the percentage contribu-
tion of manufacturing to GSVA has decreased from 6.24% in 2011-12 to 4.74% in 2017-18. During the same period, the contribution of secondary sector to the total GSVA of Delhi has also decreased from 13.09% in 2011-12 to 12.04% in 2017-18.
AGRICULTURE AND RURAL DEVELOPMENT
36. Contribution of agriculture sector has been reduced in NCT of Delhi due to rapid urbanisa-tion and the growth of trade and industry sector in Delhi. Around 25% of the total area of NCT, as per 2011 census, was in rural and the remaining 75% in urban. The number of rural villages in Delhi reduced from 214 in 1981 to 112 in 2011.
37. The number of operational holdings in Delhi reduced from 25311 in 2005-06 to 20497 in 2010-11. The operational area of Delhi decreased from 37770.29 hectares during 2005-06 to 29628.21 hectares during 2010-11. The total cropped area during 2000-01 was at 52816 hectares which reduced to 34750 hectares in 2017-18. The reduction of cropped area during this period was worked out at 1.90 per cent per annum. The main reasons be-hind such reduction in agriculture area in Delhi are due to the fast urbanization, and shifting of occupational pattern especially during the last two decades.
38. Gross area irrigated reduced from 30753 hectares during 2009-10 to 29723 hectare during 2016-17 indicating a decline of 3.35% during the last eight years likewise, area irrigated through wells which was main source of irrigation also reduced from 21205 hectare during 2009-10 to 19727 hectare during 2016-17 recording a decrease of 6.97% during the same period.
39. It is observed that wheat was the main food crop in Delhi during 2016-17. Area and Produc-tion of wheat were recorded at 19623 hectare and 87182 MT respectively. The livestock in Delhi decreased marginally from 3.75 lakh in 2003 to 3.66 lakh in 2012 recording a negative annual growth at -0.26 per cent.
40. There are 47 Govt. Veterinary hospitals, 28 Veterinary Dispensaries, 2 laboratory/ research centre for providing veterinary facilities in Delhi. Under these veterinary services, 438504 animals were treated during 2016-17.

ECONOMIC SURVEY OF DELHI, 2017-18 7
41. A new advisory board namely ‘Delhi Village Development Board (DVDB)’ has been consti-tuted in place of Delhi Rural Development Board (DRDB) vide Order dated 20.12.2017. The DVDB has been set up for integrated development of both rural and urban villages in Delhi. Delhi Village Development Board shall advise the Government on issues connected with the infrastructure development works in all rural and urban villages of Delhi.
ENERGY
42. Government of Delhi has introduced power sector reforms in 2002 with the corporatisation of transmission and generation of power and privatization of distribution of power. There has been considerable improvement in the power scenario of Delhi in terms of reduction of transmission and distribution losses, customer services, capacity addition of transmission and generation of power. The power establishment of Delhi after unbundling of Delhi Vidyut Board is shared by Generation Companies (Indraprastha Power Generation Company Lim-ited (IPGCL) and Pragati Power Corporation Limited (PPCL), transmission by Delhi Transco Limited, and five DISCOMs (BYPL, BRPL, TPDDL, NDMC and MES).
43. During the period 2010-11 to 2016-17, the number of consumers of electricity in Delhi in-creased from 40.47 lakh to 55.68 lakh. The total power purchase in Delhi has grown by 46.64% during the last ten years. Power purchase has increased from 32744 MU in 2010-11 to 34011 MU in 2016-17. While 16.93% of total power purchase is sourced from own generation by Delhi Govt. Power Plants, 83.07% is purchased from Central Govt. and other sources. The supply of electricity in Delhi periphery increased from 32744 million units in 2010-11 to 34011 million units in 2016-17. The peak demand increased from 4720 MW in 2010-11 to 6261 MW in 2016-17.
44. Delhi Transco Limited is the State Transmission Utility of the National Capital Territory of Delhi. It is responsible for transmission of power at 220KV and 400KV level, besides up gra-dation operation and maintenance of EHV Network as per system requirements. After the enactment of Electricity Act 2003, a new department: State Load Despatch Centre (SLDC) under Delhi Transco Limited was created, as an Apex body to ensure integrated opera-tion of the power system in Delhi. Earlier the SLDC was part of O&M Department of Delhi Transco Ltd / Delhi Vidyut Board. SLDC Delhi started its function on the 1st of January 2004. SLDC is responsible for the real time Load Despatch function, SCADA System and Energy Accounting. Its mission is to facilitate intra and inter-state transfer of power in coordination with NRLDC (Northern Regional Load Despatch Centre) with Reliability, Security and Econ-omy on sound commercial principles.
45. Delhi Transco Limited has power transmission network consisting of four number of 400 KV and thirty five 220 KV substations and associated with transmission lines. The existing network consists of 400 KV ring around the periphery of Delhi interlinked with the 220 KV network spread all over Delhi. It has total transformation capacity of 5410 MVA at 400 KV level and 11720 MVA at 220 KV level upto the 2016-17. The total transmission line length in Ckt. Km. is 249.192 at 400 KV level and 823.815 at 220 KV level. Delhi Transco Limited has 39 sub-stations (4 at 400 KV and 35 at 220KV).
46. Government of NCT of Delhi has established an Energy Efficiency and Renewable Energy Management Centre (EE&REMC) to implement the program of the Ministry of New and Renewable Energy (MNRE), Govt. of India. As such, EE&REMC has got a functional frame-work devoted to comprehensive and multi-disciplinary institutional objectives and orienta-tion encompassing all aspects of energy, with a focus on energy-environment-development interactions. It is proposed to develop New Delhi Municipal Council (NDMC) area as Solar

ECONOMIC SURVEY OF DELHI, 2017-188
City by installing SPV panels on rooftop of Govt. buildings, Metro Stations, Bus Stops, etc. Govt. of India approved for installation of Grid Connected Rooftop Projects in NCT of Delhi. All the grid connected solar projects have contributed to nearly 77.34 MW of power in Delhi till January 2018.
47. Disposal of Municipal Solid Waste is very challenging issue. In order to overcome this prob-lem ‘Waste-to-Energy’ Plants are being set-up at various locations in Delhi to generate elec-tricity. Presently three Waste-to-Energy plants at Timarpur-Okhla (16 MW), Ghazipur (12 MW) and Narela-Bawana (24 MW) with a total capacity of 52 MW are in operation. Setting up of two more ‘Waste-to-Energy’ plants at Bhalswa (20 MW) and Tehkhand (25 MW) are proposed.
48. The total installed capacity of renewable energy (Solar + WTE) in Delhi is 129.34 MW as on 31.01.2018
TRANSPORT
49. The capital city of India has a well developed transportation network. In fact this network is the main lifeline that ensures that people in the city can travel without delay and hassle. Delhi is a hub for personal motorized vehicles in India. Total motorized vehicles in Delhi are 103.83 lakh. Car and jeeps accounted for more than 30 per cent of the total registered mortised vehicles, whereas two wheelers are about 64% of total registered vehicles.
50. The existing network of DMRC phase-I and Phase-II is 190.03 KM (including NCR). The work for phase-III of DMRC was approved for 160.586 KM. This work is likely to be completed by Dec, 2018. The total network will be 350.616 KM approximately (including NCR) after completion of Phase-III work. Average Daily Ridership on DMRC is increased from 26 lakh during 2015-16 to 28 lakh during 2016-17 which will further be enhanced to 40 lakh after completion of Phase-III. The work of Phase-IV is under consideration and likely to be start-ed soon.
51. The total number of motor vehicles on road in NCT of Delhi as on 31st March, 2017 was 103.83 lakh, showing an increase of 6.99 per cent over previous year. Therefore, serious efforts, including a number of transport infrastructure projects at ring road and Outer Ring road were made to encourage uses of public transport in Delhi. Flyovers at Madhuban Chowk to Mukerba Chowk, Vikas Puri to Meera Bagh, Mangolpuri to Madhuban Chowk, Wazirabad to Mukerba Chowk has been opened for public. Flyover from IIT to NH-8 on Outer Ring Road is nearing to completion. The projects Signature Bridge and Barapullah Phase-II & Phase-III are in progress.
52. At present 4027 DTC buses are running on 474 city routes and 9 NCR routes and daily average passenger is about 31.55 lakh. 1757 cluster buses are operating in 08 clusters of NCT of Delhi. For the safety/ security of women passengers 120 Home Guards, 1643 Civil Defence Marshal and 115 DTC Marshals are deployed in DTC buses.
53. Bus and metro rail transport system are being integrated at both physical and operational level. ISBT Kashmiri Gate and Anand Vihar have been connected with the metro rail through suitable pathways. At the operational level, common Mobility Cards have been launched in Delhi on 08.01.2018 on pilot basis in 200 DTC and 50 Cluster buses wherein Delhi Metro Rail Card will be used for tendering fare in buses using ETMs.

ECONOMIC SURVEY OF DELHI, 2017-18 9
WATER SUPPLY & SEWAGE
54. As per 2011 Census, 81% of total households were provided piped water supply, 14% households through tube wells/ deep bore hand pumps/ public hydrants and remaining 5% households from other sources like river, canal, ponds, tank, spring, etc.
55. Delhi depends on neighboring states to meet around 50 per cent of drinking water demand of its residents. Water supply and distribution in Delhi is being made by Delhi Jal Board, an autonomous organization functioning under Government of Delhi, which is supplying water in most part of Delhi, besides, other local bodies like NDMC and Delhi Cantonment Board. DJB has a total water treatment capacity of 906 MGD as on 31st March, 2017 with 12 Wa-ter Treatment Plants. The total water resource available to Delhi Jal Board for distribution is 913 MGD, which is, from Yamuna River (375 MGD), Ganga River (240 MGD), Bhakra Storage (218 MGD) and 80 MGD from other sources like ground water from Tube well etc. DJB was able to sale 421 MGD of water to 24.95 lakh consumers in 2016-17. Collection efficiency of DJB has improved to 96.93% in 2016-17 from 89.77% during 2015-16.
56. Delhi Jal Board has improved its governance and undertook a number of measures for proper demand-side planning, efficient management of water distribution, water audit and proper water accounting. A transparent tanker water distribution system using GPS/GPRS with schedules of operation has been made available online for elimination of unscrupulous private tankers charging exorbitant rate. DJB has launched “Seva App” for bill generation, online payments and the resolution of inflated bills to deliver efficient and transparent ser-vices. Delhi Jal Board has taken several steps to minimize leakage losses, leak detection and investigation (LDI) cell was set up.
57. All domestic consumers of Delhi Jal Board consuming water up to 20 KL per month and having functional water meters are being given 100 % subsidy and fully exempted from payment of water bills w.e.f 01.03.2015. Around 515 crore was spent for water subsidy by the Government of NCT of Delhi during 2015-16 & 2016-17.
58. Delhi Jal Board has sewage treatment capacity of 607 MGD as on 31st March, 2017, whereas, treatment capacity is only 69%. Delhi Jal Board has a network of branch, peripheral sewers of about 7900 kms. Also there is a network of 200 kms of trunk sewers. HOUSING & URBAN DEVELOPMENT
59. Housing and Urban Development are the priority sectors in the development planning pro-cess of Delhi. Delhi Government is only one of the many players in the Housing Sector because land, land development and public housing are under the jurisdiction of the Delhi Development Authority. However, with the launching of Jawahar Lal Nehru National Urban Renewal Mission (JNNURM), Delhi Government has now been engaged in the construction of houses for economical weaker sections. Given the huge size of targeted population, the Government initiative is very limited due to the fact that availability and allotment of land is under DDA. Among all the state and Union Territories, Delhi has the highest population density in 2011 at 11,297 per sq km. despite a decline in the decadal growth rate from 47 % during 1991-2001 to 21 % during 2001-2011. The city of Delhi is overwhelmingly urban, with 75 % of its total area (1483 sq km) falling in urban jurisdiction and the population density in urban area is as high as 14698 persons per sq km as per 2011 Census. 16.37 million Pop-ulation i.e 98 % of total population (16.79 million) of Delhi is residing in urban areas.

ECONOMIC SURVEY OF DELHI, 2017-1810
60. About one-third of Delhi lives in sub-standard housing, which includes 695 slum and JJ Clusters, 1797 unauthorized colonies, old dilapidated areas and 362 villages. These ar-eas often lack safe, adequate housing and basic services. Highly urban character of Delhi exerts tremendous pressure on public delivery of services/civic infrastructure systems like water supply, sewerage and drainage, solid waste management, affordable housing, health and educational facilities etc. and poses a great challenge for the city government. Growth of slums, unauthorised colonies and encroachments remain permanent challenges as rate of construction is inadequate compared to growing demand for housing. Continuous flow of migrants tends to aggravate the problem.
61. There is a significant improvement in the availability of basic services in Delhi over the last decade as per 2011 Census. There is a near universal electrification and 99% of the households have access to sanitation facilities. The supply of drinking water by Delhi Jal Board now reaches 81% of the households against 75% 10 years ago. Less than 1% of the households are without both toilet and electricity facilities.
62. A comprehensive redevelopment plan has been prepared for maintaining the original heri-tage character and to improve the environment in the walled city area.
63. EDUCATION64. Delhi has a variety of good quality schools, colleges and universities as well as centers for
research and higher education. Its literacy rate at 86.2 per cent is substantially higher than the all India average of 73 per cent. Although there is gender gap in literacy, it has declined moderately over the years from 12.62 per cent in 2001 to 10.1 per cent in 2011. The literacy rate in Delhi is, however, still lower than the States like Kerala (94.0%), Mizoram(91.3%), Tripura (87.2%).
65. Delhi Govt. has total of 1228 government and government aided schools in Delhi, which is 21.27% of the total schools running in Delhi, whereas, the share of enrollment in govern-ment and government aided schools is 37.92% of total enrollment of all schools in Delhi during 2016-17.
66. As per DISE Repot-2014, during 2012-13, the Gross Enrolment Ratio in Primary Educa-tion in Delhi was 117.8 % as compared to 106% at all India level. Net Enrollment Ratio has improved over the years from 77.80 in 2007-08 to 93.26 in 2015-16. Delhi’s position in NER during 2015-16 is 93.26 which is much higher than the National Average of 87.30. NER at the National level is on a decreasing trend during 2007-08 to 2015-16.
67. As per State Budget Analysis Report of RBI released in May 2017, Govt. of NCT of Delhi has the highest share of investment in education among all States. During 2016-17, Delhi was at the top allocating 22.8 % of its budget estimates earmarked for the education sector followed by Assam (21%), Himachal Pradesh (19.1%) and Maharashtra (18.2%). The Na-tional Average percentage share of expenditure on Education to total expenditure is 15.6% in 2016-17.
68. In Delhi, the per student per annum expenditure incurred by the government on education is likely to increase to 61,622 in 2017-18 (BE) from 54,910 in 2016-17.
69. For quality improvement in learning, Government has implemented new initiative “Chunauti - 2018” aimed at bridging the accumulated learning deficits of primary classes in Classes 6 to 8, ensuring rigorous inputs to address the failure trend in Std 9 and zero drop out amongst the children, who have failed in Std 9. This initiative has helped to bringout im-

ECONOMIC SURVEY OF DELHI, 2017-18 11
provement in the exam results. Nearly 1 lakh students of Std 6 to 8 moved from non-reader to reading grade appropriate text through special reading campaign. Another important initiative implemented by Education Department is to bring out supplementary learning material called “Pragati” for its students. The Pragati series aims at providing study material in simple, contextual and child friendly manner.
MEDICAL & PUBLIC HEALTH
70. Large number of patients from neighboring States visit Delhi to avail quality health care fa-cilities. Health sector infrastructure in Delhi comprises of 1240 dispensaries, 1057 nursing homes, 193 maternity homes, 48 polyclinics / special clinics, and 17 medical colleges. Mo-halla Clinics and Polyclinics are being set up to provide health care services at door step of citizens. Besides projects of new hospitals, existing hospitals are planned to be remodeled to enhance bed strength. At the end of year 2016-17, total bed capacity was 53329.
71. Important vital indicators like Infant Mortality Rate, Neo-Natal Mortality Rate, Under Five Mortality Rate in respect of Delhi stand at lower levels as 18, 12, and 22 in comparison to All India levels viz 34, 24, 39 respectively. Similarly, the total fertility rate (TFR) of 1.6 in Delhi, is among the lowest in India (All India level – 2.3) which indicates the achievement of the replacement rate. On the same lines, the crude death rate of 4.0 in Delhi is the lowest in the country and 2nd highest life expectancy of 73.8 years.
72. However, maternal & child health care services need to be strengthened to achieve 100% institutional births, universal immunization coverage and ANC. The proportion of institution-al deliveries was 86.74 per cent. Similarly, percentage of fully immunized children was 86%. It suggests that these proportions are improving and all essential measures be adopted to achieve the goals of universal immunization and ANC.
73. Important health programmes under National Health Mission focused at reproductive and child health, control of TB, Leprosy, etc are being implemented in Delhi through Delhi State Health Mission. Delhi AIDS Control Society is implementing the programme of NACP. Direc-torate of AYUSH ensures provision of health care services of ISM & Homeopathy.
SOCIAL SECURITY & WELFARE
74. Department of Social Welfare, Women and Child Development and Welfare of SC/ST/OBC /Minorities are implementing several schemes/projects with the objective to improve quality life of vulnerable sections. The expenciture under these three departments in FY 2016-17 was 1702 Crore and budget allocation of 2731 crore in FY 2017-18. Out of these, the allocation for financial assistance to Senior Citizen (4.20 lakh beneficiaries up to Dec,17), Women in Distress (1.98 lakh beneficiaries up to Dec,17) and person with special needs (75603 beneficiaries up to Dec,17) is approximately 1595 Crore. The Government, in 2016-17, enhanced the financial assistance by 1000 per month per beneficiaries under these schemes subject to the condition that benefit will be extended to only those beneficia-ries who are receiving pension through DBT after seeding/linking with Aadhar. Government had also enhanced income limit for eligibility to 1 lakh per annum. The new rates of 2000/- per month for senior citizens of age 60-69 years, 2500/- per month for senior citi-zens of age 70 years & above and persons with special needs are effective from February 2017.
75. For empowerment and welfare of women and children, is implementing some major proj-ects like Integrated Child Development Scheme (ICDS), Ladli Yojana, schemes for Adlos-cent girls, Integrated Child Protection Scheme (ICPS), financial assistance to widows for

ECONOMIC SURVEY OF DELHI, 2017-1812
marriage of their daughters and orphan girls for their marriage etc. There are hostels fa-cilities being provided to working women in Delhi. There is Delhi Commission for Women set up in Delhi under which Mahila Panchayats are working for counseling and giving legal advice to the women those who are in distress. There are another diffrent dedicated cells under Delhi commission for women.
76. The Delhi Government has enhanced the honorarium for Anganwadi Workers (AWWs) from 5000/- p.m. to 9678/- p.m. and for Anganwadi Helpers (AWHs) from 2500/- to 4839/-
p.m. from August,2017 in which Government of India contributes 1800/p.m. for AWWs and 900/-p.m. for AWHs .
77. Various schemes for students belonging to SC/ST/OBC/MINORITIES are being implement-ed by the Department for welfare of SC/ST/OBC/ Minorities, like financial assistance for purchase of stationery, reimbursement of tuition fees and scholarship to students etc. with a total budget of 409 crore in 2017-18.
78. Delhi Commission for Protection of Child Rights is functioning in Delhi to deal with the issues related to Child Education, Health, Child Development, Juvenile Justice, Child Psy-chology and Care of Neglected Children.
PUBLIC DISTRIBUTION
79. Public Distribution System is an important government intervention for supply of food grains to the poor at a subsidized price. It acts as tool to control open- market prices for commod-ities that are distributed through the system. Government of NCT of Delhi facilitates supply of food grains to around 72.48 lakh poor people through a network of 2254 Fair Price Shops at a subsidized price on a recurring basis. Delhi Government has so far issued 19.40 lakh National Food Security Smart Cards to eligible families covering total beneficiaries of 72.48 lakh as on 31st March 2017. Almost all the digital Food Security Cards are Aadhar enabled. Delhi was one of pioneer state in implementation of the National Food Security Act, 2013 w.e.f. 1st Sept. 2013 soon after enactment of NFSA, 2013 by Government of India.
80. Government of NCT of Delhi has introduced a lot of new interventions for bringing efficiency and transparency in the public distribution system like facility of e-Ration Card, Ration Card Portability, awareness of the consumers through SMS Alerts in their registered mobile num-bers etc.
81. e-POS devices got installed in all the Fair Price Shops for distribution of ration to all eligi-ble beneficiaries through Aadhar enabled Point of Sale (AePOS) devices. In the month of January, 2018 total of 15,15,769 Card holders were distributed Food grains through e-PoS devices. The online monitoring is available to public on the portal http://epos.hry.gov.in/dl along with standard reports available with different parameters like stock register, allotment details, portability details, date-wise transactions detail, sale register, success & failure ab-stract of UIDAI, commodity allotment etc. The project is running successfully at all fair price shops and proving vital to eliminate bogus ration cards
TRADE AND COMMERCE
82. Trade and commerce have played a pivotal role in promoting the growth of Delhi’s economy by making a significant contribution in terms of tax revenues and providing gainful employ-ment to a large section of the society. Delhi is the biggest trade and consumption centre in North India. Delhi distinguishes itself as a centre for entry port of trade which means that large part of its economic activity is concerned with the redistribution of goods produced

ECONOMIC SURVEY OF DELHI, 2017-18 13
elsewhere and imported for local sales as well as for export to other states i.e. interstate sales. It has attained the status of a major distribution centre by virtue of its geographical location and other historical factors, availability of infrastructure facilities etc.
83. The income from trade, hotels and restaurant in Delhi constituted 76303 crore during 2017-18 at current prices, which is nearly 13.02 per cent of Gross State Value Added of Del-hi (base year 2011-12). More clearly this sector’s contribution to Gross State Value Added of Delhi during the last seven years was more than 13 percent.
POVERTY LINE
84. Poverty is a situation where the individual or communities lack the resources, ability and environment to meet the basic needs of life. It indicates a status wherein a person fails to maintain a living standard, adequate for a comfortable lifestyle. On the basis of National Sample Survey Organisation’s 61st Round (June 2004- July 2005), Planning Commission published State Specific poverty line for rural and urban. The poverty line was estimated at 410.38 for rural and 612.91 urban Delhi as against the national level of 356.30 for rural
and 538.60 for urban India respectively. The number of persons below poverty line in Delhi during 2011-12 was estimated at 16.96 lakh and it worked out to 9.91 per cent of the total population of Delhi.
85. Directorate of Economics and Statistics, Delhi is publishing a report titled “Level and Pattern of Household Consumer Expenditure of Delhi” on the basis of sample surveys conducted under National Sample Survey Organizations Rounds from time to time.

ECONOMIC SURVEY OF DELHI, 2017-1814
CHAPTER 2
DEMOGRAPHIC PROFILE Area
Delhi is a capital city of the Republic India and officially known as the National Capital Territory of Delhi. It is bordered by Haryana on three sides and by Utter Pradesh to the east. It is located at North Latitude from 28.24 – 28.50 degree and East Longitude from 76.50 - 77.20 degree. Delhi covers an area of 1483 Sq. Km. of which 369.35 sq. Km. is designated as Rural and 1113.65 Sq. Km. as Urban which makes it the largest city in terms of area in the country. It has a length of 51.9 km and breadth of 48.48 Km. Delhi has 11 districts with 33 Tehsils / Sub Divi-sions. Two prominent features of Delhi is the Yamuna flood plains and the Ridge. It is located in India’s seismic zone-iv, indicating it’s vulnerability to major earthquakes.

ECONOMIC SURVEY OF DELHI, 2017-18 15
1.1 Demographic Trends: Delhi is one of the fastest growing cities in the country. Due to rapid pace of urbanization, land-
scape of Delhi has undergone a change from majority of rural area to urban.
The rural-urban areas change during the last three censuses in Delhi is depicted in Statement 2.1:
Statement 2.1
AREA - RURAL AND URBAN
S. No. Classification of Area
1991 2001 2011
Sq. Km % Sq. Km % Sq. Km %
1. Rural 797.66 53.79 558.32 37.65 326.44 22.01
2. Urban 685.34 46.21 924.68 62.35 1156.56 77.99
3. Total 1483.00 100.00 1483.00 100.00 1483.00 100.00
Source: Census of India, 1991, 2001 & 2011
2. The growth in urban area during 2001-2011 was observed at 20.44 per cent. This pace of urbanization has reduced the number of rural villages in Delhi from 300 in 1961 to 165 in 2001 and 112 in 2011. The number of urbanized villages has increased from 20 in 1961 to 135 in 2011. The number of census towns has increased from 3 in 1971 to 29 in 1991 and 110 in 2011. Thus more and more rural villages of Delhi are being declared Census Towns in each successive Cen-sus resulting in decreasing rural population and rural area in Delhi.
3. Population
3.1 Population Census is the only source providing comprehensive data on population characteristics carried out decennially by Govt. of India in collaboration with states. The first synchronous census in India was held in 1881. Latest census, 15th in the series, was conducted in 2011 and as per this census, population of Delhi , as on 1st March, 2011, was 16.78 million as against 13.85 million as on 1st March, 2001. According to census 2011 about 97.50 per cent of the population of Delhi lives in urban areas and remaining 2.5 percent in rural areas. This urban population includes population of 110 Census towns in 2011 Census. As per Revenue Department record these census towns are located in rural area of Delhi and they are not part of notified urban area of Delhi.
4. Growth of Population
4.1 The population of Delhi and India and its growth during the last six decades is presented in Statement 2.2.

ECONOMIC SURVEY OF DELHI, 2017-1816
Statement 2.2:
POPULATION OF INDIA AND DELHI & ITS GROWTH DURING 1951-2011
(Lakh)
S. No.
Years Delhi India Share of Delhi’s Population in All
IndiaPopulation Growth
(%)Population Growth
(%)1. 1951 17.44 -- 3610.88 -- 0.482. 1961 26.59 52.44 4392.35 21.64 0.613. 1971 40.66 52.93 5481.60 24.80 0.744. 1981 62.20 53.00 6833.29 24.66 0.915. 1991 94.21 51.45 8464.21 23.87 1.116. 2001 138.51 47.02 10287.37 21.54 1.357. 2011 167.88 21.20 12108.55 17.70 1.39
Source: - Census of India (Primary Census Abstract 2011).
4.2 The decadal growth rate of population during 2001-2011 was recorded at 21.2 per cent. This is a peculiar feature of Census 2011 of Delhi as in all Census since 1951, the decadal growth rate of population was more than 50% and 47% in 2001. This trend may be attributable to imple-mentation of various employment promotion programmes like MNREGA and welfare schemes like pension to senior citizens and widows by Central and State Governments on the one hand and development of NCR priority towns viz. Gurgaon, Faridabad, Sonipat, Noida, Ghaziabad, Meerut etc. contributing in reducing the migration to Delhi. The rate of growth of population in Delhi during the last decade was higher than the national level by 3.5 per cent. Delhi accounts about 0.05 per cent of the India’s geographical area but consists 1.39 per cent of the nation’s population.
4.3 It may be observed from Statement 2.2 that the percentage of Delhi’s population to the national level enhanced from 0.48 per cent in 1951 to 1.39 per cent in 2011. The rate of growth of population in Delhi was highest during 1971-81 at 53.00 per cent. The annual rate of growth of population in Delhi during the last decade was 2.12 per cent per annum which was higher than the national level of 0.35 per cent per annum. The population in Delhi during 1951-2011 is depict-ed in Chart 2.1.

ECONOMIC SURVEY OF DELHI, 2017-18 17
Chart 2.1
POPULATION OF DELHI : 1951-2011 (Lakh)
1951 1961 1971 1981 1991 2001 2011
5. District-wise Population
5.1 At the time 1991 census of Delhi was a single district Territory. In 1996, Government of NCT of Delhi, through a Gazette notification, created 9 districts and 27 sub-divisions. Population Census 2001 was conducted in each of 9 districts and 27 Sub-divisions. The district-wise popu-lation of NCT Delhi during the census 2001 and 2011 is presented in Statement 2.3.
Statement 2.3
DISTRICT-WISE POPULATION OF NCT DELHI: 2001 & 2011
S. No.
Districts 2001 2011Number Per cent Rank Number Per cent Rank
1. North West 2860869 20.65 1 3656539 21.78 12. South 2267023 16.37 2 2731929 16.27 23 West 2128908 15.37 3 2543243 15.15 34 North East 1768061 12.77 4 2241624 13.35 55. South West 1755041 12.67 5 2292958 13.66 46. East 1463583 10.57 6 1709345 10.18 67. North 781525 5.64 7 887978 5.29 78. Central 646385 4.67 8 582320 3.47 89. New Delhi 179112 1.29 9 142004 0.85 9
Total 13850507 100.00 16787941 100.00Source: - Census of India (Primary Census Abstract 2011).

ECONOMIC SURVEY OF DELHI, 2017-1818
5.2 It is evident from Statement 2.3 that more than 53 per cent of the population of Delhi in 2011 lived in three districts viz. North-west, South and West districts of Delhi. The district-wise population of Delhi in 2001 and 2011 is depicted in Chart 2.2
Chart 2.2
DISTRICT-WISE POPULATION OF DELHI-2001 & 2011
6. Sex Ratio
6.1 Sex ratio is a very important demographic indicator for analyzing Socio Economic features of population. It is the ratio of females per thousand male population. As per 2011 census, the sex ratio of Delhi was 868. During the last decade sex ratio in Delhi increased from 821 in 2001 to 868 in 2011. In order to overcome this critical situation both at the national and state level, various stringent actions against female foeticide and complete abolition of sex determination practices during the pregnancy period have been introduced and implemented. The district-wise sex ratio of NCT Delhi in 2001and 2011 is presented in Statement 2.4.

ECONOMIC SURVEY OF DELHI, 2017-18 19
Statement 2.4
DISTRICT-WISE SEX RATIO OF NCT DELHI DURING 2001 &2011
S. No. Districts Sex Ratio2001 Rank 2011 Rank
1. North East 849 1 886 22. East 843 2 884 33 Central 842 3 892 14 West 830 4 875 45. North 826 5 869 56. North West 820 6 865 67. South 799 7 862 78. New Delhi 792 8 822 99. South West 784 9 840 8
Delhi 821 868Source: - Census of India (Primary Census Abstract 2011).
6.2 In most of the Northern States in India, sex ratio indicated a critical situation as per 2001 and 2011 censuses. Sex ratio of northern states as per 2001 and 2011 Census is presented in Statement 2.5.
Statement 2.5
SEX RATIO OF NORTHERN STATES IN INDIA- 2001& 2011
S.
No.
States Sex Ratio2001 2011
1. Jammu and Kashmir 892 8892. Himachal Pradesh 968 9723 Punjab 876 8954. Chandigarh 777 8185 Uttarakhand 962 9636. Haryana 861 8797. Rajasthan 921 9288. Uttar Pradesh 898 9129. Delhi 821 868
India 933 943Source: - Census of India (Primary Census Abstract 2011).
6.3 The total number of births registered in Delhi under Civil Registration System (CRS) is presented in Statement 2.6.

ECONOMIC SURVEY OF DELHI, 2017-1820
Statement 2.6
BIRTHS REGISTERED UNDER CRS – SEX-WISE.
S.
No
Years Births Sex RatioTotal Male Female
1. 2001 296287 163816 (55.29)
132471 (44.71) 809
2. 2002 300659 164184 (54.61)
136475 (45.39) 831
3. 2003 301165 165173 (54.84)
135992 (45.16) 823
4. 2004 305974 167849 (54.86)
138125 (45.14) 823
5. 2005 324336 178031 (54.89)
146305 (45.11) 822
6. 2006 322750 176242 (54.61)
146508 (45.39) 831
7. 2007 322044 174289 (54.12)
147755 (45.88) 848
8. 2008 333908 166583 (49.89)
167325 (50.11) 1004
9. 2009 354482 185131 (52.22)
169351 (47.78) 915
10. 2010 359463 189122 (52.61)
170341(47.39) 901
11 2011 353759 186870 (52.82)
166889 (47.18) 893
12 2012 360473 191129 (53.02)
169344 (46.98) 886
13 2013 370000 195226 (52.76)
174774 (47.24) 895
14 2014 373693 197078 (52.73)
176615 (47.26) 896
15 2015 374012 197080 (52.69)
176932 (47.31) 898
16 2016 379161 199358 (52.58)
179738 (47.40) 902
Source: -Annual Report on Registration of Births and Deaths, 2016, Directorate of Economics and Statistics, Delhi.
6.4 Sex ratio as per the birth registered in Delhi under Civil Registration System (CRS) in-dicate a positive picture, enhanced from 809 in 2001 to 902 in 2016.The increase in sex ratio during 2005 to 2008 may be linked to the introduction of a number of schemes for empowerment of women and welfare of children by the Government of NCT of Delhi.
6.5 On the basis of projected of Population for the year 2014 and 2015, the sex ratio (per 100

ECONOMIC SURVEY OF DELHI, 2017-18 21
Male) of selected nations in Statement 2.7.
Statement 2.7
POPULATION OF SELECTED NATIONS
(Number)
S. No. Nations 2014 2015 Sex Ratio
1. China 1,393,783,836 1,401,586,609 92.862. India 1,267,401,849 1,282,390,303 93.473. USA 322,583,006 325,127,634 103.114. Indonesia 252,812,245 255,708,785 98.845. Brazil 202,033,670 203,657,210 103.516. Pakistan 185,132,926 188,144,040 94.577. Russian Federation 142,467,651 142,098,141 116.988. Bangladesh 158,512,570 160,411,249 97.929. Japan 126,999,808 126,818,019 105.7210 Nigeria 178,516,904 183,523,432 96.3511. United Kingdom 63,489,234 63,843,856 102.7012. Sri Lanka 21,445,775 21,611,842 105.0413. South Africa 53,139,528 53,491,333 105.77
World 7,243,784,121 7,324,782,255 98.33http://statisticstimes.com/population/countries-by-sex-ratio.php
7. Density of Population
7.1 Population density is an often reported and commonly compared statistics for places all over the world. Population density is the measure of the number of population per unit area. It is commonly represented as people residing per square kilometer. As per 2011 census, the density of population in Delhi worked out at 11320 persons per square kilometer as against the national level of 382 persons per square kilometer. Density of population in Delhi was the highest among all States and Union Territories during the year 2011. District-wise density of population in Delhi in 2001and 2011 is presented in Statement 2.8.

ECONOMIC SURVEY OF DELHI, 2017-1822
Statement 2.8
DISTRICT-WISE POPULATION DENSITY OF NCT DELHI: 2001 AND 2011
S.
No.
Districts Population Density (Persons per Sq. Km)2001 Rank 2011 Rank
1. North East 29,468 1 36155 12. Central 25,855 2 27730 23 East 22,868 3 27132 34 West 16,503 4 19563 45. North 13,246 5 14557 56. South 9,068 6 11060 67. North West 6,502 7 8254 78. New Delhi 5,117 8 4057 99. South West 4,169 9 5446 8
Delhi 9340 11320Source: - Census of India, census 2011(Primary Census Abstract).
7.2 It is evident from Statement 2.8 that North East District ranks the first in terms of population density in Delhi at 36155 persons per Sq. Km and New Delhi ranks last district with population density at 4057 persons per Sq. Km. During the last decade the density of population in New Delhi showed a declining trend from 5117 persons per sq.km in 2001 to 4057 persons per sq. Km in 2011.
8. Household Size
8.1 Number of persons living together in one house commonly called as household size. As per 2011 census, there were 3340538 households in Delhi. The average size of household in Delhi was found of 5.02. It indicates that in one house there had more than five persons. More than one half of the households had more than five members during the year 2011. The distribu-tion of households by size in Delhi in 2001 and 2011 are presented in Statement 2.9.

ECONOMIC SURVEY OF DELHI, 2017-18 23
Statement 2.9
DISTRIBUTION OF HOUSEHOLDS BY SIZE IN DELHI- 2001 & 2011
S.
No.
Size of Household No. of Household Per cent of total No. of Household
2001 2011 2001 20111. One member 99786 123106 3.90 3.70
2. Two members 206925 252370 8.10 7.60
3. Three members 295216 428403 11.56 12.80
4. Four Members 544289 803065 21.31 24.00
5. Five Members 506711 681142 19.84 20.40
6. Six to Eight Members 680065 853773 26.63 25.607. Nine or more members 221157 198679 8.66 5.90
Total Households 2554149 3340538 100.00 100.00
Source: -Census of India 2011.
9. Literacy Rate
9.1 As per the Census 2011, Delhi showed a high level of literacy i.e. 86.2 per cent as com-pared to 81.67 per cent in 2001 with the literacy rate of 90.9 per cent for males and 80.8 for fe-males. The Rural and Urban literacy rates of Delhi were 81.9 and 86.3% respectively in 2011.
10. Age-wise Distribution of Population
10.1 The age-wise distribution of population is the best indicator of future human potential, the magnitude of responsibility of working population especially for taking care of children and their age-old parents. The information regarding the age-wise distribution of population in Delhi during the last two census periods is presented in Statement 2.10.

ECONOMIC SURVEY OF DELHI, 2017-1824
Statement 2.10
AGE-WISE DISTRIBUTION OF POPULATION IN DELHI: 1991, 2001 & 2011
S.
No.
Age Group 1991 2001 2011
Number Per cent
Number Per cent Number Per cent
1. 0-14 3273482 34.75 4492939 32.44 4565319 27.19
2. 15-19 914871 9.71 1427979 10.31 1667375 9.93
3. 20-24 982866 10.43 1426860 10.30 1764060 10.51
4. 25-29 956788 10.16 1358925 9.81 1668326 9.94
5. 30-39 1438035 15.26 2211006 15.96 2753943 16.40
6. 40-49 867731 9.21 1432467 10.34 2008410 11.96
7. 50-59 504149 5.35 759505 5.48 1196361 7.13
8. 60 or more 439520 4.67 719650 5.20 1147445 6.83
9. Age not stat-ed
43202 0.46 21176 0.15 16702 0.1
Total 9420644 100.00 13850507 100.00 16787941 100.00
Source: -Census of India. Primary Census Abstract 2011
10.2 It may be observed from Statement 2.10 that one third of total population in Delhi during 2001 was in the category of children within the age group of 0 to 14 and the percentage change was recorded at a minimal rate. The condition was more or less same in all other age-wise cat-egories either at positive in one group or at negative in consecutive age group. The information regarding age-wise distribution of Population of Delhi during 2001 is depicted in Chart 2.3.

ECONOMIC SURVEY OF DELHI, 2017-18 25
Chart 2.3:
AGE-WISE DISTRIBUTION OF POPULATION IN DELHI 2011
11 Metro Cities Population
11.1 The population of metropolitan cities in India is presented in Statement 2.11.
Statement 2.11
POPULATION OF SOME METROPOLITAN CITIES IN INDIA: 2001 & 2011
S. No.
Metropolitan Cities
Population (Number) Ranks2001 2011 2001 2011
1. Mumbai 16,434,386 18,414,288 1 12. Delhi 12,877,470 16,787,941 3 23. Kolkata 13,211,853 14,112,536 2 34. Chennai 6,560,242 8,696,010 4 45. Bangalore 5,701,456 8,499,399 6 56. Hyderabad 5,742,036 7,749,334 5 6
Source: - Census of India and Provisional Population census 2011.
11.2 It may be observed from Statement 2.11 that Delhi was placed at the third position during 2001 and came to second position during 2011. Population in Mumbai in 2001 was 16.43 million; 3.55 million higher than the Delhi’s population. The difference between the population of Mumbai and Delhi in 2011 (census 2011) reduced to 2.1 million which clearly indicate the fast develop-ment of national capital city, Delhi. The population of metro cities in India during 2011 is depicted Chart 2.4.

ECONOMIC SURVEY OF DELHI, 2017-1826
Chart 2.4
POPULATION OF METRO CITIES IN INDIA-2011
11.3 As the population increases, more people will prefer to live in large cities. Many people will live in the growing cities with over 10 million inhabitants, known as megacities. Megacities were numbered 16 in 2000. By 2025, there will be 27 megacities. The top ten largest urban agglomer-ations of the world during 2000, 2011 and 2025(projected) are presented in Statement 2.12.
Statement 2.12
TOP 10 LARGEST URBAN AGGLOMERATIONS: 2000, 2011 & 2025
(Million)
S. No
2000 2011 2025 (projected)Cities Population Cities Population Cities Population
1. Tokyo 34.5 Tokyo 37.2 Tokyo 38.7
2. Mexico City 18.0 Delhi 22.7 Delhi 32.9
3. New York 17.9 Mexico City 20.4 Shanghai 28.4
4. Sao Polo 17.1 New York 20.4 Mumbai 26.6
5. Mumbai 16.1 Shanghai 20.2 Mexico City 24.6
6. Shanghai 13.2 Sao Polo 19.9 New York 23.6
7. Kolkata 13.1 Mumbai 19.7 Sao Polo 23.2
8. Delhi 12.4 Beijing 15.6 Dhaka 22.9
9. Buenos Aires 11.9 Dhaka 15.4 Beijing 22.6
10 Los Angels 11.8 Kolkata 14.4 Karachi 20.2
Sources: -1. United Nations, World Urbanization Prospects the 2011 Revision 2.http://www.un-.org/en/development/desa/population/publications/pdf/urbanization/WUP2011_Report.pdf

ECONOMIC SURVEY OF DELHI, 2017-18 27
11.4 It may be observed from Statement 2.12 that three cities in India (Mumbai, Kolkata and Delhi) shown as the top ten largest urban agglomerations of the world during 2000 and 2011 (Mumbai, Delhi and Kolkata). In 2000 Kolkata ranked 7th largest urban agglomerations in the world. All the three period placed Tokyo in Japan first in terms of number of population in urban agglomerations. The information regarding the growth rate of population in largest urban agglom-erations of the world during 2000-2011 is presented in Statement 2.13.
Statement 2.13
GROWTH RATE OF POPULATION IN LARGEST URBAN AGGLOMERATIONS DURING
2000-2011 & 2000-2025
S. No.
Name of Cities
Population (million) Annual Growth Rate (Per cent)
2000 2011 2025 (project-ed)
2000-2011 2000-2025
1. Tokyo 34.5 37.2 38.7 0.71 0.492. New York 17.9 20.4 23.6 1.27 1.273. Mexico City 18.0 20.4 24.6 1.21 1.474. Sao Polo 17.1 19.9 23.2 1.49 1.435. Kolkata 13.1 14.4 18.7 0.90 1.716. Mumbai 16.1 19.7 26.6 2.03 2.617. Delhi 12.4 22.7 32.9 7.55 6.61
Sources: - 1. United Nations, World Urbanization Prospects the 2011 Revision 2.http://www.un.org/en/development/desa/population/publications/pdf/urbanization/WUP2011_Report.pdf
11.5 It may be observed from Statement 2.13 that highest annual growth rate of population during 2000-2011 and projected growth rate during 2000-2025 was recorded highest in Delhi at 7.75 per cent and 6.61 per cent per annum respectively. While Mumbai and Kolkata recorded second and third positions during the period. The attributes towards highest growth of population in Delhi may be due to higher rate of migration of people from neighboring states as well as from other parts of the nation.
12. Urban- Rural Scenario in Delhi
12.1 At the beginning of 21st century, more than 93 per cent of the population was in urban ar-eas as compared to 53 per cent in 1901. This clearly indicates fast growth of urbanization in the national capital. The information regarding the urbanization trend in Delhi during the century is presented in Statement 2.14.

ECONOMIC SURVEY OF DELHI, 2017-1828
Statement 2.14
URBANIZATION TREND OF DELHI DURING 1901-2011
S.
No
Census Year Population (Number) Growth (Per cent)Total Urban % of
urban to total
Decadal AEGR
1 1901 405819 214115 52.762 1911 413851 237944 57.50 11.13 1.13 1921 488452 304420 62.32 27.94 2.54 1931 636246 447442 70.33 46.98 3.95 1941 917939 695686 75.79 55.48 4.46 1951 1744072 1437134 82.40 106.58 7.37 1961 2658612 2359408 88.75 64.17 5.08 1971 4065698 3647023 89.70 54.57 4.49 1981 6220406 5768200 92.73 58.16 4.6
10. 1991 9420644 8471625 89.93 46.87 3.811 2001 13850507 12905780 93.18 52.34 4.212 2011 16787941 16368899 97.50 26.83 1.92
Source: - Census of India Provisional Population Totals, NCT of Delhi Series 8, Paper 1 of 2011.
Note: - AEGR means Annual Exponential Growth Rate.
12.2 District-wise urban and rural population of NCT of Delhi during the last census is men-tioned in Statement 2.15.

ECONOMIC SURVEY OF DELHI, 2017-18 29
Statement 2.15
DISTRICT-WISE URBAN & RURAL POPULATION OF DELHI: 2011
S.
No.
District Population (Number) % of Urban PopulationUrban Rural Total
1. North West 3442589 213950 3656539 94.15
2. North 870232 17746 887978 98.00
3 North east 2220097 21527 2241624 99.04
4. East 1705816 3530 1709346 99.79
5. New Delhi 142004 -- 142004 100.00
6. Central 582320 -- 582320 100.00
7. West 2536823 6420 2543243 99.75
8. South West 2149282 143676 2292958 93.73
9. South 2719736 12193 2731929 99.55
Delhi 16368899 419042 16787941 97.50
Source: -Census of India and Primary census Abstract 2011
12.3 The Statement 2.15 indicates that two districts of Delhi has 100 percent of urban population namely in Central and New Delhi districts during the year 2011. All the remaining districts in Delhi had more than 90 per cent of the population lived in urban areas.
13 Vital Rates
13.1 Vital rates are perhaps the most widely used national, state, and local data generally includes birth, death and infant mortality rates. The information regarding vital rates (Both Civil Registration System and Sample Registration System) in Delhi is presented in Statement 2.16.
13.2 Civil Registration System is the legal recording of the occurrence of vital events (birth and death) through a network of government offices and designated officials, together with certain identifying or descriptive characteristics of the events on a continuous, permanent and compul-sory basis. Civil Registration System also serves as the tool for measuring the changes in the population. In other words population census held once in a period of 10 years gives stock of population at a point of time whereas; Vital statistics presents the flow of population.

ECONOMIC SURVEY OF DELHI, 2017-1830
Statement 2.16
VITAL RATES IN DELHI: CRS AND SRS
S. No
Year *Estimated Mid Year
Population (Lakh)
Vital Rates (Per Thousand)Birth Rate Death Rate Infant Mortality
RateCRS* SRS CRS* SRS CRS SRS
1. 2001 139.40 21.23 18.9 5.81 5.1 24 292. 2002 142.10 21.18 17.2 6.05 5.1 16 303. 2003 144.86 20.78 17.3 6.07 5.0 17 284. 2004 147.68 20.72 18.4 5.76 4.7 13 325. 2005 150.54 21.52 18.6 6.24 4.6 13 356. 2006 153.47 21.05 18.4 6.45 4.7 18 377. 2007 156.45 20.58 18.1 6.46 4.8 25 368. 2008 159.49 20.94 18.4 6.77 4.8 18 359. 2009 162.58 21.77 18.1 6.89 4.4 19 33
10. 2010 165.74 21.66 17.8 7.48 4.2 22 3011. 2011 168.96 20.89 17.5 6.63 4.3 22 2812. 2012 172.24 20.90 17.3 6.10 4.2 24 2513. 2013 175.59 21.07 17.2 5.52 4.1 22 2414. 2014 179.00 20.88 16.8 6.77 3.8 22 2015. 2015 182.47 20.50 16.4 6.82 3.6 23 1816. 2016 186.01 20.38 15.5 7.61 4.0 21.35 18
Source: -Office of Chief Registrar, Births & Deaths, Government of NCT Delhi.
*Estimated midyear population based on Census 2011
Notes: -CRS- Civil Registration System and SRS- Sample Registration System.
13.3 It may be inferred from Statement 2.16 that the vital rates of Delhi during 2001-2016 under CRS showed a mixed trend in birth and infant mortality rates. On the contrary the death rate by CRS indicated slightly a increasing trend. Under SRS system birth rate, death rate and infant mortality rate showed a decreasing trend.
14. Migration
14.1 The estimates of migration in Delhi are based on birth and death rates and total increase in population. It may be observed from Statement 2.17 that the percentage of migration was 33.05 per cent in 2016, while the percentage of natural growth in 2016 was 66.94 per cent. In absolute terms, natural increase in population during 2016 was 2.37 lakh, whereas migration has been estimated at 1.17 lakh. The trend of migration from 2001 to 2016 is given in the Statement 2.17.

ECONOMIC SURVEY OF DELHI, 2017-18 31
Statement 2.17
TREND OF MIGRATION IN DELHI 2001-2016 (Lakh)
S.
No.
Year Estimated Mid Year Popula-
tion
Increased Popula-tion Over Previous
Year
Total Natural Increase
MigrationBirth Death
1. 2001 139.40 -- 2.96 0.81 2.15 --2. 2002 142.10 2.7 3.01 0.86 2.15 0.553. 2003 144.86 2.76 3.01 0.88 2.13 0.634. 2004 147.68 2.82 3.06 0.85 2.21 0.615. 2005 150.54 2.86 3.24 0.94 2.30 0.566. 2006 153.47 2.93 3.23 0.99 2.24 0.697. 2007 156.45 2.98 3.22 1.01 2.21 0.778. 2008 159.49 3.04 3.34 1.08 2.26 0.789. 2009 162.58 3.09 3.54 1.12 2.42 0.67
10. 2010 165.74 3.16 3.59 1.24 2.35 0.8111. 2011 168.96 3.22 3.53 1.12 2.41 0.8112 2012 172.24 3.28 3.60 1.05 2.55 0.7313 2013 175.59 3.35 3.70 0.97 2.73 0.6214 2014 179.00 3.41 3.74 1.21 2.53 0.8815 2015 182.47 3.47 3.74 1.25 2.49 0.9816 2016 186.01 3.54 3.79 1.42 2.37 1.17
Source: -Office of Chief Registrar, Births & Deaths, Government of NCT Delhi.
*Estimated midyear population based Census 2011
Notes: - 1. Natural Increase of population means the difference between total births and deaths.2. Migrated2. 2.Migrated population is the difference between increased population and natural increase in population.
15. Disabled Population in Delhi
15.1 As per 2011 census more than 2.34 lakh persons in Delhi were under the category of disabled and constitute 1.4 per cent of the total population in Delhi. The distribution of disabled population by sex, type of disability in NCT Delhi is presented in Statement 2.18.

ECONOMIC SURVEY OF DELHI, 2017-1832
Statement 2.18
DISABLED POPULATION IN DELHI-2011
S. No
Disability in Disabled Population (Number)Urban Rural Total
Male Female Male Female Male Female Total1. Seeing 16434 12898 430 362 16864 13260 301242. Speaking 8738 6017 208 131 8946 6148 150943. Hearing 18845 14829 432 393 19277 15222 344994. Walking 39529 25969 1198 687 40727 26656 673835. Mind 16260 9527 417 180 16677 9707 263846. Any Other Disability 21197 14811 586 419 21783 15230 370137. Multiple Disability 13708 10004 397 276 14105 10280 24385
Total 134711 94055 3668 2448 138379 96503 234882 Source: - Census of India. 2011
15.2 It may be inferred from Statement 2.18 that a good percentage of disabled persons facing the problem of blindness or eye related issues. Near about 0.67 lakh persons in Delhi were facing movement disabilities.

ECONOMIC SURVEY OF DELHI, 2017-18 33
CHAPTER 3
STATE DOMESTIC PRODUCTState Domestic Product (SDP), is the total value of goods and services produced during any financial year within the geographical boundaries of a state. Also called the state income, SDP is always calculated or estimated in monetary terms, and is instrumental in the evaluation of per capita income. It serves as an indicator for measuring economic prosperity of the State and to study the structural changes taking place in the economy. SDP estimates over a period of time reveal the extent and direction of the changes in the level of economic development. The Sectoral Composition of Gross State Value Added (GSVA) gives an idea about the relative position of different sectors in the economy over a period of time, which not only indicates the real structural changes taking place in the economy, but also facilitates in formulation of the plans for overall economic development. The major share of income of National Capital Territory of Delhi is from the service sector which is treated as the growth engine for fast developing states in the Indian Union.
2. Estimates at Current Prices
Gross State Domestic Product (GSDP) of Delhi at current prices estimated at 548081 crore, during 2015-16 showed a growth of 10.75 per cent over the preceding year. The GSDP of Delhi at current prices increased to 616826 crore during 2016-17 indicating a growth of 12.54 per cent. The advance estimate of GSDP of Delhi during 2017-18 is likely to attain a level of 686017 crore which is at a growth of 11.22 per cent over 2016-17. Net State Domestic Product (NSDP) of Delhi at current prices during 2015-16 was estimated at 496868 crore, recorded a growth of 10.77 per cent over the previous year. The NSDP of Delhi at current prices increased to 561400 crore during 2016-17 which is at a growth of 12.99 per cent over the previous year. The advance estimate of NSDP of Delhi during 2017-18 is likely to attain a level of 626002 crore which is estimated to grow at 11.51 per cent over 2016-17.
3. Estimates at Constant Prices (Base Year 2011-12)
3.1 Gross State Domestic Product of Delhi (GSDP) at constant prices recorded at 474058 crore, during 2015-16 showed a growth of 10.53 per cent over the preceding year. The GSDP of Delhi at constant prices increased to 514871 crore during 2016-17 indicating a growth of 8.61 per cent. The advance estimate of GSDP of Delhi at constant prices during 2017-18 was recorded at 556800 crore at a growth of 8.14 per cent over 2016-17. Net State Domestic Product (NSDP) of Delhi at constant prices during 2015-16 was estimated at 429149 crore, recorded a growth of 10.55 per cent over the previous year. The NSDP of Delhi at constant prices increased to 465770 crore during 2016-17 at a growth of 8.53 per cent over the previous year. The advance estimate of NSDP of Delhi during 2017-18 at constant prices calculated at 503507 crore which is estimated to grow at 8.10 per cent over 2016-17.
3.2 As a general phenomenon observed in most of the urban economies, Delhi is also showing same trend of higher share in Service Sector. The percentage distribution of Gross State Value Added (GSVA) of Delhi at 2011-12 prices showed a declining trend of agriculture and allied sector, marginal increase in tertiary sector and a downward trend in secondary sector. More clearly, the percentage contribution of agriculture sector to GSVA of Delhi

ECONOMIC SURVEY OF DELHI, 2017-1834
at 2011-12 prices reduced from 3.49 per cent in 2011-12 to 3.20 per cent in 2017-18. During the same period, the contribution of secondary sector to GSVA of Delhi at constant prices decreased from 13.09 per cent to 11.67 per cent. On the contrary, the percentage contribution of service sector to the GSVA of Delhi at 2011-12 prices increased from 83.42 per cent in 2011-12 to 85.13 per cent in 2017-18.
3.3 The information regarding the Gross State Domestic Product and Net State Domestic Product of Delhi during the last seven years both at current and 2011-12 prices is presented in Statement 3.1.
Statement 3.1
GSDP & NSDP OF DELHI – CURRENT AND 2011-12 PRICES ( Crore)
S. No. YearsGSDP at market prices NSDP at market prices
Current Constant (2011-12) Current Constant
(2011-12)
1. 2011-12 (R) 343798 343798 314650 314650
2. 2012-13 (R) 391388 366628 357400 334193
3. 2013-14 (R) 443960 392908 404841 356528
4. 2014-15 (R) 494885 428899 448568 388183
5. 2015-16 (2nd RE) 548081 474058 496868 429149
6. 2016-17 (1st RE) 616826 514871 561400 465770
7. 2017-18 (AE) 686017 556800 626002 503507
Source:- Directorate of Economics and Statistics, Government of NCT of Delhi. Note:- (R) - Revised Estimates, (2nd RE) - Second Revised Estimates, (1st RE) - 1st Revised Estimates, (AE) - Advance Estimates.
3.4 GSDP of Delhi, both at current and constant prices (2011-12) is depicted in Chart 3.1

ECONOMIC SURVEY OF DELHI, 2017-18 35
Chart 3.1
GSDP OF DELHI- CURRENT AND CONSTANT PRICES ( Crore)
616826
686017
366628392908
428899474058
514871556800
343798
391388
443960494885
548081
0
100000
200000
300000
400000
500000
600000
700000
800000
2011-12 2012-13 2013-14 2014-15 2015-16 2016-17 2017-18GSDP At Current Prices GSDP At Constant Prices
3.5 The percentage growth of GSDP and NSDP of Delhi during the last six years both at current and 2011-12 prices is presented in Statement 3.2.
Statement 3.2
GROWTH OF GSDP & NSDP OF DELHI – CURRENT AND CONSTANT PRICES
(In %)
S. No. YearsGSDP at market prices NSDP at market prices
Current Constant (2011-12) Current Constant
(2011-12)1. 2012-13 13.84 6.64 13.59 6.21
2. 2013-14 13.43 7.17 13.27 6.68
3. 2014-15 11.47 9.16 10.80 8.88
4. 2015-16 10.75 10.53 10.77 10.55
5. 2016-17 12.54 8.61 12.99 8.53
6. 2017-18 11.22 8.14 11.51 8.10 Source:- Directorate of Economics and Statistics, Government of NCT of Delhi.

ECONOMIC SURVEY OF DELHI, 2017-1836
3.6 Brief Methodology to Estimate State Domestic Product
3.6.1 The Primary Sector of the economy extracts or harvests products from the earth. The primary sector includes the production of raw materials and basic foods. Activities associated with the primary sector include agriculture (both subsistence and commercial), mining, forestry, farming, grazing, hunting and gathering, fishing and mining & quarrying. The packaging and processing of the raw materials associated with this sector is also considered to be part of this sector. The estimates of GSVA for Agriculture, Forestry & Fishing are compiled by the production method except for the operation of government irrigation system, for which the income method is followed. Estimates of GSVA in Mining & Quarrying industry are compiled from the annual financial statement of the companies for non-departmental enterprises and private corporate enterprises, extracted from MCA21 database.
3.6.2 The Secondary Sector of the economy includes those economic sectors that create a finished, usable product: manufacturing, construction and electricity, gas & water supply. This sector generally takes the output of the primary sector and manufactures finished goods or where they are suitable for use by other businesses, for export, or sale to domestic consumers. For the purposes of estimation of GSVA, the entire manufacturing activities are classified into two broad segments, namely, Manufacturing-‘Organised Manufacturing’ and ‘Unorganised Manufacturing’. Estimates for Organised Manufacturing have been derived using the annual accounts of Non-Departmental Enterprises (NDE), Private corporate sector from MCA data base and quasi-corporations as covered by ASI. The unorganised manufacturing consists of the household enterprises. The effective labour input method has been used for compilation category wise estimation of GVA of unincorporated manufacturing enterprises from the NSS 67th round Survey on Unincorporated Enterprises, 2010-11 and NSS 68th round Employment Unemployment Survey, 2011-12. The GSVA estimates in Electricity sub-sector are prepared using the income method. The estimates are based on the analysis of annual accounts of State Electricity Boards and other electricity undertakings located in the State. The estimates of GSVA in respect of Gas are compiled through the enterprise approach. The estimates of GSVA for Water Supply are compiled for the public and private sectors separately following the income method. The estimates of GSVA for Remediation and Other Utility Services have been compiled by aggregating the estimates for recycling, remediation, sewerage and other waste management services. The estimates of accounted construction for the entire economy are compiled first through the commodity flow approach. The estimates for private corporations are prepared using information on financial parameters of non-government companies from MCA21 database provided by Ministry of Corporate Affairs.
3.6.3 The Tertiary Sector has a pivotal role in the Delhi’s economic development and constitutes a major part of the economy of the State both in terms of employment potential and its contribution to the State Income. The sector covers a wide range of activities from the most sophisticated in the field of Information and Communication Technology to simple services pursued by the unorganized/informal sector workers, such as, vegetable sellers, hawkers, rickshaw pullers, etc. In terms of industrial categories, this sector inter-alia includes sub-sectors like Trade; Hotels and Restaurants; Transport; Storage; Communication; Financial Services; Real Estate, Ownership of Dwelling & Professional Services; Public Administration; and Other Services including Education, Medical and Health. The GSVA for Public Sector segment are obtained through economic analysis of annual reports/accounts. The estimates of Private corporate estimates have been compiled using MCA21 database and NSS Surveys results.

ECONOMIC SURVEY OF DELHI, 2017-18 37
4. Per Capita Income4.1 The per capita income of Delhi at current prices reached at the level of 300793 in 2016-
17 as compared to 271305 in 2015-16 and 249635 in 2014-15. The advance estimate of per capita income of Delhi at current prices during 2017-18 estimated at 329093. The annual growth rate of per capita income of Delhi at current prices during the last six years (2013-18) was worked out at 11.45 per cent, 11.15 per cent, 8.72 per cent, 8.68 per cent, 10.87 per cent and 9.41 per cent over the previous years respectively.
4.2 The per capita income of Delhi at constant prices estimated at 249555 in 2016-17 as compared to 234328 in 2015-16, registering a growth at 6.50 per cent. The advance estimate of per capita income of Delhi at constant prices during 2017-18 is estimated to reach at 264697.
4.3 Delhi’s per capita income was almost three times of the national average, both at current and constant prices. The information regarding per capita income of Delhi and India during the last seven years is presented in Statement 3.3.
Statement 3.3
PER CAPITA INCOME OF DELHI & INDIA DURING 2011-12 TO 2017-18 (In )
YEARCURRENT PRICES(Base Year 2011-12)
CONSTANT PRICES(Base Year 2011-12)
DELHI* ALL INDIA DELHI* ALL INDIA2011-12 (R) 185361 63462 185361 634622012-13 (R) 206590 70983 193175 655382013-14 (R) 229619 79118 202216 685722014-15 (R) 249635 86647 216029 72805
2015-16 (2nd RE) 271305 94731 234328 778262016-17 (1st RE) 300793 103870 249555 82229
2017-18 (AE) 329093 112764 264697 86689 Source:- Directorate of Economics and Statistics, Government of NCT of Delhi.
Note:- (R) - Revised Estimates, (2nd RE) - Second Revised Estimates,
(1st RE) - First Revised Estimates, (AE) - Advance Estimates.
* Projected on the basis of results of Population Census 2011 (Provided by CSO, Govt. of
India).
4.4 It may be inferred from Statement 3.3 that the per capita income of Delhi at current prices increased from 185361 in 2011-12 to 329093 in 2017-18 recorded an annual compound growth rate at 10.04 per cent. During the same period the per capita income of Delhi at constant prices increased at 6.12 per cent per annum. The information regarding per capita income of Delhi and India during the last seven years both at current and constant prices is depicted in Chart 3.2.1 and 3.2.2 respectively.

ECONOMIC SURVEY OF DELHI, 2017-1838
Chart 3.2.1PER CAPITA INCOME OF DELHI AND INDIA AT CURRENT PRICES
Chart 3.2.2PER CAPITA INCOME OF DELHI AND INDIA AT CONSTANT PRICES
Per Capita Income at Current Prices18
5361
2065
90
2296
19
2496
35
2713
05
3007
93
3290
93
6346
2
7098
3
7911
8
8664
7
9473
1
1038
70
1127
64
0
50000
100000
150000
200000
250000
300000
350000
2011-12 2012-13 2013-14 2014-15 2015-16 2016-17 2017-18
Year
`
Delhi All India
1853
61
1931
75
2022
16
2160
29
2343
28
2495
55
2646
97
6346
2
6553
8
6857
2
7280
5
7782
6
8222
9
8668
9
0
40000
80000
120000
160000
200000
240000
280000
2011-12 2012-13 2013-14 2014-15 2015-16 2016-17 2017-18
`
Year
Per Capita Income at Constant (2011-12) Prices
Delhi All India

ECONOMIC SURVEY OF DELHI, 2017-18 39
4.5 The growth rate of per capita income of Delhi and national level both at current and constant prices is presented in Statement 3.4.
Statement 3.4
GROWTH RATE OF PER CAPITA INCOME OF DELHI AND INDIA FROM 2012-13 TO 2017-18
(Per cent)
S. No. YearsDelhi India
Current Constant (2011-12) Current Constant
(2011-12)
1. 2012-13 11.45 4.22 11.9 3.3
2. 2013-14 11.15 4.68 11.5 4.6
3. 2014-15 8.72 6.83 9.5 6.2
4. 2015-16 8.68 8.47 9.3 6.9
5. 2016-17 10.87 6.50 9.6 5.7
6. 2017-18 9.41 6.07 8.6 5.4
Source:- Directorate of Economics and Statistics, Government of NCT of Delhi.
5. Sectoral Composition of GSVA
5.1 As a general phenomenon what is observed in most of urbanized cities in the world, Delhi is also showing the same result, that is the major contribution of income is from the service sector. The analysis of sector-wise contribution in the Gross State Value Added also clearly reveals this fact. The contribution of primary sector (comprising of agriculture, livestock, forestry, fishing, mining & quarrying) to the total GSVA is continuously showing a deteriorating trend during the last seven years. The contribution from secondary sector also showed a declining trend during the last seven years. The composition of GSVA at current and constant prices (2011-12) in three different sectors viz, agriculture, secondary and service sectors of Delhi during 2011-18 is presented in Statement 3.5.

ECONOMIC SURVEY OF DELHI, 2017-1840
Statement 3.5
SECTORAL COMPOSITION OF GSVA (at Basic Prices) IN DELHI-CURRENT AND CONSTANT (2011-12) PRICES
( Crore)S. No. Years
Primary Secondary Tertiary Total Crore % Crore % Crore % Crore %
12011-12a. Current 10585.42 3.49 39682.08 13.09 252964.99 83.42 303232.49 100.00b. Constant 10585.42 3.49 39682.08 13.09 252964.99 83.42 303232.49 100.00
2
2012-13
a. Current 10048.44 2.93 48498.08 14.17 284041.02 82.90 342587.54 100.00
b. Constant 9061.01 2.82 45118.64 14.06 266752.79 83.12 320932.43 100.00
32013-14a. Current 12741.36 3.29 54262.39 14.07 318927.16 82.64 385930.91 100.00b. Constant 10621.54 3.10 47802.34 13.99 283200.89 82.91 341624.77 100.00
42014-15a. Current 12115.29 2.79 53246.72 12.27 368804.95 84.94 434166.96 100.00b. Constant 11128.67 2.95 45131.75 11.99 320017.73 85.06 376278.15 100.00
52015-16a. Current 9790.84 2.06 58072.79 12.19 408613.86 85.75 476477.49 100.00b. Constant 11515.68 2.81 48507.41 11.84 349747.05 85.35 409770.14 100.00
62016-17a. Current 11489.51 2.16 64557.80 12.12 456609.13 85.72 532656.44 100.00b. Constant 14134.90 3.21 51976.61 11.79 374638.22 85.00 440749.73 100.00
72017-18a. Current 11964.45 2.04 70524.33 12.04 503470.53 85.92 585959.31 100.00b. Constant 15087.41 3.20 55070.65 11.67 401813.06 85.13 471971.12 100.00
Source:- Directorate of Economics and Statistics, Government of NCT of Delhi. Totals may not tally due to rounding off.
5.2 As evident from Statement 3.5 that more than 80 per cent of income of Delhi was from service sector, less than 15 per cent from secondary sector and less than 4 per cent from the primary sector. More clearly, the contribution of primary sector which was 3.49 per cent during 2011-12 has come down to 2.04 per cent in 2017-18 at current prices. Similarly, the contribution of tertiary sector recorded at 83.42 per cent in 2011-12 increased to 85.92 per cent in 2017-18 at current prices. Contrary to this, the contribution of secondary sector to income of Delhi declined from 13.09 per cent in 2011-12 to 12.04 per cent in 2017-18.
5.3 The sectoral composition of Gross State Value Added of Delhi during 2017-18 at current and constant prices (2011-12) is depicted in Chart 3.3.

ECONOMIC SURVEY OF DELHI, 2017-18 41
Chart 3.3
SECTOR-WISE COMPOSITION OF GSVA OF DELHI AT CURRENT AND CONSTANT (2011-12) PRICES
(In %)
85.92 85.13
12.04 11.67
2.04 3.200.00
10.0020.0030.0040.0050.0060.0070.0080.0090.00
2017-18 (at currentprices)
2017-18 (at constantprices)
Primary
Secondary
Tertiary
Primary Secondary Tertiary 5.4 Other statistical information pertaining to the Gross State Domestic Product of Delhi is
presented in table 3.1 to table 3.4.

ECONOMIC SURVEY OF DELHI, 2017-1842
CHAPTER 4
PUBLIC FINANCEAs per provision of Government of NCT of Delhi Act, 1991, a Consolidated Fund, separate from that of the Government of India has been constituted with effect from December, 1993. All Revenue and Capital Receipts of Delhi Government are being credited in this fund and all its expenditure under Scheme/Programme/Projects and Establishment is being met out of this Fund.
2. Delhi Government’s Revenue Receipts consist of Tax Revenue, Non-Tax Revenue and Grants-in-Aid from the Centre. The Tax Revenue covers the receipts under SGST/Value Added Tax (VAT), Stamps and Registration Fees, State Excise and Motor Vehicle Tax. On the other hand, its Non Tax Revenue mainly comprises Interest Receipts, Dividend and Profit from investments and Service Charges/Fees/Fines etc. from various Government Departments and various public sector undertakings.
3. The Grants-in-Aid from the Centre includes (i) Establishment Grant viz discretionary grant in lieu of Share in Central Taxes, Grant for specific purposes depending upon the policy of the Government of India from time to time like compensation to meet the losses on account of phasing out of Central Sales Tax (CST)/implementation of SGST/VAT, enhanced compensation to the 1984 riot victims, compensation to Jammu and Kashmir Migrants, grant for improvement of statistical system in various districts of Delhi etc. and (ii) Scheme/ Project Grants as Central Assistance including grant in aid for Centrally Sponsored Schemes, Central Road Fund and JNNURM etc.
4. Similarly, Delhi Government’s Capital Receipt mainly covers recovery of loans and advances from Local Bodies/Undertakings/Government Servants etc. and Small Savings Loan from National Small Savings Fund (NSSF) of the Government of India.
5. The expenditure out of the Consolidated Fund of Delhi is broadly maintained under the Heads of Establishment and Scheme/Project having Centrally Sponsored Scheme (CSS). Further, both the Establishment and Scheme/Project expenditure is maintained under the Heads of Revenue and Capital Account. The classification of expenditure in to Plan and Non Plan has been removed from current financial year 2017-18 and there will only be Revenue and Capital Classification.
6. The Establishment Revenue expenditure of Delhi Government mainly covers the items
like salary and office expenses, interest payment to Government of India, devolution of funds to Local Bodies, Grant-in-Aid to various Public Sector Enterprises (PSEs)/Institutions, Subsidies, if any, being provided by the Government to defray the cost of some items/ services under Establishment etc. On the other hand, the Establishment Capital expenditure of the Delhi Government covers the repayment of loan to the Government of India, loans/advances to the Local Bodies/Government Servants, Public Sector Enterprises etc.
7. The Revenue Expenditure under scheme/project mainly covers cost of equipment’s /grant-in-aid etc. On the other hand, the Capital expenditure under scheme/project covers the Capital Outlay for various infrastructure projects being implemented by Government Departments including Equity capital to the Public Sector Enterprises etc. and loans & advances being provided for remunerative schemes/projects of Local Bodies/PSEs, etc.

ECONOMIC SURVEY OF DELHI, 2017-18 43
8. Delhi Legislative Assembly passed the State Goods and Services Act on 31st May 2017 and thus GST rolled out in Delhi w.e.f 01-07-2017. As a result, erstwhile VAT (excluding items like petroleum, liquor etc) & other taxes viz Entertainment tax, Luxury Tax and Cable TV tax subsumed in GST. Trade & Tax Department, GNCTD made all efforts for smooth migration of all existing VAT dealers in new regime of Goods & Services Tax. Dissemination of related information through printed brochures, deployment of sahayata vahans, one on one contact, organizing camps in major markets, setting up of GST support committees in markets etc were such important steps taken by the Trade & Tax Department. Around 75.23% existing VAT dealers have migrated to GST up to 29-12-2017.
9. Tax Collection of Delhi Government registered a growth of 3.03% in 2016-17(Prov.) as compared to the growth of 13.61% in 2015-16. Motor Vehicle Tax recorded the highest growth of 12.56% in 2016-17(Prov.). Tax collections under VAT (including other taxes of Luxury and Entertainment etc.), Excise, and Stamps & Registration recorded a growth of 4.71%, 0.32% and -8.39% respectively. The tax collection for the year 2017-18 is budgeted with a growth of 19.33% over the previous year.
10. Delhi Government has received Small Saving Loan of 1695.53 crore in 2016-17 (Prov.) as against 2241.13 crore received in 2015-16.
11. Like earlier Central Finance Commissions, Delhi was not covered under the recommendations of Fourteenth Central Finance Commission (14th CFC) whose term covers the period from 2015-16 to 2019-20. Thus, Delhi remains loser on account of the dispensations recommended by the Fourteenth Central Finance Commission to the States which include Share in Central Taxes, Grants-in-aid for Local Bodies on account of basic and performance grants, grants for Calamity Relief etc. Now, Delhi only gets discretionary grants in lieu of Share in Central Taxes and that too is stagnant at 325 crore since 2001-02. Further, in pursuance of the recommendations of the 13th Finance Commission for providing grants for improving statistical system in State and district level, the Government of India released a special grant of 2 crore to Delhi in 2014-15 only.
12. On the other hand, as per Constitutional requirement, the Government of NCT of Delhi is making devolution of funds to its Local Bodies based on the recommendations of Delhi Finance Commission being set up from time to time. Present formula for devolution of funds to Local Bodies in Delhi has been extended based on the recommendations of the Third Delhi Finance Commission whose tenure completed in 2010-11. The Delhi Government set up the Fourth Delhi Finance Commission under the Chairmanship of Sh. P.S. Bhatnagar and the Commission submitted their report to the Government of NCT of Delhi. The decision regarding the Commission’s recommendations are still pending. The Delhi Government constituted the Fifth Delhi Finance Commission in April, 2016 under the Chairmanship of Sh. Sudhir Krishnan. 5th DFC has recently submitted its report to Hon’ble LG.
13. The Delhi Government has implemented a subsidy scheme at 50 per cent on the existing tariff to the domestic consumers of electricity consuming upto 400 units per month with effect from March 2015. Accordingly Government has released an amount of 1577.94 crore on this account during 2016-17. The Government also implemented a scheme of giving 20KL of free water per month to domestic water consumers in Delhi from March 2015 onwards. Accordingly Government has released an amount of 325 crore on this account during 2016-17 to Delhi Jal Board for meeting the expenditure on account of giving free water to consumers.

ECONOMIC SURVEY OF DELHI, 2017-1844
14. Delhi has maintained its consistent Revenue Surplus which was 5043.83 crore in 2016-17 (Prov.) as compared to 8656.30 crore in 2015-16. The budgeted revenue surplus for 2017-18(BE) is 3789.09 crore which is 0.55% of GSDP.
15. The private stage carriage buses run by individual private operators have been replaced with a new scheme for operation of cluster buses being operated by corporate entities to provide better services and safety of journey to the commuters of Delhi. According to the scheme the Government has to meet the viability gap between the cost of operation and revenue earned from such bus scheme. Thus, presently, the Delhi Government has to bear the working losses of both, DTC and Cluster bus scheme.
16. Delhi Jal Board (DJB) has succeeded in meeting their operating expenses from 2010-11. No Non Plan Assistance was provided to them since 2010-11. During 2012-13 to 2014-15 they have maintained revenue surplus, however it turned into revenue deficit in 2015-16, 2016-17 (RE) and 2017-18 (BE).
17. The Delhi Urban Shelter Improvement Board (DUSIB) has been constituted by the Government of NCT of Delhi with effect from 10th July 2010. The DUSIB is looking after the matters relating to notifying slum areas, providing civic amenities to Jhuggie Jhoprie settlements, Resettlement of such residents, etc. During 2016-17 Government of NCT of Delhi provided a non-plan loan of 80 crore for meeting their salary and other administrative expenses.
18. The Municipal Corporation of Delhi (MCD) has been trifurcated into North Delhi Municipal Corporation, South Delhi Municipal Corporation and East Delhi Municipal Corporation vide Government of Delhi’s Notification dated 13th January 2012 to provide better municipal services to the residents of Delhi. These three new Municipal Corporations have inherited debt liabilities in view of poor financial conditions of erstwhile MCD. The Delhi Government provided a Non Plan loan of 1000 crore in 2012-13 and 250 crore in 2013-14. Due to limited availability of resources during 2016-17, Government of NCT of Delhi released 531 crore under non-plan loan to Delhi Municipal Corporations to meet the salary crisis.
19. Delhi’s outstanding debt at the end of March 2017 (Prov.) was 33344.80 crore including the non plan loan received during 2013-14 from Government of India for meeting the outstanding liabilities of DVB/DESU amount of 3326.39 crore. Thus, the outstanding debt of Delhi Government constitutes 5.41% of GSDP during 2016-17.
20. The flow of Plan Grants to Delhi has increased from 1353.27 crore in 2015-16 to 1706.44 crore in 2016-17. Such enhancement in Plan Grants in 2016-17 is mainly because of release of increased grant under NSAP, Normal Assistance and Centrally Sponsored Schemes. GNCTD received an amount of 1706.44 crore consist of 462.89 crore on account of Normal Central Assistance, 81.73 crore as NSAP and 866.55 crore for Centrally Sponsored Schemes (CSS).
21. However, the Non-Plan Grants from the Centre has decreased from 2905.02 crore in 2015-16 to 1118.54 crore in 2016-17 mainly because of receipt of only 690.54 crore as compared to 2572.97crore during the year 2015-16 on account of CST/ VAT compensation which was accumulation of previous years compensation on account of phasing out of Central Sales Tax (CST)/ implementation of Value Added Tax (VAT). It is pertinent to mention that Government of India had released an amount of 85 crore for 1984 riot victims and

ECONOMIC SURVEY OF DELHI, 2017-18 45
18.19 crore as relief to J&K migrants in the year 2016-17.
22. There was Fiscal Deficit of 1050.51 crore in the year 2016-17 (Prov.) as compared to Fiscal Surplus of 1321.92 crore in 2015-16 which is 0.24% of GSDP as compared to 0.17% during 2016-17.
23. Thus, the overall expenditure of Delhi in the year 2016-17 was marginally higher than its income.
24. The details of inflow and outflow of funds of Delhi Government and some of its important financial features are described in the following paragraphs:-
25 Revenue Receipt
25.1 As per population Census- 2011, the population of Delhi has recorded a decadal growth of 21.20 % during 2001-2011 as compared to the growth of 17.67% at the all India level. Thus, in view of increased population growth, it is necessary for the Government to augment its revenue to finance its development schemes/projects in order to cater to the needs and aspirations of the people in Delhi.
25.2 Revenue receipts can broadly be categorized as Tax Revenue, Non-Tax Revenue and Grants-in-aid from the Central Government. The position of revenue receipts of Delhi Government is presented in Statement 4.1. and Charts 4.1 and 4.2 (Ref. Table 4.1 for further details).
Statement 4.1
REVENUE RECEIPT ( in Crore)
S. No. Item 2008-09 2014-15
TGR 2008-
152015-16 2016-17
(Prov.)2017-18
(BE)
1 Stamps and registration (Including Land Revenue) 788.01 2841.67 28.38 3433.96 3145.94 4035.00
2 State Excise 1420.91 3422.39 16.54 4237.69 4251.40 5200.003 VAT 9152.09 18289.31 13.23 20245.82 21144.24 26500.004 Taxes on Vehicles 419.12 1558.83 27.17 1607.01 1808.78 2000.00
5 Other taxes & duties on goods and services 400.57 491.70 6.86 700.53 789.53 965.00
A Tax Revenue (1 to 5) 12180.70 26603.90 15.39 30225.01 31139.89 38700.00B Non-Tax Revenue 2300.72 632.54 -15.88 515.40 380.69 800.00C Grants from the centre 1870.79 2348.14 -7.66 4258.29 2825.16 2716.00
D Total Revenue Receipts (A to C) 16352.21 29584.59 9.05 34998.70 34345.74 42216.00
Sources: 1.Figures for 2008-09 to 2015-16 is from Finance Accounts, GNCTD. 2. Figures for 2016-17 & 2017-18 are from Budget document, GNCTD.
Note: TGR –Trend Growth Rate (%).

ECONOMIC SURVEY OF DELHI, 2017-1846
Chart 4.1REVENUE RECEIPT OF DELHI GOVERNMENT DURING
2014-15 TO 2017-18 (BE) ( in crore)
25.3 The total Revenue Collection of Delhi Government was 34345.74 crore (5.57% of GSDP) in 2016-17 as against 34998.70 crore (6.39% of GSDP) during 2015-16. During 2016-17 (Prov.) the revenue receipts reduced marginally with negative growth of 1.87 % mainly due to fall in non tax revenue and grants from the centre. It is also pertinent to mention the fact that during 2016-17, the tax collections grow by 3.03% in compare to 13.61% in 2015-16. However, there was a negative growth of 33.65% in 2016-17 in grants from the centre as compared to growth of 81.35 % in 2015-16. The growth of non-tax revenue of the Government of NCT of Delhi has been decreased from growth of 60.15% in 2015-16 to negative growth of 32.84% in 2016-17. The targeted revenue collection for the year 2017-18 (BE) is 42216 crore with the growth of 22.91% over the previous year.
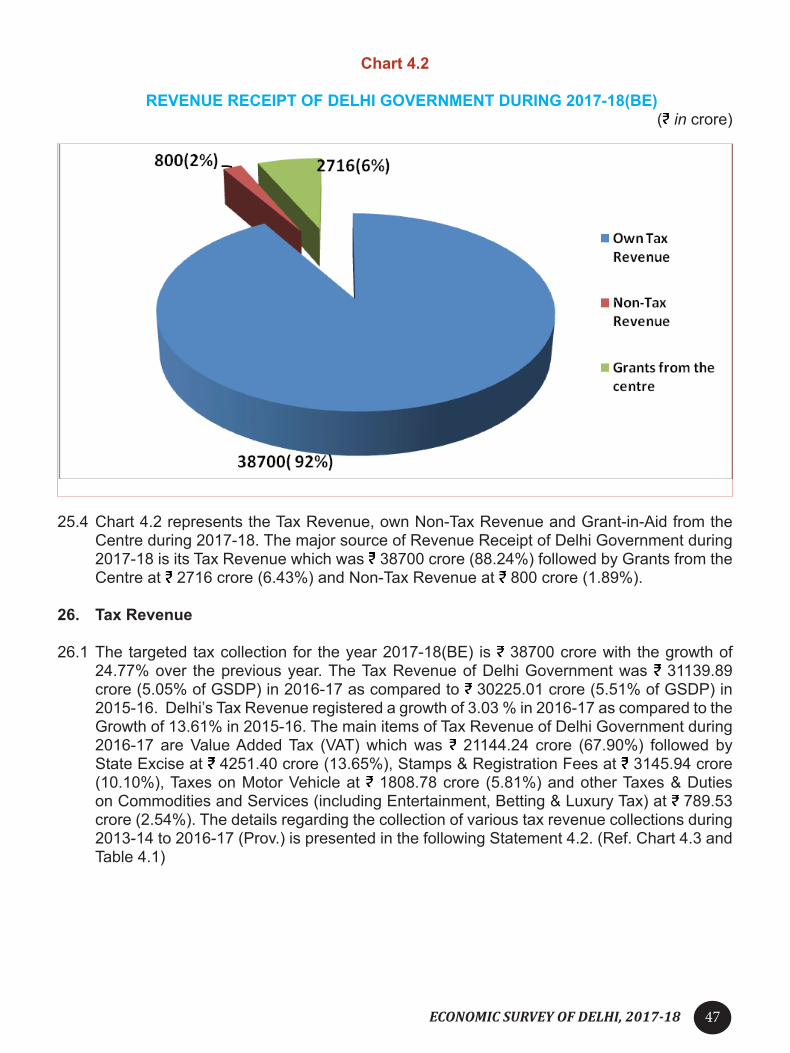
ECONOMIC SURVEY OF DELHI, 2017-18 47
Chart 4.2
REVENUE RECEIPT OF DELHI GOVERNMENT DURING 2017-18(BE)( in crore)
25.4 Chart 4.2 represents the Tax Revenue, own Non-Tax Revenue and Grant-in-Aid from the Centre during 2017-18. The major source of Revenue Receipt of Delhi Government during 2017-18 is its Tax Revenue which was 38700 crore (88.24%) followed by Grants from the Centre at 2716 crore (6.43%) and Non-Tax Revenue at 800 crore (1.89%).
26. Tax Revenue
26.1 The targeted tax collection for the year 2017-18(BE) is 38700 crore with the growth of 24.77% over the previous year. The Tax Revenue of Delhi Government was 31139.89 crore (5.05% of GSDP) in 2016-17 as compared to 30225.01 crore (5.51% of GSDP) in 2015-16. Delhi’s Tax Revenue registered a growth of 3.03 % in 2016-17 as compared to the Growth of 13.61% in 2015-16. The main items of Tax Revenue of Delhi Government during 2016-17 are Value Added Tax (VAT) which was 21144.24 crore (67.90%) followed by State Excise at 4251.40 crore (13.65%), Stamps & Registration Fees at 3145.94 crore (10.10%), Taxes on Motor Vehicle at 1808.78 crore (5.81%) and other Taxes & Duties on Commodities and Services (including Entertainment, Betting & Luxury Tax) at 789.53 crore (2.54%). The details regarding the collection of various tax revenue collections during 2013-14 to 2016-17 (Prov.) is presented in the following Statement 4.2. (Ref. Chart 4.3 and Table 4.1)

ECONOMIC SURVEY OF DELHI, 2017-1848
Statement 4.2
TAX COLLECTION: 2013-14 to 2016-17 ( in Crore)
S.No Item 2013-14 2014-15 2015-16 2016-17 2013 -14 2014-15 2015 -16 2016 -17 (Prov)
Actual Prov. Growth over previous year
1
Stamps and registration (Including Land Revenue)
2969.08 2841.67 3433.96 3145.94 -4.16 -429 20.84 -8.39
2 State Excise 3151.63 3422.39 4237.69 4251.40 9.82 8.59 23.82 0.32
3 VAT 17925.71 18289.31 20245.82 21144.24 13.43 2.03 10.70 4.44
4 Taxes on Vehicles 1409.27 1558.83 1607.01 1808.78 13.63 10.61 3.09 12.56
5
Other taxes & duties on goods and services
463.00 491.70 700.53 789.53 10.28 6.20 42.47 12.70
Tax Revenue(1 to 5) 25918.69 26603.90 30225.01 31139.89 10.61 2.64 13.61 3.03
Chart 4.3TAX REVENUE OF DELHI GOVERNMENT IN 2016-17 (Prov.)
( in Crore)

ECONOMIC SURVEY OF DELHI, 2017-18 49
26.2. The year-wise position of collection of various Taxes and their percentage share during 2012-13 to 2016-17 is shown in Chart 4.4 and Statement 4.3 respectively.
Chart 4.4
YEAR-WISE POSITION OF COLLECTION OF TAXES: 2013-14 to 2016-17 ( in crore)
Statement 4.3PERCENTAGE SHARE OF VARIOUS TAXES
DURING 2013-14 TO 2016-17 (Prov.)(Per cent)
S.No. Item 2013-14 2014-15 2015-16 2016-17
Actual Prov.1 Stamps and registration (Including
Land Revenue) 11.46 10.68 11.36 10.10
2State Excise 12.16 12.86 14.02 13.65
3VAT 69.16 68.75 66.98 67.90
4Taxes on Vehicles 5.44 5.86 5.32 5.81
5 Other taxes & duties on goods and services 1.79 1.85 2.32 2.54
Total 100.00 100.00 100.00 100.00 Sources: Figures for 2013-14 to 2015-16 from Finance Accounts and 2016-17 are from Principal Account Office of GNCTD.

ECONOMIC SURVEY OF DELHI, 2017-1850
26.3 The annual growth of Tax Revenue during 2016-17 (Prov.) was 3.03% as compared to the growth of 13.61% during 2015-16. Stamps & Registration Fees registered an negative annual growth of 8.39% during 2016-17(Prov.) as compared to the growth of 20.8% during 2015-16 due to global economic slowdown which adversely affected the collection under the head. Similarly, VAT registered a growth of 10.70% during 2016-17 against the growth of 2.03% during 2015-16. Similarly, the growth of other Taxes & Duties on Commodities & Services was only 12.70% during 2016-17 as compared to the growth of 42.47% during 2015-16. The growth of State Excise was also reduced at 0.32% during 2016-17 as compared to 23.82 during 2015-16. However, the growth in collection of Taxes on Motor Vehicle was enhanced to 12.56% during 2016-17 as compared to the growth of 3.09% during 2015-16. Similarly the growth of State Excise was at 23.82% during 2016-17 as compared to 8.59% during 2015-16.
27. Non Tax Revenue
27.1 The Delhi Government’s own Non-Tax Revenue mainly consists of interest receipt on account of loans and advances provided by Delhi Government to its Local Bodies and Undertakings, dividends and profits from investments in various Public Sector Undertakings and service charges/fees/fines etc. from various Government Departments. Statement 4.4 and Chart 4.5 indicates the position of Own Non Tax Revenue of Delhi Government.
Statement 4.4
OWN NON-TAX REVENUE OF GNCTD DURING 2013-14 TO 2017-18 (BE)
( in crore)S.
NO. Item 2013-14 2014-15 2015-16 2016-17 2017-18
Actual (Pro.) BE
1 Interest Receipts 379.35 350.52 82.53 81.39 400.00
2 Dividends and profits 11.95 12.90 12.32 11.28 15.00
3 Services Charges 267.84 269.13 420.55 288.02 385.00
Total 659.14 632.54 515.40 380.69 800.00
Sources: Finance Accounts of GNCTD for various years and budget document.

ECONOMIC SURVEY OF DELHI, 2017-18 51
Chart 4.5
BREAK-UP OF OWN NON-TAX REVENUE( in crore)
27.2 The budgeted collection under Non-Tax Revenue for the year 2017-18(BE) is 800 crore. Delhi’s own Non-Tax Revenue was 380.69 crore in 2016-17 (0.06% of the GSDP) as compared to 515.40 crore (0.08% of GSDP) received during 2015-16. During 2017-18 (BE) Delhi Government’s own Non Tax Revenue consisted interest receipt at 400.00 crore (61.39%) followed by service charges of 385.00 crore (48.12%) and dividends and profits at 15.00 crore (1.87%).
28. Grant-in-Aid from the Centre
28.1 The Government of India have categorized the states as Special Category and General Category States for the purpose of providing funds based on some norms generally revenue base of a state, border region etc.
28.2 The Grant-in-aid to Delhi from the Centre consists of discretionary grant in lieu of Share in Central Taxes, Establishment grant for specific purposes like compensation on account of phasing out of Central Sales Tax (CST)/implementation of VAT/ implementation of GST, Grant under Central Assistance for Annual outlay for schemes/projects of Delhi and also grants for Centrally Sponsored Schemes (CSS). The details of grant-in-aid from Centre to Delhi during 2013-14 to 2017-18 are mentioned in Statement 4.5.
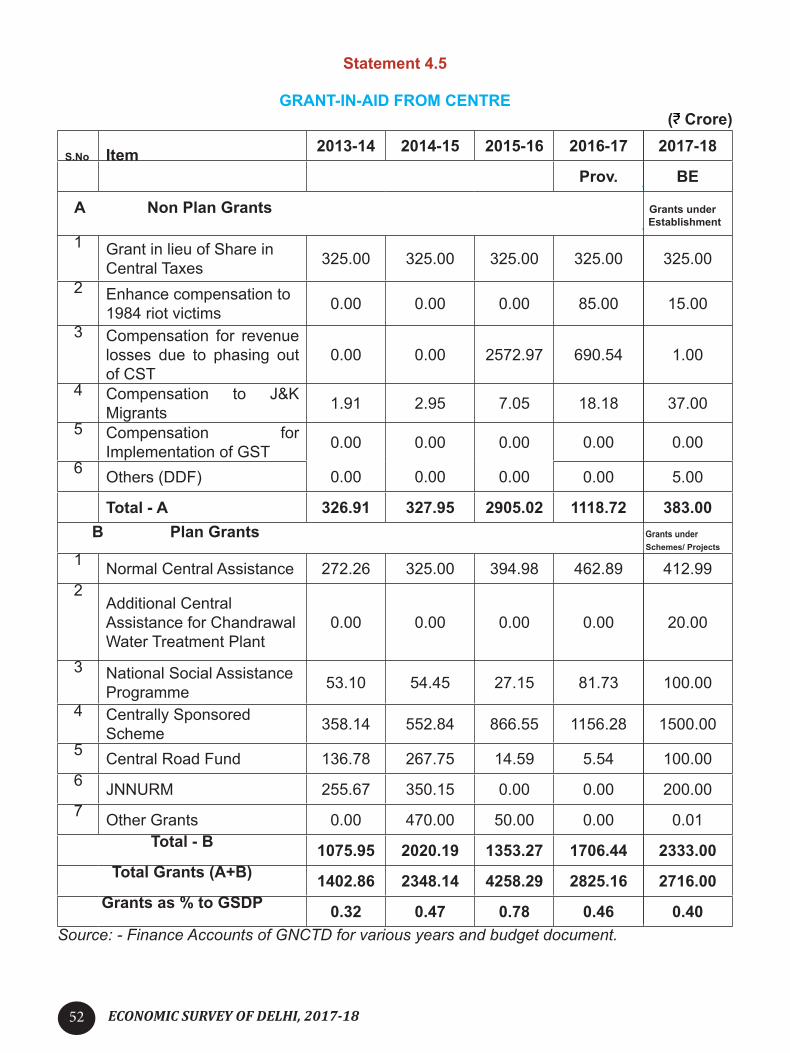
ECONOMIC SURVEY OF DELHI, 2017-1852
Statement 4.5
GRANT-IN-AID FROM CENTRE ( Crore)
S.No Item 2013-14 2014-15 2015-16 2016-17 2017-18
Prov. BE
A Non Plan Grants Grants under Establishment
1 Grant in lieu of Share in Central Taxes 325.00 325.00 325.00 325.00 325.00
2 Enhance compensation to 1984 riot victims 0.00 0.00 0.00 85.00 15.00
3 Compensation for revenue losses due to phasing out of CST
0.00 0.00 2572.97 690.54 1.00
4 Compensation to J&K Migrants 1.91 2.95 7.05 18.18 37.00
5 Compensation for Implementation of GST 0.00 0.00 0.00 0.00 0.00
6 Others (DDF) 0.00 0.00 0.00 0.00 5.00 Total - A 326.91 327.95 2905.02 1118.72 383.00
B Plan Grants Grants under Schemes/ Projects
1 Normal Central Assistance 272.26 325.00 394.98 462.89 412.992
Additional Central Assistance for Chandrawal Water Treatment Plant
0.00 0.00 0.00 0.00 20.00
3 National Social Assistance Programme 53.10 54.45 27.15 81.73 100.00
4 Centrally Sponsored Scheme 358.14 552.84 866.55 1156.28 1500.00
5 Central Road Fund 136.78 267.75 14.59 5.54 100.006 JNNURM 255.67 350.15 0.00 0.00 200.007 Other Grants 0.00 470.00 50.00 0.00 0.01
Total - B 1075.95 2020.19 1353.27 1706.44 2333.00Total Grants (A+B) 1402.86 2348.14 4258.29 2825.16 2716.00
Grants as % to GSDP 0.32 0.47 0.78 0.46 0.40Source: - Finance Accounts of GNCTD for various years and budget document.

ECONOMIC SURVEY OF DELHI, 2017-18 53
28.3 The Delhi Government has received Grant-in-aid of 2825.16 crore in 2016-17 (Prov.) as compared to 4258.29 crore in 2015-16. One of the main reasons for decrease in the grant-in-aid from the Centre during 2016-17 was the due to one time receipt of 2572.97 crore in 2015-16 on account of Compensation for revenue losses due to phasing out of CST which was the accumulation of previous years and release on account of Centrally Sponsored Schemes, etc.
29. Tax Buoyancy
29.1 The Tax Buoyancy indicates the relative growth in Tax Revenue with reference to the growth in the economy being measured by the growth of Gross State Domestic Product (GSDP). The following statement indicates the Tax Buoyancy of Delhi Government during 2012-13 to 2016-17 (Prov.) and 2017-18 BE.
Statement 4.6
TAX BUOYANCY IN DELHI
S. No. Item 2012-13 2013-14 2014-15 2015-16 2016-17
Prov.2017-18
(BE)1 Stamps and registration
(Including Land Revenue)
2.77 -0.31 -0.37 1.94 -0.67 2.52
2 State Excise 0.96 0.73 0.75 2.22 0.03 1.993 VAT 1.08 1.00 0.18 1.00 0.35 2.264 Taxes on Vehicles 1.32 1.02 0.93 0.29 1.00 0.945 Other taxes & duties on
goods and services 0.41 0.77 0.54 3.95 1.01 1.98
Total 1.25 0.79 0.23 1.27 0.24 2.16
29.2. The Tax Buoyancy of Delhi was the highest at 2.16 during 2017-18 as compared to 0.24 during 2016-17. The Tax Buoyancy was the lowest during 2014-15 due to global economic slowdown. The impact was severe in case of Stamps & Registration Fees during 2013-14 and 2014-15.
30. Tax Effort
30.1 Though Delhi is one among the higher per capita income States in the country, its position is 18th in terms of Own Tax/GSDP ratio (5.05%) during 2016-17. The Tax/GSDP ratio in 2016-17 (RE) are Madhya Pradesh (7.26%), Tamil Nadu (6.98%), Punjab (7.14%), Karnataka (7.40%), Uttar Pradesh (7.94%) and Haryana (7.34%). The following Statement indicates the position of Tax Revenue of Delhi as percentage of GSDP viz.-a-viz. the position of all States.

ECONOMIC SURVEY OF DELHI, 2017-1854
Statement 4.7
TAX REVENUE AS % OF GSDP/GDP OF DELHI VIS-À-VIS ALL STATES( in Crore)
S.No. Years
Delhi All StatesTax Revenue % of GSDP Tax Revenue % of GDP
1 2007-08 11783 7.46 286546 6.252 2008-09 12181 6.43 321930 6.073 2009-10 13450 6.18 363060 5.944 2010-11 16478 6.52 460710 6.365 2011-12 19972 5.81 532270 6.096 2012-13 23432 5.99 625930 6.297 2013-14 25919 5.84 712419 6.348 2014-15 26604 5.38 779278 6.269 2015-16 30225 5.51 891013 6.47
10 2016-17 (Prov.) 31140 5.05 1014302 6.65
31. Revenue Expenditure
31.1 The revenue expenditure of the Government of Delhi consists of salary, office expenses, grant-in-aid/ subsidy to Institutions/ Local Bodies under Plan and Non-Plan(up to 2016-17), interest payment to Government of India etc. The position of revenue expenditure of Government of Delhi is presented in Statement 4.8 and Chart 4.6.
Statement 4.8
REVENUE EXPENDITURE OF DELHIGOVERNMENT DURING 2008-09 TO 2017-18(BE)
( in Crore)
S. No Years Establishment Schemes
/Project Total of which Intt.
Payment1 2008-09 7818.42 2511.87 3944.14 11762.562 2009-10 9158.12 2472.93 4742.77 13900.893 2010-11 9490.15 2579.52 4891.59 14381.744 2011-12 11524.00 2917.26 6440.86 17964.865 2012-13 14160.64 2862.88 6498.72 20659.366 2013-14 14904.25 2824.29 7462.28 22366.537 2014-15 15563.19 2774.00 7946.30 23509.498 2015-16 17963.23 2809.81 8379.32 26342.559 2016-17 (Prov.) 20585.32 2882.52 8716.60 29301.92
10 2017-18 BE 26788.46 3006.46 11638.45 38426.91
Sources: Figures for 2008-09 to 2015-16 is from Finance Accounts, 2016-17 are from Principal Account Office and 2017-18 from Budget Documents, GNCTD.

ECONOMIC SURVEY OF DELHI, 2017-18 55
Chart 4.6
REVENUE EXPENDITURE DURING 2011-12 TO 2017-18(BE)( in crore)
31.2 The total Revenue Expenditure of Delhi Government was 29301.92 crore in 2016-17 (Prov.) with a growth of 11.23%. Statement 4.9 indicates the percentage growth of Revenue Expenditure during 2013-14 to 2017-18 (BE).
Statement 4.9
GROWTH OF REVENUE EXPENDITURE OF DELHI GOVERNMENT(Per cent)
S. No Items 2013-14 2014-15 2015-16 2016-17(Prov.)
2017-18(BE)
Total Revenue Expenditure (1+2) 8.26 5.11 12.05 11.23 31.14
32. Interest Payment to Government of India
32.1 The interest liability of Government during a year depends on its outstanding debt in the previous year. The Delhi Government has made interest payment of 2882.52 crore in 2016-17 which is 9.26 per cent of its Tax Revenue during the year. Delhi’s outstanding debt at the end of March 2017 was 33344.80 crore including the non plan loan received during 2013-14 from Government of India for meeting the outstanding liabilities of DVB/DESU amount of 3326.39 crore. The decision regarding the payment of 3326.39 crore received as Non Plan loan from Government of India during 2013-14 is yet to be finalized. The Government of NCT of Delhi has been requesting the Government of India to convert the said amount into Grant in Aid. The position of interest payment of Delhi Government as percentage of its Tax Revenue is shown in the following Statement.

ECONOMIC SURVEY OF DELHI, 2017-1856
Statement 4.10
INTEREST PAYMENT AS PERCENTAGE OF TAX REVENUE( in crore)
S. No. Years Tax Revenue Interest Payment (%)1 2007-08 11782.80 2504.34 21.252 2008-09 12180.70 2511.87 20.623 2009-10 13447.86 2472.93 18.394 2010-11 16477.75 2579.52 15.655 2011-12 19971.67 2917.26 14.616 2012-13 23431.52 2862.88 12.227 2013-14 25918.69 2824.29 10.908 2014-15 26603.90 2774.00 10.439 2015-16 30225.16 2809.81 9.30
10 2016-17 (Prov.) 31139.89 2882.52 9.2611 2017-18 (BE) 38700.00 3006.47 7.77
33. Devolution of funds to Local Bodies
33.1 Devolution of funds to Local Bodies in Delhi (i.e. MCD or its successor entities & NDMC) is being made as per the Government’s decision based on the recommendations of Delhi Finance Commission (DFC). The devolution of funds to Local Bodies covers Basic Tax Share (i.e. share out of net Tax proceeds from Delhi Government) and Non-Plan (up to 2016-17 and Establistment during 2017-18) Grant for specific purposes like education, maintenance of resettlement colonies etc. Though Delhi Cantonment Board (DCB) is not regarded as a Local Body but devolution of funds to them is also being made based on the recommendations of the Delhi Finance Commission.
33.2 The formula for devolution of funds to Local Bodies in Delhi as decided by Delhi Government based on the recommendations of the Third Delhi Finance Commission whose term was 2006-11, has been extended to the years from 2011-12 to 2017-18. Based on the recommendations of Third Delhi Finance Commission, 4% of the net tax proceeds of Delhi Government is being devolved to the Local Bodies as their Basic Tax Share, 5% of the net tax proceeds is being devolved as Non-Plan (up to 2016-17 and Establistment during 2017-18) grant towards meeting expenditure on education/resettlement colonies and 1.5% of the net tax proceeds would be available as municipal reform funds to the successor entities of MCD and NDMC if there is improvement in their revenue and economy in expenditure. The Fourth Delhi Finance Commission submitted its report to the Delhi Government which is still under consideration. The Delhi Government has already set up the Fifth Delhi Finance Commission under the Chairmanship of Sh. Sudhir Krishnan. A Statement indicating the Devolution of funds to Local Bodies during the tenure of 1st, 2nd & 3rd DFC is as follows.

ECONOMIC SURVEY OF DELHI, 2017-18 57
Statement 4.11
DEVOLUTION OF FUNDS TO LOCAL BODIES IN DELHI( Crore)
S.No. Details
Period of 1st DFC
(1996-01)
Period 2nd DFC
(2001-06)
Period of 3rd DFC( 2006-11)2006-08
(Based on the Recommendation
of 2nd DFC)
2008-11(Based on the
Recommendation of 3rd DFC)
2006-11Total
1
Grants in Aida. MCD 644.53 1380.34 1035.11 2577.74 3612.85b. NDMC 48.83 91.50 64.42 170.67 235.09c. DCB 4.82 7.08 3.89 14.31 18.20d. Total 698.18 1478.92 1103.42 2762.72 3866.14
2
Basic Tax Share a. MCD 872.01 1576.83 1151.18 1456.30 2607.48b. NDMC 44.60 51.13 38.09 39.92 78.01c. DCB 11.15 22.93 12.30 18.67 30.97d. Total 927.76 1650.89 1201.57 1514.89 2716.46
3
Totala. MCD 1516.54 2957.17 2186.29 4034.04 6220.33b. NDMC 93.43 142.63 102.51 210.59 313.10c. DCB 15.97 30.01 16.19 32.98 49.17Total 1625.94 3129.81 2304.99 4277.61 6582.60
33.3 The devolution of funds to Local Bodies during the tenure (2006-11) of 3rd DFC is 6582.60 crore with a growth of 110.32 per cent over the devolution during the tenure of 2nd DFC. Out of the total devolution of 6582.60 crore during the tenure of 3rd DFC, an amount of 6220.33 crore (94.5 per cent) was devolved to MCD, 313.10 crore (4.8 per cent) and 49.17 crore (0.7 per cent) respectively were devolved to NDMC and DCB.
33.4 The Municipal Corporation of Delhi (MCD) has been trifurcated into North Delhi Municipal
Corporation, South Delhi Municipal Corporation and East Delhi Municipal Corporation vide Government of Delhi’s Notification dated 13th January 2012 to provide better municipal services to the residents of Delhi. The following Statement indicates the year-wise devolution of funds to Local Bodies during 2012-13 to 2017-18 (BE).

ECONOMIC SURVEY OF DELHI, 2017-1858
Statement 4.12
YEAR-WISE DEVOLUTION OF FUNDS TO LOCAL BODIES IN DELHI ( in Crore)
2012-13 2013-14 2014-15 2015-16 2016-17 (Prov.)
2017-18 (BE)
1 Elementary Education 966.17 1058.97 1108.98 1116.90 1291.54 1430.69a North DMC 411.07 452.59 462.81 475.96 550.56 610.02b South DMC 313.91 345.66 353.46 363.50 420.48 465.89c East DMC 207.94 228.96 234.14 240.79 278.53 308.61d NDMC 29.38 28.12 33.45 32.25 36.94 40.64e DCB 3.87 3.64 25.12 4.40 5.03 5.532 Secondary Education
(NDMC) 36.25 35.01 37.25 40.23 46.00 50.603 Maintenance of School
Building 38.30 42.39 47.47 48.70 55.69 61.25a North DMC 16.87 18.68 20.92 21.46 24.54 26.99b South DMC 12.89 14.26 15.97 16.39 18.74 20.61c East DMC 8.54 9.45 10.58 10.85 12.41 13.654 Maintenance of
Resettlement Colonies 100.00 100.00 100.00 100.00 100.00 100.00
a North DMC 44.06 44.06 44.06 44.06 44.06 44.06b South DMC 33.65 33.65 33.65 33.65 33.65 33.65c East DMC 22.29 22.29 22.29 22.29 22.29 22.295 Maintenance of Capital
Assets 39.78 43.77 41.01 50.29 57.50 63.25a North DMC 14.55 16.11 18.04 18.51 21.16 23.28b South DMC 14.55 16.11 18.04 18.51 21.16 23.28c East DMC 9.19 10.17 11.39 11.68 13.37 14.70d NDMC 1.49 1.38 -6.46 1.59 1.81 1.996 Construction of Dhobi Ghatt
(NDMC) 0.10 0.10 0.10 0.10 0.10 0.107 Basic Tax Assignments
832.53 804.50 893.66 958.90 1021.34 1162.66a North DMC 279.67 270.25 302.66 332.93 332.64 390.56b South DMC 358.79 346.70 388.29 398.36 455.50 501.05c East DMC 151.13 146.04 163.55 179.91 179.75 211.05d NDMC 27.10 26.19 22.00 30.10 33.32 37.86e DCB 15.84 15.32 17.16 17.60 20.13 22.149 Municipal Reform Fund
(MRF) 150.00 0.00 0.00 0.00 374.00 474.39a North DMC 60.00 0.00 0.00 0.00 145.30 Bifurcation
not available
b South DMC 60.00 0.00 0.00 0.00 118.00c East DMC 30.00 0.00 0.00 0.00 110.70
Total (Transfers excluding MRF) 2163.13 2084.74 2228.47 2315.12 2572.17 2868.55
Sources: 1. PAO, GNCTD.

ECONOMIC SURVEY OF DELHI, 2017-18 59
33.5 During 2016-17 (Prov.) a total of 2572.12 crore was devolved to Local Bodies, of which an amount of 972.96 crore (38.17%) was devolved to North Delhi Municipal Corporation, 949.53 crore (36.41%) was devolved to South Delhi Municipal Corporation, 506.35
crore (19.88%) was devolved to East Delhi Municipal Corporation and 118.17crore (4.57%) and 25.16 crore (0.96%) were devolved to NDMC and DCB respectively. 2868.55 crore is budgeted in 2017-18 (BE) as devolution to local bodies.
34. Revenue Surplus
34.1 Delhi has a distinct character of having consistent Revenue Surplus. The budgeted Revenue Surplus for the year 2017-18(BE) is 3789.09 crore. Chart 4.7 indicates the revenue receipt and revenue expenditure position of Delhi Government during 2011-12 to 2017-18(BE).
Chart 4.7
REVENUE RECEIPT & REVENUE EXPENDITURE OF DELHI GOVERNMENT
( in crore)
34.2. The position regarding the revenue surplus/deficit of Delhi viz.-a-viz. all States during the period 2007-08 to 2016-17 (BE) is mentioned in Statement 4.13. Further, Chart No. 4.8 indicates the position of revenue surplus of Delhi Government.

ECONOMIC SURVEY OF DELHI, 2017-1860
Statement 4.13
REVENUE SURPLUS/DEFICIT OF ALL STATES & GNCTD DURING 2008-09 to 2017-18
( in crore)
S. NO. Years Revenue Surplus(+) /Deficit(-) Fiscal Surplus(+) /Deficit(-)
Delhi All States Delhi All States1 2008-09 4590 10700 -2824 1463492 2009-10 6550 -32295 -3550 1995103 2010-11 10642 3050 730 -1614604 2011-12 4428 23960 -2545 -1683505 2012-13 4902 20320 -2285 -1954706 2013-14 5614 -10563 -3943 -2478507 2014-15 6075 -45704 219 -3271908 2015-16 8656 -31106 1322 -4933609 2016-17 (Prov.) 5044 20848 -1051 -449520
10 2017-18(BE) 3789 Not Available -3702 Not Available(Percent to GSDP/GDP)
1 2008-09 2.42 0.24 -1.49 2.542 2009-10 3.01 -0.51 -1.63 3.093 2010-11 4.21 0.04 0.29 -2.234 2011-12 1.29 0.27 -0.74 -1.935 2012-13 1.25 0.20 -0.58 -1.976 2013-14 1.26 -0.09 -0.89 -2.217 2014-15 1.23 -0.37 0.04 -2.638 2015-16 1.32 -0.23 0.08 -3.619 2016-17 (Prov.) 0.90 0.14 -0.46 -2.96
10 2017-18(BE) 0.55 Not Available -0.54 Not AvailableSources: 1. Finance Accounts, GNCTD.
2. RBI – State Finances – A study of Budgets.
Chart. 4.8 REVENUE SURPLUS OF DELHI GOVERNMENT DURING 2011-17
( in crore)

ECONOMIC SURVEY OF DELHI, 2017-18 61
35. Capital Receipt
35.1 The Delhi Government’s capital receipts consist of loan from National Small Savings Fund (NSSF), recovery of loans and advances from Local Bodies/Public Utilities /Government Servants, etc. The information regarding the capital receipts of Delhi Government is presented in the following Statement.
Statement 4.14CAPITAL RECEIPTS OF DELHI GOVERNMENT
( in Crore)
S. No. Sources 2012-13 2013-14 2014-15 2015-16 2016-17
(Prov)2017-18
(BE)
1. Small Saving Loan 922.41 836.50 1764.32 2241.13 1695.53 2856.00
2. Recovery of Loan & Advances 724.90 802.91 227.61 83.42 212.49 400.00
3.
Non-Plan Loan (For settlement of outstanding liabilities of DESU period)
0.00 3326.39 0.00 0.00 0.00 0.00
Total Capital Receipts 1647.31 4965.80 1991.93 2324.55 1908.02 3256.00Sources: 1. Figures for 2012-13 to 2015-16 is from Finance Accounts, GNCTD.
2. Figures for 2016-17 (Prov.) are from Principal Account Office and 2017-18 from Budget Documents, GNCTD.
35.2 During 2016-17 (Prov.) Delhi Government’s Capital Receipt was 1908.02 crore as compared to 2324.55 crore received during the previous year 2015-16. One of the main reasons for steep rise in Capital Receipts during 2015-16 was due to higher small saving loan amounting to 2241.13 crore received during 2015-16. The recovery of loans and advances increased significantly from 83.42 crore in 2015-16 to 212.49 crore in 2016-17 (Prov). The budgeted capital receipts for 2017-18 (BE) is 3256.00 crore.
36. Capital Expenditure
36.1 The capital expenditure of Delhi Government takes place both under Plan & Non-plan (up to 2016-17) and under schemes / projects and Establishment 2017-18. The capital expenditure under Plan covers the expenditure like capital outlay for various infrastructure projects of the Government and loans and advances to the Local Bodies/Undertakings for development projects/schemes while the Non-Plan capital expenditure includes repayment of loan to Government of India, and non plan loan, if any, provided to the Local Bodies etc. The Statement 4.15 and Chart 4.9 indicate the capital receipts and disbursement of Delhi Government.

ECONOMIC SURVEY OF DELHI, 2017-1862
Statement 4.15
CAPITAL EXPENDITURE OF DELHI GOVERNMENT
( Crore)S. No. Sources 2012-13 2013-14 2014-15 2015-16 2016-17
(Prov) 2017-18 (BE)
1. Plan 6905.77 6777.91 6033.36 6555.28 5386.97 6861.55
2.Non Plan 2293.68 4907.16 1397.25 2297.69 2574.48 2711.54
Of which Loan Repayment 1287.99 1325.29 1346.72 1435.17 1654.62 1682.45
Total Capital Expenditure 9199.45 11685.07 7430.61 8852.97 7961.45 9573.09
Sources: 1.Figures for 2012-13 to 2015-16 is from Finance Accounts, GNCTD. 2. Figures for 2016-17 are from Principal Account Office and 2017-18 from budget
document, GNCTD. 3. Plan and non plan have been merged in 2017-18 the classification now is Scheme/
Project in place of plan and Establishment in place of Non Plan.
Chart 4.9
CAPITAL RECEIPTS & CAPITAL EXPENDITURE OF DELHI GOVERNMENT( Crore)
36.2 The total capital expenditure of Delhi Government during 2016-17 (Prov) was 7961.45 crore which is 21.37% of the total expenditure of 37263.36 crore. Out of total capital expenditure of 7961.45 crore in 2016-17 (Prov), the expenditure under Plan was 5386.97 crore (67.66%) and the remaining 2574.48 crore (32.34%) was under Non-Plan. The Non Plan Capital expenditure steeply rise to 2297.69 crore in 2015-16 (Prov) from 1397.25 crore in 2014-15 due to the disbursement of 551 crore and 250 crore as loan to MCD (North & East) and DPCL respectively. The budgeted total capital expenditure for 2017-18 (BE) is 9573.09 crore which is 19.94% of the total expenditure of 48000 crore.

ECONOMIC SURVEY OF DELHI, 2017-18 63
37. Public Debt
37.1 The Statement 4.16 indicates the outstanding Debt of Delhi Government and its debt servicing liability.
Statement 4.16
PUBLIC DEBT OF GNCTD DURING 2007-17( Crore)
S.NO. Years
Outstanding at the beginning of the
yearReceived Repaid O/s at the
end
1 2007-08 25568.03 746.02 975.09 25338.962 2008-09 25338.96 428.74 386.03 25381.673 2009-10 25381.67 1769.00 606.44 26544.234 2010-11 26544.23 4388.94 793.06 30140.115 2011-12 30140.11 556.08 1087.88 29608.316 2012-13 29608.31 922.41 1287.99 29242.737 2013-14 29242.73 4162.89 1325.29 32080.338 2014-15 32080.33 1764.32 1346.72 32497.939 2015-16 32497.93 2241.13 1435.18 33303.88
10 2016-17(Prov.) 33303.88 1695.53 1654.62 33344.80Sources: 1.Figures for 2007-08 to 2015-16 is from Finance Accounts, GNCTD. 2. Figures for 2016-17 are from Principal Account Office, GNCTD.
37.2 Delhi Government’s outstanding debt stood at 33344.80 crore at the end of March 2017 including the power loan amounting to 3326.39 crore received during 2013-14. Such outstanding debt is mainly on account of receipt of Small Savings Loan from National Small Savings Fund (NSSF) and power loan for settling outstanding liabilities of DESU/DVB received during 2013-14 from the Government of India. As a result of above outstanding debt, the Delhi Government has paid an amount of 2882.52 crore as interest and 1654.62 crore as repayment of principle to the Government of India during 2016-17.
38. Fiscal Deficit
38.1 The Fiscal Deficit is a summary statistical measure that indicates the net borrowing requirement of the Government from all sources. The Delhi Government had a Fiscal Deficit of 1050.51 crore during 2016-17 (Prov.). However, there was Fiscal Surplus of of 1321.92 crore during 2015-16. Chart 4.10 indicates the fiscal deficit/surplus as percentage of GSDP during 2011-12 to 2016-17 (Prov.). However, Delhi Government has projected the fiscal deficit of 3701.55 crore during 2017-18 (BE) which is 0.54% of GSDP.

ECONOMIC SURVEY OF DELHI, 2017-1864
Chart 4.10
GROSS FISCAL DEFICIT/ SURPLUS AS PERCENTAGE OF GSDP OF DELHI
39. Primary Deficit
39.1 Primary Deficit (i.e. the fiscal deficit net of interest payment) is a measure of the net borrowing requirements of the Government to fund its total current consumption and investment expenditure. The Delhi Governments Primary surplus was 1832.01 crore in 2016-17(Prov) as compared to the Primary surplus of 4131.73 crore in 2015-16. However, Delhi Government projected a primary surplus of -695.00 crore during 2017-18 (BE). Chart 4.11 indicates the Primary Deficit/Surplus of Delhi Government during 2011-12 to 2017-18 (BE).
Chart 4.11
PRIMARY DEFICIT/SURPLUS OF DELHI GOVERNMENT ( in crore)
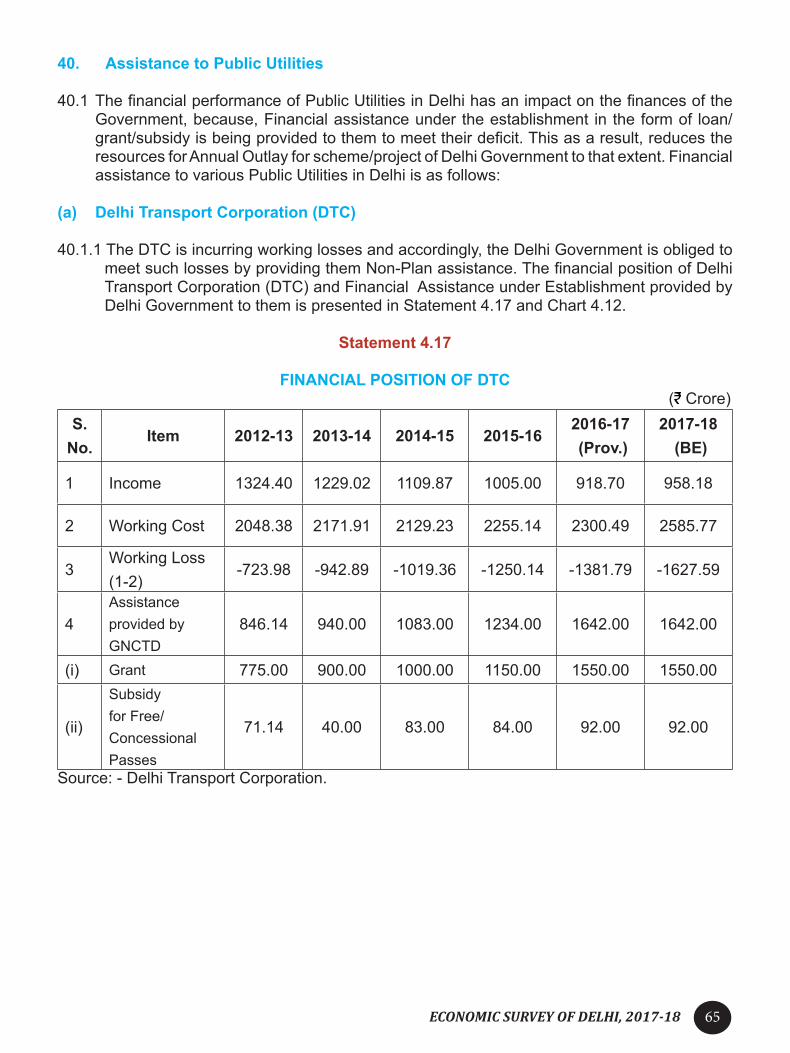
ECONOMIC SURVEY OF DELHI, 2017-18 65
40. Assistance to Public Utilities
40.1 The financial performance of Public Utilities in Delhi has an impact on the finances of the Government, because, Financial assistance under the establishment in the form of loan/grant/subsidy is being provided to them to meet their deficit. This as a result, reduces the resources for Annual Outlay for scheme/project of Delhi Government to that extent. Financial assistance to various Public Utilities in Delhi is as follows:
(a) Delhi Transport Corporation (DTC)
40.1.1 The DTC is incurring working losses and accordingly, the Delhi Government is obliged to meet such losses by providing them Non-Plan assistance. The financial position of Delhi Transport Corporation (DTC) and Financial Assistance under Establishment provided by Delhi Government to them is presented in Statement 4.17 and Chart 4.12.
Statement 4.17
FINANCIAL POSITION OF DTC( Crore)
S.No.
Item 2012-13 2013-14 2014-15 2015-16 2016-17 (Prov.)
2017-18 (BE)
1 Income 1324.40 1229.02 1109.87 1005.00 918.70 958.18
2 Working Cost 2048.38 2171.91 2129.23 2255.14 2300.49 2585.77
3Working Loss (1-2)
-723.98 -942.89 -1019.36 -1250.14 -1381.79 -1627.59
4Assistance provided by GNCTD
846.14 940.00 1083.00 1234.00 1642.00 1642.00
(i) Grant 775.00 900.00 1000.00 1150.00 1550.00 1550.00
(ii)
Subsidy for Free/Concessional Passes
71.14 40.00 83.00 84.00 92.00 92.00
Source: - Delhi Transport Corporation.
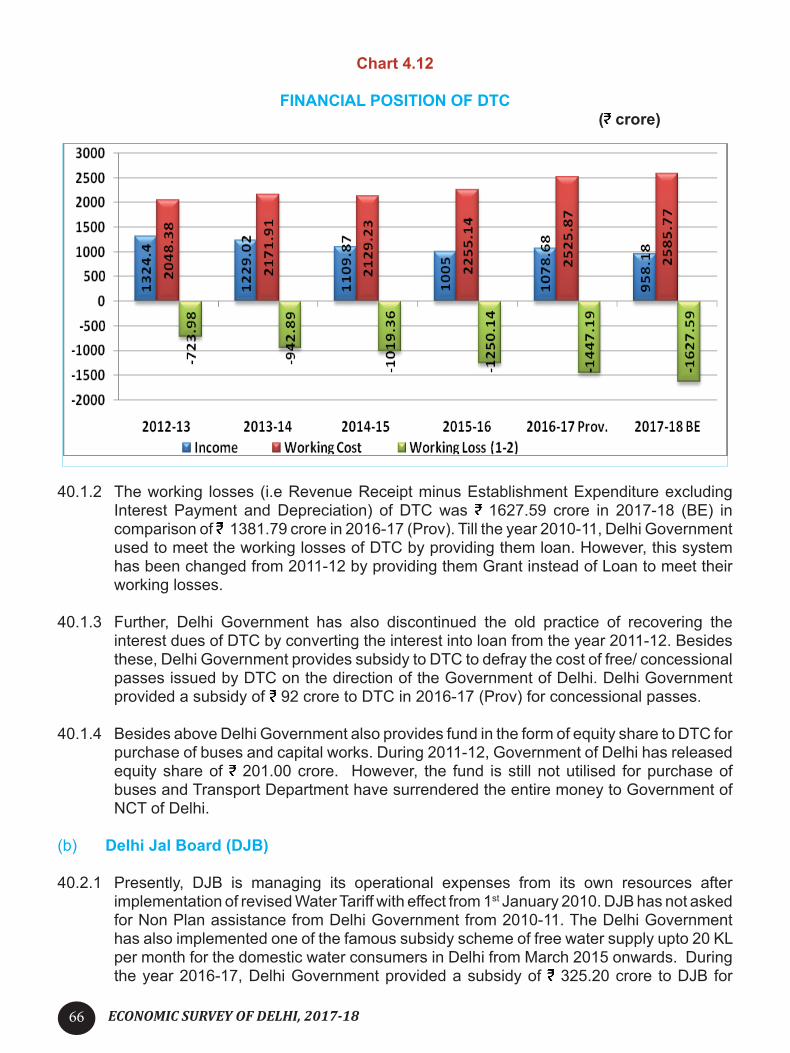
ECONOMIC SURVEY OF DELHI, 2017-1866
Chart 4.12
FINANCIAL POSITION OF DTC ( crore)
40.1.2 The working losses (i.e Revenue Receipt minus Establishment Expenditure excluding Interest Payment and Depreciation) of DTC was 1627.59 crore in 2017-18 (BE) in comparison of 1381.79 crore in 2016-17 (Prov). Till the year 2010-11, Delhi Government used to meet the working losses of DTC by providing them loan. However, this system has been changed from 2011-12 by providing them Grant instead of Loan to meet their working losses.
40.1.3 Further, Delhi Government has also discontinued the old practice of recovering the interest dues of DTC by converting the interest into loan from the year 2011-12. Besides these, Delhi Government provides subsidy to DTC to defray the cost of free/ concessional passes issued by DTC on the direction of the Government of Delhi. Delhi Government provided a subsidy of 92 crore to DTC in 2016-17 (Prov) for concessional passes.
40.1.4 Besides above Delhi Government also provides fund in the form of equity share to DTC for purchase of buses and capital works. During 2011-12, Government of Delhi has released equity share of 201.00 crore. However, the fund is still not utilised for purchase of buses and Transport Department have surrendered the entire money to Government of NCT of Delhi.
(b) Delhi Jal Board (DJB)
40.2.1 Presently, DJB is managing its operational expenses from its own resources after implementation of revised Water Tariff with effect from 1st January 2010. DJB has not asked for Non Plan assistance from Delhi Government from 2010-11. The Delhi Government has also implemented one of the famous subsidy scheme of free water supply upto 20 KL per month for the domestic water consumers in Delhi from March 2015 onwards. During the year 2016-17, Delhi Government provided a subsidy of 325.20 crore to DJB for

ECONOMIC SURVEY OF DELHI, 2017-18 67
meeting the expenditure on account of giving free water to consumers.
40.2.2 The financial position of Delhi Jal Board (DJB) as well as assistance provided by Delhi Government to it for capital projects under Plan is presented in Statement 4.18 and Chart 4.13.
Statement 4.18
FINANCIAL POSITION OF DJB ( in crore)
S.No. Details 2012-13 2013-14 2014-15 2015-16 2016-17
(RE)2017-18 (BE)
1.
Revenue Receiptsa. Water 1426.08 1482.84 1510.47 1935.60 2134.97 2067.94b. Sewerage 464.19 233.01 171.02 204.99 128.40 168.60c. Others 265.01 288.62 279.70 251.56 201.77 259.09Total 2155.28 2004.47 1961.19 2392.16 2465.14 2495.63
2.
Revenue Expenditurea. Establishment 986.51 1051.86 1123.79 1209.13 1575.19 1783.96b. Electricity 449.23 491.26 539.98 597.23 613.00 674.30c. Raw Water 30.17 17.30 21.90 22.70 27.00 27.00d. Property Tax 7.46 10.40 9.67 9.67 9.70 9.70e. Repair & Maintenance 132.57 150.23 126.73 147.52 248.01 265.12f. Chemical, Stores &
Purchase 24.05 32.12 24.99 29.19 30.70 31.25
g. Others 167.66 187.65 63.91 3806.91 4117.30 3703.40
Total 1797.65 1940.82 1910.97 5822.35 6620.90 6494.73
3.Working Surplus/ Deficit(excluding Debt Charges & Depreciation) (1-2)
357.63 63.65 50.22 -3430.19 -4155.76 -3999.10
4. Plan Fund Released 1715.18 1550.00 1789.00 1677.49 1426.00 1755.00Source: - Delhi Jal Board.
40.2.3 It may be inferred from the above table that operation of Delhi Jal Board during 2017-18 (BE) recorded a deficit of 3999.10 crore, however, Delhi Jal Board recorded consecutive working surplus during 2012-13 to 2014-15.

ECONOMIC SURVEY OF DELHI, 2017-1868
Chart 4.13
Financial Position of DJB( in crore)
(c) Power Utilities
39.3.1 Power Sector in Delhi has undergone a major transformation since 2002. From a single State Electricity Board called Delhi Vidyut Board (DVB), the entire sector was divided into 7 independent companies namely, three Distribution Companies [BSES- Rajdhani, BSES-Yamuna and TPDDL], one Transmission Company [i.e. Delhi Transco Ltd.(DTL)], two Generation Companies[i.e. Indraprastha Power Generation Company Ltd.(IPGCL) and Pragati Power Corporation Ltd.(PPCL)] and one Holding Company [i.e. Delhi Power Company Ltd. (DPCL)]. While the DISCOMs are private Companies, the others are all Government owned companies. Presently, Non-Plan assistance is being provided to the Power Utilities in Delhi i.e. to DPCL towards meeting the CPSU dues and subsidy at 50 per cent to consumers of electricity consuming upto 400 units per month with effect from 1st March 2015. During the previous year 2016-17 GNCTD has released an amount of 1753.95 crore for meeting the CPSU dues and electricity subsidy.
40. Finances of Local Bodies
40.1 For civic administration, the NCT of Delhi has been divided into five areas, working independently each other, namely the North Delhi Municipal Corporation, South Delhi Municipal Corporation, East Delhi Municipal Corporation, New Delhi Municipal Council (NDMC) and Delhi Cantonment Board (DCB). The first three new Municipal Corporations have been created after trifurcation of the erstwhile Municipal Corporation of Delhi (MCD). The information regarding area and population of trifurcated Municipal Corporations of Delhi are not readily available. The area and density of population in Municipal Corporations of Delhi as a whole, New Delhi Municipal Council and Delhi Cantonment Board as per the census of 2011is presented in Statement 4.19

ECONOMIC SURVEY OF DELHI, 2017-18 69
Statement 4.19
ESTIMATED AREA & DENSITY OF POPULATION OF LOCAL BODIES IN DELHI
(Approximate)S.
No. Local Bodies Area(Sq. Km)
Population(Lakh)
Density of Population (Persons per Sq. Km)
1. Municipal Corporations of Delhi 1397.29 164.20 11751
2. New Delhi Municipal Council 42.74 2.58 6032
3. Delhi Cantonment Board 42.97 1.10 2568
4. Total 1483.00 167.88 11320
40.2 The position of opening balance, receipts, expenditure and closing balance of New Delhi Municipal Council (NDMC) during 2012-13 to 2017-18 is presented in Statement 4.20 and Chart 4.14.
Statement 4.20
FINANCIAL POSITION OF NEW DELHI MUNICIPAL COUNCIL 2012-13 to 2017-18( in crore)
S. No. Item 2012-13 2013-14 2014-15 2015-16 2016-17
RE2017-18
BE
1 O p e n i n g Balance * 3571.99 3907.16 4074.09 4197.15 4679.83 4788.10
2 Receipts 2365.14 2777.81 3243.81 3351.46 3404.51 3627.08
3 Expenditure 2029.97 2610.88 3120.75 2925.78 3296.25 3621.62
4 C l o s i n g Balance 3907.16 4074.09 4197.15 4679.83 4788.1 4793.55
Source: - New Delhi Municipal Council.* Balance Include items on accrued basis along with cash and bank balance.

ECONOMIC SURVEY OF DELHI, 2017-1870
Chart 4.14
FINANCIAL POSITION OF NEW DELHI MUNICIPAL COUNCIL 2012-13 to 2017-18 ( in crore)
40.3 The following Statement 4.21 indicate non-plan income and expenditure of three entities of Municipal Corporation of Delhi (MCD) viz North Municipal Corporation, South Municipal Corporation and East Delhi Municipal Corporation during 2012-13 to 2017-18 (BE).
Statement 4.21
NON-PLAN INCOME & EXPENDITURE OF MCD DURING 2012-13 to 2017-18 (BE)( in crore)
S.No. Item 2012-13 2013-14 2014-15 2015-16 2016-17 (RE)
2017-18 (BE)
North Delhi Municipal Corporation
1 Opening Balance 0.00 107.88 4.86 0.00 185.96 35.48
2 Receipts 2924.43 2888.34 2924.55 2977.54 4718.54 8010.63
3 Expenditure 2816.55 2991.35 2929.41 2791.58 4869.02 7581.264 Closing
Balance 107.88 4.86 0.00 185.96 35.48 464.85South Delhi Municipal Corporation
1 Opening Balance 134.36 3.95 2.57 600.18 960.78 744.36
2 Receipts 2718.46 2672.00 3235.06 3266.12 3856.33 4195.633 Expenditure 2198.87 2473.38 2637.45 2905.52 4072.75 4643.64
4 Reserve & Surplus 650.00 200.00 NA
5 Closing Balance 3.95 2.57 600.18 960.78 744.36 296.35

ECONOMIC SURVEY OF DELHI, 2017-18 71
S.No. Item 2012-13 2013-14 2014-15 2015-16 2016-17 (RE)
2017-18 (BE)
East Delhi Municipal Corporation1 Opening
Balance 0.00 253.33 47.97 0.07 57.6 24.412 Receipts 1295.64 931.61 1454.71 1471.98 3478.41 3861.223 Expenditure 1042.32 1136.97 1502.60 1414.45 3511.6 3847.444 Closing
Balance 253.33 47.97 0.07 57.6 24.41 38.19
Source: - Municipal Corporation of Delhi.
41. Financing of Annual Outlay for Schemes / Projects
41.1 Financing of Annual Outlay for Schemes / Projects of Delhi is almost similar to that of other States. However, Delhi does not get the benefit of the dispensations recommended by the successive Finance Commissions to the States and also it cannot take resort to Market Borrowing/Negotiated loan/Provident Fund etc for its plan financing. The following Statement 4.22 indicates the achievement of resources during 2012-13 to 2017-18.
Statement 4.22Achievement of Resources during 2012-13 to 2017-18
( in crore)S.
No. Item 2012-13 2013-14 2014-15 2015-16 2016-17 Prov.
2017-18 BE
A Tax Revenue 23431.52 25918.69 26603.90 30225.16 31139.89 38700.00
1 VAT 15803.69 17925.71 18289.31 20245.82 21144.24 26500.00
2 Stamps & Regn. Fees (incl. Land Revenue) 3098.07 2969.08 2841.67 3434.11 3145.94 4035.00
3 Taxes on Motor Vehicle 1240.18 1409.27 1558.83 1607.01 1808.78 2000.00
4 State Excise 2869.74 3151.63 3422.39 4237.69 4251.40 5200.00
5Other Taxes & Duties on Commodities & Services (a to c)
419.84 463.00 491.70 700.53 789.53 965.00
a Entertainment Tax (incl. Cable TV Tax) 117.38 146.14 150.84 241.28 264.07 330.00
b Betting Tax 8.30 10.10 9.88 19.28 33.29 35.00
c Luxury Tax 294.16 306.76 330.98 439.97 492.17 600.00
B Own Non Tax Revenue 626.93 659.14 632.55 515.40 380.69 800.00
1 Interest 340.02 379.35 350.52 82.53 81.39 400.00

ECONOMIC SURVEY OF DELHI, 2017-1872
S.No. Item 2012-13 2013-14 2014-15 2015-16 2016-17
Prov.2017-18
BE
2 Dividends & Profits 26.25 12.90 12.32 11.28 15.00
3 Service Charges & Others 260.66 279.79 269.13 420.55 288.02 385.00
C Share in Central Taxes 325.00 325.00 325.00 325.00 325.00 325.00
D Non Plan Grants from Govt. of India 66.49 1.91 2.95 2580.02 793.72 58.00
E Revenue Receipts (A+B+C+D) 24449.94 26904.74 27564.40 33645.58 32639.30 39883.00
F Net Non Plan Revenue Expenditure 14160.64 14904.25 15563.19 17963.23 20585.32 26788.46
G Balance from Current Revenue (E-F) 10289.30 12000.49 12001.21 15682.35 12053.98 13094.54
H Misc. Capital Receipts (1-2) -1568.78 -777.86 -1169.64 -2214.27 -2361.99 -2311.54
1 Capital Receipts 724.90 4129.30 227.61 83.42 212.49 400.00
2 Non Plan Capital Expenditure 2293.68 4907.16 1397.25 2297.69 2574.48 2711.54
I Small Saving Loan 922.41 836.50 1764.32 2241.13 1695.53 2856.00
JDelhi’s Own Resources (excluding opening balance (G+H+I)
9642.93 12059.13 12595.89 15709.21 11387.52 13639.00
K Central Plan Assistance 1111.03 1075.95 1550.19 1303.27 1706.44 2333.00
L Other Grant from GOI 0.00 0.00 470.00 50.00 0.00 0.00
MAggregate Resources for Annual Plan (without opening balance) (J+K+L)
10753.96 13135.08 14616.08 17062.48 13093.96 15972.00
N Opening Balance 4636.27 1985.74 880.64 1517.06 3644.94 2528.00
OAggregate Resources for Annual Plan including opening balance (M+N)
15390.23 15120.82 15496.72 18579.54 16738.90 18500.00
P Plan Outlay/Expenditure 13404.49 14240.19 13979.66 14934.60 14103.56 18500.00
a Plan 13219.90 13927.49 13378.95 14145.70 13204.54 16958.07
b CSS 184.59 312.70 600.71 788.90 899.02 1541.93
Q Resources Surplus (O-P) 1985.74 880.63 1517.06 3644.94 2635.34 0.00

ECONOMIC SURVEY OF DELHI, 2017-18 73
CHAPTER 5
EMPLOYMENT AND UNEMPLOYMENTEmployment
As per Census 2001, population of Delhi was 138.50 lakh. In 2011 census, the population of Delhi increased to the level of 167.88 lakh which indicate the fact that on an average, population of Delhi increased at 2.12 per cent per annum during 2001-2011. During the same period the proportion of working population to the total population in Delhi increased at the rate of 0.46 per cent. The information regarding population, working population and non-workers in India and Delhi during 1981-2011 is presented in Statement 5.1.
Statement 5.1
Workers and Non-workers in India & Delhi: 1981-2011(Lakh)
Sl. No Details
1981 1991 2001 2011
India Delhi India Delhi India Delhi India Delhi
1. Total Workers
2446.04(35.70)
20.02(32.19)
3141.30(37.11)
29.80(31.63)
4023.60(39.11)
45.45(32.82)
4817.43(39.79)
55.87(33.28)
2. Non-workers
4405.81(64.30)
42.18(67.81)
5322.61(62.89)
64.41(68.37)
6262.51(60.89)
93.05(67.18)
7288.26(60.21)
112.00(66.72)
3. Total Population
6851.85(100.00)
62.20(100.00)
8463.91(100.00)
94.21(100.00)
10286.11(100.00)
138.50(100.00)
12105.69(100.00)
167.87(100.00)
Source: -Census of India, 1981, 1991, 2001& 2011Note: - Figures in parenthesis relate to percentage to total.
1.2 It may be observed from Statement 5.1 that the work participation rate in Delhi during 1981 was 32.19 per cent, reduced to 31.63 per cent in 1991 and slightly increased at 32.82 per cent in 2001 & now in 2011 is 33.28. The growth of workers in Delhi during 1981-2001 was worked out at 6.35 per cent per annum while non-workers were at 6.03 per cent per annum. This was same in the case of national level; where the growth of workers outweighs the growth of non-workers and the difference was worked out at 1.11 per cent per annum during the same period. This clearly indicates the fact that the work participation rate has enhanced both in national level and Delhi. As Delhi is almost a fully urbanized state in the Indian Union, the growth of workers and non-workers were higher than the national level. During the same period the percentage contribution of workers, non-workers in Delhi increased simultaneously with the increase in population. The more details regarding the growth of workers and non-workers in Delhi and India during 1981-2001 are presented in Statement 5.2.

ECONOMIC SURVEY OF DELHI, 2017-1874
Statement 5.2
Growth of Workers and Non-workers in India & Delhi: 1981-2011
S. No Details 1981-91 1991-2001 1981-2001 2001-2011
India Delhi India Delhi India Delhi India Delhi
1.
Workers
a. Absolute Increase (Lakh) 695.26 9.78 882.30 15.65 1577.56 25.43 793.83 10.42
b. Growth (%) 28.42 48.85 28.09 53.82 64.49 127.02 16.47 18.65
2.
Non-workers
a. Absolute Increase (Lakh) 916.80 22.23 939.90 28.64 1856.70 50.87 1025.75 18.95
b. Growth (%) 20.81 52.70 17.66 44.47 42.14 120.60 14.07 16.92
3.
Total
a. Absolute Increase (Lakh) 1612.06 32.01 1822.20 44.29 3434.26 76.30 1819.58 29.37
b. Growth (%) 23.53 51.46 21.53 47.01 50.12 122.67 15.03 17.50
Source: - Census of India, 1981, 1991, 2001 & 2011
1.3 According to Census, main workers were those who were engaged in any economically productive activity for 183 days (or six months) or more during the year. While marginal workers were those who worked for less than 183 days (or six months) in a year. Generally workers category includes both main and marginal workers. The classification of workers, i.e main and marginal workers, non-workers and population of Delhi during the last five censuses is mentioned in Statement. 5.3.

ECONOMIC SURVEY OF DELHI, 2017-18 75
Statement 5.3
Workers, Non-workers and Population in Delhi: 1961-2011(Number)
S. No. Years Workers Non- workers Total
PopulationMain Marginal Total1. 1961 NA NA 854451
(32.14)1804161 (67.86) 2658612
2. 1971 NA NA 1228397 (30.21) 2837301 (69.79) 4065698
3. 1981 1986399 (31.94) 15793 (0.25) 2002192 (32.19) 4218214
(67.81) 6220406
4. 1991 2968377 (31.51) 12084 (0.13) 2980461 (31.64) 6440183
(68.36) 9420644
5. 2001 4317516 (32.82) 227718 (1.65) 4545234 (32.82) 9305273
(67.18) 13850507
6. 2011 5307329(31.61)
279720(1.67)
5587049(33.28)
11200892(66.72) 16787941
Source: - Census of India, 1961, 1971, 1981, 1991, 2001 & 2011Note: - Figures in parenthesis relate to percentage to total population.
1.4 It may be inferred from Statement 5.3 that one third of the total population in Delhi was taking care of remaining two third of the population. It is generally called dependency burden of the working class. It is also observed from the above table that during 1961 and 1971 census not provided the information regarding main and marginal workers and mentioned only in the category of workers. The last census showed the highest percentage of marginal workers at 5 per cent of the workers in Delhi. The information regarding workers, non-workers and population in Delhi during 1961-2011 is depicted in Chart 5.1.
Chart 5.1
Workers, Non-workers & Population of Delhi: 1961 - 2011

ECONOMIC SURVEY OF DELHI, 2017-1876
1.5 The general phenomenon found in most of the urbanized areas is that the percentage of persons engaged in primary agriculture sector is very low. Delhi is also showing the same way, while the persons employed in service sector and industrial sectors constitute a major share. The information regarding category-wise workers (including main and marginal workers) in Delhi during 2011 is presented in Statement 5.4.
Statement 5.4
Category-wise Workers in Delhi- 2011
S. No. Category of Workers
Workers (Number) % of Total WorkersMale Female Total
1. Cultivators 27458 5940 33398 0.60
2. Agricultural Workers 31352 8123 39457 0.71
3. House hold Industrial Workers 152758 29094 181852 3.25
4. Other Workers 4550458 781866 5332324 95.44
5. Total Workers 4762026 825023 5587049 100.00Source: - Delhi Statistical Hand Book, 2013; Census 2011
1.6 It may be inferred from Statement 5.4 that female workers constitutes a less percentage of workers during 2011 and it worked out at 14 per cent of workers in Delhi. The major shares of workers in Delhi were in the category of other workers which includes all industrial and tertiary sector activities at it constitutes at 95 per cent. The information regarding category-wise workers in Delhi is depicted in Chart 5.2.
Chart 5.2
Category-wise Workers in Delhi-2011

ECONOMIC SURVEY OF DELHI, 2017-18 77
2 Employment Surveys in Delhi
2.1 National Sample Survey Office (NSSO) collects the information regarding the characteristics of labour force both employed as well as unemployed through their various rounds. The information regarding the same in Delhi during various rounds of NSSO is presented in Statement.5.5.
Statement 5.5
Employment in Delhi: NSSO Rounds(Lakh)
Sl. No. Rounds of NSSO Estimated
PopulationEmployed Persons
% of Employed persons to
total estimated population
1. 55th Round (July 1999-June 2000) 132.98 38.94 29.28
2. 57th Round (July 2001-June 2002) 139.50 41.75 29.93
3. 59th Round (Jan-December 2003) 148.28 45.49 30.684. 60th Round (Jan-June 2004) 151.28 48.57 32.115. 61st Round (July2004-June 2005) 155.69 50.55 32.47
6. 62nd Round (July2005-June 2006) 160.21 54.26 33.87
7. 64th Round (July 2007-June 2008) 169.55 57.08 33.67
8. 66th Round (July 2009-June 2010) 163.54 52.96 32.38
9. 68th Round (July 2011-June 2012) 170.89 57.06 33.39
Source: - Directorate of Economics and Statistics, GNCTD
2.2 It may be observed from Statement 5.5 that the estimated employed persons in Delhi increased from 38.94 lakh during the 55th round in 1999-2000 to 57.06 lakh in 68th round during 2011-12. The percentage of employed persons to the total population increased during all rounds of NSSO except during the 64th and 66th Round and the difference was worked out at 0.2 per cent & 1.29 per cent respectively. The information regarding employment in Delhi as per NSSO Rounds is depicted in Chart 5.3

ECONOMIC SURVEY OF DELHI, 2017-1878
Chart 5.3
Employment Positions in Delhi- As per NSSO Estimates (Lakh)
2.3 National Sample Survey Organization
The National Sample Survey office collects data on the characteristics of Labour Force (Employed & Unemployed) through various rounds of the N.S.S.O. Since 1972-73, the survey on Employment – Unemployment has become a part of the quinquennial programme of NSSO surveys. The persons surveyed are classified into various activity categories on the basis of activities pursued during certain specified reference periods as Usual Status, Current Weekly Status and Current Daily Status. These are defined as under:-
a. Usual Status: A person is considered working or employed if the person was engaged for a relatively longer period in any one or more work related (economic) activities during the reference period of 365 days preceding the date of survey.
b. Current Weekly Status: A person is considered working or employed if the person was engaged for at least one hour on any one day on any work related (economic) activity during the reference period of seven days preceding the date of survey.
c. Current Daily Status: A person is considered working for the entire day if he had worked four hours or more on any day of the reference week preceding the date of survey.

ECONOMIC SURVEY OF DELHI, 2017-18 79
3 Organized Sector Employment in Delhi
3.1 As the capital city of the country, Delhi accommodates almost all the government offices. Thus job opportunities in the government sector are in plenty. Among all the jobs available, aspirants choose from the administrative, financial, management and executive level jobs of their choice. These jobs have pretty and lucrative remuneration offer.
3.2 Private sector in Delhi also has started showing a sign of strength as their global competitors. Irrespective of the verticals, growing opportunities in the sector make the candidates highly enthusiastic about the growth, value and prospects emerged in the sector. Jobs in Delhi are available in almost all the prominent industry verticals including healthcare, pharmaceutical, media, entertainment, information technology, information technology enabled services, various other service related activities etc. The big players of the industry have established their offshore centers at various places in Delhi to conduct their operations efficiently. The information regarding organized sector employment in Delhi during the last one decade is presented in Statement 5.6.
Statement 5.6
Employment in Organized Sector in Delhi(Fig. in Lakh)
S. No Years
Public Sector Private Sector Total
Central DelhiGovt.
Quasi Govt.
Local Bodies
SubTotal
1. March 1999 2.14 1.14 2.04 0.94 6.26 2.22 8.482. March 2000 2.14 1.13 2.04 0.95 6.26 2.21 8.473. March 2001 2.12 1.14 2.03 0.95 6.24 2.17 8.414. March 2002 2.10 1.20 1.98 0.93 6.21 2.15 8.365. March 2003 2.14 1.21 1.96 0.93 6.24 2.13 8.376. March 2004 2.12 1.21 1.94 0.93 6.20 2.19 8.397. March 2005 2.10 1.20 1.92 0.93 6.15 2.16 8.318. March 2006 2.06 1.20 1.86 0.93 6.05 2.21 8.269. March 2007 2.02 1.21 1.85 0.93 6.01 2.30 8.3110. March 2008 2.04 1.24 1.79 0.93 6.00 2.36 8.3611. March 2009 2.03 1.27 1.79 0.83 5.92 2.51 8.43
Source: - Directorate of Employment, Govt. NCT Delhi.
3.3 It may be inferred from Statement 5.6 that employment in organized sector in Delhi during the last decade showed a retarded trend at 0.2 per cent per annum. During the same period the employment in private sector showed a positive growth at 1.31 per cent per annum. Employment in the public sector especially central government, quasi government and local bodies showed a declining trend while in Government of National Capital Territory Delhi showed a positive growth from 1.14 lakh in March 1999 to 1.27 lakh in March 2009 recorded a growth rate at 1.14 per cent per annum. The information regarding organized sector in Delhi during March 2009 is presented in Chart 5.4.

ECONOMIC SURVEY OF DELHI, 2017-1880
Chart 5.4
Employments in Organized Sector in Delhi- March 2009 (Lakh)
4 Unemployment Scenario in Delhi
4.1 Generally a person who is able and willing to work but unable to find a suitable job is considered as unemployed. The unemployment rate is the number of unemployed workers divided by the total number of labour which includes both the unemployed and those with jobs (all those willing and able to work for pay) or Unemployment rate refers to number of persons unemployed per 1000 persons in the labour force. In practice, measuring the number of unemployed workers actually seeking work is notoriously difficult. There are several different methods for measuring the number of unemployed workers. Each method has its own biases and the different systems make comparing unemployment statistics between countries, especially those with different systems, difficult.
4.2 As per the latest NSSO Survey, the estimated number of unemployed persons in Delhi was around 2.66 lakh during June 2012. The detail regarding the estimated number of employed and unemployed persons in Delhi during 2012 is presented in Statement 5.7.

ECONOMIC SURVEY OF DELHI, 2017-18 81
Statement 5.7
Estimated Employed & Unemployed Persons in Delhi-2016
S. No. Details
Number Employment Rate/
Unemployment RateMale Female Total
1.
Employed
a. Urban 4657580 838753 5496333 96.95
b. Rural 82325 20419 102744 96.30
c. Total 4739905 859172 5599077 96.94
2.
Unemployed
a. Urban 114472 58348 172820 3.05
b. Rural 2225 1727 3952 3.70
c. Total 116697 60075 176772 3.06
3.
Total
a. Urban 4772052 897101 5669153
b. Rural 84550 22146 106696
c. Total 4856602 919247 5775849
Source: Fifth Annual Employment - Unemployment Survey (2015-16), GOI.
4.3 It may be observed from Statement 5.7 that estimated number of workers during 2016 was at 57.75 lakh. The unemployed persons constitute 3.06 per cent of the labour force. The information regarding occupational distribution of unemployed persons registered in employment exchanges in Delhi during 2015-16 is presented in Statement 5.8.

ECONOMIC SURVEY OF DELHI, 2017-1882
Statement 5.8
Occupational Distribution of Unemployed Persons Registered in Employment Exchanges in Delhi 2006-16.
(As on 31st December)
S. No Occupations
Years
2006 2007 2008 2009 2010 2011 2012 2013 2014 2015 2016
1. Professional 111424 83940 97246 54203 98567 165666 226292 276427 329233 360697 379683
2. Administration 581 873 753 1117 1453 1897 2656 3429 4148 5008 5645
3. Clerical 35799 14775 16034 6669 49535 104390 171616 231735 296164 338049 363509
4. Sales 85 75 37 - 16933 29651 57247 87043 104047 119048 122604
5.
Farmers, Fishermen,
Hunters, Loggers & Related
1099 1182 2503 4480 6346 11963 14070 26758 30104 31692 33472
6. Production & Related 46663 31489 38401 13532 21428 30892 38389 44895 51061 56165 62263
7. Service Workers 5239 5542 5533 44929 64253 124008 169545 214020 251841 277283 294062
8. Unskilled 70485 58341 58695 13693 17939 21536 24450 26782 29049 32033 34258
9. Not Classified 285492 255278 287717 275906 216930 153300 70304 1691 1809 1834 1868
10. Total 556867 451495 506919 414539 493384 643303 774569 912780 1097456 1221809 1297364
Source: - Delhi Statistical Hand Book, 2017.
4.4 It may be inferred from Statement 5.8 that the number of unemployed persons registered in employment exchanges in Delhi increased from 5.56 lakh in 2006 to 12.97 lakh in 2016. The occupational distribution of unemployed persons registered in employment exchanges in Delhi during 2016 is depicted in Chart 5.5.
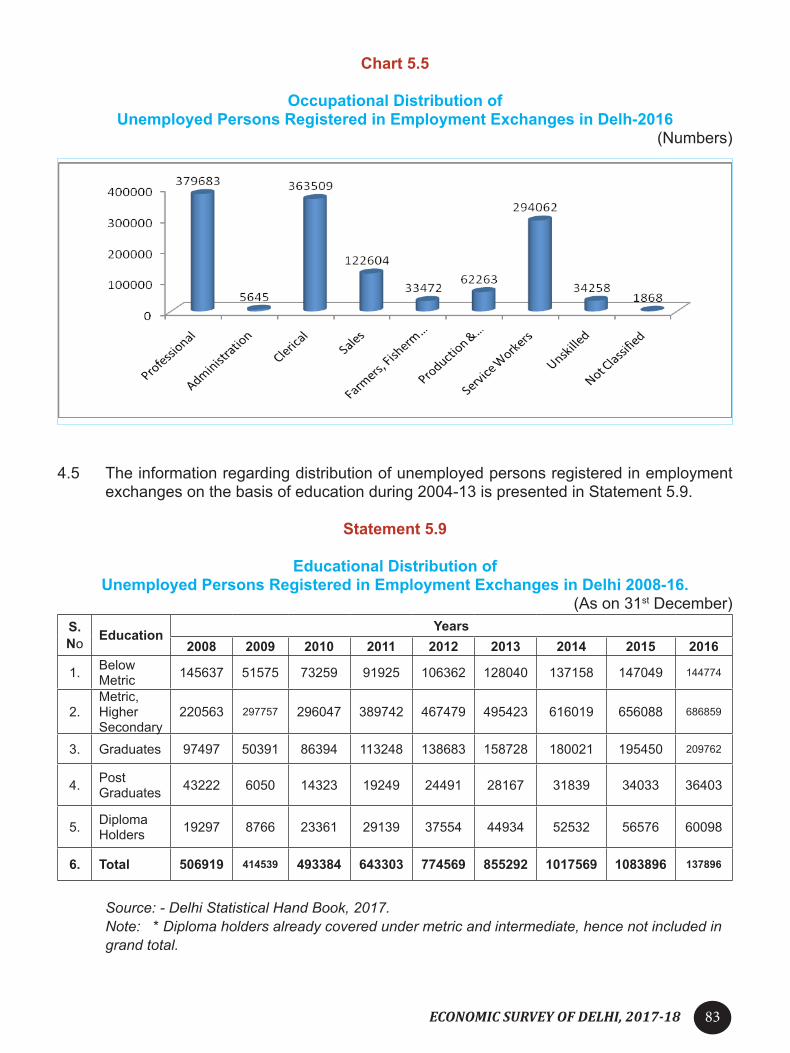
ECONOMIC SURVEY OF DELHI, 2017-18 83
Chart 5.5
Occupational Distribution of Unemployed Persons Registered in Employment Exchanges in Delh-2016
(Numbers)
4.5 The information regarding distribution of unemployed persons registered in employment exchanges on the basis of education during 2004-13 is presented in Statement 5.9.
Statement 5.9
Educational Distribution of Unemployed Persons Registered in Employment Exchanges in Delhi 2008-16.
(As on 31st December)S. No Education Years
2008 2009 2010 2011 2012 2013 2014 2015 2016
1. Below Metric 145637 51575 73259 91925 106362 128040 137158 147049 144774
2.Metric, Higher Secondary
220563 297757 296047 389742 467479 495423 616019 656088 686859
3. Graduates 97497 50391 86394 113248 138683 158728 180021 195450 209762
4. Post Graduates 43222 6050 14323 19249 24491 28167 31839 34033 36403
5. Diploma Holders 19297 8766 23361 29139 37554 44934 52532 56576 60098
6. Total 506919 414539 493384 643303 774569 855292 1017569 1083896 137896
Source: - Delhi Statistical Hand Book, 2017.Note: * Diploma holders already covered under metric and intermediate, hence not included in grand total.

ECONOMIC SURVEY OF DELHI, 2017-1884
4.6 It is evident from the above Statement that, 27 per cent of unemployed persons registered in employment exchange in Delhi had educational qualification of graduation and above during 2016. More than 73 % of the unemployed persons registered employment exchanges in Delhi were in the category matriculate or higher secondary level education. The information regarding the above during 2013 is depicted in Chart 5.6.
Chart 5.6
Educational Distribution of Unemployed Persons Registered in Employment Exchanges in Delhi; 2016
4.7. The information regarding state-wise population, workers, percentage of workers and increase in workers during 2001-2011, distribution of population of Delhi on the basis of workers and non-workers during 1999-2012 and unemployment in Delhi is presented in Tables 5.1, 5.2 and 5.3 respectively.

ECONOMIC SURVEY OF DELHI, 2017-18 85
CHAPTER 6
PRICE TRENDSConsumer price Index (CPI) is a reflection of changes in the retail prices of specified goods and services over a time period, whereas Wholesale Price index (WPI) accounts for changes in general price level of goods at wholesale level. WPI is the primary measure used for ascertaining inflation as it accounts for changes in prices for a given class of goods or services in a given region, during a given interval of time. Price Indices have several potential uses. The index can be said to measure the movement in prices or a cost of living.Some notable price indices are indicated below
1. Wholesale Price Index number-All India (WPI)2. Consumer Price Index number for Industrial Workers (CPI-IW)3. Consumer Price Index number for Agricultural Laborers (CPI-AL)4. Consumer Price Index number for Rural Laborers (CPI-RL)
1.2 The substantial change in prices of essential commodities affect both the quantum of production and the pattern of consumption .The change in prices also make an impact on living conditions of people in general and poor in particular. Therefore, it is absolutely essential to keep a constant watch on price behavior. Statistically index number of prices measures changes in prices over a period of time. The price indices are calculated at wholesale level as well as at retail level.
2. The Wholesale Price Index (WPI) is the only general index capturing price movement in a comprehensive way and is an indicator of movement in prices of commodities in all trade and transactions. It is generally taken as an indicator of the rate of inflation in the economy. The current series of WPI reflects the change in Wholesale Prices over a period as compared to the base year (2011-12=100). The information regarding year-wise whole sale price index from 2012-13 to 2016-17 is presented in Table 6.1.
3. Methodology for Compilation of Whole Sale Price Index
3.1 Wholesale price represents the quoted price of bulk transaction of a commodity generally at primary stage. The revised (current) series of Index Numbers of Wholesale Prices in India with base 2011-12 has replaced the hitherto operated WPI with base 2004-05. The current series is calculated on the principle of weighted arithmetic mean.
3.2 The Price relatives are calculated as the percentage ratios, which current prices bear to those prevailing in the base period. In other words, the price relative for each variety / quotation is calculated by dividing the current price by the corresponding base period (2011-12) price and multiplying the resulting figure by 100. The commodity index is arrived at as the simple arithmetic average of the price relatives of varieties / quotations selected for that commodity. The indices for the sub-groups/ groups/ major groups of commodities in turn are worked out as the weighted arithmetic mean of the indices of the items/sub-groups/groups falling under their respective heads. Being a representative of wholesale trade and transaction and also being available on a weekly basis, WPI is conventionally used as an indicator to measure the rate of inflation in the economy.
4. The rate of inflation during the last five years is depicted in chart 6.1.

ECONOMIC SURVEY OF DELHI, 2017-1886
Chart 6.1
Rate of Inflation in India (Wholesale Price Index) 2012-13 to 2016-17(Per cent)
5. Larger economic integration has allowed developments in international markets to trickle down to all corners of the world. At the same time, such integration has allowed developing nations to play evermore important roles in global markets. In this regard, the rise in commodity prices during this present decade highlights the growing importance of the developing world as its demand for food, energy and materials appears to have been fuelling the current commodity boom.
6. Food price inflation is one of the most talked about issues in the country today. The brunt of the same is being felt across India and across all sections of society. The .farmer or the grower may not be benefited in the ratio of rise in food prices as there are huge imperfections in the market. Demand-supply mismatches and inefficient supply mechanisms result in large price spreads between the growers and final consumers.
7. In addition to low production and productivity, the prevailing market inefficiencies – lack of coordinated efforts in public procurement, wastage due to inadequate storage facilities, etc. have been crucial in allowing food prices to rise sharply. The complex causes of the current food and agriculture crisis require a comprehensive response. The thrust of the government activities is to concentrate on improving food production and productivity, increasing investments in agriculture sector, etc,. Average wholesale prices of some essential commodities in Delhi are presented in Statement 6.1.

ECONOMIC SURVEY OF DELHI, 2017-18 87
Statement 6.1
Average Wholesale Prices of Selected Commodities in Delhi- 2009-2016(In )
S. No Commodities Unit 2009 2010 2011 2012 2013 2014 2015 2016
1. Wheat (308) Per Quintal 1314 1350 1275 1675 1745 1725 1770 1800
2. Gram (grarra) Per Quintal 2644 2372 3300 4200 3300 3450 4200 4690
3. Rice(basmati) Per Quintal 4758 5245 5175 5200 5800 6250 6300 6500
4. Dal Arhar (Split) Per Quintal 4602 6172 6235 6350 6500 6400 10200 11820
5. Dal Moong (Chhilka)
Per Quintal 4351 6940 5775 5400 6300 6550 8425 9050
6. Dal Urd (Chhilka) Per Quintal 3997 6393 4980 4600 4700 5950 10200 11720
7. Mustard Oil (Kachi Ghani) 15 Kg tin 1075 974 1295 1350 1250 1340 1390 1490
8 Ghee (desi) No.1 15 Kg Tin 3035 3456 4110 4250 4300 4200 5250 6800
9. Ghee (vanaspati) 15 Kg Tin 794 858 1120 1110 1125 1050 1000 1200
10. Kerosene Oil Per liter 9.23 9.32 14.83 14.83 NA NA NA NA
11. Hard Coke) Per 40 kg 320 360 440 NA NA NA NA NA
12. Meat Per Quintal 11768 19266 22000 23000 26000 25500 22500 34500
13. Eggs Per 100 No. 187 231 295 270 340 400 400 540
14. Chillies (Red ) Per Quintal 5472 7901 9249 4000 8100 9000 NA 9500
15. Turmeric Per Quintal 5233 14058 5200 5800 7400 8000 9500 9800
16. Sugar Per Quintal 2479 3152 3146 3425 3250 3300 3825 4150
17. Gur Per Quintal 2274 2957 3190 2700 2850 2900 2900 4000
18. Potato Per Quintal 767 535 546 600 710 750 1675 1800
19. Onion (Dry) Per Quintal 996 1283 1015 1125 1100 1200 1000 2375
Source: - Directorate of Agricultural Marketing, GNCTD.
8. Consumer Price Index for Industrial Workers
8.1 Consumer Price Indices are generally used for measuring the trends of retail prices of the most common items of daily consumption. The Directorate of Economics and Statistics, Government of NCT of Delhi collect retail prices of essential commodities from the selected markets viz Moti Nagar, Rani Bagh, Subzi Mandi, Shahdara, Mangol Puri, Azadpur, Govindpuri and Samai Pur Badli on weekly and monthly basis. These rates are provided to Labour Bureau, Shimla for compilation of Consumer Price Index Number for industrial workers. Labour Bureau, Shimla has been compiling and releasing Consumer Price Index on a monthly basis for 78 selected centers in India, including Delhi. The base year of the current series of consumer price index for industrial workers is 2001=100. The

ECONOMIC SURVEY OF DELHI, 2017-1888
old series of base year 1982=100 was replaced by new series base 2001=100 since January 2006. The present series have included eight selected markets in Delhi for data collection of consumer price index for industrial workers as mentioned above. Now, for replacement of the existing series base 2001 by new proposed base 2016 = 100, process for collection of prices have been started simultaneously in the new schedules provided by Labour Bureau. For new series, five new markets (Bawana, Najafgarh, Tilak Nagar, Bhajanpura/Yamuna Vihar and Kotla Mubarakpur) have been added and two existing/old markets (Rani Bagh and Moti Nagar) have been deleted for the new series.
8.2 The Index is separately prepared for six groups and then combined by assigning weights to each group. The highest weight is assigned to food group at 43.75 per cent, followed by miscellaneous at 22.34 per cent, housing at 20.72 per cent, clothing, bedding and footwear at 5.68 per cent, fuel & light at 5.39 per cent and pan, supari, tobacco and intoxicants at 2.12 per cent respectively. The consumer price index number for industrial workers in Delhi during 2016 and 2017 is presented in Statement 6.2.
Statement 6.2Consumer Price Index for Industrial Workers in Delhi
(Base Year 2001=100)
GROUP Group/Sub-Group WEIGHT (%) 2016 2017 % Change
1 FoodA Cereals & Products 8.31 262 284 8.4B Pulses & Products 2.99 384 296 -22.9C Oils & Fats 2.81 235 230 -2.1D Meat, Fish & Eggs 1.85 361 372 3.0E Milk & Products 11.41 276 300 8.7F Condiments & Spices 2.39 258 276 7.0G Vegetables & Fruits 6.36 282 287 1.8H Other Foods 7.63 258 281 8.9
Food Total 43.75 278 289 4.0
2 Pan, Supari, Tobacco & Intoxicants 2.12 288 313 8.7
3 Fuel & Light 5.39 216 226 4.64 Housing 20.72 227 240 5.75 Clothing, Bedding & Footwear 5.68 216 230 6.56 MiscellaneousA Medical Care 3.30 248 247 -0.4
B Education, Recreation & Amusement 6.30 194 196 1.0
C Transport & Communication 5.12 190 199 4.7D Personal Care & Effects 4.44 215 231 7.4E Others 3.18 250 262 4.8
Miscellaneous Total 22.34 213 220 3.3General Index 100.00 246 257 4.5
Source: - Labour Bureau, Shimla.

ECONOMIC SURVEY OF DELHI, 2017-18 89
8.3 It may be inferred from Statement 6.2 that the annual average consumer price index increased from 246 in 2016 to 257 in 2017 registering an increase of 11 points. The increase in consumer price index for industrial workers in Delhi was recorded at 4.5 per cent during 2017 over last year 2016.
8.4 The index for food group increased from 278 in 2016 to 289 in 2017 registering an increase of 11 points (4.0 percent). Index for pan, supari, tobacco & intoxicants increased from 288 to 313 registering an increase of 25 points (8.7 percent). The index of fuel and light increased from 216 in 2016 to 226 in 2017. The index under housing has also increased from 227 to 240 recorded an increase of 13 points (5.7 percent). Index for clothing, bedding and footwear group increased from 216 to 230 registering an increase of 14 points (6.5 percent). Under the miscellaneous group there are certain items like medical care, education, recreation & amusement, transport & communication and personal care & affects the index in this group increased from 213 to 220 registering an increase of 7 points (3.3 percent). Thus the maximum increase was in Pan, Supari, Tobacco & Intoxicants, followed by Clothing, bedding & footwear, Housing, fuel & light, Food groups and Miscellaneous.
9. Price Situation in Other Metros
9.1 Price rise has been the major issue for the majority of citizens in the country. Growth means a better life for our kids. In the last couple of years, prices of essential commodities have gone up. Barring seasonal fluctuations in some commodities like onion, potato and wheat due to decline in arrivals, inclement weather in major producing areas, transportation bottlenecks, increase in cost of movement and lower stocks, the retail prices of most of the essential commodities have exhibited a steady trend in all metro cities in India. The information regarding the consumer price index for industrial workers in metro cities in India during 2001-2016 is presented in Statement 6.3.
Statement 6.3Consumer Price Index for Industrial Workers in Metro Cities in India-
2001-2017(Average Annual Index)
S.No Year All
India%
Change Delhi % Change Kolkata %
Change Chennai % Change Mumbai %
Change1 2001 458 3.9 529 2.9 492 9.1 487 2.5 528 4.62 2002 477 4.1 550 4.0 530 7.7 513 5.3 558 5.73 2003 496 4.0 570 3.6 541 2.1 533 3.9 583 4.54 2004 514 3.6 598 4.9 565 4.4 549 3.0 604 3.65 2005 536 4.3 648 8.4 587 3.9 565 3.0 611 1.26 2005* 116 4.3 116 8.4 115 3.9 114 3.0 118 1.27 2006 123 6.0 122 5.2 121 5.2 118 3.4 126 6.88 2007 131 6.5 128 4.9 132 9.1 124 5.1 134 6.39 2008 142 8.4 137 7.0 142 7.6 135 8.9 144 7.5
10 2009 157 10.6 147 7.3 156 9.9 149 10.4 159 10.411 2010 176 12.1 163 10.9 172 10.3 161 8.1 174 9.4

ECONOMIC SURVEY OF DELHI, 2017-1890
S.No Year All
India%
Change Delhi % Change Kolkata %
Change Chennai % Change Mumbai %
Change
12 2011 192 9.1 176 8.0 185 7.6 171 6.2 192 10.313 2012 209 8.9 191 8.5 199 7.6 196 14.6 212 10.414 2013 232 11.0 209 9.4 222 11.6 218 11.2 237 11.815 2014 247 6.5 223 6.7 239 7.7 230 5.5 257 8.416 2015 261 5.7 234 4.9 251 5.0 248 7.8 276 7.417 2016 274 5.0 246 5.1 261 4.0 255 2.8 287 4.018 2017 281 2.6 257 4.5 266 1.9 261 2.4 289 0.7
Source: - Labour Bureau Shimla,
Notes: - * Converted figure according to the base year 2001=100. Base year 1982=100 changed to 2001=100 w.e.f 01.01.2006
9.2 It may be observed from Statement 6.3 that the Average General Consumer Price Index number (IW) in All India was recorded at 281. For Mumbai it was 289 followed by Kolkata 266, Chennai 261 and Delhi 257 respectively. The highest percentage change was recorded in Delhi at 4.5 percent. The prices of food items at national level increased during 2017 at 1.3 percent as compared to previous year; the highest recorded in Delhi at 4.0 per cent and lowest in Kolkata at 0.7 percent. At national level, the average consumer price index recorded during the year 2017 at 308 in food group while in Delhi recorded at 289. The group-wise price index numbers for industrial workers of mega cities in India during 2016 and 2017 is presented in Statement 6.3. Consumer price index for industrial workers in Delhi and selected megacities in India during 2006-2017 is depicted in Chart 6.2.
Chart 6.2
CPI for Industrial Workers in Delhi & Mega Cities in India 2006-2017

ECONOMIC SURVEY OF DELHI, 2017-18 91
CHAPTER 7
OUTLAY WITH EXPENDITURE AND ALLOCATION UNDER SCHEMES/ PROJECTS
A major change introduced in 2017-18 was doing away with the “plan”-“non-plan” classification of expenditure based on NITI Aayog decision to do away with the Five Year Plans and Annual Plans and Annual Plan 2016-17 was terminating year of 12th Five Year Plan (2012-17). The expenditure, henceforth, will be classified broadly into (i) Establishment Expenditure, (ii) Schemes/Projects, (iii) Centrally Sponsored Schemes (CSS) and (iv) other expenditure which will be categories under revenue and capital heads in budgeting from the year 2017-18. The Schemes/Projects and CSS expenditure needs to be closely monitored and evaluated, as most of these are related to welfare of citizen or infrastructure development.
2. The Government of Delhi presented its first comprehensive Outcome Budget based on output and outcome indicator in 2017-18 moving from traditional budgeting to an “Outcome” based approach of budgeting. Outcome Budget 2017-18 of GNCTD is an attempt to bring a high degree of transparency and accountability in public spending.
3. The main purpose of developing a comprehensive Outcome Budget is to go beyond the current approach that restricts the monitoring of a government’s performance to expenditure monitoring or at best the tracking of Outputs, usually defined as tangible infrastructure or services produced as a result of the project or programme. The following figure illustrates a few examples of how public spending on a programme typically translates to outputs, outcomes and long term goals. Together, this represents the Theory of Change of any programme or intervention.
Link between Public spending, outputs, outcome and long term goals:-
Public Money
`
PROGRAMME/PROJECT OUTPUTS OUTCOMES LONG TERM
GOALS
Building Toilets ToiletsBuilt
People areusing Toilets;find it clean
Open-defecationfree city
Providing SkillTraining/Education
Skilltrainingcoursesconducted
Youth attendthe training;receivecertification
Improvedemployment
BuildingMohalla Clinics
MohallaClinicsare built
People areusing Mohallaclinics; feelsatisfied with its service
Improvedhealth care

ECONOMIC SURVEY OF DELHI, 2017-1892
4. The Outcome Budget 2017-18 of GNCTD covers 34 departments and agencies combined into 8 major sectors. Under each department, major programmes and schemes were identified and key Output and Outcome indicators defined against each of them. Special care was taken to ensure that the indicators were SMART (Specific, Measurable, Attributable, Realistic and Targeted) and comparable across similar programmes and schemes within and across departments. In all, 1938 unique indicators have been developed — 1069 Output indicators and 869 Outcome indicators.
5. The approved outlay and expenditure of Government of National Capital Territory of Delhi under various Five Year Plans and Scheme/Projects 2017-18 is presented in Statement 7.1.
Statement 7.1
OUTLAY AND EXPENDITURE OF DELHI: 1951-2018 ( Crore)
S. No. Plans Plan Outlay Total
Expenditure% of Expenditure
to Plan Outlay
1. 1st Five Year Plan 1951-1956 6.30 4.70 74.602. 2nd Five Year Plan 1956-1961 17.00 15.37 90.413. 3rd Five Year Plan 1961-1966 99.33 93.10 93.734. 4th Five Year Plan 1969-1974 168.77 155.16 91.945. 5th Five Year Plan 1974-1979 363.75 341.34 93.846. 6th Five Year Plan 1980-1985 1039.38 1041.95 100.257. 7th Five Year Plan 1985-1990 2537.34 2631.47 103.718. 8th Five Year Plan 1992-1997 4500.00 6208.32 137.969. 9th Five Year Plan 1997-2002 15541.28 13465.09 86.6410. 10th Five Year Plan 2002-2007 23000.00 22646.00 98.46
11.
11th Five Year Plan 2007-2012 54799.15 53478.86* 97.9511.1. Annual Plan 2007-08 9000.00 8745.32 97.1711.2. Annual Plan 2008-09 10000.00 9619.32 96.1911.3. Annual Plan 2009-10 11300.00 11048.14 97.7711.4. Annual Plan 2010-11 11400.00 10490.81 92.0211.5 Annual Plan 2011-12 14200.00 13575.27 95.60
12.
12th Five Year Plan 2012-2017 90000.00 70497.04** 78.3312.1 Annual Plan 2012-13 15000.00 13237.51 88.2512.2 Annual Plan 2013-14 14700.00 13964.28 95.0012.3 Annual Plan 2014-15 *** 16350.00 13979.68 85.5012.4 Annual Plan 2015-16 16400.00 14960.54 91.2212.5 Annual Plan 2016-17 16500.00 14355.03 87.00
13 Scheme/Progrmme/Projects 2017-18 18500.00 - -
Note: - * Summation of expenditure during 2007-12 ** Summation of expenditure during 2012-16 *** Plan Outlay includes CSS 2014-15 onwords

ECONOMIC SURVEY OF DELHI, 2017-18 93
i. The Statement 7.1 clearly indicates that the plan outlay of Delhi increased from 6.3 crore in the First Five year Plan to 90000 crore in the Twelfth Five Year Plan. During the First (1951-56) to Fifth Five Year Plan (1974-79), the plan expenditure was less than the approved outlay for each Five Year Plan. Plan expenditure was more than the approved outlay during 6th, 7th and 8th Five Year Plan.
ii. Expenditure of the Eleventh Five Year Plan was totaled at 53478.86 crore, which is 97.95
per cent of the total plan outlay.
iii. Expenditure reported in Twelfth Five Year Plan was 70497.04 crore which is 78.33% of total plan outlay.
6. The Agency-wise Plan expenditure of five annual plans of 12th Five Year Plan (2012-17) and Scheme/ Projects 2017-18 is presented in Statement 7.2.
Statement 7.2
AGENCY-WISE EXPENDITURE WITH SCHEME/PROGRMME/PROJECTS( Crore)
S. No
Department/ Agency
12th Five Year Plan (2012-17)
2012-13(Exp.)
2013-14(Exp.)
2014-15(Exp.)
2015-16(Exp.)
2016-17(Exp.)
2017-18(Scheme/ Projects)
1Departments of GNCTD 66895 9682 10333 10312 11469 11186 14812
2North Delhi Municipal Corporation
4414 643 704 747 616 603 741
3South Delhi Municipal Corporation
3989 618 608 534 492 468 530
4East Delhi Municipal Corporation
1993 370 449 421 384 291 348
5New Delhi Municipal Council 79 4 0 5 5 194 99
6 Delhi Jal Board 11000 1717 1550 1789 1724 1385 1755
7 DUSIB 1630 204 320 172 271 229 215Total 90000 13238 13964 13980 14961 14355 18500
* Plan Outlay includes CSS w.e.f. 2014-15
7. The Sectoral Allocation under Scheme/ Projects 2017-18 is presented in Statement 7.3.

ECONOMIC SURVEY OF DELHI, 2017-1894
STATEMENT 7.3
SECTOR -WISE ALLOCATION UNDER SCHEMES/PROJECTS 2017-18 ( Crore)
S.No. Name of Sector Budget 2017-18 % w.r.t.Outlay
1 Education 3525 19.12 Social Security & Welfare 3081.1 16.73 Transport 3056 16.54 Medical 2627 14.25 Urban Development & Housing 2368 12.86 Water Supply & Sanitation 1755 9.57 Rural Development 614 3.38 Other Administrative Services 514.9 2.89 Energy 295 1.6
10 Public Works 234 1.311 Tourism 117 0.612 Science Tech. & Environment 90 0.513 Minor Irrigation & Flood Control 90 0.514 Jail 65 0.415 Industries 31 0.216 Agriculture & Allied Services 26 0.117 Secretariat Economic Services 11 0.1
Total 18500 100
8. It may be inferred from Statement 7.3 that Education Sector has continued to be the first priority sector with maximum share of allocation of 19.1% of the allocated Schemes/Projects 2017-18 followed with Social Security & Welfare (16.7%), Transport (16.5%), Medical & Public Health (14.2%), and Housing & Urban Development (12.8%).

ECONOMIC SURVEY OF DELHI, 2017-18 95
Chart 7.1
ALLOCATION OF PRIORITY SECTOR UNDER SCHEMES/PROJECTS 2017-18
*(Including General & Technical Education, Art & Culture, Sports & Youth Services)
9. The allocation and expenditure of social service sector which include General Education, Technical Education, Sports & Youth Services, Arts & Culture, Medical & Public Health, Water Supply & Sanitation, Housing, Urban Development, Social Welfare, Welfare of SC/ST/OBC/ Minorities, Labour and Employment, Civil Supplies and Nutrition during the Tenth, Eleventh Twelfth Five Year Plans and Schemes/ Programme/ Projects 2017-18 of GNCTD is presented in chart 7.2.

ECONOMIC SURVEY OF DELHI, 2017-1896
Chart 7.2
PLAN OUTLAY & EXPENDITURE ON SOCIAL SERVICE SECTORS IN DELHI DURING 10TH, 11TH, 12TH FIVE YEAR PLAN & SCHEMES/PROJECTS 2017-18
Chart 7.3
SOCIAL SERVICES SECTOR’S OUTLAY DURING 2017-18

ECONOMIC SURVEY OF DELHI, 2017-18 97
10 The Social Sectors all together has a share of 72% of total Schemes/Projects with a total allocation of 13321.0 crore for the Education, Medical & Public Health, Water Supply & Sanitation, Housing and Urban Development, Social Welfare, WCD, Welfare of SC/ST/OBC/Minorities, Nutrition, Labour, Food & Civil Supplies.
Statement 7.4
ALLOCATION OF SOCIAL SERVICE SECTOR IN DELHI DURING 10TH, 11TH &12TH FIVE YEAR PLAN
( Crore)
S. No. Plans Total
Outlay
of which Social Sector
% of Outlay
Total Expenditure
of which Social Sector
expenditure
% of Expenditure
1
Tenth Five Year Plan (2002-2007)a. 2002-03 4760.2 2029.2 43.2 4438.4 1895.6 43.0b. 2003-04 4929.7 2121.0 43.6 4644.7 2013.0 43.7c. 2004-05 4607.8 2409.7 53.2 4312.3 1638.8 38.5d. 2005-06 4775.0 2714.1 57.8 4327.3 2497.8 58.3e. 2006-07 5270.0 3079.2 59.2 5124.2 3005.2 59.1
Total 24342.7 12353.2 51.5 22847.0 11050.4 48.8
2
Eleventh Five Year Plan (2007-2012)f. 2007-08 9000.0 4972.5 55.3 8745.3 4782.5 54.7g. 2008-09 10000.0 5790.9 57.9 9619.3 5528.0 57.5h. 2009-10 11300.0 6190.8 54.8 11048.1 6026.2 54.5i. 2010-11 11400.0 6748.8 59.2 10490.8 6184.9 59.0j. 2011-12 14200.0 8635.5 60.8 13575.3 8026.3 59.1
Total 54799 32338.4 55.85 53479 30547.7 57.12
3
Twelfth Five Year Plan (2012-2017)k. 2012-13 15000.0 9179.4 61.2 13237.5 8529.9 64.4l. 2013-14 14700.0 9732.5 66.2 13964.3 9109.1 65.2m. 2014-15 16350.0 11028.1 67.5 13979.7 9605.2 68.7n. 2015-16 16400.0 11253.9 68.6 14960.5 10198.2 68.2o. 2016-17 16500.0 12217.0 74.0 14355.0 10596.1 73.8
Total 90000.0 53410.9 67.7 70497.0 48038.5* 68.1** Expenditure and % Plan outlay of 2012-13, 2013-14, 2014-15,2015-16 and 2016-17.

ECONOMIC SURVEY OF DELHI, 2017-1898
S.No Schemes/Programme/Projects Total
Outlay
of which Social Sector
% of Outlay
Total
Expenditure of which
Social Sector expenditure
% of
Expenditure
4. Schemes/Programme/Projects 2017-18 18500.0 13321.0 72.0 - - -
11 It is evident from the above statement that the allocation in social service sectors in Delhi increased from 51.47 per cent in 10th Five Year Plan to 67.65 per cent in 12th Five Year Plan. On the other side the expenditure incurred on social service sector in Delhi increased from 48.79 per cent in 10th Five Year Plan to 68.14 per cent in 12th Five Year Plan. However, approved outlay for the year 2017-18 is 18,500 crore, out of which 13,321 crore was earmarked for Social services sector which is 72% of total outlay.
12 Other statistical information relating to sectoral outlay and expenditure of Government of National Capital Territory of Delhi may be seen in the Table 7.1 to 7.10 respectively.

ECONOMIC SURVEY OF DELHI, 2017-18 99
CHAPTER 8
ENVIRONMENTAL CONCERNSRapid rise in population and speedy economic development has raised the concern for the environmental degradation in Delhi because of which Delhi is one of the heavily polluted city in India, having for instance one of the country’s highest volumes of particulate matter pollution. Unprecedented scale and speed of urbanization in Delhi and consequent pressure on physical and social infrastructure has created damaging stress on living environment and affected the level of pollution adversely. Increase in number of vehicles in Delhi is far faster than construction of roads. Agriculture burning in the NCR and neighbouring states is one of the major contributor of the particulate and other gaseous pollutants in Ambient Air of Delhi. Besides, there is air pollution due to heavy construction activities, water pollution owing to dumping of untreated industrial and municipal wastes in the river and excessive ground water exploration. Recharging of ground water is the need of the hour. The government is emphasizing on rain water harvesting and solar energy in order to reduce pollution from thermal power. Sewage water gets discharged in storm water drain causing serious contamination. Hazardous waste, bio-medical waste and electronic waste are serious threat to environment. These are increasing with urbanization and economic development in the city. Government took various steps to increase the Green cover of the state. Government is also promoting Green buildings for conservation of water and reduction in generation of solid and liquid waste. This chapter dwells upon the various dimension of pollution including sources, past and present status and efforts made to reduce the pollution level in Delhi.
2. Ambient Air Quality
2.1 The city of Delhi has a complex urban environment with respect to air pollution and faces severe air pollution of PM10, PM2.5 and NO2. There are several prominent sources within and outside Delhi contributing to PM10, PM2.5 and NO2 in ambient air; these pollutants can be taken as surrogate of other pollutants also, as most of the pollutants coexist and have common sources. Year-wise annual mean ambient air quality levels in Delhi during 2001 to 2017 is presented in Statement 8.1.
Statement 8.1
AMBIENT AIR QUALITY LEVELS IN DELHI: 2001-2017
S. No
Years Ambient Air Quality (µg/m3)SO2 NO2 CO RSPM (PM10)
1 2001 14.1 41.8 4183 1502 2002 11.3 50.8 3258 1923 2003 9.5 55.8 2831 170
4 2004 9.3 57.4 2581 160
5 2005 8.8 55.9 2541 168
6 2005 8.8 55.9 2541 168
7 2007 4 38 2460 161

ECONOMIC SURVEY OF DELHI, 2017-18100
S. No
Years Ambient Air Quality (µg/m3)
SO2 NO2 CO RSPM (PM10)
8 2008 5 43.1 2461 2019 2009 5 47.3 1768 248
10 2010 5 46 1937 249
11 2011 15 66 2020 281
12 2012 18.2 82.4 2020 293
13 2013 20.1 77.5 2100 28214 2014 16.9 79 1700 318
15 2015 17.6 73 1618 268
16 2016 19.9 70.2 2090 290
17 2017 23.36 73.55 2130 263Standard 50 40 2000 60
Source: - Department of Environment, GNCTD/CPCB & DPCC
2.2 The values for 2001 to 2010 are of the monitoring stations of CPCB while the values of 2011 to 2017 are of the monitoring station network developed by Delhi Pollution Control Committee. Upto last year, the air quality was being monitored through 6 CAAQMS. However, from 2017-18, 20 new CAAQMS have been installed in 20 new locations, Hence, DPCC presently monitors air quality through 26 online continuous ambient air quality monitoring stations at 26 locations. The six stations can be classified in two categories i.e. residential (R.K. Puram, Mandir Marg & Punjabi Bagh) and hot spots (I.G.I Airport and Anand Vihar). Civil Lines is also influenced by traffic emissions. Statement 8.2 shows the annual average of critical pollutants in Delhi for the Year 2017. Sustained efforts by the Government of Delhi along with the cooperation of all stakeholders, Delhi is showing signs of improvement in reducing / controlling the pollution level since past few years.
Statement 8.2ANNUAL AVERAGE OF CRITICAL POLLUTANTS AT SIX STATIONS IN DELHI (in µg/m3)
FOR THE YEAR 2017
S. No. Locations SO2 NO2 PM10 PM2.5 O3 CO (mg/ m3)
1 R. K. Puram 30.25 62.49 256 136 49.21 2.18
2 Mandir Marg 14.03 51.85 196 108 24.58 1.95
3 Punjabi Bagh 24.25 93.09 244 125 51.78 1.57
4 Civil Lines 19.90 72.17 207 170 42.98 2.38
5 IGI Airport 27.17 73.12 N/A N/A 56.26 N/A
6 Anand Vihar 24.60 88.59 410 151 48.85 2.59 Source: - Department of Environment, GNCTD.

ECONOMIC SURVEY OF DELHI, 2017-18 101
2.3 Sulphur Dioxide (SO2): No significant variation was observed in the annual average value from 2011 to 2017. The values monitored were always within the prescribed limits of 50µg/m3 at all stations. The minimum value was observed at Mandir Marg and maximum was observed at R.K. Puram.
2.4 Nitrogen Dioxide (NO2): Annual average of NO2 concentration has shown the marginal increase from year 2011. In 2017, the average value was 73.55 µg/m3. The minimum value was observed at Mandir Marg and maximum at Anand Vihar. The higher values may be due to high vehicular density in the area. At all the monitoring locations annual average exceeded the prescribed standard of 40 µg/m3.
2.5 Carbon Monoxide (CO): The value of CO in 2017 varied from 1.57 mg/ m3 to 2.59 mg/m3
at different stations. The minimum value was observed at Punjabi Bagh and maximum at Civil lines.
2.6 Particulate Matter for measuring Pollution: One way of measuring pollution is by the measure of particulate matter. Particulate matter is basically a mixture of extremely small particles and liquid droplets like acids, chemicals, gas, water, metals, soil dust particles, etc, the measurement of which gives an ideas of the pollution of a city. It is also known as particle pollution or PM.
2.7 Particulate Matter (PM10): Concentration of PM10 varied from 196 µg/m3 to 410 µg/m3
at different stations. The minimum value was observed at Mandir Marg and maximum at Anand Vihar.
2.8 Particulate Matter (PM2.5): Concentration of PM2.5 varied from 108 µg/m3 to 170 µg/m3
at different stations. The minimum was observed at Mandir Marg and maximum at Civil Lines.
2.9 Ozone (O3): The concentration of ozone varied from 24.58 µg/m3 to 56.26 µg/m3 in 2017. The minimum was observed at Mandir Marg and maximum at IGI Airport. The maximum value was observed during the summer months at Civil lines station which exceeds the prescribed limits of 100 µg/m3.
2.10 Keeping in view deteriorating ambient air quality in Delhi and need to implement area specific interventions, Government has decided to augment the Ambient Air Quality monitoring infrastructure by installing 20 new state of art Continuous Ambient Air Quality Monitoring Stations in Delhi. The old network has only six stations of DPCC and by this addition Delhi has network of 26 stations operated by DPCC. 20 Continuous Ambient Air Quality Monitoring Stations (CAAQMS) were inaugurated on 09.11.2017 at following locations in Delhi:
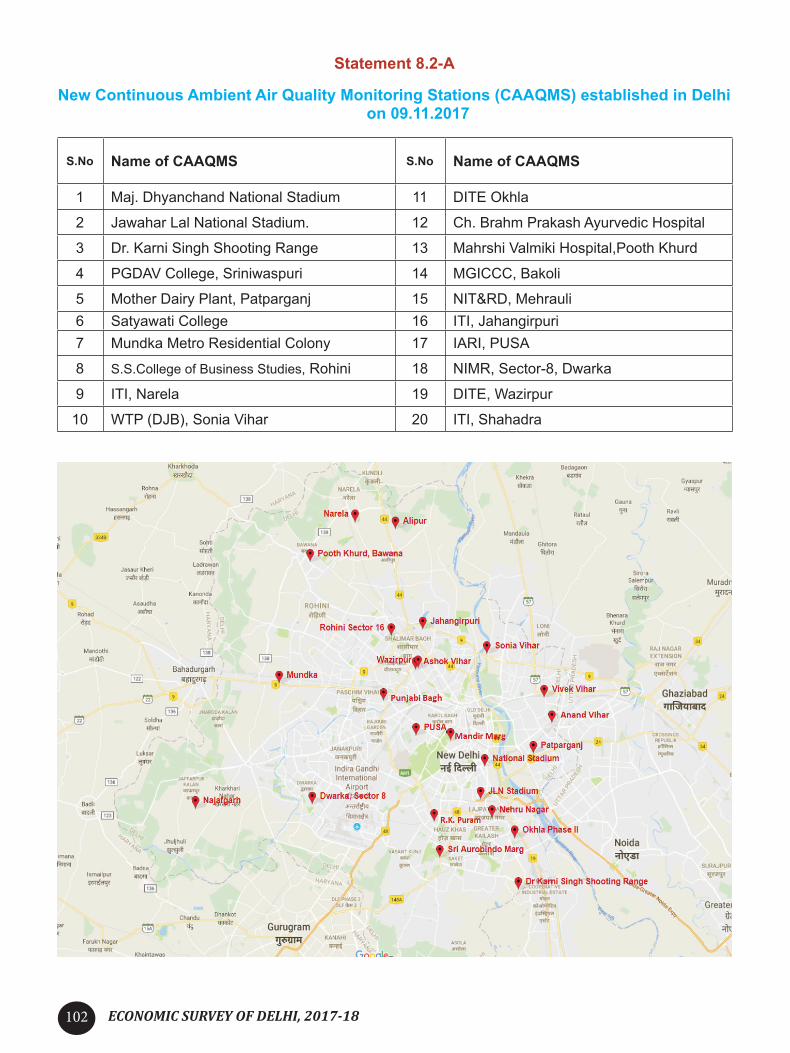
ECONOMIC SURVEY OF DELHI, 2017-18102
Statement 8.2-A
New Continuous Ambient Air Quality Monitoring Stations (CAAQMS) established in Delhi on 09.11.2017
S.No Name of CAAQMS S.No Name of CAAQMS
1 Maj. Dhyanchand National Stadium 11 DITE Okhla
2 Jawahar Lal National Stadium. 12 Ch. Brahm Prakash Ayurvedic Hospital
3 Dr. Karni Singh Shooting Range 13 Mahrshi Valmiki Hospital,Pooth Khurd
4 PGDAV College, Sriniwaspuri 14 MGICCC, Bakoli
5 Mother Dairy Plant, Patparganj 15 NIT&RD, Mehrauli6 Satyawati College 16 ITI, Jahangirpuri7 Mundka Metro Residential Colony 17 IARI, PUSA
8 S.S.College of Business Studies, Rohini 18 NIMR, Sector-8, Dwarka
9 ITI, Narela 19 DITE, Wazirpur
10 WTP (DJB), Sonia Vihar 20 ITI, Shahadra
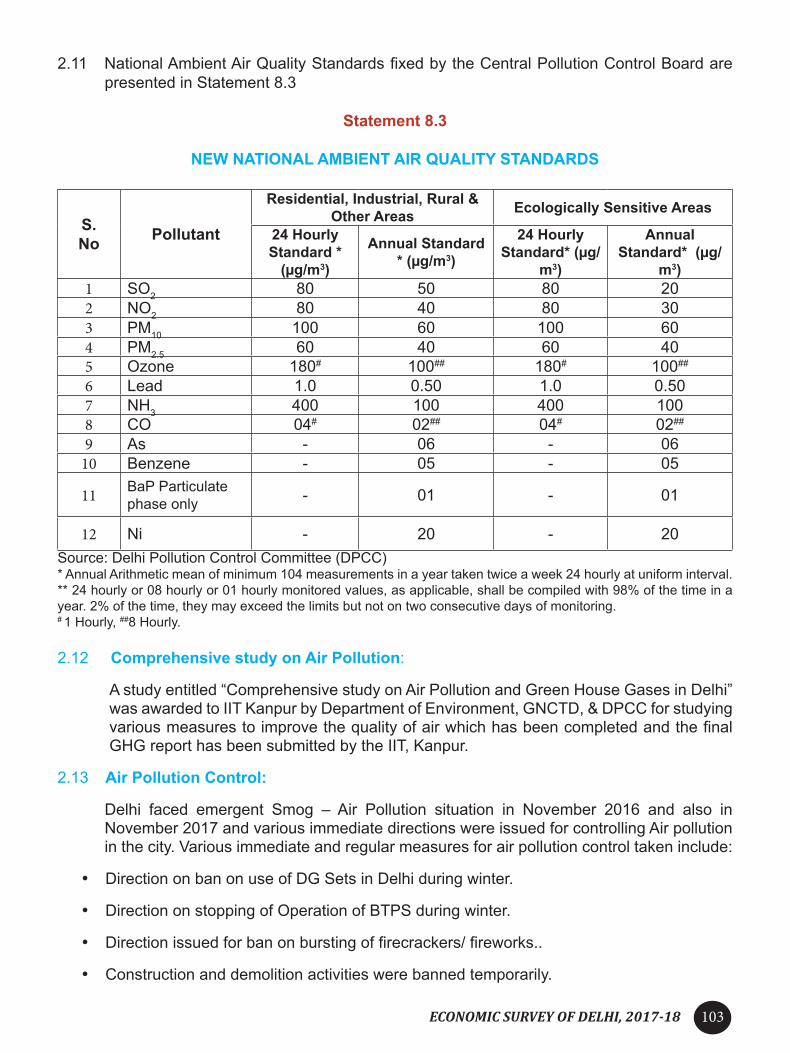
ECONOMIC SURVEY OF DELHI, 2017-18 103
2.11 National Ambient Air Quality Standards fixed by the Central Pollution Control Board are presented in Statement 8.3
Statement 8.3
NEW NATIONAL AMBIENT AIR QUALITY STANDARDS
S.No Pollutant
Residential, Industrial, Rural & Other Areas Ecologically Sensitive Areas
24 Hourly Standard *
(µg/m3)
Annual Standard * (µg/m3)
24 Hourly Standard* (µg/
m3)
Annual Standard* (µg/
m3)1 SO2 80 50 80 202 NO2 80 40 80 303 PM10 100 60 100 604 PM2.5 60 40 60 405 Ozone 180# 100## 180# 100##
6 Lead 1.0 0.50 1.0 0.507 NH3 400 100 400 1008 CO 04# 02## 04# 02##
9 As - 06 - 0610 Benzene - 05 - 05
11 BaP Particulate phase only - 01 - 01
12 Ni - 20 - 20Source: Delhi Pollution Control Committee (DPCC)* Annual Arithmetic mean of minimum 104 measurements in a year taken twice a week 24 hourly at uniform interval.** 24 hourly or 08 hourly or 01 hourly monitored values, as applicable, shall be compiled with 98% of the time in a year. 2% of the time, they may exceed the limits but not on two consecutive days of monitoring. # 1 Hourly, ##8 Hourly.
2.12 Comprehensive study on Air Pollution:
A study entitled “Comprehensive study on Air Pollution and Green House Gases in Delhi” was awarded to IIT Kanpur by Department of Environment, GNCTD, & DPCC for studying various measures to improve the quality of air which has been completed and the final GHG report has been submitted by the IIT, Kanpur.
2.13 Air Pollution Control:
Delhi faced emergent Smog – Air Pollution situation in November 2016 and also in November 2017 and various immediate directions were issued for controlling Air pollution in the city. Various immediate and regular measures for air pollution control taken include:
• Direction on ban on use of DG Sets in Delhi during winter.
• Direction on stopping of Operation of BTPS during winter.
• Direction issued for ban on bursting of firecrackers/ fireworks..
• Construction and demolition activities were banned temporarily.

ECONOMIC SURVEY OF DELHI, 2017-18104
• Ban on operation of Electricity Generator sets except essential services.
• Installation of 20 new Continuous Ambient Air Quality Monitoring Stations for better monitoring of air pollution in Delhi.
• Subsidy to Battery Operated vehicle (Two Wheelers & Cars) & e-rickshaws
• Online monitoring and Emission Control System in Thermal Power Plants, Waste-to-energy Plants, Incinerators etc
• Monitoring and Action against persons for burning of waste material/garbage in open and violators of dust control measures. Regular review of penal action taken by MCDs, NDMC, DCB, PWD, Revenue Dept. and DDA against units which are involve in dust pollution. To receive the public complaints in order to stop the burning of Garbage/Waste material/ Leaves and to stop dust pollution, Delhi Pollution Control Committee (DPCC) has opened whatsapp account with mobile number ‘9717593574’ and ‘9717593501’.
• Penal action against big construction sites by DPCC which were found with inadequate measures to mitigate the air pollution.
• Implementation of Graded Response Action Plan notified by MoEF&CC, GOI with concerned departments.
• 83 Home Guards as Environmental Marshals have been deployed in wards of three municipal corporations covering areas of East Delhi Municipal Corporation, South Delhi Municipal Corporation and North Delhi Municipal Corporation. Standard Operating Procedure (SOP) has also been developed for the working of the scheme.
• Inspection of industries and penal action against the industries which are violating environmental law
• Issuance of draft amended notification for approved fuels in Delhi.
• Regulation through inspection of industries in authorized area against the use of unacceptable fuels in Delhi
• Facilitation to convert industries to use PNG instead of other more polluting fossil fuels.
• Implementation of various directions of Hon’ble Supreme Court, Hon’ble High Court of Delhi and Hon’ble National Green Tribunal.
• Exploring of suitable technological solution through various demonstrations (e.g. anti-smog gun).
• Public Awareness for Air Pollution Control through Workshops / Seminars / Public notices.
• Mechanical sweeping of roads and sprinkling of water by MCDs and PWD.
• Directions under Air Act 1981 have been issued to ban on bursting of fire-crackers on all occasion/ celebration.
• Organized three workshops for areas under Jurisdiction of North MCD, South MCD and East MCD on “Prohibition on open burning of any kind of material - A Small Step Targeting Big Impact” respectively at Delhi Secretariat. Workshops were for public awareness and interaction with implementing authorities. The officials from MCDs i.e. SI/ASI and

ECONOMIC SURVEY OF DELHI, 2017-18 105
horticulture wing participated in the workshops along with RWAs, School/Colleges.
2.14 NCR states related Issues which impact ambient Air Quality of Delhi:
Following issues as mentioned below specifically relate to NCR states which impact ambient air quality of Delhi:
• Completion of Western and Eastern Expressway to be expedited so as to ease City of Delhi from non-destined traffic.
• The feasibility of providing U-Turn and underpass near borders to turn back the non-destined vehicles trying to enter the city needs to be explored.
• Air quality monitoring stations as set up in Delhi to be set up in NCR with online display of data.
• Local bodies and major construction agencies in Delhi have already been directed to use dust suppression methods on the construction sites to reduce the dust emissions. Delhi Police and Department of Transport have been directed to allow transportation of construction material and demolition waste only in closed and properly covered trucks. The neighbouring states must ensure that all the construction sites must undertake the dust suppression methods to control the dust emission from the construction sites. Further, it is also requested that any construction material or construction waste carried to Delhi must be transported in closed or properly covered trucks.
• Open burning of garbage in Delhi’s neighbouring areas should be strongly discouraged.
• The practice of burning of paddy stubs in the agricultural zones adjoining Delhi needs to be stopped. Agriculture burning in the NCR and neighbouring states is other major contributor of the particulate and other gaseous pollutants in Ambient Air of Delhi. It is pertinent to mention here that from October to January are crucial months for Delhi, as with onset of winter, concentration of particulate and gaseous pollutants increase significantly. Agricultural fire in Punjab & Haryana is a major cause, the Aqua satellite of NASA taken the image and shared it in public domain. The images show the cloud of ash spreading almost in the northern belt and especially on Delhi.
2.15 Though, stringent steps have been taken/being taken by Delhi Govt. for reducing air pollution in Delhi, there is an urgent need that NCR states also take similar steps as taken by GNCTD of Delhi. Therefore, a strategy needs to be worked out on similar lines by NCR states.
3. Noise Pollution
3.1 Delhi witnesses excessive noise on account of large number of vehicle of all sorts

ECONOMIC SURVEY OF DELHI, 2017-18106
including those who come from other areas where CNG is not the fuel, construction activities, diesel generating sets, etc. Use of high sound loudspeakers during festivals and many social gatherings in public place directly increases the noise pollution in the affected areas. GNCTD has notified an area of 100 metres around the hospitals with 100 beds or more, educational institutions with 1000 students or more, all court complexes, all government complexes as Silence Areas/Zones. The Central Pollution Control Board published the information regarding permitted ambient noise levels in different areas. The prescribed ambient noise levels are presented in Chart 8.1.
Chart 8.1
AMBIENT NOISE STANDARDS BY CPCB (IN LEQ/DB(A))
Source :- Noise Pollution (Regulation and Control) Rules, 2000, Ministry of Environment, Forests and climate change Government of India.
Notes:- 1. Day Time from 6 AM to 10 PM and Night Time from 10 PM to 6 AM. 2. Silence zone is an area comprising not less than 100 meters around hospitals, educational institutions, courts, religious places or any other areas which is declared as such by the competent authority.
3.2 A Continuous Noise Monitoring is undertaken at R.K. Puram, Mandir Marg, Punjabi Bagh, Civil Lines and Anand Vihar.
Statement 8.4Monthly Average of Real Time Ambient Noise Levels (Day Time
of April-2016 to March-2017
Month Anand Vihar (dB (A))
Civil Lines (dB (A))
Mandir Marg (dB (A))
Punjabi Bagh (db(A))
R.K. Puram (dB (A))
Apr-16 67.8 61.5 56.7 59.8 60.9May-16 68.1 61.6 55.8 59.4 60.3Jun-16 68.6 61.9 59.8 59.6 60.6Jul-16 68.1 62.4 63.8 59.2 61.2

ECONOMIC SURVEY OF DELHI, 2017-18 107
Month Anand Vihar (dB (A))
Civil Lines (dB (A))
Mandir Marg (dB (A))
Punjabi Bagh (db(A))
R.K. Puram (dB (A))
Aug-16 67.7 62.1 64.9 59.5 61.3Sep-16 66.7 61.6 58.7 58.4 60.2Oct-16 66.9 61.5 58.1 58.2 59.7Nov-16 67.3 65.5 58.4 58.5 60.7Dec-16 67.0 66.3 62.0 58.3 66.4Jan-17 67.1 62.4 57.9 58.1 59.9Feb-17 66.9 62.0 56.6 59.7 61.9Mar-17 67.4 61.6 56.6 59.3 59.8
Monthly Average of Real Time Ambient Noise Levels (Night Time) of April-2016 to March-2017
Month Anand Vihar
(dB (A))
Civil Lines (dB (A))
Mandir Marg
(dB (A))
Punjabi Bagh
(db(A))
R.K.Puram (dB (A))
Apr-16 64.7 60.2 49.0 53.4 54.3May-16 65.6 60.5 52.0 54.6 55.0Jun-16 67.5 62.5 59.1 59.0 61.1Jul-16 65.4 60.0 51.7 52.9 54.6Aug-16 65.4 59.7 49.6 52.7 54.4Sep-16 67.2 62.3 58.0 58.3 60.2Oct-16 67.0 62.1 57.6 58.0 59.9Nov-16 66.9 62.0 57.1 57.7 59.6Dec-16 67.0 62.0 N.A 57.7 59.6Jan-17 63.8 60.6 47.9 51.7 52.0Feb-17 63.2 59.6 48.8 52.6 54.0Mar-17 64.4 59.1 49.0 52.0 53.4
Note:- N.A. : Data Not Available
4. Water Pollution
4.1 The river Yamuna, the reason for Delhi’s existence, has suffered heavily from pollution. The entire stretch of the Yamuna River in Delhi is highly polluted due to the flow of untreated sewage and also the discharge of inadequate treated industrial effluents.
4.2 DPCC has been conducting monthly water quality monitoring of river Yamuna (at 9 locations) and major drains (24 drains) falling into river Yamuna. Statement 8.5 (at 9 locations) and 8.6 (24 drains) indicates annual average water quality of River Yamuna from April 2016 till March 2017. Recent water quality monitoring reports of river Yamuna indicate that the water quality parameters, BOD & DO, are in the desirable/prescribed norms, with respect to Water Quality criteria of “C” class, at Palla, which is upstream of Wazirabad Barrage.

ECONOMIC SURVEY OF DELHI, 2017-18108
However, the water quality of River Yamuna at the downstream of Wazirabad barrage after confluence of Najafgarh Drain is not meeting the desirable/ prescribed norms.
4.3 The highest annual average of DO is 8.9 mg/l at Palla. The annual average of BOD has ranged from 2.1 mg/l at Palla to 49.1 mg/l at Khajuri Pantool Pool. The water quality standards for DO and BOD as per CPCB norms are 4mg/l and 3mg/l respectively for class ‘C’ of river water. The water quality monitoring results in Delhi stretch clearly indicates river water is grossly polluted.
Statement 8.5ANNUAL AVERAGE WATER QUALITY OF RIVER YAMUNA AT DIFFERENT LOCATIONS:
APRIL 2016 TO MARCH 2017
S. No. LOCATIONS pH
(mg/l)COD (mg/l)
BOD (mg/l)
DO (mg/l)
Water Quality Criteria 6.0-9.0 - 3mg/l (max)
4mg/l (min)
1 PALLA 7.5 9.7 2.1 8.9
2 SURGHAT 7.4 21.7 4.4 7.7
3 KHAJURI PANTOOL POOL 7.4 152.3 49.1 0.4
4 KUDESIA GHAT 7.4 117.0 37.3 0.6
5 ITO BRIDGE 7.3 84.3 25.8 0.6
6 NIZAMUDIN BRIDGE 7.5 74.5 24.0 1.3
7 AGRA CANAL OKHLA 7.6 94.2 29.8 0.8
8 SHAHDARA (DOWN STREAM) 7.6 114.6 37.1 0.5
9 AGRA CANAL JAITPUR 7.5 86.7 28.8 0.9
Source: - Delhi Pollution Control Committee.
4.4 Water quality monitoring results of the drains indicate that most of the drains are not meeting the standards with respect to Bio-chemical Oxygen Demand (BOD), Chemical Oxygen Demand (COD) and Total Suspended Solids (TSS).
Statement 8.6
ANNUAL AVERAGE WATER QUALITY OF DRAINS AT DIFFERENT LOCATIONS IN DELHI: APRIL 2016 TO MARCH 2017
S. No. Measure/Drains pH TSS COD BODWater Quality Criteria 5.5-9.0 100 (mg/l) 250 (mg/l) 30 (mg/l)
1 Najafgarh Drain 7.32 166.67 161.00 48.752 Metcalf House Drain 7.38 80.25 90.50 29.253 Khyber Pass Drain 7.42 56.00 64.67 19.734 Sweeper Colony Drain 7.36 71.67 123.33 37.00

ECONOMIC SURVEY OF DELHI, 2017-18 109
S. No. Measure/Drains pH TSS COD BODWater Quality Criteria 5.5-9.0 100 (mg/l) 250 (mg/l) 30 (mg/l)
5 Magazine Road Drain 7.28 131.33 203.33 69.836 ISBT Drain 7.53 80.50 123.67 38.837 Tonga Stand Drain 7.47 137.17 257.00 86.428 Moat Drain No Flow No Flow No Flow No Flow9 Civil Mill Drain 7.36 100.67 187.43 72.25
10 Power House Drain 7.33 161.00 235.33 77.8311 Sen Nursing Home Drain 7.43 149.00 247.33 85.5812 Drain No. 12A No Flow No Flow No Flow No Flow13 Drain No. 14 7.48 57.27 48.73 12.4414 Barapulla Drain 7.48 96.67 129.83 52.8315 Maharani Bagh Drain 7.40 125.83 347.33 121.2516 Kalkaji Drain No Flow No Flow No Flow No Flow17 Sarita Vihar Drain (Mathura Road) 7.61 151.17 229.00 72.3318 Tehkhand Drain 7.58 186.00 336.67 117.9219 Tuglakabad Drain 7.62 126.50 269.00 86.2520 Drain Near LPG Bottling Plant No Flow No Flow No Flow No Flow21 Drain Near Sarita Vihar Bridge 7.54 68.50 115.00 36.6722 Shahdara Drain 7.60 274.67 336.67 110.8323 Sahibabad Drain 7.52 361.33 544.33 178.3324 Indrapuri Drain 7.5 285 409 139.75
Source: Delhi Pollution Control Committee.
4.5 As sewerage system is not provided in unplanned habitats, the waste water generated in unplanned area is discharged into drains. Non-utilization of installed capacity of sewage Treatment Plants is another important issue. Delhi Jal Board has prepared a plan to provide sewerage facilities in unauthorized colonies.
4.6 Delhi Jal Board initiated the process of laying of interceptor sewers along 3 major drains (Najafgarh Drain, Supplementary Drain and Shahdara Drain). Sewage generated from the colonies will be trapped before reaching the major drains and the same would be diverted to the existing unutilized STPs/new STPs.
4.7 Delhi Pollution Control Committee, being pollution control statutory agency and regulator,
collects samples of treated effluents from all operational STPs on monthly basis. Deficiencies and analysis reports are sent to Delhi Jal Board (DJB) for rectification so as to meet the norms stipulated. Effluent Analysis Report of STPs are also placed on the website of DPCC. Directions have been given to Delhi Jal Board to install online monitoring system on their STPs.
4.8 Mandatory provision of installation of on-site decentralize wastewater treatment system (ETP) by Industries, Hotels, Construction Projects etc with treated wastewater reuse in flushing, cooling, horticulture etc. More than 1800 ETPs have been installed so far. Five/four Star Hotels and Hospitals having more than 50 beds have been directed to install

ECONOMIC SURVEY OF DELHI, 2017-18110
Sewage Treatment Plants and most of them have already installed.
4.9 One of the main sources of water pollution is the waste material discharged by industrial units. Waste materials like acids, alkalies, toxic metals, oil, grease, dyes, pesticides and even radioactive materials are poured into the drains by many industrial units. Some other important pollutants include polychlorinated biphenyl (PCB) compounds, lubricants, etc. The pollutants unloaded into the drains usually dissolve or remain suspended in water. Sometimes, they also accumulate on the bottom of the drains. The industrial waste water generated in Delhi is more than 40 MGD. All industrial units located in the Industrial Areas having CETPs have been directed to ensure linkage to conveyance system in Common Effluent Treatment Plants (CETPs). There are 13 functional CETPs for 21 industrial areas in Delhi. Name of CETP along with its capacity is given at statement 8.7.
Statement 8.7
List of Common Effluent Treatment Plants (CETPs) in NCT of Delhi
S.No. Name of CETP Capacity of CETP(in MLD)
1. Jhilmil & Friends Colony Industrial Area CETP 16.8
2 Badli Industrial Estate CETP 12
3 Mayapuri Industrial Area CETP 12
4 Mangolpuri Industrial Area CETP 2.4
5 Wazirpur Industrial Area CETP 24
6 DSIDC Nangloi & Udyog Nagar Industrial Area CETP 12
7 SMA Industrial Area CETP 12
8 Okhla Industrial Area CETP 24
9 Narela Industrial Area CETP 22
10 Udyog Vihar (Bawana) Industrial Area CETP 35
11 GTK Road Industrial Area, CETP 6
12 Naraina Industrial Area, CETP 21.6
13 Lawrence Road Industrial Area CETP 12
Total 211.8 MLD(46.59 MGD)
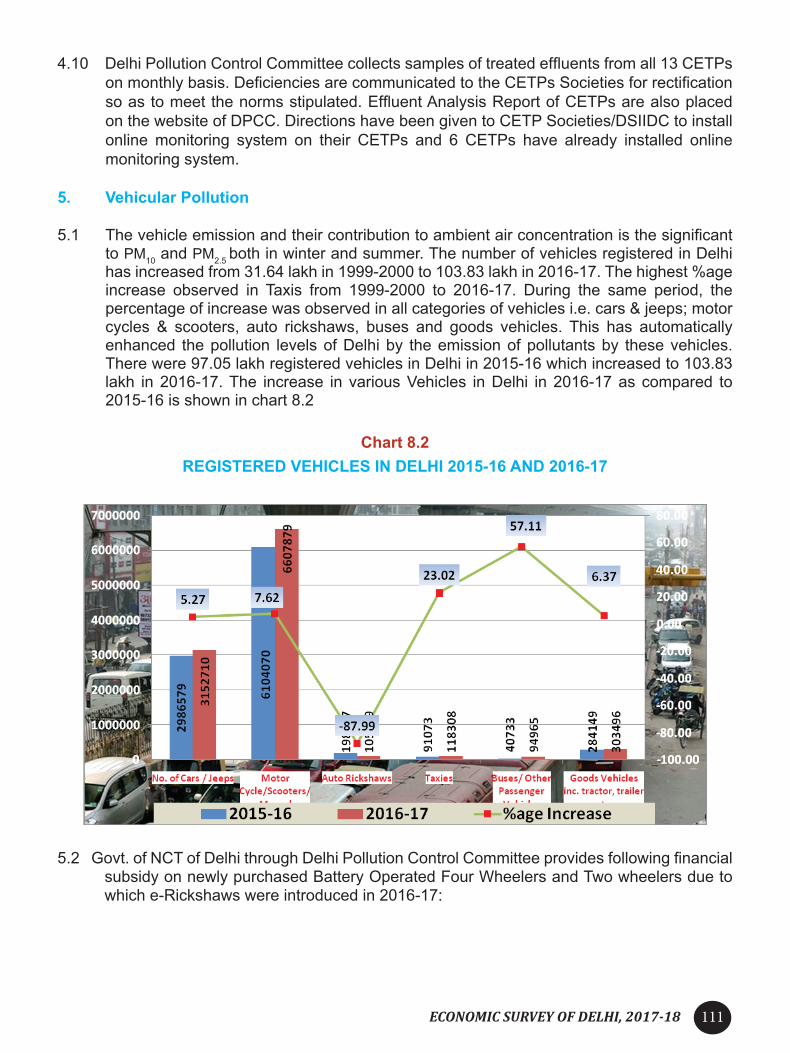
ECONOMIC SURVEY OF DELHI, 2017-18 111
4.10 Delhi Pollution Control Committee collects samples of treated effluents from all 13 CETPs on monthly basis. Deficiencies are communicated to the CETPs Societies for rectification so as to meet the norms stipulated. Effluent Analysis Report of CETPs are also placed on the website of DPCC. Directions have been given to CETP Societies/DSIIDC to install online monitoring system on their CETPs and 6 CETPs have already installed online monitoring system.
5. Vehicular Pollution
5.1 The vehicle emission and their contribution to ambient air concentration is the significant to PM10 and PM2.5 both in winter and summer. The number of vehicles registered in Delhi has increased from 31.64 lakh in 1999-2000 to 103.83 lakh in 2016-17. The highest %age increase observed in Taxis from 1999-2000 to 2016-17. During the same period, the percentage of increase was observed in all categories of vehicles i.e. cars & jeeps; motor cycles & scooters, auto rickshaws, buses and goods vehicles. This has automatically enhanced the pollution levels of Delhi by the emission of pollutants by these vehicles. There were 97.05 lakh registered vehicles in Delhi in 2015-16 which increased to 103.83 lakh in 2016-17. The increase in various Vehicles in Delhi in 2016-17 as compared to 2015-16 is shown in chart 8.2
Chart 8.2REGISTERED VEHICLES IN DELHI 2015-16 AND 2016-17
5.2 Govt. of NCT of Delhi through Delhi Pollution Control Committee provides following financial subsidy on newly purchased Battery Operated Four Wheelers and Two wheelers due to which e-Rickshaws were introduced in 2016-17:

ECONOMIC SURVEY OF DELHI, 2017-18112
S.No. Type of Vehicles Cost of Vehicles (base price)
Subsidy given by Govt. of Delhi (in )
1. 4 Wheeler Upto 5 lakhs 30,000/-
2. 4 Wheeler More than 5 lakhs 1,50,000/-
3. 2 Wheeler Upto 20,000/- 1,000/-
4. 2 Wheeler More than 20,000/- but less than 25,000/- 2,000/-
5. 2 Wheeler More than 25,000/- 5,500/-
5.3 Financial subsidy is provided from the Air Ambient fund, created by levying 25 paisa per litre of Diesel (Diesel Case) with the objective of utilizing the collect amount towards clean environment movement including promotion of environment friendly vehicles/non polluting vehicles in Delhi. One time fixed subsidy of 30,000/- is also provided to battery operated e-rickshaw owners, authorized by Transport Department and registered in NCT of Delhi w.e.f. 01.04.2016. Initially the subsidy amount w.e.f. 01.04.2015 was 15,000/-. An individual can claim subsidy only on one e-rickshaw. On subsequent purchase by the same individual no subsidy is allowed. The subsidy is given by DPCC from Air Ambience Fund.
6. Waste Management
6.1 Municipal Solid Waste
6.1.1 In Delhi, 5 Municipal Authorities are responsible for Municipal solid Waste Generation and Management.
6.1.2 There are 4 landfill sites namely Bhalaswa land fill site (since 1993), Ghazipur land fill site (since 1984), Okhla land fill site (1994) and Bawana land fill site (Developed as Engineering Landfill Site and operating since 2011). In the absence of availability of landfill sites, all the 5 Municipal Bodies are also using the first 3 sites for disposal of Municipal Solid Waste though these are not Engineering Landfill Site.
6.1.3 Integrated MSW management plant of 4000 TPD capacity has been developed at Narela-Bawana and the plant is operational for 2000 TPD.
6.1.4 There are 2 Compost Plants in Delhi one at Okhla (operated by M/s IL & FS, Capacity 200 Tonns per day) and another one at Bawana (operated by M/s Delhi MSW Solutions Ltd., Capacity 1500 Tonns per day)
6.1.5 In addition there are 3 Waste to Energy Plants in Delhi as per the details:

ECONOMIC SURVEY OF DELHI, 2017-18 113
S. No. Name Plant Capacity
( MTD )
Electricity Generated (MW)
Status
1. Timarpur - Okhla Waste to Energy Plant
2950(1950 + 1000) 16 Operational
2. Ghazipur Waste to Energy Plant 1300 12 Operational
3. Narela Waste to Energy Plant 2000 24 Operational
6.1.6 Ministry of Environment, Forests and Climate Change, GOI has notified the revised Solid Waste Management Rules 2016 on 08.04.2016. The responsibility of management of Municipal Solid Waste has been entrusted with Urban Development Department and Urban Local Bodies. All Municipal Corporations have been directed to prepare Solid Waste Management Plan with activity timelines ranging from 8-16 months.
6.2 Biomedical Waste
6.2.1 Ministry of Environment, Forests and Climate Change, Govt of India has notified Bio-Medical Waste Management Rules, 2016 on 28.03.2016. The prescribed authority for implementation of the provisions of these rules is Delhi Pollution Control Committee. About 25 Tons per day of Bio-Medical Waste is generated and treated in Delhi. There are following two Common Bio-Medical Waste Treatment Facilities (CBWTF) in Delhi for the treatment of the Bio-Medical Waste generated from the Health Care Establishments in Delhi :
(i) M/s Biotic Waste Solutions Pvt. Ltd at SMA Industrial Area, GTK Road, Delhi
(ii) M/s SMS Water Grace BMW Pvt. Ltd., near Nilothi STP of DJB.
6.2.2 These CBWTFs have total capacity of 63 Tons/ Day and having Incinerators, Autoclave and Shredders for the treatment and disposal of the Bio-Medical Waste and have installed Online Monitoring System.
6.3 Electronic Waste
Ministry of Environment, Forests and Climate Change, Govt of India has notified E-Waste (Management) Rules, 2016 on 23.03.2016 which have come into force from 1st October 2016. List of Authorities and corresponding duties are mentioned in Schedule IV of the said Rules.
6.4. Plactic Waste
6.4.1 Plastic waste especially carry bags has been creating nuisance in Delhi despite over 12 years of massive awareness campaign “Say No To Plastic Bags”. Hon’ble High Court of Delhi had passed a judgment in August 2008 for imposing ban on plastic carry bags in main markets, local shopping centers, etc. subsequent to which Government of Delhi had issued a notification on 07.01.2009, but the situation continued to worsen even after three years of issue of this notification. In light of this, Government of Delhi has imposed ban on manufacture, sale, storage, usage, import and transport of plastic carry bags in NCT of Delhi vide Notification dated 23.10.2012.

ECONOMIC SURVEY OF DELHI, 2017-18114
6.4.2 This notification has been challenged in the Hon’ble High Court of Delhi by All India Plastic Industries Association and on 05-12-2016; Hon’ble High Court of Delhi has transferred this matter to the Hon’ble NGT for further decision. Besides, Ministry of Environment, Forests and Climate Change, GOI has notified revised Plastic Waste Management Rules 2016 on 18-03-2016. These rules entrust the responsibility of plastic waste management with Urban Development Department and the Urban Local Bodies
6.5 Construction and Demolition Waste
6.5.1 There are following two operational Construction and Demolition Waste Processing Plants Plants of M/s IL & FS in Delhi
(i) Construction and Demolition Waste Processing Plant at Jahangirpuri (Capacity – 2000 Tons/Day). (ii) Construction and Demolition Waste Processing Plant at Shastri Park (Capacity
– 500 Tons/Day).
6.5.2 Processed construction and demolition material is used for making tiles/ pavement blocks and also for ready mix concrete, aggregates etc.
6.5.3 Ministry of Environment, Forests and Climate Change, GOI has notified the Construction
and Demolition Waste Management Rules, 2016 on 29.03.2016. As per these Rules, the Secretary in-charge of Urban Development shall prepare their policy document with respect to management of construction and demolition of waste in accordance with the provisions of these rules within one year from date of final notification of these rules.
6.6 Hazardous Waste
6.6.1 There are about 1100 units (Excluding S.S. Pickling Units) generating Hazardous waste in Delhi as per the report submitted by M/s Aecadics India Pvt. Ltd., i.e. consultant
engaged by DSIIDC for development of TSDF at Bawana. An estimated amount of 4197.76 T/Annum of Hazardous waste is generated from these units alongwith 13 CETPs.
6.6.2 A site for setting up of TSDF for disposal of hazardous waste of Delhi has been identified in Bawana Area and its development is under process by DSIIDC.
7. Climate Change Mitigation Measures
7.1 On the issue of Combating Climate Change, Delhi is the first city in the country to set a mandate and brought out a detailed Climate Change Agenda for 2009-2012, on the lines of National Action Plan for Climate Change released by the Government of India.
7.2 65 important point climate change agenda have been identified for the city of Delhi under following sectors:
a) Enhanced Energy Efficiencyb) Sustainable Habitatc) Green Indiad) Water Missione) Strategic Knowledgef) Solar Mission

ECONOMIC SURVEY OF DELHI, 2017-18 115
7.3 Delhi State Action Plan on Climate Change (SAPCC) is being prepared on the lines of National Action Plan on Climate Change (NAPCC).
8. Rain-Water Harvesting Structure
8.1 The demand of water in Delhi is increasing day by day with the rapid urbanization and the availability of potable water is not adequate to meet the growing requirements of Delhi. Main water source in the city is the water share from neighbouring basin states like Haryana, Himachal Pradesh, Uttar Pradesh etc. Thus, there is a limitation to augment the water supply. Due to this, the burden on ground water extraction is, increasing and unexpected withdrawal of ground water has resulted in depletion in water level and deterioration in quality of ground water. Rainwater harvesting is an ideal solution to areas where there is insufficient ground water or surface water resources are lacking. It helps in using the ground water and furthermore keeps the overflow from going into sewer or storm water drains.
8.2 Installation of Rain-Water Harvesting System has been made mandatory for plots having area of 100 Sq. Meters and above. The financial assistance of the 50 per cent of the project cost or 1 lakh whichever is less, is provided by Delhi Government / Delhi Jal Board to the Resident Welfare Associations or Schools for this purpose.
8.3 For Hotels / Malls / Construction Projects etc, installation of Rain Water Harvesting System has been made mandatory through contract mechanism.
9. Measures taken to Tackle the Pollution in Delhi
9.1 There is a policy for afforestation, atmospheric pollution, bio-medical waste, domestic refuse, and water and sewage treatment. Additionally, there are action plans to encourage public participation in environmental problems. Given the continued growth of the city and its population, problems are tackled only with difficulty—for instance,
9.2 Odd-Even Traffic Scheme: To tackle rising air pollution in Delhi, the Government of Delhi has come up with odd-even traffic scheme. The first phase was in January 2016 for the first 15 days in the month. The second phase was from April 15 to April 30, 2016. According to the notification issued by the Government, from 8 am to 8 pm, vehicles with odd registration numbers were allowed to ply on odd dates and those with even registration numbers were plying on even dates. There was no restriction on any vehicle on Sundays.
9.3 Supreme Court Ban on sale of fireworks: Since air pollution spikes in Delhi during festivities for Diwali, on 9 October 2017 the Supreme Court of India banned the sale of fireworks - a main source of the spike - in the city.
10. Other Measures to Control Pollution and Improve the Environment
10.1 Some of the important measures adopted by the Government / DPCC to control pollution and improve the environment are as follows;
• More than 15 year old commercial / transport vehicles have been phased out.• Entire public transport has been switch over to CNG fuel mode (approx. 1,60,000).

ECONOMIC SURVEY OF DELHI, 2017-18116
• Implementation of Bharat Stage IV/Euro-IV emission norms.• Sulphur content in Diesel has been reduced upto 50 PPM since April 2010.• PUCs being linked on the net so that daily reports can be downloaded & monitoring can
be done. • Air Ambience Fund has been created by levying fee on the sale of diesel at the rate of
0.25 per liter in the NCT of Delhi. The Air Ambience Fund is utilized for promoting clean technologies.
• Levy of Environment Compensation Charge on commercial vehicles.• Gas based Power Plants are being promoted. • Whole of Delhi declared as air pollution control area under Air Act.• Stringent emission norms for industries and thermal power stations• Installation of Emission Control System in air polluting industries • Burning of leaves/plastics is prohibited• Use of 5 KVA or more capacity of DG set is prohibited from 10 PM to 6 AM except in group
housing societies. Also, acoustic enclosure has been made mandatory in DG sets.• Re-use of treated waste water for gardening and cooling purposes.• Making use of Bio-degradable kitchen solid waste for Vermi Composting at community
level and utilizing compost for gardening purpose. • Environment Department has supported Schools for putting up paper re-cycling equipments/
plants.• Development and Protection of the Ridge Area.• Development of Wild Life Sanctuary at Bhatti, Asola.• Development and Preservation of lakes and water bodies.• For ground water regulations and management in the city, a notification containing
directions under section 5 of Environment Protection Act has been issued on 12th July 2010.
• Massive plantation drive is being organised each year with the involvement of some Government Departments, Municipal bodies, NGO, Civil Society Organisations, Citizens, RWAs, Schools & Colleges, etc.
• Anti-Fire cracker companies is conducted every year during Diwali Festival.• Improvement of parks and gardens and their maintenance is being taken care of by
providing adequate funds to local bodies and RWAs.• Providing Sewerage System in unplanned habitats i.e. unauthorised colonies and rural
villages.
11. How can the citizens of Delhi help in reducing pollution?
11.1 Pollution in Delhi is a perpetual problem which needs to be looked upon as a serious issue not only by the Government but also by the citizens of Delhi:
• One of the easiest ways is that there should be an efficient involvement of Resident Welfare Associations in various localities in collection, segregation of garbage from houses and the societies.
• Citizens can take steps to cover the garbage into compost in their localities.• More and more trees must be planted in every locality.• Stop open burning.• Stop bursting fire crackers.• Control dust pollution at construction sites.• Every individual should keep a proper check on the pollution level of their vehicles.• Making more use of CNG.

ECONOMIC SURVEY OF DELHI, 2017-18 117
• One of the best ways to control pollution is to manage wastes of all types in a proper manner.
• Each and every citizen should use buses and metro instead of cars and scooters, as they can carry a lot more people in one journey. Car pool is also a good option.
• Controlling the use of energy and making use of electricity in an efficient manner.• One can also reduce water pollution by reducing the use of chemicals, cleaning agents,
pesticides, herbicides, fertilizers etc.• Install rain water harvesting structures.
11.2 It is the duty of every citizen to think in a broader perspective to control pollution. We really don’t want our future generations to live in an unhealthy environment in Delhi.
12. DELHI PARKS AND GARDENS SOCIETY (DPGS)
12.1 Delhi Parks and Gardens Society (DPGS) maintain parks and gardens of Delhi. DPGS involves RWAs/NGOs, in maintaining and developing parks of Delhi, with the objective to increase the greenery in Delhi. It provides financial assistance to RWAs/NGOs for maintenance and development of parks and gardens in Delhi based on NOC from the concerned Land Owning Agency.
12.2 Performance of DPGS during 2016-17 and 2017-18
During year 2016-17, DPGS implemented the Joint Park Management Scheme of DPGS under Department of Environment, Govt. of NCT of Delhi, including new areas measuring almost 431.91 Acres with the participation of 289 RWA/NGO, covering 1394 Nos. of parks. During, 2017-18, financial assistance for maintenance of parks and gardens provided for areas measuring almost 327.62 acres with the participation of 233 RWAs/NGOs, covering 1043 number of parks till 15th Jan. 2018. Till March 2018, DPGS intends to provide assistance to around 330 RWAs for 1400 parks with an area of 400 acres.
The Society is motivating RWA’s/NGO’s in the greening activities, by organizing meetings, distribution of plants to RWAs’ for plantation in parks, technical advices and coordinating with other agencies. During 2016-17, 1.52 Lakhs plants raised & maintained in DPGS Nursery, were distributed to RWAs’/NGOs’, greening agencies, corporation etc. and got the same planted. During 2017-18, till 15th Jan, 2018, 1.60 Lakh plants procured/raised and maintained in DPGS Nursery were distributed to RWAs/NGOs, greening agencies, corporates etc., for plantation.
DPGS carried out monitoring of parks under various civic agencies like MCD, NDMC, DDA, CPWD for inventroization and categorization of status leased on its development status, i.e., well maintained, satisfactory and poor parks and effectively coordinated greenery maintenance amongst greening agencies in NCT Delhi.
DPGS is taking up greening projects in poorly maintained parks, semi vacant spaces and also in open spaces.
DPGS is providing advice to other agencies in the greening activities. Thereby motivating greening by various agencies in Delhi.
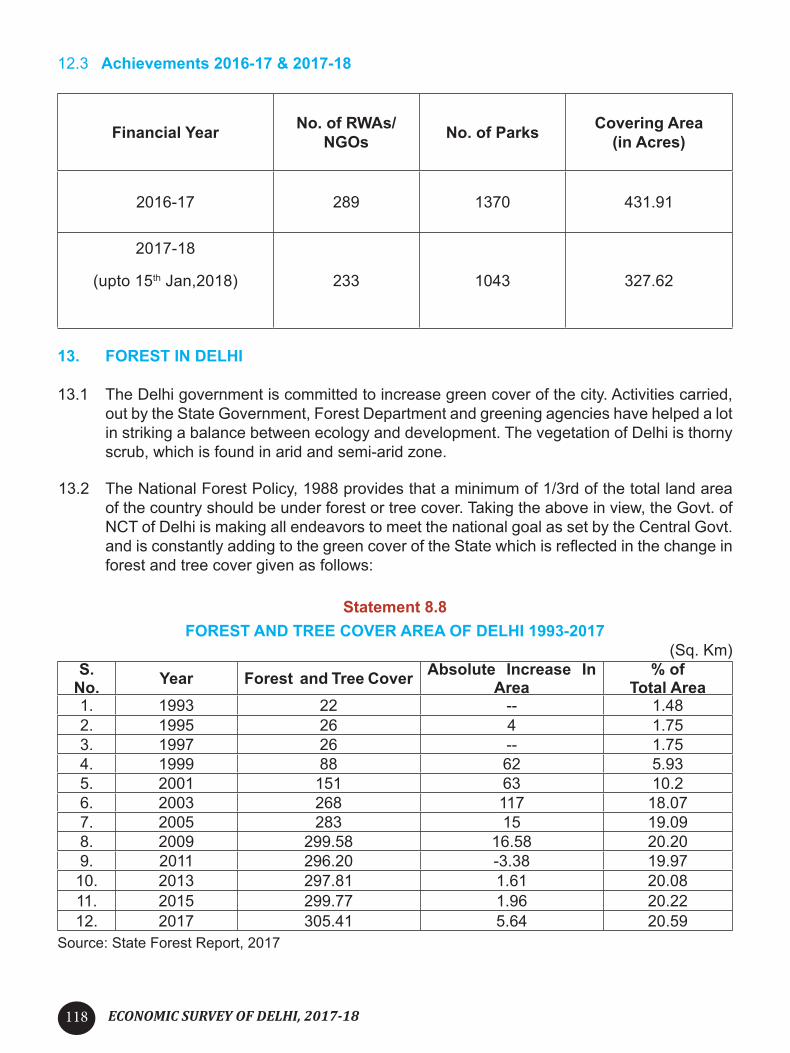
ECONOMIC SURVEY OF DELHI, 2017-18118
12.3 Achievements 2016-17 & 2017-18
Financial Year No. of RWAs/ NGOs No. of Parks Covering Area
(in Acres)
2016-17 289 1370 431.91
2017-18
(upto 15th Jan,2018) 233 1043 327.62
13. FOREST IN DELHI
13.1 The Delhi government is committed to increase green cover of the city. Activities carried, out by the State Government, Forest Department and greening agencies have helped a lot in striking a balance between ecology and development. The vegetation of Delhi is thorny scrub, which is found in arid and semi-arid zone.
13.2 The National Forest Policy, 1988 provides that a minimum of 1/3rd of the total land area of the country should be under forest or tree cover. Taking the above in view, the Govt. of NCT of Delhi is making all endeavors to meet the national goal as set by the Central Govt. and is constantly adding to the green cover of the State which is reflected in the change in forest and tree cover given as follows:
Statement 8.8FOREST AND TREE COVER AREA OF DELHI 1993-2017
(Sq. Km)S.
No. Year Forest and Tree Cover Absolute Increase In Area
% of Total Area
1. 1993 22 -- 1.482. 1995 26 4 1.753. 1997 26 -- 1.754. 1999 88 62 5.935. 2001 151 63 10.26. 2003 268 117 18.077. 2005 283 15 19.098. 2009 299.58 16.58 20.209. 2011 296.20 -3.38 19.97
10. 2013 297.81 1.61 20.0811. 2015 299.77 1.96 20.2212. 2017 305.41 5.64 20.59
Source: State Forest Report, 2017

ECONOMIC SURVEY OF DELHI, 2017-18 119
13.3 Government of NCT of Delhi has taken initiatives to increase forests and tree cover area to keep the environment green in Delhi. As a result of the initiatives taken by Government of NCT of Delhi, forest and tree cover area has been increasing steadily since 1993. The forest and tree cover area increased to 305.41 sq km in 2017 increasing thereby the share of forests in the total area to 20.59 per cent. The growth of forests and tree cover has particularly been monumental post 1999. Of the total 305.41 sq km of forest area in NCT of Delhi, nearly 279 sq km has been added during the period 1997 to 2017.
Statement 8.9CHANGE IN FOREST AND TREE COVER IN DELHI BETWEEN 2015 AND 2017
(Area in Sq Km)
Change in Forest Cover in Delhi
2015 Assessment
2017Assessment
Change
Geographical Area 1483Very Dense Forest 6.94 6.72 -0.22Moderate Dense Forest 57.15 56.24 -0.91Open Forest 124.68 129.45 4.77Total Forest 188.77 192.41 3.64Percent of Geographical Area 12.72 12.97 0.25
Change in Tree Cover in Delhi
2015 Assessment
2017Assessment
Change
Total Tree cover 111 113 2Percent of Geographical Area 7.48 7.62 0.14
Source: State Forest Report, 2017
13.4 It may be observed from Statement 8.8 that the growth of forest and tree cover area of Delhi increased from 22 Sq. Km in 1993 to 305.41 Sq. Km in 2017. The percentage of forest and tree cover area to the total area of Delhi has increased manifold from a mere level of 1.48 per cent in 1993 to 20.59 per cent in 2017. Delhi’s forest cover has increased by 0.25% or 3.64 sq km, compared to the assessments conducted in 2015, according to the State of the Forest report 2017.
13.5 The State Forest Report 2017 reveals that both ‘Very dense forest’ cover and ‘Medium dense forest’ cover in Delhi has declined over the past two years. The very dense forest cover has declined from 6.94 sq.km in 2015 to 6.72 sq. km in 2017, the medium dense forest cover has dropped from 57.1 sq. km to 56.2 sq. km during the same time. Very dense forest cover has more than 70% canopy, medium dense forest cover has a canopy of 40% to 70%. These are the actual carbon sinks. Losing out such dense forests is not a good sign as it reduces a city’s capacity to sequester carbon. It is the open forests with a canopy cover of 10% to 40% which has increased from 124 sq. km to 129 sq. km in Delhi, leading to an overall increase in forest cover.
13.6 Some trees had to be felled because of construction projects such as the Metro and road widening. But at the same time, afforestation drives were also undertaken. The new plants

ECONOMIC SURVEY OF DELHI, 2017-18120
have not been accounted for as they are too small. They would only come under the medium dense forest or very dense forest after a period of five to 10 years at least.
13.7 The report says that Delhi’s addition of 3.64 sq km of forest, mostly through open forest cover, is because of plantation and conservation activities. The decrease in forest cover has been attributed to civil construction.
13.8 As far as tree cover is concerned - sparse vegetation along roads or small- scale plantations - Delhi has the second-highest tree cover as a percentage of the total geographical area among states. The overall increase in Delhi’s green cover is a good sign. Delhi’s green cover has increased from around 20.2% during 2015 to 20.6% during 2017.
Chart 8.3 Tree Cover as % of Total Area; 2017
Chart 8.4
FOREST AND TREE COVER AREA OF DELHI 1993-2017

ECONOMIC SURVEY OF DELHI, 2017-18 121
13.9 The information regarding the district-wise forest cover area and total geographical area of Delhi is presented in Statement 8.10.
Statement 8.10DISTRICT-WISE FOREST COVER IN DELHI - 2017
(Sq. Km)S.
No. Districts GeographicalArea
Forest CoverArea
% of GeographicalArea
1. Central Delhi 25 4.94 19.762. East Delhi 64 3.70 5.783. New Delhi 35 16.41 46.89
4. North Delhi 59 4.58 7.765. North East Delhi 60 3.98 6.636. North West Delhi 440 17.55 3.997. South Delhi 250 83.35 33.348. South-West Delhi 421 51.10 12.149. West Delhi 129 6.80 5.27
Total 1483 192.41 12.97Source: State Forest Report, 2017
13.10 It may be inferred from Statement 8.10 that the forest cover area of Delhi is 192.41 sq. km i.e. 12.97 per cent of the total area of Delhi. South Delhi constitutes the highest forest cover area at 83.35 sq. km, South West Delhi at 51.10 sq. km, North West Delhi at 17.55 sq. km, New Delhi at 16.41 sq. km, respectively. On the contrary the lowest forest cover observed in East Delhi at 3.70 sq. Km. The information regarding district-wise forest cover in Delhi is also depicted in Chart 8.5.
Chart 8.5DISTRICT-WISE FOREST COVER IN DELHI - 2017

ECONOMIC SURVEY OF DELHI, 2017-18122
Forest Cover within Green Wash:Very Dense Forest 1.40 sq. kmModerately Dense Forest 6.85 sq. kmOpen Forest 1.94 sq. kmSub Total 10.19 sq. km
Forest Cover outside Green Wash:Very Dense Forest 5.32 sq. kmModerately Dense Forest 49.39 sq. kmOpen Forest 127.51 sq. kmSub Total 182.22 sq. kmTotal Forest Cover 192.41 sq. kmTree Cover 113 sq. kmTotal Forest & Tree Cover 305.41 sq. kmOf State’s Geographical Area 20.59%Of India’s Forest & Tree Cover 0.04%Per Capita Forest & Tree Cover 0.002 ha
13.11 Composition of forests in terms of its density is shown in Chart 8.6. Out of the total geographical area of NCT of Delhi, very dense forest is spread over 0.45 per cent, moderately dense forest is spread over 3.79 percent, open forest is spread over 8.73 per cent and scrub is spread over 0.05 per cent, which is almost negligible.
Chart 8.6
COMPOSITION OF FOREST COVER (%AGE) IN NCT OF DELHI IN 2017
Source: State Forest Report, 2017
14 Decadal Change in Water Bodies within Forest
14.1 An increase of 0.55 sq. km has been observed year 2015 in the water body coverage within Forests compared to the year 2005.
ECONOMIC SURVEY OF DELHI, 2017-18 123
14.2 Water Bodies within Forest for the years 2005 and 2015Area/ Coverage 2005 2015
Extent of Water Bodies (sq. km.) within Forest 3.77 4.32%age of Water Bodies to Forest Cover 2.13 2.25
15. Asola Bhatti Wild Life Sanctuary
15.1 Asola Bhatti Wildlife Sanctuary spread over 4845.57 acres is situated near Tughlakabad Fort in South Delhi. The Wildlife Sanctuary is considered the breathing lung of the cosmopolitan city of Delhi. It was established in 1992 with the aim to protect the wildlife in the area between Delhi and Surajkund (Delhi-Haryana border). The Asola Bhatti wildlife sanctuary actually lies in South Delhi District, all along Delhi Haryana Border along Faridabad and Gurgaon.
15.2 The sanctuary is located on the Southern Ridge which is part of the northern terminal of Aravalli Hills (Aravallis are one of the oldest mountain system of the world). The reason for the biodiversity significance of the Ridge lies in its merger with Indo-Gangetic Plains. The legal Status of the Southern Ridge was considered uncertain till 1986 when the community land of villages Asola, Sahurpur and Maidangari (2679.29 Acre) were notified and land of Bhatti village area (2166.28 Acre) was notified in 1991 as Sanctuary. Few Check dams have been constructed at Asola Wild Life Sanctuary as conservation measure for soil and water. These check dams have proved to be very effective for ground water recharge and creation of water bodies for the sustenance of Wild Life in the Sanctuary.
15.3 Reclamation of Bhatti area of Asola Bhatti Wild Life Sanctuary through ECO Task Force (ETF)
15.3.1 Forest Department, Government of NCT of Delhi is implementing the project of rehabilitation of about 2100 acres of Bhatti Mines area since October 2000 through ETF, which is a part of Asola-Bhatti Wild Life Sanctuary. Project period for five years was approved in 2000 at a cost of 8.23 crore, was extended further for a period of 3 years up to 8.10.2008 with an additional cost of 4.93 crore. The project was extended for a period of two years from 2008-2010 at an estimated cost of 13.04 crores. Further the project was extended till 31st March 2012 with the total revised estimated cost of 40.89 crore of the project. The project period for Rehabilitation of degraded forest land in Asola Bhatti Wildlife Sanctuary and Dera Mandi area through Eco-Task Force was again extended for the period 01.04.2012 to 31.03.2017 with the cost of 44.82 crore ( 31.39 crore for Establishment cost of ETF and 13.43 crore for Project Stores cost which includes plantation work & its maintenance for five years). In all, total project cost of 85.71 crore already approved by the EFC for the period w.e.f. 09.10.2000 to 31.03.2017.
15.3.2 EFC has approved the extension of the project period for rehabilitation of degraded forest land in the Southern Ridge area of Asola Bhatti, Dera Mandi, Maidangarhi, Ghittorni and Rajokri through Eco Task Force from 01.01.2017 to 31.03.2022 at an estimated cost of 90.25 crore ( 48.75 crore for Establishment cost of ETF and 41.50 crore for Project
cost which includes plantation work & its maintenance for five years) for improving and sustaining the wildlife habitat through plantation. Project cost includes expenditure for creation of plantation of 2 lakh saplings per year for a period of five years

ECONOMIC SURVEY OF DELHI, 2017-18124
16. Major Achievements Made during 2016-17 & 2017-18
a) The department of Forests and Wildlife regulates the removal of trees as per provisions under Delhi (Preservation) of Trees Act, 1994. Online solution e-forest has been introduced for tree felling permission to User Agency and individuals with the provision of e-payment gateway. This will facilitate time bound permission of tree felling by Forest department in a transparent manner.
b) The Government is committed to provide soothing and green environment to the citizen of Delhi. Massive tree plantation drive was launched during July-September, 2016 involving 19 other greening agencies, eco-clubs and RWAs for plantation of 10 lakh tree saplings and 5 lakh shrubs as middle canopy. During 2016-17 a total of 8.72 Lakh sapling and 12.31 Lakh shrubs had been planted by the Forest Department alongwith other greening agencies.
c) During 2017-18, about 5.5 lakh saplings and 7.93 lakh shrubs have already been planted till December, 2017. The shrubs had been planted by the civic agencies during 2017-18 as per suitability of land especially on divider and road barns.
d) More than 3.5 lakh saplings were distributed in 2017-18 free of cost to the citizens from forest nurseries for planting in their own backyard. Such effort has paid dividends and the green cover of Delhi has increased substantially.
e) Long term plan for replacement of vilyati kikkar in central ridge area had been launched. Initially the stretch at S.P. Marg is being developed where canopy manipulation and gap opening is being done in the existing vilyati kikkar trees which are gradually being replaced by planting local indigenous species.
f) City forests at Mitraon, Nasirpur, Garhi Mandu, Taj Enclave, Shastri Park, Mukhmelpur were developed/ improved to increase the awareness for green area among local residents as large numbers of people residing in the area go to these forests for recreation in clean and green environment. Butterfly park at Tughlakabad is also developed.
g) Nurseries have been developed to raise around 8 lakh saplings/ seedlings for tree plantation.
h) Eco-restoration of habitat through Eco Task Force in Asola Bhatti Wildlife Sanctuary has been done by carrying out plantation of 1.5 lakh saplings and low cost engineering structures to improve the soil moisture regime.
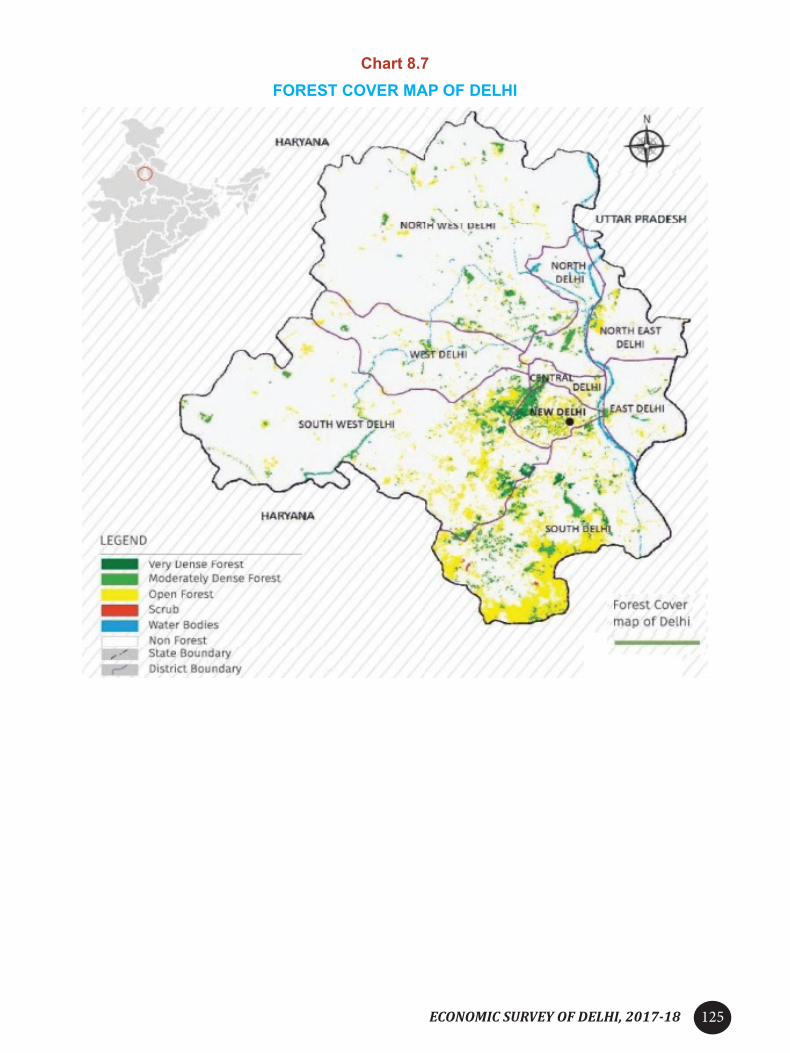
ECONOMIC SURVEY OF DELHI, 2017-18 125
Chart 8.7FOREST COVER MAP OF DELHI
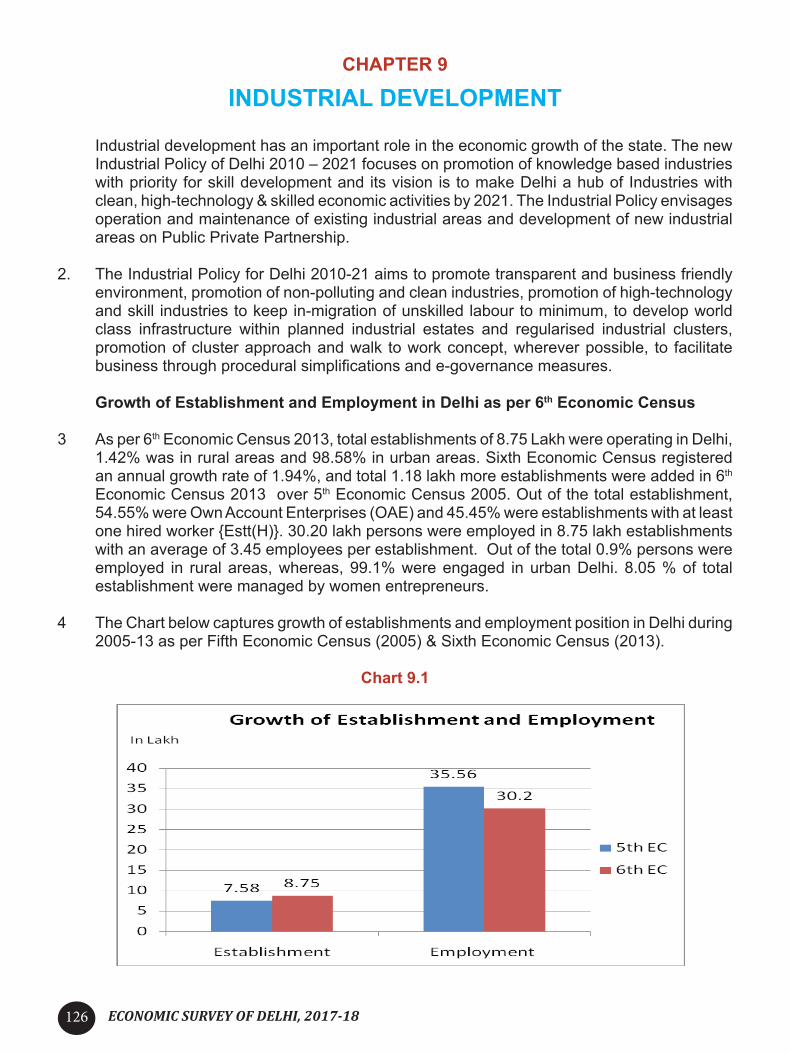
ECONOMIC SURVEY OF DELHI, 2017-18126
CHAPTER 9
INDUSTRIAL DEVELOPMENT
Industrial development has an important role in the economic growth of the state. The new Industrial Policy of Delhi 2010 – 2021 focuses on promotion of knowledge based industries with priority for skill development and its vision is to make Delhi a hub of Industries with clean, high-technology & skilled economic activities by 2021. The Industrial Policy envisages operation and maintenance of existing industrial areas and development of new industrial areas on Public Private Partnership.
2. The Industrial Policy for Delhi 2010-21 aims to promote transparent and business friendly environment, promotion of non-polluting and clean industries, promotion of high-technology and skill industries to keep in-migration of unskilled labour to minimum, to develop world class infrastructure within planned industrial estates and regularised industrial clusters, promotion of cluster approach and walk to work concept, wherever possible, to facilitate business through procedural simplifications and e-governance measures.
Growth of Establishment and Employment in Delhi as per 6th Economic Census
3 As per 6th Economic Census 2013, total establishments of 8.75 Lakh were operating in Delhi, 1.42% was in rural areas and 98.58% in urban areas. Sixth Economic Census registered an annual growth rate of 1.94%, and total 1.18 lakh more establishments were added in 6th Economic Census 2013 over 5th Economic Census 2005. Out of the total establishment, 54.55% were Own Account Enterprises (OAE) and 45.45% were establishments with at least one hired worker {Estt(H)}. 30.20 lakh persons were employed in 8.75 lakh establishments with an average of 3.45 employees per establishment. Out of the total 0.9% persons were employed in rural areas, whereas, 99.1% were engaged in urban Delhi. 8.05 % of total establishment were managed by women entrepreneurs.
4 The Chart below captures growth of establishments and employment position in Delhi during 2005-13 as per Fifth Economic Census (2005) & Sixth Economic Census (2013).
Chart 9.1

ECONOMIC SURVEY OF DELHI, 2017-18 127
5. District wise number of establishments and number of persons employed as per 6th economic Census is as under:
STATEMENT 9.1
Districts Establishments No. of Persons employed
Central 150671 599058West 106726 313574
North-West 93297 286189North-East 86597 183313
East 80061 215979South-East 75049 352562
North 73724 318960Shahdara 71738 229663
South 57126 145304South-West 42166 105954New Delhi 38153 269225
Total 875308 3019781
Statement 9.2
Sectoral Composition of Gross State Value Added at Current Prices
Year % share of
Primary Sector% share of Secondary
Sector% share of Tertiary
Sector2011-12 (R) 3.49 13.09 83.42
2012-13 (R) 2.93 14.17 82.90
2013-14 (R) 3.29 14.07 82.64
2014-15 (R) 2.79 12.27 84.94
2015-16 (2nd RE) 2.06 12.19 85.75
2016-17 (1st RE) 2.16 12.12 85.72
2017-18 (AE) 2.04 12.04 85.92
(R)- Revised Estimates, (2nd RE)- Second Revised Estimates, (1st RE)- First Revised Estimates, (AE)- Advance Estimates. 6.1 The 1st Revised Estimates and Advance Estimates of GSVA at current prices for the year
2016-17 and 2017-18 shows that contribution of Primary Sector (comprising of Crops, Livestock, Forestry and Logging, Fishing, Mining and Quarrying) in the economy of Delhi

ECONOMIC SURVEY OF DELHI, 2017-18128
decreased from 2.16% in 2016-17 to 2.04% in 2017-18. The share of primary sector in the base year 2011-12 was 3.49%. At constant prices, decline in trend was also same in the contribution of primary sector that has declined to 3.20% in 2017-18 from 3.21% in the year 2016-17.
6.2 GSVA at current prices reveals the fact that contribution of Secondary Sector (comprising of Manufacturing, Electricity, Gas, Water Supply & Other Utility Services and Construction) in the economy has decreased from 13.09% during the base year 2011-12 to 12.12% in 2016-17 (1st Revised Estimates) and to 12.04% in 2017-18 (Advance Estimates). At constant prices, the same trend is visible and the GSVA decreased to 11.67% in 2017-18 (Advance Estimates) from 11.79% in 2016-17 (1st Revised Estimates).
6.3 Contribution of Tertiary Sector (comprising of Trade, Hotels & Restaurants, Railways, Transport, Storage, Communication, Financial Services, Real Estate, Ownership of Dwellings & Other Professional Services, Public Administration and Other Services) in the economy has increased marginally. GSVA at current prices exhibited that contribution of tertiary sector in the economy, which was 83.42% in the base year 2011-12 has increased to 85.72% and 85.92% during 2016-17 (1st Revised Estimates) and 2017-18 (Advance Estimates) respectively. At constant prices, it increased to 85.13% in 2017-18 (Advance Estimates) from 85% in 2016-17 (1st Revised Estimates) respectively.
Chart 9.2
Graphical depiction of Sectoral Composition of State Economy
(GSVA at Current Prices)

ECONOMIC SURVEY OF DELHI, 2017-18 129
7. GSVA by Manufacturing Sector
7.1 Manufacturing sub-sector is the largest contributor in the secondary sector in the economy of Delhi. GSVA from manufacturing was estimated at 25840 Crore and 27756 Crore at current prices during 2016-17 and 2017-18 respectively, with annual growths of 4.99% and 7.41% respectively over previous year’s estimates. Similarly, GSVA at constant prices was 22709 Crore and 23697 Crore during 2016-17 and 2017-18 respectively with registering
annual growths of 3.62% and 4.35% respectively over previous years. NSVA estimates, by and large, are showing positive growth trend at current prices and at constant prices. As per estimates for 2016-17, NSVA is to the tune of 22306 crore with an annual growth of 5.80% over previous year at current prices and 19489 crore with an annual growth of 4.05% over previous year at constant prices. As per advance estimates for 2017-18, NSVA was to the tune of 24216 Crore with an annual growth of 8.56% over previous year at current prices and 20443 Crore with annual growth of 4.89% over previous year at constant prices respectively.
7.2 The Gross State Value Added at current prices in respect of manufacturing sector is presented in Statement 9.3:
Statement 9.3( in Crore)
Year Manu-facturing
Secondary Sector
Total GSVA
at Basic Prices
Total GSDP
at Market Prices
%age share of Manufacturing in
%age share of
Secondary Sector in
GSVATotal GSVA
Total GSVA of
Secondary Sector
2011-12 (R) 18907 39682 303232 343798 6.24 47.65 13.09
2012-13 (R) 23350 48498 342588 391388 6.82 48.15 14.17
2013-14 (R) 25338 54262 385931 443960 6.57 46.69 14.07
2014-15 (R) 23385 53247 434167 494885 5.39 43.92 12.27
2015-16 (2nd RE) 24612 58073 476477 548081 5.17 42.38 12.19
2016-17 (1st RE) 25840 64558 532656 616826 4.85 40.03 12.12
2017-18(AE) 27756 70524 585959 686017 4.74 39.36 12.04
Source: Estimation of GSVA by DES, (R)- Revised Estimates, (2nd RE)- Second Revised Estimates, (1st RE)- First Revised Estimates, (AE)- Advance Estimates
7.3 It is evident from the Statement 9.3 that the income from manufacturing has increased from 18907 Crore in 2011-12 to 27756 Crore in 2017-18. However, the percentage contribution of manufacturing to GSVA has decreased from 6.24% in 2011-12 to 4.74% in 2017-18. During the same period, the contribution of secondary sector to the total GSVA of Delhi has also decreased from 13.09% in 2011-12 to 12.04% in 2017-18.

ECONOMIC SURVEY OF DELHI, 2017-18130
8. Working Factories
8.1 The number of registered factories and estimated workers employed in these factories during the last nine years is presented in statement 9.4:
Statement 9.4
FACTORIES AND ESTIMATED WORKERS EMPLOYED
S. No Years Factories Estimated Workers Employed
1. 2007 7793 3591262. 2008 7921 3640533. 2009 7997 3676114. 2010 8109 3735005. 2011 8219 3783616. 2012 8557 3922707. 2013 8821 4032708. 2014 8968 4169279. 2015 8954 415278
10. 2016 8968 416833Source: - Delhi Statistical Handbook, 2017.
8.2 The Statement 9.4 indicates that the number of working factories in Delhi increased from 7793 in 2007 to 8968 in 2016. Likewise the estimated workers employed in these factories increased from 359126 in 2007 to 416833 in 2016. On an average of 46 persons were working in each factory in Delhi.
8.3 Due to the intervention of various environmental norms by the Central Pollution Control Board and Delhi Pollution Control Committee, number of industrial units in Delhi are not meeting with the safety standards which automatically results into closure of these units or shifting these industries to other neighboring States. The estimated number of workers employed in these industries increased at a slow rate.
8.4 The types and number of factories and workers in registered factories during the years 2012 to 2016 may be seen from statement 9.5:
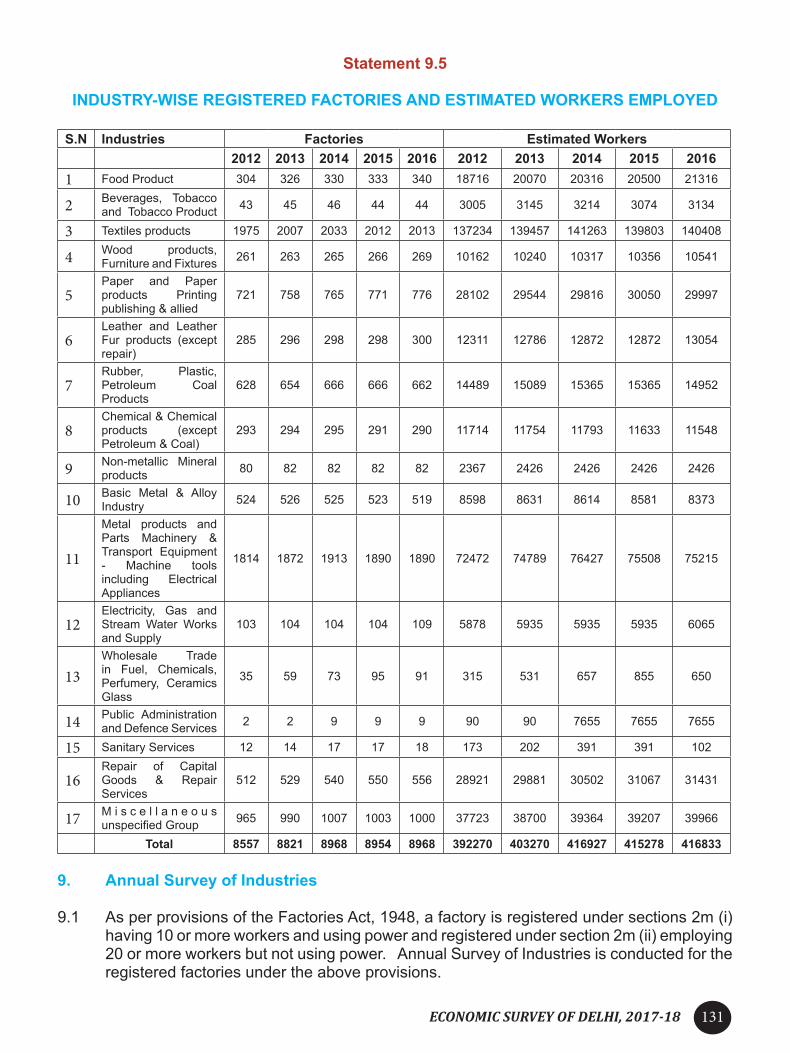
ECONOMIC SURVEY OF DELHI, 2017-18 131
Statement 9.5
INDUSTRY-WISE REGISTERED FACTORIES AND ESTIMATED WORKERS EMPLOYED
S.N Industries Factories Estimated Workers2012 2013 2014 2015 2016 2012 2013 2014 2015 2016
1 Food Product 304 326 330 333 340 18716 20070 20316 20500 21316
2 Beverages, Tobacco and Tobacco Product 43 45 46 44 44 3005 3145 3214 3074 3134
3 Textiles products 1975 2007 2033 2012 2013 137234 139457 141263 139803 140408
4 Wood products, Furniture and Fixtures 261 263 265 266 269 10162 10240 10317 10356 10541
5Paper and Paper products Printing publishing & allied
721 758 765 771 776 28102 29544 29816 30050 29997
6Leather and Leather Fur products (except repair)
285 296 298 298 300 12311 12786 12872 12872 13054
7Rubber, Plastic, Petroleum Coal Products
628 654 666 666 662 14489 15089 15365 15365 14952
8Chemical & Chemical products (except Petroleum & Coal)
293 294 295 291 290 11714 11754 11793 11633 11548
9 Non-metallic Mineral products 80 82 82 82 82 2367 2426 2426 2426 2426
10 Basic Metal & Alloy Industry 524 526 525 523 519 8598 8631 8614 8581 8373
11
Metal products and Parts Machinery & Transport Equipment - Machine tools including Electrical Appliances
1814 1872 1913 1890 1890 72472 74789 76427 75508 75215
12Electricity, Gas and Stream Water Works and Supply
103 104 104 104 109 5878 5935 5935 5935 6065
13Wholesale Trade in Fuel, Chemicals, Perfumery, Ceramics Glass
35 59 73 95 91 315 531 657 855 650
14 Public Administration and Defence Services 2 2 9 9 9 90 90 7655 7655 7655
15 Sanitary Services 12 14 17 17 18 173 202 391 391 102
16Repair of Capital Goods & Repair Services
512 529 540 550 556 28921 29881 30502 31067 31431
17 M i s c e l l a n e o u s unspecified Group 965 990 1007 1003 1000 37723 38700 39364 39207 39966
Total 8557 8821 8968 8954 8968 392270 403270 416927 415278 416833
9. Annual Survey of Industries
9.1 As per provisions of the Factories Act, 1948, a factory is registered under sections 2m (i) having 10 or more workers and using power and registered under section 2m (ii) employing 20 or more workers but not using power. Annual Survey of Industries is conducted for the registered factories under the above provisions.

ECONOMIC SURVEY OF DELHI, 2017-18132
Statement 9.6
KEY INDICATORS OF INDUSTRIAL SECTOR IN DELHI
S. No Key Indicator 2008-09 2009-10 2010-11 2011-12 2012-13 2013-14
1. Registered Factories (No) 3026 2878 2878 2976 3183 2980
2. Capital (Rs. In crore)a. a. Fixed Capital 3129 3867 4469 8938 10661 5903
b. b. Working Capital 3287 6040 8216 10352 8137 10722
c. Total 6416 9907 12685 19290 18798 16625
3. Employment
a. Workers 87752 84408 79036 76867 81901 76250
b. Other Than Workers 39064 36753 43495 41911 44453 39481
c. Total 126816 121161 122531 118778 126354 115731
4. Man Days (in Lakh) 379 363 371 359 376 350
Total Emoluments ( Crore) 1313 1590 1972 2260 2578 2489
Source: - Delhi Statistical Handbook, 2017 10. Industrial Estates
10.1 Operation and Maintenance of Industrial Estates/ Areas
Delhi has 29 planned industrial areas and 4 flatted factories complex. In addition, 22 non-confirming industrial clusters have been notified for development. Delhi State Industrial Infrastructure Development Corporation (DSIIDC) is the Agency for development, operation and maintenance of all industrial estates in Delhi. The Delhi Industrial Development, Operation & Maintenance, Act, 2010 notified on 8th June 2010, has come into force with effect from 28th March 2011 to place all industrial areas under DSIIDC. The DSIIDC has created industrial development, operation and maintenance fund with 74 crore of seed capital for discharge of its function under the Act.
10.2 Rules under the Delhi Industrial Development, Operation and Maintenance Act, 2010 have been notified on 11th November 2011.
10.3 Government of India has directed the Delhi Municipal Corporation to hand over the
industrial estates for maintenance to DSIIDC. Hon’ble L.G has also ordered transfer to industrial estates from Municipal Corporatrion of Delhi and Delhi Development Authority to DSIIDC.

ECONOMIC SURVEY OF DELHI, 2017-18 133
11 Operation and Maintenance of Industrial Estates
11.1 In order to maximise efficiency with the available resources, the Government has decided to develop and maintain industrial infrastructure on Public Private Partnehip basis. Two industrial estates namely Bawana and Narela have been selected as pilot project for maintenance of industrial estates on PPP model under a BOT concession to a private partner for 15 years.
11.2 Operation and maintenance of Bawana and Narela Industrial Areas have been handed over to the concessionaires on PPP mode. Estimated infrastructure development cost is of 230 crore. Govt. has approved redevelopment and upgradation of roads & drains in 10 industrial areas at a cost of about 169 crore during 2014-15.
12. Development of Industrial Clusters in Non-conforming Areas
12.1 There are 29 approved industrial areas and four flatted factory complexes in Delhi. However, many industries are functioning in non-conforming areas. Hon’ble Supreme Court in a PIL ordered closure of all industrial units that have come up on or after 1st August 1990 in residential/ non-conforming areas and other impermissible industries in violation to the provision of Master Plan.
12.2 With a view to ensure minimum dislocation of cluster of industries operating in residential/ non-conforming areas, 22 non-conforming industrial clusters having 70 per cent concentration have been notified by the Government for redevelopment.
12.3 The redevelopment process involves preparation of development plans for the area which includes widening of roads, laying of services, development of open space, parking etc,. It needs to be carried out in accordance with the guidelines prepared and notified for this purpose by the Government. The industrial association of the respective area will have to own the responsibility for preparation and implementation of Re-development Plan for their area.
13. Delhi Financial Corporation
13.1 The Delhi Financial Corporation (DFC) caters to the financial needs of industries located in the National Capital Territory of Delhi and the Union Territory of Chandigarh. Financial assistance is being made available to the industrial as well as service sectors units like medical & health care/diagnostic centres, transport sector, hotels, and restaurant, Tourism related facilities like amusement parks, convention centres, software/hardware services relating to information technology, telecommunication or electronics including satellite, linkage, Audio/Video/Visual communication, Hi-tech Agro Industries, floriculture, aqua poultry farming, breeding hatcheries etc. The upper limit for grant of loans in case of companies and co-operative Societies is 10 crore while for proprietorship and partnership firms, it is 4 crore. The loans are available to new industrial units as well as existing ones for shifting, expansion, modernization, diversification and rehabilitation. Loans are also provided to the units for up-gradation of technology resulting in less consumption of power and increase in qualitative productivity as also pollution control equipment etc. DFC is also providing loans to small road transport operators for commercial vehicles. In order to make Delhi an environment friendly city, DFC facilitated the relocation process of industrial units by providing loans on concessional terms. The corporation has a paid-up share capital of 2647.75 lakh and surplus of 4859.88 lakh as on 31st March 2017.

ECONOMIC SURVEY OF DELHI, 2017-18134
Statement 9.7 PERFORMANCE OF DFC: 2012-2017
in crore
Year Sanction Disbursement Recovery2012-13 9.77 8.82 49.222013-14 7.19 6.65 50.782014-15 60.72 9.14 43.702015-16 23.19 49.36 52.402016-17 1.71 2.78 41.69
Source: - Industries Department / DFC
14. Delhi State Industrial & infrastructure Development Corporation (DSIIDC)
14.1 DSIIDC was incorporated as a company and registered under Companies Act, 1956 in February, 1971 with the main objectives of aiding, counselling, assisting, financing, projecting and promoting the interests of small industries in Delhi and providing them capital, credit, resources and technical and managerial assistance for the successful execution of their work and business. At the time of registration it was known as Delhi Small Industries Development Corporation Limited. However, now it is called ‘Delhi State Industrial & Infrastructure Development Corporation Limited’
14.2 Sheds Constructed Under Half-A-Million Job Programme: The DSIIDC constructed 840 Industrial sheds to implement the Scheme launched by Government of India titled “Half-a-million Job Programme” in the year 1973-74 at various Industrial Complexes as indicated as under:
Statement 9.8
INDUSTRIAL SHEDS UNDER HALF-A-MILLION JOB PROGRAMME
S.No. Name of the Complex Number of
sheds1. Okhla Industrial Complex Ph-I 232
2. Okhla Industrial Complex Ph-II/I 112
3. Okhla Industrial Complex Ph-II/II 34
4. Okhla Industrial Complex Ph-II/III 59
5. Wazirpur Industrial Complex 103
6. Lawrance Road Industrial Complex 90
7. Jhilmil Tahirpur Industrial Complex 33
8. Rohtak Road Industrial Complex Ph-I 177Source:- Industry Department, GNCTD

ECONOMIC SURVEY OF DELHI, 2017-18 135
14.3 Sheds under Self-Financing Scheme: DSIIDC also constructed 456 industrial sheds under self financing scheme. The information regarding industrial sheds constructed under the self financing scheme is presented as:
Statement 9.9
INDUSTRIAL SHEDS UNDER SELF FINANCING SCHEME
S.No
Name of Complex Number of Sheds
Permitted Industries
1.Kirti Nagar Packing Complex
226Timber related and Packing
2.Mangolpuri Engg. Complex
94Light Engineering.
3.Okhla Computer Complex
31Computer related.
4.Rohtak Road Indl. Complex
105General
Source:- Industry Department, GNCTD
14.4 Shifting of industries from Non-Confirming areas: Allotments of new developed industrial plots have been made to 21973 applicants from non-confirming areas in the newly developed industrial areas. Water polluting industries were given allotments on priority basis in Narela and Badli while units falling under F category of Master Plan of Delhi were given priority allotments in Bawana industrial area.
15. Construction of Common Effluent Treatment Plants (CETPs):
15.1 With the growth of city of Delhi, the environmental concerns have assumed greater importance. Delhi State Industrial & Infrastructure Development Corporation (DSIIDC) was entrusted with the task of construction of CETPs in compliance of the orders of the Hon’ble Supreme Court of India. DSIIDC is executing this project in co-ordination with Delhi Pollution Control Committee (DPCC) and National Environmental Engineering Research Institute (NEERI). DSIIDC has constructed 13 CETPs at Wazirpur, Mangolpuri, GTK, Mayapuri, Badli, SMA, Okhla Industrial Area, , Jhilmil, Nagloi, Lawerence Road, Narela, Bawana and Naraina. Out of 13 CETPs , 11 CETPs have been handed over to the respective societies for operation and maintenance and 02 CETPs are being operated by DSIIDC through the concessionaires.
16. Institute of Gem and Jewellery
16.1 Delhi State Industrial & Infrastructure Development Corporation (DSIIDC) has set up National Institute of Jewellery. The institute is currently providing training in various short term certificate courses such as Basic Jewellery Designing, Computer Aided Design (CAD) for Gems & Jewellery, Diamond Identification and Grading Coloured Gemstone Identification, Costume Jewellery making as well as Six month diploma in Gemmology and Jewellery Designing.

ECONOMIC SURVEY OF DELHI, 2017-18136
17. Delhi Khadi and Village Industries Board
17.1 Delhi Khadi & Village Industries Board was established in the year 1983 under Himachal Pradesh Khadi and Village Industries Board Act 1966 as extended to Delhi. The main aim of the Board is to promote and popularise Khadi & Village product and create awareness among the masses and also to generate employment. At present the Board is implementing following two employment generation schemes namely Rajiv Gandhi Swavlamban Rozgar Yojna and Prime Minister Employment Generation Programme- KVIC, Government of India.
17.2 Rajiv Gandhi Swavlamban Rozgar Yojna (RGSRY):
17.2.1 Rajiv Gandhi Swavlamban Rozgar Yojna has been designed, developed and promoted by the Delhi Khadi and Village Industries Board, with the help of Government of National Capital Territory of Delhi, to provide sustainable self-employment opportunities to the school and college dropouts above the age of 18 years to individual entrepreneurs , trade , artisans, professionals, etc.. Under this scheme financial assistance in the shape of loan up to 3 lakh is provided with 15% subsidy component of project cost subject to a ceiling of 7500 per entrepreneur. The progress made under this scheme during 2015-16 & 2016-17 is presented in the following statement 9.10.
Statement 9.10
PROGRESS OF RGSRY
No Items Achievement2015-16 2016-17
1. Number of Loan Sub Committee meeting held 3 22. Target (Number of cases) 30 503. Details of Sanctioned Cases
a. Number of Cases 33 26b. Amount Sanctioned 84.90 lakh 69.30 lakh
4. Details of Disbursed Casesa. Number of Cases 24 21
b. Amount Disbursed 59.75 lakh 56.65 lakhSource: Industry Department, GNCTD.
17.3 Prime Minister Employment Generation Programme (PMEGP):
17.3.1 This scheme was introduced by the Ministry of Small and Medium Enterprises, Government of India with a view to generate employment opportunities in the country. Khadi and Village Industries Commission is the nodal agency for implementation of the scheme in the country as a whole and state Khadi and Village Industries Board have been nominated as the state implementing agency alongwith KVIC and DICs. In Delhi, Khadi and Village Industries Board is nominated as the nodal agency to implement the scheme in the rural as well as in urban areas along with state office, KVIC. The maximum cost of the project per unit admissible to each entrepreneur under the scheme is 25 lakh. There is no income criteria for applying loan under PMEGP scheme. The rate of subsidy differs depending on the category of the applicant along with the area where he/ she wants to establish the unit.

ECONOMIC SURVEY OF DELHI, 2017-18 137
17.3.2 Under this scheme the applications are placed before the District Task Force Committees (DTFC) headed by Deputy Commissioner of the concerned district and after the recommendation of DTFC the cases are forwarded to the banks for their evaluation and sanction. After sanction, the Bank disburses the amount to the beneficiaries and claims the margin money component from the implementing agency. The progress of the scheme during 2015-16 & 2016-17 is as under in Statement 9.11.
Statement 9.11
PROGRESS OF PMEGP IN DELHI DURING 2015-16 & 2016-17
S. No Items
Achievement2015-16 2016-17
1. Target (number of cases) 254 1502. Number of Cases disbursed by Banks 221 413. Margin money amount disbursed by the Banks 205.84 lakh 61.91 lakh
17.4 Marketing Activities:
17.4.1 Delhi Khadi and Village Industries Board started limited marketing activities from 1999. The Board is procuring items from certified Khadi and Village Industrial units and selling them at its sale outlets. There are two sale outlets at present at Udyog Sadan, Patparganj and Delhi Secretariat.
18. Development of New Industrial Areas /Hubs
18.1 Development of Multilevel Manufacturing Hub at Rani Khera, Mundka
• DSIIDC is coming up with a multilevel manufacturing hub for the development of non-polluting light and service industries with World Class facilities, in an area of approximately 147 acres at Rani Khera, located on Mundka- Rohtak road, Delhi. As per the zonal plan of DDA, the land is under zone-M, which is the Manufacturing (Light & Service Industry) Zone. The area will be developed with the states-of –the art facility, which will be a multi-level Manufacturing Hub.
• The project is expected to generate employment for nearly 1.50 Lakh people and employment for the neighboring agglomeration. The project envisages development of approximately 70% of the land as open area, out of which 40% will be green area. Thick plantation has been envisaged to give greenery to the premises to enrich the environment.
• The tentative cost of the project is 5000 crore and built up area as per proposed FAR is 8,92,584 sqm which includes 19 industrial buildings, 06 Warehouse buildings, 5 other industrial buildings and other miscellaneous provisions. Layout plan has been approved by the standing committee on 17.11.2017. Building Plan and other approvals are being obtained from concerned authorities.
18.2 Knowledge Based Industrial Park at Baprola, Delhi
18.2.1 DSIIDC is developing Knowledge Based Industrial Park at Baprola in an area of approximately 55 acres. The estimated project cost is about 2575 crore. The project will cater to the specific needs of Information Technology, ITeS Industry, Media, Research

ECONOMIC SURVEY OF DELHI, 2017-18138
& Development, Gems & Jewellery and other business services. The project is expected to provide direct employment to about 01 lakh persons and indirect employment to about 1.70 lakh persons.
18.2.2 Industrial buildings are proposed to be developed as green building with the target of four star GRIHA rating. All industrial and commercial buildings shall be centrally air condition. The tentative cost of the project is 2175 crore and the total built up area of the project is 2,23,339 sqm. The layout plan has been submitted to MCD for approval.
18.3 Development of a New Industrial Area at Kanjhawala
DSIIDC intends to develop an integrated industrial township at Kanjhawala. The proposed project shall be major Greenfield Project spread over in an area of 920 acres. The project will spearhead the industrialization of North West Delhi and also create vast employment opportunities for people directly and indirectly. The Project will be developed in consonance with the Master Plan for Delhi 2021 and Industrial Policy for Delhi 2010-21.
.

ECONOMIC SURVEY OF DELHI, 2017-18 139
CHAPTER – 10
AGRICULTURE & RURAL DEVELOPMENT
Contribution of agriculture sector has been reduced in NCT of Delhi due to rapid urbanisation and the growth of trade and industry sector in Delhi. Around 25% of the total area of NCT, as per 2011 census, was in rural and the remaining 75% in urban. The number of rural villages in Delhi reduced from 214 in 1981 to 112 in 2011.
1.2 The percentage distribution of Gross State Value Added (GSVA) of Delhi at current prices showed a declining trend of agriculture and allied sector. More clearly, the percentage contribution of agriculture sector to GSVA of Delhi at current prices reduced from 0.94 % in 2011-12 to 0.47% in 2017-18.
2. Land Holding Pattern
2.1 As economy is moving along-with rapid urbanization, the agriculture holdings in Delhi is also reducing at a speedy rate. This is evident as per the Agricultural Census. The information regarding the agricultural land holding pattern and area operated for agricultural purposes in Delhi, during the last two agricultural censuses is presented in Statement 10.1.
Statement 10.1
LAND HOLDINGS & OPERATIONAL AREA IN DELHI: 2005-06 & 2010-11
S. No. Details Agricultural Census 2005-06 Agricultural Census 2010-11
1.
Operational Holdings (Number)
a. Individual 11741 (46.39) 8195 (39.98)
b. Joint 12624 (49.87) 11358 (55.41)
c. Institutional 946 (3.74) 944 (4.61)
Total 25311 (100.00) 20497 (100.00)
2.
Operational Area (in Hectares)
a. Individual 10590.95 (28.04) 7087.95 (23.92)
b. Joint 25977.85 (68.78) 21341.82 (72.03)
c. Institutional 1201.49 (3.18) 1198.44 (4.05)
Total 37770.29 (100.00) 29628.21 (100.00)Sources: Agricultural Census 2005-06 & 2010-11
Note : Figures in parenthesis relate percentage to total

ECONOMIC SURVEY OF DELHI, 2017-18140
2.2 It may be inferred from Statement 10.1 that the number of operational holdings in Delhi reduced from 25311 in 2005-06 to 20497 in 2010-11. The reduction in land holdings in Delhi worked out at 3.80 per cent per annum. The reduction of operational holdings by the individual category was highest at 6.04 per cent per annum; while the same in joint and institutional category at 2.01 per cent and 0.04 per cent per annum respectively. The operational area of Delhi decreased from 37770.29 hectares during 2005-06 to 29628.21 hectares during 2010-11. The reduction in operational area during the last two agricultural censuses in Delhi was worked out at 4.31 per cent per annum. The reduction in operational area of institutional category during the same period was highest at 6.62 per cent per annum. The same in case of joint and institutional category was worked out at 3.57 per cent per annum and 0.05 per cent per annum respectively. The tenth Agriculture Census with reference year 2015-16 has been launched in the country during the State Agriculture Report 2016-17 Census Commissioner’s meeting held on 3rd February, 2016 at New Delhi. The land holdings and operational area of Delhi during the last two agricultural census is depicted in Chart 10.1.
Chart 10.1
LAND HOLDINGS & OPERATIONAL AREA IN DELHI: 2005-06 & 2010-11
Chart 10.1
LAND HOLDINGS & OPERATIONAL AREA IN DELHI: 2005-06 & 2010-11
2.3 As per Agriculture Census 2010-11, out of 20497 total operational holdings in the State, 77.21 per cent operational holdings belonged to marginal and small farmers with land holding less than or equal to two ha. Only 0.73% of operational holdings were under the category of large holdings which size was above ten hectares. Area operated in agriculture in Delhi was highest in medium and semi-medium size and it constitutes about 57 percent area operated. The information regarding number and area of operational holdings of all social groups in Delhi are presented in Table 10.1.
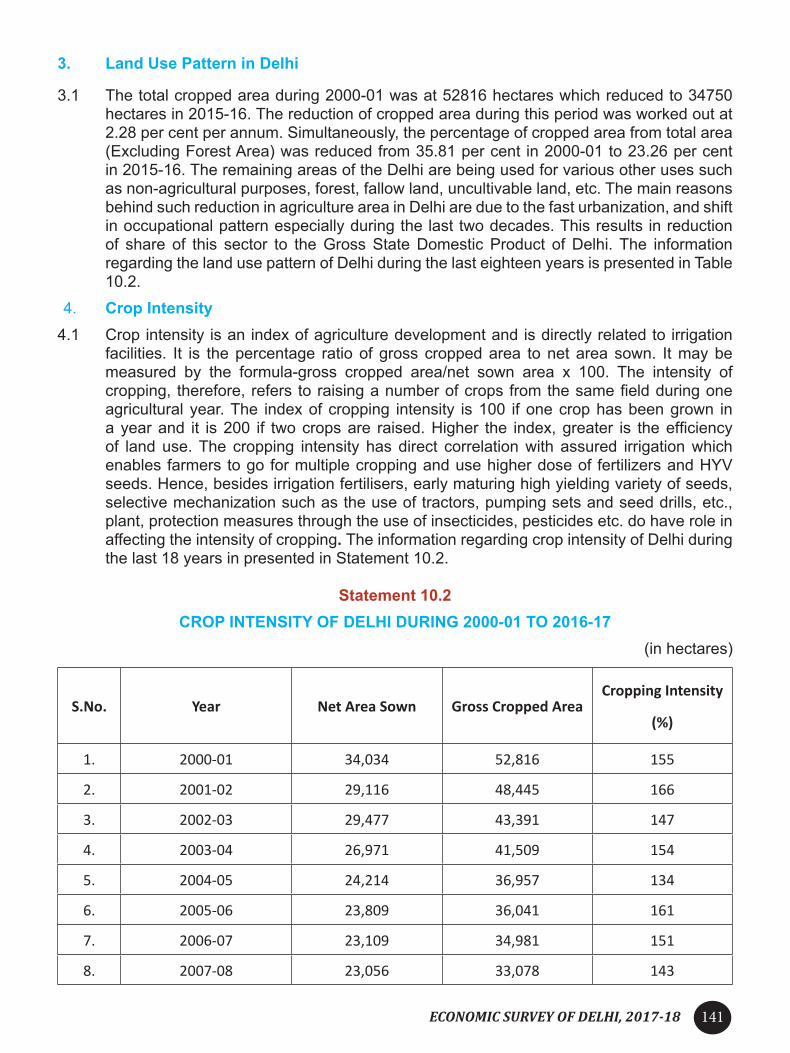
ECONOMIC SURVEY OF DELHI, 2017-18 141
3. Land Use Pattern in Delhi
3.1 The total cropped area during 2000-01 was at 52816 hectares which reduced to 34750 hectares in 2015-16. The reduction of cropped area during this period was worked out at 2.28 per cent per annum. Simultaneously, the percentage of cropped area from total area (Excluding Forest Area) was reduced from 35.81 per cent in 2000-01 to 23.26 per cent in 2015-16. The remaining areas of the Delhi are being used for various other uses such as non-agricultural purposes, forest, fallow land, uncultivable land, etc. The main reasons behind such reduction in agriculture area in Delhi are due to the fast urbanization, and shift in occupational pattern especially during the last two decades. This results in reduction of share of this sector to the Gross State Domestic Product of Delhi. The information regarding the land use pattern of Delhi during the last eighteen years is presented in Table 10.2.
4. Crop Intensity 4.1 Crop intensity is an index of agriculture development and is directly related to irrigation
facilities. It is the percentage ratio of gross cropped area to net area sown. It may be measured by the formula-gross cropped area/net sown area x 100. The intensity of cropping, therefore, refers to raising a number of crops from the same field during one agricultural year. The index of cropping intensity is 100 if one crop has been grown in a year and it is 200 if two crops are raised. Higher the index, greater is the efficiency of land use. The cropping intensity has direct correla tion with assured irrigation which enables farmers to go for multiple cropping and use higher dose of fertilizers and HYV seeds. Hence, besides irrigation fertilisers, early maturing high yielding variety of seeds, selective mechanization such as the use of tractors, pumping sets and seed drills, etc., plant, protection measures through the use of insecticides, pesticides etc. do have role in affecting the intensity of cropping. The information regarding crop intensity of Delhi during the last 18 years in presented in Statement 10.2.
Statement 10.2CROP INTENSITY OF DELHI DURING 2000-01 TO 2016-17 (in hectares)
S.No. Year Net Area Sown Gross Cropped AreaCropping Intensity
(%)
1. 2000-01 34,034 52,816 155
2. 2001-02 29,116 48,445 166
3. 2002-03 29,477 43,391 147
4. 2003-04 26,971 41,509 154
5. 2004-05 24,214 36,957 134
6. 2005-06 23,809 36,041 161
7. 2006-07 23,109 34,981 151
8. 2007-08 23,056 33,078 143

ECONOMIC SURVEY OF DELHI, 2017-18142
S.No. Year Net Area Sown Gross Cropped AreaCropping Intensity
(%)9. 2008-09 23,025 32,288 140
10 2009-10 23,575 33,700 143
11 2010-11 22,124 31,366 142
12 2011-12 22,885 36,445 159
13 2012-13 23,118 35,178 152
14 2013-14 23,150 34,312 148
15 2014-15 23,150 34,312 148
16 2015-16 23,150 34,312 148
17 2016-17 23,150 34,750 150
18 2017-18 (Estimated) 23,150 34,750 150 Source: Development Department, Govt. of NCT of Delhi
4.2 It may be observed from Statement 10.2 that the the crop intensity was highest at 166% during 2001-02 and lowest at 134% during 2004-05. The crop intensity of Delhi during 2017-18 is estimated at 150%. In addition, area under the food-grain crops have been decreased during this period but the same in vegetables increased being one of the fast growing mega cities in India, showing the importance of agriculture activity with the limited available land. The same is also depicted in chart 10.2.
Chart 10.2
CROPPING INTENSITY OF DELHI DURING 2007-08 TO 2016-17

ECONOMIC SURVEY OF DELHI, 2017-18 143
5. Cropping Pattern 5.1 Cropping pattern is the sequential arrangement of crops on a piece of land. Paddy, Jowar
and Bajra during Kharif and Wheat and Mustard crops during the Rabi seasons are the major crops in Delhi. The cultivation of vegetables is in continuous process throughout the year. The information regarding the area, production and yields of some of the selected crops in Delhi during 2016-17 is presented in Statement 10.3.
Statement 10.3AREA, PRODUCTION & YIELD OF CROPS IN DELHI 2016-17
S. No. Name of the Crops Area (Hectare) Production (Metric
Ton)Yield (Kg. per
Hectare)1. Wheat 19,623 87,182 4,4732. Barley 68 184 2,7063. Bajra 1,497 3,278 2,1904. Maize 34 174 5,1185. Jowar 3,193 3,035 9606. Paddy 5,973 25,891 4,3357. Gram 25 53 2,1208. Mustard 3,608 4,527 1,248
Source:- Development Department, Govt. of NCT of Delhi
5.2 It may be observed from Statement 10.3 that wheat was the main food crop in Delhi during 2016-17. Area, Production and Yield of Wheat were recorded at 19623 hectare, 87182 MT and 4473 Kg/Hect. respectively. During 2016-17, the yield of Barley, Bajra, Maize, Jowar, Paddy, Gram and Mustard was at 2706, 2190, 5118, 960, 4335, 2120 and 1248 kg per hectare respectively. The information regarding production and yield of food-grain in Delhi from 2005-06 to 2016-17 is presented in Table 10.3.
5.3 The returns from traditional agriculture are presently less attractive as compared to the high value of commercial horticulture and other high value added agriculture activities. The Govt. of NCT of Delhi is therefore encouraging farmers to take-up vegetables, floriculture production, mushroom cultivation etc. The area under floriculture has been increased from 5,479 hectares in 2005-06 to 12,638 hectares during the year 2015-16.
6 Irrigation in Delhi6.1 Irrigation in Delhi mainly depends upon ground water and partly upon surface water.
Irrigation from the ground water is provided through shallow cavity and the deep cavity state tube-wells, whereas surface irrigation provided by way of utilizing treated effluent available from existing sewage treatment plants located at coronation pillar, Okhla and Keshopur. Water from Western Yamuna Canal system under the control of Haryana Govt. is also utilized for irrigation purpose.
6.2 Due to fast urbanization taking place in the rural areas of Delhi, cultivable command data under irrigation is getting reduced day by day. In Master Plan of 2021 for Delhi, Delhi Development Authority has also proposed complete urbanization of Delhi. Hence any increase in the command area in future is not possible. The information regarding the source-wise irrigated area in Delhi during the last eight years is presented in Statement 10.4

ECONOMIC SURVEY OF DELHI, 2017-18144
Statement 10.4SOURCE-WISE IRRIGATED AREA IN DELHI 2009-10 TO 2016-17
(Area in hectares)
S.No
Sources 2009-10
2010-11
2011-12
2012-13
2013-14
2014-15
2015-16
2016-17*
1. Canals 2238 2241 2225 2225 2225 2225 2218 22402. Wells 21205 21742 19561 19561 19561 19561 19533 197273. Area Irrigated 23443 23982 18581 21786 21786 21786 21751 21967
4.Area irrigated under more then one crop
7310 8309 7875 7875 7875 7900 7678 7756
5. Gross area Irrigated 30753 32291 29661 29661 29661 29661 29429 29723
Source: Revenue Department & Development Department
* Estimated
6.3 It may be inferred from the statement 10.4 that gross area irrigated reduced from 30753 hectares during 2009-10 to 29723 hectare during 2016-17 indicating a decline of 3.35% during the last eight years likewise, area irrigated through wells which was main source of irrigation also reduced from 21205 hectare during 2009-10 to 19727 hectare during 2016-17 recording a decrease of 6.97% during the same period.
6.4 Rainfall is also one of the other main sources of irrigation in Delhi. Generally rainfall in Delhi is concentrated in three months viz. July, August and September. The detail of rainfall during the last eleven years in Delhi especially in the months of July, August and September is presented in Statement 10.5.
Statement 10.5RAIN FALL IN DELHI (JULY - SEPTEMBER)
(in mm)
S.No. Details July August September 1. Normal 210.60 247.70 125.402. 2006 313.30 98.00 129.603. 2007 163.10 214.30 85.604. 2008 146.20 301.70 165.405. 2009 161.20 216.60 191.206. 2010 239.60 455.10 332.907. 2011 111.70 190.30 225.808. 2012 94.80 378.80 54.809. 2013 340.50 321.40 94.40
10. 2014 103.00 139.10 82.6011. 2015 235.20 181.60 22.0012. 2016 292.50 122.70 75.00
Source:- Regional Metrological Centre, New Delhi

ECONOMIC SURVEY OF DELHI, 2017-18 145
6.5 It may be observed from above statement that the rainfall in Delhi during 2010 was higher than the normal rainfall in Delhi. Normal rainfall relates to the norms of the Metrological Department of Govt. of India.
7. Animal Husbandry7.1 Animal husbandry is the occupation which takes care of domestic animals that are used
primarily as food or product source. The word “Livestock” is an umbrella term used for domesticated animals raised in an agricultural environment, with the intent of providing food, textiles, labor, or fertilizer to their owners. Common examples of livestock are horses, pigs, goats, buffaloes cows etc. Raising livestock is an important source of livelihood of the people all over the world. It is an important component in the agriculture sector which affects the development of the economy directly and indirectly. The information regarding the livestock Census in Delhi during 2003, 2007 and 2012 is presented in Statement 10.6.
Statement 10.6
LIVESTOCK IN DELHI AND ITS GROWTH: 2003, 2007 AND 2012
S. No. Livestock
Livestock Census(Number) Growth (%)
2003 20072012 Per cent
(2003-2012)Per annum
1. Cow 91589 107730 86433 - 5.63 - 0.62
2 Buffalo 230552 266626 162142 - 29.67 - 3.30
3 Sheep 3377 5896 932 - 72.40 -8.04
4 Goat 16779 21176 30470 81.60 9.07
5 Others 32481 21891 86012 164.81 18.31
Total 374778 423319 365989 - 2.35 -0.26
7.2 It may be inferred from statement 10.6 that the livestock in Delhi decreased marginally from 3.75 lakh in 2003 to 3.66 lakh in 2012 recording a negative annual growth at -0.26 per cent. The highest growth of livestock was reported at 18.31% per annum in case of others Category of the livestock. Similarly, growth of 9.07% per annum was recorded in case of Goats. On the other hand, the highest negative growth was recorded at -8.04% per annum in the case of sheep. The negative growth also reported at -3.30% per annum and –0.62% per annum in buffaloes and cows respectively. The main reason for decline in number of live stock may be attributed to decline in agricultural and allied activities and rapid urbanization in Delhi.
8. Veterinary Facilities
8.1 There are 46 Govt. Veterinary hospitals, 28 Veterinary Dispensaries, 2 laboratory/research centre and 1 Veterinary Poly Clinic for providing veterinary facilities in Delhi. The number of Govt. Veterinary Hospitals and Dispensaries almost remained unchanged in Delhi during the last one decade. The number of animals treated in Govt. Veterinary Hospitals/Dispensaries increased from 3.64 lakh during 2000-01 to 4.38 lakh during 2016-17. It may be due to enhancement of education and awareness among the farmers. The information regarding veterinary services in Delhi is presented in Statement 10.7.

ECONOMIC SURVEY OF DELHI, 2017-18146
Statement 10.7
VETERINARY SERVICES IN DELHI DURING 2000-01 TO 2016-17
S. No. Years
Veterinary Facilities (No.)Animal treatedHospitals (inc. one
Vety. Poly. Clinic) DispensariesLabs/
Research Centres
1 2000-01 48 27 2 363555
2 2001-02 48 27 2 364592
3 2002-03 48 27 2 376734
4 2003-04 48 27 2 390023
5 2004-05 48 27 2 405009
6 2005-06 48 27 2 506017
7 2006-07 48 27 2 470879
8 2007-08 47 27 2 485501
9 2008-09 48 29 2 462778
10 2009-10 45 29 2 406878
11 2010-11 46 27 2 483709
12 2011-12 46 28 2 415986
13 2012-13 47 28 1 391152
14 2013-14 47 28 2 378359
15 2014-15 47 28 2 367518
16 2015-16 47 28 2 412363
17 2016-17 47 28 2 438504

ECONOMIC SURVEY OF DELHI, 2017-18 147
Statement 10.8
Physical Achievements 2016-17
S. No. ActivityTarget
2016-17Achievement
Target
2017-18i Treatment of Sick animals cases 4.00 Lakh 438504 4.00 Lakh
iiVaccination against Heamorrhagic Septicaemia and FMD Disease 4T
lakh each.
H.S- 4.00 Lakh
F.M.D- 4 Lakh
475193
236189
H.S- 4.00 Lakh
F.M.D-4 Lakh
iii A-I with Frozen Semen in cow 20000 Nos. 11336 20000 Nos.
ivAnimal husbandry taraining-cum-treatment camps for farmer village
level50 Nos. 50 50 Nos.
v Anti Rabies Vaccination of Dogs 40000 Nos. 40350 50000 Nos.
vi Animals to be benefited in Gosadans/ Goshalas. 14000 Nos. 14213 20000 Nos.
vii Treatment of Sterility Cases 20000 Nos. 17209 22000 Nos.
viii Training to SC/ST candidates in Modern poultry Farming 100 174 200
9. Fisheries
9.1 Fishing as an occupational activity is decreasing sharply in Delhi due to rapid urbanization, and resultant non-availability of water bodies suitable for fish culture. The Fisheries Unit surveyed/indentified 24 water bodies in rural areas of North-west district for leasing out to the fish farmers. Another 34 and 93 water bodies are being developed by I&FC department and Delhi Jal Board respectively. All these water bodies will also be utilized for fishery activities. The Government has also stressed upon fish culture which will help in harvesting the Delhi waters for increasing fish production. Besides, there is ample scope for high-tech fishery like Cage Culture, Re-circulatory Aquaculture System, (RAS) Pearl Culture, ornamental fish breeding/farming, Shrimp Culture, Aquarium making etc. These activities will enhance the farmers income significantly through high production of high value fishes and allied items in defined area of land. This will also help in employment generation for local educated youth, fisherman, SC/ST communities and entrepreneurs in Delhi. Accordingly, department has introduced projects worth 344 lakh on Cage Culture, Re-circulatory Aquaculture System, (RAS) and Shrimp farming in Delhi under ‘Blue Revaluation’ Scheme during the year 2017-18 for sustainable growth of the sector and open avenues for employment generation/ entrepreneurship development.
9.2 The Fisheries Unit regulates fishing under the Punjab fisheries Act 1914, and Indian fisheries Act 1897, and prevent destructive practices and unscrupulous fishing. The Fisheries unit performs the dual function of producing fish seed as well as fish for consumption purpose. During the year 2016-17 the fish seeds production in Delhi was 16.15 lakh (No’s) and fish production was 0.74 thousand tons. The year wise information regarding production of fish seed and fish is presented in Statement 10.9

ECONOMIC SURVEY OF DELHI, 2017-18148
Statement 10.9
FISH SEED AND FISH PRODUCTION IN DELHI 2002-03 TO 2016-17
S. No Years Fish Seed Production (lakh)
Fish Production
(Thousand Tons)1. 2002-03 23.3 2.302. 2003-04 20.0 2.103. 2004-05 17.2 1.404. 2005-06 13.50 0.805. 2006-07 12.00 0.706. 2007-08 12.40 0.707. 2008-09 13.30 0.708. 2009-10 13.90 0.729. 2010-11 12.95 0.82
10. 2011-12 13.00 0.7411. 2012-13 15.25 0.6912. 2013-14 18.25 0.6813. 2014-15 16.20 0.6814. 2015-16 16.20 0.7115. 2016-17 16.15 0.74
10. Rural Development
10.1 As per Population Census 2011, total area of Delhi was 1483 Sq. Km out of which rural area of Delhi was 369.35 Sq. Km (24.91%). 2.5% population of Delhi was residing in rural area. As an economy moves towards a progressive state, rural area automatically converted into urban area, consequently reduces the number of villages and the rural population. The number of villages in Delhi reduced from 304 in 1951 to 112 in 2011. The information regarding the villages, rural population during the last seven decades is presented in Statement 10.10.
Statement 10.10
RURAL POPULATION OF DELHI: 1951-2011
S. No YearsVillages
(Number)
PopulationRural Total % of Rural to total
1 1951 304 306938 1744072 17.602. 1961 276 299204 1658612 11.253. 1971 243 418675 4065698 10.304. 1981 214 452206 6220406 7.275. 1991 199 949019 9420644 10.076. 2001 165 944727 13850507 6.827. 2011 112 419042 16787941 2.50
Source:- Delhi Statistical Hand Book, 2017

ECONOMIC SURVEY OF DELHI, 2017-18 149
11 Delhi Village Development Board
11.1 A new advisory board namely ‘Delhi Village Development Board (DVDB)’ has been constituted in place of Delhi Rural Development Board (DRDB) vide Order dated 20.12.2017 as per cabinet decision no. 2520 dated 13.11.2017. The DVDB has been set up for integrated development of both rural and urban villages in Delhi. Earlier, Delhi Rural Development Board (DRDB) was reconstituted in the month of May, 2015.
11.2 Delhi Village Development Board shall advise the Government on issues connected with the infrastructure development works in all rural and urban villages of Delhi. Its function would be to consider requests for infrastructure development of the area of the residents in consultation with elected representatives (MPs/MLAs), recommend and prioritize the projects and ensure time bound implementation etc. and also to meet at regular intervals for evaluation of developmental projects recommended by the board. The functions of the Board would be as under:
(a) To study the deficiencies in the existing infrastructure in Delhi rural areas.
(b) To consider and recommend the prioritization of projects and schemes for implementation.
(c) To examine the nature and extent of overlapping functions, if any, so as to secure an improvement in the provision of services and quicker redressal of public grievances.
(d) To review, from time to time, the implementation of the projects and the schemes and recommend measures for effecting coordination amongst the organizations and Departments of the Government in the matter of implementation of such projects and schemes.
(e) To review the progress of the implementation of the schemes and to recommend to the government of Delhi the quantum of financial assistance required for the execution or implementation of any project or scheme in the area plan, or to be include, for the subsequent financial year.
(f) The following nature of works will be recommended by the DVDB in the rural and urban villages of NCT of Delhi in Lal Dora areas, sizra roads and public utilities on Govt. land, except in unauthorized colonies of any status and resettlement colonies and JJ bastis falling under the jurisdiction of DUSIB:
i) Construction of approach roads/ link roads/ village roads.
ii) Construction of drainage facility.
iii) Development of cremation grounds, parks, playgrounds, vyamshalas etc.
iv) Development of ponds/ water bodies.
v) Construction/repair/maintenance of chaupals, barat ghars, community centres.
vi) Other need based works like drinking water facility, street lights etc.
11.3 Village Development Committees (VDCs)To assist the DVDB in carrying out baseline survey of the villages to assess the facilities available , facilities required and identifying the priority areas in the villages where holistic development of the rural/ urban villages is required, the DVDB may constitute a Village

ECONOMIC SURVEY OF DELHI, 2017-18150
Development Committees (VDCs) for each rural and urban villages of Delhi.
11.4 During the Financial Year 2016-17, 85 sanctions amounting 67.30 crores were issued whereas, in FY 2017-18, 118 sanctions amounting Approx. 106.30 crores for various development projects in rural villages of Delhi, have been issued (upto December, 2017). An expenditure of 120.14 crores incurred during 2016-17 under the scheme Integrated Development of Rural villages. As during Budget 2017-18, it was announced to enhance the scope of DRDB to include both rural and urban villages of Delhi, budget outlay for the FY 2017-18 has been increased for integrated development of both rural and urban villages. An outlay of 600 crore was approved for the year 2017-16 for the execution of Rural & Urban village Development works (General & SCSP head).
11.5 In the rural area 78 Multi Purpose Community Centres (MPCCs) were constructed under Mini Master plan for Development of Rural Villages. All the MPCCs with complete management and maintenance thereof have been transferred to the concerned Dy. Commissioner (DMs) under the Revenue Department, Govt. of NCT of Delhi vide order No.F/PDRD/Estate/Mgmt of MPCC/2004/3121-3132 dated 16.08.2004 & subsequent F5(166)/Misc./AC/ 2005/Div.Comm./Nr/2496-2501 dated 16.06.2014.

ECONOMIC SURVEY OF DELHI, 2017-18 151
CHAPTER 11
ENERGYEnergy is the foundation upon which development and growth and human well-being in particular reposes. Delhi has already achieved 100% electrification. Modern energy access typically entails three forms of energy that is deemed essential for social and economic development : a) less polluting household energy for cooking and heating involving improved cook stoves with traditional solid biomass fuels, from liquid and gaseous fuels such as kerosene and Liquefied Petroleum Gas (LPG) and renewable energy sources such as solar b) electricity which is a secondary energy source for powering household electrical appliances and equipments and c) energy services at public facilities like schools, health clinics, government offices, industrial and commercial activities, mechanical power from electricity or other energy sources that improve the productivity of labour.
2 Delhi has its unique load pattern and peak load problem due to predominant share of domestic consumption and extreme weather conditions. Power sector of Delhi is different compared to other states, while other states have power deficit, Delhi has tied up surplus power in order to cater to the increasing demand and peak load. To ensure sustainable development, Delhi Government has initiated many programmes for capacity addition, augmentation of power infrastructure, promotion of renewable energy, energy efficiency and energy conservation for increasing the share of clean power.
3 Delhi has been the pioneer in unbundling and privatizing the power distribution with effect from 1st July 2002. The power establishment of Delhi after unbundling of Delhi Vidyut Board is shared by Generation Companies (Indraprastha Power Generation Company Limited (IPGCL) and Pragati Power Corporation Limited (PPCL), transmission by Delhi Transco Limited, and five DISCOMs (BYPL, BRPL, TPDDL, NDMC and MES).
4 Power Generation
4.1 Indraprastha Power Generation Company Limited (IPGCL) and Pragati Power Corporation Limited (PPCL) are managing following power plants in Delhi having a total installed generation capacity of 1983.2 MW. In addition to this, there is 1500 MW Coal Based Indira Gandhi Super Thermal Power Plant set-up in Jhajjar, Haryana by Aravali Power Company Private Limited, a joint Venture of IPGCL, HPGCL and NTPC Limited. The power generated is being shared equally by Delhi and Haryana. The Commercial Operation of this plant started on 26th April 2013. The Plant, under Stage-I, has 3 units of 500 MW capacity, and all the units have been fully commissioned. There is a future provision of augmenting the capacity by 1320 MW (2 x 660 MW) under Stage-II. Delhi Pollution Control Committee (DPCC) issued direction vide letter dated 22.3.2016 that Rajghat Power House (RPH) shall remain closed as it is not able to meet standard of particulates matter 50 mg/Nm3. A committee has been constituted for closer of Rajghat Power House on 22.2.2016 by GNCTD and committee has submitted its recommendation for closer of RPH in June 2016. Formal closing of Rajghat Power House is awaiting the approval of the Cabinet, GNCTD.

ECONOMIC SURVEY OF DELHI, 2017-18152
Statement 11.1
Installed Capacity of Power Generation in Delhi
(As on 30th November 2017)
S . No Companies/Station Fuel Units
1.Indraprastha Power Generation Company Limited (IPGCL)
a. Gas Turbine Power Station (GTPS) Gas
6 x 30 MW (GTs)+ = 282 MW*3 x 34 MW (STGs)
2.
Pragati Power Corporation Limited (PPCL)
b. Pragati-I Power Station Gas2 x 104 MW (GTs)+ = 330 MW1 x 122 MW (STGs)
c. Pragati-III Power Station, Bawana Gas
4 x 216 MW (GTs)+ = 1371.2 MW2 x 253.6 MW (STGs)
Total -- 1983.2 MW**
Source: Indraprastha Power Generation Company Limited and Pragati Power Corporation Limited.* Derated to 270 MW** Total Capacity 1971.2 MW (Derated & Barring RPH)
5 Plant Load Factor
5.1 In the electricity industry, plant load factor is a measure of the gross output of a power plant compared to the maximum output it could produce. The performance of the generation stations owned by Delhi Government in terms of Plant Load Factor and Availability Factor is as under:
Statement 11.2Plant Load Factor / Availability Factor of Power Plants in Delhi-2010-17
(Percentage)
S. No Year
Indraprastha Power Station
Rajghat Power House
GasTurbine Plants
Pragati-I Power Station
Pragati-III
Power Station
Average
1. 2010-11 Decommissioned on 31.12.2009
66.05 (75.98)
57.85 (81.91)
80.80(86.32)
68.23(81.40)
2. 2011-12 -- 69.01 (68.37)
52.21 (79.41)
88.32(92.61)
38.36 (68.65)
69.14(82.31)
3. 2012-13 -- 67.04 (66.94)
55.28 (84.22)
86.77(90.50)
30.24 (88.04)
54.15(85.71)
4. 2013-14 -- 32.12 (67.55)
44.01 (85.76)
83.90(92.62)
9.16 (95.69)
33.71(91.13)

ECONOMIC SURVEY OF DELHI, 2017-18 153
S. No Year
Indraprastha Power Station
Rajghat Power House
GasTurbine Plants
Pragati-I Power Station
Pragati-III
Power Station
Average
5. 2014-15 -- 35.82(56.50)
39.59(68.80)
63.91(85.62)
18.60(92.32)
29.49(91.52)
6. 2015-16 -- 3.93#
(56.16)#19.69
(74.81)53.11
(90.25)15.87
(64.55)21.77
(72.88)
7. 2016-17 -- 0.00(0.00)
29.41(82.84)
62.46(90.62)
17.04(80.70)
26.31(82.94)
Sources: Indraprastha Power Generation Company Limited and Pragati Power Corporation Limited.Figures in parenthesis relates to availability factor.# upto December 2015.
5.2 The average plant load factor of power plant of Delhi during 2015-16 to 2016-17 is consistently low due to less schedule by system control. The reason for low plant load factor attributed to non-availability of sufficient domestic gas for Bawana power plant.
6 Capacity Addition Programme
A new 750 MW Gas Based Combined Cycle Gas Turbine (CCGT) Pragati-II Power Project at Bamnauli is proposed to be set up by Pragati Power Corporation Limited (PPCL). The project has been kept on hold by the Government due to non availability of gas.
7 Power Distribution
7.1 The total power purchase in Delhi has grown by 46.64% during the last ten years. The power purchased in Delhi has increased from 32744 MU in 2010-11 to 34011 MU in 2016-17. While 16.93% of total power purchase is sourced from own generation by Delhi Govt. Power Plants, 83.07% is purchased from Central Govt. and other sources.
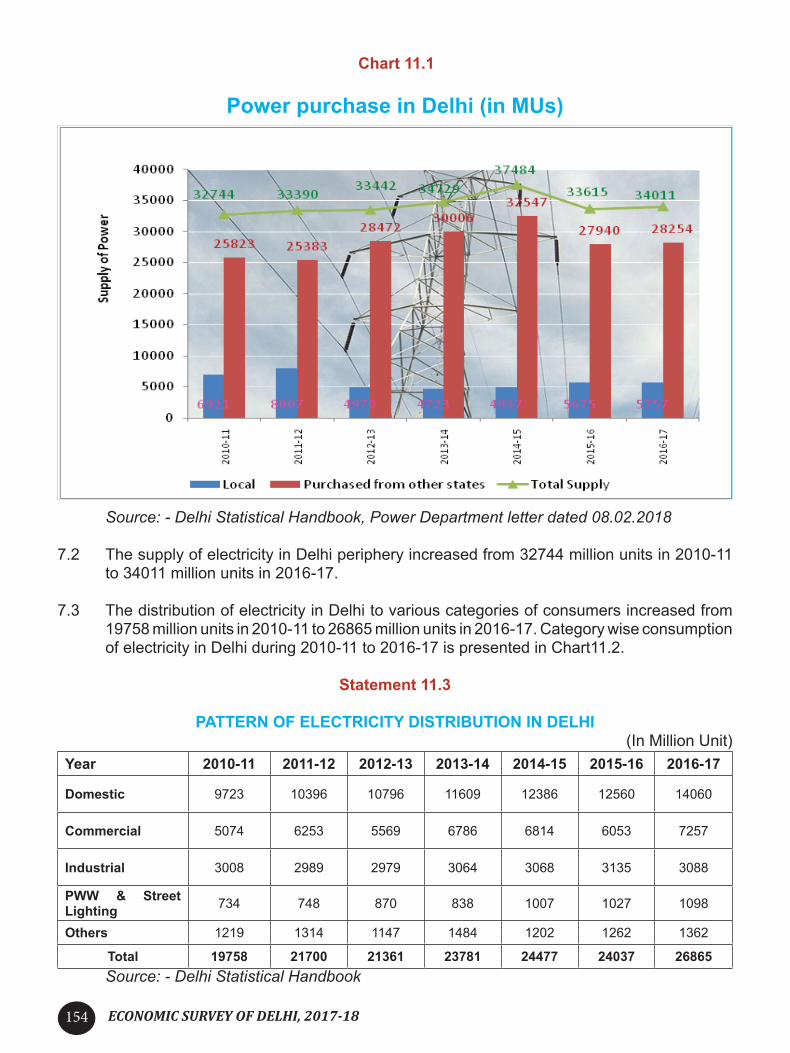
ECONOMIC SURVEY OF DELHI, 2017-18154
Chart 11.1
Power purchase in Delhi (in MUs)
Source: - Delhi Statistical Handbook, Power Department letter dated 08.02.2018
7.2 The supply of electricity in Delhi periphery increased from 32744 million units in 2010-11 to 34011 million units in 2016-17.
7.3 The distribution of electricity in Delhi to various categories of consumers increased from 19758 million units in 2010-11 to 26865 million units in 2016-17. Category wise consumption of electricity in Delhi during 2010-11 to 2016-17 is presented in Chart11.2.
Statement 11.3
PATTERN OF ELECTRICITY DISTRIBUTION IN DELHI (In Million Unit)
Year 2010-11 2011-12 2012-13 2013-14 2014-15 2015-16 2016-17
Domestic 9723 10396 10796 11609 12386 12560 14060
Commercial 5074 6253 5569 6786 6814 6053 7257
Industrial 3008 2989 2979 3064 3068 3135 3088
PWW & Street Lighting 734 748 870 838 1007 1027 1098
Others 1219 1314 1147 1484 1202 1262 1362
Total 19758 21700 21361 23781 24477 24037 26865Source: - Delhi Statistical Handbook

ECONOMIC SURVEY OF DELHI, 2017-18 155
Chart 11.2
7.4 During the period 2010-11 to 2016-17, the number of consumers of electricity in Delhi increased from 40.47 lakh to 55.68 lakh. The information regarding number of consumers of electricity in Delhi during 2010-17 is presented in Chart 11.3.
Chart 11.3
Source: - Delhi Statistical Handbook

ECONOMIC SURVEY OF DELHI, 2017-18156
7.5 The number of electricity consumers in Delhi has grown by 94.11% during the last ten years. The electricity consumers has increased 15.21 lakh consumers from 2010-11 to 2016-17. Number of consumers in domestic increased every year in the period covered under the study. While all other consumers mentioned in the chart showed an up and down situation in the period covered. The information regarding number of consumers of electricity in Delhi during 2016-17 is depicted in Chart11.4.
Chart 11.4
Number of Consumers of Electricity in Delhi: 2016-17
8 Aggregate Technical and Commercial Losses (AT&C)
8.1 Aggregate Technical and Commercial Losses (AT&C) is the difference between energy units put into the system and the units for which the payment is collected. Transmission and distribution loss do not capture losses on account of non-realization of payments. AT&C loss is the actual measure of overall efficiency of the distribution business as it measures both technical as well as commercial losses. The main reasons for technical losses may be due to overloading of existing lines and substation equipments, absence of up-gradation of old lines and equipments, low HT:LT Ratio, poor repair and maintenance of equipments, non- installation of capacitors for power correction, etc. On the contrary, commercial losses may be due to low metering/billing/collection efficiency, theft, tampering of metering system, low accountability of employees, absence of energy audit and accounting etc.
8.2 After reforms in power sector the AT & C losses in Delhi reduced significantly from 52% in the pre-reform era to 10.66% in 2016-17. The information regarding AT&C losses in Delhi during 2010-17 is presented in Statement 11.4.

ECONOMIC SURVEY OF DELHI, 2017-18 157
Statement 11.4
AT&C Losses in Delhi – post Power Sector Reforms period
(Percentage)S. No. Year BYPL BRPL TPDDL
1.2010-11
a. Target 22.00 17.00 17.00b. Achievement 21.95 18.82 14.15
2.2011-12
a. Target 18.00 15.00 15.33b. Achievement 22.07 18.11 11.49
3.2012-13
a. Target 16.82 14.16 12.50b. Achievement 22.14 17.74 10.73
4.2013-14
a. Target 15.66 13.33 12.00b. Achievement 22.19 16.93 10.35
5.2014-15
a. Target 14.50 12.50 11.50b. Achievement 18.93 13.65 NA
6.2015-16
a. Target 13.33 11.67 9.80b. Achievement 15.66 12.08 8.88
7.2016-17
a. Target -- -- 10.50b. Achievement 12.70 10.69 8.59
Sources:- DERC, Discoms and websites.
8.3 A new scheme namely “Integrated Power Development Scheme (IPDS)” has been launched (earlier known as Restructured Accelerated Power Development and Reforms Programme (R-APDRP)) by Government of India with an objective to reduce Aggregate Technical and Commercial (AT & C) losses, to establish IT-enabled energy accounting/auditing and to improve collective efficiency. It’s prime objective is for strengthening of the sub-transmission and distribution network in urban areas, metering of distribution /feeders/ transformers /consumers in urban areas and roof top solar panels. The project proposal under IPDS is under submission to Govt. of India for financing of distribution related works during 2017-18.
9 Capital Investment made by DISCOMs on infrastructure
9.1 As the demand for power increases, the demand for improved infrastructure for power also increases. For improving the power conditions in Delhi, all the three companies are augmenting infrastructure like power transformers, EHV cables, installation and 11 KV feeders, shunt capacitors, etc. The capital investment made by the three distribution companies since FY 2010-11 is presented in Statement 11.5.

ECONOMIC SURVEY OF DELHI, 2017-18158
Statement 11.5
Infrastructure Created by Power Companies in Delhi
( in crore)S. No. Year BYPL BRPL TPDDL Total
1. 2010-11 178.78 283.00 465.53 927.312. 2011-12 99.96 119.00 365.89 584.853. 2012-13 133.23 301.00 292.97 727.204. 2013-14 172.75 287.55 326.46 786.765. 2014-15 184.87 308.00 264.22 757.096. 2015-16 231.68 346.00 350.49 928.177. 2016-17 247.03 371.00 455.10 1073.13
Total 1248.30 2015.55 2520.66Sources: - DERC, Discoms.
10 Power Transmission
10.1 Delhi Transco Limited is the State Transmission Utility of the National Capital Territory of Delhi. It is responsible for transmission of power at 220KV and 400KV level, besides up gradation operation and maintenance of EHV Network as per system requirements. After the enactment of Electricity Act 2003, a new department: State Load Despatch Centre (SLDC) under Delhi Transco Limited was created, as an Apex body to ensure integrated operation of the power system in Delhi. Earlier the SLDC was part of O&M Department of Delhi Transco Ltd / Delhi Vidyut Board. SLDC Delhi started its function on the 1st of January 2004. SLDC is responsible for the real time Load Despatch function, SCADA System and Energy Accounting. It’s mission is to facilitate intra and inter state transfer of power in coordination with NRLDC (Northern Regional Load Despatch Centre) with Reliability, Security and Economy on sound commercial principles.
10.2 Delhi Transco Limited has established power transmission network consisting of four number of 400 KV and thirty five 220 KV substations and associated with transmission lines. The existing network consists of 400 KV ring around the periphery of Delhi interlinked with the 220 KV network spread all over Delhi. The network of Delhi Transmission Utility upto the year 2016-17 is presented in Statement 11.6.

ECONOMIC SURVEY OF DELHI, 2017-18 159
Statement 11.6
Network of Delhi Transmission Utility: 2016-17
S. No. Details 400 KV Level 220 KV Level1. Number of Sub Stations 4 35
2. Transformation Capacity (in MVA) 5410 11720
3. Transmission Lines (Length in Ckt. Km.) 249.192 823.815Source:- Delhi Transco Limited / SLDC.
10.3 The performance of the transmission utility during the last ten years, system has improved mainly in system availability, reduction in transmission losses, significant reduction of load shedding etc. The performance of Delhi Transco Limited is presented in Statement 11.7.
Statement 11.7
Performance of Delhi Transco Limited 2010-17
S. No Details 2010-11
2011-12
2012-13
2013-14
2014-15
2015-16
2016-17
1. Peak Demand met(in MW) 4720 5028 5642 5653 5925 5846 6261
2. Load Growth(in %) 7.10 6.50 12.21 0.19 4.81 -1.33 7.10
3.Energy Consumption(in MUs)
25581 25593 27235 28021 29035 29416 30797
4. Shedding(in MUs) 74 83 138 77 117 42 32
5.Shedding as % of Energy Consumption
0.29 0.32 0.51 0.27 0.40 0.14 0.10
6.Transmission Losses(in %)
1.28 1.20 1.17 0.95 0.69 0.85 0.98
7. System Availability(in %) 98.58 98.38 97.17 97.43 98.60 99.03 98.01
Source:- Delhi Transco Limited / SLDC.
10.4 It may be observed from Statement 11.7 that the peak demand increased from 4720 MW in 2010-11 to 6261 in 2016-17. Energy consumption recorded an average annual growth of approx. 3.51%, System availability is always 98% or more during last ten years. The information regarding peak demand met in MW and energy consumption in MUs are depicted in Charts 11.5 and 11.6 respectively.

ECONOMIC SURVEY OF DELHI, 2017-18160
Chart 11.5
Peak Demand Met (MW) in Delhi
Chart 11.6
Energy Consumption in Delhi- 2010-17 (in MUs)
10.5 Volume III of 19th Electric Power Survey (EPS) of India Report covers the demand forecast of National Capital Region (NCR). Central Electricity Authority, Ministry of Energy, Government of India, in the report of 19th Electric Power Survey has projected maximum demand of electricity in Delhi to be 6541 MW by the end of March-2018. The forecast of energy requirement made in the report indicates that the total demand may go-up to 7471 MW by 2021-22.
Energy Requirement and Peak Load Forecast for NCR- 19th EPS
2017-18 2021-22Energy Requirement (MU) 31937 37778Peak Load (MW) 6541 7471

ECONOMIC SURVEY OF DELHI, 2017-18 161
11 Major Transmission Projects
To facilitate constant access to real-time data of the entire network, Supervisory Control and Data Acquisition (SCADA) system has been implemented. In order to meet the future requirement of power in Delhi, various new and augmentation transmission network projects (400/220 KV) costing approx. 4600 crore for adding 7680 MVA transformation capacity at 220 KV level and 6815 MVA (including 4000 MVA of ISTS sub stations) at 400 KV level in the network are envisaged in Business Plan for the period upto 2022 for improving the reliability of power supply in Delhi.
12 Renewable Energy
12.1 For mass scale adoption of solar energy as green power in Delhi, a Policy named as “Delhi Solar Policy-2016” has been notified on 27.09.2016. Delhi Govt. formed Energy Efficiency and Renewal Energy Management Centre (EE&REMC) to work as ‘State Designated Agency (SDA)’ to coordinate, regulate and enforce Energy Conservation Act, 2001 in Delhi in association with Bureau of Energy Efficiency (BEE). The Centre, as ‘State Nodal Agency (SNA)’, has to implement new and renewable energy projects in the city of Delhi in association with Ministry of New & Renewable Energy (MNRE), Govt. of India.
12.2 It is proposed to develop New Delhi Municipal Council (NDMC) area as Solar City by installing SPV panels on rooftop of Govt. buildings, Metro Stations, Bus Stops, etc. Govt. of India approved for installation of Grid Connected Rooftop Projects in NCT of Delhi. Presently, the number of net metered consumers in Delhi is 1143. Execution 74 MW of solar capacity in Delhi is in progress in various Govt. Departments, domestic and social sector. Solar installations are being promoted in housing societies.
12.3 Disposal of Municipal Solid Waste is very challenging issue. In order to overcome this problem ‘Waste-to-Energy’ Plants are being set-up at various locations in Delhi to generate electricity. In this line, setting up of two more ‘Waste-to-Energy’ plants at Bhalswa (20 MW) and Tehkhand (25 MW) are proposed.
Installed Capacity of Renewable Energy
Solar Generation 77.34 MW Till 31.01.2018
Waste to Energy 52 MW
Till 31.01.2018WTE Plants atTimarpur-Okhla (16 MW)Ghazipur (12 MW)Narela-Bawana (24 MW)
TOTAL 129.34 MW
13 Government Investment in Energy Sector
Investment in energy sector by the Govt. of Delhi is only for augmentation of transmission and transformation capacity and power generation. Investment by the government in this sector during the last five year showed an up and downward trend. During the year 2010-11, energy sector in Delhi has a total budget share of 250.83 crore, which increased to
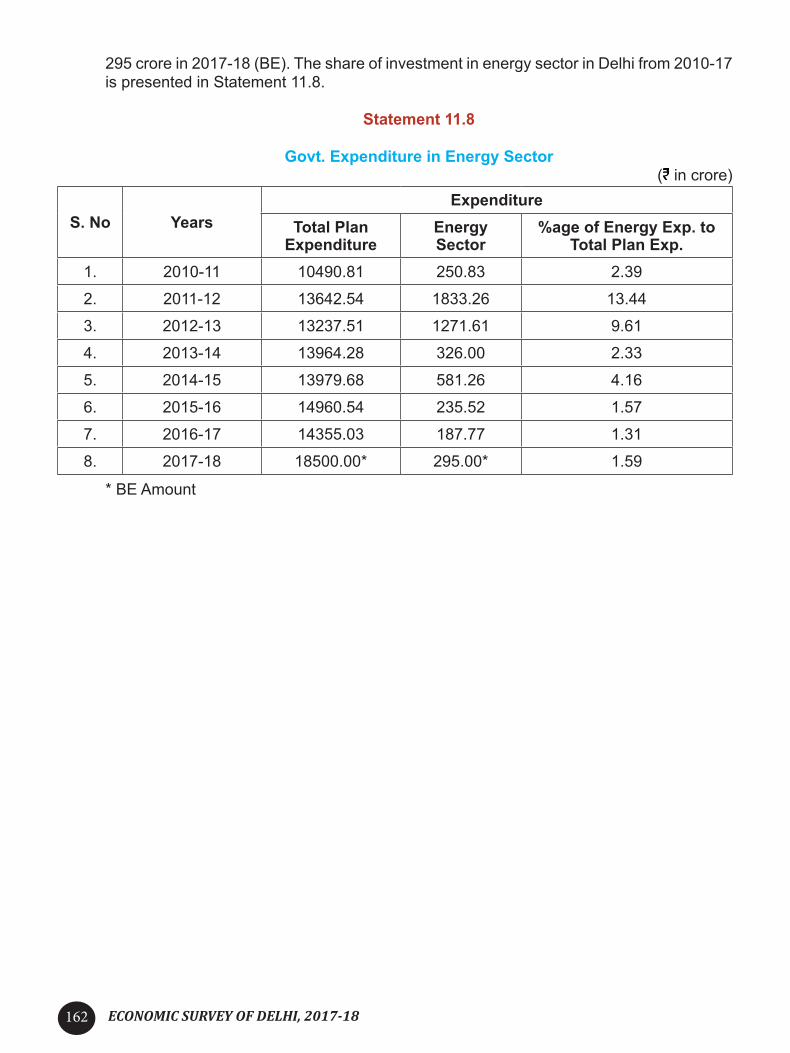
ECONOMIC SURVEY OF DELHI, 2017-18162
295 crore in 2017-18 (BE). The share of investment in energy sector in Delhi from 2010-17 is presented in Statement 11.8.
Statement 11.8
Govt. Expenditure in Energy Sector( in crore)
S. No YearsExpenditure
Total Plan Expenditure
Energy Sector
%age of Energy Exp. to Total Plan Exp.
1. 2010-11 10490.81 250.83 2.39
2. 2011-12 13642.54 1833.26 13.44
3. 2012-13 13237.51 1271.61 9.61
4. 2013-14 13964.28 326.00 2.33
5. 2014-15 13979.68 581.26 4.16
6. 2015-16 14960.54 235.52 1.57
7. 2016-17 14355.03 187.77 1.31
8. 2017-18 18500.00* 295.00* 1.59
* BE Amount

ECONOMIC SURVEY OF DELHI, 2017-18 163
CHAPTER 12
TRANSPORT
The transport sector plays a crucial role in the development process of a country. It has a direct impact on living standards both in terms of economic as well as social well-being. Demand for transportation related services is generally a derived demand for other economic and social activities such as activities related to health, education, employment, etc. Transport infrastructure needs are assessed based on the demand scenario of such activities. During recent times, mobility needs of the people have been insatiably increasing due to increasing economic activities. Transport systems have become environmentally unsustainable and are now one of the major contributors of greenhouse gas emissions worldwide. Thus, a sustainable and equitable transport system is one that provides mobility related facilities and services while minimizing emissions both at local and global level and also serve as safe, reliable and economical means of mobility for all the sections of society including elderly, women and disabled persons.
1.1 Public transport in Delhi has two major components viz. bus transport and metro rail. These two major transport systems are playing a vital role in facilitating public transport in Delhi. In fact, both the systems are the lifeline of the people of Delhi. Bus and Metro Rail transport systems needs to be integrated at both physical and operational levels. Physical integration implies combining the infrastructure of the two facilities. At present ISBT Kashmiri Gate and Anand Vihar have been connected with the metro rail through suitable pathways. At the operational level, the commuters of both metro rail and public buses were compelled to use separate tickets, passes to travel in the city. Hence, common Mobility Cards have been launched in Delhi on 08.01.2018 on pilot basis in 200 DTC and 50 Cluster buses wherein Delhi Metro Rail Card will be used for tendering fare in buses using ETMs.
1.2 Delhi is a hub for personal motorized vehicles in India. Total motorized vehicles in Delhi are 103.83 lakh. Car and jeeps accounted for more than 30 per cent of the total registered mortised vehicles, whereas two wheelers are about 64% of total registered vehicles.
1.3 At present, the average ridership of Delhi metro is 28 lakh per day which is further expected to increase up to 40 lakh per day after completion of DMRC phase-III. On average, daily ridership on DTC is 32 lakh passengers. Electric rickshaw has also been introduced in Delhi to provide services for last mile connectivity. A subsidy of 30,000/- per E-ricksha is beinig provided by the Government to encourage such facilities.
2. Motor Vehicles
2.1 The total number of motor vehicles on road in NCT of Delhi as on 31st March, 2017 was 103.83 lakh, showing the growth per cent of 6.99. The category wise number of motor vehicles in Delhi is presented in Statement 12.1.
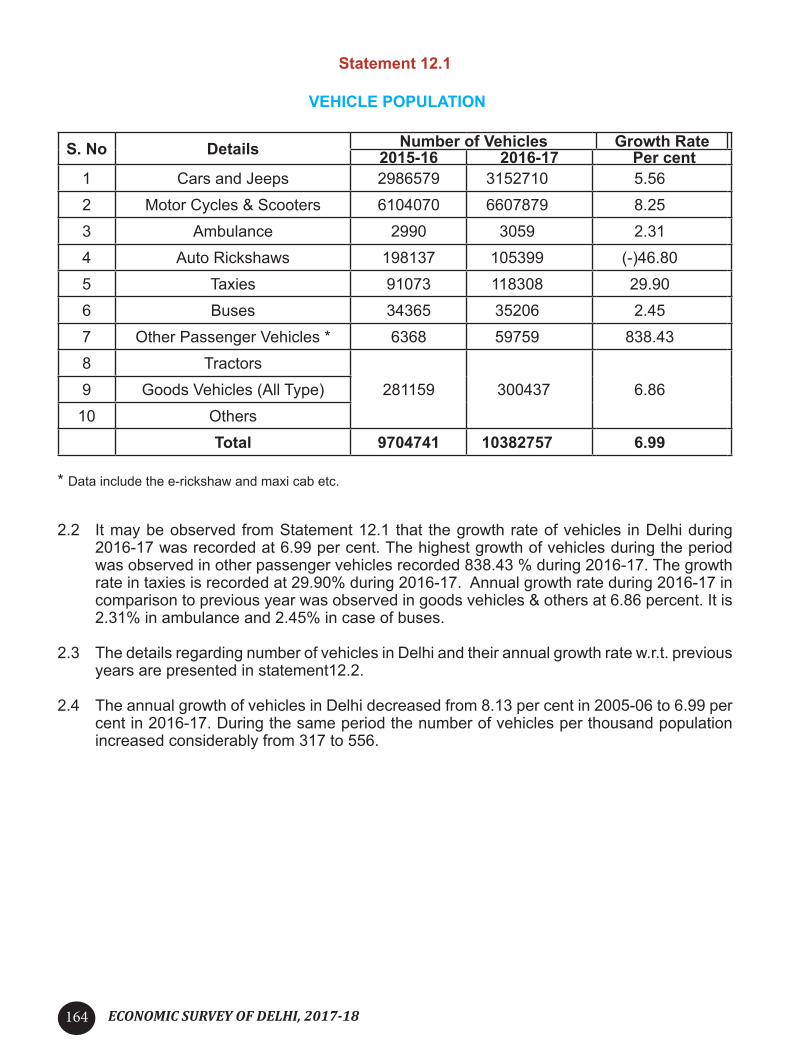
ECONOMIC SURVEY OF DELHI, 2017-18164
Statement 12.1
VEHICLE POPULATION
S. No Details Number of Vehicles Growth Rate2015-16 2016-17 Per cent
1 Cars and Jeeps 2986579 3152710 5.562 Motor Cycles & Scooters 6104070 6607879 8.253 Ambulance 2990 3059 2.314 Auto Rickshaws 198137 105399 (-)46.805 Taxies 91073 118308 29.906 Buses 34365 35206 2.457 Other Passenger Vehicles * 6368 59759 838.438 Tractors
281159 300437 6.869 Goods Vehicles (All Type)10 Others Total 9704741 10382757 6.99
* Data include the e-rickshaw and maxi cab etc.
2.2 It may be observed from Statement 12.1 that the growth rate of vehicles in Delhi during 2016-17 was recorded at 6.99 per cent. The highest growth of vehicles during the period was observed in other passenger vehicles recorded 838.43 % during 2016-17. The growth rate in taxies is recorded at 29.90% during 2016-17. Annual growth rate during 2016-17 in comparison to previous year was observed in goods vehicles & others at 6.86 percent. It is 2.31% in ambulance and 2.45% in case of buses.
2.3 The details regarding number of vehicles in Delhi and their annual growth rate w.r.t. previous years are presented in statement12.2.
2.4 The annual growth of vehicles in Delhi decreased from 8.13 per cent in 2005-06 to 6.99 per cent in 2016-17. During the same period the number of vehicles per thousand population increased considerably from 317 to 556.

ECONOMIC SURVEY OF DELHI, 2017-18 165
Statement 12.2GROWTH AND VEHICLES PER 1000 POPULATION
S. No Years
Vehicles Annual Growth(Per cent)
No. of Vehicles Per 1000
PopulationNumber Increase1 2005-06 4830136 362982 8.13 317
2 2006-07 5232426 402290 8.33 3373 2007-08 5627384 394958 7.55 356
4 2008-09 6026561 399177 7.09 374
5 2009-10 6466713 440152 7.30 393
6 2010-11 6947536 480823 7.44 4157 2011-12 7452985 505449 7.27 4368 2012-13 7785608 332783 4.46 446
9 2013-14 8258284 472676 6.07 46510 2014-15 8827431 569147 6.89 49111 2015-16 9704741 877310 9.94 53012 2016-17 10382757 678016 6.99 556
2.5 Delhi is a hub for personal motorized vehicles in India. Total motorized vehicles in Delhi are 103.83 lakh. Car and jeeps accounted for more than 30 per cent of the total registered mortised vehicles, whereas two wheelers are about 64% of total registered vehicles. Percentage of vehicles in Delhi during 2016-17 is depicted in Chart 12.1.
Statement 12.3
S. No Details Number of Vehicles2016-17 Per cent
1 Cars and Jeeps 3152710 30.36 %2 Motor Cycles & Scooters 6607879 63.64%3 Ambulance 3059 0.03%4 Auto Rickshaws 105399 1.02%5 Taxies 118308 1.14%6 Buses 35206 0.33%7 Other Passenger Vehicles 59759 0.58%8 Tractors
300437 2.90%9 Goods Vehicles (All Type)10 Others Total 10382757 100.00%

ECONOMIC SURVEY OF DELHI, 2017-18166
Chart 12.1
PERCENT OF VEHICLES POPULATION 2016-17
2.6 There is a contradiction regarding the actual number of vehicles plying on Delhi’s road as the large number of vehicles registered in Delhi are plying in NCR areas and vis- a-vis the vehicles registered in NCR are plying in Delhi. Transport department is making efforts to estimate the actual number of vehicles in Delhi by taking into account vehicles that have outlived their life due to any account, transferred to and from other states etc.
2.7 The information regarding the mode of transportation facilities in Delhi during the last two decade as per the Census of India is presented in the statement 12.4.
Statement 12.4
DISTRIBUTION OF HOUSEHOLDS ON THE BASIS OF THE MODE OF TRANSPORTATION IN DELHI: 2001 & 2011
(Per cent)
S. No
Mode of Transportation
Facilities
2001 2011
Rural Urban Total Rural Urban Total
I No. of Households 169528 2384621 2554149 79115 3261423 3340538
1 Bicycle 48.70 36.80 37.60 44.20 30.30 30.60
2 Scooter/ Motor Cycles 20.70 28.50 28.00 38.50 38.90 38.90
3 Car/ Jeep/ Van 7.30 13.40 13.00 10.80 21.00 20.70
4 None of the Specified Mode of Transportation 38.90 43.40 43.10 34.70 37.20 37.10
Source: - Census of India, 2011, Houses, Household Amenities and Assets.
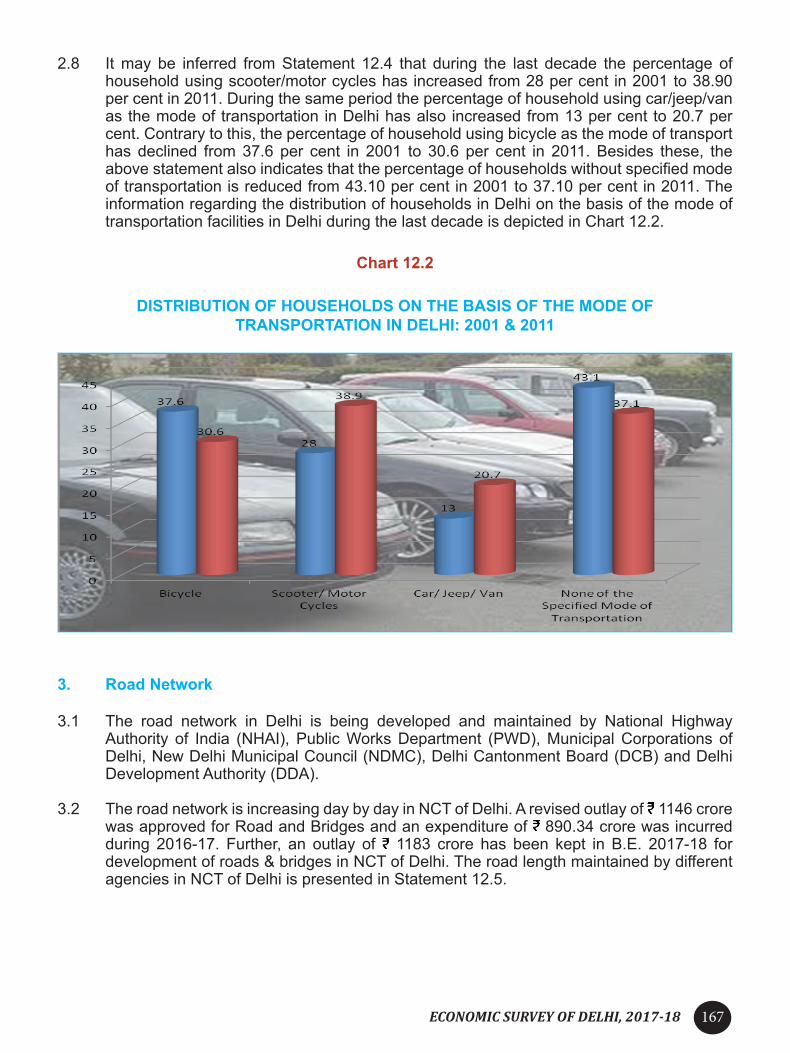
ECONOMIC SURVEY OF DELHI, 2017-18 167
2.8 It may be inferred from Statement 12.4 that during the last decade the percentage of household using scooter/motor cycles has increased from 28 per cent in 2001 to 38.90 per cent in 2011. During the same period the percentage of household using car/jeep/van as the mode of transportation in Delhi has also increased from 13 per cent to 20.7 per cent. Contrary to this, the percentage of household using bicycle as the mode of transport has declined from 37.6 per cent in 2001 to 30.6 per cent in 2011. Besides these, the above statement also indicates that the percentage of households without specified mode of transportation is reduced from 43.10 per cent in 2001 to 37.10 per cent in 2011. The information regarding the distribution of households in Delhi on the basis of the mode of transportation facilities in Delhi during the last decade is depicted in Chart 12.2.
Chart 12.2
DISTRIBUTION OF HOUSEHOLDS ON THE BASIS OF THE MODE OF TRANSPORTATION IN DELHI: 2001 & 2011
3. Road Network
3.1 The road network in Delhi is being developed and maintained by National Highway Authority of India (NHAI), Public Works Department (PWD), Municipal Corporations of Delhi, New Delhi Municipal Council (NDMC), Delhi Cantonment Board (DCB) and Delhi Development Authority (DDA).
3.2 The road network is increasing day by day in NCT of Delhi. A revised outlay of 1146 crore was approved for Road and Bridges and an expenditure of 890.34 crore was incurred during 2016-17. Further, an outlay of 1183 crore has been kept in B.E. 2017-18 for development of roads & bridges in NCT of Delhi. The road length maintained by different agencies in NCT of Delhi is presented in Statement 12.5.

ECONOMIC SURVEY OF DELHI, 2017-18168
Statement 12.5
GROWTH OF ROAD NETWORK IN DELHI-AGENCY-WISE(In Lane KM)
(As on 31st March)S. No Agency 2016-17
1. East DMC 162.24*2. South DMC 9592*3. North DMC 3272.65*4. New Delhi Municipal Council 12905. Public Works Deptt. (Delhi Govt.) a. National Highway 430b. Other Roads 6308**6. DSIIDC 14347 I&FC 408 DDA 435
Source: - Delhi Statistical Handbook 2017. * In KM
** Flyovers of length of 62 Kms is included
4. Inter State Bus Terminals (ISBTs)
Master Plan of Delhi- 2021 suggested five ISBTs for Delhi. With the setting up of two new ISBTs at Sarai Kale Khan and Anand Vihar, three ISBTs are functioning at present. Two more ISBTs are proposed to be constructed at Dwarka and Narela. ISBT, Kashmere Gate has been renovated and made operational with state of the art facilities in May’ 2013. Regarding ISBT at Dwarka, architect has been appointed. Renovation of ISBTs at Anand Vihar and Sarai Kale Khan will be done by PWD.
4.1 Development of ISBTs
· Sarai Kale Khan ISBT - The work is proposed to be undertaken in two phases. LOP and conceptual drawings based on TOD concept have been developed for Phase I and approval from local bodies is being perused. · Anand Vihar ISBT - Transport Department has been requested to close the existing consultancy contracts and hand over the work to PWD, so that PWD can take up comprehensive planning based on TOD concept. · Dwarka ISBT - Transport Department has been requested to close the existing consultancy contracts and hand over the work to PWD, so that PWD can take up comprehensive planning based on TOD concept.
5. Development of Bus Terminals and Depots
The objective of the project is to create bus transport infrastructure for the benefit of the bus commuters. The scheme envisages purchase of land for bus terminals & bus depots and construction of terminals & depots over there. With the new acquisition of bus fleet in DTC and under cluster scheme, Transport Department will require additional bus depots. Due to scarcity of land, the statutory authorities are pressing hard to have multi-level bus depots in place of the conventional bus depots. Three Bus Depots at Dichaun Kalan,

ECONOMIC SURVEY OF DELHI, 2017-18 169
Bawana Sector 1 and Rewla Khanpur have been constructed. Further, five more bus terminals/depots are under progress and will be completed in current financial year, name of which are Rani khera 1,2,3, Dwarka Sector 12, and Kharkhri Nahar and 3 projects are under consideration namely East Vinod Nagar, Bawana sector 5 and Narela.
6. Rail Network
Delhi is a major junction on the rail map of India linked with the entire major metropolitan cities directly. There are five main railway stations viz. at New Delhi, Old Delhi, Hazrat Nizamuddin, Sarai Rohila and Anand Vihar, besides Container Depots at Patparganj and Tuglakabad.
7. Mass Rapid Transit System (MRTS)
7.1 The Mass Rapid Transit System (MRTS) is an ambitious project that aims at providing a non-polluting and efficient rail-based transport system which is properly integrated with the road transport system. The Delhi Metro is being built in phases. Phase-I completed with 57 stations and 65.1 km of route length of which 13.17 km is underground and 51.93 km surface or elevated. The inauguration of the Dwarka-Barakhamba Road corridor of the Blue Line marked the completion of Phase-I in October 2006. Phase-II of the network comprises 124.93 km of route length with 84 stations (including 16.62 Km of route length with 13 stations of NCR) and is fully completed with the first section opened in June 2008 and the last line opened in August 2011. Phase-III and additional corridors of 160.586 Km route length with 109 stations (including 42.192 Km of route length with 30 stations of NCR) are planned to be completed by Dec. 2018 (except Extension to Dhansa, targeted to be completed in 2020). Phase IV is under consideration of the Government. Average ridership of Delhi Metro is 28 lakh per day during 2016-17 which is expected to be increased to 40 lakh with the completion of Phase-III. In Delhi, the Metro Trains run from 6.00 AM in the morning till about 11.00 PM in the night. The train frequency varies from 2 minutes 18 seconds in peak time upto 10 minutes in non-peak hours.
7.2 MRTS Phase III: The approved corridors of MRTS Phase III of new metro lines and extensions of its corridors are presented in statement 12.6 and year wise fund released by GNCTD in statement 12.7
Statement 12.6
MRTS Phase III - approved by Cabinet
S.No Corridors
Length(KM) No. of stationsExpected time to be completedUnder
ground Elevated Total UnderGround Elevated Total
A In NCT of Delhi
1.Line-7: Mukundpur -Shiv Vihar
19.117 39.479 58.596 12 26 38
Mar 2018 to June 2018 in stages except Mayur Vihar Pkt I to Trilokpuri due to Trilokpuri land issue
2. Line-8: Janakpuri West-Kalindikunj 23.807 10.466 34.273 15 8 23
Kalkaji Mandir –Kalindi Kunj is commissioned on 25.12.2017 and remaining portion is expected to be completed by March 2018
3.Line 6 Ext: Central Sectt.-Kashmere Gate
9.370 - 9.370 7 - 7 Commissioned in May, 17

ECONOMIC SURVEY OF DELHI, 2017-18170
S.No Corridors
Length(KM) No. of stations Expected time to be completedUnder
ground Elevated Total UnderGround Elevated Total
4. Line 2 Ext.: Jahangirpuri-Badli - 4.373 4.373 - 3 3 Commissioned on
10.11.2015
5.Line 5 Extn.: Mundka- Tikri Border
- 6.307 6.307 - 4 4 May 2018
6. Dwarka-Najafgarh 1.541 2.754 4.295 1 2 3 Dec 2018
7. Extension to Dhansa Bus Stant 1.180 - 1.180 1 - 1 2020
Sub Total 55.015 63.379 118.394 36 43 79B IN NCR
8.Line 6 Extn: Badarpur-Faridabad
- 13.875 13.875 - 9 9 Commissioned on 06.09.2015
9.Line 5 Extn.: Tikri Border to Bahadurgarh
- 4.875 4.875 - 3 3 May 2018
10 Escorts Mujesar - Ballabhgarh - 3.205 3.205 - 2 2 June 2018
11. Kalindi Kunj – Botanical Garden - 3.962 3.962 - 2 2 Commissioned on Dec,
17
12Dilshad Garden to New Bus Adda Ghaziabad *
- 9.600 9.600 - 8 8 June 2018 subject to land and fund
13Noida City Centre to Noida Sector 62*
- 6.675 6.675 - 6 6 Sept 2018
Sub Total 42.192 42.192 - 30 30
Total 55.015 105.571 160.586 36 73 109
*yet to be sanctioned by GoI
Statement 12.7YEAR-WISE RELEASED FUND FOR MRTS –III PHASE BY GNCTD
( in Crore)
S. No. Year Equity
Subordinate Debt
for land acquisition
Reimbursement of sales tax on works
contract Act to DMRC as S.D.
Loan to MRTS for
reimbursement of Central Taxes
Total
1 2012-13 749.70 294.00 - - 1043.70
2. 2013-14 672.20 170.00 448.64 - 1290.84
3. 2014-15 600.00 0.00 159.25 - 759.25
4 2015-16 827.00 40.00 590.81 - 1457.815 2016-17 323.27 39.50 300.00 671.00 1333.77
Total 3172.17 543.50 1498.70 671.00 5885.37

ECONOMIC SURVEY OF DELHI, 2017-18 171
7.3 The estimated cost of Phase III is 39784.56 crore. GNCTD has released 1333.77 crore ( 323.27 crore equity, 39.50 crore against subordinate debt for land acquisition, 300.00 crore has been released as subordinate debt towards sales tax and 671.00 crore as subordinate debt for central taxes) to DMRC during 2016-17 towards MRTS Phase III.
7.4 The details regarding year-wise Average Daily Ridership is presented in Statement 12.8
Statement 12.8
AVERAGE DAILY RIDERSHIP AND ROLLING STOCKS
Year Ridership Operational Route (Km) Excluding Airport Express
line
Rolling Stock(No. of Cars)
2007-08 625,000 65.10 2802008-09 722,000 74.55 2802009-10 919,000 95.79 3762010-11 1259,000 161.45 8442011-12 1660,000 167.33 10222012-13 1926,000 167.33 10942013-14 2190,000 167.33 12822014-15 2386,000 170.56 13062015-16 2600,000 189.747 13922016-17 2761,342 194.844 1426
7.5 DMRC Feeder Bus Service
Feeder Bus Services is a special provision made by DMRC to facilitate the commuters to reach or depart from number of metro stations situated in Delhi. At present, 517 mini buses on 93 metro feeder routes are to be inducted out of which 291 buses are operating on 43 routes to help the commuters in having smooth movement / approach to the nearest metro station. All buses are fitted with GPS.
8. Flyovers and Bridges:
A number of transport infrastructure projects at ring road and Outer Ring road were made to encourage uses of public transport in Delhi. Flyovers at Madhuban Chowk to Mukerba Chowk, Vikas Puri to Meera Bagh, Mangolpuri to Madhuban Chowk, Wazirabad to Mukerba Chowk has been opened for public. At present there are 83 numbers of flyovers and RUB/ROB has been completed at various places in Delhi.
8.1 Major Projects under progress:-
1. C/o Signature Bridge at Wazirabad, Delhi:- Due to tremendous increase in population of Trans-Yamuna Area, there is pressing demand for additional East-West corridors over River Yamuna. Therefore, a new bridge was proposed on the down-stream of existing bridge-cum-barrage at Wazirabad. The objective of this project was to have a signal free approach from NH-1 (Road No. 45) on western bank and Wazirabad Road (Road No. 59

ECONOMIC SURVEY OF DELHI, 2017-18172
Khajuri Khas intersection) on the Eastern bank for entry & exit of traffic in two directions. Planning of the project was started on 27.4.2004 which was approved by DDA’s Technical Committee on 14.06.06 and by DUAC on 20.10.06. Modified recast estimated cost of the project for 1131 crore was approved by Govt. of NCT of Delhi on 26.02.2010. Order to start the main bridge has been issued accordingly. Work on approach roads on both the eastern & western ends were taken up earlier against the previous sanction and are presently at 99% progress. The overall progress is 95 % and project is likely to be completed by March 2018.
2. Elevated Road over Barapullah Nallah Phase-II:- The project aimed to provide an efficient connectivity for general public by passing through busy Lala Lajpat Rai Path & Mathura road and connecting ring road. It was exclusive corridor for the sports personnel between the Games village and Jawahar Lal Nehru Stadium during CWG-2010. The work involves construction of an elevated road corridor of about 3.8 km starting from Sarai Kale Khan to Jawahar Lal Nehru Stadium in phase– I has been completed. Execution of work in Phase-II i.e. Jawahar Lal Nehru Stadium to Aurobindo Marg is in progress and around 99% works has been completed. The project aimed to provide an efficient connectivity for general public by passing through busy Lala Lajpat Rai Path & Mathura road and connecting ring road. It will be completed by the March 2018.
3. Barapullah Phase-III :- Barapullah, Phase-III stretch from Sarai Kale Khan to Mayur Vihar Phase-I has been sanctioned for 1260.63 crore and the work is in progress at about 55% work has been done in this project. The provision for Barapullah Nallah Ph-III of ₹ 150.00 crore has been kept under this project for the year 2017-18 and it is not the part of the JNNURM. Barapullah, Phase-III stretch from Sarai Kale Khan to Mayur Vihar Phase-I will be completed by Dec 2018.
4. Corridor improvement of outer Ring Road from IIT to NH-8:- The project of Construction of (Part-A) Flyover on portal structure linking existing Munirka Flyover in the east to the point beyond Army RR Hospital in the west on the Outer Ring Road and (Part-B) Underpass at junction of BJ Marg and Inner Ring road has been approved at the cost of 313.67 crore. The present progress of the work 35%. The provision of ₹ 150.00 crore has been kept under this project for the year 2017-18. The work has been started in the year 2015-16 and it will be completed by December, 2018.
9. Pedestrian Facilities - Foot Over Bridges (FOBs)
Traffic regulation and road construction in Delhi have to take care of cyclists and pedestrians including bus commuters. On main arterial roads, there are very few pedestrian crossing and a few over bridges or subways. Approximately 78 numbers of footover Bridges have also been completed at various places in Delhi by end of 2016. The work of 5 FOBs are in progress and likely to be completed by 31.03.2018.
10. Delhi Transport Infrastructure Development Corporation
Government of Delhi has established Delhi Transport Infrastructure Development Corporation. The Corporation has been created with the objectives of development, implementation, operation and maintenance of urban transport infrastructure and funding of the expenses associated with transport planning, project development expenses for specific projects, capital expenditure support for specific projects and operations and maintenance expenditure for providing sustainable public services, external infrastructure for all ISBTs.

ECONOMIC SURVEY OF DELHI, 2017-18 173
11. Delhi Transport Corporation (DTC)
11.1 DTC is the largest public transport entity in the NCR. DTC operates 4027 buses on 474 city routes and 9 NCR routes. DTC has also been operating International Bus Service on Delhi – Lahore & Delhi – Kathmandu. Daily average passenger is about 32 lakh during 2016-17. Automated fare collection system implemented through electronic ticketing machines. The performance of DTC during 2001-02 to 2016-17 is presented in Statement 12.9 and an activity of DTC is presented in Statement 12.10.
Statement 12.9
PERFORMANCE OF DELHI TRANSPORT CORPORATION
S. No. Years
Fleet
(No)
Fleet Utilization
(%)
Vehicle Utilization
(Km/Bus/Day)
Load Factor
(%)
Passenger Carried per bus daily
Daily Average
Passengers (in Lakh)
1. 2001-02 3286 71.68 211 82.66 854 23.40
2. 2005-06 3469 90.51 226 74.42 973 30.52
3. 2006-07 3444 81.47 199 77.18 951 26.77
4. 2007-08 3537 82.47 177 87.82 848 24.04
5. 2008-09 3804 77.03 171 68.83 772 22.62
6. 2009-10 4725 80.99 184 69.84 776 24.16
7. 2010-11 6204 75.03 185 71.43 700 30.32
8. 2011-12 5892 84.27 199 77.75 863 44.2
9. 2012-13 5445 85.77 202 92.90 973 46.77
10. 2013-14 5223 85.51 190 86.63 952 43.47
11. 2014-15 4712 83.99 188 85.02 930 38.87
12. 2015-16 4352 83.63 191 82.00 927 35.37
13. 2016-17 4027 85. 12 199 81. 36 890 31. 55
Source: - Operational Statistics of DTC

ECONOMIC SURVEY OF DELHI, 2017-18174
Statement 12.10
ACTIVITIES OF DELHI TRANSPORT CORPORATION: 2015-16 & 2016-17
S. No Details
2015-16 2016-17Non-AC AC Std. Total Non-
AC AC Std. Total
1 Total Buses in the Fleet (At the end) 2506 1276 570 4352 2506 1275 246 4027
2 Buses on Road (Daily Average) 2206 1056 555 3817 2238 1065 244 3547
3 Passengers (in Crore) 89.82 24.76 14.87 129.44 87.96 20.63 6 .57 115.16
4 Daily Average Passengers (in Lakh) 24.54 6.77 4.06 35.37 24.10 5.65 1 .80 31. 55
5 K. metres operated(in Crore) 16.07 7.42 3.25 26.73 16 .60 7 .64 1 .54 25. 78
6K. meters operated Daily
Average (in lakh)
4.39 2.03 0.89 7.31 4 .55 2 .09 0 .42 7 .06
7 Break-down per 10000 buses 825 1154 453 862 706 952 461 763
8 Accidents 89 44 20 153 82 35 11 128
(i) Major 8 3 2 13 7 - - 7
(ii) Minor 68 35 7 110 60 26 7 93
9 Inter-State Bus Route covered by D.T.C. - - - 11 - - - 9
10 D.T.C. Workshop - - - 2 - - - 2
11 D.T.C. Depots - - - 43 - - - 39Source: Delhi Statistical Handbook 2017 DTC gives various types of concession in the bus fares to students, senior citizens,
Disabled, freedom fighters, etc. The concession amount is reimbursed by GNCTD. The Govt. of NCT of Delhi has reimbursed an amount of 84.00 crore for concessional passes during 2016-17.
12. Cluster Buses: - The Government of NCT of Delhi initiated the Scheme in 2011-12 for Corporatization of Private Stage Carriage Service to substitute the Blue line private stage carriage system under Public Private Partnership (PPP) model. Under this scheme, 457 stage carriage bus routes of Delhi have been divided into 17 distinct clusters. Presently approximately, 1757 cluster buses are operating in 08 clusters of Delhi. Automatic fare collection system through electronic ticketing in Cluster Buses is being implemented.

ECONOMIC SURVEY OF DELHI, 2017-18 175
Statement 12.11
PERFORMANCE OF CLUSTER BUSES
S. No Years
Fleet
(No)
Fleet Utilization
(%)
Vehicle Utilization
(Km/Bus/Day)
Load Factor*
(%)
Passenger Carried per bus daily
Daily Average
Passengers (in Lakh)
2013-14 1090 93.49 218.43 81 950 6.362014-15 1402 97.30 217.61 78 899 9.952015-16 1490 98.84 214.52 74 831 10.612016-17 1651 98.10 210.02 78 755 10.25
*LF is calculated using CIRT FormulaSource:-DIMTS Ltd.
13. BRT Corridor
For smooth operation of buses, road stretches, that create bottlenecks in the running of buses would be systematically improved through road engineering, route by route, for better bus turn-around time and improvement in the quality of service. Preferential traffic signaling for HCBS buses, at intersections, shall be provided to avoid delay at crossings. 1st BRT corridor from Ambedkar Nagar to Delhi Gate (Mool Chand) came under operation in 2008-09. But it was decided to dismantle vide Cabinet Decision No. 2240 dated 03.11.2015 and the work of dismantling is being carried out by PWD, GNCTD.
14. Road Safety
14.1 Delhi Traffic Police established a Road Safety Cell in 1972 to generate awareness among road user. It is an educational wing of the Delhi Traffic Police and its main function is to educate the road users about the proper and safe use of roads as well as to develop the human resources who are responsive to public and are technically competent. Government of NCT of Delhi is taking various initiatives such as construction of pedestrian lanes, foot over bridges at traffic intersections, conducting Road Safety campaigns at schools and college level, educating the general public about the road safety and other measures.
14.2 State Road Safety Council: The State Road Safety Council was earlier constituted under the chairmanship of Commissioner (Transport) in 2005. However, on the directions of the Supreme Court Committee on Road Safety, the Government of NCT of Delhi has re-constituted the State Road Safety Council on 07.07.2017 under the Chairpersonship of Hon’ble Transport Minister for political commitment to assure coordination among various agencies for safety of pedestrian, non motorized vehicles & road users, to assure safety measures for Road users and facilities for design for engineering, re-engineering, repair etc. on technical standards etc.

ECONOMIC SURVEY OF DELHI, 2017-18176
14.3 District Road Safety Committees: The District Road Safety Committees have also been established vide notification dated 17.06.2014 in all the eleven revenue districts of Delhi headed by the Deputy Commissioner of each district and Deputy Commissioner of Police; Deputy Commissioner Police (Traffic); Superintending Engineer (PWD); Superintending Engineer (MCD/NDMC); Superintending Engineer (DDA); Additional CDMO (Health); Deputy Director (Education) and Motor Licensing Officer (Transport) of each district concerned as its Members and Additional District Magistrate Convener/Member of each district concerned. The District Road Safety Committees are performing the functions related to Road Safety measures at the district level.
15 Measures taken for Safe Public Transport
15.1 DTC’s Night Bus Service (11 PM – 5 AM) has been augmentation. Number of buses has been increased from 38 buses on 8 routes to 85 buses on 24 routes. Gender Sensitization Program for bus crew undertaken by DTC is being conducted on a regular basis for safety of women passengers. 1643 Civil Defence Marshal and 115 DTC Marshals are deployed in DTC buses (evening and night shift) for the safety/security of women passengers. 120 Home Guards are deployed in DTC buses for women safety and security at night and 28 Ladies Special trips are scheduled to play in Delhi. Ladies Special Buses being plied during peak hours on 28 routes. 25% seats have been reserved for women in stage carriage buses. (Low floor buses-10 seats, & standard floor buses -12 seats).
15.2 CCTV video surveillance system has been installed in 200 buses of DTC i.e. 100 buses of Sarojini Nagar Depot and 100 buses of Rajghat Depot-I. DTC has installed these CCTV cameras with its own resources. Government has decided to install CCTV cameras in all DTC & Cluster buses.

ECONOMIC SURVEY OF DELHI, 2017-18 177
CHAPTER 13
WATER SUPPLY AND SEWERAGEDelhi depends on neighboring states to meet around 50 per cent of drinking water demand of its residents. Political considerations remain very serious challenge. The city state is 98 per cent urban in terms of population. The growing need for water is very fast with rapid pace of urbanization. The distance between source of water and destination increases the possibility of leakage and pilferage. Loss of treated water is around 30 per cent. It increases the cost of water supply. Excessive drawing of water from bore wells has resulted in depletion of ground water which is aggravated with inadequate monsoon. The status of non-revenue water is around 50 per cent. DJB does not have enough resources to meet the cost of water supply and sewerage infrastructure required for growing population. Growth of the city beyond reasonable limits imposes unbearable strain for provisioning of two most basic services: water and sanitation.
2. The Delhi Jal Board was established on 1998 under an Act of the Delhi Legislative Assembly. It is accountable for the production and distribution of potable water after the treatment of raw water from Yamuna, Bhakhra Storage, Upper Ganga Canal and Groundwater. It is also responsible for treatment and disposal of waste water. To meet the growing requirement of water due to the increase in population at a rapid rate, Delhi Jal Board (DJB) is planning to increase the water supply and treatment capacity in every Five Year Plan. Efforts are being made by the Government for an equitable and adequate Water Supply in all parts of the NCT of Delhi by laying of new water lines, construction of UGRs, construction of new Water Treatment Plants, etc.
3. Delhi Jal Board has improved its governance and undertook a number of measures for proper demand-side planning, efficient management of water distribution and water audit and proper water accounting, a transparent tanker water distribution system using GPS/GPRS with schedules of operation available online, elimination of unscrupulous private tankers charging exorbitant rate. Concurrently, the Delhi Jal Board made transformative improvements in water pipeline and supply reaching constituencies like Dwarka, Sangam Vihar and Tughlakabad, truly moving towards the goal of providing water as a right. Regularization of unauthorized connections, provision of water to over 250 unauthorized colonies and reduction in sewerage and water development charges have brought water to the poorest in Delhi and also ensured better water management and accounting under the ambit of the Delhi Jal Board’s formal network. DJB had managed to improve upon its working and monitoring vis-a-vis water and sewage management. It had an increased revenue collection despite poor economics as the positive outcomes of good governance. DJB has launched “Seva App” for bill generation, online payments and the resolution of inflated bills to deliver efficient and transparent services and to instill more confidence in the citizens of Delhi. Factors attributable to the increased DJB’s revenue: are Price of the non-free water was increased by 10%, increase in the number of connections/meters, One-time window was offered to people to clear of their previous dues, several water leakages were fixed. There were several other revenue-generating measures such as ads on water tankers, renting out property and tap solar power, Innovations/ new schemes like water ATMs, “toilet to tap” and GPS-tracking of DJB water tankers.
4. The population of Delhi increased from 138.51 lakh in 2001 to 167.53 lakh in 2011 and expected to reach 190 Lakhs by March 2017. As per 2011 census, there are 33.41 lakh households in Delhi, out of which, 27.16 lakh households were provided piped water

ECONOMIC SURVEY OF DELHI, 2017-18 178
supply system. About 4.61 lakh households are getting water supply through tube wells/ deep bore hand pumps/ public hydrants and remaining 1.64 lakh households depended on other sources like river, canal, ponds, tank, spring, etc.
Statement 13.1 (A)
DISTRIBUTIONS OF HOUSEHOLDS BY AVAILABILITY OF DRINKING WATER FACILITYAND SOURCE IN DELHI
No Source and Availability of Drinking Water Households (%)I. Sources
1.Piped Water Supply System 81.30a. From Treated Source 75.20b. From Untreated Source 6.10
2. Covered Well 0.103. Hand pump 5.304. Tube Well 8.405. Tank, Pond, Lake 1.206. Other Sources 3.70
II. Availability 1. Within the Premises 78.402. Near the Premises 15.403. Away 6.20
Source: - Census of India, 2011, Houses, Household Amenities and Assets.
Statement 13.1 (B)
STATUS OF WATER SUPPLY IN DELHI IN 2016S.No Components 20161 Projected Census Population (Total) (million) 18.752 Projected Demand for Water (mgd) 10403 Projected Supply of Water (mgd) 925
4 Water Supply in Un-served Areas (Length of water line in km) 1127
5 Households with Access to Tap Water (%) 83.42
6 Households with Access to Hand pump/tube wells (%) 12.30
7 Households with Access to Water Tankers (%) 4.28
8 Households with Access to Water within Premises (%) 83.42
9 Households with Access to Water near Premises (%) 12.3010 Households with Access to Water away from Premises (%) 4.2811 Households with Access to Tap Water from Treated Sources (%) 83.42
Note: Mgd – million gallons daily, Based on per capita supply norm: Planned areas: 50 gpcd (228 lpcd), NDMC area: 75 gpcd (320 lpcd),Outer Delhi: 35 gpcd (160 lpcd) , Gpcd = gallon per capita daily, lpcd = liter per capita daily

ECONOMIC SURVEY OF DELHI, 2017-18 179
5. About 83.42% households of Delhi now have access to piped water supply. Water production during summer season is being maintained at 895 MLD per day consistently. Water is supplied to about 18 million population of Delhi through existing water supply network comprising of 14000 km long pipelines and more than 107 underground reservoirs (UGRs). Besides, total 407 new water tankers with stainless steel containers fitted with GPS have been engaged for improving the water tanker supply delivery system in the city. Apart from 400 M.S hired tankers, 250 newly purchased SS tankers are being added to the existing fleet to supplement water supply in water deficit areas.
6. Water supply distribution network has been developed to cover both planned and unplanned areas. Water supply is made available to 1209 unauthorized colonies upto December, 2017.
7. Water Requirement
7.1 Based on the norm of 60 Gallon Per Capita per Day (GPCD) as per Central Public Health and Environmental Engineering Organization (CPHEEO), Ministry of Urban Development, Government of India, the total requirement of water in March 2011 was 1020 MGD. The water requirement norms for various usages are presented in Statement 13.2.
Statement 13.2
DETAILS OF WATER REQUIREMENT NORMS - DJB
S.No.
DetailsRequirement of
Water1 Domestic 172 LPCD
2Industrial, Commercial and Community requirement based on 45000 liters per hectare per day
47 LPCD
3 Fire protection based on 1% of the total demand 3 LPCD
4 Floating population and special uses like Hotels and Embassies 52 LPCD
Total274 LPCD (60 GPCD)
Source: - Delhi Jal Board
7.2 Master Plan of Delhi-2021 prepared by Delhi Development Authority proposed water requirement with the norm of 80 Gallon Per Capita Per Day (GPCD), out of which 50 GPCD is for domestic requirement and 30 GPCD for non-domestic purposes. The domestic water requirement of 50 GPCD comprises of 30 GPCD for potable needs and 20 GPCD for non-potable water.

ECONOMIC SURVEY OF DELHI, 2017-18 180
Statement 13.3
WATER REQUIREMENT NORMS- AS PER MPD 2021
S. No Norms
Quantum (GPCD)Sources of Non-potable
WaterPotable Non-potable
1.
Domestic @50 GPCD 30 20 --
Residential 30 20Recycling & Permissible Ground Water Extraction at Community Level
2.
Non-domestic @30 GPCD 5 25
a. Irrigation, Horticulture, Recreational, Construction, Fire @ 6.65 LPCD
- 10
Recycling from Sewerage Treatment Plants (STPs) and Permissible Ground Water Extraction
b. Public, Semi-Public , Industrial and Commercial 5 15
Recycling from Common Effluent Treatment Plants (CETPs)
Total @ 80 GPCD 35 45 Source: Delhi Jal Board
7.3 The estimated demand of water in Delhi based on the norms of MPD 2021 will be around 1140 MGD based on the norm of 60 GPCD to meet the requirement of projected population of 190 lakhs upto 2017.
8. Water Supply Capacity
Statement 13.4
INSTALLED CAPACITY OF WATER TREATMENT PLANTS: 2008-2017 (As on 31st March 2017)
S. No Name of Plants
Capacity (MGD)2008 2009 2010 2011 2012 2013 2014 2015 2016 2017
1.Chandrawal Water House No. I & II
90 90 90 90 90 90 90 90 90 90
2. Wazirabad I,II & III 120 120 120 120 120 120 120 120 120 1203. Haiderpur 200 200 200 200 200 200 200 200 200 200
4.North Shahdara (Bhagirathi)
100 100 100 100 100 100 100 100 100 100
5. Bawana -- 20 20 20 20 20 20 20 20 206. Nangloi 40 40 40 40 40 40 40 40 40 407. Sonia Vihar 140 140 140 140 140 140 140 140 140 140
8.Ranney Wells & Tube Wells
100 100 100 100 100 80 80 80 80 80

ECONOMIC SURVEY OF DELHI, 2017-18 181
S. No Name of Plants
Capacity (MGD)
2008 2009 2010 2011 2012 2013 2014 2015 2016 2017
9.Recycling of Water at Bhagirathi, Haiderpur & Wazirabad
-- -- 37 37 37 45 45 45 45 45
10.C o m m o n w e a l t h Games Village
-- -- -- 1 1 1 1 1 1 1
11. Okhla -- -- -- -- -- -- 20 20 20 20
12. Dwarka -- -- -- -- -- -- 50 50 50 50
Total 790 810 847 848 848 836 906 906 906 906
Source: - Delhi Jal Board
8.1 The installed treatment capacity of Water in Delhi during 2006-17 is depicted in Chart 13.1. The installed capacity of DJB has been augmented by 39% during last 10 years. The capacity, which was 650 MGD in 2006, has been increased to 906 in 2017.
Chart 13.1
INSTALLED TREATMENT CAPACITY OF WATER TREATMENT PLANTS DELHI- 2006-2017
8.2 Two new Water Treatment Plants constructed at Dwarka (50 MGD) and Okhla (20 MGD). Raw water for these two plants has been made available with the commissioning of the pucca parallel channel from Munak to Haiderpur. Further Bawana Water Treatment Plant (20 MGD) has been constructed but will be commissioned after availability of raw water.

ECONOMIC SURVEY OF DELHI, 2017-18 182
9. Water Consumption
9.1 Water supplied and billed to various categories of consumers by Delhi Jal Board during 2015-16 and 2016-17 is presented in Statement 13.5.
Statement 13.5
CATEGORY-WISE WATER CONNECTIONS, SALES AND PERCENTAGE OF SALES
S. No Category
Connections (in lakh) Sales (MGD) % of Sales
2015-16 2016-17 2015-16 2016-17 2015-16 2016-17
1. Domestic 21.88 23.51415.45 382.78 91.89 90.94
2. Commercial & Institutional 1.33 1.44
3.Supply to NDMC & MES - - 36.70 38.13 8.11 9.06
Total 23.21 24.95 452.15 420.91 100.00 100.00Source: - Delhi Jal Board
9.2 The information regarding water consumption in Delhi, total number of connections, domestic, commercial and industrial consumption is presented in Table 13.1.
10. Sources of Water Supply
The water supply treatment plants of Delhi Jal Board treated 833 MGD surface water and 80 MGD ground water as on March, 2017. The water resources of Delhi Jal Board are indicated in Statement 13.6
Statement 13.6
WATER RESOURCES OF DELHI JAL BOARD (As on March 2017)
S. No Resources Quantity (MGD)
1 Yamuna River 375
2 Ganga River 240
3 Bhakra Storage 218
4 Ground Water/Ranney well/ Tube well 80
Total 913Source: - Delhi Jal Board

ECONOMIC SURVEY OF DELHI, 2017-18 183
11. Ground Water
11.1 The decreasing ground water level in Delhi has become a matter of serious concern. At some places in South and South West Delhi, the water level has gone 20-30 meter below the ground level. The quality of underground water is deteriorating in several places. It has been found to be unfit for human consumption. The salinity of ground water is increasing in South-West and North-West Delhi. In some areas of Shahdara and Kanjhawala, Nitrate content has been found to be more than 1000 mg/ liter. Fluoride and chemical concentrations, more than prescribed limits, have also been found in ground water at various locations in Delhi. To tackle these problems, the Central Ground Water Board has taken steps to regulate the number of tube-wells being commissioned in Delhi.
11.2 As on March 2017, Delhi Jal Board has 4209 functional Tube Wells and 14 Ranney Wells. The Flood plains downstream of Wazirabad and the area adjacent to Najafgarh Lake are being explored for extraction of water on sustainable basis. Pre-feasibility studies for ground water recharge through the abandoned Bhatti Mines and Canal system in the North Western region of Delhi have also been taken.
11.3 Deepening of old lakes and other water bodies, preserving and developing the forest area in Delhi, construction of check dams at Asola Wild Life Sanctuary and plantation of trees, are some of the steps being taken to improve ground water resources by custodian department.
12. Parallel Channel from Munak to Haiderpur
About 30-50 per cent of the raw water discharged from Tajewala Head works is lost through seepage during transit in the present water carrier system comprising of Western Yamuna Canal system and River Yamuna. To minimize the en-route losses, a parallel pucca channel has been constructed from Munak to Haiderpur by the Haryana Govt as a deposit work on behalf of Govt of Delhi. Commissioning of CLC has resulted in increased availability of water of Delhi within the existing releases at Munak and WTP at Dwarka and Bawana have been commissioned.
12.1. Reservoirs
Renuka Dam, Kishau Dam and Lakhwar Vyasi Dam are proposed to be constructed so that Delhi gets its share in Yamuna water as per Yamuna Water Sharing Agreement signed in May, 1994. The approved allocation of Yamuna water to each state is presented in Statement No. 13.7. About 275 MGD water will be available to Delhi from Renuka Dam. Delhi will also get 372 MGD water from Kishau reservoir and 135 MGD from Lakhwar Vyasi reservoir.

ECONOMIC SURVEY OF DELHI, 2017-18 184
Statement 13.7
APPROVED ALLOCATION OF WATER FROM YAMUNA RIVER TO STATES
S.No. States Allocation (BCM) Total(BCM)July to Oct. Nov. to Feb March to June1 Haryana 4.107 0.686 0.937 5.7302 Uttar Pradesh 3.216 0.343 0.473 4.0323 Rajasthan 0.963 0.070 0.086 1.119
4 Himachal Pradesh 0.190 0.108 0.080 0.378
5 Delhi
0.580 (Consumptive
1926+495 return flow) or 2421 cusec
0.068 (Consumptive
231+495 return flow) or 726
cusec
0.076(Consumptive
255+495 return flow) or 750
cusec
0.724(Consumptive
806+495 return flow) or 2350
cusec Source: - Delhi Jal Board Note: - BCM Billion Cubic Meter.
12.2 Present Status of Renuka Dam: In the 51st meeting of Upper Yamuna River Board (UYRB), representative of HPPCL apprised the Board that out of an amount of 446.96 crore Central Assistance released in 2016, a sum of 238.68 crore has already been disbursed by the Land Acquisition Collector, HPPCL upto 01.09.2017 and land measuring 534.39 ha has been acquired against this amount. Award of land measuring 23.85 ha has been announced and compensation amounting to 8.02 crore shall be disbursed by 31.10.2017.
12.3 Further, it was apprised that project proposal has been accepted in 132nd meeting of TAC subject to certain condition including Stage-II Forest Clearance. It was informed that DFO, Renukaji has raised a demand of Rs. 488.72 crores ( 502.39 crores - 13.67 crores already deposited) which needs to be deposited for processing of stage-II Forest Clearance. Accordingly, HPPCL has requested to grant above amount from Govt. of India for the purpose. It was also informed that the proposal for Investment Clearance is being framed and would be submitted shortly.
12.4 Chairman UYRB stated that Central Assistance could be provided only after the investment clearance and approval of Cabinet. Meanwhile, he urged the beneficiary States to deposit the seed money for the execution of the project.
13. Water Accounting and Auditing
13.1 At present, Delhi Jal Board was using old system for measuring the quantity of raw water available at water treatment plants and the quantity of treated water supplied by treatment plants for distribution. Similar, was the position at underground water tanks, reservoir and booster pumping stations. Due to this system, Delhi Jal Board was not able to assess exact amount of water distribution losses.
13.2 Assessment of water distribution losses through proper water accounting and auditing system has been given top priority by DJB. Delhi Jal Board has started a comprehensive programme for installation of bulk meters at all water treatment plants and about 302 bulk meters have already been installed. Delhi Jal Board has also decided to install bulk meters

ECONOMIC SURVEY OF DELHI, 2017-18 185
on all distribution mains, underground reservoirs and booster pumping stations for correct measurement of water supply from these points upto different localities/consumer points.
13.3 Complete and correct water supply accounting could not be maintained by Delhi Jal Board. As on 1st April 2016, there were 2.65 Lakh un-metered connections. (Table 13.1)Around 4.00 lakh meters were defective or non-functional.Fixing of maximum average of 20 KL/30 KL per month (as the case may be) for
domestic consumers, if water meters are non-functional and till defective water meter is replaced.
13.4 Delhi Jal Board has streamlined its system for obtaining water meters for metering of unmetered supply of water. The existing system of supply of water meter along with sanction of water connection has been amended and now consumers can purchase water meters of approved specifications from the open market. The consumers having Delhi Jal Board’s defective meters have been allowed to get the defective meter replaced with private water meter and have been given option either to get the refund of meter security or get the same adjusted towards water charges in future.
14. Water Tariff
14.1 The tariff is based on the principle of “use more pay more”. Present water tariff policy acts as a deterrent for consumers consuming excessive water or having wastage of water. Collection efficiency of DJB has improved to 96.93% in 2016-17 from 89.77% during 2015-16. DJB had actually collected 1615.83 crore against estimated revenue of 1700.00 crore, March 2017.
14.2 DJB has provided Rain Water Harvesting in its 166 no installations. The Rain Water Harvesting Cell of DJB provides technical assistance to individuals/ institutions for providing Rain Water Harvesting. DJB has provided the information regarding Rain Water Harvesting on its website for public facilitation.
14.3 As per DJB amended tariff Regulations (March 2016) rebate of 10% in the water bills is provided for having functional RWH system and non provision will make water bills increased by 1.5 times till functional RWH system is installed. These provisions are applicable for plots of 500 sqm and above.
14.4 Special subsidy in water charges has been allowed to resettlement colonies and rural areas where water charges are being recovered on assumed average of 10 Kl. per month per floor. Salient features of existing water tariff are as under:• Existing water tariff has two parts. One is Service Charge and other Volumetric Water
Consumption Charge applicable w.e.f. 1.12.2004 and 1.4.2005 respectively.
• 60 per cent of water consumption charges are recoverable towards Sewerage Maintenance Charge from such colonies / areas where sewerage services have been provided / maintained by the Delhi Jal Board.
• In case of bulk connection for a colony / group housing society serving a number of residential premises, water charges will be worked out as per residential unit-wise at the domestic rates applicable from time to time.

ECONOMIC SURVEY OF DELHI, 2017-18 186
14.5 Water Tariff for Un-metered Connections in JJ Resettlement Colonies and Rural Areas: Water charges are applicable on assumed average of 10 Kl. Per month per floor for unmetered water connection in JJ resettlement colonies. For Unmetered water connections in case of Rural areas assumed average 25 Kl per month per connection is charged. Water consumption rates and service charge are levied slab-wise. Sewerage maintenance charge is also recoverable, if sewerage services are being managed by Delhi Jal Board. Besides above, water cess is recoverable from all consumers at the rates determined by the Central Government from time to time.
14.6 All domestic consumers of Delhi Jal Board consuming water up to 20 KL per month and having functional water meters are being given 100% subsidy and fully exempted from payment of water bill including all components namely, water charges, sewerage maintenance charge, service charges, meter rent (wherever applicable) and cess w.e.f 01.03.2015.
15. Rain Water Harvesting
15.1 DJB has provided Rain Water Harvesting in its 151 no. installations. DJB has provided financial assistance to the tune of 82 lakh for 172 cases in the institutional category for providing Rain Water Harvesting Systems. The Rain Water Harvesting Cell of DJB provides technical assistance to individuals for providing Rain Water Harvesting. DJB has provided the information regarding Rain Water Harvesting on its website www.delhijalboard.nic.in for public facilitation. 2 no. of NGOs have been engaged by DJB to create public awareness and promote community participation to implement Rain Water Harvesting.
15.2 The following provisions have been made in the Delhi Water & Sewer Tariff and Metering Regulations, July’ 2012 for promoting Rain Water Harvesting:
(A) Regulation 8 (d) of Chapter II provides that for Category D consumers, the following rebate is given in tariff for provision of Rain Water Harvesting, Waste Water Recycling or both:-
i) Such plot/properties which are having area of 2000 square meter or more and having installed functional rain water harvesting system or waste water recycling system, shall be granted rebate of 10% in the total bill amount and 15% if both the above systems have been set up and functional.
ii) If the Rain Water Harvesting system is adopted by a society then the individual member of that society will be entitled to above mentioned rebate in water bill.
iii) The area Zonal Engineer or such other suitable agency as authorized by the board will provide a functional certificate in respect of the above systems mentioning therein that substantive portion of the plot/ property has been covered as far as Rain Water Harvesting is concerned. Similarly, he will certify that substantive quantity of the waste water generated has been recycled by the consumer. A certificate will be issued after every six months.
(B) Regulation 50 of Chapter V provides that rainwater harvesting is mandatory
i) The consumer of the Board having a plot/property of size 500 sq. metre or more shall make provision for rain water harvesting covering the entire plot area, within

ECONOMIC SURVEY OF DELHI, 2017-18 187
one year, in case of commercial/industrial property and within three years for residential property from the date of coming into force of these regulations under intimation to the area ZRO.
ii) In case, the consumer fails to comply the above provisions within the time limit the tariff as applicable for the consumer respective category will be increased by 1.5 times till the provision is installed.
iii) Board has deferment the implementation of Rain Water Harvesting penalty upto 31.03.2017
15.3 INCENTIVE:
(i) Such Plots/ properties having area of 500 sqm or more having installed functional RWH system or Waste Water Recycling shall be granted rebate of 10% in total bill amount for having RWH system and 15% if both the systems have been set up and are functional.
(ii) Consumers having plot area between 100 sq meter to 499.999 sq. meter and a functional Rain Water Harvesting facility will get a rebate of 10%.
(iii) The area Zonal Engineer or such other suitable agency as authorized by the Board will provide a functional certificate in respect of the above systems mentioning therein that substantive portion of the plot /property has been covered as far as Rain Water Harvesting is concerned. Similarly, he will certify that substantive quantity of the waste water generated has been recycled by the consumer. A certificate will be issued after every six months.
15.4 Penalty: For all the consumers irrespective of their consumer category Rain Water Harvesting penalty at enhanced tariff of 1.5 times will be applicable if they have plot area 500 sq meter or above and do not have a functional rain water harvesting system.
15.5 Exceptions:
1. If the consumer lives in the area which has rocky ground or it is on the banks of Yamuna River then Rain Water Harvesting penalty will not be imposed if the consumer does not install Rain Water Harvesting system in his premises.
2. If the consumer lives in the area which has rocky ground or it is on the banks of Yamuna River and have a working rain water harvesting facility in his/ her premises then applicable rebate @10% will be given to such consumer.
16. Water Conservation
16.1 Delhi has a network of about 14000 Kilometers of water supply mains, of which, a significant portion is as old as 40 to 50 years and prone to higher leakage losses. Normally, water losses are calculated by water billed or consumed subtracted from the water produced. In the case of Delhi, water billed or consumed and leakage losses there from cannot be calculated exactly as a majority of houses do not have working meters. According to the estimates of Delhi Jal Board, the total distribution losses are of the order of 40 per cent of the total water supplied. These are quite high as compared to 10-20 per cent in the developing countries. The distribution losses include losses due to (a) leaking pipes and (b) theft of water through unauthorized connections.

ECONOMIC SURVEY OF DELHI, 2017-18188
16.2 Delhi Jal Board has taken several steps to minimize leakage losses. To address this problem, a leak detection and investigation (LDI) cell was set up. The Board has replaced about 1200-km length of the old, damaged and leaking water mains during the last five years. As a result of these initiatives, the Board expects to bring down the distribution losses to 20 per cent level in the near future.
16.3 Delhi Jal Board has formulated a programme for recycling of backwash water in four major water treatment plants at Haiderpur, Bhagirathi, Chandrawal and Wazirabad. The work for commissioning of recycling plant at Haiderpur, Bhagirathi, Wazirabad recycling plant has been completed. About 45 MGD water supplies will be available without any additional raw water from these four plants.
17. Sewage Treatment Capacity
17.1 Sewage treatment capacity of Delhi Jal Board increased from 402.40 MGD in 31st March 2001 to 607.26 MGD in 31st March 2017. The information regarding the sewerage treatment capacity and percentage of utilization is presented in Statement 13.8.
Statement 13.8
SEWERAGE TREATMENT CAPACITY AND ITS UTILIZATION
(MGD)
S.No.
Name of SewerageTreatment
Plants (STPs)
Capacity ActualTreatment as
on31.3.2017
% ofUtilization31.3.2001 31.3.2017
1. Okhla 140.00 140.00 109.40 78.142. Keshopur 72.00 72.00 60.51 84.04
3. Coronation Pillar with Oxidation Ponds at Timarpur 46.00 30.00 20.09 66.97
4. Rithala 40.00 80.00 60.52 75.655. Kondli I, II, III, IV 45.00 70.00 62.43 89.196. Yamuna Vihar I,II 10.00 35.00 15.29 43.697. Vasant Kunj 5.00 5.20 2.71 52.118. Ghitorni 5.00 5.00 0.00 0.009. Pappankalan 20.00 40.00 33.98 84.95
10. Narela 10.00 10.00 1.35 13.5011. Najafgarh 5.00 5.00 2.45 49.00
12. Delhi Gate 2.20 17.20 17.65 102.6213 Sen Nursing Home 2.20 2.20 2.53 115.0014. Rohini -- 15.00 4.12 27.4715. Nilothi -- 60.00 15.97 26.6216. Mehrauli -- 5.00 3.86 77.2017 CWG Village -- 1.00 0.18 18.0018. Molarbad -- 0.66 0.61 92.4219. Kapeshera -- 5.00 1.46 29.2020. Chilla -- 9.00 9.03 100.33
Total 402.40 607.26 424.14 69.00Source: - Delhi Jal Board
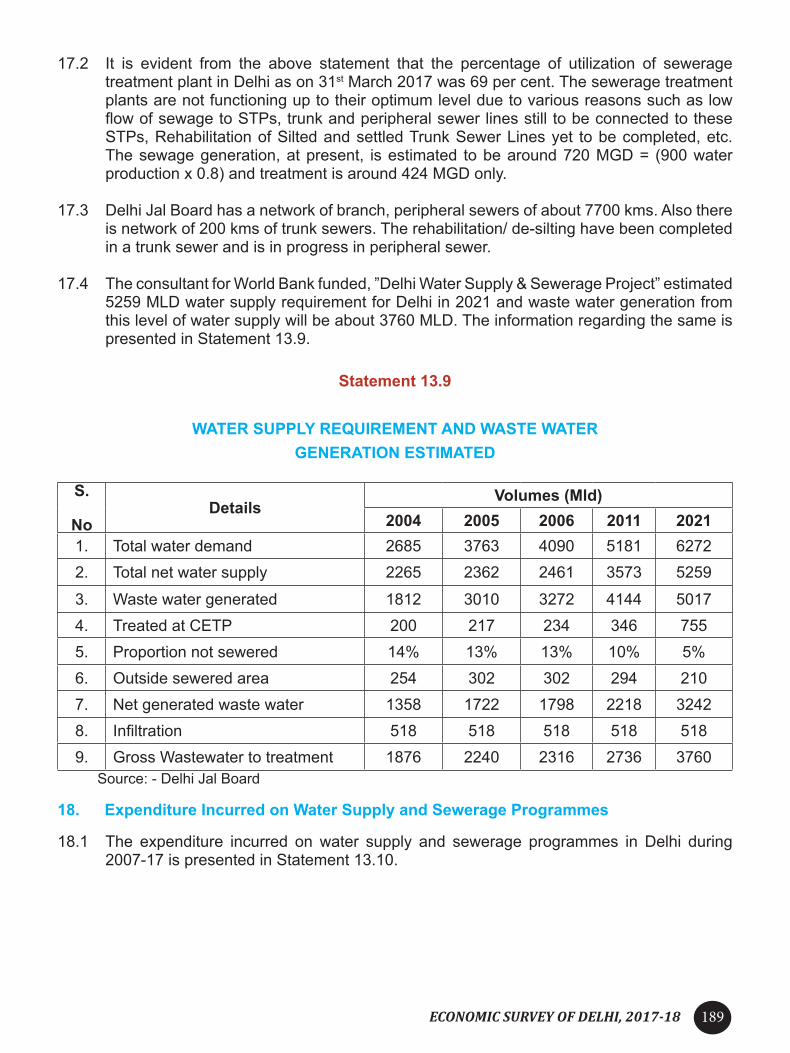
ECONOMIC SURVEY OF DELHI, 2017-18 189
17.2 It is evident from the above statement that the percentage of utilization of sewerage treatment plant in Delhi as on 31st March 2017 was 69 per cent. The sewerage treatment plants are not functioning up to their optimum level due to various reasons such as low flow of sewage to STPs, trunk and peripheral sewer lines still to be connected to these STPs, Rehabilitation of Silted and settled Trunk Sewer Lines yet to be completed, etc. The sewage generation, at present, is estimated to be around 720 MGD = (900 water production x 0.8) and treatment is around 424 MGD only.
17.3 Delhi Jal Board has a network of branch, peripheral sewers of about 7700 kms. Also there is network of 200 kms of trunk sewers. The rehabilitation/ de-silting have been completed in a trunk sewer and is in progress in peripheral sewer.
17.4 The consultant for World Bank funded, ”Delhi Water Supply & Sewerage Project” estimated 5259 MLD water supply requirement for Delhi in 2021 and waste water generation from this level of water supply will be about 3760 MLD. The information regarding the same is presented in Statement 13.9.
Statement 13.9
WATER SUPPLY REQUIREMENT AND WASTE WATER GENERATION ESTIMATED
S.
NoDetails
Volumes (Mld)2004 2005 2006 2011 2021
1. Total water demand 2685 3763 4090 5181 62722. Total net water supply 2265 2362 2461 3573 5259
3. Waste water generated 1812 3010 3272 4144 50174. Treated at CETP 200 217 234 346 7555. Proportion not sewered 14% 13% 13% 10% 5%6. Outside sewered area 254 302 302 294 2107. Net generated waste water 1358 1722 1798 2218 32428. Infiltration 518 518 518 518 5189. Gross Wastewater to treatment 1876 2240 2316 2736 3760
Source: - Delhi Jal Board
18. Expenditure Incurred on Water Supply and Sewerage Programmes
18.1 The expenditure incurred on water supply and sewerage programmes in Delhi during 2007-17 is presented in Statement 13.10.

ECONOMIC SURVEY OF DELHI, 2017-18190
Statement 13.10
EXPENDITURE INCURRED ON WATER SUPPLY AND SEWERAGE PROGRAMMES IN DELHI DURING 2007-2017
S. No Details Water Supply Sewerage Total
1. Approved Outlay (2007-2012) ( Crore) 4361.50 3132.50 7494.00
2.
Fund Released ( Crore)a. 2007-08 962.01 383.96 1345.97b. 2008-09 1015.17 441.73 1456.90c. 2009-10 1080.35 568.55 1648.90d. 2010-11 1080.14 527.93 1608.07e. 2011-12 1033.02 528.02 1561.04
Total (a+b+c+d+e) 5179.69 2450.19 7620.88
3. Approved Outlay(2012-17) ( Crore) 6087 4913 11000
4. Fund Released ( Crore)a. 2012-13 964.97 752.40 1717.37b. 2013-14 796.77 753.23 1550.00c. 2014-15 854.50 934.50 1789.00d. 2015-16 646.50 1077.43 1723.93
e. 2016-17 751.44 628.85 1380.29
Total (a+b+c+d+e) 4014.18 4146.41 8160.59
18.2 It may be observed from Statement 13.10 that the released fund for water supply and sanitation to DJB increased from 1346 crore in 2007-08 to 1380 crore in 2016-17.
19. Re-use of Waste Water
19.1 The major reuse of treated waste water in and around the city is for irrigation, horticulture and industrial use. There is now demand for use of treated waste water for cooling in the power stations. Other options include ground water recharge, return to be raw water source, and the treatment and reuse of treated waste water, for flushing of toilets, i.e. use for non-potable purposes like washing of Railways, Buses, Construction industry.
19.2 Presently, Delhi Jal Board supply about 89 MGD of treated waste water to the Irrigation Department, Power Plants and for irrigation purposes by CPWD and in Rohini area by DDA & Flood Control and Irrigation Department. Efforts are being made to increase the treated waste water supply from 89 MGD to 210 MGD in subsequent years. Treated water supply to various purposes in Delhi is presented in Statement 13.11.

ECONOMIC SURVEY OF DELHI, 2017-18 191
Statement 13.11
TREATED WASTE WATER SUPPLY FOR VARIOUS PURPOSES
S. No.
Details Units (MGD)
1. Treated effluent supplied from Keshopur STP for Irrigation, horticulture purpose 5.5
2. From Okhla STP to CPWD and Irrigation department for horticulture/Irrigation purpose 37.00
3. From Coronation Pillar STP for DDA Golf Course at Bhalswa, Gammon India for construction purposes. Minor Irrigation Department at Palla 19.02
4. From Rithala STP to PPCL for their plant at Bawana and NDPL for their owner plant at Rohini, DDA & horticulture 6.15
5. From Vasant Kunj to Sanjay Van 3.706. From Mehrauli STP to Garden of Seven Senses 3.407. From Delhi Gate and Sen Nursing Home STP to PPCL 4.80
8. From Nilothi STP to Flood Control & Irrigation Deptt. for Irrigation purposes 0.50
9. From Papankalan STP for Irrigation purposes to DDA 1.3310. From Commonwealth Games Village STP to DDA horticulture 0.1811 From Yamuna Vihar to STP’s horticulture 3.012 From Narela to Pvt. Agency for washing of vehicle 0.0513 From Najafgarh to WTP Dwarka for Horticulture 0.0714 From Chilla STP to Internal Horticulture of STP 1.0015 From Kondli STP to DDA, PPCL & Horticulture 3.0
Total 89 MGDSource: - Delhi Jal Board.
19.3 Estimates for many reuse projects are being framed. Besides, Sewerage Treatment Plants of Delhi Jal Board, treated waste water is available from Common Effluent Treatment Plants in industrial areas being maintained by DSIIDC and Mini Sewerage Treatment Plants of Delhi Urban Shelter Improvement Board (DUSIB).
19.4 For abatement of pollution in river Yamuna, DJB is executing the project of laying of interceptor sewer along three major drains (Najafgarh, Supplementary & Shahdara). Sewage to tune of 81 MGD has already been trapped. Present progress of work is 85% and the project is targeted to be completed by next year i.e. 2018. Commissioning of interceptor sewer will trap total 242 MGD of sewage which is presently flow into drains. This will significantly improve the quality of waste water flow in the major drains.
19.5 Delhi Development Authority is responsible for 4,451 hectares of open spaces, all of
which are irrigated via tube wells. There are also irrigation open spaces of Delhi Municipal Corporations, Central Government properties, private parks and properties, road verges, sports stadiums etc. The information regarding the green areas being maintained by the various agencies is presented in Statement 13.12.

ECONOMIC SURVEY OF DELHI, 2017-18192
Statement 13.12
GREEN AREAS MAINTAINED BY VARIOUS AGENCIES
S.No Agencies Green Areas (in
hectares) % age
1. New Delhi Municipal Council 445 2.172. Municipal Corporations of Delhi 2,428 11.833. Delhi Development Authority 4,451 21.69
4. Central Public Works Department 2,200 10.71
5. Forest Department 11,000 53.60
Total 20,524 100.00 Source: - Delhi Jal Board
19.6 The green areas maintained by various agencies in Delhi are depicted in Chart 13.2.
Chart 13.2GREEN AREAS MAINTAINED BY VARIOUS AGENCIES
(Hectares)
19.7 The colonies/category wise progress of sewerage system is given is statement 13.13.

ECONOMIC SURVEY OF DELHI, 2017-18 193
Statement 13.13
COLONIES/CATEGORY WISE PROGRESS OF SEWEAGE SYSTEM
S.No Colonies / categories Total no of
coloniesColonies with Sewerage
System
1. Un-authorised Regularised Colonies 567 541
2. Urban Village 135 130
3. Rural Villages 219 54
4. Un-authorised Colonies 1639 265
5. Resettlement Colonies 44 44

ECONOMIC SURVEY OF DELHI, 2017-18194
CHAPTER 14
HOUSING & URBAN DEVELOPMENT
Housing and Urban Development are the priority sectors in the development planning process of Delhi. DDA is the sole agency responsible for land, land development and public housing in Delhi. Growth of slums, unauthorised colonies and encroachments remain permanent challenges as rate of construction is inadequate compared to growing demand for housing. Continuous flow of migrants tends to aggravate the problem. MPD—2021 has suggested redevelopment and densification of the existing urban areas and city improvement through mixed land use, enhancement of ground coverage, increased FAR and height for all categories of residential plots, development of district and community centres as some major requirements of urban management. The challenge is sources of finance and implementation procedure.
1.1 Delhi has the highest population density 11,320 persons per sq km. in 2011 at despite a decline in the decadal growth rate from 47.02 % during 1991-2001 to 21.20 % during 2001-2011. The city of Delhi is overwhelmingly urban; with 75 % of its total area (1483 sq km) falling in urban jurisdiction and the population density in urban area is as high as 14698 persons per sq km as per 2011 Census. 16.37 million Population i.e 98 % of total population (16.79 million) of Delhi is residing in urban areas. Highly urban character of Delhi exerts tremendous pressure on public delivery of services / civic infrastructure systems like water supply, sewerage and drainage, solid waste management, affordable housing, health and educational facilities etc. and poses a great challenge for the city government.
1.2 About one-third of Delhi lives in sub-standard housing, which includes 695 slum and JJ Clusters, 1797 unauthorized colonies, old dilapidated areas and 362 villages. These areas often lack safe, adequate housing and basic services. According to the projections, Delhi needs 24 lakh new housing units by the year 2021 (MPD-2021). Of these, 54% are required for the EWS and LIG. About 42% housing units, i.e. about 10 lakh are to be provided by densification and redevelopment of existing residential areas, covering in-situ slum rehabilitation, infill development, regularization and redevelopment of unauthorized colonies and by densification and up-gradation of old residential areas.
1.3 Urban basic services are the lifeline of urban living. These essentially include potable water for all and always, affordable 24X7 electricity, sewerage, sanitation and toilets, especially in the localities of the poor, i.e. slums, villages, unauthorized colonies, resettlement colonies etc. The poor need municipal services and waste management to keep the city clean and hygienic. This needs a review of the practices of solid waste management, sweeping and regular maintenance of public spaces, parks and roads. Wastewater and storm water can be the assets by adopting strategy of recycling rainwater harvesting and by innovative ways of drainage, irrigation and urban farming.
1.4 High growth of urbanization and the trend of growth of urban population in Delhi during last 12 Census are depicted in the Chart 14.1

ECONOMIC SURVEY OF DELHI, 2017-18 195
Chart 14.1URBANIZATION TREND OF DELHI DURING 1901-2011
2 Housing Conditions in Delhi
2.1 Despite the challenges of population growth, migration and land availability, housing stock has increased in Delhi over a period of time. Housing status as per 2011 Census is as under:
Statement 14.1
Item No. House-list Item
Absolute number Percentage
Total Rural Urban Total Rural Urban
A Number of census houses
A.1 Total number of census houses 46,05,555 1,24,422 44,81,133 100.0 100.0 100.0
A.2 Total number of vacant census houses 5,12,691 22,556 4,90,135 11.1 18.1 10.9
A.3 Total number of occupied census houses 40,92,864 1,01,866 39,90,998 88.9 81.9 89.1
B Number of occupied census houses

ECONOMIC SURVEY OF DELHI, 2017-18196
Item No. House-list Item
Absolute number Percentage
Total Rural Urban Total Rural Urban
B.1 Total number of occupied census houses 40,92,864 1,01,866 39,90,998 100.0 100.0 100.0
B.2 Occupied Census Houses used as Residence 31,76,329 75,234 31,01,095 77.6 73.8 77.7
B.3 Residence -cum- other use 1,37,575 3,458 1,34,117 3.4 3.4 3.4
B.4 Shop/ Office 3,77,299 3,022 3,74,277 9.2 3.0 9.4
B.5 School/ College etc. 9,709 279 9,430 0.2 0.3 0.2
B.6 Hotel/ Lodge/ Guest house etc. 7,754 60 7,694 0.2 0.1 0.2
B.7 Hospital/ Dispensary etc. 7,853 113 7,740 0.2 0.1 0.2
B.8 Factory/ Workshop/ Work-shed etc. 90,945 829 90,116 2.2 0.8 2.2
B.9 Place of worship 8,668 354 8,314 0.2 0.3 0.2
B.10 Other non-residential use 2,37,244 17,713 2,19,531 5.8 17.4 5.5
B.11 No. of occupied locked census houses 39,488 804 38,684 1.0 0.8 1.0
Source: Census of India 2011.
2.2 As per 2011 Census, out of 46.1 lakh houses in Delhi, only 40.9 lakh were occupied and of the occupied houses, 77.6% were being used for residential purposes. As regards the other uses 9.2% of these housing units were being used for shops / offices, and 5.8% for entirely for non-residential purposes. The quality of housing in Delhi has improved over the last decades with the share of “good” houses having increased from 58% in 2001 to 66% in 2011. Nearly one – third of the houses need minor repairs and only 3% are in dilapidated condition and require major repair.
2.3 The trend of residential houses and households in Delhi and India during 1991, 2001 and 2011 is presented in Statement 14.2.

ECONOMIC SURVEY OF DELHI, 2017-18 197
Statement 14.2
RESIDENTIAL HOUSES AND HOUSEHOLDS IN INDIA AND DELHI DURING 1991, 2001& 2011
S.No Years
Households(Lakh)
Residential Houses(Lakh)
Difference of Households & Residential Houses (Lakh)
1.1991a. Delhi 18.62 17.14 1.48 b. India 1520.10 1470.10 50.00
2.2001a. Delhi 25.54 23.17 2.37b. India 1919.64 1792.76 126.88
3. 2011a. Delhi 33.41 31.76 1.65 b. India 2466.93 2360.52 106.41
Source: Tables on Households and Amenities, Census of India, Ministry of Home Affairs 1991, 2001 & 2011
2.4 As per the census 2011, the distribution of households by type of structure of houses in Delhi is “Good” to the extent of 60.19%, 36.19% is “Satisfactory”, and the rest 3.62% is rated as “Bad”. The survey revealed the structure-wise composition of houses as 99.10% of the total households are pucca houses, 0.68% semi-pucca houses and 0.22% kutcha type of houses.
Statement 14.3
CONDITION OF CENSUS HOUSES
Item No. House-list Item
Absolute number Percentage
Total Rural Urban Total Rural Urban
1 Total house 33,13,904 78,692 32,35,212 100.0 100.0 100.0
2 Good 21,81,500 43,489 21,38,011 65.8 55.3 66.1
3 Liveable 10,39,572 32,234 10,07,338 31.4 40.9 31.1
4 Dilapidated 92,832 2,969 89,863 2.8 3.8 2.8 Source: Census of India 2011
2.5 Ownership of houses in Delhi is also high with 68% of the households having own houses and 32% living in rented premises (2011 Census). New Delhi, being the only District, having a higher share of rented than owner occupied housing.

ECONOMIC SURVEY OF DELHI, 2017-18198
Statement 14.4
Districts Ownership statusOwned – households Rented - households Other - households
NCT of Delhi 68.2 28.2 3.6North-West 72.5 24.1 3.4
North 69.2 26.4 4.3North-East 75.3 23.3 1.4
East 68.3 28.6 3.1New Delhi 13.0 56.6 30.4
Central 70.7 24.7 4.6West 73.1 23.4 3.5
South-West 58.1 38.0 3.8South 63.5 32.8 3.7
Source: Census of India 2011
2.6 It is mentioned in the report on Housing Conditions in Delhi (69th Round of National Sample Survey) the distribution of households by type of structure of houses in Delhi was good, more than ninety per cent of the households in Delhi are in the category of pucca during July 2012-Dec. 2012. Statement 14.5 provides results relating to the type of the structure and some perceptions about the condition of the structure of the households separately for each type of structure. The survey revealed that in rural areas of Delhi 99.18% of the total households were residing in pucca houses, 0.01% in semi-pucca houses and 0.81% in kutcha type of houses.
Statement 14.5
HOUSEHOLDS BY TYPE OF STRUCTURE OF HOUSES:
S. Type of Structure
Condition of StructureNo Good Satisfactory Bad Total
1Pucca 2374529 1403898 134292 3912719Per cent 99.91 98.25 94.03 99.10
2Semi Pucca 2051 21214 3592 26857
Per cent 0.09 1.48 2.51 0.68
3All Kutcha 0 3837 4941 8778Per cent 0 0.16 0.21 0.22
Total 2376580 1428949 142825 3948359Per cent 60.19 36.19 3.62 100.00
Source: - Housing Conditions in Delhi, NSS 69th Round July 2012-Dec. 2012, Directorate of Economics and Statistics, Government of NCT of Delhi
2.7 Ownership of houses in Delhi is also high with 68% of the households owning houses and 28% living in rented premises (2011 Census). The District-wise data reveals that housing ownership is more in Northern than in Southern Districts, New Delhi being the only District having a higher share of rented than owner occupied housing.

ECONOMIC SURVEY OF DELHI, 2017-18 199
2.8 As per the 69th NSS Round on urban slums in Delhi, conducted by Directorate of Economics and Statistics, the estimated number of urban slums in Delhi during July 2012-Dec. 2012 is that 61.11% households were found to be residing in owned dwellings, 4.51% in employer provided, 3.18% in rented dwellings with written contracts, 24.90% in rented dwellings without written contracts and remaining 6.30% having other arrangement in Delhi.
Statement 14.6
HOUSEHOLDS BY TYPE OF OWNERSHIP BY 69TH NSS ROUND
S.No
Category Number % age
1
Owneda. Freehold 1991554 50.44b. Leasehold 421107 10.67Total 2412661 61.11
2
Renteda. Employer Quarter 178188 4.51b. With Written Contract 125469 3.18c. Without Written Contract 983127 24.90Total 1286784 32.59
3 Others 248914 6.30Total 3948359 100.00
Source: Housing Conditions in Delhi, NSS 69th Round July 2012-Dec. 2012, Directorate of Economics and
Statistics, Government of NCT of Delhi
2.9 Delhi Government is only one of the many players in the Housing Sector because land, land development and public housing are under the jurisdiction of the Delhi Development Authority under the Ministry of Urban Development, GoI. However, with the launching of Jawahar Lal Nehru National Urban Renewal Mission (JNNURM), Delhi Government got engaged in the construction of houses for economical weaker sections. However, given the huge size of targeted population, the Government initiative would be limited due to the fact that availability and allotment of land is under DDA. In order to cater to a projected population of 23 million by 2021, Delhi Master Plan Document (MPD-2021) is planning to add 20 lakh new dwelling units over the period 2001 to 2021, out of which 54% of the units would be for EWS category.
2.10 As per Master Plan Document 2021, projections for housing as under:

ECONOMIC SURVEY OF DELHI, 2017-18200
Chart 14.2HOUSING PROJECTIONS UNDER MPD 2021
2.11 Pradhan Mantri Awas Yojana – Housing for All (Urban): The mission seeks to address the housing requirement of urban poor including slum dwellers through following programme verticals:
a) Slum rehabilitation of Slum Dwellers with participation of private developers using land as a resource
b) Promotion of Affordable Housing for weaker section through credit linked subsidy
c) Affordable Housing in Partnership with Public & Private sectors
d) Subsidy for beneficiary-led individual house construction /enhancement.
3 Basic Facilities
3.1 One of the duties of the State is to provide all its citizens with adequate access to basic services like Water, Sanitation, Electricity and Transport. As per 2011 Census data, provisioning of basic services in Delhi improved significantly over the last decade. There is a near universal electrification and 99% of the households have access to sanitation facilities. The supply of drinking water by Delhi Jal Board now reaches 81% of the households against 75% 10 years ago. Less than 1% of the households are without both toilet and electricity facilities. There is a significant improvement in the availability of basic

ECONOMIC SURVEY OF DELHI, 2017-18 201
services in Delhi as depicted in the statement 14.7:
Statement 14.7
AVAILABILITY OF BASIC FACILITIES IN DELHI
S . No Items
2001 Census(in lakh)
Percentage of Total
Households
2011 Census(in lakh)
Percentage of total
Households1. Electricity 23.72 92.86 33.11 99.12. Toilet facility 19.91 77.96 29.91 89.53. Electricity and Toilet facility 18.74 73.77 29.80 89.2
4. Electricity available but no toilet facility 4.98 19.49 3.31 9.9
5. Toilet available but no electricity 1.17 4.59 0.11 0.3
6. No electricity and toilet facility 0.65 2.55 0.19 0.6
7. Water supply(i) Piped water supply 19.24 75.33 27.17 81.3(ii) Hand-pumps/tube-wells 5.60 21.91 4.58 13.7(iii) Wells 0.01 0.04 0.03 0.1
(iv) Other sources (river/canal/tanks) 0.69 2.72 1.63 4.8
Source: Census, 2011
4 Unauthorized Colonies
4.1 Unauthorised colonies in Delhi pose a serious human problem as a huge population is living in these colonies. They are demographically heterogeneous and more than two or three decades old with semi pucca (semi permanent) two or three storey brick structures, with low levels of basic service delivery, especially water and sewerage.
4.2 During 1993, a list of all unauthorized colonies in Delhi was prepared by Urban Development Department, which indicated that there were 1071 such unauthorized colonies. Due to litigation and other policy issues, no decision could be taken about regularization of such colonies. Government of Delhi started a Plan Scheme in 1997-98 for providing minimum civic services i.e. construction of road, roadside drain and filling up of low lying area so as to maintain hygienic conditions in these colonies. To meet the expense on provision of water supply, sewerage, roads, drains, sanitation and street lighting etc, expenditure about 6886.92 Crore has been incurred till March 2017.
4.3 It is estimated that in Delhi there are 1797 Un-authorised Colonies, which are to be regularized as per government policy. These have about 40 lakh population which needs to be effectively incorporated in the mainstream of urban development. This requires provision of infrastructure services and facilities for which differential norms and procedure

ECONOMIC SURVEY OF DELHI, 2017-18202
have been devised.
4.4 The Delhi Government and its agencies, Delhi State Industrial and Infrastructure Development Corporation (DSIIDC), Department of Irrigation and Flood Control (I&FC), Delhi Jal Board (DJB), Public Works Department (PWD) and Municipal Corporations of Delhi (MCDs) are providing services in the regularized unauthorized colonies. Delhi government had distributed provisional regularization certificates to 895 unauthorized colonies in 2008. However, in only about 70 colonies development work had been carried out. About 580 of these colonies had come up on government land and another 300 came up on private land but have some plots on government land.
4.5 DSIIDC has been carrying out the task of developing infrastructure in unauthorized colonies in Delhi for more than a decade. As per new guidelines circulated by Govt. in December, 2015, it was decided that for the purpose of carrying out development work, no distinction should be made about the colonies eligible for regularization under the regulation for regularization of unauthorized colonies and other colonies. Development work should be undertaken in all the unauthorized colonies.
4.6 GNCTD has mandated DSIIDC to carry out the necessary development activities for the construction of roads and storm water drain in all the 1797 unauthorized colonies in March 2016, Development work in 760 unauthorized colonies has been completed by DSIIDC and other agencies of GNCTD. It was decided that during the first phase, development works will be taken in all those colonies where no development work has been taken up during the last five years and the colonies which has become eligible as per the guidelines circulated by the GNCTD. Accordingly 509 numbers of colonies were finalized for taking up the development work in the first phase.
4.7 Work amounting to 200 crore in 86 colonies have been completed whereas work amounting to 505 crore is under progress covering 124 colonies and work amounting to 96 crore are under tender covering 20 colonies and estimate amounting to 1246 crore
covering 279 colonies have been prepared for taking up the balance work in remaining colonies by DSIIDC.
5 Slum Free City
5.1 In Delhi three million people live in slums, almost without hygienic sanitation, drinking water facility and a clean place to urinate and defecate. The public and individual toilet facility, particularly for women and children, is a critical area of concern.
5.2 There are 2423 slum Katras under DUSIB. These properties were transferred to the then Slum and J.J. Department, MCD (now DUSIB) by then Ministry of Rehabilitation (MOR), Govt. of India in the year 1960. These were built up properties occupied by licensees who continued to reside on perpetual license basis. There are 362 villages in Delhi, out of which 135 have been notified as urban villages under section 507 of the Delhi Municipal Corporation Act, 1957 and the remaining 227 continue to be rural villages.
5.3 With the aim of making Delhi a slum free city, the Delhi Government has, in its Approach Paper of 12th Five Year Plan, outlined mission objectives that embrace human development goals, irrespective of class and status. These goals includes environmental sustainable urbanization, provisioning of basis amenities in all the habitats irrespective of their status, urbanization for more inclusive growth with provisioning of

ECONOMIC SURVEY OF DELHI, 2017-18 203
social services, skill development and policy initiatives for productive employment for EWS workers and convergence of all programmes to make Delhi slum free city.
5.4 According to Census of India 2001, 16.3% of urban households were residing in slum of NCT of Delhi, whereas in India, this is 14.8%. This clearly shows that percentage of slum households in NCT of Delhi was higher than the national average in 2001. In 2011, there was proportion of slum households reduced to 11.3% in Delhi by 2011, whereas, it increase to 17.7% countrywide. It clearly indicates that Government of NCT of Delhi has managed to reduce the slum dwellers in the State. The reduction of slum dwellers in the NCT of Delhi has been a result of consistent efforts by GNCTD.
5.5 DUSIB is planning to rehabilitate all 99 JJ Bastis inhabited on DUSIB land, assembly constituency wise or group of assembly constituency wise in a phased manner. The basic principle of rehabilitation of JJ dwellers has been considered to be rehabilitated within a radius of 5 km and within the same assembly constituency or nearby assembly constituency. Rehabilitation beyond 5 km shall be in exceptional cases where rehabilitation is not feasible within 5 km.
5.6 The minimum basic amenities are currently being provided in all the slum clusters. A number of schemes like “Pay &Use Jan Suvidha Complexes”, “Basti Vikas Kendras” to meet the social consumption requirements of slum dwellers, “Sishu Vatika” etc. to create space for slum children is under implementation for betterment of lives of slum dwellers.
5.7 DUSIB is providing the built up space in JJ Bastis in the shape of BVKs (300 nos) for provision of integrated package of services under social consumption sector. These are also allotted to NGOs / Charitable organisations for extending facilities like health care, skill up-gradation and educational/ vocational programmes to the JJ dwellers.
5.8 Under the Clean Delhi-Green Delhi initiative of the Delhi government and to protect open land pockets from encroachments, 400 Shishu Vatikas and parks are envisaged in JJ Bastis/resettlement colonies to contribute towards green Delhi. In the next 3 years, DUSIB shall develop Shishu Vatikas through its Horticulture Division, in all except those JJ Bastis identified for redevelopment/re-location.
Jhuggi Jhopri Bastis/ Cluster
6.1 The inception of slums or jhuggi jhopri basties/clusters started with the development of cities. In Delhi the formation of slums observed even before Independence. The main reasons behind the formation of slum basties/ clusters were due to various factors such as flow of migrants from neighboring states for livelihood and employment. The condition was manageable before 1970 and most of slums were resettled. After 1970, the high pace of development of Delhi and slow development in other states in northern India speeded up the flow of migration to Delhi resulting in massive increase in slum and J.J. bastis/ clusters.
6.2 The exact number of JJ bastis/ clusters was enumerated in a survey conducted by Government of Delhi in 1990. The survey report mentioned that there were 929 slum bastis/ clusters and around 2.59 lakh households in Delhi. Delhi Urban Shelter Improvement Board estimated the number of jhuggi jhopri bastis/ clusters and slum population of Delhi during the year 2010. It is estimated that there are 675 slum bastis/ clusters with 4 lakh households having a population of 20 lakh in Delhi.

ECONOMIC SURVEY OF DELHI, 2017-18204
6.3 The 69th round of NSS survey, inter-alia, include the subject on condition of urban slums. Unlike the previous surveys conducted under the NSS rounds, where the information was collected from each selected household, information on the civic facilities of the slums was collected from one or more knowledgeable persons in respect of each of the selected slums. About 6343 slums with approximately 10.20 lakhs households were estimated to be in existence in urban Delhi in 2012. Average 161 households per slum were found to be in these slums.
6.4 About 90% of slums were built on public land, owned mostly by local bodies (46%), railways (28%) and state government (16%), etc. 16.19% of the slums have cropped up along nallah/drain, around 27.64% along railway lines, approximately 27.73% at open places/parks and the remaining 28% of the slums at other places. About 74.46% slums are surrounded by residential areas, 3.36% by industrial areas, 0.66% by commercial areas and rest by other type of areas. 54.91% of slums are composed of pucca structure, 29.47% semi pucca and only 15.62% of slums were having unserviceable katcha structure.
6.5 For 86.50% of slums, the major source of drinking water was either tap or hand pump. The most of the residents of about 30% of the slums are using septic tank/flush type of latrine facility. At the other extreme, 22% slums did not have any latrine facility at all. Underground sewerage existed in only about 16.30% slums. About 98.38% of the slums were having underground/covered pucca/open pucca/open katcha drainage system. Only 1.62% of the slums were having no drainage system.
6.6 Local bodies were collecting garbage from 31.45% of slums. Out of the slums in which garbage collection is done by local bodies, the frequency of the collection was 37% on daily basis, while in 32% of slums garbage was collected atleast once in two days, once in 3 to 7 days in 29% slums and once in 8 days to 15 days in 0.68% of slums and remaining 2% falls in other category having no regular mechanism for garbage disposal.
6.7 About 48% of the slums had a motorable (Pucca /Kutcha) approach road. About 77% of slums were having pucca road/lane/path within the slum. About 16.76% of slums were electrified with both street light and household use, 23.90% for household use only, 58.96% for street light only, while in 0.38% of slums there was no electricity. About 86.74% of the slums were having primary schools in the proximity of less than 0.5 km.
6.8 About 19.28% of the slum clusters were having the government hospital within a distance of 0.5 km, 28.33% in the distance 0.5-1 km, 36.31% in the distance 1-2 km, 14.27% in the range of 2-5 km and 1.81% slum clusters are covered by government hospitals in the distance of 5 km and above. About 9.30% of the slums were usually affected by water logging (inside of slum as well as approach road also) during monsoon. About 4% of the slums in Delhi were having associations either formal/informal for improving the condition of the slums formed by the slum dwellers themselves.
7 Delhi Urban Shelter Improvement Board (DUSIB)
7.1 Delhi Urban Shelter Improvement Board has come into existence under Delhi Urban Shelter Improvement Board Act, 2010, passed by the Legislative Assembly of the National Capital Territory of Delhi on the 01st April, 2010. The Delhi Urban Shelter Improvement Board has been nominated as nodal agency for the implementation of scheme of relocation/rehabilitation of Jhuggi Jhopri clusters in Delhi like improvement of environment, relocation and in-situ development of slums in Delhi.

ECONOMIC SURVEY OF DELHI, 2017-18 205
7.2 DUSIB is primarily responsible for the qualitative improvement of slum settlements and providing various kinds of services for slum dwellers in the city. It also undertakes works relating to provision of shelters to the urban poor / slum dwellers under the policy for relocation of slum and JJ dwellers, including the provisions of built up flats under exceptional circumstances, when the properties / katras become dangerous / unfit for human habitation. The main thrust is to provide minimal civic infrastructural facilities like toilets, bathrooms and Basti Vikas Kendras (Community Centre’s) in JJ Clusters.
7.3 The broad activities of DUSIB are as follows;
Construction, Management and Maintenance of Night Shelters.Construction of low cost Housing under EWS for Slum dwellers under Jawahar Lal
Nehru National Urban Renewal Mission (JNNURM).Relocation of squatters.In-situ up-gradationEnvironmental Improvement in Urban Slums. Construction of Pay and Use Jansuvidha (Toilet) Complexes. Construction of Basti Vikas Kendras / Community Halls.Structural Improvement and Rehabilitation of Katras.Work on behalf of Trans Yamuna Area Development Board.
7.4 MPD-2021 Mandates In-situ slum rehabilitation, including using land as a resource for community and private sector participation;
In order to prevent growth of slums, mandatory provision of EWS housing/slum rehabilitation in all group housing to the extent, minimum 15% of the proposed FAR on the plot.
Housing for urban poor to the extent of 50-55% of total;
Recategorisation of housing types, development control norms and differential densities to make EWS/LIG housing available and economical.
Shift from plotted housing to group housing for optimal utilization of land;
Private sector participation for development/ redevelopment of housing;
Removing unnecessary controls (like height) for optimum utilization of land and to facilitate creation of ‘signature’ projects.
Enhancement of ground coverage, FAR and height for residential development.
MPD-2021 envisages that for in-situ rehabilitation of JJ bastis, a maximum of 40% land can be used as a resource and minimum of 60% of land has to be used for in-situ redevelopment to rehabilitate JJ dwellers.
7.5 In-situ development shall be the preferred option, to ensure that development does not lead to a loss of job linkage or additional hours and income lost on commuting to work; where relocated, there will be emphasis on active intervention to provide mobility or recreating livelihood linkages. Implementation of slum up-gradation may however be phased out and paced as per the financial and resource capacity of the state/ city.
7.6 In order to implement the provisions of rehabilitation policy for rehabilitation of JJ dwellers, DUSIB has designed an in-situ rehabilitation plan for slum dwellers.

ECONOMIC SURVEY OF DELHI, 2017-18206
• Initially in-situ redevelopment of JJ Basties at 15 sites is proposed, which include 3 sites at Sangam Park, 3 sites at Sultanpuri, one site each at Sikri Bhatta/Shyam Nagar, F-block Ragubir Nagar, Lajpat Nagar, Bhalaswa Jahangir puri , Dev Nagar, Ambedkar Nagar , Jungpura and 2 sites at Mangolpuri.
• A total of more than 12,000 flats are proposed to be constructed under the scheme.
• 45 JJ Bastis having household about 18000 shall be rehabilitated in these flats including 7400 flats at Bhalswa Jhangirpuri and 1060 at Sultanpuri.
7.7 MAKING SLUM AND JJ BASTIS OPEN DEFECATION FREE
7.7.1 There are 675 Slum & JJ Bastis in Delhi having more than 3 lakh Jhuggies. As per the survey conducted by DUSIB in April 2016, 253 Open Defecation spots got identified at 216 locations. DUSIB has assessed total requirement of 36600 WC toilets based on the guidelines of Swachh Bharat Mission of 1 set for 30 persons.
7.7.2 There are 18559 WC seats available in 592 complexes in these Bastis and 2728 WC seats of DMCs are available nearby. DUSIB is constructing 75 new toilet complexes having 3283 WC seats and procuring 20 MTVs having 200 WC seats and 360 Portable rickshaw toilets. Thus by 31.03.2018, about 25,130 WC seats would be available to serve the poor people in JJ Bastis in Delhi.
7.7.3 Existing toilet complexes are getting improved and new toilet complexes are built with innovative design. All signage have been standardized, improved and made more informative. DUSIB has also planned portable mobile toilets for those locations where there are no water and toilet facilities. These toilets will have chemical technology to recycle the water for flushing and collection and discharge of sludge in nearby sewerage system after 70/80 uses.
7.7.4 DUSIB has requested all land-owning agencies to issue NOC to it for construction of toilets in JJ Bastis.
7.7.5 Making Community Toilets available to Slum Dwellers ‘Free of Cost’. As per the decision taken in the 20th Board Meeting of DUSIB, DUSIB has waived off the user charges in respect of complexes under DUSIB in all JJ Bastis and all the toilets of DUSIB have been made free from user charges w.e.f. 01.01.2018. These toilets remain 24x7 hours open for public use.
8 EWS HOUSING
8.1 Under Sub Mission-II Basic Services for Urban Poor (BSUP) of JNNURM, Government of India had approved 8 Projects of DSIIDC, 6 projects of DUSIB and 1 Project of NDMC with the revised cost of 2514.27 crore for construction of 52584 dwelling units. The construction of 24504 flats has been completed and 28080 flats are under different stages of construction. Only 1886 units got occupied by the end of December, 2017. The issues and problems for low occupancy are very low eligibility rate qualifying for getting the dwelling unit, non-availability of required peripheral infrastructure facilities, apprehension of allottees of losing livelihood after shifting etc.. Other issues for in situ development of JJ clusters are lack availability of land for providing alternate accommodation to the JJ dwellers for development of the colony.

ECONOMIC SURVEY OF DELHI, 2017-18 207
8.2 DUSIB has constructed 10684 EWS houses at Dwarka, Sultanpuri and Sawda Ghevra. 7400 EWS houses are under construction at Bhalswa which are likely to be completed by 31.03.2018. The DSIIDC has constructed 17,660 EWS houses under JNNURM and 16,600 EWS houses are under construction at various locations in Delhi, viz., Pooth Khurd, Baprola, Bawana, Narela, Ghoga and Bhorgarh.
9 NIGHT SHELTERS
9.1 Besides, coordinating the EWS Housing projects, DUSIB also look after the services of night shelters in Delhi. There are a total number of 263 night shelters (83 permanent shelters, 115 shelters in porta cabins) and 64 running in tents and one are in subway (AIIMS). The total capacity has been enhanced to 20,984 during 2017-18. It is ensured by DUSIB that there is availability of electricity and water, adequate number of clean toilets, blankets, daris, jute mats, heater, geysers and colour T.V. etc. to serve the people in the night shelters.
9.2 Special provisions should be made for the homeless, women and children including the differently-able, orphans and old age persons by adopting innovative concepts such as integrated complex with commercial space on the ground floor and night shelters on the first floor.
9.3 Medical facilities are also provided in the night shelters. In 10 Night Shelters, 250 candidates took training for different courses/activities and out of that, Ist batch of 175 candidates got passed and certificates were issued to 113 candidates by Hon’ble Dy. CM of Delhi.
10 Trans Yamuna Area Development Board
10.1 For development of Trans Yamuna area in a proper, speedy and sustained manner, Trans Yamuna Area Development Board (TYADB), an advisory Board was constituted in 1994. The Board approves and recommends works for the development of infrastructure in Trans Yamuna area. Various agencies are involved in the development of infrastructure facilities in Trans Yamuna area such as Delhi Jal Board, Municipal Corporation of Delhi, Public Works Department, Department of Irrigation and Flood Control and Urban Development. After the inception of Board, most of the activities relating to the development of infrastructure in Trans Yamuna area are coordinated by the Board. The agency-wise expenditure of TYADB during 2008-09 to 2016-17 is presented in Statement 14.8

ECONOMIC SURVEY OF DELHI, 2017-18208
Statement 14.8
AGENCY-WISE EXPENDITURE OF TYADB: 2008-2017 ( Crore)
S . No. Name of Agency 2008-09 2009-10 2010-11 2011-12 2012-13 2013-14 2014-15 2015-16 2016 -17
1 Delhi Jal Board (DJB) 15.17 23.00 17.00 15.75 15.72 3.00 2.00 -- --
2M u n i c i p a l Corporation of Delhi (MCD)
72.60 40.00 39.93 60.00 70.00 109.86 80.00 30.00 --
3Public Works D e p a r t m e n t (PWD)
0.28 0.01 - 0.47 4.82 0.05 0.09 -- --
4
Irrigation & Flood Control D e p a r t m e n t (I&FC)
10.93 15.00 9.78 10.00 18.93 19.99 22.71 -- --
5
U r b a n Development D e p a r t m e n t (UD)
- - - 2.50 - - -- -- --
6Delhi Urban S h e l t e r Improvement Board (DUSIB)
- - - - - -- 5.50 -- 2.00
Total 98.98 78.01 66.71 88.72 109.47 132.90 110.30 30.00 2.00Source: Urban Development Department, GNCTD
10.2 In the current financial year 2017-18, 56th meeting of the TYADB was held on 28.11.2017 and 27 proposals amounting to 34.76 Crore has been recommended for the developmental works in Trans Yamuna Area.
11 Development of Walled City- Delhi
11.1 For maintaining the original heritage character and to improve the environment in the walled city area, a comprehensive redevelopment plan has been prepared. It involves the active participation of governmental and non-governmental agencies and professionals for rejuvenating and maintaining the heritage areas. For ensuring the development of Walled city of Delhi, the Shahjanabad Re-development Corporation has been established. The major activity of the Corporation is to promote conservation of built and natural heritage in the National Capital Territory of Delhi which needs to be protected, nourished and maintained by all citizens. The corporation is to conserve the civic and urban heritage those are architecturally significant and are having socio-cultural value without any profit to do.

ECONOMIC SURVEY OF DELHI, 2017-18 209
11.2 The project for Redevelopment of Chandni Chowk was approved at an estimated cost of 47.26 crore for improvement of roads, making all overhead hanging wires and services underground, improving traffic circulation and for restoring heritage character of Chandni Chowk area.
12 Centrally Sponsored Scheme (CSS)
12.1 Atal Mission for Rejuvenation & Urban Transformation (AMRUT)
12.1.1 Ministry of Urban Development, Govt. of India launched a centrally sponsored scheme AMRUT (Atal Mission for Rejuvenation & Urban Transformation) on 24th June, 2015. The purpose of the Mission is to create infrastructure that would have a direct impact on the real needs of people by providing water & toilet connection to each household. As per MoHUA, Govt. of India, Delhi has been divided into four AMRUT Cities, i.e. North Delhi Municipal Corporation, South Delhi Municipal Corporation, East Delhi Municipal Corporation and New Delhi Municipal Council. Since, the water & sewerage are not being dealt by DMCs, therefore, the DJB as a parastatal agency has been entrusted for executing projects of water & sewerage in all the DMC areas.
12.1.2 The AMRUT scheme envisages preparation & submission of “Service Level Improvement Plan” (SLIP) by which the ULBs have to determine the gaps in the delivery of service & therefore filling-up of these gaps are called SLIP(s). Hence, the evaluation of a project comes through filling-up of the gaps and preparing SLIP(s) for the mission components (Water, Sewerage, Storm Water Drainage, Developing greenery & Parks, Urban Transportation, which includes construction of pathways, cycle track, footpath, foot over bridge, non-motorized transport, multilevel parking, etc). After submission of SLIP(s) the state govt. has to compile the SLIP(s) and aggregated SLIP(s) takes the shape of “State Annual Action Plan” (SAAP). The same has to be submitted before the SHPSC under the chairmanship of Chief Secretary, Govt. of NCT of Delhi. After the SAAP is approved by SHPSC (State Level High Powered Steering Committee), it is to be submitted to APEX Committee Chaired by Secretary, MoUD, GoI for final approval. 2.50% of the total SAAP size is mandatory for the greenery projects.
Mission Period is from FY 2015-16 to 2019-20.
The funds under AMRUT are 100% released by Govt. of India in three installments in the ratio of 20:40:40, details are as under: The first installment (20%) is released immediately after approval of the SAAP by the Apex Committee. The second and third installments (40% each) are released on receipt of (i) Score Card, (ii) Utilization Certificates, and (iii) Project Funds Request.
The details of allocation of funds & projects approved for the Mission period are given in statement 14.9

ECONOMIC SURVEY OF DELHI, 2017-18210
Statement 14.9
( Crore)
SAAP Year Cost of Earmarked Projects Approved Cost Number of Projects
Sanctioned
2015-16 226.15 223.07 06
2016-17 267.60 265.73 10
2017-18 313.51 313.51 09
Total 807.26 802.31 25 Source: - Urban Development Department, GNCTD
12.1.3 AMRUT scheme also envisages enhancing the capacity of individuals through organizing Capacity Building Programs by the empanelled agency as per the list of MoUD, GoI. This Deptt has shortlisted three training entities i.e. (i) Indian Institute of Public Administration (IIPA), New Delhi, (ii) Centre for Science & Environment, Delhi and (iii) Indian Institute of Human Settlements (IIHS), Bangalore.
12.1.4 The implementation of Reforms is one of the key elements of AMRUT. The Govt. of NCT of Delhi has achieved most of the reforms mentioned in the AMRUT guidelines. Credit Rating of the ULBs is also a part of reforms mentioned under AMRUT guidelines which is to be done by an agency empanelled by MoHUA, GoI to assess the financial capability of ULBs. The three DMCs have appointed ICRA for Credit Rating.
12.1.5 Energy efficiency for water pumps and street lights also comes under Municipal Reforms. In this regard, a MoU (Memorandum of Understanding) has to be signed between EESL and Urban Development Department, GNCTD. The process has already started for signing the MoU. As regards, street lighting, all three DMCs have appointed agencies for conversion of street lights into “LED”, and the work is in progress.
12.2 SMART CITY MISSION
12.2.1 The Ministry of Urban Development, Govt. of India launched the Smart City Mission in the month of June, 2015 for which Delhi has been allocated one Smart City. The Smart City Plan (SCP) of a city contains the city vision statement, strategy and the model chosen–retrofitting/ redevelopment/green field/pan city and smart solutions etc, the proposal for financing the smart city and the revenue model to attract private participation.
12.2.2 The selection process of Smart City under the Smart City Mission is a two stage processes. In the stage-1, the State Governments invited all the three Delhi Municipal Corporations and New Delhi Municipal Council to participate in the Smart City Mission, wherein only New Delhi Municipal Council (NDMC) was selected. The NDMC has been selected by MoUD after due recommendations by the State Level High Powered Steering Committee (HPSC) under the Chairmanship of Chief Secretary.
12.2.3 The NDMC has established a wholly owned Public Limited Company namely, New Delhi Municipal Council Smart City Limited (SPV). The SPV has received a grant of 194 Crores from MoUD, GoI and 100 Crores from NDMC. Out of 294 crore seed capital of 250 Crore has been created and rest amount used as grant.

ECONOMIC SURVEY OF DELHI, 2017-18 211
12.2.4 NDMC has constructed 28 Roll Call Centers, wherein facilities of attendance, drinking water, rest-area, separate men/women toilets have been provided, which is one of its first kind project in the Country.
12.2.5 NDMC has attained a credit rating of AA+ by CARE in 2016.
12.3 National Urban Livelihood Mission (NULM)
The National Urban Livelihood Mission (NULM) was launched in 2014 by Govt. of India with the objective to reduce poverty and vulnerability of the urban poor households by enabling them to access gainful self-employment and skilled wage employment opportunities, resulting in appreciable improvement in their livelihoods on a sustainable basis, through building strong grass-root level institutions.
12.3.1 Samajik Suvidha Sangam/Mission Swaraj (SSS/MS) has been designated as State Urban Livelihood Mission (SULM) By UD Department, GNCT of Delhi to implement the centrally sponsored scheme, NULM in Delhi. The first meeting of the Executive Committee of SULM was held on 22.6.2017 under the Chairmanship of Chief Secretary, Delhi. In the Executive Committee (SULM) meeting, for identification of urban poor in Delhi, as beneficiary for the components of NULM, the eligibility criteria as per the guidelines of Pradhan Mantri Awas Yojana (PMAY-a scheme of Ministry of HUPA, GoI) has been approved. A proposal for concurrence of Ministry of HUPA, GoI is being submitted.
12.3.2 Salient Features and progress of various components of NULM are given in statement 14.10:

ECONOMIC SURVEY OF DELHI, 2017-18212
Statement 14.10
S.No.
Component Salient Features Progress under the scheme
1. Employment through Skills Training & Placement (EST & P)
•Provide training through NSDC or State Training Providers (STPs).
•Placement and Post Placement assistance is to be provided to successful candidates.
• As per guidelines, states can empanel government institutes, training providers of National Skill Development Corporation (NSDC) and training providers engaged by other Government Agencies for the purpose of skill training. List of 10 such training providers (associated with NSDC) has been obtained. Department of Training & Technical Education have also identified 23 training providers.
2. Self-Employment Programme (SEP)
• Financial assistance in the form of interest subsidy on the bank loan (individual loan limit: 2 Lakh and Group enterprise
loan limit: 10 Lakh Interest subsidy over and above 7% rate of interest will be available on a bank loan for setting up of single or group enterprise.
• District task force committees are being formed to identify and select the beneficiaries. These DTFCs will be constituted at the Revenue Districts under the District Magistrates concerned instead of ULBs, as approved by the Executive Committee of SULM, Delhi.
3. Social Mobilization and Institutional Development (SM&ID)
•Formation of SHGs and their federations, autonomous registered agencies may be engaged as Resource Organizations (ROs).
• A maximum of 10, 000/- per SHG may be spent for its formation, handholding, training, bank linkage, formation of federation and other related activities.
• 22 Resource Organizations have been empanelled under the SM&ID component for formation, handholding and establishment of Self Help Groups. MoUs have also been signed with the Resource Organizations.
4. Capacity Building and Training (CB & T)
•CB&T component includes technical support to be given at State and City levels by placing experts and support staff and facilitating training and other capacity building supports for Mission Management Unit (MMUs) at state and city levels for SULM.
•The proposal for sanction of requisite posts, as per the norms of the NULM is under submission to the Urban Development Department, GNCT of Delhi.

ECONOMIC SURVEY OF DELHI, 2017-18 213
S.No.
Component Salient Features Progress under the scheme
5. Shelter for Urban Homeless(SUH)
•Ensure availability and access of the urban homeless population to permanent shelters including the basic infrastructure facilities like water supply, sanitation, safety and security.
•Cater to the needs of especially vulnerable segments of the urban homeless like the dependent children, aged, disabled, mentally ill and recovering gravely ill, by creating special sections within homeless shelters and provisioning special service linkages for them.
•Under Shelter for Urban Homeless component of NULM, construction of 4 new shelters and refurbishment of 13 existing shelters has been initiated by DUSIB and 3 Crore released to DUSIB for the same.
6. Support to Urban Street Vendors (SUSV)
• Survey of street vendors and issue of Identity Cards and Development of city street vending plans
•Training and Skill Development, Financial Inclusion, Access to credit & Linkages to social security schemes
•Detailed Project Reports for the Street Vendors, as per the guidelines of NULM from ULBs are awaited.
12.4 Swachh Bharat Mission (SBM)
Swachh Bharat Mission (SBM) has been launched by the Govt. of India on 02.10.2014 with the objectives of elimination of open defecation, eradication of manual scavenging, scientific solid waste management and general awareness on sanitation among others.
12.4.1 Central financial assistance earmarked for Delhi for the entire mission period (2014-2019) is given in statement 14.11.
Statement 14.11
( in Crore)
IHHT CT SWM IEC CB Total
Earmarked 50.16 5.15 263.68 24.61 6.15 349.76
Released 25.08 5.15 10.84 10.84 0.21 104.75
Remaining 25.08 Nil 13.77 13.77 5.94 245.01
(IHHT- Individual Household Toilets, CT- Community Toilets, SWM- Solid Waste Management, IEC- Information Education & Communication, CB- Capacity Building)

ECONOMIC SURVEY OF DELHI, 2017-18214
12.4.2 Current Status of SBM activities
a. No funds under any component of SBM (Urban) could be claimed from MoHUA, Govt. of India in the F.Y. 2016-17 and in the current financial year due to non-submission of utilization certificates of funds.
b. About 50% of SBM fund laying unspent with the executing agencies. The major portion of unspent fund lies with the North DMC (78%) and East DMC (47%) particularly in IHHT and SWM component. Reason for poor utilization in IHHT is due to weak demand and that for SWM, their difficulty in providing matching contribution.
12.4.3 ODF Status
a. The New Delhi Municipal Council has been declared and certified ODF City on 24.11.2016 and re-certified on 24.05.2017 for six months. Delhi Cantonment Board has been certified as ODF on 15.12.2017. East DMC and South DMC are declared as ODF on 02.10.2017. The matter has been referred to MoHUA, Govt. of India for third party verification/certification.
b. The State High Power Committee on SBM under the Chairmanship of the Chief Secretary approved, in principle, the DPR submitted by South DMC for Waste to Energy Plant with 2000 TPD capacity at Okhala. Approximately, 125.00 Crore is requested from SBM Fund.
12.4.4 Regarding State Contribution
a. The State Share enhanced from 1333/- to 4000/- to encourage more IHHT beneficiaries.
b. Additional 12.00 Crore has been released to DUSIB for constructing 1312 CT seats. Approximately 12000 CTs, 380 IHHTs and 800 PTs have already been constructed during mission period. Approx 5500 MTPD (55%) of the total waste generated (10500 MTPD) is being processed by DMCs.
12.4.5 Status of Municipal Solid Waste Management, ODF Status and Disable friendly Toilets
Solid waste of 10,600 MTPD is collected and transported to three landfill sites and processing plants. Approximately 55% of the total generated waste is processed through Waste to Energy and Waste to Compost plants and rest is dumped in 3 Sanitary Lanfill Sites (SLFs).

ECONOMIC SURVEY OF DELHI, 2017-18 215
Statement 14.12
Waste Scenario in Delhi (MTPD)
ULBsMSW Generated (MTPD)
Waste Processed (MTPD)
MSW Processing Facility
Waste Dumped at SLF (MTPD)
East DMC 2800 1300
12 MW WTE plant, Ghazipur
1000 (Ghazipur SLF)
North DMC 4000 2000
24 MW WTE & 150 WTC Plant at Narela-Bawana
2200 (Narela-Bawana SLF)APMC 200 0
South DMC 3300 2200
16 MW WTE and 200 MTPD WTC plant at Okhla
1900 (Okhala SLF)
1400 of SDMC & 500 of EDMC
NDMC 300 0
Total 10600 5500 52 MW 4500
Statement 14.13
ODF Ward Status
ULBs No. of Wards
ODF Wards Status
East DMC 64 64 Declared ODF on 02.10.2017
North DMC 104 104 Declared ODF on 31.12.2017
South DMC 104 104 Declared ODF on 02.10.2017
NDMC 14 14 Declared ODF on 24.05.2017
DCB 08 08 Declared ODF on 15.12.2017
Total 294 294

ECONOMIC SURVEY OF DELHI, 2017-18216
CHAPTER 15
EDUCATIONDelhi Government is persistently trying to improve the quality of education at various levels i.e. School Education, Higher Education, Technical and Professional Education. Education is the most priority sector of Government of Delhi. Various developmental programmes were implemented to improve the quality and accessibility of education. Government has put concerted efforts in recent times for skilling of the youth in a large scale by way of introduction of various skilling courses and vocationalisation of school education, augmentation of School infrastructure, improvement of learning outcomes, high quality teachers training & capacity building programme, improvement in school pedagogy are some of the focused areas where Delhi Govt. has been relentlessly work-ing to improve.
1.2 Govt. of Delhi has significantly increased the investment in Education Sector and the budget has been increased almost by 50% from 4799 crore in 2011-12 to 11,300 crore in 2017-18. This is the most priority sector for the Govt. which got the highest share of allocation i.e. 24% in 2017-18.
Statement 15.1
EXPENDITURE ON EDUCATION AS PERCENTAGE OF GSDP OF DELHI ( in Crore)
S. No.
Years Expen-diture
on Edu-cation
Total Bud-get of Delhi
% age share of Expendi-ture In total budget
GSDP of Delhi @ Cur-
rent Prices
% Expen-diture
on Edu-cation to GSDP of
Delhi
1. 2011-12 4798.76 26402.43 18.18 343797 1.40
2. 2012-13 5490.74 29858.80 18.39 391266 1.40
3. 2013-14 6169.11 34051.60 18.11 443803 1.39
4. 2014-15 6554.82 30940.10 21.19 494555 1.33
5. 2015-16 7755.89 37965.00 21.44 547784 1.42
6. 2016-17 (R.E) 9884.08 46600.00 22.94 616887 1.60
7. 2017-18 (B.E.) 11300.46 48000.00 23.54 686287 1.65
Source: - Budget Documents and DES
1.3 As per statement 15.1, the total expenditure (plan and non-plan) on education including sports, arts and culture increased from 4799 crore in 2011-12 to 11300 crore in 2017-18. The share of expenditure of Education in the total budget of Delhi Govt. has increased from 18% in 2011-12 to 24% in 2017-18. The Education expenditure to the Gross State Domestic Product of Delhi was the highest at 1.65 per cent in 2017-18. The year wise increase in expenditure on Education is shown through a chart 15.1.

ECONOMIC SURVEY OF DELHI, 2017-18 217
Chart 15.1
2. Expenditure on Education by States- State Budget Analysis by RBI
2.1 As per State Budget Analysis Report of RBI released in May 2017, Govt. of NCT of Delhi has the highest share of investment in education among all states. During 2016-17, Del-hi was at the top allocating 22.8 % of its budget estimates earmarked for the education sector followed by Assam (21%), Himachal Pradesh (19.1%) and Maharashtra (18.2%). The National Average is 15.6% in 2016-17.
2.2 The statement below depicts the share of expenditure on education by few States to their respective total aggregate expenditure during last six years.
Statement 15.2
INVESTMENT ON EDUCATION AS RATIO TO AGGREGATE EXPENDITURE
(In percent)
S.No States 2011-12 2012-13 2013-14 2014-15 2015-16 2016-171 Gujarat 15.8 14.3 15.0 15.2 15.5 14.1
2 Haryana 16.0 15.4 15.4 16.9 13.1 15.33 Karnataka 14.7 15.5 15.0 14.3 14.3 12.7
4 Kerala 17.7 17.2 17.2 16.4 15.3 15.35 Maharashtra 20.2 20.7 20.5 19.2 18.6 18.26 Assam 20.3 20.6 22.6 24.7 20.7 21.0

ECONOMIC SURVEY OF DELHI, 2017-18218
S.No States 2011-12 2012-13 2013-14 2014-15 2015-16 2016-177 Himachal
Pradesh17.8 17.3 17.8 17.7 18.5 19.1
8 Tamil Nadu 14.3 14.7 16.0 15.8 15.5 14.79 Uttar Pradesh 17.1 17.3 16.0 15.0 14.7 16.3
10 Delhi 18.0 18.3 18.1 21.2 21.2 22.8All States 16.3 16.4 16.5 16.0 15.4 15.6
Source: - State Budget Analysis Report from RBI site.
3. Literacy
3.1 Delhi has a variety of good quality schools, colleges and universities as well as centers for research and higher education. Its literacy rate at 86.2 per cent is substantially higher than the all India average of 73 per cent. Although there is gender gap in literacy, it has declined moderately over the years from 12.62 per cent in 2001 to 10.1 per cent in 2011. The literacy rate in Delhi is, however, still lower than the States like Kerala (94.0%), Mizoram (91.3%), Tripura (87.2%).
Literacy Rate in Delhi (In %age)
Census Male Female TotalLiteracy Gap
1991 82.01 66.99 75.29 15.022001 87.33 74.71 81.67 12.622011 90.90 80.8 86.20 10.10
Source: Delhi Statistical Handbook, 2017
3.2 The literacy in Delhi has continuously been improving and also the literacy gap has been decreasing. This is the outcome of the concerted efforts made in the Education Sector for Improvement through various programmes of the Government. There is an upward trend in the Literacy Rate for both male and female. The Literacy Rate of 75.29% in 1991 increased to 86.20 in 2011 Census. The cause of worry is still the gender gap of 10% between the male and female literacy which is to be addressed.
3. 3 Youth Literacy
Youth Literacy is defined as the percentage of population between 15-24 years who are capable of both reading and writing with understanding of a short simple statement in everyday life. Out of the total population, the share of youth population aged between 15-24 years is 20.61% in total population as per 2011 census. Youth literacy was 90.17 in 2001-02 which has gradually increased to 96.46 in 2011-12 as per the 68th National Survey Report (July 2011-June 2012).
3. 4 Youth Literacy as per NSSO Survey:
Higher literacy among youth is of great importance because they form the future of the nation and a good literate ratio of literate female points to gender parity and equal prospects for women.

ECONOMIC SURVEY OF DELHI, 2017-18 219
Statement 15.3
Round Period
Literacy Rate(in %age)
RatioMale Female Total
57th July 2001-June 2002 94.64 85.07 90.17 0.90
58th July 2002-Dec 2002 95.60 86.65 91.81 0.91
59th Jan 2003-Dec 2003 95.19 90.05 92.78 0.95
60th Jan 2004-June 2004 91.37 92.60 91.89 1.01
61st July 2004-June 2005 93.48 91.28 92.53 0.98
62nd July 2005-June 2006 95.76 85.59 91.17 0.89
63rd July 2006-June 2007 95.88 95.93 95.91 1.00
64th July 2007-June 2008 92.22 91.26 91.81 0.99
66th July 2009-June 2010 95.41 96.42 95.80 1.01
68th July 2011-June 2012 98.26 94.31 96.46 0.96Source: Millennium Source: Millennium Development Goals, Delhi State Report 2014
3.5 As shown in statement 15.3 that in 2001-02, the literacy rate in Delhi among males (15-24 years) was 94.64 percent against 85.07 percent for females in the same age group and the ratio of literate women to men was 0.90. The literacy rate of youth male and female varied from 91.37 percent to 98.26 percent and from 85.07 percent to 96.42 percent respectively during the period 2001-02 to 2011-12.

ECONOMIC SURVEY OF DELHI, 2017-18220
Chart 15.2
RATIO OF LITERATE WOMEN TO MEN (15-24 YEARS)
3.6 The above chart 15.2 shows that the ratio of literate females to males in Delhi during July 2011 to June 2012 was 0.96. It varied between 0.89 to 1.01 during year 2001-02 to 2011-12. Ratio of female literacy rate to male literacy rate exceeding 1 signifies higher literacy rate among females than males. Delhi is very close in attaining the universal literacy rate among youth with a gender parity of 1, but yet to achieve it. A little concerted push will help it in achieving the target but more important is to sustain the achieved target.
4. Network of Educational Institutions and Enrollment in schools run by all Management
The network of educational Institutions being run by all Management i.e. Local Bodies, Central Govt., Govt. of Delhi and that of private sector agencies is elucidated in statement 15.4:

ECONOMIC SURVEY OF DELHI, 2017-18 221
Statement 15.4
S. No. Items 2010-11
2011-12
2012-13
2013-14
2014-15
2015-16
2016-17
1 No. of Recognized Schools in Delhi (Government+ aided+ Unaided Schools)Pre Primary+ Primary
2613 2632 2629 2709 2806 2779 2735
Middle 588 600 564 728 933 940 933Secondary 480 463 458 389 385 393 400Senior Secondary 1392 1427 1504 1627 1674 1684 1704Total Schools 5073 5122 5155 5453 5798 5796 5772
2 Enrollment of Students (in lakh)Pre Primary+ Primary
18.80 19.73 19.81 20.22 20.83 21.02 20.83
Middle 9.83 10.10 10.63 11.16 11.16 11.20 11.27Secondary 6.34 6.79 6.44 6.44 6.52 6.92 7.41Senior Secondary 4.24 4.90 5.80 6.03 5.62 5.16 4.92Total Enroll-ment
39.21 41.52 42.68 43.85 44.13 44.30 44.43
3 No. of Teachers Pre Primary+ Primary
28876 28140 28466 28499 29708 29577 28989
Middle 7482 8029 7230 9316 11741 12315 12657Secondary 10859 10867 10755 9782 9370 10292 9401Senior Secondary 68255 71506 79275 89975 88661 93909 97224Total Teachers 115472 118542 125726 137572 139480 146093 148271
4 Student Teacher Ratio
34 35 34 32 32 30 30
Source: Directorate of Education, GNCTD
5. Network of Educational Institutions & Enrollment of Delhi Govt.
5.1 Delhi Govt. has total of 1228 government and government aided schools in Delhi, which is 21.27% of the total schools running in Delhi, whereas, the share of enrollment in gov-ernment and government aided schools is 37.92% of total enrollment of all schools in Delhi during 2016-17.
The status with respect to secondary and Senior Secondary schools functioning under the aegis of Govt. of Delhi is as under:

ECONOMIC SURVEY OF DELHI, 2017-18222
Statement 15.5
S. No.
Indicator 2012-13 2013-14 2014-15 2015-16 2016-17
A.1 No. of Delhi Govt. schools 969 992 1007 1011 1017
A.2 Total Enrollment (in lakh) 15.75 16.10 15.42 15.09 15.28
Boys 7.84 7.87 7.40 7.14 7.18
Girls 7.91 8.23 8.02 7.95 8.10
B.1 No. of Govt. Aided schools 216 211 211 211 211
B.2 Total Enrollment (in lakh) 1.65 1.65 1.63 1.68 1.57
Boys 0.90 0.90 0.87 0.85 0.83
Girls 0.75 0.75 0.76 0.83 0.74
C.1 No. of Un-Aided schools 2076 2277 2277 2113 1715
C.2 Total Enrollment (in lakh) 13.80 13.57 14.71 15.26 15.65
Boys 8.33 8.19 8.86 9.16 9.37 Girls 5.47 5.38 5.84 6.10 6.28
Source: Directorate of Education, GNCTD
Statement 15.6
Status of Basic facilities in Delhi Schools
Percentage of
Schools having access to
2010-11 2011-12 2012-13 2013-14 2014-15 2015-16 2016-17
Playgrounds 80.4 80.1 73.9 81.7 85.8 87.4 87.37Boundary wall 98.1 98.3 97.8 98.7 99.4 99.5 99.90
Girls Toilets 80.3 99.3 100 100 100 100 100.00Boys Toilets 79.9 100 100 100 100 100 100.00
Drinking Water Facility
100 100 100 100 100 100 100.00
Electricity Connec-tion
99 99.8 99.7 100 99.9 99.9 99.90
Computer Facility 83.2 93.4 77.9 81.6 81 83.9 87.18Source: Elementary Education in India, DISE Publications, NUPEA
6. Gross Enrolment Ratio (GER) / Net Enrolment Ratio (NER)
6.1 Gross Enrolment Ratio, is calculated as the ratio of the number of students in a given class or set of classes to the number of children in the given age group. Net Enrolment Ratio, on the other hand, is the enrolment of the official age group for a given level of education expressed as a percentage of the corresponding population of that age group.

ECONOMIC SURVEY OF DELHI, 2017-18 223
6.2 As per DISE Repot-2014, during 2012-13, the Gross Enrolment Ratio in Primary Educa-tion in Delhi was 117.8 % as compared to 106% at all India level.
6.3 It may be seen from the table below that the NER has been improved over the years from 77.80 in 2007-08 to 93.26 in 2015-16. Delhi’s position in NER during 2015-16 is 93.26 which is much higher than the National Average of 87.30. NER at the National level is on a decreasing trend during 2007-08 to 2015-16.
Statement 15.7
Net Enrolment Ratio in Primary Education
Year NERDelhi All India
2007-08 77.8 95.92008-09 90.6 98.62009-10 93.6 98.32010-11 96.3 -2011-12 96.3 99.92012-13 97.6 90.82013-14 92.30 88.082014-15 93.16 87.412015-16 93.26 87.30
(Source: DISE State Report Card: 2015-16)
6.4 As per the 71st NSS Survey-2016 (Jan-June 2014), the Net Attendance ratio of Delhi and all India is depicted in Statement 15.8 and chart 15.3.
Statement 15.8
6.5 The statement 15.8 and chart 15.3 shows that Net Attendance Ratio (NAR) of Delhi at all levels is higher than the NAR at all India level

ECONOMIC SURVEY OF DELHI, 2017-18224
Chart 15.3
6.4 Learning Achievement of Students
Average Score of students in different abilities as per National Achievement Survey 2014 is as follows:
Subject wise Performance of Students in Class V (Cycle 4)
Proficiency in Delhi National AverageBoys Girls Total Boys Girls Total
Reading Comprehen-sion
223 230 227 239 243 241
Mathematics 222 224 223 240 242 241
Environmental Stud-ies
223 224 223 243 245 244
Source: National Achievement Survey Summary, 2015 Class V (Cycle 4).
The Average Achievement Score of Delhi is below the National Average in Class V in Reading Comprehension and Environmental Studies.
Class X Subject wise Mean Achievement Score
Proficiency in Delhi National AverageBoys Girls Total Boys Girls Total
English 241 242 241 248 252 250Mathematics 245 237 240 250 250 250Science 244 242 243 250 250 250Social Science 249 252 250 250 250 250Modern Indian Language
258 269 264 246 254 250
Source: National Achievement Survey Summary, 2015.

ECONOMIC SURVEY OF DELHI, 2017-18 225
The performance of Delhi students is below the National Average in subjects like English, Mathematics and Science whereas it is equivalent to National Average for Social Sci-ence. The National Average under Modern Indian Language is higher than the National Average.
6.5 Share of Private Sector in Gross Enrolment
The share of private sector in school education in Delhi during 2013-14 to 2016-17 is given in the statement 15.9:
Statement 15.9
SHARE OF PRIVATE SECTOR IN SCHOOL EDUCATION
Year Schools
(Enrollment in lakh)Primary and
Middle
Secondary and Sr. Sec-
ondaryTotal
2013-14 Private Schools 12.04 3.40 15.44
Total Enrollment 31.40 12.45 43.85Share of Pvt. To total (%age) 38.34 27.30 35.21
2014-15 Private Schools 9.94 3.53 13.47
Total Enrollment 31.99 12.14 44.13Share of Pvt. To total (%age) 31.07 29.07 30.52
2015-16 Private Schools 10.34 3.62 13.96
Total Enrollment 32.22 12.08 44.30Share of Pvt. To total (%age) 32.09 29.96 31.51
2016-17 Private Schools 14.06 3.69 17.75Total Enrollment 32.10 12.33 44.43Share of Pvt. To total (%age) 43.80 29.93 39.95
Source: - Directorate of Education, GNCTD.
The above Statement shows that enrollment in primary and middle in private schools in-creased from 12.04 lakh in 2013-14 to 14.06 lakh in 2016-17. The percentage share of Private schools in total enrollment has also increased from 35.21 % in 2013-14 to 39.95% in 2016-17.
7. Performance of Delhi Govt. schools- Pass percentage
7.1 Pass percentage of students both in secondary and senior secondary level examination clearly depicts the improvement in education. The information regarding pass percentage of students both in secondary and senior secondary level in Delhi during 2010-2017 is pre-sented in the statement 15.10:

ECONOMIC SURVEY OF DELHI, 2017-18226
Statement 15.10
PASS PERCENTAGE OF CBSE RESULTS IN DELHI & INDIA: 2012-13 to 2016-17
S . No Area / Class Level 2012-13 2013-14 2014-15 2015-16 2016-17
1. Delhi
Secondary 99.45 NA 98.31 95.81 92.44
Sr. Secondary 88.65 NA 88.61 89.25 88.272. India
Secondary 98.76 98.87 97.32 96.21 93.06
Sr. Secondary 82.10 82.66 82.00 83.05 88.02
Source: - Directorate of Education for Delhi and Delhi Statistical Handbook, 2017
7.2 It may be inferred from above Statement that pass percentage at senior secondary level in Delhi is higher than the all India level during last 5 years. At the secondary level, there is a marginal difference in the pass percentage in Delhi as compared to All India CBSE results.
Statement 15.11
INVESTMENT ON SCHOOL EDUCATION
(In crore)
S. No.
Years Expenditure on Educa-
tion
Total Budget of Delhi
% share of Ex-penditure In to-tal budget
GSDP of Delhi @ Current Prices
% Expenditure on Education
to GSDP of Delhi
1. 2013-14 5732.89 34051.60 16.83 443803 1.29
2. 2014-15 6066.31 30940.10 19.60 494555 1.23
3. 2015-16 7144.93 37965.00 18.82 547784 1.30
4. 2016-17
(R.E.)
9252.34 46600.00 19.85 616887 1.50
5. 2017-18 (B.E.)
10383.37 48000.00 21.63 686287 1.51
Source: - Budget Documents and DES

ECONOMIC SURVEY OF DELHI, 2017-18 227
7.3 The Education expenditure to the Gross State Domestic Product of Delhi is the high-est at 1.51 percent in 2017-18.
8. Per Student Expenditure on Education
8.1 In Delhi, the per student per annum expenditure incurred by the government on edu-cation is likely to increase to 61,622 in 2017-18 (B.E.) from 54,910 in 2016-17. The year-wise information regarding the per student expenditure on education in Delhi is pre-sented in Statement 15.12:
Statement 15.12 PER STUDENT EXPENDITURE ON SHOOL EDUCATION IN DELHI
Year 2013-14 2014-15 2015-16 2016-17
(R.E.)
2017-18
(B.E.)
Expenditure (per annum) 32298 35580 42605 54910 61622
Note: Expenditure based on aggregate expenditure both Revenue & Capital
8.2 A State-wise statement along with all India comparison of per student (aged 5-29 years) Average Annual Expenditure pursuing general education by level of educa-tion as per 71st NSS Survey is placed in Table 15.1.
9. Major Initiatives for School Education:-
• Construction of 19 new school buildings has been completed.
• Around 6787 additional class rooms made functional in various existing schools for in-creased access to Education and help to achieve ideal pupil Teacher ratio. Proposal for construction of additional 12,000 class rooms is under process.
• For providing better ambience and state of the art facilities, 54 Govt. schools have been identified and out of them 16 Govt. Schools made fully functional as Model Schools.
• 24500 Number of students have been admitted in the entry grade classes through online lottery in different un-aided pvt. Schools under EWS & DG quota under RTE Act.
• Coverage of Aadhar and Bank Accounts in respect of students is upto 99% and seeding has been done upto 87% out of the students covered under Aadhar.
• An integrated approach was adopted for capacity building by SCERT, whereby apart from innovative in- house capacity building programmes, 89 Head of Schools were given exposure to various National & International Institutions of repute viz. Cambridge Univer-sity, U.K & leadership training programme for 57 HOS at IIM Lucknow, IIM Ahmedabad & National University of Educational Planning & Administration (NUEPA). SCERT has also organised around 1 lakh capacity building programmes of School Management Commit-tees (SMC).
• Govt. has started sports coaching & training through private sports academies in the

ECONOMIC SURVEY OF DELHI, 2017-18228
Govt. schools. In 1st phase, 55 academies have been permitted to use 100 school play-grounds. 77 Govt. School Playgrounds have been opened for public.
• Primary Classes have been introduced in 155 Sarvodaya Vidyalayas thereby paving the way for increasing the intake of more students in Nursery class.
• Commerce Stream introduced in 142 schools to promote Commerce Education among the students.
• Setting-up of Three Tier Library System for Govt. Schools has been approved.
• DOE is implementing a new initiative “Chunauti - 2018” aimed at bridging the accumu-lated learning deficits of primary classes in Classes 6 to 8, ensuring rigorous inputs to address the failure trend in Std 9 and zero drop out amongst the children, who have failed in Std 9. This initiative has helped to bringout improvement in the exam results.
• Through the Reading Campaign, nearly 1 lakh students of Std 6 to 8 moved from non reader to reading grade appropriate text.
• Another important initiative implemented by DOE is to bring out supplementary learning material called “Pragati” for its students. The Pragati series aims at providing study ma-terial in simple, contextual and child friendly manner.
• Under Sarva Shiksha Abhiyan, 9902 Out of School children were enrolled in the schools. 970 Out of school children mainstreamed to schools. 41192 teachers have been trained under SSA. Ward wise survey of out of school children has been done and data is being tabulated.
• The Government of NCT of Delhi is creating World class sports infrastructure for the up-coming sportspersons. The Government is creating hostels for the sportspersons so that they can have the residential facility along with the sports practices. The sportspersons are being given opportunity for international exposure in the sports sector.

ECONOMIC SURVEY OF DELHI, 2017-18 229
Higher Education
10.1 Development of Higher Education by way of establishing more Degree Colleges/ State Universities has been envisaged. The budget allocation for the Higher Education has been increased from Rs.300 crore in 2016-17 to Rs.483 crore in 2017-18.
10.2 The number of higher educational institutions in Delhi is presently 219. Details of higher educational institutions is presented in statement 15.13
Statement 15.13
HIGHER EDUCATIONAL INSTITUTIONS IN DELHI
S. NO. INSTITUTIONS 2011-
122012-
132013-
142014-
152015-
162016-
172017-
181. Universities 10 10 11 11 12 12 12
2. Institutions as Deemed as Universities 12 12 12 12 12 11 11
3. Institutions of National Importance 3 3 3 3 3 4 4
4. Colleges for General Education 81 81 81 81 84 84 85
5. Colleges for Profes-sional Education 103 103 100 100 100 102 107
Total 209 209 207 207 211 213 219
10.3 It may be observed from the statement that approx. half of the total higher educational in-stitutions in Delhi are under the category of professional educational institutions followed by approx. 39% under the category of colleges for general education and remaining are Universities/ Deemed Universities/ Institute of National Importance.
Total Enrolment in Higher Education (2015-16)
(In lakh)
Delhi All IndiaTotal enrolment in Higher Education 10.15 345.85
Women enrolment 4.88 159.99%age of women enrolment 48.08 46.26
Source: All India Survey on Higher Education, MHRD AISHE report 2015-16.

ECONOMIC SURVEY OF DELHI, 2017-18230
GPI at various Levels of Courses in Higher Education in 2015-16
LEVEL DELHI ALL INDIAUnder Graduate 0.88 0.87Post Graduate 1.40 1.15PG Diploma 0.62 0.86
M.Phil 1.09 1.43Ph.D 0.83 0.70
Diploma 0.70 0.42Certificate 0.63 1.28Integrated 0.40 0.68
Source: Calculated on the basis of data of enrolment in Report for AISHE 2015-16.
10.4 Gender Parity Index (GPI) is the ratio of the female enrolment to male enrolment in high-er education and it reflect status regarding gender equity at different level of education which is a significant indicator of the empowerment of women in society. It is evident from the table that the GPI in Delhi at the educational level of Under-Graduate, Post-Gradu-ate, Ph. D and Diploma are far better than at National level.
11. Major Initiatives in Higher Education:-
• Online web-portal for students to apply online for availing the education loan facility has been launched on 20/06/2016. The guarantee against loans is provided by the Delhi Higher Education & Skill Development Credit Guarantee Fund Trust.
• Karampura campus of AUD started in 2016-17 with intake of 220 students for 4 U.G. pro-grammes. During 2017-18, the intake capacity of this campus has been increased to 499.
• The construction of new building of Shaheed Sukhdev College at Rohini was completed and the college started from Academic Session 2017.
• Under the expansion programme of Ambedkar University Delhi (AUD), Karampura cam-pus started in 2016-17 with intake of 220students. During 2017-18, the intake capacity of this campus has been increased to 499. New campus of AUD at Lodhi Road has been inaugurated on 05.09.2017 and the School of Educational Studies (SES) has been shift-ed from Kashmere Gate to Lodhi Road Campus. The courses of MA (Education) and MA (Early Childhood Education) are running in this campus
• For construction of new campuses of AUD at Dheerpur & Rohini, MOU has been signed between AUD and PWD for appointment of Consultant in March, 2017. The appointment of consultant is under process.
• Construction work of East Campus of GGSIPU at Surajmal Vihar has been started. The target of completion of project is November, 2019. The University has planned to have School of Design and School of Architecture & Planning in the proposed campus. The intake capacity of GGSIPU has been increased by 1464 seats resulting to 34094 seats in the session 2017-18.

ECONOMIC SURVEY OF DELHI, 2017-18 231
Technical Education12. Government of NCT of Delhi aspires to make the state an educational hub. Through
expansion of existing Colleges/ Universities, number of seats has been increased. Efforts were made for augmenting the seats in number of vocational and skill development training centres like ITI and Polytechnics. More focus has been given for development of infrastructure as well as recruitment of faculty and supporting staff. The employability of educated students has remained a major issue, which, is being addressed through introduction of various skill development courses and establishing industry linkage.
12.1 Delhi Government has expanded the technical education by way of introducing Bachelor Programmes in Vocational Courses in all government polytechnics (Renamed as Insti-tute of Technology). Expansion of the Netaji Subhash Institute of Technology has been planned by converting it to an Autonomous University. The infrastructure of Technical Institutes is being augmented and 2nd phase expansion of the Campus of Indraprastha Institute of Information Technology has almost been completed.
12.2 Delhi Government has 04 State Universities in Technical Education namely Delhi Techno-logical University (DTU), Indira Gandhi Delhi Technical University for Women (IGDTUW) , Indraprastha Institute of Information Technology (IIIT) and Delhi Pharmaceutical Sci-ences and Research University. Besides, there are 07 degree level Institutions under Department of Training & Technical Education including premier institute “Netaji Subhash Institute of Technology”. The intake capacity in various technical and professional cours-es has significantly been increased in the last four years as depicted in statement 15.14:
Statement 15.14
Intake Capacity in Technical and Professional courses
S. No Institutes 2014-15 2015-16 2016-17 2017-181 DTU (Including East Campus) 2564 2534 2843 36892 NSIT 916 1005 1033 10513 IGDTUW 506 564 689 6894 IIIT-D 301 337 444 5465 G B Pant Engineering College 225 225 225 1806 Ambedkar Institute of Advanced Com-
munication Technologies & Research 252 252 252 252
7 Choudhury Brahm Prakash Govt. Engineering Collage
185 185 148 120
8 Delhi Institute of Tool Engineering 258 258 258 2589 Delhi Institute of Pharmaceutical
Science & Research220 227 215 235
10 Delhi Pharmaceutical Science & Research University
- 156 175 173
11 College of Art 292 283 231 239Total 5719 6026 6513 7432
12.3 Besides, there are 104 Diploma/ Certificate level technical Institutions having Student strenght of 34,168, details of which are as under statement 15.15:

ECONOMIC SURVEY OF DELHI, 2017-18232
Statement 15.15
TECHNICAL INSTITUTES IN DELHI DURING 2011-12 to 2016-17
S . No. Technical Institutes 2011 -12 2012 -13 2013 -14 2014-15 2015-16 2016-17
1. Industrial Training Insti-tutes 16 16 16 17 17 19
2. Industrial Training Centers 56 61 61 61 61 633. Basic Training Centers 1 1 1 1 1 1
4. Commercial Sector Insti-tutes 1 1 1 1 1 1
5. Polytechnic 20 20 21 20 20 19
6. World Class Skill Upgrada-tion Centre 0 0 1 1 1 1
Total 94 99 101 101 101 104Source: - .Directorate of Technical Education, GNCTD.
12.4 The number of students in technical institutes during 2011-12 to 2016-17 is presented in Statement 15.16.
Statement 15.16
STUDENTS IN TECHNICAL INSTITUTES OF DELHI: 2011-12 to 2016-17
S.
No
Technical Insti-tutes
Students in Technical Institutions2011-12 2012-13 2013-14 2014-15 2015-16 2016-17
1. Industrial Training Institutes
7545 8531 8541 8304 11675 12771
2. Industrial Training Centers
1762 2135 2292 2464 2610 4427
3. Basic Training Cen-ters
512 447 685 748 530 681
4. Institute of Basic Business Studies (Formerly Commer-cial Sector Insti-tutes)
155 110 104 88 90 118
5. Polytechnic 12211 12358 15519 15763 16982 155686. World Class Skills
Development Cen-tre
174 255 363 603
Total 22185 23581 27315 27622 32250 34168Source: - Directorate of Technical Education, GNCTD.

ECONOMIC SURVEY OF DELHI, 2017-18 233
12.5 It may be observed from Statement 15.16 that the number of students in technical insti-tutes in Delhi has increased to 34168 in 2016-17 from 22185 in 2011-12. The increase in the number of students in last 06 years is around 54%. The growth of students during last 6 years in technical institutions in Delhi is depicted in the Chart 15.4:
Chart 15.4
Students ITI Courses and Polytechnics
12.6 Following new interventions launched by Govt. of NCT of Delhi:
• Setting up of Incubation Centres
i) GNCTD has approved the State Incubation Policy for promotion of entrepreneurship among youths for setting up of start-ups and creating abilities to make them job providers instead of job seekers. 11 Incubation Centres were already set up. Grant of 1.5 crore was given by the GNCTD to each technical & higher educational institutions for setting up of requisite infrastructure, computing resources and for creating environment for col-laboration and innovation. As per the Incubation Policy, section 8 Companies has been created to act as Holding Company for Incubators and enter into MOU with participating institutes to facilitate setting up of Incubation Centres within the campus.
ii) Students studying in the higher technical institution where Incubation Centres got set up are learning entrepreneurial skills and they are getting information about completion of various formalities for start-up business. Established business companies are also invited to guide them to meet their initial challenges. About 40 proposals have been ac-cepted and supported in their venture. 04 companies are initiated by the students of Del-hi Technological University (DTU) by involving 20 students in these companies. Seven Incubation teams of students of NSIT have finalized details of their start-up companies in different fields. About 11 companies are associated with the Incubation Centre set up in IIIT. The Incubation Centre organized a start up fair where around 30 start-ups across Delhi, NCR participated and presented their business proposals with an intention to hire students for a short internship during summers. The ventures are also supported to participate in Internet Day 2017 and showcase their products. Incubation Centre of IIIT,

ECONOMIC SURVEY OF DELHI, 2017-18234
Delhi has onboard panel and advisors who are Industry experts in various domains. The other legal processes for registration are outsourced. The four start up proposals are finalized by the Incubation Centre set up in Indira Gandhi Delhi Technological University for Women. The Incubation Centre set up in Ambedkar University had identified 6 candi-dates for Incubation. About 40 business proposals were received in Incubation Centres set up in Shaheed Sukhdev College of Business Studies during last 5 months. Out of which, 11 business proposals were finally evaluated by Investment Committee and the candidates have been asked to form their respective companies. The Incubation Centre has organized orientation centre for students for start ups, entrepreneurship and also working on potential MOU.
• Industrial Collaboration for Institutional Upliftment
i) During last two years, fifteen Modern State of the Art workshops / Labs were developed in various technical Institutions under DTTE in collaboration with industrial partners by using CSR funds for sharing technical knowhow and global industrial standards.
ii) Maruti Suzuki India Limited (MSIL) has established an ultra modern workshop for automo-bile training at ITI Pusa. MSIL adopted ITI Mangolpuri under PPP and is organising train-ing of trainers programme for the teachers and students. There has been positive impact on placement and all the trainees (about 179) of the first batch of auto body and auto body paint have been placed by MSIL authorised dealers. ITI Pusa has been recognised as the best ITI of Delhi with the best industry collaboration and placement records.
iii) A MOU with Indraprastha Gas Limited (IGL) has been signed by the ITI Arab Ki Sarai, Nizamuddin, New Delhi for giving the theoretical and practical training including technical aspect of city gas distribution to the students studying in ITI by the IGL.
• Introduction of B.Voc Programme in 09 Government Institute of Technology
i) To align higher education with the emerging skill needs of the society and incorporate the requirements of various industries, the Delhi Government 09 Polytechnic Institutions were upgraded into an Integrated Model for offering degree with multiple exit such as diploma vocational (D.Voc) / Advance Diploma to the youth of Delhi. This enable the pass out of B.Voc programme at various levels to contribute in the accelerating India’s economy by gaining appropriate employment or becoming successful entrepreneurs. For this purpose, B.Voc course in ten disciplines with a total 950 seats were added. It has opened vertical path ways for skilled youth in ITI and Polytechnic for higher education at graduate level.
12.7 Delhi Skill Development Mission
12.7.1 Skill up-gradation is essential to meet the requirement of trained and skilled manpower of the industrial and service sectors. Accordingly it was decided to set up a State Level Skill Development Mission to provide inter-sectoral co-ordination at the state level by Govern-ment of Delhi under the Chairmanship of Hon’ble Chief Minister. Delhi Skill Development Mission was registered on 12th June 2009 under the Societies Act, 1860.
12.7.2 The Mission is to provide skill development training to the students passing out from schools, unemployed youth and drop-outs, informal sector workers. At present various schemes/ activities are simultaneously running under the aegis of Delhi Skill Mission in the field of imparting training, granting certification, quality improvement and introduction of new scheme, courses and institutes. The Skill Development Initiative Scheme based

ECONOMIC SURVEY OF DELHI, 2017-18 235
on modular employable skills a Centrally Sponsored Scheme is being implemented by Government of Delhi for imparting training to the semi-skilled, un-skilled persons in unorganized sectors.
13. World Class Skills Development Centre and Skill University
13.1 The Government of NCT of Delhi has set up a World Class Skill Development Centre at Jonapur, Delhi in collaboration with Institute of Technical Education, Singapore. The project was approved by Delhi Cabinet. The project, on completion, will train around 5000 trainees per annum. The main aim of setting up World Class Skill Centre is to enhance the training skills of aspirants in Delhi and create skilled manpower as per the requirement of Indian and global industries. Land measuring 37.01 acre has already been allotted for the project at Jonapur village south District, New Delhi. Permanent Campus of the WCSC has been coming up at Joanapur at an estimated cost of Rs.254 crore.
13.2 The Centre started functioning from the temporary campus at ITI Vivek Vihar with one year course in two subjects i.e. Hospitality and Retail Merchandising with an intake of 160 in each trade were started from academic session 2013-14. Trades of Information Technology & Account Banking Finance have been added with 40 intake in each trade from the academic session 2015-16.
14. Society for Self Employment (SSE)
14.1 Educated unemployed youth and school/ college dropouts constitute a sizeable percentage who are unable to contribute due to lack of technical knowledge and financial support. Society for Self Employment envisages conversion of energy of such youths, through skill formation / up-gradation, to enable them to take up jobs or self employment.
14.2 During the year 2012-13, 2013-14, 2014-15, 2015-16 and 2016-17 a total of 1520, 307, 437, 519 and 402 respectively candidates have been trained by SSE in various vocational training programme.
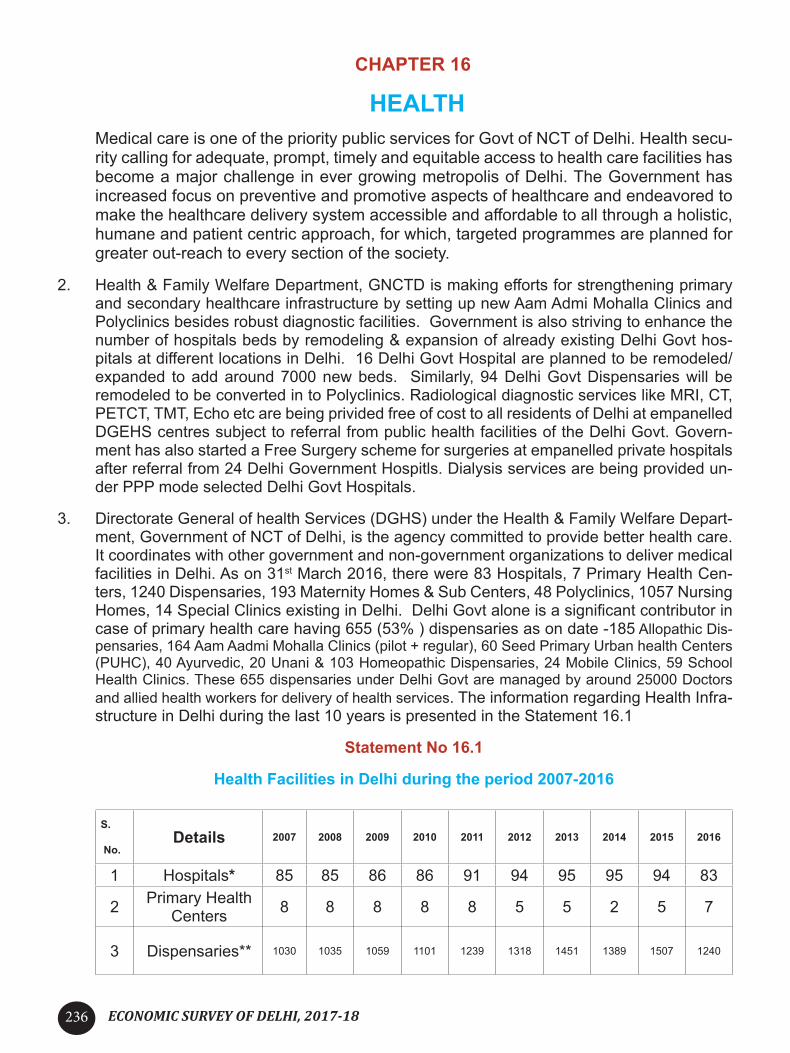
ECONOMIC SURVEY OF DELHI, 2017-18236
CHAPTER 16
HEALTHMedical care is one of the priority public services for Govt of NCT of Delhi. Health secu-rity calling for adequate, prompt, timely and equitable access to health care facilities has become a major challenge in ever growing metropolis of Delhi. The Government has increased focus on preventive and promotive aspects of healthcare and endeavored to make the healthcare delivery system accessible and affordable to all through a holistic, humane and patient centric approach, for which, targeted programmes are planned for greater out-reach to every section of the society.
2. Health & Family Welfare Department, GNCTD is making efforts for strengthening primary and secondary healthcare infrastructure by setting up new Aam Admi Mohalla Clinics and Polyclinics besides robust diagnostic facilities. Government is also striving to enhance the number of hospitals beds by remodeling & expansion of already existing Delhi Govt hos-pitals at different locations in Delhi. 16 Delhi Govt Hospital are planned to be remodeled/ expanded to add around 7000 new beds. Similarly, 94 Delhi Govt Dispensaries will be remodeled to be converted in to Polyclinics. Radiological diagnostic services like MRI, CT, PETCT, TMT, Echo etc are being privided free of cost to all residents of Delhi at empanelled DGEHS centres subject to referral from public health facilities of the Delhi Govt. Govern-ment has also started a Free Surgery scheme for surgeries at empanelled private hospitals after referral from 24 Delhi Government Hospitls. Dialysis services are being provided un-der PPP mode selected Delhi Govt Hospitals.
3. Directorate General of health Services (DGHS) under the Health & Family Welfare Depart-ment, Government of NCT of Delhi, is the agency committed to provide better health care. It coordinates with other government and non-government organizations to deliver medical facilities in Delhi. As on 31st March 2016, there were 83 Hospitals, 7 Primary Health Cen-ters, 1240 Dispensaries, 193 Maternity Homes & Sub Centers, 48 Polyclinics, 1057 Nursing Homes, 14 Special Clinics existing in Delhi. Delhi Govt alone is a significant contributor in case of primary health care having 655 (53% ) dispensaries as on date -185 Allopathic Dis-pensaries, 164 Aam Aadmi Mohalla Clinics (pilot + regular), 60 Seed Primary Urban health Centers (PUHC), 40 Ayurvedic, 20 Unani & 103 Homeopathic Dispensaries, 24 Mobile Clinics, 59 School Health Clinics. These 655 dispensaries under Delhi Govt are managed by around 25000 Doctors and allied health workers for delivery of health services. The information regarding Health Infra-structure in Delhi during the last 10 years is presented in the Statement 16.1
Statement No 16.1
Health Facilities in Delhi during the period 2007-2016
S.
No.Details 2007 2008 2009 2010 2011 2012 2013 2014 2015 2016
1 Hospitals* 85 85 86 86 91 94 95 95 94 83
2 Primary Health Centers 8 8 8 8 8 5 5 2 5 7
3 Dispensaries** 1030 1035 1059 1101 1239 1318 1451 1389 1507 1240

ECONOMIC SURVEY OF DELHI, 2017-18 237
S.
No.Details 2007 2008 2009 2010 2011 2012 2013 2014 2015 2016
4Maternity Home
& Sub Cen-ters***
284 284 267 260 259 267 267 267 265 193
5 Polyclinics 10 10 15 15 16 19 19 19 42 48$
6 Nursing Homes 607 609 613 676 679 750 855 973 1057 1057
7 Special Clinics @ 21 21 22 22 21 27 27 27 27 14@
8 Medical Col-leges 10 11 11 11 12 14 16 16 17 17#
Source:- Dte of Health Services, GNCTD.*Includes all Government Hospitals(Allopathic, Ayurvedic, Homeopathic and T.B. Clinics) but excludes mater-nity Homes & Primary Health Centers.
**Includes Allopathic, AYUSH, Dispensaries, Mobile Health clinics, Maternity Homes, M&CW centers, PP Units, UWCs.
***Includes Maternity Homes, Maternity Centers/sub-center, Mobile M & CW Units, PP Units, Urban Welfare Centers.
$ This includes 24 Delhi Govt Poly clinics which are converted from Delhi Govt dispensaries during the year.
@ Includes Chest Clinics & VD Clinics.
# Only colleges running under graduate medical courses (MBBS, BHMS, BAMS, BUMS & BDS).
4. It may be inferred from above Statement that number of medical institutions in Delhi has increased at low rate. There are number of reasons behind slow pace of extension of new health outlets such as non-availability of land, shortage of manpower and multiplicity of agencies, etc. Moreover all the hospitals especially major hospitals in Delhi attend heavy patient load.
5. The agency-wise information regarding number of medical institutions and bed capacity in Delhi as on 31st March 2017 is given in the statement 16.2
Statement 16.2
Agency-wise information regarding
number of medical institutions and bed capacity in Delhi
S.
No.Agencies
2016-17Institutions Beds sanctioned
1 Delhi Government 38 10908
2 Municipal Corporation of Delhi 50 4102
3 New Delhi Municipal Council 2 215

ECONOMIC SURVEY OF DELHI, 2017-18238
S.
No.Agencies
2016-17Institutions Beds sanctioned
4Government of India (DGHS, CGHS, Railway, ESI, Army Hospitals, AIIMS,
LRS Inst.)21 11146
5 Other Autonomous Bodies (Patel Chest Inst.) 2 142
6 Private Nursing Homes/Hospitals/ Volun-tary Organizations 1057 26816
Total 1170 53329Source:- Dte of Health Services, GNCTD.
6. Growth of Bed Capacity Since 2011 - According to the recommendations of the World Health Organization (WHO), the recommended bed population ratio is 5 beds per thousand populations. However, the bed population ratio in Delhi till 2016-17 has remained at 2.86 which were almost half of the prescribed level. The information regarding growth in number of beds in medical institutions and bed population ratio from 2011 onwards is presented in the following statement:-
Statement 16.3
Beds in Medical Institutions & Bed Population Ratio in Delhi 2011-16
YearNumber of Hospital beds
Population (in ‘00’)
Projections by CSOBeds Beds per 1000
Persons(*)
2011 169750 42598 2.512012 173000 42695 2.472013 176310 43596 2.472014 179690 48096 2.682015 183140 49969 2.732016 186640 53329 2.86
Source – Dte of Health Services, GNCTD.
Chart No 16.1
Bed Population Ratio (beds per 1000 persons) in Delhi

ECONOMIC SURVEY OF DELHI, 2017-18 239
7. The total sanctioned bed capacity of medical institutions in Delhi was 53329 as on 31st March 2017 for total 1170 (Govt./Pvt.) Medical Institutions working in Delhi. The number of beds in the Medical Institutions operated by Government of India, Delhi Government & Local bodies constituted as 20.90 percent, 20.45 percent, 8.1 percent respectively and beds in private nursing homes/ hospitals/ voluntary organizations was recorded at 50.28 per cent. In addition to the renowned government hospitals, Delhi has also showed the highest private sector participation in health sector. The information regarding agency-wise medical institutions having the beds capacity in Delhi as on 31st March 2017 is depicted in statement 16.2 while details of bed population ratio since 2011 to 2016 are available in the statement 16.3. Bed population ratio has shown a marginal rise with 2.86 in 2016 from 2.51 in 2011. Besides new projects, Government has also decided to remodel existing hospitals so as to add new beds as per available FAR.
8. Status of major Hospitals being constructed by Govt of NCT of Delhi– Around 10 Hos-pitals are being constructed or under planning stage. A List of these seven major projects showing details of no of beds, date of approval by Competent Authority, project costs, etc is placed at statement 16.4
Statement 16.4
List of hospitals which are under construction
Name of Hospital Details of ongoing project
Hospital at Ambedkar
Nagar
• Project was earlier approved by the Cabinet on 07/08/2013 at a total cost of 125.90 crore with c/o 200 beds.
• Construction work was awarded to NBCC on Plot area 10000 sqm.
• Now, the Cabinet vide decision no 2434 dated 22-10-16 has recently approved the revision of bed strength of this project from existing 200 to 600 beds at the cost of around 181 crore.
• The project is expected to be completed in the next FY 2018-19.
Indira Gandhi Hospital
at Dwarka Sec-9
• A plot of measuring area: 14.83 Acre was purchased from D.D.A. on 06.05.1997 and handed over to PWD for construction of 750 (revised) bedded Hospital.
• Tender awarded to M/s Larsen &Toubro Ltd. on composite basis.
• Construction started on 27.08.2014. 64 % progress reported by PWD.
• Govt has decided to enhance its bed strength up to 1500 beds.

ECONOMIC SURVEY OF DELHI, 2017-18240
Name of Hospital
Details of ongoing project
Hospital at Burari
• A plot of 17128.8Sq. Meter, was handed over from Gram Sabha, Panchayat Dept. to DHS on 15.03.1999.
• Cabinet approved the project vide decision no.1926 dated 27.8.2012 at the cost of 208.11 Cr.(Capital 182.77 Cr. + 25.34 Cr.).
• Now, Govt has decided to enhance its bed capacity (from 200 to 768 beds) and preliminary estimates of 266 crore (approx) are under consideration for approval.
Hospital at Chattarpur
• Possession of land of 9.2 Acre taken from Directorate of Panchayat on August 7, 2009 for c/o 225 bedded hospital.
• Consultant appointed and Lay out plan submitted to MCD
• Joint inspections were held in July 2014 and 23rd September 2014 to resolve various issues.
Hospital at Madipur
• The possession of land of 8.44 acres taken from DUSIB for c/o 200 bedded Hospital.
• Consultant already appointed by PWD. However, the project is yet to take off due to pending issues of essential clearances/ approvals.
• Delhi Govt has now decided to enhance its bed strength from 200 to 600 beds.
Hospital & Trauma Centre at Siraspur
• 20.50 acre of land was purchased from Gram Panchayat Deptt for c/o 200 bedded Hospital.
• Though A/A and PE has been finalized by PWD, other issues of clearances are still pending.
• Delhi Govt has now decided to enhance its bed strength from 200 to 600 beds.Hospital at Sarita
Vihar
• A plot of land 6319 sq.mtr was handed over from DDA to DHS for c/o 100 bed-ded hospital. Approval of the Preliminary Estimate of 87.14 Crore towards capital cost accorded by Cabinet vide Decision No.2047 dated 15.07.2013.
• Tender finalized and M/s N.N. Buildcon Pvt. Ltd. awarded work in August 2014.
• Work under process
Besides above, Delhi Govt has decided to remodel 16 existing Hospitals so as to enhance num-ber of existing beds as per FAR norms. Around 7000 new beds will be added due to planned re-modeling of these existing 16 Hospitals. The list of 7 projects recently considered by Expenditure Finance Committee is as follows-

ECONOMIC SURVEY OF DELHI, 2017-18 241
Statement 16.5 List of hospitals to be Re-modeled / Expanded.
S.No.
Hospital Bed in ex-istence
Proposed new beds
Total beds after re-modeling / expan-sion
1 Bhagwan Mahavir 300 444 7442 Acharya Shree Bhikshu 100 376 476
3 Dr. B. R. Ambedkar 500 400 9004 Deep Chand Bandhu 200 200 4005 RTRM 100 270 3706 Guru Govind Singh 100 470 5707 Sanjay Gandhi Memo-
rial 300 386 686
9. NSSO survey (71st Round- State Sample Report)suggests that around 2697 persons were hospitalized per one lakh population during the reference period of one year and the share of the govt. health institution in the treatment of hospitalized cases in urban area accounted for 51.41%. As far as the type of Wards in which in-patient services were provided, it was estimated that private hospitals provided free ward facility in only 1.86% cases as against similar arrangement in 95.03% of cases in public institutions.
10. Medical Colleges of All Systems of Medicines in Delhi: 17 medical colleges provide dif-ferent under graduate courses of all (Allopathic, Ayurvedic, Unani & Homeopathy) in Delhi. Details of annual intake, year of establishment, course offered etc in respect of these col-leges are placed at Statement 16.6
Statement 16.6
List of Medical Colleges of all systems of Medicines in DelhiS.
No.
Name of the Medical College/Uni-versity to which affiliated
Estab-lished in
Year
Course Annual Intake
1 Lady Hardinge Medical College &Hospital, New Delhi, (Delhi Univer-sity)
1916 MBBS 200
2 A &U Tibbia College & Hospital ,Karol Bagh, Delhi (Delhi University)
1921 BAMS
&BUMS
88
(44 Ayurve-da and 44
Unani )
3 All India Institute of Medical Sciences (AIIMS), New Delhi, (Autonomous)
1956 MBBS 77
4 Maulana Azad Medical College, (MAMC), Bahadur Shah Zafar Marg, New Delhi (Delhi University)
1958 MBBS 250

ECONOMIC SURVEY OF DELHI, 2017-18242
S.
No.
Name of the Medical College/Uni-versity to which affiliated
Estab-lished in
Year
Course Annual Intake
5 Nehru Homeopathic Medical College &Hospital, Defence Colony, New Del-hi
(Delhi University)
1963 BHMS 100
6 Hamdard Institute of Medical Scienc-es & Research, (Jamia Hamdard University)
1963 BUMS 50
7 University College of Medical Scienc-es, Dilshand Garden, Delhi
(Delhi University)
1971 MBBS 150
8 Maulana Azad Institute of Dental Sci-ences, Lok Nayak Hospital Complex, Jawahar Lal Nehru Marg, New Delhi
(Delhi University)
1983 BDS 40
9 Dr. B. R. Sur Homeopathic Medical College & Hospital, Moti Bagh,
(IP University)
1985 BHMS 50
10 Vardhman Mahavir Medical College,
(IP University)
2002 MBBS 150
11 Army College of Medical Science
( IP University)
2008 MBBS 100
12 Faculty of Dentistry, Jamia Millia Isla-mia, Jamia Nagar, New Delhi (Delhi
University)
2009 BDS 50
13 ESIC Dental College, Rohini,
(IP University)
2010 BDS 50
14 Chaudhary Braham Prakash
Ayurvedic Charak Sansthan, Najaf-garh,
(IP University)
2012 BAMS 100
15 Hamdard Institute of Medical Scienc-es & Research, (Jamia Hamdard Uni-versity)
2012 MBBS 100
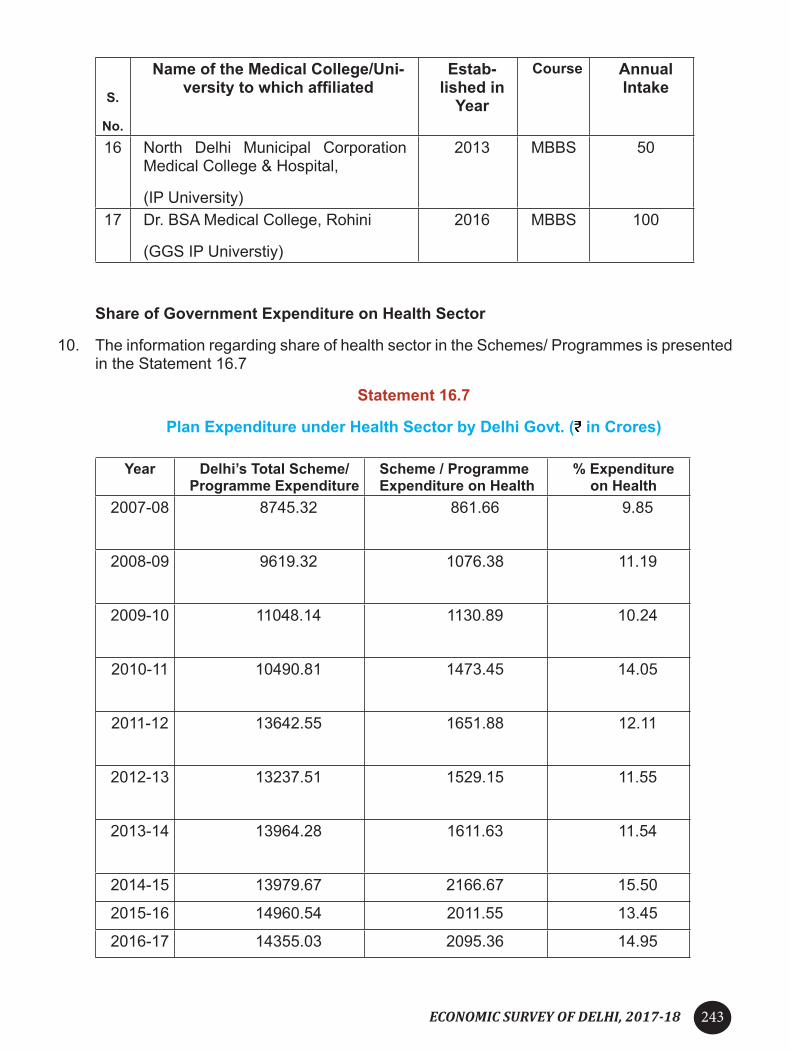
ECONOMIC SURVEY OF DELHI, 2017-18 243
S.
No.
Name of the Medical College/Uni-versity to which affiliated
Estab-lished in
Year
Course Annual Intake
16 North Delhi Municipal Corporation Medical College & Hospital,
(IP University)
2013 MBBS 50
17 Dr. BSA Medical College, Rohini
(GGS IP Universtiy)
2016 MBBS 100
Share of Government Expenditure on Health Sector
10. The information regarding share of health sector in the Schemes/ Programmes is presented in the Statement 16.7
Statement 16.7
Plan Expenditure under Health Sector by Delhi Govt. ( in Crores)
Year Delhi’s Total Scheme/ Programme Expenditure
Scheme / Programme Expenditure on Health
% Expenditure on Health
2007-08 8745.32 861.66 9.85
2008-09 9619.32 1076.38 11.19
2009-10 11048.14 1130.89 10.24
2010-11 10490.81 1473.45 14.05
2011-12 13642.55 1651.88 12.11
2012-13 13237.51 1529.15 11.55
2013-14 13964.28 1611.63 11.54
2014-15 13979.67 2166.67 15.50
2015-16 14960.54 2011.55 13.45
2016-17 14355.03 2095.36 14.95

ECONOMIC SURVEY OF DELHI, 2017-18244
11. It is clear from above Statement that investment (Scheme/ Programme expenditure) in health sector under Scheme/ Programme outlay of Delhi Government has significantly increased from 861.66 crore in 2007-08 to 2095.36 crore in 2016-17 and thus recorded a com-pound annual growth rate (CAGR) of 10.38%.
Statement 16.7 (A)
Per Capita Expenditure on Health in Delhi by GNCTD
(in only )
Year Delhi2011-12 1547.552012-13 1580.682013-14 1688.612014-15 2015.712015-16 1984.44
2016-17(Prov.) 2232.82
12. It is clear from above statement that per capita expenditure on health in Delhi has increased to 2233 in 2016-17 from 1548 in the year 2011-12 with the increase of 44 % during last five years.
13. Expenditure on Health with reference to GSDP:- The total expenditure on Health taking in to account expenditure incurred under Establishment & Scheme/ Programmes (Plan head and Non-plan head) of Govt. of Delhi and of local bodies (MCDs) with reference to GSDP of Delhi is seen hovering around one percent only during 2011-12 to 2016-17.
Statement 16.8
Expenditure on Health with reference to GSDP
Year GSDP at current prices ( in cr)
Total Exp. On Health
( in cr)
% of GSDP on Health
2011-12 343797 3117.17 0.912012-13 391388 3205.77 0.822013-14 443960 3492.49 0.792014-15 494885 4178.72 0.842015-16 548081 4224.49 0.77
2016-17 616826 5230.96 $ 0.85Source – Dte of Economics & Statistics, GNCTD, (* based on new base year since 2011-12 onwards),$ includes RE in case of MCDs

ECONOMIC SURVEY OF DELHI, 2017-18 245
14. Social Consumption on Health
As per findings of 71st round of NSS (State Sample), the average expenditure incurred for treatment (medical and other expenditure) per hospitalized case by people in Delhi has been estimated as 25,553.
15. Child & Maternal Health
Various significant indicators i.e. Vital Statistics on Birth Rate, Death Rate, Infant Mortality Rate ( Neo-natal & Post-natal), U5MR and Fertility Rates etc are released by O/o Registrar General of India, Govt of India based on findings through Civil Registration System and Sample Registration Survey. Following are Statement 16.9 - 16.12 reflecting statistics on vital events –
Statement 16.9
SELECTED VITAL RATES OF DELHI
YearBirth Rate*
(CRS)
Death* Rate
(CRS)
Average no. of events per day Infant Mortality Rate
Births (CRS)
Deaths (CRS)
Neonatal Mortality
Rate(CRS) (SRS)
Post -natal
Mortali-ty Rate
(CRS)
Infant Mor-tality Rate
(CRS) (SRS)
2010 21.66 7.48 985 341 15 19 7 22 302011 20.89 6.63 969 307 15 18 7 22 282012 20.90 6.10 988 287 14 16 10 24 252013 21.07 5.52 1014 266 15 16 7 22 242014 20.88 6.77 1024 332 14 14 8 22 202015 20.50 6.82 1025 341 16 14 7 23 182016 20.38 7.61 1036 387 13 12 8 21 18
Source – O/o RGI, Govt of India & DES, Delhi

ECONOMIC SURVEY OF DELHI, 2017-18246
Statement 16.10
Under Five Mortality Rate in Delhi and India (1998-2016)
Year Delhi India1998 55 952005 47 742009 37 642010 34 592011 32 552012 28 522013 26 492014 21 452015 20 432016 22 39
Source – O/o RGI, Govt of India.
Statement 16.11
Fertility Indicators
Indicator Age Group 2008 2009 2010 2011 2012 2013 2014 2015 2016
Age
specific
fertility
rates
15-19 16.9 14.5 10.5 9.2 8.4 9.2 9.9 3.5 3.4
20-24 148.9 140.1 136.5 139.7 137.3 137.0 130.8 139.6 81.525-29 140.9 143.6 143.8 130.3 126.1 126.5 124.8 114.7 131.230-34 59.9 62.3 61.2 60.8 60.3 55.3 56.5 52.9 71.635-39 19.4 19.5 19.8 15.7 19.1 13.9 13.5 17.6 21.340-44 6.0 7.8 3.2 4.2 4.5 4.7 4.9 4.7 8.945-49 2.1 1.4 1.7 0.3 0.8 0.5 0.8 2.4 2.3
Total fertility rate
2.0 1.9 1.9 1.8 1.8 1.7 1.7 1.7 1.6
Source – SRS, O/o RGI, GOI.

ECONOMIC SURVEY OF DELHI, 2017-18 247
Statement 16.12Births attended by skilled health personnel & Institutional Delivery
Year Proportion of births attended by skilled health personnel
Institutional Deliv-ery (%)
2007 79.84 74.572008 81.76 73.452009 82.82 75.642010 92.68 78.512011 88.67 79.75 2012 84.65 81.352013 85.53 81.752014 86.11 82.832015 87.06 84.412016 87.98 86.74
Source – Annual Report on Registrations of Births and Deaths, DES, Delhi
16. It is discerned from above statements 16.9 -16.12 that IMR, U5MR and Fertility Rates are on declining trend. Steady fall in these rates over the years certainly establishes that both State Govts and Union Govt are working hard to achieve optimal levels as far as Child & Mater-nal health is concerned. Further, following are the targets under Sustainable Development Goals to be achieved by 2030.
Target in r/o the maternal mortality ratio (MMR) is to reduce it up to 70 by 2030. The level of MMR for Delhi has remained under 40 for last 4 consecutive years and thereby it is already below the desired level.
The target for Infant Mortality Rate (IMR) and Children under 5 years of age is to reduce preventable deaths to nil by 2030. In case of Delhi, both IMR & U5MR have been decreas-ing and remained at around 18 and 22 respectively in the year 2016.
17. Implementation of various activities for reduction of MMR and IMR:-
a. Strengthening and augmentation of institutional delivery through:-
Promotion of Janani Suraksha Yojna, under which pregnant women of BPL, SC & ST families get 600/- (urban) and 700/- (rural) and 500/-(BPL status for home delivery).
Strengthening of maternity homes.
Role of ASHA workers.
Creation of seed PUHCs in the un-served populations.
Awareness creation through IEC and publicity.
Free emergency ambulance service for pregnant women.
Janani Shishu Suraksha Karyakarm – Scheme envisages free facilities are provided to pregnant women and sick infants (below one year) on account of user charges, diagnostic services, drugs and consumables, diet, two way transportation and blood

ECONOMIC SURVEY OF DELHI, 2017-18248
transfusion in all Govt health facilities for the purpose of delivery or post-natal compli-cations.
b. Strengthening of Level II (secondary level), Special Neonatal Care services (SNCUs) - to cater to sick neonates (from birth to 28 days of life), 16 hospitals (BSA, SGMH,LBS, Kas-turba, Hindu Rao, SDN, GGSH, MBH, MMMH, Jag Pravesh Chandra Hospital, AAAH & others) have SNCUs to provide intensive care and resuscitative to the babies who are sick. There are 61 New Born Care Corners (NBCCs) at all 61 delivery points within labour room and OTs in the State.
c. Routine Immunization Services in Delhi are available twice a week( Wednesday & Friday) regularly at 650 health facilities and in Govt Hospitals immunization services provided dai-ly. Delhi is the only State, to have included through its own resources, vaccines of MMR (in1999), Typhoid (in 2004) and Hepatitis B (in 2001). All these additional vaccines are a strategy in itself, when it comes to improved child survival. Hon’ble CM of Delhi launched Mission Indradhansh Kawach (MIK) on 07-04-2015 for improving full immunization cover-age. Under MIK -2015, a total of 9,00,024 children were reached out, out of which 1,33,972 were fully immunized. During the period 01/04/16 to 30/06/16, 2.46 lacs children and 0.75 lac pregnant women were covered under MIK.
d. Special catch up campaigns for immunizing children up to 5 years of age, who have missed their vaccines earlier (specially directed to slum and JJ clusters, where most of dynamic population load resides) are organized as a regular feature twice a year.
Nutrition related Interventions
e. Provision of Infant and Young Child Feeding Counseling services – There are 30 IYCF centre in Delhi. Hundreds of pregnant and lactating women (mostly belonging to poorer sections of society) are counseled on exclusive breast feeding and its benefits alongside healthy weaning food from their own domestic resources daily at these centers.
f. Mother’s Absoulte Affection Programme (MAA) – Hon’ble Health Minister launched this programme on 29-11-2016. It focuses on awareness campaign to improve breastfeeding indicators. Breastfeed indicators in the “first hour” is less than 40% though institutional de-liveries are more than 80%.
g. Kangaroo Mother Care (KMC) – The need for establishing KMC units is due to high inci-dence of LBW babies (21%) & Pre-term babies (13.6%). Kangaroo mother care has been started in 21 units in Delhi.
h. NRC – Nutritional Rehabilitation Centre (NRC) are working in 8 Hospitals to take care of severely malnourished Children (SAM) under 5 years who have medical complication.
i. IDFC – Intensified Diarrhoea Control Fortnight campaign was observed from 1st July to 14th July, 2017 in Delhi.
j. Newer Initiatives - New Born Screening (holistic evaluation of all newborns), DEIC (to count-er 4 Ds i.e. Defects, Deficiencies, Diseases, Developmental delays and Disabilities), NIPI (National Iron + initiative to cover anemic children aged 6 months to 10 years), Child Death Review etc.
18. Survey results of 71st round of NSS (State Sample Social Consumption on Health) reveal that out of approximate 1.88 lakh hospitalization cases of child birth, 62.48% cases were reported in public hospitals in Delhi. Around 2.06 lakh pregnant women received pre-natal

ECONOMIC SURVEY OF DELHI, 2017-18 249
care and 1.51 lakh women received post-natal care and average total medical expenditure per child birth incurred in public hospitals was 1437 per case as against an expenditure of 19,863 in private hospitals
19. Integrated Child Development Scheme (ICDS)- Health delivery units have been liaisoned with Anganwadi centres under ICDS to immunize children in Anaganwadi’s. For reduction in child malnutrition and control of anaemia, the government is seeking convergence with various programmes, for example, NRHM, MCD, etc. ICDS functionaries participate in campaigns like Pulse Polio, Nutrition and Health Awareness.
20. School Health Scheme -The School Health Scheme in Delhi was launched in the year 1979, initially in six schools targeted to improve the health and nutrition status of children and to provide them with useful education on hygiene. The specific services offered through these clinics relate to the promotion of positive health, prevention of diseases, early detec-tion, diagnosis, treatment of disease, and referral services to higher health centres for the individuals who require further treatment and management. At present, 48 teams are func-tioning and catering to approx 16 lakhs school children of Delhi Govt and aided schools. However, about 3.5 lakh students of 300-350 schools are covered annually. There are 2 special referral centers with sanctioned posts of ENT Specialist, Eye Specialist, Refraction-ist, Dental Surgeon & Dental hygienist. Children from nearby schools are referred to the SRCs for availing their services Major achievements of SHS during the year 2016-17 are stated as under –
• Schools Screened = 325 • Students screened = 281488• Total Referral cases= 51788• Students counselled for eye, ear and skin= 22500• Students referred for cases of eye, ear & skin = 7600• Students counselled for Drug Abuse= 535• Student referred for de-addiction = 65
Department of Health & Family Welfare has also taken several novel initiatives for Preven-tion, Early Identification, and Counseling & Treatment of children / adolescents suffering from various types of Drug/Substance Abuse. 60 beds has been earmarked exclusively for in-patient management of juveniles with Drug/Substance Abuse in seven Delhi Govern-ment hospitals & health institutions namely; Deep Chand Bandhu Hospital, Dr Baba Sahib Ambedkar Hospital, Deen Dayal Upadhaya Hospital, Pt. Madan Mohan Malviya Hospital, G B Pant Hospital, Lal Bahadur Shastri Hospital & Institute of Human Behaviors & Allied Sci-ences. Dedicated OPD services for juveniles with drug/substance abuse on at least once a week basis has also been started in these hospitals. In view of inhalant abuse observed in >40% children/ adolescents amongst those admitted in the last one year, Deptt has is-sued a Gazette Notification on 31st July 2017 to limit the access of inhalants to vulnerable children/adolescents.
21. Weekly Iron Follet Supplementation Programme (WIFS) & Mass De-worming Pro-gramme – Anaemia is a serious health problem not only among pregnant women but also among infants, young children and adolescents. So, in order to reduce the incidence of anaemia, WIFS was launched in Delhi in July 2013. The programme is implemented in all schools of Delhi Govt. & Govt. Aided, NDMC & Delhi Cantonment Board for students from 6th to 12th class and out of school adolescent girls between 10 to 19 years through Angan-

ECONOMIC SURVEY OF DELHI, 2017-18250
wadi centres. COVERAGE – 670 schools were covered in the 2016-17 with total beneficia-ries of 13.5 lacs and compliance rate 89%.
Similarly, Mass De-worming programme was implemented across Delhi in all Govt/ Govt Aided schools, selected private schools and at Anganwadi centres in 2016-17 having cov-ered around 16 lacs children.
22. Family Welfare Programmes
Population Challenge and Family Welfare in India is related to the population explosion problem which most of the countries in the world are facing today, specially the developing nations. The information regarding the family welfare programmes in Delhi during the last six years (2010-2017) is presented in the following Statement 16.13 -
Statement 16.13
Family Welfare Programmes
S.
NoDetails 2010-11 2011-12 2012-13 2 0 1 3 -
142 0 1 4 -
15 2015-16 2 0 1 6 -17
1. Family Welfare Centers in-cluding PP units 99 99 98 92 77
FP centers are now functional in hospi-
tals
2.
Insertion of Intrauterine Con-traceptive Device
40759 42293 47164 58293 71754 80293 84370
3.
Sterilizations 19226 19279 20107 19181 17458 17383 18869
a. Males 2849 2634 1563 1401 811 901 1323
b. Females 16377 16645 18544 17780 16647 16482 17546
4. Oral Pills (Cycles) 222068 195204 213992 207872 196354 185499199092
5. Condoms (‘000) 7717 8954 93255373
3990 5709 6880
Source:– Dte of Economics & Statistics, GNCTD & DFW Delhi.
23. Vector Borne diseases like Dengue, Malaria & Chikungunya
Due to prevalence of vector borne diseases like Malaria in NCT of Delhi, losses of produc-tive person days are common. Dengue has proved fatal in last few years and resulted in deaths in some cases. Besides Dengue/ Malaria cases, more than 12 thousand suspected cases of Chikungunya fever were also reported in the last year 2016-17. Following is the Statement showing confimed cases (including both residents & non - residents) and deaths due to Dengue, Malaria & Chikungunya in Delhi.

ECONOMIC SURVEY OF DELHI, 2017-18 251
Statement 16.14
Details of Vector Borne Diseases like Dengue Cases in Delhi (2010- 2017)
YearSuspected cases of Dengue
Deaths due to
Dengue
Suspected cas-es of Malaria (pf
& pv)
Deaths due to Malaria
Suspected cases of Chi-
kungunya
2010 6259 8 251 0 1202011 1131 8 413 0 1102012 2093 4 882 0 62013 5574 6 514 0 182014 995 3 201 0 82015 15867 60 311 0 642016 4431 10 454 0 77602017* 21 - 10 0 67*
* for 3 month only
Source – Annual Report 2016-17, DGHS
24 It is clear from above statement that deaths due to dengue have been declining due to ini-tiatives taken by local bodies and Govt of NCT of Delhi under State Health Mission. Delhi Govt provides free of cost disposable set of Single Donor Platelet Aphesis (SDP) kit for Dengue patients admitted in general ward, Delhi Govt Hospitals. Besides adequate pub-licity, safeguards for preventing growth of mosquitoes are carried out by DGHS and local bodies. Fever clinics in the Delhi Govt Hospitals also countered the menace of Dengue/ Malaria/ Chikungunia fever.HIV / AIDS
25. Delhi State AIDS Control Society, an autonomous body of Delhi is implementing the Nation-al AIDS Control Programme funded with the aim to prevent and control HIV transmission and to strengthen state capacity to respond to long-term challenge posed by the epidemic. An estimated HIV prevalence level amongst adults in Delhi in the year 2016 was 0.25%.
26. Around 5,34,775 persons (1,78,985 pregnant women and 3,55,790 persons) were screened for HIV infection in the year 2016-17 at facilities/ centres under Delhi State AIDS control society. Out of total screened cases, 5021 infection cases were detected amongst gen-eral clients and 246 amongst pregnant women. In the current year 2017-18(up to Dec.), around 4.98 lac persons (having 1.72 lacs pregnant women) screened and 4686 cases (264 pregnant women) detected for infection. There are 27647 persons living with HIV (PLHIV) registered at 11 ART centres of the society out of which 4086 new PLHIV registered till De-cember in CFY 2017-18.
27. Delhi Govt provides financial assistance to AIDS affected persons and children’s through the scheme “Financial Assistance to AIDS/ HIV affected persons”. With addition of 287 new beneficiaries in the current financial year, a total 3273 beneficiaries are being provided financial assistance through Aadhar payment bridge system.
Revised National TB Control Programme (RNTBCP)

ECONOMIC SURVEY OF DELHI, 2017-18252
28. Salient features of RNTBCP being implemented in Delhi through Dte of Health Services are as follows -
• Delhi is the first State in the country to have full coverage with DOTS (WHO recommended treatment strategy for TB) since 1997 and with DOTS-PLUS (treatment schedule for Drug resistant TB) since 2008.
• Tuberculosis is the most pressing health problem in our country as it traps people in a vi-cious cycle of poverty and disease, inhibiting the economic and social growth of the commu-nity at large. Tuberculosis still remains a major public health problem in Delhi., 40% of our population in Delhi is infected with TB germs and is vulnerable to the disease in case their body resistance is weakened.
• Delhi has been implementing the Revised National TB Control Programme with DOTS strategy since 1997. Delhi State RNTCP has been merged with NRHM (DSHM) w.e.f. 01.04.2013. The Delhi State RNTCP is being implemented through a decentralized flex-ible mode through 25 Chest Clinics equivalent to DTC. Out of 25 Chest Clinics, MCD are running 12, GNCTD-10, NDMC-1, GOI-l and NGO-1 chest clinics respectively. Delhi is the only state in the country where one NGO-Ramakrishana Mission, has been entrusted the responsibility to run the RNTCP in a district. The RNTCP has 201 diagnostic centers and 551 treatment centers located all over Delhi. The NGO’s and private Medical Practitioners are participating in the implementation of the RNTCP in a big way. The diagnosis and treat-ment is provided free to the patients under the RNTCP.
• Delhi has been the best performing State in terms of achieving international objective of the programme in detecting new infectious TB patients at 70% & above and their success rate at 85% consistently for the last 11 years.
• The State has been able to bring down the death rate due to tuberculosis at the lowest level of 3% (all India 4%) amongst new infected patients, 2% (4% All India) amongst new sputum negative patients and 1% (2% All India) amongst new extra pulmonary cases. Therefore, the State is saving a lot of lives and achieving the goal of the Programme to decrease mor-tality due to TB.
• Delhi has been treating maximum number of Children suffering from TB at the rate of 14% against 6% all India figures.
• Delhi State RNTCP became the first State in the country to have base line drug sensitivity to second line drugs in all cases of MDR TB.

ECONOMIC SURVEY OF DELHI, 2017-18 253
Statement16.16
PERFORMANCE OF REVISED NATIONAL TB CONTROL PROGRAMME
Indicator 2010 2011 2012 20132014 2015
2016 (April to
Dec)
Total number of patients put on
treatment50476 51,645 52006 50728 54037 55582 57967
New Infectious patients put on
treatment13680 13770 13982 12969 13704 14197 14840
Conversion rate from infectious
to non infectious status at three months of treat-
ment (Target 90%)
89% 89.50% 90 % 89% 89% 90% 89.6%
Case detection rate of new infec-
tious patients 82% 85% 85.7 80% 80% 83% 87.3%(Universal Cover-
age)Case detection rate of all types of TB patients 112% 118% 128% 118% 122% 122% 125.3 %
(Universal Cover-age)
Success rate (cure + com-
pletion ) of new smear positive
86% 86% 85.7% 86% 85% 86% 86.7%
(Target 90%)Death Rate (Tar-
get <5%) 3% 3% 2.70% 2.60% 3.50% 3% 2.6%
Default Rate (Tar-get <5%) 4.30% 4.50% 4.40% 5% 5.70% 5% 5%
Failure Rate (Tar-get < 5%) 4% 4% 4.10% 3% 2.70% 2% 2.30%
Number of per-sons saved from
death9489 9690 9776 9486 9875 10600 11280
Number of per-sons prevented
from getting infected with TB
504633 507310 517334 480501 523407 526435 552826
Source – Dte of Health Services (DHS), GNCTD.

ECONOMIC SURVEY OF DELHI, 2017-18254
Indian System of Medicine (ISM) and Homeopathy
29. To promote Indian System of Medicine (ISMH), a separate Department of ISM set up in May 1996 in order to promote indigenous systems of medicines /therapies utilizing herbal med-icines and System of Homeopathy. In 2013 it was renamed as Dte of AYUSH (Ayurveda, Yoga & Naturopathy, Unani, Siddha, Sowa-Rigpa & Homeopathy). Following are the major functions of the Directorate of AYUSH
• To provide best healthcare facilities through a network of 163 dispensaries spread across Delhi providing Ayurveda, Unani and Homoeopathy treatment
• Quality and value based education in Ayurveda, Unani and Homoeopathy through under-graduate and postgraduate courses at four educational institutes
• Licensing and regulation under Drugs & Cosmetics Act and Drugs & Magic Remedies (Ob-jectionable advertisement) Act of Ayurveda and Unani Medicines
• Registration of practitioners of Ayurveda, Unani and Homoeopathy
• To create awareness among masses about strengths of AYUSH systems through school education programmes, media campaigns and participation in various health programmes
29.1 Important steps taken by Govt of NCT of Delhi in respect of functioning of AYUSH are as followfollows-
• After creation of separate Deptt/ Directorate of Indian Systems of Medicine & Homeopathy by the Govt. of NCT of Delhi in 1996, the Drug Control Cell of Ayurvedic and Unani Medicine has been transferred to this Directorate from the Drug Control department in 1997. Assis-tant Drug Controller (Ayurveda) and Assistant Drug Controller (Unani) have been notified as the Licensing Authority for A&U Drugs. At the moment, 2 Drug Inspectors (Ayurveda) and 1 Drug Inspectors (Unani) assist the Licensing Authority (ISM). Total 91 regular AYUSH manufacturing units are there out of which 69 Ayurvedic units, 22 regular Unani units, 10 regular combined A&U units and 2 Ayurvedic loan licensed and 1 Unani loan licensed units are licensed as on 01-9-2016.
• The government has taken over Dr. B.R.Sur Homeopathic College where degree courses have already been started with an intake of 50 students. 50 beds for indoor patients have also been commissioned in this hospital. Besides OPD services, facilities of x-ray, laborato-ry services and ultrasound also available.
• The government has also taken over the management of the Ayurvedic and Unani Tibbia College & Hospital in 1998 under Delhi Tibbia College( Take over) Act 1998. This college is affiliated to Delhi University is imparting BAMS and BUMS degree and have admission capacity of 88 seats (44 for BAMS & 44 for BUMS) for students. This institute is also run-ning post graduate courses in Ayurveda & Unani in the subjects Kayachikitsa, Sharir and Moalijat respectively along with 300 beds indoor facility. A new separate block of 60 bedded maternity in A&U Tibbia College has started functioning.
• Delhi Homeopathic Anusandhan Parishad has been set up to promote research activities. Similarly, Examining Body for paramedical training for Bhartiya Chikitsa also set up as a autonomous body for holding exams for paramedical training and preparing course of study for such exams a nursing care, panch karma etc.
• Nehru Homeopathic Medical College and hospital is imparting BHMS Degree and have a capacity of 100 seats. This institute has 100 beds indoor facility for the homeopathic treat-ment of chronic patients. Post Graduate course have also been introduced in this institute.

ECONOMIC SURVEY OF DELHI, 2017-18 255
• Ch. Bharam Prakesh Ayurvedic Charak Sansthan at Khera Dabur is an autonomous Ayurve-dic Medical College and Hospital under the GNCTD. The 1st batch of Ayurveda Medical Col-lege started with the sanctioned capacity of 100 seats. 210 bedded hospital attached to the Sansthan is providing health care facilities through its experienced and qualified Doctors.
29.2. Based on findings of 71st Round of NSS (State Sample) – Social Consumption of Health, out of total ailing persons in Delhi, about 9.86% persons opted for AYUSH treatment. In rural 19.82% persons opted for AYUSH in comparison to 9.48% persons in urban.
Delhi State Health Mission
30. Delhi State Health Mission started in Delhi from October, 2006 as per guidelines under Centrally Sponsored Scheme of National Rural Health Mission. Apart from important pro-grammes targeted to improve maternal and child health, other activities connected with public health are also covered with in DSHM. The details of various programmes which are being dealt under DSHM are stated as under -
• Delhi State Health Mission is imparting various health activities such as Janani Suraksha Yojna , Janani Shishu Suraksha Karyakram (JSSK)
• For the implementation of various schemes under Delhi State Health Mission, Accredited Social Health Activist (ASHA) - women volunteers are selected from local community and trained to reinforce community action for universal immunization, safe delivery, new born care, prevention of waterborne and communicable diseases, improved nutrition and promo-tion of households/community toilets.
• There are 5210 ASHA working in Delhi as on 31st October 2017. One ASHA is being select-ed on 2000 population. For their training, master trainers impart training to unit level trainers who further provide training to ASHAs. The fund for training/selection/supporting structure is provided by GOI under NHM. The State specific activities a like surveys, community mobi-lization, facilitating Institutional delivery etc are funded from the State fund. Following is the ASHA performance in r/o important activities during the year 2016-17

ECONOMIC SURVEY OF DELHI, 2017-18256
Statement16.17
ASHA performance for the year 2016-17S. No.
Activities Results (in No’s)
1 Cataract Surgery facilitated (per Eye) 69692 Complete ANC Checkup completed 893593 Female Sterilization 105144 Follow up visit of Gr-III/IV malnourished/ anemic children 28825 For referring pregnant ladies to nearest ICTC 743626 Health Checkup of senior citizens 402817 Helping in installation of community /Household toilets 31438 Immunization completion (till measles before 1 yr of age) 1811419 Institutional Deliveries 14232610 Pregnant Women registered in first trimester 11246311 Reporting of Infant Mortality 77112 Reporting of Maternal Mortality 5513 IUCD insertion 4941414 PPIUCD insertion 2744715 Fully Immunized (< 1 year) 18114116 Fully Immunized (< 1 -2 year) 15269317 Facilitating Institutional delivery under JSY scheme 692218 Home based new born care 125065
30.1 DSHM is also implementing the National Health Mission Programmes of Govt. of India as per following details:-
• Reproductive, Maternal, Newborn, Child and Adolescent Health:- includes RMNCH + A, Mission Flexipool, Routine Immunization with pulse polio Immunization Program and Iodine Deficiency Disorder.
• National Urban Health Mission (NUHM) includes Communicable Disease Programme such as Integrated Disease Surveillance Project, National Leprosy Eradication Program, National Vector Borne Disease Control Program,-Revised National Tuberculosis Control Program. The Non-Communicable Disease Programme includes National Program for Prevention and Control of Cancer, Diabetes, Cardiovascular Diseases and Stoke(NPC-DCS), National Program for Control of Blindness (NPCB), National Mental Health Pro-gram (NMHP), National Programme for Health Care of the Elderly (NPHCE), National Programme for prevention and Control of Deafness (NPCCD), National Tobacco Control Programme (NTCP), National Oral Health Programme (NOHP), National Programme for Palliative Care (NPPC), National Programme for Prevention & Management of Burn Injuries (NPPMBI) etc.
30.2 Strengthening of Maternity Homes: Maternity Homes of MCD are being strengthened to provide 24x7 basic obstetrics care.

ECONOMIC SURVEY OF DELHI, 2017-18 257
30.3 Screening of JJ Clusters for Diabetes and Hypertension: Under the plan scheme Direc-torate of Public Health, implementation of non communicable disease, regular screening (Focusing on Diabetes/Hypertension) is being carried out through health centers and sus-pected adults above thirty plus are being targeted on regular basis. The diagnosed cases are provided treatment in the health centers itself & also being attended through biweekly Diabetes/Hypertension clinic in twenty-three hospitals under GNCT of Delhi.
30.4 Health Management Information System (HMIS): Around 500 Public Health facilities of GNCTD & MCD (District Hospitals, SDH, Maternity Homes of MCD, MCD M&CW Centres, Dispensaries) are equipped with computer / internet / printer for uploading data regarding monthly achievements under NRHM on HMIS Portal of GOI, which is being used by various Departments of GOI. Facilities are also uploading data on day to day basis on Mother & Child Tracking System (MCTS Portal). Mothers / Children registered on MCTS portal are tracked to ensure that the beneficiaries have availed timely due health care services and early intervention if required has been made, to reduce maternal & infant mortality.
30.5 Rogi Kalyan Samitis (RKS): RKS have been set up to overcome the problems of procedural delays, lack of community participation, unavailability of medicines, poor hygiene & cleanli-ness etc. RKS has been registered in 26 Delhi Govt. Hospital, 1 MCD Hospital & 7 Maternity Homes of East Delhi Municipal Corporation.
30.6 Mobile Dental Clinics: 2 Mobile Dental Clinics & 4 Mobile Dental IEC Vans have been oper-ationalized by MAIDS in North East District.
30.7 Mobile Mental Health Units: 2 Mobile Mental units operationalized through IHBAS for care of destitute / homeless.
30.8 National Leprosy Eradication Programme, Delhi – Free treatment of leprosy is available in all government hospitals and dispensaries in Delhi. The Tertiary care hospital also pro-vides facility of reconstructive surgery. Rehabilitation is an important part of leprosy cases especially those with deformities. Subsistence allowance to rehabilitated persons is paid @1800/-per month since April 2009 by department of social welfare. The dressing and
supportive care to the leprosy affected persons is also being provided by Health & Family Welfare department. During 2016-17, new cases detected was 1391. At the end of March 2017 there were total 2149 cases.
31 Centralized Accident & Trauma Services (CATS)
Centralised Accident and Trauma Services (CATS) is an Autonomous body of Govt. of National Capital Territory of Delhi, Providing free ambulace Services to victim of accident and trauma on 24x7 basis since 1991 with the fleet of well equipped ambulaces and well trained manpower. Recently “ Home to Hospital Care” Ambulace services scheme has been launched by Delhi government and a Modern Control Room with the aim to reduce current waiting time of 25 minutes (approx) to 15-10 minutes. 100 new Basic life support (BLS) and 10 Advance Life Support (ALS) ambulances have been in the exiting fleet under CATS. A pilot project of “ First Responder Vehicle” with 16 Motor cycle manned by trained ambulance manpower is also planned to be started in East Delhi to strengthen emergency services in congestedareas.

ECONOMIC SURVEY OF DELHI, 2017-18258
CHAPTER 17
SOCIAL WELFARE AND SECURITY
Social security is primarily a programme providing social and sustentation protection, in-ter-alia protection against poverty, oldage, disability, anemployment etc. The Constitution of India lists the matters relating to Social Security in the Directive Principles of State Policy and it is one of the subjects in the Concurrent List. As per the Directive Principles of State Policy the State shall, within the limits of its economic capacity and development, make effective provision for securing the right to work, to education and to public assis-tance in cases of unemployment, old age, sickness and disablement, and in other cases of undeserved want. It also asserts that the State shall make provision for securing just and humane conditions of work and for maternity relief.
2. The Govt. of NCT of Delhi is implementing, to attain the objectives laid down in Directive Principles of State Policy on Social Security, schemes/ programmes to ensure the welfare of weaker sections of the society, disadvantaged groups and physically challenged per-sons for better care and support. Government is implementing schemes and programmes for empowerment of women, security to aged people and vulnerable sections and creating an enabling environment for children. The Social Welfare Department deals with the mat-ters pertaining to the welfare of senior citizens, physically challenged persons and other vulnerable sections of the society, The WCD department deals with matters pertaining to Women and Child.
3. Schemes and Programmes for Women and Child Development
3.1 Integrated Child Development Scheme (ICDS):
Launched on 2nd October 1975, today, ICDS Scheme represents one of the world’s larg-est and most unique programmes for early childhood care and development. It is foremost symbol of country’s commitment to its children and nursing mothers, as a response to challenge of providing pre-school non-formal education on one hand and breaking the vicious cycle of malnutrition, morbidity, reduced learning capacity and mortality on other. Govt. of NCT of Delhi is implementing this programme in Delhi with the help of Govt. of India. ICDS program provides six services including supplementary nutrition, immuniza-tion, health check up, referral services, pre-school non-formal education and nutrition & health education throught 10897 Aanganwari centers. The ICDS is a Centrally Sponsored Scheme and cost sharing between Center and State is 50:50 for Supplementary Nutrition component and 60:40 for other than Nutrition Components. The beneficiaries under the scheme are children in age group 0-6 years, pregnant women and lactating mothers.
3.2 The Integrated Child Development Scheme (ICDS) in Delhi has 95 projects with 10,897 Aanganwadi Centres, functioning in various parts of Delhi covering a population of approx-imately 11.85 lakh children, pregnant women and nursing mothers in year 2016-17 and 12.68 lakh in year 2017-18 (upto Dec, 2017), who are economically deprived. In addition, Supplementary Nutrition (under ICDS) was given to 5.82 lakh children and women in year 2016-17 and 6.29 lakh in year 2017-18 (upto Dec, 2017) through 10897 Aanganwadi Centres. At present, supplementary is provided at the rate of 6.00 per child, 7.00 per woman and 9.00 per malnourished child per day for about 300 days in a year.

ECONOMIC SURVEY OF DELHI, 2017-18 259
3.3 The Delhi Government has enhanced the honorarium for Anganwadi Workers (AWWs) from 5000/- p.m. to 9678/- p.m. and for Anganwadi Helpers (AWHs) from 2500/- to
4839/- p.m. from August, 2017 in which Government of India contributes 1800/p.m. for AWWs and 900/- p.m. for AWHs .
3.4 Ladli Scheme
Government of Delhi started Ladli Scheme in January, 2008. The main objective of this scheme is to promote socio-economic development of the girl child by providing educa-tion- linked financial assistance. Eligibility conditions are that the girl child be born in Delhi. Her parents must be resident of Delhi for at least three years prior of filling the application and the annual family income should not exceed 1.00 lakh per annum. The amount of financial assistance at different stages is as under:-
• Under this scheme, 11,000/- are deposited in the name of the girl child if she is born in a hospital/ nursing home in NCT of Delhi on or after 1st January 2008 and 10,000/- if she is born at home or other than hospital/nursing home.
• 5,000/- is deposited in the name of girl child on admission in classes I, VI, IX, XI and Class XII.
• The maturity amount can be claimed when the girl child attains 18 years of age and passes Class X or Class XII as a regular student.
• 8.89 lakh girls have so far been registered up to March 2017 under the scheme of which 1,69,819 girls have already received the final maturity value, amounting to 216.32 Crore (2008-09 to 2016-17).
• In 2017-18 (Apr 2017- Dec 2017) No. of enrollment are 16263, No. of renewals are 50696 and maturity paid to 27216 girls.
• Year wise Financial Provision of Contribution i.e. budget allocation and expenditure under Ladli scheme since 2008-09:
Statement 17.1Year Wise Financial Provision of Contribution
S No. Year Budget (in Cr) Expenditure (in Cr)1 2008-09 86.38 86.442 2009-10 87.00 86.973 2010-11 110.00 89.264 2011-12 93.00 92.905 2012-13 105.50 103.006 2013-14 113.00 112.297 2014-15 95.65 95.648 2015-16 103.04 101.929 2016-17 103.98 96.67
Total 897.55 865.09Source: WCD, Department.

ECONOMIC SURVEY OF DELHI, 2017-18260
• Status position of Enrolment & Renewal under Ladli scheme: Statement 17.2
Status Position of Enrolment & Renewal
S. No. YearNo. of
Enrolment
Amount Paid
(in cr)
No. RenewalsAmount Paid
(in cr)
1 2008-09 125337 74.17 -- --2 2009-10 139823 83.57 -- --3 2010-11 105737 64.85 15367 7.684 2011-12 106585 63.57 54216 27.115 2012-13 96800 59.71 63805 31.96 2013-14 89246 54.96 97620 48.847 2014-15 82669 51.71 102466 52.838 2015-16 74846 45.99 99366 55.30
9 2016-17 68193 40.98 9728455.97
Total 889236 539.51 530124 279.63 Source: WCD, Department.
• Status position of Maturity Disbursed under Ladli scheme:
Statement 17.3Status Position of Maturity Disbursed
S No. Year No. of Maturity Paid
(No of Beneficiaries)
Amount Disbursed
(in cr)1 2008-09 -- --2 2009-10 1640 0.873 2010-11 19135 10.664 2011-12 11212 6.675 2012-13 11247 9.716 2013-14 20980 26.87 2014-15 20091 30.178 2015-16 47766 63.849 2016-17 37748 67.60
Total 169819 216.32

ECONOMIC SURVEY OF DELHI, 2017-18 261
3.5 Child Rights Commission
The Commission for Protection of Child Rights Act, 2005 came into force in year 2006. This act provides for constitution of State Commission and Children’s courts for providing speedy trial of offences against children or violation of child rights & for matters connected therewith or incidental thereto. Accordingly, the Delhi Commission for Protection of Child Rights was constituted in September, 2008. The Commission deals with the issues related with education, child health, child development, juvenile justice, care of neglected/margin-alised children, children with disabilities, children in distress, child psychology and laws re-lating to children. The Department has notified the courts of Additional Sessions Judge at each district as Children’s Court for trail of offences against children or of violation of child rights in terms of Section 25 of the Commissions for Protection of Child Rights Act, 2005.
3.6 Child Welfare Committees
Government has constituted 10 Child Welfare Committees and 3 Juvenile Justice Boards under the Juvenile Justice (Care and Protection of Children) Act, 2015 in order to ensure speedy and timely decisions on matter pertaining to care, protection and rehabilitation of children in need of care and protection and Juvenile in conflict with Law.
3.7 Welfare of Juveniles
The Department of Women and Child Development has set up 22 children institutions un-der the various provisions of Justice (Care and protection of Children) Act, 2015 to cater the children in need of care and protection and also the juveniles in conflict with law. These institutions include;
• Three observation home for boys.
• One observation home for girls.
• One place of safety for girls
• One special home for boys.
• 16 children homes.
Apart from above, at present there are 96 NGOs running child care institutions in Delhi.
3.8 Integrated Child Protection Scheme (ICPS)
The ICPS was launched by the Ministry of Women & Child Development in the year 2009. The scheme aims to provide a protective environment for all the children enabling them to lead a sage, secure and well protected life. The Ministry provides funds for implementation of ‘Integrated Child Protection Scheme’ in accordance with the cost sharing ratio and the State Government is primarily responsible for the effective implementation and monitoring of the scheme in the State. The Department has set up a State Child Protection Unit and 11 District Child Protection Units to implement the objective of the Scheme. At present 8 Shelter Homes, 13 Open Shelters & 3 State Adoption Agencies are being given grant through Integrated Child Protection Scheme.

ECONOMIC SURVEY OF DELHI, 2017-18262
3.9 Scheme for Financial Sustenance, Education & Welfare & Welfare of Children of incarcerated Parents
Govt. of NCT Delhi notified the scheme namely: “Scheme for Financial Sustenance, Edu-cation & Welfare & Welfare of Children of incarcerated Parents” in August 2014. Under this scheme financial assistance is given in the form of monthly payment to the child whose only surviving parents or parents are in jail. The Quantum of financial assistance to a child shall be fixed as 3500/- for the first child, additional 3000/- for the second child (incase of 3 or more children, the maximum amount of 6500/- shall be utilized for all children) till he/she attains the age of 18 years or parents are released from incarceration whichever is earlier. However, in case a child is placed with a fit institution, then such child will not be entitled to receive additional financial assistance.
The details regarding allocation of fund, expenditure incurred and beneficiaries covered under said scheme during 2015-16 to 2016-17 is presented in Statement 17.4
Statement 17.4
PERFORMANCE THE SCHEME FOR FINANCIAL SUSTENANCE, EDUCATION & WEL-FARE & WELFARE OF CHILDREN OF INCARCERATED PARENTS
Financial YearBudget Allocation
(in lakh)
Expenditure
(in lakh)No. of beneficiaries
2015-16 30.00 22.45 2282016-17 30.00 22.11 166
Source: WCD, Department.
3.10 Programmes for Women
As per 2011 census, the female population of Delhi is 77.77 lakh constituting 46.41 per cent of the total population. At the national level, female population is of 48.46 per cent of the total population. The literacy rate of the females in Delhi is 80.34 per cent as compared to 91.03 per cent of male and 86.34 per cent of the total. At the national level, literacy rate of women population is 63.46 per cent.
3.11 Financial Assistance to Women in Distress
The WCD Department is implementing the scheme ‘Pension to Women in Distress’ i.e. widowed, divorced, separated and destitute women by way of providing monthly financial assistance. This Scheme was introduced in year 2007-08 to help economically poor wid-ows with regular source of income.
Delhi Govt. enhanced financial assistance from 1500/- to 2500 per month per benefi-ciaries under this scheme from March 2017. Government also enhanced income limit for eligibility from 60,000 per annum to 1.00 Lakh per annum with resident of Delhi for five years with proof, in the age group of 18 years to lifelong.
The details regarding allocation of fund, expenditure incurred and beneficiaries covered under the scheme Financial Assistance to Women in Distress during 2015-16 to 2017-18 is presented in Statement 17.5:

ECONOMIC SURVEY OF DELHI, 2017-18 263
Statement 17.5PERFORMANCE OF WOMEN IN DISTRESS PENSION SCHEME
Financial YearBudget Allocation
(in Crore)
Expenditure
(in Crore)No. of beneficiaries
2015-16 267.58 267.10 1,58,603
2016-17 318.00 317.41 1,76,778
2017-18 445.00417.86
(upto January 2018)2,03,631
3.12 Financial Assistance to Widow for Performing Marriage of their daughter/Orphan Girls
Under this scheme, financial assistance of 30,000/- is being provided to the widows for performing marriage of their daughter and orphan girls for their marriage. The beneficiary must be a bonafide resident of Delhi. The benefit is given only up to two girls in the family. The Family income should be less than 60,000/- per annum. The existing rate of assis-tance was last enhanced in April 2012 from 25,000/- to 30,000/-.
The details regarding allocation of fund, expenditure incurred and beneficiaries covered under said scheme during 2015-16 to 2017-18 is presented in Statement 17.6 :
Statement 17.6 PERFORMANCE THE SCHEME FINANCIAL ASSISTANCE TO WIDOW FOR PER-
FORMING MARRIAGE OF THEIR DAUGHTER/ORPHAN GIRLS
Financial Year Budget Allocation
(in lakh)
Expenditure
(in lakh)No. of beneficia-
ries
2015-16 1090.00 984.40 32812016-17 990.00 981.90 3273
2017-18 1100.00503.00
(upto January, 2018)1677
3.13 Working Women Hostels
Delhi Government constructed a Working Women’s Hostel at Vishwas Nagar, Karkar-dooma, and handed over to YWCA for day-to-day management under an agreement. Presently the strength of the hostel is 100. A building of working women hostel has also been constructed at Rohini. The hostel is functional and 71 working women are staying in

ECONOMIC SURVEY OF DELHI, 2017-18264
this hostel. In order to provide safe and comfortable hostel facilities to the working women, WCD department has planned to setup/construct more new working women hostel at var-ious location in Delhi for which land is available. A Working Women Hostel constructed at Dwarka will be made functional with the capacity to home 50 working women.
3.14 The Women and Child Development Department is nodal department for the Implementa-tion of provision under the ‘Protection of Women from Domestic Violence Act 2005’. This act has come into force w.e.f. 26.10.2006 with the aim to provide more effective protection of the rights of women who are the victims of violence of any kind occurring within the fam-ily. Domestic violence, under the act includes actual abuse or harassment by way of un-lawful dowry demand to the women victim or her relatives. For implementation of this Act, the Department has appointed 17 Protection Officers to represent each district of Delhi.
3.15 A mental health unit was set up in Nirmal Chhaya Complex in February 2010 to promote the mental well being of girls and women residing there. This unit is being run by an NGO and is providing psychiatric treatment and psychological counseling to the residents of Nirmal Chhaya Complex with mental health concerns. Due to the activities of the mental health unit, the rate of restoration and rehabilitation of residents has been improved.
3.16 The Women and Child Development Department is running a short stay home for women in distress, a widow home for destitute widows and Nirmal chhaya for the victims of traf-ficking. In these homes, apart from free boarding and lodging, destitute women and girls are provided non-formal education and training in vocational trades.
3.17 The Women and Child Development Department has issued license to seven short stay homes run by NGOs, which provide safe and secure shelter to destitute women.
3.18 The department is setup two shelter homes at Sarai Rohilla and Jahangir puri exclusively for destitute women who are pregnant and lactating women, these shelter homes are be-ing managed by YWCA of Delhi. The women are being provided free boarding and lodg-ing, medical care specially, pre-natal and post- natal care. The capacity of these homes is 14 inmates (Sarai Rohilla) and 10 inmates (Jahangir Puri).
3.19 Delhi Commission for Women
Delhi Commission for Women was set up in 1996 to take up cases of violation of safe guards provided to women under the Constitution and other laws. The commission acts through its various programmes as under-
• Mahila Panchayat – Under the programme, a network of Mahila Panchayts at the grass root level spread across.
• Mobile Helpline :- The Delhi Commission for women started a Mobile Helpline the Commission is running 23 mobile vans in 11 districts.
• Crisis Intervention Centers (CIC) - Crisis intervention Centers programme is function-al on outsource basis. As a support system for the rape victims and their families. The aims and objectives of the CICs are to extend support/assistance for the victims where trauma of rape becomes a permanent scar on their psyche. System operates through NGOs which provides psychological counseling services for the victim and her family to cope with the trauma.
• Rape Crisis Cell : The prime responsibility of this cell is to aid and assist the rape
ECONOMIC SURVEY OF DELHI, 2017-18 265
victims and their families in order to overcome the trauma caused by the assault by providing immediate relief emotional counselling, assistance in filing of FIR etc. and the follow up. Free legal service is provided to the victim of Sexual assault from the time the complaint is lodged in the police station.
4. WELFARE PROGRAMMES FOR SENIOR CITIZENS, DEFFERENTLY-ABLED AND VULNERABLE PERSONS:
4.1 Government of Delhi has brought out a ‘policy for senior citizens’ in 2006 for providing social security to citizens above 60 years of age by providing old age pension. The policy envisages ensuring welfare of senior citizens and improving quality of their lives. It aims at providing assistance to enable them to cope with the problems of old age. It also propos-es affirmative action by the Government Departments in collaboration with civil society for ensuring that the existing public services for senior citizens are made more users friendly and sensitive to the needs of senior citizens.
4.2 Financial Assistance to Senior Citizen (Old Age Pension)
This scheme is being implemented by Department of Social Welfare. Under this scheme, financial assistance is remitted on monthly basis in the saving accounts of the beneficia-ries maintained in the bank, through APBS as per the Aadhar Number of beneficiaries or Electronic Clearing System (ECS) of RBI. The persons resident of Delhi for five years with proof, age of 60 years & above and having family(applicant & spouse) income less than 1,00,000/- per annum are eligible. The applicant must have a valid ID proof as listed in
notification. The Quantum of financial assistance to senior citizens having age of 70 years and above is 2500/- per month. For senior citizens having age between 60-69 years, it is 2000/- per month. Additional assistance of 500/- per month is provided to the bene-ficiaries of SC/ST/Minorities category (age between 60-69 years) besides the usual pen-sion on the production of relevant documents. This rate is effective from February, 2017 (earlier, it was 1500/- p.m & 1000/- p.m).
The details regarding allocation of fund, expenditure incurred and beneficiaries covered under the scheme pension to senior citizen in Delhi during 2012-13 to 2017-18 is present-ed in Statement 17.7.

ECONOMIC SURVEY OF DELHI, 2017-18266
Statement 17.7PERFORMANCE OF SENIOR CITIZEN PENSION SCHEME
S.No. Year Outlay
(in crore)
Expenditure
(in crore)
No. of
Beneficiaries1 2012-13 563.20 558.34 3860682 2013-14 541.00 537.88 3756683 2014-15 558.00 532.24 3318814. 2015-16 608.79 607.79 388471
5. 2016-17 682.00 638.48
381849
6 2017-18 (BE) 970.00670.96*
(up to Dec 2017)420555*
Source: - Social Welfare Department, GNCTD.
* Upto December 2017.
4.3 Old Age Homes
4.3.1 The aim and objective of the scheme ‘Setting up of Old Age Homes’ is to provide a place to senior citizens where they may live gracefully in a congenial atmosphere. The Department of Social Welfare, Government of Delhi is running two Old Age Homes - one at Bindapur and another at Sewa Sadan Complex, Lampur.
4.3.2 The following services are provided at the Old Age Homes • Free boarding/lodging at the state run Old Age Homes for free seats,• Medical Care & Counseling and• Recreational facilities and rehabilitation programme.
4.3.2 The Old Age Homes are open for:
• Senior Citizen, i.e. age 60 years and above, • Don’t have anyone to support or maintain them,• Not suffering from any infectious/communicable disease and • Resident of NCT of Delhi.
4.3.4 The Department of Social Welfare, GNCT of Delhi has planned construction of old age homes in different area of Delhi i.e. at Chitranjan Park, Rohini, Kanti Nagar, Pachim Vihar, Geeta Colony, Wazirpur and Chattarpur, Janakpuri, Sarita Vihar and Vasant Kunj to cater the needs and requirement of senior Citizents.
4.4 Recreation Facilities
4.4.1 The Government of Delhi is committed towards the well-being and holistic development of elderly citizen of Delhi for which a scheme of recreation centre is operational. It provides an avenue for the well-being and over all development of the elderly citizens in Delhi. The recreation centre for aged person provides facilities for relaxation, avenues of Social interaction for their leisure which help the senior citizens to integrate them with their families.

ECONOMIC SURVEY OF DELHI, 2017-18 267
Under this programme, Delhi Government is provided onetime non-recurring grant of ` 75,000/- to the suitable NGO/ organization/ RWA for setting up of a center and recurring grant of 20,000/- p.m. for covering operational expenses.
4.4.2 During 2016-17, 2.10 crore released as grant in favour of 107 running centers. During 2017-18, 82 recreation centers for senior citizen are funded up to Dec, 2017.
4.5 Maintenance Tribunal
4.5.1 The Government of Delhi has notified and set up 11 Maintenance Tribunals in all 11 dis-tricts to provide effective provisions for the maintenance and welfare of parents & senior citizens recognized and guaranteed under the Maintenance and Welfare of Parents and Senior Citizens Act, 2007. The Maintenance Tribunal in each district is headed by ADM as the Presiding Officer/ Chairperson along with two non-official members one of whom is female.
4.5.2 Under this Act any senior citizen or parent who is unable to maintain himself or whose chil-dren are not maintain him/her from his own earning or out of property owned by him, shall be entitled to make an application against their children for maintenance.
• Appellate Tribunal
The Government of Delhi has also notified and set up 11 Appellate Tribunals an all eleven district in the context to Maintenance Act-2007. Appellate Tribunal in each district is headed by Dy. Commissioners (Revenue) as Chairperson along with two non-official members, one of whom is female.
The total number of case filed and disposed off by the Maintenance Tribunals in all 11 districts of Delhi during the period 2014 and 2016 is presented in Statement 17.8.
Statement 17.8
Year Cases filed Disposed off cases
Pending Cases at the end of the year
2014 361 321 402015 433 363 702016 233 191 42
5. Welfare of Differently- Abled Persons
The Constitution of India ensures equality, freedom, justice and dignity of all individuals and implicitly mandates an inclusive society for all including Person with Disabilities. The Department of Social Welfare is the nodal department in GNCT of Delhi for the Welfare of Differently Abled Persons and believes in the fact “Help the Differently Abled Persons to help themselves”.

ECONOMIC SURVEY OF DELHI, 2017-18268
The Delhi Govt. through its various initiatives and program’s is rendering full support to the Differently Abled Persons, so that they can live with full participation and have equal involvement in the every aspect of Society.
5.1 For the welfare of differently abled, the Department of Social Welfare is running:
• 5 schools for deaf and dumb.
• 1 Training cum Production Center.
• 1 Sheltered Workshop for differently abled persons.
• 1 Hostel for school and college going blind boys.
• 1 School for blind.
• 6 homes and 1 school for mentally challenged children.
5.2 Under the scheme “National Programme for Rehabilitation of Person with Disabilities” two types of camps i.e., General Disability Camps and Special Disability Camps are organized by Department of Social Welfare in all districts of Delhi. General Disability Camps is orga-nized in coordination with other Govt. agencies in every districts in which persons with dis-abilities are facilitated with the facility of disability certificate, DTC Passes, ID Card by the office of Dy. Commissioner, Registration in Integrated School Railway Concession Pass etc., and Special Camps is organized to provide free Aid and Appliances to the disabled persons.
5.3 The information regarding allocation of fund, expenditure incurred, camps held and ben-eficiaries covered under the welfare program for persons with disabilities in Delhi during 2014-15 to 2016-17 is presented in Statement 17.9.
Statement 17.9
PERFORMANCE OF NATIONAL PROGRAM FOR REHABILITATION OF PERSONS WITH DISABILITIES SCHEME
S.No. Year Expenditure
(in lakh)Number of
Camps Beneficiaries1 2014-15 6.83 08 32422 2015-16 9.37 14 5000
3 2016-17 3.49 11 6000
Source: - Social Welfare Department, GNCTD.
5.4 Department of Social Welfare is implementing the scheme “Financial Assistance to Dif-ferently–Abled Persons” in which financial assistance of 2500/- p.m. is provided to the person who have more than 40 per cent disable, are between the age group of 0-59 years, have residence proof in Delhi for minimum five years prior to application, with family in-come not more than 1,00,000/- per annum. This rate is effective from February, 2017 (earlier, it was 1500/-p.m.)

ECONOMIC SURVEY OF DELHI, 2017-18 269
5.5 The information regarding allocation of fund, expenditure incurred and beneficiaries cov-ered under financial assistance to persons with special needs during 2010-11 to 2017-18 is presented in Statement 17.10.
Statement 17.10
FINANCIAL ASSISTANCE TO PERSONS WITH SPECIAL NEEDS IN DELHI
S.
No.Year
Revised outlay
(in lakh)
Expenditure
(in lakh)
No. of
Beneficiaries
1 2010-11 2650.00 1786.48 25691
2 2011-12 2850.00 2752.38 26622
3 2012-13 5800.00 5740.72 36809
4 2013-14 7800.00 7581.72 45471
5 2014-15 9200.00 7867.58 41043
6. 2015-16 10871.00 10842.00 60657
72016-17 13700.00 13552.00
71581
8. 2017-18 (BE) 18000.0012957.00
(up to Dec 2017)
75603
Source: - Social Welfare Department, GNCTD.
5.6 In order to provide a facilitating mechanism for rehabilitation of persons whose mental illness is treated & controlled after their discharge from mental hospitals, Govt. of Delhi constructed five Half Way/Long Stay Homes, These Homes are located at Dwaraka (01 unit), Rohini Sector-03 (02 units), Rohini Sector-22(01 unit) and Narela (01 unit). Three half way homes have been operationalzed namely Nav Kiran – I & II at Rohini sector – 3 for women and Nav Chetna at Rohini sector – 22 for men in year 2017-18.
6. Delhi Family Benefit Scheme
One time assistance is being provided to the poor households on the events of the death of the breadwinner. Amount of benefit is 20,000/- in case of death of primary breadwin-ner, irrespective of the cause of death viz. natural or accidental. The age of deceased should be between 18-60 yrs. ‘Bread earner’ is defined as the member of the household whose earnings contribution is the largest proportion to the total household income.
The information regarding allocation of fund, expenditure incurred and beneficiaries cov-ered under National Family Benefit Scheme during 2011-12 to 2017-18 is presented in Statement 17.11.

ECONOMIC SURVEY OF DELHI, 2017-18270
Statement 17.11
PERFORMANCE OF NATIONAL FAMILY BEFIT SCHEME
S.No. YearRevised Plan Outlay
(in lakh)
Expenditure
(in lakh)
No. of
Beneficiaries1 2010-11 215.00 207.70 20772 2011-12 258.00 253.40 25343 2012-13 270.00 269.40 26944 2013-14 310.00 282.70 28275 2014-15 360.00 337.20 33726. 2015-16 550.00 539.20 5396
7. 2016-17 700.00 695.11 7000
8. 2017-18 (BE) 1000.00596.20
(Dec 2017)2981
Source: - Social Welfare Department, GNCTD.
7. Beggars
There are 11 institutions for the beggars in various parts of Delhi, which look after beggars as and when beggars are sent to these homes under the Bombay Prevention of Begging Act, 1959 as extended to UT of Delhi. In addition to one regular Beggar Court, two mo-bile Beggars courts have been started in 2009. A table regarding details of anti begging operation & trial by beggars is presented in Statement 17.12.
Statement 17.12
Year Beggars apprehended/arrested by RCC/mobile court
Beggars committed by the Hon’ble Court
Released by the Hon’ble
Court
2014 4203 488 37152015 3402 301 31012016 2368 241 21272017
(Jan-Mar) 612 64 548
8. Welfare of Leprosy Affected Persons
A Rehabilitation Centre for Leprosy (RCL) affected persons was established during the year 1980-81. At present, Social Welfare Department is paying 1800/- per month to RCL beneficiaries as financial assistance. Most of the beneficiaries are residing in different ar-eas of Delhi such as Tahirpur (Trans Yamuna), R.K. Puram, Srinivaspuri and Patel Nagar etc. The major colony of leprosy affected persons is Tahirpur where Shelter workshop & Training cum Production Centre are located. In these centers, Department provides production work facilities to enable leprosy affected persons to make them economically

ECONOMIC SURVEY OF DELHI, 2017-18 271
independent and training facilities in handloom weaving, shoe-making, chalk making and candle making etc.
9. WELFARE OF SC/ST/OBC/MINORITIES
9.1 The Scheduled Caste population of Delhi, as per Census 2011, is 28.12 lakh accounting for 16.75 per cent of the State population (167.88 lakh). No tribes are notified as Sched-uled Tribes (STs) in the NCT of Delhi. There are 65 castes which have been notified as Other Backward Classes (OBC) in Delhi by the Delhi Backward Classes Commission but no authentic estimate is available regarding the OBC population in Delhi. The information regarding local body-wise SC population of Delhi during the last four census is presented in Statement 17.13.
Statement 17.13LOCAL BODY-WISE SCHEDULED CASTE POPULATION: 1981-2011
S. No Local Bodies 1981 1991 2001 2011
1.
Delhi Municipal Corporations
Male 5,89,317 9,40,191 12,24,992 14,53,597
Female 4,81,000 7,85,560 10,44,156 12,92,608
Total 10,70,317 17,25,751 22,69,148 27,46,205
2.
New Delhi Municipal Council (NDMC)
Male 20,967 30,043 29,919 26,545
Female 15,512 23,887 25,294 23,062
Total 36,479 53,930 52,213 49,607
S. No Local Bodies 1981 1991 2001 2011
3.
Delhi Cantonment Board (DCB)
Male 8,266 8,456 10,271 8,658
Female 6,581 6,699 8,623 7,839 Total 14,847 15,155 18,894 16,497
4 Grand Total 11,21,643 17,94,836 23,43,255 28,12,309
Source: Delhi Statistical Handbook, 2016

ECONOMIC SURVEY OF DELHI, 2017-18272
9.2. During 1961-1991, Delhi’s decadal population growth remained around 53 per cent which decreased to 47% during 1991-2001 and further decreased to 21.20% during 2001-2011. The Scheduled Caste decadal population growth rate which remained way above Del-hi’s total population growth rate during 1961-1991 and totally reversed the trend in 2001 Census when it was 30.56% against the 47% for total population. In 2011 census again it was 20.02% below the total population growth rate of 21.20% i.e. during 2001-2011. Teh-sil-wise scheduled caste population in Delhi during the last census is presented in Table 17.1. The growth of scheduled Caste population in Delhi during last six decade is present-ed in Statement 17.14.
Statement 17.14
DECENNIAL GROWTH OF SCHEDULED POPULATION IN DELHI
S. No
Years Growth in Total Population (in percent)
Growth in Scheduled Caste Population (in percent)
1. 1961 52.44 63.732. 1971 52.93 86.123. 1981 53.00 76.444. 1991 51.45 60.005. 2001 47.02 30.566. 2011 21.20 20.02
Source: - Census Handbook-2011, Registrar General &Census Commissioner of India
9.3 The rural urban classification of scheduled caste population in Delhi during the last seven census is presented in Statement 17.15.
Statement 17.15
URBAN- RURAL SCHEDULED CASTE POPULATION
S.
No
Years Urban Rural Total
1. 1951 1,44,619 63,993 2,08,6122. 1961 2,72,243 69,312 3,41,5553. 1971 5,30,699 1,04,999 6,35,6984. 1981 10,17,631 1,04,012 11,21,6435. 1991 15,87,127 2,07,709 17,94,8366. 2001 21,54,877 1,88,378 23,43,2557. 2011 27,30,126 82,183 28,12,309
Source:- Census Handbook-2011, Registrar General &Census Commissioner of India
9.4. The literacy rate of the scheduled caste population vis-a-vis the total literacy rate in Delhi is presented in Statement 17.16. The data reveals that the literacy rate of the scheduled caste population has steadily been increased from 20.86 per cent in 1961 to 70.85 per cent in 2001 but 78.89% in 2011. Although the literacy rate of scheduled caste population in 2011 was below Delhi’s literacy rate of 86.20 per cent, however, it remains above the

ECONOMIC SURVEY OF DELHI, 2017-18 273
national literacy rate of 63.07 per cent.
Statement 17.16
LITERACY RATE OF POPULATION AND SC POPULATION IN DELHI
(Per cent)
S. No
Years Total Population Scheduled Caste PopulationMale Female Total Male Female Total
1. 1961 60.75 42.55 52.75 32.15 6.80 20.862. 1971 63.71 47.75 56.61 39.22 14.32 28.153. 1981 68.40 53.07 61.54 50.21 25.89 39.304. 1991 82.01 66.99 75.29 68.77 43.82 57.605. 2001 87.33 74.71 81.67 80.77 59.07 70.856. 2011 90.90 80.80 86.20 86.77 70.01 78.89
Source:- Census Handbook-2011, Registrar General &Census Commissioner of India
9.5. In 2011, Delhi has a Scheduled Caste (SC) workforce population of 9.01 lakh which is 16.14% of total workforce population (55.87 lakh). Out of SC population of 28.12 lakhs, 32.06% of SC population is employed, whereas 31.60% of the total population is em-ployed.
10. Scheduled Caste Sub Plan (SCSP) of NCT of DelhiIn order to ensure over all development of SC community, the Scheduled Caste Sub Plan (SCSP) is being implemented in Delhi. A specific budgetary provision under all sectors of the annual plan is made for social-economic development of SCs. The progress of the sub-plan during last seven years is presented in Statement 17.17.
Statement 17.17
APPROVED OUTLAY AND SCSP COMPONENT
( in Crore)
S. No. Year Approved Outlay SCSP Component Percent1 2010-11 11400 1931.56 16.942 2011-12 14200 2419.95 17.043 2012-13 15000 2760.46 18.404 2013-14 16000 3003.25 18.775 2014-15 16700 2797.25 16.756 2015-16 19000 3470.39 18.277 2016-17 20600 3603.86 17.498. 2017-18* 18500 3773.84 20.39
Source- Department for Welfare of SC/ST/OBC/Minorities
*From 2017-18 Plan & Non –Plan have been merged.
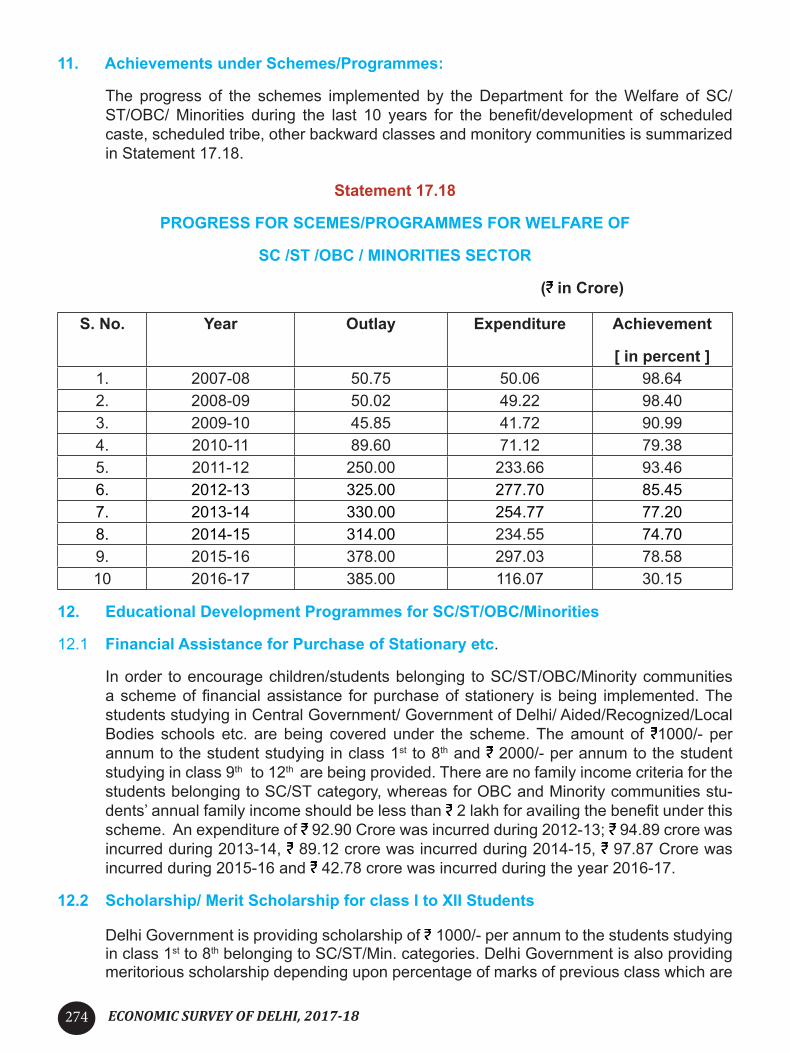
ECONOMIC SURVEY OF DELHI, 2017-18274
11. Achievements under Schemes/Programmes:
The progress of the schemes implemented by the Department for the Welfare of SC/ST/OBC/ Minorities during the last 10 years for the benefit/development of scheduled caste, scheduled tribe, other backward classes and monitory communities is summarized in Statement 17.18.
Statement 17.18
PROGRESS FOR SCEMES/PROGRAMMES FOR WELFARE OF
SC /ST /OBC / MINORITIES SECTOR
( in Crore)
S. No. Year Outlay Expenditure Achievement
[ in percent ]1. 2007-08 50.75 50.06 98.642. 2008-09 50.02 49.22 98.403. 2009-10 45.85 41.72 90.994. 2010-11 89.60 71.12 79.385. 2011-12 250.00 233.66 93.466. 2012-13 325.00 277.70 85.457. 2013-14 330.00 254.77 77.208. 2014-15 314.00 234.55 74.709. 2015-16 378.00 297.03 78.5810 2016-17 385.00 116.07 30.15
12. Educational Development Programmes for SC/ST/OBC/Minorities
12.1 Financial Assistance for Purchase of Stationary etc.
In order to encourage children/students belonging to SC/ST/OBC/Minority communities a scheme of financial assistance for purchase of stationery is being implemented. The students studying in Central Government/ Government of Delhi/ Aided/Recognized/Local Bodies schools etc. are being covered under the scheme. The amount of 1000/- per annum to the student studying in class 1st to 8th and 2000/- per annum to the student studying in class 9th to 12th are being provided. There are no family income criteria for the students belonging to SC/ST category, whereas for OBC and Minority communities stu-dents’ annual family income should be less than 2 lakh for availing the benefit under this scheme. An expenditure of 92.90 Crore was incurred during 2012-13; 94.89 crore was incurred during 2013-14, 89.12 crore was incurred during 2014-15, 97.87 Crore was incurred during 2015-16 and 42.78 crore was incurred during the year 2016-17.
12.2 Scholarship/ Merit Scholarship for class I to XII Students
Delhi Government is providing scholarship of 1000/- per annum to the students studying in class 1st to 8th belonging to SC/ST/Min. categories. Delhi Government is also providing meritorious scholarship depending upon percentage of marks of previous class which are

ECONOMIC SURVEY OF DELHI, 2017-18 275
:- (a) 600/- to 4500/- per annum for class 6th to 12th belonging to OBC category students and (b) 1620/- to 4500/- per annum for class 9th to 12th belonging to SC/ST /Minority category. Family income is not applicable to the students belonging to SC/ST communities, whereas for OBC and Minority community’s students annual family income should be less than 2 lakh for availing the benefit under this scheme. An expenditure of 79.53 crore, 81.04 crore, 77.55 crore and 76.62 were incurred during 2012-13, 2013-14, 2014-15 and 2015-16 respectively. During 2016-17, an expenditure of 32.93 crore was incurred.
12.3 Merit Scholarship for College / University Students
Delhi Government is also providing merit scholarships to the students belonging to SC/ST/OBC/Minorities communities studying in college/ professional institutions from 420/- per month to 1860/- per month. Family income is not applicable for the students belonging to SC/ST category. However, family income of 2 lakh per annum is applicable to the stu-dents belonging to OBC/Minority communities. Performance of the scheme is presented in Statement 17.19.
Statement 17.19
PERFORMANCE OF SCHEME MERIT SCHOLARSHIP FOR COLLEGE / UNIVERSITY STUDENTS
S. No. YearExpenditure
( in Crore)
No. of Beneficiaries
(students)1. 2013-14 5.80 7163
2. 2014-15 6.78 13898
3. 2015-16 7.00 11086
4 2016-17 2.93 3011* *Provisional, Source – Department for Welfare of SC/ST/OBC/MINORITIES
12.4 Reimbursement of Tuition Fee studying in Public School
Tuition and other compulsory fee of SC/ST/OBC/Minority students having family income less then 2 lakh per annum and studying in public schools are also being reimbursed by Delhi Government. The fee reimbursement is 100 % in case of the family income is up to 60,000/- per annum. The students whose family income is more than 60,000 and below 2 lakh per annum, 75% of the fee is reimbursed. Performance of the scheme is presented in Statement 17.20

ECONOMIC SURVEY OF DELHI, 2017-18276
Statement 17.20
PERFORMANCE OF SCHEME REIMBURSEMENT OF TUITION FEE IN PUBLIC SCHOOL
S. No. Year Outlay
( in Crore)
Expenditure
( in Crore)
No. of Beneficiaries
(students)1. 2012-13 9.50 9.50 6,8162. 2013-14 18.30 18.00 15,4423. 2014-15 34.00 31.80 26,7774. 2015-16 37.00 33.19 21,0905. 2016-17 42.00 5.18 1893*
*Provisional, Source – Department for Welfare of SC/ST/OBC/ MINORITIES
12.5 Hostel Facilities for SC/ST/OBC/Minority Students
In order to provide congenial study environment hostel facilities are being provided to the male and female students studying in class XI & above belonging to SC/ST/OBC/Minority communities at Dilshad Garden, Delhi. The facilities in the hostel are provided free of cost. The intake capacity of boy’s hostel is 100 students and girl’s hostel is 60 students. The income limit of parents should not exceed 2.00 lakh per annum to avail benefit under the scheme. An expenditure of 88.03 lakh was incurred in 2012-13, 149.14 lakh in 2013-14, 242.06 lakh in 2014-15, 155.13 lakh in 2015-16 and 153.26 lakh in 2016-17 on the scheme.
12.6 Residential Schools for Weaker Section of SC/OBC/Min/Orphans
Delhi Govt. vide cabinet decision no.1981 dated 31.02.2013, decided to set up a residen-tial school for SC/OBC/Min/Orphans at Issapur in collaboration with Kalinga Institute of Social Sciences (KISS). The scheme is based on “Operations, maintenance and manage-ment agreement between Department for Welfare of SC/ST/OBC/Minorities, GNCTD and KISS, Bhubaneswar. A grant of 5000/- per student per month is being provided by Delhi Govt. to the KISS Delhi to run the residential school.
Performance of the scheme is presented in Statement 17.21.

ECONOMIC SURVEY OF DELHI, 2017-18 277
STATEMENT- 17.21
PERFORMANCE OF RESIDENTIAL SCHOOLS FOR WEAKER SECTION OF SC/OBC/MINORITY/ORPHANS
Year Allocation
(in Crore)
Expenditure
(in Crore)
Students Enrolled/Class
2013-14 R 2.50 2.53
269/Class I-IIIC 6.63 6.33
2014-15 R 5.00 1.87
353/Class I-IVC 2.00 0.58
2015-16 R 4.0 2.25
369/Class I-VC 2.0 0.74
2016-17 R 4.00 2.82
473/Class I-VIC 1.00 -
2017-18 R 4.00 1.00 (up to January, 2018)
562/Class II-VIIC 5.00 -
Source – Department for Welfare of SC/ST/OBC/ MINORITIES
13. Economic Development Programmes
13.1 The Delhi Scheduled Caste, Scheduled Tribe, Financial and Development Corporation (DSCFDC) was set up to promote self-employment opportunities for the people of SC/ST communities. Further, the work to promote self-employment opportunities to the people of OBC/Minority Communities/PH was also assigned to the Corporation. It has been de-clared as State Channelizing Agency (SCA) for SC/ST/OBC/Minority Communities/Phys-ically Handicapped. The DSCFDC is implementing various schemes for the economic upliftment of the persons belonging to these communities in collaboration with respective Apex Corporations. This corporation is providing loan to the beneficiaries of SC/ST/OBC/Minority communities for their economic upliftment.
13.2 The Department is implementing a Scheme ‘Dilli Swarojgar Yojana’ for SC/ST/OBC/Min through DSCFDC. Under this scheme a loan up to 5 lakh is provided to an entrepreneur willing to start a venture in Delhi. During last two year performance is presented as under statement 17.22.

ECONOMIC SURVEY OF DELHI, 2017-18278
Statement 17.22
S. No. Year Detailed head Achievement
Expenditure
in (Lakh)1
2015-16
Composite Loan Scheme 46 45.55
2 Educational Loan Scheme 11 36.93
3 Dilli Swarojgar Yojana 70 173.45
4 Training 682 10.52
52016-17
Composite Loan Scheme 187 238.92
6 Educational Loan Scheme 14 18.69
7 Dilli Swarojgar Yojana 43 165.02
8. 2017-18
(Dec, 2017)
Composite Loan Scheme 111 220.419. Educational Loan Scheme 11 12.92
10. Dilli Swarojgar Yojana 22 68.67 Source – Department for Welfare of SC/ST/OBC/ MINORITIES
14. Improvement of SC Basties
Department is implementing the scheme “Improvement of SC Basties” with the sole ob-jectives to improve their living conditions of SCs. Under this scheme, kharanjas, road and road side drains and construction/repair of Chaupals/community centre are being carried out in those SC basties where population of SCs is more than 33% as per the census re-cord. Under this scheme work is being executed through I&FC and DUSIB of GNCTD by the DSCST. The details of expenditure under the scheme is given under statement 17.23.
Statement 17.23
EXPENDITURE INCURRED ON THE IMPROVEMENT OF SC BASTIES
AND CHAUPALS
Year No. of Chaupals No. of SC BastiesExpenditure
( In Crore)
2012-13 50 60 35.002013-14 58 58 39.86
2014-15 58 5837.63
2015-16 32 32 29.472016-17 29 36 25.16
Source – Department for Welfare of SC/ST/OBC/ MINORITIES

ECONOMIC SURVEY OF DELHI, 2017-18 279
15. Prevention of Atrocity Act
The Department for Welfare of SC/ST/OBC/ MINORITIES is also a nodal department for implementing of Prevention of Atrocity Act, 1995.
During the last three years, department has provided compensation and also incentives for the SC/ST couples. Details are as under:-
Statement 17.24
Year No. of Victims (Under PoA, Act)Amount
(in lakh)2015-16 21 6.642016-17 18 2.652017-18
(Dec, 2017)18 33.83
Statement 17.25
Year Nos. of Couples of Inter- Caste Marriage Amount
(in lakh)2015-16 3 1.502016-17 2 1.00
2017-18
(Dec 2017)
3 1.50

ECONOMIC SURVEY OF DELHI, 2017-18280
CHAPTER 18
PUBLIC DISTRIBUTION SYSTEM1. Public Distribution System is an important government intervention for supply of
foodgrains to the poor at a subsidized price. It acts as tool to control open- market prices for commodities that are distributed through the system. Government of NCT of Delhi facilitates supply of food grains to around 72.48 lakh poor people through a network of 2254 Fair Price Shops at a subsidized price on a recurring basis. Delhi Gov-ernment has so far issued 19.40 lakh National Food Security Smart Cards to eligible families covering total beneficiaries of 72.48 lakh as on 31st March 2017. Almost all the digital Food Security Cards are Aadhar enabled. Delhi was one of pioneer state in implementation of the National Food Security Act, 2013 w.e.f. 1st Sept. 2013 soon after enactment of NFSA, 2013 by Government of India.
2. The Ministry of Consumer Affairs, Food and Public Distribution, Govt. Of India, in the Targeted Public Distribution System (Control) Order dated 20th March 2015 has ear-marked the targeted beneficiaries for Delhi as 72.78 lakh including 1.57 lakh families under AAY category (Antyodaya Anna Yojana) and the balance beneficiaries under Priority Categories.The National Food Security Act, 2013 is an important legislation which marked Shift in the right to food as a legal right rather than a general entitlement and gave statutory backing to the Targeted Public Distribution System. In terms of the provision of the Act, the beneficiaries are classified into two categories i.e. Priority cat-egory (entitlement), and Antyodaya Anna Yojana (AAY; higher entitlement).
3. Department of Food Supplies and Consumer Affairs, Government of National Capital Territory of Delhi, manages the public distribution system in Delhi. At present, public distribution system in Delhi is for distribution of wheat and rice to all Food Card hold-ers under NFS Act and Sugar to AAY card holders. Govt. of Delhi has taken a number of initiatives to make the public distribution system most efficient and transparent by taking a number of steps like automation and biometric authentication in dispensing food grains through Point of Sale Machines in Fair Price Shops, developing Mobile Ap-plication like Ration Card Portability service, Issuing e-Ration Cards, sending SMS to the registered mobile numbers of the beneficiaries. Government has also designated State Grievance Commission as the State Food Commission for effective and timely redressal of grievances of beneficiaries.
5. The food entitlement to various categories of beneficiaries under Targeted Public Dis-tribution System is given in statement 18.1:

ECONOMIC SURVEY OF DELHI, 2017-18 281
Statement 18.1
Food Grains Entitlement of beneficiaries per month and the Rate
S.No. Commodity Category QuantityRate ( /- kg)
1 WheatAAY 25 Kg/Per Card
2PR 4 Kg/Member
2 Rice AAY 10 Kg/Per Card
3PR 1 Kg/Member
3 Sugar AAY 1 Kg/Per Card 13.50
Note: AAY- Antyodaya Anna Yojana, PR- Priority Household category,
6. The number of fair price shops and total number of ration cards issued by GNCTD in last 07 years is given in Statement 18.2.
Statement 18.2
DETAILS OF PUBLIC DISTRIBUTION SYSTEM IN DELHI-2010-2017
S.No. Years No. of Ration Cards (in thou-
sands)
No. of Fair Price Shops (FPS)
Licensed Shops for Kerosene
1 2010-11 3226 2474 23652 2011-12 3339 2498 23613 2012-13 3435 2479 18294 2013-14 1779 2396 Nil5 2014-15 1700 2310 Nil6 2015-16 1950 2283 Nil7 2016-17 1940 2254 Nil
7. It may be seen from the Statement 18.2 that the number of Ration Card holders dropped significantly from 34.35 lakh in 2012-13 to 17.79 lakh in 2013-14 due to implementa-tion of National Food Security Act in Delhi w.e.f. September 2013. This is due to ex-clusion of non-entitled beneficiaries from the total beneficiaries. Mainly due to ceiling of annual income of 1 lakh & other exclusion criteria under priority Group (PR) and eligibility of AAY beneficiaries There is no licensed shop for distribution of Kerosene under TPDS in Government of NCT of Delhi since Delhi had become Kerosene Free City in 2013-14.

ECONOMIC SURVEY OF DELHI, 2017-18282
8. The number of fair price shops in Delhi as on 31st march, 2017 was 2254 and on an average each fair price shops has about 861 ration cards as on 31st March, 2017.
District-wise distribution of ration cards and fair price shops is presented in Statement 18.3
Statement 18.3
DISTRICT-WISE PUBLIC DISTRIBUTION SYSTEM IN DELHI 2016-17
S.No. Districts Ration cards Per cent FPS Percent Members Percent
1 North East 298426 15.38 341 15.12 1153865 15.91
2 East 181961 9.37 237 10.51 706082 9.743 Central 142320 7.33 156 6.92 503069 6.94
4 South West 274507 14.14 321 14.24 1005771 13.87
5 South 230329 11.87 284 12.59 878897 12.12
6 New Delhi 86825 4.47 127 5.63 317000 4.37
7 West 220260 11.35 273 12.11 826107 11.39
8 North West 325408 16.77 319 14.15 1210979 16.7
9 North 180123 9.28 196 8.69 646615 8.92
Total 1940159 2254 7248385
9. It may be observed from Statement 18.3 that the highest number of cards during 2016-17 was in North West District of Delhi, while, highest number of Fair Price Shops is in North East District. The information regarding quantity of cereals and sugar allotted to Delhi and the distribution of the same through the public distribution system in Delhi during 2016-17 is depicted in statement 18.4.

ECONOMIC SURVEY OF DELHI, 2017-18 283
Statement 18.4
DISTRIBUTION OF CEREALS AND SUGAR THROUGH PDS IN DELHI 2015-16 & 2016-17
(In Quintal)
S.
NO.
Details Items Rice Wheat Sugar
2015-16 2016-17 2015-16 2016-17 2015-16 2016-17I Quantity Allotted
OTHER THAN NFS
Nil Nil Nil Nil 191172.06 190636.97
NFS (AAY+PRS+PR)
867624.06 925325.83 3334023.49 3566067.22
Nil Nil
Total 867624.06 925325.83 3334023.49 3566067.22 191172.06 190636.97
II Quantity Lifted for Distribution
OTHER THAN NFS
Nil Nil Nil Nil
189915.3 189915.3
NFS (AAY+PRS+PR)
866405.96 925291.67 3329177.86 3565943.55
Nil Nil
Total 866405.96 925291.67 3329177.86 3565943.55 189915.3 189915.3
III Percentage Distributed
OTHER THAN NFS
Nil Nil Nil Nil
99.34 99.62
NFS (AAY+PRS+PR)
99.85 99.99 99.85 99.99
Nil Nil
10. It may be seen from the table above that the cent percent food grains of rice and wheat lifted by the Government were distributed to the beneficiaries under NFS. Distribution of sugar during 2016-17 is also near to 100%.
11. Antyodaya Anna Yojana
The Scheme is for the poorest section of population who are unable to get two square meals a day on a sustained basis throughout the year and their purchasing power is so low that they are not in a position to buy food grains round the year even at BPL rates. Un-der the Scheme, the poorest of poor who are at the starving threshold are being provided 35 kg of food grains (25 kg wheat and 10 kg rice) per month, wheat @ 2/- per kg and rice @ 3/- per kg. Total 74,494 families are under this scheme.

ECONOMIC SURVEY OF DELHI, 2017-18284
12.. Food Grains at BPL Rates to Welfare Institutions As per Government of India Scheme, Govt. of NCT of Delhi is providing food grains at BPL
rates to destitute people living in welfare institutions such as beggar home, hostels for SC/ST & OBC student, home for street children, neglected and delinquent and abandoned children, juvenile, older persons, nari niketan etc. The food grain would be made available to these welfare institutions, depending on the rates at which the allocation is received from Government of India. Nineteen such institutions are registered with the Department of Food and Supplies, Govt. of NCT of Delhi under this scheme and 4218 Inmates are getting benefit under this scheme.
13. KEROSINE FREE CITY – LPG CONNECTION FOR EWS
Govt. has decided to make Delhi as Kerosene Free City in the year 2012-13. Under this Scheme Govt. of NCT of Delhi provided free LPG connection with a LPG filled cylinder along with two burner chullah and other accessories to kerosene oil user cardholders. The scheme was launched on 21.08.2012. The total number of kerosene oil users as per e-PDS database in Delhi were 356395. The scheme has since been discontinued since September, 2013 and Delhi has been declared as “Kerosene Free City” in October 2013. Distribution of Kerosene oil in GNCT of Delhi under PDS has been stopped.
14. DELHI STATE FOOD COMMISSION
Govt. of Delhi is in the process of setting up of a State Food Commission and making it functional, in terms of the provision of National Food Security Act, to handle the grievance redressal mechanism and to address non-delivery of entitlements to the eligible benefi-ciaries. The Commission will monitor and review the implementation of NFSA in efficient and transparent manner. Presently State Grievance Commission has been designated to work as Food Commission.
15. SMS ALERTS REGARDING DISPATCH OF RATION TO FPS
Recently in order to computerize Supply Chain Management of PDS operations, Specified Food Articles (SFA), off take module has been implemented in Delhi State Civil Supplies Corporation. SMS alert is being sent to Vigilance Committee headed by the Hon’ble MLA of the area, Concerned FSO, Inspectors and card holders who have registered in the website, as and when SFA is dispatched from go-down. Any Cardholder can receive SMS pertaining to any FPS, by registering their mobile number on the link: www.nfs.delhigovt.nic.in
16. POINT OF SALE DEVICE
The project for installation of e-POS devices in all FPSs implemented through M/s Bharat Electronics Ltd (BEL) who worked as System Integrator (S.I.) for execution of distribution of ration to all eligible beneficiaries through Aadhar enabled Point of Sale (AePOS) devic-es. In the month of January, 2018 total of 15,15,769 Card holders were distributed Food grains through e-PoS devices. The online monitoring is available to public on the portal http://epos.hry.gov.in/dl along with standard reports available with different parameters like stock register, allotment details, portability details, date-wise transactions detail, sale register, success & failure abstract of UIDAI, commodity allotment etc. The project is run-ning successfully at all fair price shops and proving vital to eliminate bogus ration cards

ECONOMIC SURVEY OF DELHI, 2017-18 285
17. RATION CARD PORTABILITY
For the ease of NFS beneficiaries, Department has introduced Ration Card Portability in Delhi. Under this scheme the beneficiaries can avail his/her entitlement of food grains from any FPS in Delhi. In the month of January out of 15.15 lakh card holders, 1.68 lakh Card holders availed ration through portability. This practice encourages FPS owners to provide better consumer service to attract more consumers through incentives.
18. e-RATION CARD
Facility of e-ration card has been operationlized w.e.f. April, 2015. About 10,40,095 ration card holders till date have availed the benefit by downloading the ration card from their respective places during last two years. This has brought transparency and efficient deliv-ery of the facility of ration card to the beneficiaries.
19. PAHAL
19.1 PAHAL scheme was earlier launched on 1st June 2013. It required the consumer to man-datorily have an Aadhar number for availing LPG Subsidy. After examining the difficulties faced by consumers, Government modified the scheme and re-launched it on 15-11-2014. Under the modified PAHAL Scheme, LPG Consumer can receive subsidy in his bank ac-count by two methods. Such a consumer is called CTC (Cash Transfer Compliant) once he joins the scheme and is ready to receive subsidy in the bank account. Options are:
Option I (Primary): Wherever Aadhaar number is available it will remain the medium of cash transfer. Thus, an LPG consumer who has an Aadhaar Number has to link it to the bank account number and to the LPG consumer number.
Option II (Secondary): If LPG consumer does not have an Aadhaar number, then he can directly receive subsidy in his bank account without the use of Aadhaar number. This op-tion which has now been introduced in the modified scheme ensures that LPG subsidy is not denied to an LPG consumer on account of lack of Aadhaar number.
Present Status of Pahal in Delhi as on January 2018:
Total No. of LPG Consumers 48,15,849Total No. of PAHAL beneficiaries(CTC Consumers) 38,83,456
Total No. of PAHAL beneficiaries seeded with Aadhar ATC( Number)
36,64,536
Total No. of PAHAL beneficiaries seeded with
Aadhar ATC( %)
76.10%
:

ECONOMIC SURVEY OF DELHI, 2017-18286
CHAPTER 19
TRADE AND COMMERCETrade and commerce have played a pivotal role in promoting the growth of Delhi’s economy by making a significant contribution in terms of tax revenues and providing gainful employment to a large section of the society. Delhi is the biggest trade and consumption centre in North India. Delhi distinguishes itself as a centre for entry port of trade which means that large part of its eco-nomic activity is concerned with the redistribution of goods produced elsewhere and imported for local sales as well as for export to other states i.e. interstate sales. It has attained the status of a major distribution centre by virtue of its geographical location and other historical factors, avail-ability of infrastructure facilities etc. That it is major distribution centre borne out by the fact that 49 per cent of the fuel, 47 per cent of food grains, 44 per cent of iron and steel and 78 per cent of fruit and vegetables imported to Delhi are re-exported to other parts of India as well as foreign nations also. The Master Plan of Delhi 2021 document clearly emphasize the fact the wholesale markets in Delhi deal with about 27 major commodities, covering all items especially textiles, auto parts and machinery, stationery, food items and iron and steel, etc.
2. Trade in Non-agricultural Products
2.1 The work of the Trade for Development Programme (TDP) on non-agricultural goods focuses on the implications of trade liberalization for developing countries’ capacity to develop and sustain a robust industrial base, to diversify their economic structures, to participate in the dynamic sectors of world trade and generate industrial employment. This work also concentrates on the market access conditions met by developing countries exports in international market and the ability of developing countries to use tariffs, subsidies, local content and performance requirements, export taxes and restrictions. Information available under the Value Added Tax (VAT), work force data from population census and gross state domestic products estimates do provide some meaningful estimates on the relative importance of the sector. The income from trade, hotels and restaurant in Delhi constituted 76303 crore during 2017-18 at current prices, which is nearly 13.02 per cent of Gross State Value Added of Delhi (base year 2011-12). More clearly this sector’s contribution to Gross State Value Added of Delhi during the last seven years was more than 13 percent. The information regarding number of registered dealers and receipts under / Delhi Value Added Tax in Delhi is presented in Statement 19.1.
2.2 It may be inferred from statement 19.1 that the number of registered dealers under Delhi Value Added Tax (DVAT), excluding dealers registered under Central Sales Tax Act increased from 171868 in 2003-04 to 400156 in 2016-17. During the same period the revenue increased from 4437.86 crore to 21834.76 crore.

ECONOMIC SURVEY OF DELHI, 2017-18 287
Statement 19.1REGISTERED DEALERS & RECEIPTS UNDER SALES TAX ACT/DVAT IN DELHI
S. No Years Number of Registered
Dealers
Sales Tax/ Delhi Value Added Tax Receipts( Crore)
Local Central Total1. 2003-2004 171868 3588.83 849.03 4437.862. 2004-2005 161283 4205.96 997.07 5203.033. 2005-2006 174264 5560.64 939.18 6499.824. 2006-2007 189957 6308.72 1056.94 7365.665. 2007-2008 206359 7292.51 1201.43 8493.946. 2008-2009 212665 8547.33 1122.22 9669.557.* 2009-2010 223927 9801.09 1890.82 11691.918. 2010-2011 237388 11006.03 3064.15 14070.189. 2011-2012 248829 12254.72 2149.91 14404.63
10. 2012-2013 286951 14076.80 1726.80 15803.6011. 2013-2014 264340 16176.69 1748.66 17925.3512. 2014-2015 283139 16305.81 1983.50 18289.3113. 2015-2016 308534 18164.46 4654.14 22818.6014. 2016-2017 400156 18891.14 2943.62 21834.76
Note: 1. Tax collection is gross upto 2004-05 and net of refund thereafter.
2. An amount of 2,572.97 Cr. (2015-16) and 690.53 (2016-17) is included in the above tax figure, which is received as compensation from G.O.I under Central Sales Tax.
* 341.25 Cr. received as compensation from Govt. of India was inadvertently included in 2009-10, while it was received in 2010-11.
Chart 19.1
REGISTERED DEALERS UNDER SALES TAX ACT/DVAT IN DELHI (Numbers)

ECONOMIC SURVEY OF DELHI, 2017-18288
Chart 19.2
SALES TAX/DVAT RECEIPTS (LOCAL & CENTRAL) 2002-03 to 2016-17
( Crore)
3. Economic Census
The Sixth Economic Census was a Central Sector scheme undertaken by Directorate of Eco-nomics & Statistics, Delhi conducted during 2013, covered all the entrepreneurial activities in the field of agricultural (except crop production, plantation) and non-agricultural sectors operating in the geographical boundaries of Delhi. The total number of establishments found to be operating in NCT of Delhi during 2013 comes to 8,75,308. Out of them only 1.42% were in rural areas and 98.58% in urban areas. Sixth Economic Census registered an annual growth rate of 1.94%, in absolute term there is an increase of 1,17,565 establishments over Fifth Economic Census con-ducted during 2005. Breakup of establishments in agricultural and non-agricultural reveals that 7,008 (0.80%) belong to first category and 8,68,300 (99.20%) to second. Out of total establish-ments, 4,77,498 (54.55%) were Own Account Enterprises (OAE) and 3,97,810 (45.45%) were establishments with at least one hired worker(Estt (H)). The number of persons employed by type of establishment indicates that 30,19,781 persons were employed in 8,75,308 establishments with an average of 3.45 employees per establishment. Out of total, 27,610 persons (0.91%) were employed in rural areas whereas, 29,92,171 (99.08%) were engaged in urban Delhi. In the con-text of type of establishment, 19.72% of workers were working in the establishments with no hired worker i.e.in OAE and remaining 80.28% were working in establishments with at least one hired worker. In the establishment with hired worker, persons per establishment is worked out to 6.09 as against 1.25 in the case of OAE.

ECONOMIC SURVEY OF DELHI, 2017-18 289
Statement 19.2
Number of Establishments and Employment Therein
S. No. Type of Establishments and Employ-ment
No. of Establishments
Rural Urban Total
I Agricultural Establishments (Except crop production & plantation)
(a) All Establishments 1,144 5,864 7,008
i) Own Account Establishments 825 3,560 4,385
ii) Establishments (H) 319 2,304 2,623
(b) Persons Usually workingy
i) Total 2,761 13,763 16,524
ii) Hired 661 4,995 5,656
iii) Average Employment 2.41 2.35 2.36
II Non-Agricultural Establishments
(a) All Establishments 11,297 8,57,003 8,68,300
i) Own Account Establishments 8,090 4,65,023 4,73,113
ii) Establishments (H) 3,207 3,91,980 3,95,187
(b) Persons Usually working
i) Total 24,849 29,78,408 30,03,257
ii) Hired 11,483 19,76,251 19,87,734
iii) Average Employment 2.20 3.48 3.46
III Agricultural and Non-agricultural Establishments
(a) All Establishments 1,24,41 8,62,867 8,75,308
i) Own Account Establishments 8,915 4,68,583 4,77,498
ii) Establishments (H) 3,526 3,94,284 3,97,810
(b) Persons Usually working
i) Total 27,610 29,92,171 30,19,781
ii) Hired 12,144 19,81,246 19,93,390
iii) Average Employment 2.22 3.47 3.45# Source: 6th Economic Census Report Moreover, distribution of Establishment and Employment by Major Economic Activity Group has been given in Statement 19.2.

ECONOMIC SURVEY OF DELHI, 2017-18290
Statement: 19.3
DISTRIBUTIONS OF ESTABLISHMENT AND EMPLOYMENT BY MAJOR ECONOMIC ACTIVITY GROUP
Major Economy Activity Group
Establishment EmploymentOAE Estt (H) Total OAE Estt (H) Total
Agricultural ActivitiesActivities relating to agriculture other than crop production & plantation
115 120 235 162 588 750
Livestock 4,202 2,423 6,625 7,409 7,797 15,206Forestry and Logging 35 65 100 42 435 477Fishing and aqua culture 33 15 48 47 44 91Sub-total (I) 4,385 2,623 7,008 7,660 8,864 16,524Non-Agricultural ActivitiesMining and quarrying - - - - - -Manufacturing 58,318 97,632 1,55,950 86,397 916,616 1,003,013Electricity, gas, steam and air conditioning supply 383 927 1,310 475 15,836 16,311
Water supply, sewerage, waste management and remediation activities
1,106 725 1,831 1,496 5,807 7,303
Construction 21,972 3,124 25,096 24,413 17,608 42,021Whole sale trade, retail trade & repair of motor vehicles & motor cycles
7,536 19,864 27,400 9,882 89,462 99,344
Whole sale trade ( not covered above ) 10,344 21,114 31,458 13,311 96,323 109,634Retail trade (not covered above) 1,95,779 1,16,051 3,11,830 240,456 407,043 647,499
Transportation and storage 53,148 19,424 72,572 56,618 122,384 179,002Accommodation and Food service activities 28,312 19,739 48,051 35,236 106,481 141,717Information & communication 5,524 5,433 10,957 6,643 47,524 54,167Financial and insurance activities 2,542 6,507 9,049 2,964 59,449 62,413
Real estate activities 13,804 9,327 23,131 16,550 29,502 46,052Professional, scientific & technical activities 5,708 13,132 18,840 6,802 90,377 97,179Administrative and support service activities 4,882 10,110 14,992 6,886 67,567 74,453
Education 15,037 11,791 26,828 18,340 122,846 141,186Human health & social work activities 5,520 10,919 16,439 6,625 111,627 118,252Arts entertainment, sports & amusement and recreation 1,807 1,206 3,013 2,403 9,583 11,986Other service activities not elsewhere classified 41,391 28,162 69,553 52,280 99,445 151,725
Sub-total (II) 4,73,113 3,95,187 8,68,300 587,777 2,415,480 3,003,257
Total [ST(I)+ST(II)] 4,77,498 3,97,810 8,75,308 5,95,437 24,24,344 30,19,781# Source: 6th Economic Census Report
ECONOMIC SURVEY OF DELHI, 2017-18 291
Role of Un-organized Sectors in Delhi
3.2. Trading Sector:
Directorate of Economics and Statistics, Government of National Capital Territory of Delhi conducted a survey during 1997 on un-organized trading activity in Delhi under the 53rd National Sample Survey Round (State Sample) sponsored by National Sample Survey Office (NSSO), Government of India. The coverage of the survey included two types of enterprises i.e. Own Ac-count Trading Enterprises (OATEs) operated by household members without any hired workers and Non-Directory Trading Enterprises (NDTEs) run with at least one hired worker on fairly reg-ular basis but less than 6 workers including family members. The survey report mentioned that number of un-organized trading enterprises in Delhi was at 1.99 lakh and the number of persons employed in these un-organized trading enterprises as 3.18 lakh. The contribution of this sector, which is measured in terms of Gross Value Added to the economy of Delhi, was estimated at 1.01 lakh per enterprise per annum. No further sample survey has been conducted on this subject after 1997.
3.3 Manufacturing Sector:
Directorate of Economics and Statistics, Government of National Capital Territory of Delhi con-ducted a survey during 2005-06 on un-organized manufacturing enterprises in Delhi under the 62nd National Sample Survey Round (State sample) sponsored by National Sample Survey Orga-nization, Government of India. As per the report the total number of un-organized manufacturing enterprises were estimated at 1.01 lakhs during 2005-06 and out of these 15040 (15 per cent) were Own Account Manufacturing Enterprises (without any hired worker) and 85700 (85 per cent) were Establishments operating with at least one hired worker. The total employment provid-ed by the un-organized manufacturing sector was about 4.82 lakhs. The gross value added per annum per enterprise in the un-organized manufacturing sector was 3.26 lakh. The value added per worker in this sector was estimated as 0.68 lakh per year. The value added per worker in Own Account Enterprise was 0.81 lakh and that of establishment was 3.69 lakh.
3.4 Service Sector
Directorate of Economics and Statistics, Government of NCT of Delhi conducted a survey be-tween July 2006 and June 2007 on un-organized service sector activity in Delhi under the 63rd National Sample Survey Round (State Sample). The total number of enterprises were 239447 and out of these 147281 (61.51 per cent) were Own Account Enterprises (Enterprises operating without any hired worker) and 92166 (38.49 per cent) were Establishment operating with at least one hired worker. The total employment provided by the un-organized service sector was about 6.44 lakh. The gross value Added per annum per enterprises in the un-organized service sector was 2.87 lakh. The Value Added per worker in this sector was estimated as 106895 per year. Value added per worker in OAE’s was 70372 and that of establishment was 119996 per annum.

ECONOMIC SURVEY OF DELHI, 2017-18292
3.5 Survey of unincorporated Non-Agriculture Enterprises (Manufacturing, Trading & Service Sector)
Broad activity category
Number of enterprises
Rural Urban Rural + Urban
OAE Estt All OAE Estt All OAE Estt All
(1) (2) (3) (4) (5) (6) (7) (8) (9) (10)
Manufacturing 1799 2911 4710 90691 146987 237678 92490 149898 242388
Trade 8035 2012 10047 289175 176053 465228 297210 178065 475275
Other Service 7798 2037 9835 254266 172321 426587 262064 174358 436422
Total 17632 6960 24592 634132 495361 1129493 651764 502321 1154085
% of total 1.53 0.6 2.13 54.95 42.92 97.87 56.47 43.53 100
According to 67th NSS survey conducted during July 2010 to June 2011 of unincorporated non-ag-riculture sector enterprises (Manufacturing, Trading & Service Sector ) the number of enterprises were found to be 11.54 lakh. The sector wise breakup is as follows.
The number of persons usually working in these enterprises was found to be 29.79 lakh. The sect or wise breakup is as follows:
Broad activity category
Number of Enterprises
Rural Urban Rural+Urban
OAE Estt All OAE Estt All OAE Estt All
(1) (2) (3) (4) (5) (6) (7) (8) (9) (10)
Manufacturing 2485 20499 22984 133701 747183 880884 136186 767682 903868
Trade 10462 5993 16455 371932 581823 953755 382394 587816 970210
Other Service 8170 5914 14084 298710 792864 1091574 306880 798778 1105658
Total 21117 32406 53523 804343 2121870 2926213 825460 2154276 2979736
According to the survey, the sector wise per month Gross Value Added (GVA) per enterprises and per worker at factor income and product approach (in Rs.) is presented as follows:

ECONOMIC SURVEY OF DELHI, 2017-18 293
ActivityFactor Income
Approach Product Ap-proach
GVA/Enterprise GVA/Worker GVA/Enterprise GVA/WorkerManufacturing 34561 9268 34865 9350
Trade 31307 15336 31514 15438Other Service 33431 13196 33734 13316
ALL 32793 12701 33058 12804
Moreover, latest Survey on unincorporated Non-Agriculture Enterprises has been completed in 73rd NSS round conducted during July 2015 to June 2016 & Quick estimate of survey are yet to be processed.
4. Marketing of Agricultural Produce
4.1 In modern marketing, agricultural produce has to undergo a series of transfers or ex-changes from one hand to another before it finally reaches the consumer. The National Com-mission on Agriculture defined agricultural marketing as a process which starts with a decision to produce a saleable farm commodity and it involves all aspects of market structure of system, both functional and institutional, based on technical and economic considerations and includes pre and post- harvest operations, assembling, grading, storage, transportation and distribution. The Indian Council of Agricultural Research defined involvement of three important functions, namely;
• Assembling (concentration)
• Preparation for Consumption (processing) and
• Distribution
4.2 Marketing of agricultural produce in Delhi is through a network of regulated markets. The Delhi Agricultural Marketing Board (DAMB) is the apex body established in 1977 under the Delhi Agricultural Produce Marketing (Regulation) Act 1976 which was replaced subsequently by a new Act in 1998. The Board exercises supervision and control over various agricultural produce markets and promotes better marketing of agricultural produce by developing infrastructure facil-ities. At present, there are seven principal markets functioning in Delhi and they are:
1. APMC, (MINI) Azadpur2. APMC, Narela3. APMC, Najafgarh4. APMC Keshopur5. APMC, Shahdara6. FP&EMC, Gazipur7. Flower Market, GAZIPUR

ECONOMIC SURVEY OF DELHI, 2017-18294
5. Delhi Agricultural Marketing Board (DAMB)
5.1 DAMB was established in 1977 under the provisions of Delhi Agricultural Produce Market-ing (Regulation) Act 1976 which has since been replaced by Delhi Agricultural Produce Marketing (regulation) Act, 1998. The said Act was enacted for the better regulation of the purchase, sale, and storage and processing of agricultural produce and for the establishment of markets of ag-ricultural produce in the National Capital Territory of Delhi and for markets connected therewith or incidental thereto. Under this Act organizational set up has been given to regulate the trading activity of the agricultural produce in the National Capital Territory of Delhi. Delhi Agricultural Mar-keting Board is an apex body of this organizational set up and its main functions are to provide for general improvements in the markets for their respective areas and to provide facilities for grad-ing and standardisation of agricultural produce. DAMBis in a healthy financial position and does not receive any financial assistance or grant from the Government of National Capital Territory of Delhi. The income and expenditure of DAMB over the last nine years is indicated in Statement 19.4.
Statement 19.4
FINANCIAL POSITION OF DAMB DURING 2008-09 to 2016-17
( Lakh)
S. No
Details Years 2008-09 2009-10 2010-11 2011-12 2012-13 2013-14 2014-15 2015-16 2016-17
1 Income 2099.44 2796.77 2667.42 4532.95 2518.25 3559.46 2814.13 2563 2298.02
2 Expendi-ture
3563.15 3276.2 2506.79 3176.6 860.9 1853.84 1356.69 1876.89 2911.59
3 Profit/ Loss 1463.71 (-479.43) 160.63 1356.35 1657.35 1705.62 1457.44 686.11 (-613.57)
5.2 It may be inferred from Statement 19.4 that the financial position of DAMB during the last 9 is steadily growing. The skewness of expenditure side of the DAMB during the second portion of the above mentioned period was due to the expenditure on projects in the form of Marketing infrastructure in Mandis. The income of the DAMB increased from 20.99 crore in 2008-09 to 22.98 crore in 2016-17.

ECONOMIC SURVEY OF DELHI, 2017-18 295
Chart 19.3
Financial Position of DAMB during 2008-09 to 2016-17
6. Agricultural Produce Marketing Committee (APMC) of MNI Azadpur
6.1 The Azadpur fruit and vegetable market under the agricultural produce marketing com-mittee (APMC) of MNI Azadpur is the biggest fruit and vegetable market in Asia and one of the biggest in the world. The market acts as a national distribution centre for fruits like apple, banana, orange and mango and for vegetables like potato, onion, garlic and ginger, etc,. This market was established in 1977 and presently has about 3711 commission agents/wholesalers. The market has been declared as Market of National Importance. This market is spread over in an area of about 76 acres of land and the quantity of fruits/vegetables arrived per day are around 12,418 tonnes approximate. There are 118 commodities notified for transaction in the market yards of APMC, Azadpur (i.e. 50 fruits items and 68 vegetables). The committee also provides a grower’s shed where the producers can bring and sell their produce directly to purchasers thus abolishing the role of middlemen. The information regarding financial position of APMC of MNI Azadpur during the last nine years is presented in Statement 19.5

ECONOMIC SURVEY OF DELHI, 2017-18296
Statement 19.5
FINANCIAL POSITION OF APMC AZADPUR DURING 2008-09 to 2016-17
( Lakh)
S. No Details2008-09 2009-10 2010-11 2011-12 2012-13 2013-14 2014-15 2015-16 2016-17
I Income 7817.77 8758.87 8337.71 9907.096 12052.3 13344.42 13805.21 14793.79 15308.66
II Expenditure 4445.74 4465.82 4731.96 5400.943 5760.24 17952.92 9713.16 9799.24 7103.57
III Profit/Loss 3372.03 4293.05 3605.74 4506.153 6292.06 (-4608.5) 4092.05 4994.55 8205.09
IV. Arrivals (in Lakh Tones)
a. Fruits 22.65 20.42 22.92 21.24 21.67 21.78 21.4 22.5 20.74
b. Vegetables 21.63 21.79 22.4 23.78 24.51 24.07 25.16 23.8 22.23
c. Total 44.28 44.21 45.32 45.03 46.18 45.85 46.56 46.3 42.97
6.2 It may be observed from Statement 19.5 that the financial position of the market is healthy in all the period mentioned above. The profit of the market increased from 33.72 crore in 2008-09 to 82.05 crore in 2016-17. This market has emerged as the most financially viable market committee in the National Capital Territory of Delhi.
Chart 19.4:
FINANCIAL POSITION OF APMC (MNI) AZADPUR DURING 2008-09 to 2016-17

ECONOMIC SURVEY OF DELHI, 2017-18 297
7. Agriculture Produce Marketing Committee (APMC) of Narela
7.1 The Food Grain Market under APMC Narela, spread over area of about 4 acres, was established in 1959 and is the biggest regulated market in Delhi for food grains. The notified commodities include paddy, wheat, gram, bajra, maize, jowar, gur, sugar, khandsari etc. The arrivals in this mandi are mainly from Haryana, Uttar Pradesh, Punjab and Delhi. The notified market area of APMC Narela covers entire area of NCT of Delhi excluding the market area of APMC, Shahdara and Najafgarh. The old grain market has been declare as principal market and new grain market spreading over an approx area of 33 Acres as subsidiary market. The arrivals of food grains in APMC, Narela and financial position during the last nine years are presented in Statement 19.6.
Statement 19.6
FINANCIAL POSITION OF APMC OF NARELA DURING 2008-09 to 2016-17
( Lakh)
S.No DetailsYears
2008-09 2009-10 2010-11 2011-12 2012-13 2013-14 2014-15 2015-16 2016-171 Income 1019.88 1497.01 1473.39 1450.84 2046.76 5944.22 2682.91 2112.16 2342.44
2 Expenditure 810.88 629.37 580.35 698.17 608.88 848.67 1071.97 1463.85 1089.31
3 Profit/Loss 209 867.64 893.04 752.67 1437.88 5095.55 1610.94 648.31 1253.13
4Arrival of Food Grains (Lakh
Tones)4.88 6.58 6.4 N.A 4.56 4.46 6.03 6.48 5.31
1.2 It may be inferred from Statement 19.6 that income of the APMC of Narela increased from 10.19 crore in 2008-09 to 23.42 crore in 2016-17. This clearly indicates the healthy
financial position of APMC Narela. The arrival of food grains in this market increased 4.48 lakh tones in 2008-09 to 5.31 lakh tones in 2016-17. The information regarding financial position of APMC of Narela during 2008-17 is depicted in Chart 19.5.
Chart 19.5
FINANCIAL POSITION OF APMC OF NARELA DURING 2008-17
( Lakh)

ECONOMIC SURVEY OF DELHI, 2017-18298
8. Agricultural Produce Marketing Committee (APMC) of Najafgarh
8.1 APMC Najafgarh with a main market area of about 12 acres was established in 1959 and covers the food grains such as paddy, wheat, gram, bajra, maize, jowar, gur, sugar, khandsari etc. The lion share of arrival of food grains comes from the state of Haryana and it constitutes at 95 per cent and the remaining 5 per cent from Delhi. The information regarding financial position and arrival of food grains in APMC Najafgarh during the last nine years are presented in Statement 19.7.
Statement 19.7 FINANCIAL POSITION OF APMC NAJAFGARH DURING 2008-17
( Lakh)
S. No Details
Years
2008-09 2009-10 2010-11 2011-12 2012-13 2013-14 2014-15 2015-16 2016-17
1 Income 281.24 266.08 241.35 271.73 293.66 355.74 340.24 300.59 317.1
2 Expenditure 254.68 237.79 205.81 218.2 253.94 337.34 606.12* 531.4 405.91
3 Profit/Loss 26.56 28.29 35.54 53.53 39.72 18.4(-265.88)
(-230.81) -88.81
4 Arrival of Food Grains (Lakh Tones) 1.35 0.97 0.91 1.09 0.73 0.71 1 1.2 0.99
*Exp is increased due to huge payment retirement dues during the FY 2014-15 & 2015-16
8.2 It may be observed from Statement 19.7 that the arrival of food grains in APMC in Najafgarh during 2016-17 is slightly lesser than the previous year. The arrival of food grains in this market decrease in 2016-17 to 0.99 lakh tones. The financial position of APMC, Najafgarh during 2008-17 is depicted in Chart 19.6

ECONOMIC SURVEY OF DELHI, 2017-18 299
Chart 19.6
FINANCIAL POSITION OF APMC NAJAFGARH DURING 2008-17
( Lakh)
9. Agricultural Produce Marketing Committee (APMC) of Shahdara
9.1 Agricultural Produce Marketing Committee (APMC) of Shahdara is having 37.03 Acres of area is operating from Gazipur and covers fruits and vegetables, fodder, food grain, sugar and khandsari. The total land area under the market is 37.03 Acres. The detail of income and expenditure and arrivals over the last nine years is presented in Statement 19.8.
Statement 19.8
FINANCIAL POSITION OF APMC OF SHAHDARA DURING 2008-17
( Lakh)
S.
NoDetails
Years
2007-08 2008-09 2009-10 2010-11 2011-12 2012-13 2013-14 2014-15 2015-16 2016-17
1 Income 248.96 296.45 409.17 425.56 351.79 470.43 2867.23 499.05 511.68 548.53
2 Expenditure 270.97 295.96 311.84 331.18 295.8 363.35 2749.62 510.73 1079.75 594.66
3 Profit/Loss (-22.01) 0.49 97.33 94.38 55.99 107.08 117.61 (-11.68) (-568.07) (-46.13)
4Arrival of Fruit &
Veg. (Lakh Tones)2.43 2.84 3.04 2.95 2.94 3.34 3.01 2.57 2.57 3.79
9.2 It may be inferred from Statement 19.8 that income and expenditure of AMPC at Shahadra increased considerably during the period mentioned above. The financial position of APMC Shah-dara is depicted in Chart 19.7

ECONOMIC SURVEY OF DELHI, 2017-18300
Chart 19.7
FINANCIAL POSITION OF APMC OF SHAHDARA DURING 2008-17
( Lakh)
10. Agricultural Produce Marketing Committee (APMC) of Keshopur
10.1 Agricultural Produce Marketing Committee (APMC) of Keshopur established in 2001 with an area of 15.58 acres. It has 244 shops deals with fruits and vegetables. The information regard-ing financial position of Agricultural Price Marketing Committee (APMC) of Keshopur during the last nine years is presented in Statement 19.9.
Statement 19.9
FINANCIAL POSITION OF APMC OF KESHOPUR DURING 2008-17
( Lakh)
No Details Years 2008-09 2009-10 2010-11 2011-12 2012-13 2013-14 2014-15 2015-16 2016-17
1 Income 444.3 682.33 594.98 594.96 735.66 1646.69 1328.87 936.95 874.682 Expenditure 401.16 517.65 556.37 366.8 455.83 455.14 836.46 901.01 550.533 Profit/Loss 43.14 164.68 38.61 228.16 279.83 1191.55 492.41 35.94 324.15
4 Arrival of Fruit & Veg. (Lakh Tones) 3.02 2.77 3.01 3 2.6 2.19 2.41 2.44 3.62
10.2 It may be shown from Statement 19.9 that the financial position of APMC of Keshopur during the entire period covered the study showed a positive trend. The income and financial position of APMC of Keshopur is depicted in Chart 19.8
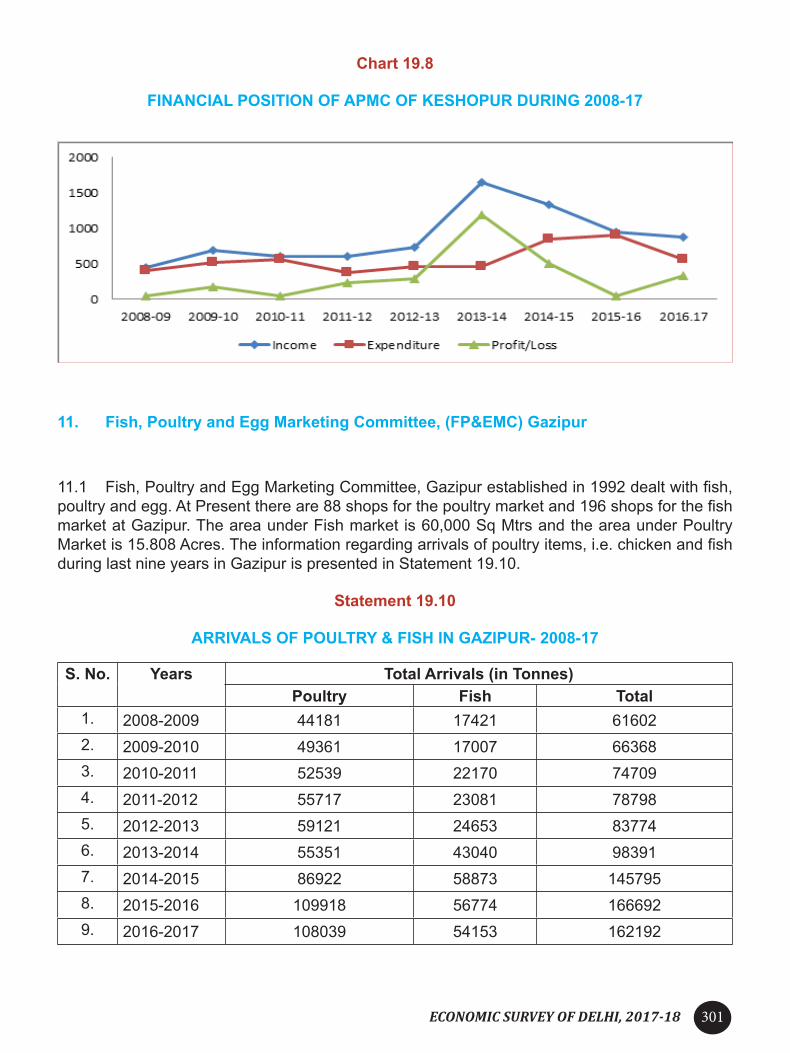
ECONOMIC SURVEY OF DELHI, 2017-18 301
Chart 19.8
FINANCIAL POSITION OF APMC OF KESHOPUR DURING 2008-17
11. Fish, Poultry and Egg Marketing Committee, (FP&EMC) Gazipur
11.1 Fish, Poultry and Egg Marketing Committee, Gazipur established in 1992 dealt with fish, poultry and egg. At Present there are 88 shops for the poultry market and 196 shops for the fish market at Gazipur. The area under Fish market is 60,000 Sq Mtrs and the area under Poultry Market is 15.808 Acres. The information regarding arrivals of poultry items, i.e. chicken and fish during last nine years in Gazipur is presented in Statement 19.10.
Statement 19.10
ARRIVALS OF POULTRY & FISH IN GAZIPUR- 2008-17
S. No. Years Total Arrivals (in Tonnes)Poultry Fish Total
1. 2008-2009 44181 17421 616022. 2009-2010 49361 17007 663683. 2010-2011 52539 22170 747094. 2011-2012 55717 23081 787985. 2012-2013 59121 24653 837746. 2013-2014 55351 43040 983917. 2014-2015 86922 58873 1457958. 2015-2016 109918 56774 1666929. 2016-2017 108039 54153 162192

ECONOMIC SURVEY OF DELHI, 2017-18302
11.2 It may be observed from Statement 19.10 that the poultry arrivals at Gazipur increased every year from 2008-2016 and decreased in 2016-17. On the contrary, fish arrivals in Gazipur increased marginally during 2008-15 and decreased in the 2015-17. The information regarding the financial position of FP&EMC Gazipur during 2008-17 is presented in Statement 19.11.
Statement 19.11
FINANCIAL POSITION OF (FP&EMC) GAZIPUR DURING 2008-17
( Lakh)
S.No. Details
Years
2008-09 2009-10 2010-11 2011-12 2012-13 2013-14 2014-15 2015-16 2016-17
1 Income 557.78 737.75 774.15 977.56 1014.67 1054.04 906.83 1275.28 1043.16
2 Expenditure 426.73 628.07 675.77 638.13 1436.8 795.47 1102.97 633.33 727.8
3 Profit/Loss 131.05 109.68 98.38 339.43 (-422.13) 258.57 (-196.14) 641.95 315.36
11.3 It may be observed from Statement 19.11 that the financial position of the Fish, Poultry and Egg Marketing Committee, Gazipur i.e. profit during 2008-112 recorded at 339.43 lakh. The financial position of (FP&EMC) at Gazipur is depicted in Chart 19.9
Chart 19.9
FINANCIAL POSITION OF (FP&EMC) GAZIPUR DURING 2008-17
( Lakh)

ECONOMIC SURVEY OF DELHI, 2017-18 303
12. Khoya/Mawa Marketing Committee, Mori Gate
12.1 Khoya/ Mawa Marketing Committee came into existence in 1997. The market has been functioning from the principal market at Mori Gate. The information regarding the financial po-sition of khoya/mawa marketing committee, Mori Gate and arrivals is presented in Statement 19.12.
Statement 19.12
FINANCIAL POSITION OF KHOYA/MAWA MARKETING COMMITTEE, MORI GATE DURING 2008-17
( Lakh)
S.
No.Details
Years
2004-05 2005-06 2006-07 2007-08 2008-09 2009-10 2010--11 2011-12 2012-13
1. Income 23.68 22.97 19.62 21.45 14.86 11.60 9.85 9.41 7.06
2. Expenditure 28.72 37.32 29.15 32.37 30.03 32.80 23.21 27.55 24.24
3. Profit/Loss (-5.04) (-14.35) (-9.53) (-10.92) (-15.17) (-21.20) (-13.36) (-18.14) (-17.18)
4.
Arrival
Khoya/ Mawa (Lakh Tones)
0.44 0.41 0.38 0.39 0.27 0.23 0.17 0.17 0.12
Khoya/Mawa Marketing Committee
Note:- The Khoya Mawa Marketing Committee came into existence in the year 1998. Earlier the Principal Market which was functioning from Bagh Diwar, Old Delhi has be de-notified vide noti-fication dated 04.06.2013. Presently, the market fee as per past practices is being collected from the market area i.e. mainly from the traders, trading from a small spaces near Mori Gate Bus Ter-minal (Mori Gate, Delhi). Since, there is no proper notified Principal market with all infrastructural facilities in Delhi, the arrival and income of the committee have been decreased drastically.
Chart 19.10
FINANCIAL POSITION OF KHOYA/MAWA MARKETING COMMITTEE, MORI GATE DURING 2008-17

ECONOMIC SURVEY OF DELHI, 2017-18304
13. Flower Marketing Committee (FMC), Mehrauli
13.1 The Flower Marketing Committee at Mehrauli started functioning in 1997 as its principal yardwith its two sub-yard at Fatehpuri, Delhi and Connaught Place respectively. The flower mar-ket at Mehrauli has now been declared as the principal market yard of the flower trade. The flower trade now has been shifted at one place i.e. F & V Market Gazipur on temporary basis. Principal market yard at Mehrauli as well as sub market yards of Fatehpuri and Connaught place have been de-notified and Gazipur has been declared as principal market yard for flower trade.
Income/ Expenditure of this committee during the last nine years is presented in Statement 19.13
Statement 19.13
FINANCIAL POSITION OF FMC, MEHRAULI - DURING 2008-17
( Lakh)
S.No Details
Years
2007-08 2008-09 2009-10 2010-11 2011-12 2012-13 2013-14 2014-15 2015-16 2016-17 1 Income 31.39 37.72 66.31 76.28 172.42 219.7 354.48 240.96 315.58 378.72
2 Expenditure 53.6 63.64 80.69 91.89 82.46 155.21 296.44 278.23 367.01 325.92
3 Profit/Loss (-22.21) (-25.92) (-14.38) (-15.61) 89.96 64.49 58.04 (-37.27) (-51.43) 52.8
10.2 It may be inferred from Statement 19.13 that the income of the FMC increased considerably from 31.39 lakh during 2008-09 to 378.72 lakh during 2016-17 the reason for increase in income is shifting of trade to temporary sheds in Gazipur mandi, Principal Yard (within the boundary) in August, 2011 resulted increase in recovery of market fee and charges of licence fee/ phar charges from the allottees. The expenditure has also increased in 2012-13 due to increase in salary and expenditure on account of maintenance of market yard & payment of Board Contribution and Ground Rent to DDA.Regarding, the construction of Ultra Modern Flower Market in 10 Acres of land in Gazipur, Delhi, the plan has already been submitted to DDA by the DAMB for approval.
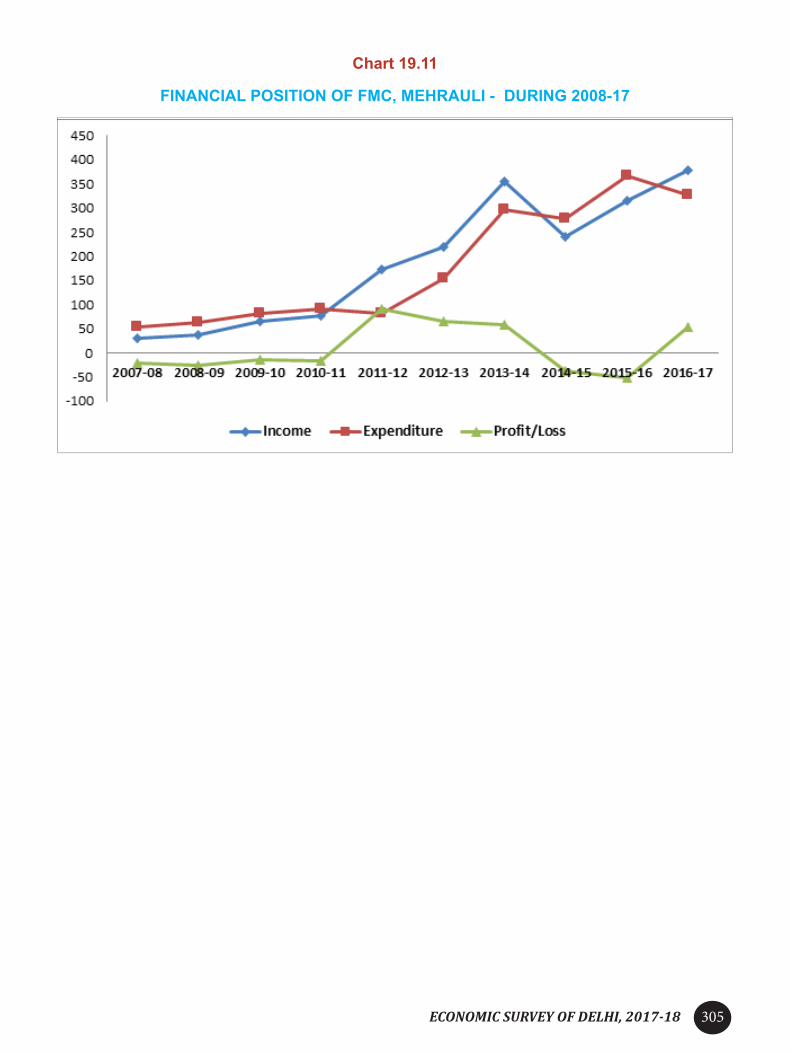
ECONOMIC SURVEY OF DELHI, 2017-18 305
Chart 19.11
FINANCIAL POSITION OF FMC, MEHRAULI - DURING 2008-17

ECONOMIC SURVEY OF DELHI, 2017-18306
CHAPTER 20
POVERTY LINE IN DELHIPoverty is a situation where the individual or communities lack the resources, ability and environment to meet the basic needs of life. Poverty is one of the issues, attracting the attention of sociologists, economists, governments, civil society organizations and almost all other organizations related to human welfare and development. It indicates a status wherein a person fails to maintain a living standard adequate for a comfortable lifestyle.
2. On the basis of National Sample Survey Organisation’s 61st Round (June 2004- July 2005), Planning Commission published State Specific poverty line for rural and urban. The poverty line was estimated at 410.38 for rural and 612.91 urban Delhi as against the national level of 356.30 for rural and 538.60 for urban India respectively. National Sample Survey Organisation’s 61st Round estimated that 22.93 lakh persons in Delhi were below the poverty line during the year 2004. Of this, 97.3 per cent of them were in urban areas of Delhi. The specific poverty line of Delhi is presented in Statement 20.1.
Statement 20.1
LEVEL OF POVERTY LINE OF DELHI( Per Capita per Month)
S. No. Years Rural Urban1. 1973-74 49.95 67.952. 1977-78 59.37 80.173. 1983 88.57 123.294. 1987-88 122.90 176.915. 1993-94 233.79 309.486. 1996-97 289.31 404.967. 1999-2000 362.68 454.118. 2004-2005 410.38 612.919. 2009-10 747.80 1040.3
10. 2011-12 1145.00 1134.00Source: Planning Commission (Now NITI Aayog) Govt. of India
3. It may be observed from Statement 20.1 that the 612.91 was the minimum monetary requirement of a person per month in urban Delhi for maintaining a minimum standard of living as prescribed by the Planning Commission during the year 2004-05. In rural area it was estimated at 410.38 per month per person. The above statement clearly indicates that in every year the amount requirement per persons per month increased considerably both in rural and urban areas. The information regarding specific poverty line of Delhi is depicted in Chart 20.1.

ECONOMIC SURVEY OF DELHI, 2017-18 307
Chart 20.1
SPECIFIC POVERTY LINE OF DELHI( Per Capita per Month)
4. The information regarding number of persons below poverty line in Delhi during 1973-2012 is presented in Statement 20.2.
Statement 20.2
PERSONS BELOW THE POVERTY LINE IN DELHI- URBAN AND RURAL (Number in Lakhs)
S. No. Years Urban Rural Total
Number Per Cent Number Per Cent Number Per Cent1. 1973-74 21.78 95.36 1.06 4.64 22.84 100.0 (49.61)2. 1977-78 16.81 92.57 1.35 7.43 18.16 100.0 (33.23)3. 1983 17.95 97.61 0.44 2.39 18.39 100.0 (26.22)4. 1987-88 10.15 99.02 0.10 0.98 10.25 100.0 (12.41)5. 1993-94 15.32 98.78 0.19 1.22 15.51 100.0 (14.69)6. 1999-2000 11.42 99.39 0.07 0.61 11.49 100.0 (8.23)7. 2004-2005 18.3 94.33 1.1 5.67 19.4 100.0 (13.0)8. 2009-10 22.9 98.28 0.30 1.29 23.3 100.0(14.2)
9. 2011-12 16.46 97.05 0.50 2.95 16.96 100.0(9.91Source: - Delhi Statistical Handbook, 2017.Note: - Figures in brackets relates to percentage to total population.

ECONOMIC SURVEY OF DELHI, 2017-18308
5. It is evident from above statement 20.2 & 20.3, that during 1973-74 near about one half of population of Delhi was below poverty line. The number of persons below poverty line in Delhi during 2011-12 was estimated at 16.96 lakh and it worked out to 9.91 per cent of the total population of Delhi. Persons below poverty level in Delhi fell to the single digit at 8 per cent of total population in 1999-2000. Due to various poverty alleviation programmes initiated by the Government of India and Government of National Capital Territory of Delhi the poverty level in India and Delhi has decreased considerably. The reduction of poverty level in Delhi and at National level may be due to various reasons such as higher growth in the service sector. The information regarding the poverty level in India and Delhi during the period covered the study is presented in Statement 20.3.
Statement 20.3PERSONS BELOW THE POVERTY LINE IN DELHI AND INDIA
(Per cent)S.
No. Years India Delhi
1. 1973-74 54.88 49.612. 1977-78 51.32 33.233. 1983 44.48 26.224. 1987-88 38.26 12.415. 1993-94 35.97 14.696. 1999-2000 26.10 8.237. 2004-2005 37.2 13.08 2009-2010 29.8 14.29 2011-2012 21.92 9.91
Source: - Delhi Statistical Handbook, 2017.
6. It may be observed from Statement 20.3 that the per cent of population below the poverty in Delhi was less than the national level in all period covered under the study. During 2011-12, 21.92 per cent of the population of India were under below poverty; while it was 9.91 per cent in Delhi. The information regarding the population below poverty line in India and Delhi during 1973-74 to 2011-12 is depicted in Chart 20.2.
Chart 20.2PERSONS BELOW THE POVERTY LINE IN DELHI AND INDIA
(Per cent)

ECONOMIC SURVEY OF DELHI, 2017-18 309
7. The poverty lines and poverty estimates pertaining to Delhi state for the year 1993-94 and 2004 is presented in Statement 20.4.
Statement 20.4POVERTY LINE & POVERTY HEAD COUNT RATIO IN DELHI- 1993-94 & 2004-05
Sl.No. Year Poverty Line ( ) Poverty Head Count Ratio (%)
Urban Rural Urban Rural Total1. 1993-94 320.30 315.40 15.7 16.2 15.7
2. 2004-05 642.47 541.39 12.9 15.6 13.1Source: - Planning Commission.
8. Level and Pattern of Household Consumer Expenditure Pattern
8.1 Directorate of Economics and Statistics is publishing a report titled “Level and Pattern of Household Consumer Expenditure of Delhi” on the basis of sample surveys conducted under National Sample Survey Organizations Rounds from time to time. The information regarding per capita expenditure on food and non food items as per 64th round (July 2007-June 2008), 66th Round (July 2009- June 2010) and 68th Round (July 2011-June 2012) is presented in Statement 20.5.

ECONOMIC SURVEY OF DELHI, 2017-18310
Statement 20.5
PER CAPITA MONTHLY EXPENDITURE ON FOOD & NON-FOOD IN DELHI
S. No. Rounds / Area Food Non-Food Total
1.
63rd Round (July 2006- to June 2007)
a. Urban 733.53 1238.66 1972.19
b. Rural 553.05 751.22 1304.27
c. Total 697.40 1141.07 1838.47
2
64th Round (July 2007-June 2008)
a. Urban 770.21 1307.83 2078.04
b. Rural 740.72 962.58 1703.30
c. Total 767.22 1278.71 2046.43
3
66th Round (July 2009- June 2010)
a. Urban 1036.21 1868.66 2904.87
b. Rural 771.28 989.75 1761.03
c. Total 1014.48 1796.57 2811.05
4
68th Round (July 2011- June 2012)
a. Urban 1489.02 2352.52 3841.54
b. Rural 1182.74 1378.41 2561.16
c. Total 1461.54 2265.12 3726.66Source: - Directorate of Economics and Statistics, GNCTD
8.2 It may be inferred from Statement 20.5 that the per capita expenditure on non-food items was higher than the food items and total per capita expenditure in all the NSS Rounds and the last Rounds (66th & 68th) increased at 32.57 per cent. The per capita expenditure on food items constituted at 39.22 per cent and the remaining 60.78 per cent on non food items as per 68th round of National Sample Survey.
8.3 The information regarding average monthly household expenditure (with average family size of 4.06) of food and non-food items during the last four rounds of National Sample Survey is presented in Statement 20.6.

ECONOMIC SURVEY OF DELHI, 2017-18 311
Statement 20.6
AVERAGE MONTHLY HOUSEHOLD EXPENDITURE IN DELHI
S.No Rounds / Area Food Non-Food Total
1
63rd Round (July 2006- to June 2007)
a. Urban 3312.26 5593.14 8905.40
b. Rural 2929.21 3978.85 6908.06
c. Total 3244.89 5309.22 8554.11
2
64th Round (July 2007-June 2008)
a. Urban 3445.38 5850.37 9295.75
b. Rural 3308.01 4298.86 7606.87
c. Total 3433.78 5719.28 9153.06
3
66th Round (July 2009- June 2010)
a. Urban 4407.12 7947.66 12354.78
b. Rural 3647.99 4681.26 8329.25
c. Total 4350.67 7704.73 12055.40
4
68th Round (July 2011- June 2012)
a. Urban 6055.23 9566.70 15621.93
b. Rural 4696.16 5473.08 10169.24
c. Total 5930.61 9191.34 15121.95Source: - Directorate of Economics and Statistics, GNCTD.
8.4 It may be seen from Statement 20.6 that average monthly household expenditure on food and non-food items during the last two Rounds (66th & 68th) has increased at 25.44 per cent in Delhi. The percentage of average monthly household expenditure on non-food items was 60.78 per cent in the 68th round and it was same as that per capita monthly expenditure on non-food items in the 68th round.
8.5 Percentage distribution of monthly per capita consumer expenditure for food and non-food items in urban Delhi and urban India is presented in Statement 20.7.

ECONOMIC SURVEY OF DELHI, 2017-18312
Statement 20.7
PERCENTAGE DISTRIBUTION OF MPCE FOR FOOD AND NON-FOOD ITEMS IN URBAN DELHI AND INDIA IN 2011-12
S. No
Items UrbanDelhi India
I. Food Items1. Cereals and Cereal Substitutes 5 72. Pulses and Products 1 23. Milk and Milk Products 11 74. Edible Oil 2 35. Meat, Egg 1 46. Vegetables 5 47. Fruits (Fresh and Dry) 3 38. Sugar/Salt/Spices 3 4
9. Beverages 9 9Sub Total 40 43
II. Non-food Items1. Pan/ Tobacco/ Intoxicant 1 22. Fuel and Light 6 73. Clothing, Bedding and Footwear 7 64. Miscellaneous Consumer Goods* 4 45. Miscellaneous Consumer Services@ 17 146. Rent 6 67. Consumer Taxes 1 18. Durable Goods 7 59. Education 8 7
10Medical (Institutional and Non-institutional) 3 5Sub Total 60 57Total Expenditure 100.00 100.00 Source:- Directorate of Economics and Statistics, Government of National Capital Territory of Delhi (National
Sample Survey 68th Round of Socio- Economic Survey 2011-12) Notes: - 1. * Miscellaneous Consumer goods includes expenditure on goods for personal care, toilet
articles and sundry articles. 2. @ Miscellaneous consumer services includes expenditure on entertainment, consumer
services and conveyances.
8.6 It may be inferred from Statement 20.7 that the every hundred rupees spent by households in urban Delhi about 40 were on food items and the remaining 60 on non-food items. In India it was 43 and 57 for food and non-food items respectively.

ECONOMIC SURVEY OF DELHI, 2017-18 313
TABLES

ECONOMIC SURVEY OF DELHI, 2017-18314

ECONOMIC SURVEY OF DELHI, 2017-18 315
Table 1.1DELHI AT A GLANCE
S. No Item Units
1 Geographical Area Sq.Km 1483
2 Rural Area Sq.Km 369.35
3 Urban Area Sq.Km 1113.65
A Administrative Setup
4 Revenue Districts No 11
5 Rural Villages No 112
6 Urban Villages No 135
B Population as per Census 2011
7 Total Population (in lakh) 167.88
8 Males (in lakh) 89.87
9 Females (in lakh) 78.01
10 Rural (in lakh) 4.19
11 Urban (in lakh) 163.69
12 Scheduled Caste (in lakh) 28.12
13 Density of Population per Sq Km 11320
14 Literacy Rate % 86.2
15 Sex Ratio Females per 1000 males 868
16 Urban Population % 97.51

ECONOMIC SURVEY OF DELHI, 2017-18316
Table 1.1 (a)DELHI AT A GLANCE
S. No Item Units 2011-12 2012-13 2013-
14 2014-15 2015-16 2016-17 2017-18
C State Income17 GSDP AT Current Prices Crore 343798 391388 443960 494885 548081 616826 686017
18 Primary Sector (GSVA) Crore 10585 10048 12741 12115 9791 11490 11964
19 % Share of Primary Sector % 3.49 2.93 3.29 2.79 2.06 2.16 2.04
20 Secondary Sector (GSVA) Crore 39682 48498 54262 53247 58073 64558 70524
21 % Share of Secondary Sector 13.09 14.17 14.07 12.27 12.19 12.12 12.04
22 Tertiary Sector (GSVA) Crore 252965 284041 318927 368805 408614 456609 503471
23 % Share of Tertiary Sector 83.42 82.90 82.64 84.94 85.75 85.72 85.92
24 Per capita Income 185361 206590 229619 249635 271305 300793 329093
D Forest25 Forest Area Sq Km 176.2 176.2 179.81 179.81 188.77 188.77 192.4126 Forest & Tree Cover Sq Km 296.20 296.20 297.81 297.81 299.77 299.77 305.41E Electricity27 Total Consumption Mu 21700 21361 23781 25111 24037 26865
N.A.
28 Industrial Consumption Mu 2989 2979 3064 3062 3135 3088
29 Comm. Consumption Mu 6253 5569 6786 6370 6053 7257
30 Domestic Consumption Mu 10396 10796 11609 12649 12560 1406031 Other Consumption Mu 2062 2017 2322 3030 2289 246032 Peak Demand MW 5028 5642 5653 5925 5846 6261F Education33 Primary + Middle Schools No 3232 3193 3437 3739 3719 3668
N.A.
34 Enrolment 000s 2983 3044 3138 3199 3222 3210
35 Secondary + Sr. Secondary Schools No 1890 1962 2016 2059 2077 2104
36 Enrolment 000s 1169 1224 1247 1214 1208 1233G Transport37 Route Length -Delhi Metro Kms 190.03 208.28 211.48 233.49
38 Total Road Lenghts Kms 32663 33198 33198 33198 33868 33868N.A.
39 Motar Vehicles in Lakh 74.38 77.74 82.95 88.27 97.05 103.83I Co-operatives
40 Total No of Co-Operative Societies No’s 5483 5526 5541 5549 5589 5648
N.A.41 No of Working Co-Operative
societies No’s 3821 3864 3879 3887 3927 3986
42 Membership 000s 1394 1396 1397 1397.5 1400 1403
S. No Item Units 2011 2012 2013 2014 2015 2016
J Demographic Status43 Birth Rate 000s 20.89 20.9 21.07 20.88 20.50 20.3844 Death Rate 000s 6.63 6.1 5.52 6.77 6.82 7.61
45 Infant mortality Rate
per 1000 live
Births
21.91 23.94 22.37 22 23.25 21.35
K Health46 Hospitals No 91 94 95 95 94 8347 Dispensaries No 1239 1318 1451 1389 1507 124048 Beds per Thousand Population No 2.51 2.47 2.47 2.68 2.73 2.86L Factories49 Working Factories No 8219 8557 8821 8968 8954 896850 Employees No 378361 392270 403270 416927 415278 416833
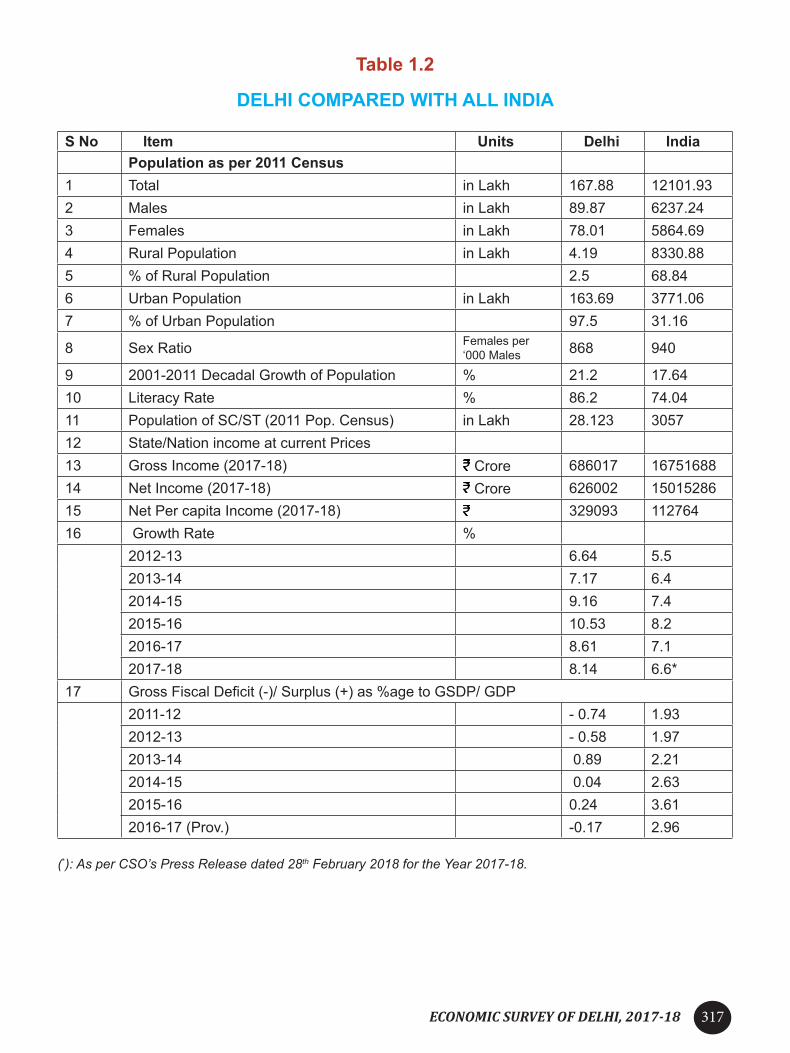
ECONOMIC SURVEY OF DELHI, 2017-18 317
Table 1.2
DELHI COMPARED WITH ALL INDIA
S No Item Units Delhi IndiaPopulation as per 2011 Census
1 Total in Lakh 167.88 12101.932 Males in Lakh 89.87 6237.243 Females in Lakh 78.01 5864.694 Rural Population in Lakh 4.19 8330.885 % of Rural Population 2.5 68.846 Urban Population in Lakh 163.69 3771.067 % of Urban Population 97.5 31.16
8 Sex Ratio Females per ‘000 Males 868 940
9 2001-2011 Decadal Growth of Population % 21.2 17.6410 Literacy Rate % 86.2 74.0411 Population of SC/ST (2011 Pop. Census) in Lakh 28.123 305712 State/Nation income at current Prices 13 Gross Income (2017-18) Crore 686017 1675168814 Net Income (2017-18) Crore 626002 1501528615 Net Per capita Income (2017-18) 329093 11276416 Growth Rate %
2012-13 6.64 5.52013-14 7.17 6.42014-15 9.16 7.42015-16 10.53 8.22016-17 8.61 7.12017-18 8.14 6.6*
17 Gross Fiscal Deficit (-)/ Surplus (+) as %age to GSDP/ GDP2011-12 - 0.74 1.932012-13 - 0.58 1.972013-14 0.89 2.212014-15 0.04 2.632015-16 0.24 3.612016-17 (Prov.) -0.17 2.96
(*): As per CSO’s Press Release dated 28th February 2018 for the Year 2017-18.

ECONOMIC SURVEY OF DELHI, 2017-18318
Table: 3.1
GSVA AND GSDP BY ECONOMIC ACTIVITY (At Current Prices)
(In Lakhs)
S. No Industry 2011-12
(R) 2012-13
(R)2013-14
(R) 2014-15
(R)2015-16 (2nd RE)
2016-17 (1st RE)
2017-18 (AE)
1. Agriculture, forestry & fishing 285663 258282 258609 247752 223812 244631 274745
1.1 Crops 65965 72784 73747 51366 36406 36366 35457
1.2 Livestock 217865 183667 182965 194500 185513 206205 237261
1.3 Forestry & Logging 1007 991 950 907 864 922 941
1.4 Fishing 826 840 947 978 1029 1138 1087
2. Mining & Quarrying 772879 746562 1015528 963777 755273 904320 921700
Primary 1058542 1004844 1274136 1211529 979084 1148951 1196445
3. Manufacturing 1890728 2334979 2533769 2338536 2461157 2584028 2775556
4. Electricity, Gas, Water Supply & other Utility Services 410629 728253 909505 999595 1315737 1613108 1804589
5. Construction 1666852 1786576 1982965 1986540 2030385 2258644 2472288
Secondary 3968208 4849808 5426239 5324672 5807279 6455780 7052433
6. Trade, hotels & restaurants 4212068 4905111 5653195 5823342 6378606 7081389 7630323
6.1 Trade & Repair Services 3806351 4458194 5170922 5316145 5817417 6457834 6944223
6.2 Hotels & Restaurants 405718 446917 482273 507197 561189 623555 686100
7. Transport, Storage & Communication 3928648 4532460 4996587 6516636 7410089 8280417 9122357
7.1 Railways 189925 206326 257746 295342 307735 351621 385300
7.2 Road transport 664297 718643 713493 717790 739613 770374 795710
7.3 Water transport 546 597 541 574 688 801 914
7.4 Air transport 98961 178752 146607 245567 430644 615684 800686
7.5 Services incidental to transport 2368549 2748291 3059301 4318758 4899660 5380345 5860931
7.6 Storage 21247 24271 27667 27712 30947 34193 37450
7.7 Communication & Services related to broadcasting 585124 655579 791232 910893 1000802 1127400 1241366
8. Financial Services 5388295 5992774 6449101 6974870 7516907 8058944 8600981
9. Real estate, ownership of dwellings & professional services 7248036 8242110 9618429 11642799 13231046 15061973 16948338
10. Public Administration 1956780 1802578 1876396 2045614 2046183 2269981 2475272
11. Other Services 2562671 2929069 3299008 3877234 4278556 4908209 5569781
Tertiary 25296499 28404102 31892716 36880495 40861386 45660913 50347053TOTAL GROSS STATE VALUE ADDED At Basic Prices 30323249 34258754 38593091 43416696 47647749 53265644 58595931
Product Taxes 4442090 5380588 6308016 6464315 7740414 9031613 10568852
Product Subsidies 385589 500578 505118 392546 580023 614691 563045
GROSS STATE DOMESTIC PRODUCT At Market Prices 34379750 39138764 44395989 49488465 54808140 61682567 68601738
Population (in '00) 169750 173000 176310 179690 183140 186640 190220
Per Capita GSDP (In ) 202532 226236 251806 275410 299269 330490 360644
Note: (R):- Revised Estimates, (2nd RE):- Second Revised Estimates, (1st RE):- First Revised Estimates, (AE):- Advance Estimates,
#:- Population Projected and Supplied by CSO, on the basis of 2011 Census
Totals may not tally due to rounding off.

ECONOMIC SURVEY OF DELHI, 2017-18 319
Table: 3.2
NSVA AND NSDP BY ECONOMIC ACTIVITY (At Current Prices)
(In Lakhs)
S. No Industry 2011-12
(R) 2012-13
(R)2013-14
(R) 2014-15
(R)2015-16 (2nd RE)
2016-17 (1st RE)
2017-18 (AE)
1. Agriculture, forestry & fishing 279933 252392 251979 240408 215971 236293 265910
1.1 Crops 62741 69039 69272 46291 30813 30255 28828
1.2 Livestock 215467 181627 180921 192397 183427 204136 235209
1.3 Forestry & Logging 996 980 939 833 795 858 882
1.4 Fishing 729 746 847 886 936 1044 992
2. Mining & Quarrying 679588 655963 869632 818162 629927 799243 836892
Primary 959521 908355 1121610 1058570 845897 1035536 1102802
3. Manufacturing 1591119 2008472 2205990 1986198 2108289 2230630 2421628
4. Electricity, Gas, Water Supply & other Utility Services 261375 468099 590568 645547 884861 1105404 1220057
5. Construction 1588185 1692371 1862414 1869749 1912097 2142363 2357139
Secondary 3440678 4168942 4658972 4501495 4905247 5478398 5998824
6. Trade, hotels & restaurants 3927832 4559580 5244633 5361930 5871362 6528313 7031415
6.1 Trade & Repair Services 3554473 4148003 4799955 4894980 5354270 5952705 6397112
6.2 Hotels & Restaurants 373360 411577 444678 466950 517092 575608 634303
7. Transport, Storage & Communication 3410354 3868858 4226076 5618824 6452427 7275226 8062012
7.1 Railways 167350 179321 216759 248159 251103 287708 313565
7.2 Road transport 621827 674917 671321 675227 695425 724561 748272
7.3 Water transport 354 357 301 363 393 422 451
7.4 Air transport 26337 100553 71624 164024 359226 554391 749518
7.5 Services incidental to transport 2099967 2353730 2646588 3807144 4319367 4741525 5156502
7.6 Storage 18189 21015 23402 23236 25930 28635 31351
7.7 Communication & Services related to broadcasting 476331 538964 596081 700671 800983 937984 1062353
8. Financial Services 5303210 5886620 6341724 6846210 7374929 7905713 8434875
9. Real estate, ownership of dwellings & professional services 6659468 7525305 8743473 10360384 11615195 13163317 14739223
10. Public Administration 1511908 1403336 1471122 1620121 1647182 1897472 2129255
11. Other Services 2195529 2539005 2873593 3417525 3814136 4439078 5095939
Tertiary 23008302 25782704 28900621 33224994 36775230 41209120 45492719TOTAL NET STATE VALUE ADDED At Basic Prices 27408501 30860001 34681203 38785059 42526374 47723053 52594345
Product Taxes 4442090 5380588 6308016 6464315 7740414 9031613 10568852
Product Subsidies 385589 500578 505118 392546 580023 614691 563045NET STATE DOMESTIC PRODUCT At Market Prices 31465002 35740011 40484101 44856828 49686765 56139976 62600151
Population (in'00) 169750 173000 176310 179690 183140 186640 190220
Per Capita NSDP (In ) 185361 206590 229619 249635 271305 300793 329093
Note: (R):- Revised Estimates, (2nd RE):- Second Revised Estimates, (1st RE):- First Revised Estimates, (AE):- Advance Estimates, #:- Population Projected and Supplied by CSO, on the basis of 2011 CensusTotals may not tally due to rounding off.

ECONOMIC SURVEY OF DELHI, 2017-18320
Table: 3.3
GSVA AND GSDP BY ECONOMIC ACTIVITY (At Constant Prices)
(In Lakhs)
S. No. Industry 2011-12
(R) 2012-13
(R)2013-14
(R) 2014-15
(R)2015-16 (2nd RE)
2016-17 (1st RE)
2017-18 (AE)
1. Agriculture, forestry & fishing 285663 223585 208519 181509 165784 176490 192112
1.1 Crops 65965 60904 55187 27745 21338 21454 21331
1.2 Livestock 217865 161036 151777 152232 142948 153505 169302
1.3 Forestry & Logging 1007 874 796 779 706 705 705
1.4 Fishing 826 771 760 753 793 825 774
2. Mining & Quarrying 772879 682516 853635 931358 985784 1237000 1316628
Primary 1058542 906101 1062154 1112867 1151568 1413490 1508741
3. Manufacturing 1890728 2203494 2293900 2059112 2191629 2270873 2369717
4. Electricity, Gas, Water Supply & other Utility Services 410629 676885 805799 846439 1077490 1238409 1346052
5. Construction 1666852 1631484 1680535 1607624 1581621 1688379 1791297
Secondary 3968208 4511864 4780234 4513175 4850741 5197661 5507065
6. Trade, hotels & restaurants 4212068 4589077 5028156 5119061 5823412 6357246 6622866
6.1 Trade & Repair Services 3806351 4170957 4599100 4672979 5310772 5797082 6026922
6.2 Hotels & Restaurants 405718 418120 429056 446083 512640 560164 595945
7. Transport, Storage & Communication 3928648 4319489 4603614 6083941 7120845 7476880 8072994
7.1 Railways 189925 197386 241272 259049 261387 263725 273189
7.2 Road transport 664297 685228 658151 674215 716944 702972 712622
7.3 Water transport 546 569 499 539 667 731 819
7.4 Air transport 98961 170441 135235 230659 417445 561816 717078
7.5 Services incidental to transport 2368549 2620504 2822007 4056579 4749491 4909607 5248937
7.6 Storage 21247 22705 24598 24342 28225 30655 32450
7.7 Communication & Services related to broadcasting 585124 622656 721851 838558 946687 1007374 1087900
8. Financial Services 5388295 5914328 6218539 6668462 7013670 7358878 7787115
9. Real estate, ownership of dwellings & professional services 7248036 7515151 8027468 9229346 9999603 10816054 11705195
10. Public Administration 1956780 1662494 1604411 1665411 1604147 1703483 1789594
11. Other Services 2562671 2674740 2837901 3235552 3413028 3751282 4203542
Tertiary 25296499 26675279 28320089 32001773 34974705 37463822 40181306TOTAL GROSS STATE VALUE ADDED At Basic Prices 30323249 32093243 34162477 37627815 40977014 44074973 47197112
Product Taxes 4442090 4998368 5527879 5561547 6815491 7781995 8770389
Product Subsidies 385589 428775 399518 299438 386734 369889 287509
GROSS STATE DOMESTIC PRODUCT At Market Prices 34379750 36662837 39290838 42889924 47405772 51487079 55679993
Population (in '00) 169750 173000 176310 179690 183140 186640 190220
Per Capita GSDP (In ) 202532 211924 222851 238688 258850 275863 292714
Note: (R):- Revised Estimates, (2nd RE):- Second Revised Estimates, (1st RE):- First Revised Estimates, (AE):- Advance Estimates, #:- Population Projected and Supplied by CSO, on the basis of 2011 CensusTotals may not tally due to rounding off.

ECONOMIC SURVEY OF DELHI, 2017-18 321
Table: 3.4
NSVA AND NSDP BY ECONOMIC ACTIVITY (At Constant Prices)
(In Lakhs)
S. No Industry 2011-12
(R) 2012-13
(R)2013-14
(R) 2014-15
(R)2015-16 (2nd RE)
2016-17 (1st RE)
2017-18 (AE)
1. Agriculture, forestry & fishing 279933 218119 202766 175401 159401 169832 185179
1.1 Crops 62741 57427 51344 23591 16954 16840 16487
1.2 Livestock 215467 159146 149965 150422 141092 151603 167354
1.3 Forestry & Logging 996 864 786 716 645 646 648
1.4 Fishing 729 682 672 672 711 742 690
2. Mining & Quarrying 679588 596258 720020 805959 880138 1151107 1250488
Primary 959521 814377 922786 981360 1039539 1320939 1435668
3. Manufacturing 1591119 1892053 1992032 1744053 1873117 1948908 2044299
4. Electricity, Gas, Water Supply & other Utility Services 261375 426142 506645 529953 691015 781945 819599
5. Construction 1588185 1541608 1567100 1499307 1471312 1576078 1677004
Secondary 3440678 3859804 4065777 3773313 4035445 4306931 4540901
6. Trade, hotels & restaurants 3927832 4263509 4656243 4713979 5369176 5853856 6070322
6.1 Trade & Repair Services 3554473 3878864 4261668 4303266 4895951 5337153 5521885
6.2 Hotels & Restaurants 373360 384645 394575 410714 473225 516703 548438
7. Transport, Storage & Communication 3410354 3681356 3874209 5287927 6273091 6577386 7121760
7.1 Railways 167350 172061 203864 218011 212482 206953 208550
7.2 Road transport 621827 643374 619126 634576 675631 659985 667961
7.3 Water transport 354 338 276 343 392 377 386
7.4 Air transport 26337 95334 65566 154522 350953 504969 669876
7.5 Services incidental to transport 2099967 2241848 2433432 3604416 4234370 4331528 4607900
7.6 Storage 18189 19635 20723 20437 23743 25596 26814
7.7 Communication & Services related to broadcasting 476331 508766 531221 655622 775521 847978 940274
8. Financial Services 5303210 5811414 6116374 6554414 6888144 7221874 7638633
9. Real estate, ownership of dwellings & professional services 6659468 6837259 7218182 8132623 8640025 9193621 9819907
10. Public Administration 1511908 1278842 1226414 1280577 1241039 1362101 1469938
11. Other Services 2195529 2303176 2444405 2831981 2999698 3328193 3770694
Tertiary 23008302 24175556 25535827 28801501 31411173 33537030 35891254
TOTAL NET STATE VALUE ADDED At Basic Prices 27408501 28849736 30524390 33556174 36486157 39164900 41867823
Product Taxes 4442090 4998368 5527879 5561547 6815491 7781995 8770389
Product Subsidies 385589 428775 399518 299438 386734 369889 287509
NET STATE DOMESTIC PRODUCT At Market Prices 31465002 33419330 35652751 38818283 42914915 46577006 50350704
Population (in'00) 169750 173000 176310 179690 183140 186640 190220
Per Capita NSDP (In ) 185361 193175 202216 216029 234328 249555 264697
Note: (R): Revised Estimates, (2nd RE):- Second Revised Estimates, (1st RE):- First Revised Estimates, (AE):- Advance Estimates, #:- Population Projected and Supplied by CSO, on the basis of 2011 CensusTotals may not tally due to rounding off.

ECONOMIC SURVEY OF DELHI, 2017-18322
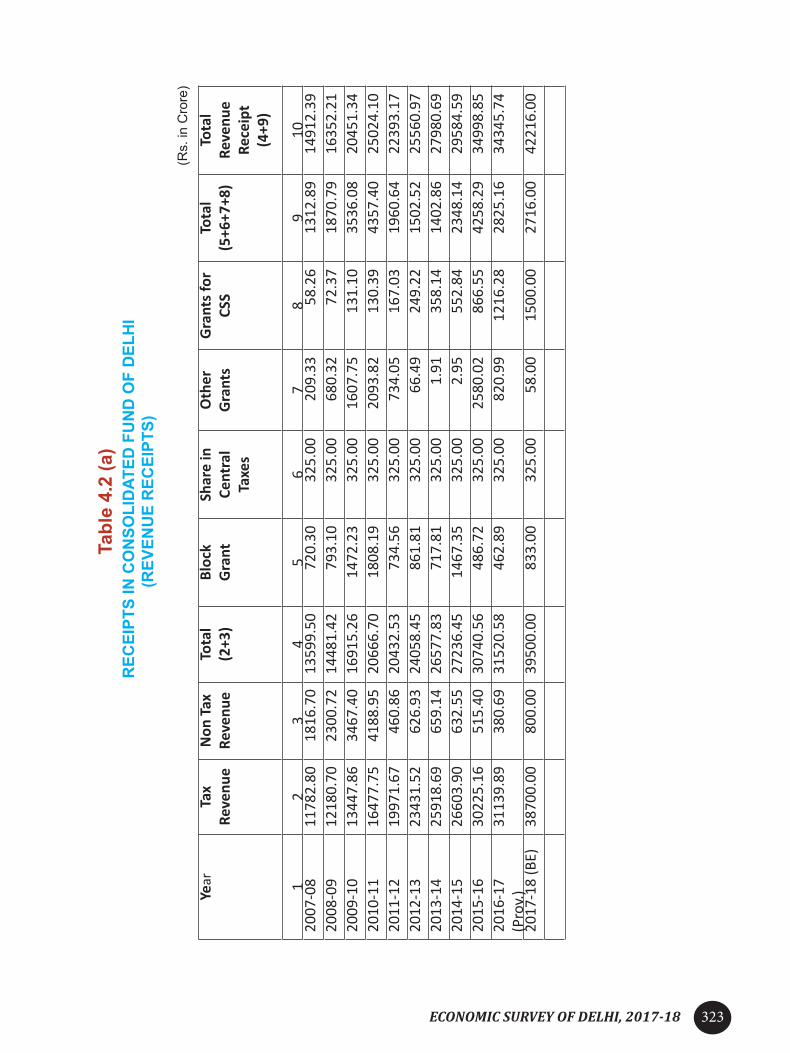
ECONOMIC SURVEY OF DELHI, 2017-18 323
Year
Tax
Reve
nue
Non
Tax
Re
venu
eTo
tal
(2+3
)Bl
ock
Gra
ntSh
are
in
Cent
ral
Taxe
s
Oth
er
Gra
nts
Gra
nts f
or
CSS
Tota
l (5
+6+7
+8)
Tota
l Re
venu
e Re
ceip
t (4
+9)
12
34
56
78
910
2007
-08
1178
2.80
1816
.70
1359
9.50
720.
3032
5.00
209.
3358
.26
1312
.89
1491
2.39
2008
-09
1218
0.70
2300
.72
1448
1.42
793.
1032
5.00
680.
3272
.37
1870
.79
1635
2.21
2009
-10
1344
7.86
3467
.40
1691
5.26
1472
.23
325.
0016
07.7
513
1.10
3536
.08
2045
1.34
2010
-11
1647
7.75
4188
.95
2066
6.70
1808
.19
325.
0020
93.8
213
0.39
4357
.40
2502
4.10
2011
-12
1997
1.67
460.
8620
432.
5373
4.56
325.
0073
4.05
167.
0319
60.6
422
393.
1720
12-1
323
431.
5262
6.93
2405
8.45
861.
8132
5.00
66.4
924
9.22
1502
.52
2556
0.97
2013
-14
2591
8.69
659.
1426
577.
8371
7.81
325.
001.
9135
8.14
1402
.86
2798
0.69
2014
-15
2660
3.90
632.
5527
236.
4514
67.3
532
5.00
2.95
552.
8423
48.1
429
584.
5920
15-1
6 30
225.
1651
5.40
3074
0.56
486.
7232
5.00
2580
.02
866.
5542
58.2
934
998.
8520
16-1
7 (P
rov.)
3113
9.89
380.
6931
520.
5846
2.89
325.
0082
0.99
1216
.28
2825
.16
3434
5.74
2017
-18
(BE)
3870
0.00
800.
0039
500.
0083
3.00
325.
0058
.00
1500
.00
2716
.00
4221
6.00
Tabl
e 4.
2 (a
) R
ECEI
PTS
IN C
ON
SOLI
DAT
ED F
UN
D O
F D
ELH
I (R
EVEN
UE
REC
EIPT
S)
(Rs.
in C
rore
)

ECONOMIC SURVEY OF DELHI, 2017-18324

ECONOMIC SURVEY OF DELHI, 2017-18 325

ECONOMIC SURVEY OF DELHI, 2017-18326
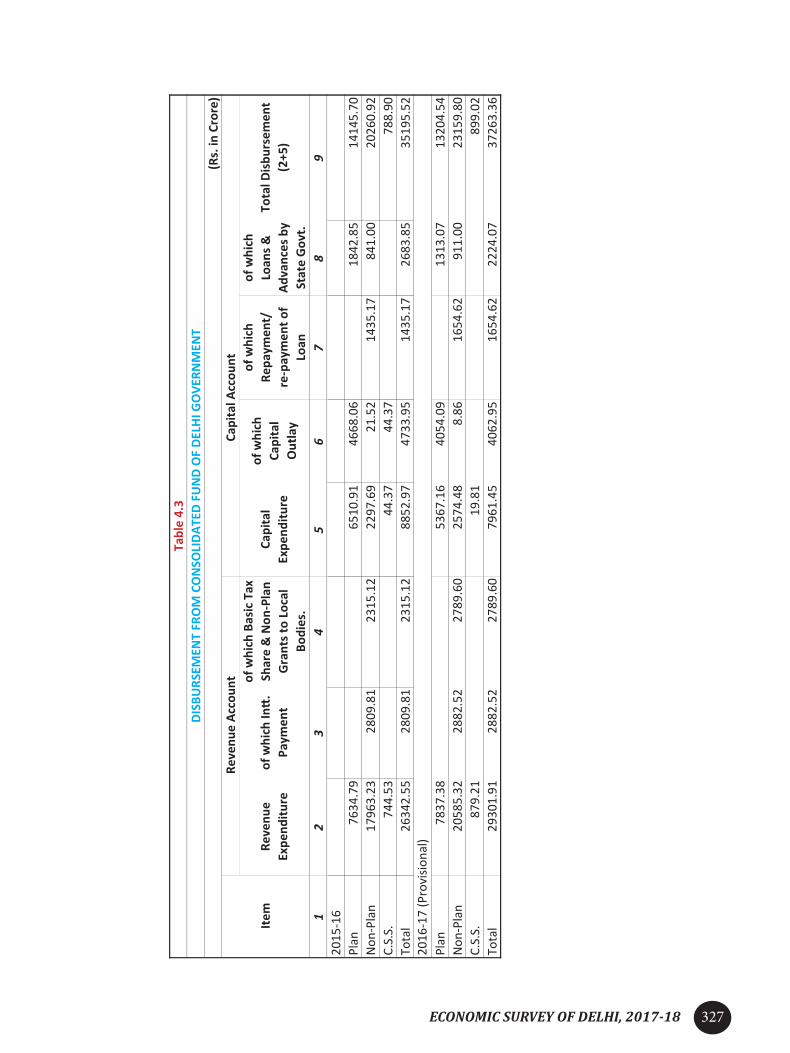
ECONOMIC SURVEY OF DELHI, 2017-18 327

ECONOMIC SURVEY OF DELHI, 2017-18328

ECONOMIC SURVEY OF DELHI, 2017-18 329
(In
%)

ECONOMIC SURVEY OF DELHI, 2017-18330
(In %
)

ECONOMIC SURVEY OF DELHI, 2017-18 331

ECONOMIC SURVEY OF DELHI, 2017-18332

ECONOMIC SURVEY OF DELHI, 2017-18 333

ECONOMIC SURVEY OF DELHI, 2017-18334

ECONOMIC SURVEY OF DELHI, 2017-18 335

ECONOMIC SURVEY OF DELHI, 2017-18336

ECONOMIC SURVEY OF DELHI, 2017-18 337

ECONOMIC SURVEY OF DELHI, 2017-18338

ECONOMIC SURVEY OF DELHI, 2017-18 339

ECONOMIC SURVEY OF DELHI, 2017-18340

ECONOMIC SURVEY OF DELHI, 2017-18 341
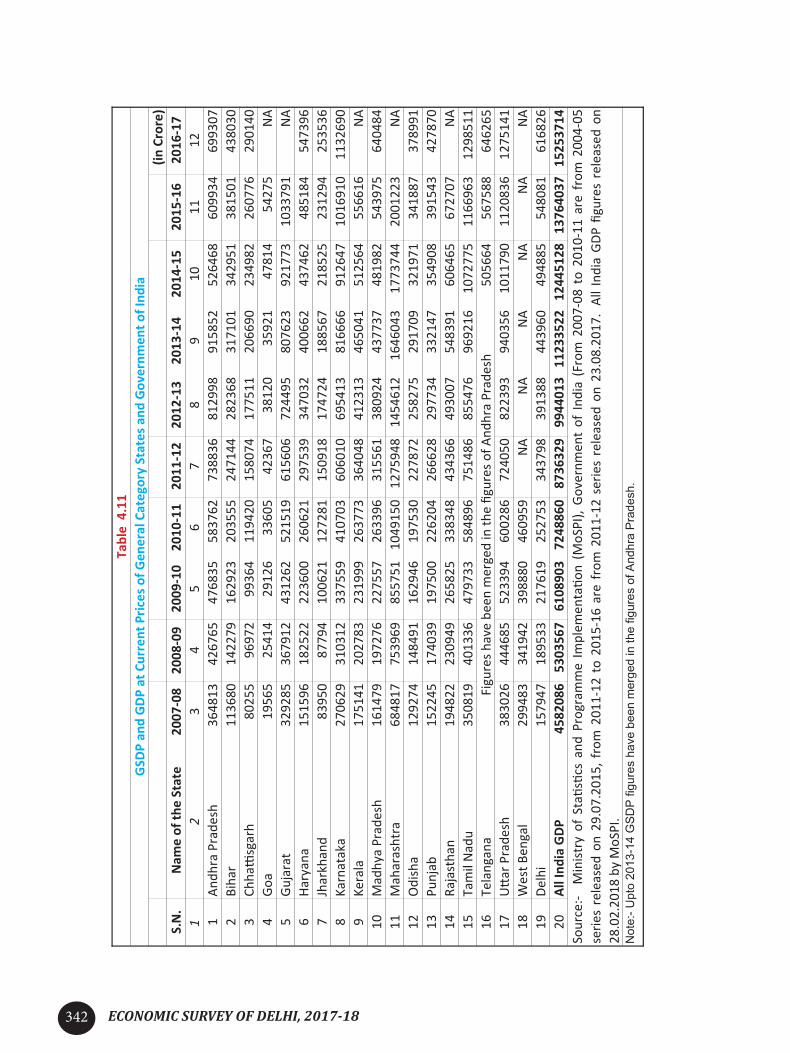
ECONOMIC SURVEY OF DELHI, 2017-18342

ECONOMIC SURVEY OF DELHI, 2017-18 343
Table 5.1
State-wise Population, Workers, Percentage of Workers and increase in Workers during 2001-2011
(In Lakh)
S. No. States/ UTs
Population Workers % of Workers to Total Population % of Increase in
Workers 2001-11
2001 2011 2001 2011 2001 2011
1. Andhra Pradesh 762.10 845.80 348.94 394.23 45.79 46.61 12.98
2. Arunachal Pradesh 10.98 13.84 4.83 5.88 43.99 42.49 21.74
3. Assam 266.56 312.06 95.39 119.70 35.79 38.36 25.48
4. Bihar 829.99 1040.99 279.75 347.25 33.71 33.36 24.13
5. Goa 13.48 14.59 5.23 5.77 38.80 39.55 10.33
6. Gujarat 506.71 604.40 212.56 247.68 41.95 40.98 16.52
7. Haryana 211.45 253.51 83.77 89.17 39.62 35.17 6.45
8. H.P 60.78 68.65 29.92 35.59 49.23 51.84 18.95
9. J &K 101.44 125.41 37.54 43.23 37.01 34.47 15.16
10 Karnataka 528.51 610.95 235.35 278.73 44.53 45.62 18.43
11. Kerala 318.41 334.06 102.84 116.19 32.30 34.78 12.98
12. M.P 603.48 726.27 257.94 315.74 42.74 43.47 22.41
13. Maharashtra 968.78 1123.74 411.73 494.28 42.50 43.99 20.05
14. Manipur 21.67 25.70 10.70 11.59 49.38 45.10 8.32
15. Meghalaya 23.18 29.67 9.70 11.86 41.85 39.97 22.27
16. Mizoram 8.89 10.97 4.67 4.87 52.53 44.39 4.28
17. Nagaland 19.90 19.78 8.48 9.74 42.61 49.24 14.86
18. Orissa 368.05 419.74 142.76 175.42 38.79 41.79 22.88
19. Punjab 243.59 277.43 91.27 98.97 37.47 35.67 8.44
20. Rajasthan 565.07 685.48 237.67 298.86 42.06 43.60 25.75
21. Sikkim 5.41 6.11 2.63 3.08 48.61 50.41 17.11
22. Tamil Nadu 624.06 721.47 278.78 328.85 44.67 45.58 17.96
23. Tripura 31.99 36.74 11.60 14.70 36.26 40.01 26.72
24. Uttar Pradesh 1661.98 1998.12 539.84 658.15 32.48 32.94 21.92
25. West Bengal 801.76 912.76 294.82 347.56 36.77 38.08 17.89
26. Uttarakhand 84.89 100.86 31.34 38.72 36.92 38.39 23.55
27. Jharkhand 269.46 329.88 101.09 130.98 37.52 39.71 29.57
28 Chhattisgarh 208.34 255.45 96.80 121.80 46.46 47.68 25.83
29. A& N Islands 3.56 3.80 1.36 1.53 38.20 40.26 12.50
30. Chandigarh 9.01 10.55 3.40 4.04 37.74 38.29 18.82
31. DNH 2.20 3.44 1.14 1.57 51.82 45.64 37.72
32. Daman & Diu 1.58 2.43 0.73 1.21 46.20 49.79 65.75
33. Delhi 138.50 167.88 45.45 55.87 32.82 33.28 22.93
34. Lakshadweep 0.61 0.65 0.15 0.19 24.59 29.23 26.67
35. Pondicherry 9.74 12.48 3.43 4.45 35.22 35.66 29.74
India 10286.11 12105.70 4023.60 348598 39.11 28.80 -13.36
Source: - CENSUS 2001-2011, Registrar General & Census Commissioner of India.

ECONOMIC SURVEY OF DELHI, 2017-18344
Table 5.2
Distribution of Population of Delhi- Workers & Non-workers during 1999-2012
(In lakh)
S. No
NSSO Survey Rounds Employed Un-
employedLabourForce
Out of Labour Force
Population% of
Unemployed to Labour
Force
1. 55TH Round (1999-200)
38.95 (29.29)
5.59(4.20)
44.54(33.49)
88.44(66.51)
132.98(100.00) 12.55
2. 57th Round(2001-02)
41.75(29.93)
2.95(2.12)
44.70(32.05)
94.80(67.95)
139.50(100.00) 6.61
3. 59th Round(2003)
45.49(30.68)
2.21(1.49)
47.70(32.17)
100.58(67.83)
148.28(100.00) 4.64
4. 60th Round(2004)
48.57(32.11)
2.94(1.94)
51.51(34.05)
99.77(65.95)
151.28(100.00) 5.71
5. 61st Round(2004-05)
50.55(32.47)
1.65(1.06)
52.20(33.53)
103.49(66.47)
155.69(100.00) 3.16
6. 62nd Round(2005-06)
54.26(33.87)
2.28(1.42)
56.54(35.29)
103.67(64.71)
160.21(100.00) 4.02
7. 64th Round(2007-08)
57.08(33.68)
3.19(1.86)
60.27(35.54)
109.28(64.46)
169.55(100.00) 5.29
8. 66th Round 52.96(32.39)
1.74 (1.07)
54.70 (33.45)
108.83(66.55)
163.54(100.00) 3.18
9.68th Round
(July 2011-June 2012)
57.06(33.39)
2.66(1.56)
59.73(34.95)
111.16(65.05)
170.89(100.00) 4.45
Source: - Directorate of Economics & Statistics, Government of NCT, Delhi.Note: - Figures in parenthesis relates to percentage to Total Population.

ECONOMIC SURVEY OF DELHI, 2017-18 345
Table 5.3Unemployment in Delhi
S. No. Years
Unemployed Persons (Number)Growth over previous year
Below Matriculates
Metric to Intermediate
Graduates & PGs ODHs Total
1. 1997 251514 562633 261433 21873 1097453 1.49
2. 1998 273364 559068 273476 22280 1128188 2.80
3. 1999 253606 496918 194908 20689 966121 -14.37
4. 2000 238386 528554 203081 20646 990667 2.54
5. 2001 230695 562781 193941 18825 1006242 1.57
6. 2002 233695 594999 210548 19763 1059005 5.24
7. 2003 226663 635623 216917 19774 1098977 3.77
8. 2004 160434 294928 164815 16023 636200 -42.11
9. 2005 186662 296527 176537 14126 673852 5.92
10. 2006 171601 216894 140366 28006 556867 -17.36
11. 2007 125302 180477 126240 19076 451495 -18.92
12. 2008 145637 201266 140719 19297 506919 12.28
13. 2009 51575 297757 56441 8766 414539 -18.22
14. 2010 73259 296047 100717 23361 493384 19.02
15. 2011 91925 389742 132497 29139 643303 30.39
16. 2012 106362 467479 163174 37554 774569 20.41
17. 2013 128040 495423 186895 44934 855292 10.42
18. 2014 137158 616019 211860 52532 1017569 18.97
19 2015 141749 656088 229483 56576 1083896 6.51Source: - Directorate of Economics & Statistics, Government of NCT, Delhi.Note: - PG means Post Graduates, ODHs- Other Diploma Holders.

ECONOMIC SURVEY OF DELHI, 2017-18346
Table No: 6.1MONTH AND YEAR WISE WHOLESALE PRICE
INDEX NUMBERS OF ALL INDIA(BASE YEAR 2011-12=100)
MONTH /YEAR 2012-13 2013-14 2014-15 2015-16 2016-17
1 2 3 4 5 6
APRIL 104.7 108.6 114.1 110.2 109.0
MAY 105.3 108.6 114.8 111.4 110.4
JUNE 105.3 110.1 115.2 111.8 111.7
JULY 106.2 111.2 116.7 111.1 111.8
AUGUST 106.9 112.9 117.2 110.0 111.2
SEPTEMBER 107.6 114.3 116.4 109.9 111.4
OCTOBER 107.4 114.6 115.6 110.1 111.5
NOVEMBER 107.3 114.3 114.1 109.9 111.9
DECEMBER 107.1 113.4 112.1 109.4 111.7
JANUARY 108.0 113.6 110.8 108.0 112.6
FEBRUARY 108.4 113.6 109.6 107.1 113.0
MARCH 108.6 114.3 109.9 107.7 113.2
ANNUAL AVERAGE 106.9 112.5 113.9 109.7 111.6
% VARIATION OVER PREVIOUS YEAR
8.1 5.2 1.2 -3.7 1.7
Source: Office of the Economic Advisor, Ministry of commerce and Industry, Govt. of India.

ECONOMIC SURVEY OF DELHI, 2017-18 347
Table 6.2:Group-wise Price Index Numbers for Industrial Workers of Megacities in India 2016 &
2017(Average Annual Index)
No Cities Food
Pan. Supari, Tobacco & intoxicants
Fuel & Light Housing
Clothing, Bedding & Footwear
Others GeneralIndex
1.
All Indiaa. 2016 304 321 249 296 204 223 274b. 2017 308 348 257 305 212 232 281c. % Change 1.3 8.4 3.2 3.0 3.9 4.0 2.6
2.
Delhia. 2016 278 288 216 227 216 213 246b. 2017 289 313 226 240 230 220 257c. % Change 4.0 8.7 4.6 5.7 6.5 3.3 4.5
3.
Mumbaia. 2016 314 339 315 276 202 245 287b. 2017 313 365 309 282 204 255 289c. % Change -0.3 7.7 -1.9 2.2 1.0 4.1 0.7
4.
Chennaia. 2016 315 416 145 208 187 213 255b. 2017 323 439 125 214 189 223 261c. % Change 2.5 5.5 -13.8 2.9 1.1 4.7 2.4
5.
Kolkataa. 2016 297 349 273 205 221 212 261b. 2017 299 359 292 210 224 218 266c. % Change 0.7 2.9 7.0 2.4 1.4 2.8 1.9
Source: - Labour Bureau Shimla,

ECONOMIC SURVEY OF DELHI, 2017-18348
Table 7.1
SECTOR-WISE PLAN OUTLAYS – 9TH, 10TH, 11TH 12TH FIVE YEAR PLANS
( Crore)
S.No
Sectors 9th FYP 10th FYP 11th FYP 12th FYP
(1997-2002) (2002-2007) (2007-2012) (2012-2017)
Plan Outlay Per cent Plan Outlay Per cent Plan Outlay Per cent Plan Outlay Per cent
1 Agr. & Allied Services 198.8 1.3 134.5 0.6 155.9 0.3 - -
2 Co-operation 4.2 0.0 3.0 0.0 35.9 0.1 - -
3 Rural Development 597.7 3.9 463.3 2.0 721.5 1.3 882.0 1.0
4 Minor Irrigation 13.0 0.1 10.0 0.0 4.9 0.0 400.0 0.4
5 Flood Control 120.0 0.8 146.0 0.6 328.8 0.6
6 Energy 2996.6 19.3 3457.5 15.0 5479.9 10.0 4820.2 5.4
7 Industries 110.0 0.7 100.0 0.4 548.0 1.0 199.0 0.2
8 Transport 3136.4 20.2 5446.7 23.7 18572.9 33.9 21954.6 24.4
9 Science Tech. & Env. 112.0 0.7 55.0 0.2 93.8 0.1 546.5 0.6
10 General Eco. Services 5.9 0.0 12.8 0.1 21.3 0.0 7.5 0.0
11 Tourism 32.0 0.2 60.0 0.3 92.6 0.2 185.0 0.2
12 Survey & Statistics 10.0 0.1 12.5 0.1 1.5 95.3 - -
13 Civil Supplies 30.0 0.2 20.0 0.1 14.6 0.0 800.0 0.9
14 Weight & Measure 0.5 0.0 2.0 0.0 3.7 0.0 - -
15 General Education 860.8 5.5 1840.0 8.0 3568.0 6.5 10344.0 11.5
16 Technical Education 220.0 1.4 250.0 1.1 629.0 1.2 1458.0 1.6
17 Art & Culture 44.3 0.3 68.6 0.3 93.2 0.2 291.0 0.3
18 Sports & Youth Services 75.5 0.5 60.0 0.3 174.4 0.3 147.5 0.2
19 Medical 1022.2 6.6 2223.5 9.7 5102.4 9.3 12934.5 14.4
20 Public Health 79.3 0.5 158.0 0.7 207.0 0.4 565.5 0.6
21 Water Supply & Sanitation 2390.0 15.4 3766.0 16.4 9125.9 16.7 11000.0 12.2
22 Housing 155.0 1.0 200.0 0.9 729.4 1.3 2700.0 3.0
23 Urban Development 2305.8 14.8 2940.3 12.8 5879.3 10.7 8700.0 9.7
24 Information & Publicity 12.5 0.1 15.0 0.1 - - - -
25 Welfare of SC/ST/OBC/Minorities 87.3 0.6 158.0 0.7 286.2 0.5 1600.0 1.8
26 Labour & Labour Welfare 34.0 0.2 43.3 0.2 91.3 0.2 574.0 0.6
27 Social Welfare & 108.6 0.7 322.5 1.4 1219.0 2.2 3831.0 4.3
Women and Child Development
28 Nutrition 150.0 1.0 202.3 0.9 329.4 0.6 1700.0 1.9
29 Jail 95.0 0.6 160.0 0.7 243.6 0.4 1340.0 1.5
30 Public Works 240.0 1.5 300.1 1.3 452.4 0.8 753.7 0.8
31 Other Admn. Services 294.3 1.9 369.3 1.6 593.5 1.1 700.0 0.8
Total 15541.3 100.0 23000.0 100.0 54799.2 100.0 90000.0 100.0

ECONOMIC SURVEY OF DELHI, 2017-18 349
Table 7.2
PLAN OUTLAY AND EXPENDITURE- ANNUAL PLAN 2012-13
( Crore)
S. No SectorsAnnual Plan- Outlay
Expenditure % of Expenditure to the Revised OutlayApproved Revised
1 Rural Development 162.22 210.62 208.20 98.85
2 Minor Irrigation & Flood Control 55.00 74.63 74.00 99.16
3 Energy 859.61 1275.00 1271.61 99.73
4 Industries 69.00 71.00 69.24 97.52
5 Transport 3372.00 3662.95 2649.60 72.34
6 Science Tech. & Environment 81.00 91.80 85.26 92.88
7 Secretariat Economic Services 1.47 2.35 2.03 86.29
8 Tourism 33.10 28.70 23.35 81.37
9 Civil Supplies 190.00 95.00 58.56 61.64
10 General Education 1625.00 1472.01 1390.27 94.45
11 Technical Education 202.00 158.00 131.11 82.98
12 Art & Culture 45.00 50.50 42.40 83.96
13 Sports & Youth Services 29.00 38.09 33.81 88.76
14 Medical 2031.00 1614.80 1375.09 85.16
15 Public Health 93.00 160.30 154.07 96.11
16 Water Supply & Sanitation 1800.00 1750.00 1717.37 98.14
17 Housing 539.00 473.05 472.12 99.80
18 Urban Development 1695.00 1739.67 1629.10 93.64
19 Welfare of SC/ST/OBC/Minorities 324.00 325.00 277.71 85.45
20 Labour & Labour Welfare 35.00 46.00 37.96 82.52
21 Social Welfare 660.00 669.00 656.14 98.08
22 Women & Child Welfare 290.00 361.00 350.67 97.14
23 Nutrition 237.50 227.00 203.52 89.66
24 Jail 133.00 56.00 51.95 92.78
25 Public Works 150.00 107.18 98.26 91.68
26 Other Administrative Services 288.10 235.35 173.58 73.75
27 Agriculture & Allied Services -- 5.00 0.53 10.66
TOTAL 15000.00 15000.00 13237.51 88.25

ECONOMIC SURVEY OF DELHI, 2017-18350
Table 7.3
PLAN OUTLAY AND EXPENDITURE- ANNUAL PLAN 2013-14
( Crore)
S.No SectorsAnnual Plan- Outlay
Expenditure% of Expenditure
to the Revised OutlayApproved Revised
1 Rural Development 217.30 185.00 177.05 95.7
2 Minor Irrigation & Flood Control 80.00 70.00 69.41 99.16
3 Energy 513.00 326.00 326.00 100
4 Industries 174.00 74.00 72.00 97.3
5 Transport 3876.00 3779.00 3754.54 99.35
6 Science Tech. & Environment 61.00 54.50 46.07 84.54
7 Secretariat Economic Services 1.70 1.90 1.32 69.34
8 Tourism 21.00 12.50 9.41 75.29
9 Civil Supplies 190.00 130.00 99.38 76.45
10 General Education 1782.00 1818.00 1678.61 92.33
11 Technical Education 199.00 314.00 293.41 93.44
12 Art & Culture 65.00 52.00 44.32 85.22
13 Sports & Youth Services 30.00 38.00 32.80 86.31
14 Medical 2265.00 1671.25 1461.16 87.43
15 Public Health 225.00 166.75 150.52 90.27
16 Water Supply & Sanitation 1665.00 1565.00 1550.00 99.04
17 Housing 460.00 498.00 484.04 97.2
18 Urban Development 1840.00 1806.80 1759.84 97.4
19 Welfare of SC/ST/OBC/Minorities 330.00 330.00 254.77 77.2
20 Labour & Labour Welfare 77.00 53.00 45.05 84.99
21 Social Welfare 746.00 678.00 660.11 97.36
22 Women & Child Welfare 388.00 455.68 446.76 98.04
23 Nutrition 147.00 156.00 148.44 95.15
24 Jail 95.00 102.60 100.60 98.06
25 Public Works 141.00 100.00 89.94 89.94
26 Other Administrative Services 373.00 260.02 206.97 79.6
27 Agriculture & Allied Services 8.00 2.00 1.78 88.85
28 Cooperation 30.00 -- --- --
TOTAL 16000.00 14700.00 13964.28 95.00

ECONOMIC SURVEY OF DELHI, 2017-18 351
Table 7.4
PLAN OUTLAY AND EXPENDITURE- ANNUAL PLAN 2014-15
( Crore)
S. No Sectors
Annual Plan- OutlayExpenditure
% of Expenditure to the Revised
OutlayApproved Revised
1 Rural Development 218.00 119.00 118.13 99.3
2 Minor Irrigation & Flood Control 82.00 84.00 81.45 97.0
3 Energy 675.00 634.00 581.26 91.7
4 Industries 82.00 88.41 48.32 54.7
5 Transport 3702.00 3671.00 2996.79 81.6
6 Science Tech. & Environment 65.00 55.25 42.08 76.2
7 Secretariat Economic Services 2.00 2.63 2.06 78.6
8 Tourism 42.00 57.75 8.61 14.9
9 Civil Supplies 35.00 2.85 1.60 56.2
10 General Education 2060.00 2177.51 1975.53 90.7
11 Technical Education 309.00 225.13 159.34 70.8
12 Art & Culture 77.00 52.00 41.79 80.4
13 Sports & Youth Services 36.00 39.79 36.74 92.3
14 Medical 2467.00 2225.98 1847.63 83.0
15 Public Health 257.00 416.64 319.06 76.6
16 Water Supply & Sanitation 2000.00 2000.00 1789.00 89.5
17 Housing 492.00 275.00 173.77 63.2
18 Urban Development 1662.00 1521.00 1463.16 96.2
19 Welfare of SC/ST/OBC/Minorities 340.00 336.45 257.01 76.4
20 Labour & Labour Welfare 99.00 44.90 25.22 56.2
21 Social Welfare 754.00 715.00 655.68 91.7
22 Women & Child Welfare 470.00 585.05 530.92 90.7
23 Nutrition 164.00 410.80 328.72 80.0
24 Jail 110.00 115.00 111.11 96.6
25 Public Works 159.00 187.00 166.47 89.0
26 Other Administrative Services 336.00 302.02 213.74 70.8
27 Agriculture & Allied Services 5.00 5.85 4.48 76.6
TOTAL 16700.00 16350.00 13979.68 85.50

ECONOMIC SURVEY OF DELHI, 2017-18352
Table 7.5
PLAN OUTLAY AND EXPENDITURE- ANNUAL PLAN 2015-16
( Crore)
S. No Sectors
Annual Plan- OutlayExpenditure
% of Expenditure to the Revised
OutlayApproved Revised
1 Rural Development 189.00 109.00 105.20 96.51
2 Minor Irrigation & Flood Control 65.00 52.00 48.55 93.36
3 Energy 645.00 255.00 235.52 92.36
4 Industries 67.00 66.00 59.82 90.63
5 Transport 3695.00 3706.00 3504.03 94.55
6 Science Tech. & Environment 101.20 46.00 37.92 82.44
7 Secretariat Economic Services 4.30 7.00 6.52 93.11
8 Tourism 41.00 31.00 19.61 63.25
9 Civil Supplies 10.00 2.00 0.69 34.56
10 General Education 4102.00 2861.00 2645.59 92.47
11 Technical Education 373.00 302.00 268.36 88.86
12 Art & Culture 53.00 48.00 32.39 67.48
13 Sports & Youth Services 42.00 49.00 45.16 92.17
14 Medical 2722.00 1968.00 1693.82 86.07
15 Public Health 416.00 377.51 331.00 87.68
16 Water Supply & Sanitation 1468.00 1732.00 1723.93 99.53
17 Housing 218.00 254.00 245.80 96.77
18 Urban Development 1575.00 1478.00 1303.94 88.22
19 Welfare of SC/ST/OBC/Minorities 378.00 378.00 284.13 75.17
20 Labour & Labour Welfare 167.50 59.00 40.24 68.20
21 Social Welfare 765.00 755.38 737.82 97.67
22 Women & Child Welfare 677.00 637.05 579.68 90.99
23 Nutrition 350.00 352.95 265.63 75.26
24 Jail 80.00 89.49 55.43 61.93
25 Public Works 205.00 263.00 230.59 87.68
26 Other Administrative Services 582.00 513.62 454.47 88.48
27 Agriculture & Allied Services 9.00 8.00 4.72 58.95
TOTAL 19000.00 16400.00 14960.54 91.22

ECONOMIC SURVEY OF DELHI, 2017-18 353
Table 7.6
PLAN OUTLAY AND EXPENDITURE- ANNUAL PLAN 2016-17
( Crore)
S. No SectorsAnnual Plan- Outlay
Expenditure% of Expenditure
to the Revised OutlayApproved Revised
1 Rural Development 190.00 146.00 130.28 89.23
2 Minor Irrigation & Flood Control 63.00 60.00 59.21 98.68
3 Energy 386.00 225.00 187.77 83.45
4 Industries 31.00 31.00 7.20 23.22
5 Transport 3943.00 3081.00 2787.82 90.48
6 Science Tech. & Environment 79.00 43.00 33.71 78.40
7 Secretariat Economic Services 7.00 4.00 1.98 49.44
8 Tourism 61.00 26.00 8.08 31.10
9 Civil Supplies 24.00 3.00 1.66 55.18
10 General Education 4155.00 3600.00 3124.85 86.80
11 Technical Education 388.00 324.00 259.62 80.13
12 Art & Culture 54.00 63.00 49.92 79.23
13 Sports & Youth Services 48.00 58.00 52.24 90.07
14 Medical 2725.00 2012.50 1752.53 87.08
15 Public Health 475.00 432.50 342.84 79.27
16 Water Supply & Sanitation 1976.00 1426.00 1384.65 97.10
17 Housing 300.00 142.00 134.81 94.93
18 Urban Development 2166.00 1753.00 1682.04 95.95
19 Welfare of SC/ST/OBC/Minorities 380.00 385.00 116.08 30.15
20 Labour & Labour Welfare 166.00 47.00 25.05 53.29
21 Social Welfare 793.00 879.00 804.27 91.50
22 Women & Child Welfare 691.00 728.00 651.48 89.49
23 Nutrition 377.00 364.00 214.12 58.82
24 Jail 72.00 71.00 64.28 90.53
25 Public Works 187.00 290.00 254.00 87.59
26 Other Administrative Services 856.00 298.00 221.15 74.21
27 Agriculture & Allied Services 7.00 8.00 3.43 42.93
TOTAL 20600.00 16500.00 14355.03 87.00

ECONOMIC SURVEY OF DELHI, 2017-18354
Table 7.7
Schemes/ Projects Outlay 2017-18 ( Crore)
S.No Sectors Outlay 2017-18 % of Outlay
1 Rural Development 614.00 3.32
2 Minor Irrigation & Flood Control 90.00 0.49
3 Energy 295.00 1.59
4 Industries 31.00 0.17
5 Transport 3056.00 16.52
6 Science Tech. & Environment 90.00 0.49
7 Secretariat Economic Services 11.00 0.06
8 Tourism 117.00 0.63
9 Civil Supplies 12.00 0.06
10 General Education 2970.00 16.05
11 Technical Education 363.00 1.96
12 Art & Culture 104.00 0.56
13 Sports & Youth Services 88.00 0.48
14 Medical 2150.90 11.63
15 Public Health 476.10 2.57
16 Water Supply & Sanitation 1755.00 9.49
17 Housing 251.00 1.36
18 Urban Development 2117.00 11.44
19 Welfare of SC/ST/OBC/Minorities 400.00 2.16
20 Labour & Labour Welfare 110.00 0.59
21 Social Welfare 1272.00 6.88
22 Women & Child Welfare 872.00 4.71
23 Nutrition 380.00 2.05
24 Jail 65.00 0.35
25 Public Works 234.00 1.26
26 Other Administrative Services 550.00 2.97
27 Agriculture & Allied Services 26.00 0.14
TOTAL 18500.00 100.00

ECONOMIC SURVEY OF DELHI, 2017-18 355
Table 7.8
SOCIAL SERVICES SECTORS EXPENDITURE
UNDER - 11TH FIVE YEAR PLAN
( Crore)
No Sectors11th FYP 2007-08 2008-09 2009-10 2010-11 2011-12
Expenditure % Expenditure % Expenditure % Expenditure % Expenditure % Expenditure %
1 General Education 3643.0 6.8 556.6 6.4 585.9 6.1 644.7 5.8 801.8 7.6 1028.2 7.6
2 Technical Education 654.5 1.2 93.8 1.1 117.3 1.2 99.7 0.9 170.1 1.6 173.7 1.3
3 Sports and Youth Services 755.6 1.4 78.4 0.9 209.1 2.2 276.0 2.5 146.4 1.4 44.9 0.3
4 Art & Culture 139.7 0.3 16.9 0.2 21.2 0.2 27.6 0.3 33.6 0.3 40.4 0.3
5 Medical and Public Health 6194.3 11.6 861.7 9.9 1076.4 11.2 1130.9 10.2 1473.4 14.1 1651.9 12.2
6 Water Supply and Sanitation 7620.9 14.3 1346.0 15.4 1456.9 15.2 1648.9 14.9 1608.1 15.3 1561.0 11.5
7 Housing 1442.5 2.7 192.0 2.2 82.6 0.9 185.3 1.7 189.8 1.8 792.8 5.8
8 Urban Development 6478.0 12.1 1342.3 15.4 1409.5 14.7 1336.5 12.1 853.3 8.1 1536.4 11.3
9 Welfare of SC/ST/OBC 445.8 0.8 50.1 0.6 49.2 0.5 41.7 0.4 71.1 0.7 202.8 1.5
10 Labour and labour welfare 76.5 0.1 19.1 0.2 16.1 0.2 14.1 0.1 12.9 0.1 14.3 0.1
11 Social Welfare 1755.7 3.3 165.0 1.9 426.0 4.4 346.1 3.1 448.1 4.3 526.2 3.9
12 Women & Child Development 817.4 1.5 * - * 176.6 1.6 223.0 2.1 262.6 1.9
13 Nutrition 585.5 1.1 60.7 0.7 77.9 0.8 98.1 0.9 153.2 1.5 191.0 1.4
14 Civil Supply 7.4 0.0 3.1 0.0 - - - - - - -
Total[Social Services] 30616.6 57.3 4785.6 54.7 5528.0 57.5 6026.2 54.5 6184.9 59.0 8026.3 59.1
Total Expenditure 53478.9 - 8745.3 - 9619.3 - 11048.1 - 10490.8 - 13575.3 -
* Bifurcated into 2 departments i.e. Women & Child Development & Social Welfare from November 2008.
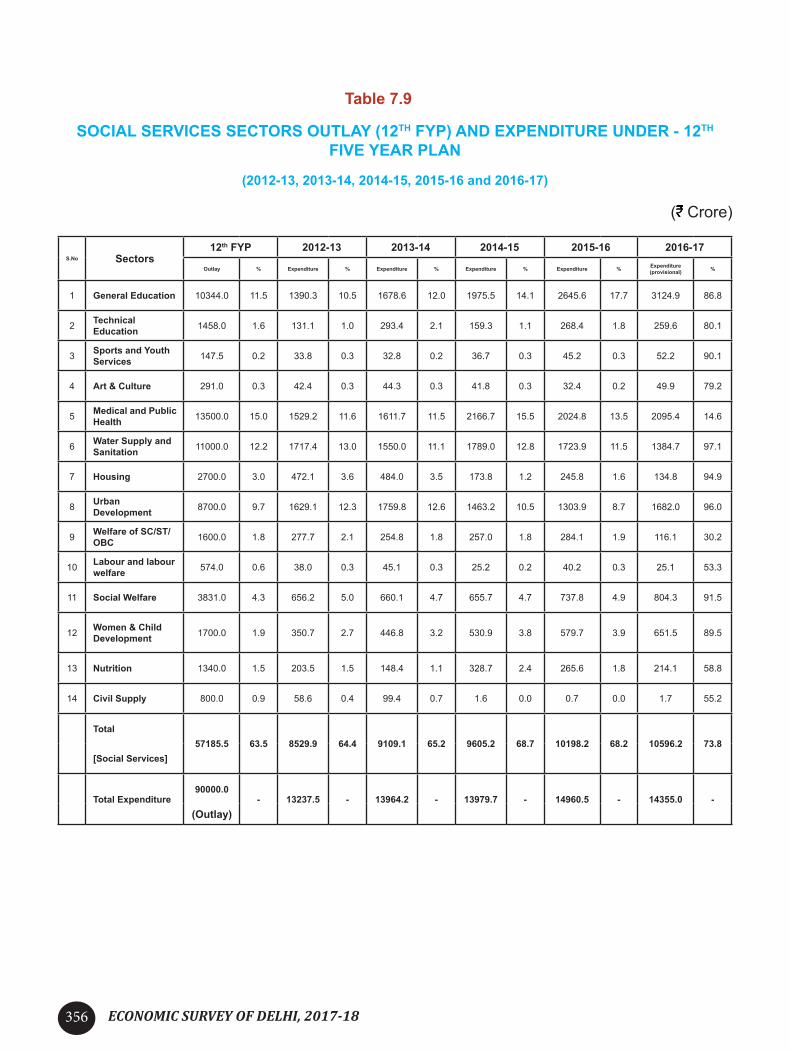
ECONOMIC SURVEY OF DELHI, 2017-18356
Table 7.9
SOCIAL SERVICES SECTORS OUTLAY (12TH FYP) AND EXPENDITURE UNDER - 12TH FIVE YEAR PLAN
(2012-13, 2013-14, 2014-15, 2015-16 and 2016-17)
( Crore)
S.No Sectors12th FYP 2012-13 2013-14 2014-15 2015-16 2016-17
Outlay % Expenditure % Expenditure % Expenditure % Expenditure % Expenditure (provisional) %
1 General Education 10344.0 11.5 1390.3 10.5 1678.6 12.0 1975.5 14.1 2645.6 17.7 3124.9 86.8
2 Technical Education 1458.0 1.6 131.1 1.0 293.4 2.1 159.3 1.1 268.4 1.8 259.6 80.1
3 Sports and Youth Services 147.5 0.2 33.8 0.3 32.8 0.2 36.7 0.3 45.2 0.3 52.2 90.1
4 Art & Culture 291.0 0.3 42.4 0.3 44.3 0.3 41.8 0.3 32.4 0.2 49.9 79.2
5 Medical and Public Health 13500.0 15.0 1529.2 11.6 1611.7 11.5 2166.7 15.5 2024.8 13.5 2095.4 14.6
6 Water Supply and Sanitation 11000.0 12.2 1717.4 13.0 1550.0 11.1 1789.0 12.8 1723.9 11.5 1384.7 97.1
7 Housing 2700.0 3.0 472.1 3.6 484.0 3.5 173.8 1.2 245.8 1.6 134.8 94.9
8 Urban Development 8700.0 9.7 1629.1 12.3 1759.8 12.6 1463.2 10.5 1303.9 8.7 1682.0 96.0
9 Welfare of SC/ST/OBC 1600.0 1.8 277.7 2.1 254.8 1.8 257.0 1.8 284.1 1.9 116.1 30.2
10 Labour and labour welfare 574.0 0.6 38.0 0.3 45.1 0.3 25.2 0.2 40.2 0.3 25.1 53.3
11 Social Welfare 3831.0 4.3 656.2 5.0 660.1 4.7 655.7 4.7 737.8 4.9 804.3 91.5
12 Women & Child Development 1700.0 1.9 350.7 2.7 446.8 3.2 530.9 3.8 579.7 3.9 651.5 89.5
13 Nutrition 1340.0 1.5 203.5 1.5 148.4 1.1 328.7 2.4 265.6 1.8 214.1 58.8
14 Civil Supply 800.0 0.9 58.6 0.4 99.4 0.7 1.6 0.0 0.7 0.0 1.7 55.2
Total
57185.5 63.5 8529.9 64.4 9109.1 65.2 9605.2 68.7 10198.2 68.2 10596.2 73.8[Social Services]
Total Expenditure90000.0
- 13237.5 - 13964.2 - 13979.7 - 14960.5 - 14355.0 -(Outlay)

ECONOMIC SURVEY OF DELHI, 2017-18 357
Table 7.10
SOCIAL SERVICES SECTOR’S OUTLAY DURING 2017-18
( Crore)
S.No. Sectors Outlay % from total outlay
1 General Education 2970 16.05
2 Technical Education 363 1.96
3 Sports & Youth Services 88 0.48
4 Art & Culture 104 0.56
5 Medical &Public Health 2627 14.2
6 Water Supply & Sanitation 1755 9.49
7 Housing 251 1.36
8 Urban Development 2117 11.44
9 Welfare of SC/ST/OBC/ Minorities 400 2.16
10 Labour & Labour Welfare 110 0.59
11 Social Welfare 1272 6.88
12 Women & Child Welfare 872 4.71
13 Nutrition 380 2.05
14 Civil Supplies 12 0.06
Total Social Services Sector 13321 72.00
Total Budget 18500.00 100.00

ECONOMIC SURVEY OF DELHI, 2017-18358
Table 10.1NUMBER & AREA OF OPERATIONAL HOLDINGS IN DELHI –
ALL SOCIAL GROUPS
S. No.
Details Marginal Small Semi-Medium
Medium Large Total
I Operational Holdings (Number)
a. Individual 5869 (51.90)
1463 (32.39)
632 (21.22)
226 (14.65)
5 (3.33)
8195 (39.98)
b. Joint 5071 (44.85)
2594
(57.43)
2266
(76.06)
1285
(83.28)
142
(94.67)
11358
(55.41)c. Institutional 368
(3.25)
460
(10.18)
81
(2.72)
32
(2.07)
3
(2.00)
944
(4.61)
Total11308
(100.00)
4517
(100.00)
2979
(100.00)
1543
(100.00)
150
(100.00)
20497
(100.00)II Areas Operated (Hectare)
a. Individual 2285.62
(47.61)
1880.44
(31.51)
1609.86
(20.09)
1221.21
(14.24)
90.82
(4.00)
7087.95
(23.92)b. Joint 2320.76
(48.35)
3530.90
(59.17)
6180.78
(77.12)
7167.88
(83.57)
2141.50
(94.36)
21341.82
(72.03)c. Institutional 193.85
(4.04)
556.05
(9.32)
223.37
(2.79)
187.37
(2.19)
37.30
(1.64)
1198.44
(4.05)Total 4800.23
(100.00)
5967.39
(100.00)
8014.01
(100.00)
8576.96
(100.00)
2269.62
(100.00)
29628.21
(100.00)Sources: - Agricultural Census 2010-11
Note: - Figures in parenthesis relate percentage to total

ECONOMIC SURVEY OF DELHI, 2017-18 359
Table 10.2LAND USE PATTERN OF DELHI: 2000-01 TO 2017-18
(In Hectares)
S.
No.Years
Area as per vil-lage papers (Ex-cluding Forest
Area)
Area Not Available for Cultivation
Other Uncultivable land
Fallow Land
Net Area sown
Total Cropped Area
1. 2000-01 147488 76597 11143 11544 34034 528172. 2001-02 147488 116988 11143 19427 29116 484453. 2002-03 147488 92206 11143 18649 29477 433914. 2003-04 147488 74891 11143 19014 26971 415095. 2004-05 147488 74280 11143 19316 24214 369576. 2005-06 147488 74167 9293 15663 23809 330417. 2006-07 147488 95798 9294 19287 23109 349818. 2007-08 147488 93944 11143 19345 23056 330789. 2008-09 147488 93864 11077 19522 23025 3228810 2009-10 147488 91425 11144 19227 22575 3370011 2010-11 147488 92700 11144 20043 22124 3136612 2011-12 147488 90875 11144 19234 22885 3644513 2012-13 147488 91058 11144 19230 23118 3517814 2013-14 147488 92071 11124 19225 23150 3431215 2014-15 147488 92701 11124 19225 23150 3431216 2015-16 147488 92701 11124 19225 23150 3431217 2016-17 147488 92701 11124 19225 23150 3475018 2017-18* 147488 92701 11124 19225 23150 34750
* Estimated
Source:- 1. Development, Department, Govt. of National Capital Territory of Delhi
2. Delhi Statistical Hand Book 2017 DES, GNCTD

ECONOMIC SURVEY OF DELHI, 2017-18360
Table 10.3PRODUCTION AND YIELD OF FOOD-GRAIN CROPS IN DELHI
DURING 2005-06 TO 2016-17 (Production in MT) (Yield in Kg/ Hect)
S. N. Years Wheat Bajra Jawar Paddy Potato
1.2005-06a. Production 79404 3081 7843 31638 33215b. Yield 4344 1845 880 4215 11421
2.2006-07a. Production 77885 2945 8354 31222 34085b. Yield 4355 1850 945 4230 21092
3.2007-08a. Production 79475 2934 8351 31382 33421b. Yield 4355 1849 945 4230 15875
4.2008-09a. Production 80355 2943 7950 29810 34154b. Yield 4360 1900 965 4235 15885
5.2009-10a. Production 92480 2979 31681 28512 21999b. Yield 4340 1875 960 4180 15890
6.2010-11a. Production 87385 2876 32270 28625 15862b. Yield 4350 1878 965 4250 15890
7.2011-12a. Production 82142 2689 30328 30297 14928b. Yield 4340 1872 965 4180 17360
8.2012-13a. Production 84802 3815 30082 29652 14652b. Yield 4360 1878 966 4322 16448
9.2013-14a. Production 84652 3815 30082 29652 14652b. Yield 4360 1878 966 4322 16448
10.2014-15a. Production 85558 3817 NA 25904 9273b. Yield 4419 2513 906 4292 21268
11.2015-16a. Production 83419 3256 3034 25256 NAb. Yield 4379 2197 960 4292 NA
12.2016-17*a. Production 87182 3278 3065 25891 NAb. Yield 4443 2190 960 4335 NA
* Estimated
Source:- 1. Development, Department, Govt. of National Capital Territory of Delhi
2. Delhi Statistical Hand Book 2017 DES, GNCTD

ECONOMIC SURVEY OF DELHI, 2017-18 361
Table 12.1
MOTOR VEHICLES IN DELHI
S. No
Years
Cars and Jeeps
Motor Cycles and Scooters
AmbulanceAuto Rickshaws
Taxies BusesOther Passenger Vehicles
Tractors
Goods Vehicle (All Types)
Others Total
1 2 3 4 5 6 7 8 9 10 11
12005-06
1471858 3078660 2088 74188 20646 25511 18378 4811 128193 5803 4830136
22006-07
1599463 3335763 2222 74200 25891 26491 19751 4859 137983 5803 5232426
32007-08
1729695 3578199 2226 75297 30704 26933 18967 4855 155871 4637 5627384
42008-09
1863574 3808503 2294 83965 4001 28453 19766 4970 170398 4637 6026561
52009-10
2017882 4065789 2392 86501 45169 30560 20371 5058 188353 4637 6466713
62010-11
2177525 4352963 2503 88200 57887 33067 21178 5148 204428 4637 6947536
72011-12
2347276 4654706 2589 88216 68965 34251 23214 5558 223534 4676 7452985
82012-13
2483886 4980227 1459 76603 71112 19942 11380 1638 139123 1738 7785608
92013-14
2625250 5296163 1519 78750 74758 19641 11289 1651 149147 106 8258274
102014-15
2790566 5681265 1527 81633 79606 19729 11284 1637 160156 28 8827431
112015-16
2986579 6104070 2990 198137 91073 34365 6368 281159 9704741
122016-17
3152710 6607879 3059 105399 118308 35206 59759 300437 10382757

ECONOMIC SURVEY OF DELHI, 2017-18362
Table 12.2
MOTOR VEHICLES - PERCENT CONTRIBUTION
S. No Details 2006-07 2007-08 2008-09 2009-10 2010-11 2011-12 2012-13 2013-14 2014-15 2015-16 2016-17
1. Cars & Jeeps 30.57 30.74 30.92 31.2 31.34 31.50 31.90 31.78 31.61 30.77 30.36
2.Motor Cycles & Scooters
63.75 63.58 63.2 62.87 62.65 62.46 63.97 64.13 64.35 62.90 63.64
3. Ambulance 0.04 0.04 0.04 0.04 0.04 0.03 0.02 0.01 0.01 0.03 0.03
4. Auto Rickshaws 1.42 1.34 1.39 1.34 1.27 1.18 0.98 0.95 0.92 2.04 1.02
5. Taxies 0.49 0.54 0.66 0.7 0.83 0.93 0.91 0.90 0.90 0.94 1.14
6. Buses 0.51 0.48 0.47 0.47 0.48 0.46 0.26 0.23 0.22 0.35 0.33
7.Other Passenger Vehicles
0.38 0.34 0.33 0.32 0.30 0.31 0.14 0.13 0.12 .07 0.58
8. Tractors 0.09 0.09 0.08 0.08 0.07 0.07 0.02 0.02 0.01
2.90 2.909.Goods Vehicles (All Type)
2.64 2.77 2.83 2.91 2.94 3.00 1.78 1.80 1.81
10. Others 0.11 0.08 0.08 0.07 0.07 0.06 0.02 0.001 0.003
Total 100 100 100 100 100 100 100 100 100 100 100

ECONOMIC SURVEY OF DELHI, 2017-18 363
Table 13.1
CONNECTIONS AND CONSUMPTION OF WATER: 1976-77 TO 2016-17
S. No Year Connections (Number) Consumption (LKLD) Per Capita Consumption (Gallons/Day)Metered Unmetered Domestic Commercial &
IndustrialTotal
1. 1976-77 210931 28673 1174 387 1561 30.38
2. 1977-78 239854 22633 1414 364 1778 33.17
3. 1978-79 258307 20159 1529 352 1881 33.65
4. 1979-80 314763 16131 1519 364 1883 32.26
5. 1980-81 355157 13143 1542 411 1953 32.07
6. 1981-82 386167 12620 1556 509 2065 32.24
7. 1982-83 409184 11396 1648 490 2138 32.16
8. 1983-84 437251 11185 NA NA NA NA
9. 1984-85 475009 10457 1929 507 2436 33.65
10. 1985-86 501174 10054 2524 513 3037 40.22
11. 1986-87 547000 26000 2918 483 3401 43.27
12. 1987-88 580000 30000 NA NA NA NA
13. 1988-89 625000 126000 NA NA NA NA
14. 1989-90 637914 206850 3534 523 4067 45.57
15. 1990-91 678461 226960 4013 527 4540 49.03
16. 1991-92 700923 245451 4049 556 4605 47.66
17. 1992-93 745029 253977 4082 567 4649 46.66
18. 1993-94 804180 294174 4087 424 4511 43.74
19. 1994-95 826624 311262 4057 433 4490 42.04
20 1995-96 853807 315687 4114 627 4841 43.76
.21 1996-97 915974 284917 8377 1478 9855 80.24
22 1997-98 934170 290217 8120 1408 9528 94.11
23 1998-99 959432 297182 8451 1491 9942 51.00
24 1999-00 997057 300102 8451 1491 9942 51.00
25 2000-01 1034724 312000 9295 1475 10770 50.00
26 2001-02 102326 313112 9296 1640 10936 40.00
27. 2002-03 1139373 322460 9624 1312 10936 39.50
28 2003-04 1173693 329278 9770 1332 11102 39.00
29 2004-05 1216542 335052 9842 1343 11185 48.02
30 2005-06 1256040 342867 9770 1332 11102 47.50
31 2006-07 1296094 340651 10976 955 11931 48.00
32 2007-08 1329953 346501 11102 1160 12262 48.00
33 2008-09 1338944 373354 11997 1260* 13257* 50.00
34 2009-10 1427768 357256 12143* 1258* 13671* 50.00
35 2010-11 1480441 314774 13754* -- 13754* 50.00
36 2011-12 1540968 399930 12789* 1296* 14085* 50.00
37 2012-13 1647363 330445 N.A. N.A. 13938* 50.00
38 2013-14 1777207 287108 N.A. N.A. 13478* 50.00
39 2014-15 1862753 265925 N.A. N.A. 14085* $ 48.00
40 2015-16 1919238 394689 N.A. N.A. 14914* $ 48.00
41 2016-17 2316210 178845 N.A. N.A. 14914* $ 47.00
Source:- Delhi Jal Board.Notes: - LKLD-Lakh Kilo Liter Daily. * Includes water losses. $ Bifurcation yet not available
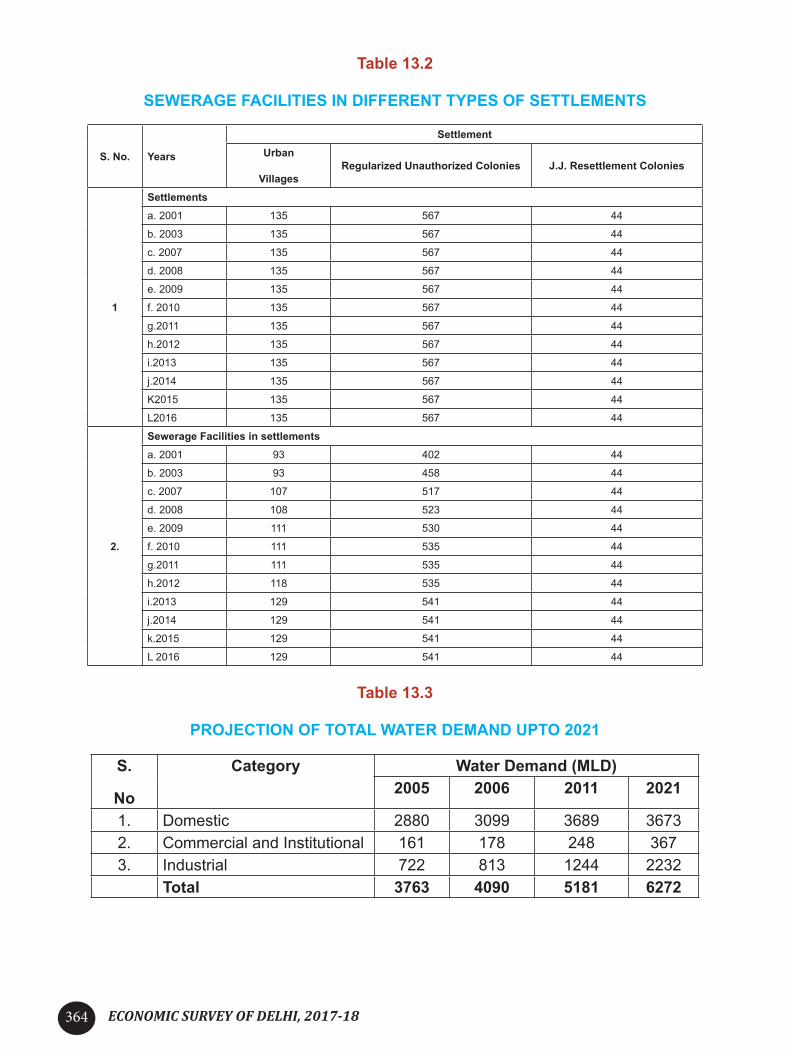
ECONOMIC SURVEY OF DELHI, 2017-18364
Table 13.2
SEWERAGE FACILITIES IN DIFFERENT TYPES OF SETTLEMENTS
S. No. Years
SettlementUrban
VillagesRegularized Unauthorized Colonies J.J. Resettlement Colonies
1
Settlementsa. 2001 135 567 44
b. 2003 135 567 44
c. 2007 135 567 44
d. 2008 135 567 44
e. 2009 135 567 44
f. 2010 135 567 44
g.2011 135 567 44
h.2012 135 567 44
i.2013 135 567 44
j.2014 135 567 44
K2015 135 567 44
L2016 135 567 44
2.
Sewerage Facilities in settlementsa. 2001 93 402 44
b. 2003 93 458 44
c. 2007 107 517 44
d. 2008 108 523 44
e. 2009 111 530 44
f. 2010 111 535 44
g.2011 111 535 44
h.2012 118 535 44
i.2013 129 541 44
j.2014 129 541 44
k.2015 129 541 44
L 2016 129 541 44
Table 13.3
PROJECTION OF TOTAL WATER DEMAND UPTO 2021
S.
No
Category Water Demand (MLD)2005 2006 2011 2021
1. Domestic 2880 3099 3689 36732. Commercial and Institutional 161 178 248 3673. Industrial 722 813 1244 2232
Total 3763 4090 5181 6272

ECONOMIC SURVEY OF DELHI, 2017-18 365
Table 13.4
INSTALLED CAPACITIES OF WATER TREATMENT PLANTS AT THE END OF
FIVE YEAR PLANS
(MGD)
S. No
Plants Five Year Plans
1st 2nd 3rd 4th 5th 6th 7th 8th 9th 10th 11th 12th *
1. Chandrawal 60 90 90 90 90 90 90 90 90 90 90 90
2. Wazirabad -- -- 40 80 80 80 100 120 120 120 120 1203. Haiderpur -- -- -- -- 50 100 100 200 200 200 200 2004. Bhagirathi -- -- -- -- -- 37 100 100 100 100 100 1005. Nangloi - -- -- -- -- -- -- -- 40 40 40 40
6. Rainy Wells -- -- -- 5 20 30 47 63 88 100 100 100
7. Sonia Vihar -- -- -- -- -- -- -- -- -- -- 140 140
8. Bawana -- -- -- -- -- -- -- -- -- -- 20 20
9. Recycling of Water -- -- -- -- -- -- -- -- -- -- 45 46
10. Commonwealth Village -- -- -- -- -- -- -- -- -- -- 1 1
11. Dwarka -- -- -- -- -- -- -- -- -- -- -- 5012. Okhla -- -- -- -- -- -- -- -- -- -- -- 20
Total60 90 130 175 240 337 437 573 638 650 856 927
* Proposed

ECONOMIC SURVEY OF DELHI, 2017-18366
Table 13.5
INSTALLED CAPACITIES OF SEWERAGE TREATMENT PLANTS AT THE END OF FIVE YEAR PLANS
(MGD)
S. No PlantsFive Year Plans
1st 2nd 3rd 4th 5th 6th 7th 8th 9th 10th 11th 12th *
1 Okhla 36 36 66 66 66 88 100 124 140 140 140 140
2 Coronation Pillar -- 20 20 20 20 20 20 20 40 4040 30
3 Keshopur -- 12 12 12 32 32 62 72 72 72 72 72
4 Rithala -- -- -- -- -- -- 10 40 80 80 80 80
5 Yamuna Vihar -- -- -- -- -- -- -- -- 10 20 20 35
6 Oxidation pond, Timarpur -- -- -- -- -- 12 12 12 6 6 6 0
7 Vasant Kunj -- -- -- -- -- -- 2 2 5 5 5 5
8 Kondli -- --- -- -- -- -- 10 10 45 45 45 70
9 Dr. Sen Nursing Home -- -- -- -- -- -- -- -- 2.2 2.2 2.2 2.2
10 Najafgarh -- -- -- -- -- -- -- -- 5 5 5 5
11 Ghitorni -- -- -- -- -- -- -- -- 5 5 5 5
12 Pappankalan -- -- -- -- -- -- --- -- 20 20 20 40
13 Narela -- -- -- -- -- -- -- -- 10 10 10 10
14 Delhi Gate -- -- -- -- -- -- -- -- 2.2 2.2 2.2 17.2
15 Nilothi -- -- -- -- -- -- -- -- 40 40 40 60
16 Mehrauli -- -- -- -- -- -- -- -- -- 5 5 5
17 Rohini -- -- -- -- -- -- -- -- -- 15 15 15
18 Commonwealth Village -- -- -- -- -- -- -- -- -- --
1 1
19 Kapashera -- -- -- -- -- -- -- -- -- -- -- 5
20 Chilla -- -- -- -- -- -- -- -- -- -- -- 9
21 Molad Bank -- -- -- -- -- -- -- -- -- -- -- 0.66
22 Bakkarwala -- -- -- -- -- -- -- -- -- -- -- -
Total 36 68 98 98 118 152 216 280 482.4 512.4 513.4 607.06
* Proposed

ECONOMIC SURVEY OF DELHI, 2017-18 367
Table 13.6
SOURCES OF WATER SUPPLY IN DELHI 2011
S. No Sources Number of HouseholdsRural Urban Total
1. All Sources 79115
(100)
3261423
(100)
3340538
(100)2. Tap 47004
(59.50)
2669789
(81.90)
2716793 (81.30)
3. Hand pump/ Tube Well 22567
(28.50)
435410 (13.40) 457977 (13.70)
4. Well 250
(0.30)
2917
(0.10)
3167
(0.10)5. Other including River/ Canal/
Tank/ Spring9294
(11.80)
153307
(4.70)
162601
(4.90)Source: Census of India, 2011
Note: Figures in brackets show percentage to total.

ECONOMIC SURVEY OF DELHI, 2017-18368
Table 14.1AREA OF DELHI DURING 1961-2011: RURAL AND URBAN
(Sq. Km)
S. No Years Urban Rural TotalArea Per cent Area Per cent Area Percent
1 1961 326.54 22.0 1157.52 78.0 1484.00 100.02 1971 446.30 30.0 1038.70 70.0 1485.00 100.03 1981 591.80 40.0 891.10 60.0 1483.00 100.04 1991 700.23 47.0 782.77 53.0 1483.00 100.05 2001 924.68 62.0 558.32 38.0 1483.00 100.06 2011 1113.65 75.0 369.35 25.0 1483.00 100.00
Source: Census of India, Registrar General of India
Table 14.2DENSITY OF POPULATION: 1961-2011
S. No Years
Density of Population (Persons per Sq. Km)Urban Population (lakh)
Urban Rural Total1 1961 7225 258 1792 23.59 (88.72)2 1971 8172 403 2738 36.47 (89.69)3 1981 9745 507 4194 57.68 (92.73)4 1991 12098 1212 6532 84.72 (89.94)5 2001 13957 1592 9240 129.06 (93.18)6 2011 14698 1135 11320 163.34 (97.50)
Source: Census of India, Registrar General of India
Note: - Figures in parenthesis relates to percentage to total population.

ECONOMIC SURVEY OF DELHI, 2017-18 369
Table 14.3DISTRIBUTION OF HOUSEHOLDS BY AVAILABILITY OF DRINKING WATER FACILITIES
AND SOURCE IN DELHI: 2011
S. No Facilities Households Per centI. Total Number of Households 3340538 100.00
II.
Availability of Drinking Water Facilitiesa. From Treated Source 2511646 75.19b. From Un Treated Source 205147 6.14c. Covered Well 2541 0.08d. Hand pump 177049 5.30e. Tube well 280605 8.40f. Tank, Pond, Lake 40086 1.20g. Any other 120259 3.60
III.
Availability of Drinking Water Sourcea. Within premises 2618982 78.4b. Near the premises 514443 15.4c. Away the premises 207113 6.20
Source:- Census of India, 2011, Houses, Household Amenities and Assets
Table 14.4
DISTRIBUTION OF HOUSEHOLDS BY NUMBER OF DWELLING UNITS
IN INDIA AND DELHI: 2011
(Per cent)
S.No Number of Dwelling Rooms India Delhi1 No Exclusive Room 3.90 1.302 One Room 37.10 32.203 Two Rooms 31.70 29.604 Three Rooms 14.50 20.005 Four Rooms 7.50 10.406 Five Rooms 2.60 3.007 Six Rooms & Above 2.80 3.50
Source:- Census of India, 2011, Houses, Household Amenities and Assets

ECONOMIC SURVEY OF DELHI, 2017-18370
Table 14.5
DISTRIBUTION OF HOUSEHOLDS BY TYPE OF FUELS USED FOR COOKING IN DELHI: 1991, 2001 & 2011
S. No Fuels Used for Cooking 1991 2001 20111 Total No. of Households 1861576 2554149 33405382 Cooking Gas 865072 1737730 30039963 Kerosene 774348 623298 1754434 Cow Dung Cakes 88680 50627 194875 Wood 86861 98555 1122916 Coal /Coak/ Lignite /Charcoal 24666 3713 44767 Bio-gas 11913 6874 30178 Electricity 2346 1257 13359 Others (including Crop Residue
& Crop Cooking)7690 49574 20493
10 All Sources 1861576 2554149 3340538Source: Census of India, 1991, 2001 and 2011. Registrar General of India
Table 14.6
CENSUS HOUSES ON THE BASIS OF THEIR USES: 1991, 2001 & 2011
S. No Details
1991 2001 2011Number % Number % Number %
I. Number of Census Houses 2,446,143 100.00 3,379,956 100.0 4605555 100.00
1. Vacant Census Houses 293,677 12.00 377,790 11.18 512691 11.13
2. Occupied Census Houses 2,152,466 88.00 3,002,166 88.82 4092864 88.87
II Occupied Census Houses by their Uses1 Total 2,152,466 100.00 3002,166 100.00 4092864 100.002 Residence 1,713,952 79.63 2,316,996 77.18 3176329 88.90
3 Residence-cum other use 88,386 4.11 135,406 4.51 137575 77.6
4 Shop, Office 172,701 8.02 319,233 10.63 377299 3.4
5 School, College, etc. -- -- 7,620 0.25 9709 9.2
6Hotel, Lodge, Guest House, etc.
2,734 0.13 6,005 0.2 7754 0.2
7 Hospital, Dispensary, etc. -- -- 7,661 0.26 7853 0.2
8Factory, Workshop, Work shed etc.
86,170 4 80,165 2.67 90945 2.2
9 Place of Worship 3,974 0.18 8,249 0.27 8668 0.2
10 Other Non-residential Use 84,549 3.93 120,831 4.00 237244* 5.8
Source: Census of India, 1991 2001 and 2011, Registrar General of India * *Includes occupied locked census houses

ECONOMIC SURVEY OF DELHI, 2017-18 371
Table 14.7DISTRIBUTION OF HOUSEHOLDS BY PREDOMINANT MATERIAL OF
FLOOR, ROOF AND WALL IN DELHI: 2011(Per cent)
S. No
Material used Roof Wall Floor
1 Grass, Thatch, Bamboo, Wood, Mud, etc
1.20 2.70 2.30
2 Plastic, polythene 0.80 0.303 Handmade Tiles 0.304 Machine made tiles 0.605 Bricks 4.20 86.30 2.606 Stones/Slate 23.40 14.507 G.I Metal, Asbestos Sheet 5.60 0.208 Concrete 63.08 5.50 64.609 Not packed with Mortar 1.10
10 Packed with Mortar 3.7011 Mosaic Floor Tiles 15.6012 Others 0.10 0.20 0.40
Source: - Census of India, 2011, Houses, Household Amenities and Assets
Table 14.8
DISTRIBUTION OF HOUSEHOLDS BY SOURCE OF LIGHTING IN
INDIA & DELHI: 2011
(Per cent)
S.No Source of Lighting India Delhi1 Electricity 67.30 99.102 Kerosene 31.40 0.703 Solar Energy 0.40 0.104 Other Oils 0.20 Nil5 Others 0.20 0.106 No Lighting 0.50 0.10
Source: - Census of India, 2011, Houses, Household Amenities and Assets
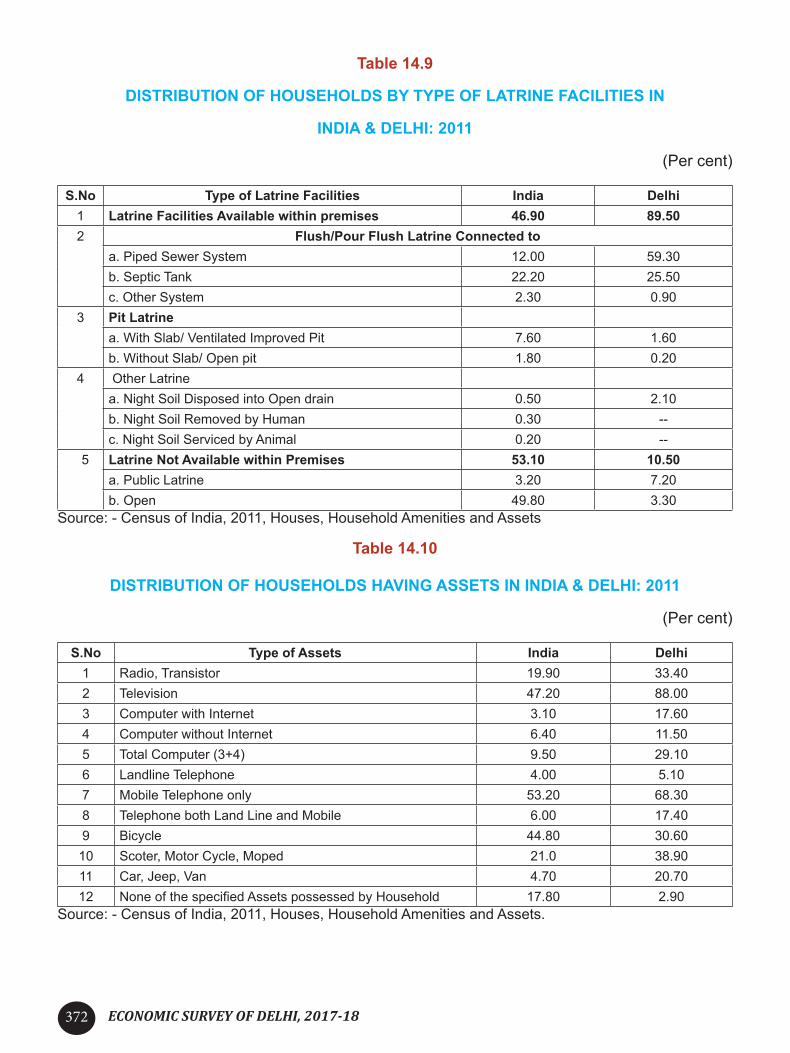
ECONOMIC SURVEY OF DELHI, 2017-18372
Table 14.9
DISTRIBUTION OF HOUSEHOLDS BY TYPE OF LATRINE FACILITIES IN
INDIA & DELHI: 2011
(Per cent)
S.No Type of Latrine Facilities India Delhi1 Latrine Facilities Available within premises 46.90 89.502 Flush/Pour Flush Latrine Connected to
a. Piped Sewer System 12.00 59.30b. Septic Tank 22.20 25.50c. Other System 2.30 0.90
3 Pit Latrinea. With Slab/ Ventilated Improved Pit 7.60 1.60b. Without Slab/ Open pit 1.80 0.20
4 Other Latrinea. Night Soil Disposed into Open drain 0.50 2.10b. Night Soil Removed by Human 0.30 --c. Night Soil Serviced by Animal 0.20 --
5 Latrine Not Available within Premises 53.10 10.50a. Public Latrine 3.20 7.20b. Open 49.80 3.30
Source: - Census of India, 2011, Houses, Household Amenities and Assets
Table 14.10
DISTRIBUTION OF HOUSEHOLDS HAVING ASSETS IN INDIA & DELHI: 2011
(Per cent)
S.No Type of Assets India Delhi1 Radio, Transistor 19.90 33.402 Television 47.20 88.003 Computer with Internet 3.10 17.604 Computer without Internet 6.40 11.505 Total Computer (3+4) 9.50 29.106 Landline Telephone 4.00 5.107 Mobile Telephone only 53.20 68.308 Telephone both Land Line and Mobile 6.00 17.409 Bicycle 44.80 30.60
10 Scoter, Motor Cycle, Moped 21.0 38.9011 Car, Jeep, Van 4.70 20.7012 None of the specified Assets possessed by Household 17.80 2.90
Source: - Census of India, 2011, Houses, Household Amenities and Assets.

ECONOMIC SURVEY OF DELHI, 2017-18 373
Table 14.11
DISTRIBUTION OF HOUSEHOLDS ON THE BASIS OF MODE OF COMMUNICATION IN
INDIA & DELHI: 2001 & 2011
(Per cent)
S. No Mode of Communication Facilities
India Delhi2001 2011 2001 2011
1 Radio/ Transistor 35.10 19.90 50.00 33.402 Television 31.60 47.20 74.50 88.003 Telephone 9.10 63.20 34.70 90.804 None of the Specified Mode of Communication 50.40 27.40 18.20 3.50
Source: - Census of India, 2011, Houses, Household Amenities and Assets.
Table 14.12
DISTRIBUTION OF HOUSEHOLDS ON THE BASIS OF MODE OF TRANSPORTATION IN INDIA & DELHI: 2001 & 2011
(Per cent)
S.No Mode of Transportation FacilitiesIndia Delhi
2001 2011 2001 20111 Bicycle/ Scooter 43.70 44.80 37.60 30.602 Motor Cycles/ Moped 11.70 21.00 28.00 38.903 Car/ Jeep/ Van 2.50 4.70 13.00 27.004 None of the Specified Mode of Transportation 51.30 44.10 43.10 2.90
Source: - Census of India, 2011, Houses, Household Amenities and Assets.
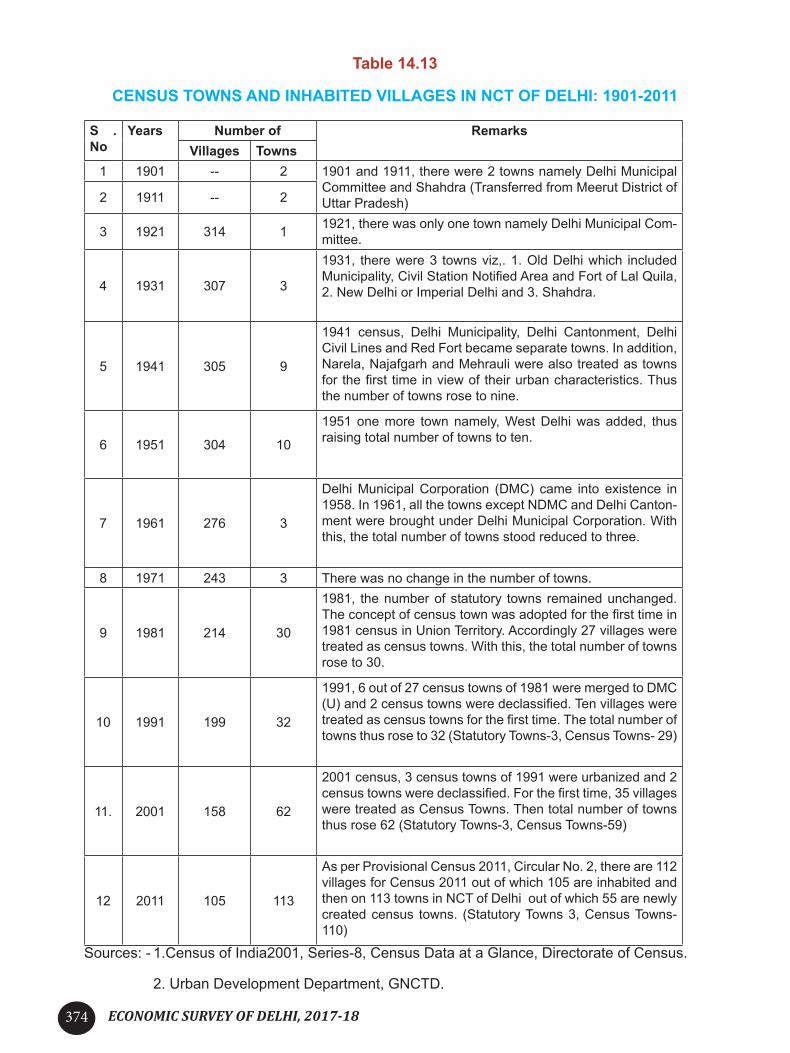
ECONOMIC SURVEY OF DELHI, 2017-18374
Table 14.13
CENSUS TOWNS AND INHABITED VILLAGES IN NCT OF DELHI: 1901-2011
S . No
Years Number of RemarksVillages Towns
1 1901 -- 2 1901 and 1911, there were 2 towns namely Delhi Municipal Committee and Shahdra (Transferred from Meerut District of Uttar Pradesh)2 1911 -- 2
3 1921 314 1 1921, there was only one town namely Delhi Municipal Com-mittee.
4 1931 307 3
1931, there were 3 towns viz,. 1. Old Delhi which included Municipality, Civil Station Notified Area and Fort of Lal Quila, 2. New Delhi or Imperial Delhi and 3. Shahdra.
5 1941 305 9
1941 census, Delhi Municipality, Delhi Cantonment, Delhi Civil Lines and Red Fort became separate towns. In addition, Narela, Najafgarh and Mehrauli were also treated as towns for the first time in view of their urban characteristics. Thus the number of towns rose to nine.
6 1951 304 10
1951 one more town namely, West Delhi was added, thus raising total number of towns to ten.
7 1961 276 3
Delhi Municipal Corporation (DMC) came into existence in 1958. In 1961, all the towns except NDMC and Delhi Canton-ment were brought under Delhi Municipal Corporation. With this, the total number of towns stood reduced to three.
8 1971 243 3 There was no change in the number of towns.
9 1981 214 30
1981, the number of statutory towns remained unchanged. The concept of census town was adopted for the first time in 1981 census in Union Territory. Accordingly 27 villages were treated as census towns. With this, the total number of towns rose to 30.
10 1991 199 32
1991, 6 out of 27 census towns of 1981 were merged to DMC (U) and 2 census towns were declassified. Ten villages were treated as census towns for the first time. The total number of towns thus rose to 32 (Statutory Towns-3, Census Towns- 29)
11. 2001 158 62
2001 census, 3 census towns of 1991 were urbanized and 2 census towns were declassified. For the first time, 35 villages were treated as Census Towns. Then total number of towns thus rose 62 (Statutory Towns-3, Census Towns-59)
12 2011 105 113
As per Provisional Census 2011, Circular No. 2, there are 112 villages for Census 2011 out of which 105 are inhabited and then on 113 towns in NCT of Delhi out of which 55 are newly created census towns. (Statutory Towns 3, Census Towns- 110)
Sources: - 1.Census of India2001, Series-8, Census Data at a Glance, Directorate of Census.
2. Urban Development Department, GNCTD.

ECONOMIC SURVEY OF DELHI, 2017-18 375
Table 15.1
Average Annual Expenditure ( ) per student aged 5-29 years pursuing general education by level of education for each State/UT
State / UT
Level of General Course
Primary Upper Primary Secondary Higher
Secondary GraduatePost-
Graduate and above
Diploma
Andhra Pradesh 5044 4960 8509 14691 15194 18782 14300
Arunachal Pradesh 3599 4411 5883 8225 10418 18524 21246
Assam 2232 3124 4891 8747 11383 23252 8707
Bihar 2687 3409 5369 9951 9913 13972 13945
Chhatissgarh 2093 2213 3089 6445 7749 9880 5530
Delhi (State Sample) 12985 13956 16766 18441 19624 23435 38657Goa 5905 6977 11361 7525 11198 0 15600
Gujarat 5163 5445 8916 17580 11636 13416 24114
Haryana 9960 9991 12236 24752 32736 29549 41369
Himachal Pradesh 6505 5803 7848 9431 12698 32655 21591
Jammu & Kashmir 5632 5382 6748 11997 12847 18671 14414
Jharkhand 3003 4062 5673 9481 9795 12262 10702
Karnataka 6164 6728 6737 14434 14050 29351 12409
Kerala 8330 7771 9296 10268 15430 14608 10690
Madhya Pradesh 3297 3341 5928 10199 12618 13408 12383
Maharashtra 6448 6446 10279 17212 16871 20420 14666
Manipur 6251 7787 13190 15928 14788 19891 9761
Meghalaya 3921 5170 8079 15867 19759 25123 29508
Mizoram 5611 8624 11035 17939 21556 42726 43880
Nagaland 5716 6729 10644 19712 24973 23493 13622
Odisha 2714 2742 5285 13180 10010 14131 15974
Punjab 10014 10121 13479 15824 24182 23942 27855
Rajasthan 4209 5677 7503 14340 13180 9752 26332
Sikkim 4258 3497 7272 10035 19345 14713 10371
TamilNadu 8872 8075 7560 9894 21112 37812 7328
Telangana 7912 9142 7478 14231 14029 19227 18141
Tripura 3973 4558 8300 12394 15756 20779 15278
Uttar Pradesh 3323 4095 6513 9730 9117 9485 11795
Uttarakhand 3740 5166 6381 8950 9593 16466 28392
West Bengal 3573 5890 8580 12492 14030 14626 22522
A & N Island 6946 6858 8994 10213 12016 6738 6200
Chandigarh 10811 15426 20583 25470 28511 30976 0
Dadra & Nagar Haveli 5625 4336 7123 25329 16950 0 0
Daman & Diu 11450 13741 11447 11408 11203 0 20280
Lakshdweep 1264 1521 1738 2142 20969 4999 0
Puducherry 10701 9348 8599 15127 24829 26297 0All-India 4610 5386 7459 12619 13478 15999 15997
Source: NSS 71st Round Survey (Jan- June 2014)

ECONOMIC SURVEY OF DELHI, 2017-18376
Table 17.1
TEHSIL-WISE SCHEDULED CASTE POPULATION – 2011
S.No Name of Tehsils Male Female Total
1. Narela 83528 71771 1552992. Sarswati Vihar 230582 204007 4345893. Model Town 57436 49913 1073494. Civil Line 67996 61395 1293915. Sadar Bazar 14546 13346 278926. Kotwali 4465 3915 83807. Seelam Pur 92879 82564 1754438. Shahdara 19498 17918 374169. Seema Puri 84682 76217 160899
10. Gandhi Nagar 19743 17718 3746111. Vivek Vihar 25309 23112 4842112. Preet Vihar 102967 92573 19554013. Parliament Street 6676 5940 1261614. Connaught Place 2928 2606 553415. Chanakya Puri 8281 6814 1509516. Korol Bagh 30203 29146 5935217. Paharganj 27807 25808 5361518. Daryagang 15769 14442 3021119. Punjabi Bagh 86233 77465 16369820. Patel Nagar 83498 73924 15742221. Rajouri Garden 30367 24985 5535222. Najafgarh 90605 80997 17160223. Delhi Contonment 29216 24678 5389424. Vasant Vihar 50384 42528 9291225. Defence Colony 35958 32522 6848026. Hauz Khas 115084 104729 21981327. Kalkajki 72157 62476 134633
Total 1488800 1323509 2812309 Source:- Directorate of Census Operations, Delhi

ECONOMIC SURVEY OF DELHI, 2017-18 377
Table 17.2
SCHEDULED CASTE AND SCHEDULED TRIBE POPULATION IN INDIA- 2011
(Lakh)
S . No States/ Union Territories SC
PopulationST
Population
Per cent of SC/ST to Total Population
SC ST1. Andhra Pradesh 138.78 59.18 16.4 7.02. Arunachal Pradesh --- 9.51 --- 68.83. Assam 22.31 38.84 7.2 12.44. Bihar 165.67 13.36 15.9 1.35. Goa 0.25 1.49 1.7 10.26. Gujarat 40.74 89.17 6.7 14.87. Haryana 51.13 --- 20.2 ---8. Himachal Pradesh 17.29 3.92 25.2 5.79. Karnataka 104.75 42.49 17.1 7.010. Kerala 30.40 4.85 9.1 1.511. Madhya Pradesh 113.42 153.17 15.6 21.112. Maharashtra 132.76 105.10 11.8 9.413. Manipur 0.97 9.02 3.8 35.114. Meghalaya 0.17 25.56 0.6 86.115. Mizoram 0.01 10.36 0.1 94.416. Nagaland --- 17.10 --- 86.517. Orissa 71.88 95.91 17.1 22.818. Punjab 88.60 - - 31.9 - -19. Rajasthan 122.21 92.38 17.8 13.520. Sikkim 0.28 2.06 4.6 33.821. Tamil Nadu 144.38 7.95 20.0 1.122. Tripura 6.55 11.67 17.8 31.823. Uttar Pradesh 413.57 11.34 20.7 0.624. West Bengal 214.63 52.97 23.5 5.825. Jammu and Kashmir 9.25 14.93 7.4 11.926. Uttarkhand 18.92 2.91 18.8 2.927. Jharkhand 39.86 86.45 12.1 26.228. Chhattisgarh 32.74 78.23 12.8 30.6
Union Territories1. Andaman & Nicobar Islands --- 0.28 --- 7.52. Chandigarh 1.99 --- 18.9 ---3. Dadra & Nagar Haveli 0.062 1.78 1.8 52.04. Daman and Diu 0.061 0.15 2.5 6.35. Delhi 28.12 --- 16.8 ---6. Lakshadweep -- 0.61 --- 94.87. Puducherry 1.96 --- 15.7 ---
India 2013.78 1042.81 16.6 8.6Source: - Population Profiles, Census of India 2011, Registrar General of India


